traffic control strategies for congested freeways and … · 2017-01-04 · traffic control...
TRANSCRIPT
Technical Report Documentation Page 1. Report No. FHWA/TX-08/0-5326-2
2. Government Accession No.
3. Recipient's Catalog No.
4. Title and Subtitle TRAFFIC CONTROL STRATEGIES FOR CONGESTED FREEWAYS AND WORK ZONES
5. Report Date November 2007 Published: October 2008
6. Performing Organization Code
7. Author(s) Geza Pesti, Poonam Wiles, Ruey Long (Kelvin) Cheu, Praprut Songchitruksa, Jeff Shelton, and Scott Cooner
8. Performing Organization Report No. Report 0-5326-2
10. Work Unit No. (TRAIS)
9. Performing Organization Name and Address Texas Transportation Institute The Texas A&M University System College Station, Texas 77843-3135
11. Contract or Grant No. Project 0-5326 13. Type of Report and Period Covered Technical Report: September 2005-August 2007
12. Sponsoring Agency Name and Address Texas Department of Transportation Research and Technology Implementation Office P. O. Box 5080 Austin, Texas 78763-5080
14. Sponsoring Agency Code
15. Supplementary Notes Project performed in cooperation with the Texas Department of Transportation and the Federal Highway Administration. Project Title: Improved Techniques for Traffic Control for Freeways and Work Zones URL: http://tti.tamu.edu/documents/0-5326-2.pdf 16. Abstract The primary objective of the research was to identify and evaluate effective ways of improving traffic operations and safety on congested freeways. There was particular interest in finding condition-responsive traffic control solutions for the following problem areas: (1) end-of-queue warning, (2) work zones with lane closure, and (3) queue spillover at exit ramps. Available techniques considered by this research include combination of static and dynamic queue warning systems, dynamic merge control in advance of freeway lane closures, and various traffic control strategies, such as traffic diversion and ramp metering, to mitigate queue spillover at exit ramps. Three sets of evaluation studies were conducted: first, two queue warning systems deployed on IH 610 and US 59 in Houston, Texas, were evaluated based on field observations. Second, strategies to resolve a ramp spillover problem at an exit ramp in El Paso, Texas, were analyzed using traffic simulations. Third, the Dynamic Merge work zone traffic control concept was evaluated using traffic simulations, and recommendations were developed for its potential use for various work zone types with different lane closure configurations. 17. Key Words Traffic Control, Queue Warning, Merge Control, Work Zone
18. Distribution Statement No restrictions. This document is available to the public through NTIS: National Technical Information Service Springfield, Virginia 22161 http://www.ntis.gov
19. Security Classif.(of this report) Unclassified
20. Security Classif.(of this page) Unclassified
21. No. of Pages 126
22. Price
Form DOT F 1700.7 (8-72) Reproduction of completed page authorized

TRAFFIC CONTROL STRATEGIES FOR CONGESTED FREEWAYS AND WORK ZONES
by
Geza Pesti, Ph.D., P.E. Associate Research Engineer Texas Transportation Institute
Poonam Wiles, P.E. Research Engineer
Texas Transportation Institute
Ruey Long (Kelvin) Cheu, Ph.D. Associate Professor
The University of Texas at El Paso
Praprut Songchitruksa, Ph.D. Assistant Research Scientist
Texas Transportation Institute
Jeff Shelton Associate Transportation Researcher
Texas Transportation Institute
Scott Cooner, P.E. Research Engineer
Texas Transportation Institute
Report 0-5326-2 Project 0-5326
Project Title: Improved Techniques for Traffic Control for Freeways and Work Zones
Performed in cooperation with the Texas Department of Transportation
and the Federal Highway Administration
November 2007 Published: October 2008
TEXAS TRANSPORTATION INSTITUTE The Texas A&M University System College Station, Texas 77843-3135

v
DISCLAIMER
The contents of this report reflect the views of the authors, who are responsible for the facts and the accuracy of the data presented herein. The contents do not necessarily reflect the official view or policies of the Federal Highway Administration (FHWA) or the Texas Department of Transportation (TxDOT). This report does not constitute a standard, specification, or regulation. Its contents are not intended for construction, bidding, or permit purposes. The use and names of specific products or manufacturers listed herein does not imply endorsement of those products or manufacturers. The principal investigator and engineer in charge of this project was Dr. Geza Pesti, P.E. #95840.
vi
ACKNOWLEDGMENTS
This project was conducted in cooperation with TxDOT and FHWA. The researchers acknowledge the support and guidance provided by Robert Boykin, Project Director; Rick Berry, David Fink, Tony Moran, Andrew Oberlander, Walter Ragsdale, Douglas Skowronek, and Rebecca Wells, project advisors; Mark Schluter, Program Coordinator during the first year of the project; and Wade Odell, Research and Technology Implementation (RTI) Office research engineer who also served as Program Coordinator during the second year of the project. The contribution of Melisa Finley, Nada Trout and Sandra Schoeneman, TTI researchers to the development of focus group materials and their assistance in conducting the focus group meetings are also acknowledged and appreciated. The researchers also acknowledge the work of Yi-Chang Chiu, assistant professor at the University of Arizona, who led the UTEP research team during the first year of the project. The assistance provided by Robert McFarland, Eagen O’Brien, Debbie K. Smith, Joseph Snyder, and Carlton J. Allen at Houston TranStar; Thelma Ramirez in the El Paso District; Theresa Lopez and Grover Schretter in the Fort Worth District; and Ricky Parker at Paradigm Traffic Systems is also greatly appreciated.
vii
TABLE OF CONTENTS
Page LIST OF FIGURES ....................................................................................................................XI LIST OF TABLES ...................................................................................................................XIII INTRODUCTION......................................................................................................................... 1 REVIEW OF LITERATURE...................................................................................................... 3
REVIEW OF RECENT RESEARCH IN ADVANCE WARNING .......................................... 3 Static Signs.............................................................................................................................. 5 Active Warning Systems......................................................................................................... 5 Active Speed Warning Signs .................................................................................................. 6 Adaptive Queue Warning System........................................................................................... 8 Variable Speed Limit for Speed Harmonization................................................................... 10 Temporary Shoulder Use ...................................................................................................... 11 Collision Avoidance Systems Using Obstacle Detection ..................................................... 14 Lane Drift Warning............................................................................................................... 15 Intersection Collision Warning System ................................................................................ 16 Simulation Study of Rear-End Collision-Warning System .................................................. 16
REVIEW OF LITERATURE ON MERGE CONTROL.......................................................... 17 Early Merge .......................................................................................................................... 17 Late Merge ............................................................................................................................ 18 Dynamic Late Merge Concept .............................................................................................. 20 Dynamic Late Merge Evaluations ........................................................................................ 20 Merge Assisting Strategy...................................................................................................... 23
SUMMARY.............................................................................................................................. 23 SURVEY OF CURRENT STATE OF PRACTICE ................................................................ 25
INTERVIEW TXDOT DISTRICTS......................................................................................... 25 Rear-End Collisions at Freeway Exit Ramps (Figure 22) .................................................... 26 Rear-End Collisions at Freeway Entry Ramps (Figure 23) .................................................. 27 Rear-End Collisions between Closely Spaced Ramps (Figure 24)....................................... 28 Rear-End Collisions at Freeway Junctions (Figure 25) ........................................................ 29 Locations with High Rear-End Collision Potential .............................................................. 29 Factors Related to Rear-End Collisions................................................................................ 32 Use of Static Queue Warning Signs...................................................................................... 33 Use of Changeable Message Signs for Queue Warning ....................................................... 34 Other Queue Warning Techniques........................................................................................ 36 Merge Control Strategies ...................................................................................................... 37
CURRENT STATE OF PRACTICE IN OTHER STATES..................................................... 38 Alabama DOT Low Visibility Warning System................................................................... 38 Idaho DOT Motorist Warning System.................................................................................. 38 New Jersey Turnpike Authority Speed Management ........................................................... 39 Utah Fog Warning System.................................................................................................... 39 South Carolina DOT Low Visibility Warning System......................................................... 40
INTERNATIONAL PRACTICE.............................................................................................. 42 CONTACT VENDORS AND EQUIPMENT SUPPLIERS .................................................... 46
viii
FOCUS GROUP MEETINGS TO SELECT EFFECTIVE WARNING MESSAGES ....... 47 GENERAL CONCERNS APPROACHING FREEWAY WORK ZONES............................. 47 TRADITIONAL LANE CLOSURE UNDER CONGESTED CONDITIONS........................ 47 ALTERNATIVE MESSAGES FOR LANE CLOSURE ......................................................... 49 POTENTIAL CONGESTION WARNING SIGNS ................................................................. 50 LANE CLOSURE UNDER NON-CONGESTED CONDITIONS.......................................... 52
MEASURES OF EFFECTIVENESS........................................................................................ 53 QUEUE WARNING SYSTEM EVALUATION...................................................................... 55
IDENTIFY A DYNAMIC QUEUE WARNING SYSTEM FOR EVALUATION................. 55 SYSTEM COMPONENTS AND LOGIC................................................................................ 56
Video Detection .................................................................................................................... 56 Advance Warning Signs ....................................................................................................... 56 Operational Logic ................................................................................................................. 57
EVALUATION......................................................................................................................... 59 Data Collection ..................................................................................................................... 59 Data Analysis ........................................................................................................................ 60 Findings................................................................................................................................. 61
RECOMMENDATIONS TO IMPROVE THE SYSTEM....................................................... 63 EXIT RAMP QUEUE SPILLBACK MITIGATING STRATEGIES ................................... 65
BACKGROUND ...................................................................................................................... 65 PURPOSE................................................................................................................................. 65 EXIT RAMP MANAGEMENT SCENARIOS........................................................................ 65
Freeway Main Lanes............................................................................................................. 65 Freeway Vehicle Mix............................................................................................................ 67 Freeway Volume................................................................................................................... 67 Ramp Merge Conditions ....................................................................................................... 67 Ramp Volumes...................................................................................................................... 67 Spacing between Ramps ....................................................................................................... 68
PERFORMANCE MEASURES............................................................................................... 68 Acceleration and Speed......................................................................................................... 68 Density .................................................................................................................................. 68
MODEL SETUP ....................................................................................................................... 68 SCENARIO SET DESCRIPTION ........................................................................................... 72 RESULTS ................................................................................................................................. 73
Queue Length........................................................................................................................ 74 Density, Speed, and Acceleration ......................................................................................... 76
DYNAMIC MERGE................................................................................................................... 87 DYNAMIC MERGE CONCEPT ............................................................................................. 87 SYSTEM COMPONENTS AND OPERATIONAL LOGIC................................................... 88 SITE SELECTION CRITERIA................................................................................................ 88 SIMULATION STUDY ........................................................................................................... 89 FINDINGS................................................................................................................................ 89
CONCLUSIONS ......................................................................................................................... 93 QUEUE WARNING SYSTEM EVALUATION..................................................................... 93 MITIGATING QUEUE SPILLOVER AT EXIT RAMPS ...................................................... 93 DYNAMIC MERGE EVALUATION ..................................................................................... 94

ix
REFERENCES............................................................................................................................ 95 APPENDIX A: SURVEY QUESTIONNAIRE ...................................................................... 101 APPENDIX B: FIELD GUIDE................................................................................................ 107
QUEUE WARNING............................................................................................................... 107 Static Queue Warning ......................................................................................................... 107 Dynamic Queue Warning ................................................................................................... 108
DYNAMIC MERGE CONTOL STRATEGY ....................................................................... 110

x
xi
LIST OF FIGURES
Page
Figure 1. Common Rear-End Collision Locations on Congested Freeways. ................................ 1 Figure 2. Rear-End Collision Potential Upstream of Work Zone Lane Closures.......................... 2 Figure 3. Static Signs with Pictogram and Text Message. 5 .......................................................... 5 Figure 4. Condition-Responsive Speed Display and Its Effect on Average Speed. 14................... 6 Figure 5. ADAPTIRTM Advisory Speed Message.15 ..................................................................... 7 Figure 6. Concept of Adaptive Queue Warning System with Smart Drums. 20 ............................ 8 Figure 7. Speed Detection Using Smart Drums. 20 ........................................................................ 9 Figure 8. Speed Sensor Technologies Tested. 20............................................................................ 9 Figure 9. Driving Simulator Test of Post-Mounted Warning Lights. 20 ...................................... 10 Figure 10. Speed Harmonization in the Netherlands. 8, 9 ............................................................. 11 Figure 11. Right Shoulder Use with Speed Harmonization in Germany. 8, 29.............................. 12 Figure 12. Temporary Shoulder Use Regulatory Signs. 8, 29 ........................................................ 12 Figure 13. Speed-Volume Relationship of Temporary Shoulder Use. 8, 29 .................................. 13 Figure 14. VORAD Monopulse Lane Coverage. 30 ..................................................................... 14 Figure 15. Intersection Collision Warning System.35 .................................................................. 16 Figure 16. Indiana Lane Merge.................................................................................................... 18 Figure 17. Late Merge.................................................................................................................. 19 Figure 18. Layout of the Maryland DLM System.45.................................................................... 21 Figure 19. Layout of the CALM System in Kansas. 46................................................................ 22 Figure 20. Email Cover Letter for the First Round of TxDOT Surveys...................................... 25 Figure 21. Email Cover Letter for the Second Round of TxDOT Surveys. ................................ 26 Figure 22. Rear-End Collisions at Freeway Exit Ramps ............................................................. 26 Figure 23. Rear-End Collisions at Freeway Entry Ramps........................................................... 27 Figure 24. Rear-End Collisions Between Closely Spaced Ramps............................................... 28 Figure 25. Rear-End Collision at Freeway Junctions .................................................................. 29 Figure 26. Idaho Visibility Sensor. 48 .......................................................................................... 38 Figure 27. Adverse Visibility Information System.49 .................................................................. 40 Figure 28. Congestion Warning System – Germany.8 ................................................................. 42 Figure 29. Congestion Warning System - The Netherlands.8 ...................................................... 42 Figure 30. Right Shoulder Use with Speed Harmonization – Germany. 8................................... 43 Figure 31. Accident Reductions for Dutch Temporary Shoulder Use. 8...................................... 43 Figure 32. Junction Control Schematic – Germany. 8.................................................................. 44 Figure 33. Dynamic Re-routing – Germany. 8 ............................................................................. 44 Figure 34. Dynamic Truck Restriction Testing – The Netherlands.8 .......................................... 45 Figure 35. Approaching Lane Closure, Congested. ..................................................................... 48 Figure 36. Possible Sign Depicting Traffic.................................................................................. 49 Figure 37. Possible Sign Depicting Roadway.............................................................................. 49 Figure 38. Approaching Lane Closure, Congested, with CMS. .................................................. 50 Figure 39. Research Project 0-4413 Signs................................................................................... 51 Figure 40. Lane Closure, Non-Congested.................................................................................... 52 Figure 41. Queue Warning Systems Evaluated in Houston, TX. ................................................ 55
xii
Figure 42. Video Detection for the Queue Warning System. ...................................................... 56 Figure 43. Queue Warning Message Sign. .................................................................................. 57 Figure 44. Layout of the Two Queue Warning Systems. ............................................................ 58 Figure 45. Queue Warning Sign on IH 610. ................................................................................ 58 Figure 46. GUI for Remote Access of TranStar Cameras. .......................................................... 60 Figure 47. Views Recorded by a Four-Channel Digital Video Recorder. ................................... 61 Figure 48. Expected Queuing Periods at the IH 610 Study Site. ................................................. 62 Figure 49. Entire Network for the Scenario Analysis.................................................................. 66 Figure 50. Hawkins Exit Ramp Location. ................................................................................... 66 Figure 51. Flow Chart of Queue Spillback Management Scenarios............................................ 73 Figure 52. Average Queue at Hawkins. ....................................................................................... 75 Figure 53. Maximum Queue at Hawkins. .................................................................................... 75 Figure 54. Average Queue at McRae........................................................................................... 76 Figure 55. Maximum Queue at McRae........................................................................................ 76 Figure 56. VISSIM Network Upstream of Hawkins Exit Ramp. ................................................ 77 Figure 57. VISSIM Network Upstream of the McRae Exit Ramp. ............................................. 77 Figure 58. Density in Freeway Lane 1 Upstream of McRae. ...................................................... 78 Figure 59. Density in Freeway Lane 1 Upstream of Hawkins..................................................... 79 Figure 60. Average Density in All Freeway Lanes Upstream of Hawkins. ................................ 79 Figure 61. Average Speed of All Freeway Lanes Upstream of Hawkins. ................................... 80 Figure 62. Average Speed in Lane 1 Upstream of Hawkins........................................................ 81 Figure 63. Average Speed of All Freeway Lanes Upstream of McRae....................................... 82 Figure 64. Average Speed of Freeway Lane 1 Upstream of McRae. .......................................... 82 Figure 65. Average Acceleration of All Freeway Lanes Upstream of Hawkins. ........................ 83 Figure 66. Average Acceleration of Freeway Lane 1 Upstream of Hawkins. ............................. 84 Figure 67. Average Acceleration of All freeway Lanes Upstream of McRae............................. 85 Figure 68. Average Acceleration of Lane 1 Upstream of McRae. .............................................. 85 Figure 69. Dynamic Merge. ......................................................................................................... 87 Figure 70. Work Zone Lane Closure Configurations Considered in the Simulations. ................ 90 Figure 71. Applicability of the Dynamic Merge in Work Zones on 2- and 3-Lane Freeways. ... 90 Figure 72. Applicability of the Dynamic Merge in Work Zones on Four-Lane Freeways. ........ 91
xiii
LIST OF TABLES
Page
Table 1. Operational Logic and Transitional Speed Thresholds for the CALM System. 46 ........ 22 Table 2. SCDOT Low Visibility Warning Strategies. ................................................................. 41 Table 3. Percent Reduction in Vehicle Conflicts......................................................................... 62 Table 4. Speeds at the Beginning of Congested Periods. ............................................................ 63 Table 5. Exit Ramp Volume for the Base Scenario. .................................................................... 68 Table 6. Truck Classification Schemes........................................................................................ 70 Table 7. Truck Type Distribution for Texas Conditions.............................................................. 71 Table 8. Truck Characteristics Applied to Texas Truck Fleet. .................................................... 71 Table 9. Texas Truck Fleet Translated into VISSIM Truck Types. ............................................ 72 Table 10. Dynamic Merge Applied to a Lane Closure in a Freeway Work Zone. ...................... 88

1
INTRODUCTION
The primary objective of the research is to identify and evaluate effective ways of improving traffic operations and safety on congested freeways. There is particular interest in finding condition-responsive traffic control solutions for the following problem areas:
• end-of-queue warning,
• work zones with lane closure, and
• queue spillover at exit ramps.
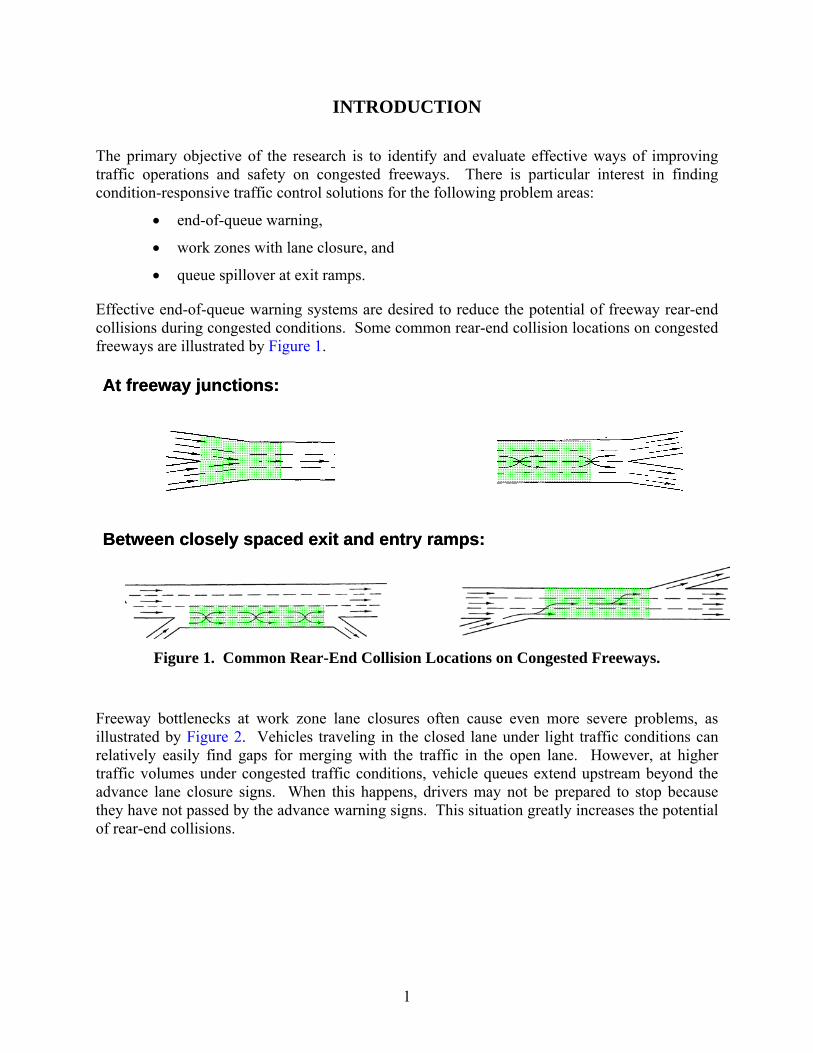
Effective end-of-queue warning systems are desired to reduce the potential of freeway rear-end collisions during congested conditions. Some common rear-end collision locations on congested freeways are illustrated by Figure 1.
At freeway junctions:
Between closely spaced exit and entry ramps:
At freeway junctions:
Between closely spaced exit and entry ramps:
Figure 1. Common Rear-End Collision Locations on Congested Freeways.
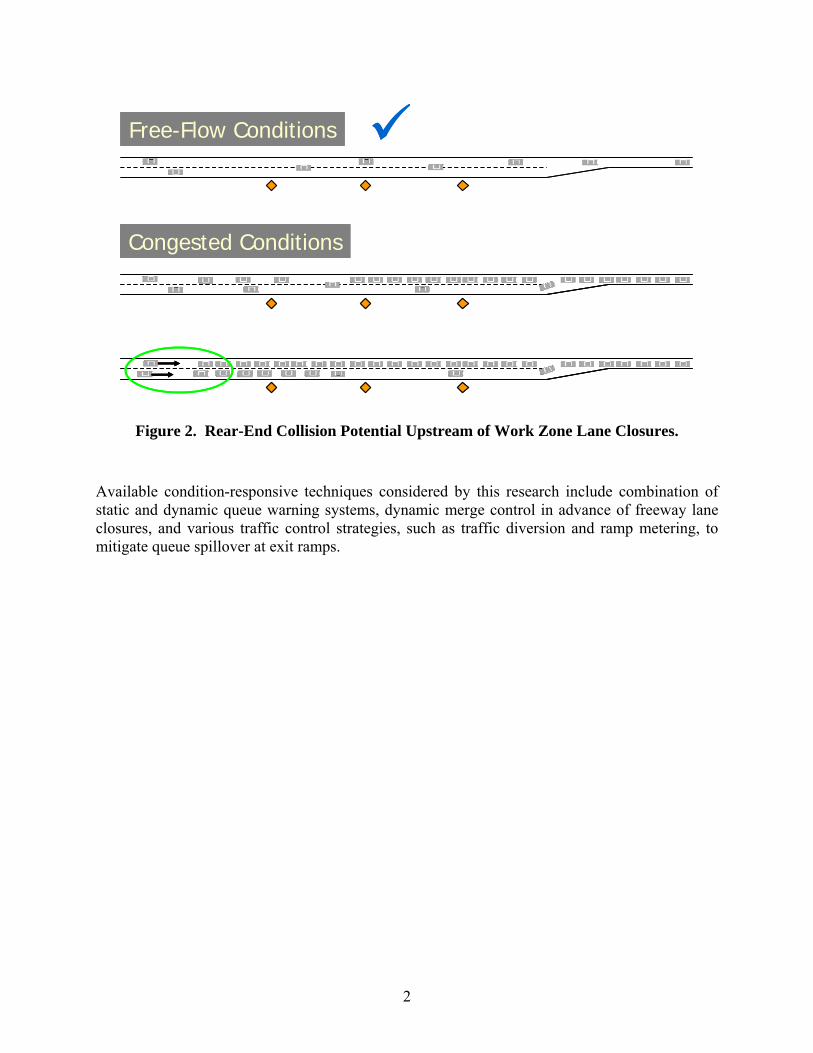
Freeway bottlenecks at work zone lane closures often cause even more severe problems, as illustrated by Figure 2. Vehicles traveling in the closed lane under light traffic conditions can relatively easily find gaps for merging with the traffic in the open lane. However, at higher traffic volumes under congested traffic conditions, vehicle queues extend upstream beyond the advance lane closure signs. When this happens, drivers may not be prepared to stop because they have not passed by the advance warning signs. This situation greatly increases the potential of rear-end collisions.
2
Free-Flow Conditions
Congested Conditions
Free-Flow Conditions
Congested ConditionsCongested Conditions
Figure 2. Rear-End Collision Potential Upstream of Work Zone Lane Closures.
Available condition-responsive techniques considered by this research include combination of static and dynamic queue warning systems, dynamic merge control in advance of freeway lane closures, and various traffic control strategies, such as traffic diversion and ramp metering, to mitigate queue spillover at exit ramps.
3
REVIEW OF LITERATURE
A review of relevant literature and recent research results on freeway and work zone traffic control was conducted. Particular attention was paid to studies relevant to:
• queue detection and advance warning of stopped or slow traffic, and
• merge control in advance of freeway lane closures and bottlenecks.
REVIEW OF RECENT RESEARCH IN ADVANCE WARNING
A combination of slow/stopped traffic conditions and insufficient stopping distance can create situations with high risk of rear-end collisions. Major causes of slow/stopped traffic on the freeway are:
• recurrent traffic congestion,
• work zones,
• incidents,
• low visibility and adverse weather, and
• inadequate geometric design.
Numerous studies found that rear-end collisions are the most frequent type of collisions on freeway facilities, especially at work zones.1, 2 Several human factors studies concluded that drivers approaching the end of queues often have very poor perception of the time and distance needed to safely slow down or stop. A research project3 conducted in Texas observed between 1 and 16 hard-braking maneuvers (significant drop in vehicle nose) per 1000 approaching vehicles at two work zone sites. A recent Texas Transportation Institute (TTI) report by Wiles et al.4 provided a comprehensive review of published research in this area.
The benefits of providing drivers with advance warning of slow/stopped traffic on freeway facilities have been estimated by a number of studies. For example, researchers at Daimler-Benz5 estimated that about 60% of rear-end collisions could be prevented by providing an additional half-second warning time to passenger car drivers. They also estimated that an extra second of warning time for drivers would prevent about 90% of rear-end collisions. An evaluation of a queue warning system in Amsterdam found a 23% decrease in overall collision rates, a 35% reduction in serious collisions, and a 46% reduction in secondary collisions at the back of the queue. A German autobahn using queue protection and freeway lane control showed a 20% decrease in collision rate. A queue warning system in England paid for itself within a year based on the estimated savings associated with the reduction in collisions.6 Findings of a recent 2006 Scan Tour in four European countries7 confirmed the safety and operational benefits of congestion warning systems. For example, the findings reported that implementation of a congestion warning system combining temporary use of shoulder lanes and speed harmonization
4
using variable speed limits resulted in a 15 to 25% decrease in primary accidents and a 40 to 50% decrease in secondary accidents in the Netherlands. The operational benefits of such systems typically included improved traffic stream stability and a 4 to 5% increase in vehicle throughput.8
A good understanding of queue dynamics is required to provide effective advance warning to drivers approaching stopped or slow queues. The appropriate number and spacing of detectors and warning message signs depend on a number of factors including queue characteristics (e.g., maximum queue length and shockwave speed) and roadway geometry. The queue characteristics can be measured in the field for certain limited traffic and roadway conditions and estimated using shockwave simulation models for any operating speed, traffic volume, and lanes configuration. Shockwaves are defined as boundaries between different traffic states (i.e., different vehicle speeds and densities). For example, the end of a traffic queue is also a shockwave (i.e., boundary between slow-moving queued vehicles and approaching high-speed traffic). During peak hours, when demand typically exceeds capacity, shockwaves may rapidly propagate upstream. An Iowa study9 of a rural interstate work zone with lane closures determined shockwave speeds as high as 30 to 40 mph. Another study on the Metropolitan Expressway in Japan10 determined an average shockwave speed of approximately 11 mph. A Canadian study11 of a short section of the Gardiner Expressway found very similar results. A recent TxDOT research project4 identified instances of sustained, repetitive, and excessive queue propagation speeds, sometimes reaching 50 mph.
Devices typically used for providing advanced warnings of slow/stopped traffic are:
• static signs,
• dynamic message signs (DMS),
• lane control signals (LCS),
• incident response vehicles, and
• in-vehicle devices,
Wiles et al.4 reviewed a range of techniques and devices available for detecting slow and stopped traffic queues, alerting drivers, and reducing queue lengths. Various advanced warning systems used within and outside the United States were documented. Wiles et al. compiled a list of products and traffic control devices applicable to queue detection and warning and assessed their potential effectiveness for addressing Texas Department of Transportation (TxDOT) concerns relating to the reduction of rear-end collisions at the end of freeway queues. This study reviewed recent developments in this area in addition to those previously documented by Texas Transportation Institute (TTI). Our literature focuses primarily on the active warning systems for slow/stopped traffic conditions where field applications are relatively recent and long-term system performance data may not yet be available.

5
Static Signs
Static warning signs have been widely used to provide advanced warning of stopped/slow traffic. For example, a recent TTI study4 field-tested two advance warning techniques using static signs. One of the devices consisted of a sign with the text message WATCH FOR STOPPED TRAFFIC, and the other of a pictogram sign depicted three closely spaced vehicles. The text message was developed so that the sign would serve as an alert because the message could be present even if congestion did not currently exist. The pictogram sign was adapted from the graphic-type message seen in Europe, New Zealand, and Turkey, among other places. Both signs are shown in Figure 3.
Figure 3. Static Signs with Pictogram and Text Message. 4
The study found that average vehicle speeds during congested periods were reduced by 15 to 25 mph after deployment of the sign with pictogram. No reductions in average speed were observed during non-congested periods. A complete evaluation of the sign with text message was not possible because of detector failures during morning peak periods when congestion was expected to occur.
Active Warning Systems
Active warning systems are traffic control devices consisting of sensors and variable message signs or flashing beacons with conventional warning signs. The message signs or flashing beacons are activated when hazardous roadway, environmental, or operational conditions are detected by the sensors. Warning signs may be divided into categories based upon the variability of the hazard identified and the uniformity of that hazard’s relevancy among drivers:12
• static hazards with uniform relevancy – e.g., warning signs for sharp curves, lane drops, etc.;
• variable hazards with uniform relevancy – e.g., weather-related condition warning signs, pedestrian warning signs, animal crossing warning signs, etc.; and
• static and variable hazards with non-uniform relevancy – e.g., grade warnings for trucks and overhead bridge clearance warnings for high-profile vehicles.

6
The following section reviews some active warning systems that have been used for advance warning of slow or stopped traffic.
Active Speed Warning Signs
Active speed warning signs (ASWS) may be activated by certain predetermined threshold for speed or speed differentials. Then the drivers are informed through a DMS of either their speed or the hazard ahead.
An ASWS system deployed at a construction zone on IH 80 near Lincoln, Nebraska, was evaluated by Pesti.13 The system consisted of three speed monitoring displays equipped with radar units. They were deployed at approximately ¼ -mile intervals in advance of the work zone lane closure. The radar units measured the speed of downstream traffic, and the speed messages displayed were intended to warn drivers of stopped or slow-moving traffic ahead and thereby enable them to reduce their speeds and avoid rear-end collisions with these vehicles. The speed display and its effect on average speed are shown in Figure 4.
Figure 4. Condition-Responsive Speed Display and Its Effect on Average Speed. 13
When a traffic slowdown is detected, the strobe lights begin flashing. When there is no slowdown, the strobe lights are off, and either the speed of traffic downstream or the work zone speed limit is displayed, whichever is lower. The results of the analysis indicated that the speed messages were effective in reducing the speed of vehicles approaching queued traffic during time periods when congestion was building. Before the speed advisory was deployed, vehicles began decelerating later but more intensively than after its deployment. After deployment vehicles began decelerating sooner and reduced their speed over a longer distance. The change in mean deceleration due to the speed advisory system was statistically significant at the 95% confidence level. In addition to the advisory speed messages, approach speed and trailer location also significantly affected vehicle deceleration. Due to the limited time available for the field studies the long-term effectiveness of the speed advisory system could not be determined.
Another portable, condition-responsive work zone traffic control system, the ADAPTIRTM was evaluated by McCoy and Pesti.14 The system was developed by The Scientex Corporation
0
10
20
30
40
50
60
70
80
-300 -200 -100 0 100 200 300
Relative distance from trailer (ft)
Ava
rage
spe
ed (m
ph)
Before After
7
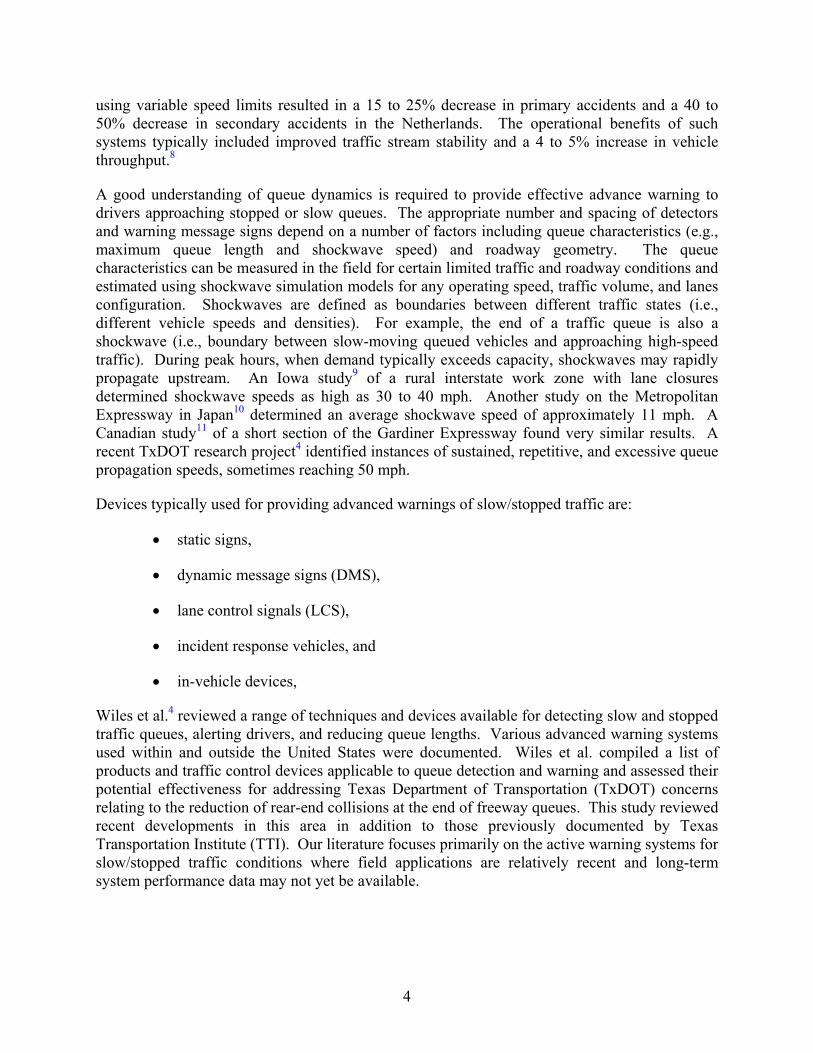
through a cooperative agreement with the Federal Highway Administration and the Maryland State Highway Administration. It utilizes radar sensors mounted on three portable changeable message signs (PCMS) and an arrow panel at the merging taper to continuously measure speeds at four locations along the approach to a freeway work zone. One PCMS with radar unit is shown in Figure 5. Whenever the average speed at the next downstream radar sensor location was found to be more than 10 mph lower than the average speed at a PCMS, a speed advisory message was displayed indicating the downstream speed rounded down to the nearest 5 mph. Otherwise, the PCMS remained blank, or in the case of the PCMS closest to the merging taper, the RIGHT LANE CLOSED message was displayed. The messages were intended to advise drivers of the speed of slower traffic ahead and thereby encourage them to slow down. Speeds downstream of the PCMSs were measured and compared to the speeds displayed in the messages. The results of the analysis indicated that the messages were only slightly effective in reducing speeds. It was concluded that their effectiveness could have been improved if the distances between the PCMSs had been shorter. Driver interviews revealed that the advisory speed messages were understood and thought to be useful by most drivers who recalled seeing them. However, some drivers questioned their usefulness and doubted their reliability because they had not seen any reason to slow down.
Figure 5. ADAPTIRTM Advisory Speed Message.15
Several other studies evaluated the effectiveness of ASWS. Kathmann15 found that the effectiveness of ASWS depends on the layout of the system. Examination of speed profiles gathered from both inductive loop and empirical data indicated that the speed reductions were quite significant. The Colorado Department of Transportation identified a downgrade curve on IH 70 in Glenwood Canyon as truck-accident-prone locations due to limited sight distance. A radar gun was installed which activates a DMS reading “You are speeding at [XX] mph, 45 mph curve ahead.” It was found that the 85th percentile speed fell by 27% after the installation.16 Kaub and Rauls17 used simple in-pavement magnets to detect speed and activate roadside or in-
8
vehicle warnings for excessive speed risks when approaching isolated stop controls, sharp curves, hazardous intersections, work zones, etc. Another study18 looked at the effect of dynamic advisory speeds provided specifically for heavy vehicles. Truck drivers were found to respond favorably to dynamic message signs with weight-specific advisory speeds on severe grades.
Adaptive Queue Warning System
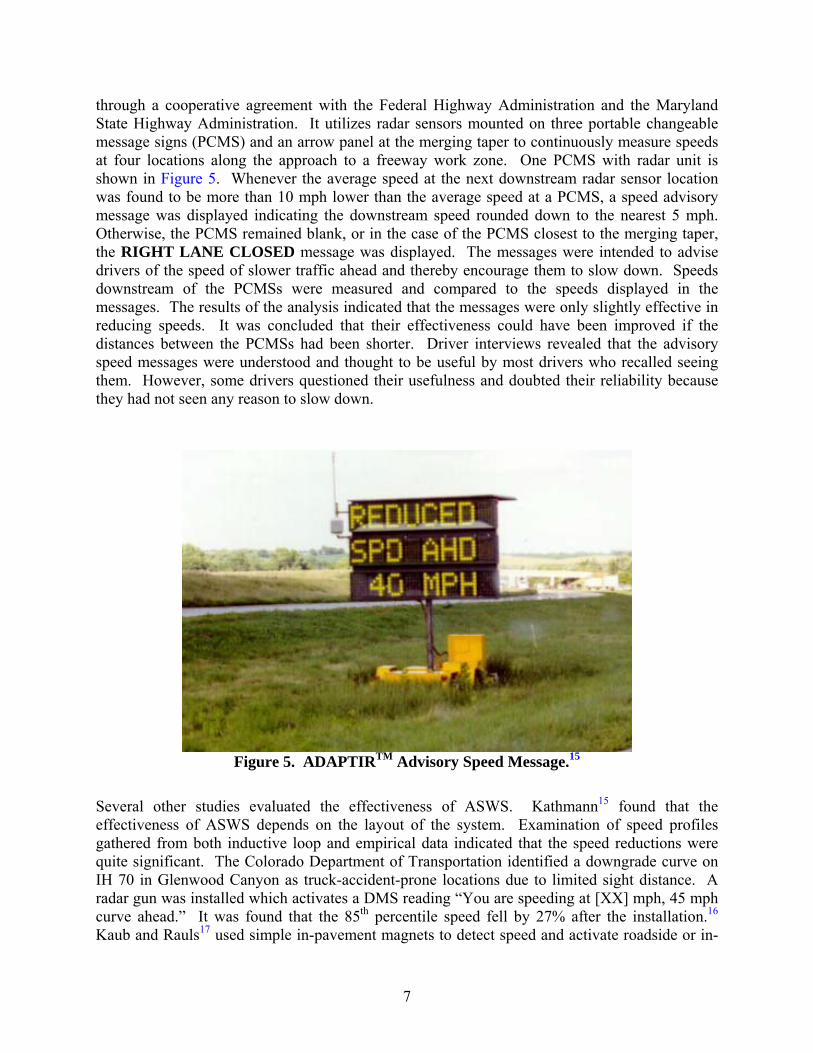
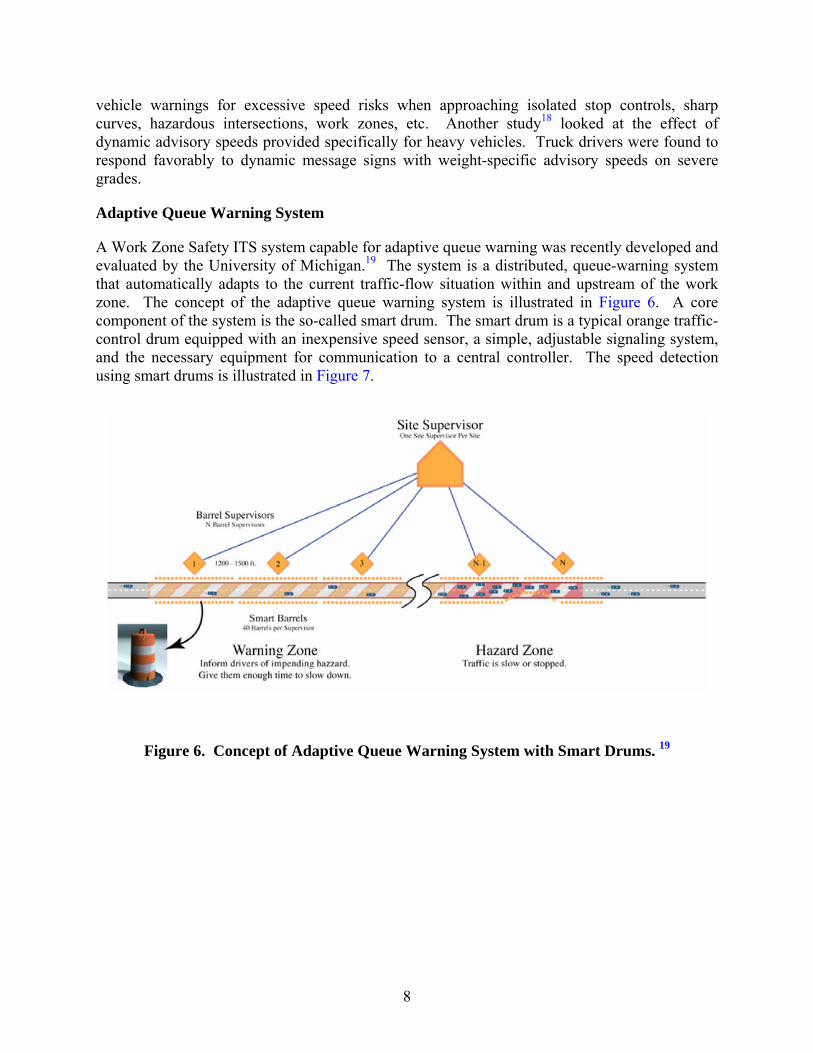
A Work Zone Safety ITS system capable for adaptive queue warning was recently developed and evaluated by the University of Michigan.19 The system is a distributed, queue-warning system that automatically adapts to the current traffic-flow situation within and upstream of the work zone. The concept of the adaptive queue warning system is illustrated in Figure 6. A core component of the system is the so-called smart drum. The smart drum is a typical orange traffic-control drum equipped with an inexpensive speed sensor, a simple, adjustable signaling system, and the necessary equipment for communication to a central controller. The speed detection using smart drums is illustrated in Figure 7.
Figure 6. Concept of Adaptive Queue Warning System with Smart Drums. 19
9
Figure 7. Speed Detection Using Smart Drums. 19
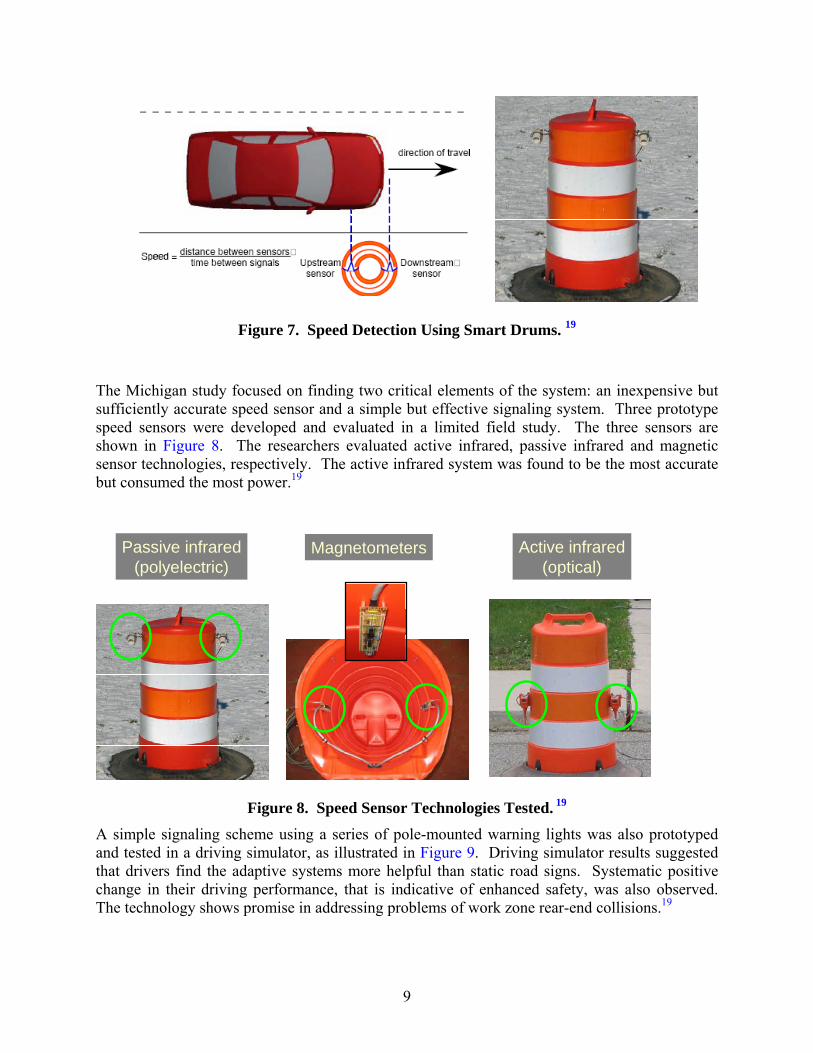
The Michigan study focused on finding two critical elements of the system: an inexpensive but sufficiently accurate speed sensor and a simple but effective signaling system. Three prototype speed sensors were developed and evaluated in a limited field study. The three sensors are shown in Figure 8. The researchers evaluated active infrared, passive infrared and magnetic sensor technologies, respectively. The active infrared system was found to be the most accurate but consumed the most power.19
MagnetometersPassive infrared(polyelectric)
Active infrared(optical)
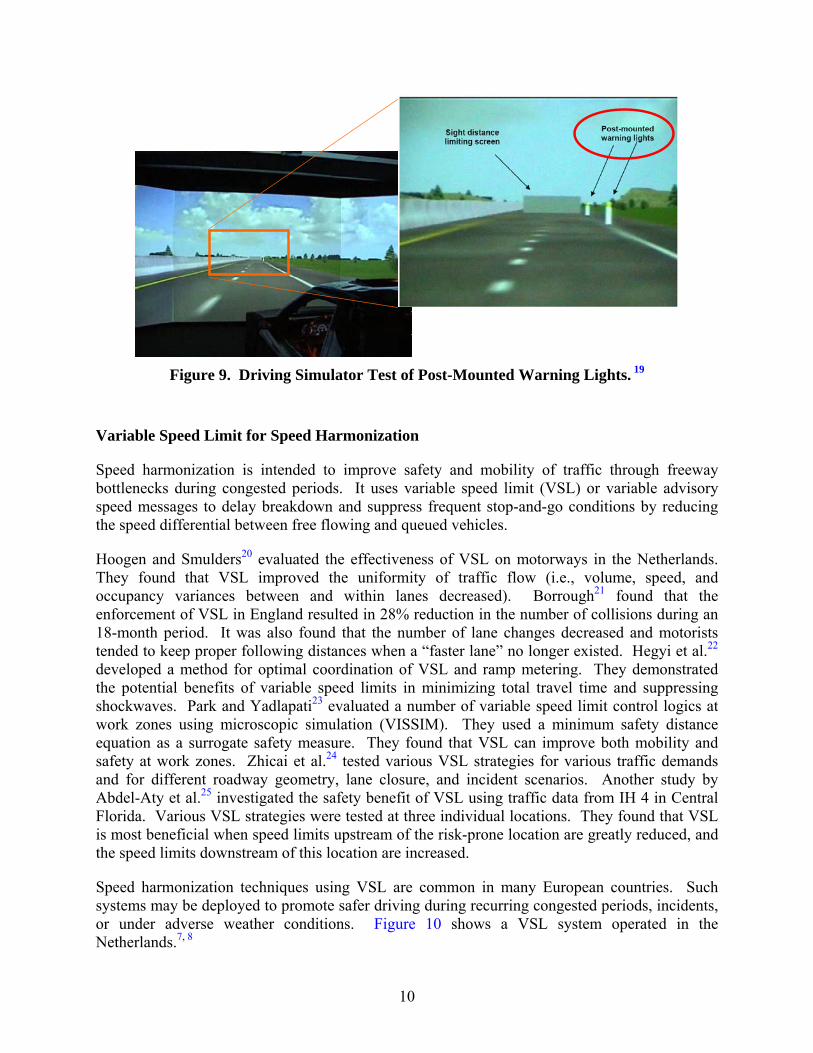
Figure 8. Speed Sensor Technologies Tested. 19 A simple signaling scheme using a series of pole-mounted warning lights was also prototyped and tested in a driving simulator, as illustrated in Figure 9. Driving simulator results suggested that drivers find the adaptive systems more helpful than static road signs. Systematic positive change in their driving performance, that is indicative of enhanced safety, was also observed. The technology shows promise in addressing problems of work zone rear-end collisions.19
10
Figure 9. Driving Simulator Test of Post-Mounted Warning Lights. 19
Variable Speed Limit for Speed Harmonization
Speed harmonization is intended to improve safety and mobility of traffic through freeway bottlenecks during congested periods. It uses variable speed limit (VSL) or variable advisory speed messages to delay breakdown and suppress frequent stop-and-go conditions by reducing the speed differential between free flowing and queued vehicles.
Hoogen and Smulders20 evaluated the effectiveness of VSL on motorways in the Netherlands. They found that VSL improved the uniformity of traffic flow (i.e., volume, speed, and occupancy variances between and within lanes decreased). Borrough21 found that the enforcement of VSL in England resulted in 28% reduction in the number of collisions during an 18-month period. It was also found that the number of lane changes decreased and motorists tended to keep proper following distances when a “faster lane” no longer existed. Hegyi et al.22 developed a method for optimal coordination of VSL and ramp metering. They demonstrated the potential benefits of variable speed limits in minimizing total travel time and suppressing shockwaves. Park and Yadlapati23 evaluated a number of variable speed limit control logics at work zones using microscopic simulation (VISSIM). They used a minimum safety distance equation as a surrogate safety measure. They found that VSL can improve both mobility and safety at work zones. Zhicai et al.24 tested various VSL strategies for various traffic demands and for different roadway geometry, lane closure, and incident scenarios. Another study by Abdel-Aty et al.25 investigated the safety benefit of VSL using traffic data from IH 4 in Central Florida. Various VSL strategies were tested at three individual locations. They found that VSL is most beneficial when speed limits upstream of the risk-prone location are greatly reduced, and the speed limits downstream of this location are increased.
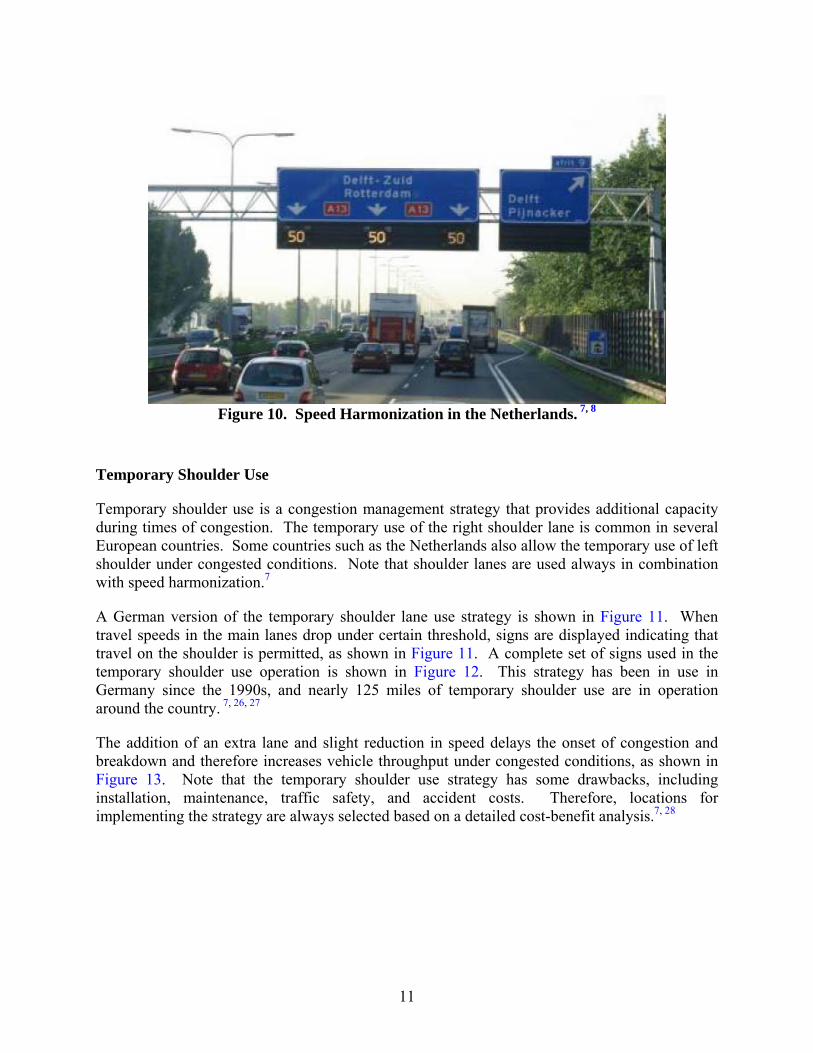
Speed harmonization techniques using VSL are common in many European countries. Such systems may be deployed to promote safer driving during recurring congested periods, incidents, or under adverse weather conditions. Figure 10 shows a VSL system operated in the Netherlands.7, 8
11
Figure 10. Speed Harmonization in the Netherlands. 7, 8
Temporary Shoulder Use
Temporary shoulder use is a congestion management strategy that provides additional capacity during times of congestion. The temporary use of the right shoulder lane is common in several European countries. Some countries such as the Netherlands also allow the temporary use of left shoulder under congested conditions. Note that shoulder lanes are used always in combination with speed harmonization.7
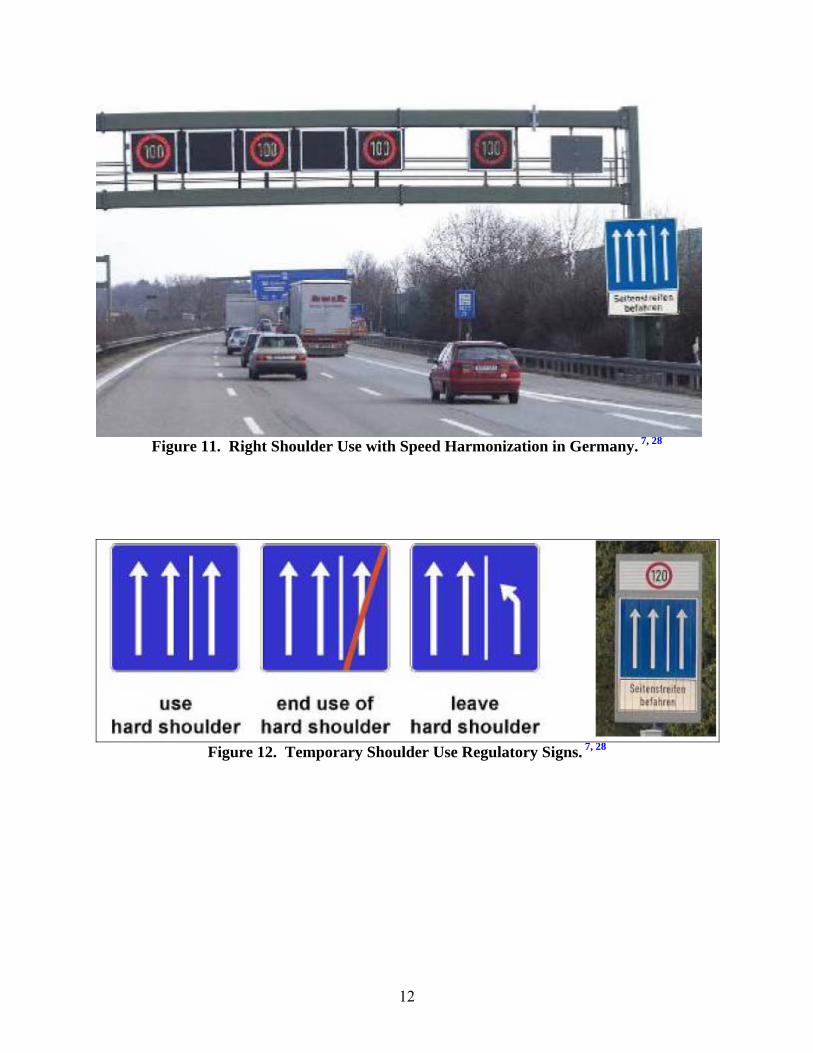
A German version of the temporary shoulder lane use strategy is shown in Figure 11. When travel speeds in the main lanes drop under certain threshold, signs are displayed indicating that travel on the shoulder is permitted, as shown in Figure 11. A complete set of signs used in the temporary shoulder use operation is shown in Figure 12. This strategy has been in use in Germany since the 1990s, and nearly 125 miles of temporary shoulder use are in operation around the country. 7, 26, 27
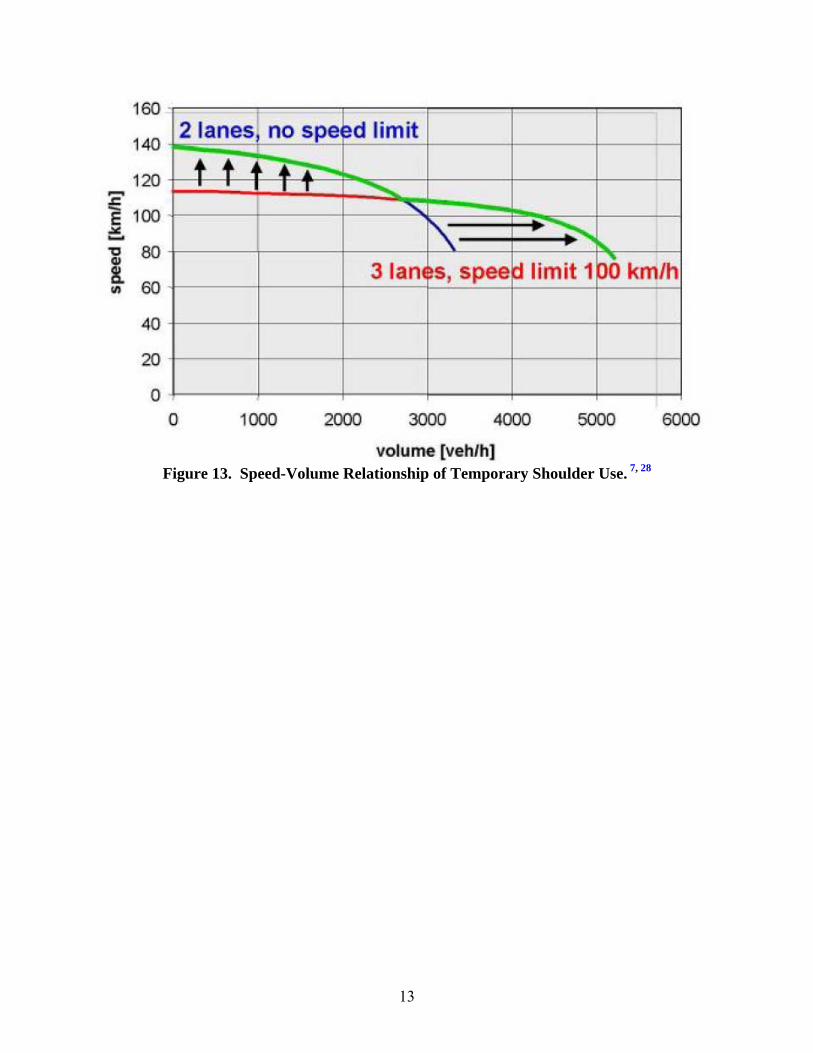
The addition of an extra lane and slight reduction in speed delays the onset of congestion and breakdown and therefore increases vehicle throughput under congested conditions, as shown in Figure 13. Note that the temporary shoulder use strategy has some drawbacks, including installation, maintenance, traffic safety, and accident costs. Therefore, locations for implementing the strategy are always selected based on a detailed cost-benefit analysis.7, 28
12
Figure 11. Right Shoulder Use with Speed Harmonization in Germany. 7, 28
Figure 12. Temporary Shoulder Use Regulatory Signs. 7, 28
13
Figure 13. Speed-Volume Relationship of Temporary Shoulder Use. 7, 28
14
Collision Avoidance Systems Using Obstacle Detection
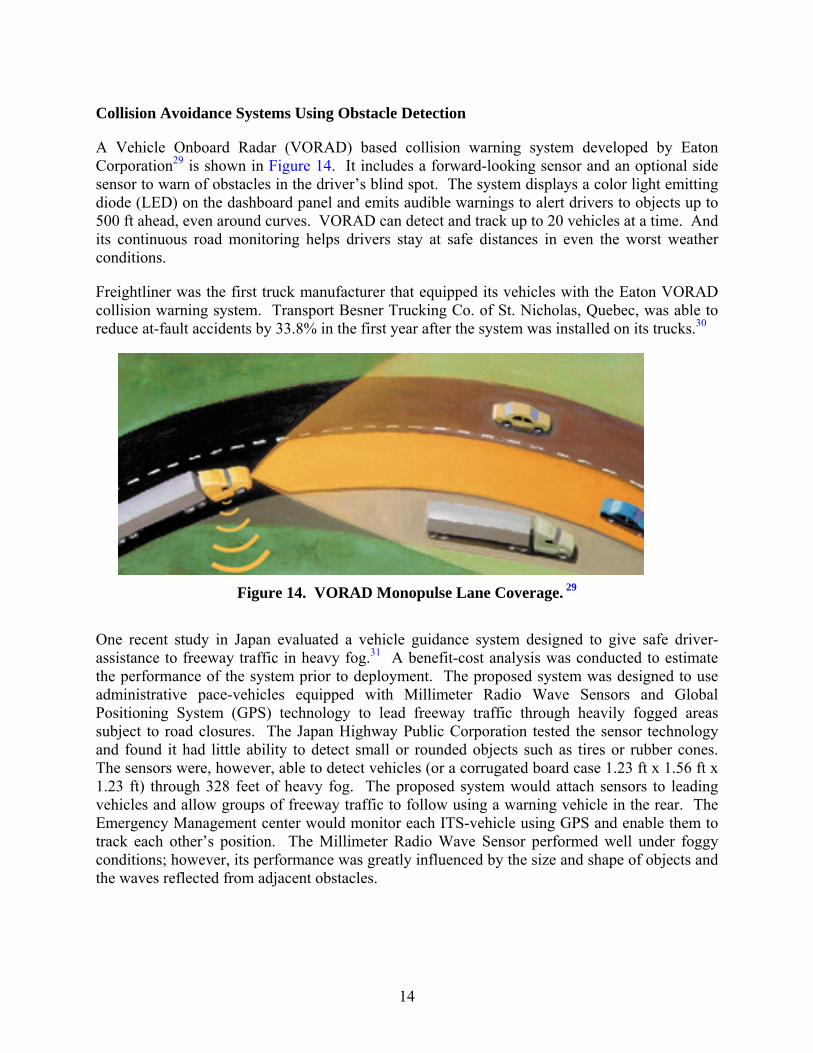
A Vehicle Onboard Radar (VORAD) based collision warning system developed by Eaton Corporation29 is shown in Figure 14. It includes a forward-looking sensor and an optional side sensor to warn of obstacles in the driver’s blind spot. The system displays a color light emitting diode (LED) on the dashboard panel and emits audible warnings to alert drivers to objects up to 500 ft ahead, even around curves. VORAD can detect and track up to 20 vehicles at a time. And its continuous road monitoring helps drivers stay at safe distances in even the worst weather conditions.
Freightliner was the first truck manufacturer that equipped its vehicles with the Eaton VORAD collision warning system. Transport Besner Trucking Co. of St. Nicholas, Quebec, was able to reduce at-fault accidents by 33.8% in the first year after the system was installed on its trucks.30
Figure 14. VORAD Monopulse Lane Coverage. 29
One recent study in Japan evaluated a vehicle guidance system designed to give safe driver-assistance to freeway traffic in heavy fog.31 A benefit-cost analysis was conducted to estimate the performance of the system prior to deployment. The proposed system was designed to use administrative pace-vehicles equipped with Millimeter Radio Wave Sensors and Global Positioning System (GPS) technology to lead freeway traffic through heavily fogged areas subject to road closures. The Japan Highway Public Corporation tested the sensor technology and found it had little ability to detect small or rounded objects such as tires or rubber cones. The sensors were, however, able to detect vehicles (or a corrugated board case 1.23 ft x 1.56 ft x 1.23 ft) through 328 feet of heavy fog. The proposed system would attach sensors to leading vehicles and allow groups of freeway traffic to follow using a warning vehicle in the rear. The Emergency Management center would monitor each ITS-vehicle using GPS and enable them to track each other’s position. The Millimeter Radio Wave Sensor performed well under foggy conditions; however, its performance was greatly influenced by the size and shape of objects and the waves reflected from adjacent obstacles.
15
Koziol et al.32 examined the safety, performance, user-acceptance, and deployment of Intelligent Cruise Control (ICC) systems. The findings were based on a field operational test (FOT) conducted by the National Highway Traffic Safety Administration (NHTSA) and the University of Michigan Transportation Research Institute (UMTRI). The FOT involved 108 volunteer test drivers and 10 ICC-equipped Chrysler Concordes. The testing was performed between July 1996 and September 1997, and the results were analyzed by Volpe Transportation Systems Center and Science Applications International Corporation (SAIC).
The ICC system was designed to automatically maintain a set-time headway using throttle modulation and down-shifting (but not braking) at speeds above 25 mph. When traffic was encountered, the ICC-equipped vehicles automatically adjusted their speed settings. When vehicles were not in traffic, the ICC system operated like conventional cruise control (CCC). UMTRI selected participants from a database of 3000 licensed drivers in Southeast Michigan. A total of 108 drivers from three different age groups (20 to 30; 40 to 50; and 60 to 70 years) were recruited to participate in the evaluation and test drive 10 mid-size passenger cars equipped with ICC. UMTRI staff introduced the ICC vehicle to participants and then demonstrated the system on interstate and state highways. Participants were informed that the cruise control system would operate conventionally during the first week, and then ICC functions would become available. The findings of the UMTRI study were based on questionnaires given to drivers and vehicle performance data collected from field trials designed from a surrogate safety analysis framework. The framework criteria evaluated vehicle behavior in terms of following, closing, cruising, or separating activities as a result of cut-ins, lane changes, approaches, and lead vehicle decelerations. The ICC-system performed well during controlled experiments on public roadways. The vehicle sensors were able to detect vehicle targets in the specified field of view, maintain set headways and velocities, and reduced the need for drivers to brake unnecessarily within the ICC control parameters. ICC sensors were able to reliably detect vehicle targets at a maximum distance of 100 meters. However, in severe rain and snow the vehicle sensors had performance problems due to backscatter.32
Lane Drift Warning
Lane Drift Warning Systems (LDWS) are designed to reduce road departure collisions through in-vehicle driver notification or warning. Available technology uses an in-vehicle camera-based system to monitor vehicle position within its travel lane and warn the driver if the vehicle drifts out of a lane unintentionally as a result of driver drowsiness, distraction, or inattention. The system may activate in-vehicle countermeasures such as directional audible or haptic signal systems to inform the driver which way to steer.33
Camera-based LDWS may not be designed to function during certain adverse environmental conditions (e.g., nighttime rain with reflections from oncoming lights, snow-covered roadways, sun very low in sky), where lane boundaries are missing, or at low speeds.
The results of the evaluation study33 suggested that LDWS have the potential to reduce road departure collisions in passenger vehicles by approximately 10% and reduce road departure collisions in heavy trucks by approximately 30%. The impacts on heavy trucks were relatively higher than those for passenger cars primarily because trucks have a higher frequency of drowsy-
16
related collisions and lower frequency of intoxication- related collisions compared to passenger vehicles.
Intersection Collision Warning System
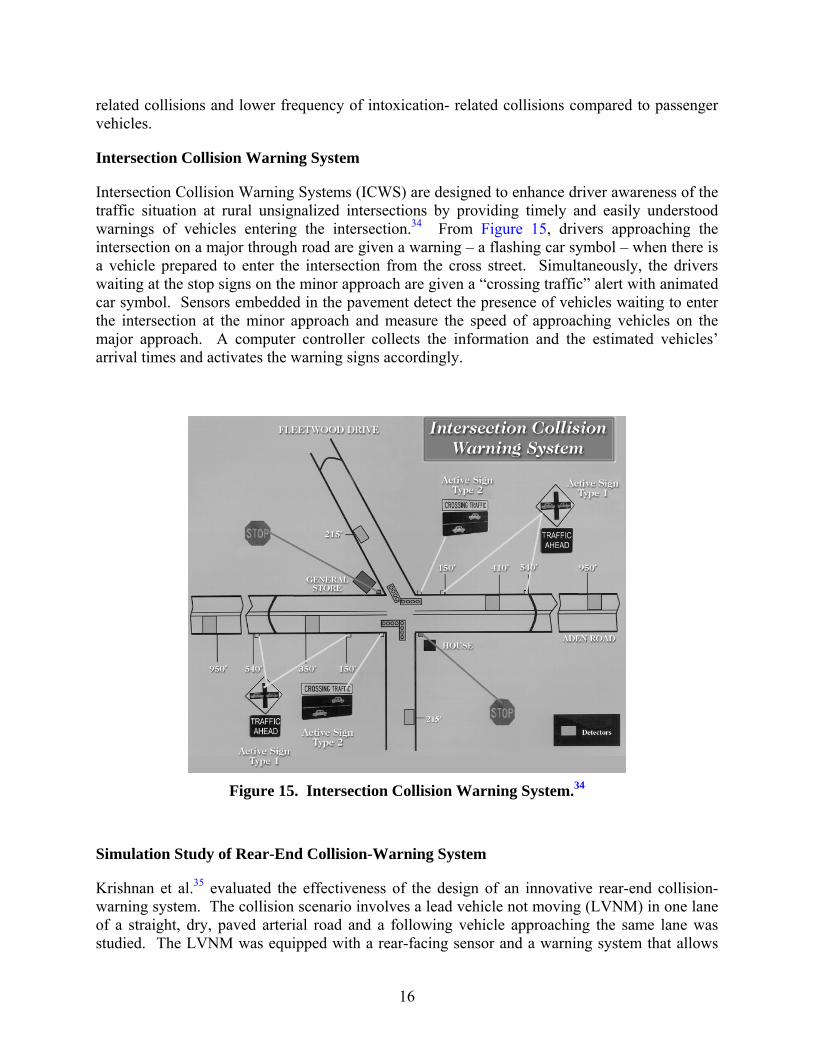
Intersection Collision Warning Systems (ICWS) are designed to enhance driver awareness of the traffic situation at rural unsignalized intersections by providing timely and easily understood warnings of vehicles entering the intersection.34 From Figure 15, drivers approaching the intersection on a major through road are given a warning – a flashing car symbol – when there is a vehicle prepared to enter the intersection from the cross street. Simultaneously, the drivers waiting at the stop signs on the minor approach are given a “crossing traffic” alert with animated car symbol. Sensors embedded in the pavement detect the presence of vehicles waiting to enter the intersection at the minor approach and measure the speed of approaching vehicles on the major approach. A computer controller collects the information and the estimated vehicles’ arrival times and activates the warning signs accordingly.
Figure 15. Intersection Collision Warning System.34
Simulation Study of Rear-End Collision-Warning System
Krishnan et al.35 evaluated the effectiveness of the design of an innovative rear-end collision-warning system. The collision scenario involves a lead vehicle not moving (LVNM) in one lane of a straight, dry, paved arterial road and a following vehicle approaching the same lane was studied. The LVNM was equipped with a rear-facing sensor and a warning system that allows
17
the LVNM to flash its brake lights or its center high-mounted stop lamp, warning the following vehicle that it is approaching too rapidly. It was assumed in the study that the driver of the following vehicle always noticed the warning after a response time lag and then applied hard braking. The algorithm was designed to select the most appropriate warning distance for each approaching vehicle speed. The objectives of the design were to maximize the capability of preventing collisions, reduce the frequency of nuisance alarms, and minimize the severity of collisions. It was found that it is possible to design a rear-end collision warning system that can be effective in preventing collisions without generating excessive nuisance alerts. However, experimental studies and field operational tests would be needed to obtain more accurate numerical values for the design parameters.
Lee et al.36 conducted experiments to develop rear-end collision warning systems that allow drivers to detect stopped and slowing leading vehicles with peripheral vision and foveal vision more quickly. The experimental results revealed that the a lamp with a motorized reflector that moves in an M-sweep pattern, was the top candidate for an imminent collision warning signal, while a pair of centrally located alternating halogen lamps would be optimal for a stopped or slowly moving vehicle signal. The TCL was also found to be superior to the alternating pair configurations in attention getting and peripheral detection for an imminent collision warning signal, with glare reduced by the use of tinted lenses in either red or amber. The high-output halogen alternating pair with either amber or red dispersive lenses represented the best configuration alternative for the stopped or slowly moving vehicle signal.
REVIEW OF LITERATURE ON MERGE CONTROL
Early Merge
Early Merge strategies encourage drivers to merge into the open lane farther in advance of the lane closure. These strategies are of two basic types, static and dynamic.
Static Early Merge
Static forms of early merge provide advance notice at a fixed distance ahead of the lane closure. Additional advance lane closed signs are placed at approximately one-mile intervals for several miles in advance of the lane closure. The additional signs reduce the probability of drivers encountering congestion without knowing which lane is closed. The early advance lane closure notice enables them to merge into the open lane before arriving at the end of the queue, which may reduce the potential for merge-related collisions. Also, it may reduce rear-end collision potential by alerting drivers to the possibility of congestion farther in advance of the lane closure. Simulation studies indicated that Early Merge control strategies significantly reduced the frequency of forced merges37 but increased travel times, especially at higher traffic volumes.38 Vehicles are more likely to be delayed over greater distances by slower vehicles ahead of them in the open lane. This may in turn increase the likelihood of drivers attempting to use the discontinuous lane to pass slower vehicles, which would increase the potential of lane-change accidents.
18
Dynamic Early Merge Strategies
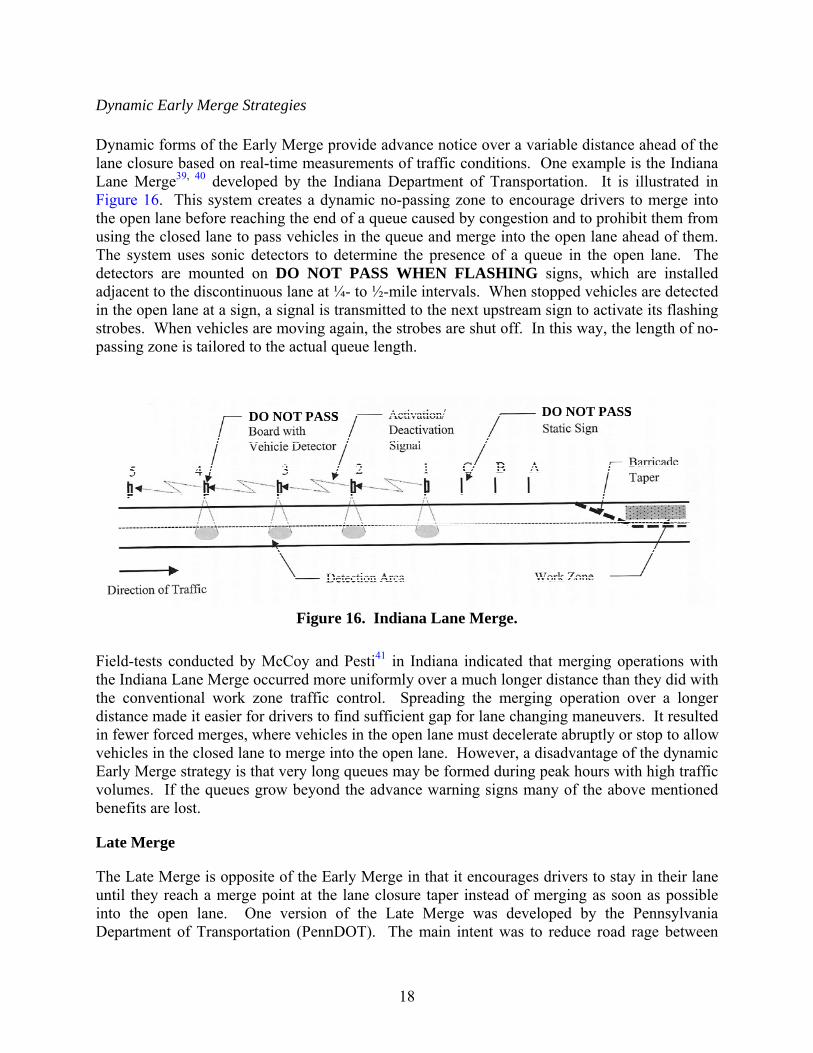
Dynamic forms of the Early Merge provide advance notice over a variable distance ahead of the lane closure based on real-time measurements of traffic conditions. One example is the Indiana Lane Merge39, 40 developed by the Indiana Department of Transportation. It is illustrated in Figure 16. This system creates a dynamic no-passing zone to encourage drivers to merge into the open lane before reaching the end of a queue caused by congestion and to prohibit them from using the closed lane to pass vehicles in the queue and merge into the open lane ahead of them. The system uses sonic detectors to determine the presence of a queue in the open lane. The detectors are mounted on DO NOT PASS WHEN FLASHING signs, which are installed adjacent to the discontinuous lane at ¼- to ½-mile intervals. When stopped vehicles are detected in the open lane at a sign, a signal is transmitted to the next upstream sign to activate its flashing strobes. When vehicles are moving again, the strobes are shut off. In this way, the length of no-passing zone is tailored to the actual queue length.
DO NOT PASS DO NOT PASSDO NOT PASSDO NOT PASS DO NOT PASSDO NOT PASS
Figure 16. Indiana Lane Merge.
Field-tests conducted by McCoy and Pesti41 in Indiana indicated that merging operations with the Indiana Lane Merge occurred more uniformly over a much longer distance than they did with the conventional work zone traffic control. Spreading the merging operation over a longer distance made it easier for drivers to find sufficient gap for lane changing maneuvers. It resulted in fewer forced merges, where vehicles in the open lane must decelerate abruptly or stop to allow vehicles in the closed lane to merge into the open lane. However, a disadvantage of the dynamic Early Merge strategy is that very long queues may be formed during peak hours with high traffic volumes. If the queues grow beyond the advance warning signs many of the above mentioned benefits are lost.
Late Merge
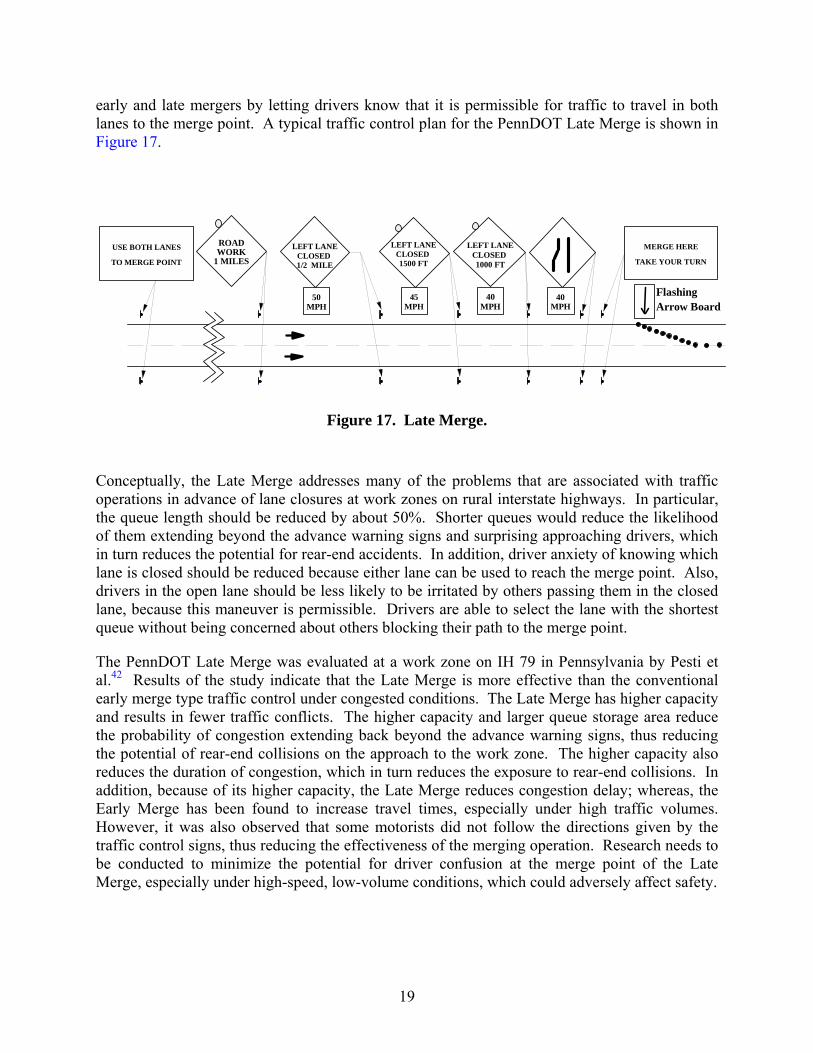
The Late Merge is opposite of the Early Merge in that it encourages drivers to stay in their lane until they reach a merge point at the lane closure taper instead of merging as soon as possible into the open lane. One version of the Late Merge was developed by the Pennsylvania Department of Transportation (PennDOT). The main intent was to reduce road rage between
19
early and late mergers by letting drivers know that it is permissible for traffic to travel in both lanes to the merge point. A typical traffic control plan for the PennDOT Late Merge is shown in Figure 17.
ROADWORK
1 MILESUSE BOTH LANES
TO MERGE POINT
LEFT LANECLOSED 1/2 MILE
50MPH
LEFT LANECLOSED 1500 FT
LEFT LANECLOSED 1000 FT
45MPH
40MPH
40MPH
MERGE HERE
TAKE YOUR TURN
CMS
FlashingArrow Board
ROADWORK
1 MILESUSE BOTH LANES
TO MERGE POINT
LEFT LANECLOSED 1/2 MILE
50MPH
LEFT LANECLOSED 1500 FT
LEFT LANECLOSED 1000 FT
45MPH
40MPH
40MPH
MERGE HERE
TAKE YOUR TURN
CMS
FlashingArrow Board
Figure 17. Late Merge.
Conceptually, the Late Merge addresses many of the problems that are associated with traffic operations in advance of lane closures at work zones on rural interstate highways. In particular, the queue length should be reduced by about 50%. Shorter queues would reduce the likelihood of them extending beyond the advance warning signs and surprising approaching drivers, which in turn reduces the potential for rear-end accidents. In addition, driver anxiety of knowing which lane is closed should be reduced because either lane can be used to reach the merge point. Also, drivers in the open lane should be less likely to be irritated by others passing them in the closed lane, because this maneuver is permissible. Drivers are able to select the lane with the shortest queue without being concerned about others blocking their path to the merge point.
The PennDOT Late Merge was evaluated at a work zone on IH 79 in Pennsylvania by Pesti et al.42 Results of the study indicate that the Late Merge is more effective than the conventional early merge type traffic control under congested conditions. The Late Merge has higher capacity and results in fewer traffic conflicts. The higher capacity and larger queue storage area reduce the probability of congestion extending back beyond the advance warning signs, thus reducing the potential of rear-end collisions on the approach to the work zone. The higher capacity also reduces the duration of congestion, which in turn reduces the exposure to rear-end collisions. In addition, because of its higher capacity, the Late Merge reduces congestion delay; whereas, the Early Merge has been found to increase travel times, especially under high traffic volumes. However, it was also observed that some motorists did not follow the directions given by the traffic control signs, thus reducing the effectiveness of the merging operation. Research needs to be conducted to minimize the potential for driver confusion at the merge point of the Late Merge, especially under high-speed, low-volume conditions, which could adversely affect safety.
20
Dynamic Late Merge Concept
Based on findings of previous merge control research,42 the Late Merge seems to be the most effective control during peak periods. However, because of some operational and safety issues regarding its operation under high-speed, low-volume conditions, the Late Merge may not be the most appropriate during off-peak periods. In order to maintain optimum merging operations at all times, it would be necessary to convert from the Early Merge during periods of non-congested flow to the Late Merge during periods of congested flow. This recognition has lead to the development of the Dynamic Late Merge concept by McCoy and Pesti.43 This merge control strategy is expected to provide the safest and most efficient merging operations at all times in advance of the lane closure by switching between the early merge-type conventional traffic control and the Late Merge, based on real-time measurements of traffic conditions.
It is envisioned that the Dynamic Late Merge would be used as a condition-responsive traffic control plan in this research. It would consist of a series of advance signs. When congestion is detected in the open lane adjacent to the signs, they would be activated to advise drivers to stay in their lane until they reach the merge point. A sign would also be placed at the merge point advising drivers to alternately merge. When the congestion clears, the signs would be deactivated, or changed, to advise drivers of the lane closure, or display speed advisory messages. The signs could be variable message signs equipped with traffic detectors similar to the radar-equipped sign shown in Figure 3, which is used in the ADAPTIRTM system. Alternatively, the signs could also be static signs equipped with traffic detectors and flashing strobes.
Research is needed to determine the most effective sign message, type, and spacing. The length of signing in advance of the lane closure should be longer than the longest backup expected for the design flow rate and capacity of the work zone. Research is also needed to determine the traffic conditions (i.e., volume, and speed thresholds) for switching between the Early and Late Merge control.
Dynamic Late Merge Evaluations
The Dynamic Late Merge (or simply Dynamic Merge) control has been evaluated at work zones in several states. This section summarizes the findings of three recent evaluation studies conducted in Maryland44 and Kansas.45
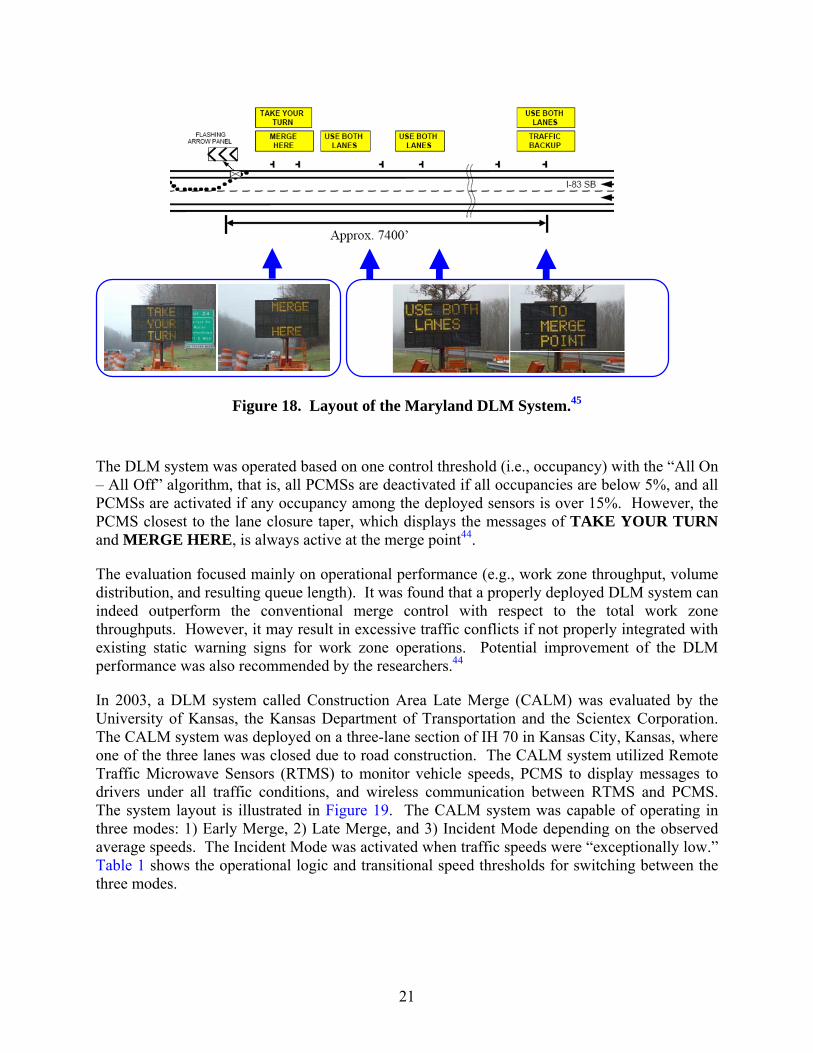
In 2003, the Maryland State Highway Administration in cooperation with International Road Dynamics Inc. implemented and evaluated the Dynamic Late Merge (DLM) at a freeway work zone in Maryland. Layout of the field study site is shown in Figure 18.
21
Figure 18. Layout of the Maryland DLM System.45
The DLM system was operated based on one control threshold (i.e., occupancy) with the “All On – All Off” algorithm, that is, all PCMSs are deactivated if all occupancies are below 5%, and all PCMSs are activated if any occupancy among the deployed sensors is over 15%. However, the PCMS closest to the lane closure taper, which displays the messages of TAKE YOUR TURN and MERGE HERE, is always active at the merge point44.
The evaluation focused mainly on operational performance (e.g., work zone throughput, volume distribution, and resulting queue length). It was found that a properly deployed DLM system can indeed outperform the conventional merge control with respect to the total work zone throughputs. However, it may result in excessive traffic conflicts if not properly integrated with existing static warning signs for work zone operations. Potential improvement of the DLM performance was also recommended by the researchers.44
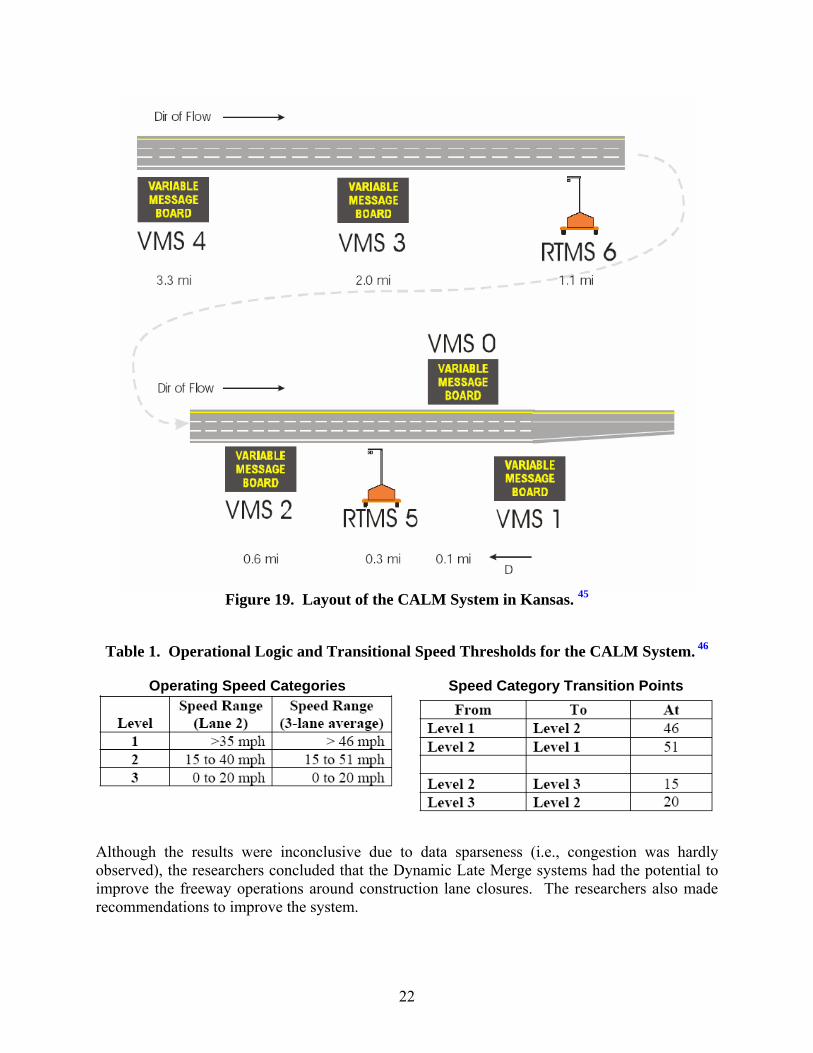
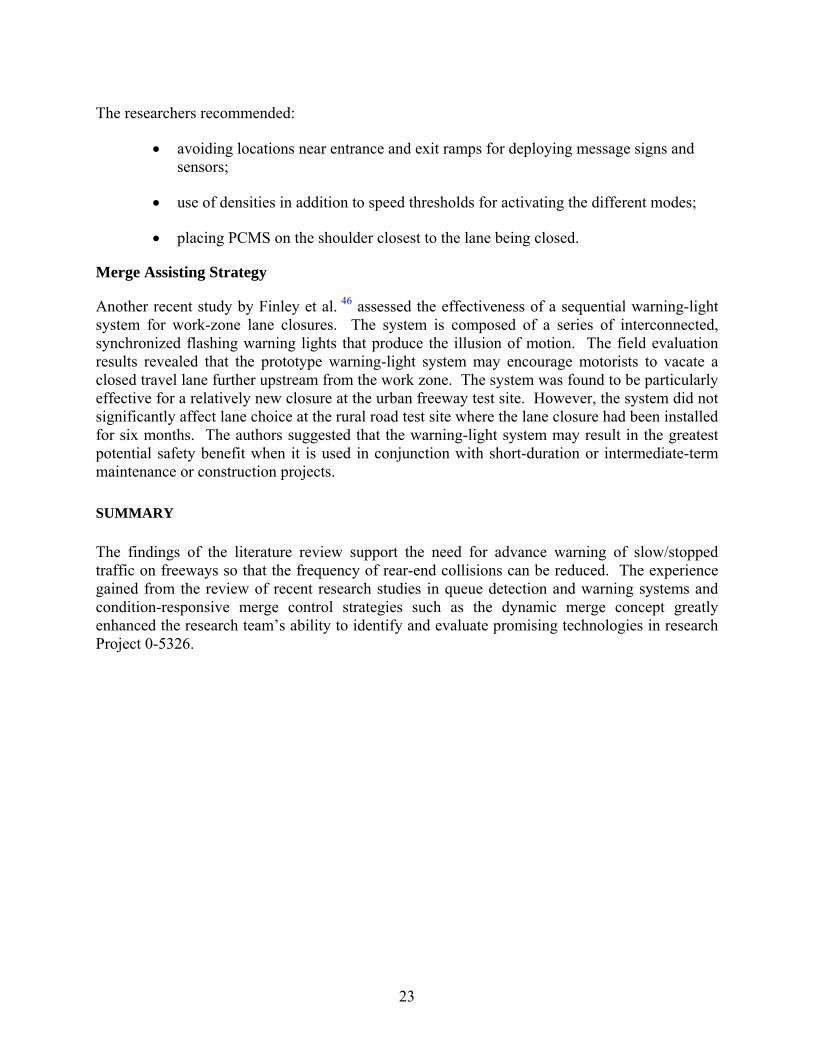
In 2003, a DLM system called Construction Area Late Merge (CALM) was evaluated by the University of Kansas, the Kansas Department of Transportation and the Scientex Corporation. The CALM system was deployed on a three-lane section of IH 70 in Kansas City, Kansas, where one of the three lanes was closed due to road construction. The CALM system utilized Remote Traffic Microwave Sensors (RTMS) to monitor vehicle speeds, PCMS to display messages to drivers under all traffic conditions, and wireless communication between RTMS and PCMS. The system layout is illustrated in Figure 19. The CALM system was capable of operating in three modes: 1) Early Merge, 2) Late Merge, and 3) Incident Mode depending on the observed average speeds. The Incident Mode was activated when traffic speeds were “exceptionally low.” Table 1 shows the operational logic and transitional speed thresholds for switching between the three modes.
22
Figure 19. Layout of the CALM System in Kansas. 45
Table 1. Operational Logic and Transitional Speed Thresholds for the CALM System. 46
Operating Speed Categories
Speed Category Transition Points
Although the results were inconclusive due to data sparseness (i.e., congestion was hardly observed), the researchers concluded that the Dynamic Late Merge systems had the potential to improve the freeway operations around construction lane closures. The researchers also made recommendations to improve the system.
23
The researchers recommended:
• avoiding locations near entrance and exit ramps for deploying message signs and sensors;
• use of densities in addition to speed thresholds for activating the different modes;
• placing PCMS on the shoulder closest to the lane being closed.
Merge Assisting Strategy
Another recent study by Finley et al. 46 assessed the effectiveness of a sequential warning-light system for work-zone lane closures. The system is composed of a series of interconnected, synchronized flashing warning lights that produce the illusion of motion. The field evaluation results revealed that the prototype warning-light system may encourage motorists to vacate a closed travel lane further upstream from the work zone. The system was found to be particularly effective for a relatively new closure at the urban freeway test site. However, the system did not significantly affect lane choice at the rural road test site where the lane closure had been installed for six months. The authors suggested that the warning-light system may result in the greatest potential safety benefit when it is used in conjunction with short-duration or intermediate-term maintenance or construction projects.
SUMMARY
The findings of the literature review support the need for advance warning of slow/stopped traffic on freeways so that the frequency of rear-end collisions can be reduced. The experience gained from the review of recent research studies in queue detection and warning systems and condition-responsive merge control strategies such as the dynamic merge concept greatly enhanced the research team’s ability to identify and evaluate promising technologies in research Project 0-5326.

24
25
SURVEY OF CURRENT STATE OF PRACTICE
The primary objective of this task was to determine the current state of practice in using advance warnings and merge control techniques upstream of congested freeway segments. The current practice in Texas and some other states, as well as other countries was reviewed. In addition, vendors and equipment suppliers were contacted to identify technologies that may be applicable to this research and can be implemented and field-tested during the project timeframe.
INTERVIEW TXDOT DISTRICTS
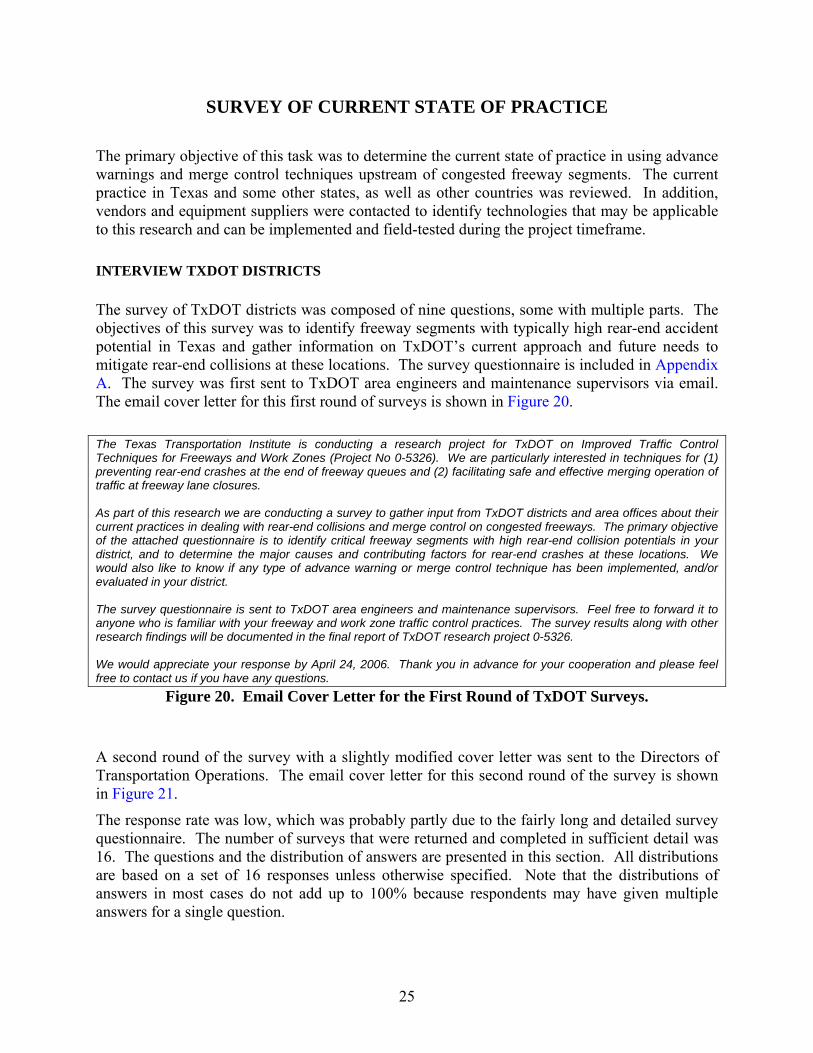
The survey of TxDOT districts was composed of nine questions, some with multiple parts. The objectives of this survey was to identify freeway segments with typically high rear-end accident potential in Texas and gather information on TxDOT’s current approach and future needs to mitigate rear-end collisions at these locations. The survey questionnaire is included in Appendix A. The survey was first sent to TxDOT area engineers and maintenance supervisors via email. The email cover letter for this first round of surveys is shown in Figure 20. The Texas Transportation Institute is conducting a research project for TxDOT on Improved Traffic Control Techniques for Freeways and Work Zones (Project No 0-5326). We are particularly interested in techniques for (1) preventing rear-end crashes at the end of freeway queues and (2) facilitating safe and effective merging operation of traffic at freeway lane closures. As part of this research we are conducting a survey to gather input from TxDOT districts and area offices about their current practices in dealing with rear-end collisions and merge control on congested freeways. The primary objective of the attached questionnaire is to identify critical freeway segments with high rear-end collision potentials in your district, and to determine the major causes and contributing factors for rear-end crashes at these locations. We would also like to know if any type of advance warning or merge control technique has been implemented, and/or evaluated in your district. The survey questionnaire is sent to TxDOT area engineers and maintenance supervisors. Feel free to forward it to anyone who is familiar with your freeway and work zone traffic control practices. The survey results along with other research findings will be documented in the final report of TxDOT research project 0-5326. We would appreciate your response by April 24, 2006. Thank you in advance for your cooperation and please feel free to contact us if you have any questions.
Figure 20. Email Cover Letter for the First Round of TxDOT Surveys.
A second round of the survey with a slightly modified cover letter was sent to the Directors of Transportation Operations. The email cover letter for this second round of the survey is shown in Figure 21.
The response rate was low, which was probably partly due to the fairly long and detailed survey questionnaire. The number of surveys that were returned and completed in sufficient detail was 16. The questions and the distribution of answers are presented in this section. All distributions are based on a set of 16 responses unless otherwise specified. Note that the distributions of answers in most cases do not add up to 100% because respondents may have given multiple answers for a single question.
26
The Texas Transportation Institute is conducting a research project for TxDOT on Improved Traffic Control Techniques for Freeways and Work Zones (Project No 0-5326). As part of this research we are conducting a survey to gather input from TxDOT districts about their current practices in dealing with rear-end collisions and merge control on congested freeways. This is the second round of the survey. If you have already received, completed and returned it, please disregard this email. We are particularly interested in techniques for (1) preventing rear-end crashes at the end of freeway queues, and (2) facilitating safe and effective merging operation of traffic at freeway lane closures. The primary objectives of the attached questionnaire are to identify critical freeway segments with high rear-end crash potentials in your district, and to determine the major causes and contributing factors for rear-end crashes at these locations. We would also like to know if any type of advance warning or merge control strategies have been implemented, and/or evaluated in your district. Your response is very important and will significantly contribute to the success of the project. The survey results along with other research findings will be documented in the final report of TxDOT research project 0-5326. I would appreciate your response by July 31, 2006. Thank you in advance for your cooperation and please feel free to contact me if you have any questions.
Figure 21. Email Cover Letter for the Second Round of TxDOT Surveys.
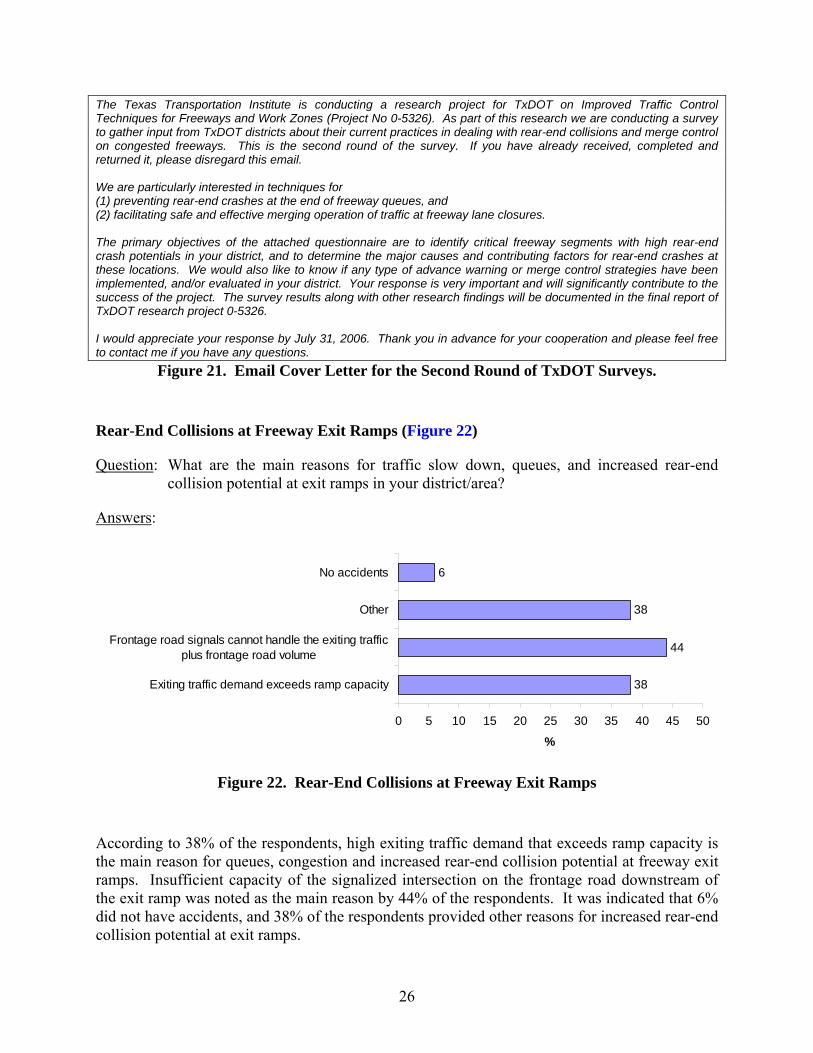
Rear-End Collisions at Freeway Exit Ramps (Figure 22)
Question: What are the main reasons for traffic slow down, queues, and increased rear-end collision potential at exit ramps in your district/area?
Answers:
38
44
38
6
0 5 10 15 20 25 30 35 40 45 50
Exiting traffic demand exceeds ramp capacity
Frontage road signals cannot handle the exiting trafficplus frontage road volume
Other
No accidents
%
Figure 22. Rear-End Collisions at Freeway Exit Ramps
According to 38% of the respondents, high exiting traffic demand that exceeds ramp capacity is the main reason for queues, congestion and increased rear-end collision potential at freeway exit ramps. Insufficient capacity of the signalized intersection on the frontage road downstream of the exit ramp was noted as the main reason by 44% of the respondents. It was indicated that 6% did not have accidents, and 38% of the respondents provided other reasons for increased rear-end collision potential at exit ramps.
27
Some of these other reasons are quoted here:
• accidents that have occurred and re-routing of traffic;
• freeway traffic exceeds speed limits, also aggressive driving;
• excessive speed while exiting ramps;
• exiting traffic slows too much trying to cross multiple lanes to turn into a side street or business;
• frontage road traffic is trying to change lanes to the left while exiting traffic is trying to move right (weaving lanes) causing slow downs on the exit ramps;
• impatient irate drivers, increased traffic volume, and tailgating;
• volume of traffic exiting at the Border Patrol Checkpoint.
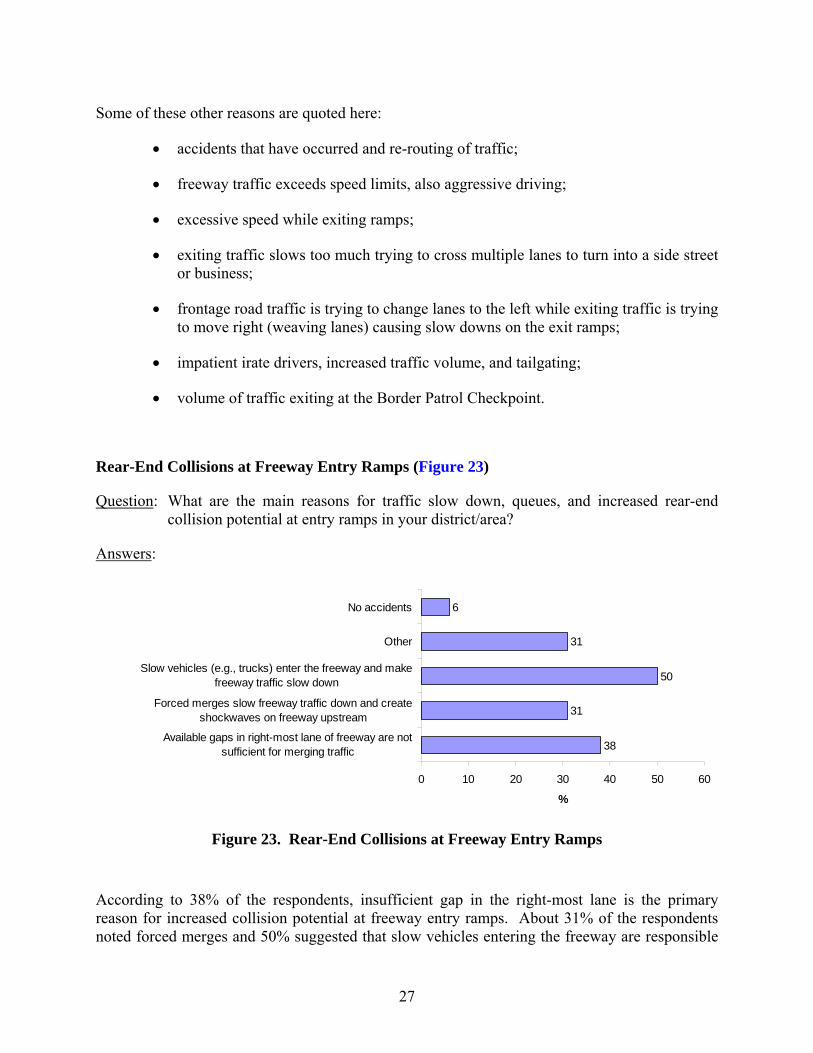
Rear-End Collisions at Freeway Entry Ramps (Figure 23)
Question: What are the main reasons for traffic slow down, queues, and increased rear-end collision potential at entry ramps in your district/area?
Answers:
38
31
50
31
6
0 10 20 30 40 50 60
Available gaps in right-most lane of freeway are notsufficient for merging traffic
Forced merges slow freeway traffic down and createshockwaves on freeway upstream
Slow vehicles (e.g., trucks) enter the freeway and makefreeway traffic slow down
Other
No accidents
%
Figure 23. Rear-End Collisions at Freeway Entry Ramps
According to 38% of the respondents, insufficient gap in the right-most lane is the primary reason for increased collision potential at freeway entry ramps. About 31% of the respondents noted forced merges and 50% suggested that slow vehicles entering the freeway are responsible
28
for most of the traffic slow downs and rear-end collisions at freeway entry-ramps. About 6% of the respondents have not experienced accidents at entry-ramps, and 31% gave other reasons. Some of these other reasons are quoted below:
• accidents that have occurred and re-routing of traffic;
• stop-and-go surge traffic;
• entrance ramps are not long enough for merging traffic and acceleration lanes are also too short or non-existing;
• bad interchange design such as clover-leaf and trumpet styles;
• entrance ramp is a one-lane ramp.
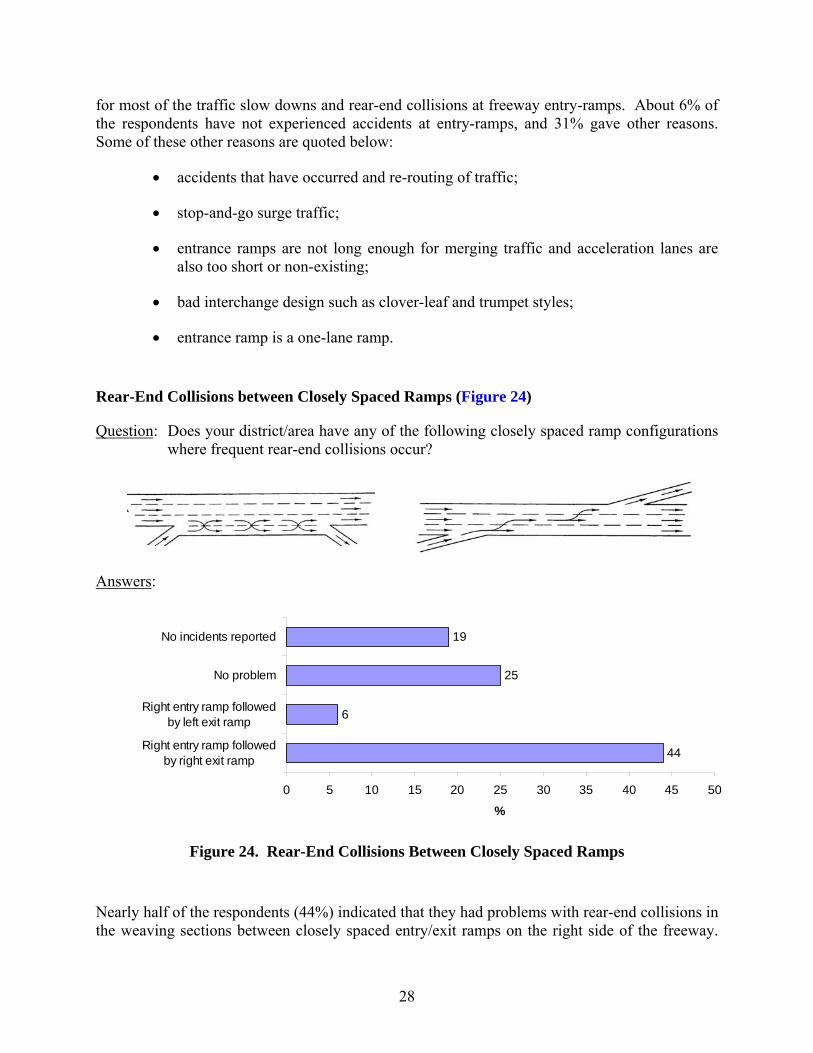
Rear-End Collisions between Closely Spaced Ramps (Figure 24)
Question: Does your district/area have any of the following closely spaced ramp configurations where frequent rear-end collisions occur?
Answers:
44
6
25
19
0 5 10 15 20 25 30 35 40 45 50
Right entry ramp followedby right exit ramp
Right entry ramp followedby left exit ramp
No problem
No incidents reported
%
Figure 24. Rear-End Collisions Between Closely Spaced Ramps
Nearly half of the respondents (44%) indicated that they had problems with rear-end collisions in the weaving sections between closely spaced entry/exit ramps on the right side of the freeway.
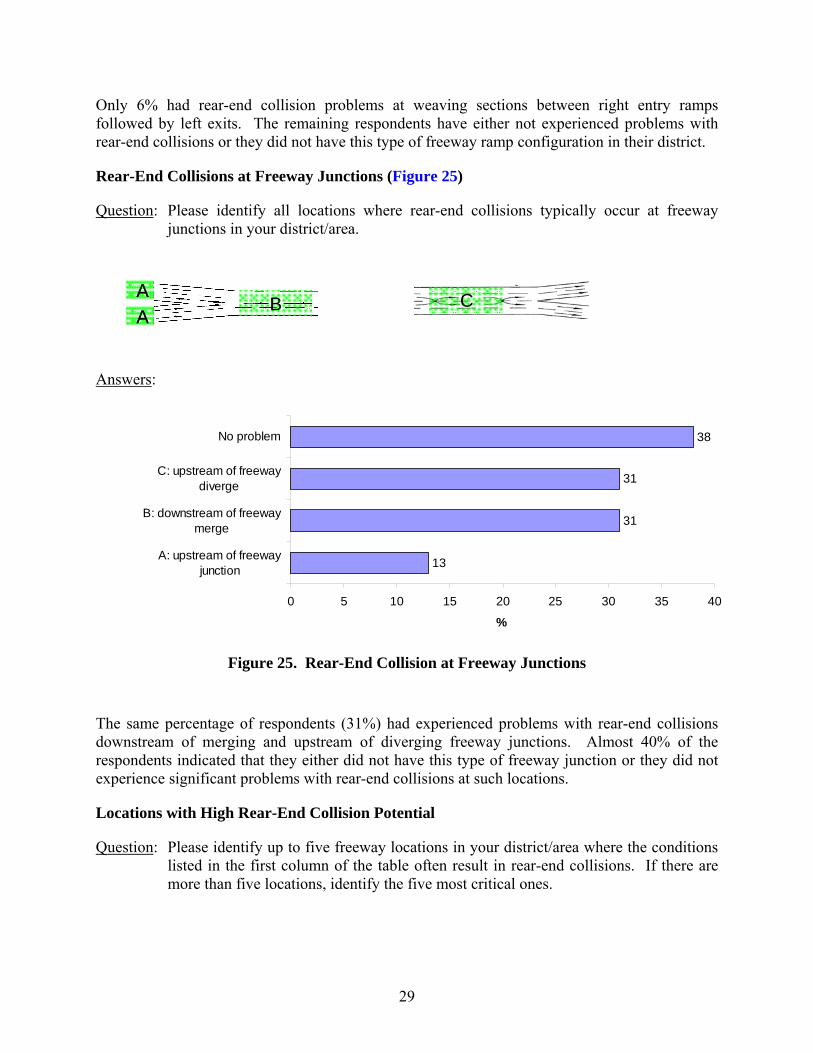
29
Only 6% had rear-end collision problems at weaving sections between right entry ramps followed by left exits. The remaining respondents have either not experienced problems with rear-end collisions or they did not have this type of freeway ramp configuration in their district.
Rear-End Collisions at Freeway Junctions (Figure 25)
Question: Please identify all locations where rear-end collisions typically occur at freeway junctions in your district/area.
Answers:
13
31
31
38
0 5 10 15 20 25 30 35 40
A: upstream of freewayjunction
B: downstream of freewaymerge
C: upstream of freewaydiverge
No problem
%
Figure 25. Rear-End Collision at Freeway Junctions
The same percentage of respondents (31%) had experienced problems with rear-end collisions downstream of merging and upstream of diverging freeway junctions. Almost 40% of the respondents indicated that they either did not have this type of freeway junction or they did not experience significant problems with rear-end collisions at such locations.
Locations with High Rear-End Collision Potential
Question: Please identify up to five freeway locations in your district/area where the conditions listed in the first column of the table often result in rear-end collisions. If there are more than five locations, identify the five most critical ones.
BAA
BAA CC
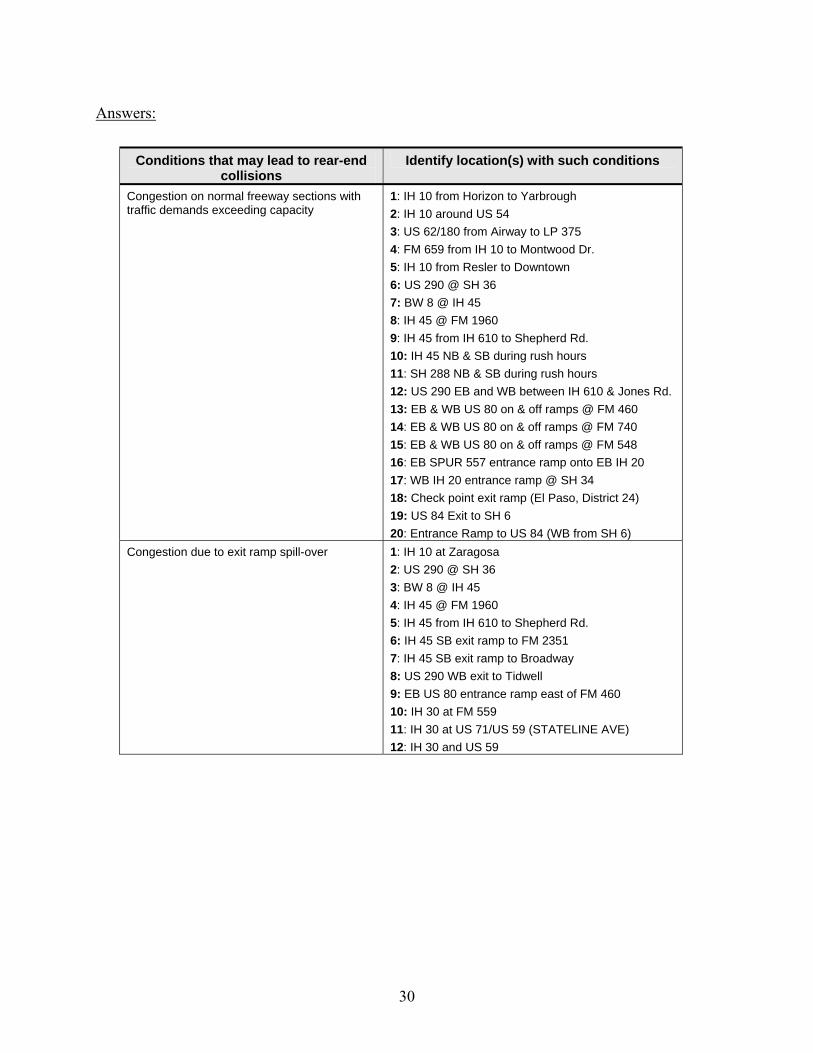
30
Answers:
Conditions that may lead to rear-end collisions
Identify location(s) with such conditions
Congestion on normal freeway sections with traffic demands exceeding capacity
1: IH 10 from Horizon to Yarbrough 2: IH 10 around US 54 3: US 62/180 from Airway to LP 375 4: FM 659 from IH 10 to Montwood Dr. 5: IH 10 from Resler to Downtown 6: US 290 @ SH 36 7: BW 8 @ IH 45 8: IH 45 @ FM 1960 9: IH 45 from IH 610 to Shepherd Rd. 10: IH 45 NB & SB during rush hours 11: SH 288 NB & SB during rush hours 12: US 290 EB and WB between IH 610 & Jones Rd. 13: EB & WB US 80 on & off ramps @ FM 460 14: EB & WB US 80 on & off ramps @ FM 740 15: EB & WB US 80 on & off ramps @ FM 548 16: EB SPUR 557 entrance ramp onto EB IH 20 17: WB IH 20 entrance ramp @ SH 34 18: Check point exit ramp (El Paso, District 24) 19: US 84 Exit to SH 6 20: Entrance Ramp to US 84 (WB from SH 6)
Congestion due to exit ramp spill-over
1: IH 10 at Zaragosa 2: US 290 @ SH 36 3: BW 8 @ IH 45 4: IH 45 @ FM 1960 5: IH 45 from IH 610 to Shepherd Rd. 6: IH 45 SB exit ramp to FM 2351 7: IH 45 SB exit ramp to Broadway 8: US 290 WB exit to Tidwell 9: EB US 80 entrance ramp east of FM 460 10: IH 30 at FM 559 11: IH 30 at US 71/US 59 (STATELINE AVE) 12: IH 30 and US 59
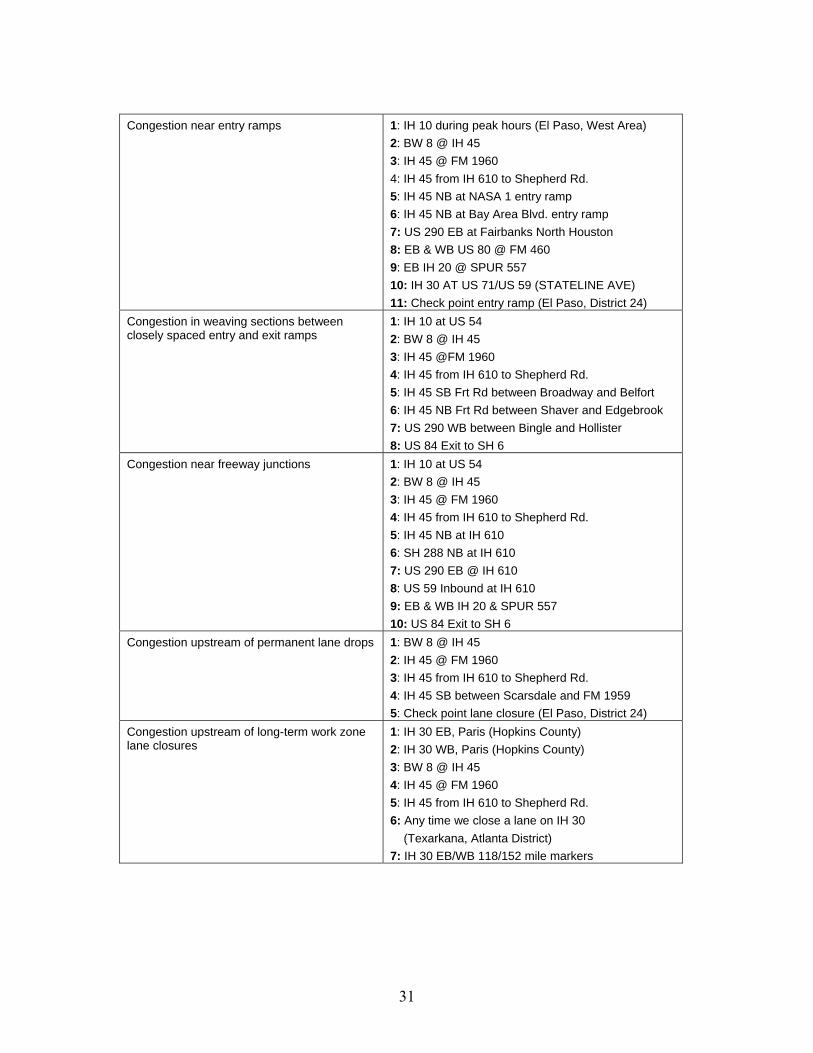
31
Congestion near entry ramps
1: IH 10 during peak hours (El Paso, West Area) 2: BW 8 @ IH 45 3: IH 45 @ FM 1960 4: IH 45 from IH 610 to Shepherd Rd. 5: IH 45 NB at NASA 1 entry ramp 6: IH 45 NB at Bay Area Blvd. entry ramp 7: US 290 EB at Fairbanks North Houston 8: EB & WB US 80 @ FM 460 9: EB IH 20 @ SPUR 557 10: IH 30 AT US 71/US 59 (STATELINE AVE) 11: Check point entry ramp (El Paso, District 24)
Congestion in weaving sections between closely spaced entry and exit ramps
1: IH 10 at US 54 2: BW 8 @ IH 45 3: IH 45 @FM 1960 4: IH 45 from IH 610 to Shepherd Rd. 5: IH 45 SB Frt Rd between Broadway and Belfort 6: IH 45 NB Frt Rd between Shaver and Edgebrook 7: US 290 WB between Bingle and Hollister 8: US 84 Exit to SH 6
Congestion near freeway junctions
1: IH 10 at US 54 2: BW 8 @ IH 45 3: IH 45 @ FM 1960 4: IH 45 from IH 610 to Shepherd Rd. 5: IH 45 NB at IH 610 6: SH 288 NB at IH 610 7: US 290 EB @ IH 610 8: US 59 Inbound at IH 610 9: EB & WB IH 20 & SPUR 557 10: US 84 Exit to SH 6
Congestion upstream of permanent lane drops
1: BW 8 @ IH 45 2: IH 45 @ FM 1960 3: IH 45 from IH 610 to Shepherd Rd. 4: IH 45 SB between Scarsdale and FM 1959 5: Check point lane closure (El Paso, District 24)
Congestion upstream of long-term work zone lane closures
1: IH 30 EB, Paris (Hopkins County) 2: IH 30 WB, Paris (Hopkins County) 3: BW 8 @ IH 45 4: IH 45 @ FM 1960 5: IH 45 from IH 610 to Shepherd Rd. 6: Any time we close a lane on IH 30 (Texarkana, Atlanta District) 7: IH 30 EB/WB 118/152 mile markers
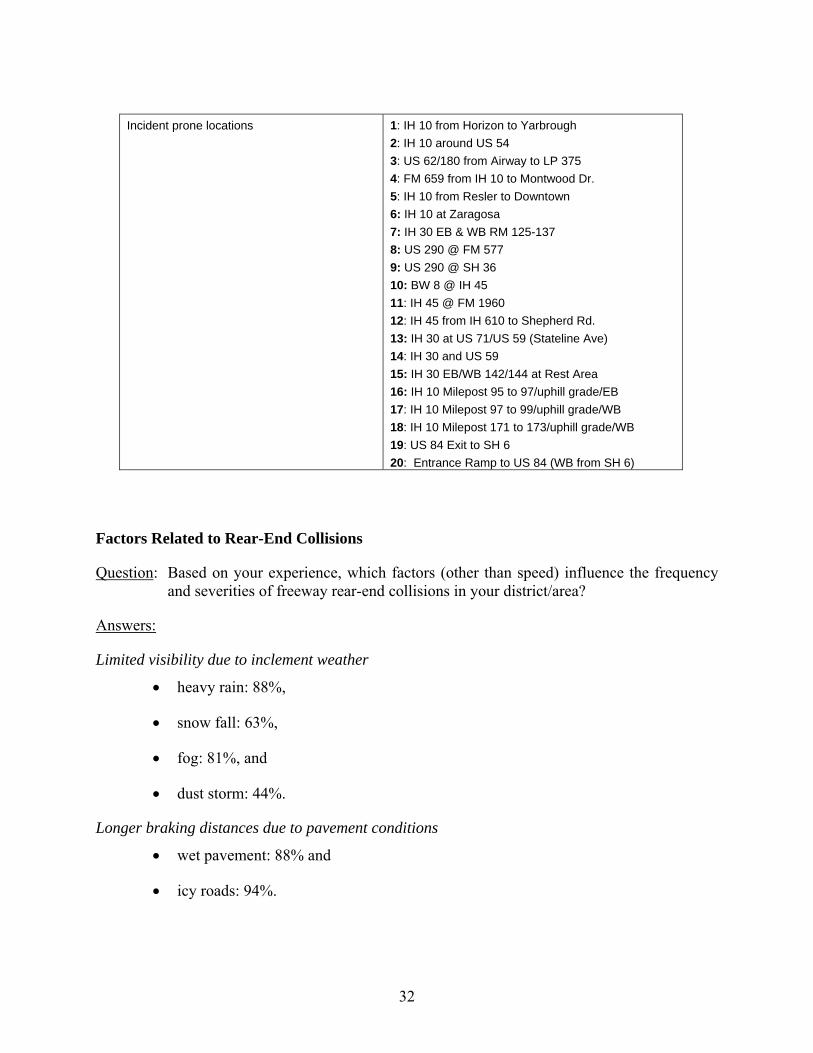
32
Incident prone locations
1: IH 10 from Horizon to Yarbrough 2: IH 10 around US 54 3: US 62/180 from Airway to LP 375 4: FM 659 from IH 10 to Montwood Dr. 5: IH 10 from Resler to Downtown 6: IH 10 at Zaragosa 7: IH 30 EB & WB RM 125-137 8: US 290 @ FM 577 9: US 290 @ SH 36 10: BW 8 @ IH 45 11: IH 45 @ FM 1960 12: IH 45 from IH 610 to Shepherd Rd. 13: IH 30 at US 71/US 59 (Stateline Ave) 14: IH 30 and US 59 15: IH 30 EB/WB 142/144 at Rest Area 16: IH 10 Milepost 95 to 97/uphill grade/EB 17: IH 10 Milepost 97 to 99/uphill grade/WB 18: IH 10 Milepost 171 to 173/uphill grade/WB 19: US 84 Exit to SH 6 20: Entrance Ramp to US 84 (WB from SH 6)
Factors Related to Rear-End Collisions
Question: Based on your experience, which factors (other than speed) influence the frequency and severities of freeway rear-end collisions in your district/area?
Answers:
Limited visibility due to inclement weather
• heavy rain: 88%,
• snow fall: 63%,
• fog: 81%, and
• dust storm: 44%.
Longer braking distances due to pavement conditions
• wet pavement: 88% and
• icy roads: 94%.
33
Roadway geometry
• steep downgrade: 25%,
• vertical curves: 19%, and
• horizontal curves: 12%.
• Poor interchange and ramp design was also mentioned by one respondent.
Traffic composition
Nearly 40% of the respondents thought that high volume of trucks and visual obstruction by high-profile vehicles are major contributing factors to rear-end collisions.
Other factors
According to one respondent, “Incompetent and inexperienced drivers” also significantly affect the occurrence and severity of rear-end collisions.
Use of Static Queue Warning Signs
Question: Do you use fixed (e.g., pole-mounted) signs for advance warning of stopped or slow traffic?
Yes = 25% No = 75%
Question: For multiple signs provide typical spacing (ft):
Answers:
• as per Manual on Uniform Traffic Control Devices (MUTCD) depending on speed limit,
• various distances,
• approx. 800 ft, and
• 700 to 1000 ft.
Question: Guidelines used for locating advance warning signs:
Answers:
• MUTCD,
• Texas Manual on Uniform Traffic Control Devices,
• troubled areas such as school bus stops, and
• sign crew field book.
34
Question: What messages have you used?
Answers:
• Road Work Ahead,
• Flagger Ahead,
• One Lane Road Ahead,
• Be Prepared to Stop,
• End Road Work,
• School Bus Stops Ahead,
• In maintenance it varies with each incident or accident that occurs. Message boards or regular construction signs are used on long-term blockage for in-house construction. For long-term emergencies message boards are also provided, e.g., Accident Ahead, Reduced Speed Ahead. Fixed signs are used during long-term in-house construction.
• Stop Ahead,
• Yield Ahead, and
• Reduced Speed Ahead.
Use of Changeable Message Signs for Queue Warning
Question: Do you use Changeable Message Signs (CMS) for advance warning of stopped or slow traffic?
Yes = 44% No = 66%
Question: For multiple CMSs, provide typical spacing (ft):
Answers:
• depends on speed and road characteristics,
• 700 to 1000 ft, and
• various spacing, from 1500 ft to 5 miles.
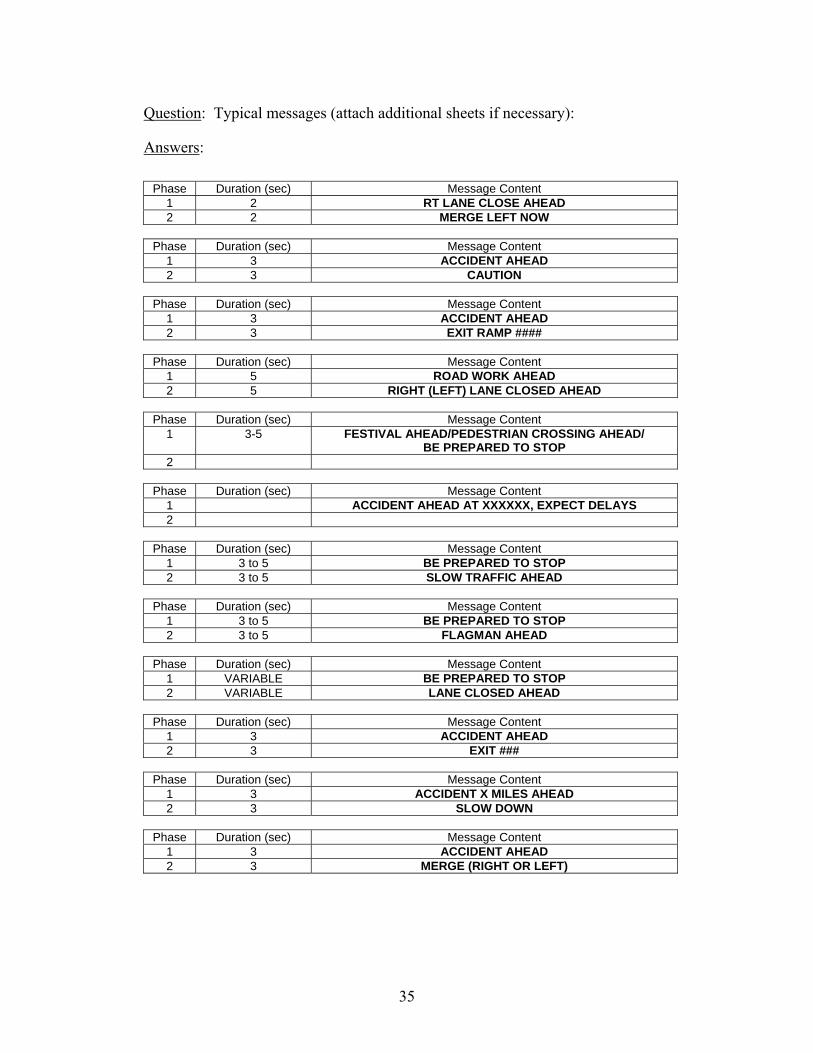
35
Question: Typical messages (attach additional sheets if necessary):
Answers:
Phase Duration (sec) Message Content 1 2 RT LANE CLOSE AHEAD 2 2 MERGE LEFT NOW
Phase Duration (sec) Message Content
1 3 ACCIDENT AHEAD 2 3 CAUTION
Phase Duration (sec) Message Content
1 3 ACCIDENT AHEAD 2 3 EXIT RAMP ####
Phase Duration (sec) Message Content
1 5 ROAD WORK AHEAD 2 5 RIGHT (LEFT) LANE CLOSED AHEAD
Phase Duration (sec) Message Content
1 3-5 FESTIVAL AHEAD/PEDESTRIAN CROSSING AHEAD/ BE PREPARED TO STOP
2
Phase Duration (sec) Message Content 1 ACCIDENT AHEAD AT XXXXXX, EXPECT DELAYS 2
Phase Duration (sec) Message Content
1 3 to 5 BE PREPARED TO STOP 2 3 to 5 SLOW TRAFFIC AHEAD
Phase Duration (sec) Message Content
1 3 to 5 BE PREPARED TO STOP 2 3 to 5 FLAGMAN AHEAD
Phase Duration (sec) Message Content
1 VARIABLE BE PREPARED TO STOP 2 VARIABLE LANE CLOSED AHEAD
Phase Duration (sec) Message Content
1 3 ACCIDENT AHEAD 2 3 EXIT ###
Phase Duration (sec) Message Content
1 3 ACCIDENT X MILES AHEAD 2 3 SLOW DOWN
Phase Duration (sec) Message Content
1 3 ACCIDENT AHEAD 2 3 MERGE (RIGHT OR LEFT)
36
Question: Guidelines used for locating CMS:
Answers:
• place about 1 mile in advance of construction lane closures for weekend/holiday traffic;
• Texas MUTCD ;
• MUTCD;
• special events/emergency situations (wrecks and natural disasters) where traffic on TxDOT maintained roads are affected;
• major intersections and in advance of alternate routes for possible detours or delayed traffic; and
• we use these on our construction projects when closing a lane on interstate. We use the spacing shown on the Traffic Control Plan (TCP) sheets.
Question: Have you used CMS with sensor (radar) capabilities?
Yes = 19% No = 81%
Question: If yes, describe system components and logic:
Answer:
• Speed check survey for evaluating posted speed limits.
Other Queue Warning Techniques
Question: Other advance warning techniques used?
Answers:
• crash attenuators, signs, cones, drums, etc.;
• static message boards;
• temporary signs with flagmen;
• on long-term with a press release and Highway Closure and Restriction System (HCRS) online;
• collision attenuator, signs, channeling devices, arrow boards;
• work ahead signs, right/left lane closed signs, and channeling device with arrow right/left;
• roadway signs;
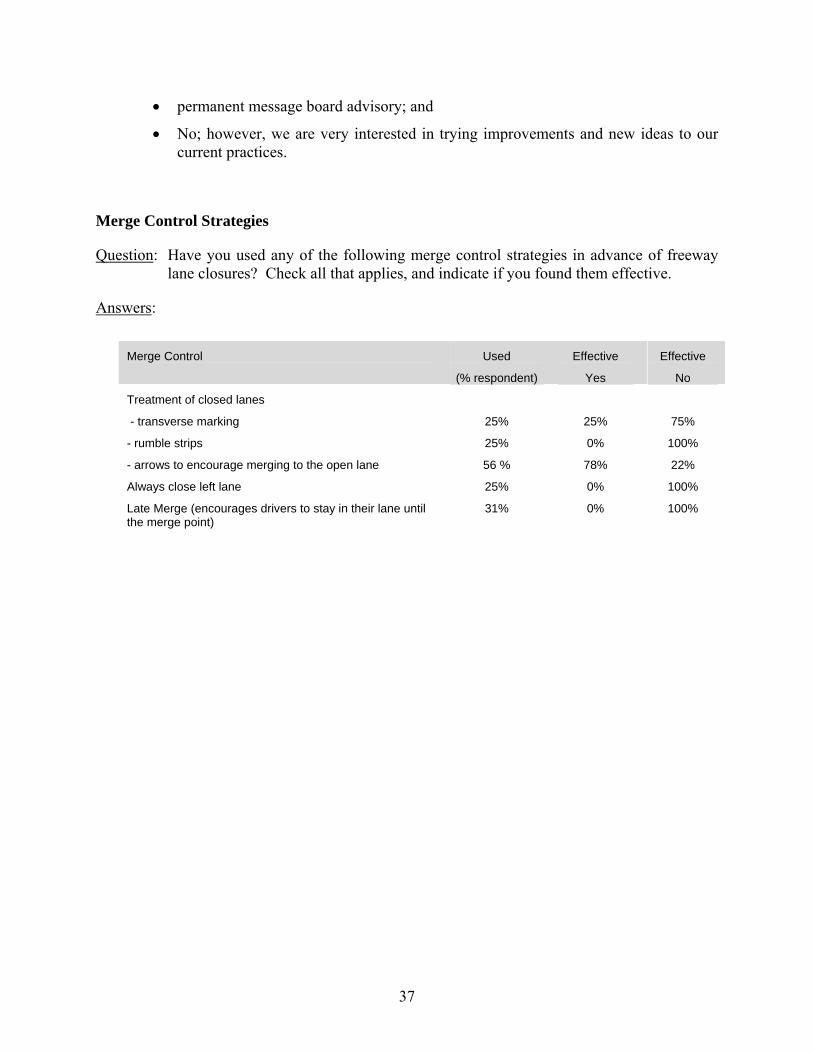
37
• permanent message board advisory; and
• No; however, we are very interested in trying improvements and new ideas to our current practices.
Merge Control Strategies
Question: Have you used any of the following merge control strategies in advance of freeway lane closures? Check all that applies, and indicate if you found them effective.
Answers:
Merge Control Used
(% respondent)
Effective
Yes
Effective
No
Treatment of closed lanes
- transverse marking
- rumble strips
- arrows to encourage merging to the open lane
25%
25%
56 %
25%
0%
78%
75%
100%
22%
Always close left lane
Late Merge (encourages drivers to stay in their lane until the merge point)
25%
31%
0%
0%
100%
100%
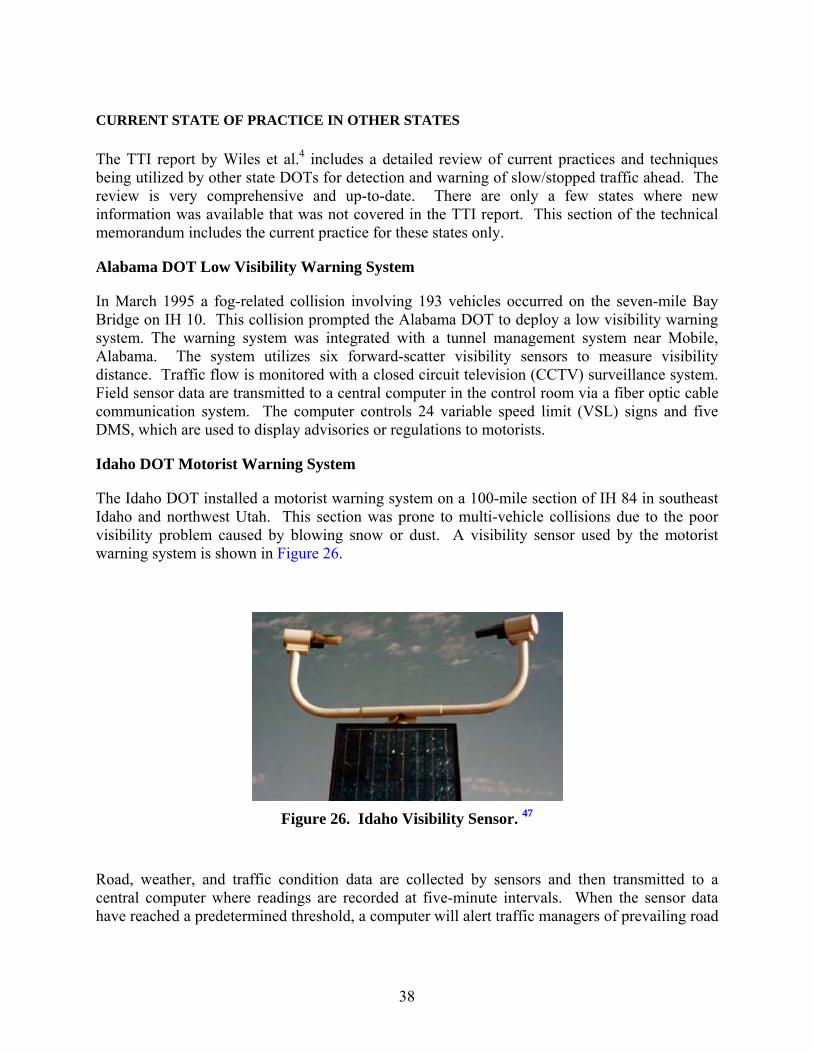
38
CURRENT STATE OF PRACTICE IN OTHER STATES
The TTI report by Wiles et al.4 includes a detailed review of current practices and techniques being utilized by other state DOTs for detection and warning of slow/stopped traffic ahead. The review is very comprehensive and up-to-date. There are only a few states where new information was available that was not covered in the TTI report. This section of the technical memorandum includes the current practice for these states only.
Alabama DOT Low Visibility Warning System
In March 1995 a fog-related collision involving 193 vehicles occurred on the seven-mile Bay Bridge on IH 10. This collision prompted the Alabama DOT to deploy a low visibility warning system. The warning system was integrated with a tunnel management system near Mobile, Alabama. The system utilizes six forward-scatter visibility sensors to measure visibility distance. Traffic flow is monitored with a closed circuit television (CCTV) surveillance system. Field sensor data are transmitted to a central computer in the control room via a fiber optic cable communication system. The computer controls 24 variable speed limit (VSL) signs and five DMS, which are used to display advisories or regulations to motorists.
Idaho DOT Motorist Warning System
The Idaho DOT installed a motorist warning system on a 100-mile section of IH 84 in southeast Idaho and northwest Utah. This section was prone to multi-vehicle collisions due to the poor visibility problem caused by blowing snow or dust. A visibility sensor used by the motorist warning system is shown in Figure 26.
Figure 26. Idaho Visibility Sensor. 47
Road, weather, and traffic condition data are collected by sensors and then transmitted to a central computer where readings are recorded at five-minute intervals. When the sensor data have reached a predetermined threshold, a computer will alert traffic managers of prevailing road
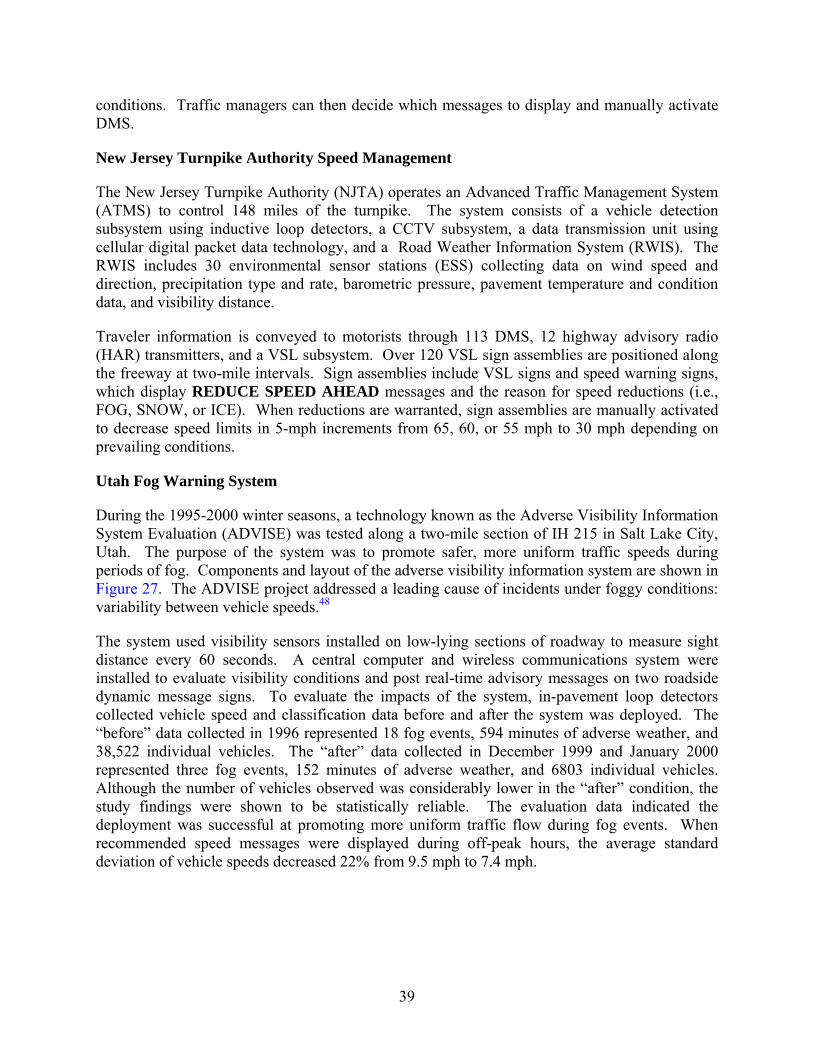
39
conditions. Traffic managers can then decide which messages to display and manually activate DMS.
New Jersey Turnpike Authority Speed Management
The New Jersey Turnpike Authority (NJTA) operates an Advanced Traffic Management System (ATMS) to control 148 miles of the turnpike. The system consists of a vehicle detection subsystem using inductive loop detectors, a CCTV subsystem, a data transmission unit using cellular digital packet data technology, and a Road Weather Information System (RWIS). The RWIS includes 30 environmental sensor stations (ESS) collecting data on wind speed and direction, precipitation type and rate, barometric pressure, pavement temperature and condition data, and visibility distance.
Traveler information is conveyed to motorists through 113 DMS, 12 highway advisory radio (HAR) transmitters, and a VSL subsystem. Over 120 VSL sign assemblies are positioned along the freeway at two-mile intervals. Sign assemblies include VSL signs and speed warning signs, which display REDUCE SPEED AHEAD messages and the reason for speed reductions (i.e., FOG, SNOW, or ICE). When reductions are warranted, sign assemblies are manually activated to decrease speed limits in 5-mph increments from 65, 60, or 55 mph to 30 mph depending on prevailing conditions.
Utah Fog Warning System
During the 1995-2000 winter seasons, a technology known as the Adverse Visibility Information System Evaluation (ADVISE) was tested along a two-mile section of IH 215 in Salt Lake City, Utah. The purpose of the system was to promote safer, more uniform traffic speeds during periods of fog. Components and layout of the adverse visibility information system are shown in Figure 27. The ADVISE project addressed a leading cause of incidents under foggy conditions: variability between vehicle speeds.48
The system used visibility sensors installed on low-lying sections of roadway to measure sight distance every 60 seconds. A central computer and wireless communications system were installed to evaluate visibility conditions and post real-time advisory messages on two roadside dynamic message signs. To evaluate the impacts of the system, in-pavement loop detectors collected vehicle speed and classification data before and after the system was deployed. The “before” data collected in 1996 represented 18 fog events, 594 minutes of adverse weather, and 38,522 individual vehicles. The “after” data collected in December 1999 and January 2000 represented three fog events, 152 minutes of adverse weather, and 6803 individual vehicles. Although the number of vehicles observed was considerably lower in the “after” condition, the study findings were shown to be statistically reliable. The evaluation data indicated the deployment was successful at promoting more uniform traffic flow during fog events. When recommended speed messages were displayed during off-peak hours, the average standard deviation of vehicle speeds decreased 22% from 9.5 mph to 7.4 mph.
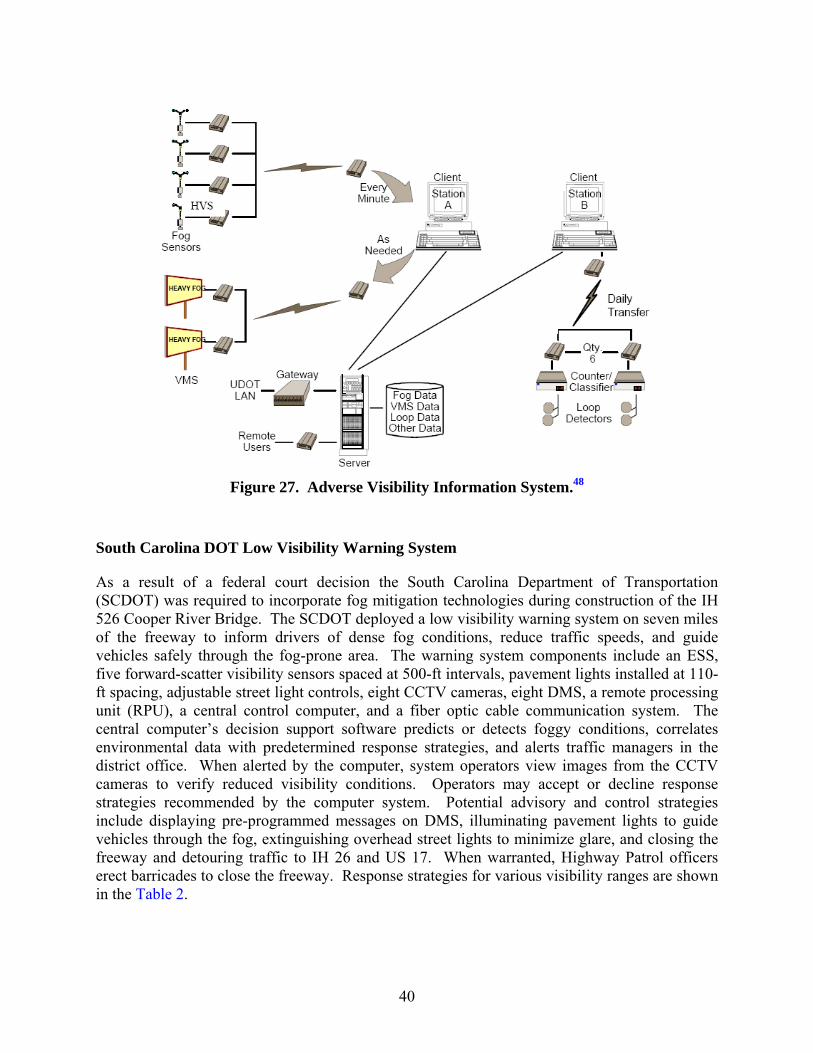
40
Figure 27. Adverse Visibility Information System.48
South Carolina DOT Low Visibility Warning System
As a result of a federal court decision the South Carolina Department of Transportation (SCDOT) was required to incorporate fog mitigation technologies during construction of the IH 526 Cooper River Bridge. The SCDOT deployed a low visibility warning system on seven miles of the freeway to inform drivers of dense fog conditions, reduce traffic speeds, and guide vehicles safely through the fog-prone area. The warning system components include an ESS, five forward-scatter visibility sensors spaced at 500-ft intervals, pavement lights installed at 110-ft spacing, adjustable street light controls, eight CCTV cameras, eight DMS, a remote processing unit (RPU), a central control computer, and a fiber optic cable communication system. The central computer’s decision support software predicts or detects foggy conditions, correlates environmental data with predetermined response strategies, and alerts traffic managers in the district office. When alerted by the computer, system operators view images from the CCTV cameras to verify reduced visibility conditions. Operators may accept or decline response strategies recommended by the computer system. Potential advisory and control strategies include displaying pre-programmed messages on DMS, illuminating pavement lights to guide vehicles through the fog, extinguishing overhead street lights to minimize glare, and closing the freeway and detouring traffic to IH 26 and US 17. When warranted, Highway Patrol officers erect barricades to close the freeway. Response strategies for various visibility ranges are shown in the Table 2.
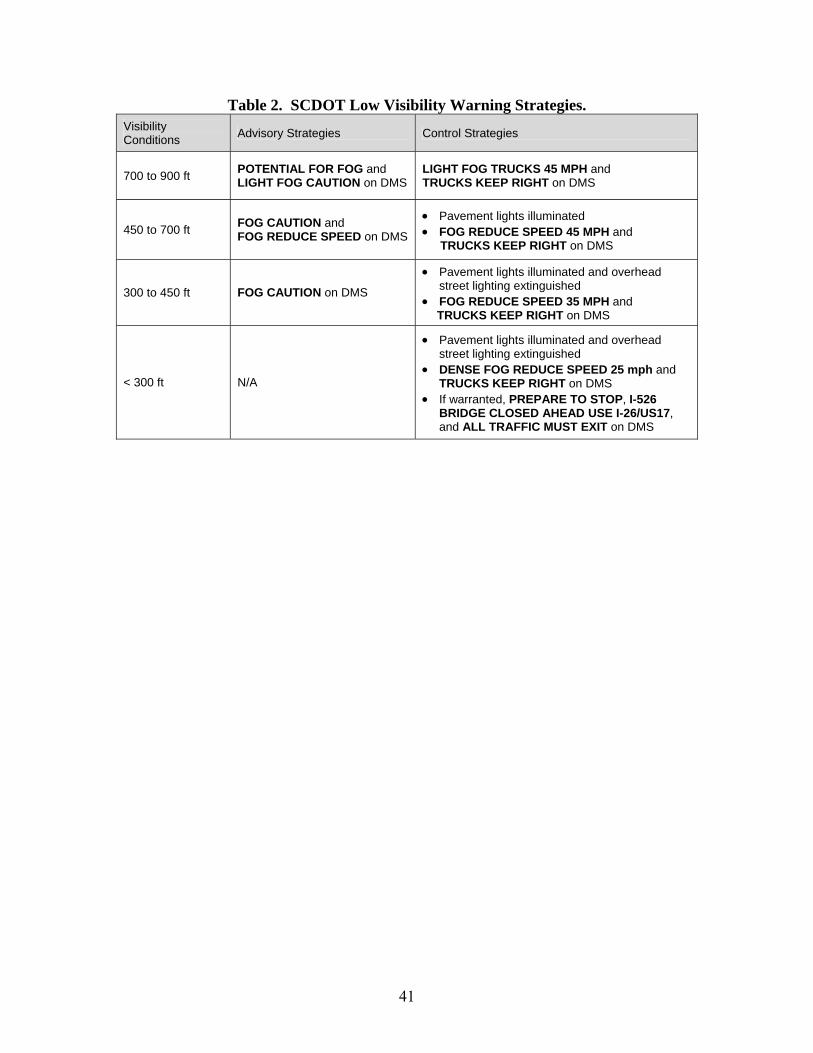
41
Table 2. SCDOT Low Visibility Warning Strategies. Visibility Conditions Advisory Strategies Control Strategies
700 to 900 ft POTENTIAL FOR FOG and LIGHT FOG CAUTION on DMS
LIGHT FOG TRUCKS 45 MPH and TRUCKS KEEP RIGHT on DMS
450 to 700 ft FOG CAUTION and FOG REDUCE SPEED on DMS
• Pavement lights illuminated • FOG REDUCE SPEED 45 MPH and
TRUCKS KEEP RIGHT on DMS
300 to 450 ft FOG CAUTION on DMS
• Pavement lights illuminated and overhead street lighting extinguished
• FOG REDUCE SPEED 35 MPH and TRUCKS KEEP RIGHT on DMS
< 300 ft N/A
• Pavement lights illuminated and overhead street lighting extinguished
• DENSE FOG REDUCE SPEED 25 mph and TRUCKS KEEP RIGHT on DMS
• If warranted, PREPARE TO STOP, I-526 BRIDGE CLOSED AHEAD USE I-26/US17, and ALL TRAFFIC MUST EXIT on DMS
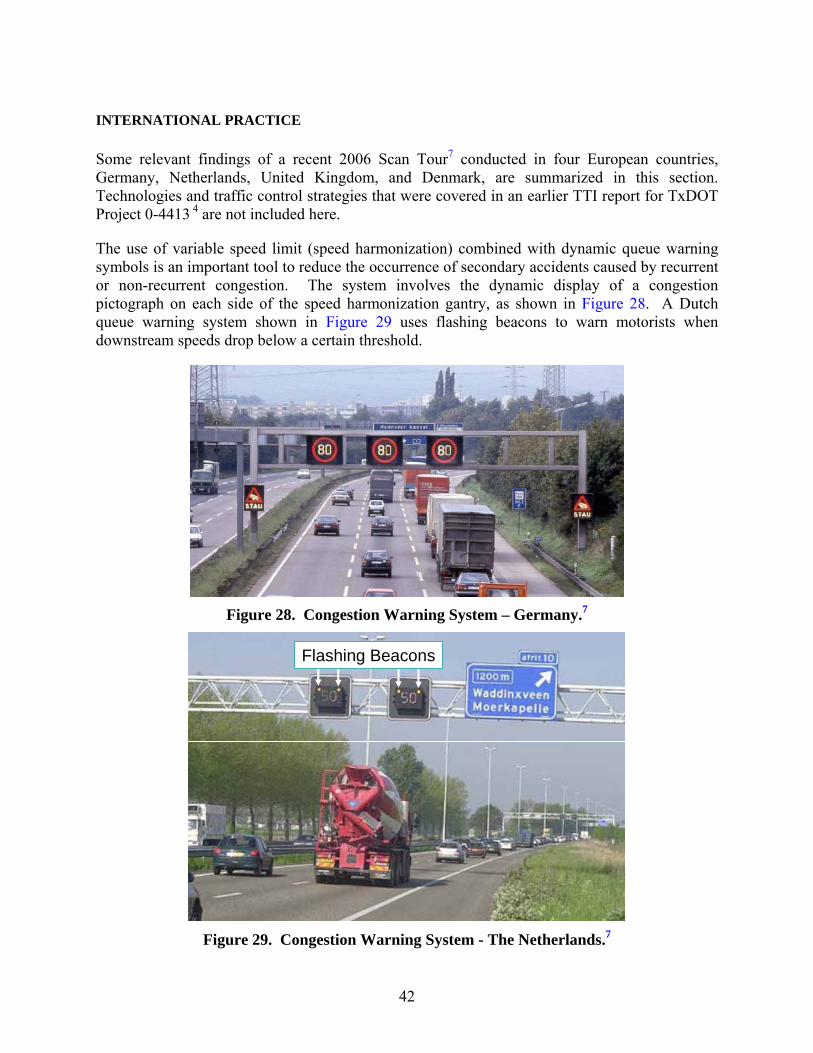
42
INTERNATIONAL PRACTICE
Some relevant findings of a recent 2006 Scan Tour7 conducted in four European countries, Germany, Netherlands, United Kingdom, and Denmark, are summarized in this section. Technologies and traffic control strategies that were covered in an earlier TTI report for TxDOT Project 0-4413 4 are not included here.
The use of variable speed limit (speed harmonization) combined with dynamic queue warning symbols is an important tool to reduce the occurrence of secondary accidents caused by recurrent or non-recurrent congestion. The system involves the dynamic display of a congestion pictograph on each side of the speed harmonization gantry, as shown in Figure 28. A Dutch queue warning system shown in Figure 29 uses flashing beacons to warn motorists when downstream speeds drop below a certain threshold.
Figure 28. Congestion Warning System – Germany.7
Flashing BeaconsFlashing Beacons
Figure 29. Congestion Warning System - The Netherlands.7
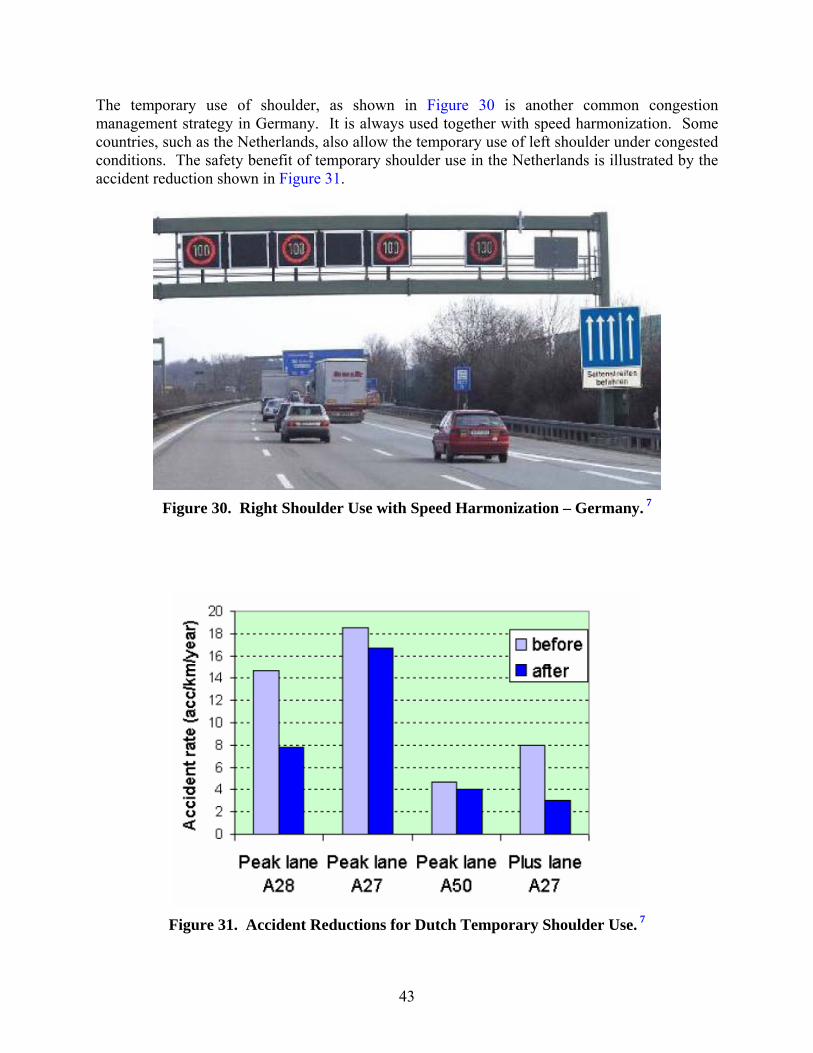
43
The temporary use of shoulder, as shown in Figure 30 is another common congestion management strategy in Germany. It is always used together with speed harmonization. Some countries, such as the Netherlands, also allow the temporary use of left shoulder under congested conditions. The safety benefit of temporary shoulder use in the Netherlands is illustrated by the accident reduction shown in Figure 31.
Figure 30. Right Shoulder Use with Speed Harmonization – Germany. 7
Figure 31. Accident Reductions for Dutch Temporary Shoulder Use. 7
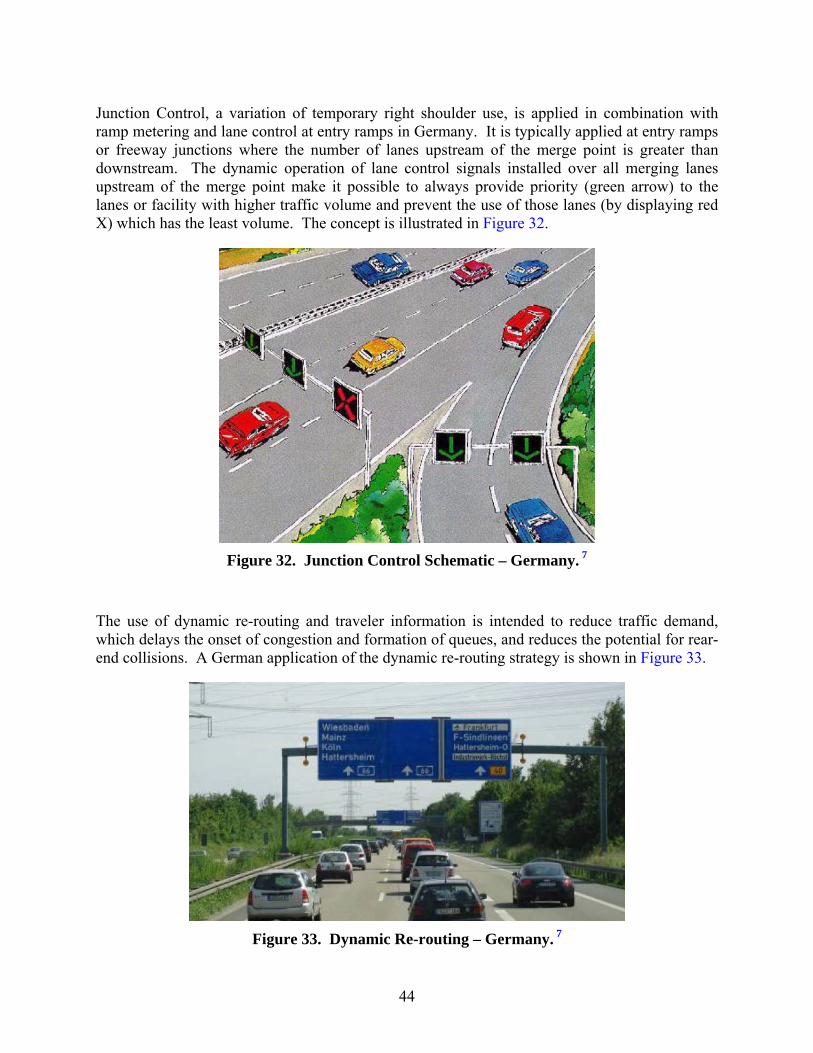
44
Junction Control, a variation of temporary right shoulder use, is applied in combination with ramp metering and lane control at entry ramps in Germany. It is typically applied at entry ramps or freeway junctions where the number of lanes upstream of the merge point is greater than downstream. The dynamic operation of lane control signals installed over all merging lanes upstream of the merge point make it possible to always provide priority (green arrow) to the lanes or facility with higher traffic volume and prevent the use of those lanes (by displaying red X) which has the least volume. The concept is illustrated in Figure 32.
Figure 32. Junction Control Schematic – Germany. 7
The use of dynamic re-routing and traveler information is intended to reduce traffic demand, which delays the onset of congestion and formation of queues, and reduces the potential for rear-end collisions. A German application of the dynamic re-routing strategy is shown in Figure 33.
Figure 33. Dynamic Re-routing – Germany. 7
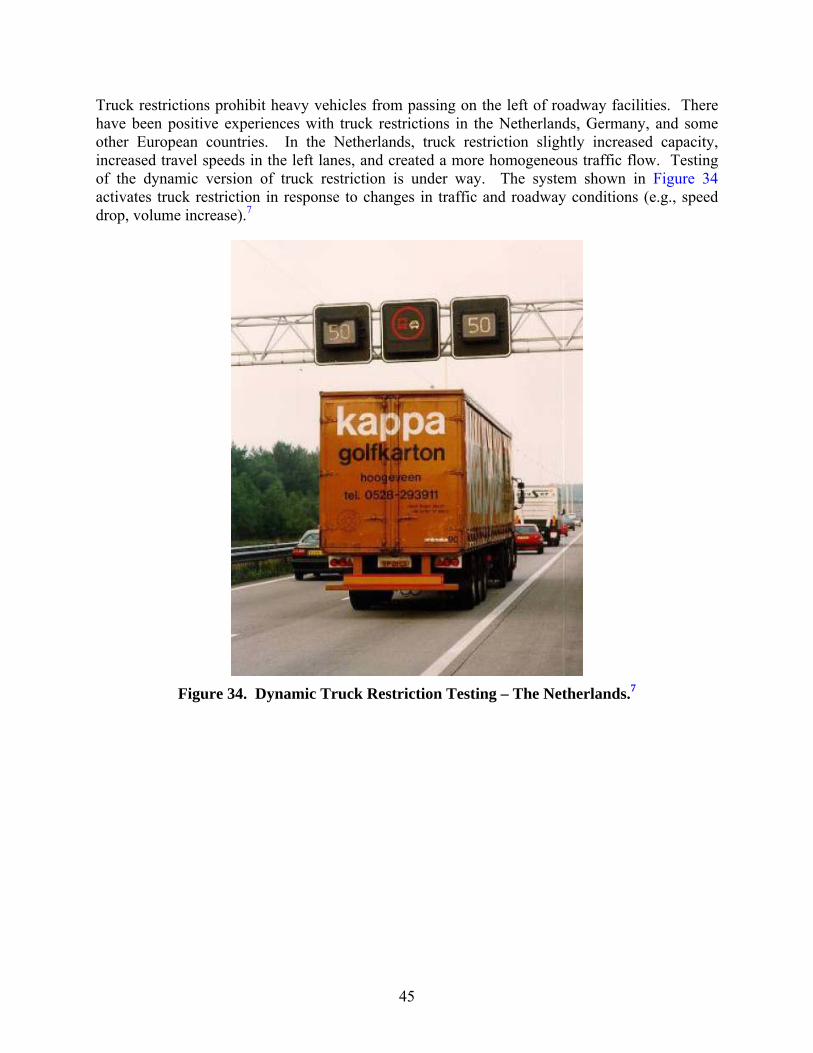
45
Truck restrictions prohibit heavy vehicles from passing on the left of roadway facilities. There have been positive experiences with truck restrictions in the Netherlands, Germany, and some other European countries. In the Netherlands, truck restriction slightly increased capacity, increased travel speeds in the left lanes, and created a more homogeneous traffic flow. Testing of the dynamic version of truck restriction is under way. The system shown in Figure 34 activates truck restriction in response to changes in traffic and roadway conditions (e.g., speed drop, volume increase).7
Figure 34. Dynamic Truck Restriction Testing – The Netherlands.7
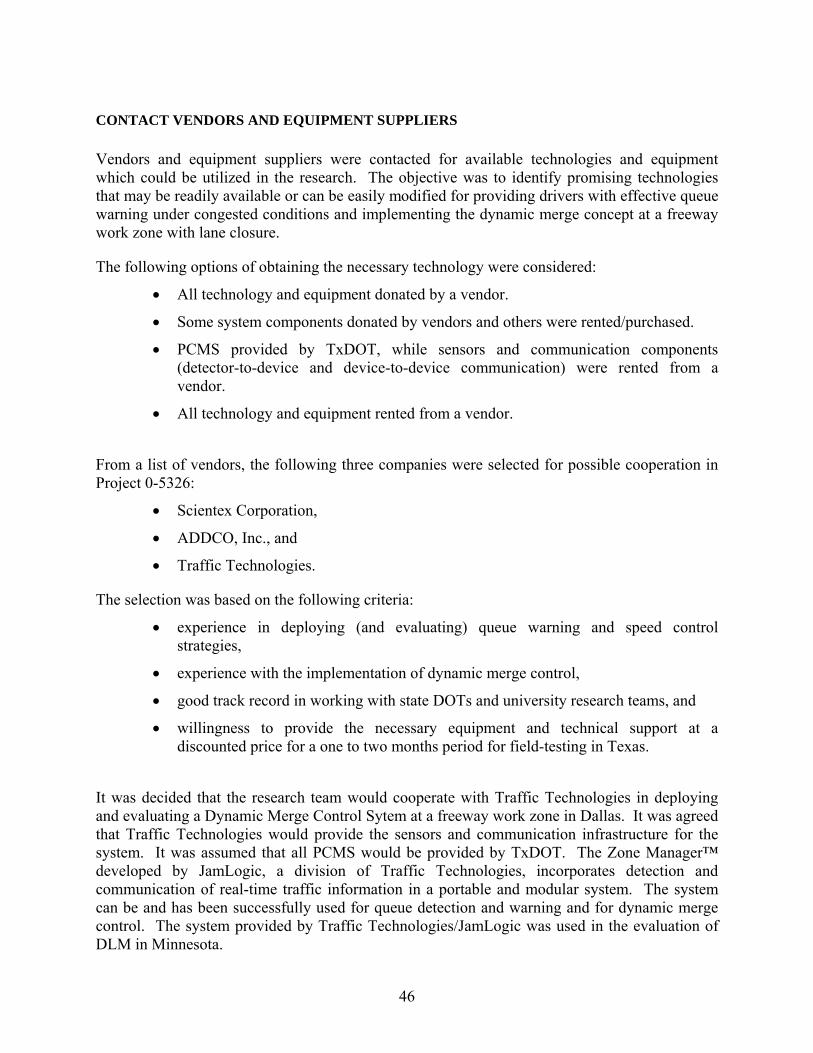
46
CONTACT VENDORS AND EQUIPMENT SUPPLIERS
Vendors and equipment suppliers were contacted for available technologies and equipment which could be utilized in the research. The objective was to identify promising technologies that may be readily available or can be easily modified for providing drivers with effective queue warning under congested conditions and implementing the dynamic merge concept at a freeway work zone with lane closure.
The following options of obtaining the necessary technology were considered:
• All technology and equipment donated by a vendor.
• Some system components donated by vendors and others were rented/purchased.
• PCMS provided by TxDOT, while sensors and communication components (detector-to-device and device-to-device communication) were rented from a vendor.
• All technology and equipment rented from a vendor.
From a list of vendors, the following three companies were selected for possible cooperation in Project 0-5326:
• Scientex Corporation,
• ADDCO, Inc., and
• Traffic Technologies.
The selection was based on the following criteria:
• experience in deploying (and evaluating) queue warning and speed control strategies,
• experience with the implementation of dynamic merge control,
• good track record in working with state DOTs and university research teams, and
• willingness to provide the necessary equipment and technical support at a discounted price for a one to two months period for field-testing in Texas.
It was decided that the research team would cooperate with Traffic Technologies in deploying and evaluating a Dynamic Merge Control Sytem at a freeway work zone in Dallas. It was agreed that Traffic Technologies would provide the sensors and communication infrastructure for the system. It was assumed that all PCMS would be provided by TxDOT. The Zone Manager™ developed by JamLogic, a division of Traffic Technologies, incorporates detection and communication of real-time traffic information in a portable and modular system. The system can be and has been successfully used for queue detection and warning and for dynamic merge control. The system provided by Traffic Technologies/JamLogic was used in the evaluation of DLM in Minnesota.
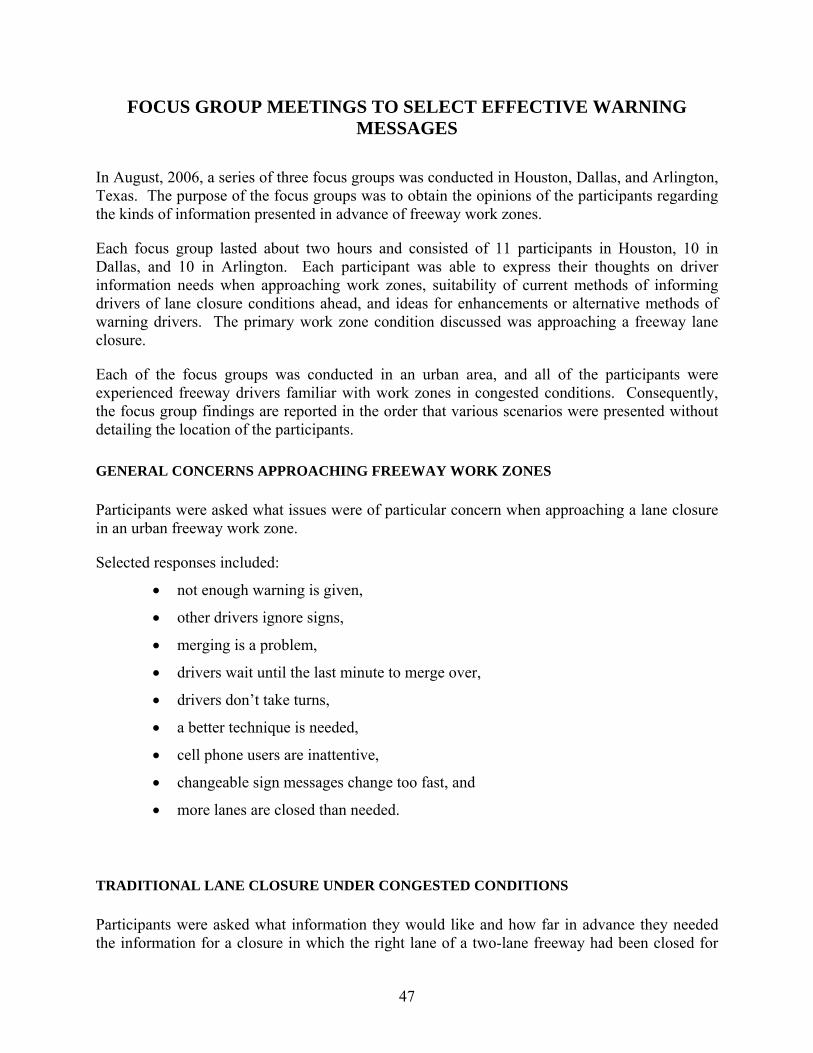
47
FOCUS GROUP MEETINGS TO SELECT EFFECTIVE WARNING MESSAGES
In August, 2006, a series of three focus groups was conducted in Houston, Dallas, and Arlington, Texas. The purpose of the focus groups was to obtain the opinions of the participants regarding the kinds of information presented in advance of freeway work zones.
Each focus group lasted about two hours and consisted of 11 participants in Houston, 10 in Dallas, and 10 in Arlington. Each participant was able to express their thoughts on driver information needs when approaching work zones, suitability of current methods of informing drivers of lane closure conditions ahead, and ideas for enhancements or alternative methods of warning drivers. The primary work zone condition discussed was approaching a freeway lane closure.
Each of the focus groups was conducted in an urban area, and all of the participants were experienced freeway drivers familiar with work zones in congested conditions. Consequently, the focus group findings are reported in the order that various scenarios were presented without detailing the location of the participants.
GENERAL CONCERNS APPROACHING FREEWAY WORK ZONES
Participants were asked what issues were of particular concern when approaching a lane closure in an urban freeway work zone.
Selected responses included:
• not enough warning is given,
• other drivers ignore signs,
• merging is a problem,
• drivers wait until the last minute to merge over,
• drivers don’t take turns,
• a better technique is needed,
• cell phone users are inattentive,
• changeable sign messages change too fast, and
• more lanes are closed than needed.
TRADITIONAL LANE CLOSURE UNDER CONGESTED CONDITIONS
Participants were asked what information they would like and how far in advance they needed the information for a closure in which the right lane of a two-lane freeway had been closed for
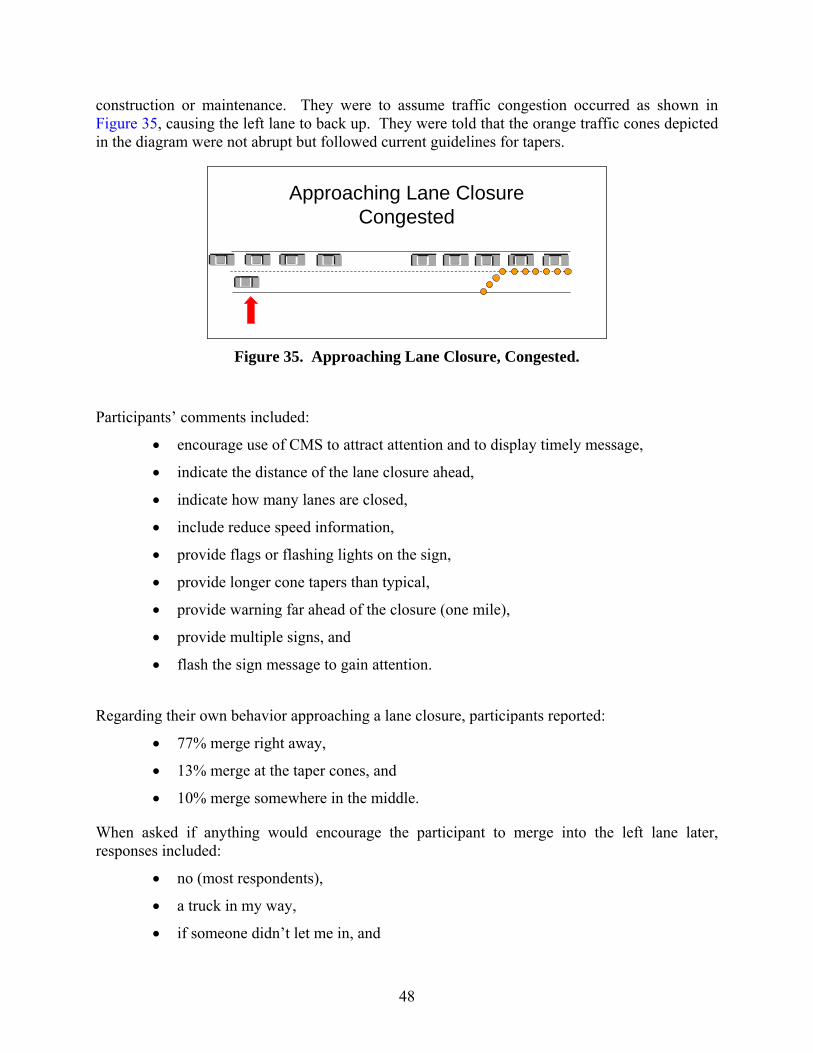
48
construction or maintenance. They were to assume traffic congestion occurred as shown in Figure 35, causing the left lane to back up. They were told that the orange traffic cones depicted in the diagram were not abrupt but followed current guidelines for tapers.
Approaching Lane Closure
Congested
Figure 35. Approaching Lane Closure, Congested.
Participants’ comments included:
• encourage use of CMS to attract attention and to display timely message,
• indicate the distance of the lane closure ahead,
• indicate how many lanes are closed,
• include reduce speed information,
• provide flags or flashing lights on the sign,
• provide longer cone tapers than typical,
• provide warning far ahead of the closure (one mile),
• provide multiple signs, and
• flash the sign message to gain attention.
Regarding their own behavior approaching a lane closure, participants reported:
• 77% merge right away,
• 13% merge at the taper cones, and
• 10% merge somewhere in the middle.
When asked if anything would encourage the participant to merge into the left lane later, responses included:
• no (most respondents),
• a truck in my way,
• if someone didn’t let me in, and
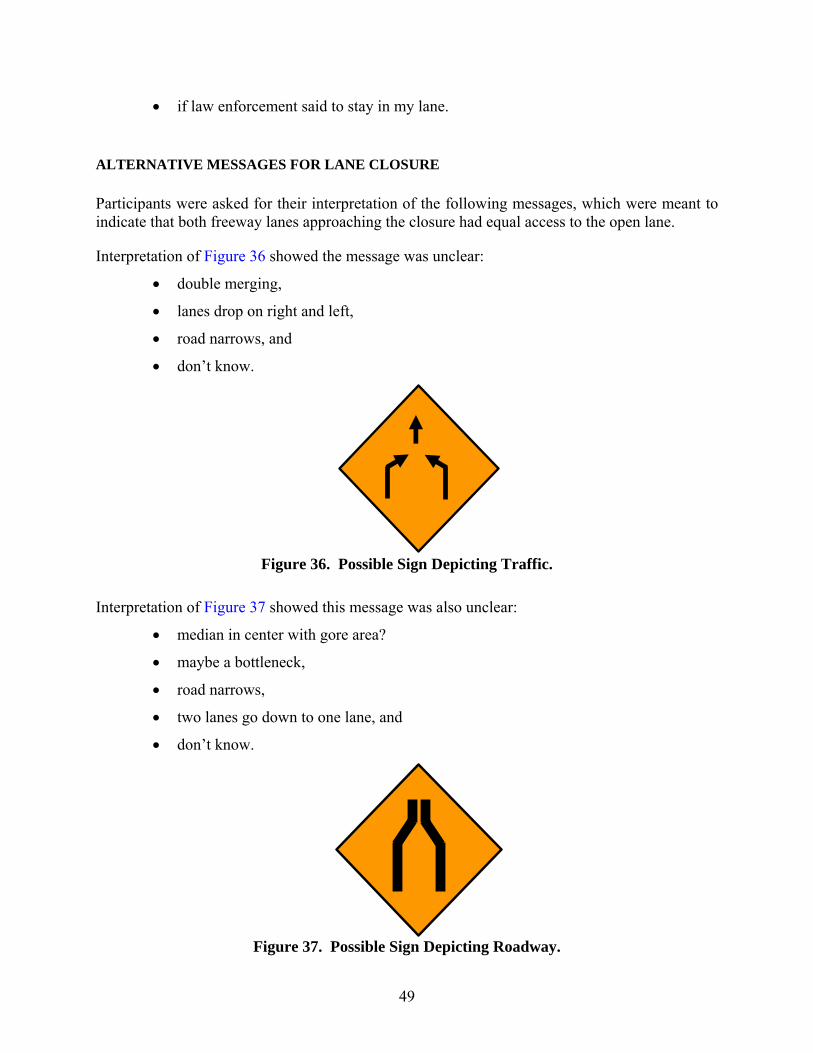
49
• if law enforcement said to stay in my lane.
ALTERNATIVE MESSAGES FOR LANE CLOSURE
Participants were asked for their interpretation of the following messages, which were meant to indicate that both freeway lanes approaching the closure had equal access to the open lane.
Interpretation of Figure 36 showed the message was unclear:
• double merging,
• lanes drop on right and left,
• road narrows, and
• don’t know.
Figure 36. Possible Sign Depicting Traffic.
Interpretation of Figure 37 showed this message was also unclear:
• median in center with gore area?
• maybe a bottleneck,
• road narrows,
• two lanes go down to one lane, and
• don’t know.
Figure 37. Possible Sign Depicting Roadway.
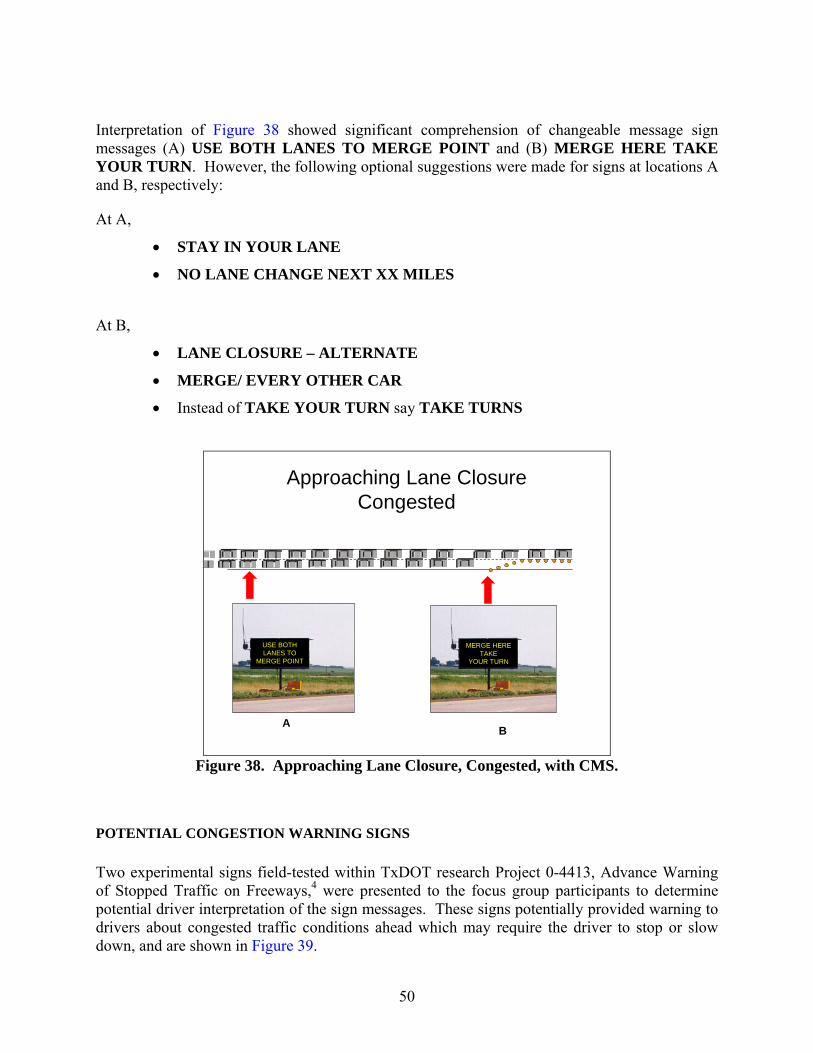
50
Interpretation of Figure 38 showed significant comprehension of changeable message sign messages (A) USE BOTH LANES TO MERGE POINT and (B) MERGE HERE TAKE YOUR TURN. However, the following optional suggestions were made for signs at locations A and B, respectively:
At A,
• STAY IN YOUR LANE
• NO LANE CHANGE NEXT XX MILES
At B,
• LANE CLOSURE – ALTERNATE
• MERGE/ EVERY OTHER CAR
• Instead of TAKE YOUR TURN say TAKE TURNS
Approaching Lane ClosureCongested
USE BOTHLANES TO
MERGE POINT
MERGE HERETAKE
YOUR TURN
AB
Figure 38. Approaching Lane Closure, Congested, with CMS.
POTENTIAL CONGESTION WARNING SIGNS
Two experimental signs field-tested within TxDOT research Project 0-4413, Advance Warning of Stopped Traffic on Freeways,4 were presented to the focus group participants to determine potential driver interpretation of the sign messages. These signs potentially provided warning to drivers about congested traffic conditions ahead which may require the driver to stop or slow down, and are shown in Figure 39.
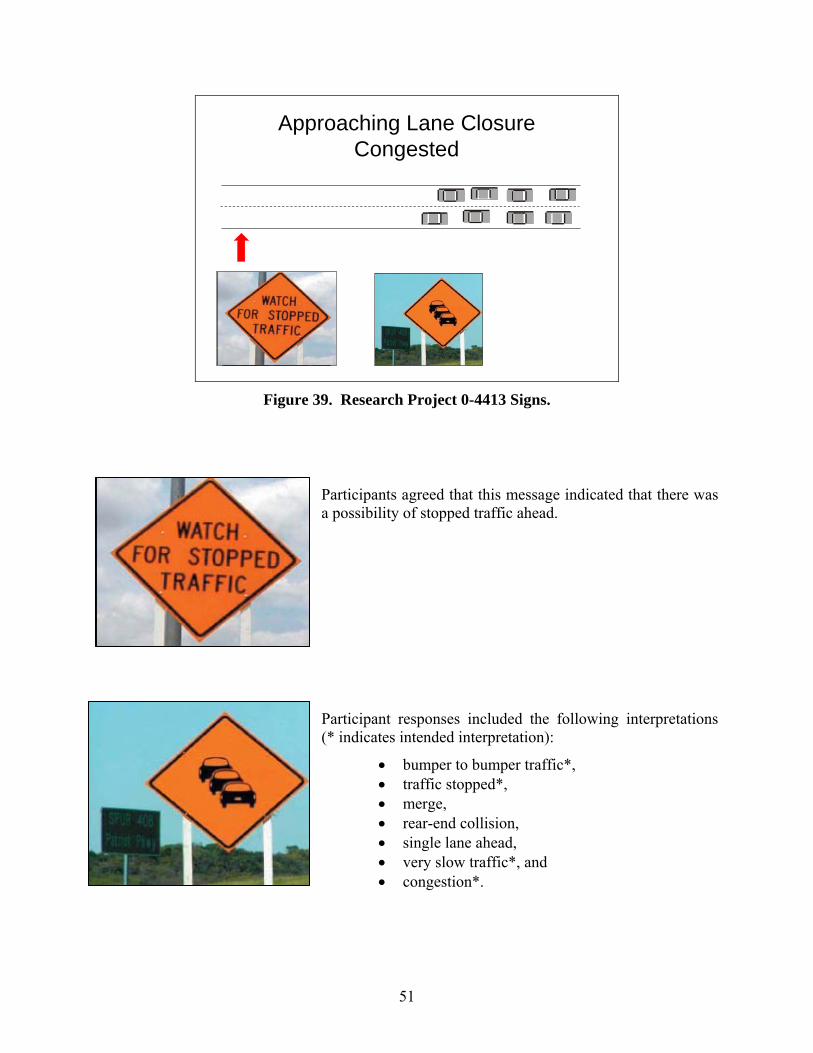
51
Approaching Lane Closure
Congested
Figure 39. Research Project 0-4413 Signs.
Participants agreed that this message indicated that there was a possibility of stopped traffic ahead.
Participant responses included the following interpretations (* indicates intended interpretation):
• bumper to bumper traffic*, • traffic stopped*, • merge, • rear-end collision, • single lane ahead, • very slow traffic*, and • congestion*.
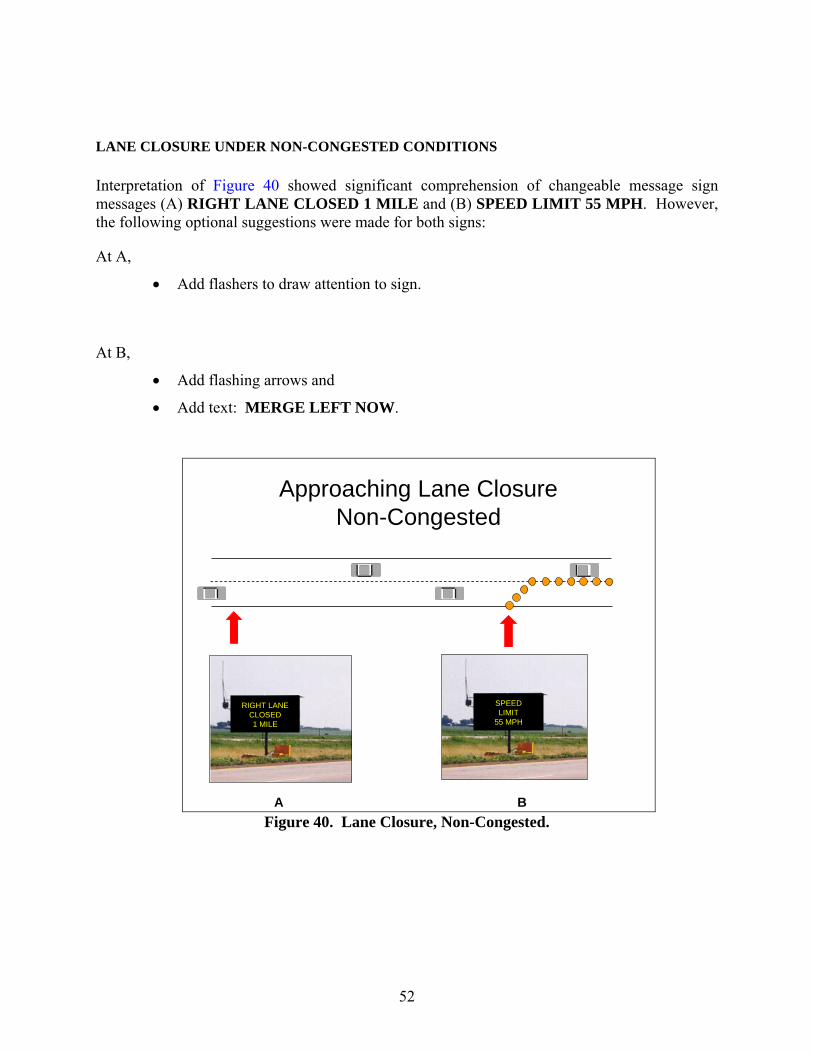
52
LANE CLOSURE UNDER NON-CONGESTED CONDITIONS
Interpretation of Figure 40 showed significant comprehension of changeable message sign messages (A) RIGHT LANE CLOSED 1 MILE and (B) SPEED LIMIT 55 MPH. However, the following optional suggestions were made for both signs:
At A,
• Add flashers to draw attention to sign.
At B,
• Add flashing arrows and
• Add text: MERGE LEFT NOW.
Approaching Lane Closure
Non-Congested
RIGHT LANECLOSED1 MILE
SPEEDLIMIT
55 MPH
A B Figure 40. Lane Closure, Non-Congested.
53
MEASURES OF EFFECTIVENESS
The research team compiled a list of potential measures of effectiveness (MOEs) for evaluating the performance of conditions-responsive traffic control systems, such as queue warning techniques and merge control strategies, in terms of their safety and operational effectiveness.
Potential safety MOEs include:
• traffic conflicts:
o sudden stops,
o intensive braking, and
o forced lane changes (to avoid rear-end collisions);
• erratic maneuvers:
o forced merges,
o last-minute lane changes in advance of lane closures, and
o lane straddles or blockings to prevent these maneuvers;
• speed variance;
• vehicle decelerations; and
• frequency of stop-and-go conditions.
Potential Operational MOEs include:
• vehicle throughput,
• average speed,
• travel time,
• delay,
• queue length,
• fuel consumption, and
• vehicle emission.
Technology evaluations described in the following chapters will use some of the MOEs listed above. They will either be directly measured or calculated from field observations, and some of them will be determined from simulation output.

54
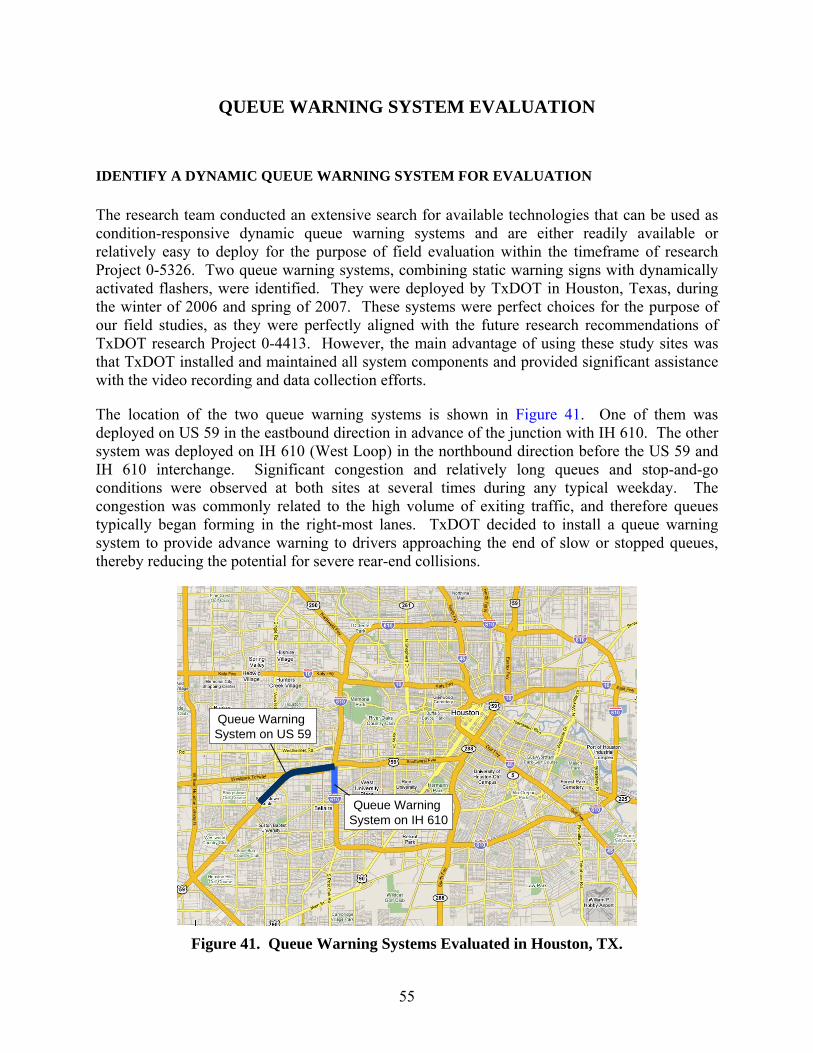
55
QUEUE WARNING SYSTEM EVALUATION
IDENTIFY A DYNAMIC QUEUE WARNING SYSTEM FOR EVALUATION
The research team conducted an extensive search for available technologies that can be used as condition-responsive dynamic queue warning systems and are either readily available or relatively easy to deploy for the purpose of field evaluation within the timeframe of research Project 0-5326. Two queue warning systems, combining static warning signs with dynamically activated flashers, were identified. They were deployed by TxDOT in Houston, Texas, during the winter of 2006 and spring of 2007. These systems were perfect choices for the purpose of our field studies, as they were perfectly aligned with the future research recommendations of TxDOT research Project 0-4413. However, the main advantage of using these study sites was that TxDOT installed and maintained all system components and provided significant assistance with the video recording and data collection efforts.
The location of the two queue warning systems is shown in Figure 41. One of them was deployed on US 59 in the eastbound direction in advance of the junction with IH 610. The other system was deployed on IH 610 (West Loop) in the northbound direction before the US 59 and IH 610 interchange. Significant congestion and relatively long queues and stop-and-go conditions were observed at both sites at several times during any typical weekday. The congestion was commonly related to the high volume of exiting traffic, and therefore queues typically began forming in the right-most lanes. TxDOT decided to install a queue warning system to provide advance warning to drivers approaching the end of slow or stopped queues, thereby reducing the potential for severe rear-end collisions.
Queue Warning System on US 59
Queue Warning System on IH 610
Figure 41. Queue Warning Systems Evaluated in Houston, TX.
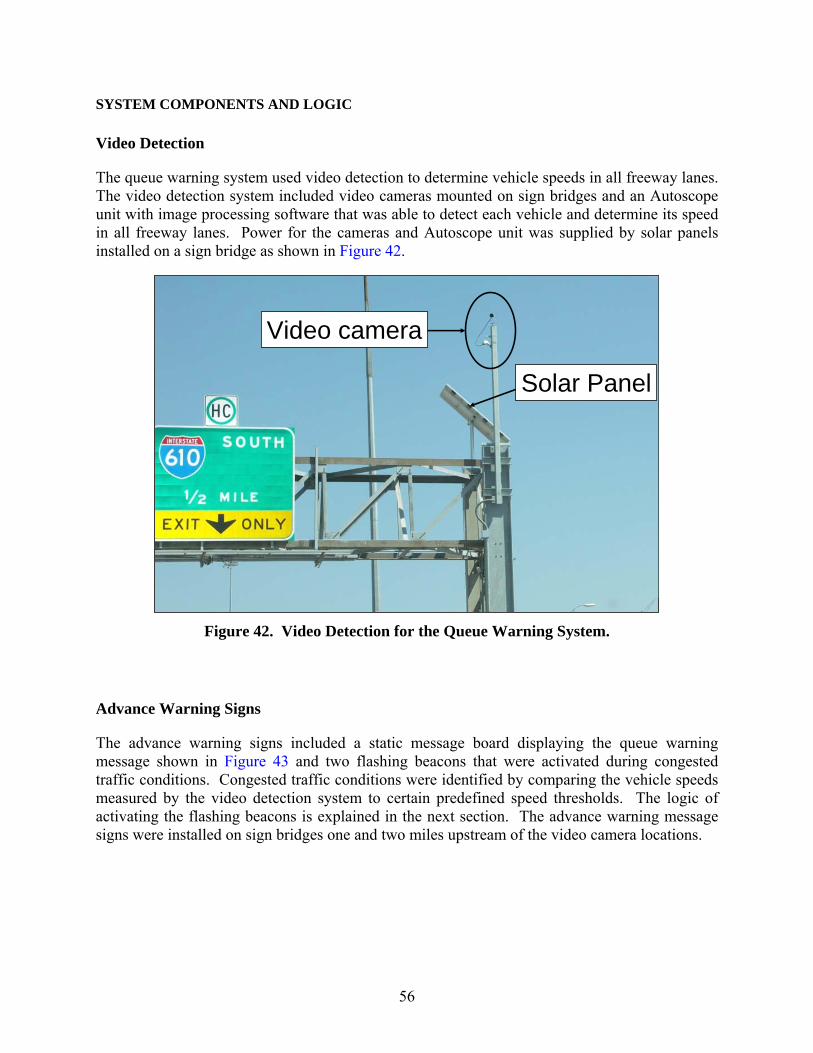
56
SYSTEM COMPONENTS AND LOGIC
Video Detection
The queue warning system used video detection to determine vehicle speeds in all freeway lanes. The video detection system included video cameras mounted on sign bridges and an Autoscope unit with image processing software that was able to detect each vehicle and determine its speed in all freeway lanes. Power for the cameras and Autoscope unit was supplied by solar panels installed on a sign bridge as shown in Figure 42.
Video camera
Solar Panel
Video camera
Solar Panel
Figure 42. Video Detection for the Queue Warning System.
Advance Warning Signs
The advance warning signs included a static message board displaying the queue warning message shown in Figure 43 and two flashing beacons that were activated during congested traffic conditions. Congested traffic conditions were identified by comparing the vehicle speeds measured by the video detection system to certain predefined speed thresholds. The logic of activating the flashing beacons is explained in the next section. The advance warning message signs were installed on sign bridges one and two miles upstream of the video camera locations.
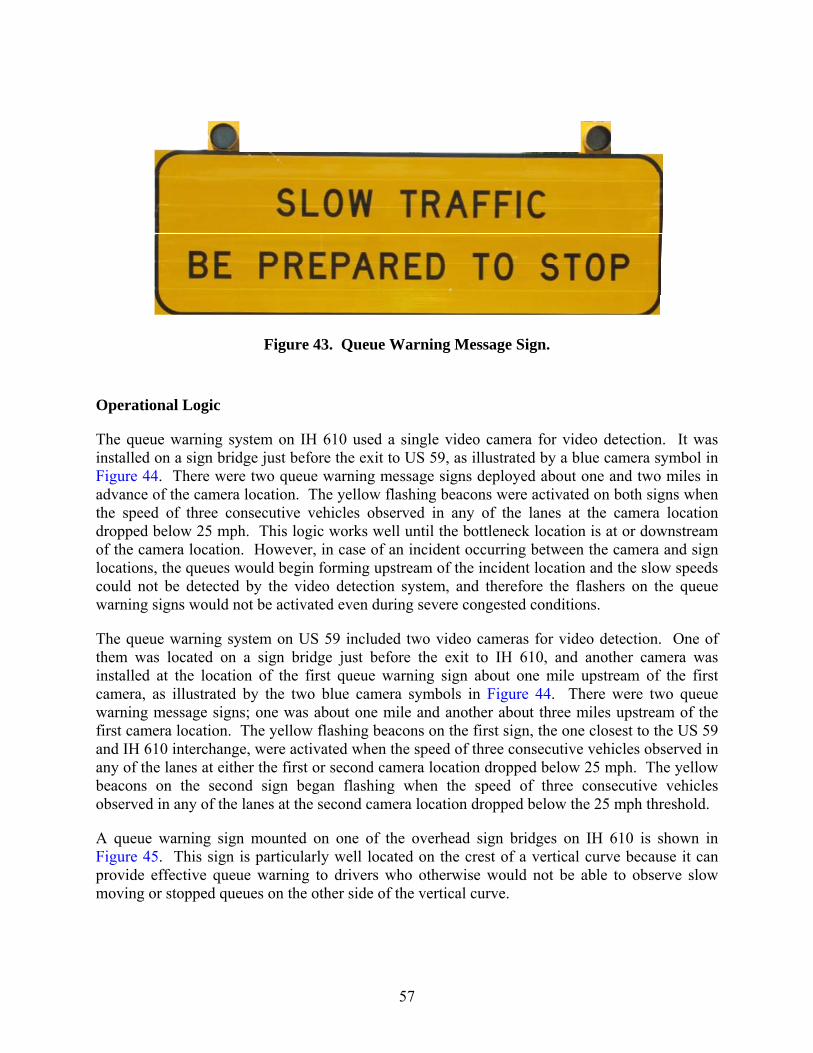
57
Figure 43. Queue Warning Message Sign.
Operational Logic
The queue warning system on IH 610 used a single video camera for video detection. It was installed on a sign bridge just before the exit to US 59, as illustrated by a blue camera symbol in Figure 44. There were two queue warning message signs deployed about one and two miles in advance of the camera location. The yellow flashing beacons were activated on both signs when the speed of three consecutive vehicles observed in any of the lanes at the camera location dropped below 25 mph. This logic works well until the bottleneck location is at or downstream of the camera location. However, in case of an incident occurring between the camera and sign locations, the queues would begin forming upstream of the incident location and the slow speeds could not be detected by the video detection system, and therefore the flashers on the queue warning signs would not be activated even during severe congested conditions.
The queue warning system on US 59 included two video cameras for video detection. One of them was located on a sign bridge just before the exit to IH 610, and another camera was installed at the location of the first queue warning sign about one mile upstream of the first camera, as illustrated by the two blue camera symbols in Figure 44. There were two queue warning message signs; one was about one mile and another about three miles upstream of the first camera location. The yellow flashing beacons on the first sign, the one closest to the US 59 and IH 610 interchange, were activated when the speed of three consecutive vehicles observed in any of the lanes at either the first or second camera location dropped below 25 mph. The yellow beacons on the second sign began flashing when the speed of three consecutive vehicles observed in any of the lanes at the second camera location dropped below the 25 mph threshold.
A queue warning sign mounted on one of the overhead sign bridges on IH 610 is shown in Figure 45. This sign is particularly well located on the crest of a vertical curve because it can provide effective queue warning to drivers who otherwise would not be able to observe slow moving or stopped queues on the other side of the vertical curve.
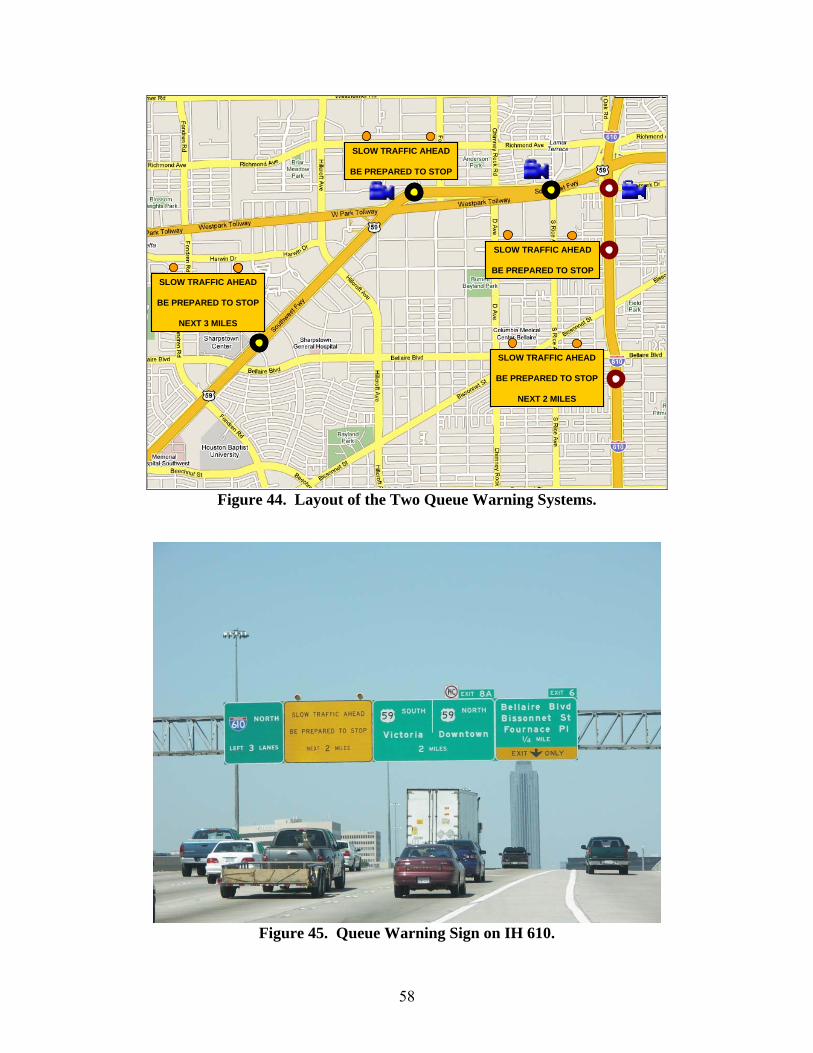
58
SLOW TRAFFIC AHEAD
BE PREPARED TO STOP
SLOW TRAFFIC AHEAD
BE PREPARED TO STOP
NEXT 2 MILES
SLOW TRAFFIC AHEAD
BE PREPARED TO STOP
SLOW TRAFFIC AHEAD
BE PREPARED TO STOP
NEXT 3 MILES
SLOW TRAFFIC AHEAD
BE PREPARED TO STOP
SLOW TRAFFIC AHEAD
BE PREPARED TO STOP
SLOW TRAFFIC AHEAD
BE PREPARED TO STOP
NEXT 2 MILES
SLOW TRAFFIC AHEAD
BE PREPARED TO STOP
NEXT 2 MILES
SLOW TRAFFIC AHEAD
BE PREPARED TO STOP
SLOW TRAFFIC AHEAD
BE PREPARED TO STOP
NEXT 3 MILES
SLOW TRAFFIC AHEAD
BE PREPARED TO STOP
SLOW TRAFFIC AHEAD
BE PREPARED TO STOP
SLOW TRAFFIC AHEAD
BE PREPARED TO STOP
NEXT 3 MILES
SLOW TRAFFIC AHEAD
BE PREPARED TO STOP
NEXT 3 MILES
Figure 44. Layout of the Two Queue Warning Systems.
Figure 45. Queue Warning Sign on IH 610.
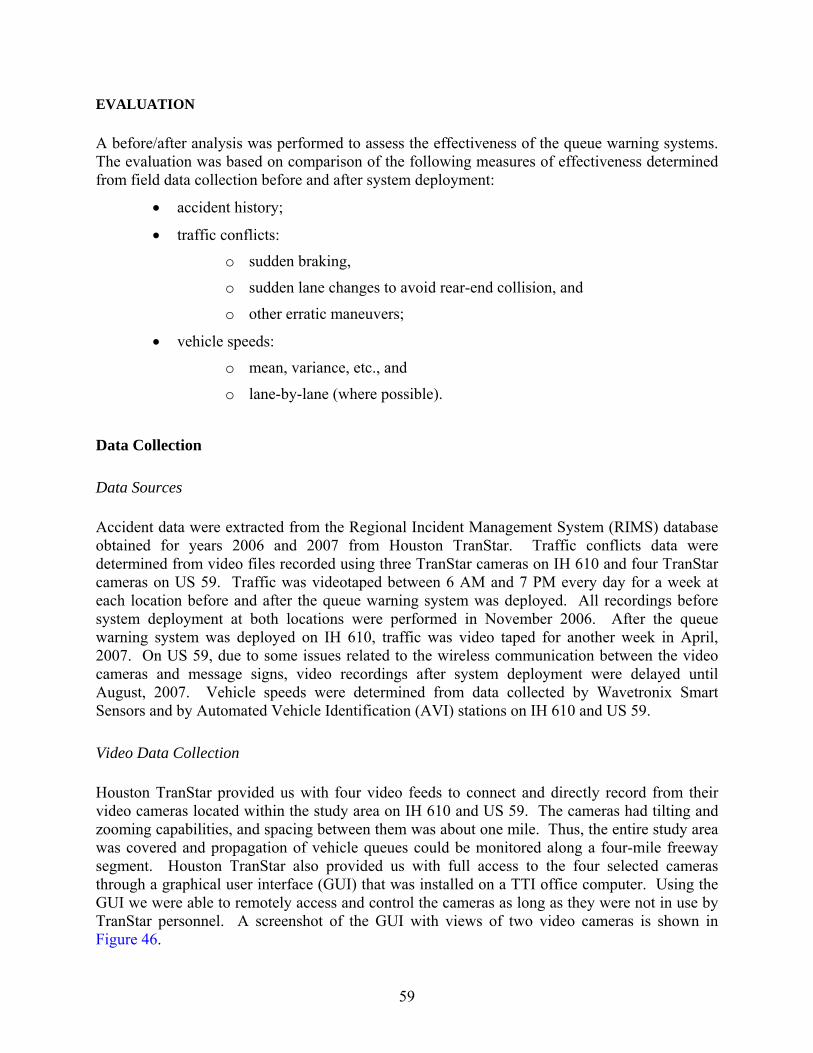
59
EVALUATION
A before/after analysis was performed to assess the effectiveness of the queue warning systems. The evaluation was based on comparison of the following measures of effectiveness determined from field data collection before and after system deployment:
• accident history;
• traffic conflicts:
o sudden braking,
o sudden lane changes to avoid rear-end collision, and
o other erratic maneuvers;
• vehicle speeds:
o mean, variance, etc., and
o lane-by-lane (where possible).
Data Collection
Data Sources
Accident data were extracted from the Regional Incident Management System (RIMS) database obtained for years 2006 and 2007 from Houston TranStar. Traffic conflicts data were determined from video files recorded using three TranStar cameras on IH 610 and four TranStar cameras on US 59. Traffic was videotaped between 6 AM and 7 PM every day for a week at each location before and after the queue warning system was deployed. All recordings before system deployment at both locations were performed in November 2006. After the queue warning system was deployed on IH 610, traffic was video taped for another week in April, 2007. On US 59, due to some issues related to the wireless communication between the video cameras and message signs, video recordings after system deployment were delayed until August, 2007. Vehicle speeds were determined from data collected by Wavetronix Smart Sensors and by Automated Vehicle Identification (AVI) stations on IH 610 and US 59.
Video Data Collection
Houston TranStar provided us with four video feeds to connect and directly record from their video cameras located within the study area on IH 610 and US 59. The cameras had tilting and zooming capabilities, and spacing between them was about one mile. Thus, the entire study area was covered and propagation of vehicle queues could be monitored along a four-mile freeway segment. Houston TranStar also provided us with full access to the four selected cameras through a graphical user interface (GUI) that was installed on a TTI office computer. Using the GUI we were able to remotely access and control the cameras as long as they were not in use by TranStar personnel. A screenshot of the GUI with views of two video cameras is shown in Figure 46.
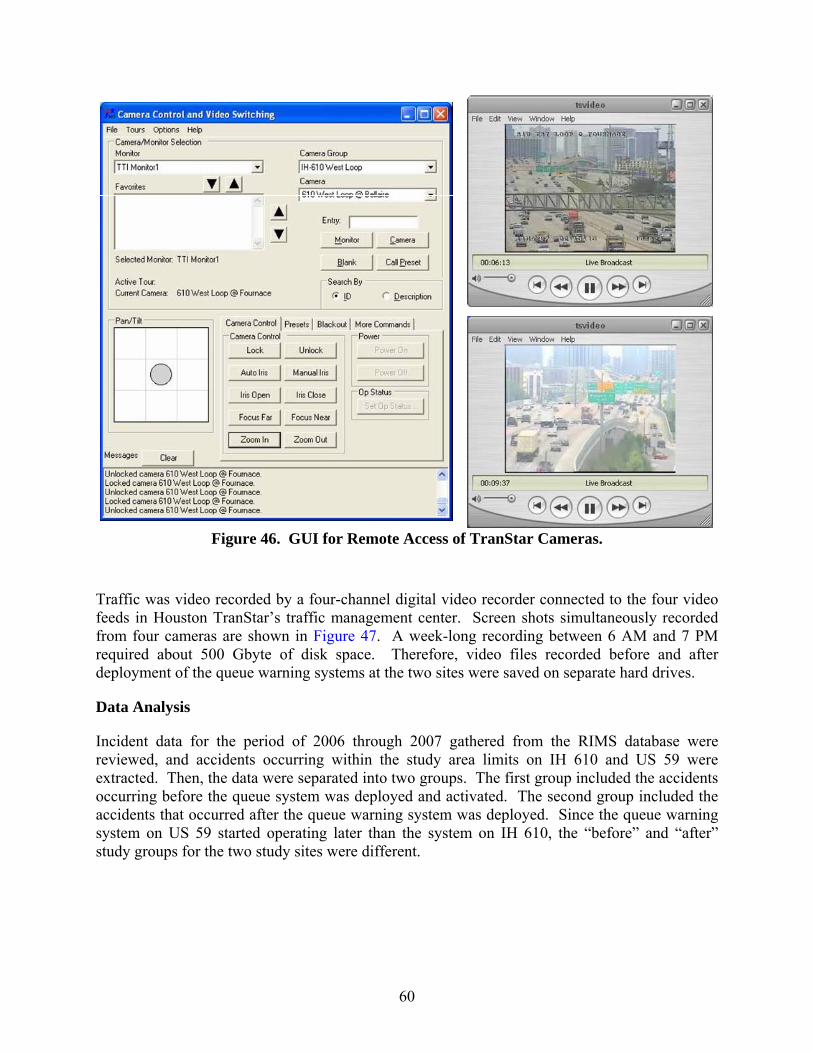
60
Figure 46. GUI for Remote Access of TranStar Cameras.
Traffic was video recorded by a four-channel digital video recorder connected to the four video feeds in Houston TranStar’s traffic management center. Screen shots simultaneously recorded from four cameras are shown in Figure 47. A week-long recording between 6 AM and 7 PM required about 500 Gbyte of disk space. Therefore, video files recorded before and after deployment of the queue warning systems at the two sites were saved on separate hard drives.
Data Analysis
Incident data for the period of 2006 through 2007 gathered from the RIMS database were reviewed, and accidents occurring within the study area limits on IH 610 and US 59 were extracted. Then, the data were separated into two groups. The first group included the accidents occurring before the queue system was deployed and activated. The second group included the accidents that occurred after the queue warning system was deployed. Since the queue warning system on US 59 started operating later than the system on IH 610, the “before” and “after” study groups for the two study sites were different.
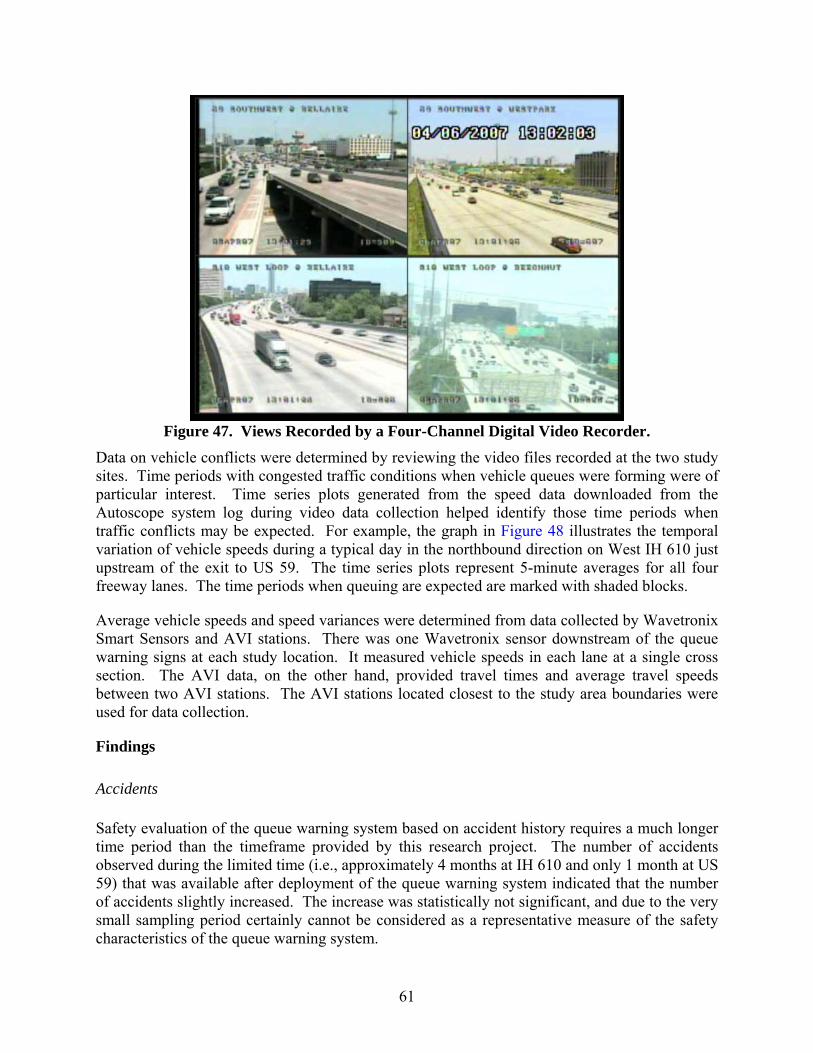
61
Figure 47. Views Recorded by a Four-Channel Digital Video Recorder.
Data on vehicle conflicts were determined by reviewing the video files recorded at the two study sites. Time periods with congested traffic conditions when vehicle queues were forming were of particular interest. Time series plots generated from the speed data downloaded from the Autoscope system log during video data collection helped identify those time periods when traffic conflicts may be expected. For example, the graph in Figure 48 illustrates the temporal variation of vehicle speeds during a typical day in the northbound direction on West IH 610 just upstream of the exit to US 59. The time series plots represent 5-minute averages for all four freeway lanes. The time periods when queuing are expected are marked with shaded blocks.
Average vehicle speeds and speed variances were determined from data collected by Wavetronix Smart Sensors and AVI stations. There was one Wavetronix sensor downstream of the queue warning signs at each study location. It measured vehicle speeds in each lane at a single cross section. The AVI data, on the other hand, provided travel times and average travel speeds between two AVI stations. The AVI stations located closest to the study area boundaries were used for data collection.
Findings
Accidents
Safety evaluation of the queue warning system based on accident history requires a much longer time period than the timeframe provided by this research project. The number of accidents observed during the limited time (i.e., approximately 4 months at IH 610 and only 1 month at US 59) that was available after deployment of the queue warning system indicated that the number of accidents slightly increased. The increase was statistically not significant, and due to the very small sampling period certainly cannot be considered as a representative measure of the safety characteristics of the queue warning system.
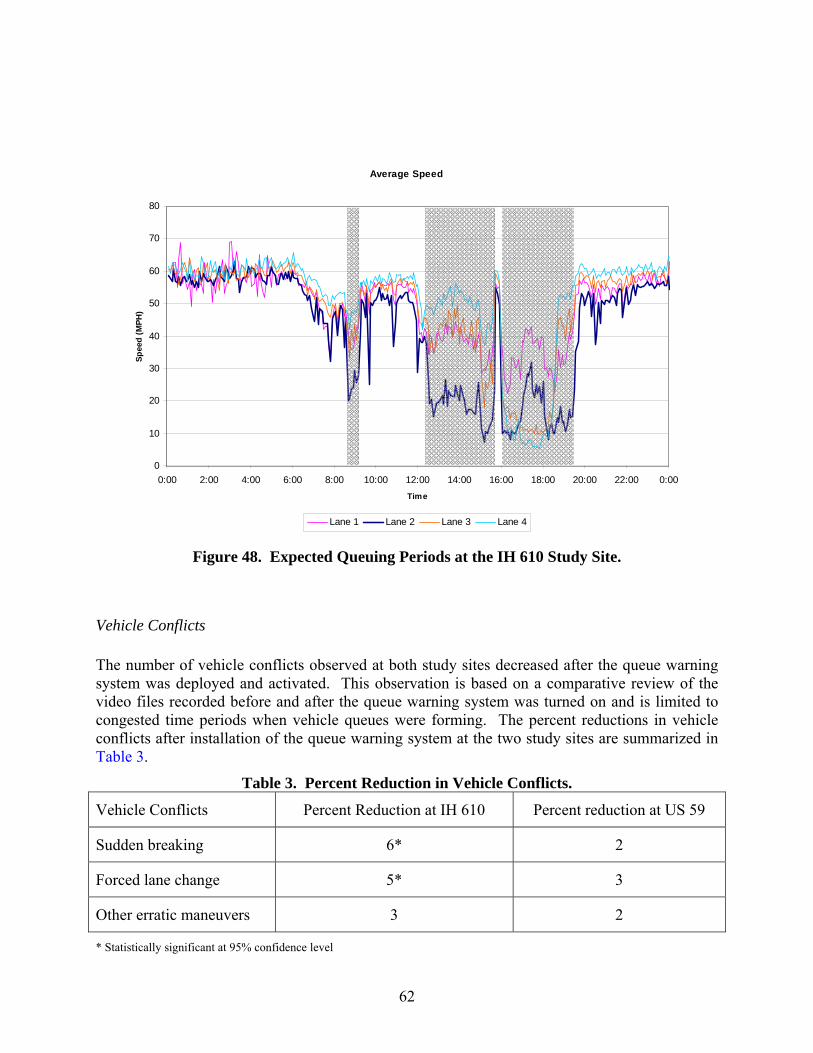
62
Average Speed
0
10
20
30
40
50
60
70
80
0:00 2:00 4:00 6:00 8:00 10:00 12:00 14:00 16:00 18:00 20:00 22:00 0:00Time
Spee
d (M
PH)
Lane 1 Lane 2 Lane 3 Lane 4
Average Speed
0
10
20
30
40
50
60
70
80
0:00 2:00 4:00 6:00 8:00 10:00 12:00 14:00 16:00 18:00 20:00 22:00 0:00Time
Spee
d (M
PH)
Lane 1 Lane 2 Lane 3 Lane 4
Figure 48. Expected Queuing Periods at the IH 610 Study Site.
Vehicle Conflicts
The number of vehicle conflicts observed at both study sites decreased after the queue warning system was deployed and activated. This observation is based on a comparative review of the video files recorded before and after the queue warning system was turned on and is limited to congested time periods when vehicle queues were forming. The percent reductions in vehicle conflicts after installation of the queue warning system at the two study sites are summarized in Table 3.
Table 3. Percent Reduction in Vehicle Conflicts.
Vehicle Conflicts Percent Reduction at IH 610 Percent reduction at US 59
Sudden breaking 6* 2
Forced lane change 5* 3
Other erratic maneuvers 3 2
* Statistically significant at 95% confidence level
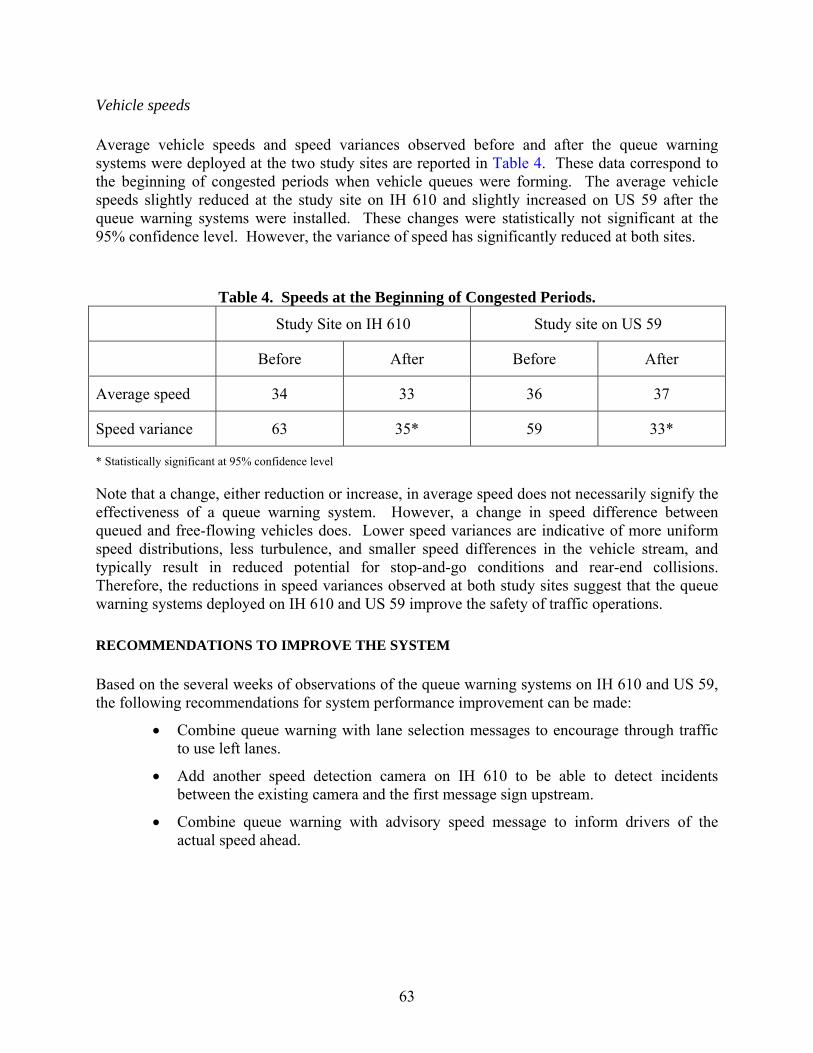
63
Vehicle speeds
Average vehicle speeds and speed variances observed before and after the queue warning systems were deployed at the two study sites are reported in Table 4. These data correspond to the beginning of congested periods when vehicle queues were forming. The average vehicle speeds slightly reduced at the study site on IH 610 and slightly increased on US 59 after the queue warning systems were installed. These changes were statistically not significant at the 95% confidence level. However, the variance of speed has significantly reduced at both sites.
Table 4. Speeds at the Beginning of Congested Periods.
Study Site on IH 610 Study site on US 59
Before After Before After
Average speed 34 33 36 37
Speed variance 63 35* 59 33*
* Statistically significant at 95% confidence level
Note that a change, either reduction or increase, in average speed does not necessarily signify the effectiveness of a queue warning system. However, a change in speed difference between queued and free-flowing vehicles does. Lower speed variances are indicative of more uniform speed distributions, less turbulence, and smaller speed differences in the vehicle stream, and typically result in reduced potential for stop-and-go conditions and rear-end collisions. Therefore, the reductions in speed variances observed at both study sites suggest that the queue warning systems deployed on IH 610 and US 59 improve the safety of traffic operations.
RECOMMENDATIONS TO IMPROVE THE SYSTEM
Based on the several weeks of observations of the queue warning systems on IH 610 and US 59, the following recommendations for system performance improvement can be made:
• Combine queue warning with lane selection messages to encourage through traffic to use left lanes.
• Add another speed detection camera on IH 610 to be able to detect incidents between the existing camera and the first message sign upstream.
• Combine queue warning with advisory speed message to inform drivers of the actual speed ahead.

64
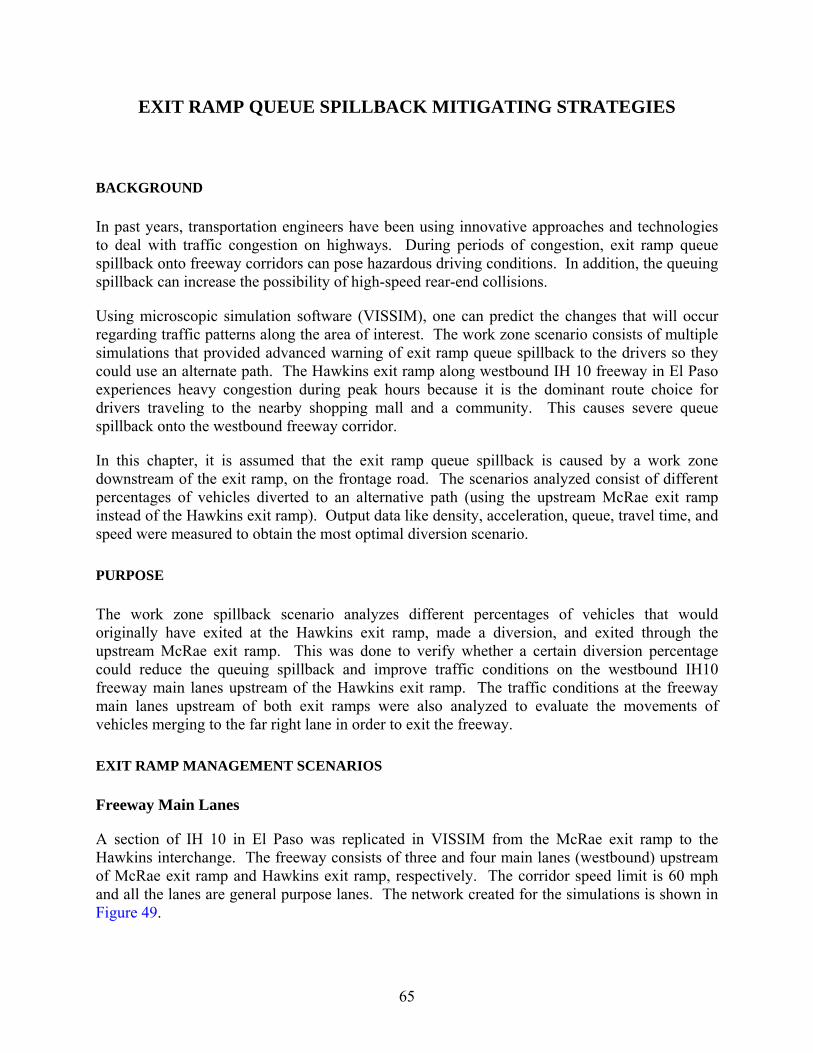
65
EXIT RAMP QUEUE SPILLBACK MITIGATING STRATEGIES
BACKGROUND
In past years, transportation engineers have been using innovative approaches and technologies to deal with traffic congestion on highways. During periods of congestion, exit ramp queue spillback onto freeway corridors can pose hazardous driving conditions. In addition, the queuing spillback can increase the possibility of high-speed rear-end collisions.
Using microscopic simulation software (VISSIM), one can predict the changes that will occur regarding traffic patterns along the area of interest. The work zone scenario consists of multiple simulations that provided advanced warning of exit ramp queue spillback to the drivers so they could use an alternate path. The Hawkins exit ramp along westbound IH 10 freeway in El Paso experiences heavy congestion during peak hours because it is the dominant route choice for drivers traveling to the nearby shopping mall and a community. This causes severe queue spillback onto the westbound freeway corridor.
In this chapter, it is assumed that the exit ramp queue spillback is caused by a work zone downstream of the exit ramp, on the frontage road. The scenarios analyzed consist of different percentages of vehicles diverted to an alternative path (using the upstream McRae exit ramp instead of the Hawkins exit ramp). Output data like density, acceleration, queue, travel time, and speed were measured to obtain the most optimal diversion scenario.
PURPOSE
The work zone spillback scenario analyzes different percentages of vehicles that would originally have exited at the Hawkins exit ramp, made a diversion, and exited through the upstream McRae exit ramp. This was done to verify whether a certain diversion percentage could reduce the queuing spillback and improve traffic conditions on the westbound IH10 freeway main lanes upstream of the Hawkins exit ramp. The traffic conditions at the freeway main lanes upstream of both exit ramps were also analyzed to evaluate the movements of vehicles merging to the far right lane in order to exit the freeway.
EXIT RAMP MANAGEMENT SCENARIOS
Freeway Main Lanes
A section of IH 10 in El Paso was replicated in VISSIM from the McRae exit ramp to the Hawkins interchange. The freeway consists of three and four main lanes (westbound) upstream of McRae exit ramp and Hawkins exit ramp, respectively. The corridor speed limit is 60 mph and all the lanes are general purpose lanes. The network created for the simulations is shown in Figure 49.
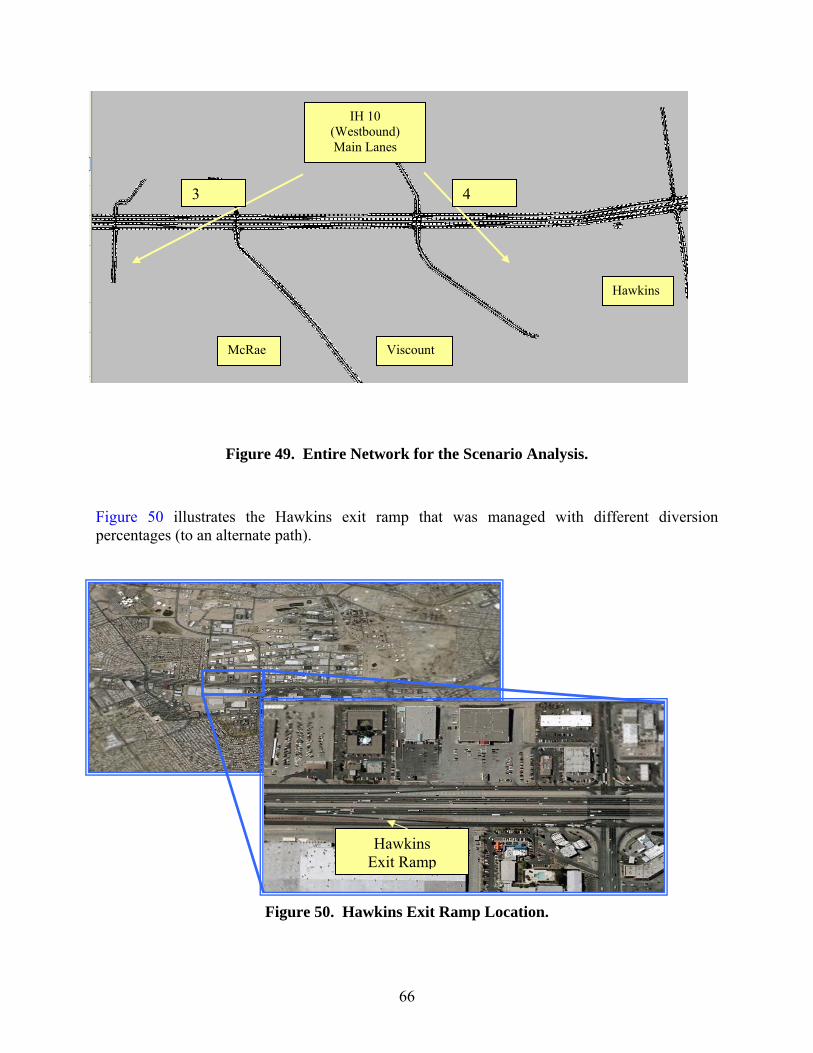
66
Figure 49. Entire Network for the Scenario Analysis.
Figure 50 illustrates the Hawkins exit ramp that was managed with different diversion percentages (to an alternate path).
Figure 50. Hawkins Exit Ramp Location.
Hawkins Exit Ramp
Hawkins
Viscount McRae
IH 10 (Westbound) Main Lanes
3 4
67
Freeway Vehicle Mix
In the simulation model, all private vehicles are classified as one vehicle type. The vehicle composition in El Paso has a high volume of truck traffic, usually ranging somewhere around 10%. Transit vehicles also have several routes that transverse through this corridor. Therefore, a “normal mix” was chosen to include 90% cars, 9% trucks, and 1% buses.
Freeway Volume
The research team did several sessions of volume counts from the video recordings taken on the freeway between McRae and Hawkins interchanges to get an accurate vehicle input volume. For each simulation run, which lasted for one hour, the freeway input volume was changed every 15 minutes (900 seconds). The freeway main lane input volumes used were 5464 vehicles per hour (vph) (from simulation clock of 0-900 seconds), 5452 vph (900-1800 seconds), 5240 vph (1800-2700 seconds), and 5408 vph (2700-3600 seconds).
Ramp Merge Conditions
The existing geometric design configurations at the Hawkins exit ramp can be denominated as “basic” since traffic on the right-most lane can either continue downstream on the freeway or take the exit ramp exit onto the frontage road. However, once on the frontage road and depending on the driver’s intended destination, maneuvering space may be limited. For example, drivers leaving the exit ramp onto the leftmost lane of the frontage road (westbound) and making a right turn to go north to Hawkins have limited space to move from the left-most lane of the frontage road to the right-most lane. This can be problematic if the frontage road is already congested or has a vehicle queue due to the traffic signal at the diamond interchange. On the other hand, drivers who take the upstream exit ramp exit and enter the frontage road early have more space to make the necessary lane changes. The previously mentioned condition can create spillback on the ramp as well as on the right-most lane on the IH 10 freeway as vehicles leaving the Hawkins exit ramps have to form a queue at the ramp due to the congestion on the frontage road.
Ramp Volumes
The traffic volumes on each of the simulated exit ramps were dynamic (varied during a simulation run). They depended on the presence of diversion and the percentage of diversion. The research team decided to use one specific set of volumes (from the upstream end of the freeway to the exit ramps) before applying any diversion percentage. Table 5 shows the specified volumes for the two exit ramps. The volume shown for the McRae exit ramp in Table 5 is the input for the base scenario (no diversion), but it may increase as diversion is applied to the model. Similarly for the Hawkins exit ramp, the volume may decrease if a certain percentage of traffic is diverted to the MaRae exit ramp. It was assumed that 5%, 10%, 15% and 20% of the Hawkins exit ramp traffic were diverted to the McRae exit ramp in the different scenarios.
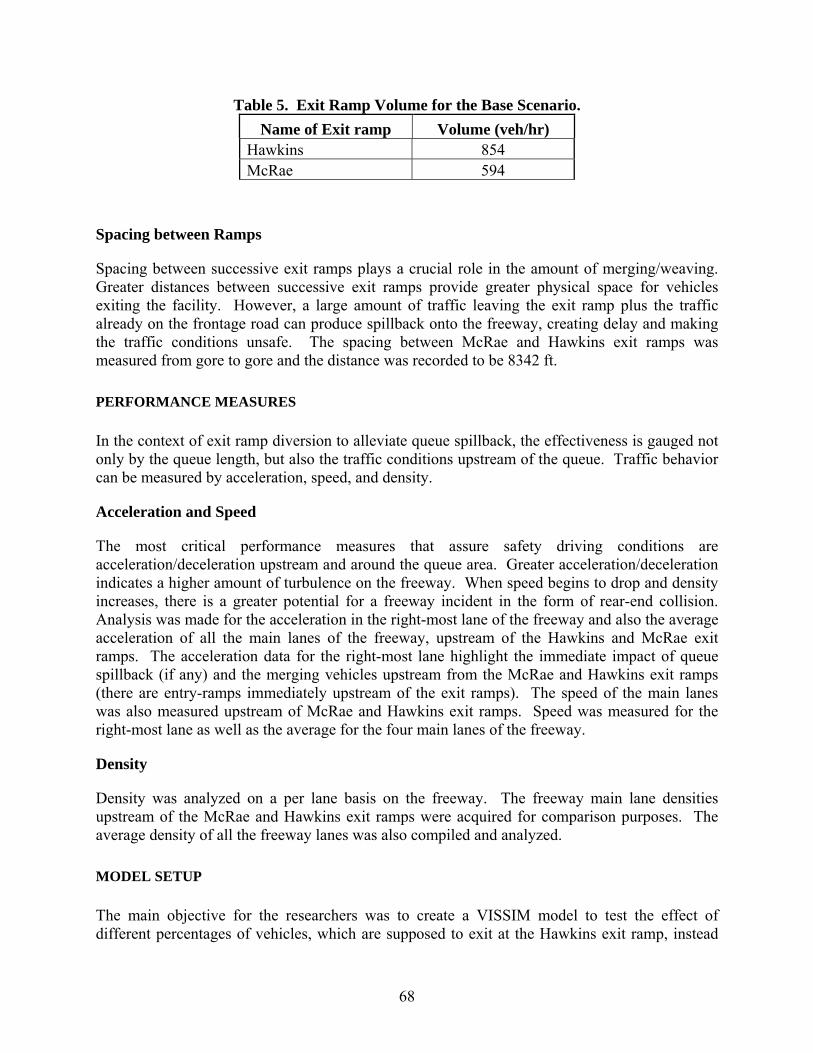
68
Table 5. Exit Ramp Volume for the Base Scenario. Name of Exit ramp Volume (veh/hr)
Hawkins 854 McRae 594
Spacing between Ramps
Spacing between successive exit ramps plays a crucial role in the amount of merging/weaving. Greater distances between successive exit ramps provide greater physical space for vehicles exiting the facility. However, a large amount of traffic leaving the exit ramp plus the traffic already on the frontage road can produce spillback onto the freeway, creating delay and making the traffic conditions unsafe. The spacing between McRae and Hawkins exit ramps was measured from gore to gore and the distance was recorded to be 8342 ft.
PERFORMANCE MEASURES
In the context of exit ramp diversion to alleviate queue spillback, the effectiveness is gauged not only by the queue length, but also the traffic conditions upstream of the queue. Traffic behavior can be measured by acceleration, speed, and density.
Acceleration and Speed
The most critical performance measures that assure safety driving conditions are acceleration/deceleration upstream and around the queue area. Greater acceleration/deceleration indicates a higher amount of turbulence on the freeway. When speed begins to drop and density increases, there is a greater potential for a freeway incident in the form of rear-end collision. Analysis was made for the acceleration in the right-most lane of the freeway and also the average acceleration of all the main lanes of the freeway, upstream of the Hawkins and McRae exit ramps. The acceleration data for the right-most lane highlight the immediate impact of queue spillback (if any) and the merging vehicles upstream from the McRae and Hawkins exit ramps (there are entry-ramps immediately upstream of the exit ramps). The speed of the main lanes was also measured upstream of McRae and Hawkins exit ramps. Speed was measured for the right-most lane as well as the average for the four main lanes of the freeway.
Density
Density was analyzed on a per lane basis on the freeway. The freeway main lane densities upstream of the McRae and Hawkins exit ramps were acquired for comparison purposes. The average density of all the freeway lanes was also compiled and analyzed.
MODEL SETUP
The main objective for the researchers was to create a VISSIM model to test the effect of different percentages of vehicles, which are supposed to exit at the Hawkins exit ramp, instead
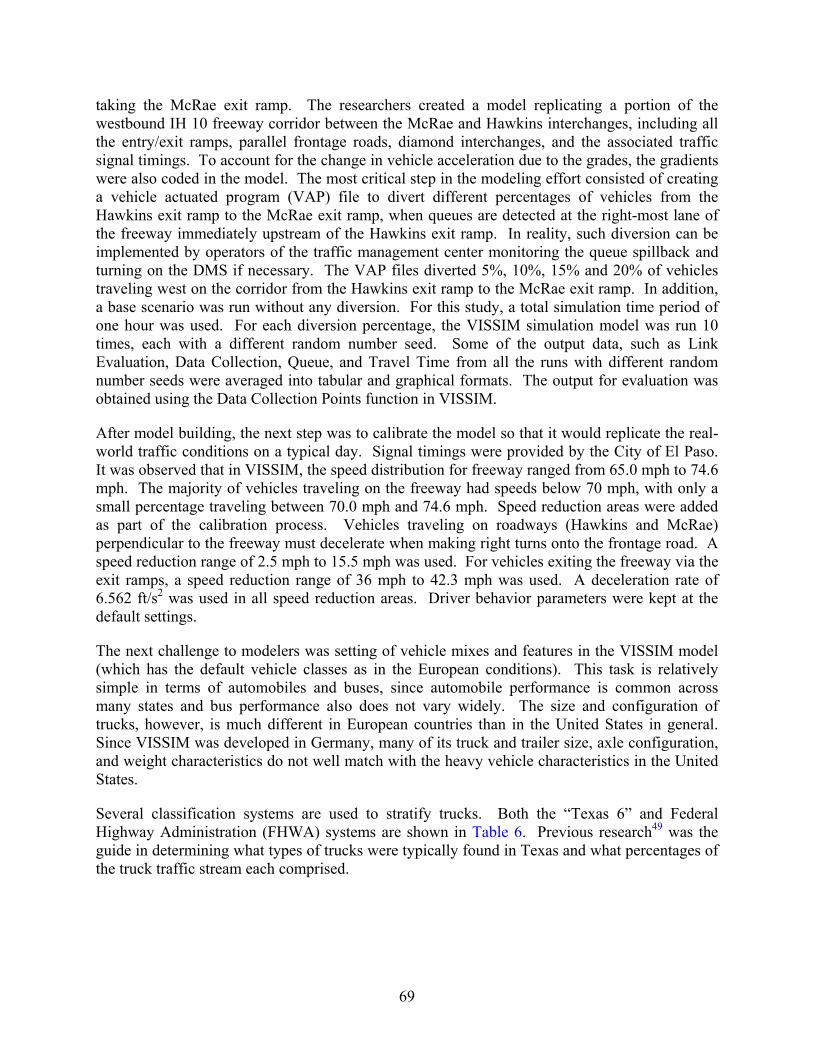
69
taking the McRae exit ramp. The researchers created a model replicating a portion of the westbound IH 10 freeway corridor between the McRae and Hawkins interchanges, including all the entry/exit ramps, parallel frontage roads, diamond interchanges, and the associated traffic signal timings. To account for the change in vehicle acceleration due to the grades, the gradients were also coded in the model. The most critical step in the modeling effort consisted of creating a vehicle actuated program (VAP) file to divert different percentages of vehicles from the Hawkins exit ramp to the McRae exit ramp, when queues are detected at the right-most lane of the freeway immediately upstream of the Hawkins exit ramp. In reality, such diversion can be implemented by operators of the traffic management center monitoring the queue spillback and turning on the DMS if necessary. The VAP files diverted 5%, 10%, 15% and 20% of vehicles traveling west on the corridor from the Hawkins exit ramp to the McRae exit ramp. In addition, a base scenario was run without any diversion. For this study, a total simulation time period of one hour was used. For each diversion percentage, the VISSIM simulation model was run 10 times, each with a different random number seed. Some of the output data, such as Link Evaluation, Data Collection, Queue, and Travel Time from all the runs with different random number seeds were averaged into tabular and graphical formats. The output for evaluation was obtained using the Data Collection Points function in VISSIM.
After model building, the next step was to calibrate the model so that it would replicate the real-world traffic conditions on a typical day. Signal timings were provided by the City of El Paso. It was observed that in VISSIM, the speed distribution for freeway ranged from 65.0 mph to 74.6 mph. The majority of vehicles traveling on the freeway had speeds below 70 mph, with only a small percentage traveling between 70.0 mph and 74.6 mph. Speed reduction areas were added as part of the calibration process. Vehicles traveling on roadways (Hawkins and McRae) perpendicular to the freeway must decelerate when making right turns onto the frontage road. A speed reduction range of 2.5 mph to 15.5 mph was used. For vehicles exiting the freeway via the exit ramps, a speed reduction range of 36 mph to 42.3 mph was used. A deceleration rate of 6.562 ft/s2 was used in all speed reduction areas. Driver behavior parameters were kept at the default settings.
The next challenge to modelers was setting of vehicle mixes and features in the VISSIM model (which has the default vehicle classes as in the European conditions). This task is relatively simple in terms of automobiles and buses, since automobile performance is common across many states and bus performance also does not vary widely. The size and configuration of trucks, however, is much different in European countries than in the United States in general. Since VISSIM was developed in Germany, many of its truck and trailer size, axle configuration, and weight characteristics do not well match with the heavy vehicle characteristics in the United States.
Several classification systems are used to stratify trucks. Both the “Texas 6” and Federal Highway Administration (FHWA) systems are shown in Table 6. Previous research49 was the guide in determining what types of trucks were typically found in Texas and what percentages of the truck traffic stream each comprised.
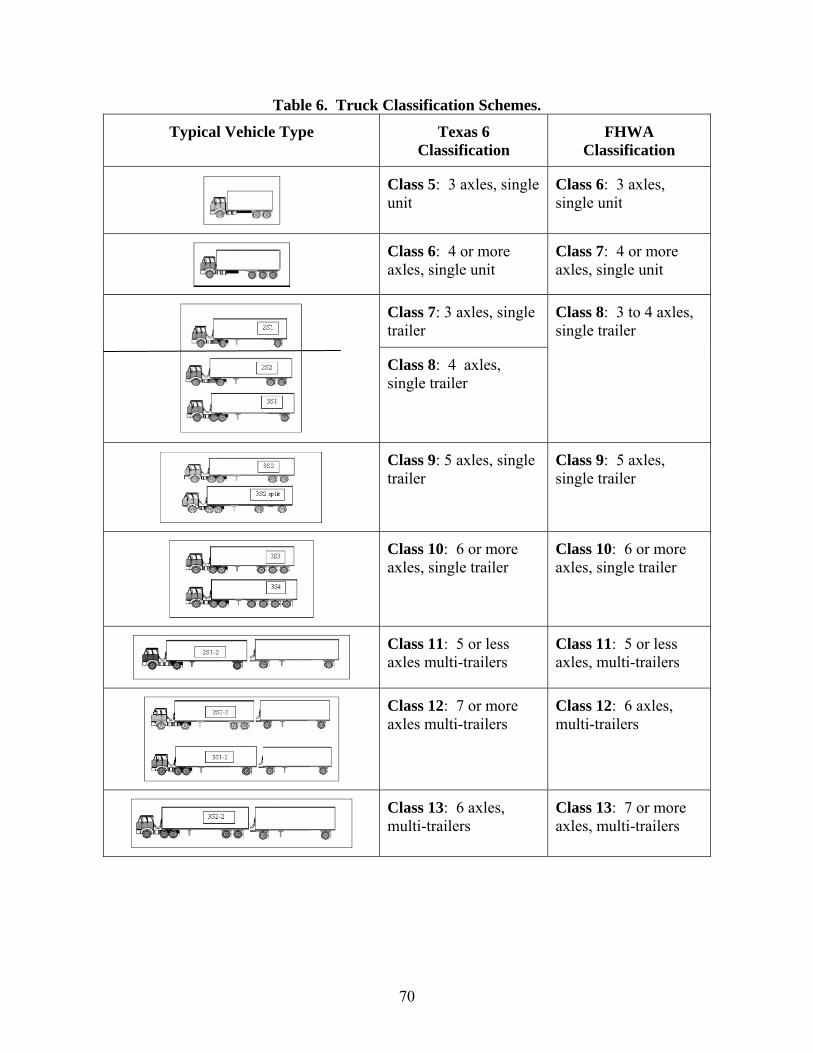
70
Table 6. Truck Classification Schemes.
Typical Vehicle Type Texas 6 Classification
FHWA Classification
Class 5: 3 axles, single unit
Class 6: 3 axles, single unit
Class 6: 4 or more axles, single unit
Class 7: 4 or more axles, single unit
Class 7: 3 axles, single trailer
Class 8: 4 axles, single trailer
Class 8: 3 to 4 axles, single trailer
Class 9: 5 axles, single trailer
Class 9: 5 axles, single trailer
Class 10: 6 or more axles, single trailer
Class 10: 6 or more axles, single trailer
Class 11: 5 or less axles multi-trailers
Class 11: 5 or less axles, multi-trailers
Class 12: 7 or more axles multi-trailers
Class 12: 6 axles, multi-trailers
Class 13: 6 axles, multi-trailers
Class 13: 7 or more axles, multi-trailers
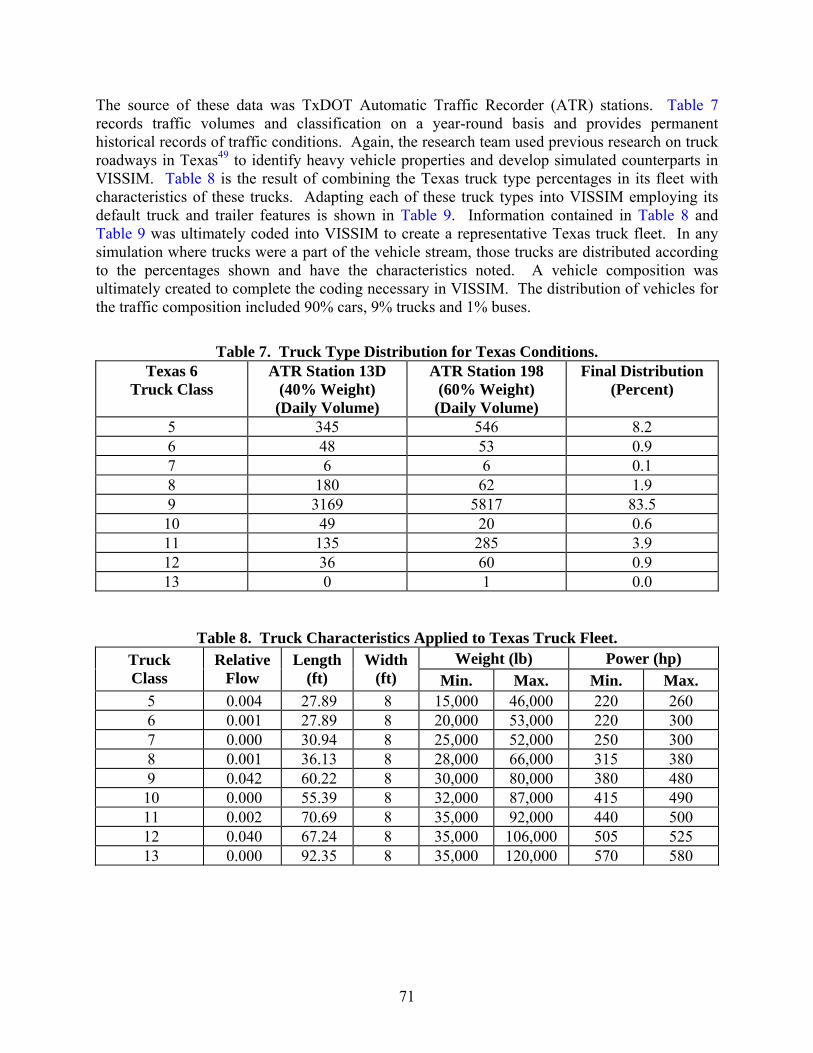
71
The source of these data was TxDOT Automatic Traffic Recorder (ATR) stations. Table 7 records traffic volumes and classification on a year-round basis and provides permanent historical records of traffic conditions. Again, the research team used previous research on truck roadways in Texas49 to identify heavy vehicle properties and develop simulated counterparts in VISSIM. Table 8 is the result of combining the Texas truck type percentages in its fleet with characteristics of these trucks. Adapting each of these truck types into VISSIM employing its default truck and trailer features is shown in Table 9. Information contained in Table 8 and Table 9 was ultimately coded into VISSIM to create a representative Texas truck fleet. In any simulation where trucks were a part of the vehicle stream, those trucks are distributed according to the percentages shown and have the characteristics noted. A vehicle composition was ultimately created to complete the coding necessary in VISSIM. The distribution of vehicles for the traffic composition included 90% cars, 9% trucks and 1% buses.
Table 7. Truck Type Distribution for Texas Conditions.
Texas 6 Truck Class
ATR Station 13D (40% Weight) (Daily Volume)
ATR Station 198 (60% Weight) (Daily Volume)
Final Distribution (Percent)
5 345 546 8.2 6 48 53 0.9 7 6 6 0.1 8 180 62 1.9 9 3169 5817 83.5 10 49 20 0.6 11 135 285 3.9 12 36 60 0.9 13 0 1 0.0
Table 8. Truck Characteristics Applied to Texas Truck Fleet. Weight (lb) Power (hp) Truck
Class Relative
Flow Length
(ft) Width
(ft) Min. Max. Min. Max. 5 0.004 27.89 8 15,000 46,000 220 260 6 0.001 27.89 8 20,000 53,000 220 300 7 0.000 30.94 8 25,000 52,000 250 300 8 0.001 36.13 8 28,000 66,000 315 380 9 0.042 60.22 8 30,000 80,000 380 480 10 0.000 55.39 8 32,000 87,000 415 490 11 0.002 70.69 8 35,000 92,000 440 500 12 0.040 67.24 8 35,000 106,000 505 525 13 0.000 92.35 8 35,000 120,000 570 580
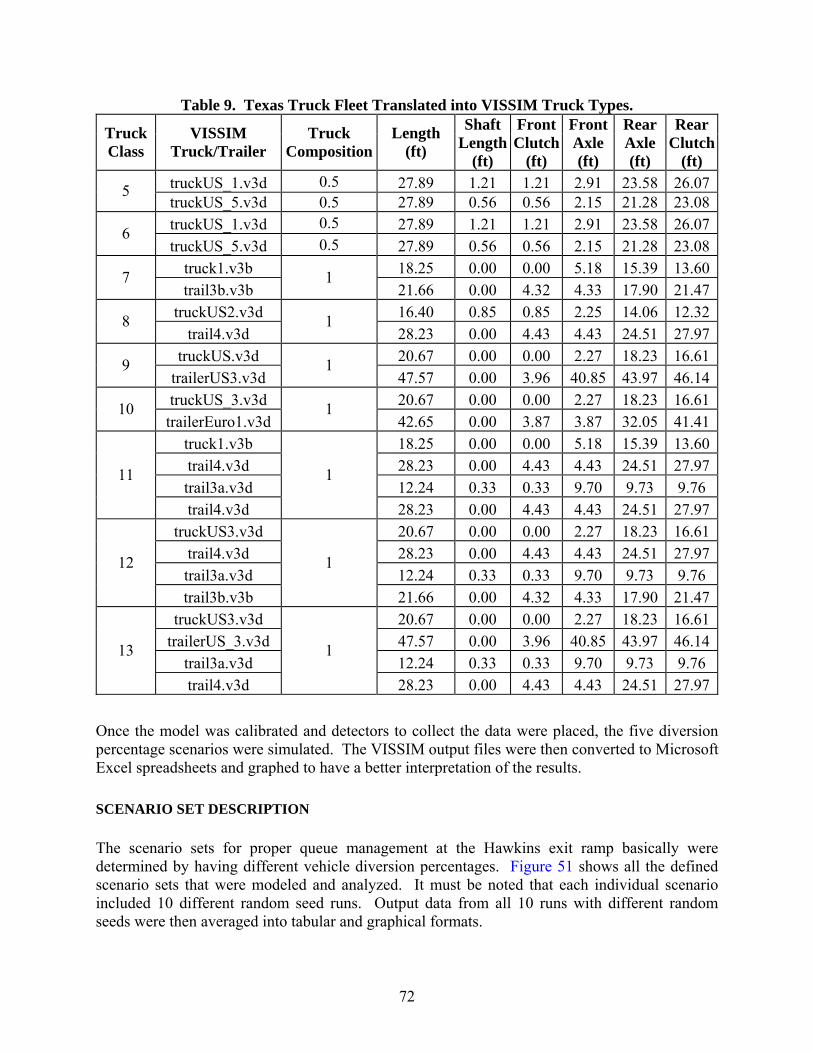
72
Table 9. Texas Truck Fleet Translated into VISSIM Truck Types.
Truck Class
VISSIM Truck/Trailer
Truck Composition
Length (ft)
Shaft Length
(ft)
Front Clutch
(ft)
Front Axle (ft)
Rear Axle (ft)
Rear Clutch
(ft) truckUS_1.v3d 0.5 27.89 1.21 1.21 2.91 23.58 26.075 truckUS_5.v3d 0.5 27.89 0.56 0.56 2.15 21.28 23.08truckUS_1.v3d 0.5 27.89 1.21 1.21 2.91 23.58 26.076 truckUS_5.v3d 0.5 27.89 0.56 0.56 2.15 21.28 23.08
truck1.v3b 18.25 0.00 0.00 5.18 15.39 13.607 trail3b.v3b
1 21.66 0.00 4.32 4.33 17.90 21.47
truckUS2.v3d 16.40 0.85 0.85 2.25 14.06 12.328 trail4.v3d
1 28.23 0.00 4.43 4.43 24.51 27.97
truckUS.v3d 20.67 0.00 0.00 2.27 18.23 16.619 trailerUS3.v3d
1 47.57 0.00 3.96 40.85 43.97 46.14
truckUS_3.v3d 20.67 0.00 0.00 2.27 18.23 16.6110 trailerEuro1.v3d
1 42.65 0.00 3.87 3.87 32.05 41.41
truck1.v3b 18.25 0.00 0.00 5.18 15.39 13.60trail4.v3d 28.23 0.00 4.43 4.43 24.51 27.97trail3a.v3d 12.24 0.33 0.33 9.70 9.73 9.76
11
trail4.v3d
1
28.23 0.00 4.43 4.43 24.51 27.97truckUS3.v3d 20.67 0.00 0.00 2.27 18.23 16.61
trail4.v3d 28.23 0.00 4.43 4.43 24.51 27.97trail3a.v3d 12.24 0.33 0.33 9.70 9.73 9.76
12
trail3b.v3b
1
21.66 0.00 4.32 4.33 17.90 21.47truckUS3.v3d 20.67 0.00 0.00 2.27 18.23 16.61
trailerUS_3.v3d 47.57 0.00 3.96 40.85 43.97 46.14trail3a.v3d 12.24 0.33 0.33 9.70 9.73 9.76
13
trail4.v3d
1
28.23 0.00 4.43 4.43 24.51 27.97
Once the model was calibrated and detectors to collect the data were placed, the five diversion percentage scenarios were simulated. The VISSIM output files were then converted to Microsoft Excel spreadsheets and graphed to have a better interpretation of the results.
SCENARIO SET DESCRIPTION
The scenario sets for proper queue management at the Hawkins exit ramp basically were determined by having different vehicle diversion percentages. Figure 51 shows all the defined scenario sets that were modeled and analyzed. It must be noted that each individual scenario included 10 different random seed runs. Output data from all 10 runs with different random seeds were then averaged into tabular and graphical formats.
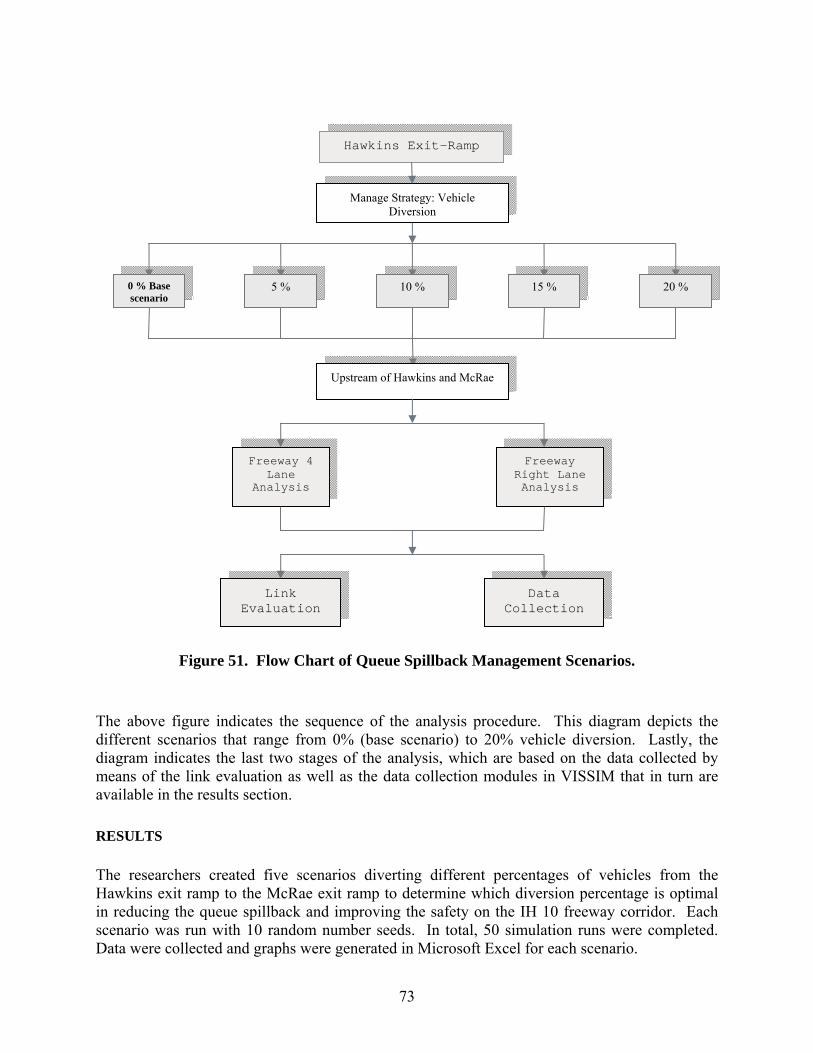
73
Figure 51. Flow Chart of Queue Spillback Management Scenarios.
The above figure indicates the sequence of the analysis procedure. This diagram depicts the different scenarios that range from 0% (base scenario) to 20% vehicle diversion. Lastly, the diagram indicates the last two stages of the analysis, which are based on the data collected by means of the link evaluation as well as the data collection modules in VISSIM that in turn are available in the results section.
RESULTS
The researchers created five scenarios diverting different percentages of vehicles from the Hawkins exit ramp to the McRae exit ramp to determine which diversion percentage is optimal in reducing the queue spillback and improving the safety on the IH 10 freeway corridor. Each scenario was run with 10 random number seeds. In total, 50 simulation runs were completed. Data were collected and graphs were generated in Microsoft Excel for each scenario.
Link Evaluation
Data Collection
Freeway 4 Lane
Analysis
Freeway Right Lane Analysis
Manage Strategy: Vehicle Diversion
Hawkins Exit-Ramp
0 % Base scenario
5 % 10 % 15 % 20 %
Upstream of Hawkins and McRae
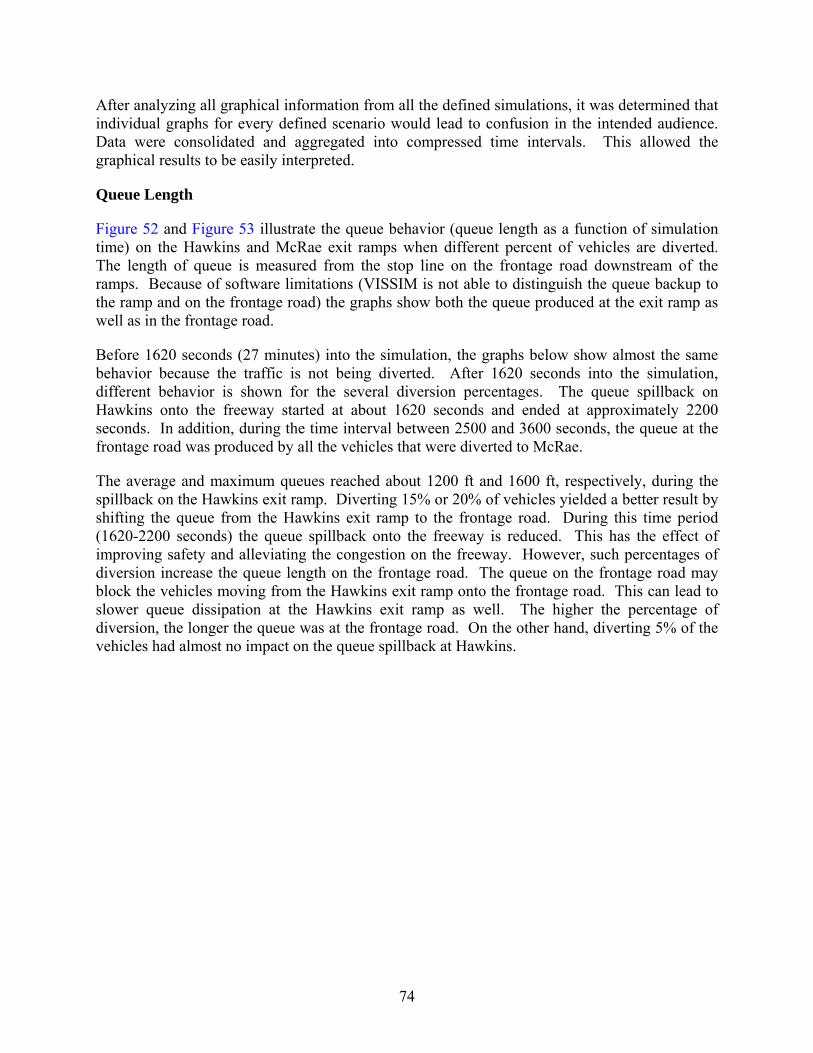
74
After analyzing all graphical information from all the defined simulations, it was determined that individual graphs for every defined scenario would lead to confusion in the intended audience. Data were consolidated and aggregated into compressed time intervals. This allowed the graphical results to be easily interpreted.
Queue Length
Figure 52 and Figure 53 illustrate the queue behavior (queue length as a function of simulation time) on the Hawkins and McRae exit ramps when different percent of vehicles are diverted. The length of queue is measured from the stop line on the frontage road downstream of the ramps. Because of software limitations (VISSIM is not able to distinguish the queue backup to the ramp and on the frontage road) the graphs show both the queue produced at the exit ramp as well as in the frontage road.
Before 1620 seconds (27 minutes) into the simulation, the graphs below show almost the same behavior because the traffic is not being diverted. After 1620 seconds into the simulation, different behavior is shown for the several diversion percentages. The queue spillback on Hawkins onto the freeway started at about 1620 seconds and ended at approximately 2200 seconds. In addition, during the time interval between 2500 and 3600 seconds, the queue at the frontage road was produced by all the vehicles that were diverted to McRae.
The average and maximum queues reached about 1200 ft and 1600 ft, respectively, during the spillback on the Hawkins exit ramp. Diverting 15% or 20% of vehicles yielded a better result by shifting the queue from the Hawkins exit ramp to the frontage road. During this time period (1620-2200 seconds) the queue spillback onto the freeway is reduced. This has the effect of improving safety and alleviating the congestion on the freeway. However, such percentages of diversion increase the queue length on the frontage road. The queue on the frontage road may block the vehicles moving from the Hawkins exit ramp onto the frontage road. This can lead to slower queue dissipation at the Hawkins exit ramp as well. The higher the percentage of diversion, the longer the queue was at the frontage road. On the other hand, diverting 5% of the vehicles had almost no impact on the queue spillback at Hawkins.
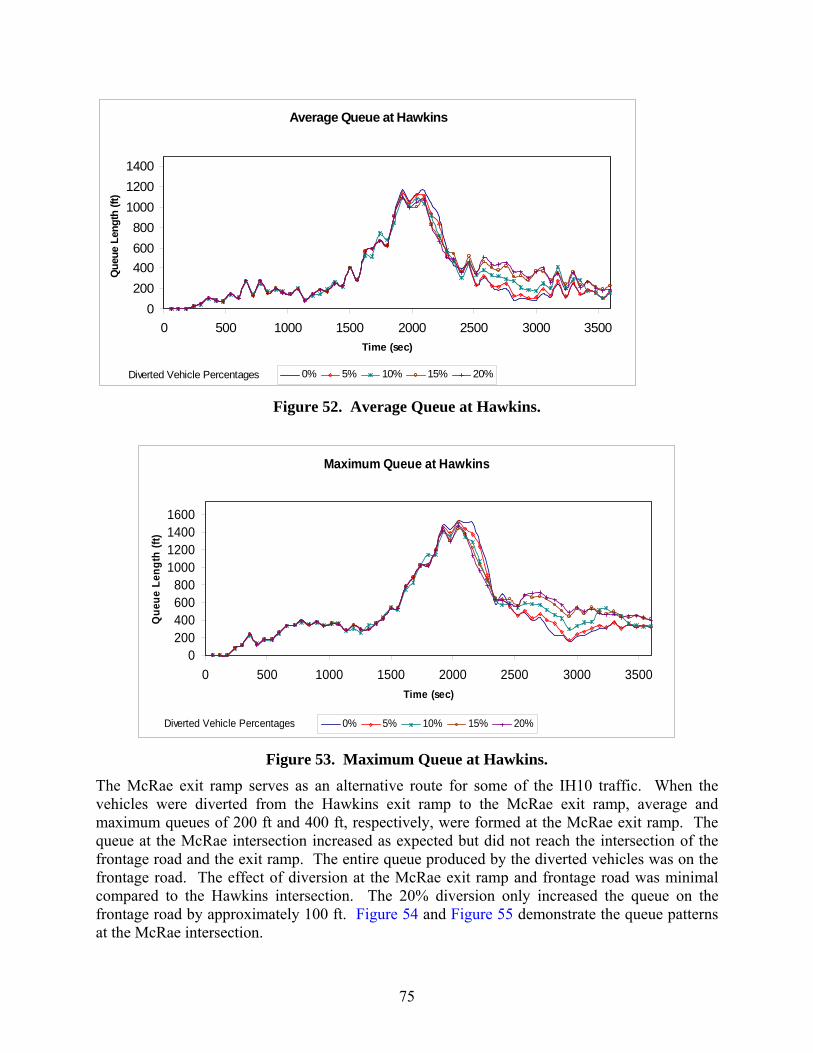
75
Average Queue at Hawkins
0200400600800
100012001400
0 500 1000 1500 2000 2500 3000 3500Time (sec)
Que
ue L
engt
h (ft
)
0% 5% 10% 15% 20%Diverted Vehicle Percentages
Figure 52. Average Queue at Hawkins.
Maximum Queue at Hawkins
0200400600800
1000120014001600
0 500 1000 1500 2000 2500 3000 3500Time (sec)
Que
ue L
engt
h (ft
)
0% 5% 10% 15% 20%Diverted Vehicle Percentages
Figure 53. Maximum Queue at Hawkins. The McRae exit ramp serves as an alternative route for some of the IH10 traffic. When the vehicles were diverted from the Hawkins exit ramp to the McRae exit ramp, average and maximum queues of 200 ft and 400 ft, respectively, were formed at the McRae exit ramp. The queue at the McRae intersection increased as expected but did not reach the intersection of the frontage road and the exit ramp. The entire queue produced by the diverted vehicles was on the frontage road. The effect of diversion at the McRae exit ramp and frontage road was minimal compared to the Hawkins intersection. The 20% diversion only increased the queue on the frontage road by approximately 100 ft. Figure 54 and Figure 55 demonstrate the queue patterns at the McRae intersection.
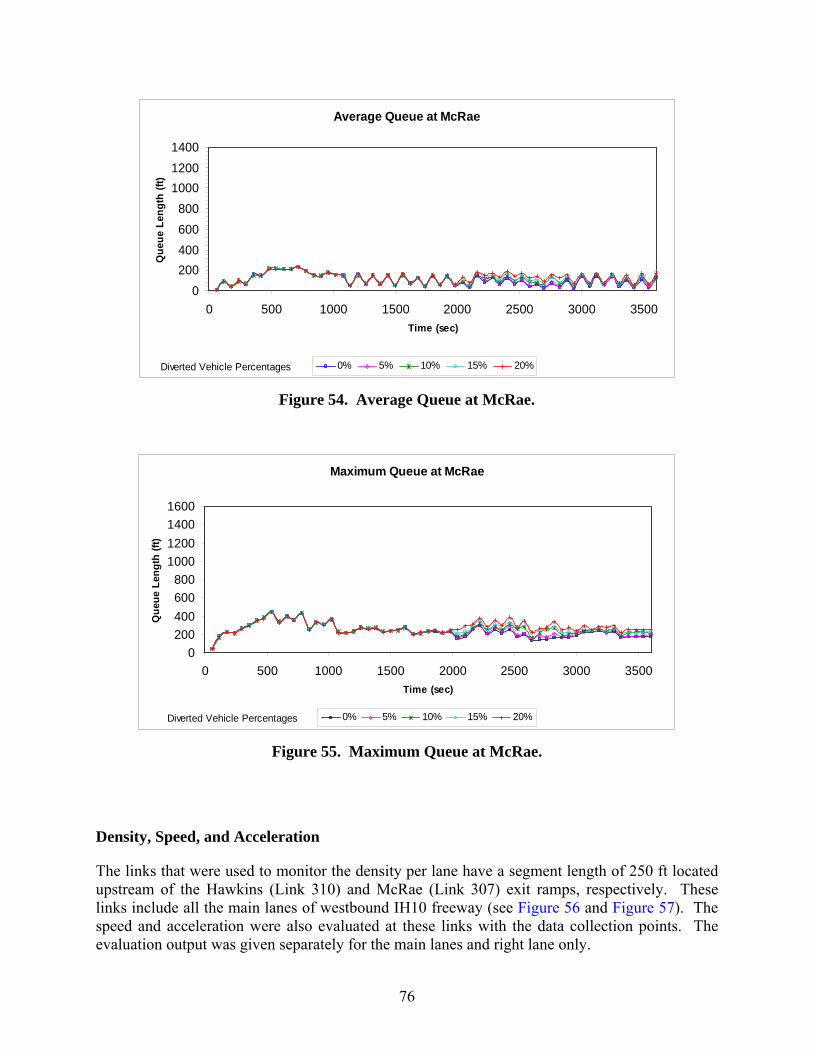
76
Average Queue at McRae
0200400600800
100012001400
0 500 1000 1500 2000 2500 3000 3500Time (sec)
Que
ue L
engt
h (ft
)
0% 5% 10% 15% 20%Diverted Vehicle Percentages
Figure 54. Average Queue at McRae.
Maximum Queue at McRae
0200400600800
1000120014001600
0 500 1000 1500 2000 2500 3000 3500Time (sec)
Que
ue L
engt
h (ft
)
0% 5% 10% 15% 20%Diverted Vehicle Percentages
Figure 55. Maximum Queue at McRae.
Density, Speed, and Acceleration
The links that were used to monitor the density per lane have a segment length of 250 ft located upstream of the Hawkins (Link 310) and McRae (Link 307) exit ramps, respectively. These links include all the main lanes of westbound IH10 freeway (see Figure 56 and Figure 57). The speed and acceleration were also evaluated at these links with the data collection points. The evaluation output was given separately for the main lanes and right lane only.
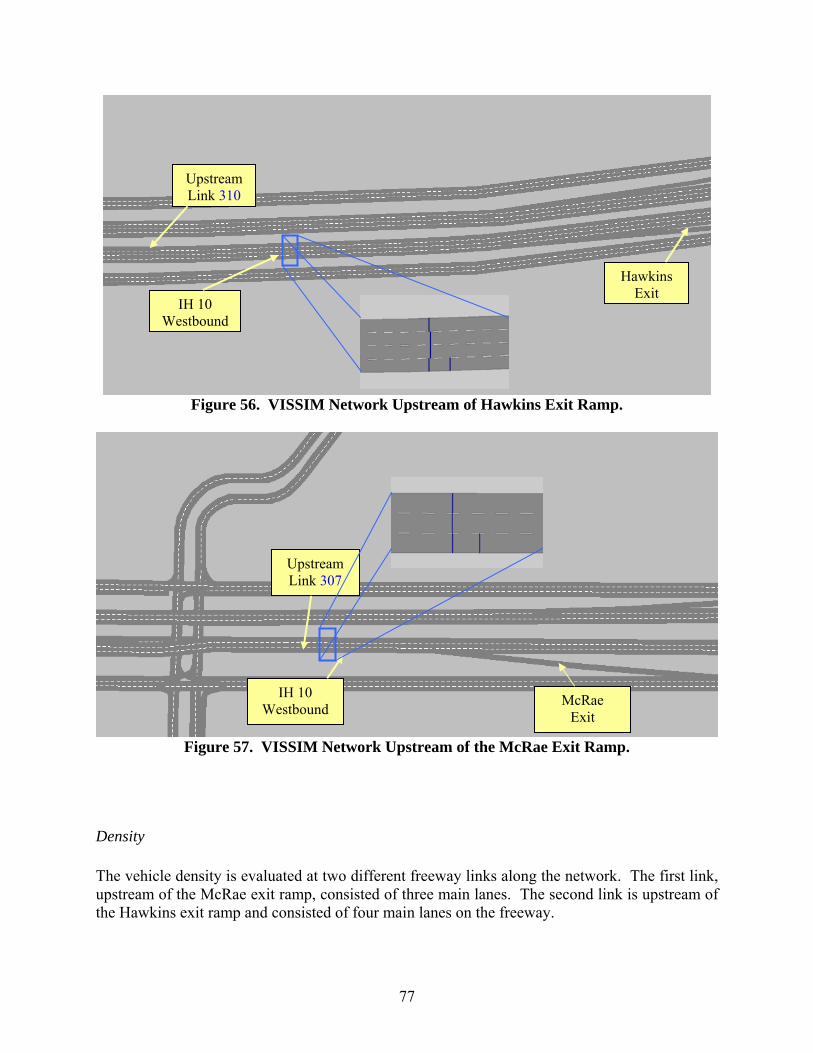
77
Figure 56. VISSIM Network Upstream of Hawkins Exit Ramp.
Figure 57. VISSIM Network Upstream of the McRae Exit Ramp.
Density
The vehicle density is evaluated at two different freeway links along the network. The first link, upstream of the McRae exit ramp, consisted of three main lanes. The second link is upstream of the Hawkins exit ramp and consisted of four main lanes on the freeway.
IH 10 Westbound
Hawkins Exit
Upstream Link 310
IH 10 Westbound
Upstream Link 307
McRae Exit
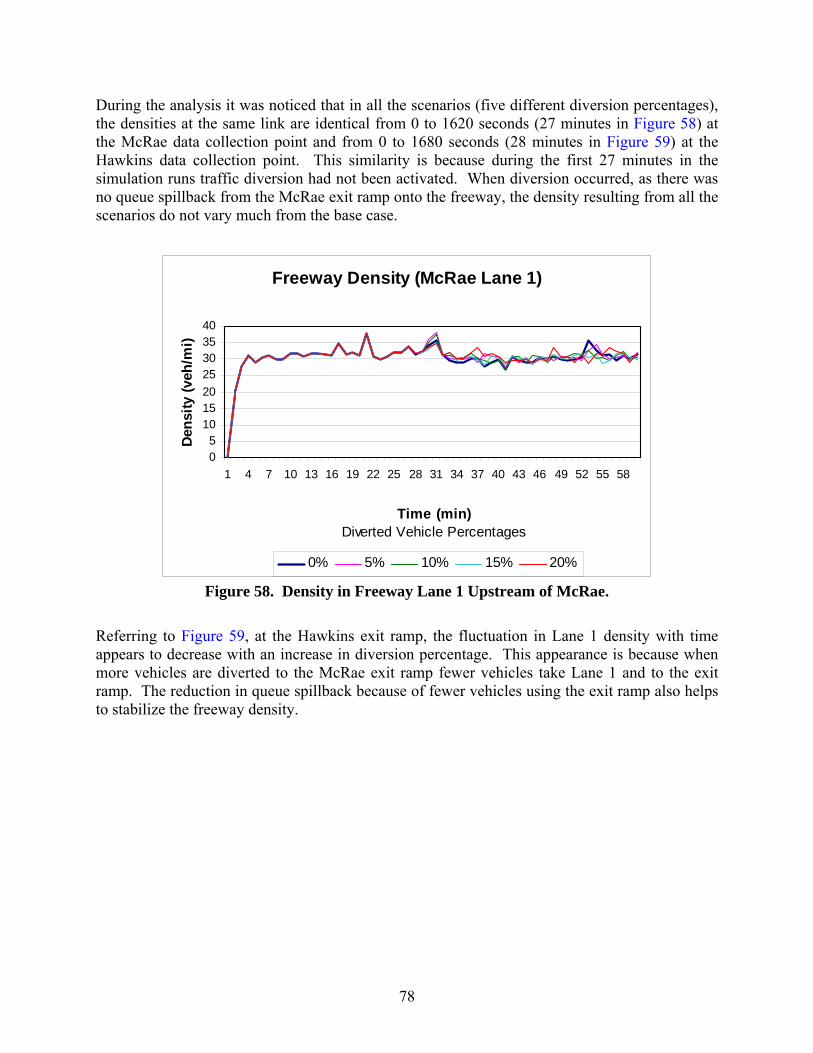
78
During the analysis it was noticed that in all the scenarios (five different diversion percentages), the densities at the same link are identical from 0 to 1620 seconds (27 minutes in Figure 58) at the McRae data collection point and from 0 to 1680 seconds (28 minutes in Figure 59) at the Hawkins data collection point. This similarity is because during the first 27 minutes in the simulation runs traffic diversion had not been activated. When diversion occurred, as there was no queue spillback from the McRae exit ramp onto the freeway, the density resulting from all the scenarios do not vary much from the base case.
Freeway Density (McRae Lane 1)
05
10152025303540
1 4 7 10 13 16 19 22 25 28 31 34 37 40 43 46 49 52 55 58
Time (min)Diverted Vehicle Percentages
Dens
ity (v
eh/m
i)
0% 5% 10% 15% 20%
Figure 58. Density in Freeway Lane 1 Upstream of McRae.
Referring to Figure 59, at the Hawkins exit ramp, the fluctuation in Lane 1 density with time appears to decrease with an increase in diversion percentage. This appearance is because when more vehicles are diverted to the McRae exit ramp fewer vehicles take Lane 1 and to the exit ramp. The reduction in queue spillback because of fewer vehicles using the exit ramp also helps to stabilize the freeway density.
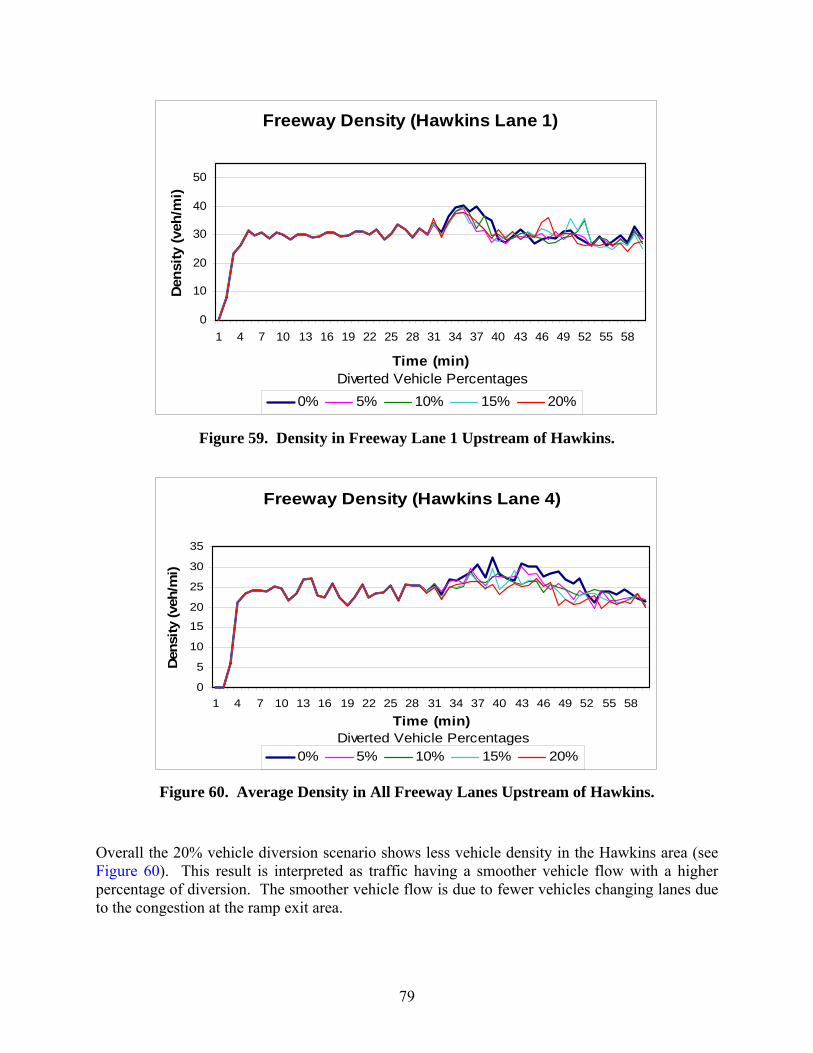
79
Freeway Density (Hawkins Lane 1)
0
10
20
30
40
50
1 4 7 10 13 16 19 22 25 28 31 34 37 40 43 46 49 52 55 58
Time (min) Diverted Vehicle Percentages
Dens
ity (v
eh/m
i)
0% 5% 10% 15% 20%
Figure 59. Density in Freeway Lane 1 Upstream of Hawkins.
Freeway Density (Hawkins Lane 4)
0
5
10
15
20
25
30
35
1 4 7 10 13 16 19 22 25 28 31 34 37 40 43 46 49 52 55 58Time (min)
Diverted Vehicle Percentages
Dens
ity (v
eh/m
i)
0% 5% 10% 15% 20%
Figure 60. Average Density in All Freeway Lanes Upstream of Hawkins.
Overall the 20% vehicle diversion scenario shows less vehicle density in the Hawkins area (see Figure 60). This result is interpreted as traffic having a smoother vehicle flow with a higher percentage of diversion. The smoother vehicle flow is due to fewer vehicles changing lanes due to the congestion at the ramp exit area.
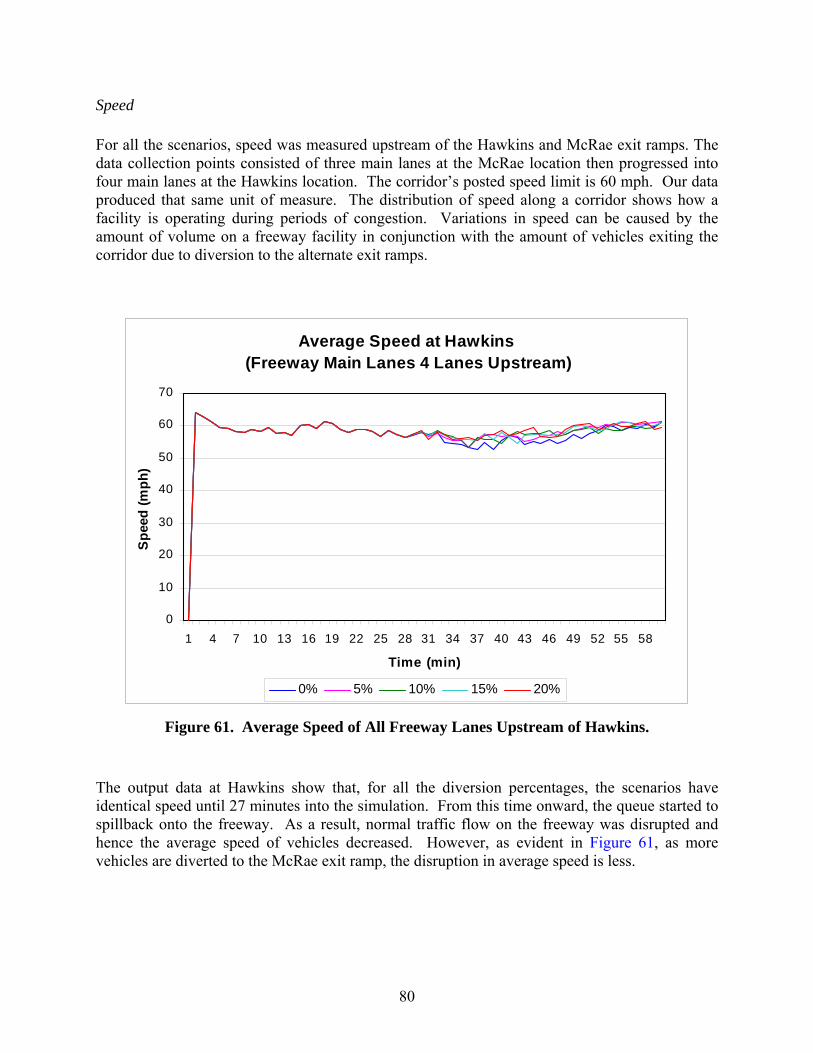
80
Speed
For all the scenarios, speed was measured upstream of the Hawkins and McRae exit ramps. The data collection points consisted of three main lanes at the McRae location then progressed into four main lanes at the Hawkins location. The corridor’s posted speed limit is 60 mph. Our data produced that same unit of measure. The distribution of speed along a corridor shows how a facility is operating during periods of congestion. Variations in speed can be caused by the amount of volume on a freeway facility in conjunction with the amount of vehicles exiting the corridor due to diversion to the alternate exit ramps.
Average Speed at Hawkins (Freeway Main Lanes 4 Lanes Upstream)
0
10
20
30
40
50
60
70
1 4 7 10 13 16 19 22 25 28 31 34 37 40 43 46 49 52 55 58
Time (min)
Spee
d (m
ph)
0% 5% 10% 15% 20%
Figure 61. Average Speed of All Freeway Lanes Upstream of Hawkins.
The output data at Hawkins show that, for all the diversion percentages, the scenarios have identical speed until 27 minutes into the simulation. From this time onward, the queue started to spillback onto the freeway. As a result, normal traffic flow on the freeway was disrupted and hence the average speed of vehicles decreased. However, as evident in Figure 61, as more vehicles are diverted to the McRae exit ramp, the disruption in average speed is less.
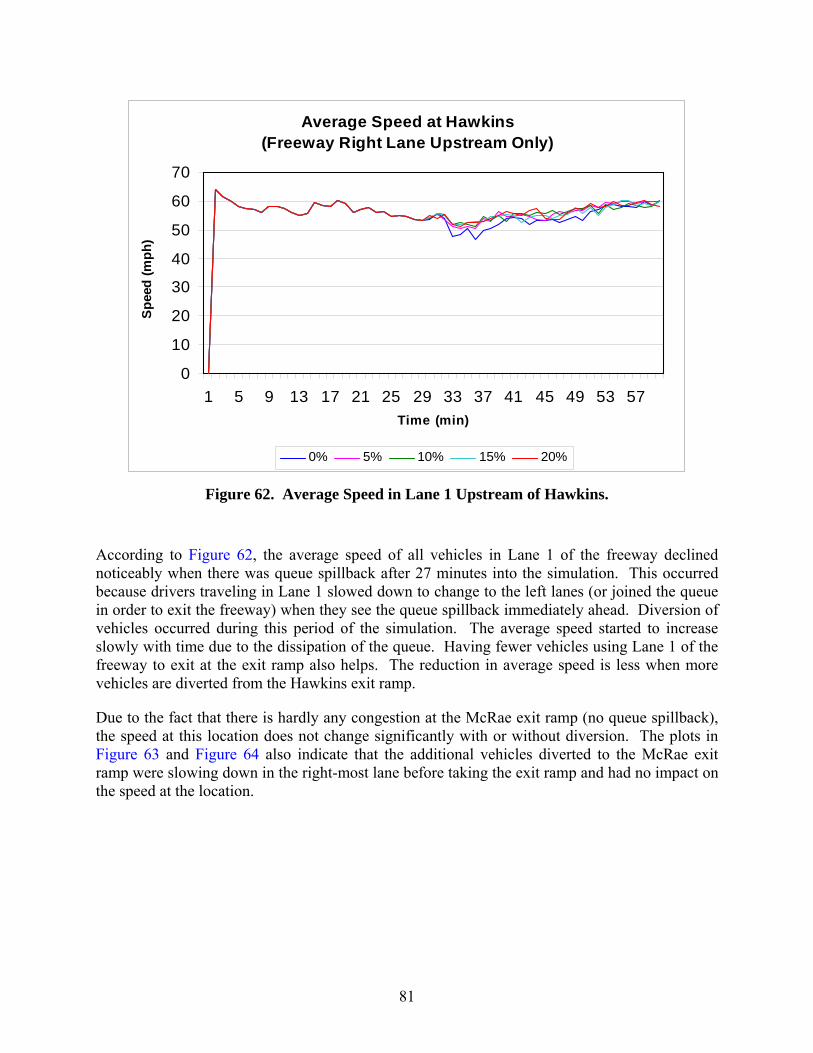
81
Average Speed at Hawkins(Freeway Right Lane Upstream Only)
0
10
20
30
40
50
60
70
1 5 9 13 17 21 25 29 33 37 41 45 49 53 57Time (min)
Spee
d (m
ph)
0% 5% 10% 15% 20%
Figure 62. Average Speed in Lane 1 Upstream of Hawkins.
According to Figure 62, the average speed of all vehicles in Lane 1 of the freeway declined noticeably when there was queue spillback after 27 minutes into the simulation. This occurred because drivers traveling in Lane 1 slowed down to change to the left lanes (or joined the queue in order to exit the freeway) when they see the queue spillback immediately ahead. Diversion of vehicles occurred during this period of the simulation. The average speed started to increase slowly with time due to the dissipation of the queue. Having fewer vehicles using Lane 1 of the freeway to exit at the exit ramp also helps. The reduction in average speed is less when more vehicles are diverted from the Hawkins exit ramp.
Due to the fact that there is hardly any congestion at the McRae exit ramp (no queue spillback), the speed at this location does not change significantly with or without diversion. The plots in Figure 63 and Figure 64 also indicate that the additional vehicles diverted to the McRae exit ramp were slowing down in the right-most lane before taking the exit ramp and had no impact on the speed at the location.
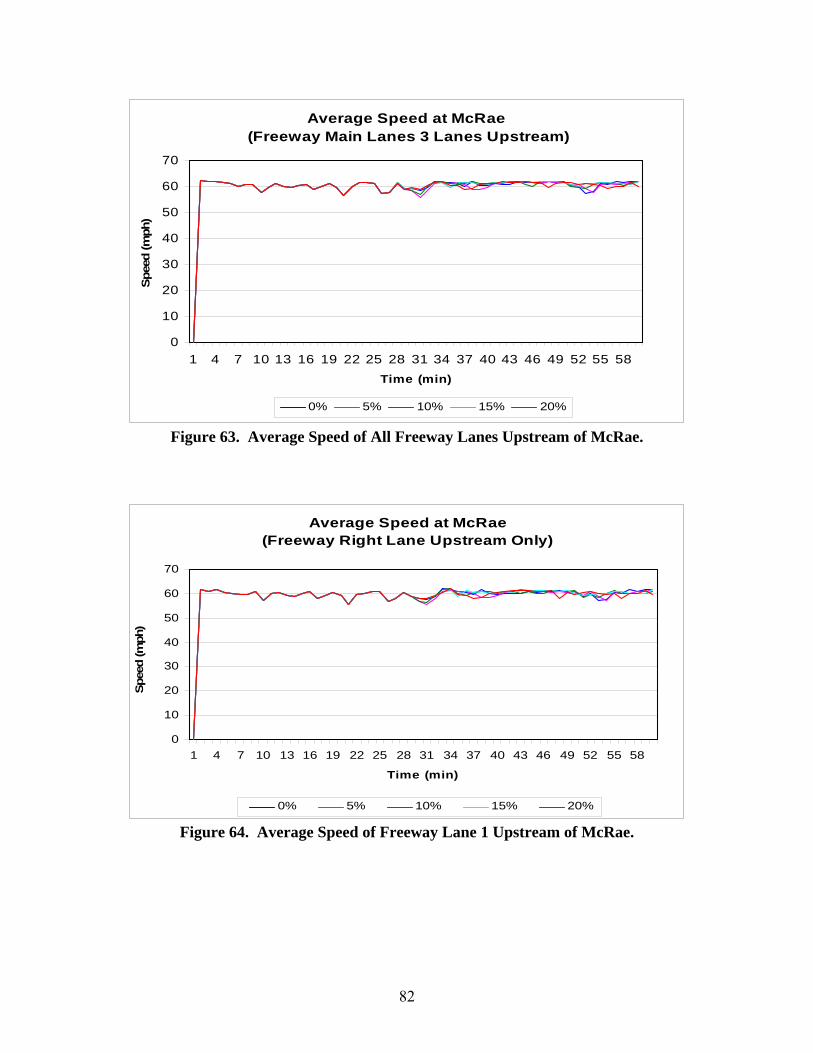
82
Average Speed at McRae (Freeway Main Lanes 3 Lanes Upstream)
0
10
20
30
40
50
60
70
1 4 7 10 13 16 19 22 25 28 31 34 37 40 43 46 49 52 55 58Time (min)
Spee
d (m
ph)
0% 5% 10% 15% 20%
Figure 63. Average Speed of All Freeway Lanes Upstream of McRae.
Average Speed at McRae (Freeway Right Lane Upstream Only)
0
10
20
30
40
50
60
70
1 4 7 10 13 16 19 22 25 28 31 34 37 40 43 46 49 52 55 58
Time (min)
Spee
d (m
ph)
0% 5% 10% 15% 20%
Figure 64. Average Speed of Freeway Lane 1 Upstream of McRae.
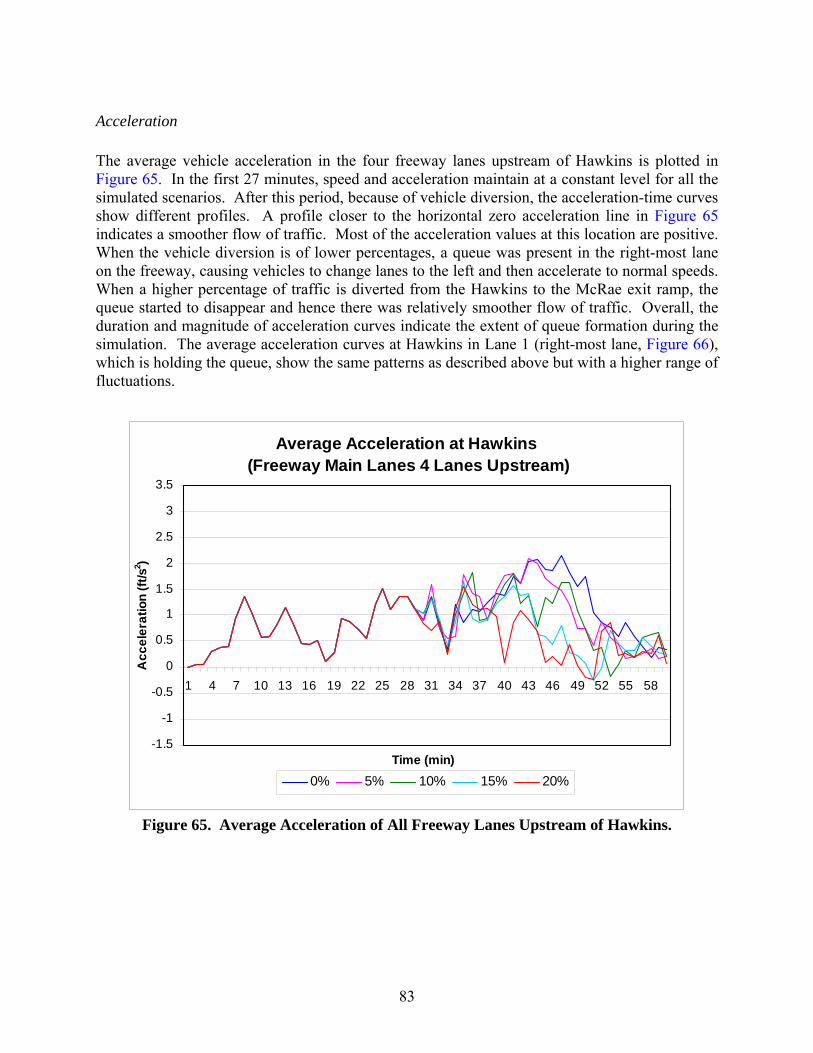
83
Acceleration
The average vehicle acceleration in the four freeway lanes upstream of Hawkins is plotted in Figure 65. In the first 27 minutes, speed and acceleration maintain at a constant level for all the simulated scenarios. After this period, because of vehicle diversion, the acceleration-time curves show different profiles. A profile closer to the horizontal zero acceleration line in Figure 65 indicates a smoother flow of traffic. Most of the acceleration values at this location are positive. When the vehicle diversion is of lower percentages, a queue was present in the right-most lane on the freeway, causing vehicles to change lanes to the left and then accelerate to normal speeds. When a higher percentage of traffic is diverted from the Hawkins to the McRae exit ramp, the queue started to disappear and hence there was relatively smoother flow of traffic. Overall, the duration and magnitude of acceleration curves indicate the extent of queue formation during the simulation. The average acceleration curves at Hawkins in Lane 1 (right-most lane, Figure 66), which is holding the queue, show the same patterns as described above but with a higher range of fluctuations.
Average Acceleration at Hawkins (Freeway Main Lanes 4 Lanes Upstream)
-1.5
-1
-0.5
0
0.5
1
1.5
2
2.5
3
3.5
1 4 7 10 13 16 19 22 25 28 31 34 37 40 43 46 49 52 55 58
Time (min)
Acc
eler
atio
n (ft
/s2 )
0% 5% 10% 15% 20%
Figure 65. Average Acceleration of All Freeway Lanes Upstream of Hawkins.
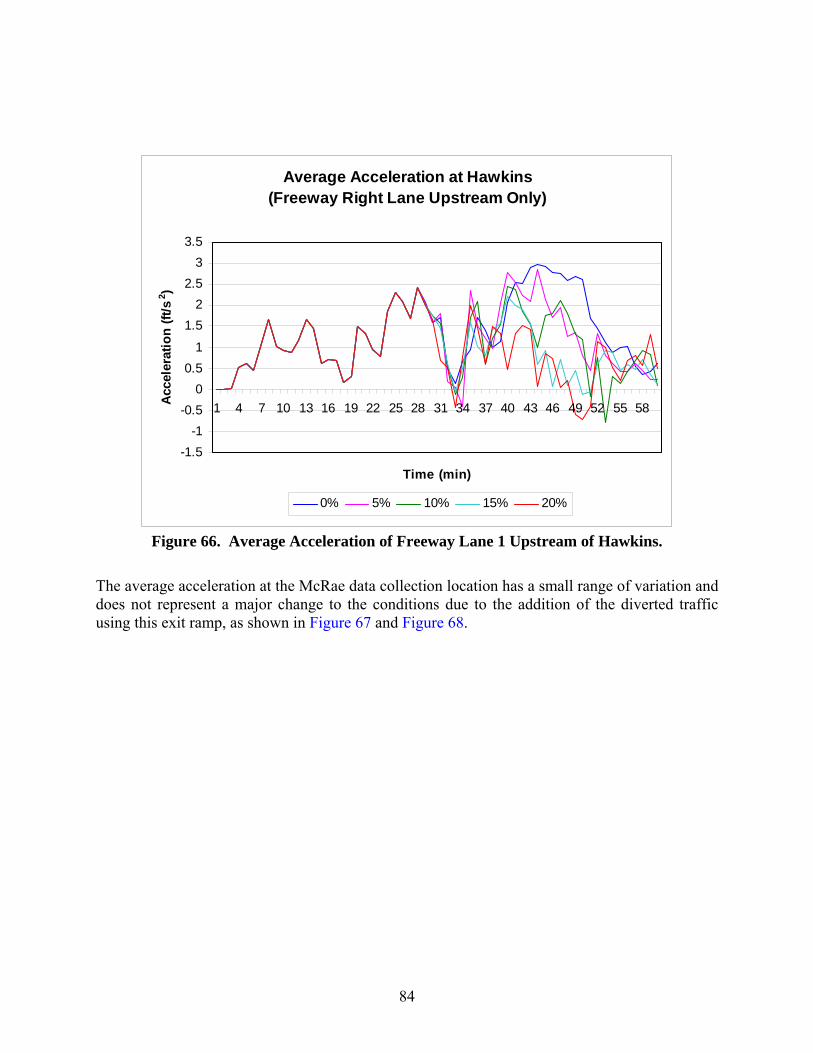
84
Average Acceleration at Hawkins (Freeway Right Lane Upstream Only)
-1.5-1
-0.50
0.51
1.52
2.53
3.5
1 4 7 10 13 16 19 22 25 28 31 34 37 40 43 46 49 52 55 58
Time (min)
Acc
eler
atio
n (ft
/s2 )
0% 5% 10% 15% 20%
Figure 66. Average Acceleration of Freeway Lane 1 Upstream of Hawkins.
The average acceleration at the McRae data collection location has a small range of variation and does not represent a major change to the conditions due to the addition of the diverted traffic using this exit ramp, as shown in Figure 67 and Figure 68.
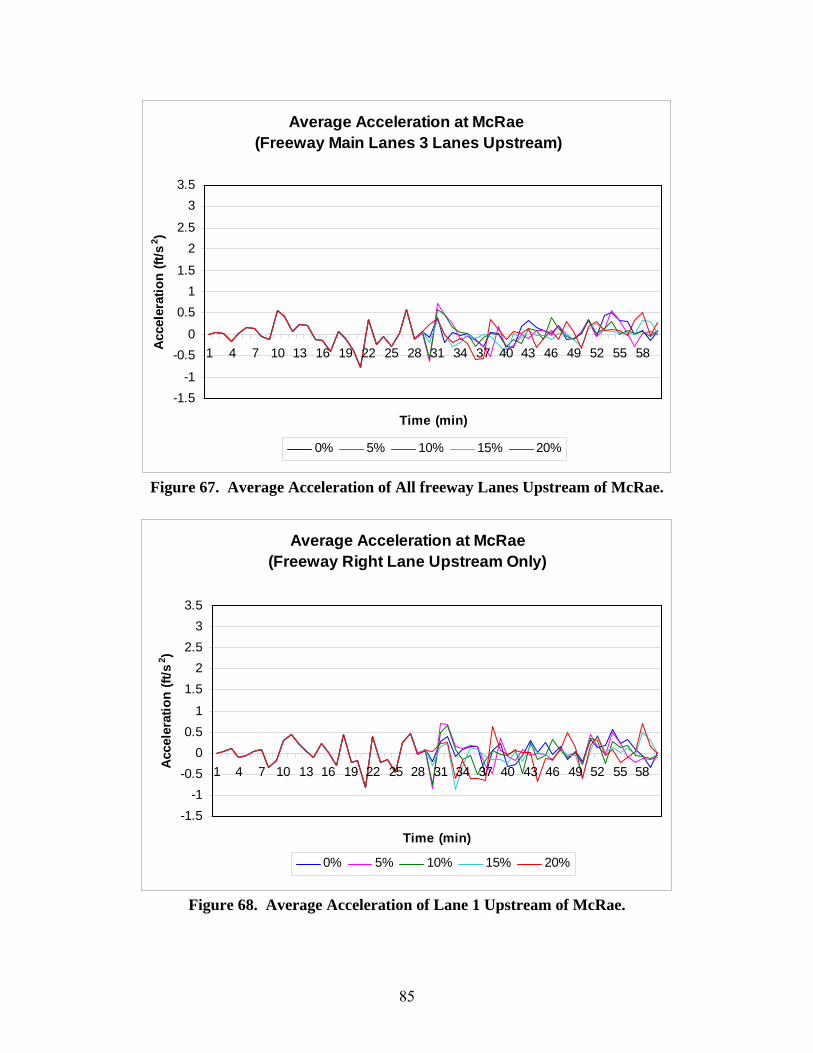
85
Average Acceleration at McRae (Freeway Main Lanes 3 Lanes Upstream)
-1.5-1
-0.50
0.51
1.5
22.5
33.5
1 4 7 10 13 16 19 22 25 28 31 34 37 40 43 46 49 52 55 58
Time (min)
Acce
lera
tion
(ft/s
2 )
0% 5% 10% 15% 20%
Figure 67. Average Acceleration of All freeway Lanes Upstream of McRae.
Average Acceleration at McRae (Freeway Right Lane Upstream Only)
-1.5-1
-0.50
0.51
1.52
2.53
3.5
1 4 7 10 13 16 19 22 25 28 31 34 37 40 43 46 49 52 55 58
Time (min)
Acc
eler
atio
n (ft
/s2 )
0% 5% 10% 15% 20%
Figure 68. Average Acceleration of Lane 1 Upstream of McRae.

86
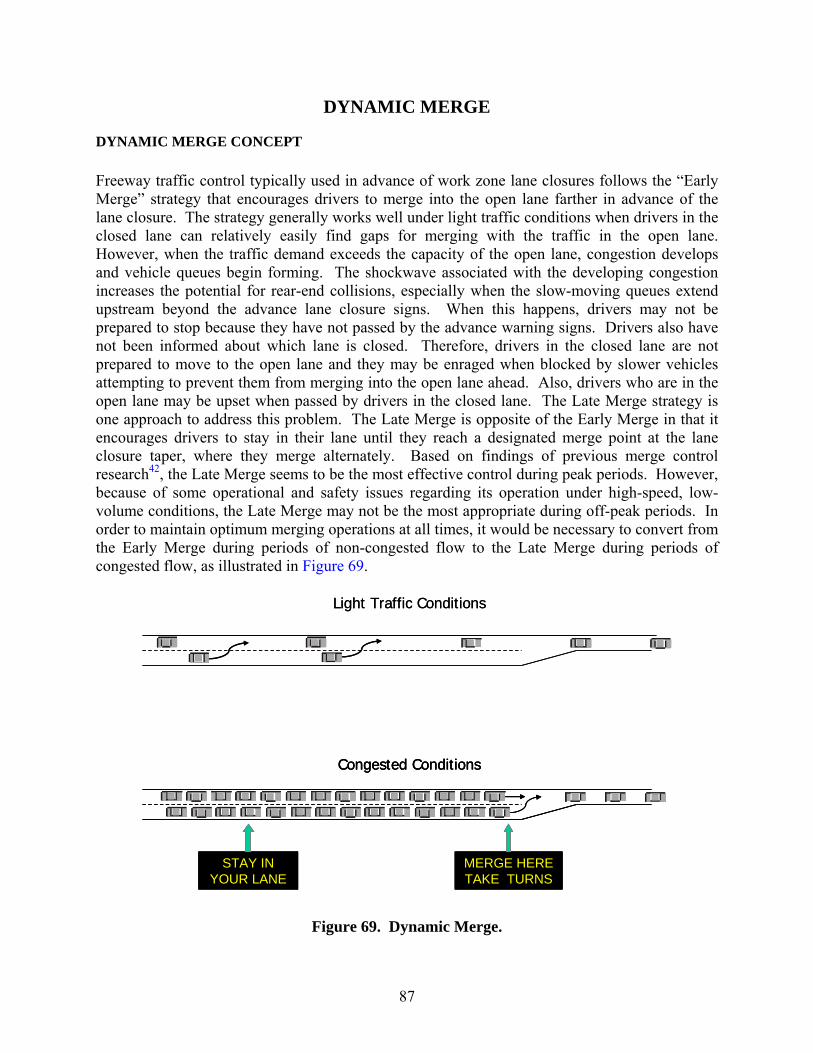
87
DYNAMIC MERGE
DYNAMIC MERGE CONCEPT
Freeway traffic control typically used in advance of work zone lane closures follows the “Early Merge” strategy that encourages drivers to merge into the open lane farther in advance of the lane closure. The strategy generally works well under light traffic conditions when drivers in the closed lane can relatively easily find gaps for merging with the traffic in the open lane. However, when the traffic demand exceeds the capacity of the open lane, congestion develops and vehicle queues begin forming. The shockwave associated with the developing congestion increases the potential for rear-end collisions, especially when the slow-moving queues extend upstream beyond the advance lane closure signs. When this happens, drivers may not be prepared to stop because they have not passed by the advance warning signs. Drivers also have not been informed about which lane is closed. Therefore, drivers in the closed lane are not prepared to move to the open lane and they may be enraged when blocked by slower vehicles attempting to prevent them from merging into the open lane ahead. Also, drivers who are in the open lane may be upset when passed by drivers in the closed lane. The Late Merge strategy is one approach to address this problem. The Late Merge is opposite of the Early Merge in that it encourages drivers to stay in their lane until they reach a designated merge point at the lane closure taper, where they merge alternately. Based on findings of previous merge control research42, the Late Merge seems to be the most effective control during peak periods. However, because of some operational and safety issues regarding its operation under high-speed, low-volume conditions, the Late Merge may not be the most appropriate during off-peak periods. In order to maintain optimum merging operations at all times, it would be necessary to convert from the Early Merge during periods of non-congested flow to the Late Merge during periods of congested flow, as illustrated in Figure 69.
Light Traffic Conditions
STAY INYOUR LANE
Congested Conditions
MERGE HERETAKE TURNS
Light Traffic Conditions
STAY INYOUR LANE
Congested Conditions
MERGE HERETAKE TURNS
STAY INYOUR LANE
Congested Conditions
MERGE HERETAKE TURNS
Figure 69. Dynamic Merge.
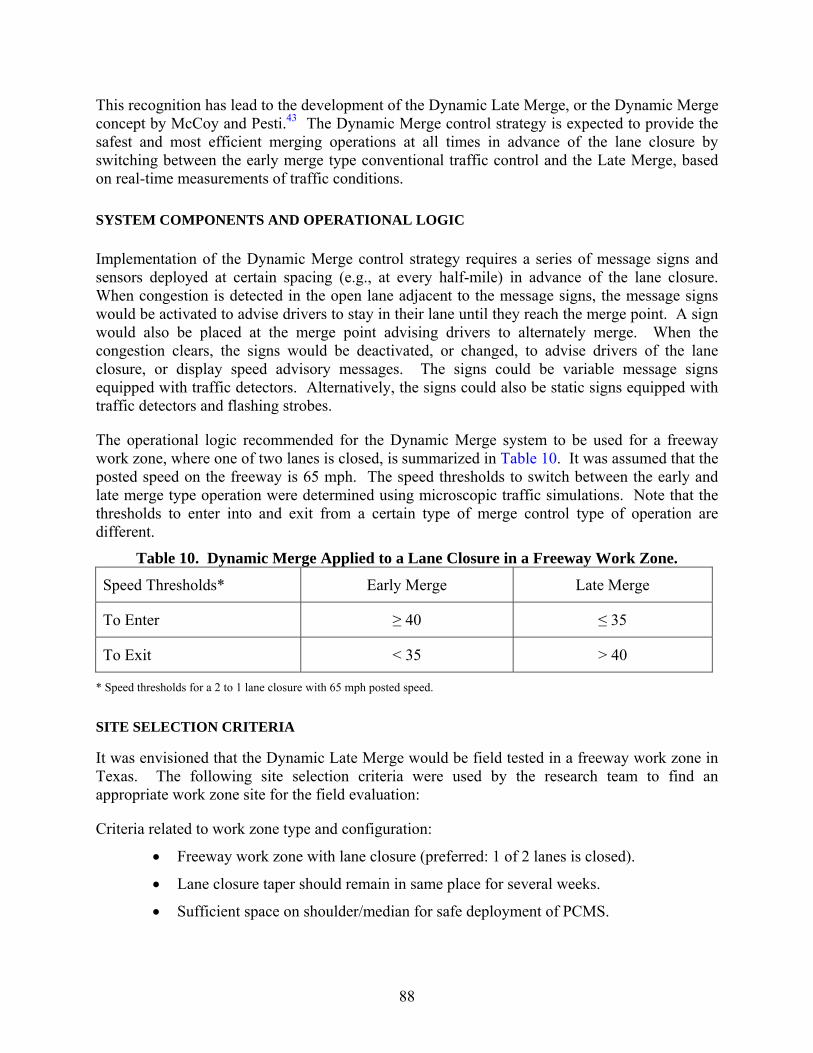
88
This recognition has lead to the development of the Dynamic Late Merge, or the Dynamic Merge concept by McCoy and Pesti.43 The Dynamic Merge control strategy is expected to provide the safest and most efficient merging operations at all times in advance of the lane closure by switching between the early merge type conventional traffic control and the Late Merge, based on real-time measurements of traffic conditions.
SYSTEM COMPONENTS AND OPERATIONAL LOGIC
Implementation of the Dynamic Merge control strategy requires a series of message signs and sensors deployed at certain spacing (e.g., at every half-mile) in advance of the lane closure. When congestion is detected in the open lane adjacent to the message signs, the message signs would be activated to advise drivers to stay in their lane until they reach the merge point. A sign would also be placed at the merge point advising drivers to alternately merge. When the congestion clears, the signs would be deactivated, or changed, to advise drivers of the lane closure, or display speed advisory messages. The signs could be variable message signs equipped with traffic detectors. Alternatively, the signs could also be static signs equipped with traffic detectors and flashing strobes.
The operational logic recommended for the Dynamic Merge system to be used for a freeway work zone, where one of two lanes is closed, is summarized in Table 10. It was assumed that the posted speed on the freeway is 65 mph. The speed thresholds to switch between the early and late merge type operation were determined using microscopic traffic simulations. Note that the thresholds to enter into and exit from a certain type of merge control type of operation are different.
Table 10. Dynamic Merge Applied to a Lane Closure in a Freeway Work Zone.
Speed Thresholds* Early Merge Late Merge
To Enter ≥ 40 ≤ 35
To Exit < 35 > 40
* Speed thresholds for a 2 to 1 lane closure with 65 mph posted speed.
SITE SELECTION CRITERIA
It was envisioned that the Dynamic Late Merge would be field tested in a freeway work zone in Texas. The following site selection criteria were used by the research team to find an appropriate work zone site for the field evaluation:
Criteria related to work zone type and configuration:
• Freeway work zone with lane closure (preferred: 1 of 2 lanes is closed).
• Lane closure taper should remain in same place for several weeks.
• Sufficient space on shoulder/median for safe deployment of PCMS.
89
Traffic condition criteria:
• significant variation in traffic volumes and
• relatively long queues during congested conditions.
The researchers, with the help of the project director and project advisors, conducted an extensive search to find an appropriate study site satisfying the above selection criteria. The TxDOT web site providing on-line information on construction zones has been constantly monitored, and potential sites were visited. In addition, Directors of Transportation Operations in all TxDOT districts were contacted by email to request information on work zone sites that satisfied the specified site selection criteria and were potentially available in their district.
Since no appropriate site for field evaluation was available within the timeframe of the research project, it was decided that a simulation-based evaluation of the Dynamic Merge concept would be conducted. The objective of the simulation study was to determine the type of work zone configurations where the Dynamic Merge is expected to provide some benefits.
SIMULATION STUDY
Microscopic traffic simulations were conducted using the VISSIM simulation package to determine the applicability of the Dynamic Merge control for various work zone lane closure configurations. The lane closure configurations shown in Figure 70 were considered. A simulation test-bed was developed for each configuration. Key model parameters were calibrated based on previous work zone studies to produce reasonable vehicle throughput and delay estimates. The Dynamic Merge concept was implemented in the simulation model by using the vehicle actuated programming (VAP) feature of VISSIM. To ensure that vehicles stay in their lane during Late Merge operation, certain network constraints also had to be implemented. A series of runs using each simulation test-bed with a range of traffic demands and various random seed numbers were performed to determine whether the Dynamic Merge can be effective for each specific lane closure configuration. The effectiveness of the Dynamic Merge was determined by comparing its performance to the typical “Early Merge” type traffic control in terms the following MOEs obtained from the model output:
• vehicle throughput,
• travel time and
• delay.
FINDINGS
The Dynamic Merge concept was originally developed for freeway work zones where one of two lanes is closed. It has never been proved or disapproved that it should also work well for other lane closure configurations. In fact, findings of the simulations study in this research indicate that the Dynamic Merge would probably not work as intended in several of the lane closure configurations shown in Figure 70. The Dynamic Merge is expected to work well and provide benefit only in three cases from the 10 lane closure scenarios considered.
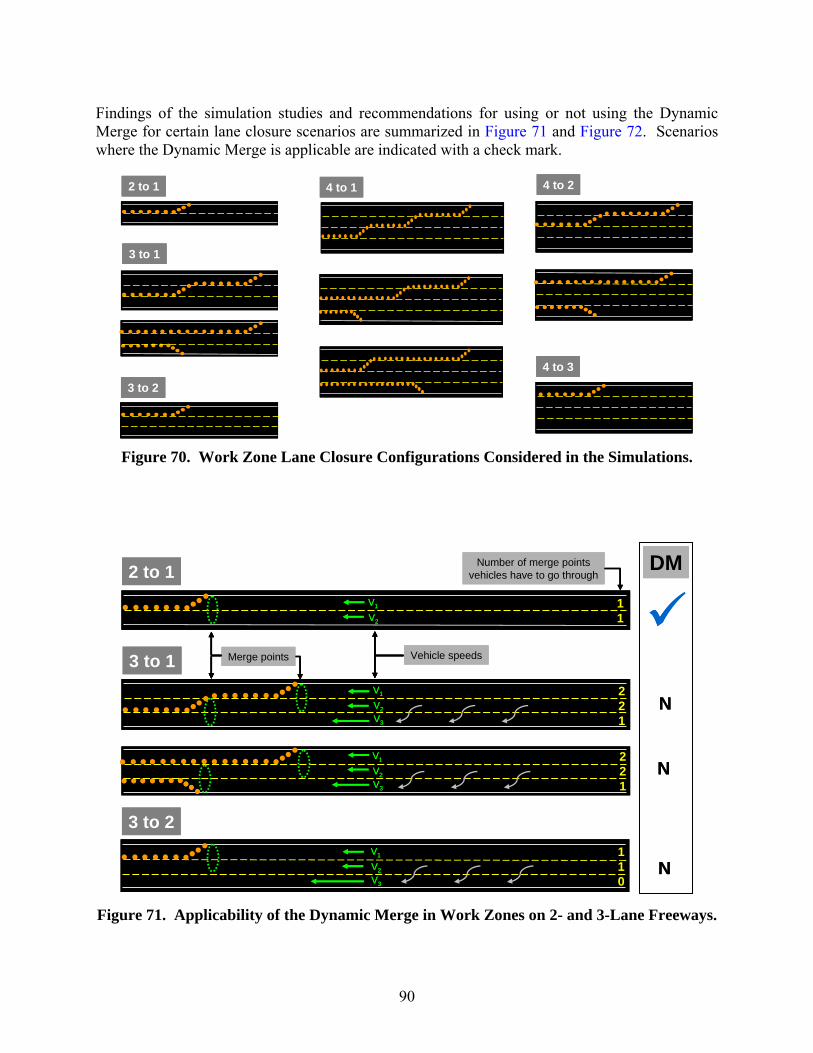
90
Findings of the simulation studies and recommendations for using or not using the Dynamic Merge for certain lane closure scenarios are summarized in Figure 71 and Figure 72. Scenarios where the Dynamic Merge is applicable are indicated with a check mark.
2 to 1
3 to 2
3 to 1
4 to 3
4 to 24 to 12 to 12 to 1
3 to 23 to 2
3 to 13 to 1
4 to 34 to 3
4 to 24 to 24 to 14 to 1
Figure 70. Work Zone Lane Closure Configurations Considered in the Simulations.
2 to 111
3 to 1221
221
3 to 2110
N
N
N
Number of merge pointsvehicles have to go through
DMV1
V2
V1
V2
V3
V1
V2
V3
V1
V2
V3
Vehicle speedsMerge points
2 to 111
3 to 1221
221
3 to 2110
N
N
N
Number of merge pointsvehicles have to go through
Number of merge pointsvehicles have to go through
DMDMV1
V2
V1
V2
V1
V2
V3
V1
V2
V3
V1
V2
V3
V1
V2
V3
V1
V2
V3
V1
V2
V3
Vehicle speedsVehicle speedsMerge pointsMerge points
Figure 71. Applicability of the Dynamic Merge in Work Zones on 2- and 3-Lane Freeways.
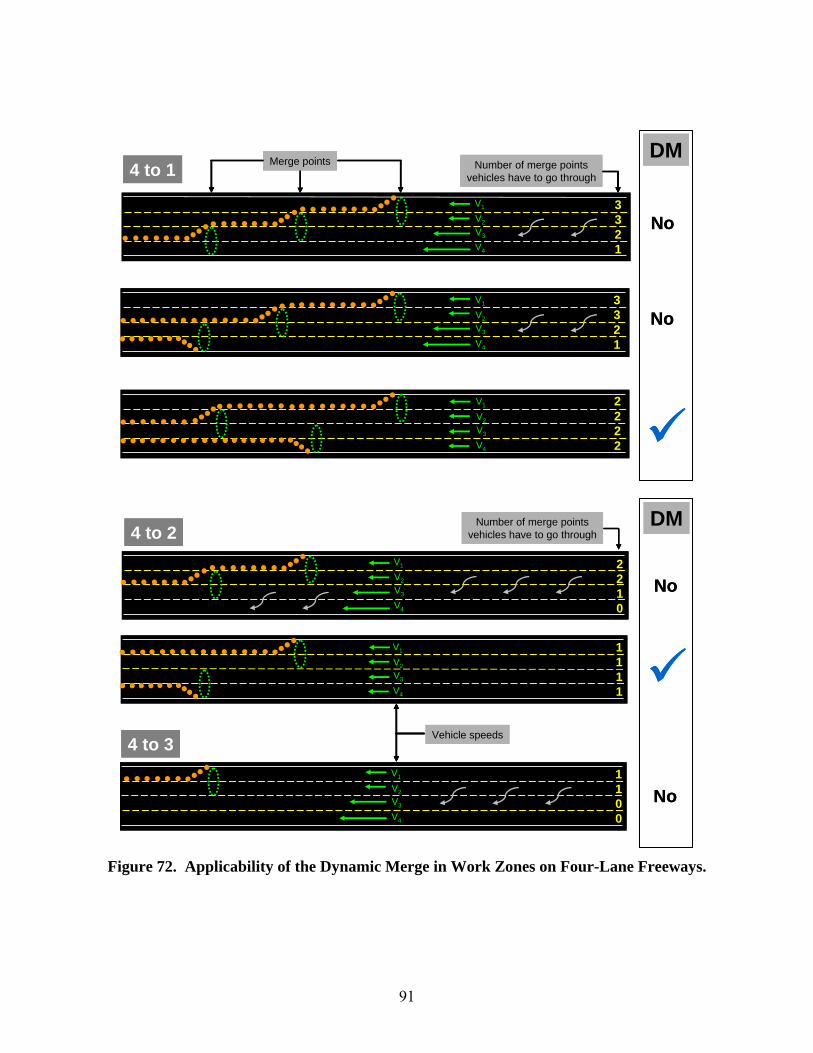
91
4 to 1
3321
3321
2222
No
No
Number of merge pointsvehicles have to go through
DMMerge points
V1
V2
V3
V4
V1
V2
V3
V4
V1
V2
V3
V4
4 to 1
3321
3321
2222
No
No
Number of merge pointsvehicles have to go through
Number of merge pointsvehicles have to go through
DMDMMerge pointsMerge points
V1
V2
V3
V4
V1
V2
V3
V4
V1
V2
V3
V4
4 to 31100
4 to 22210
1111
No
No
Number of merge pointsvehicles have to go through
DM
V1
V2
V3
V4
V1
V2
V3
V4
V1
V2
V3
V4
Vehicle speeds4 to 31100
4 to 22210
1111
No
No
Number of merge pointsvehicles have to go through
DMDM
V1
V2
V3
V4
V1
V2
V3
V4
V1
V2
V3
V4
Vehicle speeds
Figure 72. Applicability of the Dynamic Merge in Work Zones on Four-Lane Freeways.

92
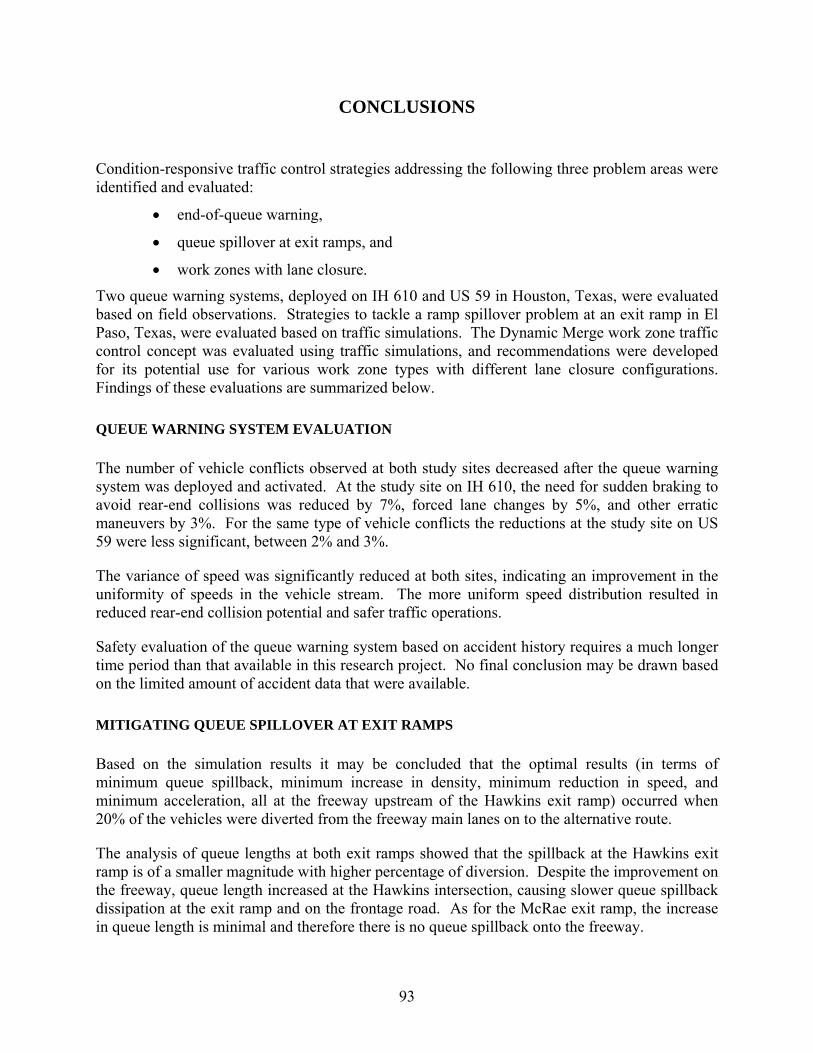
93
CONCLUSIONS
Condition-responsive traffic control strategies addressing the following three problem areas were identified and evaluated:
• end-of-queue warning,
• queue spillover at exit ramps, and
• work zones with lane closure.
Two queue warning systems, deployed on IH 610 and US 59 in Houston, Texas, were evaluated based on field observations. Strategies to tackle a ramp spillover problem at an exit ramp in El Paso, Texas, were evaluated based on traffic simulations. The Dynamic Merge work zone traffic control concept was evaluated using traffic simulations, and recommendations were developed for its potential use for various work zone types with different lane closure configurations. Findings of these evaluations are summarized below.
QUEUE WARNING SYSTEM EVALUATION
The number of vehicle conflicts observed at both study sites decreased after the queue warning system was deployed and activated. At the study site on IH 610, the need for sudden braking to avoid rear-end collisions was reduced by 7%, forced lane changes by 5%, and other erratic maneuvers by 3%. For the same type of vehicle conflicts the reductions at the study site on US 59 were less significant, between 2% and 3%.
The variance of speed was significantly reduced at both sites, indicating an improvement in the uniformity of speeds in the vehicle stream. The more uniform speed distribution resulted in reduced rear-end collision potential and safer traffic operations.
Safety evaluation of the queue warning system based on accident history requires a much longer time period than that available in this research project. No final conclusion may be drawn based on the limited amount of accident data that were available.
MITIGATING QUEUE SPILLOVER AT EXIT RAMPS
Based on the simulation results it may be concluded that the optimal results (in terms of minimum queue spillback, minimum increase in density, minimum reduction in speed, and minimum acceleration, all at the freeway upstream of the Hawkins exit ramp) occurred when 20% of the vehicles were diverted from the freeway main lanes on to the alternative route.
The analysis of queue lengths at both exit ramps showed that the spillback at the Hawkins exit ramp is of a smaller magnitude with higher percentage of diversion. Despite the improvement on the freeway, queue length increased at the Hawkins intersection, causing slower queue spillback dissipation at the exit ramp and on the frontage road. As for the McRae exit ramp, the increase in queue length is minimal and therefore there is no queue spillback onto the freeway.
94
The density upstream of the Hawkins exit ramp increased with queue growth from the exit ramp onto the right-most lane of the freeway. The density decreased when traffic was diverted to the alternative route (McRae exit ramp). The reduction in density is directly proportional to the diversion. As expected, the change in density is more significant in the right-most lane compared to other freeway lanes. The density upstream of the McRae exit ramp did not have significant variation with and without the diversions.
Speed and acceleration were the other two performance measures analyzed. Upstream of the Hawkins exit ramp, speed started to drop when the queue formed in the right-most lane of the freeway. The reduction in speed is the least significant when 20% diversion was simulated. Upstream of the McRae exit ramp, the different diversion percentages had almost no impact on speed for the entire simulation. As for acceleration, the average acceleration upstream of the Hawkins exit ramp decreased with increasing diversion. Our results also showed that upstream of the McRae off ramp there is no noticeable change in the acceleration with and without the diversions.
DYNAMIC MERGE EVALUATION
It was envisioned that the Dynamic Merge would be field tested in a freeway work zone in Texas. However, an appropriate work zone site for field evaluation was not available within the timeframe of the research project. Therefore, the Dynamic Merge concept was evaluated based on traffic simulations. The objective of the simulation study was to determine the type of work zone configurations where the Dynamic Merge is expected to work well and provide benefits relative to the conventional work zone traffic control.
It was found that the Dynamic Merge would probably not work as intended in several of the lane closure configurations considered in this study. It is expected to work well only in three cases from the ten lane closure scenarios considered. Findings of the simulation studies and recommendations for using or not using the Dynamic Merge for certain lane closure scenarios were provided in Figure 71 and Figure 72.
A Field Guide was developed to aid construction personnel and area engineers in using appropriate queue warning techniques and the dynamic merge control for congested freeways. It is included in Appendix B.
95
REFERENCES 1 National Transportation Safety Board. 2001. Vehicle- and Infrastructure-Based Technology
for the Prevention of Rear-End Collisions. Special Investigation Report NTSB/SIR-01/01. Washington, D.C. [Online]. Available: http://www.ntsb.gov/Publictn/2001/SIR0101.htm
2 Battelle Transportation Systems. Precursor Systems Analyses of Automated Highway
Systems, AHS Roadway Analysis. Report No. FHWA-RD-95-043, October 1994. 3 Ullman, G.L., M.D. Fontaine, S.D. Schrock, and P.B. Wiles. A Review of Traffic
Management and Enforcement Problems and Improvement Options at High-Volume, High-Speed Work Zones in Texas, Research Report 0-2137-1. Texas Transportation Institute, College Station, TX. February 2001.
4 Wiles, P.B., S.A. Cooner, C.H. Walters, and E.J. Pultorak. Advance Warning of Stopped
Traffic on Freeways: Current Practices and Field Studies of Queue Propagation Speeds, Research Report 0-4413-1. Texas Transportation Institute, College Station, TX. June 2003.
5 National Transportation Safety Board. Safety Recommendation H-01-10 and H-01-11, May
25, 2001. [Online]. Available: http://www.ntsb.gov/Recs/letters/2001/H01_10_11.pdf 6 Innovative Traffic Control Technology and Practice in Europe. Prepared by Study Tour
Team (Tignor et al.), Federal Highway Administration, International Technology Exchange Program, August 1999. [Online]. Available: http://www.international.fhwa.dot.gov/Pdfs/Innovtce.pdf
7 Mirshari M., J. Obenberger, Ch. Fuhs, Ch. Howard, R. Krammes, B. Kuhn, R. Mayhew, M.
Moore, K. Sahebjam, C. Stone, J. Yung. Active Traffic Management: The Next Step in Congestion Management. International Technology Scanning Program. Report No. FHWA-PL-07-012, July, 2007. Available: http://www.international.fhwa.dot.gov/pubs/pl07012/
8 Middelham F. “Dynamic Traffic Management.” Ministry of Transport, Public Works and
Water Management, Directorate-General of Public Works and Water Management, AVV Transport Research Centre, Rotterdam, The Netherlands, Presentation to PCM Scan Team, June 2006.
9 Maze, T., S.D. Schrock, and A. Kamyab. Capacity of Freeway Work Zone Lane Closures,
Proc., Mid-Continent Transportation Symposium 2000, Center for Transportation Research and Education, Iowa State University, Ames, 2000.
10 Kujirai, S., and M. Matano. Introduction of Congestion Tail Display System into
Metropolitan Expressway, OMRON Technics, 38 (2), Serial 126, 1998. [Online]. Available: http://www.omron.co.jp/omtec/E_126-10.html#UP
96
11 Lee, C., B. Hellinga, and F. Saccomanno. Real-Time Crash Prediction Model for Application to Crash Prevention in Freeway Traffic. Transportation Research Record, No. 1840, TRB, National Research Council, Washington, D.C., 2003, pp. 67-77.
12 Sisiopiku, V., and J.R. Elliott. Active Warning Systems: Synthesis. Journal of
Transportation Engineering, ASCE, Vol. 131, No. 3, 2005, pp. 205-210. 13 Pesti, G. Alternative Way of Using Speed Trailers: Evaluation of the D-25 Speed Advisory
Sign System, Compendium of Papers CD-ROM, Paper 05-2735, 84th Annual Meeting of the Transportation Research Board, Washington, D.C., January 9-13, 2005.
14 McCoy, P.T., and G. Pesti. Effectiveness of Condition-Responsive Advisory Speed
Messages in Rural Freeway Work Zones, Transportation Research Record, No. 1794, TRB, National Research Council, Washington, D.C., 2002, pp. 11-18.
15 Kathmann, T. Assessment of the Effectiveness of Active Speed Warning Signs – Use of Inductive Loop Data or Empirical Data? Proceedings of International Conference: Traffic Safety on Three Continents, Moscow, 2001.
16 Deeter, D., and C.E. Bland. “Technology for Rural Transportation: Simple Solutions.” Report FHWA-RD-97-108, United States Department of Transportation, Eagan, Michigan, 1997.
17 Kaub, A.R., and T. Rawls. Automatic Speed Monitor: An Intelligent Vehicle Highway System Safe-Speed System for Advance Warning or Hazardous Speed Monitoring. Transportation Research Record, No. 1408, TRB, National Research Council, Washington, D.C., 1993, pp. 44-46.
18 Hanscom, F.R. Weight-Specific Highway Sign Effects on Heavy Trucks. Transportation Research Record, No. 1114, TRB, National Research Council, Washington, D.C., 1987, pp. 31-36.
19 Sullivan, J.M., C. Winkler, and M.R. Hagan. Work-Zone Safety ITS: Smart Barrel for an Adaptive Queue-Warning System. FHWA. Report Number: UMTRI-2005-3, Washington, D.C., 2005.
20 Van den Hoogen, E. and S. Smulders. “Control by Variable Speed Signs: Results of the Dutch Experiment.” Institute of Electrical Engineers IEE. pp. 145-149. 1994.
21 Borrough, P. “Variable Speed Limits Reduce Crashes Significantly in the U.K.” The Urban Transportation Monitor, March 14, 1997.
22 Hegyi, A., B. De Shutter, and H. Hellendoorn. “Optimal Coordination of Variable Speed Limits to Suppress Shockwaves.” IEEE, December 2003.
23 Park, B.B., and S.S. Yadlapati. “Development and Testing of Variable Speed Limit Logics at Work Zones Using Simulation.” Transportation Research Board, 82nd Annual Meeting, Washington, D.C., 2003.
97
24 Zhicai J., X. Zhang, and H. Yao. “Simulation Research and Implemented Effect Analysis of Variable Speed Limits on Freeway.” 2004 IEEE Intelligent Transportation Systems Conference Washington, D.C., 2004.
25 Abdel-Aty M., J. Dilmore, and A. Dhindsa. Evaluation of Variable Speed Limits for Real-Time Freeway Safety Improvement, Accident Analysis and Prevention, Vol. 38, No. 2, 2006, pp. 335-345.
26 “Creative Ways to Beat Congestion.” BBC News World Edition, November, 2004, BBC News Website, http://news.bbc.co.uk/2/hi/uk_news/magazine/4044803.stm, Accessed November 2005.
27 Tignor, S., L. Brown, J. Butner, R. Cunard, S. Davis, H. Hawkins, E. Fischer, M. Kehrli, P.
Rusche, and W. Wainwright. Innovative Traffic Control Technology and Practice in Europe. International Technology Exchange Program, Federal Highway Administration, U.S. Department of Transportation, Washington, D.C., August 1999.
28 Lemke, K., and M. Irzik. “Temporary Use of Hard Shoulders – Experiences and Economic
Assessment.” Federal Highway Research Institute, Traffic Planning, Highway Design, and Safety Analyses Section, Bergisch Gladbach, Germany, Presentation to PCM Scan Team, June 2006. Original Photos Courtesy of Autobahndirektion Südbayern (South Bavaria).
29 VORAD Collision Warning System. http://www.vorad.com, Accessed April 4, 2006.
30 Inside ITS, November 20, 1995.
31 http://www.itsbenefits.its.dot.gov/its/benecost.nsf/Components?openform, Accessed April 5, 2006.
32 Koziol, J., V. Inman, M. Carter, J. Hitz, W. Najm, S. Chen, A. Lam, M. Penic, M. Jensen, M. Baker, M. Robinson, and C. Goodspeed. Evaluation of the Intelligent Cruise Control System Volume I – Study Results. Report DOT-VNTSC-NHTSA-98-3, U.S. Department of Transportation, Washington, D.C., October, 1999.
33 Pomerleau, D., T. Jochem, C. Thorpe, P. Batavia, D. Pape, J. Hadden, N. McMillan, N. Brown, and J. Everson. Run-off-Road Collision Avoidance Using IVHS Countermeasures: Final Report. Report No. DOT-HS-809-170, EDL No. 13342, Prepared by Carnegie Mellon University for the NHTSA and USDOT, Washington, D.C., December 1999.
34 Penney, T. Intersection Collision Warning System. Publication No. FHWA-RD-99-103, U.S. Department of Transportation, Washington, D.C., 1999.
35 Krishnan, H., S. Gibb, A. Steinfeld, and S. Shladover. Rear-End Collision-Warning System: Design and Evaluation via Simulation. Transportation Research Record, No. 1759, TRB, National Research Council, Washington, D.C., 2001, pp. 52-60.
36 Lee, S.E., W.W. Wierwille, and M.C. DeHart. Evolution of an Enhanced Rear Signaling System. Transportation Research Record, No. 1843, TRB, National Research Council, Washington, D.C., 2003, pp. 31-40.
98
37 Nemeth Z.A., and N.M. Rouphail. “Lane Closures at Freeway Work Zones: Simulation Study.” Transportation Research Record, No. 869, TRB, National Research Council, Washington, D.C., 1982.
38 Mousa, R.M., N.M. Rouphail, and F. Azadivar. “Integrating Microscopic Simulation and
Optimization: Application to Freeway Work Zone Traffic Control.” Transportation Research Record, No. 1254, TRB, National Research Council, Washington, D.C., 1990.
39 Tarko, A., and S. Venugopal. Safety and Capacity Evaluation of the Indiana Lane Merge
System, FHWA/IN/JTRP-2000/19. Joint Transportation Research Program, Purdue University, sponsored by Indiana Department of Transportation, Indianapolis, Indiana, February 2001.
40 Tarko, A., S. Kanipakapatnam, and J. Wasson. Modeling and Optimization of the Indiana
Lane Merge Control System on Approaches to Freeway Work Zones, FHWA/IN/JTRP-97/12. Joint Transportation Research Program, Purdue University, sponsored by Indiana Department of Transportation, Indianapolis, Indiana, May 1998.
41 McCoy, P.T., G. Pesti, and P. Byrd. Alternative Driver Information to Alleviate Work-Zone-
Related Delays. Final Report. NDOR SPR-PL-1(35)P513. Transportation Research Studies, February 1999.
42 Pesti, G., D.R. Jessen, P.S. Byrd, and P.T. McCoy. Traffic Flow Characteristics of the
“Late Merge” Work Zone Control Strategy, Transportation Research Record, No. 1657, TRB, National Research Council, Washington, D.C., 1999, pp.1-9.
43 McCoy, P.T., and G. Pesti. Dynamic Late Merge Concept for Work Zones on Rural
Interstate Highways, Transportation Research Record, No. 1745, TRB, National Research Council, Washington, D.C., 2001, pp. 20-26.
44 Kang, K., G. Chang, and J. Paracha. Dynamic Late Merge Control at Highway Work
Zones: Evaluation, Observations, and Suggestions. Transportation Research Record, No. 1948, TRB, National Research Council, Washington, D.C., 2006, pp. 86-95.
45 Meyer, E. Construction Area Late Merge (CALM) System. Technology Evaluation Report.
Midwest Smart Work Zone Deployment Initiative. FHWA Pooled Fund study. 2004. 46 Finley, M.D., G.L. Ullman, and C.L. Dudek. Sequential Warning-Light System for Work-
Zone Lane Closures. Transportation Research Record 1745, TRB, National Research Council, Washington, D.C., 2001, pp. 39-45.
47 Goodwin, L.C. Best Practices for Road Weather Management (version 2.0). FHWA Report
FHWA-OP-03-081, Federal Highway Administration, Washington, D.C., 2003.

99
48 Martin, P.T., J. Perrin, and B. Coleman. Adverse Visibility Information System Evaluation (ADVISE) Interstate 215 Fog Warning System. Final Report UTL-1001-49, University of Utah, Salt Lake City, Utah, June, 2003.
49 Middleton, D. and S. Venglar, C. Quiroga, D. Lord and D. Jasek. Strategies for Separating
Trucks from Passenger Vehicles: Final Report. Research Report FHWA/TX-07/0-4663-2, Texas Transportation Institute, 2006.

100

101
APPENDIX A: SURVEY QUESTIONNAIRE

102
1. General Information
Name:
TxDOT District:
Position:
Telephone:
E-mail:
2. Rear-end collisions at freeway exit ramps
Have you experienced congestion, queues and rear-end collisions at freeway exit ramps in your district? If yes, please identify main reasons:
[ ] Exiting traffic demand exceeds ramp capacity
[ ] Frontage road signals can not handle the exiting traffic + frontage road volume.
[ ] Other. Please explain:
3. Rear-end collisions at freeway entry ramps
Have you experienced congestion, queues and rear-end collisions at freeway entry ramps in your district? If yes, please identify main reasons:
[ ] Available gaps in right-most lane of freeway are not sufficient for merging traffic. Therefore, queues are formed on entry ramp which may or may not spill over to the frontage road.
[ ] Forced merges cause sudden traffic slow-downs and create shockwaves in freeway traffic upstream. [ ] Slow vehicles (e.g., trucks) enter the freeway and cause freeway traffic to slow down. [ ] Other - Please explain:
4. Rear-end collisions at weaving sections between closely spaced entry and exit ramps
Does your district have any of the following ramp configurations where frequent rear-end collisions occur?
[ ] Right entry ramp followed by right exit ramp
[ ] Right entry ramp followed by left exit ramp
[ ] Other (please specify):
5. Rear-end collisions at freeway junctions
Please identify all locations where rear-end collisions typically occur at freeway junctions in your district.
[ ] Location A: upstream of freeway merge
[ ] Location B: downstream of freeway merge
[ ] Location C: upstream of freeway diverge
[ ] Other (please specify):
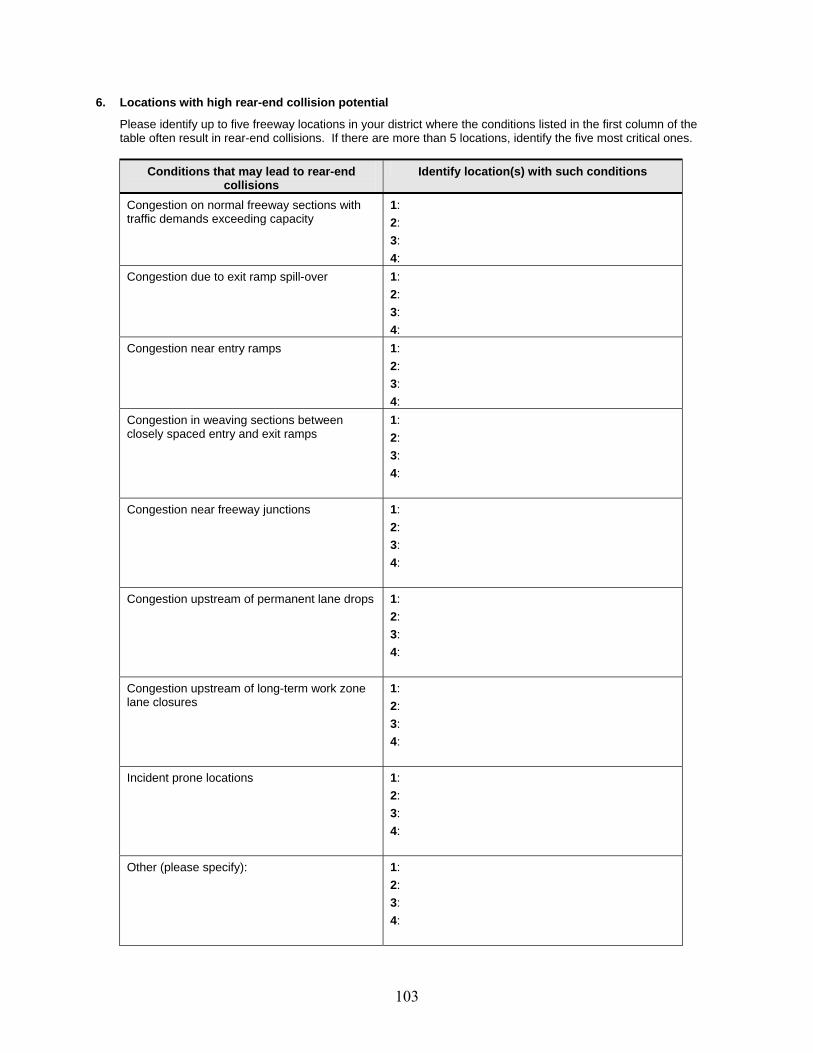
103
6. Locations with high rear-end collision potential
Please identify up to five freeway locations in your district where the conditions listed in the first column of the table often result in rear-end collisions. If there are more than 5 locations, identify the five most critical ones.
Conditions that may lead to rear-end collisions
Identify location(s) with such conditions
Congestion on normal freeway sections with traffic demands exceeding capacity
1: 2: 3: 4:
Congestion due to exit ramp spill-over
1: 2: 3: 4:
Congestion near entry ramps
1: 2: 3: 4:
Congestion in weaving sections between closely spaced entry and exit ramps
1: 2: 3: 4:
Congestion near freeway junctions
1: 2: 3: 4:
Congestion upstream of permanent lane drops
1: 2: 3: 4:
Congestion upstream of long-term work zone lane closures
1: 2: 3: 4:
Incident prone locations
1: 2: 3: 4:
Other (please specify):
1: 2: 3: 4:

104
7. Advance Warning of Stopped or Slow Traffic:
7.1 Do you use static (e.g., pole-mounted) signs for advance warning of stopped or slow traffic?
[ ] Yes [ ] No
For multiple signs provide typical spacing (ft):
Guidelines used for locating advance warning signs:
What static messages do you use? List:
7.2 Do you use Changeable Message Signs (CMS) for advance warning of stopped or slow traffic?
[ ] Yes [ ] No
For multiple CMS’s provide typical spacing (ft):
Typical Messages (attach additional sheets if necessary):
Phase Duration (sec) Message Content 1 2
Phase Duration (sec) Message Content 1 2
Phase Duration (sec) Message Content 1 2
Guidelines used for locating CMS:
Have you used CMS with sensor (e.g., radar) capabilities?
[ ] Yes [ ] No
If yes, describe system components and logic (attach additional sheet if necessary):
7.3 Have you used any other advance warning techniques? If yes, please explain (attach additional sheet if
necessary)
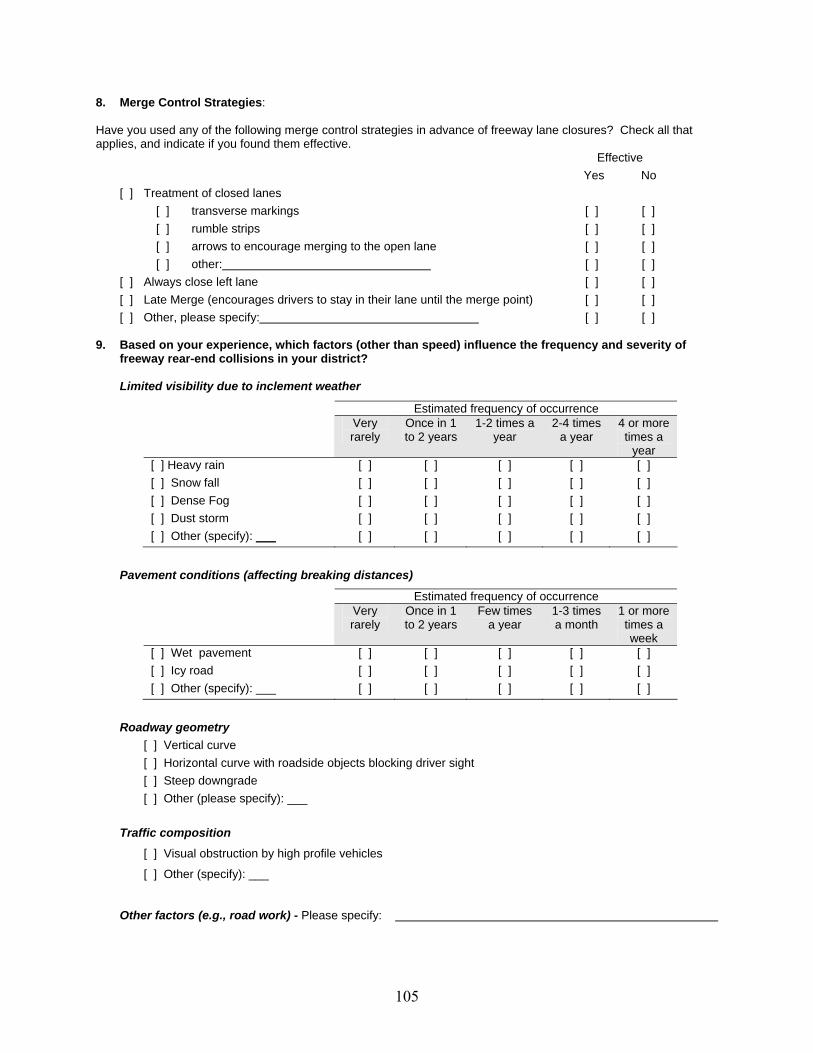
105
8. Merge Control Strategies: Have you used any of the following merge control strategies in advance of freeway lane closures? Check all that applies, and indicate if you found them effective. Effective
Yes No [ ] Treatment of closed lanes
[ ] transverse markings [ ] rumble strips [ ] arrows to encourage merging to the open lane [ ] other:
[ ] [ ] [ ] [ ] [ ] [ ] [ ] [ ]
[ ] Always close left lane [ ] Late Merge (encourages drivers to stay in their lane until the merge point) [ ] Other, please specify:
[ ] [ ] [ ] [ ] [ ] [ ]
9. Based on your experience, which factors (other than speed) influence the frequency and severity of
freeway rear-end collisions in your district? Limited visibility due to inclement weather
Estimated frequency of occurrence Very
rarely Once in 1 to 2 years
1-2 times a year
2-4 times a year
4 or more times a
year [ ] Heavy rain [ ] Snow fall [ ] Dense Fog [ ] Dust storm [ ] Other (specify): ___
[ ] [ ] [ ] [ ] [ ]
[ ] [ ] [ ] [ ] [ ]
[ ] [ ] [ ] [ ] [ ]
[ ] [ ] [ ] [ ] [ ]
[ ] [ ] [ ] [ ] [ ]
Pavement conditions (affecting breaking distances)
Estimated frequency of occurrence Very
rarely Once in 1 to 2 years
Few times a year
1-3 times a month
1 or more times a week
[ ] Wet pavement [ ] Icy road [ ] Other (specify): ___
[ ] [ ] [ ]
[ ] [ ] [ ]
[ ] [ ] [ ]
[ ] [ ] [ ]
[ ] [ ] [ ]
Roadway geometry [ ] Vertical curve [ ] Horizontal curve with roadside objects blocking driver sight [ ] Steep downgrade [ ] Other (please specify): ___
Traffic composition
[ ] Visual obstruction by high profile vehicles
[ ] Other (specify): ___
Other factors (e.g., road work) - Please specify:

106
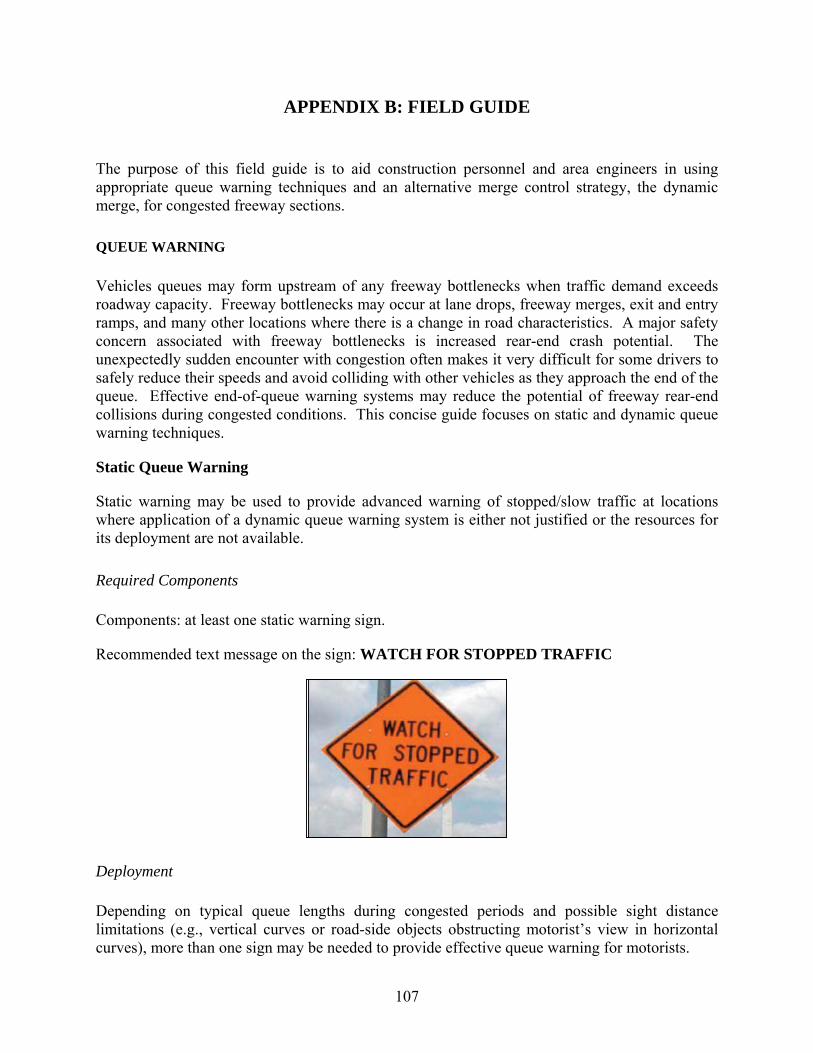
107
APPENDIX B: FIELD GUIDE
The purpose of this field guide is to aid construction personnel and area engineers in using appropriate queue warning techniques and an alternative merge control strategy, the dynamic merge, for congested freeway sections.
QUEUE WARNING
Vehicles queues may form upstream of any freeway bottlenecks when traffic demand exceeds roadway capacity. Freeway bottlenecks may occur at lane drops, freeway merges, exit and entry ramps, and many other locations where there is a change in road characteristics. A major safety concern associated with freeway bottlenecks is increased rear-end crash potential. The unexpectedly sudden encounter with congestion often makes it very difficult for some drivers to safely reduce their speeds and avoid colliding with other vehicles as they approach the end of the queue. Effective end-of-queue warning systems may reduce the potential of freeway rear-end collisions during congested conditions. This concise guide focuses on static and dynamic queue warning techniques.
Static Queue Warning
Static warning may be used to provide advanced warning of stopped/slow traffic at locations where application of a dynamic queue warning system is either not justified or the resources for its deployment are not available.
Required Components
Components: at least one static warning sign.
Recommended text message on the sign: WATCH FOR STOPPED TRAFFIC
Deployment
Depending on typical queue lengths during congested periods and possible sight distance limitations (e.g., vertical curves or road-side objects obstructing motorist’s view in horizontal curves), more than one sign may be needed to provide effective queue warning for motorists.
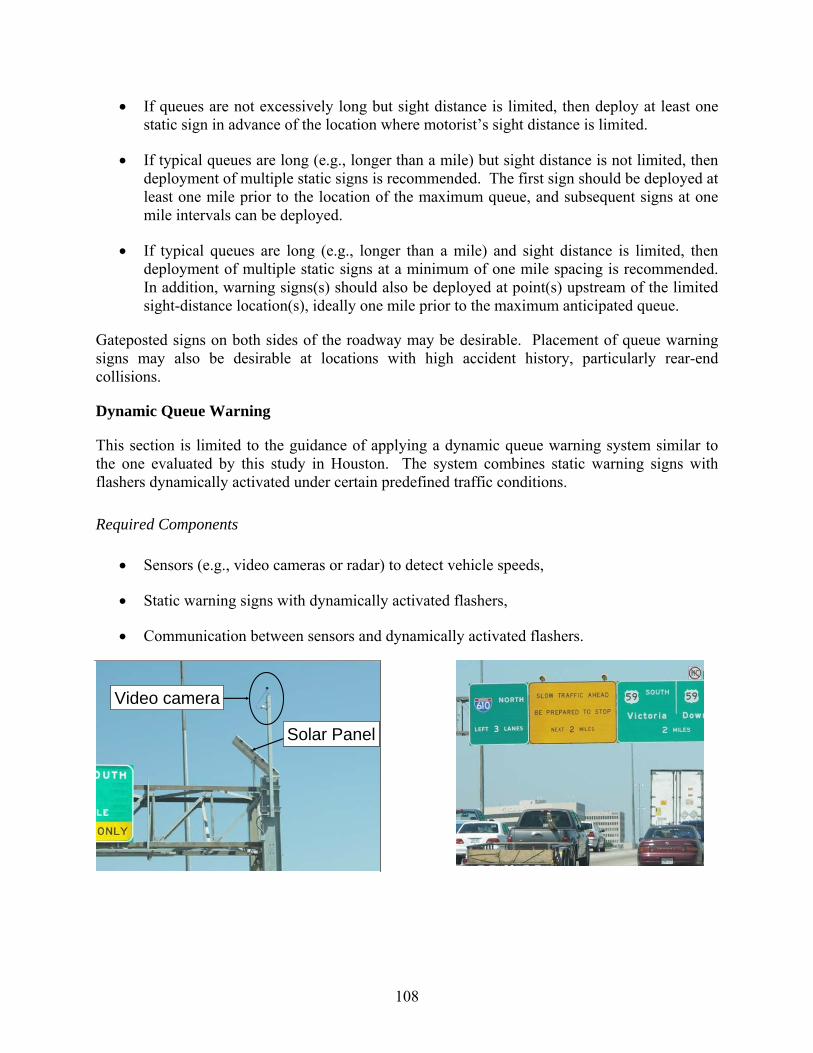
108
• If queues are not excessively long but sight distance is limited, then deploy at least one static sign in advance of the location where motorist’s sight distance is limited.
• If typical queues are long (e.g., longer than a mile) but sight distance is not limited, then deployment of multiple static signs is recommended. The first sign should be deployed at least one mile prior to the location of the maximum queue, and subsequent signs at one mile intervals can be deployed.
• If typical queues are long (e.g., longer than a mile) and sight distance is limited, then deployment of multiple static signs at a minimum of one mile spacing is recommended. In addition, warning signs(s) should also be deployed at point(s) upstream of the limited sight-distance location(s), ideally one mile prior to the maximum anticipated queue.
Gateposted signs on both sides of the roadway may be desirable. Placement of queue warning signs may also be desirable at locations with high accident history, particularly rear-end collisions.
Dynamic Queue Warning
This section is limited to the guidance of applying a dynamic queue warning system similar to the one evaluated by this study in Houston. The system combines static warning signs with flashers dynamically activated under certain predefined traffic conditions.
Required Components
• Sensors (e.g., video cameras or radar) to detect vehicle speeds,
• Static warning signs with dynamically activated flashers,
• Communication between sensors and dynamically activated flashers.
Video camera
Solar Panel
Video camera
Solar Panel
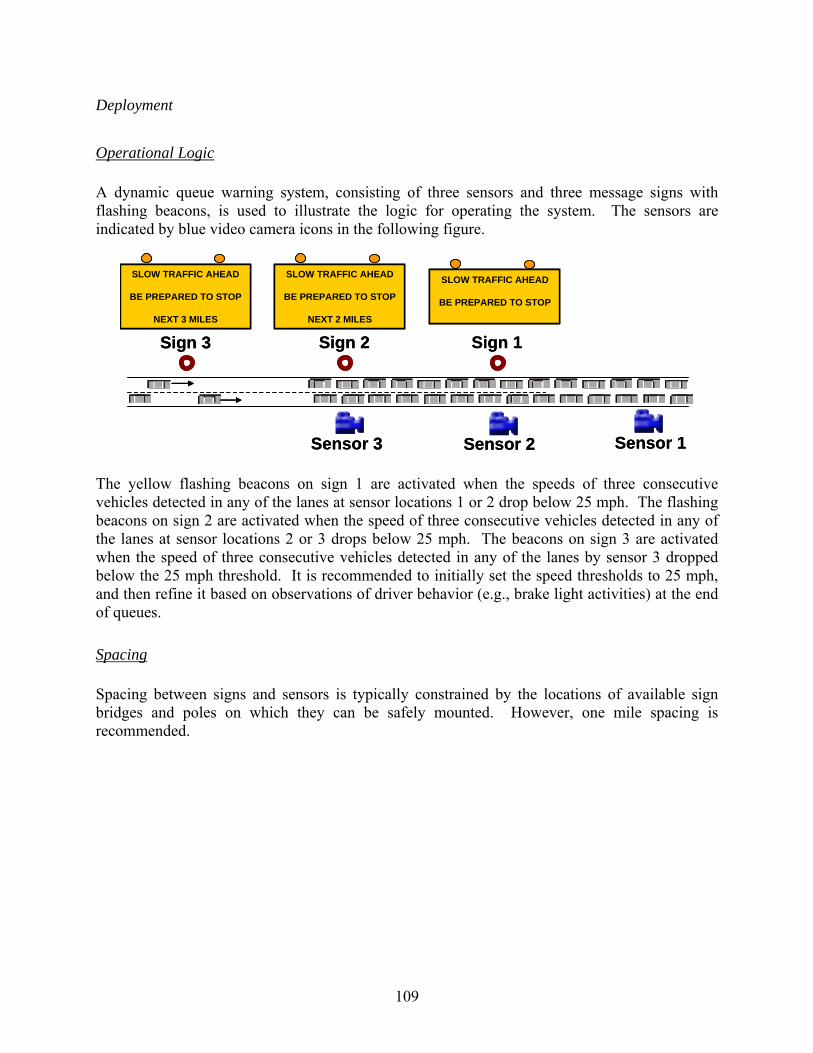
109
Deployment
Operational Logic
A dynamic queue warning system, consisting of three sensors and three message signs with flashing beacons, is used to illustrate the logic for operating the system. The sensors are indicated by blue video camera icons in the following figure.
SLOW TRAFFIC AHEAD
BE PREPARED TO STOP
NEXT 2 MILES
SLOW TRAFFIC AHEAD
BE PREPARED TO STOP
NEXT 3 MILES
SLOW TRAFFIC AHEAD
BE PREPARED TO STOP
Sign 3 Sign 2 Sign 1
Sensor 2Sensor 3 Sensor 1
SLOW TRAFFIC AHEAD
BE PREPARED TO STOP
NEXT 2 MILES
SLOW TRAFFIC AHEAD
BE PREPARED TO STOP
NEXT 2 MILES
SLOW TRAFFIC AHEAD
BE PREPARED TO STOP
NEXT 3 MILES
SLOW TRAFFIC AHEAD
BE PREPARED TO STOP
NEXT 3 MILES
SLOW TRAFFIC AHEAD
BE PREPARED TO STOP
SLOW TRAFFIC AHEAD
BE PREPARED TO STOP
Sign 3 Sign 2 Sign 1
Sensor 2Sensor 3 Sensor 1
The yellow flashing beacons on sign 1 are activated when the speeds of three consecutive vehicles detected in any of the lanes at sensor locations 1 or 2 drop below 25 mph. The flashing beacons on sign 2 are activated when the speed of three consecutive vehicles detected in any of the lanes at sensor locations 2 or 3 drops below 25 mph. The beacons on sign 3 are activated when the speed of three consecutive vehicles detected in any of the lanes by sensor 3 dropped below the 25 mph threshold. It is recommended to initially set the speed thresholds to 25 mph, and then refine it based on observations of driver behavior (e.g., brake light activities) at the end of queues.
Spacing
Spacing between signs and sensors is typically constrained by the locations of available sign bridges and poles on which they can be safely mounted. However, one mile spacing is recommended.
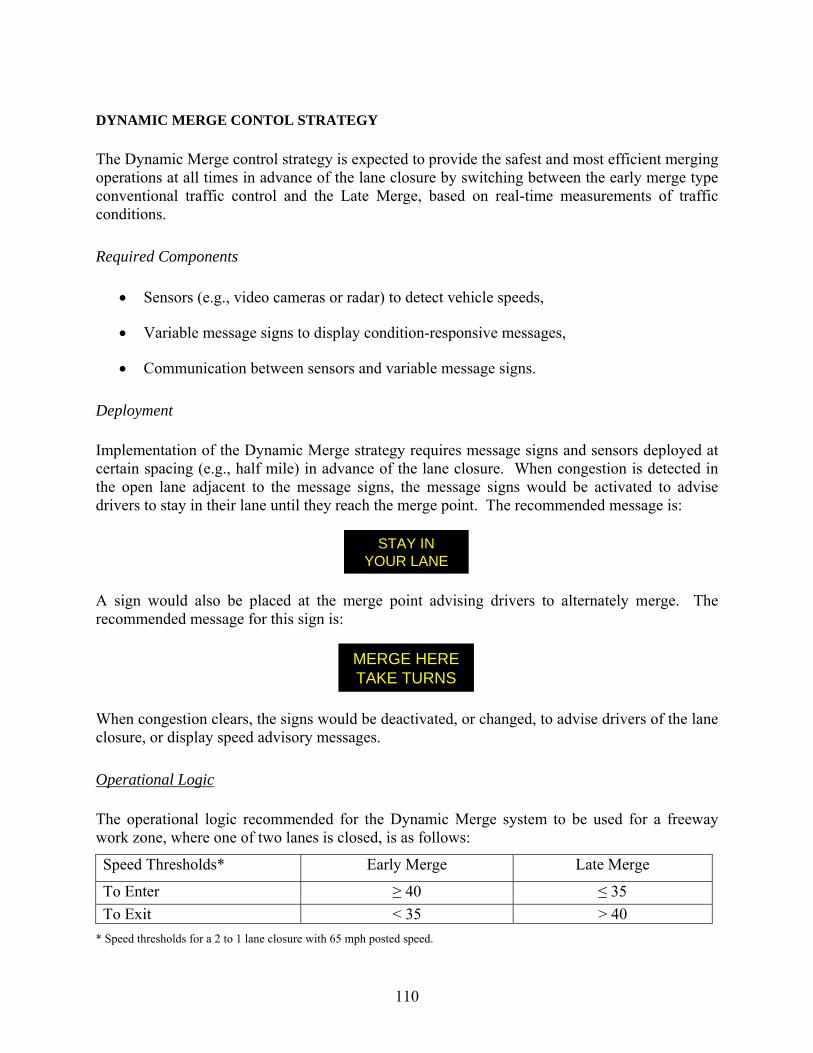
110
DYNAMIC MERGE CONTOL STRATEGY
The Dynamic Merge control strategy is expected to provide the safest and most efficient merging operations at all times in advance of the lane closure by switching between the early merge type conventional traffic control and the Late Merge, based on real-time measurements of traffic conditions.
Required Components
• Sensors (e.g., video cameras or radar) to detect vehicle speeds,
• Variable message signs to display condition-responsive messages,
• Communication between sensors and variable message signs.
Deployment
Implementation of the Dynamic Merge strategy requires message signs and sensors deployed at certain spacing (e.g., half mile) in advance of the lane closure. When congestion is detected in the open lane adjacent to the message signs, the message signs would be activated to advise drivers to stay in their lane until they reach the merge point. The recommended message is:
STAY INYOUR LANE
A sign would also be placed at the merge point advising drivers to alternately merge. The recommended message for this sign is:
MERGE HERETAKE TURNS
When congestion clears, the signs would be deactivated, or changed, to advise drivers of the lane closure, or display speed advisory messages.
Operational Logic
The operational logic recommended for the Dynamic Merge system to be used for a freeway work zone, where one of two lanes is closed, is as follows:
Speed Thresholds* Early Merge Late Merge
To Enter ≥ 40 ≤ 35 To Exit < 35 > 40
* Speed thresholds for a 2 to 1 lane closure with 65 mph posted speed.
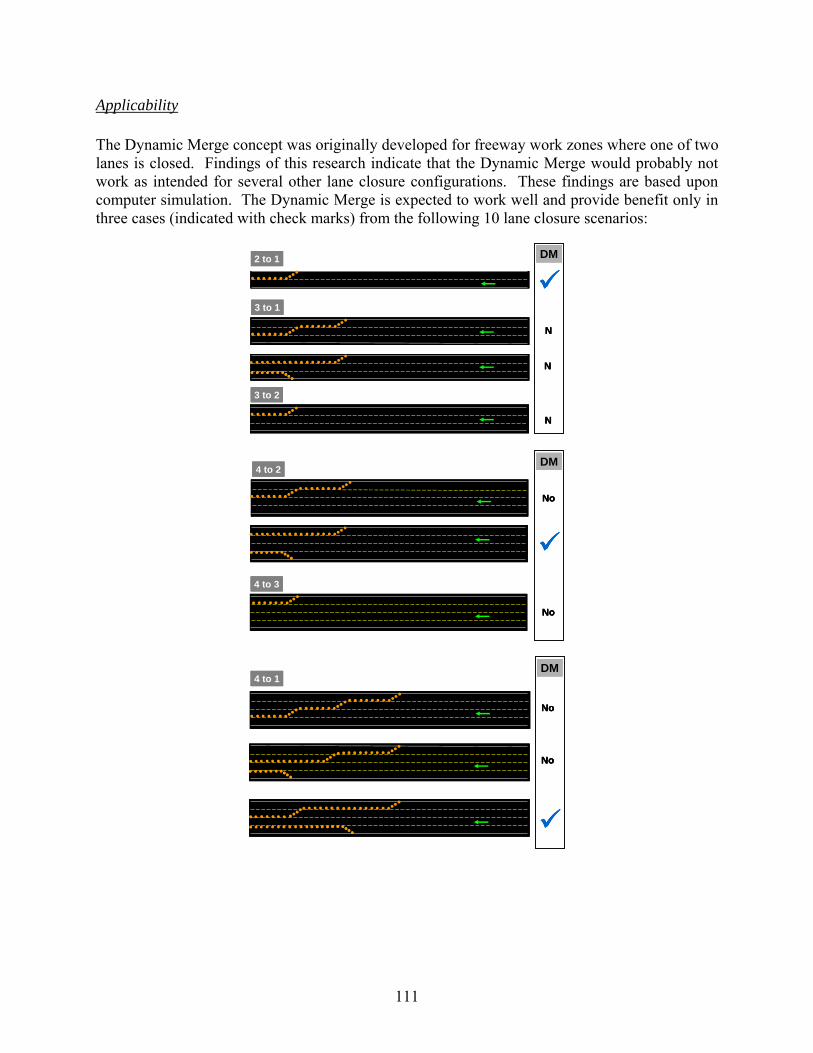
111
Applicability
The Dynamic Merge concept was originally developed for freeway work zones where one of two lanes is closed. Findings of this research indicate that the Dynamic Merge would probably not work as intended for several other lane closure configurations. These findings are based upon computer simulation. The Dynamic Merge is expected to work well and provide benefit only in three cases (indicated with check marks) from the following 10 lane closure scenarios:
2 to 1
3 to 1
3 to 2
N
N
N
DM2 to 1
3 to 1
3 to 2
N
N
N
DM2 to 1
3 to 1
3 to 2
N
N
N
DMDM
4 to 3
4 to 2
No
No
DM
4 to 3
4 to 2
No
No
DM
4 to 3
4 to 2
No
No
DMDM
4 to 1
No
No
DM4 to 1
No
No
DM4 to 1
No
No
DMDM
