study of hf behaviour of railway power substation in
TRANSCRIPT

HAL Id: hal-00672788https://hal.archives-ouvertes.fr/hal-00672788
Submitted on 22 Feb 2012
HAL is a multi-disciplinary open accessarchive for the deposit and dissemination of sci-entific research documents, whether they are pub-lished or not. The documents may come fromteaching and research institutions in France orabroad, or from public or private research centers.
L’archive ouverte pluridisciplinaire HAL, estdestinée au dépôt et à la diffusion de documentsscientifiques de niveau recherche, publiés ou non,émanant des établissements d’enseignement et derecherche français ou étrangers, des laboratoirespublics ou privés.
Study of HF behaviour of railway power substation inreduced scale
H. Ouaddi, S. Baranowski, G. Nottet, B. Demoulin, L. Koné
To cite this version:H. Ouaddi, S. Baranowski, G. Nottet, B. Demoulin, L. Koné. Study of HF behaviour of railway powersubstation in reduced scale. European Physical Journal: Applied Physics, EDP Sciences, 2011, 53(3), 10.1051/epjap/2010100061. hal-00672788

STUDY OF HF BEHAVIOUR OF RAILWAY POWER SUBSTATION I N REDUCED SCALE
H. Ouaddi*, S. Baranowski**, G. Nottet*, B. Demoulin**, L. Koné**
* Alstom Transport, Parcs d’Activités Lavoisier, Petite Forêt, France - [email protected]
** University of Lille, IEMN TELICE, Villeneuve d’Ascq, France - [email protected]
Shortened version of the title: HF model of railway power substation in reduced scale Abstract –The study presented in this paper is a first step of an EMC (Electromagnetic Compatibility) analysis of the behaviour of a railway power substation at high frequency. Before on site intensive experimentation, the approach is performed with a reduced scale model. The mock-up of the substation is powered by a 220 V three-phase voltage supplied by a 15 kVA power transformer, a rectifier and loads. The study consists in designing an equivalent electrical circuit of power transformer in high frequency, available over a large panel of loads. The model of power transformer was deduced from measurements in frequency domain within the range 40 Hz to 30 MHz.
1. Introduction According to the EMC constraints, the railway systems should not disturb the immediate environment and the standard EN 50111 [1] specifies the different elements that have to be tested and describes the measurement methods and emission levels to comply. Sometimes, the measurement of the electromagnetic field radiated at 10 meters from the railway track, can show some resonance phenomena which can exceed the standard limit for some frequency values (an example is given in Fig. 1). In addition, the new generation of rolling stock is equipped with safety communication systems with on board antennas which must not be disturbed neither. These elements of safety system operate in frequency range from 10 kHz to 30 MHz. Thus, it becomes important to know which source can introduce the resonance phenomena.
-20
0
20
40
60
0.01 0.1 1Frequency (MHz)
H (d
Bµ
A/m
)
Resonance due toInfrastructure or train
EN 50121-3-1 limit
Fig. 1. Example of magnetic field of railway
infrastructure measured at 10 m from the centre of the rail
The railway infrastructure could be divided in two parts (Fig. 2); the rolling stock represents the first one and the railway power supply is the other part. In our study we will focus on the frequency modelling of a railway power supply infrastructure in frequency band of 10 kHz – 30 MHz which is useful to predict the EMC behaviour of the railway system and especially in the studied application: the behaviour of the railway substation. The railway power supply is generally composed by two main systems: the first one is the “lines system” constituted by the catenaries and the rails, while the power supply substation defines the second main part. The substation contains generally a power transformer, sometimes a converter, and wires, bus bars...etc.
Fig. 2. Simplified diagram of railway infrastructure
The study of the power transformer which
constitutes the heart of a substation is presented in

this paper. In order to propose a high frequency model of the
whole system, it is necessary to determine a model of each element, and especially of the power transformer, which accuracy will be highly dependent of the accuracy of each primary model. The low frequency model of the transformer, defined at 50Hz, is not valid when the frequency increases. Indeed, some phenomena can be predominant at high frequencies, for example the Eddy current, which depends on the variation of the magnetizing impedance and the winding resistance, but also the parasitic capacitances which appear between windings due to the insulated parts of the transformer. The analysis of the transformer behaviour shows that it's possible to use an equivalent electrical model valid in the considered frequency band. During the past decades, many models of power transformer have been studied for several applications. Most of those models, often in a reduced frequency band, are based on equivalent circuits of resistive, inductive and capacitive elements which can take into account the physical behaviour of power transformer [2]. Some others are wide band models established using the black box principle [3]. Obviously, it is also possible to apply the FEM method but in that case, the exact constitution of the transformer must be known which introduces some additional difficulties: indeed, how to found the appropriate data sheet when the transformer is operated in the railway system since many years? In this case, it is more suitable to determine the equivalent circuit thanks to measurements process.
2. Description of the test bench In order to understand the behaviour of the railway substation, a test bench which reproduces the substation in small scale, is performed. It is composed (fig 3) by a three phase power transformer, a rectifier and loads.
Fig. 3. Schematic illustration of the test bench
The transformer is a 15 kVA 220 V/110 V with ∆ connected HV (High Voltage) winding and ∆ connected LV (Low Voltage) winding. The power rectifier is designed with twelve power diodes and is connected to 47 Ω loads. All these elements are placed over a common ground plane (Fig. 4). The different devices are connected using 1m long wires.
LoadsRectifier Power
transformer
Ground Plane
Fig. 4. Photo of the test bench
3.
4. High frequency modelling of the power transformer: proposed model
3.1 Preliminary measurements on high
power transformer Figures 5 and 6 present the impedance of the secondary winding measured when the primary is short-circuited for two power transformers: respectively 15 kVA (Fig. 5) and 2.38 MVA (Fig. 6).
Fig. 5.Impedance of the secondary winding
measured when the primary is short-circuited (15kVA power transformer)
The two impedance characteristics are measured in the frequency band 100 kHz - 40 MHz. We can observe that the evolutions of the two impedance
characteristics are globally the same. Thus, we can consider that characterisation and modelling could be applied and experienced in a first time to lower power transformers and then, high power transformers from substation will be studied.
0.1 1 10 1001
10
100
1000
10000
Frequency (MHz)
Z (O
hms)
Fig. 6. .Impedance of the secondary winding measured when the primary is short-circuited
(2MVA power transformer)
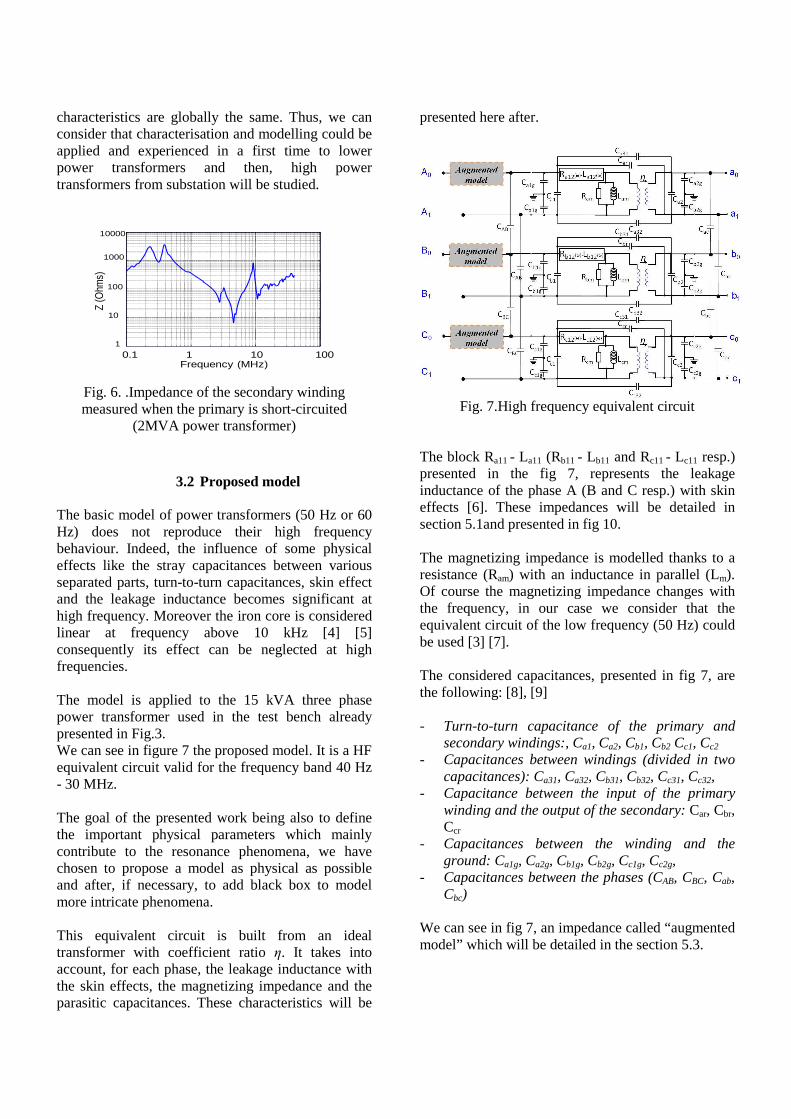
3.2 Proposed model The basic model of power transformers (50 Hz or 60 Hz) does not reproduce their high frequency behaviour. Indeed, the influence of some physical effects like the stray capacitances between various separated parts, turn-to-turn capacitances, skin effect and the leakage inductance becomes significant at high frequency. Moreover the iron core is considered linear at frequency above 10 kHz [4] [5] consequently its effect can be neglected at high frequencies. The model is applied to the 15 kVA three phase power transformer used in the test bench already presented in Fig.3. We can see in figure 7 the proposed model. It is a HF equivalent circuit valid for the frequency band 40 Hz - 30 MHz. The goal of the presented work being also to define the important physical parameters which mainly contribute to the resonance phenomena, we have chosen to propose a model as physical as possible and after, if necessary, to add black box to model more intricate phenomena. This equivalent circuit is built from an ideal transformer with coefficient ratio η. It takes into account, for each phase, the leakage inductance with the skin effects, the magnetizing impedance and the parasitic capacitances. These characteristics will be
presented here after.
Fig. 7.High frequency equivalent circuit The block Ra11 - La11 (Rb11 - Lb11 and Rc11 - Lc11 resp.) presented in the fig 7, represents the leakage inductance of the phase A (B and C resp.) with skin effects [6]. These impedances will be detailed in section 5.1and presented in fig 10. The magnetizing impedance is modelled thanks to a resistance (Ram) with an inductance in parallel (Lm). Of course the magnetizing impedance changes with the frequency, in our case we consider that the equivalent circuit of the low frequency (50 Hz) could be used [3] [7]. The considered capacitances, presented in fig 7, are the following: [8], [9] - Turn-to-turn capacitance of the primary and
secondary windings:, Ca1, Ca2, Cb1, Cb2 Cc1, Cc2 - Capacitances between windings (divided in two
capacitances): Ca31, Ca32, Cb31, Cb32, Cc31, Cc32, - Capacitance between the input of the primary
winding and the output of the secondary: Car, Cbr, Ccr
- Capacitances between the winding and the ground: Ca1g, Ca2g, Cb1g, Cb2g, Cc1g, Cc2g,
- Capacitances between the phases (CAB, CBC, Cab, Cbc)
We can see in fig 7, an impedance called “augmented model” which will be detailed in the section 5.3.

5. Experimental characterisation
4.1 Inductive and magnetizing effect
The characterisation of the power transformer is done in frequency domain by using an impedance meter and measurements are operated at its ports. The leakage inductance with the skin effect of the windings is determined by measuring the primary impedance when the secondary is short-circuited (Fig. 8) [7]. Winding losses can be estimated from the impedance measured at low frequency (40 Hz - 100 kHz). The effect of the magnetizing impedance could be characterised by measuring the impedance of the primary when the secondary is open (Fig. 9).
Leakageinductance with
skin effects
Fig. 8. Primary winding impedance with
secondary short circuited (phase A)
Magnetizingimpedance
Fig. 9. Primary winding impedance with
secondary open (phase A)
4.2 Stray capacitances
For example, in the case of the phase A, it is necessary to determine the capacitances Ca1, Ca2, Ca31, Ca32, Car, Ca1g and Ca1g. Their effects are located in high frequencies so they will be evaluated in this frequency range. The capacitance system of each phase is estimated separately. Moreover, during the measurements on one phase, the two others are short circuited in order to avoid the influence of the unused phases. Seven measurement configurations are necessary for the evaluation of the seven capacitances. Thus, they provide seven equations which unknowns are the
capacitances of the equivalent circuit. Then the equation system is solved with mathematical tools.
6. Identification of the parameters of high frequency equivalent circuit
5.1 Inductive and magnetizing effect
Some authors [10] prefer to separate the two effects (leakage inductance and skin effect) and to model the skin effect alone because it is more important in the considered frequency band. We have chosen to model both, the leakage inductance and skin effect in single impedances, called Ra11 - La11, Rb11 - Lb11 and Rc11 - Lc11 in fig 7, one for each phase. After some tests, in order to have an efficient approximation, eight resistances and inductances are used to model these effects for one phase, as shown in figure 10.
Fig. 10. Equivalent circuit of the leakage inductance and skin effect.
The parameters of the equivalent circuit are computed with the less square algorithm through an identification process performed with the measured complex values of the ‘short-circuit’ impedance (Fig. 8). Table 1 presents the values computed for the windings of the phases A and B as an example. In the studied configuration, the phase A (A0A1-a0a1) and the phase C (C0C1-c0c1) have the same physical properties consequently they will be considered equivalent [2]. The relative error between measured leakage inductance and its equivalent circuit is less than 0.3 % in the low frequency band.
Phase A Phase B Phase A Phase B R1 0.6 0.6 L1 1.1 1.1 R2 58 58.4 L2 1.08 2.3 R3 49 0.001 L3 3.64 2.4 R4 131.8 32.7 L4 100 2.5 R5 45.9 36.5 L5 13.03 8.3 R6 471.7 1082.8 L6 11 11.32 R7 746.4 15 L7 54 35.9 R8 679.4 38.8 L8 13.9 69.4
Table 1. Leakage inductance with skin effect:
value of the equivalent circuit - Resistance in Ohms and Inductance in mH

The magnetizing impedance of each phase is modelled by a resistance in parallel with an inductance. Their values are deduced from the primary winding impedance measured at low frequency when the secondary is open (Fig. 9). As an example the values of these parameters for the phases A and B of the studied transformer are respectively: RmA= 13.44 kΩ, LmA=31.19 mH, RmB= 15.87 kΩ and LmB=32.14 mH.
5.2 Stray capacitances
In order to determine the parasitic capacitances, measurements are performed in frequency domain in several configurations (Fig. 11) [11], [12]. In order to have an efficient characterization, the impedances are measured both in magnitude and in phase. Moreover, as previously in the study, phases A and C are considered to have the same physical behaviour.
A1
A0
a1
a0
A1
A0
a1
a0
A1
A0
a1
a0
A1
A0
a1
a0
A1
A0
a1
a0
A1
A0
a1
a0
A1
A0
a1
a0
Fig. 11.Measurement configuration used for determining capacitances (phase A)
As an example, Figure 11 presents the seven measurements configurations with the associated equations in the case of the phase A.
On each configuration, short circuits are drawn and the arrows present the impedance measurement points whereas Cme is the corresponding measured capacitance. The various measurements provide a non linear system where unknowns are the capacitances. This system is solved thanks to algorithm like Gauss-Newton. Results for the studied transformer: The capacitances CAB and CBC are equal to 20 pF and the capacitances Cab and Cbc, 25pF. Table 2 shows the values of the capacitances obtained after the resolution of the system for phase A and B (phase C being considered equivalent to phase A).
Ca1 Ca2 Ca31 Ca32 Car Ca1g Ca2g Ph.A 1.25 0.6 0.8 0.5 -0.1 0.11 0.03
Cb1 Cb2 Cb31 Cb32 Cbr Cb1g Cb2g Ph.B 1.1 0.9 0.8 0.4 0.03 0.03 -0.02
Table 2. Capacitances of the equivalent circuit of the
studied power transformer- (values in nF )
5.3 Augmented model
The impedance characteristics presented in Figures 8 and 9 show the same evolution at high frequency (above 3 MHz) with fast variations and consequently it costs time to model. Thanks to “augmented method” [13], it is possible to consider this part by using an inductance in parallel with a “black box”. The “black box” is elaborated by using the principle of the “vector fitting” [5]. This algorithm consists in approximating a frequency response with a rational function, expressed by a sum of partial fractions. This principle is implemented in the IdEM® software [14] [15] used for our study. This code generates a macro-model which could be integrated in software like Pspice. Figure 7 presents the main equivalent circuit of the transformer with the added impedance issued from” augmented model” (Fig.12) which takes into account the high frequency effects. Figure 13 shows the effect of this ‘augmented model impedance’ on the HF accuracy of the model, by comparison of the measurements results with the model ones.
MACRO HF
R=300 Ω
L=4.8 uH
Fig. 12.Equivalent circuit for high frequency
behaviour: “Augmented model”
7. Power transformer modelling results
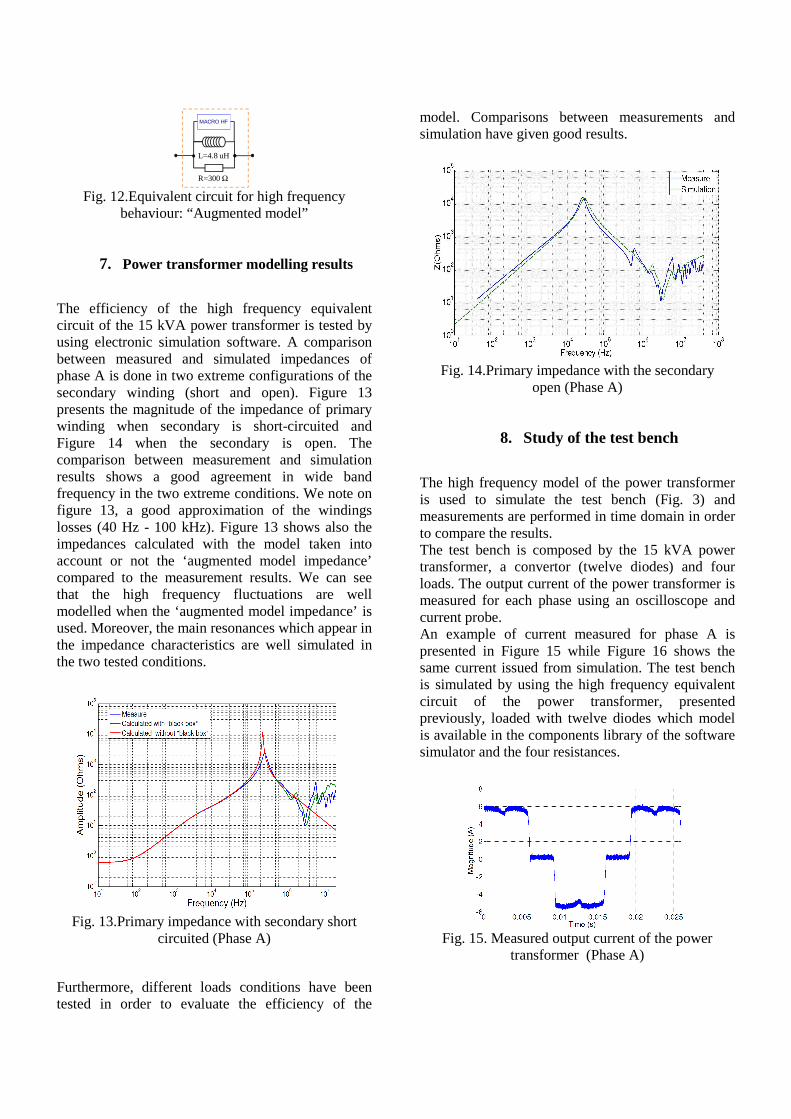
The efficiency of the high frequency equivalent circuit of the 15 kVA power transformer is tested by using electronic simulation software. A comparison between measured and simulated impedances of phase A is done in two extreme configurations of the secondary winding (short and open). Figure 13 presents the magnitude of the impedance of primary winding when secondary is short-circuited and Figure 14 when the secondary is open. The comparison between measurement and simulation results shows a good agreement in wide band frequency in the two extreme conditions. We note on figure 13, a good approximation of the windings losses (40 Hz - 100 kHz). Figure 13 shows also the impedances calculated with the model taken into account or not the ‘augmented model impedance’ compared to the measurement results. We can see that the high frequency fluctuations are well modelled when the ‘augmented model impedance’ is used. Moreover, the main resonances which appear in the impedance characteristics are well simulated in the two tested conditions.
Fig. 13.Primary impedance with secondary short
circuited (Phase A)
Furthermore, different loads conditions have been tested in order to evaluate the efficiency of the
model. Comparisons between measurements and simulation have given good results.
Fig. 14.Primary impedance with the secondary
open (Phase A)
8. Study of the test bench
The high frequency model of the power transformer is used to simulate the test bench (Fig. 3) and measurements are performed in time domain in order to compare the results. The test bench is composed by the 15 kVA power transformer, a convertor (twelve diodes) and four loads. The output current of the power transformer is measured for each phase using an oscilloscope and current probe. An example of current measured for phase A is presented in Figure 15 while Figure 16 shows the same current issued from simulation. The test bench is simulated by using the high frequency equivalent circuit of the power transformer, presented previously, loaded with twelve diodes which model is available in the components library of the software simulator and the four resistances.
Fig. 15. Measured output current of the power
transformer (Phase A)

Fig. 16. Simulated output current of the power
transformer (Phase A) As shown in Figure 15 and 16, we have a good agreement between the measured and simulated currents. Nevertheless, the wave form of the measured current is disturbed by digital noise of the oscilloscope. Moreover in our simulation we used sources without noise which does not exist in real case. The FFT of the measured and simulated currents is done and the result is presented in Figure 17. The comparison, in the frequency band 50Hz – 5 kHz, shows that the spectrums of the two currents are equivalent. Comparison for higher frequency will give false results due to the noise in the measurements.
Fig. 17. Comparison in frequency domain
between the measured and simulated output currents (Phase A)
9. Conclusion
An efficient high frequency equivalent circuit of the three phase power transformer is presented in this paper. It is available in wide frequency band (40Hz – 30 MHz) and well reproduces the main physical phenomena especially the resonances. The equivalent circuit and characterisation could be used to determine the equivalent circuit of many power transformers. In a future work, a time domain analysis will be done to validate the equivalent circuit
with high level signal. In that case, a pulse voltage with high magnitude will be injected at the input of power transformer.
Acknowledgements
This work has been done in CEMRAIL project, with competitiveness cluster I-TRANS label.
The authors thank N. Idir J.L. Kotny and J.J. Franchaud from L2EP laboratory of the University of Lille for their help during experimentation
References
1. European Standards EN 50111: 2006 Railway applications – Electromagnetic Compatibility
2. C. Andrieu, E. Daupahant and D. Boss, “A frequency- Dependant Model for a MV/LV Transformer”, IPST’99 – International Conference on Power Systems Transient, June 20-24,1999, Budapest.
3. S. Chimklai, JR Marti “simplified Three-Phase Transformer Model for Electromagnetic Transient Studies”, IEEE Trans, Power Delivery, vol. 10, no. 3, July 1995, pp. 1316-1325.
4. A. Oguz Soysal, “A method for wide frequency range modelling of power transformers and rotating machines”, IEEE Transactions on Power Delivery, vol. 8, No. 4,pp. 1802–1810, October 1993.
5. B. Gustavsen and A. Semlyen, “Rational approximation of frequency domain response by Vector Fitting”, IEEE Trans, Power Delivery, vol. 14, no. 3, July 1999, pp. 1052-1061
6. B.Cogitore, J. P. Kéradec, “The two-winding transformer: an experimental method to obtain a wide frequency range equivalent circuit”, IEEE transactions on instrumentation and measurement, Vol. 43, No. 2, April 1994.
7. T. Noda, H. Nakamoto, S. Yokoyama, “Accurate modeling of core-type distribution transformers for electromagnetic transient studies”, IEEE transactions on power delivery, Vol.17, October2002.
8. F. Blache, J. P. Kéradec, B. Cogitore, “Stray capacitance of two winding transformers: equivalent circuit, measurements, calculation and lowering”, IEEE tr IEEE transactions on Powers Electronics Specialists Conference,, 1994.
9. H.Y. Lu, J.G. Zhu,V.S. Ramsden, S.Y.R. Hui, “Measurement and modeling of stray capacitance in high frequency transformers”, IEEE transactions on Powers Electronics Specialists Conference, Vol. 2, Page(s): 763 – 768, 1999.
10. S Kim , D.P. Neikirk, “Compact equivalent circuit for the skin effect”; 1996 IEEE MTT-S International Microwave Symposium.
11. E. Laveuve, J.p Kéradec, M. Bensoam, “Electrostatic of wound components: analytical results, simulation

and experimental validation of the parasitic capacitance”, IEEE transactions, Industry Applications Society Annual Meeting, 1991.
12. Biela, J. W. Kolar, “Using Transformer Parasitic for Resonant Converters- A Review of the Calculation of the Stray Capacitance of Transformers”, Industry Applications Conference, Fourtieth IAS Annual Meeting, 2005.
13. J. Kolstad, C. Blevins, J. Dunn, A. Weisshaar, “ New Circuit Augmentation Method for Modeling of Interconnects and Passive Components”, IEEE Trans, Advanced packaging, Vol. 29, no.1, February 2006
14. www.emc.polito.it section IDEM®. 15. I. A. Maio, P. Savin, I. S. Stievano, F. Canavero, “
Augmented models of high frequency transformees for SMPS”, Proceeding, 20th Int. Zurich Symposium on EMC, Zurich 2009.
Figures and Table Captions
Figure 1: Example of magnetic field of railway infrastructure measured at 10 m from the centre of the rail
Figure 2: Simplified diagram of railway infrastructure Figure 3: Schematic illustration of the test bench Figure 4: Photo of the test bench Figure 5: .Impedance of the secondary winding measured
when the primary is short-circuited (15kVA power transformer)
Figure 6: Impedance of the secondary winding measured when the primary is short-circuited (2MVA power transformer)
Figure 7: High frequency equivalent circuit Figure 8: Primary winding impedance with secondary
short circuited (phase A) Figure 9: Primary winding impedance with secondary
open (phase A) Figure 10: Equivalent circuit of the leakage inductance
with skin effect. Figure 11: Measurement configuration used for
determining capacitances (phase A) Figure 12: Equivalent circuit for high frequency
behaviour: “Augmented model” Figure 13: Primary winding impedance with secondary
short circuited (Phase A) Figure 14: Primary winding impedance with the secondary
open (Phase A) Figure 15: measured output current of the power
transformer (Phase A) Figure 16: Simulated output current of the power
transformer (Phase A) Figure 17: Comparison in frequency domain between the measured and simulated output currents (Phase A) Table 1: Value of equivalent circuit of leakage inductance
with skin effect Table 2: Values of the capacitances of the equivalent
circuit of the power transformer