study and optimisation of the antennas for the iter plasma ... · two asymmetric sectoral horn...
TRANSCRIPT

1
Abstract— In ITER, the Plasma Position Reflectometry
diagnostics system will consist of five O-mode microwave reflectometers operating in the frequency range 15−75 GHz and probing the plasma at four specific locations known as gaps 3, 4, 5 and 6. The main purpose of the system is to supplement the magnetic-based plasma position control diagnostics by providing measurements of the gap distance between the first-wall and a density layer close and just inside the magnetic separatrix The originally proposed antenna front-end configuration for the PPR reflectometers consisted in a bi-static side-by-side arrangement of two asymmetric sectoral horn antennas. Here, this configuration is modelled and analysed within the 15−75 GHz frequency range, using the ANSYS HFSS (High Frequency Structure Simulator) simulation program. An extensive analysis of the antennas is performed, and the power coupling between the antennas is evaluated. The applied methodologies proved to be consistent with theoretical results, and have the potential to be used in the analysis of the new high-gain antenna front-end configurations being proposed for the PPR reflectometers. IndexTerms—Antenna, Diagnostic, Fusion, ITER, Reflectometry
I. INTRODUCTION icrowave reflectometry is a well-established fusion diagnostic system for plasma density profile
measurements and plasma positioning control. It will be used in ITER, providing a robust and reliable diagnostic, which requires little access to the machine.
Plasma position control will be essential in ITER for machine protection, preventing the plasma to impact the first wall, which can cause massive disruptions and severely damage the machine components. Usually, this is done by means of magnetic sensors and magnetic flux reconstruction. However, in ITER, the magnetic sensors can accumulate significant errors due to the long pulse discharges and the harsh environment felt inside the toroidal chamber. Within this
April, 2014. This work was supported by IPFN – Instituto de Plasmas e Fusão Nuclear, Av. Rovisco Pais, 1049-001 Lisboa (e-mail: [email protected])
Hugo Hugon is with Universidade de Lisboa - Instituto Superior Técnico, Av. Rovisco Pais, 11049-001 Lisboa (e-mail: [email protected])
context, O-mode reflectometry is used as a supplementary diagnostic, independent of the magnetic diagnostics.
The ITER Plasma Position Reflectometer (PPR) is a diagnostic system that comprises five reflectometers distributed along the toroidal chamber, probing the plasma in 4 different positions, commonly known as gaps 3, 4, 5 and 6.
The originally proposed antenna configuration for these reflectometers features a system of two side-by-side asymmetric sectoral horn antennas.
In this work, these antennas are individually studied and evaluated, and then the performance of the two-antenna arrangement is assessed.
II. THERMONUCLEAR FUSION Fusion science has been studied for decades, and it is a very
complex subject. Its feasibility is recognized, but it still requires a great amount of engineering, technological and scientific challenges.
Nuclear fusion is the fusion of two light atoms into a heavier element. This process releases energy, since the products of the reaction have less mass then the reactants. The use of this energy in a controlled environment, can result as a potentially unlimited source of energy. The focus of current fusion research is the 𝐷−𝑇 (Deuterium-Tritium) reaction:
𝐷 + 𝑇 → 𝛼 + 𝑛 + 17.6 𝑀𝑒𝑉 (1)
This reaction is easier to achieve, since it has a high
probability to occur at low energies. The energy produced is distributed in 14.1 𝑀𝑒𝑉 for the neutron (𝑛) and 3.5 𝑀𝑒𝑉 for the alpha particle (𝛼).
To produce the 𝐷−𝑇 reaction, a temperature of the order of 150 million degrees Celsius is required, which is around 10 times hotter than the plasma of the sun. At these temperatures, the fuel becomes completely ionized and turns into a plasma that can be confined by means of magnetic fields. The confinement of the plasma in a container is called thermonuclear controlled fusion. One of the most promising
Study and optimisation of the antennas for the ITER plasma-position reflectometry
diagnostics system
H. Hugon
IPFN, Instituto Superior Técnico, Avenida Rovisco Pais 1, 1049-001 Lisboa, Portugal
M

2
devices to achieve this confinement is the Tokamak, acronym for toroidal chamber and magnetic coil in Russian. A tokamak uses toroidal and poloidal magnetic fields to confine the hot plasma column inside the walls of a toroidal chamber. The combination of the toroidal and poloidal fields produces a helical trajectory magnetic field around the plasma current, trapping ions and electrons, and confining the plasma along the toroidal chamber (see Fig. 1). The goal of the tokamak is to confine the plasma for a sufficiently long time so that the ignition condition is reached and fusion reactions can occur in a self-sustained way, keeping the plasma temperature without the help of additional external heating [1].
Fig. 1. Tokamak coil system, toroidal and magnetic fields and the resultant helical plasma confinement
A. ITER ITER (International Thermonuclear Experimental Reactor)
is currently under construction. It is a big international cooperation project for the development of a fusion reactor with twice the size of the largest reactor in operation, with the participation of countries from around the world.
ITER’s scientific goal is to demonstrate the technological feasibility of fusion energy. For that, it is projected to produce 10 times more power than it consumes: 500 MW produced from 50 MW of input power.
The experience gained through the operation of ITER will be the basis for the next step in the fusion roadmap: the construction of DEMO (Demonstration power plant), a more advanced fusion reactor, which will aim at providing the first glance on the commercial use of fusion energy.
Diagnostics play an essential role in a tokamak, as they provide key measurements of the first wall and plasma parameters. The never experienced before extreme conditions in ITER make the subject of diagnostic integration a challenging process. The principal difficulties have to do with the high levels of neutron heating (around 1 MW/m3) and with the strong electromagnetic forces that can occur in the vacuum vessel. ITER diagnostics will have to be compatible with high vacuum levels, and to withstand large temperature amplitudes, high heat fluxes (in particular for components near the first wall) and high electromechanical loads. Due to the great activation levels foreseen, remote handling tools are needed
for the installation/removal of machine/diagnostic components. This harsh environment creates a difficult challenge for the longevity and reliability of diagnostics during the lifetime of ITER.
In some cases, the conditions will be so extreme, that R&D for new types of diagnostics must be done. In ITER, the overall diagnostic system will be comprised of about 50 individual systems, including magnetic, neutron, spectroscopic, bolometric, optical and microwave diagnostics. These will be installed inside and outside the vacuum vessel, in dedicated upper and equatorial ports, or in the divertor cassettes [2][3].
B. Microwave Reflectometry Microwave reflectometry is a diagnostic used to measure the electronic density of a fusion plasma. It probes the plasma using electromagnetic waves that are reflected at density layers (dependent of the wave’s frequency) where its local refractive index goes to zero. By comparing the phase of the reflected wave with a reference wave it is possible to derive the position of the density layer in the plasma. By varying the frequency of the probing wave it is possible to probe different density layers and in this way reconstruct the electronic density-position profile. This particular technique is known as broadband microwave reflectometry, widely recognized as a robust and well-validated diagnostic. Apart from its measuring capabilities, reflectometry has several features that make it attractive for future fusion devices like ITER and, in particular, DEMO. On one hand, reflectometry requires reduced machine access, which makes it an ideal candidate in view of the high neutron flux and restricted space in these machines. On the other hand, the combined simplicity and robustness of the diagnostic front-end (antennas and in-vessel waveguides) is an added value when compared to other diagnostic techniques that can provide similar measurements. The probing waves emitted by the antennas used in the ITER PPR will propagate in the plasma in O-mode propagation. Under some practical approximations to interpret the wave propagation in a dielectric medium (see [4], [5]), the expression obtained for the refractive index is given by [6]:
𝑁!! = 1 − !!"!
!!= 1 − !!
!! (2)
where 𝜔 is the probing wave frequency, 𝜔!" the plasma frequency (and cut-off frequency) and 𝑛! and 𝑛! the electron and cut-off densities. Propagation is possible for 𝜔 > 𝜔!" and 𝑛! < 𝑛!. For the case in which 𝜔 < 𝜔!", the refractive index becomes imaginary, the wave can no longer propagate and is reflected.
Using a WKB approximation, for the O-mode, the phase delay of the probing wave can be written as [7],[8]:
𝜙 𝜔 = !!(!)
! 𝑁 𝑛! 𝑧, 𝑡 ,𝜔(𝑡) 𝑑𝑧
!!!!(!)
− !! (3)
where 𝑧! is the position of the plasma’s edge, and the !
! factor
is due to the phase change at the reflection layer. This approximation is valid whenever the density gradient

3
characteristic length 𝐿 𝑧 is too large compared to the probing wave wavelength 𝜆!:
𝐿 𝑧 = !!!
!!!!"
!!≫ !!
!! (4)
The spatial resolution of the WKB method is given by the width of the reflecting layer [8]:
∆𝑧 ≅ 1,5 𝑋10! !!!
!!! !!" !!!!
!!/!
(5)
Typical values of ∆𝑧~1𝑐𝑚 are obtained for the fusion plasma density profiles of the gradient region. For the O-mode propagation, the position of the reflecting layer (𝑧 𝜔! ) can be found performing an Abel inversion on equation (3) [6]:
𝑧 𝜔! = 𝑧! −!!
𝜏 𝜔 . !"!!!!!!
!!!!
(6)
where 𝑧(𝜔!) gives the position of each critical layer, with the cut-off densities 𝜔! = 𝜔!". The group delay of the probing waves is given by 𝜏 𝜔 = !! !
!". The distance 𝑧! represents
the wave propagation in vacuum and in the transmission lines.
Fig. 2. Typical density profile of a fusion plasma. Gradient density region probed by the O-mode reflectometry
O-mode reflectometry is limited at lower frequencies, in which the wavelength is too large compared to the density gradient of (4), and therefore WKB solution loses its validity. It is limited at higher frequencies, where the density gradient becomes very large, decreasing the spatial resolution of (5) in such a way that reflectometry can no longer be used as an accurate diagnostic (see Fig.2 for a typical density profile).
C. ITER PPR The ITER Plasma Position Reflectometer (PPR) is a
diagnostic system that comprises five reflectometers distributed along the toroidal chamber, probing the plasma in four different positions, commonly known as gaps 3, 4, 5 and 6.
The primary purpose of this system is to monitor the gap distance between the first wall of the tokamak and a given density layer provided by the plasma control system.
It is a promising diagnostic, since it only requires waveguides and antennas that can be made very robust, in order to suit the ITER’s challenging environment. It is a well-known and widely studied diagnostic that provides high spatial and temporal resolutions, not perturbing the plasma in a significative way, requiring moderate access to the machine.
It will be a bi-static system, to avoid spurious reflections in the waveguides, and an heterodyne system. It will probe the plasma in O-mode propagation for a 15 − 75 𝐺𝐻𝑧 range of frequencies, which corresponds to a range of probed densities of ~0.28 − 7 𝑋10!" 𝑚!!. The good performance of the PPR is strongly influenced by the performance of the antennas, and by the power coupling between the emitting and receiving antennas, after the reflection of the probing wave in the plasma column.
The reflectometers will access the gaps through dedicated equatorial and upper port plugs installed on the tokamak. The integration of the PPR system (see Fig.3) will be made on the upper port 1 (gaps 4 and 5), upper port 14 (gap 6) and equatorial port 10 (gap 3). Gap 5 will need two reflectometers directed in different directions, due to the curved shape of the plasma in that region.
Fig. 3. Toroidal view of the port-plug installation on the ITER tokamak. Location of the PPR systems. Gaps 3-6 accesses for the ITER PPR systems using the Equatorial and Upper Ports (obtained from[10])
The systems located at gaps 4 and 6 are known as in-vessel systems, since their access to plasma will be done through small apertures between vertically adjacent blanket modules (see [9]). The antennas on gap 6 will probe the high-field side, entering the vessel through Upper Port 14, while in gap 4 they will probe the low-field side, entering the vessel through Upper Port 01. Due to geometric restrictions, and the need to protect the antennas from nuclear heating, in these systems the antennas will see the plasma through small apertures between two vertically adjacent blanket modules. Because of the small space available and the small separation between the feeding waveguides, the antennas are only flared along one direction, becoming asymmetric (see Fig. 4).

4
Fig. 4. Toroidal view of the port-plug installation on the ITER tokamak. Location of the PPR systems. Gaps 3-6 accesses for the ITER PPR systems using the Equatorial and Upper Ports (obtained from [10])
This thesis addresses the original antennae configuration of the PPR reflectometers, where a bi-static side-by-side arrangement of two asymmetrical sectoral horn antennas was proposed by ITER.
Recently, in ASDEX Upgrade, O-mode reflectometry was successfully used to track the plasma separatrix in real time (see [11]). The results obtained show the capability of reflectometry to provide measurements of the separatrix position within a 1 𝑚𝑠 cycle with an accuracy below 1 𝑐𝑚 [11]. This work was of the major importance to validate the use of reflectometry for plasma control, setting the basis for algorithm development and data acquisition specifications for the PPR system on ITER.
D. Aperture Antennas
Fig. 5. Horn antenna. Coordinate system used to describe the far-field generated at the aperture
An antenna is usually a metallic device that converts an electromagnetic wave propagating on a transmission line into a wave radiating in free-space (transmission), or vice versa (reception). Aperture antennas range from simple open waveguides to horn antennas with various shapes, and they are most commonly used in the microwave frequency range. Here, we focus on the study of pyramidal and sectoral horns, since these will be the antennas studied in the next section. A horn antenna is a microwave aperture antenna that is flared (opened from the original waveguide dimensions) into a larger dimension than the feeding waveguide. It is popular for its
simplicity, large gain and good performance. Fig.5 shows the geometrical description of a pyramidal horn flared in the x and y directions.
Horn antennas that have their aperture flared in only one direction are called sectoral horns. If the flare is in the electric field direction the antenna is called an E-plane sectoral horn. If it is flared in the magnetic field direction it is called an H-plane sectoral horn. If the antenna aperture is widened in both directions, the antenna is called a Pyramidal Horn. These antennas can operate at different modes, TE (Transverse Electric) and TM (Transverse Magnetic), which are defined by the feeding waveguides.
The radiation or antenna pattern is one of the most useful antenna describing parameters. It is “a mathematical function or a graphical representation of the radiation properties of the antenna as a function of space coordinates [12]“. The radiation pattern is commonly analyzed in the far-field region. The far-field region is the region far from the antenna aperture where the wave can be described as a plane wave only as a function of the angular coordinates, and the 𝑟 components of the electromagnetic fields are zero. It allows the analysis of several antenna parameters, such the Gain and Directivity along all the directions, Beamwidth and Side and Back-lobe level.
Fig. 6. Absolute directivity pattern of an E-sectoral horn, normalized to the maximum value
The antennas in ITER PPR will propagate the TE01 mode for O-mode reflectometry. Fig.6 shows, as an example, the 3D radiation pattern of the normalized directivity emitted from a pyramidal and a E-sectoral horn excited by the TE01 mode. In sectoral horns, the radiation pattern is wider in the direction where there is no flare, and narrower in the direction of the flare. In a two-antenna system, the coupling of the antennas is a measurement of how much power radiated (𝑃!) by an emitting antenna is captured by a receiving antenna (𝑃!). The power coupling between the antennas can be written as:
𝐶𝑜𝑢𝑝𝑙𝑖𝑛𝑔 = 10 log𝑃!/𝑃! (7)
which means that a good coupling between the antennas gives a value closer to zero. The coupling is dependent on various factors, such as:

5
-‐ Distance between the antennas -‐ Antennas orientation -‐ Directivity pattern of each antenna -‐ Polarization of each antenna -‐ Frequency of operation -‐ Radiation efficiency -‐ Aperture efficiency.
III. SIMULATIONS AND RESULTS The original antennae configuration proposed for ITER PPR
comprises two asymmetric sectoral horns, which are placed side by side separated by a small distance. In reflectometry, the probing wave of the emitting antenna will be reflected in the plasma before the receiving antenna captures it. To simulate this reality, we considered the plasma as a planar mirror, reflecting all the incoming radiation. However, instead of creating an actual mirror, we modelled the antennas in a mirror-like configuration, in such a way that the effect of the plasma reflection and the position of the antennas are recreated.
The simulation work was performed using the HFSS (High Frequency Structures Simulator). A full wave simulation program that analyses the Maxwell equations subject to boundary conditions, using a Finite Elements Method.
The initial part of the simulation work presents the study of a reference antenna. A catalogued pyramidal horn antenna. is modelled and tested in the range of frequencies of the fundamental mode (TE10), and the main antenna features are analysed. The data acquired using HFSS are compared with the catalogued characteristics of the antenna and with the results obtained from theory. The models and methods for the antenna analysis are validated in order to be used further in the evaluation of the ITER PPR antenna.
A system of two standard horn antennas is then modelled using the mirror-equivalent configuration in different geometrical setups, in order to mimic the conditions of the PPR antenna system. The data acquired in this section are important to interpret the results later achieved in the study of the coupling in the ITER PPR system.
A. Standard Horn Simulation A Standard Gain Horn antenna from the 2010 Flann
Microwave Catalogue [13] was modelled (model 17240, from the 240 series). The antenna is fed by a waveguide of dimensions 𝑎 = 19,05 𝑚𝑚, 𝑏 = 9.525 𝑚𝑚. The fundamental mode of the waveguide (TE10) lies in the frequency range 9,84 − 15,0 𝐺𝐻𝑧, within which the antenna is studied.
Fig. 7. Directivity (dB) of the standard horn for the H-plane. Comparison between two models used in HFSS and the theoretical results
The antenna has a nominal mid-band gain of 20 𝑑𝐵 and a ±2𝑑𝐵 mid-band gain variation with frequency. The voltage standing wave ratio has a maximum value tabled as 𝑉𝑆𝑊𝑅 = 1.2: 1. Fig.7 presents the comparison between the radiation pattern obtained for two different HFSS models for the antenna analysis and the theoretical results.
The radiation patterns showed a good correlation between the HFSS models and the predicted from theory, and helped to choose the most efficient HFSS model to further perform the antenna analysis. In fact, to reduce the computational weight, without losing significant accuracy in the results was one of the major concerns along this work.
Fig. 8. Directivity (dB) of the standard horn for the H-plane. Comparison between two models used in HFSS and the theoretical results
The gain of the simulated reference antenna showed to be
consistent with the predicted catalogued values, as well as the VSWR. Fig. 8 shows the gain given by HFSS within the 9,84 − 15,0 𝐺𝐻𝑧 frequency range, compared with the catalogued values.
B. Coupling Between Two Standard Horns Fig.9 exemplifies the field distribution on an emitting
antenna, free-space and receiving antenna, in an HFSS simulation.
6
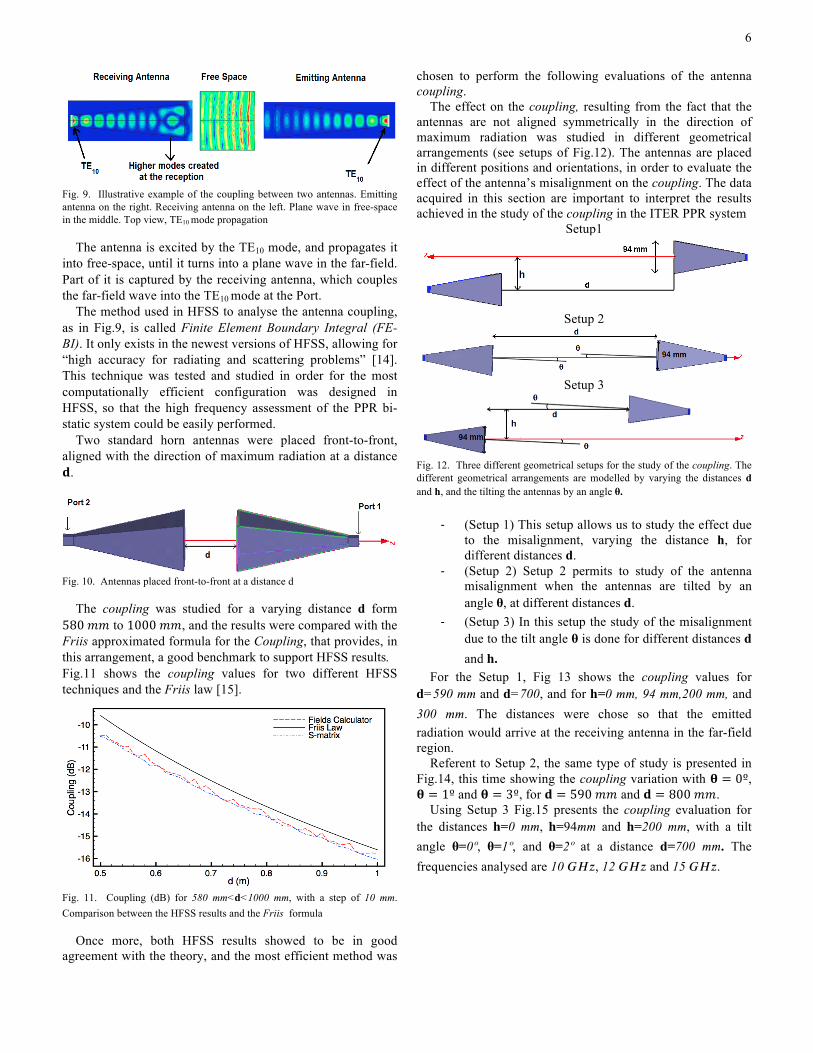
Fig. 9. Illustrative example of the coupling between two antennas. Emitting antenna on the right. Receiving antenna on the left. Plane wave in free-space in the middle. Top view, TE10 mode propagation
The antenna is excited by the TE10 mode, and propagates it into free-space, until it turns into a plane wave in the far-field. Part of it is captured by the receiving antenna, which couples the far-field wave into the TE10 mode at the Port.
The method used in HFSS to analyse the antenna coupling, as in Fig.9, is called Finite Element Boundary Integral (FE-BI). It only exists in the newest versions of HFSS, allowing for “high accuracy for radiating and scattering problems” [14]. This technique was tested and studied in order for the most computationally efficient configuration was designed in HFSS, so that the high frequency assessment of the PPR bi-static system could be easily performed.
Two standard horn antennas were placed front-to-front, aligned with the direction of maximum radiation at a distance 𝐝.
Fig. 10. Antennas placed front-to-front at a distance d
The coupling was studied for a varying distance d form 580 𝑚𝑚 to 1000 𝑚𝑚, and the results were compared with the Friis approximated formula for the Coupling, that provides, in this arrangement, a good benchmark to support HFSS results. Fig.11 shows the coupling values for two different HFSS techniques and the Friis law [15].
Fig. 11. Coupling (dB) for 580 𝑚𝑚<𝐝<1000 𝑚𝑚, with a step of 10 𝑚𝑚. Comparison between the HFSS results and the Friis formula
Once more, both HFSS results showed to be in good agreement with the theory, and the most efficient method was
chosen to perform the following evaluations of the antenna coupling.
The effect on the coupling, resulting from the fact that the antennas are not aligned symmetrically in the direction of maximum radiation was studied in different geometrical arrangements (see setups of Fig.12). The antennas are placed in different positions and orientations, in order to evaluate the effect of the antenna’s misalignment on the coupling. The data acquired in this section are important to interpret the results achieved in the study of the coupling in the ITER PPR system
Setup1
Setup 2
Setup 3
Fig. 12. Three different geometrical setups for the study of the coupling. The different geometrical arrangements are modelled by varying the distances d and h, and the tilting the antennas by an angle 𝛉.
-‐ (Setup 1) This setup allows us to study the effect due
to the misalignment, varying the distance h, for different distances d.
-‐ (Setup 2) Setup 2 permits to study of the antenna misalignment when the antennas are tilted by an angle 𝛉, at different distances 𝐝.
-‐ (Setup 3) In this setup the study of the misalignment due to the tilt angle 𝛉 is done for different distances 𝐝 and 𝐡.
For the Setup 1, Fig 13 shows the coupling values for 𝐝=590 𝑚𝑚 and 𝐝=700, and for 𝐡=0 𝑚𝑚, 94 𝑚𝑚,200 𝑚𝑚, and 300 𝑚𝑚. The distances were chose so that the emitted radiation would arrive at the receiving antenna in the far-field region.
Referent to Setup 2, the same type of study is presented in Fig.14, this time showing the coupling variation with 𝛉 = 0º, 𝛉 = 1º and 𝛉 = 3º, for 𝐝 = 590 𝑚𝑚 and 𝐝 = 800 𝑚𝑚.
Using Setup 3 Fig.15 presents the coupling evaluation for the distances 𝐡=0 𝑚𝑚, 𝐡=94𝑚𝑚 and 𝐡=200 𝑚𝑚, with a tilt angle 𝛉=0º, 𝛉=1º, and 𝛉=2º at a distance 𝐝=700 𝑚𝑚. The frequencies analysed are 10 𝐺𝐻𝑧, 12 𝐺𝐻𝑧 and 15 𝐺𝐻𝑧.

7
Fig. 13. Study of the coupling varying the distance 𝐡: 𝐡=0 𝑚𝑚,94 𝑚𝑚,200 𝑚𝑚, and 300 𝑚𝑚, for 𝐝=590 𝑚𝑚 and 𝐝=700 𝑚𝑚, at the frequencies 10 𝐺𝐻𝑧, 12 𝐺𝐻𝑧 and 15 𝐺𝐻𝑧
Fig. 14. Analysis of the coupling variation with the tilt angle: 𝛉=0º, 𝛉=1º and 𝛉=3º. The tilt angle is analysed for 𝐝=590 𝑚𝑚 and 𝐝=800 𝑚𝑚, at 10 𝐺𝐻𝑧, 12 𝐺𝐻𝑧 and 15 𝐺𝐻𝑧.
Fig. 15. Analysis of the coupling with for the distances 𝐡=0 𝑚𝑚, 𝐡=94𝑚𝑚 and 𝐡=200 𝑚𝑚, with a tilt angle 𝛉=0º, 𝛉=1º, and 𝛉=2º at a distance 𝐝=700 𝑚𝑚
The different behaviours of the coupling can be explained
by various factors, such as the decreasing of the power emitted by the antenna decreasing with 1/𝐝!, the effect of the beam narrowing with the increase of frequency, and the effect of the misalignment between the emitting and the receiving
antennas. These factors depend on the geometrical configuration of the system, the frequency of operation and the type of radiation pattern of the antennas. The detailed analysis of each and conjoined effects on the coupling is presented in the thesis.
C. PPR antenna analysis
Fig. 16. HFSS model for the ITER PPR antenna analysis
The asymmetric antenna of the ITER PPR system was modelled using the same procedures than the standard horn antenna.
The antenna was studied for the TE01 mode propagation in the frequency range 15,0−75,0 𝐺𝐻𝑧. The relevant features of the antenna analysis are:
-‐ Radiation pattern for relevant frequencies in the principal planes.
-‐ Asymmetry of the antennas. -‐ Directivity evolution with frequency. -‐ Side-lobe and back lobe levels. -‐ Half-power beamwidth. -‐ Aperture efficiency. -‐ Voltage standing wave ratio.
The directivity patterns along the H-plane at 51 𝐺𝐻𝑧 obtained using HFSS are shown in Fig.17.
Fig. 17. Directivity patterns for the H-planes of the PPR asymmetric antenna at 51 𝐺𝐻𝑧. Comparison between the results obtained in HFSS and the theoretical results
The radiation patterns obtained using HFSS showed a good agreement with theoretical results, especially in the main lobe region. The results are consistent with the ones obtained for the standard antenna analysis. Fig.18 shows the normalized

8
directivity of the asymmetric antenna in both principal planes, for some relevant frequencies.
The gain an the minor lobe number increase with frequency, and the main-lobe width decreases. The asymmetry of the radiation pattern also varies with frequency, as it can be seen in Fig.19, where the asymmetry angle is put in evidence. The deviation of the direction of maximum radiation from θ = 0º is higher around 35 − 45 𝐺𝐻𝑧, with a tilt angle of 1,4 (º).
Fig. 18. Normalized directivity pattern in the E-plane at the frequencies 15 𝐺𝐻𝑧, 30 𝐺𝐻𝑧, and at the H-plane 15GHz, 30GHz, 45 𝐺𝐻𝑧, 60 𝐺𝐻𝑧 and 75 𝐺𝐻𝑧
Fig. 19. E-plane radiation level antenna for increasing frequencies ranging from 15𝐺𝐻𝑧 to 75𝐺𝐻𝑧, zoomed in the main-lobe region. The tilt angle caused by the antenna asymmetry, and the asymmetry in the side-lobe level are put in evidence.
The VSWR was evaluated, and it displayed values below 1.2:1 between almost the entire 15-75GHz range. The aperture
efficiency showed similar results to the theoretical ones, around 80%.
The results for the HPBW show a much larger beam along the H-plane (see Fig.20). The H-plane beamwidth decreases more with the increase f frequency, decreasing from 79,3(º) at 15 𝐺𝐻𝑧 to 22,5 (º) at 75 𝐺𝐻𝑧. In the E-plane, the beamwidth decreases from 33,0(º) at 15 𝐺𝐻𝑧 to 7,4(º) at 75 𝐺𝐻𝑧.
Fig. 20. Analysis of the PPR antenna HPBW variation with frequency for the E and H-planes, within the whole frequency range (15−75 𝐺𝐻𝑧)
Fig. 21. Maximum gain of the PPR antenna for the frequencies 15−75𝐺𝐻𝑧
The maximum gain (Fig. 21) increases monotonically with frequency. The values of the gain at the band extremes and at mid-band are:
-‐ 9,7 𝑑𝐵 at 15 𝐺𝐻𝑧 (beginning of the band); -‐ 18,9 𝑑𝐵 at 45 𝐺𝐻𝑧 (mid-band); -‐ 23,1 𝑑𝐵 at 75 𝐺𝐻𝑧 (end of the band);
The side-lobe level is higher in the E-plane, and doesn’t vary much with frequency, with the values lying between −10,9 𝑑𝐵 and −14,3 𝑑𝐵. In the E-plane, the difference between the side-lobe levels in both sides of the main-lobe is small in the whole frequency range, but more significant between 35𝐺𝐻𝑧 and 60𝐺𝐻𝑧, where the antenna asymmetry is higher.

9
D. Study of the PPR Bi-static System
Fig. 22. Figure 1 – Left: TE01 mode propagation for the O-mode PPR, where the probing wave electric field is parallel to the toroidal field. Right: TE10 mode distribution at the antenna port. The arrows point the direction of the electric field, and the red colour indicates higher intensity
The coupling of the PPR antennas was studied in the originally proposed arrangement between 15 GHz and 75 GHz. The antennas are placed side by side, separated by a distance of 6 𝑚𝑚.
The antennas were placed in a mirror-equivalent configuration, where the effect of the plasma as a reflecting surface is substituted by an equivalent geometrical setup (see Fig. 23).
Fig. 23. Mirror and mirror-equivalent configuration for the analysis of the coupling of the ITER PPR antennas. The antennas are at a distance d from the plasma (mirror). The centre of the apertures are separated by a distance h=28mm
This equivalent setup was validated by comparing the
values of the coupling with the setup with the actual mirror for a given frequency range. The results were similar, and the equivalent setup was used since it proved to be more efficient in terms of RAM usage in the simulations. Fig. 24 shows the coupling between the PPR antennas within the 15 − 75 𝐺𝐻𝑧 frequency range for the TE01 mode propagation, at a distance 𝐝 = 200𝑚𝑚 from the plasma. This distance is considered representative of the space between the antennas and the plasma’s edge, where the wave is reflected.
Fig. 24. Coupling between the ITER PPR antennas for the 15−75 𝐺𝐻𝑧 frequency range, at a distance from the reflecting layer 𝐝=200 𝑚𝑚
In a general overview, the coupling increases from its lowest value of -28,3 dB at 15 GHz to its highest value of -25,7 dB at 26 GHz. Then, it decreases with abrupt variations from 26 GHz to 75 GHz. At the end of the frequency band, the coupling values are similar to the ones at the beginning of the band. The simulation noise increases at higher frequencies. The major coupling variations are observed within the 60 − 75𝐺𝐻𝑧 range, where the results are still preliminary and inconclusive, since the full capabilities of HFSS could not be used due to RAM limitations.
Fig. 25. Electric field distribution at the emitting and receiving antenna for the TE01 mode propagation
The general behavior of the coupling can be explained using the results obtained for the standard coupling analysis. However, the localized behavior of the coupling, mainly the sudden coupling drop at 35,5GHz, is explained through the propagation of higher modes (see Fig. 25), and consequent decrease on coupling for the TE01 mode. It was noted that above the 35 𝐺𝐻𝑧 the effect of the propagation of higher modes in both emitting and receiving antennas starts to have a more relevant role on the coupling. The sudden character of the appearance of these modes may explain why the coupling starts varying so abruptly from 36 𝐺𝐻𝑧 to 75 𝐺𝐻𝑧, as opposed to the smoothness verified in the variation of the coupling from 15 𝐺𝐻𝑧 to 35 𝐺𝐻𝑧. We found that, above 25 GHz to 75 GHz, the TE11 mode could propagate in the emitting antenna. Fig. 26 shows the power transfer between the TE01 and the TE11 mode. At the receiving antenna the effect of the propagation of higher modes is even more complex, since it

10
takes in account the wave reflections and the phase and field distributions of the plane wave arriving at the antenna’s mouth
Fig. 26. Percentage of power transferred by the TE01 mode to the TE11 mode from the Port to the mouth of the emitting antenna
IV. CONCLUSION HFSS showed to be a very powerful tool for antenna and
waveguide analysis. The methods herein presented were developed in a workspace where every variable is changeable, from the antenna dimensions and orientations to the size of the radiation boundaries or distances between the antennas. The development of this workspace creates the conditions to analyse any type of aperture antenna, and any type of bi-static system of aperture antennas, the same way the PPR and the standard horn antennas were studied in this thesis.
One of the major problems we had to deal concerning HFSS was the large computational requirement for complex simulations at higher frequencies. Great part of the simulation work consisted in finding ways to reduce the computational effort in the models, without loosing accuracy in the results.
In order to overcome this problem, a new computer with more RAM and a better processing unit has already been ordered. This will allow us to compute the PPR antenna coupling of Fig.24, using all the capabilities of HFSS within the 60−75 𝐺𝐻𝑧 frequency range, what was not possible with the current machine. search for the best antennae configuration to be used in ITER reflectometry is in continuous development.
The most recent proposition for the antennae configuration of the ITER PPR is represented on Fig.27. The probing wave emission this system will use an antenna with a higher gain than the asymmetric antennas originally proposed. For the wave reception the system will consist in a two-mirror receiving arrangement, which has the function of focusing the radiation into a receiving open-ended waveguide. We intend to continue the research and perform the study and evaluation of the current configuration of the ITER PPR where the major challenges are expected to arise in the modelling and optimisation of the two-mirror system. To perform this study, we will apply the same methodology and the know-how acquired along the development of this thesis.
Fig. 27. Currently proposed system for the ITER O-mode PPR. Sectoral horn as the emitting source. Two focusing mirrors and an open-ended waveguide as the receiving source.
REFERENCES [1] – Freidberg, J., Plasma Physics and Fusion Energy, Cambridge University Press, New York, USA, 2007. [2] – Costley, A. E., et al., “Technological challenges of ITER Diagnostics”, Fusion Engineering and Design, 74, 2005, pp. 109–119. [3] – Donné, A. J. H. et al., “Diagnostics”, IOP Nucl. Fusion, 47, 2007, pp.337–384. [4] – Silva, A., The ASDEX Upgrade broadband microwave reflectometry system, PhD Thesis, Universidade Técnica de Lisboa, Instituto SuperiorTécnico, Dec. 2006. [5] – Santos, J., Fast reconstruction of reflectometry density profiles on ASDEX Upgrade for plasma position feedback purposes, PhD Thesis, Universidade Técnica de Lisboa, Instituto Superior Técnico, May 2008. [6] – Hutchinson, I. H., Principles of Plasma Diagnostics, Cambridge University Press, New York, USA, 2002. [7] – Luhmann, N. C. et al., “Microwave Diagnostics”, Fusion Science and Technology, Vol. 53 ,Feb. 2008, pp. 335-396. [8] – Ginzburg, V. L., Propagation of Electromagnetic Waves in Plasmas, Gordon and Breach, New York,1961. [9] – Vayakis, G., et al., “Status and prospects for mm-wave reflectometry in ITER”, IOP Nucl. Fusion, 46, 2006, pp.836–845. [10] – Varela, P. et. al., Final Report ITER Diagnostic, Procurement Package 1 EFDA Contract No.06G1449, Instituto de Plasmas e Fusão Nuclear – Associação EURATOM/IST, May 2011. [11] – Manso, M.; Santos, J., et al., "Reflectometry-based plasma position feedback control demonstration at ASDEX Upgrade”, IOP Nucl. Fusion, 52, 032003, 2012. [12] – Balanis, A. C., Modern Antenna Handbook, John Wiley & Sons, Inc., New York, USA, 2008. [13] – Flann Microwave Catalogue, Flann Microwave Limited ®, 2010. [14] – © Ansys, Inc., HFSS for Electrically Large Antenna System Design: Hybrid Simulation Technology, November 2012. [15] – Friis, H. T., “A Note on a Simple Transmission Formula”, Proceedings of the I.R.E. and waves and electrons, 1946, pp. 254-256.