student’s t – distribution introduction · t = 307.2 , t2 = 5994.24 . a) calculate a 95%...
TRANSCRIPT

Created by T. Madas
Created by T. Madas
STUDENT’S
t – DISTRIBUTION
INTRODUCTION

Created by T. Madas
Created by T. Madas
Question 1 (**)
The weights, in grams, of ten bags of popcorn are shown below
91, 101, 98 , 98 , 103 , 97 , 102 , 105 , 94 , 90 .
a) Find a 95% confidence interval for the mean weight of a bag of popcorn.
The seller of the popcorn claims that the mean weight of the bags is 100 grams.
b) Test at the 5% level of significance whether there is evidence that the bags of
popcorn bought from this particular seller are underweight.
c) State clearly any assumptions made.
( )94.29,101.51 , not significant, 1.317 1.833− > −

Created by T. Madas
Created by T. Madas
Question 2 (**)
It is claimed by a school that the typical waiting time to see a teacher in a parents’
evening is 5 minutes.
In a recent parents’ evening one of the parents recorded the waiting time, in minutes,
for each of his son’s 9 teachers. His results are shown below
4 , 12 , 9 , 7 , 7 , 6 , 8 , 7 , 8 .
a) Find a 90% confidence interval for the mean waiting time in a parents
evening in that school.
b) Test at the 1% level of significance whether there is evidence that the mean
waiting time in a parents evening in that school is higher than 5 minutes.
c) State clearly any assumptions made.
( )6.20,8.91 , significant, 3.507 2.896>
Created by T. Madas
Created by T. Madas
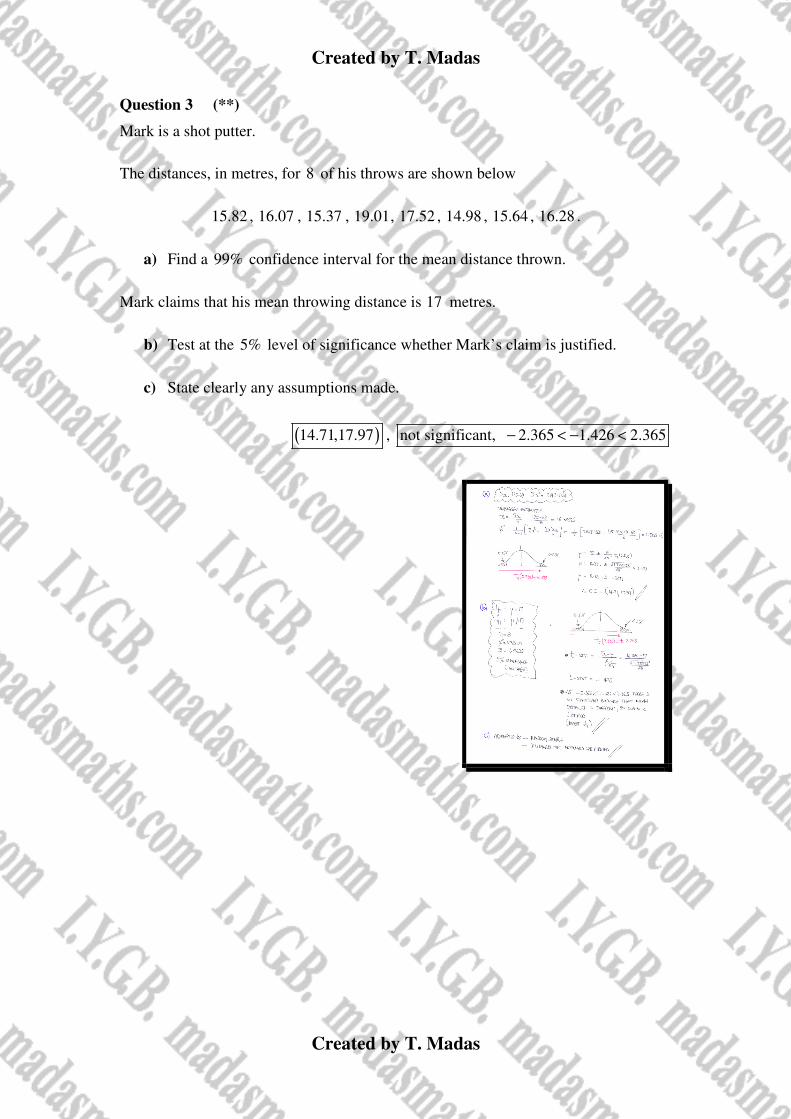
Question 3 (**)
Mark is a shot putter.
The distances, in metres, for 8 of his throws are shown below
15.82 , 16.07 , 15.37 , 19.01, 17.52 , 14.98 , 15.64 , 16.28 .
a) Find a 99% confidence interval for the mean distance thrown.
Mark claims that his mean throwing distance is 17 metres.
b) Test at the 5% level of significance whether Mark’s claim is justified.
c) State clearly any assumptions made.
( )14.71,17.97 , not significant, 2.365 1.426 2.365− < − <

Created by T. Madas
Created by T. Madas
Question 4 (**)
Joe disagrees with the statement made on the label of a packet of crisps, which states
that the net content is 40 grams.
He weighs the content, x grams, of 10 randomly chosen packets of these crisps.
His results are summarized below.
10
387.5x = and 2
10
15096.25x =
Test, at the 5% level of significance, whether there is evidence to support Joe's belief.
FS2-O , not significant, 2.262 1.3206... 2.262− < − <

Created by T. Madas
Created by T. Madas
Question 5 (**+)
An industrial wood shredder must be rested for a minimum period of 20 minutes
after a set usage time. The times of these rest brakes are thought to be modelled by a
Normal variable T , with mean µ and standard deviation σ .
16 random of values of T are summarized below.
307.2t = , 2 5994.24t = .
a) Calculate a 95% confidence interval for µ .
For the shredder to be operated correctly, µ should not be less than 20 minutes.
b) Test at the 5% level of significance whether the shredder is operated correctly.
( )17.85,20.55 , not significant, 1.265 1.753, correctly operated− > − ∴

Created by T. Madas
Created by T. Madas
Question 6 (**+)
In the main road, passing through the village of Cockfosters, the speed limit is 30
mph, however a speed measuring device indicated that the mean driving speed
through the village was 37.2 mph.
In an attempt to reduce these excessive driving speeds a carton real size model of a
police officer was placed by the side of the road, in the approach to the village.
The speeds, X mph, of a random sample of 12 vehicles were subsequently measured
yielding the following summary statistics.
12
1
411i
i
x
=
= ( )
12
2
1
134.75i
i
x x
=
− =
Stating your hypotheses clearly, carry out a suitable test, at the 1% level of
significance, to determine whether there has been a reduction in the mean speed of the
vehicles passing through the village, after the placement of the police officer model.
FS2-K , significant, 2.920 2.718− < −

Created by T. Madas
Created by T. Madas
Question 7 (***)
A machine packs peas into bags with mean weight µ grams.
The weights, in grams, of a random sample of 8 bags is shown below.
455.0 , 454.1, 453.9 , 456.2 , 454.5 , 453.7 , 454.3, 453.3.
a) Assuming the standard deviation of the weights of all bags packed by the
machine is 2 grams, find a 99% confidence interval for µ .
b) Given instead that the standard deviation of the weights of all bags packed by
the machine is unknown, find another 99% confidence interval for µ .
FS2-L , ( )452.6,456.2 , ( )453.3,455.5

Created by T. Madas
Created by T. Madas
Question 8 (***)
A coffee machine, placed in the waiting room of a garage, dispenses coffee into cups.
The volume of the coffee in a cup is Normally distributed with mean 250 ml .
The manager of the garage claims that the mean volume of coffee in a cup is no
longer 250 ml due to the age of the machine.
He records the volume, x ml , of 10 randomly selected cups, producing the following
summary statistics.
10
1
2390i
i
x
=
= and
102
1
574495i
i
x
=
= .
a) Test, at the 5% significance level, the garage manager's claim.
b) Carry another test, at the 5% significance level, if instead the garage manager
claimed that the mean amount of coffee dispensed by the machine in every cup
is less than 250 ml .
FS2-M , not significant evidence, 1.821 2.262− > − ,
not significant evidence, 1.821 1.833− > −

Created by T. Madas
Created by T. Madas
STUDENT’S
t – DISTRIBUTION
TWO SAMPLE t–TEST

Created by T. Madas
Created by T. Madas
Question 1 (**+)
A Mathematics exam was given to the Year 8 pupils of a certain school.
The percentage marks for some of the boys and some of the girls that sat this exam
are given below.
Boys: 67 , 72 , 56 , 91, 55 , 68 , 55 , 45 , 80 .
Girls: 58 , 97 , 65 , 69 , 57 , 57 , 77 , 69 .
The Head of Maths thinks that the Year 8 boys have a different mean mark than the
Year 8 girls.
Test, at the 5% level of significance, whether the claim of the Head of Maths is
justified. State your hypotheses clearly, stating any additional assumptions made.
FS2-Q , not significant, 2.131 0.470 2.131− < − <

Created by T. Madas
Created by T. Madas
Question 2 (**+)
A decathlete feels that his throwing distances have a higher mean this season than the
previous one.
Two samples for his throwing distances, in m , for the last two seasons are shown in
the table below.
Last season: 61.37 , 57.29 , 66.56 , 60.91 , 59.95 , 61.10 , 59.59 , 65.45 .
This season: 58.99 , 66.97 , 70.55 , 69.02 , 59.54 , 68.22 , 68.36 .
Assuming the throwing distances considered for each season are random, test at the
5% level of significance, whether the mean throwing distances of the decathlete have
improved this season. State your hypotheses clearly, stating any additional
assumptions made.
significant, 2.192 1.771>

Created by T. Madas
Created by T. Madas
Question 3 (***)
A Mathematics exam was given to the Year 11 pupils of a certain school.
The marks for some of the boys and some of the girls that sat this exam are given in
the table below.
Boys: 67 , 62 , 56 , 91, 55 , 68 , 55 , 45 , 80 .
Girls: 68 , 87 , 55 , 69 , 79 , 70 , 77 , 69 .
The Head of Maths thinks that the mean of the Year 11 girls is more than 5 marks
higher than the mean of the Year 11 boys.
Test, at the 10% level of significance, whether the claim of the Head of Maths is
justified. State your hypotheses clearly, stating any additional assumptions made.
FS2-U , not significant, 0.408 1.341<

Created by T. Madas
Created by T. Madas
Question 4 (***)
A factory produces batteries which are claimed to have a mean lifetime of 40 hours.
The mean lifetime of a battery, in hours, is assumed to be a Normal variable, and it is
denoted by X . The factory uses two identical machines for the battery manufacture.
The manager of the factory tests a random sample of 10 batteries produced by
machine A , and the results are summarized below.
378A
x = , 2 14598A
x = .
a) Carry out a one tail test, at the 10% level of significance, to check whether the
claim of the factory is justified.
The manager of the factory next tests a random sample of 12 batteries produced by
machine B , and these results are summarized below.
495B
x = , 2 20988B
x = .
b) Test, at the 10% level of significance, whether the mean battery lifetime
differs between the two machines, stating any additional assumptions made.
c) Make a criticism of one of the assumptions made in part (b)
FS2-I , not significant, 1.186 1.383− > − , not significant, 1.725 1.216 1.725− < <

Created by T. Madas
Created by T. Madas
STUDENT’S
t – DISTRIBUTION Difference of Means Confidence Interval

Created by T. Madas
Created by T. Madas
Question 1 (**+)
The table below shows the fuel consumption in mpg for a random sample of 11 cars
with a 2 litre engine and a random sample of 9 cars with a 1.6 litre engine.
2 litre engine 35.6 37.6 32.3 35.0 31.7 36.5 32.5 36.6 28.7 33.4 37.1
1.6 litre engine 28.1 37.2 35.6 31.1 30.8 29.5 33.4 31.6 30.8
Assuming that these samples come from populations with equal variance, find a 90%
confidence interval for the difference in mean fuel consumption between cars with a
2 litre engine and cars with a 1.6 litre engine.
( )0.054,4.470

Created by T. Madas
Created by T. Madas
Question 2 (**+)
The table below shows the lengths jumped by a triple jumper for a random sample of
6 attempts this year and the lengths jumped by the same triple jumper for a random
sample of 4 attempts last year.
Jumps this Year (m) 14.48 15.08 13.88 13.50 15.68 15.77
Jumps last Year (m) 15.45 12.32 13.69 14.25
Assuming that the variances in the lengths of the triple jumper in both years are
identical, find a 99% confidence interval for the difference in the mean length of the
jumps of the athlete between this year and last year.
FS2-J , ( )1.55,3.16−

Created by T. Madas
Created by T. Madas
Question 3 (***)
The effectiveness of two teaching systems for learning Spanish, A and B , is to be
compared using 9 randomly chosen suitable adults.
5 of these adults are allocated system A and 4 are allocated system B .
After a suitable testing period, all 9 are given the same test and information about
their scores, A
x and B
x , is given below.
52A
x = , 56.5B
x = , ( )2
248.0A A
x x− = , ( )2
381.0B B
x x− = .
It is assumed that A
X and B
X follow normal distributions with identical variance.
Determine an 80% confidence interval for the difference in the population scores
using the two methods.
( ) ( )4.50,13.50 or 13.50,4.50− −

Created by T. Madas
Created by T. Madas
STUDENT’S
t – DISTRIBUTION
PAIRED t–TEST

Created by T. Madas
Created by T. Madas
Question 1 (**+)
Research is conducted to investigate the effect of consumption of small amounts of
alcohol in driving, by measuring the reaction times of 10 drivers before and after
consuming one pint of beer. The results are summarised below.
Driver A B C D E F G H I J
Reaction Time Before (sec) 0.6 0.7 0.4 0.5 0.6 0.8 0.3 1.0 0.3 0.2
Reaction Time After (sec) 0.7 0.6 0.7 0.6 0.6 0.7 0.7 1.0 0.7 0.6
Test, at the 5% level of significance, whether the consumption of one pint of beer
appears to increase the reaction time of drivers, stating any assumptions used.
FS2-B , significant, 2.293 1.833>

Created by T. Madas
Created by T. Madas
Question 2 (**+)
An Examining Board claims that their 2 Mathematics papers had identical grade
boundaries for achieving the top grade.
The head of Mathematics of a large school decides to test this claim by looking at a
random sample of 10 students from this school, whose marks were in the region of
the top grade.
The percentage marks in each of the 2 papers for these 10 students are shown below.
Student A B C D E F G H I J
Percentage mark in paper A 91 85 81 90 78 82 71 88 75 94
Percentage mark in paper B 85 86 82 80 80 83 72 84 70 90
Test, at the 10% level of significance, the Examining Board's claim
FS2-P , not significant, 1.833 1.793 1.833− < <

Created by T. Madas
Created by T. Madas
Question 3 (**+)
A nutritional researcher is investigating the effect of dieting literature in promoting
weight loss in overweight individuals.
The weights of random sample of 9 subjects were recorded, then they were given the
dieting literature, and their weights were recorded again 9 weeks later.
The results are shown below.
Subject A B C D E F G H I
Weight Before (kg) 95.2 96.0 100.2 88.2 91.7 85.0 74.3 83.7 87.0
Weight After (kg) 93.1 95.1 98.1 90.7 90.6 87.2 71.3 80.1 89.1
Test, at the 10% level of significance, whether there is evidence that the dieting
literature has some effect in promoting weight loss.
FS2-N , not significant, 0.8499... 1.397<

Created by T. Madas
Created by T. Madas
Question 4 (**+)
Five randomly chosen pairs of identical twins were each given the same puzzle to
solve, and the times taken, in seconds, are summarized in the table below.
Twins A B C D E
Time for first twin (sec) 37 41 58 18 29
Time for second twin (sec) 42 38 49 9 30
Test, at the 20% level of significance, whether there is a difference in the mean time
taken to solve a puzzle, among identical twins, stating clearly any assumptions made.
FS2-E , not significant, 1.533 1.088 1.533− < <

Created by T. Madas
Created by T. Madas
Question 5 (**+)
Two juice extracting machines are tested by a consumer magazine.
Eight oranges are cut in half and one half has its juice extracted by machine 1 and the
other half has its juice extracted by machine 2 .
The amounts of juice extracted, in ml, are summarised in the table below.
Orange A B C D E F G H
Machine 1 75 67 69 80 77 71 67 80
Machine 2 76 70 67 79 82 76 73 77
Test, at the 5% level of significance, whether there is a difference in the amount of
juice extracted between the two machines, stating any assumptions made.
FS2-H , not significant, 2.365 1.416 2.365− < <

Created by T. Madas
Created by T. Madas
Question 6 (**+)
A new track surface is developed which is claimed to decrease the times of 100 m
sprinters, compared with the old track surfaces currently used. To investigate this
claim, the performances of 9 randomly chosen sprinters are measured on both
surfaces. The results are summarised below.
Sprinter A B C D E F G H I
Time on Old Surface (sec) 10.7 11.2 11.5 10.9 11.8 12.0 10.6 13.1 12.1
Time on New Surface (sec) 10.8 11.0 11.4 11.1 11.4 11.6 10.7 12.5 12.5
Test, at the 2.5% level of significance, the claim about the new track surface.
FS2-R , not significant, 2.306 < 0.915 2.306− <