structures and electronic states of small group 3 metal …
TRANSCRIPT

University of Kentucky University of Kentucky
UKnowledge UKnowledge
Theses and Dissertations--Chemistry Chemistry
2014
STRUCTURES AND ELECTRONIC STATES OF SMALL GROUP 3 STRUCTURES AND ELECTRONIC STATES OF SMALL GROUP 3
METAL CLUSTERS METAL CLUSTERS
Lu Wu University of Kentucky, [email protected]
Right click to open a feedback form in a new tab to let us know how this document benefits you. Right click to open a feedback form in a new tab to let us know how this document benefits you.
Recommended Citation Recommended Citation Wu, Lu, "STRUCTURES AND ELECTRONIC STATES OF SMALL GROUP 3 METAL CLUSTERS" (2014). Theses and Dissertations--Chemistry. 32. https://uknowledge.uky.edu/chemistry_etds/32
This Doctoral Dissertation is brought to you for free and open access by the Chemistry at UKnowledge. It has been accepted for inclusion in Theses and Dissertations--Chemistry by an authorized administrator of UKnowledge. For more information, please contact [email protected].

STUDENT AGREEMENT: STUDENT AGREEMENT:
I represent that my thesis or dissertation and abstract are my original work. Proper attribution
has been given to all outside sources. I understand that I am solely responsible for obtaining
any needed copyright permissions. I have obtained needed written permission statement(s)
from the owner(s) of each third-party copyrighted matter to be included in my work, allowing
electronic distribution (if such use is not permitted by the fair use doctrine) which will be
submitted to UKnowledge as Additional File.
I hereby grant to The University of Kentucky and its agents the irrevocable, non-exclusive, and
royalty-free license to archive and make accessible my work in whole or in part in all forms of
media, now or hereafter known. I agree that the document mentioned above may be made
available immediately for worldwide access unless an embargo applies.
I retain all other ownership rights to the copyright of my work. I also retain the right to use in
future works (such as articles or books) all or part of my work. I understand that I am free to
register the copyright to my work.
REVIEW, APPROVAL AND ACCEPTANCE REVIEW, APPROVAL AND ACCEPTANCE
The document mentioned above has been reviewed and accepted by the student’s advisor, on
behalf of the advisory committee, and by the Director of Graduate Studies (DGS), on behalf of
the program; we verify that this is the final, approved version of the student’s thesis including all
changes required by the advisory committee. The undersigned agree to abide by the statements
above.
Lu Wu, Student
Dr. Dong-Sheng Yang, Major Professor
Dr. Dong-Sheng Yang, Director of Graduate Studies

STRUCTURES AND ELECTRONIC STATES OF SMALL GROUP 3 METAL
CLUSTERS
DISSERTATION
A dissertation submitted in partial fulfillment of the
requirements for the degree of Doctor of Philosophy in the
College of Arts and Sciences
at the University of Kentucky
By
Lu Wu
Lexington, Kentucky
Director: Dr. Dong-Sheng Yang, Professor of Chemistry
Lexington, Kentucky
2014
Copyright © Lu Wu 2014

ABSTRACT OF DISSERTATION
STRUCTURES AND ELECTRONIC STATES OF SMALL GROUP 3 METAL
CLUSTERS
Group 3 metal clusters are synthesized by laser vaporization in a pulsed cluster beam
source and identified with laser ionization time-of-flight mass spectrometry. The adiabatic
ionization energies and vibrational frequencies of these clusters are measured using mass-analyzed
threshold ionization (MATI) spectroscopy. Their structures and electronic states are determined
by combining the MATI spectra with quantum chemical calculations and spectral simulations. This
dissertation focuses on the study of several small molecules, which include LaO2, La2, M2O2, M3O4,
M3C2, and La3C2O, where M = Sc, Y, and La. Except for La2, these molecules exhibit strong ionic
characters between the metal and oxygen or carbon atoms and can be described as [O-][La2+][O-],
[M2+]2[O2-]2, [M8/3+]3[O2-]4, [M2+]3[C3-]2, and [La8/3+]3[C3-]2[O2-]. The interactions between the
metal atoms form covalent bonds, which can be described by a triple bond in La2, a two-center two
electron bond in M2O2, a three-center one electron bond in M3O4, and a three-center three electron
bond in M3C2. In addition, the electron in the non-bonding highest occupied molecular orbital
(HOMO) is localized in the La 6s orbital in LaO2 and La3C2O. The ground states of these molecules
are all in low electron-spin states with the spin multiplicities of 1 or 2. Although the ground
electronic state of LaO2 is a linear structure, the excited quartet state of the molecule is determined
to be a bent structure. M2O2 and M3O4 have the planar rhombic and cage-like structures,
respectively; whereas M3C2 has a trigonal bipyramid structure. La3C2O is formed by oxygen
binding with two La atoms of La3C2. Ionization removes a metal-based (n+1)s electron in all

neutral molecules, and the resultant ions have similar geometries to those of the corresponding
neutral states. In the case of La2, additional ionization of a La 5d electron is also observed.
KEYWORDS: MATI spectroscopy, metal oxides, metal carbides, adiabatic ionization energy,
quantum mechanical calculations
Lu Wu
Student’s Signature
Febrary,25, 2014
Date

STRUCTURES AND ELECTRONIC STATES OF SMALL GROUP 3 METAL
CLUSTERS
By
Lu Wu
Director of Graduate Studies
Director of Dissertation
Date

STRUCTURES AND ELECTRONIC STATES OF SMALL GROUP 3 METAL
CLUSTERS
Lu Wu
The Graduate School
University of Kentucky
2014

iii
ACKNOWLEDGEMENT
I am grateful that I have met so many kind and helpful people during my graduate
studies. I would like to thank my advisor, committee members, lab mates, friends and
family for their support.
I would like to express my deepest gratitude to my advisor, Dr. Dong-Sheng Yang,
for his excellent guidance, patience, compassion and providing me courage and freedom
to learn different skills in the lab. He has been a wonderful mentor during my graduate
studies. Without his guidance and help, I would never have been able to finish my
dissertation. His wisdom, tolerant support, and guidance inspired and motivated me and
will always do so in the future.
I am deeply grateful to my advisory committee members for their kind attention
and valuable suggestions. Dr. Dennis J. Clouthier and Dr. John P. Selegue have taught me
the fundamental knowledge in spectroscopy and inorganic chemistry. Their insights
comments and broad knowledge have impressed me and provide me with new scopes of
my projects. Dr. Chang-Guo Zhan has given me helpful opinions about the theoretical
calculations. Their careful supervision, constructive comments and generous support have
been essential for my doctoral program.
In addition, I have greatly benefited from the friendship and discussion with many
current and previous group members. I would like to express my acknowledgement to Dr.
Yuxiu lei, Dr. Serge Krasnokutski, Dr. Bradford R. Sohnlein, Dr. Shenggang Li, Dr. Jung
Sup Lee, Dr. Changhua Zhang, Dr. Yang Liu, Dr. Mourad Roudjane, Dr. Silver Ruchira,

iv
Dr. Beni Dangi, Dr. Sudesh Kumari, Ms. Dilrukshi Hewage, Mr. Wenjing Cao, Mr. Tao
Jin, and Mr. Yuchen Zhang. I have learned a lot from their professional opinions and
discussion. I will always treasure the great pleasant and wonderful experience of working
with them.
Moreover, my special and deepest appreciation goes to my parents. Although they
do not understand what I am doing, they are always my unconditional supporters of my
work. It was their encouragements that help me carry on even in my difficult times.
During my graduate studies, I have experienced and learned so much that I have
never imagined before. I have gained the confidence to face and overcome any difficulties.
I will always remember the life and research experience in the University of Kentucky.
This work is dedicated to all of my teachers, friends, and family.

v
LIST OF ABBREVIATIONS
The following table describes the significance of various abbreviations and used
throughout the thesis. The page on which each one is defined or first used is also given.
Abbreviations Meaning Page
PES photoelectron spectroscopy 2
TPES threshold photoelectron spectroscopy 2
MATI mass-analyzed threshold ionization 4
VUV vacuum ultraviolet 5
UV ultraviolet 5
EUV extreme ultraviolet 5
EA electron affinity 5
AIE adiabatic ionization energy 6
PFI-ZEKE pulsed field ionization zero energy kinetic electron 6
FCF Franck-Condon factor 9
SCF self-consistent field 12
DFT density functional theory 11
CI configuration interaction 15
CSF configuration state function 15
CISD configuration interaction with singly and doubly excitation 16
MPn Møller-Plesset perturbation 16
B3LYP DFT method with Becke’s three parameter hybrid functional
with the correlation functional of Lee, Yang and Parr
18
CC Coupled cluster 19
CCSD Coupled cluster method with singly and doubly excitation 19
CCSD (T) Coupled cluster method with singly and doubly excitation and
perturbed triply excitation term
19
CASSCF Complete active space SCF 19
LCAO Linear combination of atomic orbitals 19
MCSCF Multi-configuration SCF 20
MRCI Multi-reference SCF 20
CASPT2 Complete active space with second order perturbation theory 20
MCP Multichannel plate 28
TOF Time-of-flight 28
PIE Photoionization efficiency 31
ECP Electron core potential 36
vi
TABLE OF CONTENTS
ACKNOWLEDGEMENT ................................................................................................ III
LIST OF ABBREVIATIONS ............................................................................................ V
TABLE OF CONTENTS .................................................................................................. VI
LIST OF TABLES ............................................................................................................ IX
LIST OF FIGURES ......................................................................................................... XII
CHAPTER 1 INTRODUCTION ........................................................................................ 1
1.1 PES MEASUREMENTS .......................................................................................... 4
1.1.1 Conventional PES .............................................................................................. 5
1.1.2 PFI-ZEKE and MATI spectroscopy .................................................................. 6
1.2 THEORETICAL CALCULATIONS ........................................................................ 9
1.2.1 ab initio calculations ........................................................................................ 10
1.2.2 Hartree-Fock theory ......................................................................................... 11
1.2.3 Configuration interaction (CI) theory .............................................................. 15
1.2.4 Møller-Plesset perturbation (MPn) theory ....................................................... 16
1.2.5 Density functional theory (DFT) ..................................................................... 17
1.2.6 Coupled-cluster (CC) theory ............................................................................ 18
1.2.7 Multi-reference theories ................................................................................... 19
1.3 SPECTRAL SIMULATIONS ................................................................................. 20
1.3.1 Franck-Condon principle ................................................................................. 20
1.3.2 Calculation of multidimensional FCF .............................................................. 22
1.4 OVERVIEW OF THESIS ....................................................................................... 23
CHAPTER 2 METHODOLOGY ..................................................................................... 25
2.1 EXPERIMENTS ..................................................................................................... 25
2.1.1 Experimental setups ......................................................................................... 25
2.1.2 TOF mass spectrometry ................................................................................... 29
2.1.3 Photoionization efficiency (PIE) spectroscopy ................................................ 31
2.1.4 ZEKE and MATI spectroscopy ....................................................................... 32
2.1.5 Timing sequence and ion characterization ....................................................... 34
2.2 THEORETICAL CALCULATIONS ...................................................................... 35
CHAPTER 3 MASS-ANALYZED THRESHOLD IONIZATION AND EXCITED
STATE OF LANTHANUM DIOXIDE............................................................................ 40
3.1 INTRODUCTION ................................................................................................... 40

vii
3.2 EXPERIMENTAL AND COMPUTATIONAL METHODS ................................. 43
3.2.1 Experimental .................................................................................................... 43
3.2.2 Computational .................................................................................................. 44
3.3 RESULTS AND DISCUSSION ............................................................................. 46
3.3.1 MATI spectrum ................................................................................................ 46
3.3.2 Low-lying electronic states of lanthanum dioxide (OLaO), lanthanum peroxide
(La(O2)), lanthanum superoxide (LaOO), and their cations ..................................... 48
3.3.3 Ionization of an excited state of lanthanum dioxide (OLaO) .......................... 49
3.4 CONCLUSIONS ..................................................................................................... 53
CHAPTER 4 ELECTRONIC STATES AND SPIN-ORBIT SPLITTING OF
LANTHANUM DIMER ................................................................................................... 60
4.1 INTRODUCTION ................................................................................................... 60
4.2 EXPERIMENTAL AND COMPUTATIONAL METHODS ................................. 62
4.2.1 Experiment ....................................................................................................... 62
4.2.2 Computation ..................................................................................................... 64
4.3 RESULTS AND DISCUSSION ............................................................................. 65
4.3.1 MATI spectrum of La2 ..................................................................................... 65
4.3.2 Predicted electronic states of La2 and La2+ ...................................................... 66
4.3.3 Observed electronic states of La2 and La2+ ...................................................... 68
4.3.4 Comparison of group III M2 dimers (M= Sc, Y, and La) ................................ 71
4.4 CONCLUSIONS ..................................................................................................... 72
CHAPTER 5 THRESHOLD IONIZATION, STRUCTURAL ISOMERS, AND
ELECTRONIC STATES OF M2O2 (M = SC, Y, AND LA) ........................................... 80
5.1 INTRODUCTION ................................................................................................... 80
5.2 EXPERIMENTAL AND COMPUTATIONAL METHODS ................................. 82
5.3 RESULTS AND DISCUSSION ............................................................................. 84
5.3.1 MATI spectra ................................................................................................... 84
5.3.2 Theoretical structural isomers and electronic states ........................................ 85
5.3.3 Observed structural isomers and electronic states ........................................... 87
5.3.3.1 Sc2O2 ......................................................................................................... 87
5.3.3.2 Y2O2 and La2O2......................................................................................... 90
5.3.3.3 Singlet versus triplet states of M2O2 (M = Sc, Y, and La) ........................ 92
5.4 CONCLUSIONS ..................................................................................................... 93

viii
CHAPTER 6 MASS-ANALYZED THRESHOLD IONIZATION AND ELECTRONIC
STATES OF M3O4 (M = SC, Y, AND LA) ................................................................... 108
6.1 INTRODUCTION ................................................................................................. 108
6.2 EXPERIMENTAL AND COMPUTATIONAL METHODS ............................... 110
6.3 RESULTS AND DISCUSSION ........................................................................... 112
6.3.1 MATI spectra ................................................................................................. 112
6.3.2 Possible structural isomers ............................................................................. 113
6.3.3 Observed structural isomer and electronic transition ..................................... 114
6.4 CONCLUSIONS ................................................................................................... 117
CHAPTER 7 MASS-ANALYZED THRESHOLD IONIZATION OF METAL TRIMER
CARBIDES AND CARBOXIDES................................................................................. 128
7.1 INTRODUCTION ................................................................................................. 128
7.2 EXPERIMENTAL AND COMPUTATIONAL METHODS ............................... 129
7.2.1 Experiment ..................................................................................................... 129
7.2.2 Computation ................................................................................................... 131
7.3 RESULTS AND DISCUSSION ........................................................................... 132
7.3.1 Spectroscopic measurements ......................................................................... 132
7.3.2 Possible isomers and electronic states ........................................................... 134
7.3.2.1 M3C2 (M = Sc, La) .................................................................................. 134
7.3.2.2 La3C2O .................................................................................................... 136
7.3.2.3 Chemical bonding effects ....................................................................... 138
7.4 CONCLUSIONS ................................................................................................... 140
CHAPTER 8 SUMMARY OF DISSERTATION .......................................................... 156
APPENDIX FLIGHT TIME ESTIMATION IN THE TOF SPECTROMETRY ....... 161
REFERENCES: .............................................................................................................. 165
VITA ............................................................................................................................... 174

ix
LIST OF TABLES
Table 3.1 Electronic states, geometries (RLa-O for OLaO and RLa-O/RO-O for LaOO
and La(O2)), A (for O-La-O or La-O-O), vibrational frequencies (i),a relative
energies (Erel), and adiabatic ionization energies (AIE) of lanthanum dioxide (OLaO, C2v
or Dh), lanthanum peroxide [La(O2), C2v], and lanthanum superoxide (LaOO, Cv) from
the B3LYP calculations with aug-cc-pVTZ basis set for O atoms and SDD ECP and basis
set for the La atom. Reprinted with permission from J. Chem. Phys., 137, 034207 (2013),
Copyright 2013 AIP Publishing LLC. .............................................................................. 55
Table 3.2 Electronic states, geometries (RLa-O, A for O-La-O ), and vibrational
frequencies (i),a of the 4B2 and 3B2 states and adiabatic ionization energies (AIE) of the
4B2 state of bent lanthanum dioxide (OLaO, C2v) from MATI spectroscopy and
theoretical calculations.b Reprinted with permission from J. Chem. Phys., 137, 034207
(2013), Copyright 2013 AIP Publishing LLC................................................................... 56
Table 4.1 Low-lying electronic states, electron configurations, and electronic energies
with vibrational zero-point corrections (E0), bond length (R), vibrational frequencies (e)
of La2 and La2+ from CASPT2/ANO-RCC calculations. Reprinted with permission from
J. Chem. Phys., 135, 034309 (2013), Copyright 2013 AIP Publishing LLC. ................... 74
Table 4.2 Electronic energies with vibrational zero-point corrections (E0), vibrational
frequencies (e), and bond dissociation energies (De) for the observed electronic states
La2 and La2+. Reprinted with permission from J. Chem. Phys., 135, 034309 (2013),
Copyright 2013 AIP Publishing LLC. .............................................................................. 75
Table 4.3 Comparison of group III M2 (M = Sc, Y, and La). Reprinted with permission
from J. Chem. Phys., 135, 034309 (2013), Copyright 2013 AIP Publishing LLC. .......... 76
Table 5.1 Band positions (cm-1) and assignments for the MATI spectra of M2O2 (M = Sc,
Y, La). The band positions are relative to those of the origin bands, and the absolute
energies of the origin bands are listed inside square brackets. The relative intensities of
the MATI bands are indicated by "s" (strong), "m" (medium) and "w" (weak). .............. 95
Table 5.2 Point groups, electronic states, relative energies (Erel), and transition energies
(∆E) of M2O2 (M=Sc, Y, La) from the B3LYP calculations, with the aug-cc-pVTZ basis
for the Sc and O atoms and the Stuttgart RSC segmented/ECP basis for the Y and La
atoms. ................................................................................................................................ 96
Table 5.3 Relative electronic energies (Erel, cm-1) of the 1Ag and 3B1u neutral states of
M2O2 (M = Sc, Y, La) from the B3LYP, CCSD(T)//B3LYP, and CCSD(T) calculations,
with the aug-cc-pVTZ basis for the Sc and O atoms and the Stuttgart RSC
segmented/ECP basis for the Y and La atoms. For the CCSD(T)//B3LYP calculations,
single point energies are calculated at the B3LYP optimized geometries. ....................... 97
Table 5.4 Vibrational modes and frequencies of the 1Ag and 3B1u neutral states and 2Ag
ion state of M2O2 (M = Sc, Y, La) from the B3LYP calculations, with the aug-cc-pVTZ
basis for the Sc and O atoms and the Stuttgart RSC segmented/ECP basis for the Y and
La atoms.a .......................................................................................................................... 98
Table 5.5 Measured adiabatic ionization energies (AIE, eV) of M2O2 (M = Sc, Y, and La)
and vibrational frequencies of the ion ( i , cm-1) and neutral states ( i , cm-1), along with

x
those in parentheses from the theoretical calculations.a The AIEs correspond to the
ionization processes of Sc2O2+ (2Ag, D2h) ← Sc2O2 (
1Ag, D2h) and M2O2+ (2Ag, D2h) ←
M2O2 (3B1u, D2h) for M=Y and La.b .................................................................................. 99
Table 5.6 Calculated metal-metal (M-M) and metal-oxygen (M-O) bond lengths and
oxygen-metal-oxygen (O-M-O) bond angles of the D2h M2O2 (M = Sc, Y, La) clusters
from the DFT/B3LYP calculations. The aug-cc-pVTZ basis sets are used for the Sc and
O atoms and Stuttgart RSC segmented/ECP for the Y and La atoms. ........................... 100
Table 5.7 Vibrational temperatures (K) used in spectral simulations. The temperatures are
determined by using the 1
14 sequence transition intensities. See text for the estimation of
the vibrational temperatures. ........................................................................................... 101
Figure 5.1 Possible structural isomers of M2O2 (M = Sc, Y, La) (O: red, M: cyan). ..... 102
Figure 5.2 MATI spectra of Sc2O2 (a) and Y2O2 (b) seeded in He carrier gas and La2O2
seeded in Ar carrier gas (c). ............................................................................................ 103
Figure 5.3 MATI Spectrum of Sc2O2 seeded in He carrier gas (a) and simulations of the 2Ag ← 1Ag (b) and 2Ag ← 3B1u (c) transitions from B3LYP calculations...................... 104
Figure 5.4 MATI Spectrum of Y2O2 seeded in He carrier gas (a) and simulations of the 2Ag ← 3B1u (b) and 2Ag ← 1Ag (c) transitions from B3LYP calculations....................... 105
Table 6.1 Spectral band positions (cm-1) and assignments of M3O4 (M = Sc, Y and La)
from MATI measurements and DFT/B3LYP calculations.a The band positions are
relative to that of the origin band, and the calculated values are given inside parentheses.
The energy of the origin band for each molecule is listed inside square brackets.
Reprinted with permission from J. Chem. Phys., 137, 084312 (2014), Copyright 2013
AIP Publishing LLC. ...................................................................................................... 117
Table 6.2 Point groups, electronic states and relative energies (Erel), and transition
energies (E) of Sc3O4 isomers from DFT/B3LYP calculations.a Reprinted with
permission from J. Chem. Phys., 137, 084312 (2014), Copyright 2013 AIP Publishing
LLC. ................................................................................................................................ 119
Table 6.3 Vibrational modes and frequencies of M3O4 (C3v) and M3O4+(C3v) (M = Sc, Y,
and La) from DFT/B3LYP calculations.a Reprinted with permission from J. Chem.
Phys., 137, 084312 (2014), Copyright 2013 AIP Publishing LLC. ................................ 120
Table 6.4 Measured adiabatic ionization energies (AIE, eV) and ionic vibrational
frequencies ( i , cm-1) of M3O4 (M = Sc, Y, and La), along with those in parentheses
from DFT/B3LYP calculations.a The AIE corresponds to the ionization process of M3O4+
(1A1, C3v) ← M3O4 (2A1, C3v). Reprinted with permission from J. Chem. Phys., 137,
084312 (2014), Copyright 2013 AIP Publishing LLC.................................................... 121
Table 7.2 Peak positions (cm-1) and assignments for the MATI spectrum of La3C2O. .. 142
Table 7.3 Calculated electronic states, geometric parameters, and relative energies (eV)
of M3C20/+1 (M=Sc, La) and La3C2O
0/+1. Five bond distances (Å) are Md-Md (R1), Ms-Ms
(R2), Ms-C (Rs), Md-C (Rd) and Md-O (Rd’), four angles (degree) are the dihedral angle of
Md-C-C-Md (D) and the bond angles of Md-C-Md (A1), Ms-C-Md (A2), and Md-O-Md
(A1’). The calculations are carried out at DFT/B3LYP level with lanL2DZ basis sets for
metals and aug-cc-pVTZ basis set for carbon and oxygen. ............................................ 143

xi
Table 7.4 Point groups, electronic states and relative energies (Erel), and transition
energies (E) of the La3C2O isomers from DFT/B3LYP calculations.a ......................... 144
Table 7.5 Calculated vibrational frequencies (cm-1) and their symmetries in comparison
with the experimental measurements for M3C2 (M=Sc and La) and their cations. ........ 145
Table 7.6 Calculated vibrational frequencies (cm-1) and their symmetries in comparison
with the experimental measurements for La3C2O in its neutral and ion states at C2v
symmetry......................................................................................................................... 146
Table 8.1 Summary of ionization energies (eV) for M2O2, M3O4 and M3C2 (M = Sc, Y,
and La). The relative ionization energies (eV), comparing to the free atoms, are included
in the brackets. ................................................................................................................ 158
Table 8.2 Summary of the observed metal-metal (M-M) stretch, and metal-ligand (M-L)
stretch or bending frequencies (in cm-1). The stretch and bending modes are noted as v
and ; superscript ‘+’ indicates the frequencies of the ions; asymmetric modes are
noted in the superscript ‘as’. ........................................................................................... 159

xii
LIST OF FIGURES
Figure 1.1 Schematic diagram for the conventional PES (a), threshold PES (b), and PFI-
ZEKE/MAIT (c)................................................................................................................ 24
Figure 2.1 The schematic diagram of the home-built ZEKE/MATI spectrometer. .......... 37
Figure 2.2 The schematic diagram of the voltage divider for ion (A) and electron (B)
detections. ......................................................................................................................... 38
Figure 2.3 Time sequence of the PFI-PIE, ZEKE, and MATI experiments. T0 is the
trigger of piezoelectric pulsed valve; T1 and T2 are the Q-switch triggering times of the
ablation and excitation /ionization lasers; Δ1 and Δ2 are the time delays between the laser
flash lamps and Q-switches; 1t ,
2t , and 3t are the rising edges of various electric pulses;
and 1w ,
2w , and 3w are the electric pulse widths. ............................................................ 39
Table 3.1 Electronic states, geometries (RLa-O for OLaO and RLa-O/RO-O for LaOO
and La(O2)), A (for O-La-O or La-O-O), vibrational frequencies (i),a relative
energies (Erel), and adiabatic ionization energies (AIE) of lanthanum dioxide (OLaO, C2v
or Dh), lanthanum peroxide [La(O2), C2v], and lanthanum superoxide (LaOO, Cv) from
the B3LYP calculations with aug-cc-pVTZ basis set for O atoms and SDD ECP and basis
set for the La atom. Reprinted with permission from J. Chem. Phys., 137, 034207 (2013),
Copyright 2013 AIP Publishing LLC. .............................................................................. 55
Figure 3.1 MATI spectrum of LaO2 seeded in He (a) and simulations (100 K) of the 3B2
← 4B2 transition of lanthanum dioxide (OLaO) (b), the 3A2 ← 4A2 (c) and 1A1 ← 2A1 (d)
transitions of lanthanum peroxide (La(O2)), and the 1+ ← 2+ transition of lanthanum
superoxide (LaOO) (e). Reprinted with permission from J. Chem. Phys., 137, 034207
(2013), Copyright 2013 AIP Publishing LLC................................................................... 57
Figure 3.2 Possible structures of LaO2: lanthanum dioxide (OLaO) (a, b), lanthanum
peroxide [La(O2)] (c) and lanthanum superoxide (LaOO) (d). A bent lanthanum
superoxide was also considered, but it converged to the linear structure upon geometry
optimization. Reprinted with permission from J. Chem. Phys., 137, 034207 (2013),
Copyright 2013 AIP Publishing LLC. .............................................................................. 58
Figure 3.3 Valence electron configurations of the 4B2 (a) and 2B2 (b) states of lanthanum
dioxide (OLaO). The molecule is placed on the yz plane. The relative energy orderings
of the valence molecular orbitals are different in the two states. Two electrons are
transferred from La to two O atoms in the formation of the 4B2 state, which has the
HOMO of largely a La 6s character. On the other hand, three electrons are transferred
from La to two O atoms to form the 2B2 state, which has the HOMO of largely an O 2p
character. Reprinted with permission from J. Chem. Phys., 137, 034207 (2013),
Copyright 2013 AIP Publishing LLC. .............................................................................. 59
Figure 4.1 MATI spectrum (a) of La2 seeded in Ar gas and simulations (b) of the a2g+ ←
X1g+, b23/2,u ← X1g
+, and b21/2,u ← X1g+ transitions at 300 K. Reprinted with
permission from J. Chem. Phys., 135, 034309 (2013), Copyright 2013 AIP Publishing
LLC. .................................................................................................................................. 77

xiii
Figure 4.2 Valence-space molecular orbitals that are involved in the X1g+ and a5u
-
states of La2 and the X4g-, a2g
+, and b2u states of La2+ presented in Table 4.1.
Reprinted with permission from J. Chem. Phys., 135, 034309 (2013), Copyright 2013
AIP Publishing LLC. ........................................................................................................ 78
Figure 4.3 Schematic diagram for the thermodynamic cycles used to calculated bond
energy differences between La2+ and La2 from ionization energies of the metal dimer and
atom: IE (La) – IE (La2) = D0+ (La2
+) – D0 (La2). See text for details. Reprinted with
permission from J. Chem. Phys., 135, 034309 (2013), Copyright 2013 AIP Publishing
LLC. .................................................................................................................................. 79
Figure 5.5 MATI Spectrum of L2O2 seeded in Ar carrier gas (a) and simulations of the 2Ag ← 3B1u (b) and 2Ag ← 1Ag (c) transitions from B3LYP calculations....................... 106
Figure 5.6 Interaction diagram of two ns orbitals of the M2 fragment (a) and HOMO and
LUMO of M2O2 (M = Sc, Y, La) (b). ............................................................................. 107
Figure 6.1 Possible structural isomers of M3O4 (M = Sc, Y, and La). Reprinted with
permission from J. Chem. Phys., 137, 084312 (2014), Copyright 2013 AIP Publishing
LLC. ................................................................................................................................ 122
Figure 6.2 MATI spectra of M3O4 (M = Sc, Y, and La) seeded in argon carrier.
Reprinted with permission from J. Chem. Phys., 137, 084312 (2014), Copyright 2013
AIP Publishing LLC. ...................................................................................................... 123
Figure 6.3 MATI spectrum of Sc3O4 seeded in argon carrier gas (a) and simulations (50
K) of the 1A1 ← 2A1 transitions of the C3v (b), C2v (c), and D2d isomers. Spectral bands
associated with single vibrational mode are labeled in the figure. Others are either
overtone or combination bands. Reprinted with permission from J. Chem. Phys., 137,
084312 (2014), Copyright 2013 AIP Publishing LLC.................................................... 124
Figure 6.4 MATI spectrum of Y3O4 seeded in argon carrier gas (a) and simulation (50 K)
of the 1A1 ← 2A1 transition of the C3v isomer (b). Spectral bands associated with single
vibrational mode are labeled in the figure. Others are either overtone or combination
bands. Reprinted with permission from J. Chem. Phys., 137, 084312 (2014), Copyright
2013 American Institute of Physics. ............................................................................... 125
Figure 6.5 MATI spectrum of La3O4 seeded in argon carrier gas (a) and simulation (50 K)
of the 1A1 ← 2A1 transition of the C3v isomer (b). Spectral bands associated with single
vibrational mode are labeled in the figure. Others are either overtone or combination
bands. Reprinted with permission from J. Chem. Phys., 137, 084312 (2014), Copyright
2013 American Institute of Physics. ............................................................................... 126
Figure 6.6 LUMO (a), HOMO (b), and HOMO-1 (c) of the 2A1 ground state of the C3v
isomer of Sc3O4. The LUMO and HOMO are mainly Sc 4s character, and HOMO-1 is
largely O 2p. Y3O4 and La3O4 have similar characters in these frontier orbitals.
Reprinted with permission from J. Chem. Phys., 137, 084312 (2014), Copyright 2013
American Institute of Physics. ........................................................................................ 127
Table 7.1 Peak positions (cm-1) and assignments for the MATI spectra of Sc3C2 and
La3C2. The values in parentheses are relative to the positions of the origin bands. ...... 141
xiv
Figure 7.2 MATI spectra of Sc3C2 with He (a) and He/Ar (2:1) mixture (b) carrier gas.
......................................................................................................................................... 148
Figure 7.3 MATI spectra of La3C2 with He (a) and Ar (b) carrier gas. .......................... 149
Figure 7.4 MATI spectra of La3C2O with He (a) and Ar (b) carrier gas. ....................... 150
Figure 7.5 MATI spectra of Sc3C2 in He/Ar (2:1) mixture as carrier gas (a) and
simulations (30 K) of isomer I (b-d) and isomer II (e-g) from B3LYP calculations with
the lanL2DZ basis for Sc and the aug-cc-pVTZ basis for O . ........................................ 151
Figure 7.6 MATI spectra of La3C2 in Ar as carrier gas (a) and simulations (10K) of
isomer I (b-d) and isomer II (e-g) from B3LYP calculations with the lanL2DZ basis for
La and the aug-cc-pVTZ basis for O. ............................................................................. 152
Figure 7.7 Possible isomers of La3C2O........................................................................... 153
Figure 7.8 MATI spectra of La3C2O in He (a) and simulations (100 K) of possible
transitions (b-f) from B3LYP calculations with the lanL2DZ basis for La and the aug-cc-
pVTZ basis for O. ........................................................................................................... 154
Figure 7.9 Molecular orbital diagrams for the ground states of isomer I (a) and II (b) of
La3C2, and the ground state of La3C2O (c). .................................................................... 155
Figure 8.1 Summary of the MATI spectra of metal clusters and their AIEs (eV). ......... 160
Figure Appendix Illustration of the acceleration zones in the time-of-flight spectrometer,
d is the distance between the two metal cans; d1 is the distance between the molecular
beam and the upper can; d2 is the distance from the upper can to the bottom of the TOF
tube; d3 is the length of the TOF tube; d4 is the distance from the top of TOF tube to the
MCP detector. ................................................................................................................. 164

1
CHAPTER 1 INTRODUCTION
The concept of clusters was introduced by Cotton in the 1960s to distinguish the
compounds containing metal-metal bonds from the Werner complexes.1-3 Because of a
wide range of the metal-metal bond lengths, identification of a true metal-metal bond is
often difficult. To circumvent this problem, the concept was then modified by Mingos in
the 1990s to describe the compounds having "a group of two or more metal atoms with a
direct and substantial metal-metal bond".4 With the development of the cluster science,
more and more clusters have been synthesized. Nowadays, a cluster no longer necessarily
contains metal-metal bonds and may consist of nonmetal elements, such as carbon or boron.
Instead, the concept of clusters is expanded to describe a state of aggregation between
atoms and bulk. In 2002, Johnston defined a cluster in his book as "an aggregate of
countable number (2-10n, where n can be as high as 6 or 7) of particles (i.e. atoms or
molecules)"5.
Mass spectrometry has widely been used to study the stability of different clusters.
In the 1970s, French Physicists observed the Mn+/- (M = metal) clusters when conducting
secondary molecular ion emission measurements in the gas phase. Their measurements
included the clusters of the main group elements, such as C, Si, Li, Al, Be, and Mg6-8, and
some of the transition metals, such as Ag and Cu6,7. They found that the intensities of the
secondary ion signals, which indicated the stability of the clusters, are related to their sizes
(n). The ion signals either regularly decreased with n (i.e., Be, Mg), oscillated with the
parity of n (i.e., Cu), or showed maxima at some particular n values (i.e., Al). These mass
spectrometric studies were extended to rare-gas atomic clusters, including Hen (n<32)9,

2
Nen (n<90)10, Arn (n<60)11, Krn (n<60),11 and Xen (n<150).9,12 The mass spectra of these
clusters exhibited high-intensity peaks with a size of so-called “magic numbers”. The
magic numbers were also observed in the mass spectra of alkli-metal clusters.13 The
exceptional relative stability of these clusters was attributed to the completely packed
geometric shells, similar to the closed-shell electronic structure of the rare gas elements.14
In 1984, Kroto and co-workers examined the mass spectra of carbon cluster beams
produced by laser vaporization and supersonic expansion.15 They proposed a buckyball
structure for C60 to explain its intense cation signal,15,16 which is now known as fullerene.
Due to the huge potential applications, fullerene analogs have been widely studied in the
size range of 20 to 1000 atoms.17 Met-car clusters, typically with a formula of M8C12, were
discovered by Castleman et al. as another group of stable clusters18-21 and studied by
Duncan and others. 22 These clusters also showed size-dependent adiabatic ionization
energies (AIEs), electron affinities (EAs), chemical reactivity and other
properties.5,14,19,23,24
Metal clusters in the gas phase have been prepared with Knudsen cell effusive25-28,
ion sputtering29-31, and laser ablation methods among others.32-34 The Knudsen cell
effusive method involves the heating of a solid or liquid sample in an oven with a small
orifice and is commonly used to study the thermodynamic properties of the clusters. The
ion sputtering method involves the bombarding of the solid sample surface by high-
energetic inert gas ions and is usually used for the surface analysis of solid materials. Laser
ablation coupled with supersonic expansion, introduced by Smalley and co-workers in
1981, is the most widely used method to prepare metal clusters in the gas phase.35-39 It can
be used for any metal elements and can generate a wide range of the cluster sizes in neutral

3
or ionic states with low internal temperatures. Because of these advantages, I used the laser
ablation method to prepare the transition metal clusters of interest in this work.
The transition metal clusters have been extensively studied in the gas phase. The
studies of the cationic clusters have been reported on their reactivity,40-43 UV-Vis
photofragmentation,44-46 and infrared (IR) multiphoton photodissociation or single-photon
vibrational predissociation.47-55 The studies of the anions have largely been carried out
with photoelectron spectreoscopy,56-71 and additional investigations have been reported
about their reactivity40,42,72-75 and IR photodissociation.51,76-78 The neutral clusters are more
challenging to study experimentally because they are difficult to select. Their formation
and properties have usually been investigated by ionization techniques, including
multiphoton IR79 and single-photon UV80-82 and vacuum UV laser ionization.83-86 In
addition, the neutral clusters have been studied by matrix-isolation IR spectroscopy.87 In
spite of the extensive studies, the current knowledge about the electronic states and
molecular structures of the polyatomic transition metal clusters is largely derived from the
theoretical predictions. However, the reliable prediction of the electronic and geometric
structures is often complicated by the presence of many low energy structural isomers and
many low-lying electronic states of each isomer. Inconsistent theoretical results have been
reported on the ground electronic states and minimum energy structures of the polyatomic
neutral clusters88,89 and ions.51,90,91 Therefore, a reliable identification of the molecular
structures and electronic states for the transition metal clusters and their ions generally
requires the confirmation by spectroscopic measurements, especially by high resolution
spectroscopic techniques.

4
This work focuses on the spectroscopy, bonding, and structures of the rare earth
metal oxide, carbide, and carboxide clusters. These clusters are synthesized by the laser
ablation technique and cooled by the supersonic expansion. Their AIEs and vibrational
frequencies are measured by mass-analyzed threshold ionization (MATI) spectroscopy.
Their geometric structures and electronic states are investigated by combining the
spectroscopic measurements with quantum chemical calculations and spectra simulations.
In the following sections, I will brief describe the spectroscopic and computational methods.
Because the MATI technique is derived from photoelectron spectroscopy (PES), I will first
describe the photoelectron technique.
1.1 PES MEASUREMENTS
The PES technique is based on the photoelectric effect, which was first observed
by Heinrich Hertz in 1887. In 1902, Philipp Lenard quantitatively studied the photoelectric
effect and discovered the 'stop voltage' in a photoelectric experiment. His work was
explained by Albert Einstein with the following equation:
kE h W (1.1)
Where Ek is the kinetic energy of emitted electrons, and is the frequency of light, W is
the work function of the sample surface.
Although the photoelectric phenomena were studied for a long time,92-95 the first
photoelectron spectrometer was not built until 1957 by Kai Siegbahn to study the energy
levels of atomic core electrons.96 His work focused on the characterization of solid surfaces
with the X-ray light source. The PES was also applied in the extreme ultraviolet (EUV),

5
vacuum ultraviolet (VUV), and ultraviolet (UV) energy regions to study valence electrons.
The first gas-phase PES spectrometer was developed by Turner and coworkers 97 in the
VUV region and modified by Smalley and coworkers to measure the valence electron
binding energies.98-100 In this dissertation, the term of PES will be restricted to the gas-
phase PES unless otherwise noted.
1.1.1 Conventional PES
In a PES measurement, a molecule absorbs a photon and emits an electron.
According to the energy conservation rule, the photon energy (hv) is transferred to the
kinetic energy (Ek) of the emitted electrons and the internal energy change (ΔE) of the
molecule, as expressed by Equation (1.2):
kh E E (1.2)
The internal energy of a molecule is the summation of its electronic, vibrational, rotational,
and translational energies. Because the mass of an electron is negligible compared to that
of the molecule, the kinetic energy change of the nuclear frame is approximately zero. The
energies and the angular distributions of the incident photon and the ejected photoelectron
reveal the electronic, vibrational, and rotational information of the molecule.
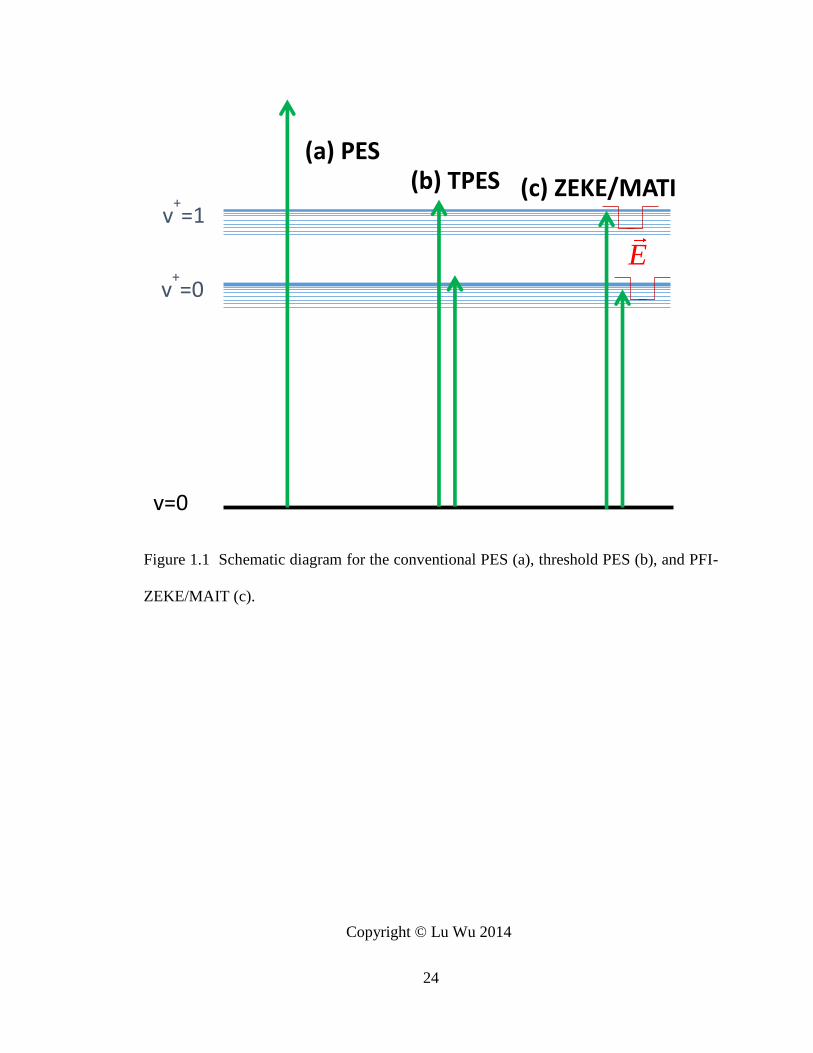
Conventional PES is used to study the neutral molecules and anions. It provides the
IEs for the neutral molecules and the EAs for the anions. As shown in Figure 1.1(a), a
molecular beam is bombarded with light of the fixed wavelength. The electrons are ejected
when the energy of light exceeds their binding energies. For a neutral molecule, the AIE
is obtained by recording the kinetic energies of the ejected electrons. It is convenient to

6
build an apparatus for the conventional PES measurements because a fixed-wavelength
laser and an electron energy analyzer can simply meet the requirements. However, the
application of this technique is limited by the resolution of the electron energies.101
Because the neutral molecules are converted to the cations at different energy levels when
the photon energy exceeds their AIEs, their vibrational and rotational information can be
derived from the energy distribution of the electrons. However, the rotational structures of
the most molecules and the vibrational structures of polyatomic metal-containing
molecules have rarely been resolved using the conventional PES, because its resolution is
generally no better than 10 meV (~80 cm-1).101,102
Threshold photoionization (TPES) spectroscopy was developed by Schlag and co-
workers103,104 to improve the spectral resolution. As shown in Figure 1.1(b), tunable pulsed
laser is used to ionize the molecules, and an electron filter is employed to remove the
electrons with high kinetic energies. A photoelectron spectrum is measured as a function
of the signal intensity of the near-zero kinetic energy electrons, instead of the energy
distribution of the emitted electrons. With this scheme, the spectral resolution has been
improved to a few meV, which is significantly higher than that of the conventional PES.
However, the separation of the near-zero energy electrons from other kinetic energy
electrons is still difficult with this method. To further improve the spectral resolution,
pulsed-field ionization zero electron kinetic energy (PFI-ZEKE or ZEKE) spectroscopy
was developed by Müller-Dethlefs, Sander, and Schlag in 1984.102,105
1.1.2 PFI-ZEKE and MATI spectroscopy
The PFI-ZEKE technique relies on the delayed pulsed field ionization of the long-
lived, high-lying Rydberg states (principal quantum number n > 150), which are prepared

7
by photoexcitation. Because the Rydberg series of the neutral molecule converge to
various eigenstates of the cation, the energies of the high-lying Rydberg states are close to
the ionization threshold. Thus, the energy of the excitation light source is a good
approximation of the AIEs. The electrons which are generated directly from the
photoionization process (direct electrons) are separated spatially from the Rydberg
molecules by a discrimination electric field. A small time-delayed pulsed electric field is
used to ionize the high-lying Rydberg molecules and generate the zero kinetic energy
electrons. A spectral resolution of a small fraction of cm-1 has been obtained by using this
method106,107, and it can further be improved by decreasing the linewidth of the light source
and the strength of the ionization field.108
The Rydberg states can be described as the energy levels of single electron weakly
bounded to an ionic core by the Coulomb force. The energies of a Rydberg series are
calculated by Rydberg formula: 2( )
Mnlm
l
RE
n
, where n, m, and l are the principle,
angular, and magnetic quantum numbers, l is the l-dependent quantum defect, and RM is
the Rydberg constant. The Rydberg constant depends on the mass of the atomic or
molecular core and can be estimated by 1109737R cm
for heavy atoms or molecules.
The high-lying Rydberg states are not fully understood yet, due to the difficulties of
theoretical calculations and experimental measurements. The challenges arise from the
high density of the energy states and their subtle response to the perturbations from even a
weak electric field. The long life time of the high-lying Rydberg states are commonly
explained by the strong l- and ml-mixing in the stray field caused by the nearby charged
particles. These perturbations remove the high energy degeneracies and generate closely

8
packed Stark levels.108-116 The effects of the electric field on high Rydberg states were
extensively studied experimentally and theoretically.108-110,117,118 In the presence of an
electric field, the AIE from the PFI-ZEKE measurements is red shifted due to the Stark
effect. This field effect is predicted by the equation IE c F ( IE is the IE shift in
cm-1, F is the strength of the electric field in V/cm, c is a constant) on the basis of the classic
atomic model.
PFI-ZEKE provides the accurate AIEs of the neutral species and vibrational
information of the cations. It has the advantages over the conventional PES and some of
the optical spectroscopic methods. In the gas phase, the optical spectroscopic methods,
such as infrared absorption and Raman scattering techniques, are generally less applicable
to measure the vibrational frequencies of cations. One of the reasons is that the Coulomb
repulsive force between the cations makes it difficult to prepare the samples with high
molecular densities. Secondly, the infrared and Raman transitions generally have smaller
cross sections than the electronic transitions. Moreover, the vibrational frequencies of
metal-ligand complexes and metal clusters are typically less than a few hundred
wavenumbers, while the tunable IR light source below 500 cm-1 is much more difficult to
generate than the UV lasers.
As a sister technique of ZEKE, MATI spectroscopy was developed by Zhu et al.119
Instead of detecting electrons, a MATI measurement records the ion signals. MATI
spectroscopy provides similar information to ZEKE, yet has the advantage of the mass
selection. If multiple clusters exist in the molecular beam and have similar AIEs, the
identification of the ZEKE electron carrier becomes less straightforward and MATI
measurements are preferred. On the other hand, because the ions are much heavier than
9
the electrons, the separation of the ions produced by the delayed filed ionization from those
by direct photoionization requires a stronger discrimination electric field and a longer delay
time of the ionization field than those in the ZEKE experiment. To increase the life time
of the high-lying Rydberg states, an AC scrambling field is often used in the MATI
experiment.120
1.2 THEORETICAL CALCULATIONS
The spectroscopic measurements are generally analyzed with the help of the
theoretical calculations. Ab initio calculations are used to find the minimum energy
structures and calculate vibrational frequencies of the neutral and ionic clusters. Franck-
Condon factor (FCF) calculations and spectral simulations are used to calculate the
intensities of the MATI spectra. The comparison of the spectral measurements and
theoretical calculations is used to determine the molecular structures and electronic states
of the neutral and ionic clusters.
Although the structure of a molecule is defined by the position of each atom, the
internal motions of the molecule are commonly described by the normal coordinates. The
potential energy surface of the molecule is calculated by the single-point energies of
different structures as a function of their coordinates. Geometry optimization aims to find
the stationary points on the potential energy surface. A stationary point is reached when
the first derivatives of the potential energy with respect to all the coordinates are zero. If
the energy of the molecule increases with an arbitrary small displacement from the
stationary point, the stationary point is called a local minimum. If the energy of the
molecule increases with a small displacement along all but one of the normal coordinates,

10
this stationary point is called a transition state. The local minimum with the lowest energy
is called the global minimum, which is the ground state of the most stable structure.
The vibrational frequencies are calculated from the second derivatives of the
potential energy surface with respect to the normal coordinate. The calculated frequency
is a positive real number if the second derivative is positive and an imaginary number if
the second derivative is negative. Thus, the number of imaginary frequencies is another
way to characterize a stationary point of the potential energy surface. The number of
imaginary frequencies is zero for a local minimum and one for a transition state. If the
number of the imaginary frequencies is n, it is called the nth-order saddle point. The
transition state is also called the first-order saddle point.
Computational methods are distinguished by the approaches they use to perform
the single-point energy calculations. The energy calculations can be performed by
molecular mechanics, semi-empirical, and ab initio methods. Among all these methods,
the ab initio methods are the most popular, systematic, and reliable, especially for small
molecular systems. Various ab initio methods are briefly introduced in this section.
1.2.1 ab initio calculations
The Schrödinger equation (Equation (1.3)) is the foundation of the quantum
mechanics. By solving the Schrödinger equation, the ab initio calculations can provide its
eigenvalues as the possible energy levels and eigenfunctions for the status of a system.
H E (1.3)

11
Where E is the total energy, is the wavefunction, and Ĥ is the Hamiltonian operator.
For a polyatomic molecule under a field-free condition, the Hamiltonian operator can be
expressed as
2 21 1 1ˆ ( ) ( ) ( , )2 2 i
M N M N M N
i i j iij i
Z Z ZH V R r
R r r
(1.4)
In this equation, only the kinetic energies of the nuclei and electrons and the static electric
potential are expressed. All other factors, such as relativistic effect and the spin-orbit
coupling, are included in the V(R, r) term.
If the expression of the Hamiltonian can be found, the total energy can be accurately
predicted by mathematics. Unfortunately, few systems can be solved analytically and
accurately. In most cases, Equation 1.4 is solved numerically with approximations. In the
following subsections, I will briefly describe the Hartree-Fock theory and several
correlation methods. Strictly speaking, density functional theory (DFT) is not an ab initio
method because it depends on the empirical density functionals. In this chapter, I will
include DFT in the ab initio methods.
1.2.2 Hartree-Fock theory
The fundamental difficulty of solving the Schrödinger equation is the separation of
the variables. This difficulty is circumvented by the Hartree-Fock theory, which offers a
numerical solution. The Hartree-Fock theory solves the Schrödinger equation iteratively
and is workable by computer programing. It is also called called self-consistent field
method (SCF) and transfers the Schrödinger equation of a multiple-electron system into

12
equations of single-electron systems with several approximations. First, it ignores the term
V(R,r) in Equation (1.4) because this term is typically small for not very heavy elements.
Second, it treats the coordinates of the electrons as variables but freezes the nuclei by
applying the well-known adiabatic approximation (also called Born-Oppenheimer
approximation or 'frozen core' approximation). 121 This is reasonable because the electrons
are moving much faster than the nuclei and the nuclear kinetic energy can be considered to
be zero. Thus, the nuclear repulsion energy becomes constant and can be removed during
the calculations. More importantly, the only variables we need to consider in the
Schrödinger equation are the coordinates of the electrons. The Hamiltonian operator can
then be simplified as
2
2
1 1ˆ ( )2
1 1( )
2
i
i
N N M N
i i i ji ij
N M N
i i ji ij
ZH
r r
Z
r r
(1.5)
The first term in Equation (1.5) is the summation of the one-electron operators, and the
second term is the summation of two-electron operators.
The basic idea of the Hartree method is to deal with the electrons separately. By
solving the single-electron equations in Equation (1.6), the wavefunctions ( ( )i ir , i = 1, 2,
3 ...) of individual electrons are used to calculate the wavefunction and the energyof the
molecule by Equation (1.7) and (1.8), respectively.
ˆ ( ) ( )i i i i i iH r r (1.6)
1 1 1 1( ) ( ) ( )N Nr r r (1.7)
13
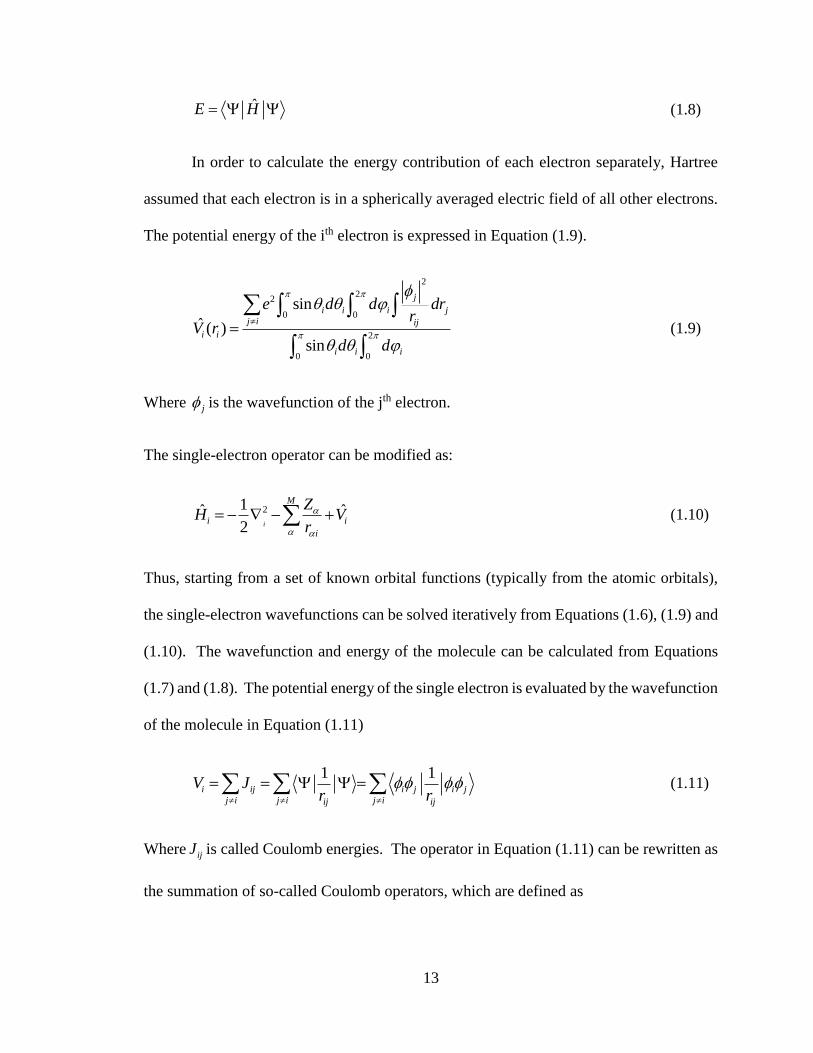
ˆE H (1.8)
In order to calculate the energy contribution of each electron separately, Hartree
assumed that each electron is in a spherically averaged electric field of all other electrons.
The potential energy of the ith electron is expressed in Equation (1.9).
2
22
0 0
2
0 0
sin
ˆ ( )sin
j
i i i j
j i ij
i i
i i i
e d d drr
V rd d
(1.9)
Where j is the wavefunction of the jth electron.
The single-electron operator can be modified as:
21ˆ ˆ2 i
M
i i
i
ZH V
r
(1.10)
Thus, starting from a set of known orbital functions (typically from the atomic orbitals),
the single-electron wavefunctions can be solved iteratively from Equations (1.6), (1.9) and
(1.10). The wavefunction and energy of the molecule can be calculated from Equations
(1.7) and (1.8). The potential energy of the single electron is evaluated by the wavefunction
of the molecule in Equation (1.11)
1 1i ij i j i j
j i j i j iij ij
V Jr r
(1.11)
Where ijJ is called Coulomb energies. The operator in Equation (1.11) can be rewritten as
the summation of so-called Coulomb operators, which are defined as

14
2
12
1ˆ (1) [ (2) (2) ] (1)j i j j iJ dr
(1.12)
Where i is the wavefunction of the ith orbital, 1 and 2 represent the coordinates of two
electrons.
Fock modified this algorithm by using the Slater-type orbital in Equation (1.13) to
substitute the one in Equation (1.4).
1 2
1 2
1 2
1 2 2
(1) (1) ...... (1)
(2) (2) ...... (2)1( , ,...... )
....... ....... ...... ......!
( ) ( ) ....... ( )
N
N
Nr r rN
N N N
(1.13)
The Pauli's exclusiive principle is considered in the Slater-type orbital, which is ignored
in the Hartree's theory. The total Hamiltonian and the single-electron operator are rewritten
as the Fock operator in Equation (1.14) and (1.15)
ˆ ˆi
i
H F (1.14)
21ˆ ˆ ˆ( )2 i
M
i j j
j ii
ZF J K
r
(1.15)
Where ˆjK is the exchange operator, which is defined in Equation (1.16)
2
12
1ˆ (1) [ (2) (2) ] (1)j i j i jK dr
(1.16)
The Hartree-Fock method considers the Pauli's principle and naturally includes the
electrons as fermions. However, it ignores most of the correlation energies from the
interaction of the electrons. The correlation energy is typically less than 1% of the total

15
energy, but it plays important roles in chemistry because it has the same magnitude as the
typical reaction or activation energies.
There are two types of the electron correlations. The first one is called the dynamic
correlation. It is due to the instantaneous repulsions of the electrons, which is assumed to
be the averaged electron field in Equation (1.3). The Hartree-Fock theory includes the
exchange energy by using the Slatter-type orbitals, but ignores the fact that two electrons
cannot occupy the same position at the same time. This effect can be corrected to various
extents by different single reference methods. The second type is called the static
correlation, which is due to the near degeneracy of the electronic states. When the two
reference states have the comparable energies, the single reference wavefunction is not able
to describe the system precisely. This effect is treated with the multi-reference theories.
The single- and multi- reference theories are briefly described below.
1.2.3 Configuration interaction (CI) theory
CI is one of the most successful methods to calculate the electron correlation
energies.122,123 The orbitals derived by solving the Hartree-Fock equations are used to form
the configuration state functions (CSFs). The CSFs are classified as single, double, triple,
and higher order excited state configurations according to the number of the electrons that
are excited from the ground electronic state. The molecular orbital in the CI calculations
is written as a linear combination of the CSFs of the same symmetry, and the molecular
wavefunction and energy are calculated by the variation theory.
The computational accuracy and cost of the CI calculations increase rapidly with
the number of the CSFs. Thus, the selection of the reasonable size of the CSFs becomes

16
an important issue. For example, the full CI calculation including all the possible CSFs is
so expensive that it is only applicable for a few small molecules,such as N2 and O2. The
CSFs are generally selected on the basis of the compromise of the computational cost and
accuracy. Because the singly and doubly exited CSFs account for a large part of the
correlation interaction energies, the configuration interaction method with the single and
double excitations (CISD) is commonly used.
1.2.4 Møller-Plesset perturbation (MPn) theory
MPn theory124,125 considers the deviation of the two-electron energy in the Hartree-
Fock calculations as a perturbation term. The Hamiltonian in MPn is expressed as
(0) (1)ˆ ˆ ˆH H H (1.17)
Where (0)H is expressed in Equation (1.14) and solved by the Hartree-Fock method,
(1)H
is the perturbed term and expressed as
(1) 1ˆ ˆ ˆ( )N
j j
j i i j iij
H J Kr
(1.18)
The MPn methods use the molecular orbitals and energies from the HF calculations as the
unperturbed term and treat the perturbed term successively to higher orders. The calculated
energy will be closer to the true value with high order calculations. Comparing to
variational theory-based methods (i.e., CI), MPn calculations converge much faster. They
are commonly used to treat the correlation effect near the equilibrium point. However,
unlike the variational theory calculations, the calculated energies by the MPn methods are
not necessarily higher than the true energies. The MPn methods cannot predict the precise

17
energy of a structure that is far away from the equilibrium and also do not work well for
the excited states. Moreover, in the unrestricted calculations, the wavefunctions from the
UHF calculations are not the eigenfunctions of 2S and ˆ
ZS (called spin contamination
effect). In such cases, MPn may produce serious errors due to the spin contaminations.
1.2.5 Density functional theory (DFT)
DFT126,127 is more efficient than the traditional wavefunction-based ab initio
methods. In DFT calculations, the ground state energy, wavefunction, and other electronic
properties are assumed to be the functionals of the ground state electron densities. The
total energy of the molecule is expressed as
[ ] [ ] [ ] [ ]E T U V (1.19)
In Equation 1.19, is the electron density as a function of the position. [ ]T , [ ]U and
[ ]V are the kinetic energies, electron-electron correlation energies, and the energies due
to the external fields, respectively. Operators T and U are called universal operators
because they are only related to the electrons and don't depend on the nuclei in the system.
On the other hand, V is a system-dependent term.
DFT can determine the properties of the ground electronic states quite well. In the
DFT calculations, the kinetic energies are determined precisely; the exchange-correlation
energies are unknown and empirically estimated by different functionals of the electron
density. Many exchange-correlation functionals have been developed. The accuracy of a
DFT calculation can be greatly improved if a better approximation for the exchange and
correlation interactions is available. The combinations of the exchange functionals from

18
the Becke’s three parameter hybrid functional (B3)128 with the gradient-corrected
correlation functionals derived by Lee, Yang, and Parr (LYP)129 and by Perdew (P86)130,131
are two of the most popular hybrid functionals. The calculations with these functionals are
sufficiently accurate for most molecular systems. The DFT calculations can provide
comparable energy accuracy with the MP2 method at a much lower cost. Thus, they are
used to study some of the larger molecules reported in this dissertation.
Similar to the MPn methods, the DFT methods are not based on the variational
theory, and the calculated energy could be higher or lower than the true ground state energy.
Unlike the wavefunction-based methods, the accuracy of the DFT methods does not only
depend on the levels of methods and the size of the basis sets, but also on the exchange-
correlation functionals. There is no obvious way to improve the accuracy of the DFT
calculations systematically.
1.2.6 Coupled-cluster (CC) theory
The CC method132-134 was introduced in 1958 to deal with the systems of interacting
particles. The basic idea is to write the molecular orbital as
0
Te (1.20)
Where 0 is the normalized ground state wavefunction from the Hartree-Fock calculations.
The operator is expanded into a Taylor-series
2 3
1 ......2! 3!
T T Te T (1.21)

19
And the cluster operator is
1 2 3 ... nT T T T T (1.22)
Where n is the number of the electrons, and Tn is the linear combination of the nth-excited
states from the ground state. Similar to the CI method, the coupled cluster calculations
with the single and double excitations (CCSD) and sometimes with the perturbed triple
excitation (CCSD (T)) are commonly used as a compromise of the computational accuracy
and expense.
1.2.7 Multi-reference theories
The complete active space self-consistent field (CASSCF)135 method also uses the
CSFs, as the CI and CC methods do. In a CASSCF calculation, the coefficients of LCAO
(linear combination of atomic orbital) molecular orbitals and the CSFs are optimized. With
the same space of the CSFs, the CASSCF method normally gives a more precise energy
than the CI method. Typically, not all configurations contribute significantly to the
correlation energies. By considering only the configurations with large coefficients, the
multi-configuration self-consistent field (MCSCF) method reduces the number of CSFs
and the computational cost without a significant loss of accuracy.
The multi-reference configuration interaction (MRCI)136,137 calculations can be
carried out by combining MCSCF with CI. In a conventional CI method, the calculation
starts with the SCF orbitals (which are called reference functions) and then generates the
CSFs with the ground and excited electron configurations. The molecular orbital is the
linear combination of the CSFs of the proper symmetry. In a MRCI calculation, the

20
MCSCF calculation is first performed to find the MCSCF wavefunctions, which are then
used to form a linear combination of the CSFs.
A complete active space with the second order perturbation theory (CASPT2)138
calculation also starts with the MCSCF calculation and treats the reference CSFs as the
basis functions of the molecular orbitals. The CASPT2 method combines the MCSCF
calculation with the MP2 method and treats the system with the perturbation theory.
1.3 SPECTRAL SIMULATIONS
1.3.1 Franck-Condon principle
The intensity profiles of ZEKE/MATI spectra can be predicted by the Franck-
Condon (FC) principle.139-141 On the basis of the FC principle, the intensity of a vibronic
transition is proportional to the square of the transition moment integral, which is expressed
as
*
' ' " "ev e v e vM d (1.23)
Where ' 'e v and " "e v are the vibronic wavefunctions of the initial and final states, and
is the molecular dipole moment operator. The molecular dipole moment is determined by
the positions of the charges. Specifically, the nuclei and electrons are separated as
i i e N
i
q r (1.24)
Where qi and ri are the charges and their positions.

21
From the Born-Oppenheimer approximation, the wavefunctions of the electrons
and nuclei can also be separated. Thus, the transition moment integral can then be
expressed as
* *
' ' " "
* * * *
' " ' " ' " ' "
( )ev e v e N e v
e e e e v v N e e e v N v N
M d
d d d d
(1.25)
Because the wavefunctions of different electronic states are orthogonal, Mev can be
simplified as
* *
' " ' "
*
' "
ev e e e e v v N
e v v N
M d d
M d
(1.26)
Where Me is the electronic transition moment and can be considered to be a constant for a
specific electronic transition. Then, the intensity of the vibronic transition can be expressed
as
2*
' ' " " ' "e v e v v v NI d (1.27)
From this expression, the intensity of a vibronic transition is calculated by the square of
the vibrational integrals, which is called Franck-Condon factor (FCF).
Most of the electronic transitions observed from our ZEKE/MATI measurements
follow the Franck-Condon principle. Thus, the intensity profile of a ZEKE/MATI
spectrum tells the structural differences of the neutral molecules and ions and the bonding
feature of the removed electrons. A strong 0-0 transition and short vibrational progressions
indicate a small structural change upon ionization. In this case, the ejected electron is

22
weakly attached to the ionic core. In cases where a strongly bonding electron is removed,
the molecular structure exhibits a significant change from the neutral molecule to the ion,
and a weak 0-0 transition is typically observed with long vibrational progressions in the
spectrum. More quantitative information may be obtained by comparing the observed
spectra with spectral simulations.
1.3.2 Calculation of multidimensional FCF
The calculation of multidimensional Franck-Condon factors is the key step to
simulate the vibronic transitions of the experimental spectrum. Prior to the simulations,
the equilibrium geometries, harmonic frequencies of the vibrational modes, and the normal
coordinates of each mode are obtained from the ab initio calculations. However, the
displacements of vibrational modes may be distorted from the neutral state to the ion state.
This is so called the Duschinsky effect.142 To treat this effect, the Eckart rotational matrix
is used to transform the neutral normal coordinates so that they can match the direction of
those of the ions.143-145 More mathematical and computational details can be found in
Shenggang Li's Ph. D. dissertation.146 The FCF program used for this study is improved
by Li146 from the original version.147,148
The PreFCF program is used to extract the geometric and vibrational information
from the output files of the neutral and ions from the ab initio calculations and to generate
the input file for the FCF calculations. In the input file, the energy range, temperature,
band width, and step-size are manually entered according to the individual ZEKE/MATI
spectra. The Boltzmann distribution is considered to account for the hot transitions, and
the Lorentzian line shape is used to describe the ZEKE/MATI band shape.
23
1.4 OVERVIEW OF THESIS
The accurate AIEs of several metal oxide and carbide clusters are characterized
using MATI spectroscopy. By combining the spectroscopic measurements with the ab
initio calculations and spectral simulations, the molecular structures, electronic transitions,
and electron configurations of these clusters are identified. Chapter 2 describes the details
of the experimental setups and theoretical calculations. Chapter 3 presents the results and
discussion of LaO2. Chapter 4 and 5 discuss about the dimetal clusters (La2 and M2O2).
Chapters 6 and 7 are about the trimetal clusters, including M3O4, M3C2 and La3C2O.
Finally, Chapter 8 summarizes the AIEs, binding characters, structures, electronic states,
and some of the vibrational frequencies of all clusters studied in this work.
24
Figure 1.1 Schematic diagram for the conventional PES (a), threshold PES (b), and PFI-
ZEKE/MAIT (c).
v=0
v+=0
v+=1
(a) PES(b) TPES (c) ZEKE/MATI
E
Copyright © Lu Wu 2014

25
CHAPTER 2 METHODOLOGY
2.1 EXPERIMENTS
2.1.1 Experimental setups
The schematic of the home-built spectrometer is illustrated in Figure 2.1.149 It
consists of two vacuum chambers, the source chamber for synthesis and the main chamber
for spectroscopy. The source chamber is pumped by an oil diffusion pump (2200 L/s, DP,
Edwards, Diffstak 250/2000 M), and the diffusion pump is backed by a two-stage
mechanical rotary pump (Edwards, E2M40). The pressure is well-maintained at 10-8-10-7
Torr when the instrument is on standby (standby pressure) and 10-5-10-4 Torr when it is in
operation (working pressure). The pressure in the foreline is kept below 10-3 Torr. An
active inverted magnetron gauge (Edwards, AIM-S-NW25) and a linear active pirani gauge
(Edwards, AGP-M-NW16) are used to monitor the pressures of the source chamber and
the foreline, respectively. The main chamber is evacuated by two turbomolecular pumps
(400 L/s, Seiko Seiki, STP-400), and each turbomolecular pump is backed by a two-stage
rotary mechanical pump (Edwards, E2M40). The standby and working pressures are
typically ~ 10-9 Torr and 10-7-10-6 Torr, respectively, as monitored by an ionization gauge
(Varian, 571). The backing pressure in the foreline is ~ 10-4 Torr as measured by a linear
active pirani gauge (Edwards, APG-L0NW16). The gate valve is electrically controlled
and will close when an unexpected high pressure is detected by the ion gauge in the main
chamber (i.e. beyond the threshold pressure set for the ion gauge). This mechanism works
as a protection for the detector and the turbomolecular pumps in the main chamber.
The source chamber houses a Smalley-type cluster source. Metal clusters are
generated from a metal rod by laser vaporization. The laser pulses (Lumonics YM-800 Nd:
26
YAG, 532 nm, ~ 12 mJ) are focused to a ~ 0.5 mm diameter spot on the surface of the
metal rod by a focal lens (f = 30 mm). The metal rod is translated and rotated by a motor-
driven mechanism (Micro Motor Electronics 1516E012S) to ensure that each laser pulse
ablates on a clean and fresh surface and produces stable metal vapor pulses. The rotating
speed of the motor is changed by a variable resistor to optimize the ion signal, since the
movement of the metal rod may affect the stability and density of the metal vapor. He, Ar,
(Ultra High Purity, Scott-Gross) or He/Ar mixtures with an appropriate ratio are used as
carrier gases, and the backing pressures of these gases are varied from 20 to 100 psi.
Other reagents can also be introduced to the molecular beam if they are needed.
Two methods are commonly used to introduce the gaseous reagents. One is to dope the
reagent in the carrier gas with different concentrations. This method can control the
concentration of the doped reagent, but it is not convenient to change the concentration
continuously. The other method is to introduce the reagent through a stainless-steel tube
to a small collision chamber at or downstream the ablation zone, prior to expansion into
the vacuum chamber. The pressure of the inert gas is carefully controlled by a main gas
valve (NUPRO, SS-4BK or Swagelok, SS-1RS4-A) and a needle valve (Swagelok, SS-
SS4-VH). This method can control the amount of the reagent to optimize the ion signal by
adjusting the valves. It is easy for operation, but does not tell how much reagent is used
each time. The vapor of a liquid ligand is introduced at the room temperature using the
second method to introduce the gaseous reagents. The liquid could be heated when the
vapor pressure is too low or cooled down when the vapor pressure is too high. Ligands in
the solid state are placed inside a copper oven where they are heated to the appropriate
temperature by a heating cartridge. The temperature is controlled by a thermo-controller

27
(Omega CN2110). A copper tube filled with tap water is wrapped around the face plate
surface of the piezoelectric valve to protect the valve from overheating.
The resulting metal clusters are expanded through a cluster tube into the vacuum
chamber. The cluster tube is typically a straight stainless-steel tube, 2 cm in length and 2
mm in diameter. Sometimes, a specially designed S-shape cluster tube is used instead.
The S-shape tube has three advantages in reducing the background. First, it blocks the
scattering ablation laser light from entering the spectroscopic chamber. Second, it
demolishes the plasma generated in the ablation process. Third, it provides more collisions
before the expansion process. Intense collisions can relax the internal energies (In chapter
1, you include the translational energy in the internal energy, make sure you don't confuse
the readers with different definitions) and thus stabilize the clusters. In other words, they
transfer the vibrational and rotational energies to translational energy along the molecular
beam axis. The vibrational temperatures of the molecules are reduced to various degrees
by the energy transfer process. The cooling efficiency strongly depends on the mass, the
backing pressure of the carrier gas, and the property of the metal clusters. Raising the
backing pressure increases the collision frequencies, and the heavier carrier gas has a larger
collision cross section. Both can lead to higher cooling efficiencies. On the other hand,
the effects of the seeded molecules are more complicated and not well studied yet. It might
be related to the sizes, masses, and energy densities of these molecules and is beyond the
scope of this dissertation.
After the supersonic expansion, the molecular beam is collimated and selected 2-5
cm downstream the cluster tube by a skimmer (inner diameter of 0.5-5 mm, typically 2
mm). The skimmer also serves as a pinhole to provide the pressure gradient between the

28
source and main chambers when the gate valve is open. The residual ions and electrons
generated by laser vaporization are removed by a pair of deflection plates (2.5 cm spacing
and ~100 V potential) located right after the skimmer. The neutral molecules travel into
the main chamber for spectroscopic investigation.
The main chamber houses a two-field, space-focused, Wiley-McLaren time-of-
flight (TOF) spectrometer150 with a 34 cm long flight tube and a dual microchannel plate
(MCP) detector (Galileo). The clusters are photoionized by a UV laser, and the resultant
ions are extracted upward into the TOF spectrometry by an electric field applied to a pair
of aluminum cans. The UV laser has a pulse width of 7-10 ns. It is the frequency doubled
output from a tunable dye laser (Lumonics HD-500), which is pumped by the second or
third harmonic output of an Nd: YAG laser (continuum Surelite III). The key component
of the frequency doubling unit is the BBO (beta-Ba2B2O4) crystal. The angle of the crystal
is tuned by a motor driven system (Lumonics HyperTRAK-1000) according to the
wavelength of the dye laser output and controlled by a computer interface. The TOF
spectrometer is shielded by a cylindrical, double-walled, µ-metal shield to protect the
charged particles (especially electrons) from the interference of the external magnetic fields.
The µ-metal consists of 77% nickel, 16% iron, and 5% copper doped by about 2%
chromium or molybdenum. This type of the alloy shows high magnetic permeability and
provides a low reluctance path for the magnetic field. Thus, the -metal offers an effective
shield against the low-frequency magnetic fields, such as the one from the earth poles.

29
2.1.2 TOF mass spectrometry
The ions are extracted and accelerated upward into the TOF tube by an electric field
and detected by a MCP detector. The strength of the electric field is optimized to focus the
axial velocities of the ions with the same masses. The optimum value is found to be 320
V/cm generated by applying +2500 V on the outer aluminum can and +1700 V on the inner
can (Figure 2.1). There are four holes with one inch diameter on the outer can. Two holes
are parallel with the molecular beam and the other two are perpendicular to it. These holes
allow the laser and molecular beams to enter the ionization region. To have a homogenous
electric field between the two cans, the aperture at the bottom of the inner can is covered
with a gold mash of 95% transmittance. The surfaces between the two cans are coated with
a layer of graphite (Sprayon, Dry graphite lube, S00204) to help remove the residual
charges more efficiently.
The MCP detector consists of an array of micro-channels. These micro-channels
lie with a small angle from the normal direction of surface and are isolated by a highly
resistive material. In the presence of a strong electric field, each MCP can gain up to 104.
The signal amplification is 106-107 with the two MCPs arranged in a chevron or V-like
shape and applied by a total voltage of 1800 V. A voltage divider is used to supply the
voltage to the detector, as illustrated in Figure 2.2 (A). The electrons are accelerated to the
anode, and the charge transfer generates analog signals. The analog signals are further
amplified by 25 times by a preamplifier (Stanford Research Systems SR445), averaged by
a boxcar integrator (Stanford Research Systems SR250), converted to digital signals by an
analog-to-digital circuit, and stored in a laboratory computer.

30
The TOF tube is grounded and shielded by the µ-metal to ensure a field-free flight
region. It is assumed that the cations produced by UV laser photoionization are singly
charged because of the following two reasons. First, the second ionization energies (the
energy required to take away an electron from a +1 charged cation) of most species are far
beyond the UV region. Second, the ionization laser is well defocused to minimize the two-
photon ionization process. For the ions of the same charge, their total kinetic energies are
about the same if they are produced at the same position. Thus, the mass-to-charge ratios
of the clusters can be conveniently and uniquely determined by their flight times. Taking
the uniform rectilinear motion (velocity of v) in the TOF tube as a simple model, the kinetic
energy (Ek) of the molecules can be calculated by:
2 2
1 1 2 2
1 1
2 2kE m v m v (2.1)
In Equation (2.1), mi and vi (i = 1, 2) represent the masses and travelling velocities of
different particles. The flight distance (L) can be expressed as a linear function of the flight
time (ti, i=1, 2), as shown in Equation (2.2):
1 1 2 2L v t v t (2.2)
For a charged particle, its flight time and mass have a straightforward relationship:
t A m (2.3)
Where A is a constant related to the structural configuration of the TOF spectrometer.
Thus, if we know the mass (mref) and flight time (tref) of a reference atom or compound, the
mass of an unknown particle can be calculated with its flight time from Equation (2.4):

31
2( )ref
ref
tm m
t (2.4)
Typically, we use aluminum atom as a reference, for which, tref is 3.66 µs and mref
is 27 amu. Alternately, we can use a cluster presented in the molecular beam as a reference.
Because the clusters generally exhibit a stoichiometric form of AmBn or AmBnCl (A, B, and
C are different atoms or molecules; m, n, and l are integers), the identification of each peak
in the mass spectrum is relatively straightforward. I will discuss the details about how to
determine the masses of unknown clusters in the Appendix.
2.1.3 Photoionization efficiency (PIE) spectroscopy
The purpose of the PIE measurements is to estimate the molecular ionization
threshold prior to the ZEKE or MATI experiments. A PIE spectrum records the intensity
of a mass-selected ion signal as a function of the laser wavenumbers. When the photon
energy exceeds the ionization threshold of the molecule, the ion signal exhibits a significant
increase. The cross point of the baseline and sharp onset of the PIE spectrum indicates the
ionization threshold of the molecule.
The PIE experiment can be performed in a dc or a pulsed field mode. If a PIE
measurement is carried in the pulsed field mode, it is called pulsed filed PIE, or PF-PIE.
In the dc mode, dc voltages are applied on the extraction cans (+2500 V and +1700 V on
the outer and inner cans, respectively) to extract the ions. The ionization energy is shifted
to a lower value by the Stark effect of the electric field. The energy shift can be estimated
by an empirical formula:151
32
6.1 fIE E ( fE is in V cm-1 and ΔIE in cm-1) (2.5)
Where fE is the electric field strength, which is 320 V/cm in this case. From Equation
(2.5), the measured ionization energy from the dc mode PIE spectrum is corrected by
adding 110 cm-1. In the pulsed field mode, the neutral molecules are photoionized without
the presence of the electric field. The amplitude of the pulsed electric field is the same as
that of the dc configuration (+1700 V/ +2500 V) and the width of the electric pulse is 5-10
µs depending on the masses of the ions. The pulsed electric field is applied about 1 µs
after the ionization laser pulse to extract the photoionized molecules into the TOF tube.
Although the PIE spectrum does not have enough resolution to resolve the vibrational
transitions, it provides the estimated ionization energy to simplify the ZEKE/MATI
measurements, which offer much higher spectral resolutions.
2.1.4 ZEKE and MATI spectroscopy
MATI and ZEKE spectroscopy have similar experimental setups. They use the
same method to synthesize the clusters and have slightly different designs for electron and
ion detections. Because our MATI setup is modified from the ZEKE apparatus, both
techniques will be discussed in this section.
In the ZEKE measurements, UV laser is tuned to a few wavenumbers below the
ionization energy of the neutral molecules to excite them to the high-lying Rydberg states.
A small dc field (spoiling field, ~0.06 V/cm) is used to separate the electrons produced by
direct photoionization (direct electrons) from the Rydberg molecules. This dc field is
generated by grounding the inner can and applying -0.15 V on the outer can. The dc field

33
correction can be estimated to be ~ 1.49 cm-1 from Equation (2.5), which is smaller than
the typical spectral linewidths of polyatomic metal-containing molecules. Because the
electron has a very small m/z value, the separation of the direct electrons from the ZEKE
electrons is relatively straightforward by the dc field. With about 3 µs delay, a negative
electric pulse (extraction field) is applied to the outer can. This electric pulse has an
amplitude of 3 V (1.2 V/cm) and a time width of 100 ns. The pulsed field effect is measured
to be ~ 1.1 cm-1.152 This field is used to ionize the high-lying Rydberg states, generate
electrons with near-zero kinetic energies, and repel the electrons upwards to the MCP
detector. A voltage divider circuit (Figure 2.2 (B)) is designed to apply an appropriate
voltage on each MCP plate and the anode. To measure the ZEKE spectra, I start with the
excitation laser at a few hundred wavenumbers below the ionization energy measured from
the PIE spectrum and scan the laser to higher wavenumbers step-by-step until no further
signal is observed. The stepsize of the laser scan is decided according to the width of the
ZEKE peaks. Each peak has at least 16 to 20 points (8-10 for the half of the peak) to ensure
the reliability of the peak shape. The laser wavelengths are calibrated by the atomic
transitions of vanadium, titanium, or zirconium.153
The amplitude of the electric field and the time delay of the excitation laser from
the pulsed electric field in the MATI experiment are significantly different from those in
ZEKE. First, because ions are much heavier than the electrons, stronger electric field is
required for extraction. The amplitude of the extraction field is the same as that in the PF-
PIE measurements. Second, to separate the ions produced by direct photoionization (direct
ions) and electric field ionizations (MATI ions), a stronger spoiling dc field (1-15 V) and
a longer delay time are required. The delay time varies with carrier gases and is typically

34
20 µs for He and 50 µs for Ar. The delay of the extraction electric pulse can be changed
by changing the timing of either the laser firing or the electric pulse triggering. In my
experiments, I fix the timing of the electric pulse and change the timing of the excitation
laser. Third, because the MATI measurements use a stronger spoiling field and a longer
delay time, some Rydberg states may not survive within the experimental time scale. An
AC field following the falling edge of the pulsed electric field (320 V/cm, 400 ns) is used
to increase the lifetime of the high-lying Rydberg states.120
2.1.5 Timing sequence and ion characterization
Pulsed delay generators (Stanford Research Systems DG535) are used to
synchronize the pulses of the molecular beam, lasers and electric fields. As shown in
Figure 2.3, T0 is the trigger for the home-made pulsed valve driver; T1 and T2 are the
triggers for the Q-switches of the ablation laser (Nd:YAG, GCR3) and the pump laser
(Surelite III) of the dye laser; t1, t2, and t3 are the triggers for the three electric pulses. In
this type of the experiments, two sets of the events must be synchronized at the ablation
and ionization zones, respectively. In the ablation zone, the pulses of the carrier gas and
the ablation laser must be synchronized so that the metal vapor generated by laser ablation
is seeded in the carrier gas. This is achieved by adjusting the time delay between the
pulsed valve trigger (T0) and the firing time of the ablation laser (T1). The delay time (from
T0 to T1) composes of the opening time of the piezoelectric valve and the traveling time of
the gas pulse. Because the ablation region is only about 3 mm from the pinhole of the
piezoelectric disk, the travelling time of the molecular pulse to the ablation region is small.
Thus, the time delay depends largely on the opening time of the piezoelectric valve and

35
slightly on the traveling speed of the molecular beam. In our experiments, this time delay
is 400 - 500 µs. In the ionization zone, synchronization ensures that the seeded clusters are
excited by the UV laser pulse and then ionized by the extraction field. Thus, the time
difference between the electric and ablation laser pulses equals the traveling time of
molecular beam from the ablation region to the ionization region. It is ~300 µs when He
is used as a carrier gas and ~500 µs when Ar is used. The time delay of the extraction field
from the UV excitation laser is about 1 µs for the PF-PIE measurements, 3 µs for ZEKE,
and 20-50 µs for MATI. The 20-50 µs delay in the MATI measurements is used for
different carrier gases.
2.2 THEORETICAL CALCULATIONS
Ab initio calculations are carried out to help analyze the MATI spectra. The
calculations are performed with GAUSSIAN03/09 and MOLPRO (v. 2010) program
packages installed on the University of Kentucky Hewlett-Packard Superdome Cluster.
Geometry optimization is carried out using the DFT method with Becke’s three parameter
hybrid functional (B3) and the gradient-corrected correlation functionals derived by Lee,
Yang, and Parr (LYP).128-131 Single-point energy calculations are performed for the
optimized structures using the coupled cluster method including single, double and
perturbed triple excitations (CCSD(T)).132-134 Multi-reference calculations including all
the possible electronic configurations are performed for the diatomic and triatomic
molecules.
The Dunning's polarized valence triple-zeta correlation consistent basis set with
augmented diffuse functions (aug-cc-pVTZ) are used for carbon and oxygen154,155 and the

36
effective core potential (ECP) basis sets for the metal atoms (because the calculations with
all-electron basis sets are prohibitively expensive). Los Alamos ECPs (LanL2156-158 and
Stuttgart/Dresden ECPs (SDD)159 are available for the transition metals. They both include
the relativistic effect and are of the same size for the 4th and 5th row transition elements.
For lanthanides, LanL2 ECPs include a uniform potential of 28 electrons and SDD ECPs
include 46 electrons. In the case of multi-reference calculations of the diatomic and
triatomic molecules, the all electron atomic natural orbitals with relativistic core correlation
(ANO-RCC) basis sets are used, which consider the relativistic effect in the second-order
Douglas-Kroll-Hess Hamiltonian.160,161
Frequency calculations of the neutral molecules and ions are performed to identify
the minimum-energy structures and help the vibrational analysis. Multidimensional
Franck-Condon (FC) factors and spectral simulations are carried out with the FCF program
written by Li146.
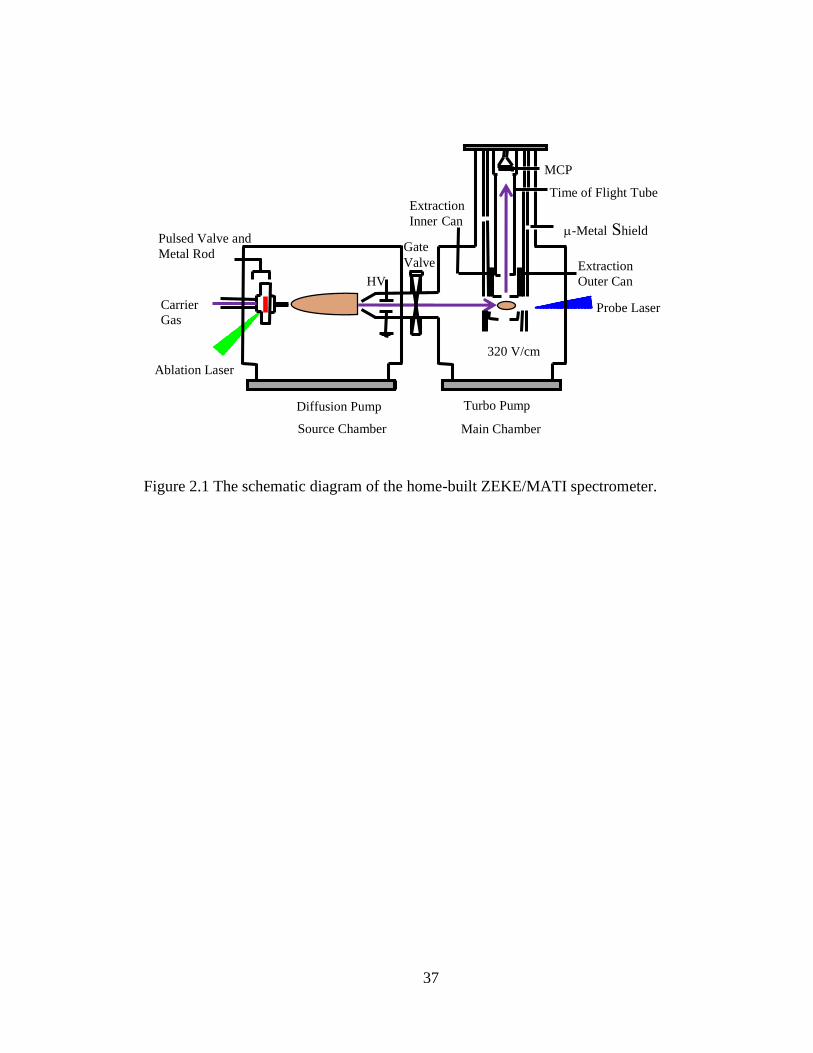
37
Figure 2.1 The schematic diagram of the home-built ZEKE/MATI spectrometer.
Pulsed Valve and
Metal Rod
Carrier
Gas
Extraction
Inner Can
MCP
Detector
-Metal Shield
Turbo Pump Diffusion Pump
HV
Gate
Valve
Time of Flight Tube
320 V/cm
Source Chamber Main Chamber
Ablation Laser
Probe Laser
Extraction
Outer Can

38
Figure 2.2 The schematic diagram of the voltage divider for ion (A) and electron (B)
detections.
20 MΩ
2.2 MΩ
-162 V
-1950 V
Anode (0 V)
Signal
0.89 mm
2 kV/cm ↓
0.86 mm
21 kV/cm ↓
Second Plate
First Plate
(A)
18 MΩ
2 MΩ
+1576 V
+2050 V
Anode (+1863 V)
Signal
0.89 mm
3 kV/cm ↓
0.86 mm
17 kV/cm ↓
1 MΩ
2.2 nF
2.2 nF
1 MΩ 10 kΩ
Second Plate
First Plate
(B)

39
Figure 2.3 Time sequence of the PFI-PIE, ZEKE, and MATI experiments. T0 is the trigger
of piezoelectric pulsed valve; T1 and T2 are the Q-switch triggering times of the ablation
and excitation /ionization lasers; Δ1 and Δ2 are the time delays between the laser flash lamps
and Q-switches; 1t , 2t , and 3t are the rising edges of various electric pulses; and 1w , 2w ,
and 3w are the electric pulse widths.
T0
T1
T2
t1~ (t
1+ w
1)
t2
t3
Δ1
Δ2
Molecular Pulse
Ablation Laser Pulse
Ionization Laser Pulse
Scrambling Electric Field
Extraction Electric Field (Ions and MATI)
Extraction Electric Field (ZEKE)
t2~ (t
2+ w
2)
t3~ (t
3+ w
3)
t1
Flash Lamp
Q-Switch
Q-Switch
Flash Lamp
Copyright © Lu Wu 2014

40
CHAPTER 3 MASS-ANALYZED THRESHOLD IONIZATION AND EXCITED
STATE OF LANTHANUM DIOXIDE
3.1 INTRODUCTION
Transition metal oxides are widely used as both catalysts and catalyst supports in
chemical processes. The widespread and important applications of transition metal oxides
have motivated numerous research groups to study their physical and chemical properties
in the gas phase, where complicating factors such as solvents and counterions are removed.
For transition metal oxide cations, extensive studies have been reported on their
reactivity,40-43 UV-Vis photofragmentation,44-46 and infrared (IR) multiphoton
photodissociation or single-photon vibrational predissociation.47-55 The studies of the
anions were largely carried out with photoelectron spectroscopy,56-71 and additional
investigations were reported about their reactivity40,42,72-75 and IR photodissociation.51,76-78
Neutral metal oxides are more challenging to study experimentally because they are
difficult to size-select, and their formation and properties are usually determined by
ionization techniques, including multiphoton IR79 and single-photon UV80-82 and vacuum
UV laser ionization.83-86 In addition, neutral metal oxides have also been studied by matrix-
isolation IR spectroscopy.87 In spite of the extensive studies, the current knowledge about
the electronic states and molecular structures of polyatomic transition metal oxide clusters
is largely derived from theoretical predictions. However, the reliable prediction of the
electronic and geometric structures is often complicated by the presence of many low-
energy structural isomers and a high density low-lying electronic states of each isomer.
Thus, inconsistent theoretical results have often been reported on the nature of the ground
electronic states and minimum energy structures of both polyatomic neutral molecules88,89

41
and ions.51,90,91 Therefore, a reliable identification of the molecular structures and
electronic states for transition metal oxide clusters and their ions generally requires the
confirmation by spectroscopic measurements, especially by high-resolution spectroscopic
techniques.
Although diatomic transition metal oxides have been well studied, the spectroscopy
of their polyatomic metal oxides is rather limited.162,163 As one of the simplest polyatomic
transition metal oxides, LaO2 has been studied previously by gas-phase guided ion beam
mass spectrometry,164 chemielectron spectroscopy,165-168 and argon matrix-isolation IR
spectroscopy.169 Clemmer et al.164 investigated the thermochemistry of LaO2 and LaO2+
formed in endothermic reactions between LaO+ and NO2 in a guided ion beam mass
spectrometer. In that study, the bond dissociation energies D0 (OLa-O) and D0 (OLa+-O)
were measured as 4.20(33) and 0.99(31) eV, respectively, and the ionization energy (IE)
of LaO2 was 8.11(35) eV. Cockett et al.165-167 reported chemielectron spectra obtained for
the reactions of La atom with O2 in the X3g- and a1g electronic states and assigned spectra
to chemiionization of lanthanum dioxide formed by association reactions. In the spectrum
of La + O2 (X3g
-), they observed two partially resolved vibrational progressions separated
by 250 (50) cm-1 with an averaged interval of 660 (30) cm-1. They assigned the 250 cm-1
separation to the symmetric O-La-O bending mode and the 660 cm-1 interval to the
symmetric La-O stretching mode of the LaO2+ cation. Andrews et al. obtained IR spectra
for the reactions of laser-ablated La, La+ and electrons with O2 in argon matrix and
observed La-O symmetric stretching frequencies of 570 cm-1 for LaO2 and 689 cm-1 for the
LaO2- anion.169 It is interesting to note that the stretching frequency of the LaO2
+ cation
measured from the gas-phase chemielectron spectrum is similar to that of the LaO2-, but is

42
substantially different from that of the LaO2 molecule from the argon matrix-isolation IR
spectra. More recently, Todorova et al. reexamined the chemiionization reactions of La +
O2 using ab initio electronic structure calculations.170 In that study, a bent C2v structure was
predicted for the neutral lanthanum dioxide in the 2B1 ground state and a linear structure
for the cation in the 1g+ ground state. The ionization and bond dissociation energies of
LaO2 were calculated to be 7.99-8.70 and 6.47-6.71 eV, respectively, depending on the
level of theory. A requirement for a chemiionization reaction of a metal oxide molecule to
take place is that its dissociation energy must be greater than its ionization energy. Because
the dissociation energy was smaller than the ionization energy (IE), it was concluded that
the chemiionization reaction La + O2 LaO2+ + e- was endothermic and should not have
contributed to the chemielectron spectra. As an alternative, a two-step process was
proposed for the formation of the chemielectrons under the La + O2 (X3g-) reactions
conditions, which included La + O2 LaO + O and La + O LaO+ + e-. However,
because the measured vibrational interval (660 cm-1) in the chemielectron spectrum is too
small for the La-O stretching frequency of the diatomic LaO+ ion ( > 800 cm-1),169,170 LaO
may not be the carrier of the chemielectrons.
A third hypothesis may be that the chemielectrons were produced by ionization of
an excited electronic state of LaO2. However, nothing is known about any excited states
of the molecule. The objective of this work is to search for and characterize the excited
states of LaO2. The LaO2 molecule is produced in a pulsed laser-vaporization molecule
beam source and characterized by MATI spectroscopy and electronic structure calculations.

43
3.2 EXPERIMENTAL AND COMPUTATIONAL METHODS
3.2.1Experimental
The metal-cluster beam MATI spectrometer used in this work is similar to the ZEKE
apparatus described in a previous publication.171 It consists of two vacuum chambers. The
first houses a Smalley-type cluster source and is pumped by a 2200 l s-1 diffusion pump.
The second chamber houses a time-of-flight spectrometer and is pumped by two 400 l s-1
turbo molecular pump. The time-of-flight spectrometer is composed of a two stage
extraction assembly, a 34 cm long flight tube, and a dual microchannel plate detector
(Burle). The entire spectrometer is housed in a cylindrical, double-walled µ-metal shield.
Lanthanum oxides were produced by laser vaporization (Lumonics YM-800
Nd:YAG, 532 nm,) of a La rod (Alfa Aesa, 99.9%) in the presence of a pulse of ultra-high-
purity He (or Ar) carrier gas delivered by a homemade piezoelectric pulsed valve.172 The
metal vapor and carrier gas passed down a clustering tube (2 mm inner diameter, 2 cm
length), and the resultant clusters were supersonically expanded into the vacuum chamber.
The supersonic jet was skimmed (2 mm diameter) 3 cm downstream from the exit end of
the clustering tube. A pair of deflection plates (2.5 cm spacing, 220 V) located after the
skimmer was used to remove residual charged species (formed during laser ablation) from
the molecular beam before it entered the second chamber.
Prior to the MATI measurements, photoionization time-of-flight mass spectra were
recorded to determine the chemical content of the cluster beam, and pulsed-field-ionization
photoionization efficiency spectra were recorded to locate the ionization threshold of La2.
With the ionization laser set above the ionization threshold, the experimental conditions
(e.g., timing and power of the vaporization and ionization lasers and the backing pressure

44
of the carrier gas) were carefully optimized to maximize the intensity of the LaO2+ signal
in the mass spectrum.
With the optimized experimental conditions, LaO2 was excited to high-lying
Rydberg states in a single-photon process by the frequency-doubled output of a dye laser
(Lumonics HD-500) pumped by a Nd:YAG laser (Quanta Ray GCR-3, 355 nm) and then
ionized by an electric pulse (DEI PVM-4140, 320 V cm-1). The laser beam was collinear
and counter propagating with the molecule beam. The time delay between the laser and
electric pulses was varied to maximize the MATI signal, and it was typically 20 s for He
carrier and 50 s for Ar. A small DC field (4.1 V cm-1) was applied to help separate the
prompt ions produced by direct photoionization from the MATI ions produced by delayed
field ionization. The MATI signal was obtained by scanning the wavelength of the tunable
dye laser, detected by a dual microchannel plate detector, amplified by a preamplifier (SRS
SR445), averaged by a gated integrator (SRS SR250), and stored in a laboratory computer.
Laser wavelengths were calibrated against vanadium atomic transitions in the spectral
region.153 The Stark shift induced by the DC field was calculated using the relation of IE
= 6.1Ef1/2, where Ef is in V cm-1 and E in cm-1.151
3.2.2 Computational
DFT and ab initio molecular orbital theory methods were used to calculate
equilibrium geometries and vibrational frequencies of the low-lying electronic states of
LaO2 and LaO2+. Single-reference calculations included DFT with Becke’s three
parameter hybrid functional with the correlation functional of Lee, Yang and Parr
(B3LYP),128,129 second-order Møller-Plesset (MP2) perturbation,173 and coupled cluster

45
with single, double and perturbative triple excitations (CCSD(T))174,175 methods. The
oxygen atomic orbitals were described by aug-cc-pVTZ basis set 176 or the 6-311g(d)
valence triple split basis set.177 La atomic orbitals were represented by the Stuttgart-type
relativistic effective core potential basis with 28 core electrons, that is, Stuttgart RSC
ANO/ECP.178 All of these single-reference calculations were carried out with Gaussian 09
program.179
Multi-reference methods, complete active space self-consistent field
(CASSCF)180,181 and CAS with second-order perturbation theory (CASPT2)182, were used
to characterize electron configurations of the electronic states of lanthanum dioxide and its
cation. A level shift technique183 was employed, if necessary, to avoid intruder state
problems in the CASPT2 calculations. In the CASSCF and CASPT2 calculations, the full-
electron atomic natural orbital with relativistic core correlation (ANO-RCC)184 basis set
and the second-order Douglas–Kroll–Hess Hamiltonian160,161 were employed to treat the
scalar relativistic effect. In the ANO-RCC basis, the primitive set of (24s, 21p, 15d, 5f, 3g,
2h) was contracted to (11s, 10p, 8d, 5f, 3g, 2h) for the La atom, and the (14s, 9p, 4d, 3f,
2g) primitive set was contracted to (8s, 7p, 4d, 3f, 2g) for the O atom. Because the La atom
has an outmost valence electron configuration of 5d16s2, three electrons and six orbitals (6s
and 5d) were included in the complete active space for the La atom. Because the O atom
has a valence electron configuration of 2p4, four electrons and three orbitals (2p) were used
in the active space for each O atom. Thus, the active space for the LaO2 molecule included
11 electrons and 12 orbitals, i.e., (11, 12), and that for LaO2+ was (10, 12). All of the multi-
reference calculations were performed using MOLPRO 2010.1 program.185

46
To compare with the experimental spectrum, Franck-Condon (FC) factors were
calculated using the equilibrium geometries, harmonic frequencies, and normal mode
coordinates of the neutral molecule and cation.146,147,186 In these calculations, recursion
relations187 were employed and the Duschinsky effect142 was taken into consideration.
Spectral simulation was obtained using the experimental linewidth and a Lorentzian line
shape. Transitions from exited vibrational levels of the neutral molecule were considered
by assuming thermal excitation at specific temperatures.
3.3 RESULTS AND DISCUSSION
3.3.1 MATI spectrum
Figure 3.1(a) presents the MATI spectrum of LaO2 seeded in He carrier gas. LaO2
was formed without addition of external oxygen gas. The presence of oxygen was due to
either the impurity of the He gas or to the La rod. The spectrum displays the most intense
band at 40134 (5) cm-1 or 4.9760(8) eV and a major progression of the 656(1) cm-1. Nested
inside the major progression is a second progression with intervals of 122(1) cm-1. In
addition, the spectrum exhibits a weak band 92 (1) cm-1 below each member of the 656 cm-
1 progression. The energy position of the origin band corresponds to the adiabatic IE of a
neutral state of the molecule. The 656 and 122 cm-1 progressions are due to transitions
from the ground vibrational level of a neutral state to vibrational levels of two modes of an
ion state, whereas the 92 cm-1 weak bands are due to transitions from an excited vibrational
level of a neutral mode to the ion. At first view, the 122 cm-1 progression was thought to
be vibrational sequence bands from excited vibrational levels of a neutral mode to various
levels of an ion mode. However, additional measurements with Ar or He/Ar carriers show

47
no changes of the relative intensity (though the signal was weaker), indicating they are not
vibrational hot bands.188 Moreover, if these transitions were sequence bands, the frequency
difference between the neutral and ionic modes would be as large as 122 cm-1. Such a large
frequency difference suggests a large geometry change from the neutral molecule to the
ion, inconsistent with the observed short FC profile.
The LaO2 molecule and its cation may be linear or bent. A linear structure could
have a Dh symmetry (OLaO) with one totally symmetric vibrational mode (g+) or a Cv
symmetry (LaOO) with two symmetric modes (+), whereas a bent structure could have a
C2v symmetry (OLaO) with two symmetric modes (a1) or a Cs symmetry (LaOO) also with
two symmetric modes (a). Because the spectrum displays two active vibrational modes of
656 and 122 cm-1 for the ion state, LaO2+ should be in a bent C2v (or Cs) structure or a linear
Cv geometry from the viewpoint of the first-order selection rule. Because the spectrum
exhibits a strong origin band and a short FC intensity profile, both the neutral and ion states
should be in the same structural configuration, as a linear-bent conversion between the two
states would produce a spectrum with a very weak origin band and a long FC intensity
profile. As discussed in the Introduction, Todorova et al. reported a theoretical study of
the gas-phase chemiionization reactions of La with oxygen atoms or molecules.170 Using
DFT and ab initio molecular orbital theory methods, they predicted the ground states of
LaO2 and LaO2+ to be 2B1 (C2v) and 1g
+ (Dh), respectively, and the IE values for the
ionization process of LaO2+ (1g
+, Dh) ← LaO2 (2B1, C2v) to be in the range of 7.99-8.70
eV. Obviously, this ionization process cannot be associated with the observed spectrum,
as the predicted IEs are more than 3.0 eV higher than the measured value and the bent-
linear structural conversion would yield a much longer FC profile than the experimental
48
spectrum. To help assign the electronic states and molecular structures involved in the
MATI transitions, we performed an extensive theoretical search of molecular structures
and electronic states, and the results are described below.
3.3.2 Low-lying electronic states of lanthanum dioxide (OLaO), lanthanum peroxide
(La(O2)), lanthanum superoxide (LaOO), and their cations
Figure 3.2 shows the possible structures of LaO2 that were considered in our
calculations. These structures include bent and linear lanthanum dioxides (OLaO), bent
lanthanum peroxide (La(O2)), and linear lanthanum superoxide (LaOO). A bent lanthanum
superoxide was also considered, but it was converged to the linear structure upon geometry
optimization. Table 3.1 summarizes the electronic states and energies, geometries, and
vibrational frequencies from the DFT/B3LYP calculations. Among all the oxides, the
OLaO dioxide is the most stable isomer, followed by the La(O2) peroxide and the LaOO
superoxide. For the OLaO dioxide, the bent structure (C2v) is slightly more stable than the
linear structure. The ground electronic state of the bent dioxide is predicted to be 2B2.
Above the 2B2 state, a 4B2 state is located at 3.40 eV. Ionization of the 2B2 state of the bent
oxide yields a linear structure (Dh) in the 1g+ ionic state; on the other hand, ionization of
the 4B2 state leads to a 3B2 ionic state also in the bent configuration. The 1g+ ionic state
could also be formed from ionization of the 2u+ neutral state, which is 0.05 eV above the
2B2 state. The prediction of the 2B2 and 1g+ states are consistent with the previous
calculations.170 However, the 4B2 and 2u+ neutral states and the 3B2 ionic state are reported
for the first time. (It is noted that the 2B2 state was previously labeled as 2B1 because of a
different axis orientation in the Cartesian coordinate system.)

49
For the La(O2) peroxide (C2v), the ground state of the neutral molecule is 2A1,
followed by an excited 4A2 state at ~ 2.3 eV; the ground state of the cation is 1A1, followed
by an excited 3A1 state at ~ 2.2 eV. The structural differences between the dioxide and
peroxide are very clear. For example, the O-La-O angle and the O-O distance in the 2B2
state of the dioxide are 146.3o and 3.73 Å, whereas the corresponding angle and distance
in the 2A1 state of the peroxide are 42.0o and 1.49 Å, respectively. The O-O distance in the
dioxide is too far apart to have any significant interaction between the oxygen atoms, while
the O-O distance in the peroxide is close to the characteristic lengths of a single O-O bond
(1.48 Å).189 Moreover, the O-O stretching frequency of the La(O2) 2A1 state is predicted
to be 872 cm-1, which is very close to the O-O stretching frequencies of 878 or 866 cm-1 of
hydrogen peroxide (H2O2).190 For the LaOO superoxide (Cv), the ground states of the
neutral molecule and cation are predicted to be 2+ and 1+, respectively. The O-O distance
(1.37 Å) in the 2+ neutral state is comparable to the bond length of molecular oxygen
anion (O2-) (1.35 Å)160 and to the characteristic bond length of a superoxide compound
(1.34 Å).189 The O-O bond in the LaOO can be considered to have a bond order of 1.5
and an averaged bond distance of the double and single O-O bonds. The calculated O-O
stretching frequency (942 cm-1) in the 2g+ neutral state of LaOO is also close to that of
hydrogen superoxide radical (HOO·) (929 cm-1)190 and comparable to that of molecular
oxygen anion (1090 cm-1).160
3.3.3 Ionization of an excited state of lanthanum dioxide (OLaO)
The electronic transition responsible for the observed MATI spectrum can be
determined by comparing the measured and predicted AIEs, vibrational frequencies, and

50
intensity profiles. As discussed in Section IIA, the experimental AIE is 4.9760 eV, and the
measured frequencies are 656 and 122 cm-1 for the cation and 92 cm-1 for the neutral
molecule. From Table 3.1, the AIEs of the 3B2 ← 2B2, 1g
+ ← 2B2, and 1g+ ← 2u
+
transitions of the OLaO dioxide are predicted to be 9.03, 8.68, and 8.63 eV, respectively,
and the AIE of the 3A2 ← 2A1 ionization of the La(O2) peroxide is 7.72 eV. Because the
predicted AIEs are 3.0 eV higher than the measured AIE and the difference is much larger
than any expected computational errors, the above transitions can safely be excluded from
the MATI spectrum. On the other hand, the predicted AIEs of the 3B2 ← 4B2 transition of
the dioxide, the 1A1 ← 2A1 and 3A2 ← 4A2 transitions of the peroxide, and the 1+ ← 2+
transition of the superoxide are all much closer to the experimental value.
For these cases, the comparison of the experimental and theoretical AIEs alone is
not sufficient for the electronic-state assignment. Therefore, vibrational frequencies are
considered as well. Table 3.1 shows that none of the vibrational frequencies of the 1+
state of (LaOO)+ and the 3A2 state of [La(O2)]+ matches the measured 656 or 122 cm-1
vibrational intervals. Although the symmetric bending frequency (2) of the [La(O2)]+
1A1 state (610 cm-1) is in reasonable agreement with the 656 cm-1 interval, the singlet ionic
state does not show any frequency comparable to the 122 cm-1 mode. In addition, none
of the initial states in the 1A1 ← 2A1 and 3A2 ← 4A2 transitions of the peroxide and the 1+
← 2+ transition of the superoxide exhibits a mode comparable to the measured 92 cm-1
mode. Thus, none of the above three transitions should be associated with the MATI
spectrum. On the other hand, the symmetric O-La-O bending frequencies (2) of the 4B2
and 3B2 states of the OLaO dioxide (90 and 113 cm-1) are in excellent agreement with the
observed vibrational intervals of 92 and 122 cm-1, even though the calculated symmetric

51
La-O stretching frequency (1, 562 cm-1) of the 3B2 state at the B3LYP level is substantially
underestimated when compared to the experimental value of 656 cm-1. Considering both
the AIE and the vibrational frequencies, 3B2 ← 4B2 is the most likely transition probed by
the MATI experiment. This conclusion is further supported by considering the spectral
intensity profile. Figure 3.1(b-e) shows the simulations from transitions of 3B2 ← 4B2 of
OLaO, 3A2 ← 4A2 and 1A1 ← 2A1 of La(O2), and 1+ ← 2+ of LaOO. In these simulations,
the calculated frequencies are not scaled, but the theoretical AIEs are shifted to the
experimental origin band for comparison. Frequency scaling is often used for the high-
frequency modes of organic molecules, but from our previous studies of numerous metal
complexes, the scaling practice does not work for the low-frequency vibrational modes.191
Low-frequency metal-ligand vibrational modes are more difficult to treat theoretically, and
predicted values can be on either side of the experimental measurements. As shown in
Figure 3.1, the 3A2 ← 4A2 and 1A1 ← 2A1 transitions of La(O2) (Figure 3.1c,d) and the 1+
← 2+ transition of LaOO (Figure 3.1e) fail to reproduce the experimental 122 cm-1
progression and the 92 cm-1 hot bands. On the other hand, the simulation of the 3B2 ← 4B2
transition of OLaO (Figure 3.1b) is in very good agreement with the experimental spectrum.
In an attempt to improve the theoretical AIEs and vibrational frequencies,
calculations at higher levels of theory were carried out for the observed 3B2 and 4B2 states
of OLaO. Table 3.2 summarizes the spectroscopic constants from MATI measurements
and DFT/B3LYP, MP2, CCSD, CCSD(T) and CASPT2 calculations. The wave-function-
based ab initio methods yield slightly better AIEs (5.37-5.39 eV) than the DFT method
(5.55 eV). For the vibrational analysis of the 3B2 ionic state, the MP2 method produces the

52
best frequency for the La-O stretching mode (1, 601 cm-1), whereas the CASPT2 method
gives the best frequency for the O-La-O bending mode (2, 121 cm-1). For the O-La-O
bending mode (2) of the 4B2 neutral state, the B3LYP, MP2, CCSD, CASPT2 and
CCSD(T) calculations all give bending frequencies within less than 15 cm-1 of experiment,
the accuracy expected for such a low frequency mode. No single method produces uniform
results matching the experimental values. The biggest issue is that all of the methods
underestimate the value of the stretching frequency for the 3B2 ionic state by 50 to 100 cm-
1.
Figure 3.3a presents the valence electron configuration of the 4B2 state of OLaO,
1a121b2
21a221b1
22a112b2
13a11, from the CASPT2 calculations. 1a1
21b221a2
21b122a1
12b21 are
oxygen 2p-based orbitals and 3a11 (highest occupied molecular orbital, HOMO) is a La 6s-
based orbital. Because the ground electron configuration of La is 5d16s2, the formation of
the 4B2 state of OLaO results in two-electron transfer from the metal to oxygen atoms.
Thus, the formal oxidation states of O and La in the 4B2 state are -1.0 and +2.0, respectively.
Ionization of the 4B2 neutral state removes the La 6s-based electron from the HOMO and
gives out a 3B2 ion ground state. Because the HOMO is essentially a non-bonding orbital,
the ion state has a similar geometry to the neutral state and the MATI spectrum has a short
FC intensity profile. In contrast to the 4B2 state, the 2B2 state has an electron configuration
of 1b221a2
21a121b1
22a122b2
1, where the HOMO (2b21) is an oxygen 2p-base orbital (Figure
3.3b). The formation of the 2B2 state leads to three electron loss of La to O. Thus, the
formal oxidation states of La and O in this case are -1.5 and +3.0, respectively. Because
the HOMO is an oxygen 2p-based orbital, the removal of this electron requires much higher

53
energy in the presence of the +3 lanthanide field. This explains why the predicted AIE of
the 2B2 state is much higher than that of the 4B2 state.
Dissociation of the 4B2 excited state of OLaO could give the La atom in an excited
state 4F and the O2 molecule in an excited state of a1g with spin conservation. The 4F
(5d26s1) state is 0.33 eV above the ground state 2D(5d16s2).153,161 The dissociation energies
of this process are predicted to be 5.81, 5.38, and 5.25 eV by the B3LYP, MP2, and
CCSD(T) calculations. The dissociation energy is slightly larger than the AIE at the
B3LYP level, but slightly smaller at the MP2 and CCSD(T) levels (Table 3.2). Because
the inconsistent trends of the predicted dissociation and AIEs, no conclusion could be made
about if the previous chemielectron spectrum165-167 was produced by ionization of the
OLaO 4B2 state. However, because the La-O stretching frequency of the [OLaO]+ 3B2
state (656 (1) cm-1) measured from our MATI spectrum is consistent with the value (660
(30) cm-1) from the chemielectron spectrum, LaO2 seems to be the carrier of the
chemielectrons. An accurate measurement for the dissociation energy of the OLaO 4B2
state is required to settle this problem in a more definitive manner.
3.4 CONCLUSIONS
A MATI spectrum is reported for the first time for LaO2 seeded in a supersonic
molecular beam. The spectrum exhibits a strong origin band, La+-O stretching and O-La+-
O bending progressions, and thermal excitation of the La-O stretching mode. Our
combined experimental and computational analysis shows that the spectrum involves
ionization of an excited high spin electronic state of lanthanum dioxide. This process is
determined to be the 3B2 ← 4B2 transition. The 4B2 excited neutral state is formed by

54
transferring two La electrons to oxygen atoms and has a valence electron configuration
consisting of oxygen 2p- and lanthanum 6s-based orbitals. The 3B2 state is formed by the
removal of the non-bonding La 6s electron and has a molecular geometry similar to the 4B2
neutral state. The ground state of the lanthanum dioxide was predicted to be a doublet,
but it was not observed by the experiment, most likely because of its much higher ionization
energy. In addition to possible transitions of the dioxide, ionization processes of lanthanum
peroxide and superoxide were considered as well, but they were excluded after comparison
with the experimental spectrum. This is the first example where a single-photon MATI
spectrum is observed from an excited initial electronic state at several electronvolts above
the ground electronic state.

55
Table 3.1 Electronic states, geometries (RLa-O for OLaO and RLa-O/RO-O for LaOO and
La(O2)), A (for O-La-O or La-O-O), vibrational frequencies (i),a relative energies
(Erel), and adiabatic ionization energies (AIE) of lanthanum dioxide (OLaO, C2v or Dh),
lanthanum peroxide [La(O2), C2v], and lanthanum superoxide (LaOO, Cv) from the
B3LYP calculations with aug-cc-pVTZ basis set for O atoms and SDD ECP and basis set
for the La atom. Reprinted with permission from J. Chem. Phys., 137, 034207 (2013),
Copyright 2013 AIP Publishing LLC.
States R(Å) A(o) 1(cm-1) 2(cm-1) 3(cm-1) Erel (eV) AIE (eV)
OLaO 2B2 (C2v) 1.95 146.3 622 142 388 0 9.03 (3B2 ← 2B2)
2u+ (Dh) 1.95 180.0 609 56 457 0.05 8.68 ( 1g
+ ← 2B2) 4B2 (C2v) 2.17 118.9 494 90 445 3.40 8.63 ( 1g
+ ← 2u+ )
(OLaO)+ 5.63 (3B2 ← 4B2) 1g
+ (Dh) 1.83 180.0 631 194 750 8.68 3B2 (C2v) 2.10 114.7 555 113 487 9.03
La(O2) 2A1 (C2v) 2.08/1.49 42.0 872 573 481 2.01 7.72 (3A2 ← 2A1) 4A2 (C2v) 2.36/1.33 32.6 1203 382 335 4.34 5.56 (1A1 ← 2A1)
[La(O2)]+ 5.39 (3A2 ← 4A2) 1A1 (C2v) 2.03/1.49 43.0 890 610 521 7.57 3A2 (C2v) 2.29/1.32 33.6 1197 423 383 9.73
LaOO 2 (Ch) 1.93/1.37 180.0 942 504 188 3.98 6.04 ( 1+ ← 2+ )
(LaOO)+ 1 (Ch) 1.92/1.33 180.0 990 525 203 10.02
a For C2v or Dh dioxide, 1, 2 and 3 are the symmetric La-O stretch (a1 or g+), O-La-O
bend (a1 or u) and asymmetric La-O stretch (b2 or u+), respectively. For C2v peroxide, 1,
2 and 3 are the symmetric O-O stretch (a1), symmetric La-O2 stretch (a1) and asymmetric
La-O2 stretch (b2), respectively. For Cv superoxide, 1, 2 and 3 are symmetric O-O
stretch (+), symmetric La-O stretch (+) and degenerate La-O-O bend (), respectively.

56
Table 3.2 Electronic states, geometries (RLa-O, A for O-La-O ), and vibrational
frequencies (i),a of the 4B2 and 3B2 states and adiabatic ionization energies (AIE) of the
4B2 state of bent lanthanum dioxide (OLaO, C2v) from MATI spectroscopy and theoretical
calculations.b Reprinted with permission from J. Chem. Phys., 137, 034207 (2013), Copyright
2013 AIP Publishing LLC.
Methods R(Å) A(o) 1 (cm-1) 2 (cm-1) 3 (cm-1) AIE(eV)
MATI 4B2 92 4.9760(6) 3B2 656 122
CASPT2c
4B2 2.18 118.8 490 105 497 5.57 3B2
2.12 113.5 556 121 551
B3LYP 4B2 2.17 119.1 512 86 449 5.55 3B2
2.10 114.7 562 107 487
MP2 4B2 2.16 117.5 548 86 543 5.53 3B2
2.10 112.2 601 98 605
CCSD 4B2 2.17 118.8 535 89 526 5.38 3B2
2.11 114.0 586 94 583
CCSD(T) 4B2 2.16 119.5 530 82 510 5.37 3B2
2.10 112.0 565 65 563
a The vibrational modes of 1 , 2 and 3 are the symmetric La-O stretch (a1), O-La-O bend
( 1a ) and asymmetric La-O stretch ( 2b ), respectively.
b The ANO-RCC basis set on La and O was used for the CASPT2 calculations. The
Stuttgart RSC ANO/ECP basis set on La and 6-311G(d) basis set on O were used for the
other calculations.
c Vibrational frequencies calculated at the CASSCF level.

57
Wavenumber (cm-1
)
40000 40500 41000 41500
0-0
656
40134
12292
(a) Experiment
(b) OLaO(3B2 4B2)
(c) La(O2) (3A2 4A2)
(d) La(O2) (1A1 2A1)
(e) LaOO (1+ 2+)
Figure 3.1 MATI spectrum of LaO2 seeded in He (a) and simulations (100 K) of the 3B2 ←
4B2 transition of lanthanum dioxide (OLaO) (b), the 3A2 ← 4A2 (c) and 1A1 ← 2A1 (d)
transitions of lanthanum peroxide (La(O2)), and the 1+ ← 2+ transition of lanthanum
superoxide (LaOO) (e). Reprinted with permission from J. Chem. Phys., 137, 034207 (2013),
Copyright 2013 AIP Publishing LLC.

58
a) OLaO (C2v) b) OLaO (Dh) c) La(O2) (C2v) d) LaOO(Cv)
Figure 3.2 Possible structures of LaO2: lanthanum dioxide (OLaO) (a, b), lanthanum
peroxide [La(O2)] (c) and lanthanum superoxide (LaOO) (d). A bent lanthanum
superoxide was also considered, but it converged to the linear structure upon
geometry optimization. Reprinted with permission from J. Chem. Phys., 137, 034207
(2013), Copyright 2013 AIP Publishing LLC.

59
b) OLaO (2B2)
2b2
2a1
1b1
1a1
1a2
1b2
a) OLaO (4B2)
3a1
2b2
2a1
1b1
1a2
1b2
1a1
Figure 3.3 Valence electron configurations of the 4B2 (a) and 2B2 (b) states of lanthanum
dioxide (OLaO). The molecule is placed on the yz plane. The relative energy orderings of
the valence molecular orbitals are different in the two states. Two electrons are
transferred from La to two O atoms in the formation of the 4B2 state, which has the
HOMO of largely a La 6s character. On the other hand, three electrons are transferred
from La to two O atoms to form the 2B2 state, which has the HOMO of largely an O 2p
character. Reprinted with permission from J. Chem. Phys., 137, 034207 (2013), Copyright
2013 AIP Publishing LLC.
Copyright © Lu Wu 2014

60
CHAPTER 4 ELECTRONIC STATES AND SPIN-ORBIT SPLITTING OF
LANTHANUM DIMER
4.1 INTRODUCTION
Identification of the ground electronic states of transition metal clusters challenges
experimentalists and theorists because of the high-density of low-lying spin states arising
from the metal d electrons. Dilanthanum may be among the simplest homonuclear
diatomics, since the ground electron configuration of the metal atom (6s25d1) has only one
unpaired electron. In spite of this seemly simplicity, the ground electronic state has not yet
been established for the neutral molecule, and low-lying electronic states have not been
reported for the singly charged cation.
In 1992, Dolg and coworker reported the first high-level theoretical study-
configuration interaction (CI) and correlation-energy DFT calculations for La2.192 The
ground state was predicted to be 5u- with the vibrational frequency of 130 cm-1 and the
dissociation energy of 1.17 eV. Since the ground states of Sc2163,193-195 and Y2
196-198 have
been reported as 5u-, the prediction of the quintet ground state for La2 might be expected
because the three metals have the same ground electron configuration [ns2(n-1)d1].
However, the predicted vibrational frequencies and dissociation energies were in
disagreement with the results obtained from argon matrix-isolation Raman spectroscopy.199
In the Raman study, Lombardi and coworkers reported the vibrational frequency of 236.0(8)
cm-1 and the dissociation energy of 1.8(3) eV. The bond energies from the theoretical
prediction and Raman spectroscopy were both low compared to the value of 2.50 (22) eV
reported by Verhaegen et al.200 The Verhaegen’s value was obtained by applying the third-

61
thermodynamic-law method to mass spectrometric measurements of dilanthanum
produced in a Knudsen cell.200 However, using the third-law method to derive bond energy
requires the knowledge of the electronic state and partition function, which was unknown.
Moreover, Knight et al.201 failed to obtain an electron spin resonance (ESR) spectrum for
La2, whereas the similar experimental conditions gave a spectrum for Sc2.193 The ESR
study showed that Sc2 had a 5u- ground state. These observations were interpreted as
suggesting that the ground state of La2 might be a singlet. In 2002, Cao and Dolg extended
their 1992’s theoretical study to higher level theories.202 They performed calculations by
using the coupled cluster with single, double, and perturbative triple excitation [CCSD(T)],
the complete active space self-consistent field (CASSCF), and the multi-reference
configuration interaction (MRCI) methods with relativistic effective core potential basis
set and found that the ground state of La2 was likely 1g+. The best estimates of the
vibrational frequencies and bond energies were 186 (13) cm-1 and 2.31(13) eV, respectively.
Although the bond energy is more close to the experimental values, the vibrational
frequency is still significantly underestimated. More recently, DFT calculations were used
to study lanthanum clusters,203 and several lanthanide dimers.203,204 These DFT
calculations predicted that the ground states of La2 were either a singlet204 or a triplet203,
with vibrational frequencies in the range of 140-163 cm-1 and bond energies of 1.1 -3.7
eV.
We report here the determination of the ground electronic states of La2 and low-
lying states of La2+ using a synergestic experimental and theoretical approach. The first
electronic spectrum of La2 was obtained with single-photon MATI spectroscopy, a sister
technique of PFI-ZEKE spectroscopy. Low-lying electronic states of the neutral molecule

62
and cation were obtained with CASSCF, CAS with second-order perturbation theory
(CASPT2), MRCI, and MRCI with Davidson’s cluster correction (MRCI+Q) multi-
configuration ab initio methods. Single-photon ZEKE experiments have demonstrated
tremendous potential to provide vibronic and structural information for metal-organic
complexes.191 On the other hand, correlating ZEKE signals with a particular metal cluster
is less straightforward. This is because the metal cluster synthesis in molecular beams is
less selective than that of metal-organic complexes, and the IEs of neighboring cluster sizes
are often close to each other.81,82 MATI is attractive for studying metal clusters because of
the inherent mass selection. However, its potential applications to metal clusters remain to
be explored.205,206 The observed MATI spectrum of La2 is shown to be consistent with the
a2g+ ← X1g
+ and b2u ← X1g+ transitions. Both experimental measurements and
theoretical calculations show that the ground electronic state of La2 is X1g+. The ground
state of La2 is different from that of the other dimers in the same group (Sc2 and Y2), for
which the ground state has been reported as X5u-.
4.2 EXPERIMENTAL AND COMPUTATIONAL METHODS
4.2.1 Experiment
The metal-cluster beam MATI spectrometer used in this work is similar to the
ZEKE apparatus described in a previous publication.207 It consists of two vacuum
chambers. The first houses a Smalley-type cluster source and is pumped by a 2200 l s-1
diffusion pump. The second chamber houses a time-of-flight spectrometer and is pumped
by two 400 l s-1 turbo molecular pump. The time-of-flight spectrometer is composed of a
two stage extraction assembly, a 34 cm long flight tube, and a dual microchannel plate
63
detector (Burle). The entire spectrometer is housed in a cylindrical, double-walled, µ-metal
shield.
Lanthanum clusters were produced by laser vaporization (Lumonics YM-800
Nd:YAG, 532 nm,) of a La rod (Alfa Aesa, 99.9%) in the presence of a pulse of ultra-high-
purity He (or Ar) carrier gas delivered by a homemade piezoelectric pulsed valve.172 The
metal vapor and carrier gas passed down a clustering tube (2 mm inner diameter, 2 cm
length), and the resultant clusters were supersonically expanded into the vacuum chamber.
The supersonic jet was skimmed (2mm diameter) 3 cm downstream from the exit end of
the clustering tube. A pair of deflection plates (2.5 cm spacing, 220V) located after the
skimmer was used to remove residual charged species (formed during laser ablation) from
the molecular beam before it entered the second chamber.
Prior to the MATI measurements, photoionization time-of-flight mass spectra were
recorded to determine the chemical content of the cluster beam, and pulsed-field-ionization
photoionization efficiency (PIE) spectra were recorded to locate the ionization threshold
of La2. With the ionization laser set above the PIE threshold, the experimental conditions
(e.g., timing and power of the vaporization and ionization lasers and the backing pressure
of the carrier gas) were carefully optimized to maximize the intensity of the La2+ signal in
the mass spectrum.
With the optimized experimental conditions, La2 was excited to high-lying Rydberg
states in a single-photon process by the frequency-doubled output of a dye laser (Lumonics
HD-500) pumped by a Nd:YAG laser (Quanta Ray GCR-3, 355 nm) and then ionized by
an electric pulse (DEI PVM-4140, 320 V cm-1). The laser beam was collinear and counter
propagating with the molecule beam. The time delay between the laser and electric pulses

64
was varied to maximize the MATI signal, and it was typically 20 s for He carrier and 50
s for Ar. A small DC field (1.2 V cm-1) was applied to help separate the prompt ions
produced by direct photoionization from the MATI ions produced by delayed field
ionization. MATI signal was obtained by scanning the wavelength of the tunable dye laser,
detected by a dual microchannel plate detector, amplified by a preamplifier (SRS SR445),
averaged by a gated integrator (SRS SR250), and stored in a laboratory computer. Laser
wavelengths were calibrated against vanadium atomic transitions in the spectral region.153
The Stark shift induced by the DC field was calculated using the relation of IE = 6.1Ef1/2,
where Ef is in V cm-1 and E in cm-1.151
4.2.2 Computation
Equilibrium geometries and harmonic vibrational frequencies of the low-lying
electronic states of La2 and La2+ were calculated using CASSCF180,181 and CASPT2182
methods. A level-shift technique183 was employed, if necessary, to avoid the intruder state
problem in the CASPT2 calculations. Single-point energies of the electronic states were
refined at the MRCI and MRCI+Q levels.208 Spin-orbit splitting was calculated using the
state interaction method,209 where the spin-orbit matrix elements were first obtained at the
CASSCF level, and the diagonal elements of the matrix were then replaced by the CASPT2
energies. In all these calculations, the full-electron atomic natural orbital with relativistic
core correlation (ANO-RCC)184 basis set and the second-order Douglas–Kroll–Hess
Hamiltonian160,161 were employed to treat the scalar relativistic effect. In the ANO-RCC
basis set of La atom, the primitive set of (24s,21p,15d,5f,3g,2h) was contracted to
(11s,10p,8d,5f,3g,2h) basis functions. Since La atom has an electron configuration of

65
[Xe]6s25d1, three electrons and six orbitals are included in the complete active space of the
La atom, i.e., CAS (3, 6); and two electrons and six orbitals are in the active space of the
La+ ion, i.e., CAS (2, 6). Thus, the active spaces are CAS(6, 12) and CAS (5, 12) for La2
and La2+, respectively. The [Kr]4d10 core of La was frozen in electron-correlation CASPT2
and MRCI calculations. To compare with La2, we also calculated Sc2 and Y2 in the same
group using the same methods and same type of basis sets and active spaces. All
calculations were performed using MOLPRO 2010 quantum chemistry program
package.185
Although for some metal dimers there is evidence that the coupling between highly
excited Rydberg states has an important effect on two-photon ZEKE intensities,210-212 for
other small metal clusters, a Franck-Condon (FC) model appears to yield reasonably
accurate intensities for single-photon ZEKE spectra.147,196,213-217 Thus, we calculated FC
factors using the equilibrium geometries, harmonic frequencies, and normal mode
coordinates of the neutral and ion molecules and simulated the MATI spectrum using
experimental linewidth and Lorentzian line shape. Transitions from exited vibrational
levels of the neutral complexes were considered by assuming thermal excitation at specific
temperatures.
4.3 RESULTS AND DISCUSSION
4.3.1 MATI spectrum of La2
Figure 1(a) shows the MATI spectrum of La2 seeded in Ar carrier. It exhibits three
band systems originating from the 39046, 40314, and 40864 cm-1 bands, respectively. The
first system originating from the 39046 cm-1 band consists of at least four intervals with
66
the spacing of about 232 cm-1 at the higher energy side and a 207 cm-1 interval at the lower
energy side. The energy of the 39046 cm-1 band corresponds to the adiabatic AIEs of the
molecule. The 232 cm-1 progression arises from the excitation of the ground vibronic level
of La2 to various vibrational levels of a La2+ electronic state, and the 207 cm-1 spacing is
the vibrational frequency of the neutral molecule. Superimposed on the origin band and
several other bands are sequence transitions separated by about 25 cm-1. This separation
is the frequency difference between the ion and neutral states. For the other two band
systems, similar structures are identified and vibrational frequencies are measured for the
neutral and ion states. The ion frequencies measured from these two electronic transitions
are 240 cm-1, slightly higher than that of the first band system (232 cm-1). On the other
hand, the neutral frequencies are the same from all three band systems (207 cm-1). These
observations indicate that the three band systems originate from the same electronic state
of the neutral molecule and that ion states involved in the second and third band systems
have similar electron bonding characters as these two states have identical vibrational
frequencies. Beside the measurements of the energies of the three ion states and the
vibrational frequencies of the neutral and ion states, the spectrum shows very strong origin
bands and short vibrational progression for the three transitions. This additional
observation suggests that bond lengths may be rather similar in these neutral and ion states.
4.3.2 Predicted electronic states of La2 and La2+
Table 4.1 presents the low-energy electronic states of La2 and La2+ obtained
from the CASPT2/ANO-RCC calculations. The lowest energy state of La2 is predicted to
be X1g+, consistent with previous calculations by Dolg et al. 13 and Wu et al..14 The X1g
+

67
state has an electron configuration of 5du4 6sσg
2 in the valence space. The u4 orbital is
formed by the bonding interaction of two pairs of perpendicular 5dxz and 5dyz orbitals, and
g is formed by the bonding interaction largely between the 6s orbitals of two La atoms.
These bonding orbitals, along with the 5dg and 6su empty orbitals, are presented in
Figure 2. Because of the bonding nature of the u4 and g
2 orbitals, lanthanum dimer in the
X1g+ state possesses a triple bond between the two metal atoms. The excitation of two
electrons from the occupied 5du orbital into the empty 5dg and 6su orbitals produces an
a5u- state, with an electron configuration of 6sg
2 5du2 5dg
1 6su1. Because two
electrons are placed in the higher energy orbitals, the quintet state is less stable than the
singlet state. The predicted energy difference between the two states is 886 cm-1. Because
one of the electrons is in the antibonding u orbital, La2 in the a5u- state may be considered
as having a double bond (i.e., a bond plus a bond). The reduction of the bond order
from 3 in X1g+ to 2 in a5u
- leads to an increase of the La-La bond length from 2.692 to
3.093 Å (Table 4.1). Ionization of the X1g+ neutral state may form two different doublet
states. If a g electron is removed from the singlet state, the resulting ion will be in the
a2g+ state with the 5du
4 6sg1 electron configuration. On the other hand, if a u electron
is ejected, the ion will be in the b2u state with an electron configuration of 6sg2 5du
3 .
It is interesting to note from Table 4.1 that although the ejected electrons ( or ) have
bonding character, ionization does not significantly increase the La-La bond length, and in
fact, the bond length is slightly shorter in the b2u state. This is probably due to the charge
effect, which compensates the loss of a bonding electron and pulls the metal atoms closer
in the cation. Ionization of the a5u- state may form several quartet ion states depending

68
on which electron is removed. However, the lowest-energy quartet state is expected to be
the one that arises from the removal of the antibonding u1 electron. This quartet state is
predicted to be X4g- and is calculated to lie at lower energy than either a2g
+ or b2u state.
4.3.3 Observed electronic states of La2 and La2+
On the basis of the comparison of the measurements with the theoretical
calculations, three electronic transitions are assigned to the observed spectrum. These are
a2g+ ← X1g
+, b23/2, u ← X1g+, and b21/2, u ← X1g
+.
The X1g+ neutral state is the lowest-energy state, and its vibrational frequency of
194 cm-1 is close to the measured value of 207 cm-1. On the other hand, the a5u- neutral
state is an excited state, and the La-La stretching frequency (122 cm-1) is too low compared
to the measured value. Therefore, the neutral state that is responsible for the observed
transitions must be X1g+. For the cation, three states are predicted to be in the order of
X4g- < a2g
+ < b2u. The X4g- ion state can be excluded because the predicted stretching
frequency of 120 cm-1 in this state is too small compared to the measured frequency of 232
or 240 cm-1. Moreover, transitions from a singlet neutral state to a quartet ion state are not
allowed because of the restriction in electron spin multiplicity. Thus, the possible ion states
contributing to the observed transitions should be a2g+ and b2u. Because of the spin-
orbit coupling, the b2u state is split into two components, b23/2, u and b21/2, u. The
predicted energies for the a2g+ ← X1g
+, b23/2, u ← X1g+, and b21/2, u ← X1g
+
transitions are 38976, 40114, and 40752 cm-1, respectively; which compare nicely with the
positions of 39046, 40314, and 40864 cm-1 of the three origin bands in the MATI spectrum.
The stretching frequencies for the a2g+, b23/2, u, and b21/2, u states are calculated to be

69
219, 256, and 256 cm-1, consistent with the measured frequencies of 232, 240, and 240 cm-
1. Thus, the observed three band systems are assigned to the a2g+ ← X1g
+, b23/2, u ←
X1g+, and b21/2,u ← X1g
+ transitions, respectively. The spin-orbit splitting between the
two components of b2u is measured to be 550 cm-1. For a 2 state with a 3 electron
configuration, the spin-orbit splitting, E, is given by E = E(23/2, u) –E(21/2,u) = -a,
where a is a molecular spin-orbit parameter.218 Because a is always a positive quantity,
the 2 state is inverted for the 3 configuration, as is well known. Since the electrons are
essentially pure 5d electrons, a can be set equal to the atomic spin-orbit parameter 5d.
The values of 5d for La(4F, 6s15d2) and La+(3D, 6s15d1) are 499 and 619 cm-1, respectively,
as obtained from a Hartree-Fock calculation.219 In computing the 5d values, the first
excited states of La (4F, 6s15d2) and La+ (3D, 6s15d1) are considered because the b2u
(6sg25du
3) state of La2+ is formed by removing a u electron from the X1g
+ (5du46sg
2)
ground state of La2 and the X1g+ state is derived from two excited La (4F, 6s15d2) atoms.
Since the La atoms in the La2+ cation can be considered to each have a charge of +1/2, the
average of 5d (La) and 5d(La+) seems appropriate for comparison to the spin-orbit splitting
of La2+. This averaged value, 5d = (449 + 619)/2 cm-1 = 559 cm-1, is close to the measured
separation of the two b2u levels (550 cm-1).
The measured spectroscopic parameters, along with those from the CASPT2
calculations, are summarized in Table 4.2. The frequencies for the X1g+ neutral state and
b21/2,u ion state are obtained directly from the spectrum. For the a2g+ and b23/2,u ion
states, harmonic frequencies and anharmonicities are obtained via least-squares fitting. It
is noted that the La-La stretching frequency from the current measurement (207 cm-1) is

70
significantly lower than that measured by Ar matrix isolation Raman spectroscopy (236
cm-1).199 This discrepancy may be due to a large Ar matrix shift. A shift of 22 cm-1 (e
(ArLa2 La2)) was estimated by ab initio calculations.220 A second possibility is that the
Raman frequency obtained in the Ar matrix might be for the La2+ ion, rather than for the
La2 neutral molecule, as the Raman frequency (236 cm-1) is very close to the ion frequency
obtained in the current work (232 or 240 cm-1).
Although it does not measure the bond energies of La2 or La2+, the MATI
experiment provides the bond energy difference between the ion and neutral molecule
using the thermodynamic cycle presented in Figure 3. In this figure, IEs of La2 are obtained
from the MATI spectrum, and those of La atom are taken from the literature.153,189 From
the thermodynamic cycle,
D0+ [La2
+ (a2g+) La+ (3F) + La (4F)] - D0[La2(X
1g+) 2La (4F)]
= IE [La+ (3F) ← La (4F)] – IE [La2+ (a2g
+) ← La2 (X1g
+)]
= 0.405 eV
Similarly,
D0+ [La2
+ (b2u) La+ (3D) + La (4F)] - D0[La2(X1g
+) 2La (4F)]
= IE [La+ (3D) ← La (4F)] – IE [La2+ (b2u) ← La (X1g
+)]
= 0.449 eV
The CASPT2 predicted differences for D0+ [La2
+ (a2g+) La+ (3F) + La (4F)] -
D0[La2(X1g
+) 2La (4F)] and D0+ [La2
+ (b2u) La+ (3D) + La (4F)] - D0[La2(X1g
+)
2La (4F)] are 0.54 and 0.57 eV, respectively; they are slightly larger than the measured
values (by 0.12-0.13 eV).

71
Previous studies reported that the ZEKE or MATI spectral intensities could be
described by the FC principle for some metal-containing diatomic molecules,196 but not for
others.210-212 To test the FC picture for La2, we calculated the MATI spectrum by using the
linewidth of the experimental spectrum and the FC factors obtained from the equilibrium
geometries and vibrational force fields of La2 and La2+. The simulation is presented in
Figure 2b. In this simulation, the theoretical 0-0 energy for the a2g+ ← X1g
+ transition
is shifted to the experimental value, whereas vibrational frequencies for all involved states
and 0-0 energies of the b23/2,u ← X1g+ and b21/2,u ← X1g
+ transitions are not scaled.
It can be seen that the simulation reproduces the overall features of the experimental
spectrum, even though the vibrational intensity for the a2g+ ← X1g
+ transition is
somewhat underestimated. This is similar to the previous observation for another metal
dimer (Y2) in the same group.196
4.3.4 Comparison of group III M2 dimers (M= Sc, Y, and La)
Although they are in the same family, Sc2 and Y2 were reported to have 5u- ground
states previously,193-198 and La2 is determined to have a 1g+ ground state in the current
study. The previous calculations on Sc2 and Y2 were carried out with different
methods/basis sets from those used in the current work on La2. To ensure a fair comparison
of the triad, we have also calculated 1g+ and 5u
- states of Sc2 and Y2 using the same
methods as those for La2. Table 4.3 summarizes the theoretical results for the three metal
dimers. It shows that the relative stability of the singlet and quintet states is indeed different
between Sc2/Y2 and La2. For the lighter species, the 5u- state is more stable than the 1g
+
state, and the energy difference decreases with higher level of theory. On the other hand,

72
the 1g+ state is more stable than 5u
- for La2, and the energy difference increases with
better electron-correlation treatments. In all three cases, higher-order electron
configuration stabilizes the 1g+ state relative to the 5u
- state, supporting the previous
argument obtained from the calculations on diyttrium.198,221
A question arises about why Sc2 and Y2 prefer the high-spin 5u- state, while La2
favors the low-spin 1g+ state. The 5u
- state of Sc2 (Y2) with the 4sg23du
23dg14su
1
(5sg24du
24dg15su
1) electron configuration is derived from the 4s23d1 + 4s13d2 (5s24d1
+ 5s14d2) atomic asymptotes, whereas the 1g+ state of La2 with the 5du
46sg2 electron
configuration is derived from two excited 6s15d2 atoms. For the three metal atoms, the
ground electron configuration is ns2 (n-1)d1 (2D), and the first excited configuration is ns1
(n-1)d2 (4F). The excitation energies are 1.428, 1.356, and 0.330 eV for Sc, Y, and La,
respectively.153 The formation of the 1g+ dimer requires two atoms to be in the excited
state, whereas the formation of the 5u- dimer requires one atom to be excited. Because the
excitation energy for La is much smaller than that of Sc or Y, La2 is expected to have a
higher tendency to form the triply-bound 1g+ state by the sd electron promotion. The
stabilization of the La2 1g
+ state relative to its 5u- state (0.70 eV, Table 4.3) is more than
sufficient to compensate for the energy cost for the s d excitation (0.330 eV). On the
other hand, if Sc2 (Y2) were formed in the 1g+ state by the interaction of two excited atoms,
it would cost 1.428 (1.356) eV for the s d excitation of each atom.
4.4 CONCLUSIONS
A MATI spectrum is reported for La2 seeded in an Ar supersonic molecular beam.
Analysis shows that the spectrum involves three ionization processes originating from the

73
ground electronic state of the neutral molecule. In combination with multi-configuration
ab initio calculations, these processes are determined as a2∑g+ ← X1∑g
+, b2Π3/2,u ← X1∑g
+,
and b 2Π1/2,u ← X1∑g
+. X1g+ is the ground state of the neutral molecule, while a2g
+ and
b2u states are low-lying excited states of the singly charged ion. The b2u state is
observed to split into two components by spin-orbit coupling. The ground state of the
cation is predicted to be X4g-, but it is not observed by the experiment because of the
electron spin restriction. Although they are in the same group in the Periodic Table, neutral
dilanthanum prefers the low-spin singlet state, while its lighter analogues, discandium and
diyttrium, favor the high-spin quintet states. The different electron spin multiplicities of
these metal dimers are associated with the ns (n-1)d electron excitation energies of the
metal atoms.

74
Table 4.1 Low-lying electronic states, electron configurations, and electronic energies with
vibrational zero-point corrections (E0), bond length (R), vibrational frequencies (e) of La2
and La2+ from CASPT2/ANO-RCC calculations. Reprinted with permission from J. Chem.
Phys., 135, 034309 (2013), Copyright 2013 AIP Publishing LLC.
State Leading configuration (weight) E0 (cm-1) R (Å) e (cm-1)
La2 X1g+ 5du
4 6sg2 (0.92) 0 2.692 194
a5u- 6sg
2 5du2 5dg
1 6su1 (0.88) 886 3.093 122
La2+ X4g
- 6sg2 5du
2 5dg1 (0.92) 37755 3.015 120
a2g+ 5du
4 6sg1 (0.93) 38796 2.698 219
b2u
b23/2, 1/2,u
6sg2 5du
3 (0.92) 40433
40114/40752
2.649 256

75
Table 4.2 Electronic energies with vibrational zero-point corrections (E0), vibrational
frequencies (e), and bond dissociation energies (De) for the observed electronic states La2
and La2+. Reprinted with permission from J. Chem. Phys., 135, 034309 (2013), Copyright
2013 AIP Publishing LLC.
State E0 (cm-1) e (cm-1) /
eχe (cm-1)
De (eV)
MATI CASPT2 MATI CASPT2 CASPT2
La2 X1g+ 0 0 207(1)a
236.0 (8)b
194
186(13)c
2.31[La2 (X1g+) 2 La (4F)]
1.8(3),b 2.31(13),c 2.52(22)d
La2+ a2g
+ 39046 (5) 38796 235.7 (9) /
1.1 (2)
219 2.86
[La2+ (a2g
+) La+ (3F) +
La(4F)
b23/2, u 40314 (5) 40114 242.2 (8) /
0.4(1)
256 2.89
[La2+ (b2u) La+ (3D) +
La(4F)
b21/2,u 40864 (5) 40752 240(1)a 256
a From direct spectral measurements, this work.
bFrom Ar-matrix isolation Raman spectrum, reference199.
cFrom MRCI+Q and CCSD(T) calculations, reference202.
d,eFrom thermodynamical absolute-entropy method, references200,222.

76
Table 4.3 Comparison of group III M2 (M = Sc, Y, and La). Reprinted with permission from
J. Chem. Phys., 135, 034309 (2013), Copyright 2013 AIP Publishing LLC.
Bond length (Å) ΔE (1∑g+ -5∑u
ˉ) (eV)
5∑uˉ 1∑g
+ CASPT2 MRCIa MRCI+Qa
Sc2 2.745 2.430 1.03 0.81 0.70
2.704 2.360 1.00b
Y2 3.011 2.755 0.91 0.76 0.63
3.03 2.76 0.87c
La2 3.093 2.692 -0.11 -0.58 -0.70
a The MRCI and MRCI+Q energies are obtained at CASPT2/ANO-RCC geometries, this
work.
bFrom multi-reference single and double CI + Q calculations, reference223.
cFrom CASSCF/SOCI+Q calculations, reference198.

77
Wavenumber (cm-1
)
39000 39300 39600 39900 40200 40500 40800 41100 41400 41700
240
25
33
240
39046
33
232
40864
0-0
207
207
0-0
40314
207
0-0
(a)
(b) 2 1g ga X
2 13/2, gub X 2 1
1/2, gub X
Figure 4.1 MATI spectrum (a) of La2 seeded in Ar gas and simulations (b) of the a2g+ ←
X1g+, b23/2,u ← X1g
+, and b21/2,u ← X1g+ transitions at 300 K. Reprinted with
permission from J. Chem. Phys., 135, 034309 (2013), Copyright 2013 AIP Publishing LLC.
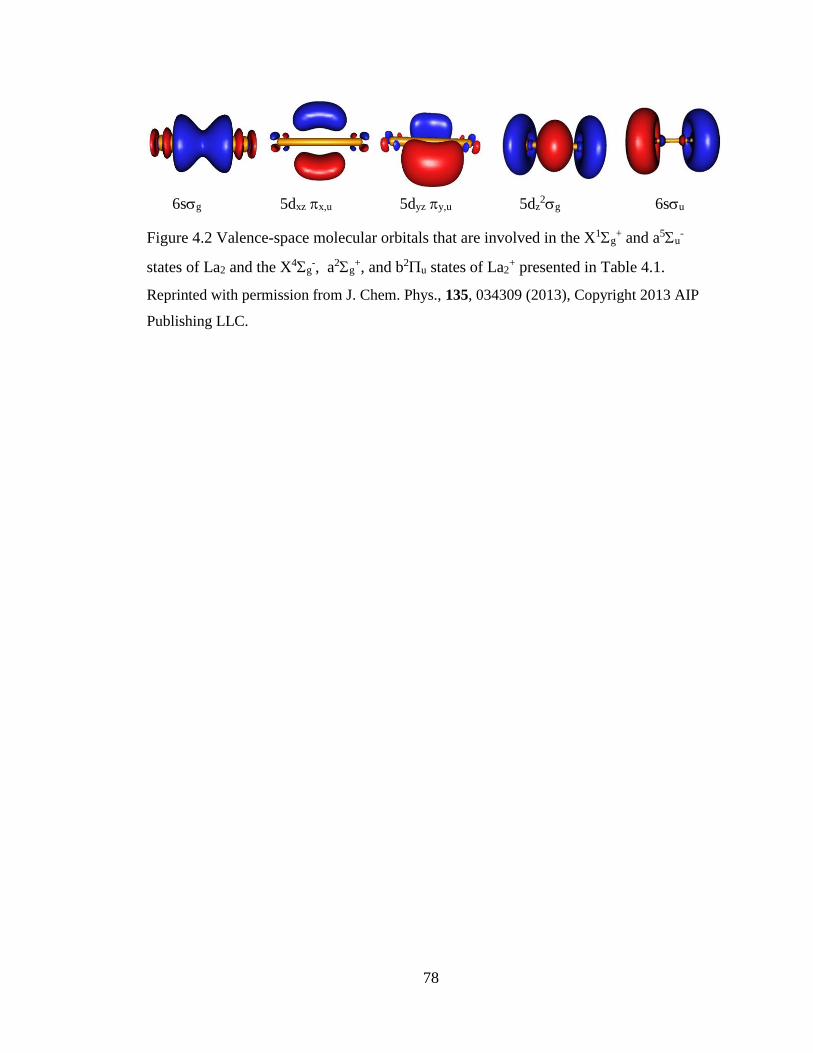
78
6sg 5dxz x,u 5dyz y,u 5dz2g 6su
Figure 4.2 Valence-space molecular orbitals that are involved in the X1g+ and a5u
-
states of La2 and the X4g-, a2g
+, and b2u states of La2+ presented in Table 4.1.
Reprinted with permission from J. Chem. Phys., 135, 034309 (2013), Copyright 2013 AIP
Publishing LLC.
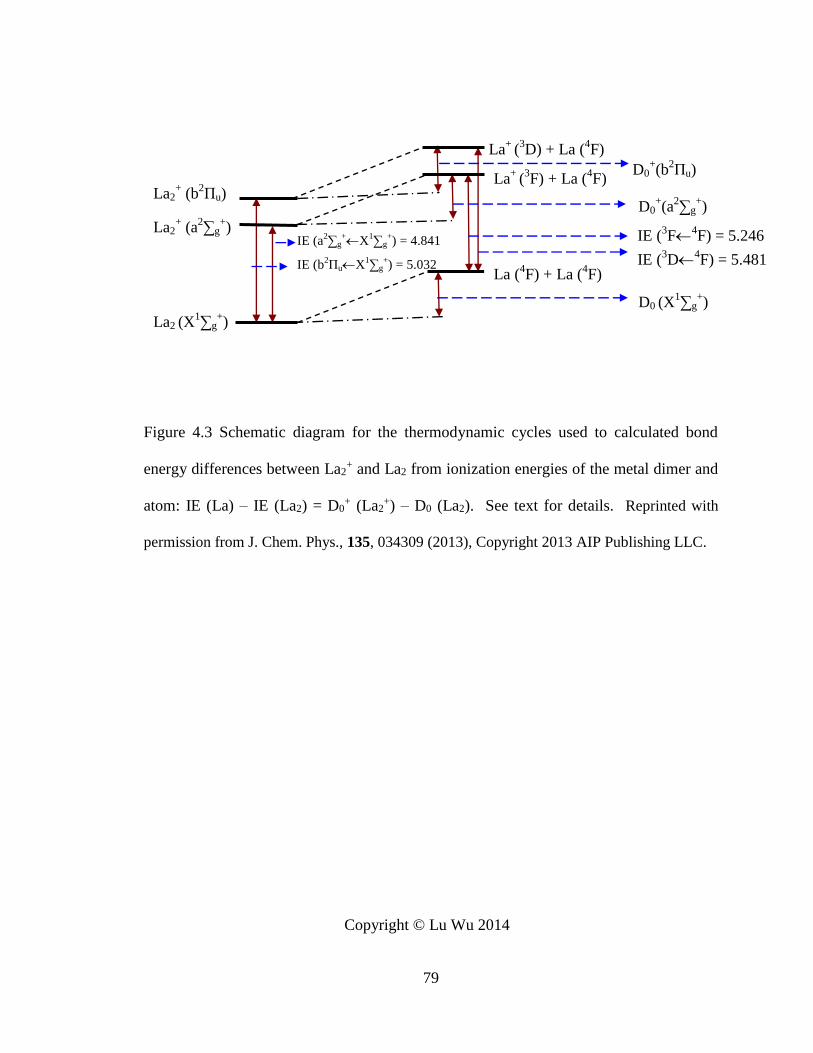
79
La+
(3D) + La (
4F)
La2+ (b
2Πu)
La2+ (a
2∑g
+)
La2 (X1∑g
+)
D0+(a
2∑g
+)
IE (b2ΠuX
1∑g
+) = 5.032
IE (a2∑g
+X
1∑g
+) = 4.841
D0 (X1∑g
+)
La (4F) + La (
4F)
IE (3D
4F) = 5.481
D0+(b
2Πu)La
+ (3F) + La (
4F)
IE (3F
4F) = 5.246
Figure 4.3 Schematic diagram for the thermodynamic cycles used to calculated bond
energy differences between La2+ and La2 from ionization energies of the metal dimer and
atom: IE (La) – IE (La2) = D0+ (La2
+) – D0 (La2). See text for details. Reprinted with
permission from J. Chem. Phys., 135, 034309 (2013), Copyright 2013 AIP Publishing LLC.
Copyright © Lu Wu 2014

80
CHAPTER 5 THRESHOLD IONIZATION, STRUCTURAL ISOMERS, AND
ELECTRONIC STATES OF M2O2 (M = SC, Y, AND LA)
5.1 INTRODUCTION
Because small metal oxide clusters serve as the building blocks of nanostructural
materials and exhibit size-dependent properties, investigation of their structures has
attracted considerable interests in spectroscopy and theory.87,224 Figure 5.1 shows possible
structural isomers reported for M2O2 clusters, where M is a transition metal atom.87 They
are three cycles and three open structures. The cyclic structures include a D2h MOMO
rhombus (Figure 5.1a), a C2v MOMO nonplanar cycle (Figure 5.1b), and a C2v MMOO
planar metal peroxide (Figure 5.1c). The open structures consist of a "S"-shaped C2h
OMMO (Figure 5.1d), a curved Cs MOMO (Figure 5.1e), and a triangular C2v OOMM
(Figure 5.1f). For group 3 M2O2 (M = Sc, Y, and La), several experimental and
computational studies have been reported about their structures and electronic states.
Andrews and coworkers reported in 1997 the infrared spectrum of Sc2O2 in a study of
reactions of the laser-ablated Sc atom with O2 in the Ar matrix and proposed the formation
of two Sc2O2 isomers.225 One was an open ScOScO and the other a ring (ScO)2. Two
years later, Johnson and Panas reported a DFT study of a series of scandium oxide
molecules, including the anionic, neutral and cationic Sc2O2 species.226 The DFT
calculations with the B3LYP functional predicted that the neutral molecule was in a planar
cyclic structure, with the ground state of 3B1u in D2h point group (Figure 5.1a), and the
molecular structure undertook only minor changes upon adding or removing an electron.
In contrast to the DFT/B3LYP calculations, Yang et al. predicted using the DFT/PBE

81
calculations that the cyclic Sc2O2 molecule preferred a singlet state.227 Besides the D2h
ring structure, the authors located an open ScOScO isomer (Figure 5.1d) at about 2.0 eV
higher in energy. For Y2O2, Nakajima, Kaya, and coworkers reported the photoelectron
spectrum of the anion and proposed the most likely structures for the neutral molecule and
anion to be rhombus.67 On the other hand, Yang and Xiong predicted using the
DFT/B3LYP method that the most stable Y2O2 molecule was in a cyclic C2v peroxide
structure (Figure 5.1c) with the 3A2 ground state, and considerable structural changes
occurred upon adding an electron to the molecule.228 The preferred structures of Y2O2
and Y2O2- from these calculations were different from those proposed by the photoelectron
measurements67 and also from those of the Sc analogs predicted by the DFT/B3LYP or
DFT/PBE methods.226,227 To our knowledge, there has been no spectroscopic or
computational report about La2O2, the heaviest species among the triad. However,
Willson and Andrews studied a series of (LnO)2 (Ln = Ce, Pr, Nd, Sm, Eu, Tb, Dy, Tm,
Yb, Lu) by using Ar matrix-isolation infrared spectroscopy.229,230 They observed D2h or
C2v ring structures formed by dimerization of LnO or addition of a second Ln atom to
LnO2. Burow et al. reported a CeOCeO ring structure of Ce2O2+ in the study of a series
of cerium oxide clusters using free electron laser infrared vibrational predissociation
spectroscopy. 231
In spite of the continuous efforts reported in the literature, the preferred structures
and electronic states of the group 3 M2O2 cluster remain in debate. In a recent study of
the group 3 M3O4 clusters, we proposed that the M3O4 clusters were formed by fusing
three cyclic MOMO fragments together, each sharing two O-M bonds with others.232 The
objectives of this work is to investigate the structures and electronic states of M2O2

82
through a synergetic spectroscopic and computational approach. The spectroscopic
method is MATI, and the computational effort includes electronic structure calculations
and spectral simulations. This synergetic approach has been shown to be powerful for
studying small metal clusters and oxides.149,171,232
5.2 EXPERIMENTAL AND COMPUTATIONAL METHODS
The metal-cluster beam MATI spectrometer has been described in a previous
publication.14,171 The group 3 metal cluster oxides were produced by laser vaporization
(Lumonics YM-800 Nd:YAG, 532 nm,) of a metal rod in the presence of ultra-high-purity
He or Ar carrier gas (delivered by a homemade piezoelectric pulsed valve)172 and a small
amount of ultra-high purity oxygen (supplied with a metering valve). The metal vapor and
gas mixture passed down a clustering tube (2 mm inner diameter, 2 cm length), and the
resultant clusters were supersonically expanded into the vacuum chamber. The supersonic
jet was skimmed by a cone-shape skimmer (2 mm artifice diameter) at 3 cm downstream
from the exit end of the clustering tube. A pair of deflection plates (2.5 cm spacing, 220
V) located after the skimmer was used to remove residual charged species formed during
laser ablation from the molecular beam before it entered the spectroscopic chamber. Prior
to the MATI measurements, photoionization time-of-flight mass spectra were recorded to
determine the chemical content of the cluster beam, and photoionization efficiency spectra
were recorded to locate approximate ionization thresholds of the M2O2 clusters. With the
energy of the ionization laser being set above the ionization threshold, the experimental
conditions (e.g., timing and power of the vaporization and ionization lasers, the backing
pressure of the carrier gas, and the concentration of oxygen) were carefully optimized to

83
maximize the intensity of the M2O2+ signal in the mass spectra. Under the optimized
conditions, M2O2 was excited to high-lying Rydberg states in a single-photon process by
the frequency-doubled output of a dye laser (Lumonics HD-500) pumped by a Nd:YAG
laser (Quanta Ray GCR-3, 355 or 532 nm) and then ionized by an electric pulse (DEI PVM-
4140, 320 V cm-1). The laser beam was collinear and counter propagating with the
molecule beam. The time delay between the laser and electric pulses was varied to
maximize the MATI signal and was typically 20 s for He carrier and 50 s for Ar. A
small DC field (0.7, 1.2, and 1.2 V cm-1 for Sc2O2, Y2O2, and La2O2, respectively) was
applied to separate the prompt ions produced by direct photoionization from the MATI
ions produced by delayed field ionization. The MATI signal was obtained by scanning the
wavelength of the tunable dye laser, detected by a dual microchannel plate detector,
amplified by a preamplifier (SRS SR445), averaged by a gated integrator (SRS SR250),
and stored in a laboratory computer. Laser wavelengths were calibrated against vanadium
atomic transitions in the spectral region.153 The Stark shift induced by the DC separation
field was calculated using the relation of IE = 6.1Ef1/2, where Ef is in V cm-1 and E in
cm-1.151
DFT/B3LYP128,129 method was used to calculate the equilibrium geometries and
vibrational frequencies of M2O2 and M2O2+. Coupled cluster with single, double and
perturbative triple excitations (CCSD(T)) method174,175 was employed to calculate the
single point energies at the DFT/B3LYP geometries. These calculations were carried out
with Gaussian 09 program179. In addition, the CCSD(T) method was also used to calculate
the equilibrium geometries with MOLPRO 2010.1 program.185 In all these calculations,
oxygen and scandium atomic orbitals were described by the aug-cc-pVTZ basis

84
set,154,176,233 and yttrium and lanthanum atomic orbitals were represented by the segmented
basis set with Stuttgart-type small core (28 electrons) relativistic effective core potential
(Stuttgart RSC segmented/ECP).178,234
To compare with the experimental spectra, Franck-Condon (FC) factors were
calculated using the equilibrium geometries, harmonic frequencies, and normal mode
coordinates of the neutral cluster and cation.146,147,186 In these calculations, recursion
relations from Doktorov et al. 187 were employed, and the Duschinsky effect142 was taken
into consideration. Spectral simulations were obtained using the experimental linewidth
and a Lorentzian line shape. Transitions from exited vibrational levels of the neutral
molecule were considered by assuming thermal excitation at specific temperatures.
5.3 RESULTS AND DISCUSSION
5.3.1 MATI spectra
Figure 5.2 shows the MATI spectra of M2O2 (M=Sc, Y, La) seeded in He or Ar
carrier gas. The spectra of the three clusters exhibit a similar profile, and each shows a
predominant original band (0-0) and several weaker ones. The bands from possibly
common-type transitions of the three molecules are linked with dotted lines, and additional
vertical lines in the spectrum of La2O2 are used to indicate the transitions that are specific
for the molecule. For Sc2O2, the origin band is at 44967(5) cm-1 with several multiples 17-
21 cm-1 apart. Relative to the origin band, two doubles are at 415/431 and 713/728 cm-1
and an additional pair at -267/-245 cm-1. The multiples around the 0-0 band are sequence
transitions with the vibrational frequencies of the ion modes being larger than those of the
neutral modes. Similarly, the higher energy satellite band in each pair (i.e., -245, 431, and

85
728 cm-1) arises from the sequence transition as well. The spectrum of Y2O2 shows the 0-
0 band at 42456 (5) cm-1, four weaker bands at 142, 285, 655, and 970 cm-1, and two
additional ones at -279 and -142 cm-1. There is also a shoulder at ~ 30 cm-1 above the
origin band. For La2O2, the strong 0-0 band is at 36936 (5) cm-1 surrounded by three
satellite bands at -51, -19, and 16 cm-1. Besides, five bands with weak or medium
intensities are located at 107, 245, 421, 591, and 857 cm-1 and three more at -569, -254,
and -140 cm-1. The transitions at energies below the 0-0 bands are all likely from excited
vibrational levels of the neutral clusters. Table 5.1 lists the energy position of each band,
relative to that of the origin band. The observed spectral profiles indicate that the three
clusters probably exist in similar geometries and the structure of each cluster is not
significantly affected by ionization. The small ionization effect on the molecular structures
implies that the ejected electron is likely weakly bound (or anti-bound) in the highest
occupied molecular orbital (HOMO). The HOMO should be a metal-based orbital, as the
adiabatic AIEs of these metal atoms is much lower than that of the oxygen atom.189
Compared to those of the metal atoms, the AIEs (i.e., energy positions of the origin bands)
of the clusters are red shifted by 7955 cm-1 for Sc, 7690 cm-1 for Y, 8044 cm-1 for La.189
Since the AIE shifts are comparable, the metal-oxygen bonding is expected to be similar
in the three clusters.
5.3.2 Theoretical structural isomers and electronic states
In searching for preferred structures of the M2O2 clusters, we included all six
possible isomers showed in Figure 5.1 in our theoretical calculations and located three
minimum energy structures with alternative M-O bonds (Figure 5.1(a, b, and e)). The other

86
three isomers were not converged in the geometry optimization. Because group 3 metal
atoms have an (n-1)d1ns2 ground electron configuration and the electron spin multiplicities
of the M2O2 clusters are determined by the orientation of the metal-based electrons, we
considered the singlet and triplet states for the neutral species and doublet and quartet states
for the singly charged cations. The singlet state is formed if all metal-based electrons are
in pairs, whereas the triplet state is formed if two of which are unpaired and with the same
spin orientation. Ionization of the singlet state is expected to yield a doublet state, while
ionization of the triplet state produces a doublet or a quartet state. Table 5.2 summarizes
the electronic states and energies of each isomer of the M2O2 clusters. Among the three
converged structures, the rhombus D2h isomer is predicted be the most stable one, followed
by the Cs open chain (1-2 eV) and the non-planar C2v cyclic structure ( 6 eV). For the D2h
structure, the triplet states of Sc2O2 and Y2O2 have slightly lower energies than the singlet
states, while the opposite is predicted for La2O2. The prediction of the 3B1u ground state of
Sc2O2 is consistent with the previous DFT/B3LYP calculation.226 On the other hand, the
prediction of the rhombus Y2O2 is not in agreement with the previous calculation, where a
cyclic peroxide structure was calculated to be more stable.228 There has been no previous
report on the structures and electronic states of La2O2. Upon ionization, the resultant
doublet is more stable than the quartet state, and the energy differences between the two
ion states are much larger ( 2 eV) than those between the two neutral states (0.15 eV).
Because the DFT/B3LYP predicted energy differences between the 1Ag and 3B1u
neutral states are within the computational errors of the theoretical method, further
calculations at higher levels of theory have also been performed on these two states. Table
5.3 lists the relative energies of the 1Ag and 3B1u states from the CCSD(T) single point

87
calculations at the B3LYP optimized geometries and the CCSD(T) geometry optimizations.
In contrast to DFT/B3LYP, the CCSD(T) calculations give the 1Ag ground state for all
three clusters, with 3B1u at 0.15-0.20 eV above the singlet state. The inconsistent results
among the three methods and the small energy differences between the two states suggest
that a reliable identification of the ground states of the M2O2 clusters is not trivial and
requires confirmation by experimental measurements.
5.3.3 Observed structural isomers and electronic states
5.3.3.1 Sc2O2
Although three isomers (D2h, C2v, and Cs in Table 5.2) are predicted to be stable, the
non-planar C2v ring and the Cs chain have much higher energies and are expected to be
quenched by the supersonic cooling if they are formed in the molecular beams. Moreover,
because ionization of the C2v and Cs isomers yields a 2Ag ion state in the D2h structure, the
resultant spectrum would exhibit a very weak origin band and a long FC profile,
incompatible with the measured spectrum. Although a 4A' ion state is found for the Cs
isomer, formation of this ion state (from ionization of the 3A' neutral state) requires 7.9 eV
energy, 2.3 eV higher than the experimental AIE. Therefore, both C2v and Cs isomers are
unlikely the carriers of the observed spectrum, and the following discussion will be focused
on the ionization of the D2h isomer.
Three ionization processes are possible for the D2h isomer. They are 2Ag ← 1Ag,
2Ag ← 3B1u, and 4B3g ← 3B1u (Table 5.2), with the predicted transition energies of 5.27,
5.42, and 8.96 eV, respectively. Among the three processes, the 4B3g ← 3B1u transition can
be excluded from the observed spectrum. This is because its transition energy (8.96 eV) is

88
much higher than the measured AIE (5.5752 eV) and the geometry of the 4B3g ion state
(R(M-M) = 3.168 Å, R(M-O) = 1.946 Å, and O-M-O = 71o) is considerably different
from that of the 3B1u neutral state (R(M-M) = 2.782 Å, R(M-O) = 1.886 Å, and O-M-O
= 85o) (Table 5.6).133 The large differences in the M-M bond distance and the O-M-O
angle would lead to a weak origin band and a long spectral profile, which are inconsistent
with the observation. For the remaining 2Ag ← 1Ag and 2Ag ← 3B1u processes, their
transition energies (5.27 and 5.42 eV) are comparable to each other and to the measured
AIE (5.5752 eV). The geometries of 1Ag (R(M-M) = 2.728 Å, R(M-O) = 1.873 Å, and
O-M-O = 86o) and 3B1u (R(M-M) = 2.782 Å, R(M-O) = 1.886 Å, and O-M-O = 85o)
are also similar to each other and undergo small changes upon ionization (i.e., R(M-M) =
2.743 Å, R(M-O) = 1.863 Å, and O-M-O = 85o for the 2Ag ion state). Therefore, the two
transitions should yield comparable spectra with a strong origin band and a short FC profile
originated from the vibronic ground state, as the experimental spectrum shows. The
B3LYP calculations predict the 3B1u neutral state to be 1202 cm-1 more stable than the 1Ag
state, whereas the CCSD(T)//B3LYP and CCSD(T) methods yield a more stable 1Ag state
than 3B1u by 1270 and 1812 cm-1, respectively. Thus, a definitive assignment of the ground
state of Sc2O2 is not straight forward from the energy viewpoint.
However, despite the similarities in energies and geometries of the two neutral
states, the vibrational frequencies of several modes are considerably different, especially
for and 6 (Table 5.4). These differences are expected to be evident in the spectrum
because vibrational hot bands are observed (Table 5.1 and Figure 5.3). Therefore, the
distinction of the 2Ag ← 1Ag and 2Ag ← 3B1u transitions may be possible by considering
the transitions from thermally excited vibrational levels. For small molecules seeded in
89
supersonic molecular beams, they are generally not in the thermal equilibrium. Different
vibrational modes are expected to cool with different efficiencies and thus have different
temperatures. Lower frequency modes tend to have lower temperatures than the higher
frequency modes. This non-thermal equilibrium behavior was previously observed for
small molecules.235 To estimate the vibrational temperature of each mode, we first used the
intensity ratio of the hot band at -267 cm-1 to the origin band to calculate the temperature
of the vibrational mode corresponding to this transition. From Table 5.4, this band likely
originates from the sequence transition of 4 (1
14 ) as the frequency difference (-291 cm-1)
of this mode between the 2Ag ion and 1Ag neutral states are mostly close to the observed
value (-267 cm-1). After the 4 temperature is determined, the temperatures of all other
neutral modes of the 1Ag state and those of the 3B1u are calculated, which are listed in Table
5.7.133 Using these estimated vibrational temperatures, we calculated the spectra of the 2Ag
← 1Ag and 2Ag ← 3B1u transitions, which are shown in Figure 5.3(b, c). In these
simulations, the theoretical transition energies are shifted to the experimental AIE, but the
vibrational frequencies are not scaled. There are two major differences between the two
simulations. First, the 2Ag ← 1Ag transition exhibits the sequence bands at the higher
energy side of the 0-0 transition as the experimental spectrum, while 2Ag ← 3B1u shows
these bands at both sides of the origin band. Second, the 1
14 band of 2Ag ← 1Ag is predicted
at -291 cm-1 from the 0-0 transition, which is fairly close to the -267 cm-1 band in the
measured spectrum; on the other hand, the 1
14 band of 2Ag ← 3B1u is -395 cm-1 away from
the 0-0 transition, more than 100 cm-1 larger than the experimental measurement. These
comparisons suggest that the 2Ag ←1Ag transition is responsible for the observed spectrum
and 2Ag ← 3B1u can be excluded. The good agreement of the 2Ag ← 1Ag simulation and the
90
measured spectrum helps to assign the observed bands. The 21, 38, 58, and 75 cm-1
sequence bands above the origin band are assigned to 1
12 , 1
16 , 1 1
1 12 6 , and 2
26 ; the 415 and
713 cm-1 bands to 1
02 and 1
01 , the 431 and 728 cm-1 bands to2
12 and 1 1
0 11 2 ; and the -267 and -
245 cm-1 bands to 1
14 and 1 1
1 12 4 , respectively. 1 (ag) and ag) are the symmetric O-Sc
and Sc-Sc stretching modes, and 4 (b1u) and 6 (b3u) are the asymmetric O-Sc stretch and
O atom out-of-plane rock, respectively. Table 5.1 summarizes these spectral assignments.
In a previous Ar-matrix-isolation IR study,225 Andrews and coworkers reported three weak
bands at 866.0, 699.1, and 647.8 cm-1 and assigned the 866.0 cm-1 band to an open ScOScO
dimer and the other two bands to a ring (ScO)2 dimer. The 699.1 cm-1 IR transition is
slightly lower in vibrational frequency than the 713 cm-1 band measured in our MATI
spectrum. The small frequency shift could be due to the Ar-matrix effect that reduces the
O-Sc bond strength or the charge effect from the neutral molecule to the cation. However,
because the symmetric O-Sc stretch is an ag species in D2h point group, this mode is not
expected to be IR active. Thus, the ring (ScO)2 dimer formed in the Ar matrix should have
a lower molecular symmetry than D2h.
5.3.3.2 Y2O2 and La2O2
Because Y and La are in the same group as Sc in the periodical table, Y2O2 and
La2O2 are assumed to adopt the D2h structure as Sc2O2. This assumption is confirmed by
the predicted energies, where the C2v and Cs isomers are much less stable than D2h (Table
5.2). Among the three possible transitions of the D2h structure (i.e., 2Ag ← 1Ag, 2Ag ←
3B1u, 4B3g ← 3B1u ), the 4B3g ← 3B1u process would yield a very different spectrum from
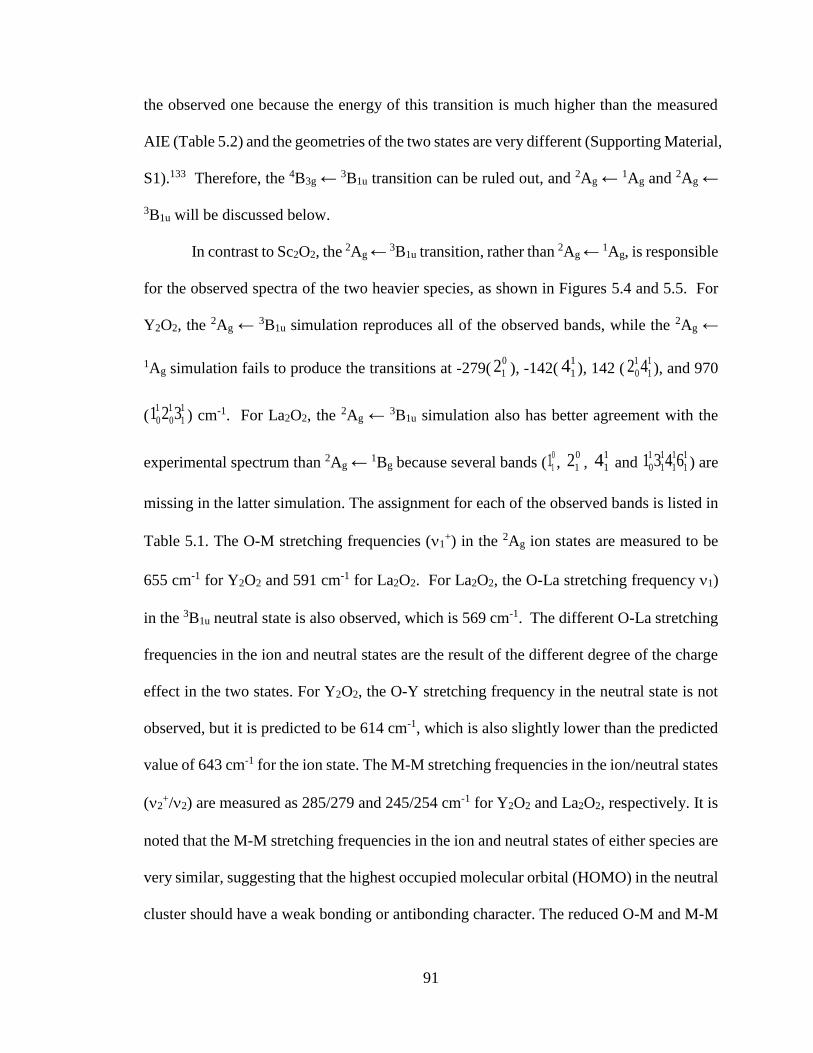
91
the observed one because the energy of this transition is much higher than the measured
AIE (Table 5.2) and the geometries of the two states are very different (Supporting Material,
S1).133 Therefore, the 4B3g ← 3B1u transition can be ruled out, and 2Ag ← 1Ag and 2Ag ←
3B1u will be discussed below.
In contrast to Sc2O2, the 2Ag ← 3B1u transition, rather than 2Ag ← 1Ag, is responsible
for the observed spectra of the two heavier species, as shown in Figures 5.4 and 5.5. For
Y2O2, the 2Ag ← 3B1u simulation reproduces all of the observed bands, while the 2Ag ←
1Ag simulation fails to produce the transitions at -279(0
12 ), -142(1
14 ), 142 (1 1
0 12 4 ), and 970
(1 1 1
0 0 11 2 3 ) cm-1. For La2O2, the 2Ag ← 3B1u simulation also has better agreement with the
experimental spectrum than 2Ag ← 1Bg because several bands (0
11 , 0
12 , 1
14 and 1 1 1 1
0 1 1 11 3 4 6 ) are
missing in the latter simulation. The assignment for each of the observed bands is listed in
Table 5.1. The O-M stretching frequencies (1+) in the 2Ag ion states are measured to be
655 cm-1 for Y2O2 and 591 cm-1 for La2O2. For La2O2, the O-La stretching frequency 1)
in the 3B1u neutral state is also observed, which is 569 cm-1. The different O-La stretching
frequencies in the ion and neutral states are the result of the different degree of the charge
effect in the two states. For Y2O2, the O-Y stretching frequency in the neutral state is not
observed, but it is predicted to be 614 cm-1, which is also slightly lower than the predicted
value of 643 cm-1 for the ion state. The M-M stretching frequencies in the ion/neutral states
(2+/2) are measured as 285/279 and 245/254 cm-1 for Y2O2 and La2O2, respectively. It is
noted that the M-M stretching frequencies in the ion and neutral states of either species are
very similar, suggesting that the highest occupied molecular orbital (HOMO) in the neutral
cluster should have a weak bonding or antibonding character. The reduced O-M and M-M
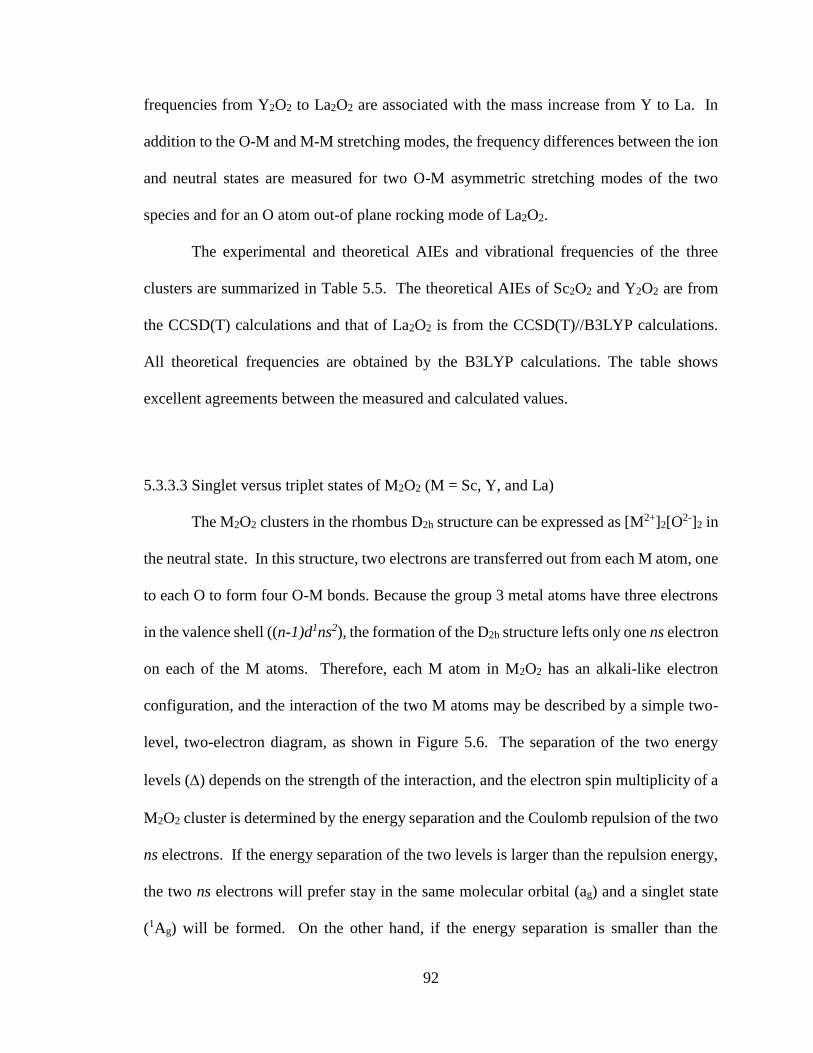
92
frequencies from Y2O2 to La2O2 are associated with the mass increase from Y to La. In
addition to the O-M and M-M stretching modes, the frequency differences between the ion
and neutral states are measured for two O-M asymmetric stretching modes of the two
species and for an O atom out-of plane rocking mode of La2O2.
The experimental and theoretical AIEs and vibrational frequencies of the three
clusters are summarized in Table 5.5. The theoretical AIEs of Sc2O2 and Y2O2 are from
the CCSD(T) calculations and that of La2O2 is from the CCSD(T)//B3LYP calculations.
All theoretical frequencies are obtained by the B3LYP calculations. The table shows
excellent agreements between the measured and calculated values.
5.3.3.3 Singlet versus triplet states of M2O2 (M = Sc, Y, and La)
The M2O2 clusters in the rhombus D2h structure can be expressed as [M2+]2[O2-]2 in
the neutral state. In this structure, two electrons are transferred out from each M atom, one
to each O to form four O-M bonds. Because the group 3 metal atoms have three electrons
in the valence shell ((n-1)d1ns2), the formation of the D2h structure lefts only one ns electron
on each of the M atoms. Therefore, each M atom in M2O2 has an alkali-like electron
configuration, and the interaction of the two M atoms may be described by a simple two-
level, two-electron diagram, as shown in Figure 5.6. The separation of the two energy
levels () depends on the strength of the interaction, and the electron spin multiplicity of a
M2O2 cluster is determined by the energy separation and the Coulomb repulsion of the two
ns electrons. If the energy separation of the two levels is larger than the repulsion energy,
the two ns electrons will prefer stay in the same molecular orbital (ag) and a singlet state
(1Ag) will be formed. On the other hand, if the energy separation is smaller than the
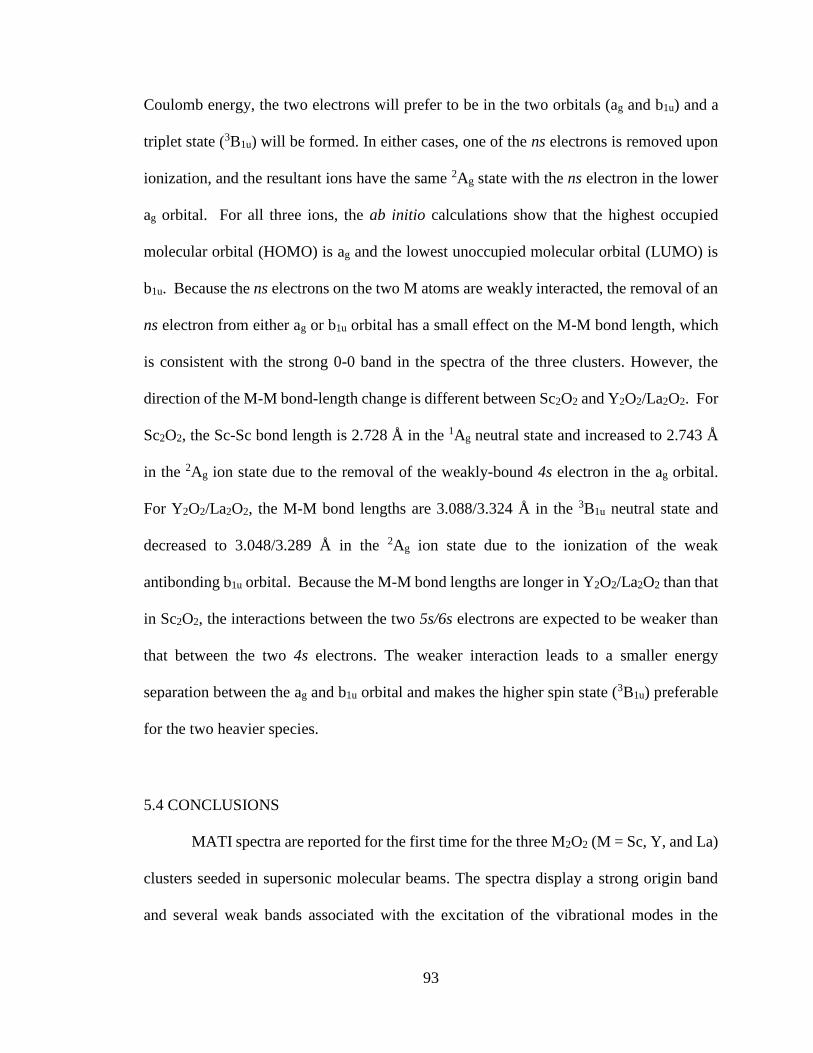
93
Coulomb energy, the two electrons will prefer to be in the two orbitals (ag and b1u) and a
triplet state (3B1u) will be formed. In either cases, one of the ns electrons is removed upon
ionization, and the resultant ions have the same 2Ag state with the ns electron in the lower
ag orbital. For all three ions, the ab initio calculations show that the highest occupied
molecular orbital (HOMO) is ag and the lowest unoccupied molecular orbital (LUMO) is
b1u. Because the ns electrons on the two M atoms are weakly interacted, the removal of an
ns electron from either ag or b1u orbital has a small effect on the M-M bond length, which
is consistent with the strong 0-0 band in the spectra of the three clusters. However, the
direction of the M-M bond-length change is different between Sc2O2 and Y2O2/La2O2. For
Sc2O2, the Sc-Sc bond length is 2.728 Å in the 1Ag neutral state and increased to 2.743 Å
in the 2Ag ion state due to the removal of the weakly-bound 4s electron in the ag orbital.
For Y2O2/La2O2, the M-M bond lengths are 3.088/3.324 Å in the 3B1u neutral state and
decreased to 3.048/3.289 Å in the 2Ag ion state due to the ionization of the weak
antibonding b1u orbital. Because the M-M bond lengths are longer in Y2O2/La2O2 than that
in Sc2O2, the interactions between the two 5s/6s electrons are expected to be weaker than
that between the two 4s electrons. The weaker interaction leads to a smaller energy
separation between the ag and b1u orbital and makes the higher spin state (3B1u) preferable
for the two heavier species.
5.4 CONCLUSIONS
MATI spectra are reported for the first time for the three M2O2 (M = Sc, Y, and La)
clusters seeded in supersonic molecular beams. The spectra display a strong origin band
and several weak bands associated with the excitation of the vibrational modes in the
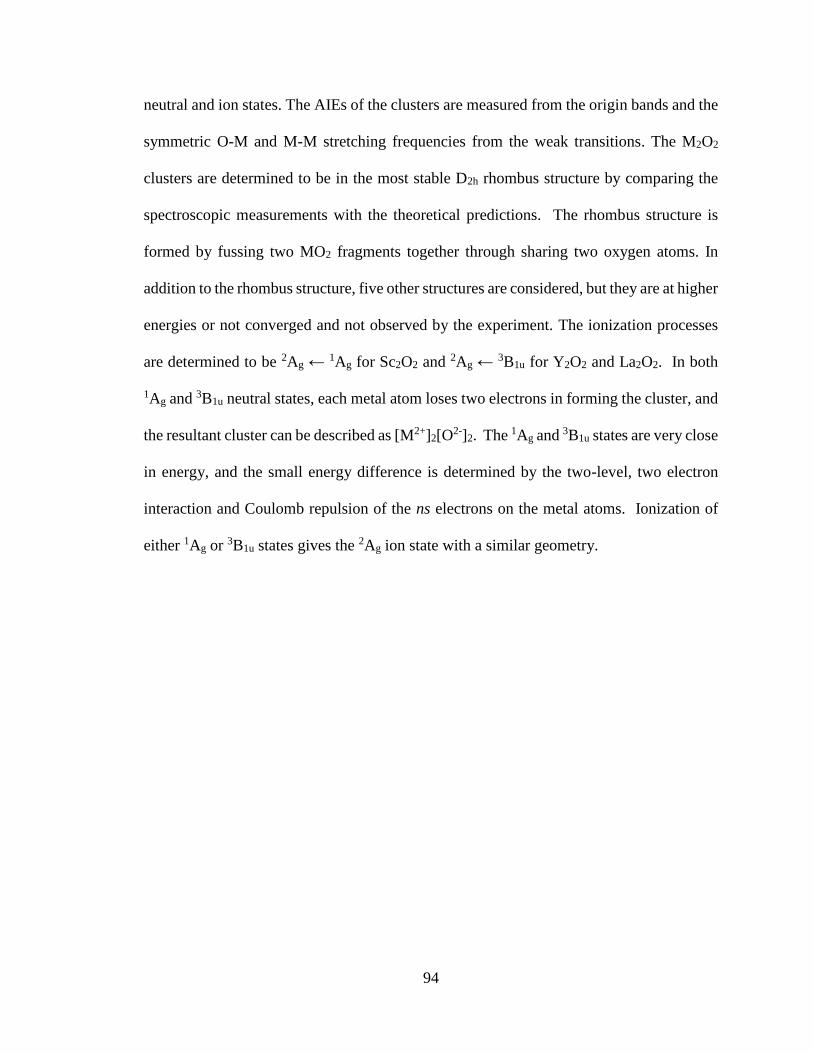
94
neutral and ion states. The AIEs of the clusters are measured from the origin bands and the
symmetric O-M and M-M stretching frequencies from the weak transitions. The M2O2
clusters are determined to be in the most stable D2h rhombus structure by comparing the
spectroscopic measurements with the theoretical predictions. The rhombus structure is
formed by fussing two MO2 fragments together through sharing two oxygen atoms. In
addition to the rhombus structure, five other structures are considered, but they are at higher
energies or not converged and not observed by the experiment. The ionization processes
are determined to be 2Ag ← 1Ag for Sc2O2 and 2Ag ← 3B1u for Y2O2 and La2O2. In both
1Ag and 3B1u neutral states, each metal atom loses two electrons in forming the cluster, and
the resultant cluster can be described as [M2+]2[O2-]2. The 1Ag and 3B1u states are very close
in energy, and the small energy difference is determined by the two-level, two electron
interaction and Coulomb repulsion of the ns electrons on the metal atoms. Ionization of
either 1Ag or 3B1u states gives the 2Ag ion state with a similar geometry.

95
Table 5.1 Band positions (cm-1) and assignments for the MATI spectra of M2O2 (M = Sc,
Y, La). The band positions are relative to those of the origin bands, and the absolute
energies of the origin bands are listed inside square brackets. The relative intensities of the
MATI bands are indicated by "s" (strong), "m" (medium) and "w" (weak).
Sc2O2 Y2O2 La2O2 Assignment
-569, w 0
11
-279, w -254, w 0
12
-267, m -142, m -140, m 1
14
-245, m 1 1
1 14 2
0, s
[44967±5]
0, s
[42456±5]
0, s
[36936±5] 0
00
21,s -19, m 1
12
38, m -51, w 1
16
58, m 1 1
1 12 6
75, w 2
26
30, m 16, m 1
13
142, w 107, w 1 1
0 12 4
415, m 285, m 245, w 1
02
431, m 2
12
421, m 1 1 1 1
0 1 1 11 3 4 6
713, m 655, m 591, m 1
01
728, m 1 1
0 11 2
970, m 857, m 1 1 1
0 0 11 2 3

96
Table 5.2 Point groups, electronic states, relative energies (Erel), and transition energies
(∆E) of M2O2 (M=Sc, Y, La) from the B3LYP calculations, with the aug-cc-pVTZ basis
for the Sc and O atoms and the Stuttgart RSC segmented/ECP basis for the Y and La atoms.
Point
Groupa
Neutral Ion ∆E (eV)
State Erel (eV) State Erel (eV)
Sc2O2
D2h 1Ag 0.15 2Ag 5.42 5.27 (2Ag ← 1Ag)
3B1u 0 4B3g 8.96 5.42/8.96 (2Ag
/4B3g ← 3B1u)
C2v
v
1A1 6.71
3B2 6.32
Cs 1A' 1.69
3A' 2.10 4A' 9.96
Y2O2
D2h 1Ag 0.04 2Ag 5.14 5.10 (2Ag ← 1Ag)
3B1u 0 4B3g 8.60 5.14/8.60 (2Ag /
4B3g← 3B1u)
C2v 1A1 5.85 2B2 11.23
3B2 6.15
Cs 1A' 1.84
4A' 9.69
La2O2
D2h 1Ag 0 2Ag 4.43 4.43 (2Ag ← 1Ag)
3B1u 0.06 4B3g (TS)b 9.47 4.37 (2Ag ← 3B1u)
C2v 1A1 6.89 2A1(TS)b 11.25
3A2 6.87 4B1 11.39
Cs 1A' 1.25 2A' 6.03 4.78 (2A' ← 1A')
3A' 1.89 4.14 ( 2A' ← 3A')
a D2h, C2v, and Cs correspond to the three isomers shown in Figure 5.1 (a, b, and e), and other isomers in
Figure 5.1 are not converged. For Sc2O2, the doublet states of the C2v and Cs structures are converged to the 2Ag state of D2h, and the quartet state of C2v is not converged. For Y2O2, the doublet and triplet states of Cs
are converged to the 2Ag and 3B1u states of D2h, respectively, and the quartet state of C2v is not converged.
For La2O2, the quartet state of D2h and the doublet of C2v are transition states and the quartet state of Cs is not
converged. b TS is the transition state.

97
Table 5.3 Relative electronic energies (Erel, cm-1) of the 1Ag and 3B1u neutral states of M2O2
(M = Sc, Y, La) from the B3LYP, CCSD(T)//B3LYP, and CCSD(T) calculations, with the
aug-cc-pVTZ basis for the Sc and O atoms and the Stuttgart RSC segmented/ECP basis for
the Y and La atoms. For the CCSD(T)//B3LYP calculations, single point energies are
calculated at the B3LYP optimized geometries.
Methods Erel (cm-1)
1Ag 3B1u
Sc2O2
B3LYP 1202 0
CCSD(T)//B3LYP 0 1270
CCSD(T) 0 1812
Y2O2
B3LYP 0 522
CCSD(T)//B3LYP 0 1712
CCSD(T) 0 1562
La2O2
B3LYP 293 0
CCSD(T)//B3LYPb 0 1727
CCSD(T) 0 1618
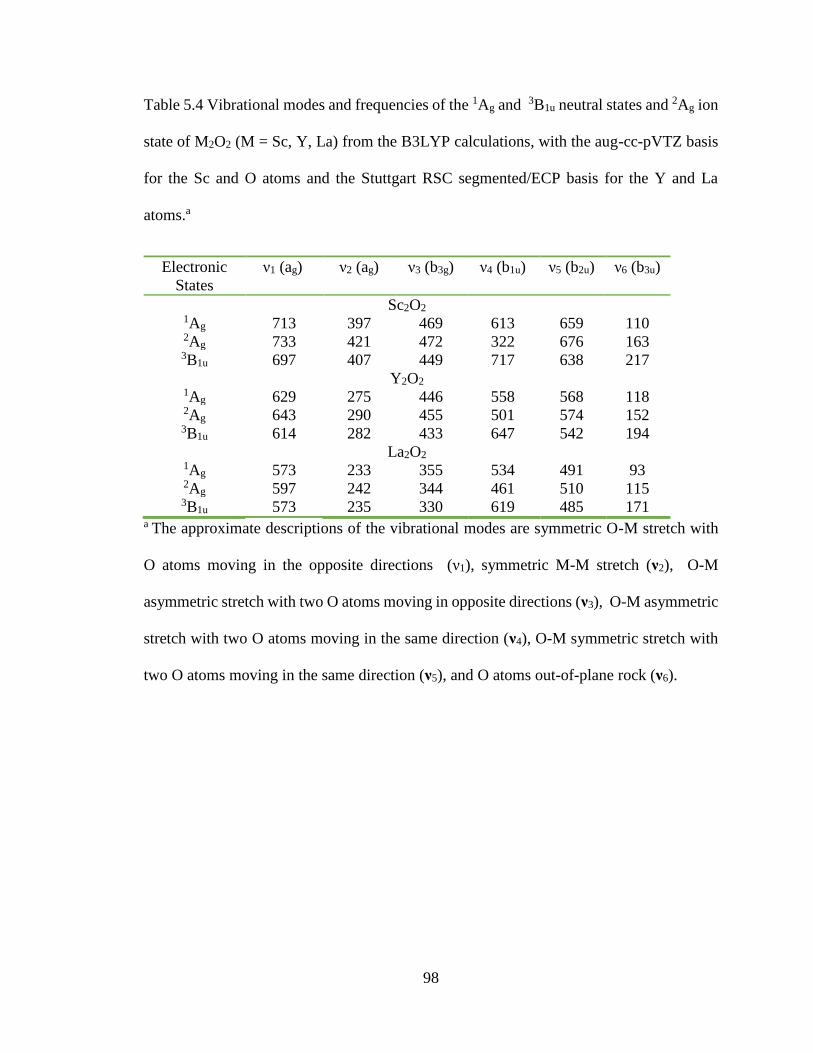
98
Table 5.4 Vibrational modes and frequencies of the 1Ag and 3B1u neutral states and 2Ag ion
state of M2O2 (M = Sc, Y, La) from the B3LYP calculations, with the aug-cc-pVTZ basis
for the Sc and O atoms and the Stuttgart RSC segmented/ECP basis for the Y and La
atoms.a
Electronic
States
ν1 (ag) ν2 (ag) ν3 (b3g) ν4 (b1u) ν5 (b2u) ν6 (b3u)
Sc2O2 1Ag 713 397 469 613 659 110 2Ag 733 421 472 322 676 163 3B1u 697 407 449 717 638 217
Y2O2 1Ag 629 275 446 558 568 118 2Ag 643 290 455 501 574 152 3B1u 614 282 433 647 542 194
La2O2 1Ag 573 233 355 534 491 93 2Ag 597 242 344 461 510 115 3B1u 573 235 330 619 485 171
a The approximate descriptions of the vibrational modes are symmetric O-M stretch with
O atoms moving in the opposite directions (ν1), symmetric M-M stretch (ν2), O-M
asymmetric stretch with two O atoms moving in opposite directions (ν3), O-M asymmetric
stretch with two O atoms moving in the same direction (ν4), O-M symmetric stretch with
two O atoms moving in the same direction (ν5), and O atoms out-of-plane rock (ν6).

99
Table 5.5 Measured adiabatic ionization energies (AIE, eV) of M2O2 (M = Sc, Y, and La)
and vibrational frequencies of the ion ( i , cm-1) and neutral states ( i , cm-1), along with
those in parentheses from the theoretical calculations.a The AIEs correspond to the
ionization processes of Sc2O2+ (2Ag, D2h) ← Sc2O2 (
1Ag, D2h) and M2O2+ (2Ag, D2h) ←
M2O2 (3B1u, D2h) for M=Y and La.b
Sc2O2 Y2O2 La2O2 Approx. description
AIE 5.57520.0006 5.26390.0006 4.57950.0006
(5.62) (5.27) (4.54)
1 713 (733) 655 (643) 591 (597) O-M symmetric stretch
1 569 (573)
2
415 (421) 285 (290) 245 (242) M-M symmetric stretch
2 395(397) 279 (282) 254 (235)
3 3
30 (22) 16 (14) O-M asymmetric stretch
with two O
m
atoms moving in the
opposite directions 4 4 -267 (-291) -142 (-146) -140 (-158) O-M asymmetric stretch
with two O
m
atoms moving in the
direction -51(-56) O atoms out-of-plane rock
a The theoretical AIEs of Sc2O2 and Y2O2 are from the CCSD (T) calculations and that of
La2O2 from the CCSD(T)//B3LYP calculations. The CCSD(T) geometry optimization was
not converged for the La2O2 ion. The theoretical vibrational frequencies are from the
B3LYP calculations. Basis sets in all calculations are aug-cc-pVTZ for the Sc and O atoms
and Stuttgart RSC segmented/ECP for the Y and La atoms.

100
Table 5.6 Calculated metal-metal (M-M) and metal-oxygen (M-O) bond lengths and
oxygen-metal-oxygen (O-M-O) bond angles of the D2h M2O2 (M = Sc, Y, La) clusters from
the DFT/B3LYP calculations. The aug-cc-pVTZ basis sets are used for the Sc and O atoms
and Stuttgart RSC segmented/ECP for the Y and La atoms.
M-M (Å) M-O (Å) O-M-O (o)
Sc2O2
1Ag 2.728 1.873 86
2Ag 2.743 1.863 85
3B1u 2.782 1.886 85
4B3g 3.168 1.946 71
Y2O2
1Ag 3.042 2.032 83
2Ag 3.048 2.019 82
3B1u 3.088 2.043 82
4B3g 3.497 2.093 67
La2O2
1Ag 3.271 2.111 78
2Ag 3.289 2.103 77
3B1u 3.324 2.124 77
4B3g 3.846 2.257 63
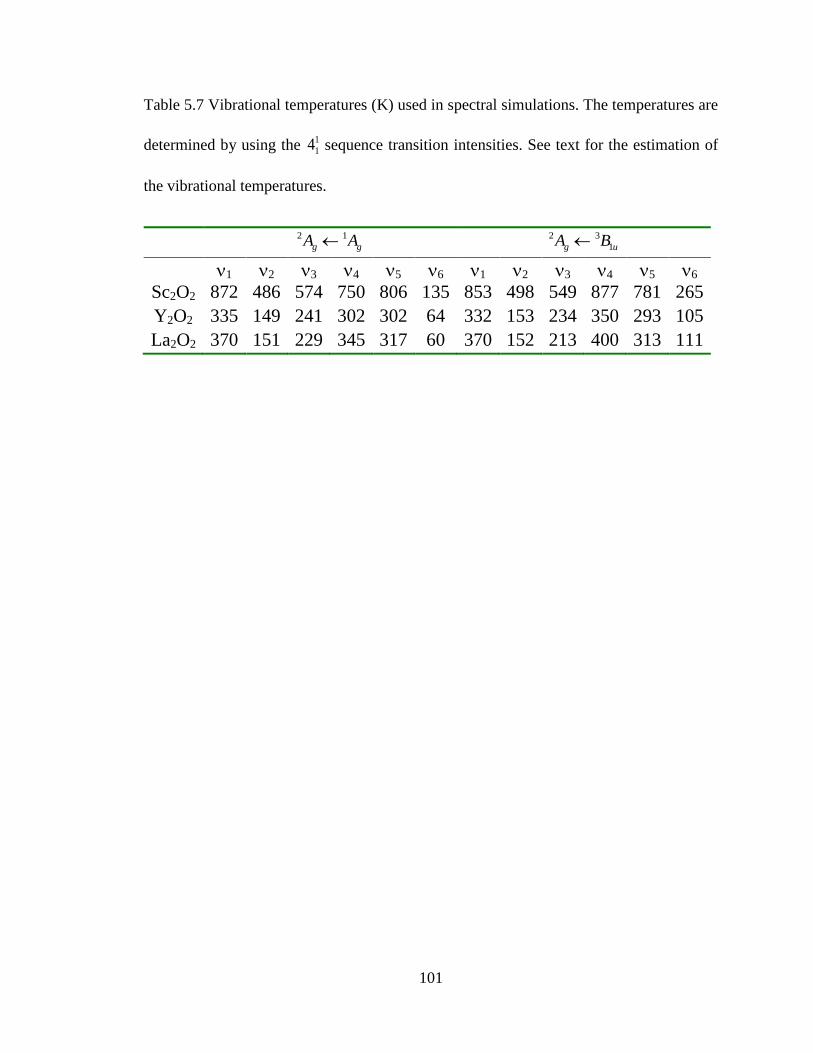
101
Table 5.7 Vibrational temperatures (K) used in spectral simulations. The temperatures are
determined by using the 1
14 sequence transition intensities. See text for the estimation of
the vibrational temperatures.
2 1
g gA A 2 3
1g uA B
1 2 3 4 5 6 1 2 3 4 5 6
Sc2O2 872 486 574 750 806 135 853 498 549 877 781 265
Y2O2 335 149 241 302 302 64 332 153 234 350 293 105
La2O2 370 151 229 345 317 60 370 152 213 400 313 111
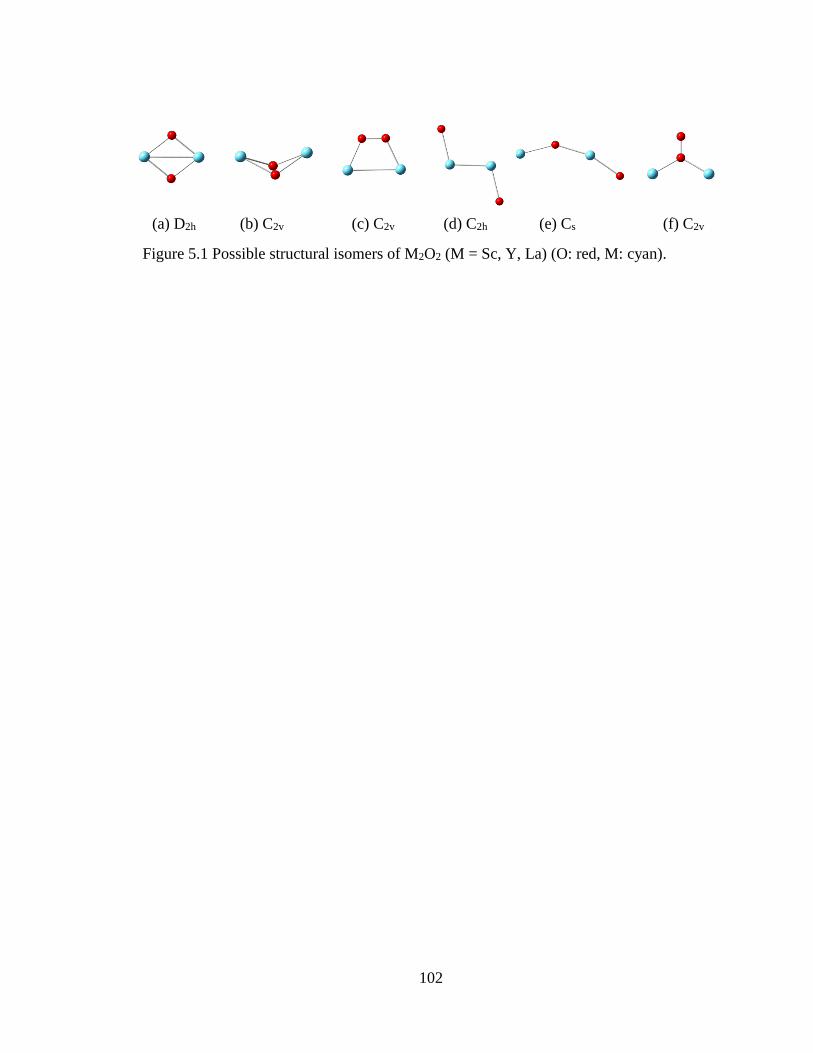
102
(a) D2h (b) C2v (c) C2v (d) C2h (e) Cs (f) C2v
Figure 5.1 Possible structural isomers of M2O2 (M = Sc, Y, La) (O: red, M: cyan).

103
0-0 (44967)
Wavenumber (cm-1
)
-500 0 500 1000
0-0 (42456)
0-0 (36936)
(a) Sc2O
2
(b) Y2O
2
(c) La2O
2
Figure 5.2 MATI spectra of Sc2O2 (a) and Y2O2 (b) seeded in He carrier gas and La2O2
seeded in Ar carrier gas (c).

104
Wavenumber (cm-1
)
-400 -200 0 200 400 600 800
(a) Experiment
2 1
g gA A
2 3
1g uA B
1 1
1 14 2
1
140-0 1
12 6n
n
6n
n1
021
01
(b)
(c)
2
12 1 1
0 11 2
Figure 5.3 MATI Spectrum of Sc2O2 seeded in He carrier gas (a) and simulations of the
2Ag ← 1Ag (b) and 2Ag ← 3B1u (c) transitions from B3LYP calculations.

105
Wavenumber (cm-1)
-500 0 500 1000 1500
(a) Experiment
2 3
1g uA B
2 1
g gA A
0
12 1
140-0 1 1
0 12 41
02 1
011 1 1
0 0 11 2 3
(b)
(c)
Figure 5.4 MATI Spectrum of Y2O2 seeded in He carrier gas (a) and simulations of the 2Ag
← 3B1u (b) and 2Ag ← 1Ag (c) transitions from B3LYP calculations.

106
Wavenumber (cm-1)
-500 0 500 1000
(a) Experiment
2 3
1g uA B
2 1
g gA A
0
110
12 1
16
1
131 1 1 1
0 1 1 11 3 4 6
1
011
020-0
1
141 1
0 12 4
2 1 1
0 0 11 2 3
(b)
(c)
1
12
Figure 5.5 MATI Spectrum of L2O2 seeded in Ar carrier gas (a) and simulations of the 2Ag
← 3B1u (b) and 2Ag ← 1Ag (c) transitions from B3LYP calculations.

107
HOMO (ag)
LUMO (b1u)
M2+ M2+ M2O2
ag
b1u
ns ns
(a) (b)
Figure 5.6 Interaction diagram of two ns orbitals of the M2 fragment (a) and HOMO and
LUMO of M2O2 (M = Sc, Y, La) (b).
Copyright © Lu Wu 2014

108
CHAPTER 6 MASS-ANALYZED THRESHOLD IONIZATION AND ELECTRONIC
STATES OF M3O4 (M = SC, Y, AND LA)
6.1 INTRODUCTION
Transition metal oxide clusters serve as building blocks of nanostructural materials
and exhibit size-dependent physical and chemical properties. Their important applications
and interesting properties have motivated numerous research groups to study these clusters
in the gas phase, where complicating factors such as solvents and counterions are removed.
For transition metal oxide cluster cations, extensive studies have been reported on their
reactivity,40-43 UV-Vis photodissociation,44-46 and infrared (IR) multiphoton
photodissociation or single-photon vibrational predissociation.47-55,224 The studies of
cluster anions were largely carried out with photoelectron spectreoscopy,56-71 and
additional investigations were reported about their reactivity40,42,72-75 and IR
photodissociation.51,76-78 Neutral cluster oxides are more challenging to study
experimentally because they are difficult to size-select, and their formation and properties
are usually determined by ionization techniques, including multiphoton IR79 and single-
photon UV80-82 and vacuum UV laser ionization.83-86 In addition, neutral metal oxides have
also been studied by matrix-isolation IR spectroscopy.87 In spite of the extensive studies,
the current knowledge about the electronic states and molecular structures of transition
metal oxide clusters is largely derived from theoretical predictions. However, the reliable
prediction of the electronic states and geometric structures is often complicated by the
presence of many low energy structural isomers and high density low-lying electronic
states of each isomer. Thus, inconsistent theoretical results have often been reported on

109
the nature of the ground electronic states and minimum energy structures of both
neutral88,89 and ionic clusters.51,90,91 Therefore, a reliable identification of the molecular
structures and electronic states for transition metal oxide clusters and their ions generally
requires the confirmation by spectroscopic measurements, especially by high resolution
spectroscopic techniques.
For group 3 multinuclear metal oxide clusters, there have been several reports on
photoionization, photoelectron, and mass spectrometric measurements. Zhao et. al
reported anion photoelectron spectra of Sc3O6- and proposed the ground state of the cluster
was an oxygen-centered biradical.236 Nakajima, Kaya, and coworkers measured
photoelectron spectra of yttrium oxide clusters YnOm- (n =2-10, m = 1-3) and observed an
increase of the EAs for the monoxide clusters with increasing cluster size.67 On the other
hand, Yang and Knickelbein observed from photoionization efficiency spectra the
reduction of the IEs of the ScnO (n = 5-36) and YnO (n = 2-31) monoxide clusters with
increasing cluster size.81,82 Aubriet and Muller studied the formation of scandium and
yttrium cluster oxide ions using laser ablation mass spectrometry.237 Reed and Duncan
studied the stoichiometry and photodissociation of yttrium and lanthanum oxide cluster
cations produced by laser vaporization of metal targets in a He/O2 expansion.46 The mass
spectra exhibited a strong preference for the odd-numbered metal clusters, with the intense
peaks in the MO(M2O3)n+ (M = Y and La) stoichiometry. The preference of the
MO(M2O3)n+ stoichiometry was also reported by Schweikert and coworkers in the study of
the metastable decay of lanthanum oxides produced from the high energy atom
bombardment,238 by Gibson in laser ablation synthesis of lanthanide oxide cluster ions
incorporating a heterovalent metal,239,240 and by Kahwa and Selbin in the study of stability

110
trends and fragmentation patterns of yttrium oxide clusters by fast atom bombardment
tandem mass spectrometry.241 The smallest cluster with the MO(M2O3)n+ stoichiometry,
M3O4, was predicted to prefer a C3v cage-like structure (Figure 6.1a),46,227 but no
experimental confirmation was reported. Similar cage structures were identified for Al3O4+
and Ce3O4+ by free electron IR laser spectroscopy.242,243 On the other hand, a Cs ring
structure (Figure 6.1c) was reported for Ta3O4-/0 and a D2d double ring structure (Figure
6.1e) for Si3O4-1/0 from anion photoelectron spectroscopic studies.244,245 These studies
suggest that the preferred structure of a M3O4 cluster depend on the identity of the metal
elements.
In this chapter, we report MATI spectroscopy of group 3 metal trimer tetroxides
produced by laser ablation. From the MATI spectra, we measured AIEs of the neutral
clusters and vibrational frequencies of the singly charged cations. By combining the
spectroscopic measurements with DFT calculations, we determined the preferred structures
and ground electronic states of these clusters.
6.2 EXPERIMENTAL AND COMPUTATIONAL METHODS
The metal-cluster beam MATI spectrometer has been described in a previous
publication.171 Metal cluster oxides were produced by laser vaporization (Lumonics YM-
800 Nd:YAG, 532 nm,) of a metal rod in the presence of a pulse of ultra-high-purity He or
Ar carrier gas, delivered by a homemade piezoelectric pulsed valve,172 and a small amount
of oxygen, supplied with a metering valve. The metal vapor and gas mixture passed down
a clustering tube (2 mm inner diameter, 2 cm length), and the resultant clusters were
supersonically expanded into the vacuum chamber. The supersonic jet was skimmed (2mm
111
diameter) 3 cm downstream from the exit end of the clustering tube. A pair of deflection
plates (2.5 cm spacing, 220V) located after the skimmer was used to remove residual
charged species (formed during laser ablation) from the molecular beam before it entered
the spectroscopic chamber. Prior to the MATI measurements, photoionization time-of-
flight mass spectra were recorded to determine the chemical content of the cluster beam,
and pulsed-field-ionization photoionization efficiency spectra were recorded to locate the
ionization threshold of the M3O4 clusters. With the ionization laser set above the ionization
threshold, the experimental conditions (e.g., timing and power of the vaporization and
ionization lasers, the backing pressure of the carrier gas, and the concentration of oxygen)
were carefully optimized to maximize the intensity of the M3O4+ signal in the mass spectra.
With the optimized experimental conditions, M3O4 was excited to high-lying Rydberg
states in a single-photon process by the frequency-doubled output of a dye laser (Lumonics
HD-500) pumped by a Nd:YAG laser (Quanta Ray GCR-3, 355 nm) and then ionized by
an electric pulse (DEI PVM-4140, 320 V cm-1). The laser beam was collinear and counter
propagating with the molecule beam. The time delay between the laser and electric pulses
was varied to maximize the MATI signal and was typically 20 s for He carrier and 50 s
for Ar. A small DC field (1.2, 1.7, and 1.0 V cm-1 for Sc3O4, Y3O4, and La3O4, respectively)
was applied to help separate the prompt ions produced by direct photoionization from the
MATI ions produced by delayed field ionization. The MATI signal was obtained by
scanning the wavelength of the tunable dye laser, detected by a dual microchannel plate
detector, amplified by a preamplifier (SRS SR445), averaged by a gated integrator (SRS
SR250), and stored in a laboratory computer. Laser wavelengths were calibrated against
vanadium atomic transitions in the spectral region.153 The Stark shift induced by the DC

112
field was calculated using the relation of IE = 6.1Ef1/2, where Ef is in V cm-1 and E in
cm-1.151
Calculation of molecular geometries and vibrational frequencies were carried with
Gaussian 09 program.179 In these calculations, DFT was employed with Becke’s three
parameter hybrid functional with the correlation functional of Lee, Yang and Parr
(B3LYP),128,129 Oxygen and scandium atomic orbitals were described by the aug-cc-pVTZ
basis set 176 or the 6-311+g(d) valence triple split basis set.177 Yttrium and lanthanum
atomic orbitals were represented by the Stuttgart-type relativistic effective core potential
basis with 28 core electrons (Stuttgart RSC segmented/ECP).234 To compare with the
experimental spectra, Franck-Condon (FC) factors were calculated using the equilibrium
geometries, harmonic frequencies, and normal mode coordinates of the neutral cluster and
cation.146,147,186 In these calculations, recursion relations187 were employed and the
Duschinsky effect142 was taken into consideration. Spectral simulations were obtained
using the experimental linewidth and a Lorentzian line shape. Transitions from exited
vibrational levels of the neutral molecule were considered by assuming thermal excitation
at specific temperatures.
6.3 RESULTS AND DISCUSSION
6.3.1 MATI spectra
Figure 6.2 presents the MATI spectra of the M3O4 (M = Sc, Y, and La) clusters seeded in
argon carrier gas. Each spectrum displays a predominant origin band (0-0) and many weak bands.
The band positions are listed in Table 6.1. The observed spectral profile suggests that the three
clusters have similar structures and that the structure of each cluster does not change significantly

113
upon ionization. The small ionization effect on the molecular structure implies that the ejected
electron from the highest occupied molecular orbital (HOMO) is weakly bound. The energy of the
origin band corresponds to the AIE of each cluster, and the AIEs of three clusters decrease
considerably from Sc to Y to La. The large AIE differences among the three clusters indicate the
ejected electron originates from a metal-based, rather than an oxygen-based orbital. Compared to
those of free metal atoms,189 the AIEs of the clusters are red shifted by 17985 cm-1 for Sc, 17441
cm-1 for Y, and 16952 cm-1 for La. Because the AIE shifts are comparable, the metal-oxygen
bonding is expected to be similar in these clusters.
6.3.2 Possible structural isomers
Because a cage-like structure was previously predicted for Sc3O4, Y3O4+, and La3O4
+, 46,227
we considered this structure a starting point in our computational search for possible isomers of the
M3O40/+1 clusters, which are shown in Figure 6.2. The search for a preferred isomer is performed
on Sc3O4 only, as the other two clusters are expected to have similar structures. The C2v isomer
(Figure 6.2b) is derived from the C3v cage (Figure 6.2a) by breaking an Ot-M bond, the Cs ring
(Figure 6.2c) from the C2v structure by breaking another Ot-M bond, and the C1 isomer from the
C3v cage by cleaving an Od-M bond. Ot and Od are referred to triply and doubly coordinated oxygen
atoms, respectively. The D2d isomer (Figure 6.2d) is formed by fusing two M2O2 four-member
rings together through a M atom, and the two rings are perpendicular to each other. The Cs isomer
was previously identified for Ta3O4-1/0 and the D2d isomer for Si3O4
-1/0, both by anion photoelectron
spectroscopy.244-246
Table 6.2 summarizes the electronic states and energies of various Sc3O4 isomers from the
DFT/B3LYP calculations. Among these isomers, the C3v cage structure is the most stable one. For
each isomer, the doublet state is the ground state of the neutral cluster and the singlet is the ground
state of the cation. The geometry optimization of the initial Cs and C1 isomers in the singlet ion

114
states leads to the 1A1 state of the C3v cage structure, indicating the cluster ion with a terminal
oxygen atom is not stable. On the other hand, the geometry optimization of the initial C3v and D2d
isomers are not converged in their high spin quartet neutral states and triplet ion states. Instead,
the re-optimization without symmetry restriction leads to the quartet and triplet states in distorted
C1 structures.
6.3.3 Observed structural isomer and electronic transition
We first focus on the Sc3O4 cluster for which extensive computations are performed for
various electronic states of five isomers (Table 6.2) and use the results from the Sc cluster as guide
for the structural and spectral assignments of the two heavier analogues. Because the quartet state
of each isomer has much higher energy than the doublet ground state, we will consider ionization
of the doublet neutral state in the discussion of the spectral and structural assignments. Ionization
of a doublet spin state would yield a triplet or a singlet ion state, but the triplet ← doublet transition
of each isomer requires AIE > 8.0 eV, which is more than 3.0 eV than the measured value. Thus,
the triplet ← double ionization is not likely responsible for the observed MATI spectrum.
Moreover, because ionization of the 2A state of the Cs isomer or the 2A state of the C1 isomer yields
the 1A1 ion state in C3v geometry, the 1A1 (C3v) ← 2A (Cs) or 2A (C1) transition would give a MATI
spectrum with a very long FC profile, inconsistent with the observation. Therefore, the 1A1 (C3v)
← 2A (Cs) or 2A (C1) transition can be excluded from the spectral assignment. From the energy
viewpoint, the 1A1 ← 2A1 transitions of the C3v, C2v, or D2d isomers are possible candidates for the
observed MAIT spectrum. These are the lowest-energy isomers, with the predicted AIEs within
0.4 eV of the experimental measurement. However, the MATI spectrum does not seem to involve
multiple electronic transitions because it displays only a single origin band. The most likely
transition for the observed spectrum is the 1A1 ← 2A1 process of the C3v isomer because of the
following evidences. First, the C3v isomer is the most stable one among the three isomers, with the

115
C2v and D2d structures lying 0.35 and 1.27 eV, respectively. Second, the predicted AIE of the 1A1
← 2A1 process of the C3v isomer (4.58 eV) is in excellent agreement with the experimental value
(4.5939 0.0006 eV), while those of the C2v and D2d are 0.4 eV higher. Third, the spectral
simulation of the 1A1 ← 2A1 transition of the C3v structure reproduces nicely the overall features of
the experimental spectrum, while those of the C2v and D2d isomer are not, as shown by Figure 6.3.
In these simulations, the calculated vibrational frequencies (Table 6.3) are not scaled, but the
theoretical AIEs are shifted to the experimental origin band for comparison. Similarly, the
simulations of the 1A1 ← 2A1 transitions of the C3v isomers of the Y3O4 and La3O4 reproduce the
overall features of the experimental spectra (Figure 6.4 and 6.5), suggesting that the singlet ←
doublet transition is also responsible for the two heavier clusters.
With the identification of the electronic transition, the vibrational assignments of the MATI
spectra are straightforward. Figures 6.3-6.5 show the assignments for the MATI bands from single
mode excitations, and Table 6.1 lists the assignments for all observed bands. In the table, the band
positions are relative to that of the origin band, the predicted band wavenumbers are listed inside
parentheses, and the vibrational modes are labeled in the Herzberg order. The Herzberg order for
the C3v point group proceeds as follows: symmetry species a1 is before a2 before e; for a given
symmetry type, normal mode frequencies are arranged in descending order. It can be seen from
Table 6.1 that 1 1 1 1 10 0 0 0 01 , 2 , 3 , 4 , and 6 transitions are observed in the spectra of all three clusters
and additional 1 10 09 and 10 are obtained in the spectrum of Sc3O4. Because 1
+, 2+, 3
+, and 4+ are
totally symmetric modes (Table 6.3), the observation of their excitations is expected on the basis
of the general electronic selection rule. On the other hand, 6+, 9
+ and 10+ are doubly degenerate
modes and their activity arises from the vibronic coupling. Because the direct product of the
vibronic species of the neutral and ion states (a1e) is the same as the species of the (x,y)
component of the electric dipole moment (e), the vibronic coupling makes these modes active.
However, vibronic coupling is not included in the spectral simulations, the 1 1 10 0 010 , 9 , and 6

116
transitions are not reproduced by the 1A1 ← 2A1 simulation of the Sc3O4 cluster (Figure 6.3b) and
the 106 transition is missing in the 1A1 ← 2A1 simulations of the Y3O4 and La3O4 clusters (Figures
6.4b and 6.5b).
Table 6.4 summarizes the AIEs and vibrational frequencies from the MATI measurements
and DFT calculations. The predicted AIEs and vibrational frequencies are within 0.2 eV and 10
cm-1 of the measured values, respectively. The AIEs of the clusters decrease down the triad, similar
to those of the free atoms.189 The observed vibrational modes include metal-oxygen stretching (1+,
2+, and 6
+), metal triangle breathing (3+ and 9
+), oxygen-metal-oxygen rocking (4+ and 10
+).
Because there are two types of oxygen atoms in C3v M3O4 clusters (Figure 6.1a), two different
symmetric metal-oxygen stretching frequencies are observed: one (1+) corresponds to the
stretching motion associated with three doubly-coordinated oxygen atoms (Od) and the other (2+)
with triply-coordinated oxygen (Ot). It is noted that the frequencies of the symmetric La-Od (531
cm-1, 1+) and La-Ot (421 cm-1, 2
+) stretching and antisymmetic La-Od stretching (627 cm-1, 9+)
are comparable to those of the corresponding Ce-O stretching motions (536, 413, and 633 cm-1,
respectively) in the Ce3O4+Ne cluster measured by IR vibrational predissociation spectroscopy.231
This is not surprising as La and Ce metals have similar atomic masses and comparable bonding to
oxygen.
Figure 6.6 present frontier molecular orbitals of M3O4 using M = Sc as an example. The
HOMO is consists of essentially a Sc 4s character, contributed equally by each of the three metal
atoms. No other valence occupied orbitals consist of significant M nd or (n+1)s characters (Lu,
please check this statement by looking more occupied MOs). HOMO-1 is doubly degenerate,
largely with an O 2p character. The lowest unoccupied molecular orbital (LUMO) is also doubly
degenerate, but mainly with a M (n+1)s character. The orbital analysis suggests that each M atom
in M3O4 has only 1
3 (n+1)s electron on average. Because each free M atom has three valence
117
electrons (with the ground electron configuration of nd1(n+1)s2), three M atom lose a total of eight
electrons in forming the M3O4 cluster, and each M atom may be consider having a formal oxidation
state of +2
23
.
6.4 CONCLUSIONS
MATI spectra are reported for the first time for the M3O4 (M = Sc, Y, and La) clusters
seeded in supersonic molecular beams. The spectra exhibit a strong origin band and many weak
bands associated with excitations of vibrational modes of the cationic clusters. Our joint
experimental and computational analysis shows that each spectrum involves the 1A1 ← 2A1
transition of the most stable cage-like structure. The cage-like structure contains alternative M-O-
M-O bonds and is formed by joining three M2O2 fragments together, each sharing two O-M bonds
with others. One of the four oxygen atoms is bonded to three metal atoms and the other three are
bonded to two metals, whereas each metal atom forms at least three bonds with oxygen atoms.
Molecular orbital analysis shows that the three metal atoms in the 2A1 neutral ground state of M3O4
lose a total of eight electrons in forming the cluster and each metal atom may be considered having
+2
23
oxidation state. Ionization of the 2A1 state yields the 1A1 ion by removing a metal-based s
electron. For the 1A1 sate, four vibrational modes are measured for all three clusters, and additional
two modes are observed for Sc3O4. In addition to the cage-like structure, four other structural
isomers are considered, but they have higher energies and are not probed by the MATI experiment.
This is the first high-resolution ion spectroscopic measurement on the transition metal clusters of
the MO(M2O3)n stoichiometry, and further measurements on larger clusters would be valuable in
understanding the formation of this class of metal clusters.
Table 6.1 Spectral band positions (cm-1) and assignments of M3O4 (M = Sc, Y and La)
from MATI measurements and DFT/B3LYP calculations.a The band positions are relative

118
to that of the origin band, and the calculated values are given inside parentheses. The
energy of the origin band for each molecule is listed inside square brackets. Reprinted with
permission from J. Chem. Phys., 137, 084312 (2014), Copyright 2013 AIP Publishing LLC.
Sc3O4b Y3O4
b La3O4b Assignment
0
[359375 (37052)]
0
[327355 (34259)]
0
[280285 (28449)] 0
00
204 (202), w 1010
273 (275), m 238 (242), vw 204 (202), vw 104
300 (293), w 109
437 (439),m, 314 (311), w 251 (250), m 103
545 (549), vw 475 (470), w 421 (416), m 102
573 (568), vw 1 10 04 9
604 (586), vw 209
639 (641), w 1 10 03 10
667 (671), s 591 (589), s 531 (526), s 101
713 (714), w 1 10 03 4
732 (732), w 1 10 03 9
751 (746), m 678 (676), m 627 (633), m 106
794 (781), vw 674 (666), vw 1 10 02 3
867 (873), vw 1 10 01 10
935 (946), vw 1 10 01 4
1018 (1025), vw 1 20 03 9
1098 (1110), vw 782 (776), vw 1 10 01 3
946 (942), vw 1 10 01 2
1330 (1343), w 1182 (1178), vw 201
1420 (1417), w 1 10 01 6
1485 (1492), vw 206
aBasis sets are aug-cc-pVTZ for Sc and O atoms and Stuttgart RSC Segmented/ECP for Y
and La atoms.
bThe relative intensities of the MATI bands are indicated by “s” (strong), “m” (medium),
“w” (weak), and “vw” (very weak).

119
Table 6.2 Point groups, electronic states and relative energies (Erel), and transition energies
(E) of Sc3O4 isomers from DFT/B3LYP calculations.a Reprinted with permission from J.
Chem. Phys., 137, 084312 (2014), Copyright 2013 AIP Publishing LLC.
Point Groupb Neutral Ion E(eV)
State Erel (eV) State Erel (eV)
C3v
2A1 0 1A1 4.58 4.58 (1A1←2A1)
4A 3.95 3A 8.66
C2v
2A1 0.35 1A1 5.34 4.99 (1A1←2A1)
4B1 3.51 3B1 8.25
D2d
2A1 1.27 1A1 6.18 4.91 (1A1←2A1)
4A 4.03 3A 9.27
Cs
2A 2.40
4A 3.85 3A 9.30
C1
2A 1.91
4A 4.02 3A 9.15
a 6-311+G(d,p) basis set are used for the Sc and O atoms.
bThe structure of each point group is shown in Figure 6.1. The singlet states of the Cs and
C1 isomers are converged to the 1A1 state of the C3v structure. The quartet and triplet states
with initial C3v and D2d structures are not converged, but reoptimization without symmetry
restriction leads to distorted C1 structures.

120
Table 6.3 Vibrational modes and frequencies of M3O4 (C3v) and M3O4+(C3v) (M = Sc, Y,
and La) from DFT/B3LYP calculations.a Reprinted with permission from J. Chem. Phys.,
137, 084312 (2014), Copyright 2013 AIP Publishing LLC.
1 (a1) 2(a1) 3(a1) 4(a1) 5(a2) 6(e) 7 (e) 8(e) 9(e) 10(e)
Sc3O4+ (1A1) 671 549 439 275 465 746 672 433 293 202
Sc3O4 (2A1) 643 532 390 252 457 650 550 424 288 185
Y3O4+ (1A1) 589 470 311 242 456 676 567 402 212 169
Y3O4 (2A1) 571 453 294 232 441 562 518 390 204 160
La3O4+ (1A1) 526 416 250 202 335 633 494 329 152 140
La3O4 (2A1) 508 396 234 184 329 507 435 319 149 128
a Basis sets are aug-cc-pVTZ for Sc and O atoms and Stuttgart RSC Segmented/ECP for Y
and La atoms.

121
Table 6.4 Measured adiabatic ionization energies (AIE, eV) and ionic vibrational
frequencies ( i , cm-1) of M3O4 (M = Sc, Y, and La), along with those in parentheses from
DFT/B3LYP calculations.a The AIE corresponds to the ionization process of M3O4+ (1A1,
C3v) ← M3O4 (2A1, C3v). Reprinted with permission from J. Chem. Phys., 137, 084312 (2014),
Copyright 2013 AIP Publishing LLC.
Mode Sc3O4 Y3O4 La3O4 Approx. description
AIE 4.45560.0006
(4.59)
4.05860.0006
(4.25)
3.47500.0006
(3.53)
1 1, a 667 (671) 591 (589) 531 (526) Symmetric Od-M stretch
2 1, a 545 (549) 475 (470) 421 (416) Symmetric Ot-M stretch
3 1, a 437 (439) 314 (311) 251 (250) Symmetric M3 ring breath
4 1, a 273 (275) 238 (242) 204 (202) Symmetric Od-M-Od rock
6 , e 751 (746) 678 (676) 627 (633) Antisymmetric Od-M
stretch
9 , e 300 (293) (212) (152) Antisymmetric M3 breath
10 , e 204 (202) (169) (140)
Antisymmetric Od-M-Od
rock
aBasis sets are aug-cc-pVTZ for Sc and O atoms and Stuttgart RSC Segmented/ECP for Y
and La atoms.
b “Od” and “Ot” are doubly- and triply-bound oxygen atoms, respectively.

122
(a) C3v (b) C2v (c) Cs (d) C1 (e) D2d
Figure 6.1 Possible structural isomers of M3O4 (M = Sc, Y, and La). Reprinted with
permission from J. Chem. Phys., 137, 084312 (2014), Copyright 2013 AIP Publishing
LLC.

123
0-0 (35937)
Wavenumber (cm-1
)
0 200 400 600 800 1000 1200 1400
X10
X5
0-0 (32735)
0-0 (28028)
X5
X5
(a) Sc3O
4
(b) Y3O
4
(c) La3O
4
Figure 6.2 MATI spectra of M3O4 (M = Sc, Y, and La) seeded in argon carrier. Reprinted
with permission from J. Chem. Phys., 137, 084312 (2014), Copyright 2013 AIP Publishing
LLC.

124
Wavenumer (cm-1
)
0 200 400 600 800 1000 1200 1400
(a) Experment
(b) C3v
, 1A
1-2A
1
(c) C2v
, 1A
1-2A
1
(d) D2d
, 1A
1-2A
1
X51010
104
109
103
1011
02
106
Figure 6.3 MATI spectrum of Sc3O4 seeded in argon carrier gas (a) and simulations (50
K) of the 1A1 ← 2A1 transitions of the C3v (b), C2v (c), and D2d isomers. Spectral bands
associated with single vibrational mode are labeled in the figure. Others are either
overtone or combination bands. Reprinted with permission from J. Chem. Phys., 137,
084312 (2014), Copyright 2013 AIP Publishing LLC.

125
Wavenumber (cm-1
)
0 200 400 600 800 1000
(a) Experiment
(b) C3v
, 1A
1-2A
1
X5104
103
1011
02
106
Figure 6.4 MATI spectrum of Y3O4 seeded in argon carrier gas (a) and simulation (50 K)
of the 1A1 ← 2A1 transition of the C3v isomer (b). Spectral bands associated with single
vibrational mode are labeled in the figure. Others are either overtone or combination
bands. Reprinted with permission from J. Chem. Phys., 137, 084312 (2014), Copyright 2013
American Institute of Physics.

126
Wavenumber (cm-1
)
0 200 400 600 800 1000 1200 1400
(a) Experiment
(b) C3v
, 1A
1-2A
1
X5104
103
1011
02
106
Figure 6.5 MATI spectrum of La3O4 seeded in argon carrier gas (a) and simulation (50 K)
of the 1A1 ← 2A1 transition of the C3v isomer (b). Spectral bands associated with single
vibrational mode are labeled in the figure. Others are either overtone or combination
bands. Reprinted with permission from J. Chem. Phys., 137, 084312 (2014), Copyright 2013
American Institute of Physics.

127
(a) LUMO, Sc 4s, e
(b) HOMO, Sc 4s, a1
(c) HOMO-1, O 2p, e
Figure 6.6 LUMO (a), HOMO (b), and HOMO-1 (c) of the 2A1 ground state of the C3v
isomer of Sc3O4. The LUMO and HOMO are mainly Sc 4s character, and HOMO-1 is
largely O 2p. Y3O4 and La3O4 have similar characters in these frontier orbitals.
Reprinted with permission from J. Chem. Phys., 137, 084312 (2014), Copyright 2013
American Institute of Physics.
Copyright © Lu Wu 2014

128
CHAPTER 7 MASS-ANALYZED THRESHOLD IONIZATION OF METAL TRIMER
CARBIDES AND CARBOXIDES
7.1 INTRODUCTION
Probing the structures and electronic states of transition metal cluster carbides are
challenging because of the existence of many possible isomers and the high density of low-
lying electronic states of each isomer. Nevertheless, several experimental techniques have
been used to study these clusters. Mass spectrometry has been used to investigate their
stoichiometry and stability, especially for the ‘met-car’ clusters and nanocrystals.18,19,22,247-
250 Photoionization efficiency (PIE) spectroscopy has been used to estimate the ionization
thresholds of the neutral clusters251-253 and PES to measure the EAs of the anions.
Multiphoton IR ionization spectroscopy has been applied to measure the vibrational
frequencies of the neutral molecules, especially the ‘met-car’ clusters and the nanocrystals.
254-256 Typically, the met-cars and nanocrystals have lower ionization energies than
dissociation energies. Moreover, PFI-ZEKE spectroscopy has been used to measure the
accurate AIEs of the neutral molecules and the vibrational frequencies of the
cations.214,216,257 Closely related to this work was the PFI-ZEKE study of Y3C2 by Yang
and co-workers.214 In that study, they determined a trigonal bipyramidal structure of Y3C2
with the neutral state in C2v point group and ion state in D3h. The precise ionization energy
of Y3C2 was reported to be 34065 (5) cm-1 [4.334(8) eV]. The Y3 ring-breathing frequency
was observed to be 228 cm-1for Y3C2+. The two deformation modes have frequencies of
82 and 24 cm-1 in the neutral state and a degenerate frequency of 86 cm-1 in the ion.
In this work, we extend the previous work by Yang and co-workers to include Sc3C2
and La3C2 using MATI spectroscopy. As discussed in the section of Introduction of this

129
dissertation, the MATI technique provides similar spectroscopic information as ZEKE
does, but has the advantage of easy mass selection. We consider both C2v and D3h trigonal
bipyramid geometries for the neutral clusters (and D3h for the ions) and find the C2v
structure to be more stable and responsible for the observed MATI spectra. In the process
of studying La3C2, I observe unexpectedly a strong mass peak corresponding to La3C2O.
Therefore, MATI measurements are also carried out for this species. In La3C2O, the
oxygen atom is located in the La3 plane and bound to two of the lanthanum atoms of the
trigonal bipyramidal La3C2. La3C2O has a C2v structure in both neutral and ion states.
7.2 EXPERIMENTAL AND COMPUTATIONAL METHODS
7.2.1 Experiment
The cluster beam apparatus has been described in detail in a previous publication.147
The apparatus consists of two vacuums chambers. The first houses a Smalley-type cluster
source and is pumped by a 2200 l s-1 diffusion pump. The second chamber houses the
MATI spectrometer and is pumped by a 400 l s-1 turbo-molecular pump. The MATI
spectrometer is composed of a two stage extraction assembly, a 34 cm long flight tube, and
a dual microchannel plate detector (Galileo). The entire spectrometer is housed in a
cylindrical, double-walled, µ-metal shield. The spectrometer could also be operated as a
two-field, space-focused, Wiley-McLaren time-of-flight mass spectrometer by supplying
the appropriate voltages.
Lanthanum carbides were produced by laser vaporization (Spectra Physics, 355 nm,
12 mJ, focused by a 30 cm focal length lens) of a lanthanum rod (99.9%, Alfa Aesarf) in
the presence of inert carrier gases (He or Ar, UHP, Scott-Gross, 50 psi backing pressure,
130
doped with 2 *10-6 ethylene, Scott-Grass, and traces of O2 gas, Scott-Gross), delivered by
a home-built pulsed valve. The clusters passed down a clustering tube (2 mm inner
diameter, 2 cm length) and were supersonically expanded into the vacuum chamber. The
supersonic jet was skimmed 2.5 cm downstream from the exit end of the clustering tube.
A pair of deflection plates (2 cm spacing, 300 V) located after the skimmer removed
residual charged species from the molecular beam before it entered the second chamber.
Before the MATI experiments, pulse field ionization photoionization efficiency
(PFI-PIE) experiments were performed. PFI- PIE measurements were taken to locate the
approximate ionization potentials. With the ionization energy set to the PIE threshold, the
experiment conditions, such as the firing time and fluence of the vaporization and
ionization laser, the ethylene concentration, and the backing pressure of the carrier gases,
were carefully optimized in order to maximize the intensity of the cluster (i.e., Sc3C2, La3C2,
or La3C2O) of interest in the time-of-flight mass spectrum relative to those of all other mass
peaks.
To perform the MATI experiment, the clusters were exited to high-lying Rydberg
states in a single photon process. The tunable UV beam (1 mJ/pulse) was obtained from a
frequency-doubled dye laser (Lumonics HD-5000) pumped by a Nd:YAG laser (Quanta-
Ray GCR 3) , which was then expanded and collimated by a simple telescope to give a
5mm-diameter circular beam. The excitation laser is counterpropagated on the axis of the
molecular beam. The high-lying Rydberg states were then ionized by a delayed pulsed
field of 320 V/cm applied to the repeller plate. The time delay of the pulsed field from the
laser is controlled by a digital delay generator (Standfor DG 535) and optimized to separate
the prompt ion (generated by direct ionization) from the long-lived Rydberg states. A

131
typical delay time of 20 µs and 50 µs were used for He and Ar carrier gases, respectively.
During the time-delay, the prompt ions generated by UV photon ionization were separated
from the high-Rydberg states by a spoiling dc field (4 to 9V/cm for Ar and He carrier gases,
respectively) before the pulsed field ionization. A small ac field was used to lengthen the
life time of the Rydberg states. The MATI ion signals were capacitively coupled from the
MCP anode and were amplified by a preamplifier (standfor SR 445), averaged by a gated
integrator (standfor SR 250), and collected in a micro-computer. Laser wavelength was
calibrated against appropriate atomic transitions in the wavelength range. The Stark shift
induced by the DC field was calculated using the relation of E = 6.1Ef1/2, where Ef is in
V cm-1 and E in cm-1.151
7.2.2 Computation
Equilibrium geometries, harmonic vibrational frequencies, and normal coordinates
258 of the low-lying electronic states of the clusters were calculated with GAUSSIAN03
program package.259 In these calculations, we used Becke’s three-parameter hybrid
functional with the correlation functional of Lee, Yang, and Parr (B3LYP) and LanL2DZ
basis set for the metal atoms (Sc and La) and aug-cc-pVTZ basis set for the non-metal
atoms (C and O).
Multidimensional Franck–Condon (FC) factors were calculated from the
equilibrium geometries, harmonic vibrational frequencies, and normal coordinates of the
neutral and ionized complexes. The Duschinsky effect142 was considered to account for
normal mode differences between the neutral and ionic complexes in the FC calculations.
More details of the FC calculations were described previously.

132
A Lorentzian line shape with the experimental linewidth was used to simulate
spectral broadening. Transitions from the excited vibrational levels of the neutral clusters
were simulated by assuming thermal excitations at specific temperatures.
7.3 RESULTS AND DISCUSSION
7.3.1 Spectroscopic measurements
Figure 7.1 shows the time-of-flight mass spectra of Sc and La carbide molecular
beams. Both spectra exhibit similar features, with MnC2 (M = Sc and La) as the dominant
peaks. Zooming into the region of the trimetal clusters, the two spectra show the same
mass sequences: M3C2, M3C2H4, M3O2, M3C3, and M3C2O. These similar features indicate
that similar laser vaporization processes and reactions with C2H4 and O2 occurred for Sc
and La. This is understandable both metals are in the same group in the periodic table.
However, the intensity ratios of the M3C2O to M3C2 peaks are different between the two
metal elements, which are 0.28 for Sc and 0.76 for La. The difference may be due to the
different contents of the oxygen impurity in the Sc/La rods or the different reactivity of
Sc/La carbides with O2.
Figures 7.2 and 7.3 present the MATI spectra of Sc3C2 and La3C2 seeded in different carrier
gases. The spectrum of each cluster with He as the carrier gas exhibits similar intensity profiles to
those with Ar or He/Ar mixture as the carrier gases. The MATI spectra of Sc3C2 and La3C2 show
three and four major progressions, respectively. The band positions of the spectra are summarized
in Table 7.1. These progressions have the same energy spacing: 95 cm-1 for Sc3C2 and 66 cm-1 for
La3C2. Comparing the peak intensities of the MATI spectra with different carrier gases (i.e., He,
Ar, or 2:1 He/Ar), the progression with intense peaks are attributed to the cold transitions. The
energy separations in these progressions are the vibrational frequencies of the cations. The

133
observations are consistent with the PFI-ZEKE spectrum of Y3C2, which exhibits four progressions
with the same spacing of 86 cm-1. These observations indicate that all three clusters should have
similar structures and the observed transitions should involve the same M3 deformation mode of
the ionic cluster. The long progression profiles can be explained by significant geometry changes
upon ionization. The significant decreases of the energy spacing from Sc3C2 to La3C2 are due to
the mass effect. The AIEs can be determined by the first peak in the cold transitions, which are
4.512(8) eV for Sc3C2 and 3.742(8) eV for La3C2. Compared to the ionization energies of the free
metal atoms,189 the AIEs of the clusters are red shifted by 2.049 eV for Sc, 1.993 eV for Y, and
1.835 eV for La. Because the AIE shifts are comparable, the metal-carbon bonding is expected to
be similar in these clusters.
Figure 7.4 presents the MATI spectra of La3C2O seeded in He and Ar gases. The
peak positions are summarized in Table 7.2. Unlike the MATI spectra of La3C2, the
La3C2O spectra show the most intense peak at the 0-0 position and have much shorter FC
profiles. These are strong evidences that the neutral molecule and cation have similar
structures. The AIE of La3C2O is measured to be 3.830 eV, and several cold transition
progressions are located at 160, 235, 530, and 665 cm-1 from the 0-0 transition toward the
high energies. These peaks are related to the vibrational modes of the ions. Superimposed
on the high-energy side of each cold transition are satellite peaks separated by about 38
cm-1 from the main peak. In addition, the MATI spectrum with He exhibits a weak
transition of 115 cm-1 at the lower energy side of the 0-0 transition. The intensities of these
peaks decrease significantly from He to Ar carrier (Figure 7.4a), indicating that these weak
transitions originate from the excited vibrational levels of the neutral state.

134
7.3.2 Possible isomers and electronic states
7.3.2.1 M3C2 (M = Sc, La)
Similar spectral profiles indicate that Sc3C2 and La3C2 may have the similar
structures to that of Y3C2 suggested by the previous work.214 Moreover, the geometric
optimizations of Sc3C2 and La3C2 from different starting geometries all converge to the
trigonal bipyramid structures. The molecular symmetries are either C2v or D3h, depending
on the electronic states and are summarized in Table 7.3. In all these structures, three metal
atoms form a triangle and two carbon atoms are on the opposite side of the metal plane. In
the C2v structures, two of the metal atoms are equivalent, labeled as Md, and the third metal
atom is labeled as Ms. In the D3h structures, these Md and Ms atoms are equivalent, but
labeled in the same way for the convenience and consistency.
Two sets of isomers are located for the M3C2 molecules, and their geometries as
listed in Table 7.3. Type I isomers have shorter C-C distances (1.6~1.8 Å) than the type II
isomers (~2.4 Å for Sc3C20/+, and ~2.7 Å for La3C2O
0/+). The transitions between the two
types of structures can be excluded for the following reasons. The geometry from type I
to type II structures is changed by increasing the C-C distances and shrinking the M3 ring
(indicated by the decrease of the M-M distances in Table 7.1). This change is related to a
total-symmetry vibration mode with the frequencies greater than 300 cm-1 for Sc3C2+ and
160 cm-1 for La3C2+. According to Franck-Condon principle, this vibration mode is
expected to be active in the MATI spectrum, and the transitions are expected to form a long
progression. However, there is no long progression observed with frequencies greater than
300 or 160 cm-1.

135
For both isomers, we considered the local minima of the doublet and quartet states
in the neutral molecules and the singlet and triplet states in the cations. Type I isomer is
close to what observed for Y3C2. It is not obvious which isomer is responsible for the
observed spectra by considering the calculated energies only. First, the predicted energies
of the low-lying excited neutral states are not too far from that of the ground state. Second,
six transitions are possible (i.e. those with the multiplicity change by 1). The predicted
energies of these transitions vary from 4.407 to 5.124 eV for Sc3C2 and 3.733 to 4.566 eV
for La3C2, which are not too far from the measured values. Thus, it is necessary to consider
the geometric parameters and spectral profiles to determine which isomer is responsible to
the observed spectra. Because the MATI spectra have long progressions, the predicted
neutral and ionic states should have significant structural changes. The transitions from
the doublet to the singlet and triplet states of isomer II can be excluded because the
simulations show only very short progressions. There are four possible transitions with
significant geometry changes, which are 1A1'←2B2,
3B2←2B2 and 3B2←
4A2 transitions of
isomer I and 3A2''←4A2 transition of isomer II. The simulations of these transitions (with
the 0-0 transition energies being shifted to the experimental values) are shown in Figure
7.5 for Sc3C2 and Figure 7.6 for La3C2 and compared with the experimental spectra. From
the comparison, the 1A1'←2B2 transition of isomer I matches the MATI spectra best. The
3B2←2B2 and 3B2←
4A2 transitions of isomer I show much longer progressions than the
experimental spectra, as shown in Figure 7.5(c,d) for Sc3C2 and Figure 7.6(c,d) for La3C2.
The 3A2''←4A2 transition of isomer II shows similar spectral profile to the measured
spectrum. But the predicted cationic frequencies are much higher than the measured values
(Figures 7.5(g) and 7.6(g) for Sc3C2 and La3C2, respectively)

136
From the comparison of the simulations with the measurements, the 1A1'←2B2
transition of isomer I is assigned to the MATI spectra, which is consistent with the previous
study of Y3C2.214 As summarized in Table 7.1, the four observed progressions are n p p
0 04 9
and its combinations with 1
14 , 0
29 and 1
03 . The spacing of all these progressions are related
to the degenerate mode 4
of the cation, with the measured frequencies of 95 and 66 cm-1
for Sc3C2 and La3C2, respectively. This vibrational mode corresponds to 4 and 9 of the
neutral molecule because the Jahn-Teller distortion lowers the molecular symmetry from
D3h to C2v. Besides, the 1
03 mode is the M3 ring breathing mode, which has the frequencies
of 338 and 154 cm-1 for Sc3C2 and La3C2, respectively. These values differ from the
vibration modes of Y3C2 (1
3 4 4228, 86,and 86cm ) mainly because of the mass
effect.
7.3.2.2 La3C2O
To our knowledge, there is no previous study on this type of the metal clusters. We
started the calculatios by substituting La for Nb and Ta in the previously reported clusters
of M3C3, M4C2 and M5C (M = Nb and Ta).251,253,260,261 Figure 7.7 shows eight optimized
isomers. Isomers (A) and (B) have the same shape and are derived from one of the M4C2
or M5C isomers. They have the carbon and oxygen atoms substituted at different positions.
Similarly, isomers (C), (D), and (E) take the structures of the other isomers of M4C2 or
M5C clusters. Isomer (G) and (H) are based on the M3C3 isomers. Isomer (F) is obtained
by rotating the direction of C-C bond in isomer (C). The relative energies of the low-lying
electronic states of each isomer are summarized in Table 7.4. Because the molecules with

137
high energies will unlikely survive after the supersonic expansion, isomer (B), (D), (E), (G)
and (H) will not be included in the spectral analysis. Five transitions are considered
because their energies (3.895-4.440 eV) are comparable to the measured value. These
transitions include 1A1←2A1 of isomer (A), 1A'←2A', 3A"←2A' and 3A"←4A' of isomer
(C), and 3A'←2A" of isomer (F). The simulations of these transitions are compared with
the MATI spectra in Figure 7.8. The neutral states of isomer (C) have lower energies than
those of the other isomers. However, the 1A'←2A', 3A"←2A' and 3A"←4A' transitions of
this isomer can be excluded because they have much weaker 0-0 transitions and longer
progressions than the MATI spectrum. The other two transitions, 1A1←2A1 of isomer (A)
and 3A'←2A" of isomer (F), have intense 0-0 bands and short progressions. However, the
3A'←2A" transition of isomer (F) is not likely responsible for the observed MATI spectrum.
First, the predicted AIE is 0.61 eV above the measured value, which is 0.5 eV higher than
that of the other transition. Second, it does not reproduce the two peaks at 530 and 665
cm-1.
Thus, the most likely transition for the observed spectrum is 1A1←2A1 of isomer
(A). Isomer (A) has a C2v symmetry, formed by binding an oxygen atom to two metal
atoms of La3C2 (isomer I). It has five total symmetric vibrational modes, and four of them
are observed in the MATI spectrum. They are 1+ (665 cm-1), 3
+ (530 cm-1), 4+ (235 cm-
1) and 5+ (160 cm-1) of La3C2O
+ and 5 (155 cm-1) of La3C2O. These vibrational modes
are associated mainly to the C-Las stretching (𝑣1+ ), O-Lad stretching (𝑣3
+ ), Lad-Lad
stretching (𝑣4+), and LasC2-LadOLad stretching (𝑣5
+). The predicted 𝑣2+is 596 cm-1 and
associate with C-C stretching mode. The predicted Franck-Condon intensity of this mode
is negligible, which is consistent with the observed MATI spectrum. Besides, a sequence
138
band (911) is observed at 38 cm-1 from the 0-0 band. 9 has 𝑏1 symmetry in both neutral
and ion states, but the sequence transition is allowed. This mode is associated to the
deformation of the cluster.
7.3.2.3 Chemical bonding effects
Because they are in the same group in the periodic table, the scandium and lanthanum
clusters are expected to have similar bonding features as the corresponding yttrium clusters. The
M3C2 (M = Sc, La) clusters are identified to be in the doublet ground state of isomers I, which is
the same as Y3C2.214 The AIEs of the M3C2 (M = Sc, Y, La) clusters (4.512/4.291/3.742 eV for
Sc/Y/La) decrease from Sc to Y to La as that of the free metal atoms. The frequencies of the M3
ring-breath mode (338/228/154 cm-1 for Sc/Y/La) and Md-C-Md deformation mode (95/84/67 cm-1
for Sc/Y/La) in the cations also decrease as the increase of the metal atomic masses.
The metal carbides have the ionic bonding character of [M2+]3[C3-]2 (M = Sc, La), and a
total of two more electrons are transferred from the metal atoms to oxygen when forming the
[M8/3+]3[C3-] 2O2- cluster. The unsaturated electron configurations on the carbon atoms are because
of the small C-C distances. The C-C distances in isomers I are predicted to be in the range of 1.6-
1.8 Å, which are slightly longer than the 3 3( ) ( )C sp C sp bonds.262 The σ-type anti-bonding
molecular orbital formed by the carbon p orbitals in this cluster has the high energy and remains
empty upon the electron transfer. Thus, the C-C bond order is 1. In contrast, the C-C distances of
the type II isomer are predicted to be much longer (> 2.4 Å), and the doublet ground state of isomer
II has D3h symmetry and the [M8/3+]3[C4-]2 form. The C-C bond order is 0 in this case.
Because each free M atom has three valence electrons (with the ground electron
configuration of nd1(n+1)s2), the total number of the metal-based valence electrons is 3 in the
ground states of Type I isomers of M3C2 and 1 for Type II isomers of M3C2 and the ground state of

139
M3C2O. The remaining metal-based electrons have (n+1)s characters, similar to the group 3 metal
oxides.263,264 Three molecular orbitals (2𝑎1 + 𝑏2) are generated from the linear combination of the
valence (n+1)s orbitals in C2v point group. Figure 7.9 represents the molecular orbital diagrams of
the trimetal clusters by using the lanthanum clusters as examples. The highest occupied molecular
orbital (HOMO) of La3C2 isomer I is an anti-bonding orbital localizing on the two Lad atoms. The
repulsion force caused by the anti-bonding electron pushes the two atoms apart and causes a C2v
structure with a large Lad-C-C-Lad dihedral angle (134º). After removing the anti-bonding electron,
La3C2+ exhibits a D3h structure and has two electrons evenly distributed among the three La atoms.
The average La-La bond order is 1/3. As a comparison, La3C2 isomer II has a D3h structure with
one electron being shared by the three La atoms, which is similar to the case of La3O4.263 Its cation
has an average La-La bond order of 0.
The observed La3C2O is not the most stable isomer, which indicates that it is likely
generated by a kinetic-driven mechanism. Because it has a similar structure with La3C2, it is
probably formed by the reaction of La3C2 with O atoms or O2. For La3C2O, its HOMO is largely
the 6s orbital of the Las atom. Thus, removing the HOMO electron will increase the bonding of
La3C2 with O because of the increasing static electronic attractions. The AIE of La3C2O is
measured as 3.830 eV from the MATI spectrum, which is 0.088 eV higher than that of La3C2. The
thermodynamic cycle ( 0 3 2 0 3 2 3 2 3 2( ) ( ) ( ) ( )D La C O D La C O AIE La C AIE La C O )
shows that La3C2O+ has a lower dissociation energy than La3C2O. It is noted that the change of the
Lad-C-C-Lad dihedral angle upon oxygen dissociation is much larger in the neutral state (134º - 96º
= 38º) than in the ion (120º - 94º = 26º). The LasC2-LadOLad stretching mode (160 cm-1) of
La3C2O+ is comparable to the M3 ring breathing mode of La3C2
+ (154 cm-1), both are
smaller than the ring-breathing mode of La3O4 (251 cm-1)263. On the other hand, the Lad-
Lad stretching frequency (235 cm-1) of La3C2O+ is much larger than that of La3C2
+ (67 cm-
140
1). This can be explained by the increasing tensions between metal atoms caused by the
lanthanum-oxygen bonds.
7.4 CONCLUSIONS
We have obtained the vibrationally resolved MATI spectra of M3C2 (M = Sc and
La) and La3C2O. Their AIEs have been measured as 36391 (5), 30181 (5) and 30891 (5)
cm-1. The M3C2 clusters exhibit similar spectral features as Y3C2 does. Two sets of the
isomers are explored for M3C2. They are differentiated by the C-C distance, which causes
the different number of electrons being transferred to form the ionic M-C bonds ([M+2]3[C-
3]2 for isomer I and [M+8/3]3[C-4]2 for isomer II) and different C-C bond orders. Isomer I
with shorter C-C distance is responsible for the observed MATI spectrum. The spectrum
of La3C2O shows short progressions of different vibrational modes of the cluster in its
neutral and ionic ground states. They were identified as the C-Las, O-Lad, Lad-Lad, and
LasC2-LadOLad stretching modes. La3C2O is likely formed by the reaction of La3C2 with
an oxygen atom or molecule. The oxygen atom in the cluster is in the La3 plane and binds
to the Lad atoms.

141
Table 7.1 Peak positions (cm-1) and assignments for the MATI spectra of Sc3C2 and La3C2.
The values in parentheses are relative to the positions of the origin bands.
Sc3C2 La3C2
n 0 04 9n p p
1
1 04 9n p p 0 24 9n p p
1
0 0 04 9 3n p p 0 04 9n p p
1 04 9n p p
1
0 0 04 9 3n p p
1
1 04 9n p p
0 36391(0) 30181(0) 30169(-12)
1 36486(95) 36372(-19) 36430(39) 30247(66) 30209(-11)
2 36582(191) 36464(73) 36528(137) 30311(130) 30275(94)
3 36678(287) 36563(172) 36625(234) 36729(338) 30378(197) 30352(171)
4 36772(381) 36657(266) 36723(332) 36822(431) 30444(263) 30417(236)
5 36868(477) 36754(363) 36821(430) 36924(533) 30511(330) 30482(301) 30667(486) 30496(315)
6 36963(572) 36850(459) 36917(526) 37022(621) 30580(399) 30547(366) 30735(554)
7 37061(670) 36947(556) 37015(624) 37119(728) 30647(466) 30614(433) 30803(622) 30633(452)
8 37045(654) 30715(534) 30679(498) 30871(690)
9 30781(600) 30746(565) 30936(755)
10 30847(666) 30814(633) 31001(820)
11 30914(733) 31066(885)
12 30979(798) 31133(952)
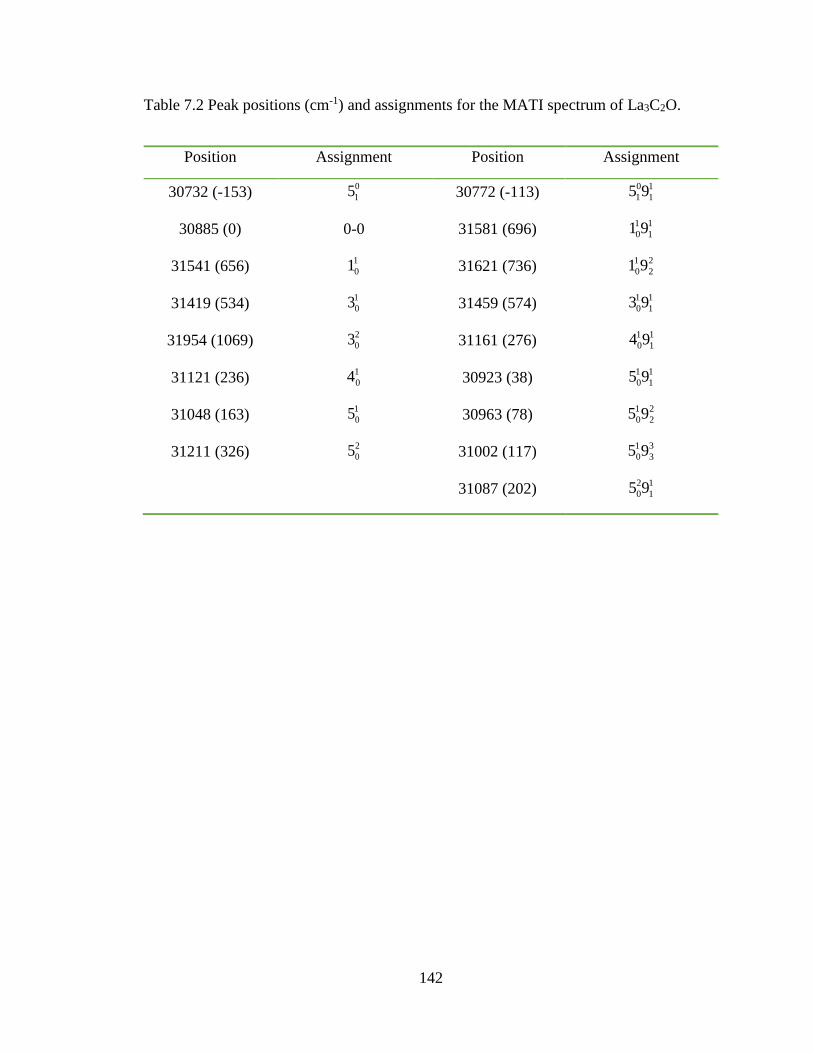
142
Table 7.2 Peak positions (cm-1) and assignments for the MATI spectrum of La3C2O.
Position Assignment Position Assignment
30732 (-153) 0
15 30772 (-113) 0 1
1 15 9
30885 (0) 0-0 31581 (696) 1 1
0 11 9
31541 (656) 1
01 31621 (736) 1 2
0 21 9
31419 (534) 1
03 31459 (574) 1 1
0 13 9
31954 (1069) 2
03 31161 (276) 1 1
0 14 9
31121 (236) 1
04 30923 (38) 1 1
0 15 9
31048 (163) 1
05 30963 (78) 1 2
0 25 9
31211 (326) 2
05 31002 (117) 1 3
0 35 9
31087 (202) 2 1
0 15 9
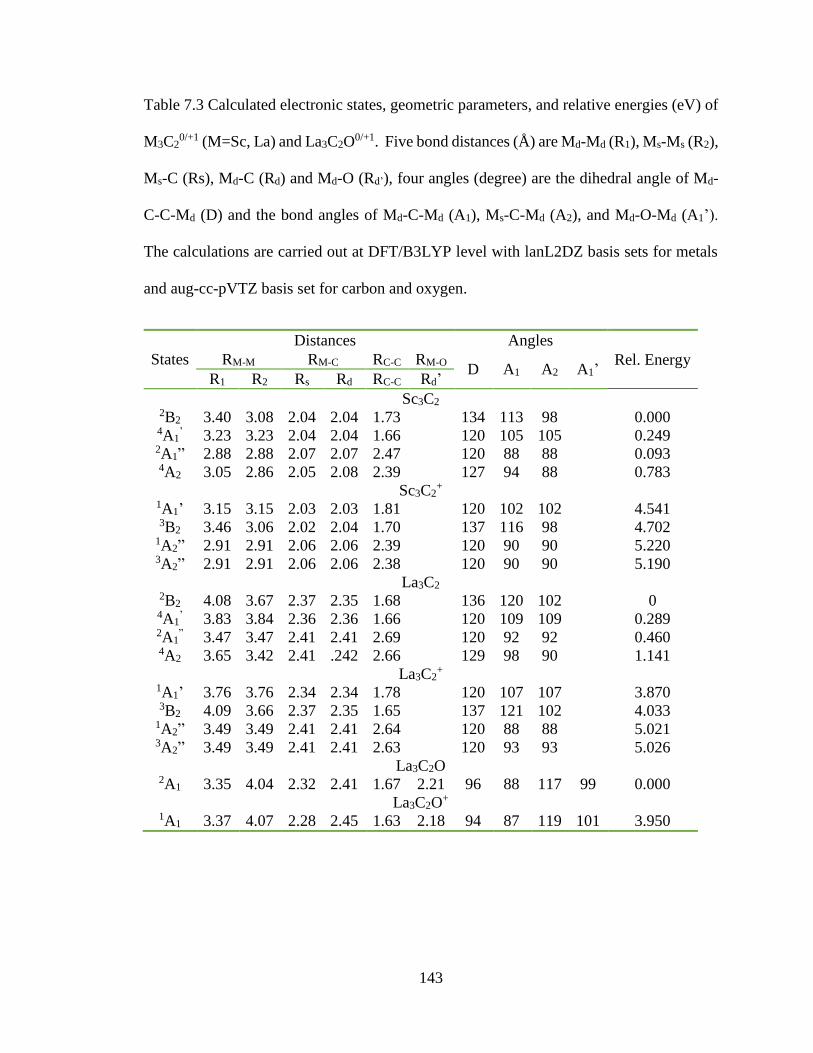
143
Table 7.3 Calculated electronic states, geometric parameters, and relative energies (eV) of
M3C20/+1 (M=Sc, La) and La3C2O
0/+1. Five bond distances (Å) are Md-Md (R1), Ms-Ms (R2),
Ms-C (Rs), Md-C (Rd) and Md-O (Rd’), four angles (degree) are the dihedral angle of Md-
C-C-Md (D) and the bond angles of Md-C-Md (A1), Ms-C-Md (A2), and Md-O-Md (A1’).
The calculations are carried out at DFT/B3LYP level with lanL2DZ basis sets for metals
and aug-cc-pVTZ basis set for carbon and oxygen.
Distances Angles
Rel. Energy States RM-M RM-C RC-C RM-O D A1 A2 A1’
R1 R2 Rs Rd RC-C Rd’
Sc3C2 2B2 3.40 3.08 2.04 2.04 1.73 134 113 98 0.000 4A1
’ 3.23 3.23 2.04 2.04 1.66 120 105 105 0.249 2A1” 2.88 2.88 2.07 2.07 2.47 120 88 88 0.093 4A2
3.05 2.86 2.05 2.08 2.39 127 94 88 0.783
Sc3C2+
1A1’ 3.15 3.15 2.03 2.03 1.81 120 102 102 4.541 3B2
3.46 3.06 2.02 2.04 1.70 137 116 98 4.702 1A2” 2.91 2.91 2.06 2.06 2.39 120 90 90 5.220 3A2” 2.91 2.91 2.06 2.06 2.38 120 90 90 5.190
La3C2 2B2 4.08 3.67 2.37 2.35 1.68 136 120 102 0 4A1
’ 3.83 3.84 2.36 2.36 1.66 120 109 109 0.289 2A1
” 3.47 3.47 2.41 2.41 2.69 120 92 92 0.460 4A2
3.65 3.42 2.41 .242 2.66 129 98 90 1.141
La3C2+
1A1’ 3.76 3.76 2.34 2.34 1.78 120 107 107 3.870 3B2
4.09 3.66 2.37 2.35 1.65 137 121 102 4.033 1A2” 3.49 3.49 2.41 2.41 2.64 120 88 88 5.021 3A2” 3.49 3.49 2.41 2.41 2.63 120 93 93 5.026
La3C2O 2A1 3.35 4.04 2.32 2.41 1.67 2.21 96 88 117 99 0.000
La3C2O+
1A1 3.37 4.07 2.28 2.45 1.63 2.18 94 87 119 101 3.950

144
Table 7.4 Point groups, electronic states and relative energies (Erel), and transition energies
(E) of the La3C2O isomers from DFT/B3LYP calculations.a
Point Group b Neutral Ion ∆E (eV)
State Erel (eV) State Erel (eV)
(A) C2v
2A1 0.592 1A1 4.534 3.942 (1A1←2A1)
4B2 1.128 3A2 4.643
(B) Cs
2A' 3.376 1A' 7.950
3A" 7.935
(C) Cs
2A' 0.000 1A' 4.189 4.189 (1A'←2A')
4A' 0.313 3A" 4.208 4.208 (3A"←2A')
3.895 (3A"←4A')
(D) Cs
2A' 2.069 1A' 6.290
4A" 2.594 3A' 6.398
(E) Cs
2A' 2.904 1A' 7.351
4A" 3.413 3A' 7.372
(F) Cs
2A" 0.066 1A' 4.272
4A' 0.641 3A' 4.506 4.440 (3A'←2A")
(G) Cs
2A" 3.419
4A" 3.434 3A" 7.814
(H) C1
2A 2.445
4A 2.444 3A 6.727 a LanL2DZ basis set is used for La atom, aug-cc-pVTZ basis sets are used for C and O
atoms.
b The triplet state of structure (A), singlet and triplet states of structure (B), and singlet and
quartet states of structure (F) are transition states.

145
Table 7.5 Calculated vibrational frequencies (cm-1) and their symmetries in comparison
with the experimental measurements for M3C2 (M=Sc and La) and their cations.
Mode Symmetry Frequencies a Vibrational Modes
M=Sc M=La
3
1a 338(314) 154(178) M3 ring breathing
4
1a 95(96) 67(58) Md-C-Md bending
9
1a 95(96) 67(58) Ms deformation
4 1a 116(109) 77(66) Md-C-Md bending
9 1b 28(33) (21) Ms deformation
a the calculated values are in the brackets.

146
Table 7.6 Calculated vibrational frequencies (cm-1) and their symmetries in comparison
with the experimental measurements for La3C2O in its neutral and ion states at C2v
symmetry.
Mode Symmetry Frequencies a Vibrational Modes
1
1a 665 (669) C-Las stretch
2
1a (596) C-C stretch
3
1a 530 (519) O-Lad stretch
4
1a 235 (212) Lad-Lad stretch
5
1a 160 (143) LasC2-LadOLad stretch
5 1a 155 (157) LasC2-LadOLad stretch
9 9
1b 38 (29) Las deformation
a the calculated values are in the brackets.

147
Sc2C2
m/z
Sc3C2
Sc5C2
Sc6C2
Sc7C2
Sc8C2
Sc4C2
(a)
La2C2
m/z
La3C2
La4C2
La5C2
La8C2
(b)
Figure 7.1 MS-TOF spectra of Sc +C2H4 (a) and La + C2H4 (b) recorded with 240 nm UV
laser, the five peaks shown in the zoomed region from left to right are: M3C2, M3C2H4,
M3O2, M3C3,and M3C2O ( M = Sc and La).

148
(b) He/Ar=2/1
Wavenumber (cm-1
)
36200 36400 36600 36800 37000 37200 37400 37600
(a) He
0 04 9n p p
1
1 04 9n p p
0 24 9n p p
1
0 0 03 4 9n p p
Figure 7.2 MATI spectra of Sc3C2 with He (a) and He/Ar (2:1) mixture (b) carrier gas.
.

149
(b) Ar
Wavenumber (cm-1
)
30000 30200 30400 30600 30800 31000 31200 31400
(a) He
p n p
0 04 9
p n p
0 24 9
p n p m
0 0 04 9 3
1
n4 4
146
14
Figure 7.3 MATI spectra of La3C2 with He (a) and Ar (b) carrier gas.

150
Wavenumber (cm-1
)
30500 31000 31500 32000
(a) He
(b) Ar
1
01 9n
n
03 9m n
n1
04 9n
n
05 9m n
n
0
15 9n
n
Figure 7.4 MATI spectra of La3C2O with He (a) and Ar (b) carrier gas.

151
Wavenumber (cm-1
)
0 500 1000 1500 2000
(a) MATI of Sc3C
2
(b) 1 2
1 2'A B
(c) 3 2
2 2B B
(d) 3 4
2 2B A
(e)1 2
2 2'' ''A A
(f)3 2
2 2'' ''A A
(g) 3 4
2 2''A A
Figure 7.5 MATI spectra of Sc3C2 in He/Ar (2:1) mixture as carrier gas (a) and simulations
(30 K) of isomer I (b-d) and isomer II (e-g) from B3LYP calculations with the lanL2DZ
basis for Sc and the aug-cc-pVTZ basis for O .

152
Wavenumber (cm-1
)
0 200 400 600 800 1000 1200 1400
(a) MATI of La3C
2
(b) 1 2
1 2'A B
(c) 3 2
2 2B B
(d) 3 4
2 2B A
(e)1 2
2 2'' ''A A
(f)3 2
2 2'' ''A A
(g) 3 4
2 2''A A
Figure 7.6 MATI spectra of La3C2 in Ar as carrier gas (a) and simulations (10K) of isomer
I (b-d) and isomer II (e-g) from B3LYP calculations with the lanL2DZ basis for La and the
aug-cc-pVTZ basis for O.

153
Figure 7.7 Possible isomers of La3C2O.
(A) C2v (C) Cs
(G) Cs
(D) Cs
(H) C1 (F) Cs
(B) Cs
(E) Cs

154
Wavenumber (cm-1
)
-500 0 500 1000 1500
(a) MATI of La3C
2O
(b) 1 2
1 1A A
(c) 1 2' 'A A
(d)
(e) 3 4" 'A A
3 2" 'A A
(f) 3 2' "A A
Figure 7.8 MATI spectra of La3C2O in He (a) and simulations (100 K) of possible
transitions (b-f) from B3LYP calculations with the lanL2DZ basis for La and the aug-cc-
pVTZ basis for O.

155
Figure 7.9 Molecular orbital diagrams for the ground states of isomer I (a) and II (b) of
La3C2, and the ground state of La3C2O (c).
(a) La3C2 (I) (b) La3C2 (II) (c) La3C2O
𝑎1
𝑎1
𝑏2
𝑎1
𝑎1
𝑏2
𝑎1′
𝑒
Copyright © Lu Wu 2014
156
CHAPTER 8 SUMMARY OF DISSERTATION
In this dissertation, the MATI spectra have been reported for eleven group 3 small
metal clusters, including six lanthanum, two yttrium and three scandium clusters. These
spectra are summarized in Figure 8.1 with the measured AIEs. The AIEs, bonding,
structures, electronic states, and some of the vibrational frequencies of the metal clusters
are determined by combining the spectroscopic analysis with the quantum mechanical
calculations. These spectroscopic properties are compared by different cluster sizes with
the same metal element and also same size clusters with different metal substitutes.
The AIEs of the metal clusters exhibit a red shift comparing to that of the free atoms,
as summarized in Table 8.1. For the same metal, the AIEs show decrease trend when the
size of cluster increases. Lanthanum clusters, for example, show an increase trend in AIEs
following the sequence of La2, La2O2, and La3O4. One the other hand, La3O4, La3C2 and
La3C2O clusters with the similar sizes have comparable AIEs. For different metal clusters
with the same size, the AIEs have comparable red shifts from the free atoms. The AIEs
are about 1 eV lower than the respective free atoms for the M2O2 clusters and about 2 eV
for the M3O4 and M3C2 clusters.
Strong ionic characters exist between the metal and oxygen or carbon atoms and
can be described for different metal clusters as [O-][La2+][O-], [M2+]2[O2-]2, [M
8/3+]3[O2-]4,
[M2+]3[C3-]2, and [La8/3+]3[C
3-]2[O2-]. The interactions between the metal atoms form
covalent bonds, which can be described by a triple bond in La2, a two-center two electron
bond in M2O2, a three-center one electron bond in M3O4, and a three-center three electron

157
bond in M3C2. Besides, the electrons in the non-bonding HOMO is localized in La 6s
orbital in LaO2 and La3C2O.
The ground states of these molecules are all in low electron-spin states, and are
generally responsible for the MATI spectra. M2O2 and M3O4 have planar rhombic and
cage-like three dimensional structures, respectively; whereas M3C2 has a trigonal
bipyramid structure. Low-lying electronic states are observed instead for LaO2 and La3C2O.
Although the ground electronic state of LaO2 is in a linear structure, the excited state of the
molecule is determined to be in a bent structure. La3C2O is formed by oxygen binding with
two La atoms of La3C2, but its ground state is the trigonal bipyramide structure with C2 and
O on each side of the La3 plane. Ionization removes a metal-based (n+1)s electron in all
neutral molecules, and the resultant ions have similar geometries to those of the
corresponding neutral states. In the case of La2, additional ionization of a La 5d electron
is also observed.
The vibrational motions are complicated in the polyatomic clusters. However,
some of the modes are distinguishable in different clusters. The metal-metal stretch mode,
La-La for example, are observed as 236/242, 245, and 235 cm-1 in La2+, La2O2
+ and
La3C2O+, respectively. These frequencies varies within a small range and are also close to
the M3 breath mode of La3O4. However, the M3-breathing frequency is much smaller in
La3C2, probably because of its more deformative structure compared to the fused four-
member ring structures in La3O4. The metal-ligand stretch frequencies have larger
derivatives, but they are overall larger than the metal-metal stretch frequencies. All these
metal-metal, metal-ligand (oxygen or carbon) stretch and bending frequencies are
summarized in Table 8.2.

158
Table 8.1 Summary of ionization energies (eV) for M2O2, M3O4 and M3C2 (M = Sc, Y, and
La). The relative ionization energies (eV), comparing to the free atoms, are included in the
brackets.
Sc Y La
Ma 6.561 (0) 6.217 (0) 5.577 (0)
MO2 4.976 (-0.601)
M2 4.841 b (-0.736)
M2O2 5.575 (-0.986) 5.264 (-0.953) 4.580 (-0.997)
M3O4 4.456 (-2.105) 4.059 (-2.158) 3.475 (-2.102)
M3C2 4.512 (-2.049) 4.224c (-1.993) 3.742 (-1.835)
M3C2O 3.829 (-1.748)
a From ref. 194
b The ionization energy when removing a metal based 6s electrons.
c From ref. 214

159
Table 8.2 Summary of the observed metal-metal (M-M) stretch, and metal-ligand (M-L)
stretch or bending frequencies (in cm-1). The stretch and bending modes are noted as v and
; superscript ‘+’ indicates the frequencies of the ions; asymmetric modes are noted in
the superscript ‘as’.
M-Ma M-L
LaOb / 808 / 878v v
La2 2 2/ 207 / 236( ),242( )g uv v
LaO2 656v , / 92 /122
La2O2 / 254 / 245v v / 569 / 591v v
Y2O2 / 279 / 285v v 655v
Sc2O2 / 395 / 415v v 713v
La3O4 251v 531,421v
, 627asv , 204
Y3O4 314v 591,475v
, 678asv , 238
Sc3O4 437v ,, 300asv 667,545v
, 751asv , 273 ,, 204as
La3C2 154v / 77 / 67
Y3C2c 228v / 82 / 86
,/ 24 / 86as as
Sc3C2 338v / 116 / 95 ,/ 28 /116as as
La3C2O 235 ( )v La La stretch 665( )v C La stretch
530( )v O La stretch
a Frequencies in this column means M-M stretch for the La2, M2O2 and La3C2O, and M3
ring breath for M3O4 and M3C2
b Unpublished results
c From Ref. 214

160
Wavenumber (cm-1
)
30000 35000 40000 45000 50000
LaO (5.245)
La2O
2
(4.580)
Y2O
2
(5.264)
Sc2O
2
(5.575)
La2
(4.841)
LaO2
(4.976)
La3O
4
(3.475)
Y3O
4
(4.059)
Sc3O
4
(4.456)
La3C
2
(3.742)
Sc3C
2
(4.512)
La3C
2O
(3.829)
La (5.577)
Y (6.217)
Sc (6.561)
Figure 8.1 Summary of the MATI spectra of metal clusters and their AIEs (eV).
Copyright © Lu Wu 2014
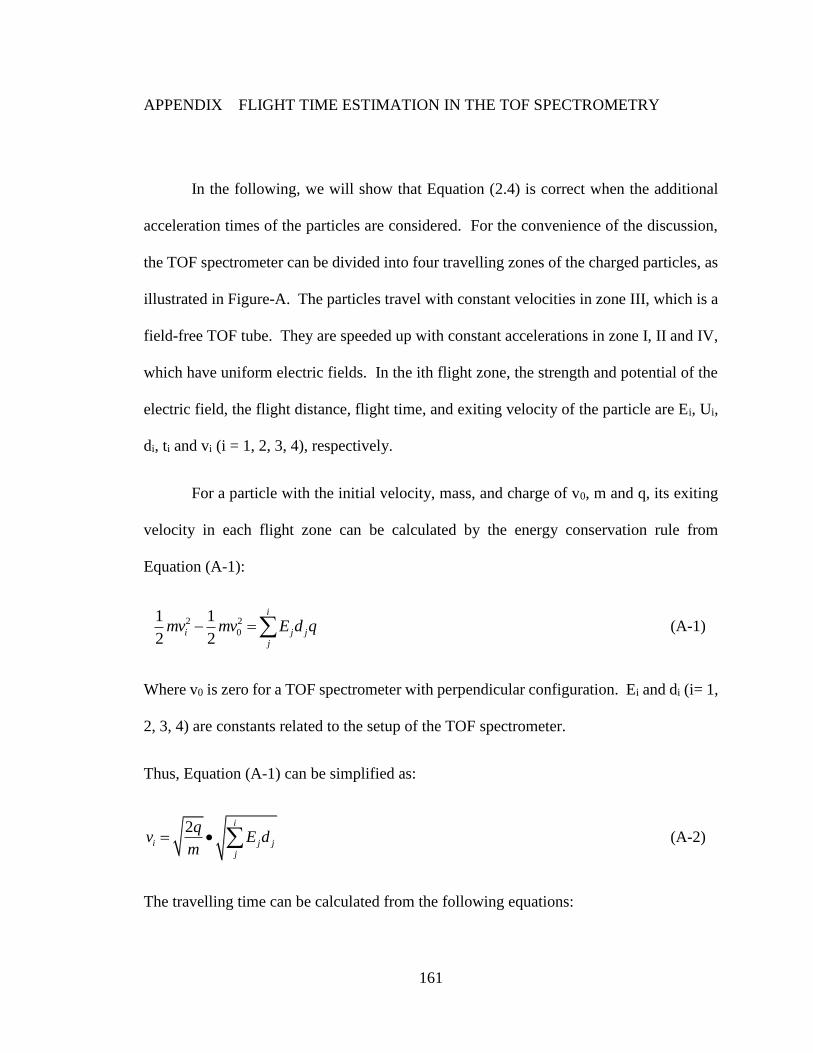
161
APPENDIX FLIGHT TIME ESTIMATION IN THE TOF SPECTROMETRY
In the following, we will show that Equation (2.4) is correct when the additional
acceleration times of the particles are considered. For the convenience of the discussion,
the TOF spectrometer can be divided into four travelling zones of the charged particles, as
illustrated in Figure-A. The particles travel with constant velocities in zone III, which is a
field-free TOF tube. They are speeded up with constant accelerations in zone I, II and IV,
which have uniform electric fields. In the ith flight zone, the strength and potential of the
electric field, the flight distance, flight time, and exiting velocity of the particle are Ei, Ui,
di, ti and vi (i = 1, 2, 3, 4), respectively.
For a particle with the initial velocity, mass, and charge of v0, m and q, its exiting
velocity in each flight zone can be calculated by the energy conservation rule from
Equation (A-1):
2 2
0
1 1
2 2
i
i j j
j
mv mv E d q (A-1)
Where v0 is zero for a TOF spectrometer with perpendicular configuration. Ei and di (i= 1,
2, 3, 4) are constants related to the setup of the TOF spectrometer.
Thus, Equation (A-1) can be simplified as:
2 i
i j j
j
qv E d
m (A-2)
The travelling time can be calculated from the following equations:

162
1 11 1
1 1 1
2 22 2
1 2 1 1 1 1 2 2
3 33 3
2 1 1 2 2
4 44 4
2 4 1 1 2 2 1 1 2 2 4 4
2 2
2 2
2
2 2
d dmt A m
v q E d
d dmt A m
v v q E d E d E d
d dmt A m
v q E d E d
d dmt A m
v v q E d E d E d E d E d
(A-3)
Where Ai (i = 1, 2, 3, 4) are constants related to the parameters of the TOF spectrometer.
The total travelling time can be calculated with Equation (2.4), and the coefficient A is the
summation of the Ais (i = 1, 2, 3, 4). By considering aluminum (m = 27 amu, t = 3.66 µs)
atom as the reference, the constant A in Equation (2.3) is calculated to be
1/20.7044 ( . )s amu .
Besides the travelling time, the total flight time of the charged particles also
includes the response time of the MCP detector (< 1 ns), the travelling time of the electrons
emitted from the MCP detector to the anode, and the travelling time of the signal from
anode to the computer. The time consumed in these processes is small and constants and
thus generally ignored in the measurements. If we include all these factors, the total flight
time can be calculated more precisely by adding a small constant B:
t A m B (A-4)
For the current experimental setup, by considering helium (m = 4 amu, t = 1.44 µs) and
aluminum (m = 27 amu, t = 3.66 µs) atoms as references, A and B are calculated to be:
1/2A= 0.6946 ( . ), 0.0508 ( )s amu B s . Thus, the bias of the total flight time from
Equation (2.3) is expressed as:

163
/ ( ) 0.0098 / ( .) 0.0508t s m amu (A-5)
Δt is small at a lower mass range and will increase with the masses of the particles,
as shown in Equation (A-5). In Chapter 2, two methods are mentioned to predict the flight
time and help assign the mass spectra. In the mass spectra of the metal oxides, the adjacent
peaks generally have a mass difference of 16 (amu.) or larger. The first method is
sufficiently accurate to distinguigh different mass peaks when the masses of the metal
oxides are small. For example, the travelling time of ScO (m = 71 amu.) is calculated to
be 5.9354 µs from Equation (2.3). In the mass spectrum of scandium oxides, three adjacent
peaks appear at 5.20, 5.90 and 6.53 µs. Thus, the middle peak can be assigned to ScO
straightforwardly. However, this method fails when the masses of the particles are very
different from that of the reference element (aluminum). For example, the flight time of
La3O4 (m = 481 amu.) is calculated to be 15.45 µs by Equation (2.4), but the mass spectrum
of lanthanum oxides exhibits two peaks with the flight times of 15.29 and 15.54 µs, both
are close to the calculated value of 15.45 s . Therefore, the second method must be used
to assign this mass spectrum. To do so, we use La2O2 (t = 12.28 µs, m = 310 amu.) or
La3O3 (t = 15.18 µs, m = 465 amu.) as a reference and calculate the flight time of La3O4
using Equation (2.4). The flight times of La3O4 are predicted to be 15.29 and 15.30 s
with La2O2 and La3O3 as the references, respectively. Both values match nicely with the
measured flight time of 15.29 s, but are quite different from 15.54 s. Thus, the peak at
15.29 s can easily be assigned to La3O4.

164
Figure Appendix Illustration of the acceleration zones in the time-of-flight spectrometer, d
is the distance between the two metal cans; d1 is the distance between the molecular beam
and the upper can; d2 is the distance from the upper can to the bottom of the TOF tube; d3
is the length of the TOF tube; d4 is the distance from the top of TOF tube to the MCP
detector.
+2500 V
+1700V
Ground
Ground
-162 V
-1950 V
Anode
MCP
I
II
III
d1
d
d2
d3=L
IV d4
Copyright © Lu Wu 2014

165
REFERENCES:
1 F. A. Cotton, Inorg. Chem., 3, 1217 (1964) 2 F. A. Cotton and T. E. Haas, Inorg. Chem., 3, 10 (1964) 3 F. A. Cotton, C. A. Murillo and R. A. Walton, Multiple Bonds Between Metal Atoms,
(Weily, New York, 1982). 4 D. M. P. Mingos and D. J. Wales, Introduction to Cluster Chemistry, (Prentice Hall,
New Jerssey, 1990), Prentic Hall Inorganic and Organometallic Chemistry. 5 R. L. Johnston, Atomic and Molecular Clusters, (Taylor & Francies, London, 2002),
Master Series in Physics and Astronomy. 6 P. Joyes, J. Phys. Chem. Solids, 32, 1269 (1971) 7 P. Joyes, J. Phys. B, 4, L15 (1971) 8 M. Leleyter and P. Joyes, J. Phys. B, 7, 516 (1974) 9 P. W. Stephens and J. G. King, Phys. Rev. Lett., 51, 1538 (1983) 10 T. D. Märk and P. Scheier, Chem. Phys. Lett., 137, 245 (1987) 11 A. Ding and J. Hesslich, Chem. Phys. Lett., 94, 54 (1983) 12 O. Echt, K. Sattler and E. Recknagel, Phys. Rev. Lett., 47, 1121 (1981) 13 W. D. Knight, K. Clemenger, W. A. de Heer, W. A. Saunders, M. Y. Chou and M.
L. Cohen, Phys. Rev. Lett., 52, 2141 (1984) 14 A. W. Castleman, Jr.,Magic Numbers in Atomic Clusters: Energetic, Electronic and
Structural Effects in Clustering Phenomena in Atoms and Nuclei, edited by M. Brenner, T.
Lönnroth and F. B. Malik (Springer Berlin Heidelberg, 1992), pp. 99-109. 15 E. A. Rohlfing, D. M. Cox and A. Kaldor, J. Chem. Phys., 81, 3322 (1984) 16 H. W. Kroto, J. R. Heath, S. C. O'Brien, R. F. Curl and R. E. Smalley, Nature, 318,
162 (1985) 17 L. Becker, R. Poreda, J. Nuth, F. Ferguson, F. Liang and W. Edward Billups,Future
Procedures for Isolation of Higher Fullerenes in Natural and Synthetic Soot in Natural
Fullerenes and Related Structures of Elemental Carbon, edited (Springer Netherlands,
2006), pp. 279-295. 18 B. C. Guo, K. P. Kerns and A. W. Castleman, Science, 255, 1411 (1992) 19 B. C. Guo, S. Wei, J. Purnell, S. Buzza and A. W. Castleman, Science, 256, 515
(1992) 20 S. Wei, B. C. Guo, J. Purnell, S. Buzza and A. W. Castleman, Science, 256, 818
(1992) 21 S. Wei, B. C. Guo, J. Purnell, S. Buzza and A. W. Castleman, J. Phys. Chem., 96,
4166 (1992) 22 J. S. Pilgrim and M. A. Duncan, J. Am. Chem. Soc., 115, 9724 (1993) 23 G. Benedek, T. P. Martin and G. Pacchioni, Elemental and molecular clusters,
(Springer, Verlag, 1988), Vol. 6, Springer Series in Materials Science. 24 J. Jortner, Zeitschrift für Physik D Atoms, Molecules and Clusters, 24, 247 (1992) 25 M. Knudsen, Ann. Phys., 333, 75 (1909) 26 M. Knudsen, Ann. Phys., 333, 999 (1909) 27 M. Miller and K. Armatys, Open Thermodyn. J., 7, 2 (2013) 28 R. Yamdagni and R. F. Porter, J. Electrochem. Soc., 115, 601 (1968) 29 L. Yang, M. P. Seah and I. S. Gilmore, J. Phys. Chem. C, 116, 23735 (2012) 30 M. P. Seah, J. Phys. Chem. C, 117, 12622 (2013)
166
31 C. M. Mahoney, Mass Spectrom. Rev., 29, 247 (2010) 32 M. Okamura and S. Kondrashev, in Particle Accelerator Conference, PAC, IEEE,
2007, pp. 3761-3765 33 H. Daido, M. Nishiuchi and A. S. Pirozhkov, Rep. Prog. Phys., 75, 056401 (2012) 34 P. Gasior and M. Rosinski, in Proc. SPIE 8903, Photonics Applications in
Astronomy, Communications, Industry, and High-Energy Physics Experiments 2013, pp.
89030L-89030L-9 35 T. G. Dietz, M. A. Duncan, D. E. Powers and R. E. Smalley, J. Chem. Phys., 74,
6511 (1981) 36 M. A. Duncan, T. G. Dietz and R. E. Smalley, J. Am. Chem. Soc., 103, 5245 (1981) 37 D. E. Powers, J. B. Hopkins and R. E. Smalley, J. Phys. Chem., 85, 2711 (1981) 38 D. E. Powers, S. G. Hansen, M. E. Geusic, A. C. Puiu, J. B. Hopkins, T. G. Dietz,
M. A. Duncan, P. R. R. Langridge-Smith and R. E. Smalley, J. Phys. Chem., 86, 2556
(1982) 39 M. D. Morse, J. B. Hopkins, P. R. R. Langridge-Smith and R. E. Smalley, J. Chem.
Phys., 79, 5316 (1983) 40 D. K. Bohme and H. Schwarz, Angew. Chem., Int. Ed., 44, 2336 (2005) 41 D. R. Justes, N. A. Moore and A. W. Castleman, Jr., J. Phys. Chem. B, 108, 3855
(2004) 42 K. A. Zemski, D. R. Justes and A. W. Castleman, Jr., J. Phys. Chem. B, 106, 6136
(2002) 43 K. A. Zemski, R. C. Bell and A. W. Castleman, Jr., J. Phys. Chem. A, 104, 5732
(2000) 44 K. S. Molek, C. Anfuso-Cleary and M. A. Duncan, J. Phys. Chem. A, 112, 9238
(2008) 45 K. S. Molek, T. D. Jaeger and M. A. Duncan, J. Chem. Phys., 123, 144313 (2005) 46 Z. D. Reed and M. A. Duncan, J. Phys. Chem. A, 112, 5354 (2008) 47 A. Fielicke, C. Ratsch, G. von Helden and G. Meijer, J. Chem. Phys., 127, 234306
(2008) 48 K. R. Asmis, M. Bruemmer, C. Kaposta, G. Santambrogio, G. von Helden, G.
Meijer, K. Rademann and L. Woeste, Phys. Chem. Chem. Phys., 4, 1101 (2002) 49 K. R. Asmis, A. Fielicke, G. von Helden and G. Meijer, Chem. Phys. Solid Surf.,
12, 327 (2007) 50 K. R. Asmis, G. Meijer, M. Bruemmer, C. Kaposta, G. Santambrogio, L. Woeste
and J. Sauer, Journal of Chemical Physics, 120, 6461 (2004) 51 K. R. Asmis and J. Sauer, Mass Spectrom. Rev., 26, 542 (2007) 52 K. Demyk, D. van Heijnsbergen, G. von Helden and G. Meijer, Astron. Astrophys.,
420, 547 (2004) 53 A. Fielicke, G. Meijer and G. von Helden, Eur. Phys. J. D, 24, 69 (2003) 54 A. Fielicke, G. Meijer and G. von Helden, J. Am. Chem. Soc., 125, 3659 (2003) 55 G. von Helden, A. Kirilyuk, D. van Heijnsbergen, B. Sartakov, M. A. Duncan and
G. Meijer, Chem. Phys., 262, 31 (2000) 56 S. M. E. Green, S. Alex, N. L. Fleischer, E. L. Millam, T. P. Marcy and D. G.
Leopold, J. Chem. Phys., 114, 2653 (2001) 57 L.-S. Wang, in Photodetachment photoelectron spectroscopy of transition metal
oxide species, 'edited by' C.-Y. Ng (WORLD SCIENTIFIC, 2000), pp. 854-957.

167
58 X. Yang, T. Waters, X.-B. Wang, R. A. J. O'Hair, A. G. Wedd, J. Li, D. A. Dixon
and L.-S. Wang, J. Phys. Chem. A, 108, 10089 (2004) 59 H.-J. Zhai, J. Doebler, J. Sauer and L.-S. Wang, J. Am. Chem. Soc., 129, 13270
(2007) 60 H.-J. Zhai, X. Huang, T. Waters, X.-B. Wang, R. A. J. O'Hair, A. G. Wedd and L.-
S. Wang, J. Phys. Chem. A, 109, 10512 (2005) 61 N. O. Jones, S. N. Khanna, T. Baruah, M. R. Pederson, W. J. Zheng, J. M. Nilles
and K. H. Bowen, Phys. Rev. B, 70, 134422 (2004) 62 S. N. Khanna, P. Jena, W. J. Zheng, J. M. Nilles and K. H. Bowen, Phys. Rev. B,
69, 144418 (2004) 63 R. B. Wyrwas, B. L. Yoder, J. T. Maze and C. C. Jarrold, J. Phys. Chem. A, 110,
2157 (2006) 64 B. L. Yoder, J. T. Maze, K. Raghavachari and C. C. Jarrold, J. Chem. Phys., 122,
094313 (2005) 65 A. Pramann, K. Koyasu, A. Nakajima and K. Kaya, J. Phys. Chem. A, 106, 4891
(2002) 66 A. Pramann, K. Koyasu, A. Nakajima and K. Kaya, J. Chem. Phys., 116, 6521
(2002) 67 A. Pramann, Y. Nakamura, A. Nakajima and K. Kaya, J. Phys. Chem. A, 105, 7534
(2001) 68 Y. D. Kim and G. Gantefor, Chem. Phys. Lett., 383, 80 (2004) 69 Q. Sun, P. Jena, Y. D. Kim, M. Fischer and G. Gantefor, J. Chem. Phys., 120, 6510
(2004) 70 Q. Sun, B. K. Rao, P. Jena, D. Stolcic, G. Gantefor and Y. Kawazoe, Chem. Phys.
Lett., 387, 29 (2004) 71 Q. Sun, B. K. Rao, P. Jena, D. Stolcic, Y. D. Kim, G. Gantefor and A. W. Castleman,
Jr., J. Chem. Phys., 121, 9417 (2004) 72 R. G. Keesee, B. Chen, A. C. Harms and A. W. Castleman, Jr., Int. J. Mass
Spectrom. Ion Phys., 123, 225 (1993) 73 W. D. Vann, R. L. Wagner and A. W. Castleman, Jr., Proc. Electrochem. Soc., 97-
39, 731 (1997) 74 W. D. Vann and A. W. Castleman, Jr., J. Phys. Chem. A, 103, 847 (1999) 75 S. W. Sigsworth and A. W. Castleman, Jr., J. Am. Chem. Soc., 114, 10471 (1992) 76 K. R. Asmis, G. Santambrogio, M. Bruemmer and J. Sauer, Angew. Chem., Int.
Ed., 44, 3122 (2005) 77 S. Feyel, H. Schwarz, D. Schroder, C. Daniel, H. Hartl, J. Dobler, J. Sauer, G.
Santambrogio, L. Woste and K. R. Asmis, ChemPhysChem, 8, 1640 (2007) 78 G. Santambrogio, M. Bruemmer, L. Woeste, J. Doebler, M. Sierka, J. Sauer, G.
Meijer and K. R. Asmis, Phys. Chem. Chem. Phys., 10, 3992 (2008) 79 G. von Helden, D. van Heijnsbergen and G. Meijer, J. Phys. Chem. A, 107, 1671
(2003) 80 M. B. Knickelbein, Phys. Rev. A, 67, 013202 (2003) 81 M. Knickelbein, J. Chem. Phys., 102, 1 (1995) 82 S. H. Yang and M. B. Knickelbein, Zeitschrift für Physik D Atoms, Molecules and
Clusters, 31, 199 (1994)

168
83 F. Dong, S. Heinbuch, S. G. He, Y. Xie, J. J. Rocca and E. R. Bernstein, J. Chem.
Phys., 125, 164318 (2006) 84 S. Heinbuch, F. Dong, J. J. Rocca and E. R. Bernstein, J. Opt. Soc. Am. B, 25, B85
(2008) 85 S. Heinbuch, F. Dong, J. J. Rocca and E. R. Bernstein, Proc. SPIE Int. Soc. Opt.
Eng., 6921, 69213F (2008) 86 E. R. Bernstein and Y. Matsuda, Environmental Catalysis, (CRC Press, 2005). 87 Y. Gong, M. Zhou and L. Andrews, Chem. Rev., 109, 6765 (2009) 88 M. Pykavy and C. van Wullen, J. Chem. Phys., 120, 4207 (2004) 89 Y. Matsuda and E. R. Bernstein, J. Phys. Chem., 109, 3803 (2005) 90 M. Calatayud, J. Andres and A. Beltran, J. Phys. Chem. A, 105, 9760 (2001) 91 D. R. Justes, R. Mitric, N. A. Moore, V. Bonacic-Koutecky and J. Castleman, A.
W., J. Am. Chem. Soc., 125, 6289 (2002) 92 P. D. Innes, Proc. Roy. Soc. Lond. Math. Phys. Sci., 79, 442 (1907) 93 K.-F. Hu, Phys. Rev., 11, 505 (1918) 94 H. Robinson, Proc. Roy. Soc. Lond. Math. Phys. Sci., 104, 455 (1923) 95 R. G. Steinhardt and E. J. Serfass, Anal. Chem., 25, 697 (1953) 96 C. Nordling, E. Sokolowski and K. Siegbahn, Phys. Rev., 105, 1676 (1957) 97 D. W. Turner and M. I. A. Jobory, J. Chem. Phys., 37, 3007 (1962) 98 T. G. Dietz, M. A. Duncan, M. G. Liverman and R. E. Smalley, Chem. Phys. Lett.,
70, 246 (1980) 99 T. G. Dietz, M. A. Duncan, M. G. Liverman and R. E. Smalley, J. Chem. Phys., 73,
4816 (1980) 100 O. Cheshnovsky, S. H. Yang, C. L. Pettiette, M. J. Craycraft, Y. Liu and R. E.
Smalley, Chem. Phys. Lett., 138, 119 (1987) 101 E. R. Grant and M. G. White, Nature, 354, 249 (1991) 102 K. Muller-Dethlefs and E. W. Schlag, Annu. Rev. Phys. Chem., 42, 109 (1991) 103 T. Baer, W. B. Peatman and E. W. Schlag, Chem. Phys. Lett., 4, 243 (1969) 104 W. B. Peatman, T. B. Borne and E. W. Schlag, Chem. Phys. Lett., 3, 492 (1969) 105 K. Müller-Dethlefs, M. Sander and E. W. Schlag, Chem. Phys. Lett., 112, 291
(1984) 106 M. C. R. Cockett, Chem. Soc. Rev., 34, 935 (2005) 107 U. Hollenstein, R. Seiler, H. Schmutz, M. Andrist and F. Merkt, J. Chem. Phys.,
115, 5461 (2001) 108 F. Merkt, Annu. Rev. Phys. Chem., 48, 675 (1997) 109 F. Merkt, J. Chem. Phys., 100, 2623 (1994) 110 M. J. J. Vrakking and Y. T. Lee, J. Chem. Phys., 102, 8818 (1995) 111 D. Bahatt, U. Even and R. D. Levine, J. Chem. Phys., 98, 1744 (1993) 112 S. T. Pratt, J. Chem. Phys., 98, 9241 (1993) 113 X. Zhang, J. M. Smith and J. L. Knee, J. Chem. Phys., 99, 3133 (1993) 114 F. Merkt, S. R. Mackenzie and T. P. Softley, J. Chem. Phys., 103, 4509 (1995) 115 M. J. J. Vrakking and Y. T. Lee, J. Chem. Phys., 102, 8833 (1995) 116 M. J. J. Vrakking, I. Fischer, D. M. Villeneuve and A. Stolow, J. Chem. Phys., 103,
4538 (1995) 117 S. J., Ann. Phys., 48, 193 (1915) 118 J. Holtsmark, Ann. Phys., 363, 577 (1919)

169
119 L. Zhu and P. Johnson, J. Chem. Phys., 94, 5769 (1991) 120 S. T. Park, H. L. Kim and M. S. Kim, Bull. Korean Chem. Soc., 23, 1247 (2002) 121 M. Born and J. P. Oppenheimer, Ann. Phys., 84, 457 (1927) 122 M. Head-Gordon, R. J. Rico, M. Oumi and T. J. Lee, Chem. Phys. Lett., 219, 21
(1994) 123 D. Maurice and M. Head-Gordon, Mol. Phys., 96, 1533 (1999) 124 C. Møller and M. S. Plesset, Phys. Rev., 46, 618 (1934) 125 R. Krishnan and J. A. Pople, Int. J. Quantum Chem., 14, 91 (1978) 126 T. van Mourik and R. J. Gdanitz, J. Chem. Phys., 116, 9620 (2002) 127 W. Kohn and L. J. Sham, Phys. Rev., 140, A1133 (1965) 128 A. D. Becke, J. Chem. Phys., 98, 5648 (1993) 129 C. Lee, W. Yang and R. G. Parr, Phys. Rev. B, 37, 785 (1988) 130 J. P. Perdew, Phys. Rev. B, 33, 8822 (1986) 131 J. P. Perdew, Phys. Rev. B, 34, 7406 (1986) 132 G. D. Purvis and R. J. Bartlett, J. Chem. Phys., 76, 1910 (1982) 133 K. Raghavachari, G. W. Trucks, J. A. Pople and M. Head-Gordon, Chem. Phys.
Lett., 157, 479 (1989) 134 T. Van Voorhis and M. Head-Gordon, J. Chem. Phys., 115, 5033 (2001) 135 D. Hegarty and M. A. Robb, Mol. Phys., 38, 1795 (1979) 136 H.-J. Werner and P. J. Knowles, J. Chem. Phys., 89, 5803 (1988) 137 P. J. Knowles and H.-J. Werner, Chem. Phys. Lett., 145, 514 (1988) 138 J. Finley, P.-Å. Malmqvist, B. O. Roos and L. Serrano-Andrés, Chem. Phys. Lett.,
288, 299 (1998) 139 J. Franck and E. G. Dymond, Trans. Faraday Soc., 21, 536 (1926) 140 E. Condon, Phys. Rev., 28, 1182 (1926) 141 E. U. Condon, Phys. Rev., 32, 858 (1928) 142 F. Duschinsky, Acta Physicochim. U.R.S.S., 7, 551 (1937) 143 G. M. Sando and K. G. Spears, J. Phys. Chem. A, 105, 5326 (2001) 144 H. L. Strauss and H. M. Pickett, J. Am. Chem. Soc., 92, 7281 (1970) 145 C. Eckart, Phys. Rev., 47, 552 (1935) 146 S. Li, Threshold Photoionization and ZEKE Photoelectron Spectroscopy of Metal
Complexes, (University of Kentucky,2004) 147 D.-S. Yang, M. Z. Zgierski, D. M. Rayner, P. A. Hackett, A. Martinez, D. R.
Salahub, P.-N. Roy and J. T. Carrington, J. Chem. Phys., 103, 5335 (1995) 148 A. Berces, M. Z. Zgierski and D. S. Yang, Computational Molecular Spectroscopy,
(Weley, New York City, 2000). 149 L. Wu, Y. Liu, C. Zhang, S. Li, D. A. Dixon and D.-S. Yang, J. Chem. Phys., 137,
034307 (2012) 150 W. C. Wiley and I. H. McLaren, Rev. Sci. Instrum., 26, 1150 (1955) 151 M. A. Duncan, T. G. Dietz and R. E. Smalley, J. Chem. Phys., 75, 2118 (1981) 152 B. R. Sohnlein and D.-S. Yang, J. Chem. Phys., 124, 134305 (2006) 153 C. E. Moore, Atomic Energy Levels, Washington, D. C. , 1971), National Bureau
of Standards. 154 J. Dunning, T. H. , J. Chem. Phys., 90, 1007 (1989) 155 D. E. Woon and T. H. Dunning, J. Chem. Phys., 100, 2975 (1994) 156 P. J. Hay and W. R. Wadt, J. Chem. Phys., 82, 270 (1985)

170
157 W. R. Wadt and P. J. Hay, J. Chem. Phys., 82, 284 (1985) 158 P. J. Hay and W. R. Wadt, J. Chem. Phys., 82, 299 (1985) 159 M. Dolg, H. Stoll, H. Preuss and R. M. Pitzer, J. Phys. Chem., 97, 5852 (1993) 160 M. Reiher and A. Wolf, J. Chem. Phys., 121, 2037 (2004) 161 M. Reiher and A. Wolf, J. Chem. Phys., 121, 10945 (2004) 162 A. J. Merer, Annu. Rev. Phys. Chem., 40, 407 (1989) 163 M. D. Morse, Chem. Rev., 86, 1049 (1986) 164 D. E. Clemmer, N. F. Dalleska and P. B. Armentrout, Chem. Phys. Lett., 190, 259
(1992) 165 M. C. R. Cockett, J. M. Dyke, A. M. Ellis, M. Fehér and T. G. Wright, J. Electron.
Spectrosc. Relat. Phenom., 51, 529 (1990) 166 M. C. R. Cockett, L. Nyulászi, T. Veszprémi, T. G. Wright and J. M. Dyke, J.
Electron. Spectrosc. Relat. Phenom., 57, 373 (1991) 167 M. C. R. Cockett, J. M. Dyke, A. M. Ellis and T. G. Wright, J. Chem. Soc., Faraday
Trans., 87, 19 (1991) 168 C. E. Young, R. B. Cohen, P. M. Dehmer, L. G. Pobo and S. Wexler, J. Chem.
Phys., 65, 2562 (1976) 169 L. Andrews, M. Zhou, G. V. Chertihin and C. W. Bauschlicher, J. Phys. Chem. A,
103, 6525 (1999) 170 T. K. Todorova, I. Infante, L. Gagliardi and J. M. Dyke, J. Phys. Chem. A, 112,
7825 (2008) 171 Y. Liu, L. Wu, C. H. Zhang, S. A. Krasnokutski and D. S. Yang, J. Chem. Phys.,
135, 034309 (2011) 172 D. Proch and T. Trickl, Rev. Sci. Instrum., 60, 713 (1989) 173 M. Head-Gordon, J. A. Pople and M. J. Frisch, Chem. Phys. Lett., 153, 503 (1988) 174 J. Cizek,in Advances in Chemical Physics, edited by P. C. Hariharan (Wiley
Interscience, New York, 1969), p. 35. 175 J. A. Pople, M. Head-Gordon and K. Raghavachari, J. Chem. Phys., 87, 5986 (1987) 176 R. A. Kendall, T. H. J. Dunning and R. J. Harrison, J. Chem. Phys., 96, 6796 (1992) 177 R. Krishnan, J. S. Binkley, R. Seeger and J. A. Pople, J. Chem. Phys., 72, 650 (1980) 178 X. Cao and M. Dolg, J. Chem. Phys., 115, 7348 (2001) 179 M. J. Frisch, G. W. Trucks, H. B. Schlegel, G. E. Scuseria, M. A. Robb, J. R.
Cheeseman, G. Scalmani, V. Barone, B. Mennucci, G. A. Petersson, H. Nakatsuji, M.
Caricato, X. Li, H. P. Hratchian, A. F. Izmaylov, J. Bloino, G. Zheng, J. L. Sonnenberg,
M. Hada, M. Ehara, K. Toyota, R. Fukuda, J. Hasegawa, M. Ishida, A. Nakajima, Y. Honda,
O. Kitao, H. Nakai, T. Vreven, J. Montgomery, J. A. , J. E. Peralta, F. Ogliaro, M. Bearpark,
J. J. Heyd, E. Brothers, K. N. Kudin, V. N. Staroverov, R. Kobayashi, J. Normand, K.
Raghavachari, A. Rendell, J. C. Burant, S. S. Iyengar, J. Tomasi, M. Cossi, N. Rega, J. M.
Millam, M. Klene, J. E. Knox, J. B. Cross, V. Bakken, C. Adamo, J. Jaramillo, R. Gomperts,
R. E. Stratmann, O. Yazyev, A. J. Austin, R. Cammi, C. Pomelli, J. W. Ochterski, R. L.
Martin, K. Morokuma, V. G. Zakrzewski, G. A. Voth, P. Salvador, J. J. Dannenberg, S.
Dapprich, A. D. Daniels, Ö. Farkas, J. B. Foresman, J. V. Ortiz, J. Cioslowski and D. J.
Fox, Gaussian 09, Revision A.1, 2009, 180 P. J. Knowles and H.-J. Werner, Chem. Phys. Lett., 115, 259 (1985) 181 H.-J. Werner and P. J. Knowles, J. Chem. Phys., 82, 5053 (1985) 182 P. Celani and H.-J. Werner, J. Chem. Phys., 112, 5546 (2000)
171
183 B. O. Roos and K. Andersson, Chem. Phys. Lett., 245, 215 (1995) 184 B. O. Roos, R. Lindh, P.-Å. Malmqvist, V. Veryazov, P.-O. Widmark and A. C.
Borin, J. Phys. Chem. A, 112, 11431 (2008) 185 H. J. Werner, P. J. Knowles, F. R. Manby and M. Schütz, MOLPRO, version 2010.1,
a package of ab initio programs, see http://www.molpro.net, 2010, 186 A. Berces, M. Z. Zgierski and D.-S. Yang, Computational Molecular Spectroscopy,
(Wiley, New York, 2000). 187 E. V. Doktorov, I. A. Malkin and V. I. Man'ko, J. Mol. Spectrosc., 64, 302 (1977) 188 J. F. Fuller, S. Li, B. R. Sohnlein, G. K. Rothschopf and D.-S. Yang, Chem. Phys.
Lett., 366, 141 (2002) 189 D. R. Lide, CRC Handbook of Chemistry and Physics, (CRC Press, Boca Raton,
2008), 88 edn. 190 M. E. Jacox, Vibrational and Electronic-Energy Levels of Polyatomic Transient
Molecules, (American Chemical Society, Washington. DC, 1994). 191 D. S. Yang, J. Chem. Phys. Lett., 2, 25 (2011) 192 M. Dolg, H. Stoll and H. Preuss, J. Mol. Struct. THEOCHEM, 277, 239 (1992) 193 L. B. Knight, R. J. Van Zee and W. Weltner, Chem. Phys. Lett., 94, 296 (1983) 194 A. Kalemos, I. G. Kaplan and A. Mavridis, J. Chem. Phys., 132, 024309 (2010) 195 C. Camacho, H. A. Witek and R. Cimiraglia, J. Chem. Phys., 132, 244306 (2010) 196 D. S. Yang, B. Simard, P. A. Hackett, A. Breces and M. Z. Zgierski, Int. J. Mass
Spectrom. Ion Phys., 159, 65 (1996) 197 D. Dai and K. Balasubramanian, Chem. Phys. Lett., 238, 203 (1995) 198 D. Dai and K. Balasubramanian, J. Chem. Phys., 98, 7098 (1993) 199 Y. Liu, L. Fang, X. Shen, X. Chen, J. R. Lombardi and D. M. Lindsay, Chem. Phys.,
262, 25 (2000) 200 G. Verhaegen, S. Smoes and J. Drowart, J. Chem. Phys., 40, 239 (1964) 201 L. B. Knight, R. W. Woodward, R. J. Vanzee and W. Weltner, J. Chem. Phys., 79,
5820 (1983) 202 X. Cao and M. Dolg, Theo. Chem. Acc., 108, 143 (2002) 203 A. Lyalin, A. V. Solov'yov and W. Greiner, Phys. Rev. A, 74, 043201 (2006) 204 Z. J. Wu, J. S. Shi, S. Y. Zhang and H. J. Zhang, Phys. Rev. A, 69, 064502 (2004) 205 M. S. Ford and S. R. Mackenzie, J. Chem. Phys., 123, 084308 (2005) 206 X. Z. Peng, J. E. Abbott and W. Kong, J. Chem. Phys., 113, 3020 (2000) 207 G. K. Rothschopf, J. S. Perkins, S. Li and D.-S. Yang, J. Phys. Chem. A, 104, 8178
(2000) 208 P. J. Knowles and H. J. Werner, Theor. Chim. Acta, 84, 95 (1992) 209 A. Berning, M. Schweizer, H.-J. Werner, P. J. Knowles and P. Palmieri, Mol. Phys.,
98, 1823 (2000) 210 G. I. Nemeth, H. Ungar, C. Yeretzian, H. L. Selzle and E. W. Schlag, Chem. Phys.
Lett., 228, 1 (1994) 211 C. Linton, B. Simard, H. P. Loock, S. Wallin, G. K. Rothschopf, R. F. Gunion, M.
D. Morse and P. B. Armentrout, J. Chem. Phys., 111, 5017 (1999) 212 D. S. Yang, A. M. James, D. M. Rayner and P. A. Hackett, J. Chem. Phys., 102,
3129 (1995) 213 D. S. Yang and P. A. Hackett, J. Electron. Spectrosc. Relat. Phenom., 106, 153
(2000)

172
214 D.-S. Yang, M. Z. Zgierski and P. A. Hackett, J. Chem. Phys., 108, 3591 (1998) 215 D. S. Yang, M. Z. Zgierski, A. Berces, P. A. Hackett, A. Martinez and D. R. Salahub,
Chem. Phys. Lett., 277, 71 (1997) 216 D.-S. Yang, M. Z. Zgierski, A. Bérces, P. A. Hackett, P. N. Roy, A. Martinez, T.
Carrington, D. R. Salahub, R. Fournier, T. Pang and C. Chen, J. Chem. Phys., 105, 10663
(1996) 217 P. Calaminici, A. M. Koster, T. Carrington, P. N. Roy, N. Russo and D. R. Salahub,
J. Chem. Phys., 114, 4036 (2001) 218 H. Lefebvre-Brion and R. W. Field, Perturbations in the Spectra of Diatomic
Molecules, (Academic Press, Orlando, 1986). 219 F. Froese Fischer, Comput. Phys. Commun., 43, 355 (1987) 220 X. Cao and M. Dolg, Mol. Phys., 101, 1967 (2003) 221 S. P. Walch and C. W. Bauschlicheer,Comparision of Ab Initio Quantum Chemistry
with Experiment for Small Molecules, edited by R. J. BartlettReidel, Holland, 1985). 222 A. R. Miedema, Faraday Symp. Chem. Soc., 14, 136 (1980) 223 G. H. Jeung, Chem. Phys. Lett., 125, 407 (1986) 224 K. R. Asmis, Phys. Chem. Chem. Phys., 14, 9270 (2012) 225 G. V. Chertihin, L. Andrews, M. Rosi and C. W. Bauschlicher, J. Phys. Chem. A,
101, 9085 (1997) 226 J. R. T. Johnson and I. Panas, Chem. Phys., 248, 161 (1999) 227 Y. Yang, H. T. Liu and P. Zhang, Phys. Rev. B, 84, 205430 (2011) 228 Z. Yang and S. J. Xiong, J. Phys. Chem. A, 114, 54 (2010) 229 S. P. Willson and L. Andrews, J. Phys. Chem. A, 103, 6972 (1999) 230 S. P. Willson and L. Andrews, J. Phys. Chem. A, 103, 3171 (1999) 231 A. M. Burow, T. Wende, M. Sierka, R. Wlodarczyk, J. Sauer, P. Claes, L. Jiang, G.
Meijer, P. Lievens and K. R. Asmis, Phys. Chem. Chem. Phys., 13, 19393 (2011) 232 L. Wu, C. Zhang, S. A. Krasnokutski and D.-S. Yang, J. Chem. Phys., 137, 084312
(2012) 233 B. B. Nikolai and A. P. Kirk, J. Chem. Phys., 123, 064107 (2005) 234 D. Andrae, U. Häußermann, M. Dolg, H. Stoll and H. Preuß, Theo. Chem. Acc., 77,
123 (1990) 235 C. A. Caroline and M. N. Daniel, J. Chem. Phys., 100, 1797 (1994) 236 Y. X. Zhao, J. Y. Yuan, X. L. Ding, S. G. He and W. J. Zheng, Phys. Chem. Chem.
Phys., 13, 10084 (2011) 237 F. Aubriet and J.-F. Muller, J. Am. Soc. Mass Spectrom., 19, 488 (2008) 238 M. J. Van Stipdonk, D. R. Justes, R. D. English and E. A. Schweikert, J. Mass
Spectrom., 34, 677 (1999) 239 J. K. Gibson, Journal of Physical Chemistry, 100, 507 (1996) 240 J. K. Gibson, J. Appl. Phys., 78, 1274 (1995) 241 I. A. Kahwa, J. Selbin, T. C. Y. Hsieh, D. W. Evans, K. M. Pamidimukkala and R.
Laine, Inorg. Chim. Acta., 144, 275 (1988) 242 G. Santambrogio, E. Janssens, S. Li, T. Siebert, G. Meijer, K. R. Asmis, J. Dobler,
M. Sierka and J. Sauer, J. Am. Chem. Soc., 130, 15143 (2008) 243 A. M. Burow, T. Wende, M. Sierka, R. Włodarczyk, J. Sauer, P. Claes, L. Jiang, G.
Meijer, P. Lievens and K. R. Asmis, Phys. Chem. Chem. Phys., 13, 19393 (2011) 244 H.-J. Zhai, B. Wang, X. Huang and L.-S. Wang, J. Phys. Chem. A, 113, 9804 (2009)

173
245 J. Fan, J. B. Nicholas, J. M. Price, S. D. Colson and L.-S. Wang, J. Am. Chem. Soc.,
117, 5417 (1995) 246 L.-S. Wang, J. B. Nicholas, M. Dupuis, H. Wu and S. D. Colson, Phys. Rev. Lett.,
78, 4450 (1997) 247 G. v. Helden, A. G. G. M. , Tielens, D. v. Heijnsbergen, M. A. Duncan, S. Hony,
L. B. F. M. Waters and G. Meijer, Science, 288, 313 (2000) 248 S.-G. He, Y. Xie, F. Dong and E. R. Bernstein, J. Chem. Phys., 125, 164306 (2006) 249 J. S. Pilgrim, L. R. Brock and M. A. Duncan, J. Phys. Chem., 99, 544 (1995) 250 S. Wei, B. C. Guo, H. T. Deng, K. Kerns, J. Purnell, S. A. Buzza and A. W.
Castleman, J. Am. Chem. Soc., 116, 4475 (1994) 251 V. Dryza, J. F. Alvino and G. F. Metha, J. Phys. Chem. A, 114, 4080 (2010) 252 N. Fukushima, K. Miyajima and F. Mafune, J. Phys. Chem. A, 113, 2309 (2009) 253 V. Dryza, M. A. Addicoat, J. R. Gascooke, M. A. Buntine and G. F. Metha, J. Phys.
Chem. A, 109, 11180 (2005) 254 H. Sakurai and A. W. Castleman, J. Phys. Chem. A, 102, 10486 (1998) 255 D. van Heijnsbergen, G. von Helden, M. A. Duncan, A. J. A. van Roij and G. Meijer,
Phys. Rev. Lett., 83, 4983 (1999) 256 G. von Helden, D. van Heijnsbergen, M. A. Duncan and G. Meijer, Chem. Phys.
Lett., 333, 350 (2001) 257 D.-S. Yang, Coord. Chem. Rev., 214, 187 (2001) 258 M. Z. Z. A. Berces, and D.-S. Yang, Computational Molecular Spectroscopy,
(Wiley, New York, 2000). 259 M. J. Frisch, G. W. Trucks, H. B. Schlegel, G. E. Scuseria, M. A. Robb, J. R.
Cheeseman, J. Montgomery, J. A., T. Vreven, K. N. Kudin, J. C. Burant, J. M. Millam, S.
S. Iyengar, J. Tomasi, V. Barone, B. Mennucci, M. Cossi, G. Scalmani, N. Rega, G. A.
Petersson, H. Nakatsuji, M. Hada, M. Ehara, K. Toyota, R. Fukuda, J. Hasegawa, M. Ishida,
T. Nakajima, Y. Honda, O. Kitao, H. Nakai, M. Klene, X. Li, J. E. Knox, H. P. Hratchian,
J. B. Cross, V. Bakken, C. Adamo, J. Jaramillo, R. Gomperts, R. E. Stratmann, O. Yazyev,
A. J. Austin, R. Cammi, C. Pomelli, J. W. Ochterski, P. Y. Ayala, K. Morokuma, G. A.
Voth, P. Salvador, J. J. Dannenberg, V. G. Zakrzewski, S. Dapprich, A. D. Daniels, M. C.
Strain, O. Farkas, D. K. Malick, A. D. Rabuck, K. Raghavachari, J. B. Foresman, J. V.
Ortiz, Q. Cui, A. G. Baboul, S. Clifford, J. Cioslowski, B. B. Stefanov, G. Liu, A.
Liashenko, P. Piskorz, I. Komaromi, R. L. Martin, D. J. Fox, T. Keith, M. A. Al-Laham,
C. Y. Peng, A. Nanayakkara, M. Challacombe, P. M. W. Gill, B. Johnson, W. Chen, M.
W. Wong, C. Gonzalez and J. A. Pople, Gaussian 03, Revision C.02, 2003, 260 V. Dryza, J. R. Gascooke, M. A. Buntine and G. F. Metha, Phys. Chem. Chem.
Phys., 11, 1060 (2009) 261 V. Dryza, M. A. Addicoat, J. R. Gascooke, M. A. Buntine and G. F. Metha, J. Phys.
Chem. A, 112, 5582 (2008) 262 M. A. Fox and J. K. Whitesell, Organische Chemie: Grundlagen, Mechanismen,
Bioorganische Anwendungen, (Springer, 1995). 263 L. Wu, C. Zhang, S. A. Krasnokutski and D.-S. Yang, J. Chem. Phys., 137, 084312
(2012) 264 L. Wu, C. Zhang, S. A. Krasnokutski and D.-S. Yang, J. Chem. Phys., submitted,
(2014)

174
VITA
B. Sc., Chemical Physics
University of Science and Technology of China 2003-2007
Publications:
1. Lu Wu, Changhua Zhang, Serge A. Krasnokutski, and Dong-Sheng Yang, " Mass-
analyzed threshold ionization and structural isomers of M3O4 (M = Sc, Y, and La)", J.
Chem. Phys. 137, 084312 (2012)
2. Lu Wu, Yang Liu, Changhua Zhang, Shenggang Li, David A. Dixon, and Dong-Sheng
Yang, "Mass-analyzed threshold ionization of an excited state of lanthanum dioxide", J.
Chem. Phys. 137, 034307 (2012)
3. Yuxiu Lei, Lu Wu, Bradford R. Sohnlein, and Dong-Sheng Yang, "High-spin electronic
states of lanthanide-arene complexes: Nd(benzene) and Nd(naphthalene)", J. Chem.
Phys. 136, 204311 (2012)
4. Yang Liu, Lu Wu, Chang-Hua Zhang, Serge A. Krasnokutski, and Dong-Sheng Yang,
"Electronic states and spin-orbit splitting of lanthanum dimer", J. Chem. Phys. 135,
034309 (2011)
5. Lu Wu, Changhua Zhang, Serge A. Krasnokutski, and Dong-Sheng Yang, " Mass-
analyzed threshold ionization and structural isomers of M2O2 (M = Sc, Y, and La)"
submitted

175
Conference Presentations:
1. Lu Wu, Roudjane Mourad, Yang Liu, and Dong-Sheng Yang, "Mass-Analyzed threshold
ionization of lutetium dimer"(oral), June 18-22, 2013, 68th International Symposium on
Molecular Spectroscopy, Columbus, Ohio.
2. Lu Wu, Beni Dangi, Roudjane Mourad, and Dong-Sheng Yang, "Mass-Analyzed threshold
ionization of M2O2 (M = Ce and Pr)"(oral), June 17-21, 2012, 67th International
Symposium on Molecular Spectroscopy, Columbus, Ohio.
3. Lu Wu and Dong-Sheng Yang, 7th Kentucky Innovation and Entrepreneurship
Conference(poster), June 1, 2011, Louisville, Kentucky.
4. Lu Wu, Roudjane Mourad and Dong-Sheng Yang, "Mass-Analyzed Threshold Ionization
of M3C2 ( M = Sc and La)"(oral), June 20-24, 2011, 66th International Symposium on
Molecular Spectroscopy in Columbus, Ohio, June, 2011
5. Lu Wu and Dong-Sheng Yang, 7th Kentucky Innovation and Entrepreneurship
Conference(poster), June, 2011, May 26, Louisville, Kentucky.
6. Lu Wu, Changhua Zhang, Sergiy Krasnokutski, and Dong‐Sheng Yang, "Mass-Analyzed
threshold ionization of La2O2"(oral), June 21-25, 2010, 65th International Symposium on
Molecular Spectroscopy, Columbus, Ohio.
7. Lu Wu and Dong-Sheng Yang, 6th Kentucky Innovation and Entrepreneurship
Conference(poster), April 6, 2010, Lexington, Kentucky.
8. Lu Wu, Changhua Zhang, Sergiy Krasnokutski, and Dong‐Sheng Yang, "Mass-Analyzed
threshold ionization of Lanthanum oxide clusters", June 22-26, 2009, 64th International
Symposium on Molecular Spectroscopy, Columbus, Ohio.