structure and behaviour of inorganics in …users.abo.fi/rbackman/515_516.pdf · structure and...
TRANSCRIPT

LIEKKI 2 Technical Review 1993 - 1998 1073
STRUCTURE AND BEHAVIOUR OF INORGANICS INRECOVERY BOILERS - A MODELING APPROACH
Rainer Backman, Sonja Enestam, Ron Zevenhoven
Åbo Akademi UniversityCombustion Chemistry Research GroupLemminkäisenkatu 14-18 BFIN-20520 Turku, Finland
Phone: +358 (0)2 2154762Fax: +358 (0)2 2154780Internet: http://www.abo.fi/ktf/ccrg
The dust in the flue gases of a recovery boiler consists of two major fractions: a)
coarse (10 - 1000 µm) carryover particles, generated from black liquor droplets
carried over with the flue gases to the upper furnace, and b) submicron-sized
fume, generated either from the smelt bed or at the pyrolysis stage of the black
liquor combustion. The amount of the two dust fractions varies with location in
the boiler. The highest amount of carry over particles are found in the upper
furnace and superheaters. Fume is the dominating fraction in the colder parts of
the flue gas channel.
The melting behavior of the two dust fractions plays an important role in the
formation and growth of superheater and boiler bank deposits. Two characteristic
temperatures have been identified to describe the tendency of deposit formation
[1]. These are the sticky temperature and the flow temperature, also called the
initial deformation and radical deformation temperatures. The sticky temperature
is the temperature where the amount of liquid in the material is high enough for
the mixture to stick on a metal surface. The flow temperature is that where the
amount of liquid is high enough for the mixture to flow down a vertical surface. It
has been shown [2, 3] that the sticky temperature is reach at 15% melt content and
the flow temperature at 70% melt content. These two characteristic temperatures
are also referred to as T15 and T70.
1074 LIEKKI 2 Technical Review 1993 - 1998
The first melting point, T0, is of particular interest for the study of corrosion of
superheater tubes or floor tubes. Surface temperatures near the first melting point
can be exposed to reactive molten phase due to local temperature fluctuations. In
the smelt bed, the melting properties play an important role as well for the
physical processes as for the heat transfer. Knowledge of the temperature range
where both liquid and crystalline material can be present is valuable.
In this paper the theoretical background for a thermodynamic melting model for
alkali salts is presented. The model has been developed based on literature data,
laboratory scale measurements, and large scale measurements in boilers. It can
predict the melting range as well as other thermodynamic properties of mixtures
of sodium and potassium carbonates, sulfates, sulfides and chlorides. The model
has been used in a variety of applications in recovery boiler design, operation
optimization and trouble shooting. In this paper we particularly present an
application to the dynamic thermal modeling of the smelt bed.
Projects
515 The Structure and Behaviour of Salts in Kraft Recovery Boilers
516 New Black Liquor Combustion Characteristics III
523 The Fate of Liquor Droplet Residues Carried Over from the Lower Furnace
in Kraft Recovery Boilers

LIEKKI 2 Technical Review 1993 - 1998 1075
PHASE CHEMISTRY OF SALT MIXTURES
The pure salt components in the system (Na, K)(CO3, SO4, Cl, S), including
carbonates, sulfates, chlorides and sulfides of sodium and potassium, have their
melting points in the temperature range 771 - 1180°C (Table 1). Potassium
chloride is the lowest melting component and sodium sulfide the highest melting.
At pure component melting points the melting is sharp and complete, i.e. all
crystals are transformed to liquid when the melting point is reached. Vice versa
the crystallisation is sharp on cooling a pure salt liquid. Pure salts of sodium and
potassium exhibit no tendency of supercooling.
Table 1. Melting points for pure salt components [4, 5].
Component
KCl 771NaCl 801Na2CO3 858Na2SO4 884K2CO3 901K2S 948K2SO4 1069Na2S 1180
Mixtures of several alkali salts behave very differently compared to the pure
components. Extensive solid solubility is observed between many of the
components [6]. Table 2 summarizes the solution phases identified. In liquid
phase, all components are miscible in each other, i.e there is only one liquid
present in multicomponent systems. At temperatures above some 500°C, Na2SO4,
K2SO4, Na2CO3 and K2CO3 are miscible with each other in the whole composition
range. They form a solid solution with hexagonal crystalline structure. NaCl and
KCl are completely soluble into a halite phase above some 500°C. The crystalline
stucture is cubic. Recent work [7] indicates that also Na2S and K2S are completely
soluble into each other. These three solid solutions, the hexagonal, halite and
sulfide are the once in equilibrium with liquid at the first melting point of
multicomponent salt mixtures. At lower temperatures, some other solid solutions

1076 LIEKKI 2 Technical Review 1993 - 1998
can form. The orthorombic sulfate/carbonate is stable up to 626°C in potassium
sulfate rich mixtures and the α-form of K2CO3 up to 422°C in potassium carbonate
rich mixtures. Glaserite is a solid solution of sodium and potassium sulfate near
the composition 2K2SO4·Na2SO4. It is stable up to 470°C. The α-forms of Na2SO4
viz. Na2CO3, both can dissolve a few percent of the corresponding potassium
salts. The low temperature solid solutions are not important for the melting
behavior, but they can play a significant role in sintering processes.
In order to study the phase relationsships and the melting behavior in
multicomponent salt systems, a consistent method of dividing the bulk system
into subsystems must be used. One important feature of the salt systems is the
reciprocity. This means that in a recation between two components, the anions (or
cations) switch places:
Na2SO4 + K2CO3 = K2SO4 + Na2CO3
This reaction can take place both in solid and liquid state. A reciprocal system is
ternary to its nature, in spite of the four components reacting. Taking into account
the extensive solid solubility of alkali salt components, it is convenient to divide
salt mixtures into a) common cation binaries, b) common anion binaries, and c)
reciprocal systems (Table 3). Higher order systems are regarded as combinations
Table 2. Chemical phases and their constituents in the system (Na,K)(CO 3,SO4,S,Cl) [6, 7, 8].
Na2SO4 Na2CO3 Na2S NaCl K2SO4 K2CO3 K2S KCl
Liquid x x x x x x x x
Hexagonal ss x x x x
Halite x x
Sulfide ss x x
Orthorombic ss x x x x
K2CO3-a x x x x
Glaserite x x
Na2SO4-a x x
Na2CO3-a x x

LIEKKI 2 Technical Review 1993 - 1998 1077
of these subsystems. Thus, the system Na2SO4-KCl, is not a true binary system,
but a ternary, represented by the reciprocal (Na,K)(SO4,Cl). (Both K2SO4 and
NaCl can form if Na2SO4 and KCl are mixed and heated.)
The composition of the salt system considered with 8 "end component salt", can
be described unambigously by four characteristic number, choosen in this work to
be:
Sulfidity SU = portion of alkali as sulfur compounds = (S+SO4)/(Na2+K2)
Reduction RE = portion of total sulfur as sulfid = S/(S+SO4)
Potassium KA = portion of alkali as potassium = K/(Na+K)
Chloride CL = portion of alkali as chloride = Cl/(Na+K).
The symbols are (molar scale in mixture):
Na2 = content of Na2 S = molar content of sulfide ions
K2 = content of K2 SO4 = molar content of sulfate ions
Na = content of Na (2Na2) Cl = content of chloride ions
K = content of K (2K2).
Table 3. All true binary and some ternary subsystems in the system(Na,K)(CO3,SO4,S,Cl).
Common cation binariesSodium Potassium
Na2CO3-Na2SO4 K2CO3-K2SO4
Na2CO3-Na2S K2SO3-K2SNa2CO3-NaCl K2CO3-KClNa2SO4-Na2S K2SO4-K2SNa2SO4-NaCl K2SO4-KCl
Na2S-NaCl K2S-KCl
Common anion binaries Some reciprocals (ternaries)
Na2CO3-K2CO3 Na2CO3-Na2SO4-K2CO3-K2SO4
Na2SO4-K2SO4 Na2CO3-NaCl-K2CO3-KClNa2S-K2S Na2SO4-NaCl-K2SO4-KClNaCl-KCl Na2CO3-Na2S-K2CO3-K2S
1078 LIEKKI 2 Technical Review 1993 - 1998
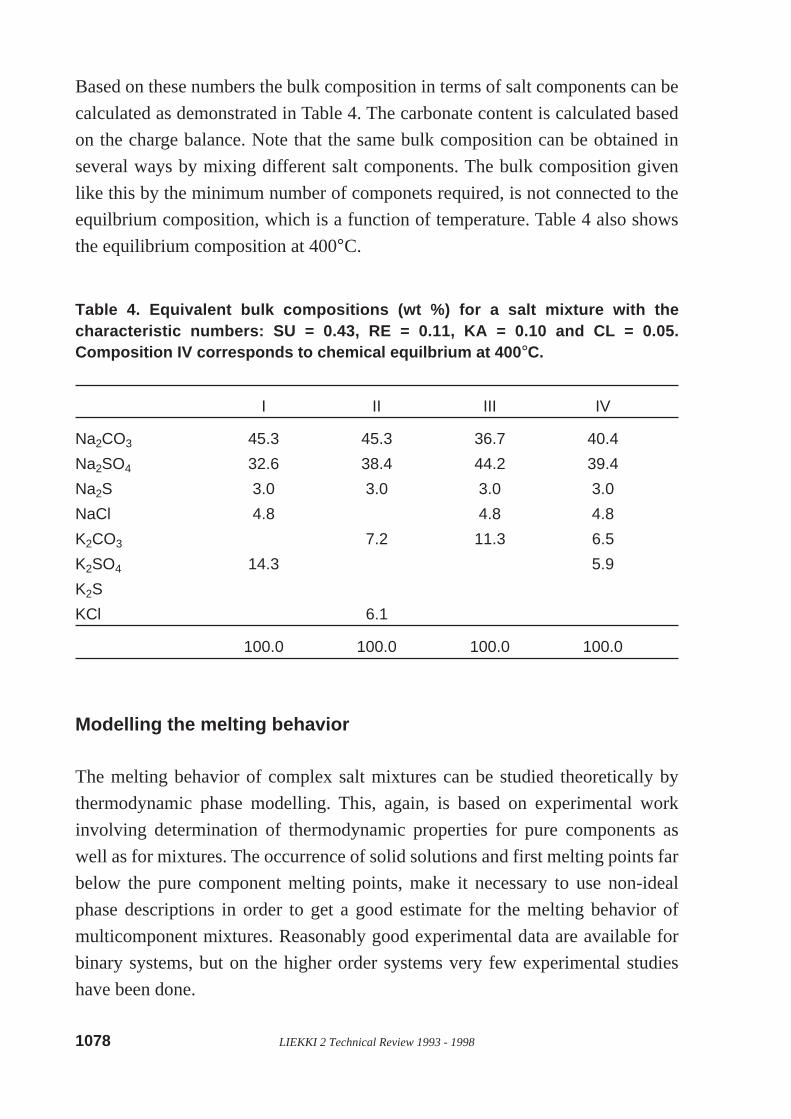
Based on these numbers the bulk composition in terms of salt components can be
calculated as demonstrated in Table 4. The carbonate content is calculated based
on the charge balance. Note that the same bulk composition can be obtained in
several ways by mixing different salt components. The bulk composition given
like this by the minimum number of componets required, is not connected to the
equilbrium composition, which is a function of temperature. Table 4 also shows
the equilibrium composition at 400°C.
Table 4. Equivalent bulk compositions (wt %) for a salt mixture with thecharacteristic numbers: SU = 0.43, RE = 0.11, KA = 0.10 and CL = 0.05.Composition IV corresponds to chemical equilbrium at 400 °C.
I II III IV
Na2CO3 45.3 45.3 36.7 40.4
Na2SO4 32.6 38.4 44.2 39.4
Na2S 3.0 3.0 3.0 3.0
NaCl 4.8 4.8 4.8
K2CO3 7.2 11.3 6.5
K2SO4 14.3 5.9
K2S
KCl 6.1
100.0 100.0 100.0 100.0
Modelling the melting behavior
The melting behavior of complex salt mixtures can be studied theoretically by
thermodynamic phase modelling. This, again, is based on experimental work
involving determination of thermodynamic properties for pure components as
well as for mixtures. The occurrence of solid solutions and first melting points far
below the pure component melting points, make it necessary to use non-ideal
phase descriptions in order to get a good estimate for the melting behavior of
multicomponent mixtures. Reasonably good experimental data are available for
binary systems, but on the higher order systems very few experimental studies
have been done.

LIEKKI 2 Technical Review 1993 - 1998 1079
In the present work, first melting and final melting temperatures for 30 well
defined samples in the system (Na,K)(CO3,SO4,Cl) were determined by thermal
analysis. A detailed description is given elsewhere [9]. These results, complemented
by studies of multicomponent mixtures containing sulfide are the basis for the
model work reported here.
The solution model used for the liquid phase and solid solution phases in the salt
mixtures is the two-sublattice equivalent fraction formalism [10]. Using this
model the binaries in (Na,K)(CO3,SO4,Cl) was descibed by Sangster and Pelton
[6]. They used altogether 28 non-ideal parameters to describe the equilibrium
between liquid, hexagonal solid solution, and halite solid solution. They also
added some ternary interaction terms. Backman [11] evaluated the system Na2CO3-
Na2SO4-Na2S by the subregular model. These literature data have been the basis
for the present evaluation, which has added 10 binary interaction coefficients to
the model (Table 5). Some additional ternary interaction coefficients are also
added. The final numerical values of these are still to be optimized based on
experiments involving sulfides. The optimization and all calculations in this work
Table 5. Non-ideal interaction parameters for the two-sublattice equivalentfraction formalism in the system (Na,K)(CO 3,SO4,S,Cl).
Interaction coefficients (J/mol)
BinaryLiquidNa2CO3-Na2S 1 1 4256Na2CO3-Na2S 1 2 -7614Na2S-Na2SO4 1 1 3293Na2S-Na2SO4 2 1 -7836Na2S-NaCl 1 1 -3350 +35*T/KK2CO3-K2S 1 1 -2400K2S-K2SO4 1 1 -9000Sulfide ssK2S-Na2S 1 1 12500K2S-Na2S 1 2 500TernaryLiquid(Na,K)(SO4,CO3) 1 1 1 1 -18000

1080 LIEKKI 2 Technical Review 1993 - 1998
Figure 1. Comparison between measured and calculated first melting (solidus) and finalmelting (liquidus) temperatures. a) Salt mixtures prepared in laboratory, b) differentsamples from boilers.
LIEKKI 2 Technical Review 1993 - 1998 1081
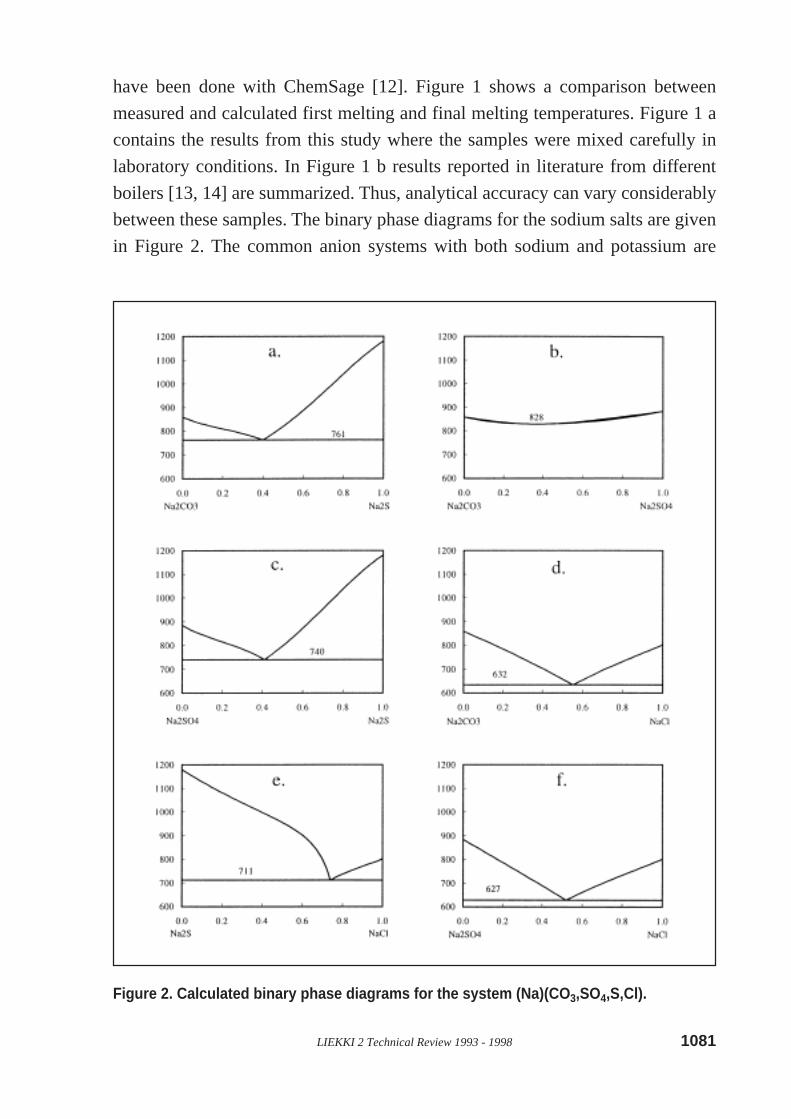
have been done with ChemSage [12]. Figure 1 shows a comparison between
measured and calculated first melting and final melting temperatures. Figure 1 a
contains the results from this study where the samples were mixed carefully in
laboratory conditions. In Figure 1 b results reported in literature from different
boilers [13, 14] are summarized. Thus, analytical accuracy can vary considerably
between these samples. The binary phase diagrams for the sodium salts are given
in Figure 2. The common anion systems with both sodium and potassium are
Figure 2. Calculated binary phase diagrams for the system (Na)(CO 3,SO4,S,Cl).

1082 LIEKKI 2 Technical Review 1993 - 1998
collected in Figure 3. Pure component data in the model have been compiled from
different sources [4, 6, 11].
APPLICATIONS OF THE MODEL
The thermodynamic model, called MELTEST, is a useful tool for estimating the
amount of melt as a function of temperature and composition of different dust
fractions and deposits in kraft recovery boilers. A number of applications have
recently been reported [15-23] . Not only the first melting and final melting points
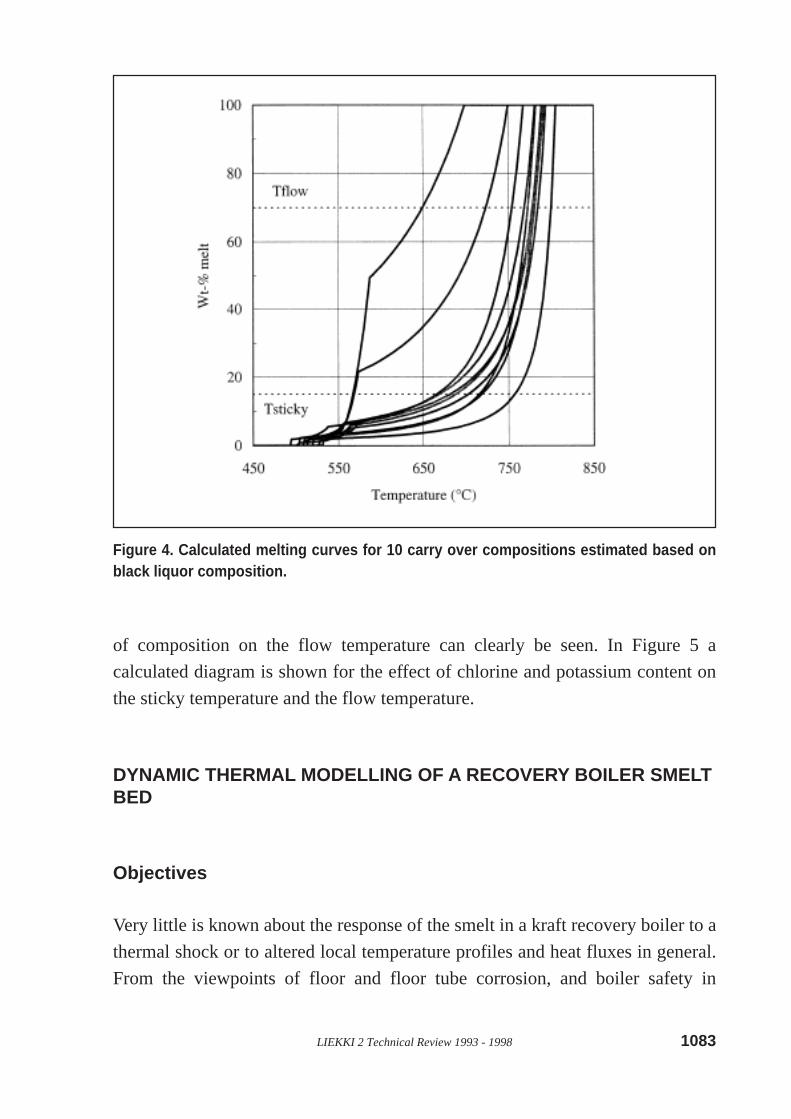
can be estimated, but the whole melting curve as a function of temperature. Figure
4 shows such curves for some different carry over compositions. The compositions
were estimated based on differences in black liquor composition. The big impact
Figure 3. Calculated solidus curves for Na-K common anion systems.
LIEKKI 2 Technical Review 1993 - 1998 1083
of composition on the flow temperature can clearly be seen. In Figure 5 a
calculated diagram is shown for the effect of chlorine and potassium content on
the sticky temperature and the flow temperature.
DYNAMIC THERMAL MODELLING OF A RECOVERY BOILER SMELTBED
Objectives
Very little is known about the response of the smelt in a kraft recovery boiler to a
thermal shock or to altered local temperature profiles and heat fluxes in general.
From the viewpoints of floor and floor tube corrosion, and boiler safety in
Figure 4. Calculated melting curves for 10 carry over compositions estimated based onblack liquor composition.

1084 LIEKKI 2 Technical Review 1993 - 1998
general, quantitative knowledge is needed. A handful of studies have been published
so far [24, 25], fortunately the issue is currently being addressed also elsewhere
[26, 27]. The purpose of the work described here is to analyse the thermal
response of a typical kraft recovery smelt to sudden changes which lead to a
change in the temperature profile in the smelt bed. These changes could be a
sudden increased (or decreased) heat flux to the top of the smelt, a sudden
increase (or decrease) in the top temperature of the smelt, a sudden outflow of the
liquid and partial melt or sudden change in the chemical composition of the smelt.
In all cases, the parameter of major interest is the temperature at the boiler floor,
Figure 5. Calculated diagram showing the effect of chlorine and potassium on the stickytemperature (T 15) and flow temperature (T 70) of salt mixtures containing sulfate andcarbonate.

LIEKKI 2 Technical Review 1993 - 1998 1085
as a result of such a change. This then allows for a further analysis considering
corrosion behaviour and thermal shock resistance of the boiler floor and floor
tubes.
Approach
In our approach, a 1-dimensional temperature profile is considered along the
vertical centre line of the boiler, ranging from the boiler floor to the top of the
smelt bed. Carbon or reacting carbon are not considered. The smelt is described
by the following characteristic numbers:
SU = 0.3, RE = 0.95, KA = 0.05, CL = 0.02.
In order to see the effect of potassium and chloride, an ideal Na2CO3/Na2S 70/30
mixture will be refered as an ideal case: i.e., SU = 0.3, RE = 1, KA = CL = 0.
The evaluation of the thermal response requires a defined steady-state situation as
a starting point. Thus, a smelt bed has to be defined by the above-mentioned 4
characteristic numbers, the steady-state boiler floor temperature plus two of the
three following parameters: the total bed height, the heat flux through the smelt
bed and the temperature at the top of the smelt bed. (From the two that are given,
the third is calculated.) Given this system definition, the position (= height from
the boiler floor) of the temperatures which corrrespond to the solidus T0, and
liquidus temperature, T100, of the smelt mixture are determined, allowing for
separating the smelt in three zones: 1) solid with temperature Tfloor < T < T0, 2)
partial melt with temperature T0 < T < T100 and 3) liquid with T100 < T < Ttop.
After having defined the bed, various other steady states of this bed and the
response of the bed to a chemical or thermal shock can be evaluated as a function
of time.
Possibilities for dynamic thermal modelling are 1) a sudden new bed surface
temperature, 2) a sudden new bed floor temperature or 3) a sudden removal of the
liquid, the liquid + partial melt, or another mass fraction of the bed.

1086 LIEKKI 2 Technical Review 1993 - 1998
Numerical procedure and input data
The differential equation for temperature, T, that is solved is the following [28]:
∂T∂t
=λρcp
∂2T∂m2 + ( λ
cp
∂ρ∂T
+ρcp
∂λ∂T
) ( ∂T∂m
)2
= A(T) ∂2T∂m2 + B(T) ( ∂T
∂m)
2
In order to account for changes in the volume of the bed, the height coordinate, x,
is replaced by a mass coordinate, m, i.e., the bed is divided in sections with a mass
∂m (which is constant) instead of sections with height ∂x (which varies due to
density changes). The values for the specific heat, cp, the density, ρ, and the
thermal conductivity, λ, were all taken as a function of temperature, giving the
'lumped' variables A(T) and B(T).
The equation was discretised in 200 mass (m = i∆m) sections and 100 time
sections (t = j∆t), and the resulting temperature profiles T(i,j) were calculated.
Given a number of mass sections of the bed, ∆m, the maximum allowable time
step, ∆t, for numerical stability was calculated using amax∆t /∆x2 < 1/2, is used
where amax is the maximum value for the heat diffusivity a = λ/ρcp in this system.
The initial conditions are a steady state solution for a bed defined by its chemistry,
floor and surface temperature and heat flux, boundary conditions are the bed floor
and surface temperature.
Software RBSMELT was produced using FORTRAN 77. The calculation of the
solidus and liquidus temperatures for the smelt beds was carried out by linking the
ChemApp routine (the non-interactive version of ChemSage) version 1.1 [12],
based on Gibbs' energy minimisation, to the software. This routine is also used to
calculate how much of each chemical compound in the partial melt is, at a certain
temperature, in a liquid phase or in a solid phase. Literature data for the density
and specific heat for all 8 compounds (Na,K) (CO3,S,SO4,Cl) was used, for their
liquid and solid state, respectively. (When data for a potassium salt KX was
missing, the value for the corresponding sodium salt NaX was used). For the heat
conductivity, temperature dependencies were not available so constant values for
a solid and liquid bed were used [24, 25]. The thermodynamic data used were the
enhanced MELTEST data described above.
LIEKKI 2 Technical Review 1993 - 1998 1087
Results and discussion
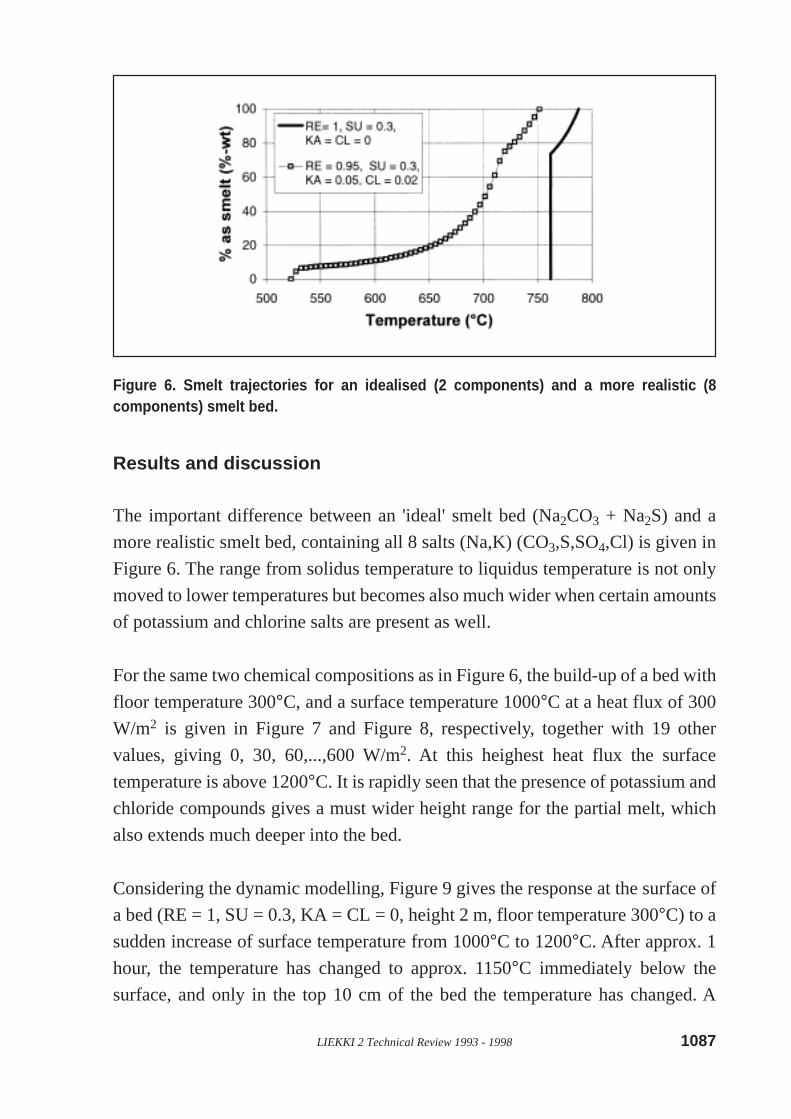
The important difference between an 'ideal' smelt bed (Na2CO3 + Na2S) and a
more realistic smelt bed, containing all 8 salts (Na,K) (CO3,S,SO4,Cl) is given in
Figure 6. The range from solidus temperature to liquidus temperature is not only
moved to lower temperatures but becomes also much wider when certain amounts
of potassium and chlorine salts are present as well.
For the same two chemical compositions as in Figure 6, the build-up of a bed with
floor temperature 300°C, and a surface temperature 1000°C at a heat flux of 300
W/m2 is given in Figure 7 and Figure 8, respectively, together with 19 other
values, giving 0, 30, 60,...,600 W/m2. At this heighest heat flux the surface
temperature is above 1200°C. It is rapidly seen that the presence of potassium and
chloride compounds gives a must wider height range for the partial melt, which
also extends much deeper into the bed.
Considering the dynamic modelling, Figure 9 gives the response at the surface of
a bed (RE = 1, SU = 0.3, KA = CL = 0, height 2 m, floor temperature 300°C) to a
sudden increase of surface temperature from 1000°C to 1200°C. After approx. 1
hour, the temperature has changed to approx. 1150°C immediately below the
surface, and only in the top 10 cm of the bed the temperature has changed. A
Figure 6. Smelt trajectories for an idealised (2 components) and a more realistic (8components) smelt bed.

1088 LIEKKI 2 Technical Review 1993 - 1998
Figure 7. The build-up of an idealised smelt bed (2 components) at various heat fluxes.Bed height 2 m at 300 W/m 2 and 1000°C surface temperature. Floor temperature 300 °C.
similar calculation was conducted for a change at the floor (RE = 1, SU = 0.3, KA
= CL = 0, height 2 m, surface temperature 1000°C) when the floor temperature is
suddenly changed from 300°C to 100°C, see Figure 10. Again, after 1 hour only in
the lowest 10 cm of the bed a temperature change is found. Finally, the effect of a
sudden, instantaneous removal of the liquid smelt from the top of the bed is shown
in Figure 11 (RE = 1, SU = 0.3, KA = CL = 0, height 2 m, floor temperature
300°C, surface temperature 1000°C). The bed height is reduced to below 1.7 m
Figure 8. The build-up of a more realistic smelt bed (8 components) at various heat fluxes.Bed height 2 m at 300 W/m 2 and 1000°C surface temperature. Floor temperature 300 °C.

LIEKKI 2 Technical Review 1993 - 1998 1089
and after 1 hour the temperature of the new surface has increased to approx.
950°C, and the top 15 cm of the bed has warmed up.
Repeating this for a bed that contains 8 compounds (SU= 0.3, RE = 0.95, KA=
0.05, CL= 0.02) gives practically the same results for a surface heat-up and a floor
cool-down. This is due to the small effect of the presence of a few % sulphates,
Figure 9. Thermal response of a smelt bed surface to a sudden temperature increase:1000°C → 1200°C (2 components). Initial state 2 m bed height, floor temperature 300 °C.
Figure 10. Thermal response of a smelt bed at the floor to a sudden temperaturedecrease: 300 °C → 100°C (2 components). Initial state 2 m bed height, surfacetemperature 1000 °C.

1090 LIEKKI 2 Technical Review 1993 - 1998
chlorides and potassium salts on the density and specific heat of the bed
(conductivities were taken constant). Since, however, these compounds have a
significant effect on the melting behaviour of the bed, the amount of material
removed at an instantaneous liquid smelt removal is much larger than for the ideal
case given in Figure 11: see Figure 12. The thermal response of the resulting
material, however, is again very much the same.
Figure 11. Thermal response of a smelt bed to a sudden removal of liquid smelt (2components). Initial state 2 m bed height, surface temperature 1000 °C, floor temperature300°C.
Figure 12. Thermal response of a smelt bed to a sudden removal of liquid smelt (8components). Initial state 2 m bed height, surface temperature 1000 °C, floor temperature300°C.
LIEKKI 2 Technical Review 1993 - 1998 1091
It is concluded that the smelt bed in a typical recovery boiler has very good
insulating properties so that floor corrosion problems are very unlikely to be
correlated to smelt bed surface temperature excursions. However, the analysis
suffers from some uncertainties considering thermal conductivities. Linking up
with the ChemSage software for rigourous calculations of the bed thermodynamics
appears very powerful.
ACKNOWLEDGEMENT
Financial support from Ahlstrom Machinery Oy, Kvaerner Pulping Oy, and the
Nordic Energy Research Program is acknowledged.
REFERENCES
1. Tran, H., Reeve, D., Barham, D., "Formation of kraft recovery boiler fireside
deposits", Pulp Paper Can. 84(1)(1983)T7.
2. Isaac, P., Tran, H., Barham, D., Reeve, D., "Stickiness of kraft recovery unit
fireside deposits", J. Pulp Paper Sci. 12(3)(1986)J84.
3. Backman, R., Hupa, M., Uppstu, E., "Fouling and corrosion mechanisms in
the recovery boiler superheater area", Tappi Journal, 70(1987) pp. 123-127.
4. SGTE-database for pure substances, Scientific Group Thermodata Europe
1996.
5. Tegman, R., Warnqvist, B., "On the phase diagram Na2CO3-Na2S", Acta
Chem. Scand. 26(1972)1, 413-414.
6. Sangster, J., M., Pelton, A. D., "Critical coupled evaluation of phase diagrams
and thermodynamic properties of binary and ternary alkali salt systems" in
Cook, L. P., McMurdie H. F., (eds) "Phase Diagrams for ceramists", The
American Ceramic Society 1989.
1092 LIEKKI 2 Technical Review 1993 - 1998
7. Mäkipää, M., Backman, R., "Corrosion of floor tubes in reduced kraft
smelts: studies on effects of chlorine and potassium", Proc. 9th International
Symposium on Corrosion in the Pulp & Paper Industry", 1998.
8. Bale, V., W., Pelton, A. D., Thompson, W. T., "The FACT Database" Ecole
Polytechnique de Montreal/Royal Military College, Canada 1997.
9. Backman, R., "The structure and behavior of salts in kraft recovery boilers"
in Hupa, M., Matinlinna, J., Ljung, M, (eds) "LIEKKI 2 Vuosikirja - Årsboken
1997" pp. 801-811.
10. Pelton, A. D., "A database and sublattice model for molten salts", Calphad
12(1988)2, 127-142.
11. Backman, R., "Sodium and Sulfur Chemistry in Combustion Gases", Report
89-4, Förbränningskemiska forskargruppen, Åbo Akademi, Åbo 1989.
12. Eriksson, G., Hack, K., "ChemSage - A computer Program for the calculation
of complex chemical equilibria", Met. Trans. 21B(1990)1013-1023.
13. Stead, N. J., Singbeil, D. L., Forget, C., Lund, G., "Formation of low melting
deposits in a modern kraft recovery boiler", Proc. 1995 International Chemical
Recovery Conference, Tappi Press 1995, pp. A105-A109.
14. Walsh, A. R., Verloop, A., La Fond, J. F., "Thermal analysis of recovery
boiler deposits", Tappi Journal, June 1993, 208.
15. Hupa, M., Backman, R., Skrifvars, B-J., Hyöty, P., "The influence of chlorides
on the fireside behaviour in the recovery boiler", Tappi Journal 73(1990) pp.
153-158.
16. Backman, R., Salmenoja, K., "Equilibrium behaviour of sodium, sulfur and
chlorine in pressurized black liquor gasification with addition of titanium
dioxide", Paperi ja Puu - Paper and Timber 76(5)(1994) 320-325.

LIEKKI 2 Technical Review 1993 - 1998 1093
17. Salmenoja, K., Mäkelä, K., Backman, R., "Corrosion in bubbling fluidized
beds boilers burning chlorine containing fuels", Proc. 8th International
Symposium on Corrosion in the Pulp & Paper Industry", 1995, pp. 198-206.
18. Backman, R., Skrifvars, B-J., Hupa, M., Siiskonen, P., Mäntyniemi, J., "Flue
Gas and Dust Chemistry in Recovery Boilers with High Levels of Chlorine
and Potassium" Journal of Pulp and Paper Science 22(4)(1996)J119-J126.
19. Backman, R., Eriksson, G., Sundström, K., "The Recovery Boiler Advisor -
Combination of Practical Experience and Advanced Thermodynamic
Modelling", Proc. 3rd Colloquium on Process Simulation, 12-14.6, 1996, p.
357, Report TKK-V-B117, Espoo 1996.
20. Mäkipää, M., Mäkinen, S., Backman, R., Hämäläinen, M., "Corrosion of
BLRB floor tubes in reduced kraft smelts: Experimental and theoretical
studies" Proc. 1996 Tappi Engineering Conference, TAPPI Press Atlanta
1996, pp. 682-691.
21. Hupa, M., Backman, R., Skrifvars, B-J., Forssén, M., "Liquor-to-liquor
differences in combustion and gasification processes: Dust composition and
melting properties.", Proc. 1998 International Chemical Recovery Conference,
TAPPI Press, Atlanta 1998, pp.615-628.
22. Janka, K., Heinola, A., Heinola, M., Skrifvars, B-J., Backman, R., "The roles
of black liquor composition and boiler combustion parameters on the fouling
tendency of recovery boilers", Proc. 1998 International Chemical Recovery
Conference, TAPPI Press, Atlanta 1998, pp.629-640.
23. Vakkilainen, E., Backman, R., Forssén, M., Hupa, M., "Effect of liquor heat
treatment on black liquor combustion properties", Proc. 1998 International
Chemical Recovery Conference, TAPPI Press, Atlanta 1998, pp.229-243.
24. Richardson, D.L., Merriam, R.L. "Study of cooling and melt solidification in
black liquor recovery boilers", phase 1 report prepared for the American
Paper Institute by Arthur D. Little, Inc., Cambridge (MA), 1977.

1094 LIEKKI 2 Technical Review 1993 - 1998
25. Adams, T.N., Frederick, W.J. "Kraft recovery boiler physical and chemical
processes", the American Paper Institute, New York 1988, Chapter 5.
26. Agranat, V., Kawaji, M., Tran, H., "Development of a Recovery Boiler
Lower Furnace Heat Transfer Model - Part 1: Analysis of Floor Tube
Temperature Excursions", TAPPI Proceedings 1997, Nashville (TN), USA,
October 6-9, pp. 1131-1139.
27. Hogan, E.F. "Investigation of Chemical Recovery Unit Floor Tube Overheat
Failures", TAPPI Proceedings 1997, Nashville (TN), USA, October 6-9, pp.
567-575.
28. Zevenhoven, R. "Dynamic thermal modellling of a recovery boiler smelt
bed", Report 98-?, Åbo Akademi University, Combustion Chemistry Research
Group (1998), Turku, Finland, under preparation.