structural reforms and firms’ productivitydocuments.worldbank.org/curated/en/... · an objective...
TRANSCRIPT

Policy Research Working Paper 8308
Structural Reforms and Firms’ Productivity
Evidence from Developing Countries
Wilfried A. Kouamé Sampawende J.-A. Tapsoba
Africa RegionOffice of the Chief EconomistJanuary 2018
WPS8308P
ublic
Dis
clos
ure
Aut
horiz
edP
ublic
Dis
clos
ure
Aut
horiz
edP
ublic
Dis
clos
ure
Aut
horiz
edP
ublic
Dis
clos
ure
Aut
horiz
ed

Produced by the Research Support Team
Abstract
The Policy Research Working Paper Series disseminates the findings of work in progress to encourage the exchange of ideas about development issues. An objective of the series is to get the findings out quickly, even if the presentations are less than fully polished. The papers carry the names of the authors and should be cited accordingly. The findings, interpretations, and conclusions expressed in this paper are entirely those of the authors. They do not necessarily represent the views of the International Bank for Reconstruction and Development/World Bank and its affiliated organizations, or those of the Executive Directors of the World Bank or the governments they represent.
Policy Research Working Paper 8308
This paper is a product of the Office of the Chief Economist, Africa Region. It is part of a larger effort by the World Bank to provide open access to its research and make a contribution to development policy discussions around the world. Policy Research Working Papers are also posted on the Web at http://econ.worldbank.org. The authors may be contacted at [email protected].
This paper assesses the effects of selected structural reforms on labor productivity growth for 37 developing countries over 2006–14. It combines newly constructed reform indexes using the International Monetary Fund’s Mon-itoring of Fund Arrangements data set and firm-level productivity from the World Bank Enterprise Surveys. The paper highlights the following results. Structural reforms under consideration in this study—financial, fiscal, real sector, and trade reforms—significantly improve produc-tivity at the firm level. Interestingly, real sector reforms have the most sizable effects on firms’ productivity. The
relationship between reforms and productivity is nonlinear and shaped by certain characteristics of firms, including financial access, a distortionary environment, and firms’ size. The pace of reforms matters, since being a “strong reformer” is associated with a clear productivity dividend for firms. Finally, except for financial and trade reforms, all the macroeconomic reforms considered are bilaterally com-plementary in improving firms’ productivity. These findings are robust to several sensitivity checks, including alterna-tive methodologies and measures of productivity, and a counterfactual experiment based on unsuccessful reforms.

Structural Reforms and Firms’ Productivity: Evidence from Developing Countries
Wilfried A. Kouamé1
Sampawende J.-A. Tapsoba2
JEL Classification Numbers: J24; L16 O16, O23, O24.
Keywords: Structural Reforms, Productivity, Developing countries.
1 [email protected]/[email protected] - World Bank and Economics Department - Université de Sherbrooke, Canada (Corresponding author). Authors are grateful to Axel Schimmelpfennig, Chris Papageorgiou, Cesar Calderon, Punam Chulan-Pole, Doerte Doemeland, Alper Emre, Barhoumi, Karim, John Bluedorn, Jorge Alvarez, Paulo Lopez, Frederico Lima, Moussa Blimpo, Maty Konté, Neree Noumon, Erik van der Marel and colleagues for their comments. The paper benefited from presentations at the International Economic Association – World Congress 2017 and the Panel on “Structural Change, Inequality and Inclusive Growth” at the EADI-NORDIC Conference 2017. The usual disclaimers apply. 2 [email protected], International Monetary Fund, Washington, DC, USA and Fondation pour les Études et Recherches sur le Développement International (FERDI), Clermont-Ferrand, France.

2
I. INTRODUCTION
The literature on the economic effects of structural reforms has focused so far on developed
countries.3 Most papers document that structural reforms have positive effects on productivity.
In this stream of work, there is a consensus in the literature that reforms are important to boost
and sustain long-term growth. Reforms matter for macroeconomic performance (Bordon et al.,
2016; Christiansen et al., 2013; Bouis et al., 2012; Bourlès et al., 2010) and promote growth
(Prati et al., 2013) by increasing aggregate productivity (Nicoletti and Scarpetta, 2003) and
raising employment (Bordon et al., 2016).
Little is known about how reforms affect industries or firms in developing countries. In this
group, the role of reforms to buttress firm-level productivity is crucial. Constraints to the
business environment are huge (Almeida and Carneiro, 2009; Aterido et al., 2011); the
business environment is characterized by macroeconomic instability with negative effects on
taxation and private investment (Krugman, 1988); labor market and entry regulations are heavy
(Dabla-Norris et al., 2016; Klapper et al., 2006); and financial and market distortions are
severe (Ayyagari et al., 2016; Bah and Fang, 2015; Giannetti and Ongena, 2009).
This paper focuses on four key structural reforms viewed as productivity enhancing in
developing countries. First, fiscal reforms are key to improving productivity at the firm level
through changes in labor supply and investment in physical and human capital. For instance,
tax reforms aimed at addressing youth unemployment improve firms’ productivity (Banerji et
al., 2015). Reforming public investment in human capital (education and health) accelerates
the technological catch-up and enhances the skills of domestic workers and firms’ labor
productivity (Pritchett, 2013; Baldacci et al., 2008). Likewise, basic reforms such as
expenditure rationalization, revenue base broadening, or taxing “excess returns” and rents
could minimize distortions and reduce cumbersome burdens and improve firms’ productivity
(IMF, 2015, Cottarelli and Keen, 2012).
3 In this paper, we adopt the common definition in the literature (Spilimbergo et al., 2009). Reforms refer to government policies aiming to address market failures, reduce or remove impediments to the efficient allocation of resources, government intervention (including removal of state-imposed price controls and the abolition of state monopolies), and restriction on trade, domestic and financial transactions.

3
Second, several papers find that financial sector reforms have positive effects on productivity
through more efficient allocation of resources (Galindo et al., 2005) and easier access to
external financing (Rajan and Zingales, 1998). Financial sector reforms aiming at removing
financial restrictions and financial repression have the potential to lower the cost of capital and
boost productivity and growth at the firm level. They align the allocation of financial resources
to more productive firms and, therefore, contribute to boosting firms’ productivity (Larrain
and Stumpner, 2015).
Third, several authors also document that real sector reforms enhance productivity at the firm
level. Various studies using rich micro-level data sets find robust evidence that reforms that
promote competition in product markets could help boost firms’ productivity (Nicoletti and
Scarpetta, 2003; Faini et al., 2006; Buccirossi et al., 2009; Bourlès et al., 2010). Excessive
labor market regulation and collective bargaining in developing countries are sources of
inefficiency that reduce firms’ output and employment (World Bank, 2013). Looser regulations
could also encourage competition and firms to experiment with new ideas and technologies
and facilitate the shift of resources from slow to fast-growing sectors (Daude, 2016).
Fourth, trade sector reforms were found to be productivity enhancing at the aggregate level
(Trefler, 2004; Melitz, 2003). For developed countries, Topalova and Khandelwal (2011) find
that trade reforms increase firms’ productivity, with input tariff reforms having a larger impact.
Melitz (2003) and Melitz and Ottaviano (2008) find, for example, that trade sector reforms
increase competition, which results in a reallocation of resources from less productive to more
productive firms. In summary, there is ample evidence that the key reforms of interest in this
paper are positively associated with increases in productivity at the firm level, especially in
developed countries.
The paper examines whether structural reforms are followed by significant changes in firms’
productivity on a large sample of developing countries over the 2006-14 period. To account
for the fact that firms in the same country deal with similar contextual characteristics, the paper
uses a multilevel modeling approach to assess the impact of structural reforms on firms’
productivity. By capturing both the between-country and within-country effects, the multilevel
model accounts for the fact that firms are nested within the country and allows including both

4
firm-level and macroeconomic variables. The paper also explores the relevance of potential
conditional factors of the relationship between structural reforms and firms’ productivity and
whether reforms are substitutes or complementarity in affecting firms’ labor productivity
growth.
The paper constructs an index of structural reforms from the IMF Monitoring of Fund
Arrangements (MONA) database. Structural reform indexes are matched with firm-level data
from the World Bank Enterprise Surveys (WBES) for 37 Lower and Lower-Middle income
countries over the 2006-14 period. The MONA database contains comparable information on
the economic objectives and outcomes in the IMF-supported arrangement programs. It tracks
the performance of countries regarding scheduled purchases and reviews, quantitative and
structural conditionality, and macroeconomic indicators. To construct our structural reform
indexes, we assume that conditionalities met under IMF-supported programs in developing
countries could be identified as major macroeconomic structural reforms. We use the
information available on structural benchmarks affecting the fiscal sector, the financial sector,
the real sector, and the trade sector.4 For each measure, we focus on measures for which targets
have been met or met with minor delays. The WBES is a collection of firm-level surveys in
developing countries based on a representative sample of the economy’s private sector. It
contains cross-country information on individual firms’ characteristics and allows the
calculation of productivity measures.
In addition to using the multilevel model, the paper devotes efforts to minimize endogeneity
concerns. We present sample balance tables showing that the sample developing countries are
not statistically different from those without the IMF’s program regarding key macroeconomic
variables.5 Having the pre-treatment macroeconomic variables well matched allows us to
minimize the concerns that the estimated effects of reforms on productivity are driven by the
pre-reforms macroeconomic environment. Moreover, the identification strategy relies on
matching productivity data only with reforms within the 3 previous years. The matching
strategy limits potential reverse causality issues between reforms and productivity by ensuring
4 Structural benchmarks are reform measures that are important to achieve program goals and are intended to assess program implementation during a review. 5 Current account and overall balance, debt and interest payment on external debt, inflation rate, GDP growth, and exchange rate.

5
that the approval year of each the IMF’s arrangement programs corresponds exactly or is after
the reference year of labor productivity growth. This means that the possibility of the level of
productivity determining the implementation of reforms can be ignored.
Key findings are as follows. In developing countries, the macroeconomic structural reforms
under consideration in this study (financial, fiscal, real sector, and trade reforms) significantly
improve productivity at the firm level.6 We also find that the pace of reforms matters since
being a “strong reformer” is associated with a clear productivity dividend for firms.
Interestingly, real sector reforms have the most sizable effects on firms’ productivity. In
addition, we find that financially-included firms benefit less from financial reforms; financial
access also strengthens the relationship between fiscal reforms and firms’ productivity; the
effects of fiscal and trade reforms on labor productivity growth are hindered by distortions;
and, furthermore, the evidence suggests that small firms benefit more from financial reforms
relative to the larger ones. Finally, except for financial and trade reforms, all macro reforms
considered are bilaterally complementary in improving firms’ productivity. The findings are
robust to several sensitivity analyses, including alternative measures of productivity,
alternative methodology, the inclusion of a variable accounting for the economic crisis
conditions. Moreover, we take advantage of unsuccessful reforms and conduct a counterfactual
experiment. The latter consists in estimating the impacts of reforms not met on labor
productivity growth. The counterfactual experiment validates our findings in the sense that
unsuccessful reforms tend to have a negative impact on productivity.
This paper brings at least two key contributions to the literature. It is the first paper to use
IMF’s MONA data to construct new reform indexes. Constructing these indexes is one of the
contributions of this paper, as the indexes can be used in other research on the impact of
structural reforms in developing countries. Moreover, our reform indexes have the advantage
of focusing on reforms successfully implemented, while the existing literature mostly uses a
liberalization index as a proxy of structural reforms.7 We use the performance criteria defined
by the IMF review board to identify reforms met or met with minor delay. Second, to the best
6 The paper considers the impact of reforms under the IMF arrangement programs. Reforms implemented might raise productivity but are not considered in this paper. 7 See, for instance Arnold et al. (2015); Prati et al. (2013); Abiad and Mody (2005); Abiad, Detragiache and Tressel (2008).

6
of our knowledge, this is the first paper to assess the impact of structural reforms on firms’
productivity in developing countries. The paper is close to Tressel (2008), which investigates
the effects of financial and trade sector reforms on real output growth at the industrial level in
91 countries, including developed countries. However, Tressel (2008) focuses on financial and
trade liberalization and does not examine the effects of these reforms on firm-level
productivity. The few studies examining the impact of reforms on firms’ productivity in
developing countries mainly focus on a specific reform in China, Colombia, India, and
Indonesia.8 We take advantage of the MONA and the WBES data sets and cover a broad range
of sectors (financial, fiscal, real, and trade sector reforms) in a large sample of developing
countries.
The rest of the paper is structured as follows. Section II describes the data sets. Summary
statistics and the empirical strategy are discussed in Section III. Section IV reports and
discusses the estimation results. Section V examines the sensitivity of the findings. Finally,
Section VI presents concluding remarks.
II. DATA SETS
The data are compiled from four different sources. Reform indexes are computed from the IMF
Monitoring of Fund Arrangements (MONA) database, firms’ characteristics are culled from
the World Bank Enterprises Surveys (WBES), and the other macroeconomic variables are
collected from the World Bank’s World Development Indicators (WDI) and World
Governance Indicators (WGI).
A. The IMF Monitoring of Fund Arrangements (MONA) database
As argued in the literature, reforms are more difficult to measure than typical macroeconomic
policies, limiting the scope for quantitative analysis of the micro effects of economic reforms.
They typically concern policies geared towards raising productivity by improving the technical
efficiency of markets and institutional structures and by reducing or removing impediments to
the efficient allocation of resources. Thus, reforms have typically been associated with
8 See for instance Arnold et al. (2015); Javorcik and Li (2013); Bas and Causa (2013); Topalova and Khandelwal (2011); Eslava et al (2004).

7
regulatory policies aimed at strengthening market-based incentives in the domestic product
and service markets, labor markets, trade, and capital and financial markets, among others.
However, reforms may also involve actions to address market failures (such as the increased
emphasis on effective financial sector regulation since the crisis) or other government policies
that could affect productivity more directly.
The paper uses the IMF Monitoring of Fund Arrangements (MONA) database, which is
publicly available and covers all aspects of the program conditionality. The MONA database
provides a cumulative history of Fund-supported programs from Executive Board approval
through its completion. The Monitoring of Fund Arrangements (MONA) database contains
comparable information on the economic objectives and outcomes in Fund-supported
arrangements. It tracks the performance of countries in terms of scheduled purchases and
reviews, quantitative and structural conditionality, and macroeconomic indicators. Data are
available for most arrangements since 2002 to the present and are collected at the time of
arrangement approval and following each review. The data set covers 94 countries with an
IMF arrangement program since 2002.
Most IMF financing features disbursements made in installments that are linked to the Board’s
approval or review. Program reviews provide a framework to assess periodically whether the
IMF-supported program is on track and whether modifications are necessary to achieve the
program’s objectives. Reviews combine a backward-looking assessment (were the program
conditions met per the agreed timetable?) with a forward-looking perspective (does the
program need to be modified considering new developments?).
Program approval or reviews are based on various policy commitments agreed with the country
authorities. Conditionalities could take different forms, including prior actions (PA),
quantitative performance criteria (QPC), indicative targets (IT) or structural benchmarks (SB).
Prior actions are measures that a country agrees to take before the IMF’s Executive Board
approves financing or completes a review. They ensure that the program has the necessary
foundation to succeed or is put back on track in the event of deviations from agreed policies.
Examples include the elimination of price controls or formal approval of a budget consistent
with the program’s fiscal framework. Quantitative performance criteria (QPCs) are specific

8
and measurable conditions that must be met to complete a review. QPCs always relate to
macroeconomic variables under the control of the authorities, such as monetary and credit
aggregates, international reserves, fiscal balances, and external borrowing. For example, a
program might include a minimum level of net international reserves, a maximum level of
central bank net domestic assets, or a maximum level of government borrowing.9 Indicative
targets may be established in addition to QPCs as quantitative indicators to assess the
member’s progress in meeting the objectives of a program. Sometimes they are also set when
QPCs could not be because of data uncertainty about economic trends (for the latter months of
a program). As uncertainty is reduced, these targets are normally turned into QPCs, with
appropriate modifications. Structural benchmarks (SB) are (often non-quantifiable) reform
measures that are critical to achieving program goals and are intended as markers to assess
program implementation during a review. They vary across programs: examples are measures
to improve financial sector operations, build up social safety nets, or strengthen public financial
management.10
Using the economic sector classification, we regroup the different SBs in four categories
reported in Table 1. Fiscal sector reforms include both fiscal policy related and public sector
reforms. Financial sector reforms include reforms in the banking and financial sectors aiming
to ensure the supervision of financial institutions and lessen regulation. Real sector reforms
contain reforms on the investment climate, price controls, and labor markets. Finally, trade
sector reforms account for international trade policy and regime reforms.
9 If a QPC is not met, the Executive Board may approve a formal waiver to enable a review to be completed if it is satisfied that the program will, nonetheless, be successfully implemented, either because the deviation was minor or temporary or because the country authorities have taken or will take corrective actions. 10 Structural benchmarks and indicative targets do not require waivers if they are not met but are assessed in the context of overall program performance.

9
Table 1. Description of reforms indices Reforms indices Description Financial sector Financial sector legal reforms
Regulation and supervision of financial institutions Restructuring and privatization of financial institutions Bank regulation and supervision
Fiscal sector Tax policy (excluding trade policy) and revenue administration measures; Expenditure (including arrears clearance and poverty reduction); Debt management measures; Auditing, accounting, and financial controls; Fiscal transparency (including publication, parliamentary oversight); Central Bank financing to Government or the public sector; Pensions and social sector reforms (including social safety nets, health, and
education); Anti-corruption legislation or policy.
Real sector Private sector and regulatory environment reform (non-financial sector); Public firm reform and privatization (including pricing and subsidies) and
restructuring other than pricing; Price controls and marketing restrictions; Labor market reform.
Trade sector Changes in trade regime and policies (excluding customs reforms). Source: Authors’ classification based on MONA database.
B. The World Bank Enterprise Surveys (WBES) database
We use the WBES to compute firms’ productivity. The WBES is a collection of firm-level
surveys in developing countries based on a representative sample (random stratified sampling)
of the economy’s private sector mainly. The surveys cover a broad range of business
environment topics including access to finance, corruption, infrastructure, crime, competition,
and performance measures in most countries of the world. The surveys follow common
guidelines in design and implementation, thereby allowing cross-country analyses. We use the
standardized questionnaires and data set over the period 2006 to 2014 in order to be able to
match firm level productivity and structural reforms data from the MONA data set. The
standardized data set has a pseudo-panel structure. While the data set contains information on
117,358 firms in 136 countries, this paper focuses on developing countries under an IMF
program and having at least one round of the WBES. In addition, our identification strategy
requires matching firm-level data with reform programs within the 3 previous years. The
median sample size is 360 firms, with only three having samples over 1,000 observations
(Bangladesh, Pakistan, and Ukraine). The WBES contains information on firms’ performance
such as employment, investment, and sales. The existence of retrospective information on

10
employment and sales allows capturing labor productivity growth over the period of reforms.
All firms in the sample are producing in the formal sector i.e., registered with local or national
authorities. Approximately, 54 percent of the observations reflect firms in manufacturing and
46 percent are in the service sector. Table 14 in appendix B reports a complete list of countries
with the number of firms in each country.
The analysis includes a set of firm-level characteristics such as size, age, ownership, financial
access, distortions in facing firms, connection to foreign markets and the initial performance
of the firm. Firm’s age is captured by three categorical variables: Young (1-5 years old),
Mature (6-15 years old), and Older (more than 15 years old). Older is the reference category.
Ownership is measured as the percentage of the firm owned by the government/state and by
private foreign individuals, companies, or organizations. To capture the initial conditions, we
use the 3-year-lagged natural logarithm of the real total sales. Demand condition and
production environment facing firms within the country are captured by a dummy variable that
takes 1 if the firm is in a city with a population over one million and 0 otherwise. Firm size is
captured by four categorical variables based on the number of permanent employees: Micro-
firms (1 to 10), Small (11 to 50), Medium (51 to 200), and Large (more than 200). Large is the
reference category. Connection to foreign markets is captured by a dummy variable that takes
1 if a positive share of sales is exported directly or indirectly and 0 otherwise. Financial access
is a dummy variable that takes 1 if a firm has a credit line or an overdraft facility and 0
otherwise. Finally, distortions in the business environment are measured as the costs in the
percentage of sales of power outages, insecurity, and bribe or an informal payment to public
officials “to get things done.” The level of distortions facing firms is captured by a dummy
variable that takes 1 for firms in the fourth quintile of the distribution of distortions, i.e., firms
facing high levels of distortions. All the nominal values are adjusted for inflation. Table 2 in
the next section reports the descriptive statistics.
C. Other macroeconomic data
We control for three main macroeconomic variables that could affect both reforms and firms’
productivity, which are the average GDP growth, the inflation rate and the quality of the
regulatory environment over the period covered by the reforms. The average GDP growth

11
controls for change in productivity due to the economic environment and the inflation rate to
control for macroeconomic stability. The inflation rate is measured by the consumer price
index and captures the annual change in the prices of a basket of goods and services. The
quality of the regulatory environment captures the ability of the government to formulate and
implement sound policies that permit and promote private sector development. This variable
is a proxy of the institutional framework in which firms operate. Also, this variable helps to
control for the fact that the average institutional quality may affect the initial reform targets,
reform implementation as well as the productivity. The average GDP growth and inflation level
data are from the World Development Indicators database while the average quality of the
regulatory environment is from the World Governance Indicators.11 The macroeconomic
variables and fixed effects help to minimize potential endogeneity issues. They control for the
country’s business cycle and aggregate productivity trend, the institutional capacity, and the
ambitiousness of the authorities, the political situation and several other factors such as the
availability of development partners in providing technical assistance.
III. EMPIRICAL STRATEGY
The empirical analysis first presents the estimation strategy of productivity at the firm level.
The subsection discusses the estimation strategy that helps assess the effects of reforms at the
macroeconomic level on productivity at the firm level.
A. Calculation of Firms’ Productivity and Structural Reform Indexes
We first compute productivity at the firm level and then an index of structural reforms. The
literature has proposed several measures of productivity at the firm level. The common ones
are the labor productivity, value-added per worker and the total factor productivity (TFP). In
this paper, we focus primarily on labor productivity growth for two main reasons. First, the
labor productivity growth measured as sales per worker has the advantage of being dynamic
and is computed over the period covered by structural reforms, an advantage that might allow
11 The World Governance Indicators proxy the quality of governance at the macroeconomic level over six dimensions including the quality of the regulatory framework. The indicators rely on perception-based governance data from a set of 31 sources, including survey of firms, households, non-governmental organizations, and multilateral organizations, and other public sector bodies. See Kaufmann, Kraay and Mastrizzi (2011) for more detailed information on the methodology.

12
us to better capture the change in labor productivity due to structural reforms. Second, although
the TFP, the most used measure of productivity, accounts for the level of capital and the
production technology, we are unable to capture the change in TFP stemming from structural
reforms as the WBES database collects information only on the current stock of capital. The
information on the past stock of capital required for calculating retrospective TFP is not
reported. Recall that the standardized WBES data set used in this study has a pseudo panel
structure.12 The sensitivity analysis explores the robustness of the findings using TFP and
value-added per worker as alternative measures of productivity.
Labor productivity growth is computed as the annual average growth of labor productivity over
the last three years. Firms are asked during the surveys to report their total annual sales and
full-time employees at the end of the previous fiscal year ( −1) and three years ago ( −3),
respectively. At each period, labor productivity is computed as the ratio of total annual
sales over total permanent full-time employees. Following Davis and Haltiwanger (1999) and
World Bank (2016), we compute labor productivity growth by dividing the change in
productivity between −1 and −3 – by the average value of initial and final
labor productivity
. This approach helps to reduce the influence of outliers.
Further, since there were two full years between the two points in time, we calculate the annual
average labor productivity growth as follows:
∗ – (1)
is ranged between -1 and 1 and refers to the information on labor productivity growth
available at time t.
To construct the structural reform indexes, we use the SB indicators in the MONA database as
described above. The IMF supporting programs begin during the approval year and are
supposed to finish at the initial end period. Only a very few programs end early or are delayed
until the next year. In general, the IMF supporting programs cover a 3-year period. We focus
on the SBs that have been met or met with minor delay during the last review of the program
12 The lack of panel data on firms limits the possibility to use robust measures of productivity such as the TFP from Levinsohn-Petrin (Levinsohn and Petrin, 2003).

13
by the IMF board. Based on Nardo et al. (2005) and OECD (2008), we use the centered-
reduced normalization, or Z-score approach which consists of transforming a given variable X
characterized by its mean µ and standard deviation σ, into an index or Z score expressed as
follows:
.
If X is normally distributed, then Z follows a centered-reduced normal distribution, with a zero
mean and a unit standard deviation. With this standardization, all reform variables are
expressed in the same unit, namely the standard deviation, and can, therefore, be meaningfully
compared in terms of effects.13
For each class of reforms described above and for each period, we compute a normalized
reform index by country as follows:
(2)
is the total number of successful reforms (met or met with minor delay) in country c during
the last review by the IMF board at year t. N and are, respectively, the average number
of reforms met or met with minor delay and the standard deviation of the number of successful
reforms for all countries at a given year. The index takes the value 0 if the number of reforms
corresponds to the average number of successful reforms. All the indexes of reforms are
computed using the entire sample of the MONA data set i.e., the 94 countries.
We also build an average index of reforms by averaging indexes of different reforms (fiscal,
financial, trade, and real sectors). The average index of reforms is computed using equal
weights for each reform and ranges between -1.6 and 3.5 with high values corresponding to a
higher intensity of successful reforms on average. Compared to the existing literature, our
reform index focuses on reforms “truly” implemented as we select successful reforms based
on performance criteria in countries under IMF programs. Moreover, the database allows
13 One matter of concern related to this approach is the sensitivity of the transformed Z variable to the presence of outliers. In the robustness section, we address this issue by using the min-max approach.
(continued…)
X
Z

14
covering fiscal and real sector reforms whereas the existing literature mostly uses trade and
financial liberalization indexes as a measure of structural reforms.14 The indexes of reforms for
each country of the sample are reported in table 13 of appendix B.
We minimize potential endogeneity issues between productivity and reforms by matching
structural reform indexes with firm-level data from the WBES considering only reform
programs within the 3 previous years. For example, for firm-level data available in 2010, we
match successful reforms in 2009, 2008, or 2007. Matching structural reform data from the
MONA data set and firm-level data from the WBES data set, we obtain a pair of reform indexes
and firm characteristics for 3715 Low and Low-middle income countries from six different
regions (Sub-Saharan Africa, East Asia and the Pacific, Europe and Central Asia, Latin
America and the Caribbean, the Middle East and North Africa, and South Asia).16 The final
sample contains 10,822 firms in 37 countries over the period 2006-14.
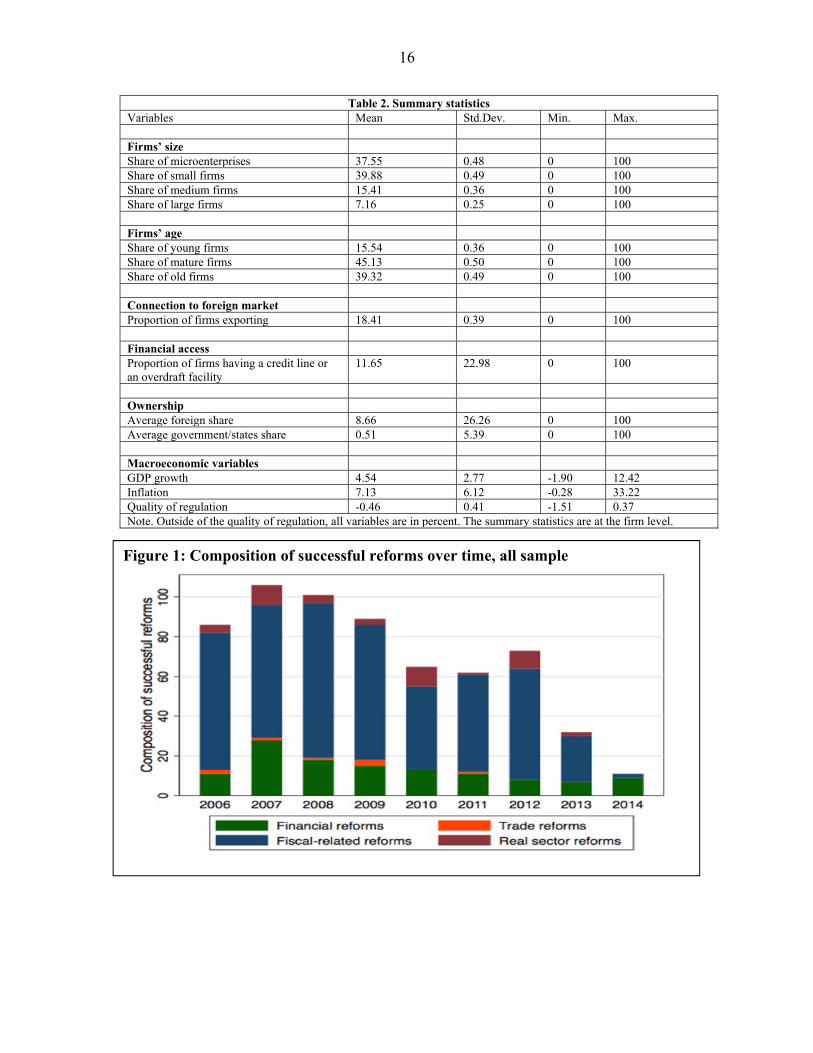
Table 2 summarizes the statistics of the variables described above. In a nutshell, micro and
small firms dominate the sample by a proportion of almost 77.5 percent. Most firms in the
sample are mature (between 5 and 15 years old) or old (more than 15 years old) with a
proportion of 84 percent. On average, 18.4 percent of firms are exporting, and only 11.65
percent of firms have a credit line or an overdraft facility. The average GDP growth over the
period is 4.54 percent, the average level of inflation is 7.13 percent, and the average index of
the quality of regulation is -0.46.
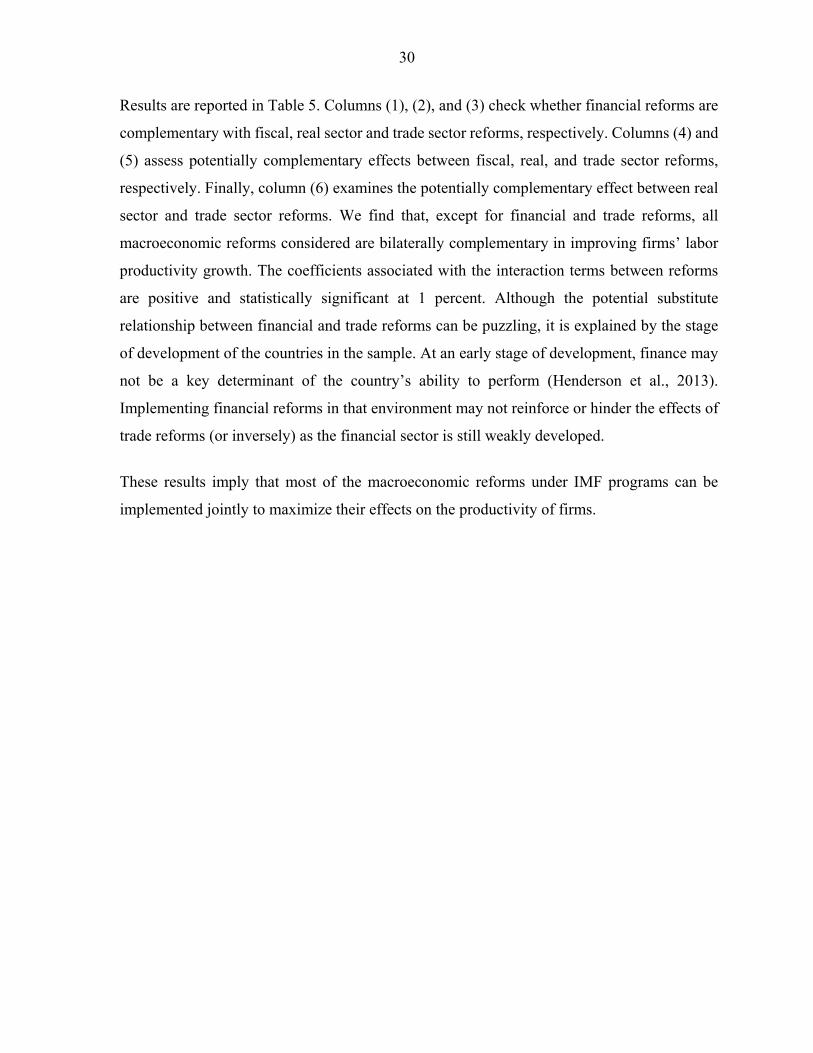
In addition, a visual inspection of the data in Figure 1 indicates that, in the sample, reforms
comprise mostly fiscal and financial reforms. This is in line with the choice of the sources of
reforms. IMF programs are mostly dominated by fiscal and financial measures under the
macro-critical reforms. The real sector and the trade sector are often added under the section
14 See, for instance, Arnold et al. (2015) Prati et al. (2013); Abiad and Mody (2005); Abiad, Detragiache and Tressel (2008). 15 Seven countries in the sample experimented with two IMF programs over the period and at least two rounds of the enterprise surveys over the period. We keep all the observations in those countries as they fit our matching strategy. Tables 13 and 14 in Appendix B report the list of countries and related descriptive statistics. 16 The list of countries in the sample is as follows: Afghanistan, Armenia, Bangladesh, Bolivia, Bosnia and Herzegovina, Burkina Faso, Burundi, Central African Republic, Republic of Congo, Democratic Republic of Congo, Djibouti, Dominican Republic, El Salvador, Ethiopia, Ghana, Guatemala, Honduras, Kosovo, Kyrgyz Republic, Madagascar, Malawi, Mali, Mauritania, Moldova, Mongolia, Nepal, Nicaragua, Niger, Pakistan, Rwanda, Senegal, Tajikistan, Tanzania, Uganda, Ukraine, Republic of Yemen, and Zambia.

15
of structural reforms and business climate improvement. Reforms spiked around 2007-2009
following the significant increase in IMF programs after the fallout of the global financial
crisis. Also, as can be seen in Figure 2, there is a positive correlation between the average labor
productivity growth and the reform indexes in line with our assumptions that structural reforms
stimulate firm level productivity.
16
Table 2. Summary statistics Variables Mean Std.Dev. Min. Max. Firms’ size Share of microenterprises 37.55 0.48 0 100 Share of small firms 39.88 0.49 0 100 Share of medium firms 15.41 0.36 0 100 Share of large firms 7.16 0.25 0 100 Firms’ age Share of young firms 15.54 0.36 0 100 Share of mature firms 45.13 0.50 0 100 Share of old firms 39.32 0.49 0 100 Connection to foreign market Proportion of firms exporting 18.41 0.39 0 100 Financial access Proportion of firms having a credit line or an overdraft facility
11.65 22.98 0 100
Ownership Average foreign share 8.66 26.26 0 100 Average government/states share 0.51 5.39 0 100 Macroeconomic variables GDP growth 4.54 2.77 -1.90 12.42 Inflation 7.13 6.12 -0.28 33.22 Quality of regulation -0.46 0.41 -1.51 0.37 Note. Outside of the quality of regulation, all variables are in percent. The summary statistics are at the firm level.
Figure 1: Composition of successful reforms over time, all sample

17
B. The multilevel mixed model
Estimating the effects of structural reforms at the country level on the outcomes at the firm
level is challenging because of the hierarchical structure of the data. Firms in the same
countries may not be independent. Within countries, firms share similar contextual
characteristics such as institutional environment, macroeconomic framework, and policies
affecting their productivity. Standard econometric methods ignore such clustering effects,
which may generate biased and underestimated standard errors. To account for such bias, we
rely on multilevel mixed modeling, which has the advantage of considering such clustering
effects by allowing the intercept to vary across countries and takes into account the
heterogeneity that exists at the country level.17 Finally, the multilevel model allows accounting
simultaneously for country-level variables and country fixed-effects. The last point is
particularly important for this study as the paper examines the impacts of reforms at the country
level on firms’ productivity.
17 See Hox et al (2010) for more extensive discussion on the multilevel analysis.
Figure 2: Average labor productivity growth and successful reforms, over 2006-14

18
An additional challenge is the potential endogeneity issues between structural reforms and
productivity, which may originate from omitted variable bias. To minimize the latter, we
include in all estimates a set of country, sector, and year fixed effects. In addition to controlling
for some potentially important omitted variables, these fixed effects control for differences in
demand conditions and survey differences, and time-invariant omitted variables. Moreover,
our matching strategy between reforms and the firm level data set limits potential reverse
causality issues between reforms and productivity. We match structural reform indexes with
firm-level data considering only reform programs within the 3 previous years. The matching
strategy ensures that the approval year of each IMF supporting program corresponds exactly
or is after the reference year of labor productivity growth. This means that the possibility of
the level of productivity determining the implementation of reforms can be ignored. Finally,
we ensure that the estimated effects of reforms are not driven by the difference in key pre-
treatment macroeconomic variables by presenting a sample balance table. Table 11 in appendix
A compares low and low-middle income countries under an IMF program and those without
an IMF program three years prior to the reforms. The analysis focuses on key macroeconomic
condition variables that are the level of debt, the current account and overall balances, the GDP
growth, the level of inflation, the exchange rate, and interest payment on the external debt (%
of exports). As it can be seen, countries under an IMF program and those without are not
statistically different. The evidence suggests that the challenge of identifying the impacts of
reforms due to the difference in the pre-treatment macroeconomic conditions can be ignored.
This evidence suggests that the estimated effects of structural reforms are not driven by the
difference in pre-reform macroeconomic environment. As an additional robustness check, we
account explicitly for countries in crisis over the period of the analysis.
The estimated multilevel mixed model is based on a two-level model where the highest level
is the country, and the lowest level is the firm:
1: , , , ~ 0, (3)
is the labor productivity growth of firm in country at year as described above.
, refers to indexes of the 3-year lagged successful reforms in country .
refers to a set of firm individual characteristics that were described above. The vector refers

19
to a set of macroeconomic variables described as well in the previous section. Finally, refers
to the firm-level error term. The coefficient is the parameter of interest that captures the
impact of structural reforms on firm-level productivity. We expect a positive sign in line with
the expectation that structural reforms raise firm-level productivity in developing countries.
2: , ~ 0, , (4)
Combining equations (3) and (4), the baseline model could be written as follows:
, , (5)
is the random part of the model with the country-specific error term. The
multilevel model has the advantage of capturing both between and within country effects of
structural reforms. In addition, we include country, sector, and year fixed effects to control for
some potentially important omitted variables, differences in demand conditions18 and survey
differences. The standard errors are clustered at the country-level in all specifications.19 In the
section below, we discuss the key findings from a sample of 10,822 firms across 37 countries
over the 2006-14 period.
IV. ESTIMATION RESULTS
A. Package and pace of reforms
Aggregate index of reforms
Baseline results are reported in Table 3. All estimates are standardized and can be compared
across structural reforms. Column (1) reports the estimates with the average reform index. We
find that the aggregate structural reform index has a positive impact on labor productivity
growth. The associated coefficient is positive and statistically significant at the 1 percent level.
A one standard deviation increase in the reform index is an improvement of 0.284 percentage
18 This accounts for the short-term economic recovery effects as some countries might begin the IMF programs in a near-crisis condition with a weak macroeconomic environment. From a sluggish economy, domestic demand may be restored as a result of the program. The year fixed effects help to distinguish between the impacts of structural reforms from the effects of economic recovery. The findings are robust using different combinations of country, sector, and year fixed effects. 19 The findings are robust clustering the standard errors at the country-sector and country-sector-year levels respectively.

20
point in firm-level labor productivity growth.
Most of the control variables are statistically significant. Exporting and foreign-owned firms
have a positive impact on labor productivity growth. Estimated coefficients are significant at
1 percent with a magnitude between 0.05 and 0.072 standard deviation increase for a 1 standard
deviation increase in the index of reforms. Initial conditions matter and are significant, at least
at the 1 percent level. Labor productivity growth is lower for firms having large sales at the
beginning of the period. The magnitude of the effects is relatively higher at 0.62 standard
deviation decrease in labor productivity growth for a 1 standard deviation differential in real
sales. Mature firms have a lower labor productivity growth. The coefficient is statistically
significant at, respectively, the 1 and 5 percent levels. Likewise, micro, small, and medium-
size firms have lower labor productivity growth relative to the large ones. Relative to the large
firms, the gap in labor productivity growth is, respectively, 0.429 standard deviation for micro-
firms, 0.294 standard deviation for small firms, and 0.102 standard deviation for medium firms.
Large cities and government-owned firms are significant drivers of labor productivity growth.
The macroeconomic environment influences firm level labor productivity growth. Higher GDP
growth favors firm level productivity growth. The estimated coefficient is significant at 1
percent. A 1 standard deviation improvement in GDP growth translates to 0.526 standard
deviation increase in labor productivity growth. Conversely, higher inflation (often considered
as an indicator of macroeconomic instability) has a negative impact on labor productivity
growth. The estimated impact is significant at 1 percent. An increase of inflation by 1 standard
deviation decreases labor productivity growth by 10.74 standard deviation. Further, a good
quality of institutions stimulates labor productivity growth. The associated coefficient is
positive and significant at 1 percent. An increase of 1 standard deviation in the quality of
regulation indicator raises labor productivity growth by 2.77 standard deviation.20
“Strong reformer” vs. “Weak reformer”
As discussed in Figure 2, there is significant country heterogeneity in structural reforms across
20 Table 12 in appendix A presents the evidence on the sub-group of low-income countries. All the reforms under consideration increase labor productivity growth.

21
countries. This suggests that the effect of structural reforms might vary according to the pace
of reforms. This section tests whether the positive effect of structural reform on labor
productivity growth evidenced above varies with the intensity of reforms implemented.
Distinguishing countries by the pace of reforms implemented might be tricky. To avoid a priori
bias, we chose the median of the reform index as a threshold.21 We generate a dummy variable
taking the value 1 when the average of the reform index for a country is above the median and
0 otherwise.22 We extend equation (5) and introduce additively and multiplicatively (with
, , ), the “strong reformer” dummy variable.23
, , ∗ , , (6)
denotes labor productivity growth, , , the reform index,
∗ , , the interaction between the “strong
reformer” dummy variable ( ) and the reform variable. As in equation (5),
we control for firm-level characteristics, macroeconomic variables, and a set of country, sector
and year fixed effects.
The results are reported in the second column of Table 3. It turns out that there is a clear
dividend for being a “strong reformer”. We find that countries dubbed as “strong reformer”
21 Although, the indexes of reforms capture the intensity of reforms for each country, it is limited in distinguishing between the quality and the quantity of reforms. One can imagine that high quality reforms might be more ambitious and thereby less successful relative to less-ambitious reforms. We are unable to explore those aspects, as the MONA data set does not allow us to categorize the reforms by level of ambition or quality. The indexes of reforms as well as the findings in this paper are interpreted as the impact of the intensity of successful reforms on firms’ productivity. 22 According to this classification, the list of strong reformer countries over the period is as follows: Armenia, Bangladesh, Bolivia, Burkina Faso, Burundi, Central African Republic, Republic of Congo, Democratic Republic of Congo, Djibouti, Dominican Republic, Ghana, Honduras, Moldova, Nicaragua, Niger, Rwanda, Tanzania, Zambia. 23 Among countries under the IMF’s program, we could expect countries with good pre-reform conditions to perform better than those with weak pre-reform macroeconomic conditions. On the opposite, we could expect countries in pre-crisis or crisis context (weak macroeconomic environment) to perform better in terms of labor productivity than the others due to the economic recovery. In each case, the effects of reforms for strong and weak reformers may be misleading. We ensure that the difference in the estimated effects of reforms between strong and weak reformer countries is not driven by the difference in pre-treatment macroeconomic conditions. The sample balance test reported in Table 11 in Appendix A shows that “strong reformer” countries are not statistically different from the “weak reformers” on the pre-treatment basis. The sample balance analysis uses the same macroeconomic variables as previously, i.e., the level of debt, the current account and overall balance, the inflation and exchange rate, the interest rate on the external debt over GDP, and the GDP growth.

22
might drive the baseline results. Note that firms in the “strong reformer” category do not appear
to be more productive than the counterfactual group (dubbed as “weak reformer”). The
coefficient of the strong reformer dummy is negative and statistically not significant. However,
the gains from reforms in labor productivity growth between a firm in the “strong reformer”
group and one in the control group is about 0.257 percentage point. This corresponds to the
coefficient associated with the interactive term between the reform indexes and the dummy
variable indicating “strong reformer” countries. The findings indicate that structural reforms
have a positive effect on labor productivity growth in countries dubbed as “strong reformer”.
The net effect of structural reforms is very close to the estimate in the baseline.
B. Specific reforms and conditional effects
So far, the analysis focuses on the aggregate index of reforms. We analyze in this section the
effect of specific reforms. The effects of structural reforms on labor productivity growth might
vary according to their nature. To shed light on this assumption, we split the reform index into
its subcomponents: financial sector reform, fiscal sector reform, real sector reform, and trade
sector reform, respectively. We then re-estimate equation (5) for financial, fiscal, real and trade
sector reforms. The findings are presented in columns (3) to (6) of Table 3. We find that all
structural reforms considered have positive impacts on labor productivity growth. The
estimated coefficients are all positive and statistically positive at the 1 percent level.
Interestingly, the real sector reform turns out to be the reform with the most sizable impact on
firms’ labor productivity growth. Indeed, the effect of real sector reform stands out in
magnitude relative to the baseline result. The associated coefficient is positive and estimated
at 9.7, implying that a one standard deviation increase in the real sector reform index leads to
an improvement of 9.7 percentage points in labor productivity growth at the firm level, which
is more than 34 times higher than the baseline estimate. Next, we find that the impacts of
financial and fiscal reforms (dominant in the sample given the fact that reforms are extracted
from IMF programs’ measures) are close in magnitude at around 0.35, slightly above that of
the average index. A one standard deviation increase in these reform indexes is associated with
an improvement of 0.37 and 0.34 percentage point in labor productivity growth at the firm
level. Finally, the impact of trade reforms is close to the one estimated with the aggregate

23
index.
Conditional factors
We further refine the estimates of the effect of structural reforms on labor productivity growth.
We focus on firms’ characteristics that shape that effect. Even though in the same country,
firms face similar macroeconomic and policy environments, they have different individual
characteristics, which could amend the impact of reforms on their productivity.
We follow the literature on the business environment and firms’ productivity24 and center on
four potential conditional factors that are access to international markets, financial access,
distortion in the business environment, and the size of firms. First, access to the foreign market
is one of the channels through which trade sector reforms could affect productivity at the firm
level. Trade sector reforms could affect all firms, while the exporting ones are the most exposed
to changes in trade regimes such as liberalization, reduction of tariffs, and time necessary to
comply with all export procedures. We expect, therefore, that exporting firms benefit more
from trade sector reforms relative to the non-exporting ones. Second, financial access is one of
the main channels through which financial reforms impact productivity at the firm level. As
argued by Rajan and Zingales (1998) and Beck et al. (2005), access to finance is crucial for
firms’ development and growth. It remains one of the big obstacles weighing down on firms
in developing countries. Given that financial reforms are aimed at improving the efficiency of
the banking system and reducing financial repression, we expect firms, which are already
financially included, to benefit less from financial reforms. Third, as highlighted by Bah and
Fang (2015), firms in developing countries face idiosyncratic distortions affecting their
productivity and economic performance. Distortions can take different forms such as bribery,
nuisance or discriminatory taxes/subsidies, tax exemption, bias against exporters, the cost of
insecurity, barrier to entry, complex tax system and the costs of power outages. In such
environment, firms can be stifled and limited in their development potential. Finally, firms’
24 See for instance, Bah and Fang, 2015; Aterido et al., 2011; Aghion et al., 2010; Berman and Héricourt, 2010; Rajan and Zingales, 1998.

24
size is one of the channels through which reforms, in general, affect firms’ productivity. As
pointed out in the literature, small businesses in developing countries are negatively affected
by a heavy regulatory framework (Aterido et al., 2011), and strict labor market regulation
negatively affects firm size (Almeida and Carneiro, 2009). Hence, by lightening the regulatory
framework and price controls, real sector reforms could increase firms’ productivity in
developing countries, especially for smaller firms.
To capture these potential heterogeneous effects, we extend equation (5) and introduce
additively and multiplicatively (with , , ) a conditional factor variable ( )
which captures firms’ individual characteristics that could potentially affect the effect of
structural reforms at the macroeconomic level on labor productivity growth at the firm level.
The empirical model estimated with a multilevel approach could be specified as follows:
, , ∗ , , (7)
denotes labor productivity growth, , , the reform index, ∗
, , the interaction between the reform index and conditional factors described
below. As previously, we control for firm-level characteristics, macroeconomic variables, and
a set of country-, sector-, and year-fixed effects. As described above, connection to foreign
market is captured by a dummy variable that takes 1 if a positive share of sales is exported
directly or indirectly and 0 otherwise.

25
Table 3. Impact of the structural reforms on labor productivity growth Dependent variable: Labor productivity growth
Package of reforms Financial reforms
Fiscal reforms Real sector reforms
Trade sector reforms
(1) (2) (3) (4) (5) (6) Structural Reforms
Structural Reforms 0.284*** (0.0160)
0.0380 (0.0763)
0.370*** (0.0209)
0.344*** (0.0194)
9.674*** (0.546)
0.266*** (0.0150)
Strong reformer dummy -0.0693 (0.0632)
Strong reformer dummy*Structural Reforms
0.257*** (0.0455)
Firms’ size
Micro-firms -0.429*** (0.0519)
-0.429*** (0.0519)
-0.429*** (0.0519)
-0.429*** (0.0519)
-0.429*** (0.0519)
-0.429*** (0.0519)
Small firms -0.294*** (0.0382)
-0.294*** (0.0382)
-0.294*** (0.0382)
-0.294*** (0.0382)
-0.294*** (0.0382)
-0.294*** (0.0382)
Medium firms -0.102*** (0.0218)
-0.102*** (0.0218)
-0.102*** (0.0218)
-0.102*** (0.0218)
-0.102*** (0.0218)
-0.102*** (0.0218)
Firms’ age
Young -0.0174 (0.0114)
-0.0174 (0.0114)
-0.0174 (0.0114)
-0.0174 (0.0114)
-0.0174 (0.0114)
-0.0174 (0.0114)
Mature -0.0419*** (0.0097)
-0.0419*** (0.0097)
-0.0419*** (0.0097)
-0.0419*** (0.0097)
-0.0419*** (0.0097)
-0.0419*** (0.0097)
Ownership
Government share 0.0087 (0.0104)
0.0087 (0.0104)
0.0087 (0.0104) 0.0087 (0.0104)
0.0087 (0.0104)
0.0087 (0.0104)
Foreign share 0.0715*** (0.0180)
0.0715*** (0.0180)
0.0715*** (0.0180)
0.0715*** (0.0180)
0.0715*** (0.0180)
0.0715*** (0.0180)
Others firms’ characteristics
Exporting status - dummy 0.0491*** (0.0164)
0.0491*** (0.0164)
0.0491*** (0.0164)
0.0491*** (0.0164)
0.0491*** (0.0164)
0.0491*** (0.0164)
Financial access 0.0162 (0.0140)
0.0162 (0.0140)
0.0162 (0.0140) 0.0162 (0.0140)
0.0162 (0.0140)
0.0162 (0.0140)
Log. real sales (3 years ago)
-0.616*** (0.0528)
-0.616*** (0.0528)
-0.616*** (0.0528)
-0.616*** (0.0528)
-0.616*** (0.0528)
-0.616*** (0.0528)
Large city 0.0165 (0.0261)
0.0165 (0.0261)
0.0165 (0.0261)
0.0165 (0.0261)
0.0165 (0.0261)
0.0165 (0.0261)
Macroeconomic variables
GDP growth (percent) 0.526*** (0.0301)
-0.0395*** (0.009)
1.359*** (0.0299)
0.294*** (0.0412)
-0.521*** (0.0848)
0.625*** (0.0259)
Inflation (percent) -10.74*** (0.414)
-0.0107 (0.009)
-23.88*** (0.526)
-7.741*** (0.549)
-11.73*** (1.284)
-8.398*** (0.327)
Institutions
Quality of regulation 2.772*** (0.0922)
0.0166 (0.0294)
6.058*** (0.169)
2.150*** (0.111)
4.394*** (0.099)
1.782*** (0.126)
R-squared 0.236 0.236 0.240 0.240 0.240 0.240 Observations 10,822 10822 10822 10822 10822 10822 Country FE Sector FE Year FE
YES YES YES
YES YES YES
YES YES YES
YES YES YES
YES YES YES
YES YES YES
Notes. The table presents standardized coefficients of the effects of reforms on firms’ labor productivity growth using a multilevel mixed effects model. All estimates use the weights and are standardized so that can be compared across reforms. Robust standard errors clustered at the country level in parentheses. ***, **, * denote significance at the 1, 5, and 10 percent level.

26
Financial access is a dummy variable that takes 1 if a firm has a credit line or an overdraft
facility and 0 otherwise. The level of distortions facing firms is captured by a dummy variable
that takes 1 for firms in the fourth quintile of the distribution of distortions, i.e. firms facing a
high level of distortions. Firm size is captured by four categorical variables based on the
number of permanent employees: Micro-firms (1 to 10), Small (11 to 50), Medium (51 to 200),
and Large (more than 200).
The findings reported in Table 4 confirm the existence of conditional effects of reforms.
Contrary to our expectations, being connected to the foreign market does not generate specific
labor productivity gains from reforms. The estimated coefficients are positive (except for the
real sector reform) but not statistically significant. Also, we find that financially-included firms
benefit less from financial reforms. The estimated coefficient of the interaction term is negative
and statistically significant at the 1 percent level. Being financially included reduces the
productivity gain from financial reforms by 0.135 percentage point for a one standard deviation
increase in financial reforms. Moreover, financial access also strengthens the impact of fiscal
reforms on firms’ productivity. The coefficient associated with the interaction term between
financial access and fiscal reform is positive and statistically significant at the 1 percent level.
The magnitude of productivity gain is 0.089 for a one standard deviation increase in fiscal
reforms. These findings suggest that financial sector reforms in developing countries help
financially excluded firms to have better access to finance, thereby boosting their productivity.
Regarding the additional gains from fiscal reforms for firms having access to finance, the
findings suggest that fiscal reforms seem to open access to a new source of financing. Fiscal
reforms such as debt management could lower borrowing rate spreads for firms having access
to finance and enable the local currency financial market to function properly. In addition,
other reforms such as tax reforms could increase the efficiency of the banking or financial
system as these could reduce uncertainty and intertemporal incoherence.
As expected, the effects of fiscal reforms on labor productivity gain are hindered by distortions.
The more a firm faces distortions in the business environment, the less are productivity gains
from fiscal reforms. The estimated coefficient of the interaction term is negative and
statistically significant at the 5 percent level. A one standard deviation increase in fiscal related
reforms raises firms’ productivity by 0.342 standard deviation. The cost of being a part of the

27
top 50 more distorted firms is 0.042 standard deviation decrease in productivity for a one
standard deviation increase in fiscal reforms, respectively. The findings suggest that facing
higher level of distortions, measured in this paper as the costs in the percentage of sales of
crime, insecurity, power outage and bribe paid “to get things done,” mitigates the effects of
fiscal reforms. The findings suggest that fiscal reforms may help to reduce distortions in a
business environment such as bribery activities. Consequently, firms using corruption to grease
the wheels of the business environment25 may be disadvantaged by these reforms, especially
anti-corruption policies.
Finally, regarding firms’ size, the evidence suggests that small firms benefit more from
financial reforms relative to the other ones. The estimated coefficient of the interaction term is
positive and statistically significant at 10 percent. Being a small firm improves labor
productivity growth gains from financial reforms by 0.038 standard deviation for one standard
increase in financial reforms. As pointed out by Atérido et al. (2011), small businesses have
less access to formal finance. Hence, financial reforms that aim at easing financial constraints
will impact small firms mostly.
In sum, financial, fiscal, real and trade reforms increase firm-level productivity in developing
countries. Factors such as financial access, distortions, and the size of firms play a conditional
role. The findings show that financial access and being a small firm enhance the impact of
financial reforms on firms’ productivity. The effect of fiscal reforms is improved by better
financial access while hindered by distortions. The effect of trade reforms on labor productivity
growth is also impaired by distortions in the business environment. We show in the appendices
that our findings are robust to alternative measures of productivity, methodologies, additional
control variables, and counterfactual experiment based on unsuccessful reforms.
25 See Herrera and Kouamé (2017) for more extensive discussion on firms using corruption to grease the wheels of the business environment.

28
Table 4. Impacts of specific reforms on productivity – Conditional factors
Financial sector reforms
Fiscal sector reforms
Real sector reforms Trade sector reforms
Conditional factor: Exporting firm dummy Reforms 0.376***
(0.0223) 0.342*** (0.022)
9.670*** (0.543)
0.266*** (0.017)
Reforms* Exporting firm dummy
-0.010 (0.013)
0.004 (0.018)
-0.003 (0.019)
0.001 (0.0192)
Exporting firm dummy 0.04367*** (0.0157)
0.0484*** (0.0180)
0.0493*** (0.0160)
0.0473*** (0.0163)
R-squared 0.2361 0.2361 0.2361 0.2361 Conditional factor: Financial access Reforms 0.505***
(0.040) 0.261*** (0.0401)
9.678*** (0.566)
0.220*** (0.0342)
Reforms* Financial access
-0.135*** (0.0414)
0.0891*** (0.0323)
-0.007 (0.04593)
0.0514 (0.0376)
Financial access 0.0492*** (0.0163)
0.0484*** (0.0162)
0.0491*** (0.0164)
0.0491*** (0.0164)
R-squared 0.2368 0.2370 0.2360 0.2361 Conditional factor: Distortions Reforms 0.358***
(0.0268) 0.374*** (0.0224)
9.635*** (0.579)
0.271*** (0.0193)
Reforms* Distortions 0.0133 (0.0111)
-0.0424** (0.0170)
-0.0150 (0.0219)
-0.0101 (0.0138)
Distortions 0.0377 (0.0359)
0.0573 (0.0573)
0.0055 (0.0301)
0.0213 (0.0529)
R-squared 0.2362 0.2372 0.2362 0.2361 Conditional factor: Small firms Reforms 0.341***
(0.0334) 0.353*** (0.0484)
9.634*** (0.529)
0.282*** (0.055)
Reforms* Small firms 0.0375* (0.0225)
-0.0282 (0.0417)
0.0267 (0.0409)
-0.0180 (0.0393)
Small firms -0.290*** (0.0382)
-0.294*** (0.0382)
-0.285*** (0.0448)
-0.295*** (0.0386)
R-squared 0.2364 0.2370 0.2361 0.2361
Observations 10,822 10,822 10,822 10,822 Control variables YES YES YES YES Country FE YES YES YES YES Sector FE YES YES YES YES Year FE YES YES YES YES Notes: The table presents standardized coefficients of the effects of reforms on firm-level labor productivity growth using a multilevel mixed effects model. All estimates use the weights and are standardized so that can be compared across structural reforms. Robust standard errors clustered at the country level are in parentheses. ***, **, * denote significance at the 1, 5, and 10 percent level.

29
C. Complementarities between reforms
In this section, we assess whether structural reforms have substitutable or complementarity
effects on productivity. Documenting the complementarity between reforms would help the
design of the reform package when preserving productivity growth potential is at the core of
policy recommendations. Complementarity and sequencing are vital issues while
implementing several policies. As pointed out by Dewatripont and Roland (1995) and
Hausmann et al. (2005), the success of implementation might depend on the order of reforms.
Dewatripont and Roland (1995) suggest prioritizing political feasibility, and Hausmann et al.
(2005) recommend targeting the most binding constraints. For instance, the effectiveness of
growth-friendly reforms could have mutually reinforcing effects. Complementary reforms,
such as trade liberalization or real sector reform (labor and product market reforms) could
enhance the impact of fiscal reforms by promoting savings, stimulating investment, and
unlocking productivity gains.
To analyze potential substitutability and complementarity between reforms, we estimate a
modified version of equation (5) by introducing interaction terms between reforms:
, ∗ (8)
, 1,2,34
where refers to labor productivity growth, , and two different
reforms among financial, fiscal, real and trade sector reforms, and ∗
the interaction term between them. The coefficient captures the complementarity effect. The
latter is expected to be positive if two reforms have mutually reinforcing effects
(complementarity effects) and negative if the reforms have mutually adverse effects
(substitutability effect). is expected to be statistically insignificant if the effects of the
reforms on firms’ productivity are independent. The potential complementarity among reforms
will be tested through six (6) equations, including each one-interaction theme between reforms.
Each equation is estimated with a multilevel model as described above and controls for firm-
level characteristics, macroeconomic variables as well as country-, sector-, and year-fixed
effects.
30
Results are reported in Table 5. Columns (1), (2), and (3) check whether financial reforms are
complementary with fiscal, real sector and trade sector reforms, respectively. Columns (4) and
(5) assess potentially complementary effects between fiscal, real, and trade sector reforms,
respectively. Finally, column (6) examines the potentially complementary effect between real
sector and trade sector reforms. We find that, except for financial and trade reforms, all
macroeconomic reforms considered are bilaterally complementary in improving firms’ labor
productivity growth. The coefficients associated with the interaction terms between reforms
are positive and statistically significant at 1 percent. Although the potential substitute
relationship between financial and trade reforms can be puzzling, it is explained by the stage
of development of the countries in the sample. At an early stage of development, finance may
not be a key determinant of the country’s ability to perform (Henderson et al., 2013).
Implementing financial reforms in that environment may not reinforce or hinder the effects of
trade reforms (or inversely) as the financial sector is still weakly developed.
These results imply that most of the macroeconomic reforms under IMF programs can be
implemented jointly to maximize their effects on the productivity of firms.

31
Table 5. Substitutable or complementary effects of structural reforms (1) (2) (3) (4) (5) (6)
Financial reform*Fiscal refom 0.213*** (0.0655)
Financial reform*Real sector reform
1.122*** (0.0357)
Financial reform*Trade reform -0.170*** (0.0407)
Fiscal reform*Real sector reform
0.341*** (0.0211)
Fiscal reform*Trade reform 0.288*** (0.0231)
Real sector *Trade reform 2.720*** (0.125)
Financial reform 0.0422 (0.0568)
0.994*** (0.0444)
-0.336*** (0.0239)
Fiscal reform 0.231*** (0.0912)
0.237*** (0.0281)
-0.892*** (0.162)
Real sector reform -5.239*** (0.282)
0.105 (0.108)
1.307*** (0.221)
Trade reform 0.630*** (0.0589)
0.533*** (0.0796)
-1.376*** (0.0914)
Observations 10,822 10,822 10,822 10,822 10,822 10,822 R-squared 0.2360 0.2360 0.2360 0.2360 0.2360 0.2360 Notes. The table presents standardized coefficients of the effects of reforms on firm-level labor productivity growth using a multilevel mixed effects model. The specifications include firm’s individual characteristics, sector and year fixed effects. At the macroeconomic level, the specifications include the average growth of GDP, the level of inflation, and the quality of policies and regulations related to the private sector and country fixed effects. All estimates use the weights and are standardized so that can be compared across structural reforms. Robust standard errors clustered at the country level are in parentheses. ***, **, * denote significance at the 1, 5, and 10 percent level.

32
V. ROBUSTNESS CHECKS
So far, the results are consistent with our hypothesis that reforms in developing countries
increase firm-level productivity with specific effects for firms facing high levels of distortions,
financially included firms and small firms. In the following, we perform a variety of sensitivity
analyses to check the robustness of the impacts of reforms on productivity. First, we account
for economic crisis context in order to distinguish the effects of reforms from the effects of
economic recovery. Second, we add additional control variables. Third, we check the
sensitivity of the findings using an alternative way of calculating the indexes of reforms.
Fourth, we check whether our results are robust using alternative measures of productivity.
Fifth, we investigate whether our results are robust to the use of an alternative methodology,
especially the Difference and Difference approach from Rajan and Zingales (1998) following
among others by Aghion et al. (2014). Finally, we use unsuccessful reforms as a counterfactual
experiment to validate the hypothesis of the positive impact of successful structural reforms
on productivity. Finally, we check the sensitivity of the findings using an alternative way of
calculating the indexes of reforms.
Crisis and economic recovery. First, the MONA database includes both reforms implemented
in a context of crisis (pre- and post-crisis reforms) and typical structural reforms, i.e., reforms
implemented outside a crisis context. In the crisis context, the increase in productivity might
be due to economic recovery and non-directly related to reforms implemented. From being
sluggish in a crisis context characterized by weak economic growth, the domestic demand
might be naturally restored and drive the increase in productivity. To ensure that the increase
in productivity is due to reforms and not to economic recovery, we assess the robustness of the
findings accounting for economic crisis context. The approach consists of identifying countries
that were officially in crisis before and after the period of the reforms based on Laeven and
Valencia’s (2012) database of crisis.26 Following Reinhart and Rogoff (2014), we consider that
economic recovery can influence productivity growth within eight years following the crisis.
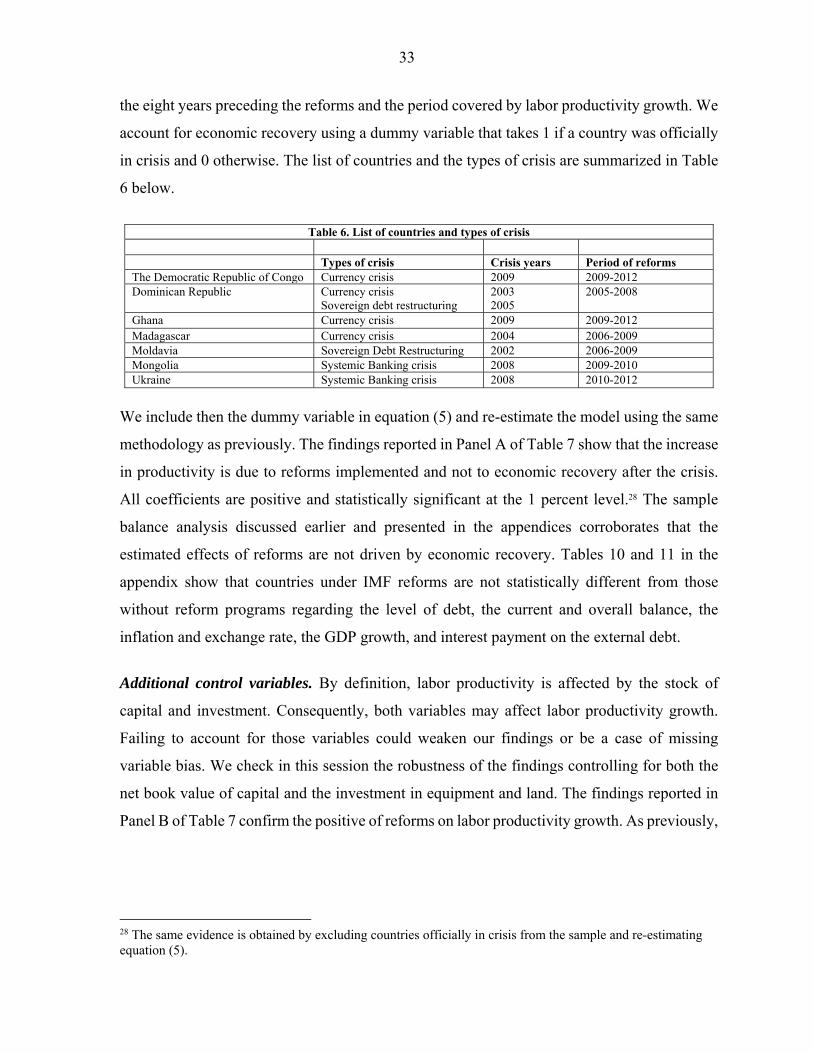
27 The crisis context analysis shows that only 7 countries of 30 were officially in crisis within
26 The database documents systemic banking crisis, currency crisis, and sovereign debt crisis (default and restructuring). 27 Reinhart and Rogoff (2014) show that it takes on average about eight years to reach the pre-crisis level of income.
33
the eight years preceding the reforms and the period covered by labor productivity growth. We
account for economic recovery using a dummy variable that takes 1 if a country was officially
in crisis and 0 otherwise. The list of countries and the types of crisis are summarized in Table
6 below.
Table 6. List of countries and types of crisis Types of crisis Crisis years Period of reforms The Democratic Republic of Congo Currency crisis 2009 2009-2012 Dominican Republic
Currency crisis Sovereign debt restructuring
2003 2005
2005-2008
Ghana Currency crisis 2009 2009-2012 Madagascar Currency crisis 2004 2006-2009 Moldavia Sovereign Debt Restructuring 2002 2006-2009 Mongolia Systemic Banking crisis 2008 2009-2010 Ukraine Systemic Banking crisis 2008 2010-2012
We include then the dummy variable in equation (5) and re-estimate the model using the same
methodology as previously. The findings reported in Panel A of Table 7 show that the increase
in productivity is due to reforms implemented and not to economic recovery after the crisis.
All coefficients are positive and statistically significant at the 1 percent level.28 The sample
balance analysis discussed earlier and presented in the appendices corroborates that the
estimated effects of reforms are not driven by economic recovery. Tables 10 and 11 in the
appendix show that countries under IMF reforms are not statistically different from those
without reform programs regarding the level of debt, the current and overall balance, the
inflation and exchange rate, the GDP growth, and interest payment on the external debt.
Additional control variables. By definition, labor productivity is affected by the stock of
capital and investment. Consequently, both variables may affect labor productivity growth.
Failing to account for those variables could weaken our findings or be a case of missing
variable bias. We check in this session the robustness of the findings controlling for both the
net book value of capital and the investment in equipment and land. The findings reported in
Panel B of Table 7 confirm the positive of reforms on labor productivity growth. As previously,
28 The same evidence is obtained by excluding countries officially in crisis from the sample and re-estimating equation (5).

34
the real sector reforms are the most impactful following by financial sector reforms, fiscal
reforms, and trade reforms respectively.
Measuring structural reform: the “min-max” approach. The third robustness check involves
an alternative way of calculating structural reform indexes. We re-compute the reform indexes
based on the “min-max” approach as follows: ,
,. is the total
number of reforms met or met with a minor delay in country c. , and , are,
respectively, the minimum and the maximal total number of the 3-year successful reforms in
year t. We then re-estimate equation (5) using the min-max reform indexes. The results,
reported in Table 7, Panel C, strongly corroborate the baseline findings. All coefficients are
positive and statistically significant at the 1 percent level. In developing countries, structural
reforms at the macroeconomic level increase firms’ productivity with a larger impact of real
sector reforms.
Alternative measures of productivity. As discussed previously, the paper takes advantage of
the dynamic aspect of labor productivity to capture the impact of reforms on productivity.
However, one may wonder whether the findings are robust using alternative measures of
productivity. We explore in this section the robustness of the findings using value added per
worker and total factor productivity as alternative measures of productivity.
Value Added (VA) per worker. The value added per worker is one of the standard
measures of productivity in the literature. The value-added is computed as the annual sales
minus the costs of raw materials and energy. The difference is normalized by the number of
employees in order to obtain the value added per worker. The findings reported in Panel D of
Table 7 confirm the positive impacts of reforms on productivity. All the individual reforms
considered in this paper have a positive impact on the value added per worker.
Total Factor Productivity. Second, we use the TFP concept as an alternative measure
of productivity at the firm level. TFP has the advantage to account for the technology of
production and the level of capital but could not be applied in our sample to capture the

35
dynamics of productivity gains29; hence our preference for labor productivity growth.
Nevertheless, we test whether our results hold with TFP. We derive TFP from a Cobb-Douglas
production function with the following technology . refers to the gross
output of firm in sector in country during the previous fiscal year with and denoting
capital and labor, respectively. Using the natural logarithm, production could be specified as
follows: . is the natural logarithm of output at
the end of the previous fiscal year; and represent the natural logarithm of the net book
value of capital and the total permanent full-time employees (labor) at the end of the previous
fiscal year.30 captures unobservable productivity shocks; and is an independent and
identically distributed shock, which does not affect firm decision. Estimating the TFP at the
firm level is challenging because of the potential correlation between productivity shocks and
inputs. Firms facing a positive productivity shock could respond by using higher levels of
inputs. Following Levinshon and Petrin (2003)31 and Saliola and Seker (2012), we tackle this
potentially endogenous issue by using the cost of energy as a proxy of unobservable
productivity shock.32 The TFP is estimated as the residual from the production function based
on the following equation: ≅ ; where , , and are
the estimated coefficients from equation (5). Results reported in Table 7, Panel E, confirm that
in developing countries, financial, fiscal, real sector, and trade reforms at the macroeconomic
level increase firms’ productivity. All coefficients associated with structural reforms are
positive and statistically significant at the 1 percent level. As previously shown, real sector
reform has the greatest impact on productivity gains at the firm level.
29 As discussed above, information on previous netbook value of capital is missing in the WBES. We are therefore unable to compute the lag of TFP. 30 The WBES database is a pseudo-panel that does not report previous information on the net book of capital. We are, therefore, unable to compute the growth of TFP between −1 and −3. Firm-level TFP are, therefore, calculated for a specific year. 31 A robust application of the TFP approach from Levinsohn-Petrin requires panel data. However, we apply the intuition using the costs of energy as a proxy of unobservable productivity shocks. 32 We are grateful to Frederica Saliola for sharing this paper.

36
Table 7. Robustness checks Financial reforms Fiscal reforms Real sector reforms Trade reforms
Panel A: Accounting for the effects of economic recovery Reforms 0.986***
(0.0344) 0.429*** (0.0150)
10.74*** (0.375)
0.342*** (0.0120)
Dummy - crisis -2.651*** (0.0630)
-0.393*** (0.0259)
-0.176*** (0.0318)
-0.453*** (0.0244)
Observations 10,822 10,822 10,822 10,822 R-squared 0.2360 0.2360 0.2360 0.2360
Panel B: Additional control variables Reforms 0.244***
(0.063) 0.227*** (0.0432)
6.390*** (1.212)
0.176*** (0.033)
Log. Net book value of capital
0.020*** (0.006)
0.018*** (0.006)
0.018*** (0.06)
0.018*** (0.003)
Log. Investment in capital
0.005 (0.005)
0.005 (0.006)
0.005 (0.005)
0.005 (0.005)
Observations 2880 2880 2880 2880 R-squared 0.3470 0.3470 0.3470 0.3470
Panel C: min-max index Reforms 0.282***
(0.0159) 0.671*** (0.0378)
2.043*** (0.115)
0.253*** (0.0143)
Observations 10,822 10,822 10,822 10,822 R-squared 0.2360 0.2360 0.2360 0.2360
Panel D: Value Added per worker Reforms 0.116***
(0.007) 0.125*** (0.008)
3.264*** (0.210)
0.0898*** (0.006)
Observations 9. 942 9. 942 9. 942 9. 942 R-squared 0.80 0.80 0.80 0.80
Panel E: Total factor productivity Reforms 0.122***
(0.0271) 0.114*** (0.0253)
3.204*** (0.709)
0.0882*** (0.0165)
Observations 4,965 4,965 4,965 4,965 R-squared 0.3398 0.3398 0.3398 0.3398 Notes: The table presents standardized coefficients of the effects of reforms on firm-level labor productivity growth (Panels A, B, C), value added per worker (Panel D), and Total factor productivity (Panel E) using a multilevel mixed effects model. The specifications include firm’s individual characteristics, sector and year fixed effects. At the macroeconomic level, the specifications include the average growth of GDP, the level of inflation, and the quality of policies and regulations related to the private sector and country fixed effects. All estimates use the weights and are standardized so that can be compared across structural reforms. Robust standard errors clustered at the country level are in parentheses. ***, **, * denote significance at the 1, 5, and 10 percent level.

37
Difference-in-difference approach. Finally, we investigate whether our results are robust to
the use of the difference-in-difference methodology as suggested by Rajan and Zingales
(1998). So far, we use a multilevel model to capture both the between and within country
effects of reforms on firms’ productivity. However, some might be concerned as to whether
our findings are driven by the methodology used. To allay such concerns, we re-estimate the
model using the difference-in-difference approach. The empirical model could be specified as
follows:
∗ , , (9)
and are full sets of industry and country dummies which helps to control for unobserved
heterogeneity across industries and across countries; and are the
conditional factors and firms’ individual characteristics, respectively, as described previously.
Equation (9) is estimated for each reform with a simple OLS procedure. Results are reported
in Table 8. All interaction terms between reforms and exposure variables are statistically
significant. As previously, firms with financial access benefit less from financial reforms while
the latter benefit more from fiscal reforms; productivity gains from fiscal reforms are lower for
firms facing significant distortions.
Table 8. Impacts of specific reforms on productivity – Alternative methodology Financial sector
reforms Financial sector reforms
Fiscal reforms Fiscal sector reforms
Conditional factor: Financial access
Conditional factor: Small firms
Conditional factor: Distortions
Conditional factor: Financial access
Reforms* Conditional factor
-0.103** (0.0452)
0.0358 (0.0216)
-0.0450*** (0.0160)
0.831** (0.0236)
Conditional factor 0.001 (0.0147)
-0.292*** (0.0347)
0.0656 (0.0147)
0.009 (0.0142)
Observations 11,807 11,807 11,807 11,807 R-squared 0.221 0.220 0.221 0.221 Firms Controls YES YES YES YES Country FE YES YES YES YES Sector FE YES YES YES YES Year FE YES YES YES YES The table presents standardized coefficients of the effects of reforms on firm-level labor productivity growth using an OLS model. The specifications include firm’s individual characteristics, sector and year fixed effects. Estimates include country fixed effects. All estimates use the weights and are standardized so that can be compared across structural reforms. Robust standard errors clustered at the country level are in parentheses. ***, **, * denote significance at the 1, 5, and 10 percent level.

38
Unsuccessful reforms. So far, our indexes of reforms consider only successful reforms. This
can be problematic as one might wonder whether the findings allow drawing the strong
conclusion that structural reforms matter for labor productivity growth. Although it is difficult
to find a perfect counterfactual in economics, the MONA database provides an opportunity to
explore the impact of unsuccessful reforms. If the hypothesis that successful reforms raise
productivity holds, we should expect unsuccessful reforms to have no impact or a negative
impact on productivity. This section examines the impact of reforms not met on labor
productivity growth using the same sectorial categorization of reforms as in Table 1 and the Z-
score approach described in section III to compute an index of unsuccessful reforms. The
estimation strategy and control variables are similar to those described in the baseline analysis.
The findings reported in Table 9 below seem to reinforce the conclusion that successful
structural reforms matter for labor productivity growth. As can be seen, unsuccessful financial
and real sector reforms have negative impacts on productivity. A one standard deviation
increase in unsuccessful reforms in financial and real sector reforms decreases labor
productivity growth by 1.121 and 3.975 standard deviation respectively. In both cases, the
estimated coefficients are highly significant at the 1 percent level. On the opposite,
unsuccessful fiscal and trade reforms seem to have a positive impact on labor productivity
growth. However, the estimated coefficient for trade reforms is barely significant at the 10
percent level. Although the findings on fiscal reforms might appear counterintuitive, the high
proportion of successful fiscal reforms implemented in parallel might drive it. The externality
effects of successful fiscal reforms might drive the positive and significant coefficient.
Table 9. Impact of unsuccessful on labor productivity growth
Financial reforms Fiscal reforms Real sector reforms Trade reforms Reforms -1.121***
(0.091) 0.705*** (0.044)
-3.975*** (0.308)
0.115* (0.060)
Observations 5,126 8,347 7,987 2,615
R-squared 0.2376 0.2516 0.2535 0.1783
Notes: The table presents standardized coefficients of the impacts of reforms Not Met on firm-level labor productivity growth. The specifications include firm’s individual characteristics, sector and year fixed effects. At the macroeconomic level, the specifications include the average growth of GDP, the level of inflation, and the quality of policies and regulations related to the private sector and country fixed effects. All estimates use the weights and are standardized so that can be compared across structural reforms. Robust standard errors clustered at the country level are in parentheses. ***, **, * denote significance at the 1, 5, and 10 percent level.

39
VI. CONCLUDING REMARKS
Structural reforms are at the core of policy advice to developing countries. Reforms are
expected to ensure a sound macroeconomic and non-distortionary environment, improve
productivity, deliver sustainable and inclusive growth, and raise long-term living standards.
Several papers have analyzed the issue at the macroeconomic level, but few have focused on
the transmission from macroeconomic reforms to the firm level productivity in developing
countries.
This paper takes advantage of original data sets (structural reforms from the IMF and enterprise
surveys from the World Bank) and examines the impact of structural reforms at the
macroeconomic level on firms’ productivity. Structural reforms computed from the IMF
Monitoring of Fund Arrangements (MONA) database are based on conditionalities
implemented (met as planned and met with minor delay) under IMF-supported arrangement
programs. Using the economic description of each reform, we regroup reforms into four
different classes: financial, fiscal, real sector, and trade reforms. Firms’ characteristics and
productivity measures are culled from the World Bank Enterprise Surveys (WBES) database.
The paper finds strong evidence that structural reforms are associated with productivity
improvement in developing countries. All structural reforms considered in this paper
(financial, fiscal, real sector, and trade reforms) have positive effects on firms’ productivity.
Interestingly, the real sector reform turns out to be the reform with the most sizable impact on
firms’ productivity. In addition, being a “strong reformer” is associated with higher
productivity gains. Furthermore, the relationship between structural reforms and firms’
productivity is nonlinear and influenced by certain firm characteristics, such as financial
access, whether facing a distortionary environment, and size. We find that financial inclusion
strengthens the impact of financial and fiscal reforms on firms’ productivity; being a small
firm enhances the impact of financial reforms on firms’ productivity; and the effects of fiscal
and trade reforms on firms’ productivity are hindered by distortions. Finally, we find that,
except for financial and trade reforms, all macroeconomic reforms considered are bilaterally
complementary in improving firms’ productivity.
40
In sum, we find that structural reforms are key to stimulate firms’ productivity in developing
countries. The design of reforms should be comprehensive and account for complementarities
and nonlinearities between reforms. The standardized WBES data set used in this paper focuses
only on the formal sector, while in low and low middle-income countries, an important share
of the labor force works in the informal sector. Our findings capture, therefore, the productivity
gain from reforms in the formal sector. As both the informal and formal sectors are interrelated
in developing countries, we should expect the gains from reforms to spread over the informal
sector through the externality effects and potential encouragement for informal firms to move
into the formal sector. Similarly, this paper does not account for structural reforms not
supported by IMF programs due to lack of data assessing successful reforms. However, our
findings on complementary factors let us suggest that the coexistence of an IMF supporting
program with other types of reforms will have a higher impact on labor productivity growth.

41
REFERENCES
Abiad, A., & Mody, A. (2005). Financial Reform: What Shakes It? What Shapes It? . The American Economic Review , 95(1), 66-88.
Abiad, A., Detragiache, E., & Tressel, T. (2008). A New Database of Financial Reforms. IMF Working Paper 08/266.
Aghion , P., Angeletos, G.-M., Banerjee, A., & Manova, K. (2010). Volatility and Growth: Credit Constraints and the Composition of Investment. Journal of Monetary Economics, 47, 246-265.
Aghion, P., Hémous, D., & Kharroubi, E. (2014). Cyclical Fiscal Policy, Credit Constraints, and Industry Growth. Journal of Monetary Economics, 62, 41-58.
Almeida, R., & Carneiro, P. (2009). Enforcement of Labor Regulation and Firm Size. Journal of Comparative Economics, 37, 28-46.
Arnold, M. J., Javorcik, B., Lipscomb, M., & Mattoo, A. (2015). Services Reform and Manufacturing Performance: Evidence From India . The Economic Journal, 126, 1-39.
Aterido, R., Hallward-Driemeier, M., & Pagès, C. (2011). Big constraints to small firms’ growth? Business environment and employment growth across firms. Economic Development and Cultural Change, 59(3), 609--647.
Bah, E.-h., & Fang, L. (2015). Impact of Business environment on output and Productivity in Africa. Journal of Development Economics, 114, 159-171.
Baldacci, E., Clements, B., Gupta, S., & Cui, Q. (2008). Social spending, human capital, and growth in developing countries. World Development, 36(8), 1317--1341.
Banerji, A., Lin, H. H., & Saksonovs, S. (2015). Youth unemployment in advanced Europe: Okun’s law and beyond. IMF.
Beck, T., Demirgüç-Kunt, A., & Maksimovic, V. (2005). Financial and legal constraints to growth: Does firm size matter? The Journal of Finance, 60(1), 137--177.
Berman, N., & Héricourt, J. (2010). Financial factors and the margins of trade: Evidence from cross-country firm-level data. Journal of Development Economics, 93(2), 206--217.
Bordon, A. R., Shirono, K., & Ebeke, C. (2016). When Do Structural Reforms Work? On the Role of the Business Cycle and Macroeconomic Policies. IMF Working Paper, 16/62.
Bouis, R., Causa, O., Demmou , L., Duval, R., & Zdzienicka, A. (2012). The Short-Term Effects of Structural Reforms. OECD Economics Department Working Papers No. 949.
Bourlès, R., Cette, G., Lopez, J., Mairesse, J., & Nicoletti, G. (2010). Do Product Market Regulations in Upstream Sectors Curb Productivity Growth?: Panel Data Evidence for OECD Countries. OECD Economics Department Working Papers, No. 791.
Buccirossi, P., Ciari, L., Duso, T., Spagnolo, G., & Vitale, C. (2009). Competition Policy and Productivity Growth: An Empirical Assessment. CEPR Discussion Papers No. 7470.
Christiansen, L., Schindler, M., & Tressel, T. (2013). Growth and structural reforms: A new assessment . Journal of International Economics, 89, 347-356.
Cottarelli, C., & Keen, M. (2012). Fiscal Policy and Growth: Overcoming the Constraints. In O. Canuto, & D. M. Leipziger , Ascent after Decline: Regrowing Global Economies after the Great Recession (pp. 83--133). The World Bank Group.
Dabla-Norris, E., Ho, G., & Kyobe, A. (2016). Structural Reforms and Productivity Growth in Emerging Market and Developing Economies. IMF Working Paper, 16/15.
Dewatripont, M., & Gerard, R. (1995). The Design of Reform Packages Under Uncertainty. The American Economic Review, 1207-1223.

42
Galindo, A. J., & Micco, A. (2007). Creditor Protection and Credit Response to Shocks . World Bank Economic Review , 21(3), 413-438.
Galindo, A., Schiantarelli, F., & Weiss. (2005). Does Financial Liberalization Improve the Allocation of Investment? Micro Evidence from Developing Countries. Journal of Development Economics, 83, 562-587.
Giannetti, M., & Ongena, S. (2009). Financial integration and firm performance: Evidence from foreign bank entry in emerging markets. Review of Finance, 13(2), 181--223.
Haltiwanger, J., & Davis, S. (1999). On the Driving Force Between Cyclical Movements in Employment and Job Reallocation. The American Economic Review, 89(2), 1234-1258.
Hausmann, R., Pritchett, L., & Rodrik, D. (2005). Growth Accelerations. Journal of Economic Growth, 10(4), 303-329.
Helpman, E., & Krugman, P. R. (1985). Market structure and foreign trade: Increasing returns, imperfect competition, and the international economy. MIT press.
Henderson, D., Papageorgiou, C., & Parmeter, C. (2013). Who Benefits from Financial Development? New Methods, New Evidence. European Economic Review, 63, 47-67.
Herrera, S., & Kouamé, W. A. (2017). Productivity in the Non-Oil Sector in Nigeria : Firm-Level Evidence. Policy Research working paper, no. WPS 8145.
Hox, J., Moerbeek, M., & van de Schoot, R. (2010). Multilevel analysis: Techniques and applications. Routledge.
IMF. (2015). Fiscal policy and long-term growth . IMF Policy Paper.
Kaufmann, D., Kraay, A., & Mastruzzi, M. (2011). The Worldwide Governance Indicators: Methodology and Analytical Issues. Hague Journal on the Rule of Law, 220-246.
Klapper, L., Laeven, L., & Rajan, R. (2006). Entry Regulation as a Barrier to Entrepreneurship . Journal of Financial Economics, 82, 591–629.
Kouamé, W., & Goyette, J. (2017). Tax Evasion in Africa and Latin American: The Role of Distortionary Infrastructures and Policies.
Krugman, P. (1988). Financing vs. Forgiving a Debt Overhang. Journal of Development Economics, 29(3), 253--268.
Laeven, L., & Valencia, F. (2012). Systemic banking crises database: An update. IMF Working Paper 12/163.
Larrain, M., & Stumpner, S. (2015). Capital account liberalization and aggregate productivity: The role of firm capital allocation.
Levinsohn, J., & Melitz, M. (2002). Productivity in a Differentiated Products Market Equilibrium. Unpublished manuscript.
Levinsohn, J., & Petrin, A. (2003). Estimating production functions using inputs to control for unobservables. Review of Economic Studies, 70(2), 317-341.
Melitz, M. J. (2003). The impact of trade on intra-industry reallocations and aggregate industry productivity. Econometrica, 71(6), 1695--1725.
Melitz, M. J., & Ottaviano, G. (2008). Market size, trade, and productivity. Review of Economic Studies, 75(1), 295--316.
Nicoletti, G., & Scarpetta, S. (2003). Regulation, productivity and growth: OECD evidence. Economic Policy, 18(36), 9--72.
Prati, A., Onorato, M. G., & Papageorgiou, C. (2013). Which reforms work and under what institutional environment? Evidence from a new data set on structural reforms. Review of Economics and Statistics, 95(3), 946 -- 968.

43
Pritchett, L. (2013). The rebirth of education: Schooling ain't learning. CGD Books.
Rajan, R. G., & Zingales, L. (1998). Financial Dependence and Growth. The American Economic Review, 88(3), 559--586.
Rajan, R. G., & Zingales, L. (2001). Financial systems, industrial structure, and growth. Oxford review of economic Policy, 17(4), 467--482.
Reinhart, C., & Rogoff, K. (2014). Recovery from Financial Crises: Evidence from 100 Episodes. The American Economic Review, 104(5), 50-55.
Saliola, F., & Seker, M. (2012). Measuring Total Factor Productivity using Micro-level Data from Entreprise Surveys. Entreprise Analyis Unit.
Spilimbergo, A., Prati, A., & Ostry, J. D. (2009). Structural reforms and economic performance in advanced and developing countries. IMF Working Paper, 16/268.
Topalova, P., & Khandelwal, A. (2011). Trade liberalization and firm productivity: The case of India. Review of Economics and Statistics, 93(3), 995--1009.
Trefler, D. (2004). The long and short of the Canada-US free trade agreement. The American Economic Review, 94(4), 870--895.
Tressel, T. (2008). Unbundling the effects of reforms. IMF Working Paper.
World Bank . (2013). World Development Report 2013: Jobs. World Economic Forum.
World Bank. (2016). An Assessment of the Investment Climate in NIgeria: The Challenge of Nigeria Private Sector.

44
APPENDICES
Appendix A – Sample balance checks
Table 10. Sample balance – Countries under program vs Countries not under program Countries not
under program Countries under program
p-value (diff 0)
Current account balance (% of GDP) -2.355 (24.378)
-4.986 (5.466)
0.257
Public debt (% of GDP) 79.01 (90.057)
67.67 (52.44)
0.191
Overall balance (% of GDP) -1.879 (9.328)
-2.513 (3.378)
0.466
Inflation rate (%) 14.005 (46.817)
7.644 (7.730)
0.166
GDP growth (%) 2.573 (5.338)
3.207 (4.344)
0.220
Official exchange rate (LCU per US $)) 139.105 (306.106)
337.3 (473.50)
0.613
Interest payment on external debt (% exports) 3.582 (5.523)
3.544 (2.706)
0.942
Notes: Public debt and fiscal balance data are from the World Economic Outlook 2017. The other variables are from the World Development Indicators. Standard errors in parentheses.
Table 11. Sample balance - Strong reformers vs Weak reformers
Top reformer Weak reformer p-value (diff 0) Current account balance (% of GDP) -4.568
(6.203) -5.389 (4.668)
0.429
Public debt (% of GDP) 66.94 (44.00)
68.34 (59.50)
0.3024
Overall balance (% of GDP) -2.448 (2.823)
-2.581 (3.902)
0.831
Inflation rate (%) 6.789 (6.500)
8.549 (8.826)
0.2454
GDP growth (%) 3.532 (4.342)
2.900 (4.357)
0.4130
Official exchange rate (LCU per US $)) 328.58 (368.24)
345.75 (559.52)
0.841
Interest payment on external debt (% exports) 3.779 (2.729)
3.317 (2.687)
0.357
Notes: Public debt and fiscal balance data are from the World Economic Outlook 2017. The other variables are from the World Development Indicators. Standard errors in parentheses.
Table 12. Impact of the structural reforms on labor productivity growth – Low Income Countries
Financial reforms Fiscal reforms Real sector reforms Trade reforms Reforms 1.475***
(0.0407) 0.438*** (0.0121)
5.432*** (0.150)
0.385*** (0.0106)
Observations 10,822 10,822 10,822 10,822
R-squared 0.2608 0.2608 0.2608 0.2608
Notes: The table presents standardized coefficients of the effects of reforms on firm-level labor productivity growth in Low Income Countries. The specifications include firm’s individual characteristics, sector and year fixed effects. At the macroeconomic level, the specifications include the average growth of GDP, the level of inflation, and the quality of policies and regulations related to the private sector and country fixed effects. All estimates use the weights and are standardized so that can be compared across structural reforms. Robust standard errors clustered at the country level are in parentheses. ***, **, * denote significance at the 1, 5, and 10 percent level.

45
Appendix B – List of countries and statistics
Table 13. Indexes of reforms by countries
Country Approval year End year Aggregate index of
reforms Fiscal reforms Financial reforms Trade reforms Real sector reforms
Afghanistan 2011 2014 -0.6117583 -1.362004 1.695302 -0.2988166 -0.5703603
Armenia 2005 2008 1.071619 1.239591 0.7974541 -0.6068032 -0.2633663
2009 2011 -0.7301394 -0.6306869 -0.0966838 -0.3278063 -0.8216249
Bangladesh 2003 2006 0.1596279 0.2731389 0.1791924 1.36533 -0.6276057
Bolivia 2003 2004 0.161249 0.1138408 0.971172 -0.6915562 -0.6716594
Bosnia and Herzegovina 2009 2012 -0.2526479 -0.103032 -0.0966838 -0.3278063 -0.8216249
Burkina Faso 2003 2006 0.2681517 1.457129 -1.070609 -0.5973788 -0.6276057
Burundi 2008 2011 1.604923 2.351658 -0.768036 -0.2988166 -0.5703603
Central African Republic 2006 2009 1.179827 1.611847 -0.544629 -0.3278063 -0.8216249
Congo, Rep. 2004 2007 0.9192942 1.964554 -0.7581587 -0.5973788 -0.0323602
Congo, Dem. Rep. 2009 2012 1.16401 1.925937 -0.5880653 -0.131852 -0.7319708
Djibouti 2008 2011 0.4113255 0.2295654 0.4636328 3.344147 -0.5703603
Dominican Republic 2005 2007 2.140975 1.338853 3.291972 -0.6068032 0.4801811
El Salvador 2009 2010 -1.20969 -1.065978 -1.174547 -0.363407 -0.6980247
Ethiopia 2009 2010 -0.9688852 -0.7626007 -0.9925742 -0.3278063 0.133477
Ghana 2003 2006 0.0511042 0.6114219 -0.4457083 -0.5973788 -0.3299829
2009 2012 0.9228674 1.113771 -0.768036 -0.2988166 0.7362494
Guatemala 2003 2004 -0.9372912 -0.7566683 -0.5873028 -0.5705534 -0.8791274
Honduras 2004 2007 0.0510605 -0.1155414 1.336038 -0.6915562 -0.6716594
2008 2009 -1.566127 -1.539762 -0.8655577 -0.6068032 -0.6351399
Kosovo 2010 2012 -1.327004 -1.026428 -0.9925742 -0.3278063 -0.8216249
Kyrgyz Republic 2005 2008 -0.2828995 -0.6463987 0.5895776 -0.6068032 0.1084074
Madagascar 2006 2009 -0.2828995 0.0484395 -0.8655577 0.4321579 -0.2633663
Malawi 2005 2008 -0.4967707 -0.2493483 -0.4498048 -0.6068032 -0.6351399
Mali 2004 2007 -0.5627232 -0.5339202 -0.9177791 0.6061228 0.8635321
Mauritania 2003 2006 -0.8312215 -0.48808 -1.069804 -0.5705534 -0.8791274
2010 2013 -0.7385685 -0.4416437 -0.3839962 -0.2264968 -0.3067944
Moldova 2006 2009 0.2161335 -0.3486109 1.005331 1.471119 0.1084074
2010 2013 0.2408115 0.4064064 0.1557156 -0.2988166 -0.5703603
Mongolia 2009 2010 -0.7301394 -0.7626007 -0.0966838 -0.3278063 0.133477
Nepal 2003 2006 -0.4567616 -0.3874089 0.0243646 -0.5018527 -0.4363659
Nicaragua 2002 2010 0.7088156 0.0521254 0.5896508 -0.5018527 1.188507
Niger 2005 2008 0.6438761 1.239591 -0.6576812 0.4321579 -0.2633663
Pakistan 2008 2010 -0.133275 0.0288818 -0.544629 -0.3278063 0.133477
Rwanda 2006 2009 0.0217124 0.0840037 0.3855484 -0.363407 -0.6980247
Senegal 2003 2006 -0.1659433 0.4422804 -1.070609 -0.5973788 -0.0323602
Tajikistan 2002 2005 -0.3829908 -0.065144 -0.4457083 -0.5973788 -0.3299829
2009 2012 -0.2707303 -0.6546399 -0.1522016 -0.2988166 1.171786
Tanzania 2000 2003 2.881218 3.003569 0.8602014 2.71838 0.321443
2007 2010 0.2248436 0.2927093 -0.0966838 -0.3278063 0.133477
Uganda 2006 2009 -0.7301394 -0.6306869 -0.0966838 -0.3278063 -0.8216249
Ukraine 2010 2012 -0.9688852 -1.026428 -0.544629 -0.3278063 1.088579
Yemen, Rep. 2010 2013 -1.327004 -1.158342 -0.9925742 -0.3278063 0.133477
Zambia 2008 2011 0.0119912 0.1040548 -0.0487214 -0.131852 -0.1886481
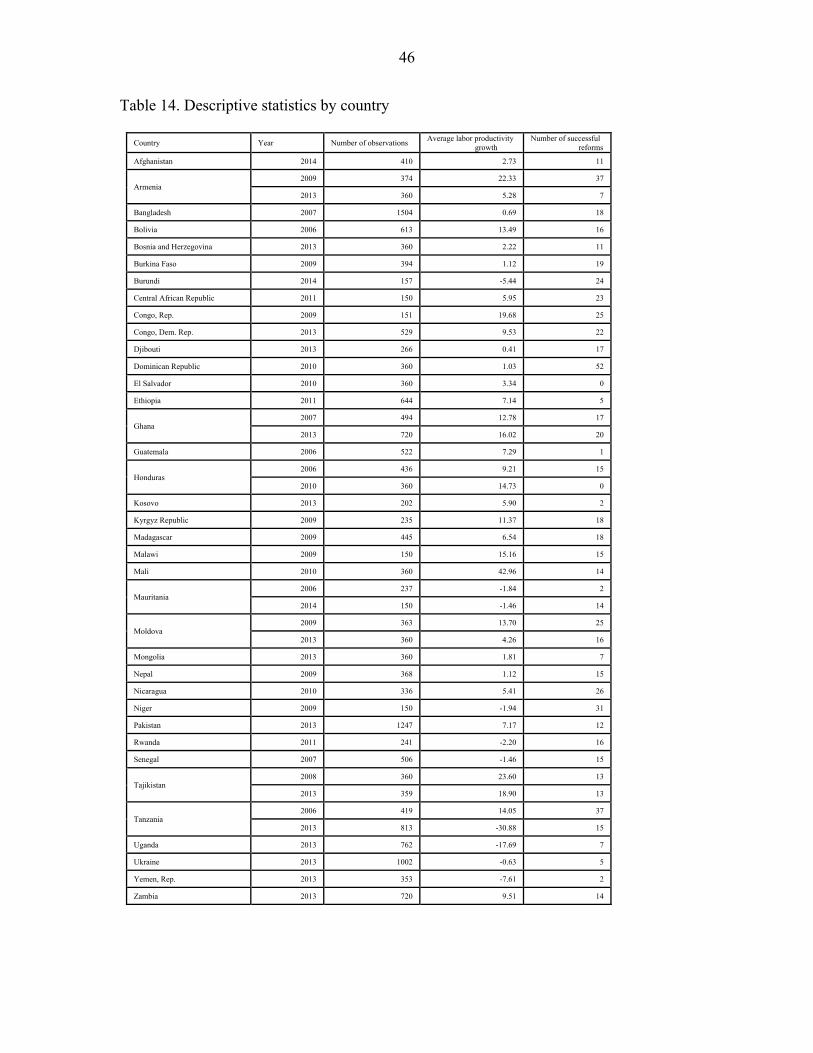
46
Table 14. Descriptive statistics by country
Country Year Number of observations Average labor productivity
growth Number of successful
reforms
Afghanistan 2014 410 2.73 11
Armenia 2009 374 22.33 37
2013 360 5.28 7
Bangladesh 2007 1504 0.69 18
Bolivia 2006 613 13.49 16
Bosnia and Herzegovina 2013 360 2.22 11
Burkina Faso 2009 394 1.12 19
Burundi 2014 157 -5.44 24
Central African Republic 2011 150 5.95 23
Congo, Rep. 2009 151 19.68 25
Congo, Dem. Rep. 2013 529 9.53 22
Djibouti 2013 266 0.41 17
Dominican Republic 2010 360 1.03 52
El Salvador 2010 360 3.34 0
Ethiopia 2011 644 7.14 5
Ghana 2007 494 12.78 17
2013 720 16.02 20
Guatemala 2006 522 7.29 1
Honduras 2006 436 9.21 15
2010 360 14.73 0
Kosovo 2013 202 5.90 2
Kyrgyz Republic 2009 235 11.37 18
Madagascar 2009 445 6.54 18
Malawi 2009 150 15.16 15
Mali 2010 360 42.96 14
Mauritania 2006 237 -1.84 2
2014 150 -1.46 14
Moldova 2009 363 13.70 25
2013 360 4.26 16
Mongolia 2013 360 1.81 7
Nepal 2009 368 1.12 15
Nicaragua 2010 336 5.41 26
Niger 2009 150 -1.94 31
Pakistan 2013 1247 7.17 12
Rwanda 2011 241 -2.20 16
Senegal 2007 506 -1.46 15
Tajikistan 2008 360 23.60 13
2013 359 18.90 13
Tanzania 2006 419 14.05 37
2013 813 -30.88 15
Uganda 2013 762 -17.69 7
Ukraine 2013 1002 -0.63 5
Yemen, Rep. 2013 353 -7.61 2
Zambia 2013 720 9.51 14