stress analysis lecture 4 me 276 spring...
TRANSCRIPT

Stress Analysis
Lecture 4
ME 276
Spring 2017-2018
Dr./ Ahmed Mohamed Nagib Elmekawy
Shear and Moment Diagrams
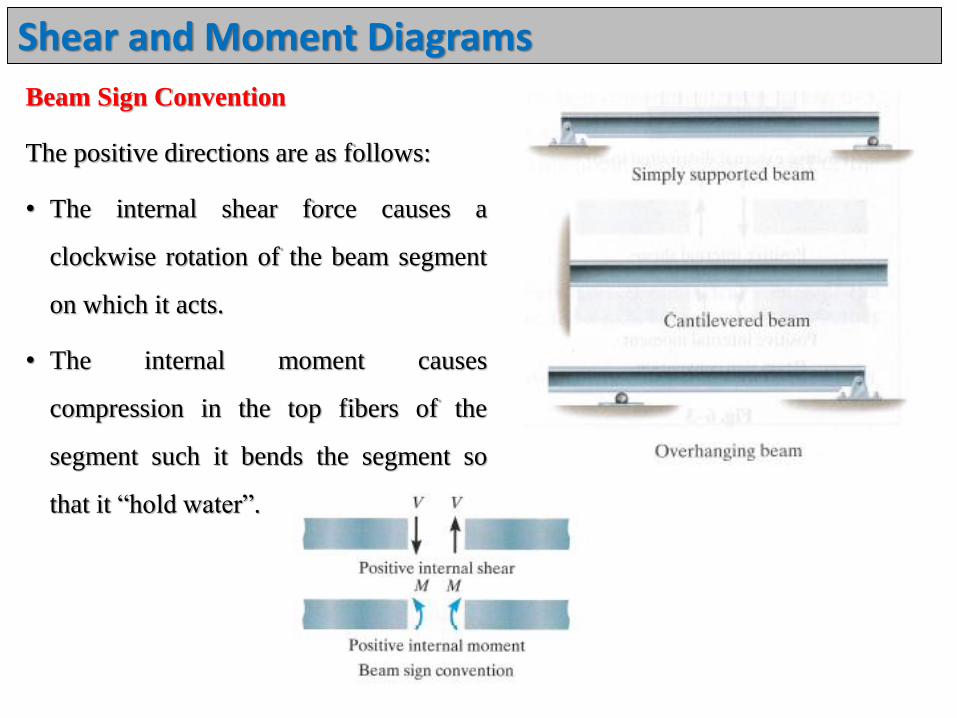
Beam Sign Convention
The positive directions are as follows:
• The internal shear force causes a
clockwise rotation of the beam segment
on which it acts.
• The internal moment causes
compression in the top fibers of the
segment such it bends the segment so
that it “hold water”.

Example 1
Draw the shear and moment diagrams for the beam shown in the attached figure.
)1(2
02
0
xL
wV
VwxwL
Fy
Shear and Moment Diagrams
)2(2
022
0
2xLxw
M
Mx
wxxwL
M

Shear and Moment Diagrams
8222
22
max
wLLLL
wM
dx
dMV
Note
Shear and Moment Diagrams
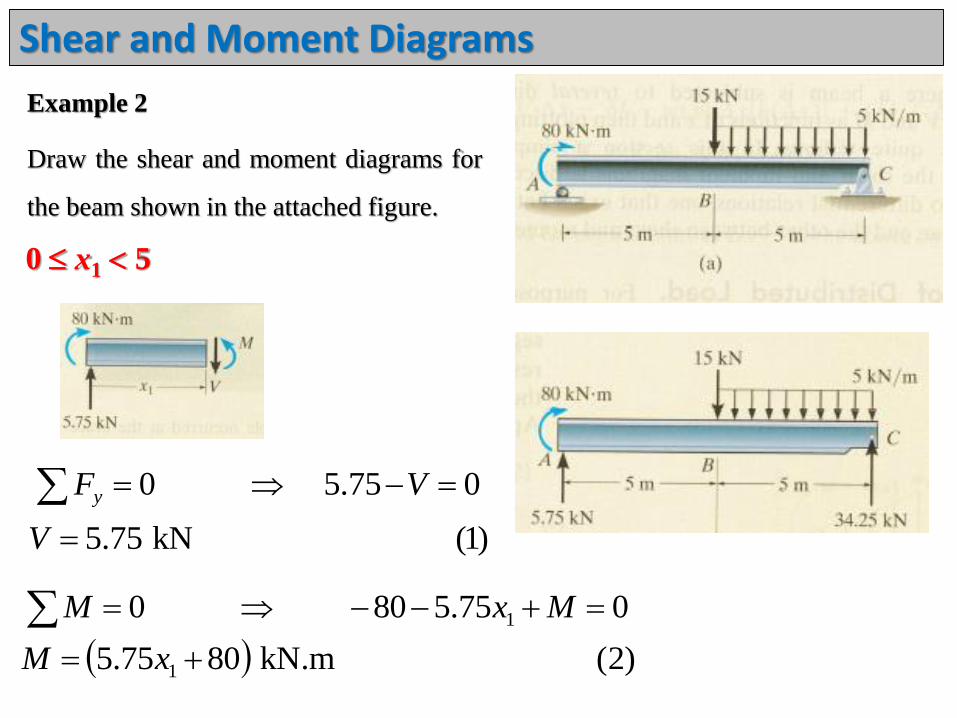
Example 2
Draw the shear and moment diagrams for
the beam shown in the attached figure.
0 x1 5
)1(kN75.5
075.50
V
VFy
)2(kN.m8075.5
075.5800
1
1
xM
MxM
Shear and Moment Diagrams
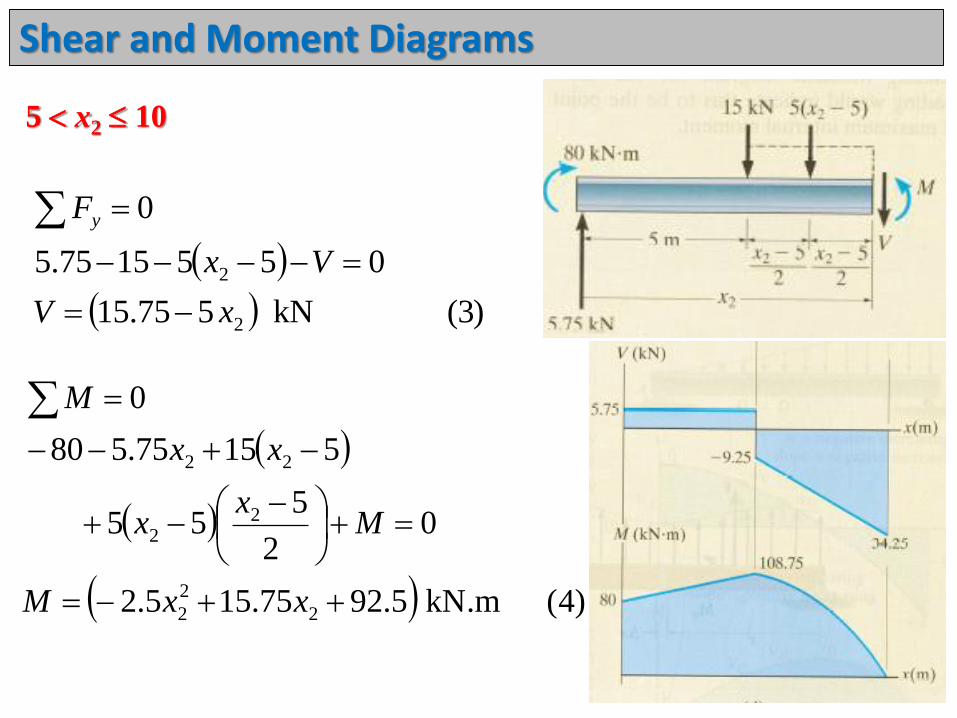
5 x2 10
)3(kN575.15
0551575.5
0
2
2
xV
Vx
Fy
)4(kN.m5.9275.155.2
02
555
51575.580
0
2
2
2
22
22
xxM
Mx
x
xx
M
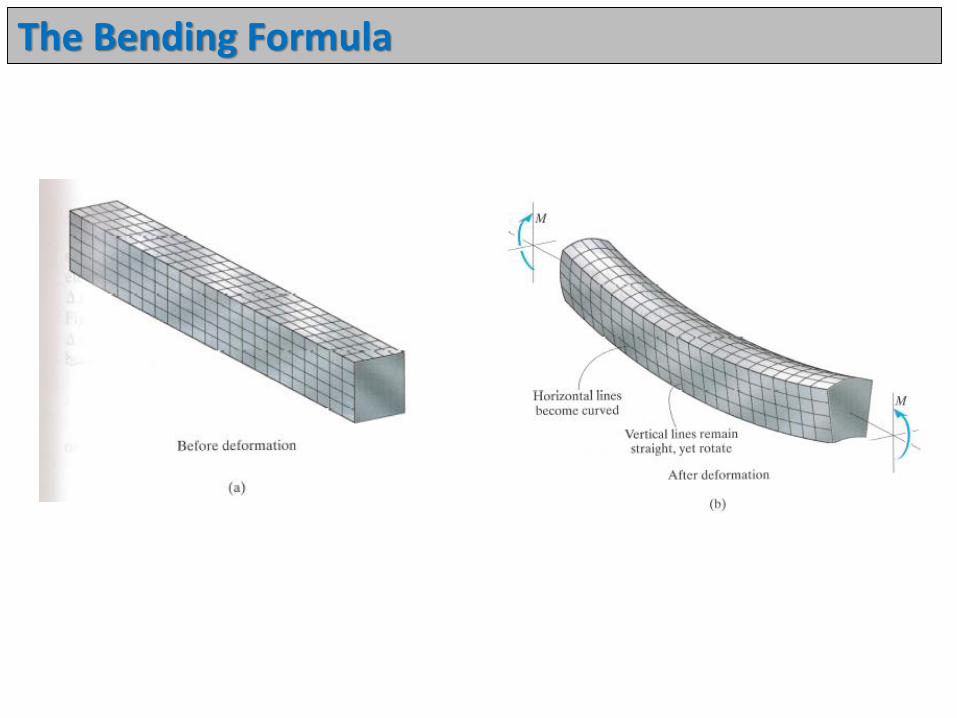
The Bending Formula
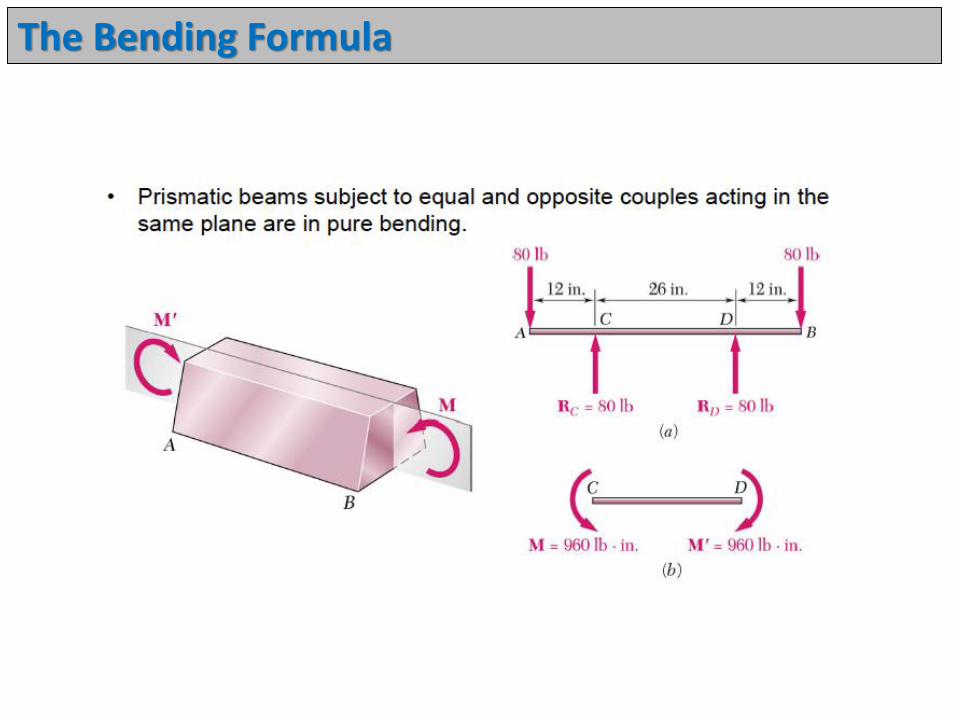
The Bending Formula

The Bending Formula
The Bending Formula
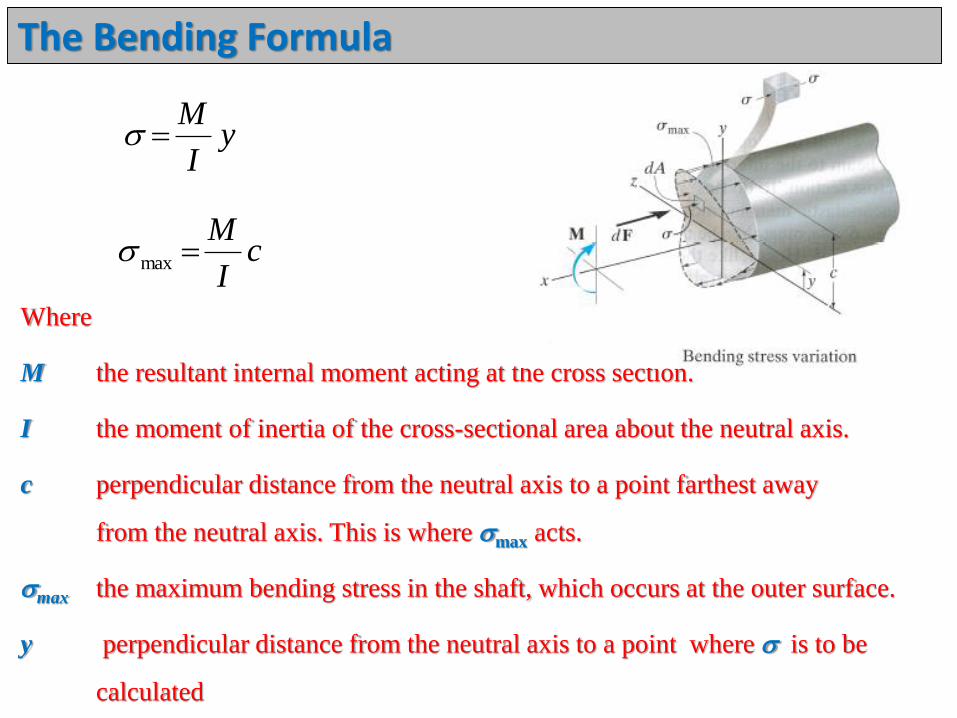
Where
M the resultant internal moment acting at the cross section.
I the moment of inertia of the cross-sectional area about the neutral axis.
c perpendicular distance from the neutral axis to a point farthest away
from the neutral axis. This is where max acts.
max the maximum bending stress in the shaft, which occurs at the outer surface.
y perpendicular distance from the neutral axis to a point where is to be
calculated
yI
M
cI
Mmax

Bending a Cantilever Beam under a Concentrated Load
11

Bending a Cantilever Beam under a Concentrated Load
12

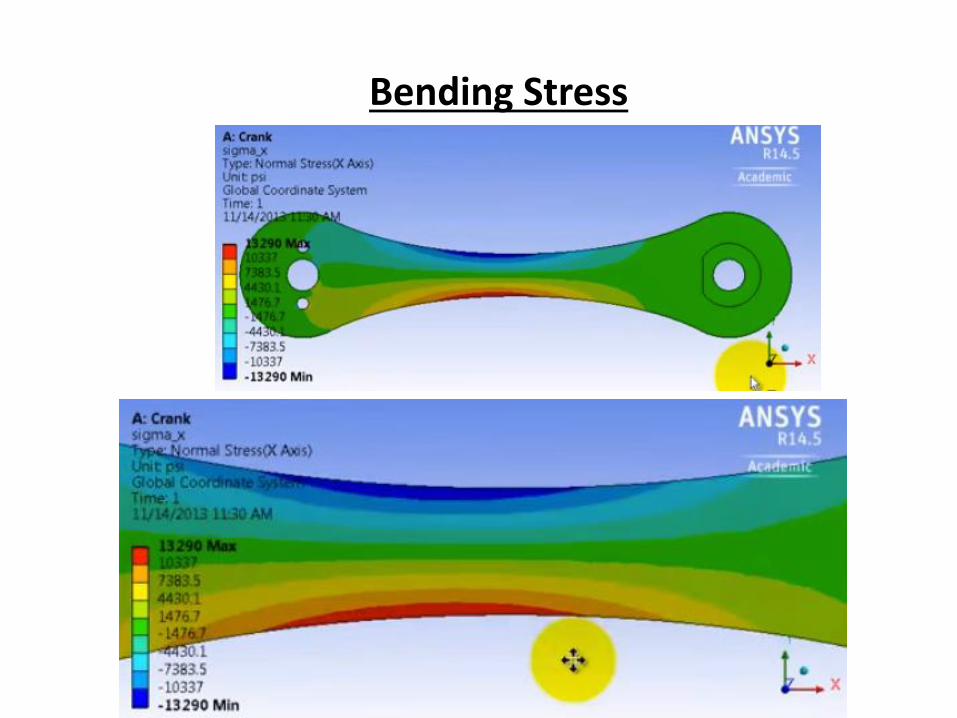
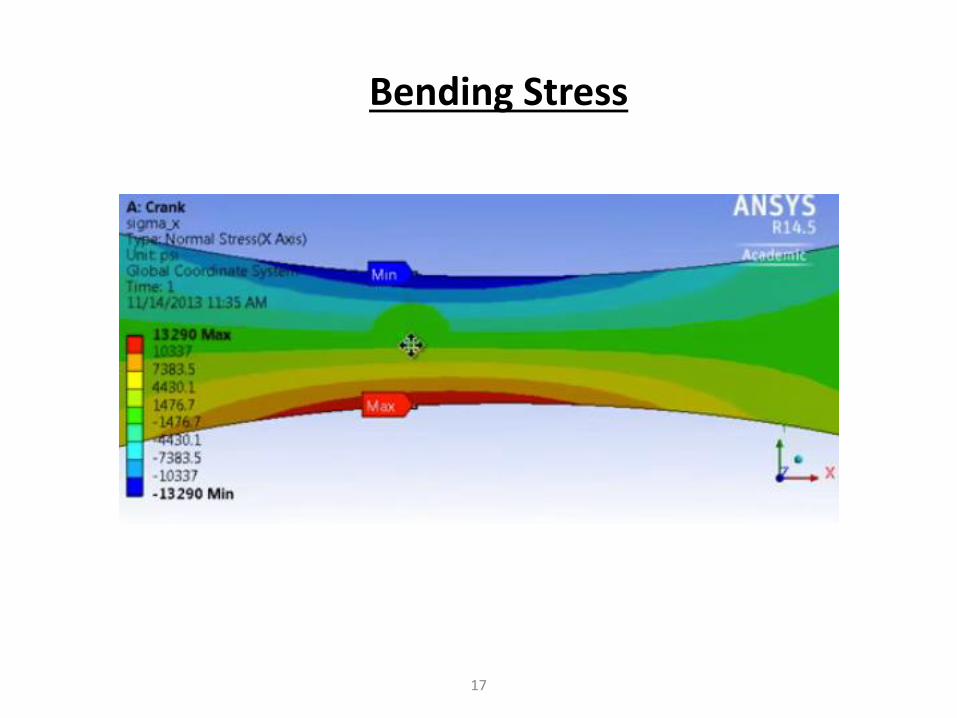
Bending Stress
13

Bending Stress
14
Bending Stress
15
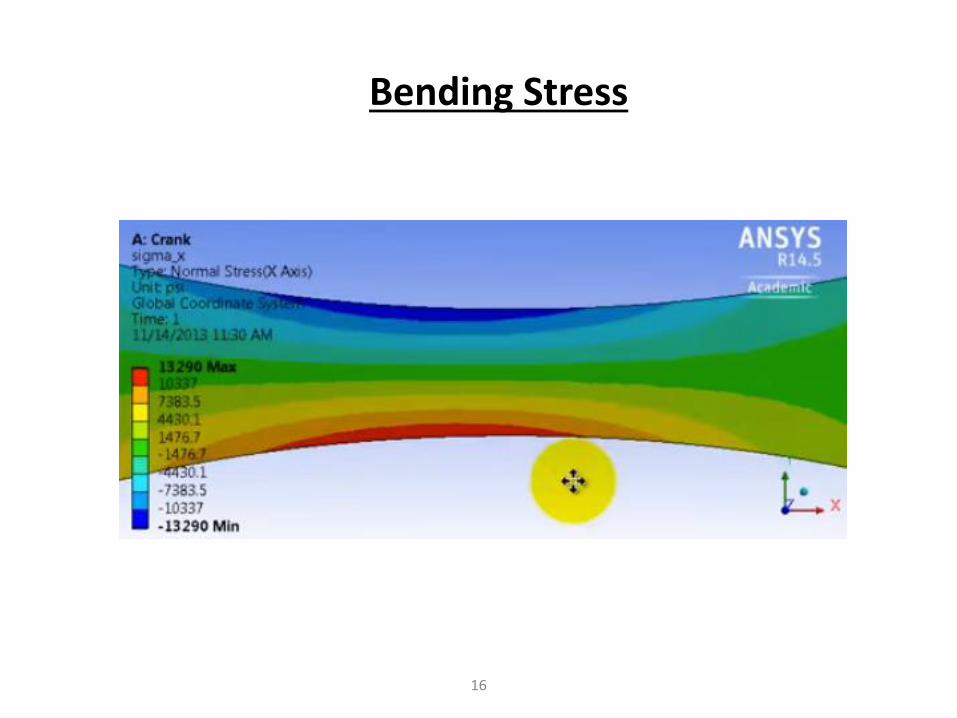
Bending Stress
16
Bending Stress
17
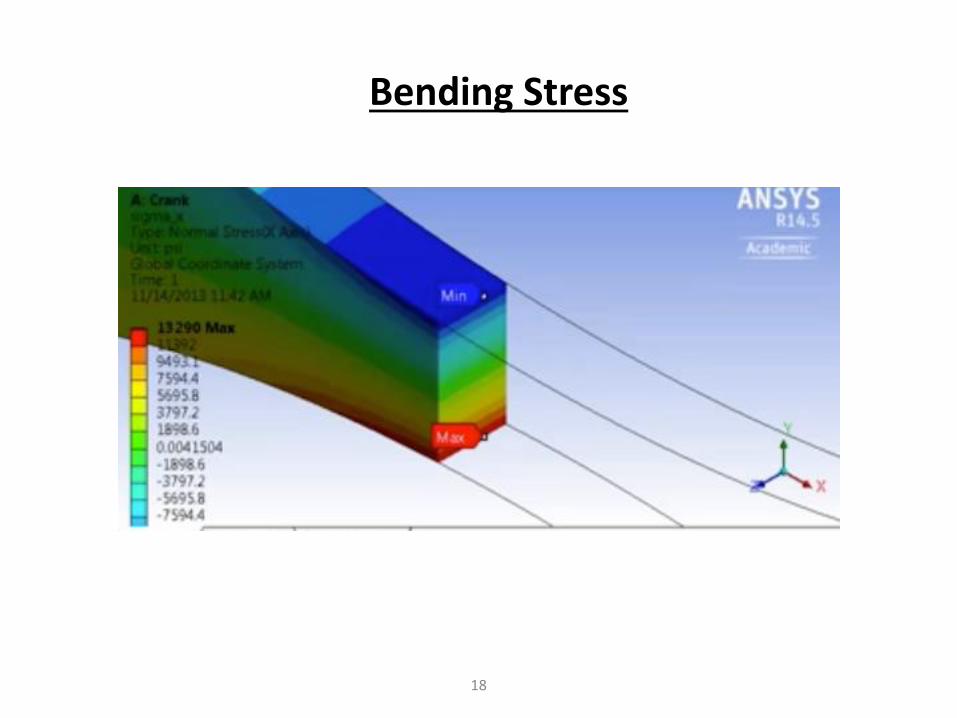
Bending Stress
18
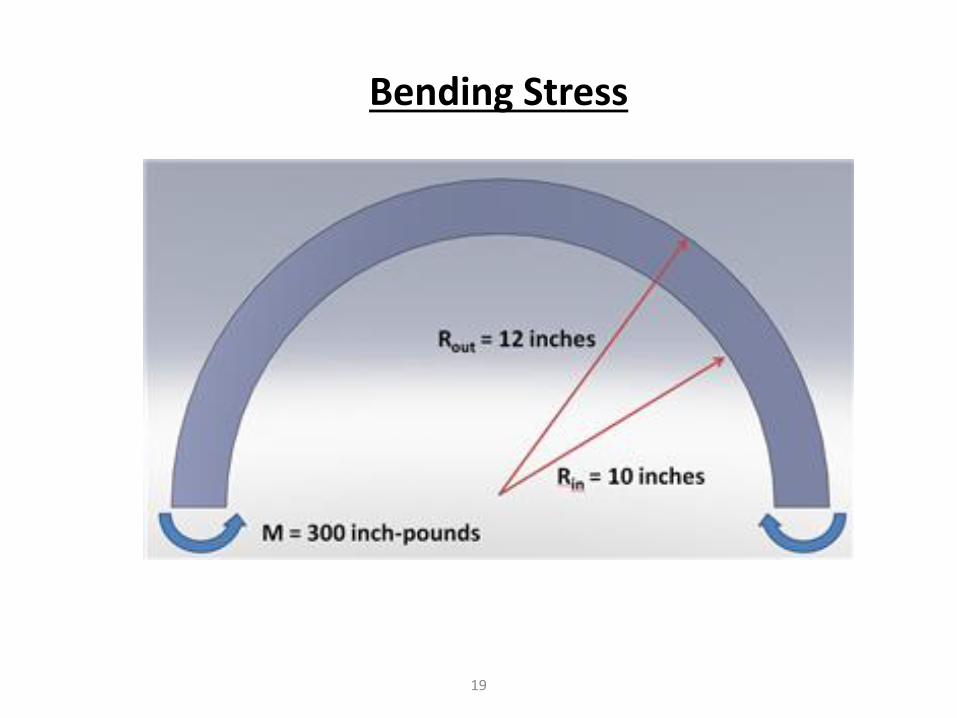
Bending Stress
19
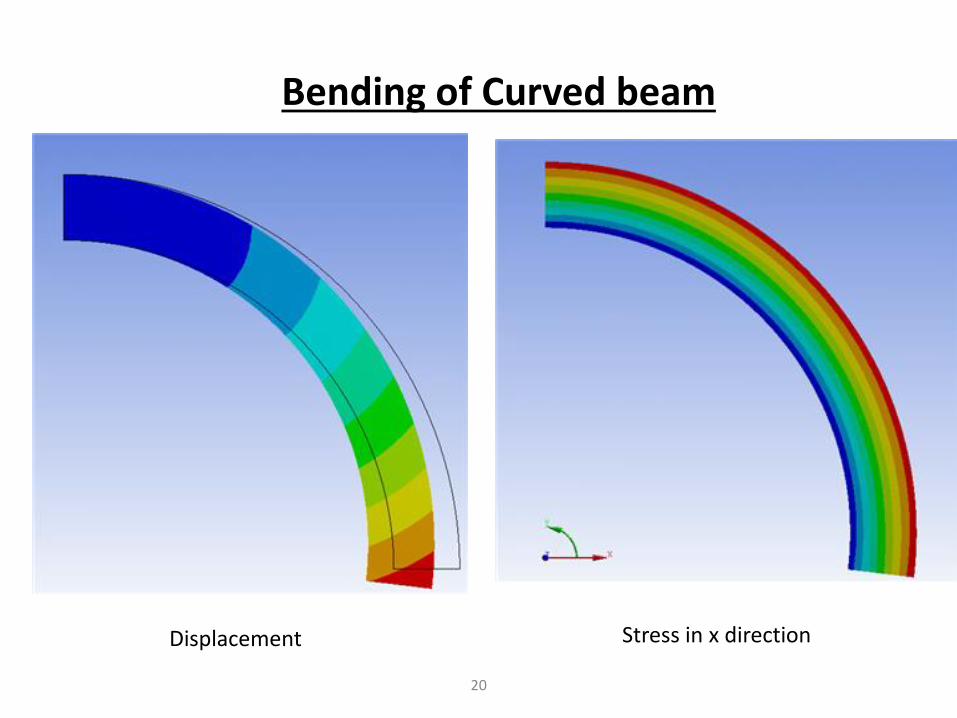
Bending of Curved beam
20
Displacement Stress in x direction
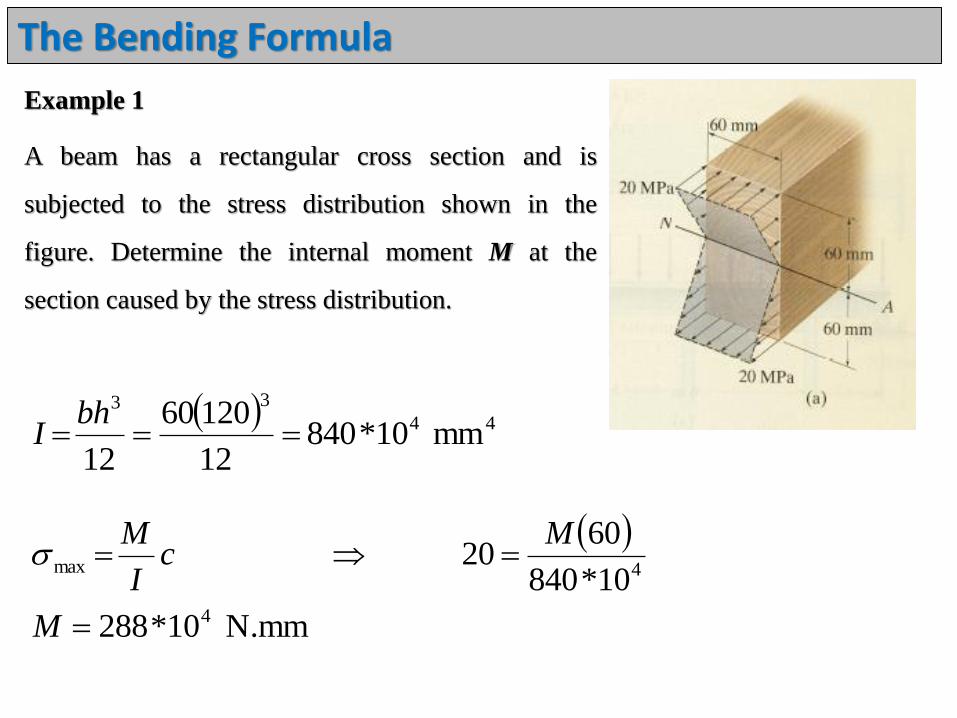
Example 1
A beam has a rectangular cross section and is
subjected to the stress distribution shown in the
figure. Determine the internal moment M at the
section caused by the stress distribution.
The Bending Formula
N.mm10*288
10*840
6020
4
4max
M
Mc
I
M
44
33
mm10*84012
12060
12
bhI

The Bending Formula
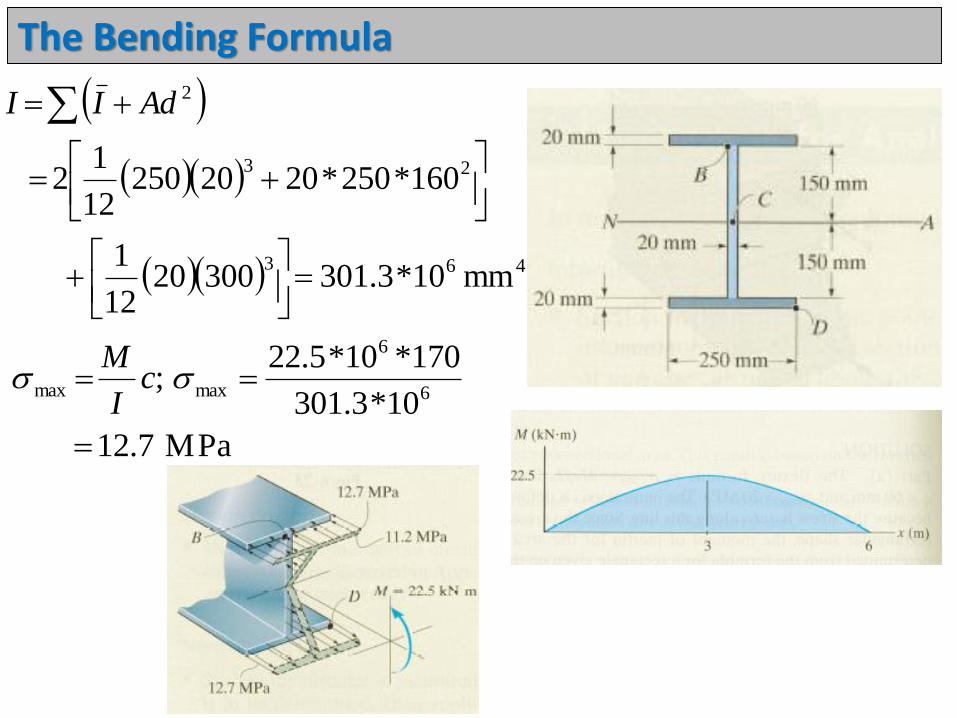
Example 2
The simply supported beam has the cross-sectional area shown in the figure.
Determine the absolute maximum bending stress in the beam and draw the
stress distribution over the cross section at this location.
The Bending Formula
463
23
2
mm10*3.3013002012
1
160*250*202025012
12
AdII
MPa7.12
10*3.301
170*10*5.22;
6
6
maxmax
cI
M

The Bending Formula
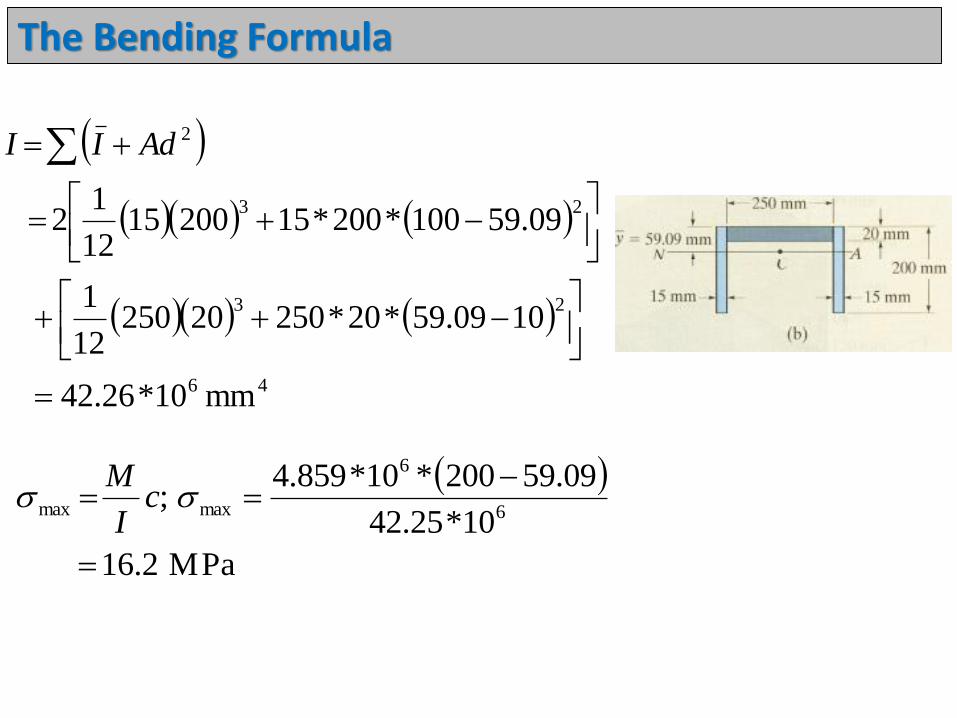
Example 3
The beam shown in the figure has a
cross-sectional area in the shape of a
channel as shown in the attached figure.
Determine the maximum bending stress
that occurs in the beam at section a-a.
mm09.59
250*20200*15*2
250*20*10200*15*100*2~
A
Ayy
N.mm10*4859
009.59*10002000*2400
0
3
M
M
M NA
The Bending Formula
46
23
23
2
mm10*26.42
1009.59*20*2502025012
1
09.59100*200*152001512
12
AdII
MPa2.16
10*25.42
09.59200*10*859.4;
6
6
maxmax
c
I
M

The Shear Formula
Where
The shear stress in the member at the point located a distance y from the neutral
axis. This stress is assumed to be constant and therefore averaged across the
width t of the member.
V The internal resultant shear force, determined from the method of sections and the
equations of equilibrium.
It
VQ

The Shear Formula
I The moment of inertia of the entire cross-sectional area calculated about the
neutral axis.
t The width of the member’s cross-sectional area, measured at the point where is
to be calculated.
Q = , where A is the area of the top portion of the member’s cross-sectional area,
above the section plane where t is measured, and is the distance from the
neutral axis to the centroid of A.
Ay
y
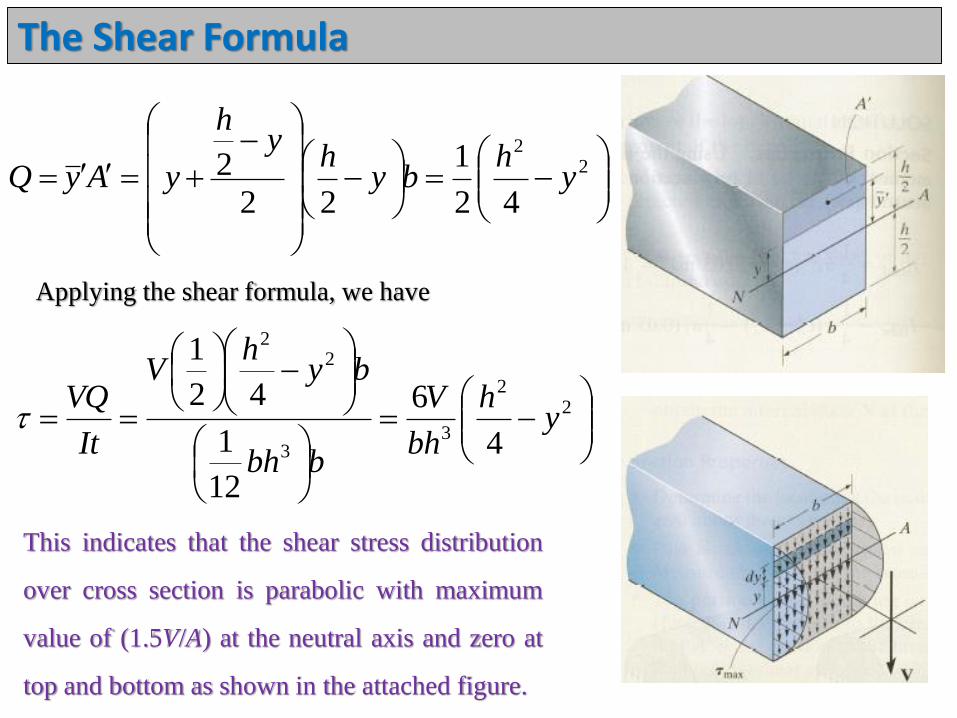
Example 1
Determine the distribution of the shear stress
over the cross section of the beam shown in the
attached figure.
The Shear Formula
22
42
1
22
2 yh
byh
yh
yAyQ
Applying the shear formula, we have
22
33
22
4
6
12
1
42
1
yh
bh
V
bbh
byh
V
It
VQ
This indicates that the shear stress distribution
over cross section is parabolic with maximum
value of (1.5V/A) at the neutral axis and zero at
top and bottom as shown in the attached figure.
The Shear Formula
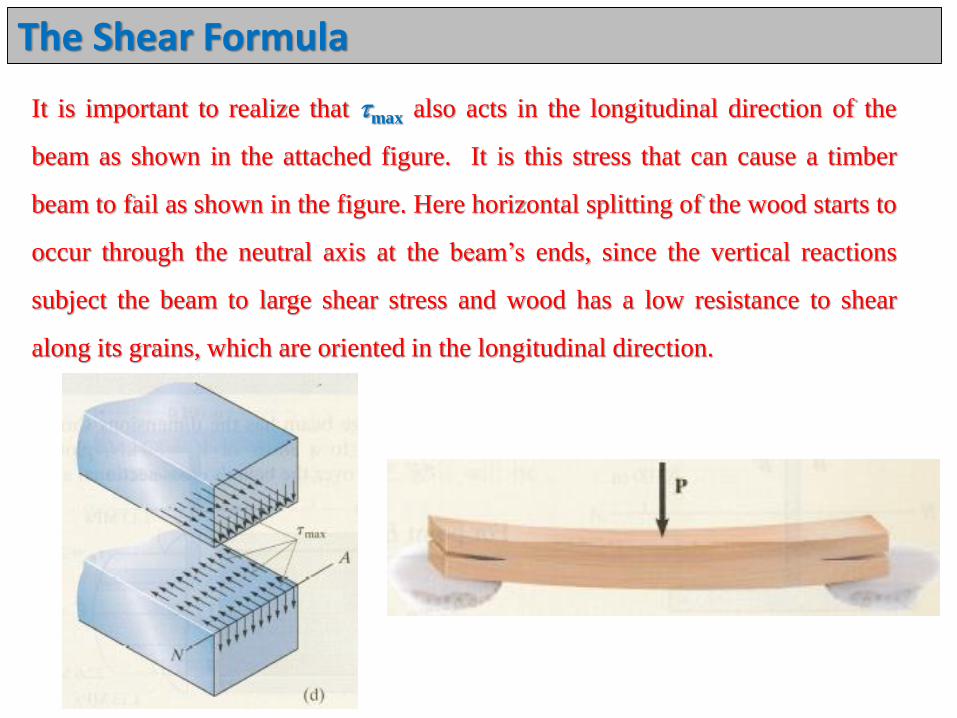
It is important to realize that max also acts in the longitudinal direction of the
beam as shown in the attached figure. It is this stress that can cause a timber
beam to fail as shown in the figure. Here horizontal splitting of the wood starts to
occur through the neutral axis at the beam’s ends, since the vertical reactions
subject the beam to large shear stress and wood has a low resistance to shear
along its grains, which are oriented in the longitudinal direction.

Shear Stress due to bending
30

The Shear Formula
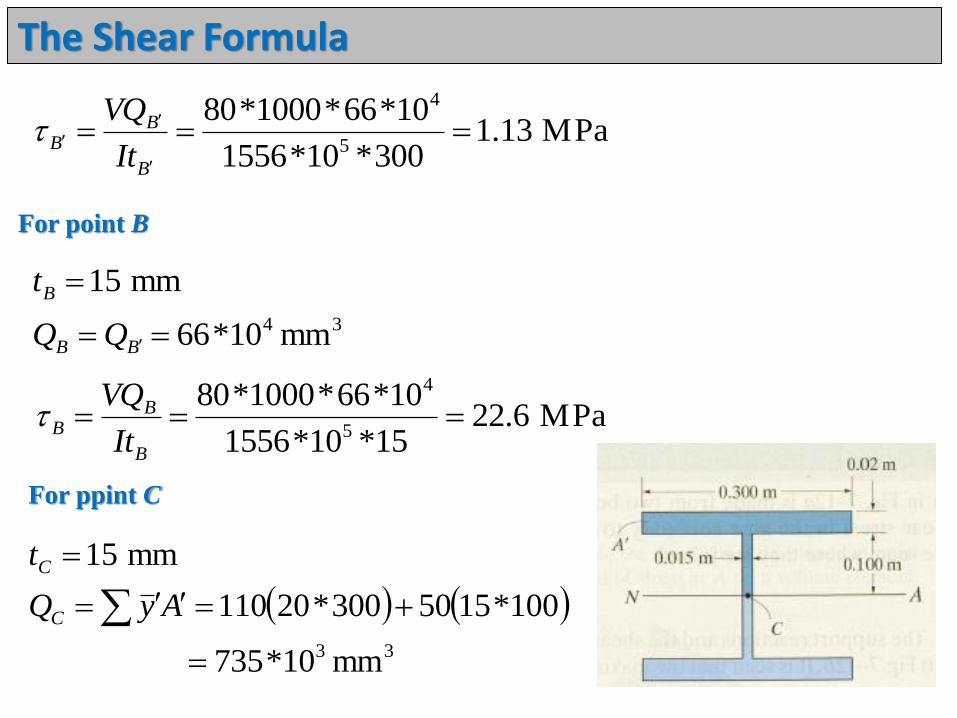
Example 2
A steel wide-flange beam has the
dimensions shown in the figure. If is
subjected to a shear of V = 80 kN, plot
the shear-stress distribution acting over
the beam’s cross sectional area.
452
33
mm10*15561102030012
203002
12
20015
I
For point B
34 mm10*6620*300110
mm300
AyQ
t
B
B
The Shear Formula
For point B
34 mm10*66
mm15
BB
B
t
MPa13.1300*10*1556
10*66*1000*805
4
B
BB
It
VQ
MPa6.2215*10*1556
10*66*1000*805
4
B
BB
It
VQ
For ppint C
33 mm10*735
100*1550300*20110
mm15
AyQ
t
C
C

The Shear Formula
MPa2.2515*10*1556
10*735*1000*805
3
C
CC
It
VQ
From the attached figure, note that the shear
stress occurs in the web and is almost
uniform throughout its depth, varying from
22.6 MPa to 25.2 MPa. It is for this reason
that for design, some codes permit the use of
calculating the average shear stress on the
cross section of the web rather than using the
shear formula; that is,
MPa7.26200*15
1000*80
A
Vavg

The Shear Formula
State of Stress Caused by Combined Loadings
In previous chapters we developed methods for determining the stress distribution in
a member subjected to either an internal axial force, a shear force, a bending moment,
or a torsional moment. Most often, however, the cross section of a member is
subjected to several of these loadings simultaneously. When this occurs, the method
of superposition can be used to determine the resultant stress distribution.
36

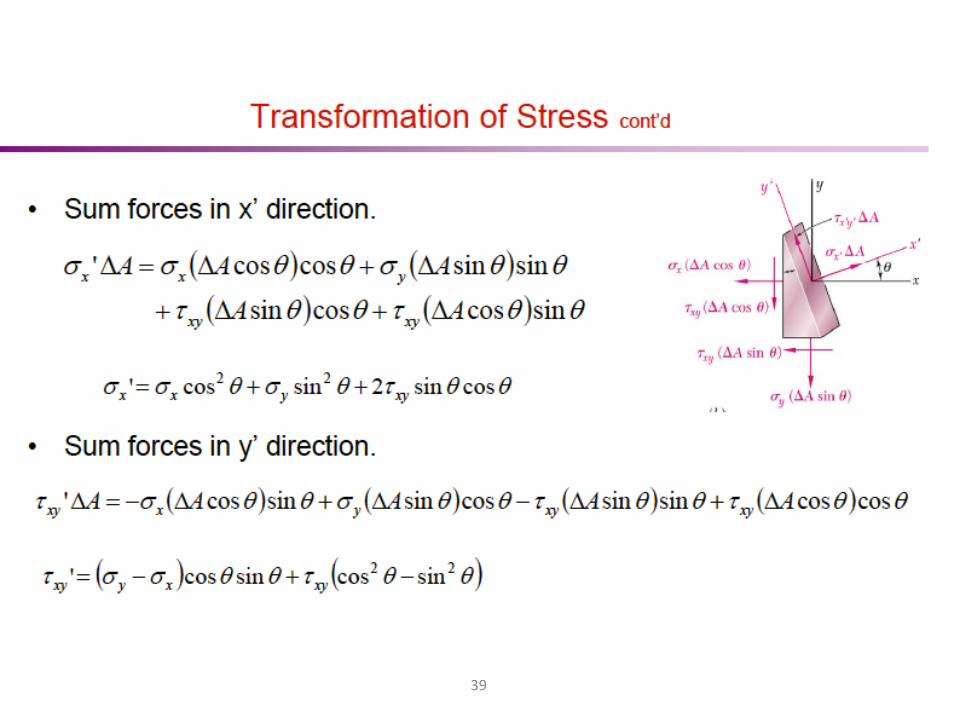
37

38
39

40
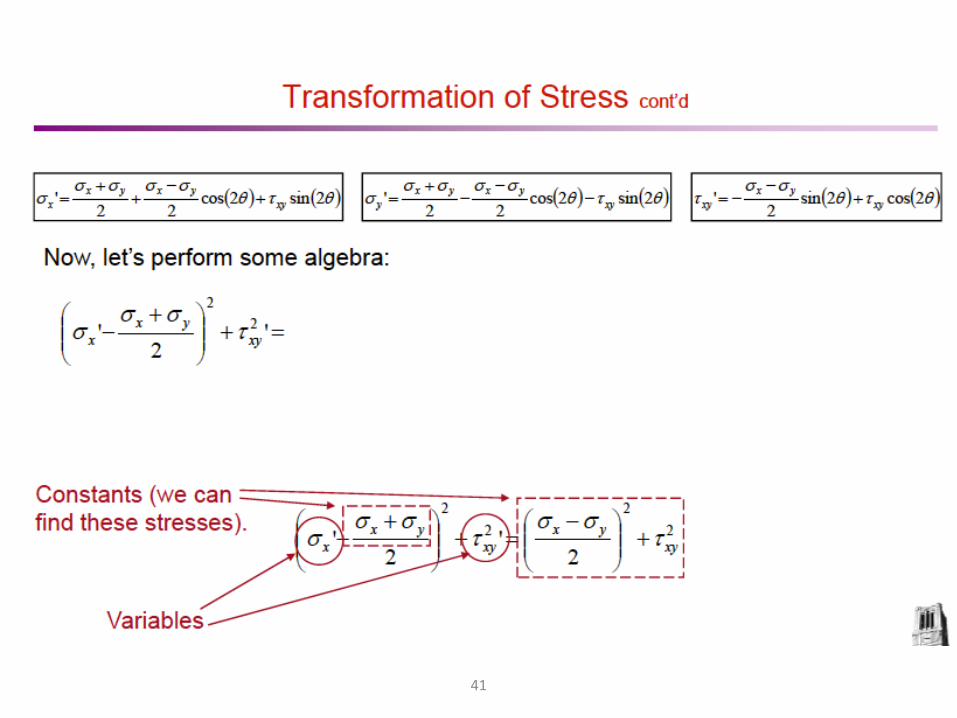
41
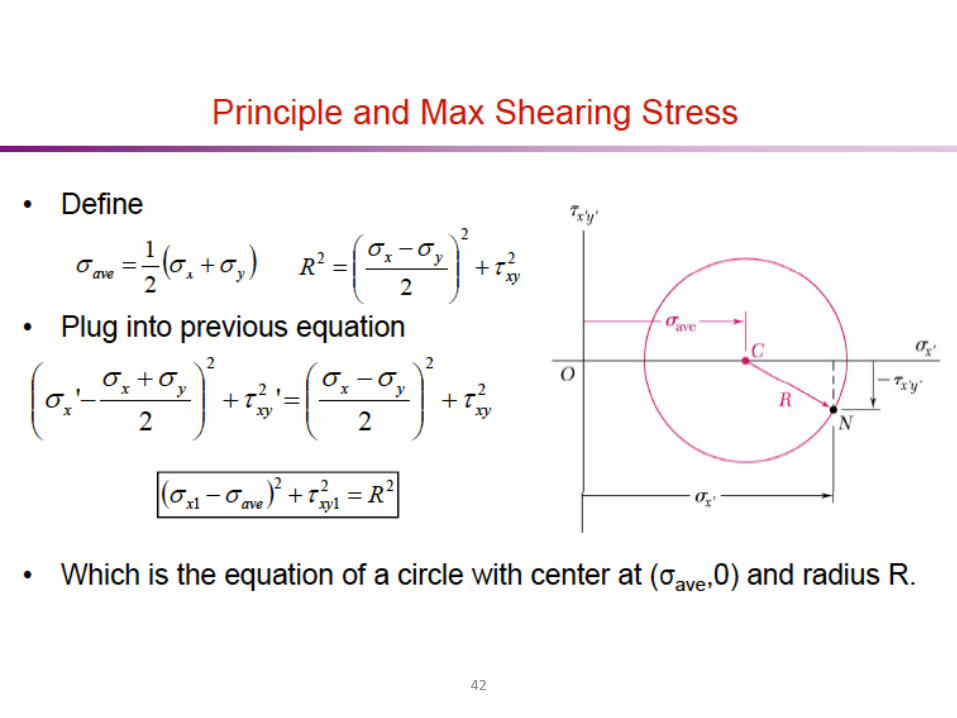
42
43
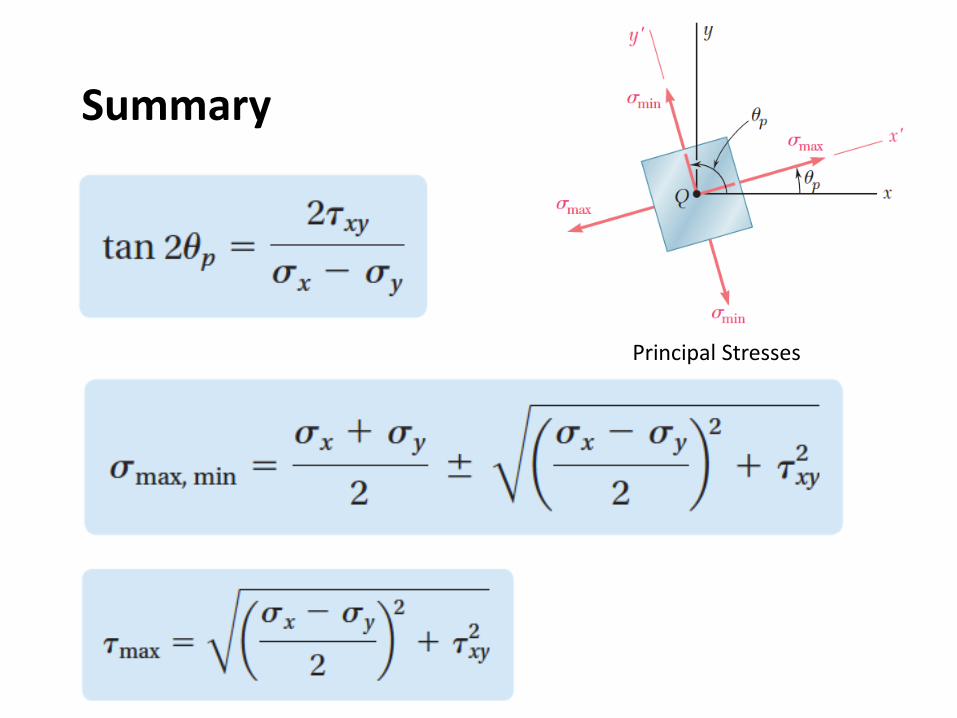
Summary
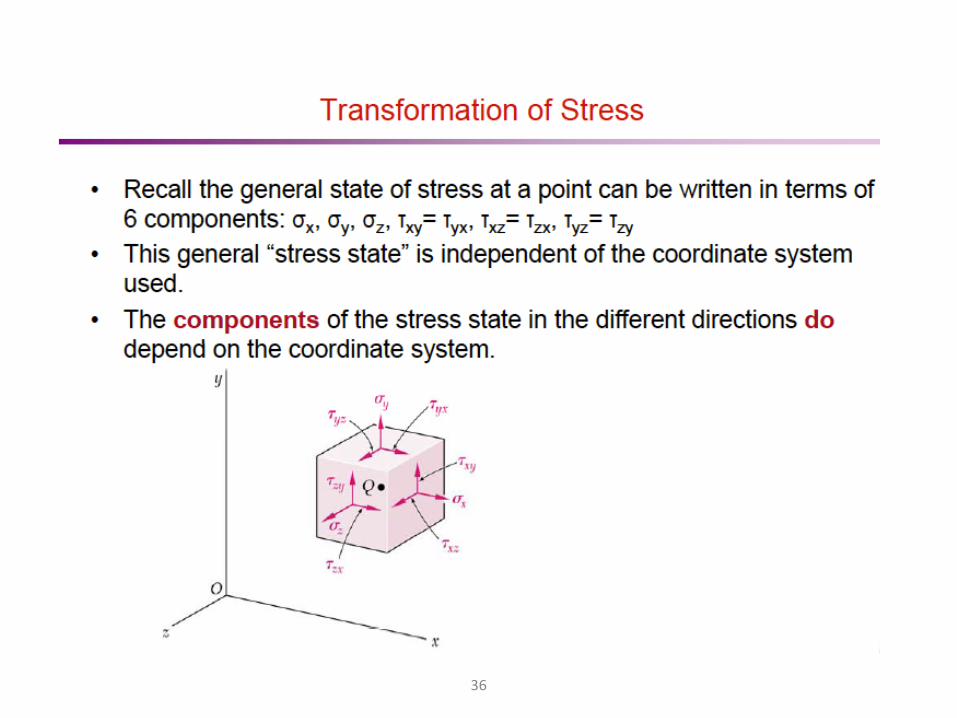
Principal Stresses

44
Example 1For the state of plane stress shown in Fig., determine (a ) theprincipal planes, (b ) the principal stresses, (c ) the maximum shearing stress.
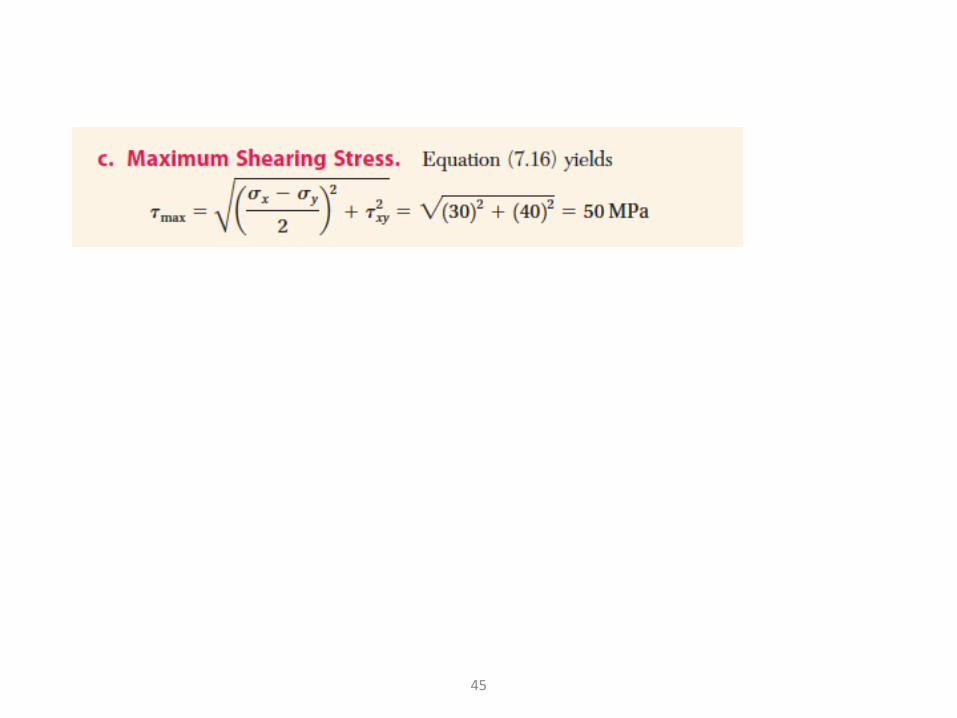
45

46
47
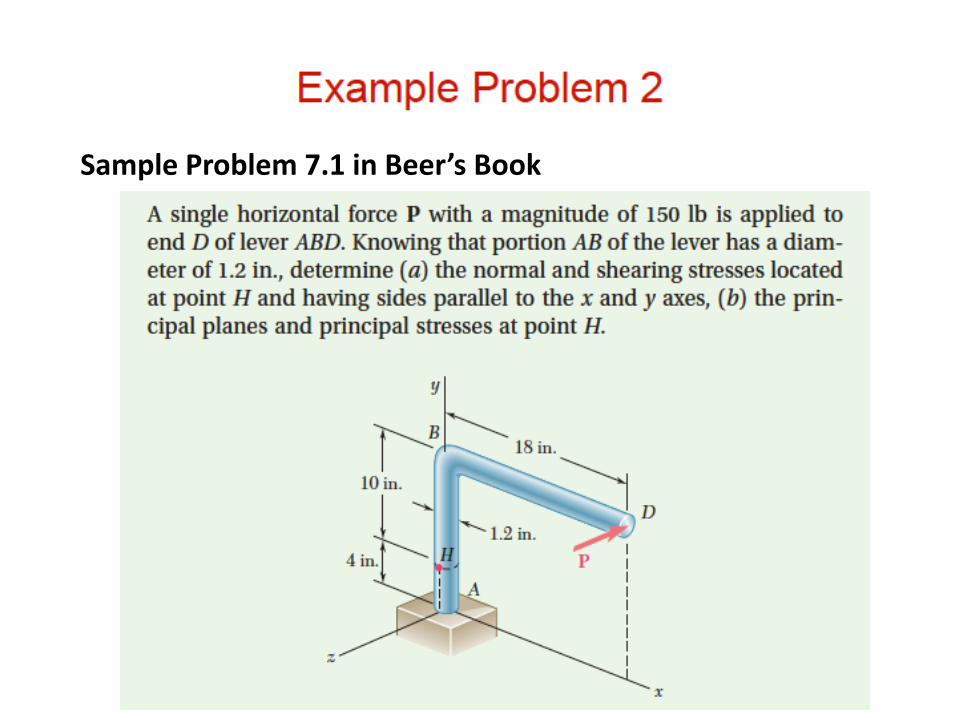
Sample Problem 7.1 in Beer’s Book

48
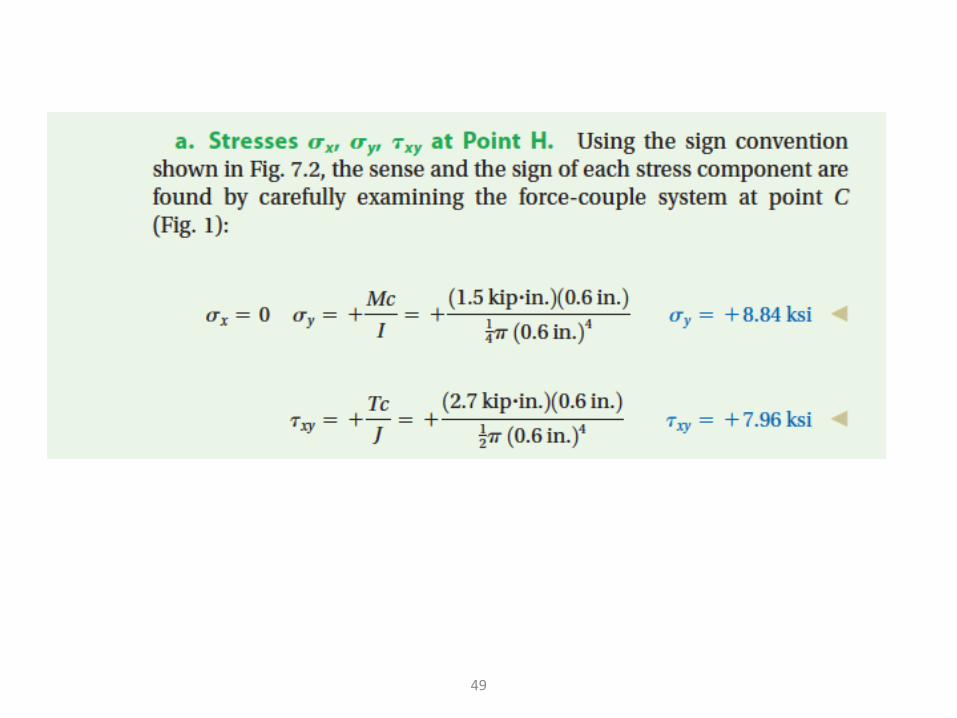
49

50

51

State of Stress Caused by Combined Loadings
Example 1
A force of 15 kN is applied to the edge of the member shown in the figure.
Neglect the weight of the member and determine the state of stress at points B
and C.
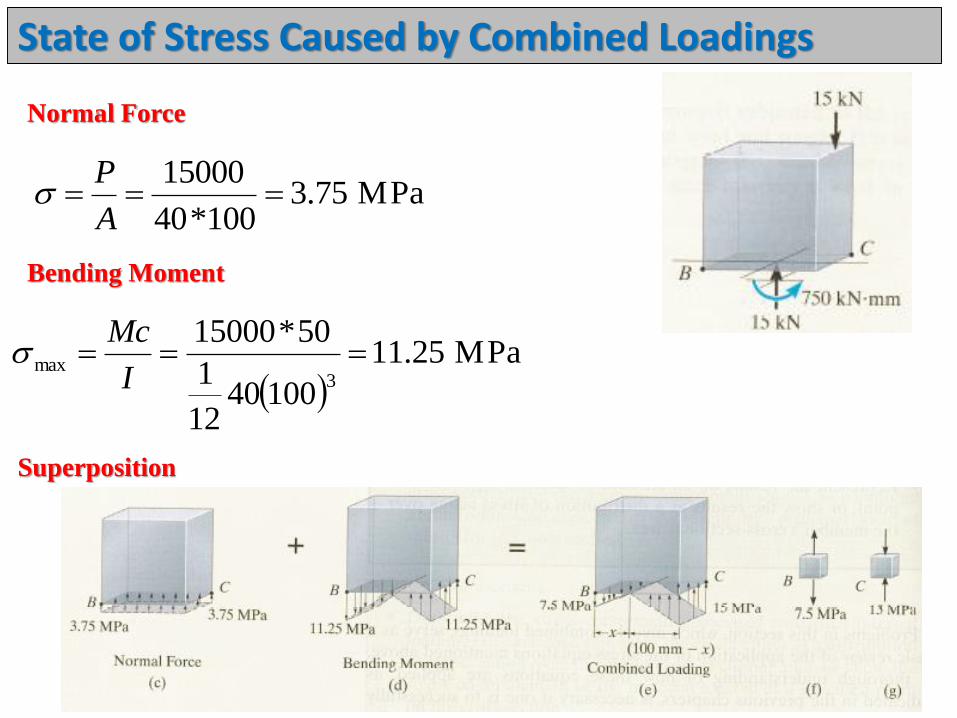
State of Stress Caused by Combined Loadings
MPa75.3100*40
15000
A
P
MPa25.11
1004012
1
50*15000
3max
I
Mc
Normal Force
Bending Moment
Superposition

State of Stress Caused by Combined Loadings
mm3.33
100
155.7
x
xx MPa1575.325.11
MPa5.775.325.11
C
B
Example 2
The member shown in the figure has a rectangular cross section. Determine the state
of stress that the loading produces at point C.
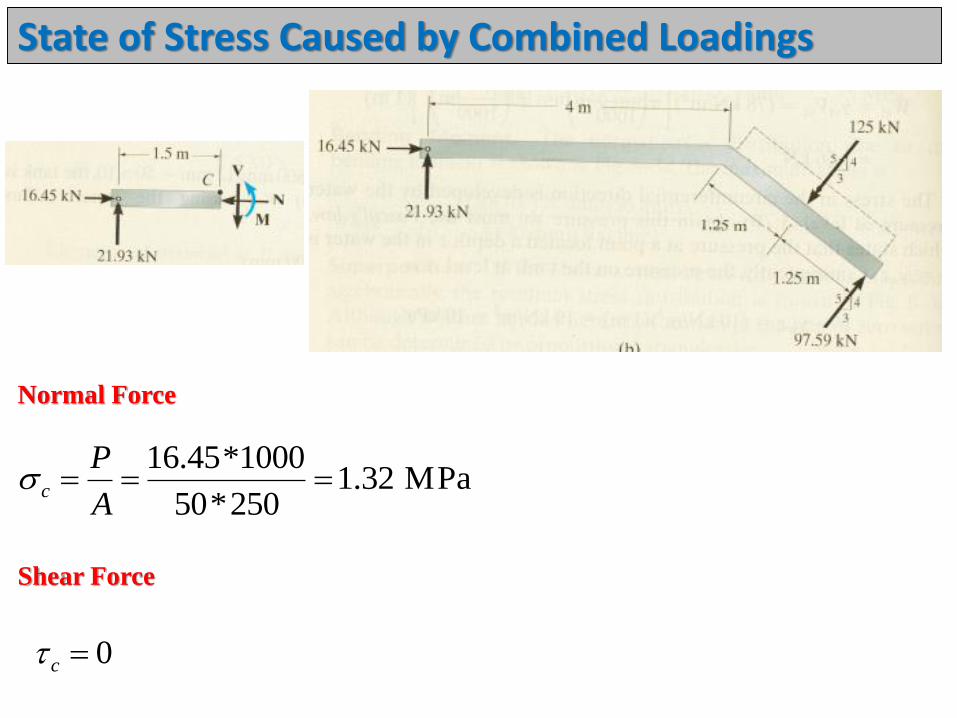
State of Stress Caused by Combined Loadings
Normal Force
Shear Force
MPa32.1250*50
1000*45.16
A
Pc
0c
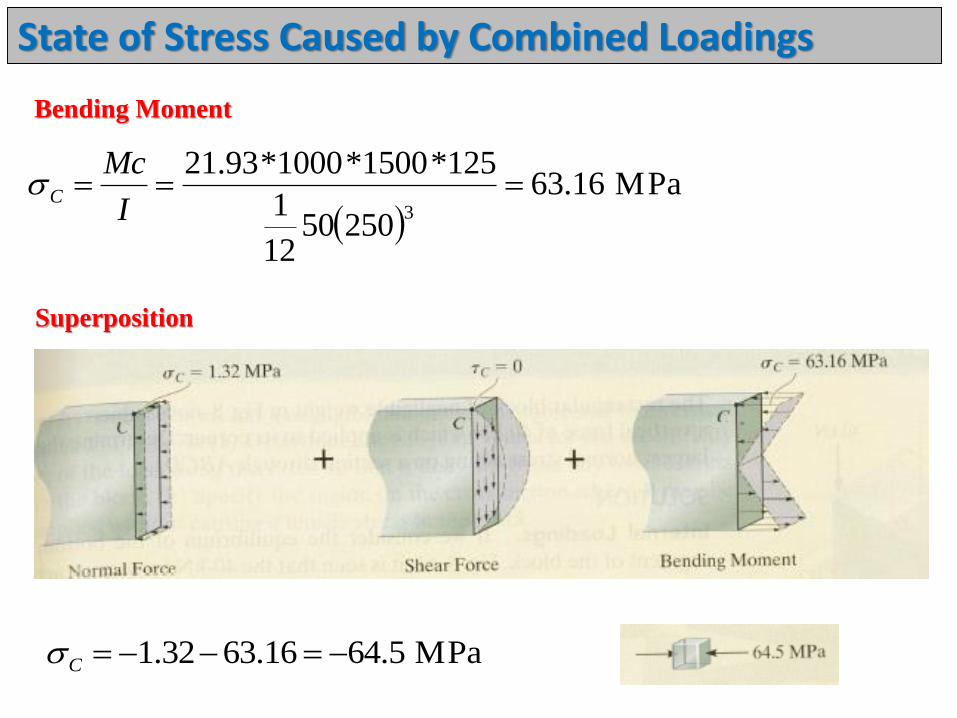
State of Stress Caused by Combined Loadings
Bending Moment
MPa16.63
2505012
1
125*1500*1000*93.21
3
I
McC
Superposition
MPa5.6416.6332.1 C
State of Stress Caused by Combined Loadings
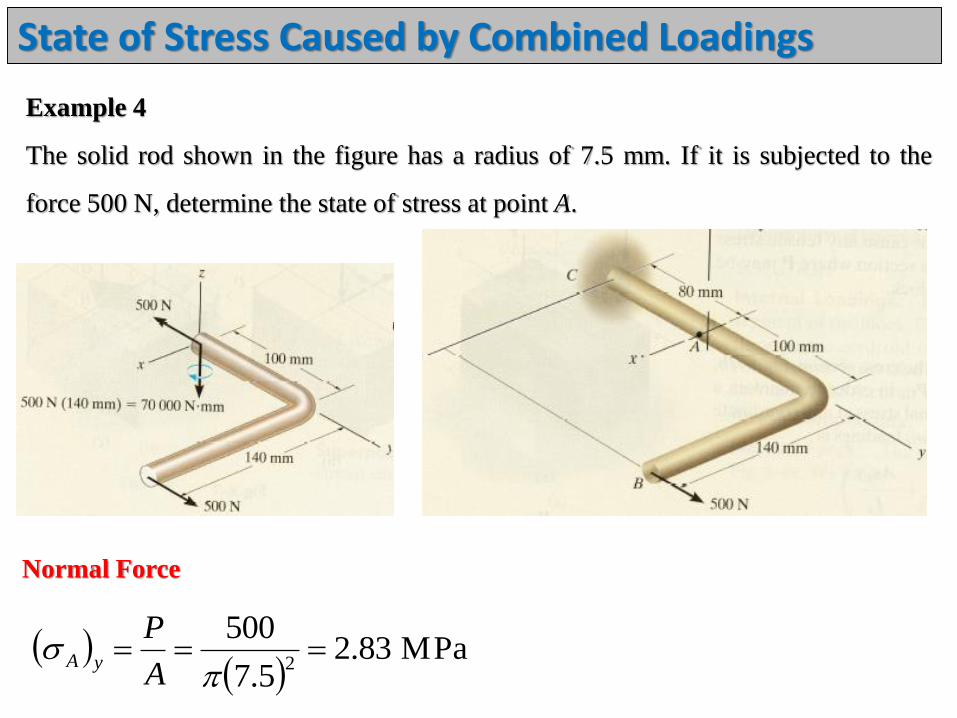
Example 4
The solid rod shown in the figure has a radius of 7.5 mm. If it is subjected to the
force 500 N, determine the state of stress at point A.
Normal Force
MPa83.25.7
5002
A
PyA
State of Stress Caused by Combined Loadings
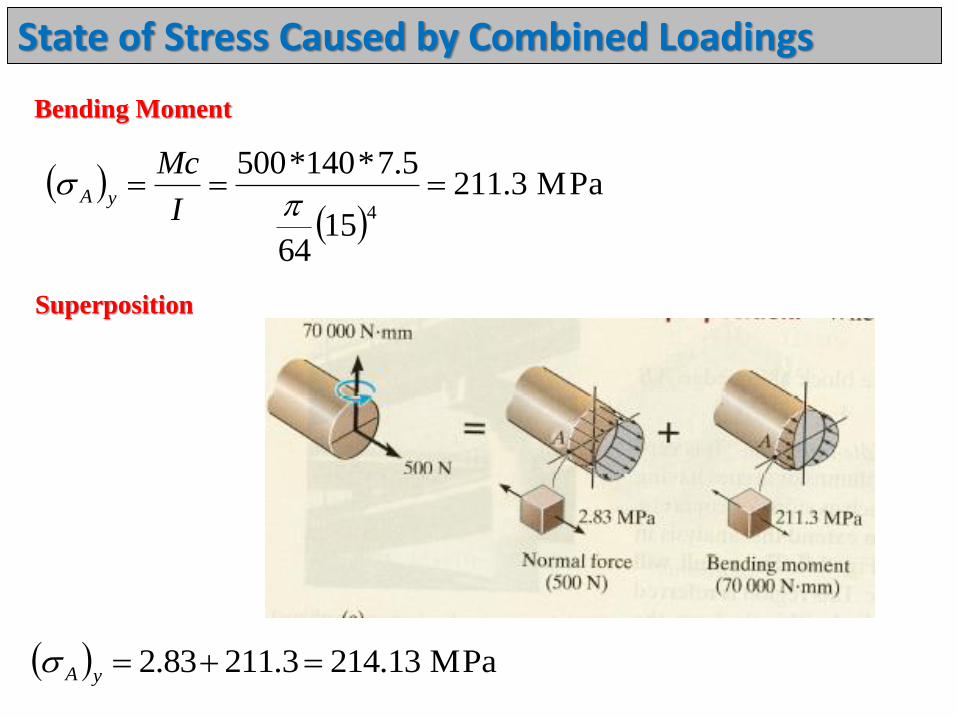
Bending Moment
MPa3.211
1564
5.7*140*500
4
I
McyA
Superposition
MPa13.2143.21183.2 yA

State of Stress Caused by Combined LoadingsExample 5
The solid rod shown in the figure has a radius of 7.5 mm. If it is subjected to the
force 800 N, determine the state of stress at point A.
Shear Force
32mm25.2815.7
2
1
3
5.7*4
AyQ
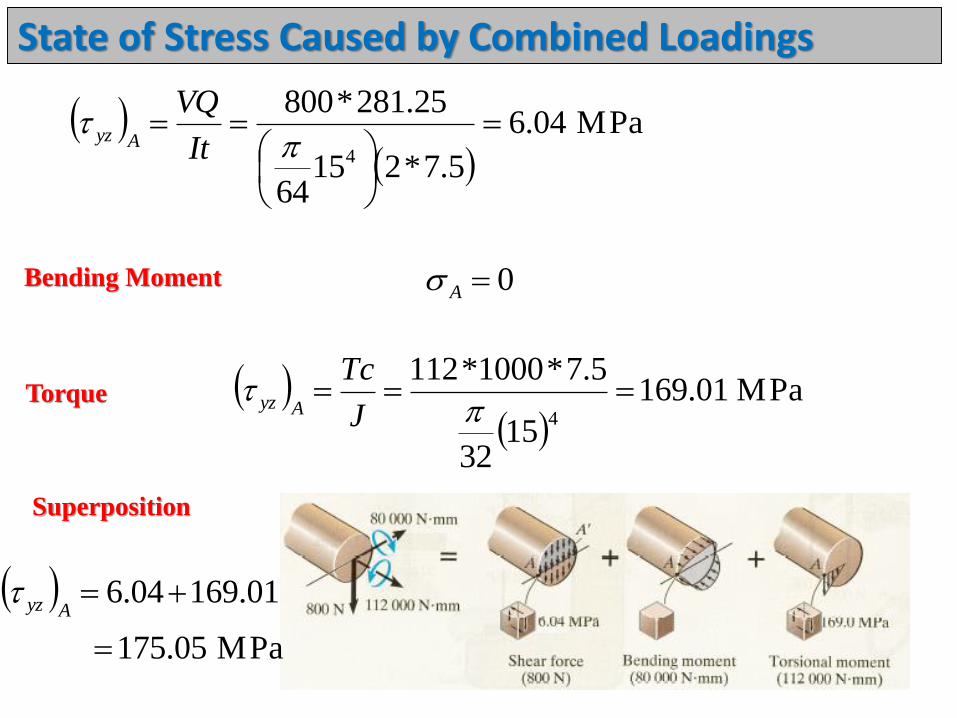
State of Stress Caused by Combined Loadings
MPa04.6
5.7*21564
25.281*800
4
It
VQAyz
Bending Moment 0A
Torque
MPa01.169
1532
5.7*1000*112
4
J
TcAyz
Superposition
MPa05.175
01.16904.6
Ayz

State of Stress Caused by Combined Loadings
MPa04.6
5.7*21564
25.281*800
4
It
VQAyz
Bending Moment 0A
Torque
MPa01.169
1532
5.7*1000*112
4
J
TcAyz
Superposition
MPa05.175
01.16904.6
Ayz