strategies to succeed in the “new normal” - ispe - … · strategies to succeed in the “new...
TRANSCRIPT

Strategies to succeed in the “new normal”
April, 2013
CONFIDENTIAL AND PROPRIETARYAny use of this material without specific permission of McKinsey & Company is strictly prohibited
Ulf Schrader
Trend in pharma and implications on operations
McKinsey & Company | 1
Contents
SOURCE: McKinsey
The new normal
Looking into the mirror
Strategies to succeed

McKinsey & Company | 2
1,600
600
1,400
1,200
1,000
800
+131%
09
400
200
00504 080706030201009998979695949392919089
Pharma industry revenue pool has more than doubled over the past 20 years
SOURCE: S&P Capital IQ Unit; McKinsey
INFLATION-ADJUSTED
Pharma industry revenues, 1989-2009
$ bn

McKinsey & Company | 3
Over the same time period, pharma industry profit pool has more than trebled
SOURCE: S&P Capital IQ Unit; McKinsey
INFLATION-ADJUSTED
220
200
180
160
140
120
100
80
60
40
20
0
1,600
1,400
1,200
1,000
800
600
400
200
0
+278%
+131%
090807060504030201009998979695949392919089
Pharma industry revenues, 1989-2009
$ bn

McKinsey & Company | 4
Recently, growth was mainly driven by emerging markets, while Europe declined
SOURCE: Business Monitor International (5. Apr. 2013)
RoW
BRICTM2
Japan
EU 1
US
2009
~ 1 bn
Pharma sales development at constant exchange rate (2011)USD billion
CAGR (2009-12)Percent
3
-1
3
13
9
4
1 EU countries + Switzerland, Norway, Croatia2 Brazil, Russia, India, China, Turkey, Mexico
INCLUDING INFLATION

McKinsey & Company | 5
6
10
16
23
12
17
8
11
16
19
25
2009 sales at risk because of U.S. patent expiries, 2010-17, $ bn
Pharma facing unprecedented period of loss of exclusivity
Share of 2009 pharma sales at risk because of U.S. patent expiries, 2010-17, %
40
52
79
72
43
42
34
30
39
45
54
Ø 48
SOURCE: Evaluate 2010

McKinsey & Company | 6
Sales of selected Gx companies1
Indexed (2002 = 100), percent
Generic companies have doubled in sales every 4 years
0
50
100
150
200
250
300
350
400
X 2
X 2
2010090807060504032002
1 Sum of the annual sales of Teva, Mylan, Hospira, Watson, Perrian, STADA, Ranbaxy, Dr. Reddy’s, Cipla, KRKA DD, Gedeon, Sun, Lupin, Cadila, Aurobindo, Wockhardt, Matrix, Hisun, Glenmark, Torrent, Daewong, Piramal, Haw Par
SOURCE: Annual reports; McKinsey

McKinsey & Company | 7
Omeprazole Paroxetine Alendronic acid Amlodipine
70 mg tab.20 mg tab./caps.
Fiscal pressures continue and lead to radical prices cuts
0.36
-93%
JuneMay
4.99
Q2
0.270.05
-86%
JuneMay
0.36
Q2
0.04
5 mg tab.20 mg tab.
0.07
-81%
JuneMay
0.37
Q2
0.11
Q2
0.030.03
-85%
JuneMay
0.19
SOURCE: McKinsey
Impact of healthcare reform on selected products in NetherlandsPrices in $ per standard unit
Netherlands India

McKinsey & Company | 8
Quality issues and regulator activity have intensified
Issues Actions Speed of response
U.S. drug recalls U.S. GMP warning letters % of warning letters issued within 4 months of inspection
844
254
+27% pa
20102005
49
18
20102005
+22% pa +14% pa
2010
27%
2005
14%
SOURCE: FDA
McKinsey & Company | 9SOURCE: Company websites; press
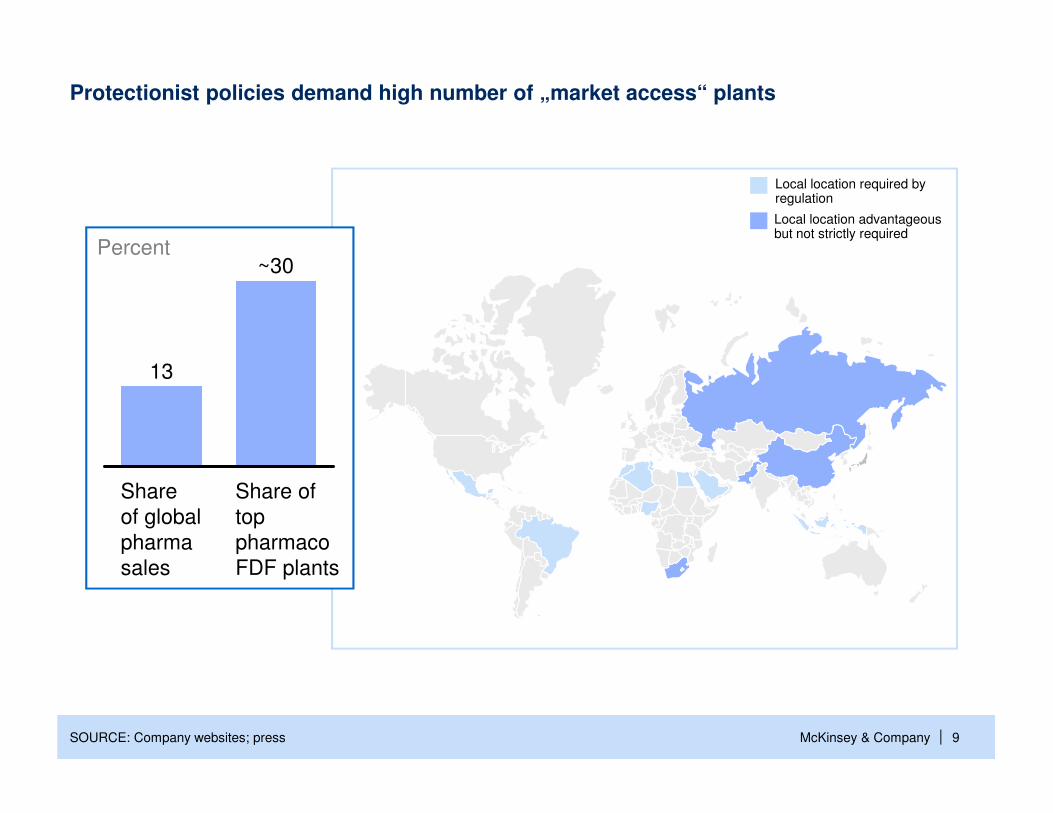
Local location required by regulation
Local location advantageous but not strictly required
Percent
Share of top pharmaco FDF plants
~30
Share of global pharma sales
13
Protectionist policies demand high number of „market access“ plants

McKinsey & Company | 1010
Companies are facing increasingly unpredictable and rapid changes
Growing scale, scope, and pace of uncertainty
Value stream
Macro/ regulatory
Non-economic
▪ Customer demand
▪ Input cost volatility
▪ Social-network influences
▪ Value chain restructuring
▪ Government policies
▪ Exchange rates
▪ Emerging market growth
▪ Regulatory approvals
▪ Pandemics
▪ Political unrest
▪ Natural disasters
▪ Activism
Ab
ilit
y t
o c
on
tro
l/in
flu
en
ce
SOURCE: McKinsey

McKinsey & Company | 11
Increase in counterfeit drugs has been substantial
SOURCE: Press searches; Pharmaceutical Security Institute; WHO
Number of drug-counterfeiting incidents in the U.S., 2002-2009
2,0021,8341,759
1,412
1,123964
484
190
+40% pa
20092008200720062005200420032002
30% of all drugs in Africa are believed to be counterfeit
McKinsey & Company | 12
Contents
SOURCE: McKinsey
The new normal
Strategies to succeed
Looking into the mirror

McKinsey & Company | 13
Pharma starts from a very high base
SOURCE: Company Web sites; McKinsey
Headquarters of leading innovative Pharmacos
Headquarter of Teva

McKinsey & Company | 14
Pharma industry cost curve shows a very immature industry
SOURCE: POBOS
0
50
100
150
200
250
300
350
400
450
500
550
600
Sites (solids)
Overall Productivity, '000 PUs per FTE
+50%
median
top quartile

McKinsey & Company | 15
>40 companies
>400 plants
>8000 production lines
100 new plants in 2012

McKinsey & Company | 16
Changeover time on FETTE 2090 Staffing level on IMA C90 – A91
Hours Number of operators
Major
8.0
4.0
16.0
Minor
1.0
0.6
2.0
Line staffing
3.5
3.0
5.5
Lower Q
Medium
Top Q
SOURCE: POBOS
High spread also on individual practices - examples

McKinsey & Company | 17
Large spread within pharmacos indicates lack of a “production system”
Overall productivity, ‘000 Productions Units/FTE
0
50
100
150
200
250
300
350
400
450
500
550
600
650
326.0
5
219.0
7 8
213.0
150.0
4
203.0
62
191.0
3
252.0
1
185.9
Company average
Top performing
Worst in group
Companies
SOURCE: POBOS

McKinsey & Company | 18
Maintenance productivity
Reliability
Only 10% of plants achieve high reliability at low maintenance cost SOLIDS
STRONGPOOR
LOW
HIGH
SOURCE: POBOS
40%
10%
McKinsey & Company | 19
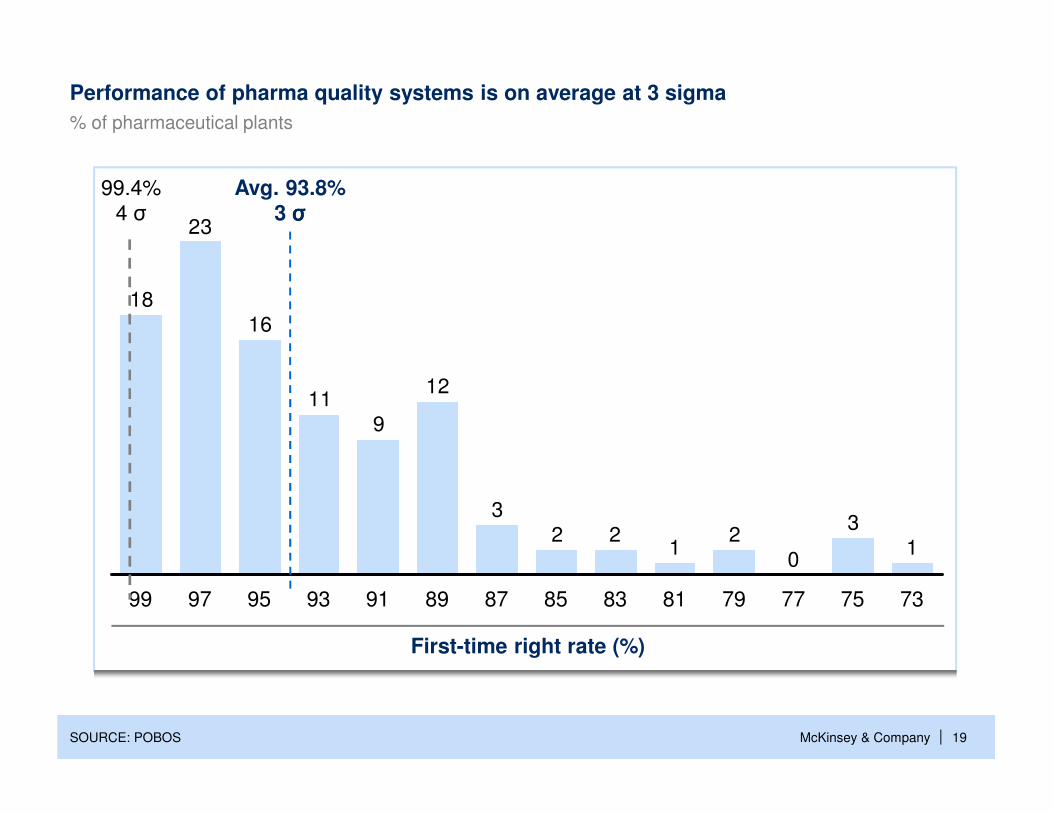
Performance of pharma quality systems is on average at 3 sigma
SOURCE: POBOS
13
02
122
3
12
911
16
23
18
8587 83 7381 757779899193959799
First-time right rate (%)
Avg. 93.8%3 σσσσ
99.4%4 σ
% of pharmaceutical plants

McKinsey & Company | 20
+11%(2008-2010)
84
16
63
37
43
57
Produced batches Recalls
Justified complaints
-1%(2008-2010)
CaptiveExternalOverview of complaints for third party vs. own production
SOURCE: McKinsey; client example
CLIENT EXAMPLEExternal supply is often undermanaged

McKinsey & Company | 21
Contents
SOURCE: McKinsey
The new normal
Looking into the mirror
Strategies to succeed

McKinsey & Company | 22
SOLIDS
SOURCE: POBOS
1 Line staffing for compression and packaging
OEE
Line staffing1Median quartile productivity
Bottom quartile productivity
Top quartile productivity
Fixing the basics still remains a top priority

McKinsey & Company | 23
US/Western Europe
OEE, packaging (based on validated speed), percent
OEE still shows huge potential
SOURCE: POBOS, Rx plants, solids
41
50
65
+59%
AverageTop 25%Top 10%

McKinsey & Company | 24
11
4
Transfor-mationalapproach
Traditional cost reduction
x3
SOURCE: POBOS
Average year-on-year unit cost reduction, % before inflation
Transformations outpace traditional cost reductions by factor 3

McKinsey & Company | 25
Justified complaints (ppm)
6.66
5.04
1.67
-75%
Bottom quartile
Middle quartiles
Top quartile
Average USD cent/production unitN = ~200 solids sites
SOURCE: POBOS
Excellence in operations correlates with high quality
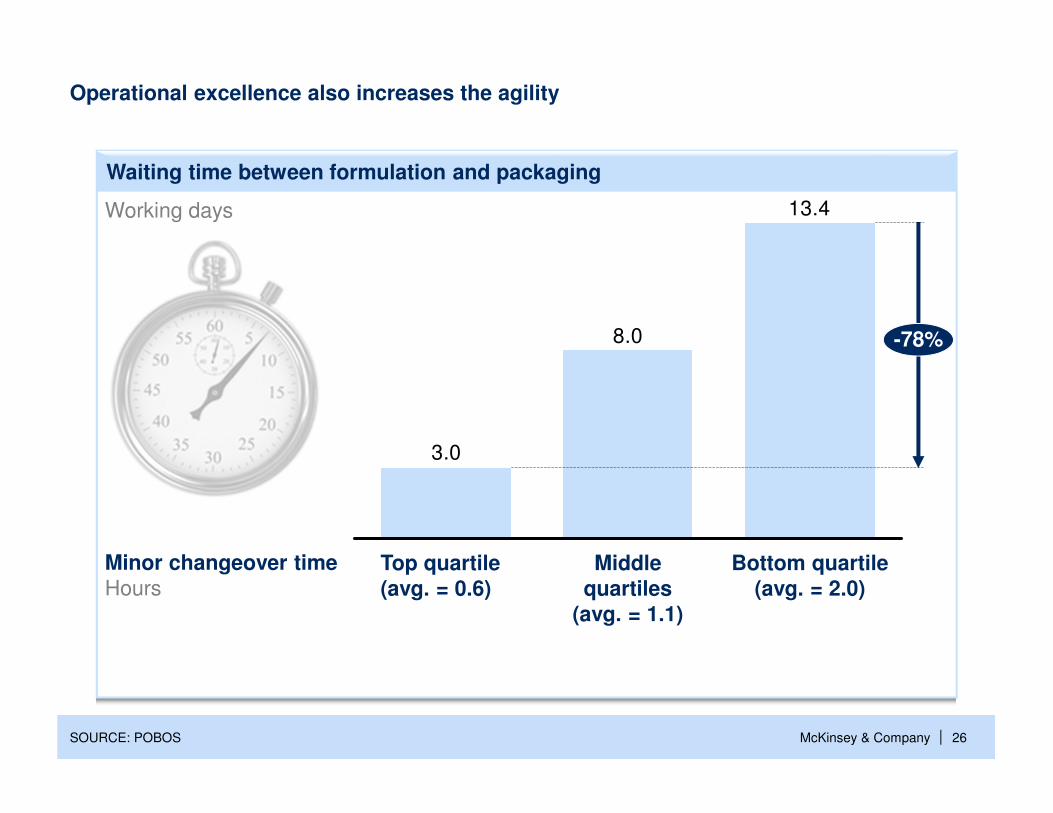
McKinsey & Company | 26SOURCE: POBOS
13.4
8.0
3.0
-78%
Top quartile(avg. = 0.6)
Bottom quartile(avg. = 2.0)
Middle quartiles
(avg. = 1.1)
Waiting time between formulation and packaging
Working days
Minor changeover timeHours
Operational excellence also increases the agility

McKinsey & Company | 27
Pharma needs to move from “projects” to a “production system”
Just-in-time
The right product/service with the right quantity at the right time and at the right cost
▪ Stick to the client need
▪ Adapt resources to the demand
▪ Reduce lead time
Quality
Transfer only the right part or the right service to the next step
▪ Do it right the first time
▪ Stop at the first defect
▪ Answer rapidly to problems
Kaizen
Continuous improvement
▪ Think process
▪ Think standards
▪ Think improvements
▪ Measure to improve
▪ Apply San Gen Shugi
▪ Work in team
▪ Understand client needs
▪ Understand the added value
▪ Follow working standards
▪ Train through on the Job Training
Foundation: Good mindset and good behaviour
Production systems delivered impact across industries
production system
SOURCE: Press clippings, web sites

McKinsey & Company | 28
Site locations
Site footprint is still skewed towards high cost countries
Note: Rx incl. Abbott/Solvay, Amgen, AZ, Bayer, BI, BMS, Lilly, Genentech, GSK, J&J, Merck, Novartis, Novo Nordisk, Pfizer/Wyeth, Roche, Sanofi; Gx incl. Actavis, Hospira, Ranbaxy, Sandoz, STADA, Sun, Teva, Zydus Cadila; only pharma and consumer sites, excl. all dedicated animal health or medical products sites
SOURCE: Espicom; press releases; McKinsey expert interviews
56
28
44
72
Average Gx
100
Low cost countries
High cost countries
Average Rx
100
Percentage of all pharma and OTC sites

McKinsey & Company | 29
Offshoring still remains an opportunity, especially for emerging markets
Top quartileAverage
17
46
-62%
LCCNon-LCC
61
96
-36%
LCCNon-LCC
SOURCE: POBOS
Unit cost in USD cents/Production Unit
LCC: Low cost countries

McKinsey & Company | 30
World's cheapest production car brings mobility to the masses
Lowest-priced microwave adaptive to Chinese cooking style
30
Design-to-value and platforming is a big lever in other industries to win in emerging markets
SOURCE: Interviews and press search
Launched to support student community in India
Eliminated display, added languages, market rates for goods, e.g., vegetables
20 instead of 200 parts. Uses PC chips and fans
Wind-turbine manufacturer eliminates product complexity
First incubator for rural babies - no electricity or training required
Ultra portable and a fraction of the cost of traditional machines
“Sakshat” Laptop ($30)Spice mobile phone ($12)
ChotuKool fridge ($69)
Embrace baby incubator ($25)
Tata Nano ($2,000)
Galanz microwave ($50)
Sinovel wind turbines (price 20% < competition)
GE MAC 400 ECG Machine($1,000)
McKinsey & Company | 31
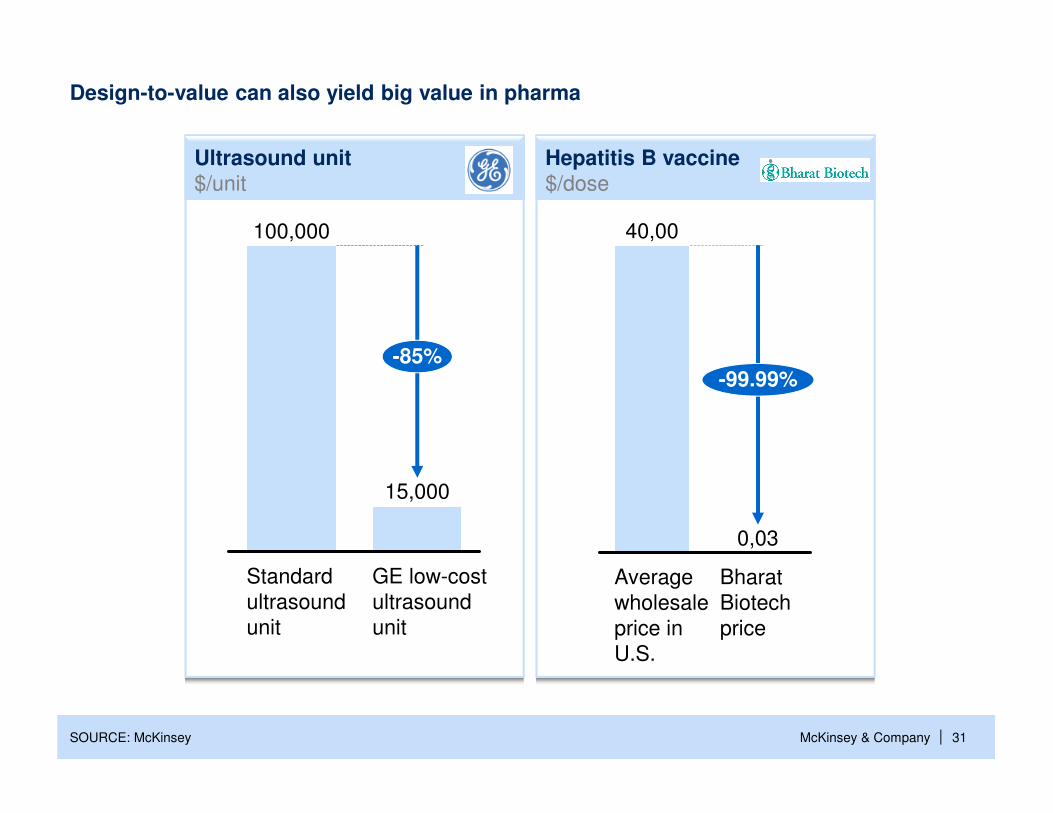
Design-to-value can also yield big value in pharma
15,000
-85%
GE low-cost ultrasound unit
Standard ultrasound unit
100,000
0,03
-99.99%
Bharat Biotech price
Average wholesale price in U.S.
40,00
SOURCE: McKinsey
Ultrasound unit$/unit
Hepatitis B vaccine$/dose

McKinsey & Company | 32
Atomization of the value chain will drive performance also in pharma
SOURCE: McKinsey
Front end design
Core design
Back end design
Manufacturing equipment
Wafer fabrication
Assembly
From 1970s view …“do it all”
… to 2000s view:“atomized”
Front-end design
Core design
Back end design
Manufacturing equipment
Wafer fabrication
Assembly
Sales and marketing
In-house (ARM provides key components)
In-house
Engineering design/
automation
Engineering design/
automation
Example from High-Tech

McKinsey & Company | 33
Building agility into the system will be key to succeed in a volatile environment
SOURCE: McKinsey
Manufacturing agility
Workforce agility
Supply chain agility
Suppliermanagement
agility
Product development
agility
Capitaland risk mgmt.

McKinsey & Company | 34
When lightning struck, Nokia was able to leverage its supply chain setup to respond efficiently and mitigate risk
SOURCE: A. J. Schmitt, Using Stochastic Supply Inventory Models to Strategically Mitigate Supply Chain Disruption Risk, Logistics Spectrum, 2008; EIU "Managing supply-chain risk for reward"
In 2000, lightning struck a Philips microchip plant in New Mexico, causing a fire that contaminated millions of mobile-phone chips
▪ Reported long-term losses of $2.3bn
▪ Ultimately withdrew from the cell-phone market
▪ Profits rose by 42%
▪ Increased their market share from 27% to 30% in the first 6 months after the fire
Lightning struck Impact on Ericsson and Nokia