stifel financial investor presentation · (1) 2010 net revenues are annualized using the nine...
TRANSCRIPT

December 2010
Stifel
Financial Investor Presentation

Table of ContentsForward-Looking Statements
This presentation may contain “forward-looking statements”
within the meaning of the Private Securities Litigation Reform Act of 1995 that involve significant risks, assumptions, and
uncertainties, including statements relating to the market opportunity and future business prospects of Stifel
Financial Corp., as well as Stifel, Nicolaus
& Company, Incorporated and its subsidiaries (collectively, “SF”
or the “Company”). These statements can be identified by the use of the words “may,”
“will,”
“should,”
“could,”
“would,”
“plan,”
“potential,”
“estimate,”
“project,”
“believe,”
“intend,”
“anticipate,”
“expect,”
and similar expressions. In particular, these statements may refer to our goals, intentions, and expectations, our business plans and growth strategies, our ability to integrate and manage our acquired businesses, estimates of our risks and future costs and benefits, and forecasted demographic and economic trends relating to our industry.
You should not place undue reliance on any forward-looking statements, which speak only as of the date they were made. We will not update these forward-looking statements, even though our situation may change in the future, unless we are obligated to do so under federal securities laws.
Actual results may differ materially and reported results should
not be considered as an indication of future performance. Factors that could cause actual results to differ are included in the Company’s annual and quarterly reports and from time to time in other reports filed by the Company with the Securities and Exchange Commission and include, among other things, changes in general economic and business conditions, actions of competitors, regulatory and legal actions, changes in legislation, and technology changes.

I.
Stifel
Financial Overview

$2.0 billion market capitalization(3)
One of the largest U.S. equity research platforms with over 1,000 stocks under coverage
Over 1,900 Financial Advisors with over $100 billion in combined client assets –national presence
Broad industry expertise
40% Insider ownership aligns employees’interests with shareholders (4)
Proven ability to build Global Wealth Management Business
Grown from 86 branches and 621 Financial Advisors in 2004 to 279 branches and 1,920 Financial Advisors in 2010.Proven Integrator of Acquisitions
Middle-market focusResearch driven, industry specialist approachCommitment to small/mid-cap companies
Independent advisorPrimarily a client-facing agency businessNo proprietary trading desks
Broad product portfolioEquities, Fixed Income, M&A AdvisoryCommitment to private equity and venture investors
Proven growth, stability and scale$1.2 billion in equity capital(1)
$1.3 billion in annual revenues(2)
4
Stifel
Financial Overview
Key Points of Differentiation
Global Wealth Management (GWM)
Institutional Group (IG)
Equity & Convertible Capital RaisingDebtM&A AdvisoryInstitutional Brokerage
Private ClientStifel Bank & Trust
Assets $1.5BN1
Customer FinancingAsset Management
Firm at a Glance
(1) As of 9/30/10. (2) Based on consensus 2010 estimates as of October 2010. (3) As of 12/2/10. (4) Insider ownership percentage includes all fully diluted shares, units outstanding, options outstanding, as
well as shares owned by Stifel’s
former Chairman as of 11/16/2010.

$80 $100 $131 $155 $220
$425
$593
$873
$1,213
$0
$250
$500
$750
$1,000
$1,250
2002 2003 2004 2005 2006 2007 2008 2009 Sept. 2010
$3
$15 $23 $21
$40
$67 $73
$76
$103
$0
$16
$32
$48
$64
$80
$96
$112
2002 2003 2004 2005 2006 2007 2008 2009 2010 Annlzd
$188 $217 $247 $264
$452
$763$870
$1,091
$1,308
$0
$300
$600
$900
$1,200
$1,500
2002 2003 2004 2005 2006 2007 2008 2009 2010 Annlzd
$16 $20 $20 $27
$35
$59 $52
$91 $100
$0
$20
$40
$60
$80
$100
$120
2002 2003 2004 2005 2006 2007 2008 2009 Sept. 2010
543647 621 644 735
1,1631,315
1,885 1,920
0
500
1,000
1,500
2,000
2,500
2002 2003 2004 2005 2006 2007 2008 2009 Sept. 2010
$5.91 $7.23 $9.02 $10.21
$12.35
$18.36
$22.68
$28.86
$35.52
$0.00
$5.00
$10.00
$15.00
$20.00
$25.00
$30.00
$35.00
$40.00
2002 2003 2004 2005 2006 2007 2008 2009 Sept. 2010
(1) 2010 net revenues are annualized using the nine months ended
9/30/10. (2) Core Net Income is annualized using the nine months ended 9/30/10 excludes merger-related equity compensation expenses and restructuring charges. (3) Includes Independent Contractors. CAGR reflects years 2002 to 2010.
Stifel
Financial Overview
CAGR: 27% CAGR: 56%
CAGR: 25%CAGR: 17%CAGR: 26%
5
A Growth Story…
Net Revenues ($MM) (1) Core Net Income ($MM) (2) Total Equity ($MM)
Total Client Assets ($BN) Financial Advisors (3) Book Value Per Share
CAGR: 41%

$87 $110 $123 $127 $141$178 $177 $188
$217$247 $264
$452
$763
$870
$1,091
$1,308
$0
$200
$400
$600
$800
$1,000
$1,200
$1,400
1995 1996 1997 1998 1999 2000 2001 2002 2003 2004 2005 2006 2007 2008 2009 2010 Annlzd
15 Years of Growth
Stifel
Financial Overview
6
1995 –
2010E Net Revenue ($MM)
2010 net revenues are annualized using the nine months ended 9/30/10.
CAGR since 1995: 20%
CAGR since 2005: 38%
2010 is expected to be the 15th
consecutive year of Record Net Revenue

7
Stifel
Financial Overview
Stifel’s
Peer Analysis Shows Continued Strength
Prices as of 11/11/10. Peer Group consists of following firms: Oppenheimer Holdings, SWS Group, Inc., Sanders Morris Harris Group, Inc., Stifel
Financial, Corp., Raymond James Financial, Jeffries Group, Legg Mason, Goldman Sachs Group and Morgan Stanley.
Peer Analysis –
2000 to Present
861%
130%
-8%
-200%
0%
200%
400%
600%
800%
1000%
2000 2001 2002 2003 2004 2005 2006 2007 2008 2009 2010
Stifel Financial Corp (23.2% CAGR)
Peer Group (2.3% CAGR)
S&P 500 (-0.8% CAGR)

Cumulative Stock Price Appreciation assumes closing price on 11/11/10 will be the price at 12/31/10.
Stifel
Financial Overview
Cumulative Price Appreciation As of November 11, 2010
8
Since 12/31/07 – 3 Years Since 12/31/05 – 5 Years Since 12/31/00 – 10 Years
Stifel Financial Corp. 55.93% Stifel Financial Corp. 118.08% Stifel Financial Corp. 860.87%Evercore Partners 49.88% Greenhill & Co. 41.36% Jefferies Group 225.25%Greenhill & Co. 19.42% Goldman Sachs Group 31.32% Raymond James Financial 97.81%Jefferies Group 10.24% Oppenheimer 29.21% Goldman Sachs Group 56.83%KBW -0.04% Raymond James Financial 22.09% Sanders Morris Harris 49.88%Raymond James Financial -6.12% Lazard 17.74% Oppenheimer 7.18%Lazard -7.67% Jefferies Group 12.98% Legg Mason -6.70%JMP Group -16.04% S&P 500 Index -2.78% S&P 500 Index -8.09%S&P 500 Index -17.35% Piper Jaffray -17.95% SWS Group -58.17%Goldman Sachs Group -22.01% SWS Group -53.01% Morgan Stanley -66.80%Piper Jaffray -28.43% Morgan Stanley -53.63% Evercore Partners NMSanders Morris Harris -37.85% Sanders Morris Harris -61.13% Greenhill & Co. NMOppenheimer -39.01% Legg Mason -71.68% KBW NMSWS Group -48.22% Evercore Partners NM Lazard NMMorgan Stanley -50.46% KBW NM JMP Group NMLegg Mason -53.66% JMP Group NM Piper Jaffray NMCowen Group -55.73% FBR Capital Markets NM FBR Capital Markets NMFBR Capital Markets -61.06% Cowen Group NM Cowen Group NM

Continue to build client facing agency-only businesses in financial services
Expand private client footprint in the U.S.
Expand institutional equity business both domestically and internationally
Grow investment banking
Focus on asset generation within banking operations
Enhance and accelerate Stifel Bank and Trust strategy
Approach acquisition opportunities with discipline
Consolidation and Industry Retrenchments Drive our Growth
Stifel
Financial Overview
9
Stifel
Strategy

Stifel’s
Track Record in Integrating Transactions: Low Risk Opportunity
Builds the premier middle-market investment bank with the scale and diversification to become a top-tier playerComplementary fit with minimal overlap in research and investment bankingFast tracks growth in investment banking through expanded industry, product and geographic coverageCreates one of the largest U.S. equity research platformsClosed on July 1, 2010
Successfully integrated UBS’ private client groupRevenue production in-line with expectations Achieving synergy objectives Last closing October 16, 2009
Successfully integrated Butler Wick’s private client group and investment banking platformsAchieved cost savings objectivesClosed December 2008
Successfully integrated Ryan Beck’s private client group and investment banking platformsAchieved cost savings objectivesClosed February 28, 2007
Successfully integrated Legg’s sales and trading, research and investment banking platformsMajority of Legg Mason Investment Banking Managing Directors remain with Stifel today Achieved cost savings objectivesRemains core of Institutional Capital Markets business Closed December 1, 2005
(56 branches from UBS Financial Services)
Stifel
Financial Overview
10

II. Global Wealth Management

Rank Company Headquarters RRs (2)Client
Assets (3)
1 Citigroup/Smith Barney New York, NY 19,296 $1,0342 Wells Fargo Securities St. Louis, MO 16,678 1,000+3 Merrill Lynch & Co New York, NY 15,880 1,4754 Edward D. Jones St. Louis, MO 10,532 4005 UBS Financial Services, Inc. Weehawken, NJ 8,182 5376 RBC Dain Rauscher Minneapolis, MN 2,157 1777 Stifel Proforma (4) St. Louis, MO 1,920 1008 Oppenheimer New York, NY 1,395 NA9 Raymond James Financial New York, NY 1,218 170
10 Morgan Keegan & Co. Memphis, TN 1,075 NA11 Janney Montgomery Philadelphia, PA 857 NA12 Robert Baird Milwaukee, WI 591 NA13 Hilliard Lyons Louisville, KY 410 NA
$48 $48 $50
$96 $98 $100
$175
$0
$30
$60
$90
$120
$150
$180
2004 2005 2006 2007 2008 2009 2010 Annlzd(1)
Includes Independent Contractors. (2) Source: SIFMA 2008 Year Book Retail RRs. (3) Source: Company Data, Goldman Sachs Research. $ in billions. (4) Stifel
data is as of 9/30/2010.Note: 2010 Net Revenues and Operating Contribution are annualized using the nine months ended 9/30/2010.
Global Wealth Management
Provides Securities Brokerage Services and Stifel
Bank ProductsStrength of Stifel’s
Brokerage Position
CAGR: 24%CAGR: 28%
12
Stifel has grown from 600+ financial advisors in 2005 to over 1,900 financial advisors(1)
Stifel retail investors are generally mid- to long-term buyersGoal of providing price stability and support to the institutional order bookStrategy of recruiting experienced advisors with established client relationships and further expanding U.S. footprint
Net Revenues ($MM)
Overview
Operating Contribution ($MM)
$187 $197$231
$441$471
$591
$809
$0
$100
$200
$300
$400
$500
$600
$700
$800
$900
2004 2005 2006 2007 2008 2009 2010 Annlzd

20,286 26,735
35,446
59,299 51,828
91,342 100,389
0
20,000
40,000
60,000
80,000
100,000
120,000
December 2004
December 2005
December 2006
December 2007
December 2008
December 2009
September 2010
(1) Includes Independent Contractors.
Global Wealth Management
13
Opportunity Through Growth
GWM Account Growth
GWM Broker Growth (1)
GWM Assets Under Management Growth ($MM)
GWM Branch Growth
172,751 180,639 213,973
340,235 375,165
607,661 628,081
0
100,000
200,000
300,000
400,000
500,000
600,000
700,000
December 2004
December 2005
December 2006
December 2007
December 2008
December 2009
September 2010
621 644 735
1,163 1,315
1,885 1,920
0
500
1,000
1,500
2,000
2,500
December 2004
December 2005
December 2006
December 2007
December 2008
December 2009
September 2010
86 92 111
148
196
272 279
0
50
100
150
200
250
300
December 2004
December 2005
December 2006
December 2007
December 2008
December 2009
September 2010

Global Wealth Management
Assets of $1.50 billion, up 34% from the prior year-end balance of $1.14 billion
Investment portfolio of $830 million, up 44% from the prior year-end balance of $579 million
Loan portfolio of $479 million, up 20% from prior year-end balance of $401 million
Deposits of $1.4 billion, up 34% from prior year balance of $1.03 billion
Interest Earning Assets
Stifel
Bank & Trust Overview
Maintain solid asset quality:
Non-performing loans to gross loans of 0.30%Non-performing assets to total assets of 0.20%$0.1 million LTM losses on $1.5 billion in assets
Offer banking products (securities based loans and mortgage loans) within the GWM client base, including establishing trust services
Maintain high levels of liquidity to capitalize on opportunities
Low Risk Asset Growth Strategy & Opportunity
14
($ in thousands) 9/30/10 12/31/09 6/30/09 6/30/10 12/31/09 6/30/09
Agency investments 645,316$ 434,031$ 28,536$ 49.5% 44.3% 7.9%
Consumer 245,239 226,648 30,025 18.8% 23.1% 8.3%
Non-agency investments 184,811 144,457 104,702 14.2% 14.7% 29.0%
Mortgage 191,716 143,443 123,705 14.7% 14.6% 34.3%
Commercial 37,004 30,993 73,823 2.8% 3.2% 20.5%Total interest earning assets 1,304,086$ 979,572$ 360,791$ 100% 100% 100%
Percent of total As of
III. Institutional Group

$39 $43
$150
$238 $215 $245
$434
$239 $214
$251
$256
$197$174
$278$257
$401
$494
$412 $419 $434
$0
$200
$400
$600
2004 2005 2006 2007 2008 2009 2010 AnnlzdTWPG SF
$56 $61
$204
$303$390
$494
$639
$239 $214
$251
$256
$197
$174
$295$275
$455
$559$587
$668$639
$0
$200
$400
$600
$800
2004 2005 2006 2007 2008 2009 2010 AnnlzdTWPG SF
$17 $18
$54$65
$175
$249
$206
$0
$100
$200
$300
2004 2005 2006 2007 2008 2009 2010 AnnlzdSF
(1) Excludes TWPG Asset Management revenues. 2010 represents the
first nine months annualized for Stifel
and the first six months annualized for TWPG.
Institutional Group
CAGR: 14%
16
Net Revenues ($MM)(1)
Equity Capital Markets ($MM)(1) Fixed Income ($MM)
Provides securities brokerage, trading, research services, as well as underwriting and corporate advisorySF has opportunistically expanded talent pool
Victor Nesi, Co-Head of Institutional Group (June 2009)William Heinzerling, Head of Fixed Income Capital Markets (May 2009)Hired an 11-person sales & trading team from Bear Stearns, eight senior healthcare investment banking professionals, a four-person convertible securities team from Banc of America, and strategic hires from Wachovia, JPMorgan, Barclays and other top firms.
TWPG acquisition is highly complementary
Overview

Financial Institutions, 18%
Real Estate, 7%
Technology, 19%
Education, 1%
Energy & Power, 13%
Diversified Industrials, 3%
Consumer & Retail, 12%
Aerospace, Defense & Gov't
Svcs., 4%
Healthcare, 9%
Transportation, 4%
Internet, Media & Telecom, 5%
Metals & Mining, 5%
Large Cap, 26%
Mid Cap, 36%
Small Cap, 38%
17
One of the Largest U.S. Equity Research Platforms
#1 U.S. Equity Research Coverage(1) Significant Coverage Across All Market Caps
(2)
(1)
Source: Starmine
and Thomson Reuters rankings as of 9/30/10. Does not include Closed End Funds.(2)
Small Cap includes market caps less than $1 billion; Mid Cap includes market caps less than $5 billion. Note: Research coverage distribution as of 10/29/10.
Breadth Of Coverage Across Industry Sectors
Institutional Group
Companies Under CoverageRank Firm Overall Small Cap
1 JP Morgan 1,056 204 2 Stifel Nicolaus & Co. 1,025 374 3 BofA Merrill Lynch 931 166 4 Barclays Capital 891 136 5 Deutsche Bank Securities 846 167 6 Citi 799 112 7 Goldman Sachs 795 86 8 RBC Capital Markets 792 217 9 Raymond James 775 278
10 Credit Suisse 755 124 11 UBS 738 88 12 Morgan Stanley 723 94 13 Jefferies & Co. 680 209 14 Wells Fargo Securities, Llc. 650 151 15 Robert W. Baird & Co., Inc. 605 204 16 Morningstar, Inc. 571 76 17 Oppenheimer & Co. 570 178 18 Sidoti & Company LLC 561 362 19 BMO Capital Markets 513 122 20 Piper Jaffray 495 202 21 Macquarie Research Equities 489 119 22 Keefe, Bruyette & Woods 427 202 23 Argus Research Company 419 NA24 FBR Capital Markets 408 129 25 Keybanc Capital Markets 398 143
*Bold indicates middle-market firms.

Rank Broker # of Awards
1 Stifel 142 Credit Suisse 83 Deutsche Bank 73 J.P. Morgan Chase 73 UBS 76 BofA Merrill Lynch 66 Raymond James 66 Wells Fargo 69 Barclays Capital 59 Citigroup 59 Keefe Bruyette & Woods 59 KeyBanc Capital Markets 59 Oppenheimer & Co. 59 Standard & Poor’s 5
15 BMO Capital Markets 415 CL Kin & Associates 415 Cowen & Co. 415 Goldman Sachs 415 Jefferies 415 JMP Securities 415 Morgan Stanley 415 William Blair 4
18
StarMine
Broker Rankings
(2)
Institutional Group
#1 in WSJ “Best on the Street”
Survey (1)
Research Accolades
(1) Source: Wall Street Journal, 2010 “Best on the Street”
Survey; includes Stifel
and TWP. (2) Source: StarMine
Monitor. Note: Bold indicates middle-market firms.
Highlights#1 ranked research group of investment banks by awards in 2010 Wall Street Journal poll with 14 analysts#2 U.S. Ranking for 2009 FT/StarMine World’s Top Analysts#1 ranked equity research group for earnings estimate accuracy in StarMine’s 2008 and 2007 domestic rankingsFirst firm to be ranked #1 by Starmine for both earnings accuracy and stock pickingCover approximately 50% of the S&P 500
Analyst Profile> 50% of Analysts worked in the field they cover> 50% of Analysts started as Stifel AssociatesAverage sell side experience is > 10 Years and more than 33% of Analysts are CFA’s
Rank Broker # of Awards
1 Goldman Sachs 232 Stifel 173 BofA Merrill Lynch 154 Citigroup 134 Credit Suisse 134 Robert W. Baird 137 Barclays Capital 127 RBC Capital Markets 127 UBS 1210 Raymond James 11

19
Institutional Equity Sales
Powerful Institutional Equity Sales and Trading Platform
(1) 2009 U.S. Trading Volume per Bloomberg. Ranking reflects rank among middle-market investment banks.
U.S. Trading Volume: Middle Market Banks
(1)
Institutional Group
120 person sales force, commission basedExperts in small and mid cap growth and valueTeam based sales model with 2-4 coverage sales people per accountTeam leaders have an average of 15 years experienceOffices in all major institutional markets in North America & EuropeAccounts range from large mutual funds to small industry focused investorsManaged over 800 non-deal roadshow days in 2009Extensive experience with traditional and overnight corporate finance transactions
Equity Trading
35 coverage traders located in Baltimore, New York, Boston, Dallas, San Francisco, Denver, Cleveland and London20 position traders covering each major industryAgent model – no proprietary trading or prime brokerageProfitable model with advantages of scale
Rank Firm Shares in Millions
1 Jefferies 19,502 2 Stifel Nicolaus 12,784 3 Cowen 7,423 4 Oppenheimer 6,823 5 Cantor Fitzgerald 6,556 6 HSBC 6,038 7 Raymond James & Associates 5,357 8 Robert W. Baird 5,344 9 Friedman Billings Ramsey 5,069 10 Piper Jaffray 4,868 11 Wells Fargo 3,816 12 Keefe Bruyette Woods 3,329 13 Natexis Bleichroeder 3,291 14 Hapoalim Securities 3,035 15 Jesup & Lamont 3,030 16 Noble Financial Group 2,895 17 Brown Brothers Harrman 2,743 18 William Blair 2,559 19 Leerink Swann 2,115 20 Morgan Keegan 2,043 21 Sterne Agee 1,911 22 Macquarie 1,873 23 BMO Capital Markets 1,732 24 JMP Securities 1,672 25 Keybanc Capital Markets 1,621

20
Overview
Strong Fixed Income Capital Markets CapabilitiesPlatform & Products
Institutional Group
Client Distribution
Comprehensive platformApproximately 50 traders averaging 14 years of experienceAnnual client trade volume approaching $200 billion
Institutional Investor All-Star nominated teamWidespread distribution
Over 100 fixed income sales professionals covering over 3,200 accounts30 institutional fixed income offices nationwide
Focus on long-only money managers and income funds versus hedge fundsConsistency of executionIdentification of relative value through security selection
Agency/Gov’t SecuritiesAircraft Finance & Credit SolutionsAsset–Backed SecuritiesEmerging MarketsHigh Yield CreditInvestment Grade CreditMoney MarketsMortgagesMunicipalsStructured ProductsWhole Loans
Money Manager, 34%
Bank/Thrift, 28%
Broker/Dealer, 13%
Insurance, 7%
Government, 6%
Credit union, 5%
Other, 7%
Net Revenue ($MM)
$17 $18
$54$65
$175
$249
$206
$0
$100
$200
$300
2004 2005 2006 2007 2008 2009 2010 Annlzd

Equity Capital Raising
48%
Fixed Income Capital Raising
13%
Advisory 39%
21
Investment Banking Overview
Capital Markets M&A Advisory
Private Placements
Investment
Banking Product Areas
Institutional Group
Full-Service, Industry-Focused Middle-Market Investment BankOver 250 Investment Banking ProfessionalsOperates under the Stifel Nicolaus Weisel name
YTD(1)
Investment Banking Revenues
Equity & ConvertibleInitial public offeringsFollow-on offeringsAt-the-market offeringsPIPEs, registered directs, confidentially marketed offeringsConvertible securitiesSpecial situations block trading and buybacksStock distributions for fund LPsU.S. & Canadian listings
Fixed IncomeHigh yield debtInvestment grade debtPreferred securities Corporate bankingStructured financeAsset-backed securities
Sale & acquisition advisoryRecapitalizationsRestructuringsCorporate divestituresBuyouts/take privatesFairness opinions & valuations
Common stockPreferred stockPreferred securitiesTerm loansSecured debtUnsecured debtConvertible securitiesSub debtHigh yield debt
(1) YTD represents the first nine months of 2010.

Accomplished U.S. Equity Underwriting Franchise –
All Equity Transactions
Source: Dealogic. Rank eligible SEC registered IPOs and Follow-On offerings since 2005. Includes demutualizations. As of 9/30/10.Note: $ Volume represents full credit to underwriter for All Managed Equity Deals and apportioned credit to bookrunner
for Bookrun
Equity Deals.Note: Stifel
results based on pro forma figures for both Stifel
and TWP.Note: Bold font indicates middle-market firms.
Institutional Group
Bookrun
Equity Deals Since 2005All Managed Equity Deals Since 2005($ in billions) # of $
Rank Firm Deals Volume
1 Bank of America Merrill Lynch 1,087 $667.22 JPMorgan 1,016 $587.13 UBS 810 $449.04 Citi 791 $463.95 Wells Fargo Securities 758 $374.86 Morgan Stanley 719 $467.67 Barclays Capital 660 $378.28 Credit Suisse 650 $418.59 Goldman Sachs 606 $421.0
10 Deutsche Bank 570 $325.811 RBC Capital Markets 552 $203.312 Stifel Nicolaus Weisel 541 $128.813 Oppenheimer & Co Inc 397 $73.314 Raymond James 383 $124.615 Piper Jaffray & Co 346 $88.716 Jefferies & Company 324 $71.517 Keefe Bruyette & Woods 242 $103.118 Robert W Baird & Co 214 $60.519 BMO Capital Markets 213 $73.120 KeyBanc Capital Markets 209 $58.921 Cowen & Co LLC 198 $56.222 William Blair & Co LLC 190 $35.423 JMP Securities LLC 171 $29.324 Morgan Keegan & Co 164 $56.124 FBR Capital Markets 164 $40.5
($ in billions) # of $Rank Firm Deals Volume
1 Bank of America Merrill Lynch 813 $168.12 JPMorgan 678 $147.33 Morgan Stanley 562 $120.84 Citi 557 $114.75 UBS 490 $69.06 Goldman Sachs 476 $138.87 Barclays Capital 445 $71.58 Credit Suisse 411 $63.39 Deutsche Bank 300 $38.5
10 Wells Fargo Securities 297 $39.911 RBC Capital Markets 126 $11.911 Jefferies & Company 126 $9.013 Stifel Nicolaus Weisel 93 $6.314 Piper Jaffray & Co 90 $4.615 Oppenheimer & Co Inc 88 $4.016 Keefe Bruyette & Woods 85 $7.217 Raymond James 78 $6.018 Sandler O'Neill & Partners 63 $5.019 FBR Capital Markets 56 $5.220 Roth Capital Partners 51 $1.721 Robert W Baird & Co 41 $2.722 Cowen & Co LLC 40 $1.923 Lazard Capital Markets 35 $2.023 Canaccord Genuity Corp 35 $2.423 BMO Capital Markets 35 $3.8
22

($ in billions) # of $Rank Firm Deals Volume
1 Stifel Nicolaus Weisel 81 $10.92 JPMorgan 62 $10.52 Morgan Stanley 62 $9.34 Bank of America Merrill Lynch 56 $11.24 Piper Jaffray & Co 56 $6.96 Cowen & Co LLC 52 $4.67 Jefferies & Company 40 $5.28 Deutsche Bank 39 $5.39 Oppenheimer & Co Inc 36 $3.4
10 Credit Suisse 35 $4.411 Goldman Sachs 32 $4.912 William Blair & Co LLC 31 $3.412 Barclays Capital 31 $3.314 RBC Capital Markets 29 $3.015 Wells Fargo Securities 28 $4.316 JMP Securities LLC 27 $2.516 Needham & Company, LLC 27 $2.218 Citi 26 $4.319 UBS 25 $4.520 Lazard Capital Markets 19 $1.621 Pacific Crest Securities LLC 18 $1.922 Leerink Swann LLC 17 $1.323 Pacific Growth Equities LLC 16 $0.924 Panmure Gordon/Think Equity 12 $1.625 Raymond James 11 $2.9
Leadership in the Venture Capital Community
23
Institutional Group
Source: Venture backed IPOs rankings based on Dealogic
and Thomson One data as of 10/31/10.Note: Bold font indicates middle-market firms.
Venture-Backed IPOs 2005 –
10/31/2010Selected Venture Capital-Backed IPOs

24
Strong Momentum and Track Record as Bookrunner
Note: Includes all U.S. and Canadian bookrun
IPOs and underwritten equity and equity-linked offerings since 2002. 2010 results based on current YTD
run rate.
Institutional Group
% of Deals Bookrun
17%
23%
19%
24%
17%
26%
16%
20%
30%
42%
Filed/MandatedPipeline
0
1,000
2,000
3,000
4,000
5,000
6,000
2002 2003 2004 2005 2006 2007 2008 2009 2010E
Dea
l Val
ue ($
mm
)
0
10
20
30
40
50
60
70
No.
Dea
ls
No. Deals Deal Value

2525
Recent Bookrun
SaaS
IPOs
Convio SPS CommerceSciQuestMarket Cap @ IPO (mm) $131 $147 $193Offer to 1 Day 13% 14% 29%Offer to 1 Week 11% 10% 27%LTM/NTM Revenue $37.7 /$42.1 $63.1 /$68.0 $39.5 /$45.1LTM/NTM EBITDA $3.2 / $3.2 $6.6 /$7.3 $9.6 /$7.9EV/Revenue @ Pricing(2010E / 2011E)
2.7x / 2.3x 1.8x / 1.7x 3.9x / 3.4x
EV/Revenue Current(2010E / 2011E)
2.9x / 2.5x 1.8x / 1.7x 5.3x / 4.6x
EV/EBITDA @ Pricing(2010E / 2011E)
35.5x / 20.9x 16.7x / 12.1x 18.9x / 16.7x
EV/EBITDA Current(2010E / 2011E)
27.7x / 20.9x 15.9x / 12.2x 25.8x / 22.8x
VC Ownership BVCF, CID Capital, River Cities Capital,Split Rock Partners
Granite Ventures, Austin Ventures,El Dorado Ventures, Adams Street Partners
Trinity Ventures; Intersouth Partners
Bookrunner Selection Process
SciQuest selected SNW without conducting a formal bakeoff based on our experience with
SaaS models and the supply-chain management sector
SNW was originally mandated as co-lead manager alongside Goldman Sachs, but
management asked us to bookrun the deal after Goldman balked on the transaction
SPS Commence selected SNW based on our ability to execute a micro-cap IPO that would
allow long-term VC investors to achieve significant liquidity at the IPO (39% Sec)
Institutional Group

2626
Completed 72 Capital Markets Offerings Since 7/1/10, Including 15 IPOs
Institutional Group
Note: Selected Capital Markets Transactions. Completed offerings as of 11/12/10.

27
Strategic M&A Capabilities Driven by Deep Sector Knowledge
Institutional Group
As of 10/25/10. Represents period since 2000.(1
)
Strategic Advisor role includes Fairness Opinions, Merger of Equals, Recapitalizations and other Strategic Investments.
Transaction Role Differentiated ApproachBuyside 24% Dedicated senior M&A expertiseSell-side 49% Independent from common Wall Street conflicts
Strategic Advisor
(1) 27% Deep industry and cross-border expertiseQualified to execute complex, public-to-public as well as private M&A
M&A Industry Group Focus# Value
Industry Groups Sectors Transactions ($ billions)
Aerospace, Defense & Gov't Services Aerospace & Defense, Specialty Defense & Homeland Security, Government Services
36 $2.8
Cleantech Renewables, Energy Efficiency & Smart Grid, Energy Storage, Advanced Transportation & Fuels
5 $0.2
Consumer & Retail Food & Beverage, Gaming & Entertainment, Hardlines Retail, Softlines Retail, Products & Lifestyles, Restaurants
64 $4.3
Diversified Industrials Building Products & Construction Materials, Business Services, Capital Equipment, Engineering & Construction, Heavy Machinery, Infrastructure, Instruments & Controls, Waste & Environmental Services
92 $3.0
Education Education & e-Learning 23 $1.0Energy & Natural Resources Oil Exploration & Production, Oilfield Services, Utilities, MLPs, and
Royalty Trusts29 $5.8
Financial Institutions Asset Management, BDCs, Depository Institutions, Mortgage REITs, Specialty Finance
161 $10.8
Healthcare Biotech, Devices, Diagnostics & Tools, Information Technology, Services 68 $13.6Internet, Media & Communications Media & Entertainment, Internet Services, Telecom Services 105 $24.2Metals & Mining Precious & Base Metals, Basic Materials, Coal 29 $5.2Real Estate Health Care REITs, Industrial REITs, Retail REITs, Lodging REITs, Multi-
Family REITs, Office REITs23 $13.1
Technology Electronics & Supply Chain, Equipment & Storage, IT Services, Semiconductors, Software
126 $80.2
Transportation & Logistics Airlines, Logistics, Railroads, Trucking, Airfreight & Barge 14 $2.4Total 775 $166.7

IV. Third Quarter 2010 Financial Results
29
Chairmen’s Comments
“Our record net revenues and operating results demonstrate the diversity of our platform and our ability to navigate through changing economic conditions. We have made significant investments in our associates and infrastructure, the latest being the completion of the merger with Thomas Weisel Partners. As we build out our investment bank, we believe we are well positioned to take advantage of future opportunities,”
said Ronald J.
Kruszewski, Chairman, President and Chief Executive Officer.
30
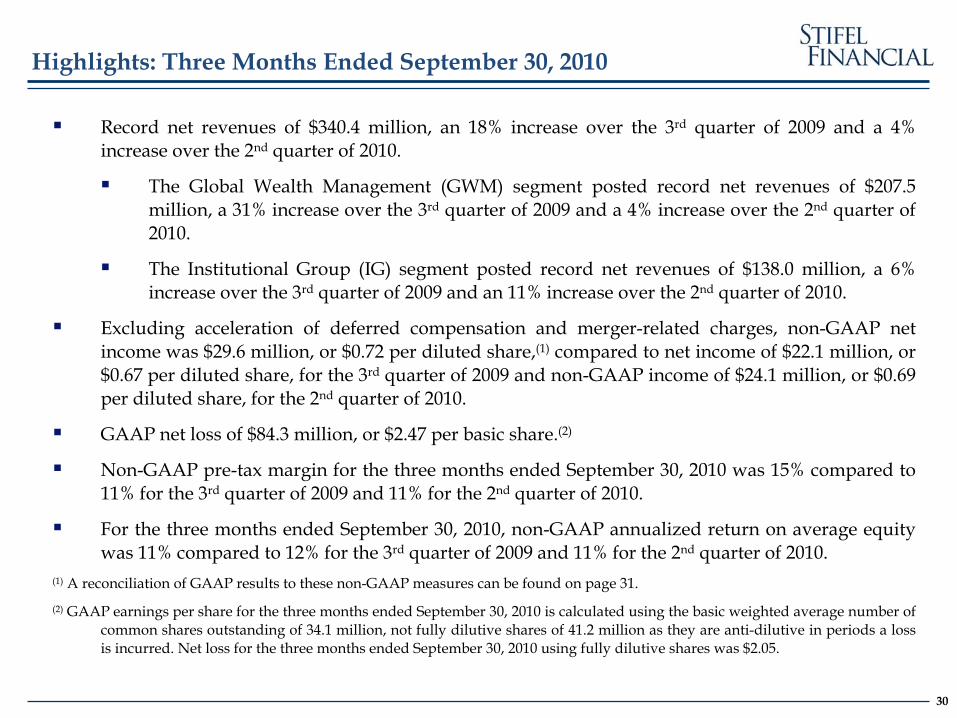
Record net revenues of $340.4 million, an 18% increase over the 3rd quarter of 2009 and a 4% increase over the 2nd quarter of 2010.
The Global Wealth Management (GWM) segment posted record net revenues of $207.5 million, a 31% increase over the 3rd quarter of 2009 and a 4% increase over the 2nd quarter of 2010.
The Institutional Group (IG) segment posted record net revenues of $138.0 million, a 6% increase over the 3rd quarter of 2009 and an 11% increase over the 2nd quarter of 2010.
Excluding acceleration of deferred compensation and merger-related charges, non-GAAP net income was $29.6 million, or $0.72 per diluted share,(1) compared to net income of $22.1 million, or $0.67 per diluted share, for the 3rd quarter of 2009 and non-GAAP income of $24.1 million, or $0.69 per diluted share, for the 2nd quarter of 2010.
GAAP net loss of $84.3 million, or $2.47 per basic share.(2)
Non-GAAP pre-tax margin for the three months ended September 30, 2010 was 15% compared to 11% for the 3rd quarter of 2009 and 11% for the 2nd quarter of 2010.
For the three months ended September 30, 2010, non-GAAP annualized return on average equity was 11% compared to 12% for the 3rd quarter of 2009 and 11% for the 2nd quarter of 2010.
(1)
A reconciliation of GAAP results to these non-GAAP measures can be found on page 31.(2)
GAAP earnings per share for the three months ended September 30, 2010 is calculated using the basic weighted average number of common shares outstanding of 34.1 million, not fully dilutive shares of 41.2 million as they are anti-dilutive in periods a loss is incurred. Net loss for the three months ended September 30, 2010 using fully dilutive shares was $2.05.
Highlights: Three Months Ended September 30, 2010

31
($ in thousands, except per share amounts) GAAP
Merger‐Related
Charges (1) Non‐GAAP
Quarter Ended 9/30/09 (GAAP)
%
Change(2)
Ended 6/30/09 (Non‐GAAP)
%
Change(2)
Net revenues 340,388$ 939$ 341,327$ 289,683$ 17.8% 328,009$ 4.1%
Compensation and benefits 395,936 (183,176) 212,760 193,131 10.2% 213,788 (0.5%)Non‐comp operating expenses 87,008 (8,495) 78,513 65,716 19.5% 73,251 7.2%Total non‐interest expenses 482,944 (191,671) 291,273 258,847 12.5% 287,039 1.5%
Income/(loss) before income taxes/(benefit) (142,556) 192,610 50,054 30,836 62.3% 40,970 22.2%Provision for income taxes/(benefit) (58,220) 78,635 20,415 8,698 134.7% 16,910 20.7%Net income/(loss) (84,336)$ 113,975$ 29,639$ 22,138$ 33.9% 24,060$ 23.2%
Earnings per share: (3)
Basic (2.47)$ 3.34$ 0.87$ 0.77$ 13.0% 0.78$ 11.5%Diluted (2.47)$ 2.77$ 0.72$ 0.67$ 7.5% 0.69$ 4.3%
Ratios to net revenues :Compensation and benefits 116.3% 62.3% 66.7% 65.2%Non‐comp operating expenses 25.6% 23.0% 22.7% 22.3%Income/(loss) before income taxes/(benefit) (41.9%) 14.7% 10.6% 12.5%
Three Months Ended September 30, 2010
(3) GAAP earnings per share i s ca lculated us ing the bas ic weighted average number of common shares outstanding of 34.1 mil l ion, not ful ly di lutive shares as they are anti ‐di lutive in periods a loss i s incurred. Net loss for the three months ended September 30, 2010, us ing ful ly di lutive shares of 41.2 mil l ion was $2.05.
(2) Quarterly resul ts compare non‐GAAP resul ts for the quarter ended September 30, 2010 to non‐GAAP resul ts for the quarter ended June 30, 2010 and to GAAP resul ts for the year‐ago period.
(1) Merger‐related charges cons is t of: amortization of backlog intangible of $0.9 mil l ion, non‐cash deferred compensation charges of $181.1 mil l ion and merger‐related charges of $11.5 mil l ion.
Stifel
Financial Corp. Results
Three months ended September 30, 2010

32
12/31/10 3/31/11
($ in thousands) Plan Actual Plan Actual Plan PlanOperating expenses:
Compensation and benefits 3,100$ 3,100$ 177,050$ 183,176$ (1) 700$ ‐
Non‐comp operating expenses 1,900 1,900 12,800 8,495 10,000 (3) 2,000
Total operating expenses 5,000$ 5,000$ 189,850$ 191,671$ 10,700$ 2,000$
After‐tax impact 3,000$ 3,000$ 113,910$ 113,975$ 6,420$ 1,200$
Impact to diluted EPS (net of tax) (0.09)$ (0.09)$ (2.68)$ (2) (2.77)$ (0.15)$ (2) (0.03)$ (2)
(1) Includes non‐cash compensation expense related to the modification of our deferred compensation plan of $181.1 million
($169.3 million of unit expense and $11.8 million of optional investment awards) and other merger‐related costs.(2) Calculated using an effective tax rate of 40% and fully‐diluted shares outstanding of 42.5 million.
6/30/10 9/30/10
Quarter Ended
(3) Non‐comp operating expenses plan for the quarter ended December 31, 2010 is a revised estimate compared to the $2.3 million previously disclosed in our August 12, 2010 presentation.
Estimated TWPG Merger-Related Expenses

33
Highlights: Nine Months Ended September 30, 2010
Record net revenues of $980.4 million, a 27% increase over the comparable period in 2009.
The GWM segment posted record net revenues of $606.8 million, a 48% increase over the comparable period in 2009.
The IG segment posted record net revenues of $375.9 million, a 4% increase over the comparable period in 2009.
Excluding acceleration of deferred compensation and merger-related charges, non-GAAP net income was $77.4 million, or $2.09 per diluted share, (1) compared to net income of $51.1 million, or $1.62 per diluted share, for the comparable period in 2009.
GAAP net loss of $39.5 million, or $1.24 per basic share.(2)
Non-GAAP pre-tax margin for the nine months ended September 30, 2010 was 13% compared to 10% for the comparable period in 2009.
For the nine months ended September 30, 2010, non-GAAP annualized return on average equity was 11% compared to 10% for the comparable period in 2009.
(1)
A reconciliation of GAAP results to these non-GAAP measures can be found on page 34.(2)
GAAP earnings per share for the nine months ended September 30,
2010 is calculated using the basic weighted average number of common shares outstanding of 31.9 million, not fully dilutive shares of 37.1 million as they are anti-dilutive in periods a loss is incurred. Net loss for the nine months ended September 30, 2010 using fully dilutive shares was $1.07.

34
Stifel
Financial Corp. Results
Nine months ended September 30, 2010
($ in thousands, except per share amounts) GAAP
Merger‐Related Charges Non‐GAAP
Nine Months Ended
9/30/2009
%
Change(1)
Net revenues 980,427$ 939$ 981,366$ 771,169$ 27.3%
Compensation and benefits 819,085 186,295 632,790 516,852 22.4%Non‐comp operating expenses 228,388 10,404 217,984 175,217 24.4%Total non‐interest expenses 1,047,473 196,699 850,774 692,069 22.9%
Income/(loss) before income taxes/(benefit) (67,046) 197,638 130,592 79,100 65.1%Provision for income taxes/(benefit) (27,559) 80,709 53,150 27,970 90.0%Net income/(loss) (39,487)$ 116,929$ 77,442$ 51,130$ 51.5%
Earnings per share:Basic (1.24)$ 3.67$ 2.43$ 1.85$ 31.4%Diluted (1.07)$ (2) 3.16$ 2.09$ 1.62$ 29.0%
Ratios to net revenues :Compensation and benefits 83.5% 64.5% 67.0%Non‐comp operating expenses 23.3% 22.2% 22.7%Income/(loss) before income taxes/(benefit) (6.8%) 13.3% 10.3%
(1) Resul ts compared to non‐GAAP resul ts for the nine months ended September 30, 2010 (2009 resul ts are GAAP).
Nine Months Ended September 30, 2010
(2) GAAP earnings per share i s ca lculated us ing the bas ic weighted average number of common shares outs tanding of 31.9 mil l ion, not ful ly di lutive shares of 37.1 mil l ion as they are anti ‐di lutive in periods a loss i s incurred.

35
Sources of Revenues
($ in thousands)9/30/10 9/30/09
% Change 6/30/10 % Change 9/30/10 9/30/09
% Change
Revenues
Principal transactions 123,194$ 123,238$ 0.0% 122,923$ 0.2% 363,537$ 341,777$ 6.4%
Commissions 96,986 90,905 6.7% 103,634 (6.4%) 305,655 246,236 24.1%
Asset mgt and service fees 50,876 27,012 88.4% 44,138 15.3% 136,117 78,266 73.9%
Investment banking 51,656 35,056 47.4% 41,252 25.2% 127,129 75,262 68.9%
Other 3,656 5,072 (27.9%) 3,757 (2.7%) 9,358 6,148 52.2%
Total operating revenues 326,368 281,283 16.0% 315,704 3.4% 941,796 747,689 26.0%
Interest revenue 17,718 11,306 56.7% 14,654 20.9% 47,019 31,782 47.9%
Total revenues 344,086 292,589 17.6% 330,358 4.2% 988,815 779,471 26.9%
Interest expense 3,698 2,906 27.2% 2,349 57.4% 8,388 8,302 1.0%
Net revenues 340,388$ 289,683$ 17.5% 328,009$ 3.8% 980,427$ 771,169$ 27.1%
Quarter Ended Nine Months Ended

36
($ in thousands) 9/30/10 9/30/09 % Change 6/30/10 % Change 9/30/10 9/30/09 % Change
Net revenues 207,484$ 158,659$ 30.8% 199,940$ 3.8% 606,845$ 409,911$ 48.0%
Compensation and benefi ts 119,100 96,711 23.2% 123,609 (3.6%) 367,447 253,169 45.1%
Non‐comp operating expenses 36,677 32,894 11.5% 35,890 2.2% 108,092 86,369 25.2%
Total non‐interest expenses 155,777 129,605 20.2% 159,499 (2.3%) 475,539 339,538 40.1%
Income before income taxes 51,707$ 29,054$ 78.0% 40,441$ 27.9% 131,306$ 70,373$ 86.6%
Ratios to net revenues :
Compensation and benefi ts 57.4% 61.0% 61.8% 60.6% 61.8%
Non‐comp operating expenses 17.7% 20.7% 18.0% 17.8% 21.0%
Income before income taxes 24.9% 18.3% 20.2% 21.6% 17.2%
Nine Months EndedQuarter Ended
Global Wealth Management

37
($ in thousands) 9/30/10 9/30/09 % Change 6/30/10 % Change 9/30/10 9/30/09 % Change
Net revenues:Interest 9,601 4,962 93.5% 8,171 17.5% 25,859 12,395 108.6%Other income 1,924 865 122.4% 1,062 81.2% 5,099 3,284 55.3%
Total revenues 11,525 5,827 97.8% 9,233 24.8% 30,958 15,679 97.4%Interest expense 1,378 911 51.3% 287 380.1% 2,112 2,605 (18.9%)
Total net revenues 10,147 4,916 106.4% 8,946 13.4% 28,846 13,074 120.6%
Compensation and benefits 739 914 (19.1%) 1,036 (28.7%) 2,804 1,968 42.5%Non‐comp operating expenses 3,280 1,832 79.0% 3,601 (8.9%) 11,360 5,492 106.8%
Total non‐interest expenses 4,019 2,746 46.4% 4,637 (13.3%) 14,164 7,460 89.9%
Income before income taxes 6,128$ 2,170$ 182.4% 4,309$ 42.2% 14,682$ 5,614$ 161.5%
Ratios to net revenues:Compensation and benefits 7.3% 18.6% 11.6% 9.7% 15.1%Non‐comp operating expenses 32.3% 37.3% 40.3% 39.4% 42.0%
Efficiency ratio (1) 40.1% 46.1% 50.1% 48.3% 46.4%Income before income taxes 60.4% 44.1% 48.1% 50.9% 42.9%
(1) Non‐interest expenses less the provis ion for loan losses as a percentage of net revenues .
Nine Months EndedQuarter Ended
Stifel
Bank & Trust

38
($ in thousands) 9/30/10 9/30/09 % Change 6/30/10 % Change 9/30/10 9/30/09 % Change
Sales and trading:Equity 43,711$ 39,733$ 10.0% 44,099$ (0.9%) 126,462$ 114,598$ 10.4%Fixed income 43,808 58,196 (24.7%) 44,263 (1.0%) 132,416 174,698 (24.2%)
87,519 97,929 (10.6%) 88,362 (1.0%) 258,878 289,296 (10.5%)Investment Banking:Capital raising 22,575 18,070 24.9% 25,220 (10.5%) 67,799 32,890 106.1%Advisory fees 23,063 12,724 81.3% 10,539 118.8% 42,516 33,197 28.1%
45,638 30,794 48.2% 35,759 27.6% 110,315 66,087 66.9%Other revenue 4,886 1,456 235.6% 481 915.8% 6,744 5,404 24.8%Total net revenue 138,043$ 130,179$ 6.0% 124,602$ 10.8% 375,937$ 360,787$ 4.2%
Ratios to net revenues :Sales and trading 63.4% 75.2% 70.9% 68.9% 80.2%Investment banking 33.1% 23.7% 28.7% 29.3% 18.3%Other 3.5% 1.1% 0.4% 1.8% 1.5%
100.0% 100.0% 100.0% 100.0% 100.0%
(1) Other income includes net interest and other income.
Nine Months EndedQuarter Ended
Institutional Group Revenues

39
25,89131,362
23,012
0
10,000
20,000
30,000
40,000
1Q 10 2Q 10 3Q 10US Market Daily
124 127131
100
110
120
130
140
1Q 10 2Q 10 3Q 10SF Daily Volumes
39
Volume Comparison
Stifel
Gained Market Share in 3Q 10
Source: U.S. industry composite volumes from Bloomberg and Stifel
volumes from internal sources.
Industry Volumes Declined 27% in 3Q 10 vs. 2Q 10 Stifel
Volumes Increased 4% in 3Q 10 vs. 2Q 10
(27%) 4%
Volume (Millions)

V. Conclusion

Stifel
is well-positioned in the current market:
Dislocation creating opportunity for market share gains
Ability to add talented professionals
Expand Fixed Income/High Yield
Evolving regulatory framework (Stifel is already regulated by the Fed)
Expand traditional Asset Management capabilities
Strong balance sheet
Looking Forward
41
We See Opportunity

Stifel
Financial Investor Presentation