fy2020 nine months financial results (ended november 30
TRANSCRIPT

© 2021 YASKAWA Electric Corporation
FY2020 Nine Months Financial Results(Ended November 30, 2020)
FY2020 Full-Year Forecasts(Ending February 28, 2021)
Notes:
Yaskawa Group has voluntarily adopted International Financial Reporting Standards (IFRS) since its Annual Securities Report submitted on May 28, 2020, in order to enhance business management through the unification of accounting standards and to improve the international comparability of financial information in capital markets. We have also changed the segment classification since fiscal 2020. As a result, the figures for the same period of the previous fiscal year were calculated taking into account the impact of these changes. (Please see P.19)
The information within this document is made as of the date of writing. Any forward-looking statements are made according to the assumptions of management and are subject to change as a result of risks and uncertainties. YASKAWA Electric Corporation undertakes no obligation to update or revise these forward-looking statements, whether as a result of new information, future events, or otherwise.
Figures in this document are rounded off, and may differ from those in other documents such as financial results.
The copyright to all materials in this document is held by YASKAWA Electric Corporation.No part of this document may be reproduced or distributed without the prior permission of the copyright holder.

© 2021 YASKAWA Electric Corporation 11
Contents
1. FY2020 Nine Months
Financial Results• FY2020 Nine Months Financial Results
• Business Segment Overview
• Revenue Breakdown by Business
Segment
• Revenue Breakdown by Destination
• Breakdown of Changesin Operating Profit
• Measures for FY2020 3Q
2. FY2020 Full-Year Forecasts• FY2020 Full-Year Financial Forecasts
• Breakdown of Changesin Operating Profit
3. Reference
• Retroactive Application of IFRS/
Business Reclassification to the
FY2019 Nine Months & Full-Year Results
• Capital Expenditure, R&D Investment,
Forex Rates and Sensitivity
• Financial Indices
• Revenue / Operating profit
• Quarterly Revenue Trends
• Quarterly Order Trends
• Major Production Bases

© 2021 YASKAWA Electric Corporation 22
Motion Control System Engineering
・Logistics
【Core products】・Large-scale wind power generator
and converter・PV inverters・Electrical systems for steel plants・Electrical instrumentation
systems for water supply plantsand sewage treatment facilities
Electrical instrumentation systems for water and
sewerage
Continuous-casting machine
【Core products】・Industrial robots- Arc and spot welding robots, painting robots
- FPD glass sheet transfer robots, handling robots
・Semiconductor wafer transferrobots
・Biomedical robots・Collaborative robots
Robotics
PV inverterXGI1500 150kW
Matrix converter
U1000
Other
Yaskawa AC drive
new series
Generator and converter for large-scale wind turbines
7-axis arc-welding robot
MOTOMAN-AR1440E
GA700
GA500
Business Overview
Dust and drip proofcollaborative robotMOTOMAN-HC20DT
【Core products】・AC servo motors and controllers・Linear servo motors・AC drives・PM motor
AC servo motor Σ-7 series
Small and versatile industrial robot
MOTOMAN-GP4

© 2021 YASKAWA Electric Corporation 3
• マスター テキストの書式設定
• 第 2 レベル
• 第 3 レベル
• 第 4 レベル
• 第 5 レベル
サブタイトルの書式設定
© 2021 YASKAWA Electric Corporation
1. FY2020 Nine Months
Financial Results(Ended November 30, 2020)

© 2021 YASKAWA Electric Corporation 44
FY2020 Nine Months Financial Results (Highlights)
FY2020 FY2019
Mar.-Nov. Mar.-Nov. Amounts %
Revenue \ 279.9bn. \ 309.8bn. -\ 29.9bn. -9.6%
\ 20.0bn. \ 19.1bn. +\ 0.9bn. +4.8%
\ 19.1bn. \ 19.2bn. -\ 0.1bn. -0.5%
\ 14.1bn. \ 13.6bn. +\ 0.4bn. +3.3%
Changes
Profit attributable
to owners of parent
Operating profit
Profit before
tax
• Revenue decreased due to decreased demand in the first half of the nine months due to the spread of new coronavirus infection
• Operating profit increased by improving profitability through thorough cost control

© 2021 YASKAWA Electric Corporation
ResultsProfit
ratioResults
Profit
ratioAmounts %
279.9 309.8 -29.9 -9.6%
Motion Control 128.0 137.2 -9.1 -6.7%
Robotics 99.6 116.5 -16.9 -14.5%
System Engineering 35.1 38.8 -3.6 -9.4%
Other 17.1 17.3 -0.2 -1.0%
20.0 7.2% 19.1 6.2% +0.9 +4.8%
Motion Control 18.2 14.3% 16.4 12.0% +1.8 +11.2%
Robotics 4.2 4.2% 4.8 4.1% -0.6 -12.6%
System Engineering 0.0 0.0% -0.3 -0.7% +0.3 -
Other -0.3 -1.5% 0.0 0.2% -0.3 -
Elimination or Corporate -2.2 - -1.9 - -0.3 -
FY2020 Mar.-Nov. Changes
Revenue
FY2019 Mar.-Nov.
Operating profit
5
•Profit increased for Motion Control and System Engineering despite lower revenue
•Revenue and profit of Robotics declined due to the impact of new coronavirus to the automobile industry, the segment's key market
FY2020 Nine Months Financial Results by Business Segment
(Billions of yen)

© 2021 YASKAWA Electric Corporation
FY2020 Mar.-Nov.
\ 128.0 bn.
16.418.2
12.0%
14.3%
8.0%
10.0%
12.0%
14.0%
0
5
10
15
20
25
FY2019 Mar.-Nov. FY2020 Mar.-Nov.
6
【Revenue】• AC servo & controller: New infrastructure-related
demand in China grew, while global demand for semiconductors and electronic component-related products remained firm
• Drives: Global demand slumped as the U.S. oil and gas-related demand significantly declined
【Operating profit】• Increased due to an improvement in profitability
reflecting growth in revenue in China and the effect of cost control
6
Business Segment Overview: Motion Control
Operating profit/loss (Billions of yen)
Operating profit ratio (%)
Revenue (Billions of yen)
Revenue breakdownby region
137.2128.0
0
40
80
120
160
FY2019 Mar.-Nov. FY2020 Mar.-Nov.

© 2021 YASKAWA Electric Corporation
FY2020 Mar.-Nov.
\ 99.6 bn.
7
【Revenue】• Automobile market was sluggish due to restrained
capital investment caused by the impact of the new coronavirus in regions except China
• In the general industrial sector, capital investment was seen mainly in China against the backdrop of expanding needs for automation
• Sales of semiconductor robots were solid【Operating profit】• Despite efforts to cut costs, posted a year-on-year
decrease due to decrease in revenue
Business Segment Overview: Robotics
Operating profit/loss (Billions of yen)
Operating profit ratio (%)
Revenue (Billions of yen)
116.5
99.6
0
40
80
120
FY2019 Mar.-Nov. FY2020 Mar.-Nov.
4.8
4.2
4.1%
4.2%
-5.0%
0.0%
5.0%
10.0%
15.0%
0
1
2
3
4
5
6
FY2019 Mar.-Nov. FY2020 Mar.-Nov.
Revenue breakdownby region

© 2021 YASKAWA Electric Corporation
-0.3
0.0
-0.7%
0.0%
-4.5%
-2.5%
-0.5%
1.5%
3.5%
-0.5
-0.3
-0.1
0.1
0.3
0.5
FY2019 Mar.-Nov. FY2020 Mar.-Nov.
8
【Revenue】• Domestic sales of steel plant and water supply and
sewerage electrical systems decreased due to the impact of the new coronavirus
• PV inverter business was solid as new products were launched
【Operating profit】• Improved mainly due to structural reforms and the
effect of launching new products
Business Segment Overview: System Engineering
Operating profit/loss (Billions of yen)
Operating profit ratio (%)
Revenue (Billions of yen)
Revenue breakdownby region
FY2020 Mar.-Nov.
\ 35.1 bn.
38.835.1
0
10
20
30
40
FY2019 Mar.-Nov. FY2020 Mar.-Nov.

© 2021 YASKAWA Electric Corporation 99
Revenue Breakdown by Business Segment
FY2019 Mar.-Nov. FY2020 Mar.-Nov.
Revenue Revenue
\ 309.8 bn. \ 279.9 bn.

© 2021 YASKAWA Electric Corporation
Amounts %
279.9 309.8 -29.9 -9.6%
Japan 97.0 111.4 -14.4 -12.9%
Overseas 182.9 198.4 -15.5 -7.8%
The Americas 43.1 55.5 -12.4 -22.4%
Europe 38.4 45.8 -7.5 -16.3%
China 72.1 64.0 +8.2 +12.8%Asian Countries
except China29.1 32.7 -3.5 -10.9%
Other 0.2 0.4 -0.2 -45.5%
Revenue
FY2019
Mar.-Nov.
ChangesFY2020
Mar.-Nov.
10
• Revenue of China grew year-on-year
Revenue Breakdown by Destination (1)
(Billions of yen)
Note : Europe includes Middle East and Africa.

© 2021 YASKAWA Electric Corporation 11
Revenue Breakdown by Destination (2)
FY2019 Mar.-Nov. FY2020 Mar.-Nov.
Revenue Revenue
\ 309.8 bn. \ 279.9 bn.
Note : Europe includes Middle East and Africa.

© 2021 YASKAWA Electric Corporation
-1.3
-7.3
+0.1
+9.3 +0.1
12
20.0 +0.9
19.1
Breakdown of Changes in Operating Profit( FY2019 Nine Months → FY2020 Nine Months )
FY2019Mar.-Nov.
FY2020Mar.-Nov.Profit
decreasedue to
revenue decrease
Effects of changes in forex
rates
Decrease in expenses
Increase inadded value
Other
(Billions of yen)

© 2021 YASKAWA Electric Corporation 13
Establishment of "i3-Mechatronics" business model
Development capabilities
・Accelerated preparation for the establishment of YASKAWA Technology Center
Sales capabilities
・Launched MOTOMAN-GP4, a small robot for general industry such as 3C*1
market
・Launched four models of MOTOMAN-PL series palletizing robots(payload 190-800kg)
・Enhanced collaboration of i3-Mechatronics CLUB
*2
Production capabilities
・Applied the concept of YASKAWA Solution Factory to robot plant in Japan
Reinforcement of the management base through "digital transformation"
Promotion of YDX*3
and work-style reform
・Early visualization of consolidated key management indicators
・Introduced a new personnel evaluation system in Japan and telework became established
*1: Digital communications equipment (From the three acronyms Computer, Communication, and Consumer Electronics)
Small robotMOTOMAN-GP4
Palletizing robotMOTOMAN-PL320
*2: Collaborative organization with partners to plan and create i3-Mechatronics solutions
Measures for FY2020 3Q
(scheduled to be established in March, 2021)
(opened collaboration lab in Japan)
(Calculation period shortened by approximately 60%)
*3: An abbreviation for YASKAWA digital transformation; Yaskawa’s unique activities to realize digital transformation

© 2021 YASKAWA Electric Corporation 1414
Confidential
• マスター テキストの書式設定
• 第 2 レベル
• 第 3 レベル
• 第 4 レベル
• 第 5 レベル
サブタイトルの書式設定
© 2021 YASKAWA Electric Corporation
2. FY2020 Full-Year Forecasts (Year Ending February 28, 2021)

© 2021 YASKAWA Electric Corporation 15
•Revise upward the full-year forecasts announced on October 9, 2020 due to improved demand in key markets such as automobile, semiconductor and electronic components
※Announced on October 9, 2020
FY2020 Full-Year Financial Forecasts (Highlights)
Amounts %
Revenue \ 380.9bn. \ 411.0bn. -\ 30.0bn. -7.3% \ 366.8bn.
\ 27.2bn. \ 24.2bn. +\ 3.0bn. +12.4% \ 22.3bn.
\ 26.4bn. \ 24.6bn. +\ 1.7bn. +7.0% \ 22.5bn.
\ 18.1bn. \ 15.6bn. +\ 2.5bn. +15.9% \ 15.5bn.
FY2020Previous forecasts※
FY2020
Forecasts
ChangesFY2019
Results
Operating profit
Profit before
tax
Profit attributable
to owners of parent

© 2021 YASKAWA Electric Corporation
ForecastsProfit
ratioResults
Profit
ratioAmounts %
380.9 411.0 -30.0 -7.3%
Motion Control 173.0 180.4 -7.4 -4.1%
Robotics 135.9 152.2 -16.2 -10.7%
System Engineering 48.8 55.5 -6.7 -12.1%
Other 23.1 22.8 +0.3 +1.4%
27.2 7.1% 24.2 5.9% +3.0 +12.4%
Motion Control 24.5 14.2% 20.6 11.4% +3.9 +19.2%
Robotics 6.8 5.0% 6.5 4.3% +0.3 +4.1%
System Engineering 0.0 0.0% 0.5 0.8% -0.5 -98.6%
Other -0.6 -2.4% -0.0 -0.1% -0.5 -
Elimination or Corporate -3.5 - -3.3 - -0.2 -
Changes
Operating profit
Revenue
FY2019FY2020
16
FY2020 Full-Year Financial Forecasts by Business Segment
(Billions of yen)

© 2021 YASKAWA Electric Corporation
-1.3
-7.4
+1.4
+9.9 +0.2 27.2
24.2
17
+3.0
Breakdown of Changes in Operating Profit (FY2019 → FY2020 Forecasts)
FY2019
FY2020ForecastsOther
Profitdecrease
due torevenue decrease
Effects of changes in forex
rates
Decrease in expenses
Increase in added
value
(Billions of yen)

© 2021 YASKAWA Electric Corporation 18
Confidential
• マスター テキストの書式設定
• 第 2 レベル
• 第 3 レベル
• 第 4 レベル
• 第 5 レベル
サブタイトルの書式設定
© 2021 YASKAWA Electric Corporation
3. Reference

© 2021 YASKAWA Electric Corporation 19
Retroactive Application of IFRS/Business Reclassification to the FY2019 Nine Months & Full-Year Results
Change Change Change Change
IFRSBusiness
reclassificationIFRS
Business
reclassification
309.8 - - 309.8 411.0 - - 411.0
Motion Control 135.4 - +1.8 137.2 177.9 - +2.6 180.4
Robotics 116.5 - - 116.5 152.2 - - 152.2
System Engineering 40.6 - -1.8 38.8 58.1 - -2.6 55.5
Other 17.3 - - 17.3 22.8 - - 22.8
16.8 +2.3 - 19.1 22.3 +1.9 - 24.2
Motion Control 14.9 +0.8 +0.7 16.4 18.7 +0.5 +1.3 20.6
Robotics 4.2 +0.2 +0.5 4.8 5.5 +0.1 +0.9 6.5
System Engineering -0.8 +0.6 -0.1 -0.3 0.2 +0.7 -0.5 0.5
Other -0.1 +0.1 - 0.0 -0.3 +0.2 - -0.0
Elimination or Corporate -1.4 +0.6 -1.1 -1.9 -1.8 +0.2 -1.7 -3.3
Profit attributable to owners of parent 11.1 +2.5 - 13.6 14.4 +1.1 - 15.6
Net sales , Revenue
Operating profit
(Unit: Billions of yen)
Japanese
accounting
standards
I F R S(After segment rivision)
F Y 2 0 1 9 Mar. - Nov. F Y 2 0 1 9 _ F u l l Y e a rJapanese
accounting
standards
I F R S(After segment rivision)

© 2021 YASKAWA Electric Corporation 2020
Capital Expenditure, R&D Investment, Forex Rates and Sensitivity
(Billions of yen)
Capital expenditure
Depreciation and
Amortization
R&D investment
Note:Average rate during the period
Mar.-Nov. 4Q 2H Full-Year Mar.-Nov. 4Q 2H Full-Year Mar.-Nov. 4Q 2H Full-Year
USD 110.4 110.6 111.7 110.5 108.9 109.5 108.8 109.0 106.5 102.0 103.6 105.4
EUR 129.8 125.9 127.8 128.9 121.5 120.9 120.1 121.4 121.6 126.0 125.0 122.7
CNY 16.65 16.25 16.28 16.56 15.71 15.69 15.48 15.70 15.38 15.90 15.79 15.51
KRW 0.100 0.099 0.099 0.100 0.093 0.093 0.092 0.093 0.090 0.095 0.093 0.091
USD
EUR
CNY
KRW
approx. 0.69approx. 0.56approx. 0.92approx. 0.19
approx. 0.12approx. 0.09approx. 0.25approx. 0.13
Revenue Operatiing profit
F Y 2 0 2 0 (Forcasts)
F Y 2 0 2 0 (Plan)
25.47
16.75
19.00
F Y 2 0 1 9
25.0035.65
16.00
Impact of 1% fluctuation (FY2020 Full-Year Forcasts)
20.79 18.00
F Y 2 0 1 9F Y 2 0 1 8
F Y 2 0 1 8
14.31
Capital expenditure, R&D investment
Forex rates
Forex sensitivity
(Yen)
(Billions of yen)

© 2021 YASKAWA Electric Corporation
0.1
0.2
0.3
0.4
0.5
0.6
0.0
FY2010 FY2011 FY2012 FY2013 FY2014 FY2015 FY2016 FY2017 FY2018 FY2019 FY2020 3Q
Equity attributable to owners parent
Interest-bearing debt
Ratio of equity attributable to owners of parent
21
Financial Indices
*Interest-bearing debt includes lease obligations.*Inventory at the end of the period is used for calculating turnover months.*ROE= Profit attributable to owners of parent /
Shareholders’ equity (average of beginning and end of fiscal year)*ROIC= Profit attributable to owners of parent /
Invested capital
Ratio of equity attributable to owners of parent 50.7%
Equity attributable to owners of parent 228.4 billion yen
Interest-bearing debt 81.6 billion yenD/E ratio 0.36(Net D/E ratio) 0.18Inventory 102.0 billion yen(Turnover) (3.0 months)ROE 6.6%ROIC 5.9%
As of February 29, 2020
Ratio of equity attributable to owners of parent 51.6%
Equity attributable to owners of parent 234.5 billion yen
Interest-bearing debt 80.0 billion yenD/E ratio 0.34(Net D/E ratio) 0.12Inventory 105.1 billion yen(Turnover) (3.4 months)
As of November 30, 2020
Operating CF 2.5 6.4 24.6 24.0 29.0 32.0 33.8 46.1 32.8 21.5 35.0Investment CF - 6.7 - 11.9 - 18.1 - 16.9 - 27.9 - 22.4 - 18.9 - 18.9 - 27.1 - 20.6 - 7.3
Free CF - 4.3 - 5.5 6.6 7.0 1.1 9.5 14.8 27.2 5.7 0.8 27.7
(Billions of yen)
[Note] Data up to February 2019 are based on Japanese GAAP.

© 2021 YASKAWA Electric Corporation 22
0
10
20
30
40
50
60
70
80
90
100
0.0
500.0
FY2010 FY2011 FY2012 FY2013 FY2014 FY2015 FY2016 FY2017 FY2018 FY2019 FY2020
Revenue
Operating profit
22
Revenue / Operating Profit (FY2010 - FY2020 Forecasts)
(Billions of yen)
Realize 100 Dash 25Challenge 100 Challenge 25
Note2: The data for FY2017 are made on a reference basis. (March 21, 2017 – March 20, 2018)Note1: Data up to FY2018 are based on Japanese GAAP.
〈Reference basis〉 (Forecasts)
1 Operating profit ratio

© 2021 YASKAWA Electric Corporation 23
0.0
20.0
40.0
60.0
80.0
100.0
120.0
140.0Japan The Americas
Europe China
Oher Asian Countries Other
0.0
20.0
40.0
60.0
80.0
100.0
120.0
140.0
(M) (R) (S) Other
23
Quarterly Revenue Trends (1)
Note1: Data of FY 19 and FY 20 are based on the values after segment reclassification.Note2: (M)=Motion Control (R)=Robotics (S)=System Engineering
(Billions of yen)Business segment Destination
(Billions of yen)

© 2021 YASKAWA Electric Corporation 2424
Quarterly Revenue Trends (2)
(Billions of yen)Motion Control Robotics
(Billions of yen)
Note: Data of FY 19 and FY 20 are based on the values after segment reclassification.
0.0
10.0
20.0
30.0
40.0
50.0
60.0
70.0Japan The Americas
Europe China
Oher Asian Countries Other
0.0
10.0
20.0
30.0
40.0
50.0
Japan The Americas
Europe China
Oher Asian Countries Other
© 2021 YASKAWA Electric Corporation 25
1Q 2Q 3Q 4Q 1Q 2Q 3Q 4Q 1Q 2Q 3Q
YoY +10% -4% -9% -17% -17% -14% -11% -4% -12% -14% -0%
QoQ +8% -10% -4% -10% +7% -6% -2% -3% -1% -8% +14%
( M ) +3% -7% -12% -20% -26% -15% -7% +4% -8% -14% +2%
YoY ( R ) +15% +7% -8% -10% -19% -22% -17% -15% -18% -16% -2%
( S ) +14% -37% +4% -17% +64% +27% -6% -3% -13% -14% -1%
( M ) +21% -19% -9% -11% +13% -7% -0% -1% +0% -13% +19%
QoQ ( R ) +11% -4% -7% -9% -0% -7% -2% -6% -4% -5% +15%
( S ) -39% +20% +27% -11% +21% -7% -6% -8% +8% -8% +8%
円/ドル 107.8 110.8 112.7 110.6 111.0 107.6 108.2 109.5 107.6 106.8 105.2円/ユーロ 130.9 128.9 129.6 125.9 124.7 120.6 119.3 120.9 117.9 122.8 124.0
FY2020
為替
レート
FY2018
全社
FY2019
25
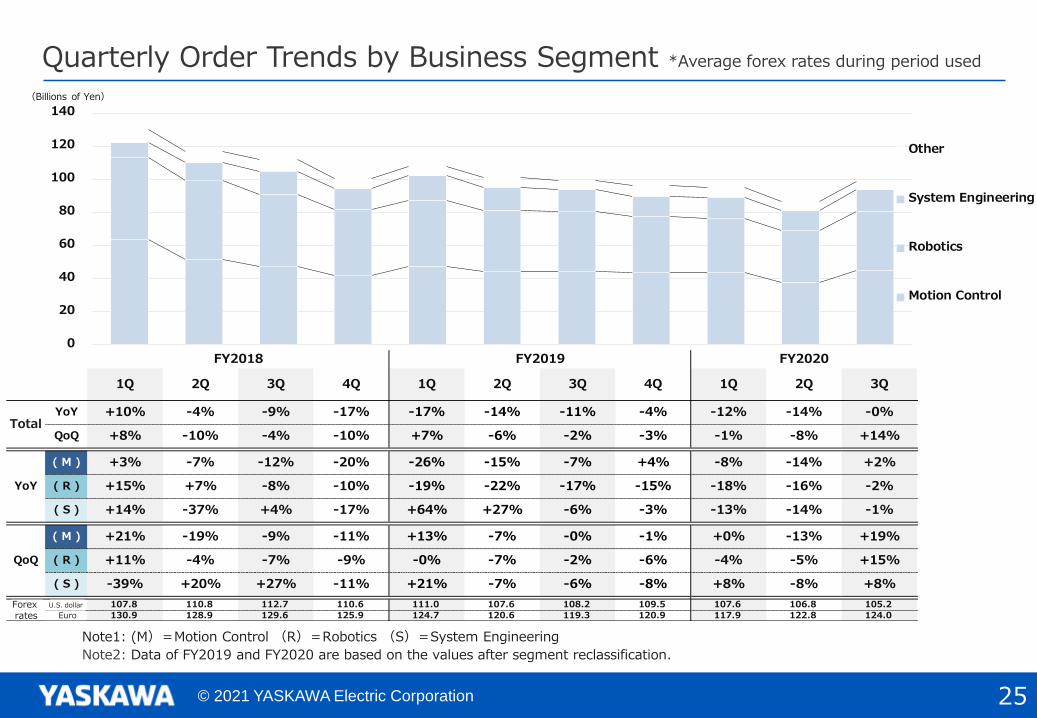
Quarterly Order Trends by Business Segment *Average forex rates during period used
Forex rates
U.S. dollar
Euro
Total
Note2: Data of FY2019 and FY2020 are based on the values after segment reclassification.
Note1: (M)=Motion Control (R)=Robotics (S)=System Engineering
0
20
40
60
80
100
120
140
Other
System Engineering
Robotics
Motion Control
(Billions of Yen)

© 2021 YASKAWA Electric Corporation 2626
Quarterly Order Trends by Destination *Average forex rates during period used
1Q 2Q 3Q 4Q 1Q 2Q 3Q 4Q 1Q 2Q 3Q
YoY +10% -4% -9% -17% -17% -14% -11% -4% -12% -14% -0%
QoQ +8% -10% -4% -10% +7% -6% -2% -3% -1% -8% +14%
Japan +18% +4% -6% -6% -15% +1% -4% +6% -3% -20% -11%
The
Americas+11% -10% -5% -10% -23% -8% -21% -5% -28% -28% -16%
YoY Europe +16% -6% +11% -15% +7% -33% -19% -13% -27% -11% +2%
China +8% -8% -23% -35% -22% -21% -3% -15% -1% +13% +28%
Other Asian
Countries-6% -13% -28% -21% -30% -20% -18% -7% -12% -21% +8%
Japan +4% -2% -1% -7% -7% +17% -5% +3% -15% -4% +5%
The
Americas+10% -12% +8% -14% -6% +5% -8% +4% -29% +6% +7%
QoQ Europe +5% +5% +8% -28% +32% -34% +27% -21% +10% -20% +46%
China +12% -24% -21% -4% +35% -23% -3% -16% +57% -12% +10%
Other Asian
Countries+7% -17% -13% +3% -5% -5% -11% +16% -10% -15% +22%
FY2020
Total
FY2018 FY2019
Note: Data of FY2019 and FY2020 are based on the values after segment reclassification.
0
20
40
60
80
100
120
140
Other
Other Asian Countries
China
Europe
The Americas
Japan
(Billions of Yen)

© 2021 YASKAWA Electric Corporation 2727
YASKAWA India Private Ltd.
Robotics Div.
YASKAWA America, Inc.Drives&Motion Div.
YASKAWA Electric UK Ltd.
YASKAWA Nordic AB
Scotland
Germany
Sweden
Canada
U.S.
Brazil
YASKAWA America, Inc.Motoman Robotics Div.
Mexico
YASKAWA Europe GmbH Robotics Div.
YASKAWA Europe Robotics d.o.o.
Slovenia
China
U.S.
YASKAWA Mexico, S.A. de C.V.
YASKAWA Elétrico do Brasil Ltda.
Motoman Robotica do Brasil
YASKAWA India Private Ltd.
India
India
YASKAWA Canada, Ltd.
Yaskawa Electric Corp.【Production bases in Japan】
- Yahata-nishi Plant (Yaskawa Robot Center)-Yahata-higashi Plant -Yukuhashi Plant (Drive Center/ System Engineering Center) -Iruma Plant (Solution Center)
-Nakama Plant
YASKAWA (China) Robotics Co., Ltd
China
Shanghai Yaskawa Drive Co., Ltd.China
YASKAWA SHOUGANG ROBOT CO.,LTD.
YASKAWA Electric (Shenyang) Co., Ltd
China
Major overseas production bases
Production bases in Japan
Major Production Bases

© 2021 YASKAWA Electric Corporation 28
© 2019 YASKAWA Electric Corporation
© 2021 YASKAWA Electric Corporation