status of hydrogen production with co capture · 2019-11-06 · status of hydrogen production with...
TRANSCRIPT

STATUS OF HYDROGEN PRODUCTION WITH CO2 CAPTURE- INCLUDING PERSPECTIVES ON EMISSIONS AND SCALE
Sigmund Ø. Størset, SINTEF
Research Manager, Leader of SINTEF
Coorporate Hydrogen Initiative
CSLF Workshop, Chatou Nov. 6 2019

Integrated syngas production & gas separation
2Voldsund, M., Jordal, K. and Anantharaman, R. (2016) ‘Hydrogen production with CO2 capture’, International Journal of Hydrogen Energy

Protonic Membrane Reformer technology
3
NG + Steam
H2
PCR
Q
PMRCO2
Today’s solution Protonic Membrane Reformer (PMR)
Process Stepreduction
Key advantages:
✓ H2 Compression
✓ Heat integration
✓ SMR+WGS as single stage
✓ H2 Separation
✓ Simple CO2 capture
Syngas
Fuel
Air
NG + Steam
Q
H2
CO2
WGSSMRHeat H2
Separation
H2
Compression
CO2
capture
Steam Methane Reforming w. CCS (6 steps)
Malerød-Fjeld, H. et al. (2017) ‘Thermo-electrochemical production of compressed hydrogen from methane with near-zero energy loss’. Nature Energy

Protonic Membrane Reformer (PMR) technology
4
• "Tube-in-shell" membrane reactor producing pure H2
from natural gas
• Membrane wall has three layers:
• Anode (thickest layer, porous material - BZCY and Ni)
• Solid electrolyte (dense proton conductor - BZCY)
• Cathode (porous material - BZCY and Ni)
• High-pressure H2 is delivered to shell (electrochemical
compression)
Malerød-Fjeld, H. et al. (2017) ‘Thermo-electrochemical production of compressed hydrogen from methane with near-zero energy loss’. Nature Energy

5
PSA
Membrane
Berstad, D., Anantharaman, R. and Nekså, P. (2013) ‘Low-temperature CO2 capturetechnologies – Applications and potential’, International Journal of Refrigeration.
Low temperature CO2 separation – capture conditions

• H2-rich off-gas can be partially recycled to the reactor
maximizing the overall HRF and CO conversion
Low-temperature separation technology
• Vapor–liquid phase separation after compression and cooling of the gaseous mixture
• Obtainable CO2 capture rate, specific separation and compression work, and thus power consumption, are
sensitive to the CO2 concentration of the incoming flue- or syngas
• CO2-enhanced retentate stream ideal incoming stream
Berstad, D., Anantharaman, R. and Nekså, P. (2013) ‘Low-temperature CO2 capturetechnologies – Applications and potential’, International Journal of Refrigeration.
6

Membane + Low temperature processfor H2 & CO2 production from syngas
7

ELEGANCY –Enabling a low carbon economy by H2 and CCS
8
Sustainable Decisions
• Duration: 2017-08-31to 2020-08-31.
• Budget: 15 599 kEUR

Hydrogen production with CCS
Anne Streb, Marco Mazzotti, ETH Zurich 9
→VPSA promising for process intensification
→New adsorption processes are needed for this separation
→Cycle design for a generic inlet stream and a commercial activated carbon
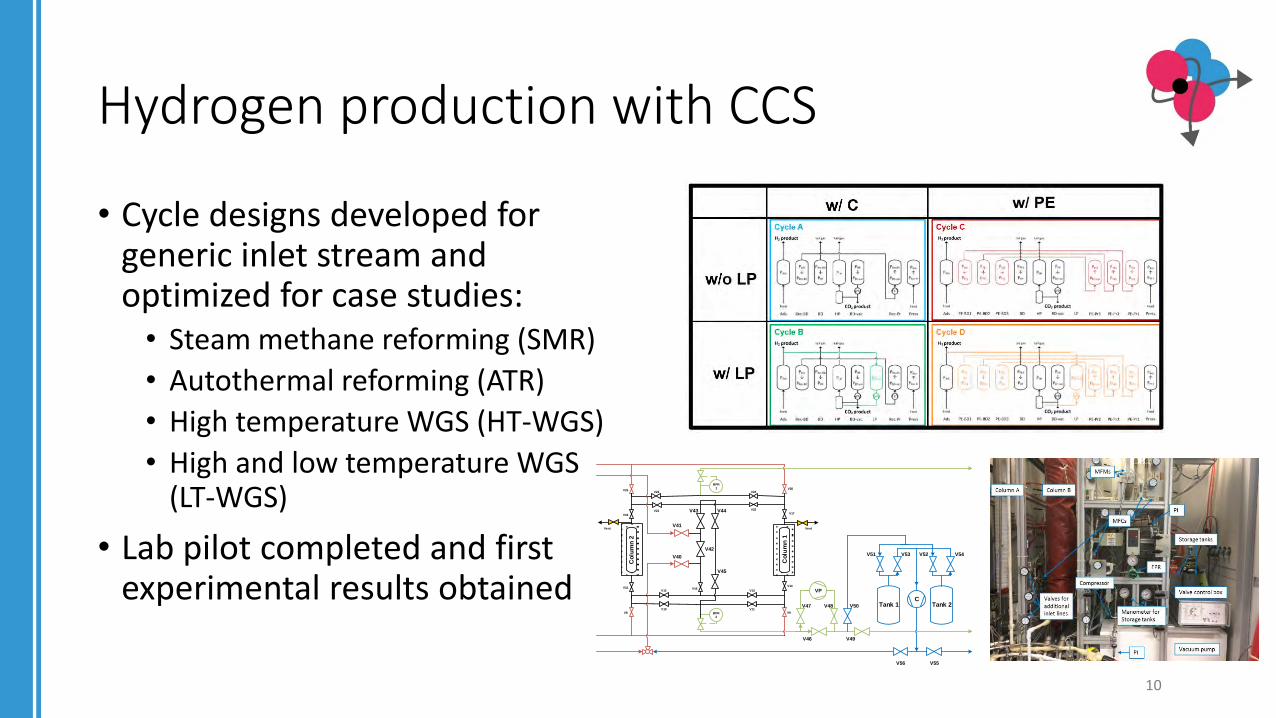
Hydrogen production with CCS
• Cycle designs developed for generic inlet stream and optimized for case studies:
• Steam methane reforming (SMR)
• Autothermal reforming (ATR)
• High temperature WGS (HT-WGS)
• High and low temperature WGS (LT-WGS)
• Lab pilot completed and first experimental results obtained
10
Vent
BPR
1
BPR
2
Vent
Co
lum
n 2
V12 V13V15
V11V10
V16
V8
V25
V19
V23
V21
V14
V9
V24
V22
V26
V17
VP
Tank 1C
Co
lum
n 1
V40
V41
V42
V43 V44
V45
V47 V48
V46
V50
V49
V51 V53 V54V52
V55V56
Tank 2

Cycle D application: Separation performance for different case studies
SMR + HT-WGSSMR + LT-WGS
ATR + LT-WGS
ATR + HT-WGS
𝑟CO2≥ 0.90
𝛷CO2≥ 0.96
SMR + HT-
WGS
SMR + HT-WGS
+ LT-WGS
ATR + HT-WGS
ATR + HT-WGS
+ LT-WGS
H2 mol% 75.81 76.2 70.6 72.73
CO2 mol% 16.31 19.6 19.74 25.6
CH4 mol% 3.03 3.5 0.34 0.5
CO mol% 4.65 0.4 9 0.9
N2 mol% 0.2 0.3 0.24 0.2
Ar mol% 0 0 0.08 0.07
Adsorbent Zeolite 13X
11
H2 Separation Performance
▪ Very high H2 purity possible
▪ H2 purity limited for ATR: Argon in H2 product

"Green" or "Blue" hydrogen?
12

0
20
40
60
80
100
120
140
160
0 10 20 30 40 50 60 70 80 90 100
CO
2in
ten
sity
of
LH2
pro
du
ctio
n [
kg/M
Wh
HH
V]
CO2 intensity of grid electricity [kg/MWh]
Mythbusting: "Blue hydrogen" vs. "Green hydrogen"
13
Up-/mid-stream emissions from natural gas production
Indirect CO2 emissions from electricity consumption
Natural gas reforming with 93.4 % CO2 capture+ Liquefaction
16.4 kg/MWhel
Norway average (2017, NVE)
Direct CO2 emissions from reforming plant (93.4 % CO2 capture)

0
20
40
60
80
100
120
140
160
0 10 20 30 40 50 60 70 80 90 100
CO
2in
ten
sity
of
LH2
pro
du
ctio
n [
kg/M
Wh
HH
V]
CO2 intensity of grid electricity [kg/MWh]14
Up-/mid-stream emissions from natural gas production
Indirect CO2 emissions from electricity consumption
Water electrolysis+ Liquefaction
Natural gas reforming with 93.4 % CO2 capture+ Liquefaction
16.4 kg/MWhel
Norway average (2017, NVE)
Direct CO2 emissions from reforming plant (93.4 % CO2 capture)
Mythbusting: "Blue hydrogen" vs. "Green hydrogen"
"Green" or "Blue" hydrogen?
15

= Clean hydrogen?
16

How large is large is large-scale?In perspective: 500 ton liquid hydrogen per day
• 820 MWHHV hydrogen energy flux
• 7 TWh per year of hydrogen energy
output
• Decabonised fossil route (NG with CCS):
• < 1 % of annual Norwegian natural gas production
• Renewable route (electricity as sole
primary energy source):
• > 1200 MW electric power
• ≈ 10 TWhel annually (about 7 % of annual Norwegian
power generation)17
Source: Kawasaki Heavy Industries

~70% efficiency for H2 production, CO2
capture and H2 liquefcation
18
Liqu
id h
ydro
genMWel
MW LHVMW HHV
MW LHVMW HHVInput/Output MWLHV MWHHV
Natural gas input 810.9 891.7
Hydrogen LH2 product output 694.4 821.2
MWel
Net power requirement 245.2
Plant Efficiency (1st law efficiency) LHV basis HHV basis
Stand-alone for the NG-based system 66.9 % 72.8 %
Stand-alone for the electrolyser-based system 57.1 % 67.5 %
Overall for the 450 + 50 t/d plant 65.8 % 72.2 %
Including > 93 % CO2 capture ratio

• Comparison of greenhouse gas emissions related to production of hydrogen from
• European grid electricity via electrolysers
• Natural gas with carbon capture
• Hydrogen production from natural gas using autothermal reformers with 93 % (2016) to 96 % (2030 - 2050) CO2 capture ratio
• European grid electricity mix shown in the pie-chart – forecasts based upon the IRENA REmapcase for 2030 and the decarbonised scenarios from "A Clean Planet for All" for 2050
• Without deep decarbonization of the European power generation, emissions from production of hydrogen from dedicated renewably based electricity must account for potentially reduced emission reductions of the power sector
19
Hydrogen produced from natural gas with CCS will have lower GHG emissions than hydrogen from electricity in the EU grid for decades

• Estimated upper bounds for annual emission reductions in Europe due to the use of hydrogen to replace fossil fuels
• Hydrogen consumption estimated from predictions for final energy consumption in 2050
• Total potential: 813 Mt CO2(2016 emissions: 4300 Mt CO2)
20
The potential for reducing Europe's greenhouse gas emission by use of clean hydrogen is more than 800 Mt CO2/year in 2050 (19% of current GHG emissions)
4300
3487
207
276
30129
0
500
1000
1500
2000
2500
3000
3500
4000
4500
5000
European GHG emissions in 2016 Share of emission reductions in 2050
GH
G e
mis
sio
ns
[Mt
CO
2eq
.]
Power
Residential and commercial
Transport
Industry
Other emission reductions
European GHG emissions in 2016
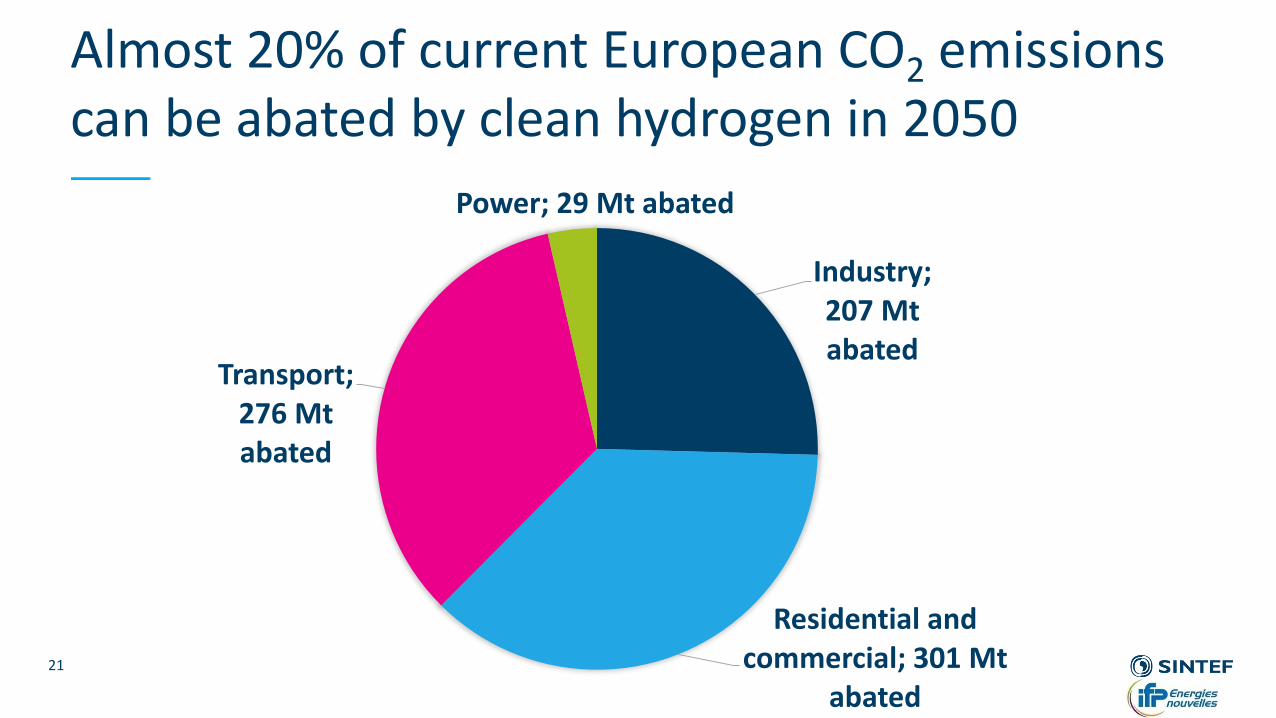
Almost 20% of current European CO2 emissions can be abated by clean hydrogen in 2050
21
Industry; 207 Mt abated
Residential and commercial; 301 Mt
abated
Transport; 276 Mt abated
Power; 29 Mt abated

Technology for a better society