lam pt status of capture fisheries activities and mangemen
TRANSCRIPT

STATUS OF CAPTURE FISHERIES ACTIVITIES AND
MANAGEMENT IN TRI AN RESERVOIR, VIETNAM
by
Phan Thanh Lam
A thesis submitted in partial fulfilment of the requirements for the Master
of Science Degree in International Fisheries Management
Department of Economics and Management
Norwegian College of Fishery Science
University of TromsØ, Norway
May 2006

MSc. Thesis
STATUS OF CAPTURE FISHERIES ACTIVITIES AND
MANAGEMENT IN TRI AN RESERVOIR, VIETNAM
by
Phan Thanh Lam
A thesis submitted in partial fulfilment of the requirements for the Master of
Science Degree in International Fisheries Management
Department of Economics and Management
Norwegian College of Fishery Science
University of TromsØ, Norway
May 2006

- i -
ACKNOWLEDGEMENTS First and foremost, I would like to express sincere gratitude to my supervisor Ass.
Prof. Arne Eide for his full support and supervision both during the preparation of
the proposal and the write up of the thesis. Then I would like to thank all the
Professors and Coordinators that have contributed to making these two years here at
the Norwegian College of Fishery Science very memorable and educational.
My sincere gratitude goes to the Norwegian government, the State Education Loan
Fund for granting me the scholarship to undertake graduate studies at the University
of Tromsø. I would also like to thank the SEMUT for its financial support that
enabled me to undertake my fieldwork. At large, thanks to NFH for all the quality and
effort you put in for the running of this International Master course.
The data on which this paper is based were collected under the Dong Nai Fisheries
Company, Vietnam. Special gratitude goes to the Dong Nai Fisheries Company
officials for their permission to carry out the study. I am highly grateful to Mr. Dau
Trong Bang, Vice Director, and Mr. Phan Trung Liet, Chief of the Technical Fisheries
Division of the Dong Nai Fisheries Company, for their support and cooperation during
my fieldwork. I also thank to Dr. Nguyen Thanh Tung and my colleagues at Research
Institute for Aquaculture No.2, for their invaluable support and suggestions throughout
the course of this study. I express thank to Dr. Nguyen Thanh Hung and Ms. Paula
Brown for their comments and English review of manuscript.
I dearly thank my family, my wife, little son and mother-in-law, for their never-ending
love and moral support. Finally yet importantly, I thank all my IFM classmates, UiTØ
and Vietnamese friends who have been part of my stay in Tromsø, it was a pleasure
and experience to have acquainted with you all.
Tromsø, 12 May 2006
Phan Thanh Lam
- ii -
TABLE OF CONTENTS
ACKNOWLEDGEMENTS ................................................................................................i
LIST OF FIGURES........................................................................................................... iii
LIST OF TABLES.............................................................................................................iv
ABBREVIATIONS............................................................................................................v
ABSTRACT.......................................................................................................................vi
I. INTRODUCTION.........................................................................................................2
1.1. Introduction ......................................................................................................2
1.2. Main concerns of the study..............................................................................3
II. BACKGROUND OF FISHERY IN TRI AN RESERVOIR ......................................5
2.1. Characteristics of fisheries resources ..............................................................5
2.2. Status of fish stocking program.......................................................................9
2.3. Status of capture fisheries activities ..............................................................11
2.4. Fisheries management practices ....................................................................14
III. MODEL ......................................................................................................................17
3.1. The logistic growth model .............................................................................17
3.2. Modified surplus production model ..............................................................18
3.3. Biological analysis .........................................................................................22
3.4. Economic analysis .........................................................................................23
IV. DATA AND PARAMETERS ESTIMATION .......................................................27
4.1. Type of data ...................................................................................................27
4.2. Data analysis ..................................................................................................29
4.3. Parameters estimation ....................................................................................34
V. RESULTS ....................................................................................................................35
5.1. Trends in catch, effort, CPUE and stocking..................................................35
5.2. Impact of stocking on population growth and harvest regime .....................38
5.3. Estimations of reference points and economics rents ...................................39
VI. DISCUSSION AND CONCLUSION.......................................................................44
6.1. Discussion ......................................................................................................44
6.2. Conclusion and management implications....................................................51
REFERENCES .................................................................................................................57
APPENDICES ..................................................................................................................62

- iii -
LIST OF FIGURES
Figure 2.1. Map of Tri An reservoir showing the location and study area..................5
Figure 2.2. Photographs of main stocked fish in Tri An reservoir ..............................7
Figure 2.3. The distribution of stocked species from 1995 to 2003 ............................9
Figure 2.4. Trends of fish stocking program from 1993 to 2005 ..............................10
Figure 2.5. Trend of catch and effort from 1993 to 2005 ..........................................13
Figure 3.1. Population growth according to the logistic curves ................................20
Figure 3.2. Plot of population growth versus stock biomass and stocking rate .............20
Figure 3.3. Plot of harvest curve versus effort level and stocking rate ......................21
Figure 3.4. Plot of profit curve versus effort level and stocking rate ........................24
Figure 3.5. Plotted curves of TR, TC vs. effort and stocking....................................26
Figure 5.1. Trends of actual catch, effort and CPUE over time ................................35
Figure 5.2. Trends in standardized catch, effort and CPUE, 1999-2005...................36
Figure 5.3. Trends of actual catch and standardized catch, 1999-2005.....................37
Figure 5.4. Plotted curve of standardized CPUE vs. effort and stocking ..................38
Figure 5.5. Population growth curve vs. stocking and stock biomass levels.............38
Figure 5.6. Plotted curve of harvest vs. effort and stocking ......................................39
Figure 5.7. Plotted curve of profit vs. effort and stocking.........................................40
Figure 5.8. Harvest curve vs. stocking and effort at harvest condition 3 ..................43
Figure 5.9. Profit curve vs. stocking and effort at harvest condition 3......................43

- iv -
LIST OF TABLES
Table 2.1. Estimating the maximum stocking density for Tri An reservoir ..............11
Table 2.2. Major fishing gears used in Tri An reservoir ...........................................12
Table 4.1. Actual catch and efforts data of capture fisheries, 1993-2005 .................27
Table 4.2. Average investment fishing costs of households (2004-2005).................28
Table 4.3. Fish stocking activity in Tri An reservoir, 1993-2005 .............................29
Table 4.4. Effort standardizations by type of fishing gears from 1999 to 2005 ........31
Table 4.5. Cost-efficiency analysis by fishing gears .................................................33
Table 4.6. Estimated parameters based on non-linear regression model...................34
Table 5.1. Standardized catch, effort and CPUE, 1999-2005....................................36
Table 5.2. Calculation indicators of the reference points and economic rents ..........41

- v -
ABBREVIATIONS
AMCF Assessment of Mekong Capture Fisheries
CPUE(E, S) Catch per Unit of Effort as a function of Effort and Stocking
DNFC The Dong Nai Fisheries Company
E Effort
EMEY Effort at Maximum Economic Yield
EMSY Effort at Maximum Sustainable Yield
EOAY Effort at Open Access Yield
FAU The University of Agriculture and Forestry
H(E, S) Harvest as a function of Effort and Stocking
MEY Maximum Economic Yield
MoF Ministry of Fisheries
MRC Mekong River Commission
MSY Maximum Sustainable Yield
MSPM Modified Surplus Production Model
OAY Open Access Yield
R2 The coefficient of determination
RIA2 Research Institute for Aquaculture No.2
rs Intrinsic growth rate affected by fish stocking
S Stocking
SMEY Stocking at Maximum Economic Yield
SMSY Stocking at Maximum Sustainable Yield
SOAY Stocking at Open Access Yield
SPM Surplus Production Model
TC(E, S) Total Cost as a function of Effort and Stocking
TR(E, S) Total Revenue as a function of Effort and Stocking
VNDs Vietnamese Dongs (currency, 15,908 VNDs is equivalent to 1$)
Π(E, S) Profit as a function of Effort and Stocking

- vi -
ABSTRACT
Reservoir fisheries management must be based on an understanding that they are
complex and dynamic ecosystem. This study describes fisheries activities status in the
Tri An reservoir. The main objective is to determine an efficient exploitation level of
fisheries resources affected by the stocking program. The Verhulst-Schaefer model
(logistic growth) was applied and the classic model modified to also include the case
of stocking. The modified surplus production model (MSPM) that considers fish
stocking as a major factor influencing population growth has been employed to
estimate static reference points. Adding economic components to the MSPM, a
bioeconomic model was established and applied in analyzing the interaction between
human harvesting pressures, stocking and biological resources regeneration. Data on
catch/effort and stocking from 1993 to 2005 were used to analyze the fishery.
Empirical results reveal that the stocking program was a major factor influencing both
population growth and the harvest regime in the reservoir. Fish stocking was
positively correlated to change in population growth, and led to a considerable
enhancement in fish production. The fisheries resources cannot sustain current
exploitation levels which have led to both biological and economic overfishing as a
result of ineffective management. The current centralized top-down management has
proven ineffective and inappropriate. Therefore, rational management is required to
rescue the fisheries resources from depletion, to maintain the fisheries productivity
capacity and to prevent further resource degradation. However, reservoir fisheries are
currently dependent on harvesting and stocking regimes, so a change of management
plan should be achieved by simultaneously changing the level of effort and stocking
rate.
KEY WORDS: Reservoir, Stocking, MSPM, Harvest, Overfishing and Management

- 2 -
Chapter I
I. INTRODUCTION
1.1. Introduction
Reservoirs are an important water resource in Asia, the reservoir resources are diverse
and therefore the strategies to be adopted for optimizing yields are also different
(Bhukaswan 1980; Cowx 1996; De Silva 2001). Most reservoirs in Vietnam were
impounded after 1954 for different purposes such as irrigation, hydroelectricity, flood
control, and water supply for domestic consumption and industry (Hao 1997; Van &
Luu 2001). With few exceptions, these reservoirs have been used for fish production
by stock enhancement and cage culture (Luong et al. 2004). The fish production from
reservoirs depends on nutrients, biomass, and the quantity of stocked fingerlings.
There is a common belief that fish yields of reservoirs tend to be high in the initial
few years after impoundment, and then begin to stabilize at a lower level (Van & Luu
2001). Recently the fisheries resources of reservoirs in Vietnam have shown a
downward tendency, as the size and population structure of the fish species (including
stocked species) in the reservoirs have decreased (Hao 1994; Lam 1994). As
indicated by Bernacsek (1997) fisheries catch per unit effort is quite low in large
reservoirs, mainly due to the low productivity of pelagic water. Recently, reservoir
fisheries resources have tended to be overexploited (Coates 2002; Cowx 2002). First
of all this is caused by ineffective or inappropriate management measures. Open
access may be an important cause of overfishing, and lack of knowledge on fisheries
resources may lead to or result in overfishing (Coates 2002).
Tri An reservoir was built in 1987, it has an average water surface area of 250 km2,
changing from 75 to 324 km2. The main functions are hydroelectricity and
agricultural irrigation for South-east Vietnam (Hao 1997). In addition, fisheries are
beginning to be recognized as an important secondary function of the reservoir water
resource (De Silva 2001; DNFC 1997). Fishing is traditionally an important
occupation for local people living in reservoir areas and has a main role as a protein
source in the diets of many households (DNFC 1995; Hao 1997; Sonny & Oscar
2001; Tung et al. 2004). Stocking has been a major component of reservoir fisheries
management since 1995, for biological control, enhancement of fish yields and

- 3 -
employment. The stocking program leads to an increasing number of species in the
reservoir through introduction of exotic stocked fish as Tilapia, Indian carp, Grass
carp, Silver carp and Big head carp (DNFC 2005; Tung et al. 2004). Although aquatic
resources in the reservoir are highly diversified in species composition as well as
abundant primary productivity, these resources have been reduced in terms of
quantity and size of fish caught in recent years (Hao 1997; Tung et al. 2004). This
suggests that the fishery is being overexploited, and that better fishery management
needs to be imposed to maintain productivity of the fisheries resources on a
sustainable basis (Luu 1998; Sonny & Oscar 2001).
Previous studies of fisheries in Tri An reservoir focused mainly on specific technical
aspects and their specific solutions, whereas less attention was paid to other aspects
influencing the development of fisheries such as research on data archives to estimate
aquatic resources, management methods and fisheries assessment. This study,
therefore, tries to show whether or not overfishing indeed exists and the impact of
fish stocking on population dynamics. The findings of this study will contribute to fill
some of the existing gap of empirical studies focusing on the bioeconomic analysis of
sustainable use of fish resources. The thesis begins with the introduction chapter
presenting the rationale of the study, and defines the main concerns and objectives.
Background information on fisheries in the reservoir is presented in chapter 2.
Chapter 3 summarizes the basic theory and introduces a surplus production model
including the effects of a stocking program. Chapter 4 outlines the data used and steps
of data processing, followed by the results of the study in chapter 5. Finally, chapter 6
presents the discussion and conclusion based on the findings in the previous chapter.
1.2. Main concerns of the study
To carry out the study, main concerns of the fishery in the reservoir are defined as
follows:
i. The Dong Nai Fisheries Company (DNFC), a local government fishery
enterprise, is responsible for managing fisheries activities in the reservoir.
Generally, management is weak due to lack of specialized technicians and
knowledge in management. The financial source of DNFC is mainly from
the local government; with additional revenue from activities such as fish
- 4 -
hatchery, forestry exploitation and taxation on fishing. Annually, a fixed
share of fishing taxes is used for introducing fish fingerlings into the
reservoir; however, the stocking density and species rations were suspected
to be inappropriate. The stocking rate is only based on the budget of the
DNFC, instead of depending on basic stocking principles. Although
stocking was introduced as a fisheries management component 12 years ago,
studies on stocking impact on population dynamics have not been carried
out so far.
ii. As a result of ineffective or inappropriate methods of management, the
average size of fish caught and catch per unit of effort (CPUE) have showed
declining trends in recent years (FAU 2000; Hao 1997). Recent surveys
report that harvests are decreasing in terms of fish size and quantity of
commercial species. This indicates that the fish resources in the reservoir are
reduced because of overfishing. Possible reasons of resource reduction are
high fishing pressure, gears used with small mesh-size, ineffective
management and poor stocking strategies.
In order to get insight into the above problems, this study aims to assess the status of
existing capture fisheries activities and management in the reservoir. The main
objective is to identify an efficient level of fisheries resources exploitation that are
affected by the stocking program. Reference points as Maximum Sustainable Yield
(MSY), Maximum Economic Yield (MEY) and Open Access Yield (OAY),
represented by their corresponding effort and stocking levels and estimated by
applying a theoretical bioeconomic model. Based on the findings, several possible
management measures for sustainable development are discussed and recommended.
The study is based on empirical investigations that have provided insight into such
questions as: How does the fish stocking influence population dynamics and fish
harvest level? Is there overfishing in the reservoir? Is the current exploitation of
fisheries resources sustainable?
- 5 -
Chapter II
II. BACKGROUND OF FISHERY IN TRI AN RESERVOIR
2.1. Characteristics of fisheries resources
2.1.1. The location, area and climate
Tri An reservoir lies between latitudes 10000’ to 12020’ North and longitudes 107000’
to 108030’ East. The reservoir was built and completely impounded in 1987, and is
mainly used for hydro-electricity (DNFC 1997). It is also utilized for fisheries, and
has been supplying water for agricultural irrigation and domestic consumption of the
lower Dong Nai river basin. Tri An is the biggest reservoir of Vietnam, with a
catchment area of approximately 14,800 km2, an average annual outflow of 15,100
million m3 and total volume of 2,765 million m3 (see Fig. 2.1). The reservoir has a
water surface area of around 324 km2, with an average depth of 8.5 m, about 44 km in
length and has a maximum width of 10 km (DNFC 2005; Tung et al. 2004).
Figure 2.1. Map of Tri An reservoir showing the location and study area
[Source: maps cited from Tran (2002)]
The reservoir belongs to a tropical climate region, with a water temperature range of
210C-310C, and a characteristic of two distinct seasons: the rainy season from June to

- 6 -
November, with high rainfall of 2,400 mm; and the dry season from December to
June the following year (DNFC 1995; Tung et al. 2004). Additionally, the reservoir
contains about 50 coves of various sizes, and connects to many tributaries of the
Dong Nai and La Nga rivers (Hao 1997; Luong et al. 2004; Tung et al. 2004).
Therefore, the Tri An reservoir has advantageous conditions of climate and
topography for fisheries development. Although the initial principal purpose of the
reservoir was not primarily fisheries development, the fisheries value has been
recognized as an important secondary use of the water resource (De Silva 2001;
DNFC 1997).
2.1.2. Species composition
The fish species composition in a reservoir is a result of the different reactions of the
species to varying environmental conditions after impoundment (Bhukaswan 1980).
Some species not able to adapt to the new conditions may become extinct while other
species adapt to change to varying degrees and may continue to exist at a changed
abundance (Li & Xu 1995; Tung et al. 2004).
The fish fauna of Tri An reservoir first of all reflects the fauna of the impounded
Dong Nai and La Nga rivers (Li & Xu 1995; MoF 1996; Tung et al. 2004;
Welcomme 2001). The current reservoir ecosystem is diverse and includes many
species; the fish fauna is known to constitute 109 species, belonging to 28 families
and 9 orders. The Cyprinids, constituting 56 species, are still dominant among species
inhabiting the reservoir. The families of Cobitidae, Cichlidae, Siluridae and Bagridae
with 5 species of each respectively accounted for 18.35% of total, followed by
Belontiidae with 4 species; and other families were recorded with 29 species. There
are 32 commercial species and 77 low value economic species. The highly
commercial species are Common carp (Cyprinus carpio), Silver carp
(Hypophthalmichthys molitris), Big head carp (Aristichthys nobilis), Grass carp
(Ctenopharyngodon idellus) and Indian carp (Labeo rohita), and they constitute
annually the main fish production for the reservoir (DNFC 1995; Hao 1997; Tung et
al. 2004). These sources also confirm that the size and population structure of the fish
species in the reservoir have decreased recently.
- 7 -
Bighead carp (Aristichthys nobilis)
Silver carp(Hypophthalmichthys molitris)
Common carp(Cyprinus carpio)
Mud-carp (Cirrhinus molitorella)
2.1.3. Fish stocking
Stocking and introduction of fish are frequently used throughout the world (Cowx
1998; 2002; Welcomme 1998; 2001). Stocking is a management measure to enhance
and optimize yield of lacustrine bodies (Bhukaswan 1980; Li & Xu 1995). In Tri An
reservoir, stocking has been a major management component since 1995. The
stocking program was a main part of the project “Assessment of socio-economics
and investment of fisheries potential exploitation of Tri An reservoir, 1995-1999”
(DNFC 1995). The purposes of stocking are to reduce water pollution through
increasing the biological filter capacity of suitable stocked species; to utilize
ecological niches to which none of the existing species are adapted; to control aquatic
weeds; to enhance the fish yields and provide more food fish; and to curb
unemployment through fishery development (Bhukaswan 1980; Li & Xu 1995; Luu
1998). Annually, stocked fish which are re-caught contribute an average of 30% of
fish production in the reservoir (An 2001; FAU 2001).
Figure 2.2. Photographs of main stocked fish in Tri An reservoir
[Source: photographs cited from MRC (2003)]
Series of management measures for stocking in the reservoir established, including
choice of suitable species, species combinations, stocking size and measures for
preventing escape of stocked fish (An 2001; DNFC 1995; Lorenzen et al. 2001).
- 8 -
Eight fish species, including 3 indigenous and 5 exotic species, were introduced into
the reservoir (see Fig. 2.2). Recently, a change in species composition of fish in the
reservoir is a result of stocking impact, 109 species were recorded when compared
with 102 species during the pre-impoundment period (Tung et al. 2004). Some of
exotic stocked fish such as Silver carp, Big head carp, Tilapia, Indian carp and Grass
carp, lead to increase in the number of species (DNFC 2005; Tung et al. 2004).
2.1.4. Fishing community
Fisheries communities are located around or close to the reservoir at Vinh cuu, Thong
nhat and Dinh quan districts of Dong Nai province (DNFC 1997). About 1,000
households are permanently involved in fishing activities (AMCF 2002; DNFC 2005;
FAU 2000; Sonny & Oscar 2001), of which:
1. The full-time fishermen who are more specialized and operated their
fishing as a main occupation and accounted for 60% of the total.
2. The part-time fishermen who usually operated their fishing as a
consequence of lack of work in their main occupation, or who capture fish
as feed supplying for their cage culture system was about 30% of the total.
3. The subsistence fishermen who mainly harvested fish for their own
consumption occupied 10% of the total.
Fishing activities in the reservoir have supplied over 2,000 permanent employments,
and ensured livelihoods for about 1,000 households with more than 5,500 inhabitants
(DNFC 1995). The average household consisted of five to six persons with the father
being the main income earner, and consistent with the characteristics of the extended
family system, married couples tend to remain with their parents and involve
themselves in fishing activities (Ahyaudin & Lee 1994; DNFC 1995). In general,
most fishermen have a low education level, with about 17% being illiterate, 59% with
primary school level of education (FAU 2000), and their fishing practices mainly
depend on experience passed down from their forebears (AMCF 2002; FAU 2000;
Luu 1998).
- 9 -
Java barb9%
Nile tilapia12%
Grass carp9%
Mud carp13%
Indian carp9%
Common carp12%
Bighead carp12%
Silver carp 24%
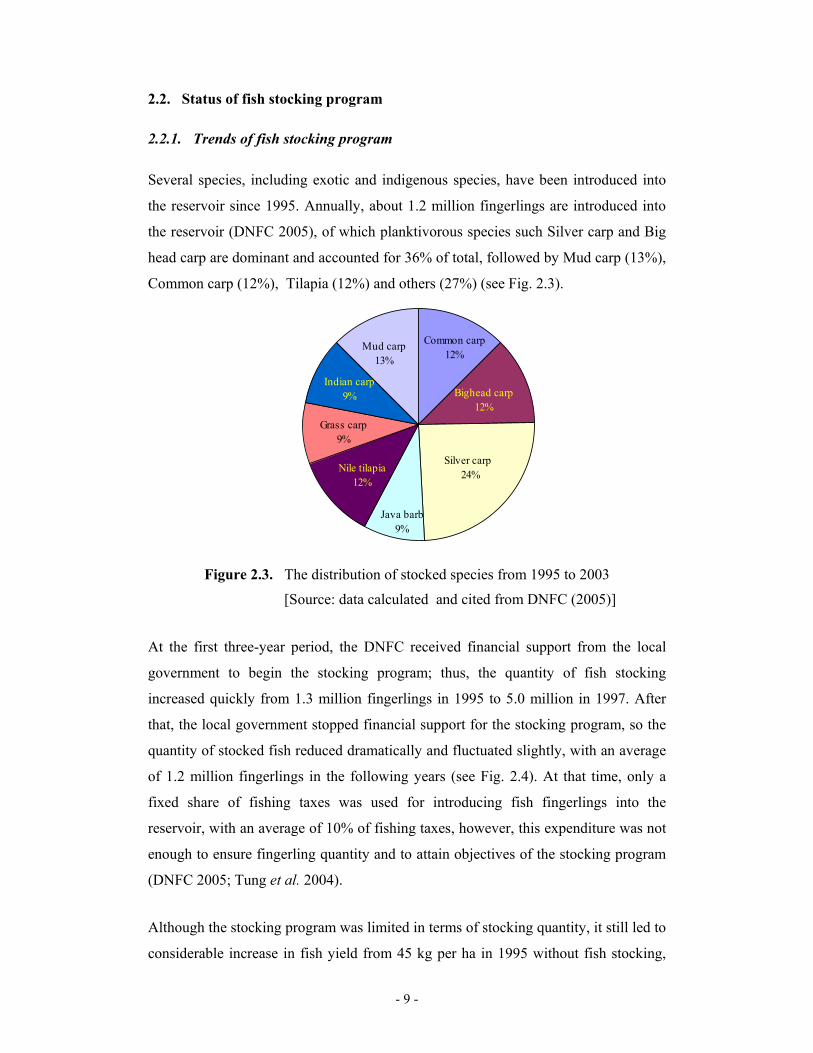
2.2. Status of fish stocking program
2.2.1. Trends of fish stocking program Several species, including exotic and indigenous species, have been introduced into
the reservoir since 1995. Annually, about 1.2 million fingerlings are introduced into
the reservoir (DNFC 2005), of which planktivorous species such Silver carp and Big
head carp are dominant and accounted for 36% of total, followed by Mud carp (13%),
Common carp (12%), Tilapia (12%) and others (27%) (see Fig. 2.3).
Figure 2.3. The distribution of stocked species from 1995 to 2003
[Source: data calculated and cited from DNFC (2005)]
At the first three-year period, the DNFC received financial support from the local
government to begin the stocking program; thus, the quantity of fish stocking
increased quickly from 1.3 million fingerlings in 1995 to 5.0 million in 1997. After
that, the local government stopped financial support for the stocking program, so the
quantity of stocked fish reduced dramatically and fluctuated slightly, with an average
of 1.2 million fingerlings in the following years (see Fig. 2.4). At that time, only a
fixed share of fishing taxes was used for introducing fish fingerlings into the
reservoir, with an average of 10% of fishing taxes, however, this expenditure was not
enough to ensure fingerling quantity and to attain objectives of the stocking program
(DNFC 2005; Tung et al. 2004).
Although the stocking program was limited in terms of stocking quantity, it still led to
considerable increase in fish yield from 45 kg per ha in 1995 without fish stocking,

- 10 -
0
50
100
150
200
250
1993
1994
1995
1996
1997
1998
1999
2000
2001
2002
2003
2004
2005
Yie
ld a
nd S
tock
ing
dens
ity
0.0
1.0
2.0
3.0
4.0
5.0
6.0
Stoc
ked
fish
quan
tity
Yield (kg/ha)
Stocking density(fingerlings/ha)Stocked fish quantity(million fingerlings)
compared to over 60 kg per ha in the following years affected by the stocking
program (see Fig. 2.4). In general, the fingerlings were introduced with lower density,
around 48 fingerlings/ha/year compared with stocking principles, so re-capture rate of
stocked fish and productivity were too low to be economical (An 2001).
Recently, the DNFC has been changed it operating regime; hence, the stocking
program was stopped. The DNFC will continue introducing fish fingerlings into the
reservoir when they re-organize completely, but interruption to the stocking program
led to an immediate reduction in fish yield (An 2001; Van & Luu 2001).
Figure 2.4. Trends of fish stocking program from 1993 to 2005
[Source: data calculated and cited from DNFC (2005)]
2.2.2. Optimal stocking density for Tri An reservoir
Technically, estimation of maximum stocking density needs to be considered in the
process of stocking planning and management. According to Li & Xu (1995), the
theoretical equation used for stocking density estimated is:
Where d is stocking density (fingerlings/ha), F is potential
yield (kg/ha), W is average size of harvested fish (kg), and
R is re-capture rate of stocked fish (% of stocked quantity). WRFd = (2.1)

- 11 -
In Tri An reservoir, the maximum stocking density is around 600 fingerlings/ha/year,
the corresponding level of stocked fish into the reservoir is 15 million fingerlings/year
or 100 tons fingerlings/year (see Table 2.1).
Table 2.1. Estimating the maximum stocking density for Tri An reservoir
Items: Value UnitPotential yield of stocked fish (F)1 90 (kg/ha)Re-capture rate (R)2 10 (% of stocked quantity)Mean weight of fish at capture (W)3 1.5 (kg)Maximum stocking density (d)4 600 (fingerlings/ha)Average surface area (A) 25,000 (ha)Maximum stocking in: - Quantity (Q)5 15,000,000 (fingerlings) - Weight (TW)6 100,000 (kg)
1 , 2 & 3. Data are cited from Hao (1997), Van & Luu (2001) and Welcomme (1998). 4. Stocking density is maximum when re-capture of stocked fish reaches the potential yield of stocked fish, it is calculated by Eq. (2.1). 5. Quantity of stocked fish (Q) equals average surface area (A) multiplied by maximum density (d). 6. Weight of stocked fish equals Q divided by an average of 150 fingerlings per kg (DNFC 2005).
2.3. Status of capture fisheries activities
2.3.1. Fishing season
Fishing is a highly seasonal activity in most parts of the world (Welcomme 2001).
The seasonality of fishing in Tri An reservoir is determined mainly by the outflow
regime. Fishing seasons can be distinguished as dry season with low water level and
rainy season with high water level (DNFC 2005), as follows:
i. Dry season (from January to June) is main fishing season, and the highest
fishing intensity starts from April to the end of May. Trawl net, gillnet, long
line, big cast net and beach seine are widely used, and their catches are
larger than for other gear types. The fishing grounds are mainly
concentrated at the middle and the lower basin of the reservoir.
ii. Rainy season (from July to December) is the supplemental fishing season.
Fishing gears widely used with high catches are the sprat scoop net, shrimp
basket trap, scoop net and gillnet. In this season, the water surface area may
vary from 25,000 ha to 32,400 ha, hence, most fishing grounds are used.

- 12 -
2.3.2. Fishing gears The reservoir capture fishery reflects the general state of inland fisheries in Southeast
Asia by being multi-species and multi-gear fisheries, primarily artisanal and small-
scale (Ahyaudin & Lee 1994; Coates 2002). The types of fishing gear used depend
mainly on the habitats exploited, fishing season, the target species and the purpose of
exploitation (AMCF 2002). The DNFC divided these gears into 17 categories (see
Appendix 2). The fishing gears widely used are gillnet 1 (average of 28% of total
households use), followed by shrimp basket trap (29%), gillnet 2 (8%), sprat scoop net
(7%) and long line (6%) (see Table 2.2 and Appendix 4). They also contribute mainly
and largely to the total fish production of the reservoir (DNFC 2005). The use of
illegal gears and prohibited destructive fishing activities like the use of explosives,
toxicants (poisoning), and certain other destructive fishing methods such as filtering
barrier with small mesh size, have been banned since 1995. However, many fishermen
still operate these types of prohibited activities (Bhukaswan 1980; DNFC 2005).
Table 2.2. Major fishing gears used in Tri An reservoir
Gear name Description
% of
householdsused
% of total catch
Average catch
(kg/year) Gillnet 1 - a net 1,000 metres in length/gear
- the mesh size ranges 40–60mm 16
÷4013
÷33 1,448
÷2,521Gillnet 2 - a net 1,500 metres in length/gear
- the mesh size ranges 70–140mm 4
÷104 ÷8
710÷3,251
Long line - a long-line 1,000-1,500 hooks 2÷9
1 ÷3
527÷2,538
Scoop net - a scope net with 1 oil-lamps/gear 4÷5
5 ÷24
3,101÷16,542
Shrimp basket trap
- It is made by bamboo. - a 100 basket-traps/boat
24÷34
5 ÷9
334÷914
Sprat scoop net
- a scope net with 18 lamps/gear - the mesh size ranges 2–5mm
5÷12
28 ÷32
5,405÷17,151
Trawl net - a net 500 metres in length/gear - the mesh size ranges 70–150mm
2÷5
2 ÷5
1,182÷7,088
[Source: data calculated and cited from DNFC (2005)]

- 13 -
0
500
1,000
1,500
2,000
2,500
3,000
3,500
1993
1994
1995
1996
1997
1998
1999
2000
2001
2002
2003
2004
2005
Cat
ch
0
200
400
600
800
1,000
1,200
1,400
1,600
Effo
rt
Catch (tons)
Effort (numberof households)
2.3.3. Fish production and market
Capture fisheries in the reservoir have increased both in fish production and in effort
over a period of ten years (1993-2002). The growth rate of fish production rose
quickly as a result of introducing fish fingerlings into the reservoir, and increasing
effort (DNFC 1997; 2005). Recently, both production and effort were reduced, from
2003 up to now (see Fig. 2.5). The reasons for this are the interruption of the stocking
program when the responsible fishery company is changing the operating regime, and
weakness in fisheries management. Declining profit of fishing activities is the main
reason for many fishermen leaving the fishery (AMCF 2002; DNFC 2005; FAU
2000). Average of approximately 2,500 tons fish is landed annually, representing
about 80% of the total fish production of Dong Nai province. Fishing activity is also
an important occupation of local people living in the area close to the reservoir;
giving permanent jobs for over 1,000 households and more than 2,000 employees
(DNFC 2005; Tung et al. 2004).
Figure 2.5. Trend of catch and effort from 1993 to 2005
[Source: data cited from DNFC (2005)]
Fish landed are transported from the fishing grounds to six commercial landing sites
close to the reservoir, each controlled and operated by about 10 permanent
wholesalers and a landing centre of local government through various middlemen.
- 14 -
Most fishermen sell their harvest to the middlemen. The relationship between
middlemen and fishermen has been set up for a long time. Middlemen often buy
catches from fishermen at low prices, while the middlemen on their side ensure the
fishermen that all their catches will be bought and also provide small loans to
fishermen if needed (Ahyaudin & Lee 1994; DNFC 1995; 2005; Sonny & Oscar
2001). Price on harvest is mostly decided by middlemen when fishermen have a debt
to them. Landed fish prices tend to be lower in the dry season compared with the
rainy season, because of differences in available catches and productivity between dry
and rainy seasons (DNFC 2005; Hannesson 1993). Many fishermen sell their product
directly to retailers and consumers at market prices in order to achieve higher profits.
Harvested fish with low economic value as trash fish are often sold directly to owners
of cage culture farms to be processed and supplied as a fish feed source for cage
culture (DNFC 2005).
2.4. Fisheries management practices
After impoundment, the DNFC is responsible for running the hatchery, producing
fingerlings for stocking and managing fisheries activities. The usual management
problems related to ownership are therefore avoided. However, production of a plan
is initiated by the DNFC depending on its investment capacity, availability of
financial resources and marketing. The problem of controlling illegal fishing is
substantial, being one of the most important social issues in reservoir fisheries. In
addition, property-sharing in water resources among the DNFC and other
stakeholders such as Tourism and Industrial Companies has produced conflict (Luu
1998; Van & Luu 2001).
A series of fisheries management measures employed in the reservoir was set up by
the DNFC in 1995, including introduction of fisheries regulations, fish stocking
strategies and monitoring strategies (DNFC 1995; 1997; FAU 2000).
2.4.1. Fishing regulations
The principal purpose of fishing regulations and control is to ensure a high, but
sustainable yield (Bhukaswan 1980). Decision No 171/QD-UBNDTDN on 1 August
1995 (DNFC 1995), which describes the legal framework regarding the exploitation

- 15 -
of fisheries resources in the reservoir, comprises mainly protection and conservation
measures to control fishing such as:
i. Technical measures: the DNFC set up management measures such as closed
area and closed season which are to establish localities and times of the year
when fish must not be taken to protect the brood-stocks and fry fish/or
fingerlings in spawning seasons/areas (Charles 2001; Welcomme 2001).
However, where the fishing depends on multi-species resources, it is
difficult to design appropriate closed season and closed area regulations to
ensure adequate protection for all species (Bhukaswan 1980; De Silva
1988), the DNFC suggested closed seasons and closed areas for 10 high
value economic species. Limitations on minimum mesh size of fishing gears
were also established. Pollution regulation and control of prohibited wastes
release into the reservoir are enforced for all stakeholders using the water
resources. Partitioning off the reservoir with a barrier net fixed across those
cove mouths which are spawning grounds or passage for migration in
spawning season is prohibited for all fishermen (DNFC 1995).
ii. Input control: although the capture fishery in the reservoir is open access
due to local community pressure, entry to the fishery is restricted only to the
local people. All local fishermen can access fishing, however, they have to
sign a contract to license/or pay operation fees with the DNFC before
entering the fishery. Based on type of gears used and operating time,
fishermen have to pay operation fees to the DNFC (DNFC 1995).
iii. Output control: the minimum size regulation on fish caught is considered to
be an important control measure, particularly for species with low
reproductive capacity. As a result of the difficulties in setting up proper
minimum size regulation in a multi-species fishery (Bhukaswan 1980; De
Silva 1988), the DNFC only identified and implemented size limitations to
protect about 20 commercial species. The size limitations of fish caught are
enforced for both fishermen and wholesalers. In particular cases, if
fishermen want to harvest fry fish/or fingerlings used for cultivation in
coves and cage culture systems, the fishermen have to apply for a license
and will be controlled by managers from the DNFC (DNFC 1995).

- 16 -
Although fishing regulations were implemented in 1995, the effects have been limited
and it has been difficult to achieve targets due to weakness of management capacity
and low awareness level of fishermen about conservation issues (Luu 1998).
2.4.2. Fish stocking strategies
Fish stocking has proven to be one of the most successful tangible tools in reservoir
fisheries management (An 2001; Li & Xu 1995). The DNFC set up strategies for the
stocking program as follows:
i. Choice of suitable species, species combinations, stocking size and rate, and
measures for preventing escape of stocked fish were studied. Stocked fish
feed on phytoplankton, zooplankton, organic detritus and periphyton to be
of priority. Stocked fish must be well and minimum size of fingerlings is 8-
12 cm in length (An 2001; DNFC 1995; Luu 1998).
ii. Annually, about 2-3 million fingerlings have been introduced into the
reservoir, with an average density of 100 fingerlings/ha. The stocking time
is from August to December, and the harvesting time of stocked fish is from
February the following year. The DNFC also chooses suitable areas for
stocking, and establishes the closed areas and seasons for all fishing gears
(DNFC 1995; 2005; Luu 1998).
iii. To ensure the stable and annual budget source for the stocking program, all
fishermen who enter the fishery have to pay operation fees. The fee size
varies by type of gears and intensity level from 10 to 20% of the value of the
total catch. This taxes source will be used to control fishing activities and
stocking at the following year (DNFC 1995; 2005).
Overall, because of ineffective management and financial constraints, the above
stocking regulations could not be implemented correctly and it is difficult to obtain
clear objectives of the current stocking program. Annually about 10% of fishing taxes
was used for stocking, hence, the stocking density was low leading to low recapture
rate and ineffectiveness of the stocking program (An 2001; Van & Luu 2001).

- 17 -
Chapter III
III. MODEL
The abundance of fish stock in a particular area is a function of interactions between
environmental factors and the fish stock properties. The stock tends to stabilize at a
particular set of environmental conditions (Gulland 1977). When the surplus
production is not harvested, at the level of maximum fish stock size the addition of
recruitment and growth to the stock is just sufficient to compensate for natural
mortality and hence, surplus production will equal zero (Clark 1990; Haddon 2001;
Hannesson 1993). This implies that fishing plans can be expressed in terms of surplus
production. The surplus production models are very flexible and have different
variations; Verhulst-Schaefer, Gompertz-Fox and Pella-Tomlinson models are some of
the best known and popular (Frank et al. 1979; Seijo et al. 1998). In this study a
modified surplus production model that was developed from Verhulst-Schaefer model
has been built and used for assessment of fish stock affected by the stocking program.
3.1. The logistic growth model
Population growth has been typified in several ways, but most commonly, the logistic
model of population growth has been found to fit a large number/or stock biomass of
populations both in nature and in captivity. Generally, the Verhulst (1838)/Pearl
(1925) surplus production model (SPM) was defined as change in population biomass
per unit of time (Clark 1990; Flaaten 2004), and is described by the logistic equation:
Where X is stock biomass, and r and K are positive constants referred to as the intrinsic
growth rate and environmental carrying capacity, respectively. The reason for these
terms is simple: r represents the maximum relative growth rate of population, which is
the approximate rate of growth, when X<<K. Similarly, K represents the stable
equilibrium biomass level: if X is a positive solution of Eq. (3.1), then X → K as t → ∞
(Clark 1985). F(X) is natural population growth describing change in population biomass
per unit of time. Natural population growth is usually positive, but may even be negative
if the stock level for any reason is higher than K. F(X) has its maximum for a specific
dtdX
KXrXF X =
−= 1)( (3.1)

- 18 -
stock level that may be found by maximizing F with respect to X, at which the
productivity of resource is maximum (Clark 1990; Flaaten 2004).
In order to apply the logistic growth model to fish population dynamics that considers
the effect of fishing (Clark 1985; Frank et al. 1979; Gordon & Clark 1980), Schaefer
model (1957) is the most commonly used among SPMs (known as Biomass Dynamics
Models), it bases precisely on the logistic population growth model of Verhulst
(1838)/Pearl (1925). To include the effect of fishing in Eq. (3.1), Schaefer introduces
the rate at which fish are caught, that is, the catch rate H of the fishery, is given by:
Where H denotes the catch rate in terms of fishing effort E, and q is a constant called
catchability coefficient and X is the fish stock biomass.
When catch/or harvest (Eq. 3.2) is included in the Eq. (3.1) in order to model the
effect of fishing on fish population dynamics, Schaefer (1957) altered Eq. (3.1) to
While the Verhulst-Schaefer model (Eq. 3.3) is desirable to utilize the fish resources, it
is intuitively clear that if many fish are harvested, then the fish population may be
reduced below a useful level, and possibly even driven to extinction (Boyce & DiPrima
1992). Thus, the sustainable harvest of fish resources generally requires that the catch
rate should not exceed the growth rate of fish stock (Charles 2001). Setting dX/dt=0 is
the condition of a sustainable equilibrium in the Verhulst-Schaefer model, this model
helps to find MSY of the fish resources, corresponding to the equilibrium value
X=K/2. This indicates that the fishery is unsustainable if the catch rate exceeds MSY.
The fishery is considered to be overexploited if the stock is reduced to a level below
K/2 or sustainable yield falls below MSY (Boyce & DiPrima 1992).
3.2. Modified surplus production model
In practice, fish fingerlings are frequently introduced into reservoirs, thus fish stocking
directly influences fish population dynamics (Cowx 2002). The previous studies for
reservoir fisheries show that sexual maturation of stocked fish under natural conditions is
impossible or very low, and stocked fish are unable to reproduce locally or to adapt and
HKXrX
dtdX
−
−= 1 (3.3)
qEXH = (3.2)

- 19 -
dtdX
KXXaSrF SX =
−+= 1)( 0),( (3.4)
compete successfully with local species in terms of growth and competition for food
(Ali 1998; Hao 1997; Welcomme 1998). Therefore, stocking is the principal method
used in reservoir fisheries to enhance fish production, to maintain fisheries
productivity or to improve recruitment and bias fish assemblage structure which is a
result of overfishing (Cowx 2002; Welcomme 2001). Regarding the stock assessment
of the reservoir, the Verhulst-Schaefer model can be applied in order to provide initial
reference points for management in the reservoir, however, the SPM needs to be
modified due to the stocking program’s impact on fish population growth. The
following modification is proposed:
Where (r0 + aS ) is intrinsic growth rate affected by stocked fish S, and F(X, S) is population
growth, it is the change in population biomass per unit of time affected and depended on
stocked fish, in the case of no fishing. When S=0, Eq. (3.4) is reduced to Eq. (3.1).
Cowx (1998) and Welcomme (1998) report that when stocked fisheries have been
managed well, usually in terms of stoking strategies and fishing regulations, the
stocking could help to maintain the fisheries productivity at the highest possible level.
Furthermore, the stocking may help to compensate for recruitment overfishing,
because the stocking may provide sufficient quantity of catch demands to increasingly
higher fishing pressure levels (Cowx 2002). It is reasonable to assume that the rate at
which fish are harvested depends on the fish population: the more fish stock including
wild fish and stocked fish there are, the easier it is to catch them (Boyce & DiPrima
1992). Thus, the stocking can help to reduce fishing pressure for natural fish stock,
and the fish stock may increase as positive results of the stocking.
In this point of view, we assume that the stocking is positively related to population
growth through intrinsic growth rate of population (r); it means that r will increase
when fingerlings are introduced into the reservoir, because stocked fish are unable to
reproduce and they help to reduce fishing pressure for natural fish stock. This indicates
that the fish population growth affected by stocked fish will increase and approach the
carrying capacity of the environment more quickly compared to change with no stocking
(King 1995; Lever 1998) (see Fig. 3.1). As the result of the change in intrinsic growth
rate affected by fish stocking, the population growth tends to be positively trended with

- 20 -
05000
1000015000
20000 0
20
40
60
80
100
02000400060008000
05000
1000015000
K
S-stocking
X-stock biomass
F-population growth
02
46
8Time
0
20
40
60
80
10
Stockin
0
000
0
02
46
8Time
K
0 0
10 0
100
S-stocking
Time
Xt-population size
stocking rate, it rises when stocked fish increase and vice versa (see Fig. 3.2).
Figure 3.1. Population growth according to the logistic curves
The graph shows the trajectories of population growth for the different values of r.
Integrating Eq. (3.4) leads to the continuous solution to the logistic equation, giving the
expected population size Xt at time t after some starting time and population size X0 ,
( ) ( )( )[ ]aSrt eXXKKX +−+= 0
00 /1/ . The top dashed line represents the asymptotic
carrying capacity K. Maximum growth rate is at K/2, where the inflection exists in the
curve. The population size affected by stocked fish will increase and approach the
environmental carrying capacity more quickly compared to change with no stocking.
Figure 3.2. Plot of population growth versus stock biomass and stocking rate
The graph shows the relationship of population growth with stocking and stock levels.
Population growth is a function of stock and stocking rates, F(X,S) = (r0 + aS)X[1-X/K]

- 21 -
01
23
45 0
20
40
60
80
100
0
2000
4000
6000
01
23
4
0 0
0
100
S-stocking
E-effort
H-harvest
12
In this case, in order to model the effect of fishing on fish population dynamics, the
catch rate H (Eq. 3.2) is included in the Eq. (3.4), we obtain the MSPM as:
Sustainable equilibrium of the population dynamics model occurs when setting
dX/dt=0; the MSPM helps to find the MSY of the fish resources exploitation in the
reservoir, it indicates that the catch rate should not exceed the MSY level to ensure
sustainable harvesting, and the fish resources are overexploited when sustainable
yield is reduced to a level below MSY.
Replacing Eq. (3.2) into Eq. (3.5) and rearranging Eq. (3.5), the stock biomass can be
expressed in equilibrium condition as:
Substituting Eq. (3.6) into Eq. (3.2) and rearranging Eq. (3.2), the harvest rate is
estimated in equilibrium condition as:
Figure 3.3. Plot of harvest curve versus effort level and stocking rate
The graph is plotted from Eq. (3.7), and shows relationship of harvest rate with effort and
stocking. At a given stocking rate, Eq. (3.7) is quadratic in E, the effort is only positively increase
in harvest rate up to a certain limit, after which yields decline. Whereas, at a given effort level
Eq. (3.7) is a line up in S, the stocking is positively correlated to harvest rate.
+
−=aSr
qEKX SE0
),( 1 (3.6)
+
−=aSr
qEqEKH SE0
),( 1 (3.7)
HKXXaSr
dtdX
−
−+= 1)( 0 (3.5)

- 22 -
We assume the constant q (i.e. no changes in gear or vessel efficiency have taken
place), and biologically it implies that environmental conditions are constant/or no
environmental factors affect the population. The intrinsic growth rate affected by
stocked fish responds instantaneously to changes in biomass. The CPUE, a direct
(proportional) index of stock abundance X(E,S), can be expressed as:
3.3. Biological analysis
The SPM which utilizes catch and effort data has been used widely in fisheries
management (Clark 1985; King 1995). Biological analysis help managers to know
levels of change in population biomass per unit of time, the MSY is introduced as the
simplest management objective that shows the level of biological stock not being
exploited too heavily without an ultimate loss of productivity (Clark 1990). Applying
annual effort level EMSY and stocking rate SMSY will produce the maximum harvest of
fish that can, in theory, be caught year after year indefinitely into the future.
The MSY can be obtained when partial derivative of harvest function in the long run
(see Eq. 3.7) that depends on effort or stocking variables equals zero, as follows:
The EMSY can be estimated based on Eq. (3.9). While, )(SH•
in Eq. (3.10) is always
positive or )(SH•
0 when S + ∞. The harvest is positively related to stocking rate
(see Fig. 3.3), however stocking rate is technically and biologically limited in terms
of stocking density. In context of stocking practices, technically the SMSY cannot
exceed a given maximum stocking quantity (see Table 2.1). The Eqs. (3.11) and
(3.12) indicate that EMSY is a function of SMSY and vice versa, thus they cannot be
solved separately. We carried out the numerical solution by Mathematica 5.2, the
SMSY is estimated and the EMSY is also solved with a given range of stocking quantity.
Inserting the EMSY and SMSY into Eq. (3.7), one has the local maximum yield.
+
−=aSr
qEqKCPUE SE0
),( 1 (3.8)
qaSr
E MSYMSY 2
0 += (3.9)0)(
2
0
2
)( =+
−=•
aSrKEqqKH E
0)( 2
0
22
)( =+
=•
aSrKqaEH S (3.10) a
rqES MSY
MSY02 −
=
(3.11)
(3.12)

- 23 -
3.4. Economic analysis
In order to analyze the interaction between human harvesting pressures, stocking and
biological resource regeneration, economic analysis is used in the study of fisheries
exploitation (Clark 1973; Lokina 2000; Seijo et al. 1998). Economic analysis can help
managers to answer the questions of why resources are used as they are, why fisheries
are economically inefficient, and how fisheries could be better managed (Hannesson
1993; Jennings et al. 2001).
The total fishery cost and total revenue are essential in an economic analysis. It is
assumed that the objective is to maximize the resource rent of the fishery. Cost per
unit of effort C1, cost per unit of stocking C2 and harvested fish price p are constants
being used for economic analysis. In the long run, we assume that vessels are
homogenous with respect to cost and catchability, C1 is constant and equal for all
vessels. The reason for this is the long run perspective where it is reasonable to
assume that adding homogenous vessels to the fleet can expand effort at a constant C1
(Flaaten 2004). The C2 varies slightly among types of stocked species, thus we also
assume that C2 is a constant. The p is largely dependent on the quality of landed fish
that is mixed fish, however, mixed fish caught should be treated as an aggregated fish
stock in order to estimate an average fish price, and let us assume that p is constant.
Introducing a bioeconomic model, in which:
Total cost TC is the sum of cost for effort and cost for stocking, it is a function of
effort and stocking:
Fish price multiplied by harvest rate in Eq. (3.7) gives the total revenue TR, it is a
function of effort and stocking:
The economic rent/or profit ∏ is the difference between TR and TC, it is also a
function of effort and stocking:
TC(E,S) = C1E + C2S (3.13)
( )SCECaSr
qEpqEKSE 210
),( 1 +−
+
−=∏ (3.15)
+
−=aSr
qEpqEKTR SE0
),( 1 (3.14)

- 24 -
01
23
4 0
20
40
60
801
000
01
23
E-effort
S-stocking
П-profit
10
012
0
0
Figure 3.4. Plot of profit curve versus effort level and stocking rate
The graph is plotted from Eq. (3.15), and shows the relationship of fishing profit with effort and
stocking. At a given stocking rate, Eq. (3.15) is quadratic in E, the effort is only positively
increase in the profit up to a certain limit, after which the profit declines. Whereas, at a given
effort level Eq. (3.15) is line in S, the stocking is mostly positive trend to the profit. However, if
high effort level combined with low stocking rate and vice versa will produce negative profit,
thus the fishing profit is managed by simultaneous control on both stocking rate and effort level.
3.4.1. MEY, the corresponding effort and stocking rate
Regarding economic efficiency in the fishery, an aspect that needs to be considered in
the harvesting of fish resources is the maximization of the economic rent (Lokina
2000). That refers to attaining the economic equilibrium, which is referred to as the
MEY. It is important not only because it protects fish stock and guarantees
sustainability, but also because it assures that resources will be allocated to the fishery
correctly and in a way that maximizes the returns from fishing (Kompas 2005).
Setting annual effort level EMEY and stocking rate SMEY generate theoretically a
maximum level of sustainable economic rents from the fishery, obtainable each year
indefinitely into the future. The MEY is attained when the partial derivative of profit
function (Eq. 3.15) that bases on effort or stocking variables equals zero as follows:
201
2))((
KpqaSrKpqC
E MEYMEY
++−= (3.16)021
01)( =
+
−+−=∏•
aSrqEpqKCE
0)( 2
0
22
2)( =+
+−=∏•
aSrKpqaECS (3.17)
2
20
Ca
CrpKaqES MEY
MEY
−=
(3.18)
(3.19)
- 25 -
The EMEY can be estimated by Eq. (3.16), and solving Eq. (3.17) gives two values of
SMEY but the negative value is excluded. The EMEY is a function of SMEY and vice
versa. In general, to obtain MEY, the EMEY and SMEY cannot be solved separately, and
then one value of EMEY and SMEY respectively has been determined by the numerical
solution from Mathematica 5.2. As mentioned above, technically the SMEY cannot
exceed a given maximum stocking quantity (see Table 2.1). Thus, the SMEY is
estimated with this range, and the EMEY is also calculated. The local maximum yield
is estimated by inserting EMEY and SMEY into Eq. (3.7).
3.4.2. OAY, the corresponding effort and stocking rate
Fisheries based on biological highly productive resources with large r and K, may
sustain a large fishing effort under open access (Flaaten 2004). In some cases,
stocking is to develop a largely culture-based fishery while maintaining high
exploitation rate, it helps to curb unemployment through fishery development
(Lorenzen et al. 2001). Thus, the stocked fisheries may take place in an open access
system. Applying annual effort level EOAY and stocking rate SOAY will still produce
normal profits for the fishermen but zero economic rents from the fishery. The OAY
is obtained when total cost (Eq. 3.13) equals total revenue (Eq. 3.14) as:
Solving Eq. (3.20) gives two values of EOAY and SOAY respectively, and the small
values are excluded because the main purpose of an open access system is maximum
employment (see Fig. 3.5). The EOAY is a function of SOAY and vice versa, thus EOAY
and SOAY cannot be solved separately. Technically, the SOAY cannot exceed a given
SCECaSr
qEpqEK 210
1 +=
+
− (3.20)
++−+−
= 21001
2KpqaKpqSSaCKpqrrC
E OAYOAYOAY
( ) ( )2
2202
221001
24
KpqSaCSrCKpqaKpqSSaCKpqrrC OAYOAYOAYOAY +−−+−
+
(3.21)
−−+−
=2
021
2aCrCKpqaEEaCS OAYOAY
OAY
( ) ( )2
00122
22
021
24
aCKpqrErECkpqEaCrCaeKpqEaC OAYOAYOAYOAY +−−+−+−
−
(3.22)

- 26 -
maximum stocking quantity (see Table 2.1). The EOAY and SOAY can be calculated by
the numerical solution from Mathematica 5.2, with a given range of stocking
quantity. The OAY is achieved by inserting EOAY and SOAY into Eq. (3.7).
Figure 3.5. Plotted curves of TR, TC vs. effort and stocking
The graph is plotted from Eqs. (3.13) and (3.14), and shows the relationship of total cost and
total revenue with effort and stocking. The TC curve intercepts the TR curve at two points, but
only the intercepted point that produces the higher effort level and stocking rate is selected
because of maximum fishing employments in open access systems.
0
2
4
6
Effort
0
25
50
75
100
Stocking
0
20000
40000
TR
0
2
4Effort
12 0
0 0
100
S-stocking
E-effort
TR TC
TC
TR

- 27 -
Chapter IV
IV. DATA AND PARAMETERS ESTIMATION
4.1. Type of data To carry out the study, time-series of data (1999-2005), which is considered more
accurate and sufficient to set up a detailed modified surplus production model, was
gathered on the following variables catch, effort, harvested fish price, stocking and
fishing cost. Data on catch, effort and cost of stocking were collected from the
DNFC, and the fishing cost data came from the survey in July 2005 and cited from
research in 2004 of Agriculture and Forestry University.
4.1.1. Catch and effort data
The DNFC has recorded catch and effort data through the Fisheries Tax Office and
surveyed fishing data (see Table 4.1). The DNFC has annually implemented
collection of statistics for catch/effort data by types of fishing gears, and fishing
effort data have been recorded and being represented by number of households,
boats and days of fishing (see Appendix 2).
Table 4.1. Actual catch and efforts data of capture fisheries, 1993-2005
Year Catch Type of fishing effort (tons) No.of fishing
households No.of fishing
boats No.of fishing
days 1993 800 300 - - 1994 833 400 - - 1995 1,126 550 - - 1996 1,475 748 - - 1997 1,825 800 - - 1998 1,840 1,234 - - 1999 2,269 1,136 992 147,602 2000 2,301 1,470 1,470 143,363 2001 2,786 1,237 1,020 125,840 2002 3,118 892 822 162,065 2003 3,080 978 978 165,354 2004 2,835 898 898 148,937 2005 2,589 872 809 132,520
[Source: data cited from DNFC (2005)]

- 28 -
4.1.2. Cost of fishing effort data
Operating costs reflect method, intensity of fishing effort and the amount of capital
invested in the study site. Two types of cost for fishing activities are in Table 4.2, as
follows:
1. The fixed costs are calculated in terms of the payment for fishing tax and
depreciation of both fishing boat and gear used in Tri An reservoir; and
2. The variable costs include the costs of bait, energy, cost for gear and boat
repairing, other accessories and actual labors costs.
All cost data were collected from 116 surveyed fishing households in 2004 of
Agriculture and Forestry University (Vietnam) and 22 surveyed fishing households in
July 2005. The average cost of fishing was 17.26 million VNDs/year for a fishing
household operation (see Table 4.2).
Table 4.2. Average investment fishing costs of households (2004-2005)
Type of costs:
Value(million VNDs/household)
% of total cost
Fixed costs: Depreciation of boat 0.60 3.47Depreciation of gear 2.60 15.08Operating tax 2.21 12.83
Variable costs: Operating costs 9.29 53.82Labors 2.55 14.80
Total cost 17.26 100.00
[Source: data calculated and cited from FAU (2004) and Survey in July 2005]
4.1.3. Harvested fish price data
Harvested fish price data have annually been recorded from 1999 to 2005 through
the Fisheries Tax Office and annual fisheries statistics by 17 types of fishing gear
from the DNFC. However, fish price depends on species caught and species group,
some of them are very expensive and another is low (see Appendix 2).

- 29 -
4.1.4. Fish stocking data
Fish stocking data, containing quantity and weight of stocked fish, fish
composition and fish stocking cost, has been recorded since 1993 through the
Technical Fisheries Office of the DNFC (see Table 4.3 and Appendix 1). The cost
per unit of stocked fish C2 was about 25,000 VNDs per kg of fingerlings/or 150
fingerlings, therefore, the total cost of stocking is the cost of all individual stocked
fish multiplied by cost per unit of stocked fish (DNFC 2005).
Table 4.3. Fish stocking activity in Tri An reservoir, 1993-2005
Year Number of Fish stocking species
stocking Quantity
(fingerlings) Weight
(kg) Total cost
(million VNDs) 1993 0 0 0 01994 0 0 0 01995 8 1,300,000 8,827 220.681996 8 1,900,000 12,900 322.501997 8 5,006,000 33,986 849.651998 8 1,000,000 6,789 169.731999 8 1,317,000 8,941 223.532000 6 1,200,633 7,233 180.832001 8 1,500,165 11,056 276.402002 8 1,168,705 8,178 204.452003 8 868,348 5,698 142.452004 0 0 0 02005 0 0 0 0
[Source: data cited from DNFC (2005)]
4.2. Data analysis
4.2.1. Effort standardization
To get one measure of fishing effort for the annual total catches, the effort values
from individual gear type had to be converted into standard units of effort. According
to Mark & Andre (2004), various methods for standardizing catch and effort data
have been developed by Gulland (1956), Beverton and Holt (1957), Robson (1966),
and Honma (1973). However, the approach developed by Beverton and Holt (1957)
was commonly applied, this method involves selecting a ‘standard vessel/gear’ and
determining the relative fishing power of all other vessels/gears (Beverton & Holt
1993).

- 30 -
In this study, fishing effort is described in terms of the number of fishing days, number
of boats and number of households used associated with types of fishing gears. The
data showed that the fishing gears used most frequently are the sprat scoop nets,
gillnet 1, gillnet 2 and shrimp basket traps. The gillnet 1 is selected as standardized
gear for 17 types of fishing gear. There are several criteria to select this gear, as
follows:
i. Gillnet 1 is a main fishing gear, and being used as commercial and full-time
fishing in the study site;
ii. The number of households and boats use of gillnet 1 is higher;
iii. The composition of fish caught by gillnet 1 is the most diversified; and
iv. Gillnet 1 contributes higher catches to fish production of the reservoir.
The fishing effort is measured in days of fishing, and the effort values from individual
gear type are converted into standard effort unit, the “gillnet 1”. The set of fishing
gears are labeled from 1 to 17, and the total catches of each fishing gear is H1,
H2,...H17, respectively, and the corresponding levels of fishing effort are E1, E2,...E17.
Therefore, the CPUE of fishing gear i is defined as:
Where CPUEi is catch per unit of effort of gear i, Hi is catch of gear i, Ei is effort of
gear i, and i is type of fishing gear used.
The Gillnet 1 denoted as gear number 1 being chosen as the standard fishing unit in this
study. The stock was assumed to follow logistic growth, then a year-by-year
procedure is used to obtain the standardized effort values, and then total standardized
fishing effort can be calculated as:
Where ES is total standardized effort, E1 is effort of gillnet 1, Ei is effort of gear i,
CPUE1 is catch per unit of effort of gillnet 1, CPUEi is catch per unit of effort of gear
i, and i is type of fishing gear used.
ii
iS E
CPUECPUE
EE ∑=
+=17
2 11 (4.2)
i
ii E
HCPUE = (4.1)
- 31 -
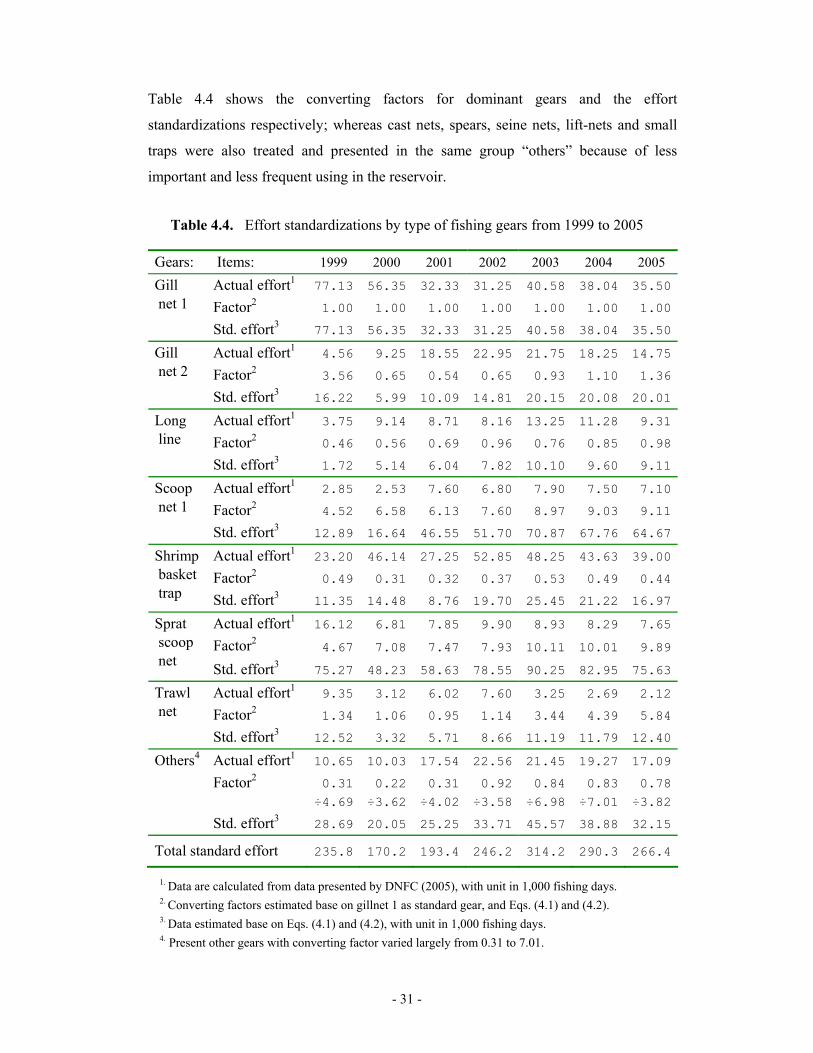
Table 4.4 shows the converting factors for dominant gears and the effort
standardizations respectively; whereas cast nets, spears, seine nets, lift-nets and small
traps were also treated and presented in the same group “others” because of less
important and less frequent using in the reservoir.
Table 4.4. Effort standardizations by type of fishing gears from 1999 to 2005
Gears: Items: 1999 2000 2001 2002 2003 2004 2005
Actual effort1 77.13 56.35 32.33 31.25 40.58 38.04 35.50Factor2 1.00 1.00 1.00 1.00 1.00 1.00 1.00
Gill net 1 Std. effort3 77.13 56.35 32.33 31.25 40.58 38.04 35.50
Actual effort1 4.56 9.25 18.55 22.95 21.75 18.25 14.75Factor2 3.56 0.65 0.54 0.65 0.93 1.10 1.36
Gill net 2 Std. effort3 16.22 5.99 10.09 14.81 20.15 20.08 20.01
Actual effort1 3.75 9.14 8.71 8.16 13.25 11.28 9.31Factor2 0.46 0.56 0.69 0.96 0.76 0.85 0.98
Long line Std. effort3 1.72 5.14 6.04 7.82 10.10 9.60 9.11
Actual effort1 2.85 2.53 7.60 6.80 7.90 7.50 7.10Factor2 4.52 6.58 6.13 7.60 8.97 9.03 9.11
Scoop net 1
Std. effort3 12.89 16.64 46.55 51.70 70.87 67.76 64.67Actual effort1 23.20 46.14 27.25 52.85 48.25 43.63 39.00Factor2 0.49 0.31 0.32 0.37 0.53 0.49 0.44
Shrimp basket trap Std. effort3 11.35 14.48 8.76 19.70 25.45 21.22 16.97
Actual effort1 16.12 6.81 7.85 9.90 8.93 8.29 7.65Factor2 4.67 7.08 7.47 7.93 10.11 10.01 9.89
Sprat scoop net Std. effort3 75.27 48.23 58.63 78.55 90.25 82.95 75.63
Actual effort1 9.35 3.12 6.02 7.60 3.25 2.69 2.12Factor2 1.34 1.06 0.95 1.14 3.44 4.39 5.84
Trawl net Std. effort3 12.52 3.32 5.71 8.66 11.19 11.79 12.40
Actual effort1 10.65 10.03 17.54 22.56 21.45 19.27 17.09Factor2 0.31
÷4.690.22
÷3.620.31
÷4.020.92
÷3.580.84÷6.98
0.83 ÷7.01
0.78÷3.82
Others4
Std. effort3 28.69 20.05 25.25 33.71 45.57 38.88 32.15Total standard effort 235.8 170.2 193.4 246.2 314.2 290.3 266.4
1. Data are calculated from data presented by DNFC (2005), with unit in 1,000 fishing days. 2. Converting factors estimated base on gillnet 1 as standard gear, and Eqs. (4.1) and (4.2). 3. Data estimated base on Eqs. (4.1) and (4.2), with unit in 1,000 fishing days. 4. Present other gears with converting factor varied largely from 0.31 to 7.01.
- 32 -
100i
iii C
CRIR
−= (4.3)
iS
i
EC
C =1 (4.4)
4.2.2. Cost of fishing effort and fish price estimation We assume that the gears/vessels are homogenous with respect to cost and
catchability, because in the long run adding homogenous gears/vessels to the fleet can
expand effort when setting a constant cost per unit of effort C1 for all gears/vessels
(Flaaten 2004).
A cost-efficiency analysis of all gears can be implemented to select the most cost-
efficient. The interest rate of capital investment may be evaluated to find the fishing
gear that produced the most cost-efficient, and it can be expressed as:
Where IRi is interest rate of capital investment, Ri is total revenue of gear i , and Ci is
total cost of gear i operating that includes fixed costs and variable costs.
The cost per unit of effort for this study can be estimated as:
Where Ci is total cost of gear i that can be produced the most cost-efficiently, and EiS
is effort standardization that is converted into standard units of the “gillnet 1”.
Table 4.5 shows that “Seines net 1” is produced in the most cost-efficient manner,
therefore its cost per unit of effort can be selected for this study. The cost per unit of
effort for fishing in Tri An reservoir was 64,867 VNDs.
The average harvested fish price of “Seines net 1” was 12,429 VNDs/kg. However,
this price cannot be attained for aggregate fish caught that are multi-species, and may
not be applied for this study, some reasons are:
i. The “Seines net 1” often harvests the big fish, with a range of mesh size from
4 to 14cm. Thus, price of harvested fish was always higher than that of others.
ii. The fish fauna in the reservoir are multi-species resources, so the price of
harvested fish varies largely and depends on species caught in terms of
harvested size, fish quality and type of fishing gear used.
iii. According to fishermen and wholesalers interviewed, they indicated that the
average of aggregate fish caught price was generally around 5,500 VNDs/kg.

- 33 -
The results of cost-efficiency analysis show the average interest rate was always
positive for all gears (see Table 4.5). Mixed fish of harvested fish should be treated as
an aggregated fish stock, hence, in order to estimate an average price of harvested fish
for this study; the weighed data method was applied and expressed as:
Where p is the average of harvested fish price, i is type of fishing gears, PGAi is the
fish price of gear i, and TCC7i is total catch in 7 years of gear i (data: 1999-2005).
Based on Eq. (4.5), the average price of landed fish in Tri An reservoir was 5,485
VNDs per kg (see Appendix 2).
Table 4.5. Cost-efficiency analysis by fishing gears
Type of gears1 Total Cost2
Total Revenue2
Interest rate3
Fish price4
Stand. Effort5
Cost per unit of effort6
Gill net 1 10.04 12.69 26.40 4.750 150.79 66.56Gill net 2 13.07 25.95 98.58 6.67 248.42 52.61Long line 8.49 25.51 200.47 9.80 144.49 58.75Scoop net 1 32.08 33.07 3.09 5.69 1688.05 19.00Shrimp basket trap 25.45 44.29 74.03 10.80 78.41 324.57Sprat scoop net 11.64 44.43 281.61 3.03 1402.48 8.30Trawl net 13.42 33.05 146.33 8.20 671.72 19.97Seines net 1 36.77 140.35 281.66 12.43 566.91 64.87Seines net 2 26.85 35.18 31.04 5.67 354.03 75.83Shrimp pull net 20.50 52.89 158.03 9.00 286.47 71.55Mussel trawl net 8.48 18.51 118.40 8.93 155.28 54.59Small cast net 7.17 15.60 117.57 5.00 167.86 42.71Lift net 2 10.05 11.93 18.65 5.50 259.13 38.80Big cast net 15.53 18.14 16.81 10.00 394.05 39.41Scoop net 2 24.23 27.31 12.70 5.50 368.13 65.82
1. Missing values of “Lift-net 1” and “Spears”. Data are calculated from data presented by 116 surveyed households in 2004 of FAU (2004) and 22 surveyed households in July 2005. 2. Data were estimated for operation of a fishing gear per year, with unit in million VNDs 3. Interest rate was estimated by Eq. (4.3), with unit in percent 4. Average harvested fish price (1,000 VNDs/kg) 5. Standardization effort was converted into standard units of Gillnet 1, with unit in number of days 6. Cost per unit of effort was calculated by Eq. (4.4), with unit in 1,000 VNDs/day of fishing.
∑
∑
=
== 17
1
17
1
7
7.
ii
iii
TCC
TCCPGAp (4.5)

- 34 -
4.3. Parameters estimation
When sustainable equilibrium occurs, CPUE is an index of stocked abundance that is
expressed in Eq. (3.8). It is that change in CPUE from one year to the next dependent
on effort and stocked fish levels. This is a complicated function whose parameters
a, q, r0 and K can be solved by a non-linear regression model (Gallant 1987). We
carried out the numerical solution of Eq. (3.8) by Mathematica 5.2 Software (Wolfram
2005). Data on Table 4.1, 4.3 and 4.4 were used for solving Eq. (3.8). The estimation of
parameters is showed in Table 4.6, Appendix 3, and the original CPUE equation is
expressed as:
Most parameters are statistically significant, with p-values less than 0.05. The R2
value is about 0.74, it means that 74% of CPUE variation is explained by the model.
Consequently, the relationship of CPUE with effort and stocking rates is significant
and has the expected signs. It indicates that stocking S is positively correlated to
changes in CPUE, whereas effort E is negatively correlated to changes in CPUE
values.
Table 4.6. Estimated parameters based on non-linear regression model
Parameters1: Estimate SE t-stat p-value CI q 0.093561 0.01808 5.17331 0.01402 0.036÷0.151K 0.20267 0.02539 7.97981 0.00411 0.122÷0.283r0 0.496084 0.01283 38.65784 0.00004 0.455÷0.537a 0.0117891 0.01437 0.82013 0.47223 -0.03÷0.058ANOVA table: DF SS MS R2 Variance
Model 4 0.000922 0.00023 0.73748 2.304x10⁻⁶
Error 3 6.91x10⁻⁶ 2.31x10⁻⁶ Uncorrected Total 7 0.000929 Corrected Total 6 0.000026
1. CPUE(E,S) is catch per unit of effort (tons/day); q is catchability coefficient (tons/100,000
days/year); K is carrying capacity (100,000 tons); (r0 + aS) is intrinsic growth rate affected by
stocked fish; S is fish stocking (tons), and E is effort standardized (100,000 days). Assumption: there
is no change in fishing technology over time, biologically environmental conditions are constant,
and the multi-species fisheries is technical with no predator prey relationship.
+−=
SECPUE SE 0117891.0496084.0
018962.020267.0093561.0),( (4.6)

- 35 -
0
500
1,000
1,500
2,000
2,500
3,000
3,500
1993
1994
1995
1996
1997
1998
1999
2000
2001
2002
2003
2004
2005
Act
ual c
atch
and
eff
ort .
0.00
0.50
1.00
1.50
2.00
2.50
3.00
3.50
4.00
Act
ual C
PUE
.
Effort (number of households) Catch (tons) CPUE (kg/household)
Chapter V
V. RESULTS
5.1. Trends in catch, effort, CPUE and stocking
5.1.1. Trends of actual catch, effort and CPUE over time Catch data reflects aggregate freshwater fish instead of a single species of harvested
fish. This is because data on a particular species or even species groups are not
available for the study site. Catch and effort increased quickly from 1993 to 2000, and
then catch continued to increase and reached a peak of around 3,100 tons in 2002.
Whereas, the effort reduced slightly up to now. The corresponding CPUE fluctuated
largely over time, and has been declining in recent years (see Fig. 5.1).
Figure 5.1. Trends of actual catch, effort and CPUE over time
5.1.2. Trends of standardized effort, catch, CPUE and stocking over time
Trends of standardized effort, catch2 and stocking increased slightly from 2000 to
2003, and then dropped down after 2003 to 2005 (see Fig. 5.2 and Table 5.1).
Recently, the decreasing number of fishing days may be explained by fishermen
leaving or reducing their activity because of a poor fishing season, declining profit
and interruption of the stocking program. Figure 5.2 also depicts that the standard

- 36 -
0.00
2.00
4.00
6.00
8.00
10.00
12.00
1999 2000 2001 2002 2003 2004 2005
Stan
dard
ized
Effo
rt an
d St
ocki
ng
.
0
5
10
15
20
25
30
35
Stan
dard
ized
Cat
ch a
nd C
PUE
.
Standardized Effort (100,000 days) Stocking (tons)
Standardized CPUE (kg/day) Standardized Catch (100 kg)
CPUE decreased gradually between 2000 and 2003, after that CPUE reduced faintly
and tends to remain stable. This may indicate that fisheries resources were declining
initially, and may be a reason for fishermen leaving the fishery in recent years.
Figure 5.2. Trends in standardized catch, effort and CPUE, 1999-2005
Table 5.1. Standardized catch, effort and CPUE, 1999-2005
Year Standard effort
Fish stoking1
Standard CPUE
Standard catch2
Actual catch
Difference of catch3
(105days) (tons) (kg/day) (tons) (tons) (tons) (%) 1999 2.36 6.79 11.70 2,759 2,269 -490 -17.772000 1.70 8.94 13.94 2,373 2,301 -72 -3.022001 1.93 7.23 13.06 2,526 2,786 260 10.292002 2.46 11.06 11.99 2,952 3,118 166 5.632003 3.14 8.18 9.56 3,002 3,080 78 2.592004 2.90 5.69 9.82 2,850 2,835 -16 -0.552005 2.66 0 9.45 2,517 2,589 72 2.87
1. The fingerlings are often introduced into the reservoir at the end of year (August - December), so
the impact of stocking to population growth is assumed to begin from the following year. 2. “Standardized catch” or sustainable yield is theoretical harvest level, it is estimated by harvest
function (Eq. 3.7) of the modified surplus production model in Chapter III. 3. It presents the difference between the actual catch and the standardized catch, and the ratio of the
difference between the actual catch and the standardized catch to the standardized catch.
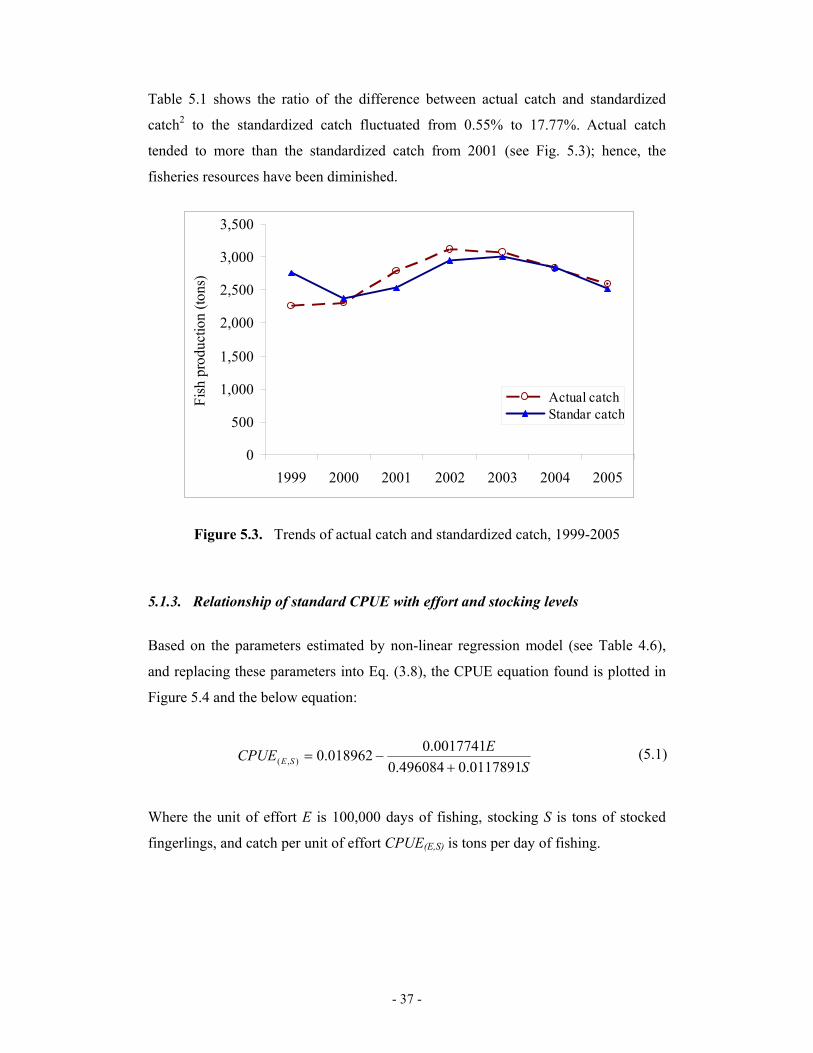
- 37 -
SECPUE SE 0117891.0496084.0
0017741.0018962.0),( +−= (5.1)
0
500
1,000
1,500
2,000
2,500
3,000
3,500
1999 2000 2001 2002 2003 2004 2005
Fish
pro
duct
ion
(tons
) ...
Actual catchStandar catch
Table 5.1 shows the ratio of the difference between actual catch and standardized
catch2 to the standardized catch fluctuated from 0.55% to 17.77%. Actual catch
tended to more than the standardized catch from 2001 (see Fig. 5.3); hence, the
fisheries resources have been diminished.
Figure 5.3. Trends of actual catch and standardized catch, 1999-2005
5.1.3. Relationship of standard CPUE with effort and stocking levels
Based on the parameters estimated by non-linear regression model (see Table 4.6),
and replacing these parameters into Eq. (3.8), the CPUE equation found is plotted in
Figure 5.4 and the below equation:
Where the unit of effort E is 100,000 days of fishing, stocking S is tons of stocked
fingerlings, and catch per unit of effort CPUE(E,S) is tons per day of fishing.

- 38 -
01
23
45 0
20
40
60
80100
00.0050.01
0.015
01
23
4 E
S
CPUE(E,S)
05000
1000015000
20000 0
20
40
60
80
100
02000400060008000
05000
1000015000
S
X
F(X,S)
Figure 5.4. Plotted curve of standardized CPUE vs. effort and stocking
5.2. Impact of stocking on population growth and harvest regime
5.2.1. Impact of stocking on population growth The MSPM found the population growth equation that was determined by
substituting the parameters estimation in Table 4.6 into Eq. (3.4), and expressed as:
Where the unit of stock biomass X is tons, stocking S is tons of stocked fingerlings,
and population growth F(X,S) is tons.
Figure 5.5. Population growth curve vs. stocking and stock biomass levels
( )
−+=
2026710117891.0496084.0),(
XXSF SX (5.2)
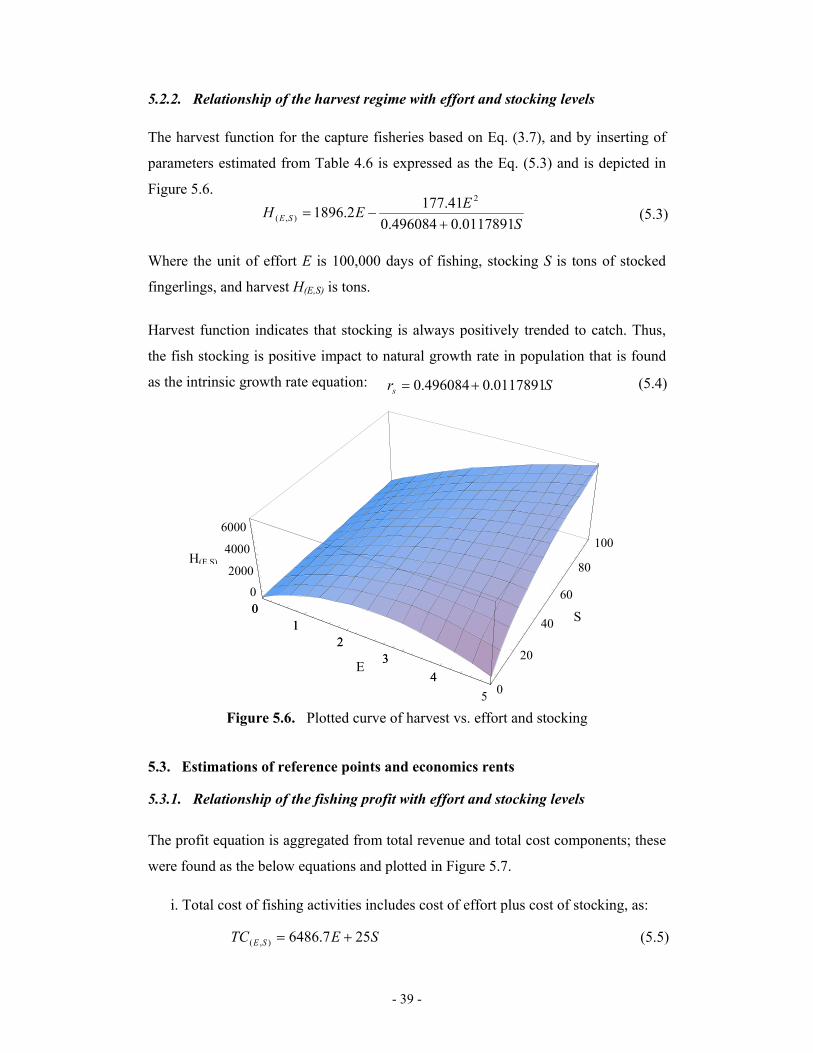
- 39 -
01
23
45 0
20
40
60
80
100
0
2000
4000
6000
01
23
4 E
S
H(E,S)
5.2.2. Relationship of the harvest regime with effort and stocking levels The harvest function for the capture fisheries based on Eq. (3.7), and by inserting of
parameters estimated from Table 4.6 is expressed as the Eq. (5.3) and is depicted in
Figure 5.6.
Where the unit of effort E is 100,000 days of fishing, stocking S is tons of stocked
fingerlings, and harvest H(E,S) is tons.
Harvest function indicates that stocking is always positively trended to catch. Thus,
the fish stocking is positive impact to natural growth rate in population that is found
as the intrinsic growth rate equation:
Figure 5.6. Plotted curve of harvest vs. effort and stocking
5.3. Estimations of reference points and economics rents
5.3.1. Relationship of the fishing profit with effort and stocking levels The profit equation is aggregated from total revenue and total cost components; these
were found as the below equations and plotted in Figure 5.7.
i. Total cost of fishing activities includes cost of effort plus cost of stocking, as:
SEEH SE 0117891.0496084.0
41.1772.18962
),( +−= (5.3)
Srs 0117891.0496084.0 += (5.4)
SETC SE 257.6486),( += (5.5)

- 40 -
01
23
45
Effort
0
20
40
60
80
100
Stocking
-10000
-5000
0Profit
01
23
4EffortE
S
П(E,S)
ii. Total revenue of fishing activities is landed fish price multiplied by harvest, as:
iii. Profit of fishing activities equals total revenue minus to total cost, as:
Where the unit of effort E is 100,000 days of fishing, stocking S is tons of stocked
fingerlings, and TR(E,S), TC(E,S), П(E,S) are million VNDs.
Figure 5.7. Plotted curve of profit vs. effort and stocking
5.3.2. Estimations of MSY, MEY, OAY and Economic rents When sustainable equilibrium occurs, the MSPM was used to calculate the indicators
of reference points for the fishery in the reservoir as presented in Table 5.2. The
parameterized harvest function (see Eq. 5.3) indicates that fish harvested was
positively correlated to the stocking rate. To estimate the reference points, the
stocking rate and effort level have to be solved simultaneously. The stocking rate
technically cannot exceed a given maximum stocking density, consequently, the
values of MSY, MEY, OAY and the corresponding effort levels are local maximum
values and limited in terms of a given range of stocking quantity.
SEETR SE 0117891.0496084.0
096.9737.104002
),( +−= (5.6)
SS
EESE 250117891.0496084.0
096.97396.39132
),( −+
−=∏ (5.7)

- 41 -
Table 5.2. Calculation indicators of the reference points and economic rents
Items: Harvest condition 11 Harvest condition 22 Harvest condition 33
MSY MEY OAY MSY MEY OAY MSY MEY OAY
Current status4
Effort5 (days of fishing) 265,113 99,767 199,534 315,514 118,734 232,243 895,133 336,855 602,258 266,444Catch (tons) 2,514 1,536 2,360 2,991 1,828 2,783 8,487 5,186 7,578 2,589Stocking6 (tons) 0 0 0 8.00 8.00 8.00 100 100 100 0Total Revenue (million VNDs) 13,787 8,424 12,943 16,408 10,025 15,265 46,550 28,443 41,567 14,200Total Cost7 (million VNDs) 17,197 6,472 12,943 20,666 7,902 15,265 60,565 24,351 41,567 19,197 + Cost for fishing (million VNDs) 17,197 6,472 12,943 20,466 7,702 15,065 58,065 21,851 39,067 19,197
+ Cost for stocking (million VNDs) 0 0 0 200 200 200 2,500 2,500 2,500 0
Profit (million VNDs) -3,410 1,952 0 -4,259 2,124 0 -14,015 4,092 0 -4,9971. Harvest condition 1: stocking quantity is limited or not introduced into the reservoir. 2. Harvest condition 2: stocking quantity is actually introduced into the reservoir, with an average of 48 fingerlings/ha (i.e. corresponding 1.2 million fingerlings/year or 8 tons fingerlings/year). This rate of stocking is suitable with investment capacity of the DNFC at present. 3. Harvest condition 3: stocking quantity is set up at optimal level. Stocking rate technically cannot exceed a given maximum stocking density, with about 600 fingerlings/ha (i.e. corresponding 15 million fingerlings/year or 100 tons fingerlings/year) (see Table 2.1). 4. The current fishing status (in 2005), data calculated from DNFC (2005). 5. Standardized effort measured in terms of number of fishing days, if it is converted to the corresponding number of households, it will be an average of 156 fishing days per household per year. 6. Weight of fish fingerlings was introduced into the reservoir at different levels of investment capacity. 7. Harvested fish price is 5,485 VNDs/kg; cost per unit of effort is 64,867 VNDs/days of fishing; cost per unit of fish stocking is 25,000 VNDs/kg of fingerlings; and an average of 150 fingerlings/kg.

- 42 -
Regarding the capture fisheries in Tri An reservoir, the harvest condition can be
separated to three levels that depend on given ranges of stocking quantity, as follows:
1. Harvest condition 1: fish stocking is limited or not introduced into the
reservoir.
2. Harvest condition 2: stocking quantity is still kept as the same as the
current level. Stocked density actually introduced was 48 fingerlings/ha.
This rate of stocking is suitable with the current investment capacity of the
DNFC.
3. Harvest condition 3: stocking quantity is set up at optimal stocking level.
Stocking rate technically cannot exceed a given maximum stocking
density, with about 600 fingerlings/ha.
As indicated in Table 5.2, the values of MSY level are different at the harvest
conditions. When these estimated values are compared with the actual catch and
effort values in Table 5.1, the MSY at the harvest condition 1 was attained back in
late 2001. At the harvest condition 2 the MSY level occurred back to 2002, whereas,
value of MSY at the harvest condition 3 was never reached before total catch stated
reducing (see Fig. 5.8).
On the other hand, there are different values of MEY level related to three harvest
conditions respectively. Comparing these values with the actual catch and effort
figures in Table 4.1 and Table 5.1, at the harvest condition 1 and 2, the MEY level
was attained back in late 1996 and 1997, respectively, while the MEY level at harvest
condition 3 has never been reached (see Fig. 5.8 and Fig. 5.9).
Regarding the issue of open access at different harvest conditions, Table 5.2 also
shows that the values of OAY level are different. Compared to figures in Table 4.1
and Table 5.1 indicated that values of the OAY level were reached in late 2000 and
2001 related to harvest conditions 1 and 2, respectively. At harvest condition 3, the
OAY level is still not attained, because the stocking program was not funded
sufficiently to ensure the maximum stocking quantity.
The computed total revenues, total costs and economic rents using the MSPM are also
shown in Table 5.2. Considering the economic efficiency, if operated at MSY target,
the fishing profit is always negative at all harvest conditions. Conversely, if operated

- 43 -
02.5
57.5
1099
99.2
99.4
99.6
99.8
100
02000400060008000
02.5
57.5
10
H(E,S)
E
S
•MSY
•MEY
01
23
45 99
99.2
99.4
99.6
99.8
100
-20000
2000
4000
01
23
4
Π(E,S)
E
S
•Πmax
at MEY target, the positive profit increases from 1,952 to 2,124 and 4,092 million
VNDs associated to the harvest condition 1, 2 and 3, respectively.
Figure 5.8. Harvest curve vs. stocking and effort at harvest condition 3
The graph is plotted from Eq. (5.3) in the case of optimal stocking; it shows that MSY may
reach at 8,487 tons when effort level is set up at 895,133 days of fishing. MEY value may
attain at 5,186 tons as long as the corresponding effort level is set up at 336,855 days.
Figure 5.9. Profit curve vs. stocking and effort at harvest condition 3
The graph is plotted from Eq. (5.7) in the case of optimal stocking; it shows that maximum
profit may attain at 4,092 million VNDs when effort level is set up at 336,855 days of
fishing.
- 44 -
Chapter VI
VI. DISCUSSION AND CONCLUSION
6.1. Discussion
6.1.1. Impact of fish stocking on population dynamics
Restocking and conservation measures are frequently implemented where the
fisheries resources have been overexploited or suffered environmental perturbation.
Introduction of fish into a reservoir may improve fish production where native stocks
have declined due to overfishing (Muli 1998; Welcomme 1998). Stocking may thus
be a method to meet to the problem of overexploitation (Cowx 2002). The major aims
of the stocking program in the reservoir are biological control and balancing a
depleted fish population, however the impact of stocking to fish population dynamics
was not considered in previous studies. This study initially points out the relationship
between stocking and the rate of population change. The MSPM describes one
possible interaction between fish stocking and population growth (see Eq. 5.2).
The stocking rate is found to be positively correlated to population growth, as the
change in population biomass per unit of time increased rapidly when many
fingerlings were introduced into the reservoir (see Fig. 5.5). Most of the stocked
species are non-predatory species, mostly plantivorus, zooplankton, organic detritus
and/or periphyton species, with the dominant species of Silver carp and Big head carp
(see Fig. 2.3). According to Luu (1998) and Luong et al. (2004), development of
these stocked species relies on natural food within the reservoir being ecologically
sound and most likely more sustainable. In addition, previous studies also point out
that these stocked fish are unable to reproduce locally or to adapt and compete
successfully with the local species in terms of growth and competition for food in the
reservoir (Ali 1998; An 2001; Hao 1997). Consequently, the stocking needs to
compensate for recruitment overfishing, and to maintain the fisheries productivity of
a water body at the highest possible level (Welcomme 1998). The findings of this
study and results of previous studies indicate that fish stocking in the reservoir is
positively related to changes in population growth and leads to a faster increase in the
population biomass compared with growth in the case of no stocking.

- 45 -
6.1.2. Influence of fish stocking on harvesting regime In order to evaluate the role of stocking in enhancing fish production, the fish yield or
harvest level needs to be considered (An 2001; Cowx 1998). Stocking in inland
waters in Southeast Asia is proven and recognized as a successful methods of
increasing and sustaining fish catch (An 2001; Li & Xu 1995; Welcomme 1998). In
connection to this study, the findings in Figure 2.4 and Figure 5.2 showed that the
yield increased considerably when fish fingerlings were stocked into the reservoir,
compared to the year before the stocking program. The stocking was positively
trended to change in catch; it led to an increase in actual catch from 2,269 tons in
1999 to 3,118 tons in 2002, corresponding to an increase in stocking quantity. After
that, the actual catch reduced as a result of stocked fish quantity declining (see Table
5.1). The MSPM also found the harvest function for fishing activity in the reservoir
(see Eq. 5.3).
The change of harvest level depended on stocking rate and effort level (see Eq. 5.3
and Fig. 5.5). This indicates that the higher rate of stocking led to the greater yields of
harvested fish levels, while the effort rate was only positively increased in harvested
fish up to a certain limit, after which yields decline. Stocked fisheries can be managed
by changing the stocking rate or the fishing effort; however, they need to be
controlled by simultaneous change in both effort level and stocking rate. The
important issue of stocking management should define and note that high effort rates
combined with low stocking density leads to overfishing, conversely, leading to
overstocking/or superfluous stocking quantity (Lorenzen 1995). Welcomme (1998)
notes that effort and stocking are positively correlated and increases in yield should
be achieved by simultaneous increases in both effort and stocking rates, although an
initial reduction in effort may be needed to give the stocked population time to
establish.
6.1.3. Overfishing issues in the reservoir
In many cases, signs of overfishing are typically indicated in fisheries by decline in
CPUE, reduction in size of capture, loss of large-sized species, and change in

- 46 -
exploitation to smaller, less valued fish species (Clark 1985; Cowx 2002; Lokina
2000). In order to show whether or not overfishing indeed exists in the reservoir,
CPUE is an index of abundance and level of fisheries resources exploitation. The
MSPM indicated that relationship of CPUE with stocking and effort rates was defined
as Eq. (5.1).
The CPUE was in negative trend with effort level and positive trend with stocking
rate (see Eq. 5.1 and Fig. 5.4). The results in Table 5.1, Figure 5.2 and Figure 5.4
indicated that CPUE reduced gradually from 13.94 kg per fishing day in 2000 to 9.45
kg per fishing day in 2005, the tendency of CPUE corresponded to variations of effort
and stocking rates at that time. Regarding effort in number of fishing households (see
Fig. 5.1), the trend of CPUE decreased in the first three-year period, and then it
increased quickly until 2002 as the positive results of the stocking program became
evident. However, from 2003 up to now the CPUE has reduced steadily. It is
evidence to conclude that the current fisheries resources in the reservoir are
diminished and show signs of overfishing, and may suggest sustainability of the
resource is under threat. Tung et al. (2004) and Hao (1997) report that aquatic
resources of the reservoir have been reduced in terms of quantity and size of fish in
recent years.
The trend of catch also showed that actual fish harvested has been more than the
standardized catch from 2001 (see Table 5.1 and Fig. 5.3), so the fisheries resources
have tended to be degraded. In addition, the decline in effort in last three years may
be a sign of dwindling fisheries resources in the reservoir. Although the price of
harvested fish has increased recently as an impact of “Bird Flu Event” in late 2003,
the fishermen were still leaving the fishery. According to Lokina (2000), the
fishermen do not see the increase in fishing effort as a problem that was to be relating
to dwindling fish stocks. The interruption of the stocking program from 2004 was a
major reason leading to reduction in the number of fishing efforts. On the other hand,
the increase in the price of fuel may lead to decline of fishing profit, and this may be
another reason for many fishing households leaving the fishery or reducing their
fishing effort recently.

- 47 -
6.1.4. Main factors accounting for overfishing
The trend of CPUE showed that the current fisheries resources in the reservoir are
overexploited. In order to gain insight into reasons leading to overfishing, several
factors need to be considered such as:
i. The dramatical increase in fishing effort level: although the entry to the
fishery was restricted to the local fishermen only, the fishing effort has
increased quickly from 300 households in 1993 to 1,470 households in 2002,
and then reduced gradually to 872 households in 2005 (see Table 4.1).
ii. Low awareness level of the fishermen about conservation issues: most
fishermen have a low education level (FAU 2000), it implies that fishing is
an easy livelihood for poor local people and that the provision of greater
livelihood opportunities within the existing fishery could thus lead to
increased fishing effort. Due to low education levels, most fishermen are still
limited in perception on conservation of fisheries resources. They continued
to use the prohibited fishing gears, and catch small fish with a higher
intensity of fishing.
iii. Ineffective measures of fisheries management: although fishing regulation
and controlling system for fishing activities were set up in 1995, the
implementation is limited and difficult to achieve expected targets due to
weakness of management capacity, and lack of knowledge and officers to
manage and monitor (Luu 1998; Tung et al. 2004). Many illegal fishermen
enter the fishery without fishing license/without control as the result of a
lack of officers in license control and monitoring (DNFC 2005). The fishery
has often been mismanaged, usually in terms of regulating catch and access,
consequently the fish stock are overexploited or unable to support the
fishing pressure imposed (Cowx 2002).
iv. Inappropriate strategies of the stocking program: the stocking program
attracted a larger number of new fishermen to the fishery, with 748
households in 1996 and reached a peak at 1,470 households in 2002
compared with 400 in 1994 before the stocking program (see Table 4.1).
However, the stocking strategies were inappropriate, fish fingerlings were
stocked into the reservoir at low density (48 fingerlings/ha) compared with

- 48 -
regulation of stocking (see Table 2.1 and Fig 2.4). Thus, stocking could not
provide a sufficient quantity of catch demands to increasingly higher fishing
pressure levels. Lorenzen (1995) points out that low stocking density
combined with high fishing effort level lead to overfishing.
v. The use of illegal fishing gears and violation of fishing regulations: gear
limitations and fishing regulation were also set up in 1995; however, many
fishermen did not follow the regulations. Many violators of fishing
regulations still operated these types of prohibited gear that result in
destructive fishing activities such as explosives, toxicants, and certain other
destructive fishing methods (eg. filtering barrier with small mesh size). For
example, in 2005, the DNFC detected 165 violators who either used gears
with small mesh size, explosives and/or operated in closed areas.
6.1.5. Sustainability and efficiency issues In biological terms, MSY is a reference point used for control of the harvest regime.
The MSY is itself based on a biological model and indicates that a fish stock cannot
be exploited too heavily and shows the maximum harvest level that ensures
sustainable development (Clark 1990). To assess whether or not ecological
sustainability of the current stocking and fishing activities in the reservoir indeed
exist, the MSY level was estimated and compared with actual catches.
Theoretically, if the actual catch, effort level and stocking rate exceed the values of
the MSY level, it indicates that the current fisheries exploitation is unsustainable. The
findings report that at the harvest condition 1 and 2, sustainable yields increased and
reached values of the MSY level in late 2001 and 2002 respectively, and then
reduced below MSY level from 2004 (see Table 5.1 and Table 5.2). Therefore, the
fishery moved into a situation of biological overfishing. Currently, the interruption of
stocking time (i.e. harvest condition 1), actual effort level was more than the EMSY
from 2003, while actual stocking rate was too small compared with required SMSY.
This indicates that the current fisheries moved into a situation of biological
overfishing, because the high effort level combined with low stocking density lead to
overfishing (Lorenzen 1995). The MSY were also less than the actual catch from
2002, which is evidence that the current fishery was unsustainable. However,

- 49 -
regarding the harvest condition 3 values of MSY level have not yet been reached, this
MSY level only reaches at 8,487 tons when ensured by simultaneously set up EMSY at
895,133 fishing days and SMSY at 100 tons of fish fingerlings (see Table 5.2 and Fig.
5.8). This MSY target may be impossible/or ineffective to be applied to management
in the reservoir, because it is very difficult to implement in terms of monitoring and
controlling, especially for a large reservoir as Tri An.
Regarding economics, economic efficiency occurs when the sustainable catch or
effort level and stocking rate for the fishery as a whole maximizes profits. This point
is referred as MEY that is the largest difference between total revenue and total cost
of fishing and stocking (Clark 1985). At the MEY level, the stock biomass is larger
than that associated with MSY level, so the economic objective of MEY is better than
that of MSY in protecting the fishery from negative environmental shocks that may
diminish the fish population (Kompas 2005). Catch and effort levels at MEY will
vary due to a change in the price of harvested fish or the cost of fishing and stocking.
As long as the cost of fishing and stocking increase, the MEY as a target will always
be preferred to MSY, the harvested fish at the MSY level becomes economic
overfishing (Kompas 2005).
The findings show that MEY at the harvest condition 1 and 2 attained at 1,536 and
1,828 tons when the corresponding EMEY was produced at 99,767 and 118,734 days of
fishing, respectively (see Table 5.2). Comparing these values at MEY with the actual
data, the fishery sustained economic overfishing from 1996 up to now. The main
reasons of economic overfishing were inappropriate stocking strategies and poor
management. Regarding the harvest condition 3, the MEY can be reached at 5,186
tons, and produced at effort of 336,855 fishing days (see Table 5.2 and Fig. 5.8),
however, this MEY level was never attained before. This MEY target may be applied
for reservoir management, because it may be suitable with the existing management
capacity.
6.1.6. Required rational management of stocked fisheries
The findings from the MSPM indicate that the current fisheries exploitation level
constitutes overfishing and is unsustainable. At harvest condition 1 and 2, the current

- 50 -
effort level exceeded the sustained effort at MSY, MEY and OAY. The fish
fingerlings will continue to be introduced into the reservoir, thus a rational
management of stocked fisheries is required in order to guarantee sustainability and
efficiency of fish resources exploitation that can be exploited year after year
indefinitely into the future. The optimal stocking regime is dependent on the
harvesting regime and vice versa. Fishing activities are dependent on the harvesting
and stocking regimes, thus, a change in the fisheries management plan should be
ensured by simultaneous change in both stocking rate and effort level, and need to
avoid overstocking or overfishing (Lorenzen 1995). The following management
guidelines should be considered in order to improve the current fisheries
management:
i. If the fishery operation is maintained at harvest condition 2 in which 8 tons
of fingerlings are annually introduced into the reservoir, then change in
fishing effort levels and stocking rates to achieve levels at the reference
points may recover the current fisheries resources from degradation. In this
context, the current effort should increase by 18.42% and 8 tons of fish
fingerlings would be introduced into the reservoir to get the corresponding
MSY level. Whereas, to attain the MEY and OAY the current effort levels
have to be decreased by 55.44% and 12.84% respectively, and the stocking
rates sets up at 8 tons of stocked fingerlings.
ii. Considering harvest condition 3, the MSY and OAY targets seem to be
exceeding the management capacity, or are impossible and ineffective to be
applied in the large reservoir. Only MEY target may be possible to be
implemented for reservoir management. The current effort level is still less
than the effort level at MEY, hence, in order to achieve this MEY target the
current effort level would need to be increased by 26.43% while the
stocking rate would need to be 100 tons of stocked fingerlings.
6.1.7. Limitations of the study and model Data used in this study were collected mostly from the DNFC, so the quality of an
assessment of capture fishery status and management was very dependent on the
input information that can be limited in accuracy and reliability due to poor

- 51 -
management and poor stocking strategies. The R2 value of the non-linear regression
model was limited due to a short time series of data. Based on 138 surveyed fishing
households in 2004 and 2005, cost per unit of effort was calculated and assumedly
used for the reference points and economic rents estimation in this study, therefore
the results were still limited in accuracy.
The MSPM was assumed and has been developed for stock assessment in the
reservoir; however, it has disadvantages that should be improved in future studies.
The MSPM used and is based on some assumptions, and if these assumptions are not
met such as change of catchability or environmental factors, then the MSPM is not
suitable. The MSPM only used the catch/effort and stocking data to estimate the
biological parameters by non-linear regression, so the findings were limited in
accuracy because of the multi-species nature of the fisheries resource and lack of long
historical data series. In addition, the bioeconomics approach including both biology
of the stock and economics of the fishery was also modified based on the MSPM.
This approach required many parameters concerning all aspects of fishing activities
such as costs of effort/stocking, prices, etc., therefore, the complexity of the model
increases its uncertainties. Moreover, the high fluctuation of landed fish price and
cost of fishing effort were also reasons leading to uncertainties of this approach.
Based on the limitations addressed, in future the MSPM should be applied for single
species that are commercial species. The impact of fish stocking will be tested more
accurately based on the biological relationship between stocked species and native
species. To ensure greater certainty of the MSPM and bioeconomics approach, future
studies should use long data time-series of catch, effort and stocking, and more
detailed and accurate fish price and cost of fishing by month.
6.2. Conclusion and management implications
The surplus production model of Verhulst-Schaefer was modified and it initially
pointed out the relationship between fish stocking and the rate of population change.
The model assumed that fish stocking in the reservoir was positively correlated to
population growth and led to rapid increase in population growth compared with
change in the case of no stocking impact, which was confirmed by available data. To

- 52 -
evaluate the role of stocking in enhancement of fish production, the findings also
found that harvest level was positively related to change of stocking rate, and the
higher rate of stocking led to the greater yields of harvested fish. The harvest also
depended on the effort level, thus stocked fisheries can be managed by simultaneous
change in both effort level and stocking rate.
Empirically analyze and evaluate the status of fisheries resources exploitation affected
by the stocking program were implemented. Empirical results indicated that CPUE
declined steadily in recent years; therefore the current fisheries resources were
overexploited and have been degraded. There were many factors leading to
overexploitation of the fisheries resources, however, major factors can be specified as
dramatic increase in fishing effort, low awareness level of fishermen of conservation
issues, ineffective methods of management, and the use of illegal fishing gears and
violation of fishing regulations. In addition, the stocking strategies were
inappropriate, fish stocking of low density combined with high fishing effort also led
to overfishing.
The current exploitation of fisheries resources in the reservoir has moved into an
unsustainable situation of biological and economic overfishing. The main reason was
an excess of the current effort combined with low stocking rate compared with the
corresponding levels associated with the MSY target in harvest conditions 1 and 2.
On the other hand, the actual catch, effort and stocking rates also exceeded the levels
associated with the MEY target in these cases; hence, the fishery sustained economic
overfishing from 1996 up to the present. The current centralized top-down
management has proven ineffective and has faced many problems in fisheries
management, hence, rational and improved management are required in order to
ensure sustainability and efficiency of fish resources exploitation that can be
obtainable each year indefinitely into the future.
Sustainability and efficiency issues in a fishery, or pursuing MSY and MEY targets,
are important. To manage fisheries resources, the MSY and MEY are the simplest
reference points used to control the harvest regime and protect the fish population.
The values of MSY and MEY estimations based on the MSPM also helped to
evaluate biological sustainability and economic efficiency. The MSPM indicates that:

- 53 -
i. Regarding the biological side, if the fishery operates at harvest condition 3,
MSY reaches at 8,487 tons, with the effort level of 895,133 days. At present,
it would not be possible or effective to apply this MSY target to the Tri An
reservoir.
ii. From an economic point of view, if the fishery operates at harvest condition 3,
the MEY attains at 5,186 tons as long as the corresponding effort level is set
up at 336,855 days of fishing. This MEY target may be possible and can be
applied for fisheries resources exploitation because the current effort level is
less than the effort at MEY level and is suited to current management
capacity.
Fisheries management in Tri An reservoir is based on a centrally controlled, top–
down approach under provincial patronage, with the local authorities acting as the
centralized management authority. There are still many problems in fisheries
management related to the reservoir, for example, the current legal framework for
management was not yet suitable, protection of the fisheries resources was still very
limited, and funds for the stocking program into the reservoir was low. The current
fisheries management regime should be improved. This study provided preliminary
results on the status of stock and fisheries management to build and recommend
several possible measures for reservoir fisheries management.
The findings indicate that current fisheries resources are overfished and fishing
activities unsustainable. Since the fisheries resources have been depleted by
overfishing, the following management plans should be considered (Lorenzen et al.
2001), as follows:
1) Stocking to develop a largely culture-based fishery while maintaining high
exploitation rates; or
2) Supplemental stocking combined with more restricted harvesting to rebuild
natural spawning stocks more quickly than would be possible through harvest
restrictions alone.
Fisheries policy may be a choice between option (1) and option (2). In order to
improve the current fisheries management for the reservoir, option (1) seems to be the

- 54 -
MSY target at harvest condition 3. This option is not feasible when applied to a large
reservoir as Tri An, because the stocked fish have a low survival rate in a large
reservoir and it is difficult to appropriately manage. Whereas option (2) seems to be
the MEY target at harvest condition 3, it may be possible for the reservoir fisheries
management because of the stocking program to compensate for recruitment
overfishing and to maintain the fisheries productivity at the possible harvest level.
Moreover, the MEY target is more suitable with existing management capacity.
However, in implementation of new management measures the following need to be
considered (Lokina 2000):
i. The policy should be flexible enough to allow for proper reaction to changes
in economic and biological conditions; and
ii. Involve the participation and support of the local communities and ensure
minimum resistance.
To implement simultaneously in both the restricted harvesting and supplemental
stocking, there are some effective measures for the control of fishing and protection
of fish resources (Bhukaswan 1980; Clark 1985; Cowx 2002), as follows:
1. Time and place restriction measures are more suitable for the reservoir
because the species caught varies from area to area, or from season to season
within the same area (DNFC 1997).
2. Regulation of the minimum size of fish caught, particularly by controlling the
mesh size of the fishing gear is difficult to enforce in the reservoir due to the
multi-species resources and multi-gears used. The application of this measure
must be considered carefully in the reservoir because it is impossible to set a
proper size limit suited for all species. However, regulation of mesh size
should be used for controlling the minimum commercial size in protected fish
populations in order to protect immature fish and first spawning fish.
3. Limitation of entry by limiting the fishermen and/or fishing units. This
management measure is also difficult to implement in this fishery since the
reservoir fisheries are open access and important firstly as a source of protein
and secondly as providers of employment. Moreover, one of purposes of the
fishery is to supply employment for people living around the reservoir, any
regulation that limited employment, either directly or indirectly, would not be

- 55 -
favorable (Amarasinghe & De Silva 1999; Kapetsky 1983). However, to get
the MEY target at harvest condition 3, this measure is not a serious problem
due to the current effort level less than EMEY. In this case, the policy makers
should choose an optimal stocking regime that have in order to avoid the
overfishing/overstocking situations.
4. The existing illegal fishing gears, non-registered fishermen and violation of
fishing regulations are the biggest social issues in the reservoir. Therefore, in
order to successfully implement the prohibition of destructive fishing
activities by prohibition of the use of explosives, toxicants, and certain other
destructive fishing methods, the policy actions on education of people living
around the reservoir need to be considered foremost. Training courses should
focus on protection of fisheries resources and the benefits of managed
fisheries resources to promote awareness of the fishing communities about
fisheries resource protection.
The current management regime through a centralized top-down management
approach has also proven ineffective in addressing and resolving the above issues,
primarily because of the absence of participation with the local communities. In the
search for alternative reservoir management approaches, the most promising option
appears to be co-management (Lorenzen et al. 2001; Nathanael & Edirisinghe 2002),
where all stakeholders, especially fishermen, collaborate with the government, to seek
solutions to fishery related issues. The essential idea of co-management is the sharing
of decision making and management functions between government and stakeholders
in the fishery (Bavinck et al. 2005; Charles 2001). Moreover, an important advantage
of a co-management approach for managers is that through co-operative societies,
more reliable catch and effort statistics can be collected which are useful not only for
monitoring the status of the fisheries but also for planning welfare programs
(Amarasinghe & De Silva 1999).
In the reservoir, co-management tasks such as the introduction of a licensing system
for fishing, setting up a monitoring system, establishment of a revolving fund to
ensure continuous supplies of fingerlings and promotion of a managed hatchery
should be implemented as a necessity. The fishing communities who invest funds in
stocking activities through fishing taxes should be interested in fisheries management.

- 56 -
The participation of these communities in fisheries governance may ensure that
stocked fish are harvested at optimum yield and fishermen who do not participate
financially in stocking activities are kept out. Furthermore, the co-management
approach allows all stakeholders to take roles in the governance process and to have
the chance for sharing of responsibility and power. The work pressure of the DNFC
and provincial government may be reduced, because other stakeholders as fishermen,
farmed-fishers and wholesalers will be directly involved in governance to monitor and
control all fishing activities.
- 57 -
REFERENCES Ahyaudin, B.A. & Lee, K.Y. (1994). Chenderoh reservoir, Malaysia: a
characterization of a small-scale, multi-gear and multi-species artisanal
fishery in the tropics. Fisheries Research 23 (1995), 267-281.
Ali, A.B. (1998). Impact of fish introductions on indigenous fish populations and
fisheries in Malaysia. In Stocking and introduction of fish (ed. I. G. Cowx),
pp. 274-286. Fishing News Books. Blackwell Science, Oxford.
Amarasinghe, U.S. & De Silva, S.S. (1999). Sri Lankan reservoir fishery: a case for
introduction of a co-management strategy. Fisheries Management and
Ecology 6, 387-399.
AMCF. (2002). Fisheries surveys in the Mekong Delta. RIA2, Ho Chi Minh.
An, N.Q. (2001). Effectiveness of stocking in reservoirs in Vietnam. In Reservoir and
culture-based fisheries: biology and management (ed. S. S. De Silva), pp.
235-245. Australian Centre for International Agricultural Research. Canberra,
Proceedings of an International Workshop held in Bangkok.
Bavinck, M., Chuenpagdee, R., Diallo, M., Van der Heijden, P., Kooiman, J., Mahon,
R. & Williams, S. (2005). Interactive fisheries governance: a guide to better
practice. Eburon Academic Publishers, Amsterdam.
Bernacsek, G.M. (1997). Large dam fisheries of the Lower Mekong countries: review
and assessment-main report and database. MRC, Bangkok.
Beverton, R.J.H. & Holt, S.J. (1993). On the dynamics of exploited fish populations.
Fish and fisheries series 11. Chapman & Hall., London.
Bhukaswan, T. (1980). Management of Asian reservoir 1980 fisheries. FAO Fisheries
Techincal Paper 207, Rome.
Boyce, W.E. & DiPrima, R.C. (1992). Elementary differential equations and
boundary value problems - 5th ed. Wiley, New York.
Charles, A. (2001). Sustainable Fishery Systems. Fishing News Books. Blackwell
Science, Oxford.
Clark, C.W. (1973). Profit maximisation and the extinction of animal species.
Political Economy 81 4, 950-961.
Clark, C.W. (1985). Bioeconomic modelling and fisheries management. Wiley, New
York.

- 58 -
Clark, C.W. (1990). Mathematical bioeconomics: the optimal management of
renewable resources, 2nd edition. Wiley, New York.
Coates, D. (2002). Inland capture fishery statistics of Southeast Asia: current status
and information needs. FAO Regional Office for Asia & Pacific, Bangkok.
Cowx, I.G. (1996). The integration of fish stock assessment into fisheries
management. In Stock assessment in inland fisheries (ed. I. G. Cowx), pp.
495-506. Fishing News Books. Blackwell Science, Oxford.
Cowx, I.G. (1998). Stocking strategies: issues and options for future enhancement
programs. In Stocking and introduction of fish (ed. I. G. Cowx), pp. 3-13.
Fishing News Books. Blackwell Science, Oxford.
Cowx, I.G. (2002). Principles and approaches to the management of lake and
reservoir fisheries. In Management and ecology of lake and reservoir fisheries
(ed. I. G. Cowx), pp. 336-393. Fishing News Books. Blackwell Science,
Oxford.
De Silva, S.S. (1988). The reservoir fishery of Asia. In Reservoir fishery management
and development in Asia (ed. S. S. De Silva), pp. 19-28. International
Development Research Centre, Proceedings of a workshop held in Nepal.
De Silva, S.S. (2001). Reservoir fisheries: broad strategies for enhancing yields. In
Reservoir and culture-based fisheries: biology and management (ed. S. S. De
Silva), pp. 7-15. Australian Centre for International Agricultural Research.
Canberra, Proceedings of an International Workshop held in Bangkok.
DNFC. (1995). Capture fisheries and aquaculture planning for Tri An reservoir (In
Vietnamese). Department of Agriculture and Rural Development, Dong Nai.
DNFC. (1997). Assessment of potentials, current situation and planning for
sustainable fisheries development in Tri An reservoir (In Vietnamese).
Department of Agriculture and Rural Development, Dong Nai.
DNFC. (2005). Annual technical reports on fisheries activities of Tri An reservoir
from 1987-2005 (In Vietnamese). Department of Agriculture and Rural
Development, Dong Nai.
FAU. (2000). Assessment of potentials, current situation and planning for sustainable
fisheries development for Dong Nai province (1999-2010) (In Vietnamese).
The University of Agriculture and Forestry, Ho Chi Minh.
FAU. (2001). Survey on fish production in Tri An Reservoir in 2001 (In
Vietnamese). The University of Agriculture and Forestry, Ho Chi Minh.

- 59 -
FAU. (2004). Survey on fish production in Tri An Reservoir in 2004 (In
Vietnamese). The University of Agriculture and Forestry, Ho Chi Minh.
Flaaten, O. (2004). Lecture notes on fisheries economics and management.
Norwegian College of Fishery Science, University of Tromsø, Tromsø.
Frank, H.C., Clark, C.W. & Gordon, R.M. (1979). The optimal exploitation of
renewable resource stocks: problems of irreversible Investment. Econometrica
1 47, 25-48.
Gallant, A.R. (1987). Nonlinear statistical models. Wiley, New York.
Gordon, R.M. & Clark, C.W. (1980). Fisheries and the processing sector: Some
implications for management policy. The Bell Journal of Economics 2 11,
603-616.
Gulland, J.A. (1977). The problems of population dynamics and contemporary
fisheries management. In Fish population dynamics: the implication for
management, vol. XI (ed. J. A. Gulland), pp. 383-406. John Wiley,
Chichester.
Haddon, M. (2001). Modelling and quantitative methods in fisheries. Chapman &
Hall, Boca Raton, Fla.
Hannesson, R. (1993). Bioeconomic analysis of fisheries. Fishing News Books.
Blackwell Science, Oxford.
Hao, N.V. (1994). Fisheries development in the reservoirs of Vietnam (In
Vietnamese). In The National workshop on Integrated fisheries management
of reservoir in Vietnam, pp. 20-30. Ministry of Fisheries, Hanoi.
Hao, N.V. (1997). Culture-based on large water surface areas in Vietnam (In
Vietnamese). The University of Fisheries, Nha Trang.
Jennings, S., Kaiser, M.J. & Reynolds, J.D. (2001). Marine fisheries ecology.
Blackwell Science, Oxford.
Kapetsky, J.M. (1983). Management of fisheries large African reservoirs - An
overview. In Reservoir fisheries management: strategies for the 80's (ed. G.
E. Hall, D. A. Van & J. Michael), pp. 28-38. American Fisheries Society,
Proceedings of a symposium held in Lexington, Kentucky.
King, M. (1995). Fisheries biology: assessment and management. Fishing News
Books. Blackwell Science, Oxford.
Kompas, T. (2005). Economic efficiency and the concept of maximum economic
yield. Fisheries management 12, 152-160.
- 60 -
Lam, N.V. (1994). Development trend of fisheries in Thac ba reservoirs (In
Vietnamese). In The second workshop on reservoir fisheries in Vietnam, pp.
20-30. Ministry of Fisheries, Habac.
Lever, C. (1998). Introduced fishes: an overview. In Stocking and introduction of fish
(ed. I. G. Cowx), pp. 143-152. Fishing News Books. Blackwell Science,
Oxford.
Li, S. & Xu, S. (1995). Culture and capture of fish in Chinese reservoirs. The
International Development Research Centre, Ottawa.
Lokina, R.B. (2000). An Economic Analysis to Sustainable Fisheries Management.
Unit of Environmental Economics, Goteborgs University, Sweden.
Lorenzen, K. (1995). Population dynamics and management of culture-based
fisheries. Fisheries Management and Ecology 2, 61-73.
Lorenzen, K., Amarasinghe, U.S., Bartley, D.M., Bell, J.D., Bilio, M., De Silva, S.S.,
Garaway, C.J., Hartmann, W.D. & Kapetsky, J.M. (2001). Strategic review of
enhancements and culture-based fisheries. In Aquaculture in the Third
Millennium. (ed. R. P. Subasinghe, P. Bueno, M. J. Phillips, C. Hough & S. E.
McGladdery), pp. 221-237. Technical Proceedings of the Conference on
Aquaculture in the Third Millennium, Bangkok.
Luong, V.C., Yang, Y. & Chang, K.L. (2004). Cove culture of marble goby
(Oxyeleotris marmorata Bleeker) and carps in Tri An Reservoir of Vietnam.
Aquaculture 244 (2005), 97-107.
Luu, T.T. (1998). The survey of pollution of cage aquaculture in Tri An Reservoir in
1997-1998 (In Vietnamese). RIA2, Ho Chi Minh.
Mark, N.M. & Andre, E.P. (2004). Standardizing catch and effort data: a review of
recent approaches. Fisheries Research 70 (2004), 141-159.
MoF. (1996). Fisheries resources of Vietnam (In Vietnamese). Agricultural
Publishing House, Hanoi.
MRC. (2003). Mekong fish database - CD-ROM. Fisheries Programme, Cambodia.
Muli, J.R. (1998). An appraisal of stocking and introduction of fish in Lake Victoria
(East Arfica). In Stocking and introduction of fish (ed. I. G. Cowx). Fishing
News Books. Blackwell Science, Oxford.
Nathanael, S. & Edirisinghe, U. (2002). Developing co-management in an artisanal
gill net fishery of a deep hydro-electric reservoir in Sri Lanka. Fisheries
Management and Ecology 9, 267–276.

- 61 -
Seijo, J.C., Defeo, O. & Salas, S. (1998). Fisheries bioeconomics: theory, modelling
and management. FAO, Rome.
Sonny, K. & Oscar, C. (2001). Management options for the inland fisheries resource
in South Sumatra, Indonesia: I bioeconomic model. University of New
England, Australia.
Tran, L.P.D. (2002). Administrative Atlas. Cartographic Publishing House, Hanoi.
Tung, N.T., Trong, N.V. & Chau, L.N. (2004). Survey on fish composition in Tri An
reservoir (In Vietnamese). RIA2, Ho Chi Minh.
Van, N.V. & Luu, L.T. (2001). Status of reservoir fisheries in Vietnam. In Reservoir
and culture-based fisheries: biology and management (ed. S. S. De Silva), pp.
29-35. Australian Centre for International Agricultural Research. Canberra,
Proceedings of an International Workshop held in Bangkok.
Welcomme, R.L. (1998). Evaluation of stocking and introduction as management
tools. In Stocking and introduction of fish (ed. I. G. Cowx), pp. 397-413.
Fishing News Books. Blackwell Science, Oxford.
Welcomme, R.L. (2001). Inland fisheries: Ecology and Management. Fishing News
Books. Blackwell Science, Oxford.
Wolfram, S. (2005). Mathematica professional upgrade version 5.2.0 Windows (ed.
5.2.0). Wolfram Research, Oxford.
- 62 -
APPENDICES
Appendix 1. Data on fish stocking in Tri An reservoir, 1995-2003 [Source: data cited from DNFC (2005)]
STATISTICAL DATA IN 1995 STATISTICAL DATA IN 1996 STATISTICAL DATA IN 1997 Species name
Scientific name
Biological features Weight1 Quantity2 Cost3 Weight1 Quantity2 Cost3 Weight1 Quantity2 Cost3
Silver carp H.molitris Planktivorous 2,105 314,317 52.63 3,077 459,387 76.92 8,106 1,210,363 202.66 Bighead carp A.nobilis Planktivorous 1,102 160,822 27.54 1,610 235,048 40.25 4,242 619,290 106.06 Grass carp C.idellus Herbivorous 793 114,320 19.82 1,159 167,083 28.97 3,054 440,221 76.34 Nile tilapia O.niloticus Detritivorous 1,026 150,120 25.64 1,499 219,406 37.48 3,950 578,078 98.74 Common carp C.carpio Detritivorous 1,049 162,310 26.22 1,533 237,222 38.33 4,039 625,018 100.98 Indian carp L.rohita Detritivorous 887 120,759 22.16 1,296 176,494 32.39 3,414 465,016 85.35 Mud carp C.molitorella Detritivorous 1,110 163,925 27.74 1,622 239,583 40.54 4,273 631,239 106.82 Java barb B.gonionotus Detritivorous 755 113,426 18.88 1,104 165,776 27.59 2,908 436,776 72.69
1. Weight of stocked fish, with unit in kg
2. Quantity of stocked fish, with unit in number of fingerlings
3. Total cost of stocked fish, with unit in million VNDs

- 63 -
Appendix 1. Data on fish stocking in Tri An reservoir, 1995-2003 (cont.) [Source: data cited from DNFC (2005)]
STATISTICAL DATA IN 1998 STATISTICAL DATA IN 1999 STATISTICAL DATA IN 2000 Species name
Scientific name
Biological features Weight1 Quantity2 Cost3 Weight1 Quantity2 Cost3 Weight1 Quantity2 Cost3
Silver carp H.molitris Planktivorous 1,619 241,782 40.48 2,133 318,427 53.32 1,630 268,425 40.75 Bighead carp A.nobilis Planktivorous 847 123,709 21.19 1,116 162,925 27.90 0 0 0.00 Grass carp C.idellus Herbivorous 610 87,939 15.25 803 115,815 20.08 970 178,550 24.25 Nile tilapia O.niloticus Detritivorous 789 115,477 19.72 1,039 152,083 25.98 1,120 176,115 28.00 Common carp C.carpio Detritivorous 807 124,854 20.17 1,063 164,433 26.57 1,225 212,350 30.63 Indian carp L.rohita Detritivorous 682 92,892 17.05 898 122,338 22.45 0 0 0.00 Mud carp C.molitorella Detritivorous 854 126,096 21.34 1,124 166,069 28.10 1,518 237,863 37.95 Java barb B.gonionotus Detritivorous 581 87,251 14.52 765 114,909 19.12 770 127,330 19.25
STATISTICAL DATA IN 2001 STATISTICAL DATA IN 2002 STATISTICAL DATA IN 2003 Species name
Scientific name
Biological features Weight1 Quantity2 Cost3 Weight1 Quantity2 Cost3 Weight1 Quantity2 Cost3
Silver carp H.molitris Planktivorous 2,262 326,300 56.55 2,418 345,774 60.45 1,362 205,030 34.05 Bighead carp A.nobilis Planktivorous 1,216 172,505 30.40 1,776 255,765 44.40 1,023 157,847 25.58 Grass carp C.idellus Herbivorous 1,087 116,944 27.18 359 50,978 8.98 474 70,168 11.85 Nile tilapia O.niloticus Detritivorous 1,278 173,763 31.95 868 126,728 21.70 472 70,507 11.80 Common carp C.carpio Detritivorous 940 132,456 23.50 832 117,416 20.80 826 129,317 20.65 Indian carp L.rohita Detritivorous 2,374 315,763 59.35 531 75,296 13.28 326 49,048 8.15 Mud carp C.molitorella Detritivorous 1,157 158,942 28.93 612 86,904 15.30 757 113,717 18.93 Java barb B.gonionotus Detritivorous 742 103,492 18.55 782 109,844 19.55 458 72,714 11.45

- 64 -
Appendix 2. Data on capture fisheries activities in Tri An reservoir, 1999-2005 [Source: data cited from DNFC (2005)]
STATISTICAL DATA IN 1999 STATISTICAL DATA IN 2000 Type of fishing gear No.of
gears1 No.of hhs2
No.of boats3
No.of f.days4
Total catch5
Fish price6
No.of gears1
No.of hhs2
No.of boats3
No.of f.days4
Total catch5
Fish price6
Sprat scoop net 134 134 134 16,120 724,240 2 68 68 68 6,808 652,120 2Scoop net 1 40 40 19 2,850 124,050 5 52 52 52 2,530 225,000 5Scoop net 2 25 25 25 2,750 72,500 4 2 2 2 210 4,840 4Shrimp basket trap 13,050 279 156 23,200 109,240 7 21,360 356 356 46,140 195,750 7Trawl net 46 46 46 9,350 120,450 4 38 38 38 3,120 44,920 4Gill net 1 452 452 452 77,125 742,050 4 526 526 526 56,350 761,850 4Gill net 2 48 48 48 4,560 156,050 4.5 114 114 114 9,250 80,980 4.5Mussel trawl net 8 8 8 610 7,320 5 3 3 3 945 9,209 5Lift net 1 6 6 6 450 3,650 4.5 17 17 17 812 8,050 4.5Lift net 2 38 38 38 2,650 119,700 3 22 22 22 920 15,450 3Long line 25 25 25 3,750 16,520 7 132 132 132 9,140 69,560 7Spears 9 9 9 567 1,710 10 1 1 1 93 274 10Small cast net 12 12 12 1,720 20,790 5 27 27 27 2,020 32,000 5Big cast net 0 0 0 0 0 0 38 38 38 1,550 66,350 5Seines net 1 0 0 0 0 0 0 35 35 35 1,550 75,790 4Seines net 2 14 14 14 1,900 50,400 4 39 39 39 1,925 59,120 4Shrimp pull net 0 0 0 0 0 0 0 0 0 0 0 0 1. Number of gears, 2. Number of households, 3. Number of boats, 4. Number of fishing days, 5. Catch with unit in kg, 6. Price with unit in 1,000 VNDs/kg

- 65 -
Appendix 2. Data on capture fisheries activities in Tri An reservoir, 1999-2005 (cont.) [Source: data cited from DNFC (2005)]
STATISTICAL DATA IN 2001 STATISTICAL DATA IN 2002 Type of fishing gear No.of
gears1 No.of hhs2
No.of boats3
No.of f.days4
Total catch5
Fish price6
No.of gears1
No.of hhs2
No.of boats3
No.of f.days4
Total catch5
Fish price6
Sprat scoop net 78 78 78 7,850 844,606 2 58 58 58 9,900 994,776 2Scoop net 1 68 68 68 7,600 670,600 5 42 42 42 6,800 654,756 5Scoop net 2 3 3 3 596 34,500 4 1 1 1 100 3,897 4Shrimp basket trap 26,320 378 214 27,250 126,240 7 25,500 304 234 52,850 249,450 7Trawl net 68 68 68 6,020 82,320 6 28 28 28 7,600 109,662 6Gill net 1 197 197 197 32,325 465,625 4 157 157 157 31,250 395,768 4Gill net 2 90 90 90 18,550 145,350 6 90 90 90 22,950 187,560 6Mussel trawl net 14 14 14 950 9,350 7 14 14 14 1,850 21,560 7Lift net 1 41 41 41 1,450 17,250 5 22 22 22 1,950 23,552 5Lift net 2 52 52 52 2,160 53,790 4 36 36 36 2,780 59,977 4Long line 111 111 58 8,710 87,025 7 42 42 42 8,160 98,976 7Spears 2 2 2 189 850 12 0 0 0 0 0 0Small cast net 32 32 32 3,420 52,430 5 26 26 26 3,900 58,950 5Big cast net 19 19 19 845 31,420 8 10 10 10 1,500 49,242 9Seines net 1 17 17 17 850 40,250 8 10 10 10 1,050 47,545 9Seines net 2 28 28 28 1,950 59,200 4 21 21 21 2,700 72,685 4Shrimp pull net 39 39 39 5,125 64,725 7 31 31 31 6,725 89,505 7 1. Number of gears, 2. Number of households, 3. Number of boats, 4. Number of fishing days, 5. Catch with unit in kg, 6. Price with unit in 1,000 VNDs/kg

- 66 -
Appendix 2. Data on capture fisheries activities in Tri An reservoir, 1999-2005 (cont.)
[Source: data cited from DNFC (2005)] STATISTICAL DATA IN 2003 STATISTICAL DATA IN 2004
Type of fishing gear No.of
gears1 No.of hhs2
No.of boats3
No.of f.days4
Total catch5
Fish price6
No.of gears1
No.of hhs2
No.of boats3
No.of f.days4
Total catch5
Fish price6
Sprat scoop net 61 61 61 8,925 884,776 2.5 60 60 60 8,288 809,888 4Scoop net 1 42 42 42 7,902 694,756 5.5 40 40 40 7,501 661,628 9Scoop net 2 1 1 1 54 3,697 5.5 1 1 1 27 1,849 5.5Shrimp basket trap 27,300 273 273 48,250 249,450 9 25,300 253 253 43,625 207,175 18Trawl net 26 26 26 3,248 109,662 7 22 22 22 2,686 115,081 10Gill net 1 267 267 267 40,575 397,768 4.5 252 252 252 38,038 371,384 6Gill net 2 88 88 88 21,750 197,560 6 76 76 76 18,250 196,030 10Mussel trawl net 14 14 14 2,150 21,560 8 14 14 14 2,455 21,280 15Lift net 1 22 22 22 2,850 23,552 5.5 20 20 20 2,850 23,026 8Lift net 2 31 31 31 2,880 59,977 5.5 31 31 31 3,215 67,239 5.5Long line 39 39 39 13,250 98,976 8 39 39 39 11,279 93,738 20Spears 0 0 0 0 0 0 0 0 0 0 0 0Small cast net 36 36 36 4,150 58,950 5 34 34 34 3,925 55,725 6Big cast net 18 18 18 2,920 69,242 10 14 14 14 2,050 53,863 16Seines net 1 10 10 10 1,250 47,545 12 7 7 7 1,335 45,273 15Seines net 2 19 19 19 2,350 72,685 5 19 19 19 1,989 66,593 7Shrimp pull net 31 31 31 2,850 89,505 9 16 16 16 1,425 44,753 9 1. Number of gears, 2. Number of households, 3. Number of boats, 4. Number of fishing days, 5. Catch with unit in kg, 6. Price with unit in 1,000 VNDs/kg

- 67 -
Appendix 2. Data on capture fisheries activities in Tri An reservoir, 1999-2005 (cont.) [Source: data cited from DNFC (2005)]
STATISTICAL DATA IN 2005 STATISTICAL DATA IN 2006 Type of fishing gear No.of
gears1 No.of hhs2
No.of boats3
No.of f.days4
Total catch5
Fish price6
No.of gears1
No.of hhs2
No.of boats3
No.of f.days4
Total catch5
Fish price6
Sprat scoop net 58 58 58 7,650 735,000 4 - - - - - -Scoop net 1 38 38 38 7,100 628,500 9 - - - - - -Scoop net 2 0 0 0 0 0 0 - - - - - -Shrimp basket trap 25,090 295 232 39,000 164,900 18 - - - - - -Trawl net 17 17 17 2,124 120,500 10 - - - - - -Gill net 1 236 236 236 35,500 345,000 6 - - - - - -Gill net 2 64 64 64 14,750 194,500 10 - - - - - -Mussel trawl net 14 14 14 2,760 21,000 15 - - - - - -Lift net 1 17 17 17 2,850 22,500 8 - - - - - -Lift net 2 31 31 31 3,550 74,500 5.5 - - - - - -Long line 39 39 39 9,308 88,500 20 - - - - - -Spears 0 0 0 0 0 0 - - - - - -Small cast net 31 31 31 3,700 52,500 6 - - - - - -Big cast net 9 9 9 1,180 38,484 16 - - - - - -Seines net 1 4 4 4 1,420 43,000 15 - - - - - -Seines net 2 19 19 19 1,628 60,500 7 - - - - - -Shrimp pull net 0 0 0 0 0 0 - - - - - - 1. Number of gears, 2. Number of households, 3. Number of boats, 4. Number of fishing days, 5. Catch with unit in kg, 6. Price with unit in 1,000 VNDs/kg

- 68 -
Appendix 3. Results of non-linear regression statistics of CPUE function
The software used is “Mathematica 5.2.0 Windows” (Wolfram 2005)
Where: CPUE is catch/effort (tons/day of fishing); e is effort
standardization (100,000 days of fishing); sw1 is stocking (tons of
stocked fingerlings); q is catchability coefficient (tons/100,000
fishing days/year); k is carrying capacity (100,000 tons); and (r0+
a*sw1) is intrinsic growth rate which affected by stocking.

- 69 -
Appendix 4. Photographs of main fishing gears used
[Source: photos cited from AMCF (2002)]
Source of photographs in the front page:
(1) Photos showing main fish species introduced into the Tri An reservoir cited
from MRC (2003).
(2) Photo showing Tri An Hydro-Electric Plant cited from
http://www.dongnai-industry.gov.vn/english/tp_bh.html#vc
(3) Photo showing “Scoop net” cited from AMCF (2002)
Shrimp basket trap Gill-net
Sprat scoop net Long line