assessment hydrogen production with co2 capture, … library/research/energy analysis... ·...
TRANSCRIPT
Assessment of Hydrogen Production with CO2 Capture Volume 1: Baseline State-of-the-Art Plants
August 30, 2010
DOE/NETL-2010/1434

Disclaimer
This report was prepared as an account of work sponsored by an agency of the
United States Government. Neither the United States Government nor any
agency thereof, nor any of their employees, makes any warranty, express or
implied, or assumes any legal liability or responsibility for the accuracy,
completeness, or usefulness of any information, apparatus, product, or process
disclosed, or represents that its use would not infringe privately owned rights.
Reference therein to any specific commercial product, process, or service by trade
name, trademark, manufacturer, or otherwise does not necessarily constitute or
imply its endorsement, recommendation, or favoring by the United States
Government or any agency thereof. The views and opinions of authors expressed
therein do not necessarily state or reflect those of the United States Government
or any agency thereof.
ASSESSMENT OF
HYDROGEN PRODUCTION
WITH CO2 CAPTURE
VOLUME 1: BASELINE STATE-OF-THE-ART PLANTS
DOE/NETL-2010/1434
FINAL REPORT
August 30, 2010
NETL Contact:
Lawrence K. Rath
Systems Analyst
Office of Systems, Analyses and Planning
National Energy Technology Laboratory
www.netl.doe.gov

This page intentionally left blank

Assessment of Hydrogen Production with CO2 Capture Volume 1: Baseline State-of-the-Art Plants
I
8/30/2010
Table of Contents TABLE OF CONTENTS .............................................................................................................. I
LIST OF EXHIBITS................................................................................................................... III PREPARED BY ............................................................................................................................ V ACKNOWLEDGMENTS .......................................................................................................... VI LIST OF ACRONYMS AND ABBREVIATIONS .................................................................VII EXECUTIVE SUMMARY ...........................................................................................................1
PERFORMANCE SUMMARY ............................................................................................................1
COST ESTIMATING SUMMARY.......................................................................................................4
1. INTRODUCTION ................................................................................................................11 1.1 SITE DESCRIPTION ..........................................................................................................11
1.2 PRODUCT SPECIFICATIONS ..............................................................................................12 1.3 DESIGN NATURAL GAS ...................................................................................................13 1.4 DESIGN COAL .................................................................................................................14
1.5 PLANT CAPACITY FACTOR AND AVAILABILITY ..............................................................15 1.6 ENVIRONMENTAL REQUIREMENTS ..................................................................................15 1.7 PROCESS DESIGN CRITERIA ............................................................................................16
1.8 BALANCE OF PLANT ........................................................................................................18
2. COST ESTIMATING METHODOLOGY ........................................................................19
3. PROCESS DESCRIPTIONS ..............................................................................................23 3.1 STEAM METHANE REFORMING – CASES 1-1 AND 1-2 .....................................................23 3.2 COAL GASIFICATION – CASES 2-1 AND 2-2 .....................................................................26
3.3 GAS CLEANUP – CASES 2-1 AND 2-2 ...............................................................................27 3.4 PRESSURE SWING ADSORPTION SEPARATION PROCESS ..................................................29
3.5 CO2 COMPRESSION AND DEHYDRATION – ALL CASES....................................................29 3.6 CO2 TRANSPORT, STORAGE AND MONITORING – ALL CASES .........................................30
4. CASES 1-1 AND 1-2: SMR RESULTS ..............................................................................31 4.1 COMPONENT TABLES ......................................................................................................37 4.2 PERFORMANCE SUMMARY ..............................................................................................46
4.3 MASS AND ENERGY BALANCES ......................................................................................47 4.3.1 WATER BALANCE ..........................................................................................................49 4.3.2 CARBON BALANCE ........................................................................................................50
4.3.3 SULFUR BALANCE ........................................................................................................50 4.3.4 AIR EMISSIONS .............................................................................................................51
4.4 MAJOR EQUIPMENT LIST ................................................................................................51 4.5 COST ESTIMATION ..........................................................................................................54
4.5.1 EQUIPMENT COSTING...................................................................................................54
4.5.2 O&M COSTS................................................................................................................55 4.5.3 COST ESTIMATION RESULTS ..........................................................................................55
5. CASES 2-1 AND 2-2 RESULTS: COAL GASIFICATION WITH H2 SEPARATION
BY PSA .................................................................................................................................61 5.1 COMPONENT TABLES ......................................................................................................69 5.2 PERFORMANCE SUMMARY ..............................................................................................84 5.3 MASS AND ENERGY BALANCES ......................................................................................85
5.3.1 WATER BALANCE ..........................................................................................................87
Assessment of Hydrogen Production with CO2 Capture Volume 1: Baseline State-of-the-Art Plants
II
8/30/2010
5.3.2 CARBON BALANCE ........................................................................................................88
5.3.3 SULFUR BALANCE ........................................................................................................88 5.3.4 AIR EMISSIONS .............................................................................................................89
5.4 MAJOR EQUIPMENT LISTS ...............................................................................................89
5.5 COST ESTIMATION ..........................................................................................................98 5.5.1 EQUIPMENT COSTING...................................................................................................98 5.5.2 O&M COSTS................................................................................................................99 5.5.3 COST ESTIMATING RESULTS ........................................................................................100
6. SUMMARY ........................................................................................................................109 7. REFERENCES ...................................................................................................................123

Assessment of Hydrogen Production with CO2 Capture Volume 1: Baseline State-of-the-Art Plants
III
8/30/2010
List of Exhibits Exhibit ES-1 Case 1-1 & 1-2 Block Flow Diagram: SMR with PSA & CO2 Capture .................. 2 Exhibit ES-2 Case 2-1 Block Flow Diagram: Coal to Hydrogen with PSA & CO2 Capture ........ 2
Exhibit ES-3 Case 2-2 Block Flow Diagram: Coal to Hydrogen with PSA & CO2 Capture ........ 3 Exhibit ES-4 Overall Performance ................................................................................................ 3 Exhibit ES-5 Capital Cost Estimation Results (June 2007 dollars) ............................................... 4 Exhibit ES-6 Total As-Spent Cost Components (June 2007 dollars) ............................................ 5 Exhibit ES-7 First Year Cost of Hydrogen Estimation Results (June 2007 dollars) ..................... 6
Exhibit ES-8 First Year COH by Cost Component (June 2007 dollars) ....................................... 7 Exhibit ES-9 First Year COH Sensitivity to Fuel Costs (June 2007 dollars) ................................ 8 Exhibit ES-10 First Year COH Sensitivity to Capacity Factor (June 2007 dollars) ...................... 9
Exhibit 1-1 Site Ambient Conditions ........................................................................................... 11 Exhibit 1-2 Site Characteristics ................................................................................................... 11 Exhibit 1-3 Hydrogen Product Specification ............................................................................... 12
Exhibit 1-4 Carbon Dioxide Pipeline Specification..................................................................... 12 Exhibit 1-5 Design Natural Gas Analysis .................................................................................... 13
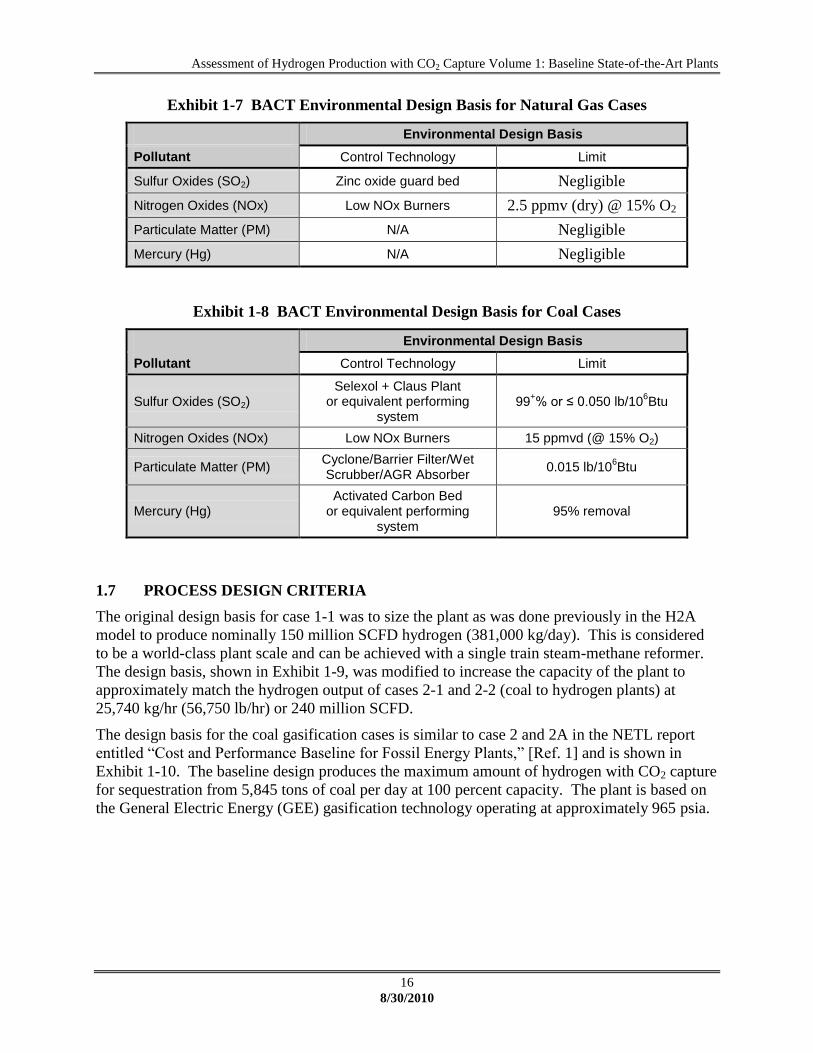
Exhibit 1-6 Design Coal Analysis – Illinois No. 6 ...................................................................... 14 Exhibit 1-7 BACT Environmental Design Basis for Natural Gas Cases ..................................... 16 Exhibit 1-8 BACT Environmental Design Basis for Coal Cases ................................................ 16
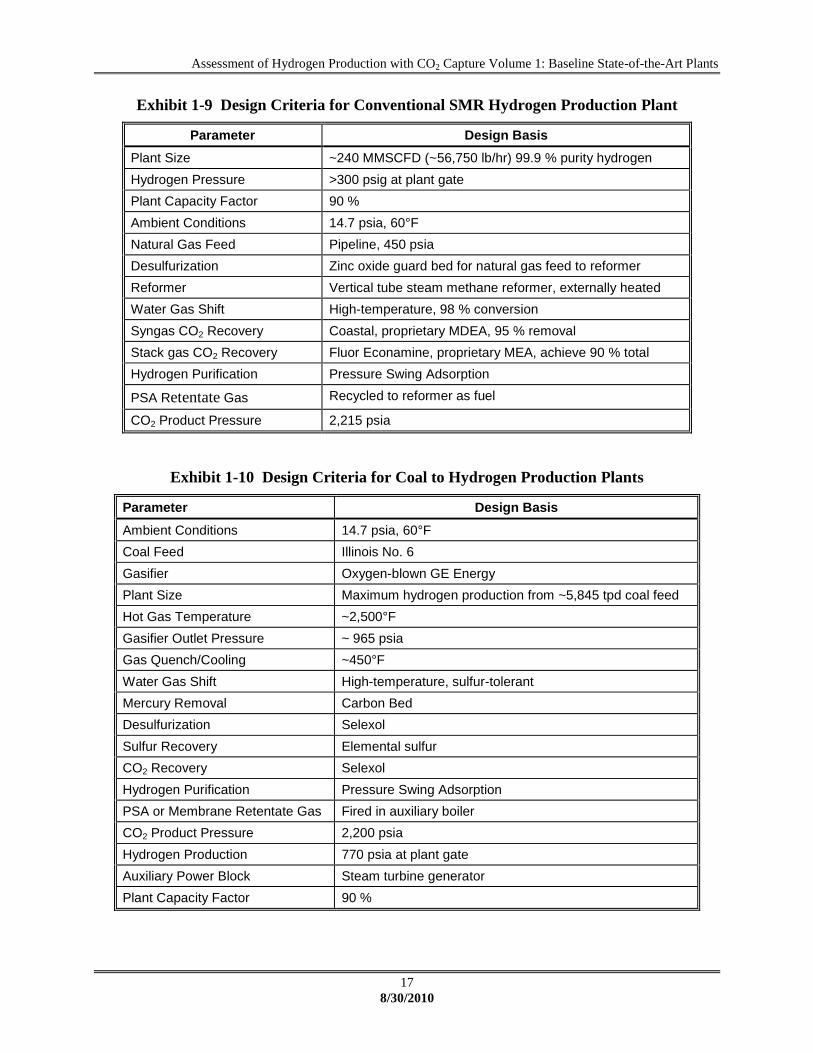
Exhibit 1-9 Design Criteria for Conventional SMR Hydrogen Production Plant ....................... 17 Exhibit 1-10 Design Criteria for Coal to Hydrogen Production Plants ....................................... 17
Exhibit 2-1 Financial Structure for High-Risk Fuels Projects ..................................................... 20 Exhibit 2-2 Parameter Assumptions for Cost of Hydrogen Calculations .................................... 21 Exhibit 3-1 Typical Composition of the Synthesis Gas Leaving a Steam-Methane Reformer ... 24
Exhibit 3-2 CO2 Compressor Interstage Pressures ...................................................................... 29
Exhibit 3-3 CO2 Pipeline Specification ....................................................................................... 30 Exhibit 3-4 Deep, Saline Aquifer Specification .......................................................................... 30 Exhibit 4-1 Case 1-1 and 1-2 Block Flow Diagram: Baseline SMR with CO2 Capture ............. 32
Exhibit 4-2 Case 1-1 Stream Table: Baseline SMR with CO2 Capture ....................................... 33 Exhibit 4-3 Case 1-2 Stream Table: Baseline SMR with CO2 Capture ....................................... 35
Exhibit 4-4 Cases 1-1 and 1-2 Plant Performance Summaries .................................................... 46 Exhibit 4-5 Case 1-1 Overall Energy Balance ............................................................................. 47 Exhibit 4-6 Case 1-2 Overall Energy Balance ............................................................................. 48 Exhibit 4-7 Case 1-1 Water Balance ............................................................................................ 49 Exhibit 4-8 Case 1-2 Water Balance ............................................................................................ 49 Exhibit 4-9 Case 1-1 Carbon Balance .......................................................................................... 50 Exhibit 4-10 Case 1-2 Carbon Balance ........................................................................................ 50
Exhibit 4-11 Cases 1-1 and 1-2 Air Emissions ............................................................................ 51 Exhibit 4-12 Case 1-1 Capital Cost Summary ............................................................................. 56
Exhibit 4-13 Case 1-1 Operating Cost Summary ........................................................................ 57 Exhibit 4-14 Case 1-2 Capital Cost Summary ............................................................................. 58 Exhibit 4-15 Case 1-2 Operating Cost Summary ........................................................................ 59 Exhibit 4-16 Case 1-1 and Case 1-2 Cost Estimate CO2 TS&M ................................................. 60 Exhibit 5-1 Case 2-1 Block Flow Diagram: Baseline Coal to Hydrogen with CO2 Capture ...... 63 Exhibit 5-2 Case 2-1 Stream Table: Baseline Coal to Hydrogen with CO2 Capture ................... 64

Assessment of Hydrogen Production with CO2 Capture Volume 1: Baseline State-of-the-Art Plants
IV
8/30/2010
Exhibit 5-3 Case 2-2 Block Flow Diagram: Baseline Coal to Hydrogen with CO2 Capture ...... 66
Exhibit 5-4 Case 2-2 Stream Table: Baseline Coal to Hydrogen with CO2 Capture ................... 67 Exhibit 5-5 Cases 2-1 & 2-2 Plant Performance Summaries ....................................................... 84 Exhibit 5-6 Case 2-1 Overall Energy Balance ............................................................................. 85
Exhibit 5-7 Case 2-2 Overall Energy Balance ............................................................................. 86 Exhibit 5-8 Case 2-1 Water Balance ............................................................................................ 87 Exhibit 5-9 Case 2-2 Water Balance ............................................................................................ 87 Exhibit 5-10 Case 2-1 Carbon Balance ........................................................................................ 88 Exhibit 5-11 Case 2-2 Carbon Balance ........................................................................................ 88
Exhibit 5-12 Case 2-1 Sulfur Balance ......................................................................................... 89 Exhibit 5-13 Case 2-2 Sulfur Balance ......................................................................................... 89 Exhibit 5-14 Cases 2-1 and 2-2 Air Emissions ............................................................................ 89 Exhibit 5-15 Case 2-1 Capital Cost Summary ........................................................................... 101
Exhibit 5-16 Case 2-1 Operating Cost Summary ...................................................................... 103 Exhibit 5-17 Case 2-2 Capital Cost Summary ........................................................................... 104
Exhibit 5-18 Case 2-2 Operating Cost Summary ...................................................................... 106 Exhibit 5-19 Cases 2-1 & 2-2 Cost Estimate CO2 TS&M ......................................................... 107
Exhibit 6-1 Overall Performance ............................................................................................... 110 Exhibit 6-2 Effective Thermal Efficiencies ............................................................................... 111 Exhibit 6-3 Annual Air Emissions ............................................................................................. 112
Exhibit 6-4 Annual Mercury Emissions .................................................................................... 112 Exhibit 6-5 Annual CO2 Emissions ........................................................................................... 113
Exhibit 6-6 Raw Water Withdrawal, Discharge, and Consumption .......................................... 114 Exhibit 6-7 Capital Cost Estimation Results ............................................................................. 115 Exhibit 6-8 Total As-Spent Cost Components........................................................................... 116
Exhibit 6-9 Cost of Hydrogen Estimation Results ..................................................................... 117
Exhibit 6-10 First Year COH by Cost Component (June 2007 dollars) .................................... 118 Exhibit 6-11 First Year COH Sensitivity to CO2 Emissions Value (June 2007 dollars) ........... 119 Exhibit 6-12 First Year COH Sensitivity to Cost of Electricity (June 2007 dollars) ................ 120
Exhibit 6-13 First Year COH Sensitivity to Fuel Costs (June 2007 dollars) ............................. 121 Exhibit 6-14 First Year COH Sensitivity to Capacity Factor (June 2007 dollars) .................... 122
Assessment of Hydrogen Production with CO2 Capture Volume 1: Baseline State-of-the-Art Plants
V
8/30/2010
PREPARED BY:
Research and Development Services (RDS)
UPDATED BY:
Energy Sector Planning and Analysis (ESPA)
Vincent H. Chou
Booz Allen Hamilton
Norma J. Kuehn
Booz Allen Hamilton
DOE Contract DE-FE0004001
Task 04001.410.01, Activity 022

Assessment of Hydrogen Production with CO2 Capture Volume 1: Baseline State-of-the-Art Plants
VI
8/30/2010
Acknowledgments This report was initially prepared by Research and Development Solutions, LLC (RDS) for the
United States Department of Energy’s (DOE) National Energy Technology Laboratory (NETL)
under DOE NETL Contract Number DE-AM26-04NT41817; Subtask 41817.401.01.04C,
Activity 5. The report was updated by Booz Allen Hamilton, Inc. under DOE NETL Contract
Number DE-FE0004001, Energy Sector Planning and Analysis, Task 04001.410.01,
Activity 022.
The authors wish to acknowledge the excellent guidance, contributions, and cooperation of the
NETL staff and other past contributors, particularly:
John Wimer, Director of OSAP Systems Division
Kristin Gerdes, General Engineer
Michael Matuszewski, General Engineer
James Black, Lead, Combustion-Based Processes Team
Robert Brasington, formerly of Parsons Corporation
Pamela Capicotto, formerly of Parsons Corporation
John Haslbeck, formerly of Parsons Corporation
Michael Rutkowski, formerly of Parsons Corporation
John Marano, JM Energy Consulting, Inc
Assessment of Hydrogen Production with CO2 Capture Volume 1: Baseline State-of-the-Art Plants
VII
8/30/2010
LIST OF ACRONYMS AND ABBREVIATIONS
acfm Actual cubic feet per minute
AEO Annual Energy Outlook
AGR Acid gas removal
ASU Air separation unit
atm Atmosphere
BACT Best available control technology
BEC Bare erected cost
BFW Boiler feed water
BLS U.S. Bureau of Labor Statistics
Btu British thermal unit
Btu/hr British thermal unit per hour
CCF Capital charge rate factor
CF Capacity factor
CGE Cold gas efficiency
cm Centimeter
CM Construction management
CO2 Carbon dioxide
COE Cost of electricity
COH Cost of hydrogen
COS Carbonyl sulfide
CWT Cold water temperature
DB Dry basis
DCS Distributed control system
DI De-ionized
DOE Department of Energy
EIA Energy Information Administration
EPC Engineering, procurement, construction
EPRI Electric Power Research Institute
ERC Emission reduction credits
ETE Effective thermal efficiency
FD Forced draft
FG Flue gas
ft Foot, Feet
FW Feedwater
FO&M Fixed operations and maintenance
gal Gallon
gal/MWh Gallon per megawatt hour
gpm Gallons per minute
GEE General Electric Energy
GJ Gigajoule
GRI Gas Research Institute
GT Gas turbine
H2 Hydrogen
H2A DOE’s Hydrogen Advisory Group
HHV Higher heating value

Assessment of Hydrogen Production with CO2 Capture Volume 1: Baseline State-of-the-Art Plants
VIII
8/30/2010
HCl Hydrogen chloride
HO Home office
hp Horsepower
HP High pressure
hr Hour
HRSG Heat recovery steam generator
HSS Heat stable salts
HVAC Heating, ventilating, and air conditioning
HWT Hot water temperature
Hz Hertz
ID Induced draft
IEA International Energy Agency
IGCC Integrated coal gasification combined cycle
in. H2O Inches water
in. Hga Inches mercury (absolute pressure)
in. W.C. Inches water column
in Inch, Inches
kg/hr Kilogram per hour
kJ Kilojoules
kJ/hr Kilojoules per hour
KO Knockout
kPa Kilopascal absolute
kV Kilovolt
kW Kilowatt
kWe Kilowatts electric
kWh Kilowatt-hour
kWt Kilowatts thermal
LAER Lowest achievable emission rate
lb Pound
lb/hr Pounds per hour
lb/ft2 Pounds per square foot
LHV Lower heating value
LIBOR London Interbank Offered Rate
LP Low pressure
lpm Liters per minute
LV Low voltage
m Meters
m/min Meters per minute
m3/min Cubic meter per minute
MAF Moisture and Ash Free
MCR Maximum continuous rate
md millidarcy, is a measure of permeability defined as roughly 10-12
Darcy
MDEA Methyldiethanolamine
MEA Monoethanolamine
MHz Megahertz
million $ Millions of dollars
Assessment of Hydrogen Production with CO2 Capture Volume 1: Baseline State-of-the-Art Plants
IX
8/30/2010
MMBtu Million British thermal units (also shown as 106 Btu)
MMBtu/hr Million British thermal units (also shown as 106 Btu) per hour
MMSCFD Million standard cubic feet per day
mole% Mole percent (percent by mole)
MPa Megapascals absolute
MVA Megavolt (average)
MWe Megawatts electric
MWh Megawatt-hour
MWt Megawatts thermal
Neg. Negligible
NETL National Energy Technology Laboratory
N/A Not applicable
nm3 Normal cubic meter
NOx Oxides of nitrogen
NSR New Source Review
O&M Operations and maintenance
OC Operating cost
OSU Ohio State University
PM Particulate matter
POTW Publicly owned treatment works
ppm Parts per million
ppmd Parts per million, dry basis
ppmv Parts per million volume
ppmvd Parts per million volume, dry
ppmw Parts per million weight
PSA Pressure swing adsorption
PSFM Power Systems Financial Model
psia Pounds per square inch absolute
psid Pounds per square inch differential
psig Pounds per square inch gage
Qty Quantity
Ref. Reference
RDS Research and Development Solutions, LLC
scfd Standard cubic feet per day
scfm Standard cubic feet per minute
Sch. Schedule
SCR Selective catalytic reduction
SG Specific gravity
SMR Steam methane reforming
SNCR Selective non-catalytic reduction
SNG Synthetic natural gas
SO2 Sulfur dioxide
SOx Oxides of sulfur
SS Stainless steel
ST Steam turbine
STG Steam turbine generator

Assessment of Hydrogen Production with CO2 Capture Volume 1: Baseline State-of-the-Art Plants
X
8/30/2010
SWS Sour water scrubber
TASC Total as-spent cost
TGTU Tail gas treatment unit
TOC Total overnight cost
TPC Total plant cost
tpd Tons per day
tph Tons per hour
TPI Total plant investment
tonne Metric ton (1000 kg)
TS&M Transport, storage, and monitoring
UOP UOP LLC, a Honeywell company
Vert. Vertical
V-L Vapor and liquid portion of stream (excluding solids)
VO&M Variable Operations and maintenance
vol% Volume percent (percent by volume)
WB Wet bulb
WG Water gauge
WGS Water gas shift
WPI Worcester Polytechnic Institute
wt% Weight percent (percent by weight)
$M Millions of dollars

Assessment of Hydrogen Production with CO2 Capture Volume 1: Baseline State-of-the-Art Plants
1
8/30/2010
EXECUTIVE SUMMARY
The objective of this study was to analyze potential plant configurations to determine their
baseline performance and cost of producing hydrogen from natural gas and coal. The plants
were assumed to be designed and constructed in the near future based on technologies as they
exist today, with a planned startup year of 2015. This report covers the following base cases:
Case 1-1 – Baseline Steam Methane Reforming (SMR) Hydrogen Plant with CO2
Capture and Sequestration matching the hydrogen generation rate of case 2-1
Case 1-2 – Baseline Steam Methane Reforming (SMR) Hydrogen Plant with CO2
Capture and Sequestration matching the hydrogen generation rate of case 2-2
Case 2-1 – Baseline Coal Gasification Hydrogen Plant using GE Energy Radiant-Only
Gasifier with CO2 Capture and Sequestration and Hydrogen Separation by Pressure
Swing Adsorption
Case 2-2 – Baseline Coal Gasification Hydrogen Plant using GE Energy Quench Gasifier
with CO2 Capture and Sequestration and Hydrogen Separation by Pressure Swing
Adsorption
This report is part of a larger study that seeks to evaluate and compare a relatively large number
of potential design configurations in a relatively short period of time. As such, the level of
engineering effort expended in the production of these reports is commensurate with a
conceptual design and is not sufficient for producing a preliminary design. The results should be
viewed in this context. Performance and process limits are best estimates based upon published
reports, information obtained from vendors, scaling of vendor information, and best engineering
judgment.
Hydrogen cost is first determined by preparing plant designs for hydrogen production based on
currently available process technology and meeting current permitting regulations for
environmental compliance. To arrive at an estimated cost for producing hydrogen, the designs
include commercially available process technology obtained from verifiable sources. While
input was sought from various technology vendors, the final assessment of performance and cost
was determined independently and may not represent the views of the technology vendors.
Plants in this study were designed and estimated for 90 percent availability.
PERFORMANCE SUMMARY
Simplified process flow diagrams are presented in Exhibit ES-1 through Exhibit ES-3. More
details including stream data are presented in Sections 3 through 5 in this report. Overall
performance for each case is summarized in Exhibit ES-4.

Assessment of Hydrogen Production with CO2 Capture Volume 1: Baseline State-of-the-Art Plants
2
8/30/2010
Exhibit ES-1 Case 1-1 & 1-2 Block Flow Diagram: SMR with PSA & CO2 Capture
Exhibit ES-2 Case 2-1 Block Flow Diagram: Coal to Hydrogen with PSA & CO2 Capture

Assessment of Hydrogen Production with CO2 Capture Volume 1: Baseline State-of-the-Art Plants
3
8/30/2010
Exhibit ES-3 Case 2-2 Block Flow Diagram: Coal to Hydrogen with PSA & CO2 Capture
Exhibit ES-4 Overall Performance
Case 1-1 1-2 2-1 2-2
Plant Size, MMSCFD (kg/day) Hydrogen 242
(616,528) 243
(618,936) 242
(616,527) 243
(618,940)
Fuel Natural
Gas Natural
Gas Illinois #6
Coal Illinois #6
Coal
Natural Gas Feed to SMR, GJ/hr (MMBtu/hr) 4,500
(4,270) 4,520
(4,290) N/A N/A
Supplemental Natural Gas, GJ/hr (MMBtu/hr) 550 (520) 550 (520) N/A N/A
Coal Feed to Gasification, GJ/hr (MMBtu/hr) N/A N/A 5,994 (5,681) 5,994 (5,681)
Coal Feed to Gasification, tonne/day (ton/day) N/A N/A 5,302 (5,844) 5,301 (5,844)
Plant Availability 90% 90% 90% 90%
Cold Gas Efficiency1, HHV 72.18% 72.17% 60.81% 61.05%
Effective Thermal Efficiency2, HHV 69.74% 69.73% 61.24% 58.94%
CO2 Recovered, tonne/day (ton/day) 5,456
(6,014) 5,478
(6,038) 10,954
(12,075) 10,951
(12,071)
CO2 Emissions, tonne/day (ton/day) 606 (668) 609 (671) 1,183 (1,304) 1,192 (1,313)
Gross Power Generated, kWe N/A N/A 155,600 112,700
Auxiliary Power Consumed, kWe 34,200 34,330 148,440 147,830
Net Power, kWe -34,200 -34,330 7,160 -35,130 1 CGE = (Hydrogen Product Heating Value)/ Fuel Heating Value, HHV
2 ETE = (Hydrogen + Power Heating Value)/ Fuel Heating Value, HHV

Assessment of Hydrogen Production with CO2 Capture Volume 1: Baseline State-of-the-Art Plants
4
8/30/2010
COST ESTIMATING SUMMARY
The cost estimates carry an accuracy of ±30 percent, consistent with the screening study level of
engineering effort expended in the design. The results of the capital estimation calculations are
shown in Exhibit ES-5. The value of this study lies not in the absolute accuracy of the individual
case results but in the fact that all cases were evaluated under the same set of technical and
economic assumptions. This consistency of approach allows meaningful comparisons among the
cases evaluated. All capital and operations and maintenance (O&M) costs are presented as
“overnight costs” expressed in June 2007 dollars. The cost estimation methodology is explained
in more detail in Section 2.7 of “Cost and Performance Baseline for Fossil Energy Power Plants,
Volume 1: Bituminous Coal and Natural Gas to Electricity” [Ref. 1].
The bare erected costs (BEC) for the equipment were factored from cases 2 and 2A of the
bituminous baseline study [Ref. 1] for all equipment that was included in those original cases.
Additional equipment costs were obtained from other similar studies. The estimates were
prepared by factoring the capital estimate on the basis of coal, gas, and stream flows and
conditions.
The total plant cost (TPC) includes all equipment (complete with initial chemical and catalyst
loadings), materials, labor (direct and indirect), engineering and construction management, and
contingencies (process and project). The total overnight cost (TOC) for each plant was
calculated by adding owner’s costs to the TPC. Additional financing costs including escalation
during construction were estimated and added to the TOC to provide the total as-spent cost
(TASC). The TASC normalized on net hydrogen output is shown for each plant configuration in
Exhibit ES-6. The coal to hydrogen cases are substantially more capital intensive than the SMR
cases.
Exhibit ES-5 Capital Cost Estimation Results (June 2007 dollars)
Case 1-1 1-2 2-1 2-2
H2 Production (kg H2/day) 616,528 618,936 616,527 618,940
Bare Erected Cost, 1000$ $342,553 $343,355 $1,107,930 $958,576
Eng, CM, HO, Fees, etc., 1000$ $34,255 $34,335 $110,793 $95,858
Project Contingency, 1000$ $82,913 $83,107 $221,901 $190,503
Process Contingency, 1000$ $32,832 $32,909 $77,533 $61,446
Total Plant Cost, 1000$ $492,553 $493,706 $1,518,158 $1,306,383
Total Plant Cost, $/(kg H2/day) $799 $798 $2,462 $2,111
Owner’s Cost, 1000$ $118,642 $118,926 $332,624 $291,118
Total Overnight Cost, 1000$ $611,195 $612,632 $1,850,782 $1,597,501
Total Overnight Cost, $/(kg H2/day) $991 $990 $3,002 $2,581
Financing Cost, 1000$ $66,905 $67,062 $372,543 $321,561
Total As-Spent Cost 1000$ $678,100 $679,694 $2,223,325 $1,919,061
Total As-Spent Cost, $/(kg H2/day) $1,100 $1,098 $3,606 $3,101
Assessment of Hydrogen Production with CO2 Capture Volume 1: Baseline State-of-the-Art Plants
5
8/30/2010
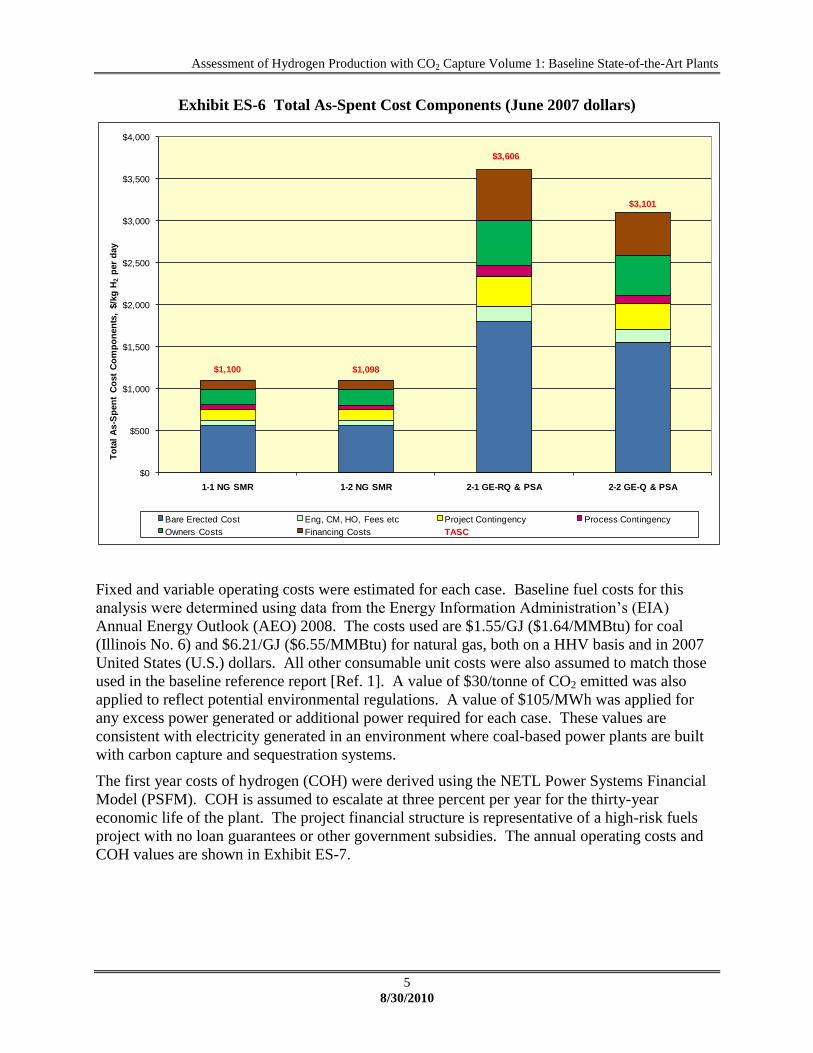
Exhibit ES-6 Total As-Spent Cost Components (June 2007 dollars)
Fixed and variable operating costs were estimated for each case. Baseline fuel costs for this
analysis were determined using data from the Energy Information Administration’s (EIA)
Annual Energy Outlook (AEO) 2008. The costs used are $1.55/GJ ($1.64/MMBtu) for coal
(Illinois No. 6) and $6.21/GJ ($6.55/MMBtu) for natural gas, both on a HHV basis and in 2007
United States (U.S.) dollars. All other consumable unit costs were also assumed to match those
used in the baseline reference report [Ref. 1]. A value of $30/tonne of CO2 emitted was also
applied to reflect potential environmental regulations. A value of $105/MWh was applied for
any excess power generated or additional power required for each case. These values are
consistent with electricity generated in an environment where coal-based power plants are built
with carbon capture and sequestration systems.
The first year costs of hydrogen (COH) were derived using the NETL Power Systems Financial
Model (PSFM). COH is assumed to escalate at three percent per year for the thirty-year
economic life of the plant. The project financial structure is representative of a high-risk fuels
project with no loan guarantees or other government subsidies. The annual operating costs and
COH values are shown in Exhibit ES-7.
$1,100 $1,098
$3,606
$3,101
$0
$500
$1,000
$1,500
$2,000
$2,500
$3,000
$3,500
$4,000
1-1 NG SMR 1-2 NG SMR 2-1 GE-RQ & PSA 2-2 GE-Q & PSA
To
tal
As-S
pen
t C
ost
Co
mp
on
en
ts,
$/k
g H
2p
er
day
Bare Erected Cost Eng, CM, HO, Fees etc Project Contingency Process Contingency
Owners Costs Financing Costs TASC

Assessment of Hydrogen Production with CO2 Capture Volume 1: Baseline State-of-the-Art Plants
6
8/30/2010
Exhibit ES-7 First Year Cost of Hydrogen Estimation Results (June 2007 dollars)
Case 1-1 1-2 2-1 2-2
H2 Production (kg H2/day) 616,528 618,936 616,527 618,940
Fuel Natural Gas Natural Gas Illinois #6 Illinois #6
Natural Gas Price ($/MMBtu) $6.55 $6.55 N/A N/A
Natural Gas Price ($/ton) $298.47 $298.47 N/A N/A
Natural Gas Consumption, tpd 2,520 2,530 N/A N/A
Coal Price ($/MMBtu) N/A N/A $1.64 $1.64
Coal Price ($/ton) N/A N/A $38.19 $38.19
Coal Consumption, tpd N/A N/A 5,844 5,844
Capacity Factor, % 90% 90% 90% 90%
First Year Fuel Cost, $/yr $247,114,305 $248,102,221 $73,307,753 $73,302,484
First Year Fixed O&M Cost, $/yr $22,668,479 $22,703,075 $53,436,617 $47,083,365
First Year Variable O&M Cost, $/yr $14,937,300 $14,978,807 $40,717,934 $36,216,846
First Year Electricity Cost (Revenue), $/yr $28,311,444 $28,419,061 ($5,927,191) $29,081,317
First Year Carbon Emissions Value, $/yr $5,974,186 $5,998,070 $11,661,501 $11,742,952
First Year Capital, $/yr $124,920,703 $125,214,495 $459,987,842 $397,140,235
First Year COH, $/kg H2 2.19 2.19 3.13 2.92
First year COH, $/1000scf H2 5.59 5.58 7.97 7.45
First Year CO2 TS&M, $/yr $23,520,371 $23,675,800 $41,344,396 $41,349,212
First year COH including CO2
TS&M, $/kg H2 2.31 2.31 3.33 3.13
First year COH including CO2
TS&M, $/1000scf H2 5.88 5.88 8.49 7.97
The first year COH results are shown graphically in Exhibit ES-8 with the capital cost, fixed
operating cost, variable operating cost, and fuel cost components shown separately. CO2
transport, storage, and monitoring (TS&M) costs are also shown as a separate bar segment. The
following conclusions can be drawn:
The COH is dominated by capital charges in both of the coal cases. The capital cost
component of COH comprises 62-68 percent in the coal cases but only 27 percent in the
natural gas SMR cases.
The fuel cost component is relatively minor in the coal cases, representing 11-12 percent
of the COH, but it dominates the natural gas SMR cases at 53 percent.
The excess power generated in case 2-1 reduces the variable O&M for that case by
10 percent.
The TS&M component of COH in all cases is 5-7 percent.

Assessment of Hydrogen Production with CO2 Capture Volume 1: Baseline State-of-the-Art Plants
7
8/30/2010
Exhibit ES-8 First Year COH by Cost Component (June 2007 dollars)
0.62 0.62
2.27
1.95
0.11 0.11
0.26
0.23
0.07 0.07
0.20
0.18
0.14 0.14
-0.03
0.14
0.03 0.03
0.06
0.06
1.22 1.22
0.36
0.36
0.12 0.12
0.20
0.20
2.31 2.31
3.33
3.13
0.00
0.50
1.00
1.50
2.00
2.50
3.00
3.50
4.00
1-1 NG SMR 1-2 NG SMR 2-1 GE-RQ & PSA 2-2 GE-Q & PSA
Fir
st
Year
CO
H,
$/k
g H
2
Capital Fixed O&M Variable O&M Power CO2 Emissions Fuel CO2 TS&M Total

Assessment of Hydrogen Production with CO2 Capture Volume 1: Baseline State-of-the-Art Plants
8
8/30/2010
Exhibit ES-9 shows the first year COH sensitivity to fuel costs. Again the COH values
calculated for the prices of natural gas and coal assumed in this study are shown on each line. As
expected, all cases show a linear increase in COH with an increase in fuel prices. The COHs for
the natural gas SMR cases increase by approximately 19 cents for each $/MMBtu increase in
natural gas price. The COHs for the coal cases increase by approximately 22 cents for each
$/MMBtu increase in coal prices. In general, the values for the SMR cases approach the values
for the coal to hydrogen cases as natural gas prices increase and coal prices decrease.
Exhibit ES-9 First Year COH Sensitivity to Fuel Costs (June 2007 dollars)
0
1
2
3
4
5
6
0 2 4 6 8 10 12
Fir
st
Ye
ar
CO
H (
$/k
g)
(ex
clu
din
g C
O2
TS
&M
)
Fuel Price ($/MMBtu)
1-1 NG SMR 1-2 NG SMR 2-1 GE-RQ & PSA 2-2 GE-Q & PSA

Assessment of Hydrogen Production with CO2 Capture Volume 1: Baseline State-of-the-Art Plants
9
8/30/2010
The sensitivity of first year COH to capacity factor is shown in Exhibit ES-10. Again the COH
values calculated for the capacity factor assumed in this study are shown on each line. At high
capacity factors, the COH value for the coal cases approaches the COH for the natural gas cases.
All cases show a substantial decrease in COH as the capacity factor increases. At very lower
capacity factors (10 to 20 percent), the COH for the natural gas cases are less than one-half that
of the two coal cases.
Exhibit ES-10 First Year COH Sensitivity to Capacity Factor (June 2007 dollars)
The first year COH for coal to hydrogen with CO2 capture cases is estimated to be approximately
$1.08 to $1.35 per kg of hydrogen greater than the COH for hydrogen generated from natural gas
by the current commercial SMR technology with the addition of CO2 capture. As gasification
and CO2 capture technologies become more commercially available, this differential should
decrease and the coal to hydrogen cases would likely become more economically viable. Natural
gas prices above $9.60/MMBtu would also make the coal to hydrogen cases more competitively
attractive.
0
2
4
6
8
10
12
14
16
18
20
10% 20% 30% 40% 50% 60% 70% 80% 90% 100%
Fir
st
Ye
ar
CO
H (
$/k
g)
(ex
clu
din
g C
O2
TS
&M
)
Capacity Factor, %
1-1 NG SMR 1-2 NG SMR 2-1 GE-RQ & PSA 2-2 GE-Q & PSA

Assessment of Hydrogen Production with CO2 Capture Volume 1: Baseline State-of-the-Art Plants
10
8/30/2010
This page intentionally left blank

Assessment of Hydrogen Production with CO2 Capture Volume 1: Baseline State-of-the-Art Plants
11
8/30/2010
1. INTRODUCTION
This report presents the design configuration and performance summaries for four baseline cases
in the Advanced Hydrogen Production Plant study. This report is part of a larger study that seeks
to evaluate and compare a relatively large number of potential design configurations in a
relatively short period of time. As such, the level of engineering effort expended in the
production of these reports is commensurate with a conceptual design and is not sufficient for
producing a preliminary design. The results should be viewed in this context. Performance and
process limits are best estimates based upon published reports, information obtained from
vendors, scaling of vendor information, and best engineering judgment.
Objective: The objective of this study is to estimate the performance and cost of fossil-based
hydrogen production from both baseline and advanced systems. Baseline systems will utilize
state-of-the-art technology available in 2015 and advanced systems will feature hydrogen
separation membranes, technology currently under development for future plants.
1.1 SITE DESCRIPTION
All plants in this study are assumed to be located at a generic plant site in Midwestern USA, with
ambient conditions and site characteristics as presented in Exhibit 1-1 and Exhibit 1-2.
Exhibit 1-1
Site Ambient Conditions
Elevation, ft 0
Barometric Pressure, psia 14.696
Design Ambient Temperature, Dry Bulb, F 59
Design Ambient Temperature, Wet Bulb, F 51.5
Design Ambient Relative Humidity, % 60
Exhibit 1-2
Site Characteristics
Location Green-field, Midwestern USA
Topography Level
Size, acres 300
Transportation Rail
Ash Disposal Off Site
Water Municipal (50%) / Groundwater (50%)
Access Land locked, having access by railway and highway

Assessment of Hydrogen Production with CO2 Capture Volume 1: Baseline State-of-the-Art Plants
12
8/30/2010
The following design parameters are considered site-specific and are not quantified for this
study. Allowances for normal conditions and construction will be included in the cost estimates.
Flood plain considerations
Existing soil/site conditions
Water discharges and reuse
Rainfall/snowfall criteria
Seismic design
Buildings/enclosures
Fire protection
Local code height requirements
Noise regulations – Impact on site and surrounding area
1.2 PRODUCT SPECIFICATIONS
Elemental Sulfur – 99 percent sulfur
Hydrogen – 99.9 percent hydrogen
The baseline plant designs produced hydrogen with a purity of 99.9 percent (by volume),
minimum delivery pressure of 300 psig utilizing pressure swing adsorption (PSA) technology.
The PSA performance is based on POLYBED ten-bed unit by UOP, LLC (a Honeywell
company).
The hydrogen separation performance for all cases is presented in Exhibit 1-3.
Exhibit 1-3 Hydrogen Product Specification
Hydrogen Recovery 80%
Hydrogen purity >99.9%
Max. CO 5 ppm
Max. H2S 5 ppb
Max H2O 1 ppb
Carbon Dioxide Sequestration
The study assumed that sequestration-ready CO2 is transported to the plant boundary as a
supercritical fluid. The CO2 and pipeline requirements are presented in Exhibit 1-4.
Exhibit 1-4 Carbon Dioxide Pipeline Specification
Inlet Pressure ~15.3 MPa (~2,200 psig)
Water Content -40°C (-40 F) dew point
N2 < 300 ppmv
O2 < 40 ppmv
Ar < 10 ppmv

Assessment of Hydrogen Production with CO2 Capture Volume 1: Baseline State-of-the-Art Plants
13
8/30/2010
1.3 DESIGN NATURAL GAS
DOE’s Hydrogen Advisory Group (H2A) previously utilized a GRI survey (U.S. Natural Gas
Composition Based on 26-City Survey: Gas Research Institute Report GRI-92/0123) to
determine the average composition of natural gas as a feedstock for SMR hydrogen plants. The
composition that was used in the current analysis is the National Average, shown in Exhibit 1-5.
Exhibit 1-5
Design Natural Gas Analysis
Volume share National Average
Methane 93.90%
Ethane 3.20%
Propane 0.70%
C4+ 0.40%
CO2+N2 2.60%
Water 85-105ppmv
Sulfur 6ppmv

Assessment of Hydrogen Production with CO2 Capture Volume 1: Baseline State-of-the-Art Plants
14
8/30/2010
1.4 DESIGN COAL
The design coal assumed for this study is presented in Exhibit 1-6. All coal-fired cases will be
modeled with Illinois No. 6 coal.
Exhibit 1-6
Design Coal Analysis – Illinois No. 6
Rank Bituminous
Seam Illinois No. 6 (Herrin)
Source Old Ben Mine
Proximate Analysis (weight %) (Note A)
As Received Dry
Moisture 11.12 0.00
Ash 9.70 10.91
Volatile Matter 34.99 39.37
Fixed Carbon 44.19 49.72
Total 100.00 100.00
Sulfur 2.51 2.82
HHV, kJ/kg 27,113 30,506
HHV, Btu/lb 11,666 13,126
LHV, kJ/kg 26,151 29,544
LHV, Btu/lb 11,252 12,712
Ultimate Analysis (weight %)
As Received Dry
Moisture 11.12 0.00
Carbon 63.75 71.72
Hydrogen 4.50 5.06
Nitrogen 1.25 1.41
Chlorine 0.29 0.33
Sulfur 2.51 2.82
Ash 9.70 10.91
Oxygen (Note B) 6.88 7.75
Total 100.00 100.00
Notes: A. The proximate analysis assumes sulfur as volatile matter
B. By difference
Assessment of Hydrogen Production with CO2 Capture Volume 1: Baseline State-of-the-Art Plants
15
8/30/2010
1.5 PLANT CAPACITY FACTOR AND AVAILABILITY
The overall availability of the natural gas case operating plant was assumed to be 90 percent,
which is consistent with commercial SMR plants. The balance of plant will be single train,
operating at 100 percent capacity, based on commercial process operating experience as verified
by equipment vendors.
The goal of the designs for the two coal cases was to achieve an overall availability for the
operating plant of 90 percent. This is a high factor for single train gasification and will result in
the requirement for two gasifier trains operating at full coal throughput along with a hot standby
gasifier train with the capability to ramp up and maintain 100 percent hydrogen production. The
balance of plant will be single train, operating at 100 percent capacity, based on commercial
process operating experience as verified by equipment vendors.
1.6 ENVIRONMENTAL REQUIREMENTS
The environmental approach for the study was to evaluate each case on the same regulatory
design basis, considering differences in fuel and technology. Since all cases are located at a
green-field site, permitting a new plant would probably invoke the New Source Review (NSR)
permitting process. The NSR process requires installation of emission control technology
meeting either Best Available Control Technology (BACT) determinations for new sources
being located in areas meeting ambient air quality standards (attainment areas) or Lowest
Achievable Emission Rate (LAER) technology for sources being located in areas not meeting
ambient air quality standards (non-attainment areas).
BACT guidelines will be used for the plant modeled in this evaluation. The production of
hydrogen from steam methane reforming is inherently emissions free, with the exception of NOx
from the SMR burner. Low NOx burners will be included to minimize the NOx emissions and
meet BACT requirements. Sulfur emissions are eliminated due to the pre-treatment of the
feedstock to remove sulfur. For the production of hydrogen from coal gasification, the primary
control standards which are expected to apply include emissions of particulates, nitrogen oxides,
sulfur species, and mercury. Process technology is directed toward minimum sulfur content in
the syngas and product. BACT for NOx emissions from the auxiliary boilers will be utilized.
BACT control technologies and emission limits are summarized in Exhibit 1-7 and Exhibit 1-8.
The following regulatory assumptions are used for assessing environmental control technologies:
NOx Emission Reduction Credits (ERCs) and allowances are not available for the project
emission requirements when located in the ozone attainment area.
Solid waste disposal is either offsite at a fixed $/ton fee or is classified as a byproduct for
reuse, claiming no net revenue ($/ton) or cost.
Raw water is available to meet technology needs.
Wastewater discharge will meet effluent guidelines rather than water quality standards
for this screening.
90 percent removal of carbon in design fuel.
Assessment of Hydrogen Production with CO2 Capture Volume 1: Baseline State-of-the-Art Plants
16
8/30/2010
Exhibit 1-7 BACT Environmental Design Basis for Natural Gas Cases
Environmental Design Basis
Pollutant Control Technology Limit
Sulfur Oxides (SO2) Zinc oxide guard bed Negligible
Nitrogen Oxides (NOx) Low NOx Burners 2.5 ppmv (dry) @ 15% O2
Particulate Matter (PM) N/A Negligible
Mercury (Hg) N/A Negligible
Exhibit 1-8 BACT Environmental Design Basis for Coal Cases
Environmental Design Basis
Pollutant Control Technology Limit
Sulfur Oxides (SO2) Selexol + Claus Plant
or equivalent performing system
99+% or ≤ 0.050 lb/10
6Btu
Nitrogen Oxides (NOx) Low NOx Burners 15 ppmvd (@ 15% O2)
Particulate Matter (PM) Cyclone/Barrier Filter/Wet Scrubber/AGR Absorber
0.015 lb/106Btu
Mercury (Hg) Activated Carbon Bed
or equivalent performing system
95% removal
1.7 PROCESS DESIGN CRITERIA
The original design basis for case 1-1 was to size the plant as was done previously in the H2A
model to produce nominally 150 million SCFD hydrogen (381,000 kg/day). This is considered
to be a world-class plant scale and can be achieved with a single train steam-methane reformer.
The design basis, shown in Exhibit 1-9, was modified to increase the capacity of the plant to
approximately match the hydrogen output of cases 2-1 and 2-2 (coal to hydrogen plants) at
25,740 kg/hr (56,750 lb/hr) or 240 million SCFD.
The design basis for the coal gasification cases is similar to case 2 and 2A in the NETL report
entitled “Cost and Performance Baseline for Fossil Energy Plants,” [Ref. 1] and is shown in
Exhibit 1-10. The baseline design produces the maximum amount of hydrogen with CO2 capture
for sequestration from 5,845 tons of coal per day at 100 percent capacity. The plant is based on
the General Electric Energy (GEE) gasification technology operating at approximately 965 psia.
Assessment of Hydrogen Production with CO2 Capture Volume 1: Baseline State-of-the-Art Plants
17
8/30/2010
Exhibit 1-9 Design Criteria for Conventional SMR Hydrogen Production Plant
Parameter Design Basis
Plant Size ~240 MMSCFD (~56,750 lb/hr) 99.9 % purity hydrogen
Hydrogen Pressure >300 psig at plant gate
Plant Capacity Factor 90 %
Ambient Conditions 14.7 psia, 60°F
Natural Gas Feed Pipeline, 450 psia
Desulfurization Zinc oxide guard bed for natural gas feed to reformer
Reformer Vertical tube steam methane reformer, externally heated
Water Gas Shift High-temperature, 98 % conversion
Syngas CO2 Recovery Coastal, proprietary MDEA, 95 % removal
Stack gas CO2 Recovery Fluor Econamine, proprietary MEA, achieve 90 % total
Hydrogen Purification Pressure Swing Adsorption
PSA Retentate Gas Recycled to reformer as fuel
CO2 Product Pressure 2,215 psia
Exhibit 1-10 Design Criteria for Coal to Hydrogen Production Plants
Parameter Design Basis
Ambient Conditions 14.7 psia, 60°F
Coal Feed Illinois No. 6
Gasifier Oxygen-blown GE Energy
Plant Size Maximum hydrogen production from ~5,845 tpd coal feed
Hot Gas Temperature ~2,500°F
Gasifier Outlet Pressure ~ 965 psia
Gas Quench/Cooling ~450°F
Water Gas Shift High-temperature, sulfur-tolerant
Mercury Removal Carbon Bed
Desulfurization Selexol
Sulfur Recovery Elemental sulfur
CO2 Recovery Selexol
Hydrogen Purification Pressure Swing Adsorption
PSA or Membrane Retentate Gas Fired in auxiliary boiler
CO2 Product Pressure 2,200 psia
Hydrogen Production 770 psia at plant gate
Auxiliary Power Block Steam turbine generator
Plant Capacity Factor 90 %
Assessment of Hydrogen Production with CO2 Capture Volume 1: Baseline State-of-the-Art Plants
18
8/30/2010
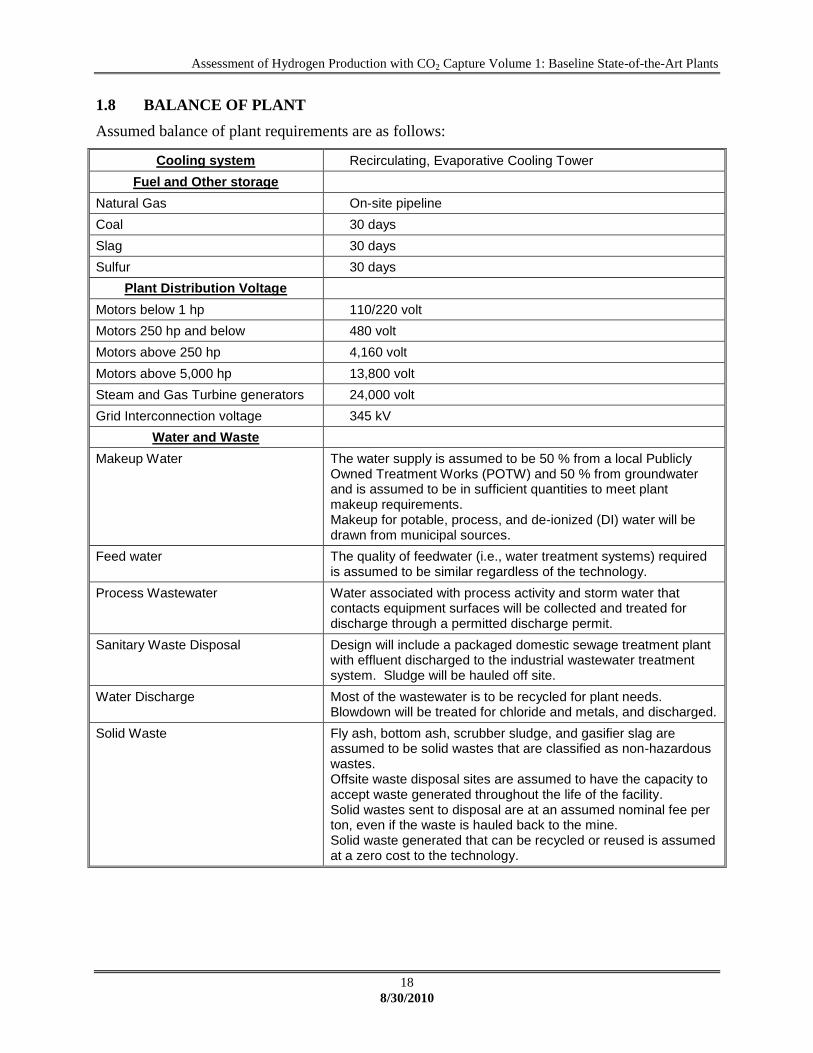
1.8 BALANCE OF PLANT
Assumed balance of plant requirements are as follows:
Cooling system Recirculating, Evaporative Cooling Tower
Fuel and Other storage
Natural Gas On-site pipeline
Coal 30 days
Slag 30 days
Sulfur 30 days
Plant Distribution Voltage
Motors below 1 hp 110/220 volt
Motors 250 hp and below 480 volt
Motors above 250 hp 4,160 volt
Motors above 5,000 hp 13,800 volt
Steam and Gas Turbine generators 24,000 volt
Grid Interconnection voltage 345 kV
Water and Waste
Makeup Water The water supply is assumed to be 50 % from a local Publicly Owned Treatment Works (POTW) and 50 % from groundwater and is assumed to be in sufficient quantities to meet plant makeup requirements. Makeup for potable, process, and de-ionized (DI) water will be drawn from municipal sources.
Feed water The quality of feedwater (i.e., water treatment systems) required is assumed to be similar regardless of the technology.
Process Wastewater Water associated with process activity and storm water that contacts equipment surfaces will be collected and treated for discharge through a permitted discharge permit.
Sanitary Waste Disposal Design will include a packaged domestic sewage treatment plant with effluent discharged to the industrial wastewater treatment system. Sludge will be hauled off site.
Water Discharge Most of the wastewater is to be recycled for plant needs. Blowdown will be treated for chloride and metals, and discharged.
Solid Waste Fly ash, bottom ash, scrubber sludge, and gasifier slag are assumed to be solid wastes that are classified as non-hazardous wastes. Offsite waste disposal sites are assumed to have the capacity to accept waste generated throughout the life of the facility. Solid wastes sent to disposal are at an assumed nominal fee per ton, even if the waste is hauled back to the mine. Solid waste generated that can be recycled or reused is assumed at a zero cost to the technology.

Assessment of Hydrogen Production with CO2 Capture Volume 1: Baseline State-of-the-Art Plants
19
8/30/2010
2. COST ESTIMATING METHODOLOGY
The estimates carry an accuracy of ±30 percent, consistent with the screening study level of
engineering effort expended in the design. Capital and O&M costs are presented as “overnight
costs” expressed in June 2007 dollars. The cost estimation methodology is explained in more
detail in Section 2.7 of “Cost and Performance Baseline for Fossil Energy Power Plants, Volume
1: Bituminous Coal and Natural Gas to Electricity” [Ref. 1].
The capital costs for the equipment were factored from cases 2 and 2A of the bituminous
baseline study [Ref. 1] for all equipment that was included in that original case. Additional
equipment costs were obtained from other similar studies. The estimates were prepared by
factoring the capital estimate on the basis of coal, gas, and steam flows and conditions.
Bare erected capital costs (BEC) include:
Equipment (complete with initial chemical and catalyst loadings)
Materials
Labor (direct and indirect)
Project contingencies were added to the BEC and Engineering, Construction Management,
Home Office & Fees (Eng'g CM, H.O. & Fee) costs to cover project uncertainty and the cost of
additional equipment that could result from a more detailed design. The project contingencies
represent costs that are expected to occur. Each capital account was evaluated against the level
of estimate detail, field experience, and the basis for the equipment pricing to define project
contingency. Process contingencies were added to compensate for uncertainty in cost estimates
caused by performance uncertainties associated with the development status of technologies for
the gasification and CO2 removal systems. Contingency values were applied based on
recommendations in “Quality Guidelines for Energy System Studies” [Ref. 2] and values used in
the baseline cost and performance report [Ref. 1]. The percentages assessed for both types of
contingency vary between accounts and cases.
All the capital costs are then summed to calculate the total plant cost (TPC). Owner’s costs were
subsequently calculated and added to the TPC, the result of which is total overnight cost (TOC).
Additionally, financing costs were estimated by applying a factor to the TOC value to calculate
total as-spent costs (TASC). The first year cost of hydrogen production (COH) was calculated
using TOC.
Fixed and variable operating costs were estimated for each case. Baseline fuel costs for this
analysis were determined using data from the Energy Information Administration’s (EIA)
Annual Energy Outlook (AEO) 2008. The costs used are $1.55/GJ ($1.64/MMBtu) for coal
(Illinois No. 6) and $6.21/GJ ($6.55/MMBtu) for natural gas, both on a HHV basis and in 2007
United States (U.S.) dollars. All other consumable unit costs were assumed to match those used
in the baseline reference report [Ref. 1]. A value of $30/tonne of CO2 emitted was also applied
to reflect potential environmental regulations. A value of $105/MWh was applied for any excess
power generated or required for each case. These values are consistent with electricity generated
in an environment where coal-based power plants are built with carbon capture and sequestration
systems.

Assessment of Hydrogen Production with CO2 Capture Volume 1: Baseline State-of-the-Art Plants
20
8/30/2010
The revenue requirement method of performing an economic analysis of a prospective energy
plant has been widely used in the electric utility industry. This method permits the incorporation
of the various dissimilar components for a potential new plant into a single value that can be
compared to various alternatives. The revenue requirement figure-of-merit in this report is the
cost of hydrogen (COH) expressed in $/kg. The first year COHs were calculated by the Power
Systems Financial Model [Ref. 3] using the financial assumptions specified in Exhibit 2-1 and
Exhibit 2-2 [Ref. 4]. The first year COH is estimated to be the value calculated when the
required return on equity (ROE) equals the internal rate of return (IRR) for 30 years of operation
based on the assumed financial structure and escalations. COH is assumed to escalate at three
percent per year for the thirty-year economic life of the plant.
All costs are expressed in June 2007 year dollars. In this study the first year of plant
construction is assumed to be 2010. A three year capital expenditure/construction period is
assumed for the natural gas based case plants with startup in 2013. For the coal based case
plants, a five year capital expenditure/construction period is assumed with startup in 2015. The
five-year period is assumed to include at least one year prior to the start of construction, during
which capital costs associated with items such as detailed design, permitting, and long-lead
equipment orders might be incurred. A five-year capital expenditure period is appropriate for
more complex projects, including many coal-based energy projects, while the shorter, three-year
capital expenditure period may be representative for simpler projects such as the natural gas
based plant.
The capital and operating costs for CO2 transport, storage, and monitoring (TS&M) were
independently estimated by NETL. Those costs were combined with the plant capital and
operating costs to produce an overall COH. The TS&M cost estimation methodology is also
explained in more detail in Section 2.7 of “Cost and Performance Baseline for Fossil Energy
Power Plants, Volume 1: Bituminous Coal and Natural Gas to Electricity” [Ref. 1].
Exhibit 2-1 Financial Structure for High-Risk Fuels Projects
Type of Security
% of Total
Current (Nominal) Dollar Cost
Weighted Current (Nominal) Cost
After Tax Weighted Cost of Capital
Debt 50 9.5% (LIBOR plus 6%) 4.75%
Equity 50 20% 10.0%
Total 14.75% 12.945%

Assessment of Hydrogen Production with CO2 Capture Volume 1: Baseline State-of-the-Art Plants
21
8/30/2010
Exhibit 2-2 Parameter Assumptions for Cost of Hydrogen Calculations
Parameter Value
TAXES
Income Tax Rate 38% (Effective 34% Federal, 6% State)
Capital Depreciation 20 years, 150% declining balance
Investment Tax Credit 0%
Tax Holiday 0 years
FINANCING TERMS
Repayment Term of Debt 15 years
Grace Period on Debt Repayment 0 years
Debt Reserve Fund None
TREATMENT OF CAPITAL COSTS
Capital Cost Escalation During Construction
(nominal annual rate) 3.6%
1
Distribution of Total Overnight Capital over the
Capital Expenditure Period (before escalation)
3-Year Period: 10%, 60%,30%
5-Year Period: 10%, 30%, 25%, 20%, 15%
Working Capital zero for all parameters
% of Total Overnight Capital that is Depreciated
100% (this assumption introduces a very
small error even if a substantial amount of
TOC is actually non-depreciable)
INFLATION
COH, O&M, Fuel Escalation (nominal annual rate) 3.0%2 COH, O&M, Fuel
1 A nominal average annual rate of 3.6% is assumed for escalation of capital costs during construction. This rate is
equivalent to the nominal average annual escalation rate for process plant construction costs between 1941 and 2008
according to the Chemical Engineering Plant Cost Index.
2 An average annual inflation rate of 3.0% is assumed. This rate is equivalent to the average annual escalation rate
between 1947 and 2008 for the U.S. Department of Labor's Producer Price Index for Finished Goods, the so-called
"headline" index of the various Producer Price Indices. (The Producer Price Index for the Electric Power Generation
Industry may be more applicable, but that data does not provide a long-term historical perspective since it only dates
back to December 2003.)

Assessment of Hydrogen Production with CO2 Capture Volume 1: Baseline State-of-the-Art Plants
22
8/30/2010
This page intentionally left blank

Assessment of Hydrogen Production with CO2 Capture Volume 1: Baseline State-of-the-Art Plants
23
8/30/2010
3. PROCESS DESCRIPTIONS
The hydrogen production cases described here are based on a combination of commercially-
proven and developmental processes. For cases 1-1 and 1-2, steam reforming of methane
continues to be the most widely used process for the production of hydrogen and
hydrogen/carbon monoxide mixtures. The process involves catalytic conversion of
hydrocarbons and steam to produce hydrogen and carbon oxides. Since the process works only
with light hydrocarbons which can be vaporized completely without carbon deposition, the
feedstocks used can range from methane (natural gas) to naphtha to No. 2 fuel oil.
For the coal to hydrogen processes, cases 2-1 and 2-2 are configured with two gasifier trains and
a hot standby spare train. The GEE single-stage coal gasification technology features an oxygen-
blown, entrained flow, refractory lined gasifier with continuous slag removal. Coal/water slurry
reacts with oxygen at about 2,500 ºF and 965 psia. A turnkey, dedicated air separation unit
(ASU) supplies oxygen at 95 percent purity to the gasifier. The gasifier trains include processes
to progressively cool and clean the gas, making it suitable for hydrogen production.
Individual process components for all the cases are described below.
3.1 STEAM METHANE REFORMING – CASES 1-1 AND 1-2
Natural Gas Conditioning
Natural gas is fed to the plant from the pipeline at a pressure of 450 psia. To protect the catalysts
in the hydrogen plant, the natural gas has to be desulfurized before being fed to the reformer.
The gas is generally sulfur-free but mercaptan-based odorizers must be cleaned from the gas to
prevent contamination of the reformer catalyst. This is accomplished with a zinc oxide polishing
bed also known as a sulfur guard.
Natural Gas Reformer/Boiler
The desulfurized natural gas feedstock is mixed with process steam and reacted over a nickel-
based catalyst contained inside a system of high alloy steel tubes. The following reactions take
place in the reformer:
CH4 + H2O = CO + 3H2
CO + H2O = CO2 + H2
CO + 3H2 = CH4 + H2O
The reforming reaction is strongly endothermic, with energy supplied by firing the reformer on
the outside of the catalyst tubes with recycled syngas from the hydrogen purification process plus
supplemental natural gas as needed. The metallurgy of the tubes usually limits the reaction
temperature to 1,400-1,700oF. The flue gas path of the fired reformer is integrated with
additional boiler surfaces to produce about 1,428,000 lb/hr steam. About 655,000 lb/hr of this
steam is superheated to 450 psia and 750 F, to be added to the incoming natural gas.
Additional steam from the boiler is used within the plant for regeneration of CO2 solvent from
the acid gas removal (AGR) processes. The reformer burner uses a low-NOx design to limit NOx
emissions to 20 ppm, very low for a gas-fired boiler. This consists of burning predominantly
PSA purge gas along with supplemental natural gas with air at ambient temperature. The use of
SNCR or SCR for NOx reduction is not required with this plant design.
Assessment of Hydrogen Production with CO2 Capture Volume 1: Baseline State-of-the-Art Plants
24
8/30/2010
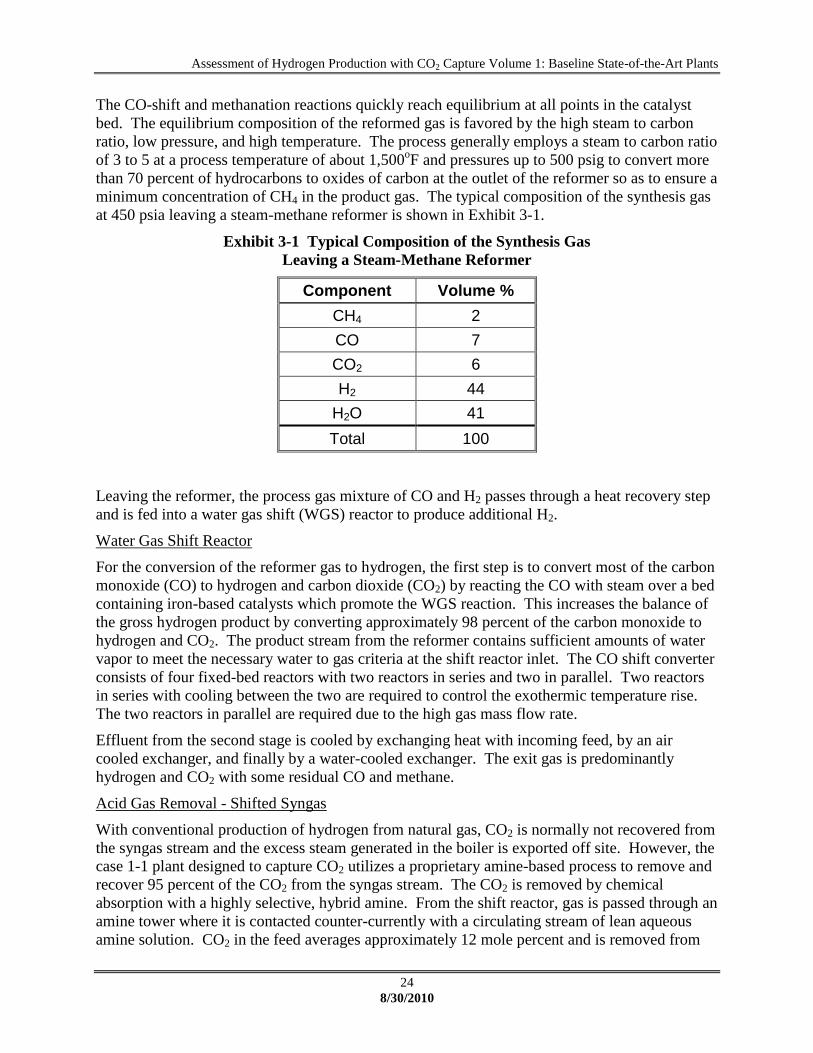
The CO-shift and methanation reactions quickly reach equilibrium at all points in the catalyst
bed. The equilibrium composition of the reformed gas is favored by the high steam to carbon
ratio, low pressure, and high temperature. The process generally employs a steam to carbon ratio
of 3 to 5 at a process temperature of about 1,500oF and pressures up to 500 psig to convert more
than 70 percent of hydrocarbons to oxides of carbon at the outlet of the reformer so as to ensure a
minimum concentration of CH4 in the product gas. The typical composition of the synthesis gas
at 450 psia leaving a steam-methane reformer is shown in Exhibit 3-1.
Exhibit 3-1 Typical Composition of the Synthesis Gas
Leaving a Steam-Methane Reformer
Component Volume %
CH4 2
CO 7
CO2 6
H2 44
H2O 41
Total 100
Leaving the reformer, the process gas mixture of CO and H2 passes through a heat recovery step
and is fed into a water gas shift (WGS) reactor to produce additional H2.
Water Gas Shift Reactor
For the conversion of the reformer gas to hydrogen, the first step is to convert most of the carbon
monoxide (CO) to hydrogen and carbon dioxide (CO2) by reacting the CO with steam over a bed
containing iron-based catalysts which promote the WGS reaction. This increases the balance of
the gross hydrogen product by converting approximately 98 percent of the carbon monoxide to
hydrogen and CO2. The product stream from the reformer contains sufficient amounts of water
vapor to meet the necessary water to gas criteria at the shift reactor inlet. The CO shift converter
consists of four fixed-bed reactors with two reactors in series and two in parallel. Two reactors
in series with cooling between the two are required to control the exothermic temperature rise.
The two reactors in parallel are required due to the high gas mass flow rate.
Effluent from the second stage is cooled by exchanging heat with incoming feed, by an air
cooled exchanger, and finally by a water-cooled exchanger. The exit gas is predominantly
hydrogen and CO2 with some residual CO and methane.
Acid Gas Removal - Shifted Syngas
With conventional production of hydrogen from natural gas, CO2 is normally not recovered from
the syngas stream and the excess steam generated in the boiler is exported off site. However, the
case 1-1 plant designed to capture CO2 utilizes a proprietary amine-based process to remove and
recover 95 percent of the CO2 from the syngas stream. The CO2 is removed by chemical
absorption with a highly selective, hybrid amine. From the shift reactor, gas is passed through an
amine tower where it is contacted counter-currently with a circulating stream of lean aqueous
amine solution. CO2 in the feed averages approximately 12 mole percent and is removed from

Assessment of Hydrogen Production with CO2 Capture Volume 1: Baseline State-of-the-Art Plants
25
8/30/2010
the gas stream by the circulating lean amine. The rich amine from the absorber is then sent to a
stripper column where the amine is regenerated with a steam reboiler to remove the CO2 by
fractionation. Because of the steam load required to regenerate CO2, there is no steam export
from this plant. Regenerated lean amine is then cooled and sent back to the amine tower. The
regenerated CO2 stream is recovered at 20 psia and 120 F and is sent to the CO2 compressor for
shipment off-site.
Acid Gas Removal - Stack Gas
If the CO2 were only captured from the shifted syngas stream, the overall CO2 recovery would be
about 65 percent. To increase the overall carbon recovery to 90 percent, a second CO2 removal
process is utilized in the reformer heater stack to remove CO2 resulting from reformer heater
combustion.
The CO2 recovery process for the stack is based on the Fluor Econamine FG Plus technology
[Ref. 5]. The Econamine FG Plus process uses a formulation of monoethanolamine (MEA) and
a proprietary oxidation inhibitor to recover CO2 from the flue gas. This process is designed to
recover high-purity CO2 from low-pressure streams that contain oxygen, such as flue gas from
coal-fired power plants, gas turbine exhaust gas, and other waste gases.
A fraction of the flue gas exiting the HRSG from the reformer heater enters the bottom of the
CO2 Absorber and flows up the tower countercurrent to a stream of lean monoethanolamine
(MEA)-based solvent (Econamine FG Plus). This results in approximately 70 percent of the CO2
in the stack gas being absorbed into the lean solvent, and the remaining gas leaves the top of the
absorber section and flows into the water wash section of the tower. This extraction, combined
with CO2 removed from the shifted syngas stream, results in an overall CO2 capture of
90 percent. The lean solvent enters the top of the absorber, absorbs the CO2 from the flue gases,
and leaves the bottom of the absorber with the absorbed CO2. The purpose of the water wash
section is to minimize solvent losses due to mechanical entrainment and evaporation.
A solvent stripper is used to separate the CO2 from the rich solvent feed exiting the bottom of the
CO2 absorber. The rich solvent is collected on a chimney tray below the bottom packed section
of the solvent stripper and routed to the solvent stripper reboiler where the rich solvent is heated
by steam, stripping the CO2 from the solution. The uncondensed CO2-rich gas is then delivered
to the CO2 product compressor. The condensed liquid from the solvent stripper reflux drum is
pumped via the solvent stripper reflux pumps where a portion of condensed overhead liquid is
used as make-up water for the water wash section of the CO2 absorber. The rest of the pumped
liquid is routed back to the solvent stripper as reflux, which aids in limiting the amount of
solvent vapors entering the stripper overhead system.
A small slipstream of the lean solvent from the solvent stripper bottoms is fed to the solvent
stripper reclaimer for the removal of high-boiling nonvolatile impurities (heat stable salts - HSS),
volatile acids and iron products from the circulating solvent solution. The solvent bound in the
HSS is recovered by reaction with caustic and heating with steam. The solvent reclaimer system
reduces corrosion, foaming, and fouling in the solvent system.
Assessment of Hydrogen Production with CO2 Capture Volume 1: Baseline State-of-the-Art Plants
26
8/30/2010
3.2 COAL GASIFICATION – CASES 2-1 AND 2-2
Coal Grinding and Slurry Preparation
Coal is fed onto a conveyor by vibratory feeders located below each coal silo. The conveyor
feeds the coal to an inclined conveyor that delivers the coal to the rod mill feed hopper. The feed
hopper provides a surge capacity of about two hours and contains two hopper outlets. A
vibrating feeder on each hopper outlet supplies the weigh feeder, which in turn feeds a rod mill.
Each rod mill is sized to process 60 percent of the coal feed requirements of the gasifier. The rod
mill grinds the coal and wets it with treated slurry water transferred from the slurry water tank by
the slurry water pumps. The coal slurry is discharged into the rod mill product tank, and then the
slurry is pumped from the rod mill product tank to the slurry storage and slurry blending tanks.
The coal grinding system is equipped with a dust suppression system consisting of water sprays
aided by a wetting agent. The degree of dust suppression required depends on local
environmental regulations. All of the tanks are equipped with vertical agitators to keep the coal
slurry solids suspended.
Air Separation Unit
The air separation unit (ASU) is designed to produce a nominal output of 6,000 tpd of 95 percent
pure O2 for use in the gasifier for both of the gasification cases. The designs also include the
generation of additional O2 for the Claus plants, thermal oxidizers, and calcium looping process
as needed for specific cases. The ASU is designed with two production trains. The air
compressors are powered by an electric motor.
Gasification
This plant utilizes two gasification trains to process a total of about 6,000 tpd of Illinois No. 6
coal. Each of the 2 x 50% gasifiers operates at nearly maximum capacity. To achieve 90 percent
availability, each plant is configured with a third spare gasifier train (gasifier, radiant cooler,
and/or quench) on hot standby. The slurry feed pump takes suction from the slurry run tank, and
the discharge is sent to the feed injector of the GEE gasifier. Oxygen from the ASU is vented
during preparation for startup and is sent to the feed injector during normal operation. The air
separation plant supplies about 6,000 tpd of 95 percent purity oxygen to the gasifiers and the
Claus plant.
The gasifier vessel is a refractory-lined, high-pressure combustion chamber. Coal slurry is
transferred from the slurry storage tank to the gasifier with a high-pressure pump. At the top of
the gasifier vessel a combination fuel injector is located through which coal slurry feedstock and
oxidant (oxygen) are fed. The coal slurry and the oxygen feeds react in the gasifier at about
965 psia at a high temperature (in excess of 2,500 F) to produce syngas.
The syngas consists primarily of hydrogen and carbon monoxide, with lesser amounts of water
vapor and carbon dioxide, and small amounts of hydrogen sulfide, carbonyl sulfide, methane,
argon, hydrogen chloride, and nitrogen. The heat in the gasifier liquefies coal ash. Hot syngas
and molten solids from the reactor flow downward either into a radiant heat exchanger where the
syngas is cooled to 1,250°F and the slag solidifies or to the syngas quench chamber for cooling
and removal of entrained solids. The solids collect in the water sump at the bottom of the
gasifier and are removed periodically using a lock hopper system.

Assessment of Hydrogen Production with CO2 Capture Volume 1: Baseline State-of-the-Art Plants
27
8/30/2010
Raw Gas Cooling (Cases 2-1)
Hot raw gas exits the gasifier at 965 psia and 2,500 ºF. This gas stream is cooled to
approximately 1,250 ºF in a radiant exchange boiler. The waste heat from this cooling is used to
generate high-pressure steam. Boiler feedwater in the tubes is saturated and then steam and
water are separated in a steam drum. The raw syngas is saturated and cooled further in a water
bath quench.
3.3 GAS CLEANUP – CASES 2-1 AND 2-2
Syngas Quench/Scrubber
Syngas enters the syngas quench area and is directed downwards by a dip tube into a water sump
at the bottom of the gasifier vessel or radiant cooler. Most of the solids are separated from the
syngas at the bottom of the dip tube as the syngas goes upwards through the water. From the
overhead of the quench, the syngas enters the low-temperature gas cooling section for further
cooling and particulate capture.
The water removed from the syngas scrubber contains all the solids that were not removed in the
quench gasifier water sump. In order to limit the amount of solids recycled to the quench
chamber and to limit HCl concentration to below 800 ppmw, a continuous blowdown stream is
removed from the bottom of the syngas quench. The blowdown is sent to the sour water stripper.
The circulating quench water is pumped by circulating pumps to the quench gasifier.
Solids collected in the water sump are removed by gravity and forced circulation of water from
the lock hopper circulating pump. Fine material, which does not settle as easily, is removed in
the gasification blowdown and goes to the vacuum flash drum by way of the syngas scrubber.
The slag handling system removes solids from the gasification process equipment. These solids
consist of a small amount of unconverted carbon and essentially all of the ash contained in the
feed coal. These solids are in the form of a glassy frit, which fully encapsulates any metals.
Sour Water Stripper
The sour water stripper removes chloride, NH3, SO2, and other impurities from the waste stream
of the gasifier quench blowdown. The sour gas stripper consists of a sour drum that accumulates
sour water from the gasifier quench blowdown, following quench blowdown treatment for
chloride. The treated water flows to the sour stripper, which consists of a packed column with a
steam-heated reboiler. Sour gas is stripped from the liquid and sent to the sulfur recovery unit.
Remaining water is then recycled to the gasifier slurry makeup.
Water Gas Shift Reactors
The WGS reactor is the same as that described for the SMR cases above consisting of two sets of
parallel fixed-bed reactors arranged in series. Steam is added to the syngas before it enters the
WGS reactor. Cooling is provided between the series of two reactors to control the exothermic
temperature rise. The parallel set of reactors is required due to the high gas mass flow rate. Feed
to the shift converter is first preheated by hot effluent from the second converter, and finally fed
to the top of the two parallel first-stage converters. Effluent from the first stage is cooled and fed
to the top of the second-stage converters. A nominal 80 percent of the CO is converted to CO2
and H2. The effluent from the second stage is cooled through a series of gas coolers to about 100
ºF before mercury and H2S removal.

Assessment of Hydrogen Production with CO2 Capture Volume 1: Baseline State-of-the-Art Plants
28
8/30/2010
Mercury Removal
Performance of carbon bed systems was based on information obtained from the Eastman
Chemical Company, which uses carbon beds at its syngas facility in Kingsport, Tennessee. The
packed carbon bed vessels are located upstream of the sulfur recovery unit and at a temperature
of about 100°F.
Mercury removal is accomplished by packed beds of sulfur-impregnated carbon similar to that
used at Eastman Chemical’s gasification plant. Dual beds of sulfur-impregnated carbon with
approximately a 20-second superficial gas residence time achieve 95 percent mercury reduction
in addition to removal of other volatile heavy metals such as arsenic.
Acid Gas Removal
H2S and CO2 are removed within the same process system, the Selexol unit. The purpose of the
Selexol unit is to preferentially remove H2S as a product stream and then to remove CO2 as a
separate product stream. This is achieved in the double-stage Selexol unit.
Cool, dry, and particulate-free synthesis gas enters the first absorber unit at approximately
867 psia and 103°F. In this absorber, H2S is preferentially removed from the fuel gas stream by
“loading” the lean Selexol solvent with CO2. The solvent, saturated with CO2, preferentially
removes H2S. The rich solution leaving the bottom of the absorber is regenerated in a stripper
through the indirect application of thermal energy via condensing low-pressure steam in a
reboiler. The stripper acid gas stream, consisting of 35 percent H2S and 52 percent CO2, is then
sent to the Claus unit.
Sweet fuel gas flowing from the first absorber is cooled and routed to the second absorber unit.
In this absorber, the fuel gas is contacted with “unloaded” lean solvent. The solvent removes
approximately 95 percent of the CO2 in the fuel gas stream. A CO2 balance is maintained by
hydraulically expanding the CO2-saturated rich solution and then flashing CO2 vapor off the
liquid at reduced pressure. Sweet fuel gas off the second absorber is sent to the hydrogen
separation process.
Claus Unit
Acid gas from the first-stage stripper of the Selexol unit is routed to the Claus plant. The Claus
plant partially oxidizes the H2S in the acid gas to elemental sulfur. About 150 tpd of elemental
sulfur are recovered from the fuel gas stream. This value represents an overall sulfur recovery
efficiency of 99.8 percent.
Acid gas from the Selexol unit is preheated to 450°F. A portion of the acid gas along with all of
the sour gas and oxidant are fed to the Claus furnace. In the furnace, H2S is catalytically
oxidized to SO2 using 95 percent pure oxygen from the ASU. A furnace temperature greater than
2,450°F must be maintained in order to thermally decompose all of the NH3 present in the sour
gas stream.
Three preheaters and three sulfur converters are used to obtain a per-pass H2S conversion of
approximately 97.8 percent. In the furnace waste heat boiler, 650 psia steam is generated. This
steam is used to satisfy all Claus process preheating and reheating requirements as well as steam
to the medium-pressure steam header. The sulfur condensers produce 50 psig steam for the low-
pressure steam header.

Assessment of Hydrogen Production with CO2 Capture Volume 1: Baseline State-of-the-Art Plants
29
8/30/2010
3.4 PRESSURE SWING ADSORPTION SEPARATION PROCESS
The pressure swing adsorption (PSA) process is used for hydrogen purification, based on the
ability to produce high purity hydrogen, low amounts of CO and CO2, and ease of operation.
Treated gas from the amine unit is fed directly to the PSA unit where hydrogen is purified up to
approximately 99.9 percent. The PSA process is based on the principle of adsorbent beds
adsorbing more impurities at high gas-phase partial pressure than at low partial pressure. The
PSA process operates on a cyclic basis and is controlled by automatic switching valves. Multiple
beds are used in order to provide constant product and purge gas flows.
In case 1-1, the gas stream is passed through adsorbent beds at 375 to 400 psia; and the
impurities are purged from the beds at 20 psia. Purified hydrogen is produced at 380 psia. The
purified product hydrogen leaves the PSA unit at 380 psia, and the PSA off-gas (containing
remaining hydrogen and CO) is sent as fuel to the gas-fired reformer heater which is primarily
fired with supplemental natural gas. The exhaust from the reformer heater enters a heat recovery
steam generator (HRSG) for steam generation from the reformer stack gas. The stack gas then
passes through an MEA process to capture 70 percent of the CO2.
In cases 2-1 and 2-2, the gas stream is passed through adsorbent beds at 770 psia and the
impurities are purged from the beds at 77 psia. The purified product hydrogen leaves the PSA
unit at 770 psia, and the PSA off-gas (containing remaining hydrogen and CO) is sent as fuel to
the auxiliary boiler where it is fired with air in a low-NOx burner to produce a stack gas of
nitrogen, water vapor, and a minor amount of CO2.
3.5 CO2 COMPRESSION AND DEHYDRATION – ALL CASES
The CO2 streams from the MEA and MDEA units in case 1-1 and those from the Selexol units in
cases 2-1 and 2-2 are compressed and dried. In the compression section, the CO2 is compressed
to approximately 2,200 psia by a multi-stage intercooled centrifugal compressor. The discharge
pressures of the stages are balanced to give reasonable power distribution and discharge
temperatures across the various stages as shown in Exhibit 3-2 for five stages.
Exhibit 3-2 CO2 Compressor Interstage Pressures
Stage Outlet Pressure, MPa (psia)
1 0.4 (51.00)
2 0.9 (130)
3 2.3 (334)
4 5.9 (859)
5 15.3 (2,213)
Power consumption for this large compressor was estimated assuming an adiabatic efficiency of
75 percent. During compression to approximately 2,200 psia in the multiple-stage, intercooled
compressor, the CO2 stream is dehydrated to a dew point of -40º with triethylene glycol. The
virtually moisture-free supercritical CO2 stream is then ready for pipeline transport.
The overall availability of the operating plant will be 90 percent, which is consistent with
commercial SMR plants. The balance of plant will be single train, operating at 100 percent
capacity, based on commercial process operating experience as verified by equipment vendors.

Assessment of Hydrogen Production with CO2 Capture Volume 1: Baseline State-of-the-Art Plants
30
8/30/2010
3.6 CO2 TRANSPORT, STORAGE AND MONITORING – ALL CASES
CO2 is supplied to the pipeline at the plant gate at a pressure of 15.3 MPa (2,215 psia). The CO2
product gas composition varies in the cases presented but is expected to meet the specification
described in Exhibit 3-3. The CO2 is transported 80 km (50 miles) via pipeline to a geologic
sequestration field for injection into a saline formation.
The CO2 is transported and injected as a supercritical fluid in order to avoid two-phase flow and
achieve maximum efficiency [Ref. 6]. The pipeline is assumed to have an outlet pressure above
the supercritical pressure of 10.4 MPa (1,515 psia) with no recompression during transport.
Accordingly, CO2 flow in the pipeline was modeled to determine the pipe diameter that results in
a pressure drop of 4.8 MPa (700 psi) over a fifty mile pipeline length [Ref. 7]. (Although not
explored in this study, the use of boost compressors and a smaller pipeline diameter could
possibly reduce capital costs for sufficiently long pipelines.) The diameter of the injection pipe
will be of sufficient size that frictional losses during injection are minimal and no booster
compression is required at the well-head in order to achieve an appropriate down-hole pressure.
The saline formation is at a depth of 1,236 meters (4,055 feet) and has a permeability of 22 md
and formation pressure of 8.4 MPa (1,220 psig). This is considered an average storage site and
requires roughly one injection well for each 9,360 metric tons (10,300 short tons) of CO2
injected per day [Ref. 8]. The assumed aquifer characteristics are tabulated in Exhibit 3-4.
Exhibit 3-3 CO2 Pipeline Specification
Parameter Units Molar Composition
Inlet Pressure MPa (psia) 15.3 (2,215)
Outlet Pressure MPa (psia) 10.4 (1,515)
Inlet Temperature °C (°F) 35 (95)
N2 Composition ppmv < 300
O2 Composition ppmv < 40
Ar Composition ppmv < 10
Exhibit 3-4 Deep, Saline Aquifer Specification
Parameter Units Base Case
Pressure MPa (psi) 8.4 (1,220)
Thickness m (ft) 161 (530)
Depth m (ft) 1,236 (4,055)
Permeability md 22
Pipeline Distance km (miles) 80 (50)
Injection Rate per Well tonne (ton) CO2/day 9,360 (10,320)

Assessment of Hydrogen Production with CO2 Capture Volume 1: Baseline State-of-the-Art Plants
31
8/30/2010
4. CASES 1-1 AND 1-2: SMR RESULTS
This case is an upgrade from the original H2A design basis. Changes to the scope of work as
requested in technical direction from NETL include adjusting the hydrogen production rate to
match that of the revised cases 2-1 and 2-2, hydrogen from coal gasification, and adjusting the
amount of CO2 recovered to 90 percent. This design modification affected the steam balance as
discussed below.
Modified Steam Balance
Because of the steam load required to regenerate CO2 absorbents, there is no steam export from
this plant. Prior SMR cases estimated the amount of steam required to regenerate the CO2 from
the MDEA and MEA systems. The estimate assumed that the steam generated within the plant
would approximate the regeneration requirements and that the steam was balanced without
additional fuel.
In the revised design, the MDEA and MEA regeneration steam exceeded that which is generated
internally and therefore the model required additional steam generation. This additional
generation was modeled as an integral component of the reformer heater and that, combined with
the steam generated in the HRSG in the reformer flue gas train, achieves the required amount of
steam for plant operation. The increased steam production results in an additional reformer
heater fuel feed by supplementing the baseline PSA off-gas with natural gas (approximately
12 percent of the total plant natural gas consumption).
Steam reforming of hydrocarbons continues to be the most efficient, economical, and widely
used process for production of hydrogen and hydrogen/carbon monoxide mixtures. The process
involves catalytic conversion of hydrocarbons and steam to produce hydrogen and carbon
oxides. Since the process works only with light hydrocarbons which can be vaporized
completely without carbon deposition, the feedstocks used range from methane (natural gas) to
naphtha to No. 2 fuel oil.
A block flow diagram of the process is shown in Exhibit 4-1 with the corresponding stream
tables shown in Exhibit 4-2 and Exhibit 4-3 for cases 1-1 and 1-2 respectively.
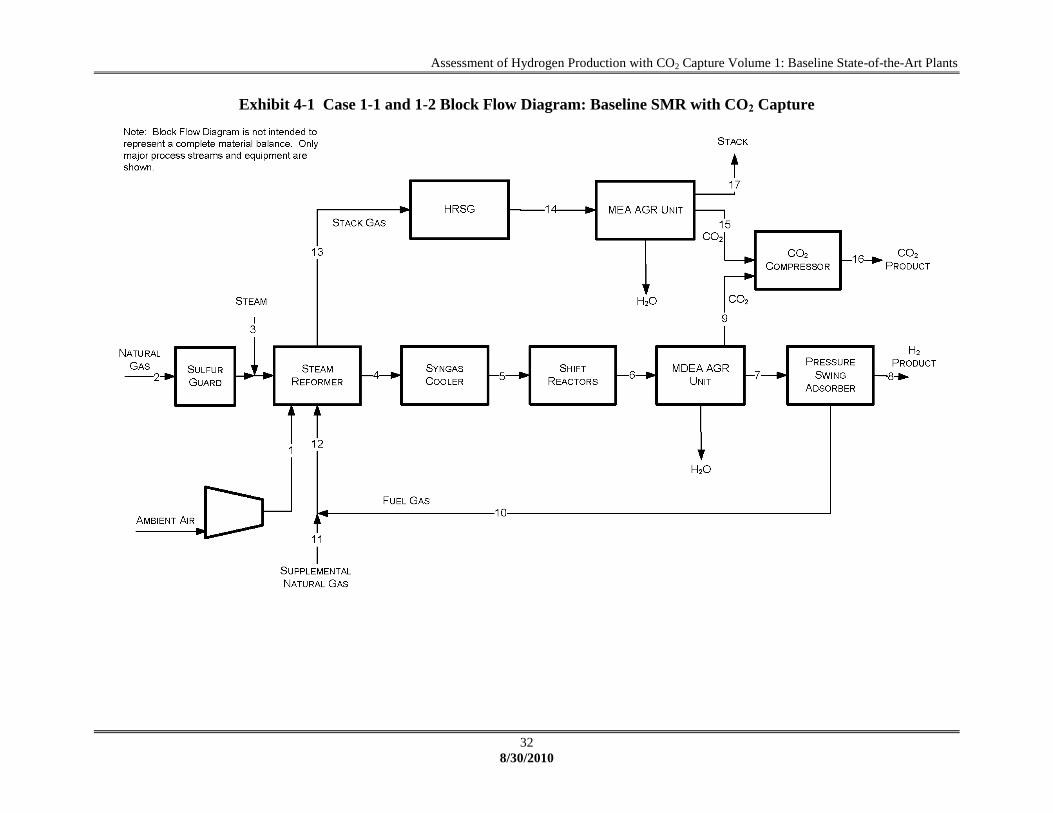
Assessment of Hydrogen Production with CO2 Capture Volume 1: Baseline State-of-the-Art Plants
32
8/30/2010
Exhibit 4-1 Case 1-1 and 1-2 Block Flow Diagram: Baseline SMR with CO2 Capture

Assessment of Hydrogen Production with CO2 Capture Volume 1: Baseline State-of-the-Art Plants
33
8/30/2010
Exhibit 4-2 Case 1-1 Stream Table: Baseline SMR with CO2 Capture
1 2 3 4 5 6 7 8 9
V-L Mole Fraction
AR 0.0094 0.0000 0.0000 0.0000 0.0000 0.0000 0.0000 0.0000 0.0000
CH4 0.0000 0.9315 0.0000 0.0179 0.0179 0.0179 0.0333 0.0000 0.0000
C2H6 0.0000 0.0317 0.0000 0.0049 0.0049 0.0049 0.0091 0.0000 0.0000
C3H8 0.0000 0.0069 0.0000 0.0011 0.0011 0.0011 0.0020 0.0000 0.0000
C4H10 0.0000 0.0040 0.0000 0.0006 0.0006 0.0006 0.0011 0.0000 0.0000
CO 0.0000 0.0000 0.0000 0.0699 0.0699 0.0010 0.0018 0.0000 0.0000
CO2 0.0003 0.0129 0.0000 0.0579 0.0579 0.1268 0.0118 0.0000 0.9458
COS 0.0000 0.0000 0.0000 0.0000 0.0000 0.0000 0.0000 0.0000 0.0000
H2 0.0000 0.0000 0.0000 0.4331 0.4331 0.5020 0.9370 1.0000 0.0001
H2O 0.0104 0.0000 1.0000 0.4128 0.4128 0.3439 0.0000 0.0000 0.0540
N2 0.7722 0.0129 0.0000 0.0020 0.0020 0.0020 0.0037 0.0000 0.0000
O2 0.2077 0.0000 0.0000 0.0000 0.0000 0.0000 0.0000 0.0000 0.0000
Total 1.0000 1.0000 1.0000 1.0000 1.0000 1.0000 1.0000 1.0000 1.0000
V-L Flowrate (kgmol/hr) 25,890 4,892 18,861 31,733 31,733 31,733 17,000 12,743 4,040
V-L Flowrate (kg/hr) 747,048 84,947 339,788 424,735 424,735 424,735 59,986 25,689 172,101
Solids Flowrate (kg/hr) 0 0 0 0 0 0 0 0 0
Temperature (°C) 16 15 399 866 204 39 38 38 49
Pressure (MPa, abs) 0.11 3.10 3.10 3.03 3.00 2.79 2.69 2.62 0.14
Enthalpy (kJ/kg)A 31.61 -6.89 3,228.10 3,665.98 1,857.72 92.17 316.08 546.87 98.41
Density (kg/m3) 1.3 24.5 10.5 4.3 10.3 21.6 3.6 2.0 2.2
V-L Molecular Weight 28.854 17.365 18.015 13.385 13.385 13.385 3.529 2.016 42.599
V-L Flowrate (lbmol/hr) 57,078 10,785 41,582 69,960 69,960 69,960 37,478 28,094 8,907
V-L Flowrate (lb/hr) 1,646,960 187,276 749,105 936,381 936,381 936,381 132,247 56,634 379,418
Solids Flowrate (lb/hr) 0 0 0 0 0 0 0 0 0
Temperature (°F) 60 59 750 1,590 400 103 100 100 120
Pressure (psia) 16.0 450.0 450.0 440.0 435.0 405.0 390.0 380.0 19.7
Enthalpy (Btu/lb)A 13.6 -3.0 1,387.8 1,576.1 798.7 39.6 135.9 235.1 42.3
Density (lb/ft3) 0.083 1.529 0.656 0.267 0.644 1.347 0.226 0.126 0.136
A - Reference conditions are 32.02 F & 0.089 PSIA
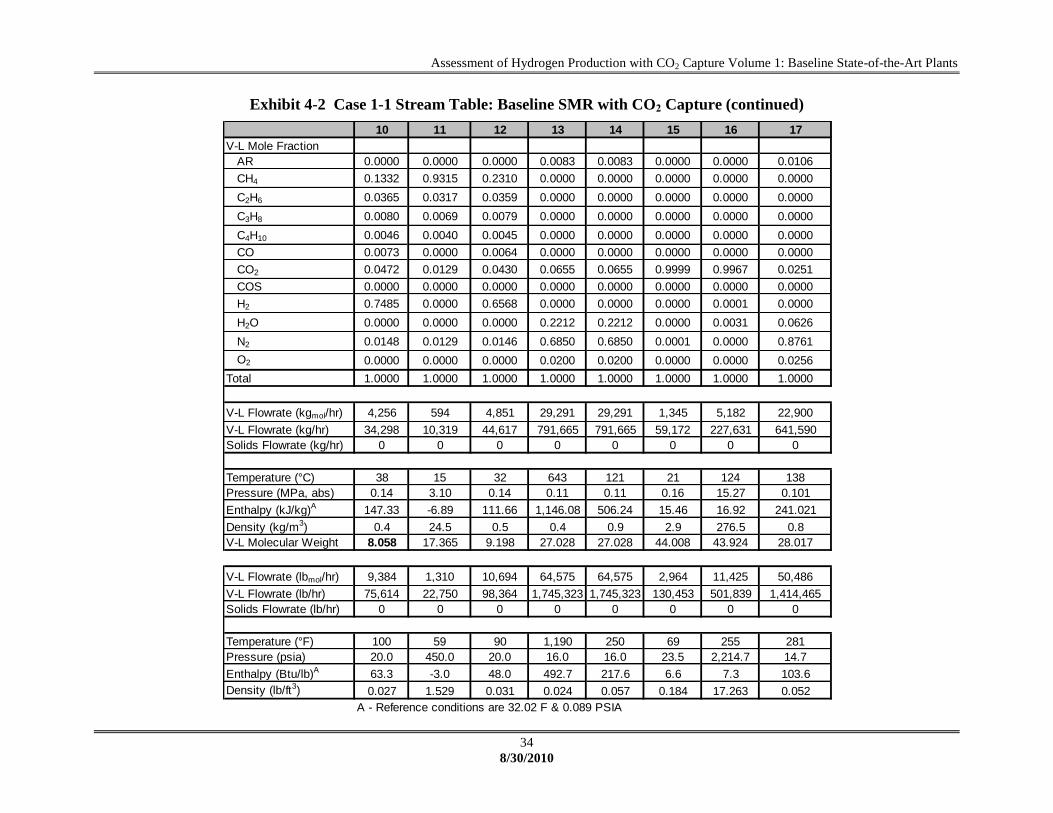
Assessment of Hydrogen Production with CO2 Capture Volume 1: Baseline State-of-the-Art Plants
34
8/30/2010
Exhibit 4-2 Case 1-1 Stream Table: Baseline SMR with CO2 Capture (continued)
10 11 12 13 14 15 16 17
V-L Mole Fraction
AR 0.0000 0.0000 0.0000 0.0083 0.0083 0.0000 0.0000 0.0106
CH4 0.1332 0.9315 0.2310 0.0000 0.0000 0.0000 0.0000 0.0000
C2H6 0.0365 0.0317 0.0359 0.0000 0.0000 0.0000 0.0000 0.0000
C3H8 0.0080 0.0069 0.0079 0.0000 0.0000 0.0000 0.0000 0.0000
C4H10 0.0046 0.0040 0.0045 0.0000 0.0000 0.0000 0.0000 0.0000
CO 0.0073 0.0000 0.0064 0.0000 0.0000 0.0000 0.0000 0.0000
CO2 0.0472 0.0129 0.0430 0.0655 0.0655 0.9999 0.9967 0.0251
COS 0.0000 0.0000 0.0000 0.0000 0.0000 0.0000 0.0000 0.0000
H2 0.7485 0.0000 0.6568 0.0000 0.0000 0.0000 0.0001 0.0000
H2O 0.0000 0.0000 0.0000 0.2212 0.2212 0.0000 0.0031 0.0626
N2 0.0148 0.0129 0.0146 0.6850 0.6850 0.0001 0.0000 0.8761
O2 0.0000 0.0000 0.0000 0.0200 0.0200 0.0000 0.0000 0.0256
Total 1.0000 1.0000 1.0000 1.0000 1.0000 1.0000 1.0000 1.0000
V-L Flowrate (kgmol/hr) 4,256 594 4,851 29,291 29,291 1,345 5,182 22,900
V-L Flowrate (kg/hr) 34,298 10,319 44,617 791,665 791,665 59,172 227,631 641,590
Solids Flowrate (kg/hr) 0 0 0 0 0 0 0 0
Temperature (°C) 38 15 32 643 121 21 124 138
Pressure (MPa, abs) 0.14 3.10 0.14 0.11 0.11 0.16 15.27 0.101
Enthalpy (kJ/kg)A 147.33 -6.89 111.66 1,146.08 506.24 15.46 16.92 241.021
Density (kg/m3) 0.4 24.5 0.5 0.4 0.9 2.9 276.5 0.8
V-L Molecular Weight 8.058 17.365 9.198 27.028 27.028 44.008 43.924 28.017
V-L Flowrate (lbmol/hr) 9,384 1,310 10,694 64,575 64,575 2,964 11,425 50,486
V-L Flowrate (lb/hr) 75,614 22,750 98,364 1,745,323 1,745,323 130,453 501,839 1,414,465
Solids Flowrate (lb/hr) 0 0 0 0 0 0 0 0
Temperature (°F) 100 59 90 1,190 250 69 255 281
Pressure (psia) 20.0 450.0 20.0 16.0 16.0 23.5 2,214.7 14.7
Enthalpy (Btu/lb)A 63.3 -3.0 48.0 492.7 217.6 6.6 7.3 103.6
Density (lb/ft3) 0.027 1.529 0.031 0.024 0.057 0.184 17.263 0.052
A - Reference conditions are 32.02 F & 0.089 PSIA

Assessment of Hydrogen Production with CO2 Capture Volume 1: Baseline State-of-the-Art Plants
35
8/30/2010
Exhibit 4-3 Case 1-2 Stream Table: Baseline SMR with CO2 Capture
1 2 3 4 5 6 7 8 9
V-L Mole Fraction
AR 0.0094 0.0000 0.0000 0.0000 0.0000 0.0000 0.0000 0.0000 0.0000
CH4 0.0000 0.9315 0.0000 0.0179 0.0179 0.0179 0.0335 0.0000 0.0000
C2H6 0.0000 0.0317 0.0000 0.0049 0.0049 0.0049 0.0091 0.0000 0.0000
C3H8 0.0000 0.0069 0.0000 0.0011 0.0011 0.0011 0.0020 0.0000 0.0000
C4H10 0.0000 0.0040 0.0000 0.0006 0.0006 0.0006 0.0011 0.0000 0.0000
CO 0.0000 0.0000 0.0000 0.0698 0.0698 0.0010 0.0018 0.0000 0.0000
CO2 0.0003 0.0129 0.0000 0.0579 0.0579 0.1267 0.0118 0.0000 0.9458
COS 0.0000 0.0000 0.0000 0.0000 0.0000 0.0000 0.0000 0.0000 0.0000
H2 0.0000 0.0000 0.0000 0.4329 0.4329 0.5018 0.9369 1.0000 0.0001
H2O 0.0104 0.0000 1.0000 0.4129 0.4129 0.3441 0.0000 0.0000 0.0541
N2 0.7722 0.0129 0.0000 0.0020 0.0020 0.0020 0.0037 0.0000 0.0000
O2 0.2077 0.0000 0.0000 0.0000 0.0000 0.0000 0.0000 0.0000 0.0000
Total 1.0000 1.0000 1.0000 1.0000 1.0000 1.0000 1.0000 1.0000 1.0000
V-L Flowrate (kgmol/hr) 25,997 4,914 18,946 31,871 31,871 31,871 17,069 12,793 4,056
V-L Flowrate (kg/hr) 750,135 85,328 341,312 426,640 426,640 426,640 60,268 25,789 172,779
Solids Flowrate (kg/hr) 0 0 0 0 0 0 0 0 0
Temperature (°C) 16 15 399 865 204 39 38 38 49
Pressure (MPa, abs) 0.11 3.10 3.10 3.03 3.00 2.79 2.69 2.62 0.14
Enthalpy (kJ/kg)A 31.61 -6.89 3,228.10 3,665.15 1,857.85 92.16 315.89 546.87 98.47
Density (kg/m3) 1.3 24.5 10.5 4.3 10.3 21.6 3.6 2.0 2.2
V-L Molecular Weight 28.854 17.365 18.015 13.386 13.386 13.386 3.531 2.016 42.598
V-L Flowrate (lbmol/hr) 57,314 10,833 41,768 70,263 70,263 70,263 37,630 28,204 8,942
V-L Flowrate (lb/hr) 1,653,764 188,116 752,463 940,579 940,579 940,579 132,868 56,855 380,912
Solids Flowrate (lb/hr) 0 0 0 0 0 0 0 0 0
Temperature (°F) 60 59 750 1,589 400 103 100 100 120
Pressure (psia) 16.0 450.0 450.0 440.0 435.0 405.0 390.0 380.0 19.7
Enthalpy (Btu/lb)A 13.6 -3.0 1,387.8 1,575.7 798.7 39.6 135.8 235.1 42.3
Density (lb/ft3) 0.083 1.529 0.656 0.267 0.644 1.347 0.227 0.126 0.136
A - Reference conditions are 32.02 F & 0.089 PSIA

Assessment of Hydrogen Production with CO2 Capture Volume 1: Baseline State-of-the-Art Plants
36
8/30/2010
Exhibit 4-3 Case 1-2 Stream Table: Baseline SMR with CO2 Capture (continued)
10 11 12 13 14 15 16 17
V-L Mole Fraction
AR 0.0000 0.0000 0.0000 0.0083 0.0083 0.0000 0.0000 0.0106
CH4 0.1337 0.9315 0.2311 0.0000 0.0000 0.0000 0.0000 0.0000
C2H6 0.0365 0.0317 0.0359 0.0000 0.0000 0.0000 0.0000 0.0000
C3H8 0.0080 0.0069 0.0079 0.0000 0.0000 0.0000 0.0000 0.0000
C4H10 0.0046 0.0040 0.0045 0.0000 0.0000 0.0000 0.0000 0.0000
CO 0.0073 0.0000 0.0064 0.0000 0.0000 0.0000 0.0000 0.0000
CO2 0.0472 0.0129 0.0430 0.0655 0.0655 0.9999 0.9967 0.0251
COS 0.0000 0.0000 0.0000 0.0000 0.0000 0.0000 0.0000 0.0000
H2 0.7480 0.0000 0.6567 0.0000 0.0000 0.0000 0.0001 0.0000
H2O 0.0000 0.0000 0.0000 0.2212 0.2212 0.0000 0.0031 0.0626
N2 0.0148 0.0129 0.0146 0.6850 0.6850 0.0001 0.0000 0.8761
O2 0.0000 0.0000 0.0000 0.0200 0.0200 0.0000 0.0000 0.0256
Total 1.0000 1.0000 1.0000 1.0000 1.0000 1.0000 1.0000 1.0000
V-L Flowrate (kgmol/hr) 4,276 594 4,870 29,411 29,411 1,350 5,203 22,994
V-L Flowrate (kg/hr) 34,479 10,319 44,798 794,933 794,933 59,423 228,541 644,231
Solids Flowrate (kg/hr) 0 0 0 0 0 0 0 0
Temperature (°C) 38 15 32 643 121 21 124 138
Pressure (MPa, abs) 0.14 3.10 0.14 0.11 0.11 0.16 15.27 0.101
Enthalpy (kJ/kg)A 147.23 -6.89 111.73 1,146.06 506.22 15.46 16.92 240.992
Density (kg/m3) 0.4 24.5 0.5 0.4 0.9 2.9 276.5 0.8
V-L Molecular Weight 8.064 17.365 9.199 27.028 27.028 44.008 43.924 28.017
V-L Flowrate (lbmol/hr) 9,427 1,310 10,737 64,841 64,841 2,977 11,471 50,694
V-L Flowrate (lb/hr) 76,013 22,750 98,763 1,752,527 1,752,527 131,004 503,846 1,420,287
Solids Flowrate (lb/hr) 0 0 0 0 0 0 0 0
Temperature (°F) 100 59 90 1,190 250 69 255 281
Pressure (psia) 20.0 450.0 20.0 16.0 16.0 23.5 2,214.7 14.7
Enthalpy (Btu/lb)A 63.3 -3.0 48.0 492.7 217.6 6.6 7.3 103.6
Density (lb/ft3) 0.027 1.529 0.031 0.024 0.057 0.184 17.263 0.052
A - Reference conditions are 32.02 F & 0.089 PSIA

Assessment of Hydrogen Production with CO2 Capture Volume 1: Baseline State-of-the-Art Plants
37
8/30/2010
4.1 COMPONENT TABLES
The component tables below contain general specifications and overall process data for the
major process component systems for cases 1-1 and 1-2.
NATURAL GAS SULFUR GUARD
Case 1-1 1-2
Technology Type Fixed bed zinc oxide pellets Fixed bed zinc oxide pellets
Basis for Design and
Performance
Vendor data – commercial
design
Vendor data – commercial
design
Operating Conditions
Inlet – Gas
95,267 kg/hr (210,029 lb/hr)
natural gas, as received
3.1MPa (450.0 psia), 15°C
(59°F) (flow includes
supplemental gas)
95,648 kg/hr (210,868 lb/hr)
natural gas, as received
3.1MPa (450.0 psia), 15°C
(59°F) (flow includes
supplemental gas)
Operating Conditions
Outlet – Gas
95,266kg/hr (210,026 lb/hr)
natural gas, as received
3.1 MPa (450.0 psia),
15°C (59°F) (flow includes
supplemental gas)
95,647kg/hr (210,866 lb/hr)
natural gas, as received
3.1 MPa (450.0 psia),
15°C (59°F) (flow includes
supplemental gas)
Assumed or Specified
Performance
Characteristics
Operating pressure,
temperature, sulfur removal,
sorbent capacity, all based on
information published by
vendor.
Operating pressure,
temperature, sulfur removal,
sorbent capacity, all based on
information published by
vendor.
Calculated Performance
Characteristics
Calculated 99.9% sulfur
removal
Calculated 99.9% sulfur
removal
Contaminant Removed, % 99.9% 99.9%
Assumptions Regarding
Anticipated Application
Issues
Commercial, no issues Commercial, no issues

Assessment of Hydrogen Production with CO2 Capture Volume 1: Baseline State-of-the-Art Plants
38
8/30/2010
STEAM METHANE REFORMER
Case 1-1 1-2
Technology Type Single-stage, catalytic,
externally heated
Single-stage, catalytic,
externally heated
Basis for Design and
Performance
Vendor data – commercial Vendor data – commercial
Operating Conditions
Inlet – Gas
Inlet - Steam
Fuel - PSA Off-Gas +
Nat Gas
84,947 kg/hr (187,276 lb/hr)
natural gas, sulfur free 3.1MPa
(450.0 psia), 15°C (59°F)
339,788 kg/hr (749,105 lb/hr)
steam 3.1 MPa (450.0 psia),
399°C (750°F)
44,617 kg/hr (98,364 lb/hr)
fuel 0.1MPa (20.0 psia),
32°C (90°F)
85,328 kg/hr (188,116 lb/hr)
natural gas, sulfur free 3.1MPa
(450.0 psia), 15°C (59°F)
341,312 kg/hr (752,463 lb/hr)
steam 3.1 MPa (450.0 psia),
399°C (750°F)
44,798 kg/hr (98,763 lb/hr)
fuel 0.1MPa (20.0 psia),
32°C (90°F)
Operating Conditions
Outlet – Syngas
Outlet - Stack Gas
424,735 kg/hr (936,381 lb/hr)
raw syngas 3.0MPa (440.0
psia), 866°C (1,590°F)
791,665 kg/hr (1,745,323
lb/hr) stack gas 0.1MPa (16.0
psia), 643°C (1,190°F)
426,640 kg/hr (940,579 lb/hr)
raw syngas 3.0MPa (440.0
psia), 866°C (1,590°F)
794,933 kg/hr (1,752,527
lb/hr) stack gas 0.1MPa (16.0
psia), 643°C (1,190°F)
Assumed or Specified
Performance
Characteristics
Operating temperature,
pressure; equilibrium syngas
composition
Operating temperature,
pressure; equilibrium syngas
composition
Calculated Performance
Characteristics
Modeled performance based
on performance assumptions
Modeled performance based
on performance assumptions
Contaminant Removed, % N/A N/A
Assumptions Regarding
Anticipated Application
Issues
Commercial, no issues Commercial, no issues

Assessment of Hydrogen Production with CO2 Capture Volume 1: Baseline State-of-the-Art Plants
39
8/30/2010
SYNGAS COOLER
Case 1-1 1-2
Technology Type Convective Boiler - Drum Convective Boiler - Drum
Basis for Design and
Performance
Vendor data – commercial
design
Vendor data – commercial
design
Operating Conditions
Inlet - Syngas
424,735 kg/hr (936,381 lb/hr)
raw syngas, 3.0 MPa (440.0
psia), 874°C (1,605°F)
426,640 kg/hr (940,579 lb/hr)
raw syngas, 3.0 MPa (440.0
psia), 874°C (1,605°F)
Operating Conditions
Outlet - Syngas
424,735 kg/hr (936,381 lb/hr)
raw syngas, 3.0 MPa (435.0
psia), 204°C (400°F)
426,640 kg/hr (940,579 lb/hr)
raw syngas, 3.0 MPa (435.0
psia), 204°C (400°F)
Assumed or Specified
Performance
Characteristics
Syngas temperature profile Syngas temperature profile
Calculated Performance
Characteristics
Modeled performance based
on performance assumptions
Modeled performance based
on performance assumptions
Contaminant Removed, % N/A N/A
Assumptions Regarding
Anticipated Application
Issues
Commercial design – no
issues.
Commercial design – no
issues.

Assessment of Hydrogen Production with CO2 Capture Volume 1: Baseline State-of-the-Art Plants
40
8/30/2010
WATER GAS SHIFT REACTOR
Case 1-1 1-2
Technology Type Haldor Topsoe Two-Stage
Shift Catalyst
Haldor Topsoe Two-Stage
Shift Catalyst
Basis for Design and
Performance
Vendor data – commercial
design
Vendor data – commercial
design
Operating Conditions
Inlet – Gas (1)
424,735 kg/hr (936,381 lb/hr)
syngas, 3.0 MPa (435.0 psia),
204°C (400°F)
424,640 kg/hr (940,579 lb/hr)
syngas, 3.0 MPa (435.0 psia),
204°C (400°F)
Operating Conditions
Cooled Outlet – Syngas (2)
424,735 kg/hr (936,381 lb/hr)
syngas, 2.8 MPa (405.0 psia),
39°C (103°F)
424,640 kg/hr (940,579 lb/hr)
syngas, 2.8 MPa (405.0 psia),
39°C (103°F)
Assumed or Specified
Performance
Characteristics
Specified shift catalyst which
also promotes COS hydrolysis;
Assume minimum H2O/CO
ratio of 2.0 at inlet; Interstage
cooling; Assume two stages
required to achieve >97% CO
conversion
Specified shift catalyst which
also promotes COS hydrolysis;
Assume minimum H2O/CO
ratio of 2.0 at inlet; Interstage
cooling; Assume two stages
required to achieve >97% CO
conversion
Calculated Performance
Characteristics
Modeled WGS reaction based
on equilibrium to >97% CO
conversion
Modeled WGS reaction based
on equilibrium to >97% CO
conversion
Contaminant Removed, % N/A N/A
Assumptions Regarding
Anticipated Application
Issues
Commercial design; no issues Commercial design; no issues
(1) The SMR outlet syngas contains sufficient water for the WGS reaction and no steam is added.
(2) The WGS Reactor component table includes the catalytic reactors, intercoolers, and the syngas aftercooler in
preparation for entrance to the MDEA absorber.

Assessment of Hydrogen Production with CO2 Capture Volume 1: Baseline State-of-the-Art Plants
41
8/30/2010
SYNGAS MDEA CO2 REMOVAL
Case 1-1 1-2
Technology Type Proprietary MDEA Solvent Proprietary MDEA Solvent
Basis for Design and
Performance
Vendor data – commercial
design
Vendor data – commercial
design
Operating Conditions
Inlet - Syngas
424,735 kg/hr (936,381 lb/hr)
shifted syngas,
2.8 MPa (405.0 psia), 39°C
(103°F)
426,640 kg/hr (940,579 lb/hr)
shifted syngas,
2.8 MPa (405.0 psia), 39°C
(103°F)
Operating Conditions
Outlet - CO2
Outlet – Syngas (1)
172,101 kg/hr (379,418 lb/hr)
CO2, 0.1 MPa (19.7 psia),
49°C (120°F)
59,986 kg/hr (132,247 lb/hr)
Claus feed gas, 2.7 MPa
(390.0 psia), 38°C (100°F)
172,779 kg/hr (380,912 lb/hr)
CO2, 0.1 MPa (19.7 psia),
49°C (120°F)
60,268 kg/hr (132,868 lb/hr)
Claus feed gas, 2.7 MPa
(390.0 psia), 38°C (100°F)
Assumed or Specified
Performance
Characteristics
Specified 95% specific to CO2
removal
Specified 95% specific to CO2
removal
Calculated Performance
Characteristics
Model results reflect design
assumptions
Model results reflect design
assumptions
Contaminant Removed, % 95% CO2 95% CO2
Assumptions Regarding
Anticipated Application
Issues
Vendor design specifically
applied to similar Hydrogen
production conditions
Vendor design specifically
applied to similar Hydrogen
production conditions
(1) Condensed water separates from the cool syngas at the entrance to the absorber, reducing the net outlet syngas
mass flow
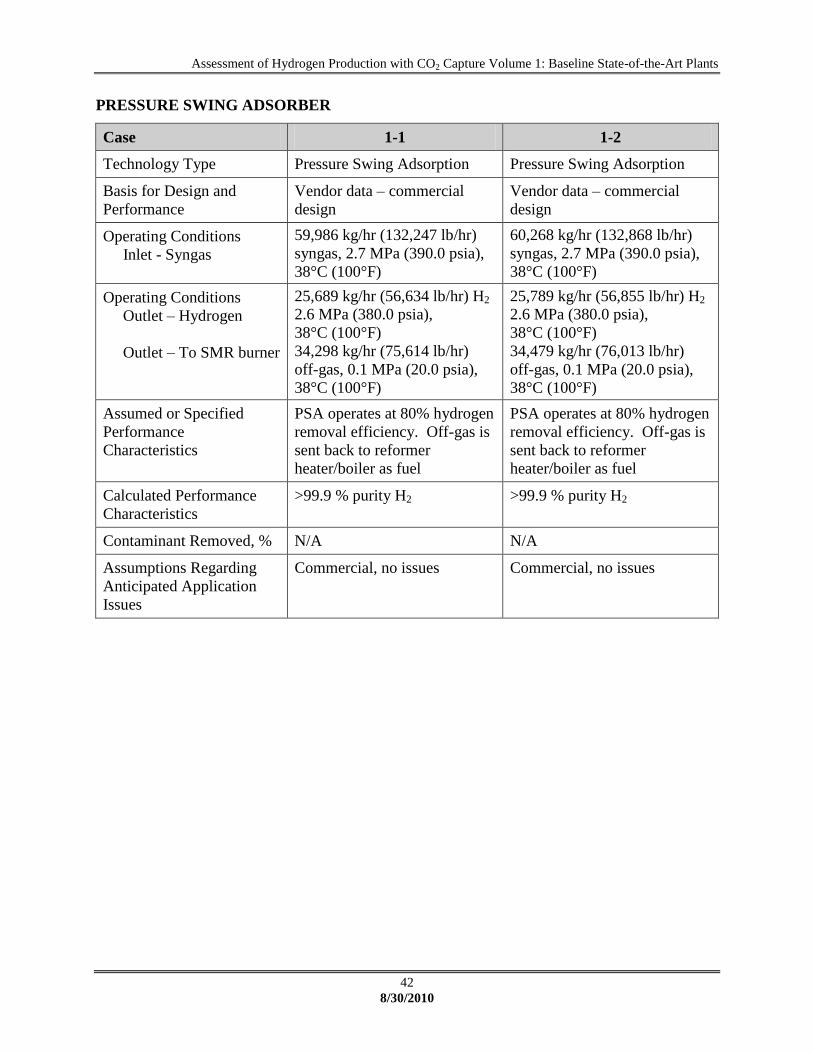
Assessment of Hydrogen Production with CO2 Capture Volume 1: Baseline State-of-the-Art Plants
42
8/30/2010
PRESSURE SWING ADSORBER
Case 1-1 1-2
Technology Type Pressure Swing Adsorption Pressure Swing Adsorption
Basis for Design and
Performance
Vendor data – commercial
design
Vendor data – commercial
design
Operating Conditions
Inlet - Syngas
59,986 kg/hr (132,247 lb/hr)
syngas, 2.7 MPa (390.0 psia),
38°C (100°F)
60,268 kg/hr (132,868 lb/hr)
syngas, 2.7 MPa (390.0 psia),
38°C (100°F)
Operating Conditions
Outlet – Hydrogen
Outlet – To SMR burner
25,689 kg/hr (56,634 lb/hr) H2
2.6 MPa (380.0 psia),
38°C (100°F)
34,298 kg/hr (75,614 lb/hr)
off-gas, 0.1 MPa (20.0 psia),
38°C (100°F)
25,789 kg/hr (56,855 lb/hr) H2
2.6 MPa (380.0 psia),
38°C (100°F)
34,479 kg/hr (76,013 lb/hr)
off-gas, 0.1 MPa (20.0 psia),
38°C (100°F)
Assumed or Specified
Performance
Characteristics
PSA operates at 80% hydrogen
removal efficiency. Off-gas is
sent back to reformer
heater/boiler as fuel
PSA operates at 80% hydrogen
removal efficiency. Off-gas is
sent back to reformer
heater/boiler as fuel
Calculated Performance
Characteristics
>99.9 % purity H2 >99.9 % purity H2
Contaminant Removed, % N/A N/A
Assumptions Regarding
Anticipated Application
Issues
Commercial, no issues Commercial, no issues

Assessment of Hydrogen Production with CO2 Capture Volume 1: Baseline State-of-the-Art Plants
43
8/30/2010
STACK GAS HEAT RECOVERY STEAM GENERATOR (HRSG)
Case 1-1 1-2
Technology Type Sub-Critical Drum Sub-Critical Drum
Basis for Design and
Performance
Vendor data – commercial
design
Vendor data – commercial
design
Operating Conditions
Inlet - Flue Gas
791,665 kg/hr (1,745,323
lb/hr) syngas, 0.1 MPa (16.0
psia), 644°C (1,191°F)
794,933 kg/hr (1,752,527
lb/hr) syngas, 0.1 MPa (16.0
psia), 644°C (1,191°F)
Operating Conditions
Outlet -Flue Gas
791,665 kg/hr (1,745,323
lb/hr) syngas, 0.1 MPa
(16.0 psia), 121°C (250°F)
794,933 kg/hr (1,752,527
lb/hr) syngas, 0.1 MPa
(16.0 psia), 121°C (250°F)
Assumed or Specified
Performance
Characteristics
Specified pressure and steam
requirement
Specified pressure and steam
requirement
Calculated Performance
Characteristics
Calculated 507 GJ/hr
(480 MMBtu/hr) Heat
Recovery based on gas flow
and temperatures
Calculated 509 GJ/hr
(482 MMBtu/hr) Heat
Recovery based on gas flow
and temperatures
Contaminant Removed, % N/A N/A
Assumptions Regarding
Anticipated Application
Issues
Commercial, no issues Commercial, no issues

Assessment of Hydrogen Production with CO2 Capture Volume 1: Baseline State-of-the-Art Plants
44
8/30/2010
STACK GAS HINDERED AMINE (MEA) CO2 REMOVAL
Case 1-1 1-2
Technology Type Fluor Econamine FG Plus Fluor Econamine FG Plus
Basis for Design and
Performance
Vendor data – commercial
design
Vendor data – commercial
design
Operating Conditions
Operating Conditions
Inlet - Syngas
791,665 kg/hr (1,745,323
lb/hr) flue gas,
0.1 MPa (16.0 psia),
121°C (250°F)
794,933 kg/hr (1,752,527
lb/hr) flue gas
0.1 MPa (16.0 psia),
121°C (250°F)
Operating Conditions
Outlet - CO2
Outlet - To Stack
59,172 kg/hr (130,453 lb/hr)
CO2, 0.2 MPa (23.5 psia),
21°C (69°F)
641,590 kg/hr (1,414,465
lb/hr) stack gas
0.1 MPa (14.7 psia), 138°C
(281°F)
59,423 kg/hr (131,004 lb/hr)
CO2, 0.2 MPa (23.5 psia),
21°C (69°F)
644,231 kg/hr (1,420,287
lb/hr) stack gas
0.1 MPa (14.7 psia), 138°C
(281°F)
Assumed or Specified
Performance
Characteristics
Specified 70% specific to CO2
removal
Specified 70% specific to CO2
removal
Calculated Performance
Characteristics
Model results reflect design
assumptions
Model results reflect design
assumptions
Contaminant Removed, % 70% CO2 from gas to stack 70% CO2 from gas to stack
Assumptions Regarding
Anticipated Application
Issues
Vendor design specifically
provided for low pressure
syngas conditions
Vendor design specifically
provided for low pressure
syngas conditions
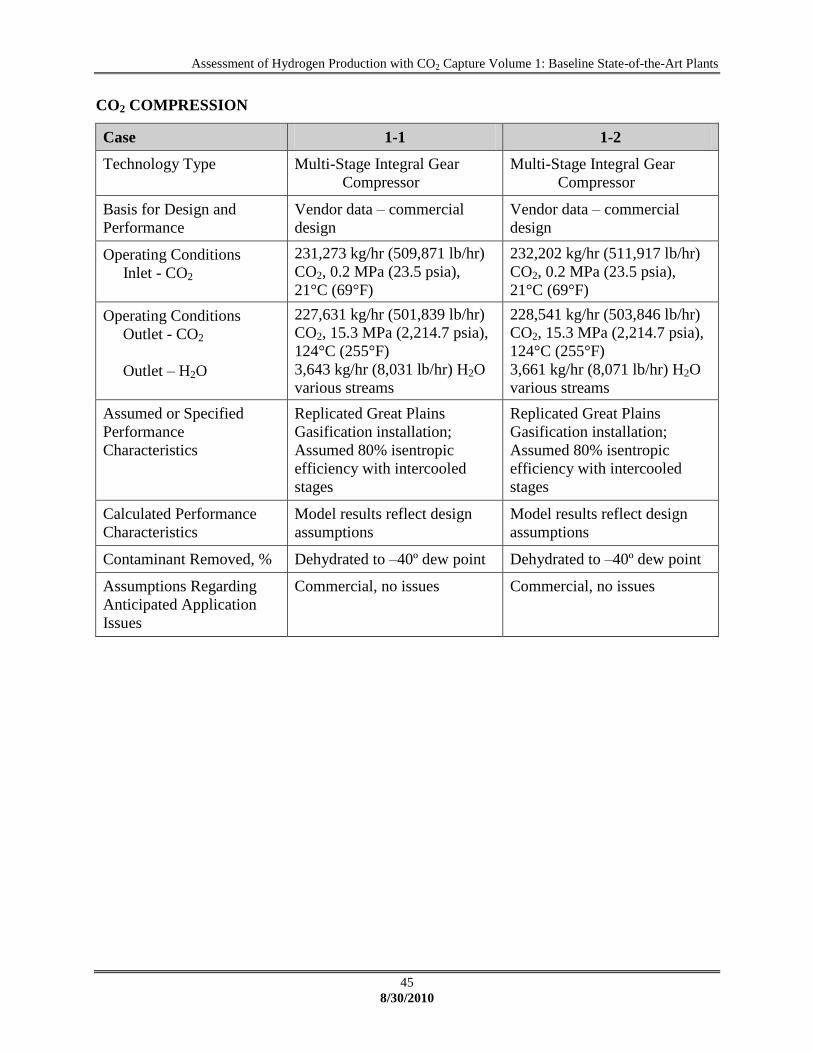
Assessment of Hydrogen Production with CO2 Capture Volume 1: Baseline State-of-the-Art Plants
45
8/30/2010
CO2 COMPRESSION
Case 1-1 1-2
Technology Type Multi-Stage Integral Gear
Compressor
Multi-Stage Integral Gear
Compressor
Basis for Design and
Performance
Vendor data – commercial
design
Vendor data – commercial
design
Operating Conditions
Inlet - CO2
231,273 kg/hr (509,871 lb/hr)
CO2, 0.2 MPa (23.5 psia),
21°C (69°F)
232,202 kg/hr (511,917 lb/hr)
CO2, 0.2 MPa (23.5 psia),
21°C (69°F)
Operating Conditions
Outlet - CO2
Outlet – H2O
227,631 kg/hr (501,839 lb/hr)
CO2, 15.3 MPa (2,214.7 psia),
124°C (255°F)
3,643 kg/hr (8,031 lb/hr) H2O
various streams
228,541 kg/hr (503,846 lb/hr)
CO2, 15.3 MPa (2,214.7 psia),
124°C (255°F)
3,661 kg/hr (8,071 lb/hr) H2O
various streams
Assumed or Specified
Performance
Characteristics
Replicated Great Plains
Gasification installation;
Assumed 80% isentropic
efficiency with intercooled
stages
Replicated Great Plains
Gasification installation;
Assumed 80% isentropic
efficiency with intercooled
stages
Calculated Performance
Characteristics
Model results reflect design
assumptions
Model results reflect design
assumptions
Contaminant Removed, % Dehydrated to –40º dew point Dehydrated to –40º dew point
Assumptions Regarding
Anticipated Application
Issues
Commercial, no issues Commercial, no issues
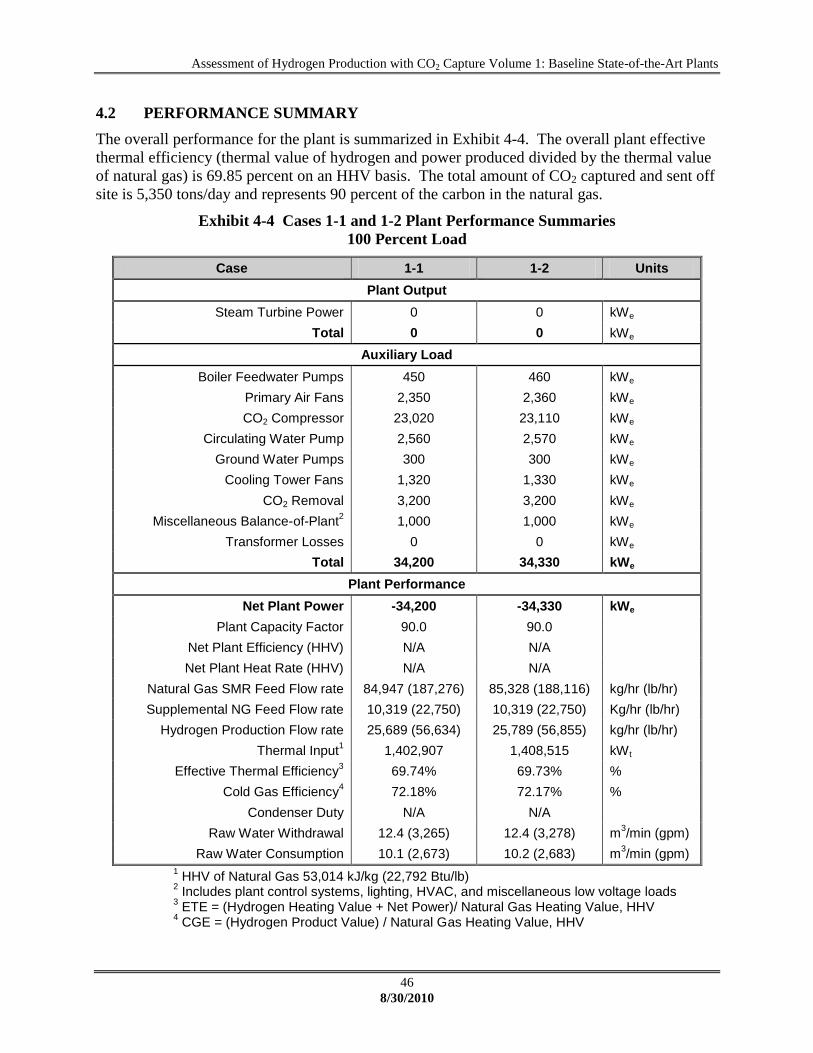
Assessment of Hydrogen Production with CO2 Capture Volume 1: Baseline State-of-the-Art Plants
46
8/30/2010
4.2 PERFORMANCE SUMMARY
The overall performance for the plant is summarized in Exhibit 4-4. The overall plant effective
thermal efficiency (thermal value of hydrogen and power produced divided by the thermal value
of natural gas) is 69.85 percent on an HHV basis. The total amount of CO2 captured and sent off
site is 5,350 tons/day and represents 90 percent of the carbon in the natural gas.
Exhibit 4-4 Cases 1-1 and 1-2 Plant Performance Summaries
100 Percent Load
Case 1-1 1-2 Units
Plant Output
Steam Turbine Power 0 0 kWe
Total 0 0 kWe
Auxiliary Load
Boiler Feedwater Pumps 450 460 kWe
Primary Air Fans 2,350 2,360 kWe
CO2 Compressor 23,020 23,110 kWe
Circulating Water Pump 2,560 2,570 kWe
Ground Water Pumps 300 300 kWe
Cooling Tower Fans 1,320 1,330 kWe
CO2 Removal 3,200 3,200 kWe
Miscellaneous Balance-of-Plant2 1,000 1,000 kWe
Transformer Losses 0 0 kWe
Total 34,200 34,330 kWe
Plant Performance
Net Plant Power -34,200 -34,330 kWe
Plant Capacity Factor 90.0 90.0
Net Plant Efficiency (HHV) N/A N/A
Net Plant Heat Rate (HHV) N/A N/A
Natural Gas SMR Feed Flow rate 84,947 (187,276) 85,328 (188,116) kg/hr (lb/hr)
Supplemental NG Feed Flow rate 10,319 (22,750) 10,319 (22,750) Kg/hr (lb/hr)
Hydrogen Production Flow rate 25,689 (56,634) 25,789 (56,855) kg/hr (lb/hr)
Thermal Input1 1,402,907 1,408,515 kWt
Effective Thermal Efficiency3 69.74% 69.73% %
Cold Gas Efficiency4 72.18% 72.17% %
Condenser Duty N/A N/A
Raw Water Withdrawal 12.4 (3,265) 12.4 (3,278) m3/min (gpm)
Raw Water Consumption 10.1 (2,673) 10.2 (2,683) m3/min (gpm)
1 HHV of Natural Gas 53,014 kJ/kg (22,792 Btu/lb)
2 Includes plant control systems, lighting, HVAC, and miscellaneous low voltage loads
3 ETE = (Hydrogen Heating Value + Net Power)/ Natural Gas Heating Value, HHV
4 CGE = (Hydrogen Product Value) / Natural Gas Heating Value, HHV
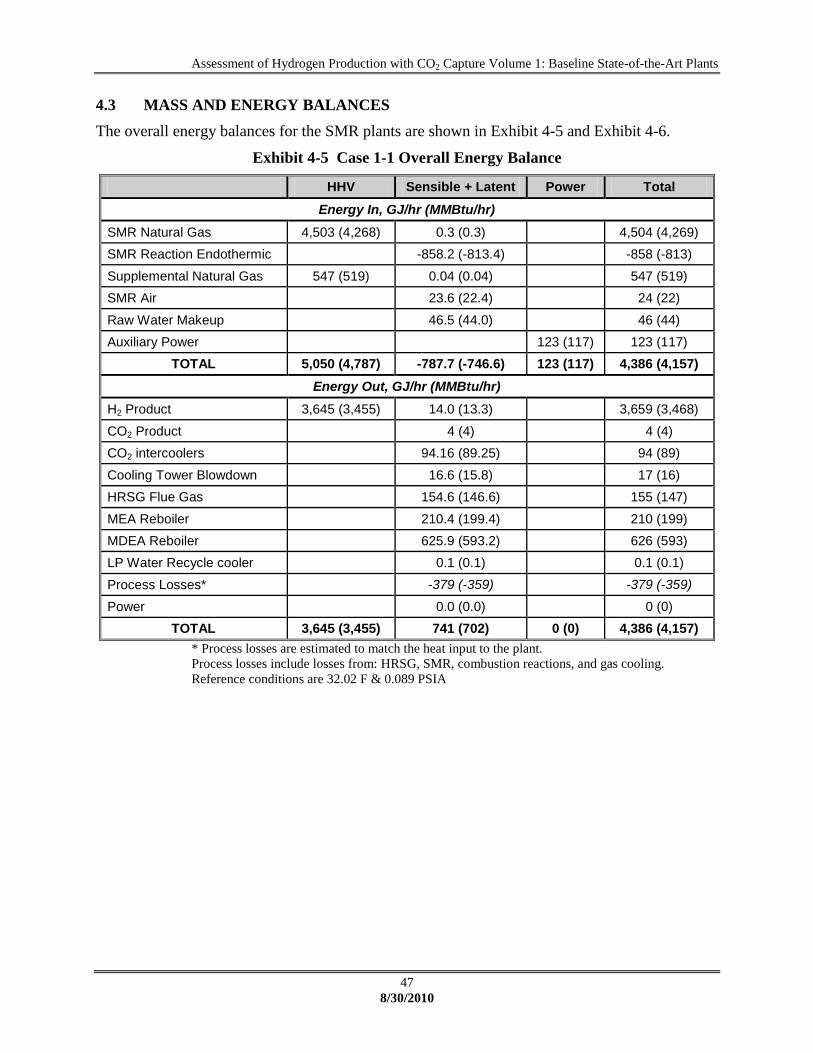
Assessment of Hydrogen Production with CO2 Capture Volume 1: Baseline State-of-the-Art Plants
47
8/30/2010
4.3 MASS AND ENERGY BALANCES
The overall energy balances for the SMR plants are shown in Exhibit 4-5 and Exhibit 4-6.
Exhibit 4-5 Case 1-1 Overall Energy Balance
HHV Sensible + Latent Power Total
Energy In, GJ/hr (MMBtu/hr)
SMR Natural Gas 4,503 (4,268) 0.3 (0.3) 4,504 (4,269)
SMR Reaction Endothermic -858.2 (-813.4) -858 (-813)
Supplemental Natural Gas 547 (519) 0.04 (0.04) 547 (519)
SMR Air 23.6 (22.4) 24 (22)
Raw Water Makeup 46.5 (44.0) 46 (44)
Auxiliary Power 123 (117) 123 (117)
TOTAL 5,050 (4,787) -787.7 (-746.6) 123 (117) 4,386 (4,157)
Energy Out, GJ/hr (MMBtu/hr)
H2 Product 3,645 (3,455) 14.0 (13.3) 3,659 (3,468)
CO2 Product 4 (4) 4 (4)
CO2 intercoolers 94.16 (89.25) 94 (89)
Cooling Tower Blowdown 16.6 (15.8) 17 (16)
HRSG Flue Gas 154.6 (146.6) 155 (147)
MEA Reboiler 210.4 (199.4) 210 (199)
MDEA Reboiler 625.9 (593.2) 626 (593)
LP Water Recycle cooler 0.1 (0.1) 0.1 (0.1)
Process Losses* -379 (-359) -379 (-359)
Power 0.0 (0.0) 0 (0)
TOTAL 3,645 (3,455) 741 (702) 0 (0) 4,386 (4,157)
* Process losses are estimated to match the heat input to the plant.
Process losses include losses from: HRSG, SMR, combustion reactions, and gas cooling.
Reference conditions are 32.02 F & 0.089 PSIA

Assessment of Hydrogen Production with CO2 Capture Volume 1: Baseline State-of-the-Art Plants
48
8/30/2010
Exhibit 4-6 Case 1-2 Overall Energy Balance
HHV Sensible + Latent Power Total
Energy In, GJ/hr (MMBtu/hr)
SMR Natural Gas 4,524 (4,288) 0.3 (0.3) 4,524 (4,288)
SMR Reaction Endothermic -864.1 (-819.0) -864 (-819)
Supplemental Natural Gas 547 (519) 0.04 (0.04) 547 (519)
SMR Air 23.7 (22.5) 24 (22)
Raw Water Makeup 46.7 (44.2) 47 (44)
Auxiliary Power 124 (117) 124 (117)
TOTAL 5,071 (4,806) -793.4 (-752.0) 124 (117) 4,401 (4,171)
Energy Out, GJ/hr (MMBtu/hr)
H2 Product 3,659 (3,468) 14.1 (13.4) 3,674 (3,482)
CO2 Product 4 (4) 4 (4)
CO2 intercoolers 94.55 (89.61) 95 (90)
Cooling Tower Blowdown 16.7 (15.8) 17 (16)
HRSG Flue Gas 155.3 (147.2) 155 (147)
MEA Reboiler 211.2 (200.2) 211 (200)
MDEA Reboiler 628.3 (595.5) 628 (596)
LP Water Recycle cooler 0.1 (0.1) 0.1 (0.1)
Process Losses* -383 (-363) -383 (-363)
Power 0.0 (0.0) 0 (0)
TOTAL 3,659 (3,468) 741 (703) 0 (0) 4,401 (4,171)
* Process losses are estimated to match the heat input to the plant.
Process losses include losses from: HRSG, SMR, combustion reactions, and gas cooling.
Reference conditions are 32.02 F & 0.089 PSIA

Assessment of Hydrogen Production with CO2 Capture Volume 1: Baseline State-of-the-Art Plants
49
8/30/2010
4.3.1 Water Balance
The overall water balances for the plants are shown in Exhibit 4-7 and Exhibit 4-8. Raw water is
obtained from groundwater (50 percent) and from municipal sources (50 percent). Water
demand represents the total amount of water required for a particular process. Some water is
recovered within the process as syngas condensate and that water is re-used as internal recycle.
Raw water makeup is the difference between water demand and internal recycle.
Exhibit 4-7 Case 1-1 Water Balance
Water Use
Water Demand, m
3/min
(gpm)
Internal Recycle, m
3/min
(gpm)
Raw Water Withdrawal,
m3/min
(gpm)
Process Water
Discharge, m
3/min
(gpm)
Raw Water Usage, m
3/min
(gpm)
MEA Steam 1.66 (438) 1.66 (438)
MDEA Steam 4.9 (1,302) 4.9 (1,302)
SMR Steam 5.67 (1,498) 5. 7 (1,498) 5.7 (1,498)
Cooling Tower 10.0 (2,632) 3.3 (865) 6.7 (1,767) 2.2 (592) 4.4 (1,175)
SWS Blowdown 3.2 (849) 3.2 (849)
CO2 Product Knockout 0.06 (16) 0.06 (16)
Total 22.2 (5,870) 9.9 (2,605) 12.4 (3,265) 2.2 (592) 10.1 (2,673)
Exhibit 4-8 Case 1-2 Water Balance
Water Use
Water Demand, m
3/min
(gpm)
Internal Recycle, m
3/min
(gpm)
Raw Water Withdrawal,
m3/min
(gpm)
Process Water
Discharge, m
3/min
(gpm)
Raw Water Usage, m
3/min
(gpm)
MEA Steam 1.66 (439) 1.66 (439)
MDEA Steam 4.9 (1,307) 4.9 (1,307)
SMR Steam 5.70 (1,505) 5.7 (1,505) 5.7 (1,505)
Cooling Tower 10.0 (2,642) 3.3 (870) 6.7 (1,773) 2.2 (594) 4.5 (1,178)
SWS Blowdown 3.2 (854) 3.2 (854)
CO2 Product Knockout 0.06 (16) 0.06 (16)
Total 22.2 (5,894) 9.9 (2,616) 12.4 (3,278) 2.2 (594) 10.2 (2,683)
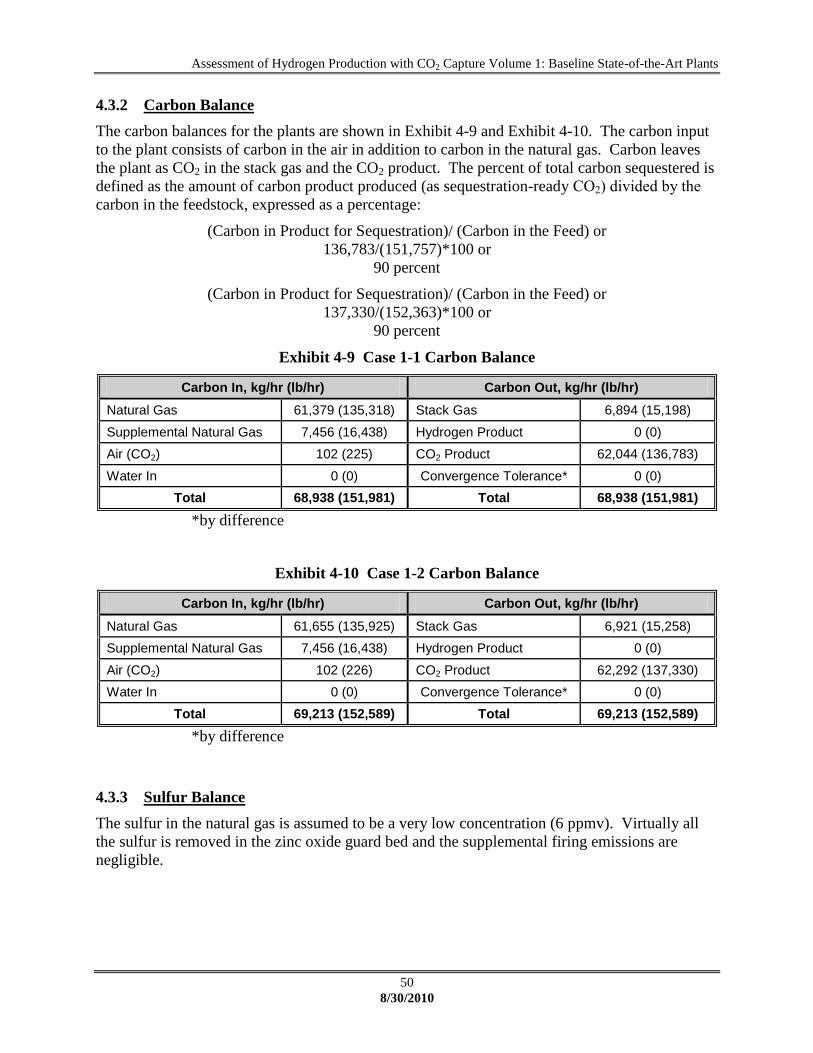
Assessment of Hydrogen Production with CO2 Capture Volume 1: Baseline State-of-the-Art Plants
50
8/30/2010
4.3.2 Carbon Balance
The carbon balances for the plants are shown in Exhibit 4-9 and Exhibit 4-10. The carbon input
to the plant consists of carbon in the air in addition to carbon in the natural gas. Carbon leaves
the plant as CO2 in the stack gas and the CO2 product. The percent of total carbon sequestered is
defined as the amount of carbon product produced (as sequestration-ready CO2) divided by the
carbon in the feedstock, expressed as a percentage:
(Carbon in Product for Sequestration)/ (Carbon in the Feed) or
136,783/(151,757)*100 or
90 percent
(Carbon in Product for Sequestration)/ (Carbon in the Feed) or
137,330/(152,363)*100 or
90 percent
Exhibit 4-9 Case 1-1 Carbon Balance
Carbon In, kg/hr (lb/hr) Carbon Out, kg/hr (lb/hr)
Natural Gas 61,379 (135,318) Stack Gas 6,894 (15,198)
Supplemental Natural Gas 7,456 (16,438) Hydrogen Product 0 (0)
Air (CO2) 102 (225) CO2 Product 62,044 (136,783)
Water In 0 (0) Convergence Tolerance* 0 (0)
Total 68,938 (151,981) Total 68,938 (151,981)
*by difference
Exhibit 4-10 Case 1-2 Carbon Balance
Carbon In, kg/hr (lb/hr) Carbon Out, kg/hr (lb/hr)
Natural Gas 61,655 (135,925) Stack Gas 6,921 (15,258)
Supplemental Natural Gas 7,456 (16,438) Hydrogen Product 0 (0)
Air (CO2) 102 (226) CO2 Product 62,292 (137,330)
Water In 0 (0) Convergence Tolerance* 0 (0)
Total 69,213 (152,589) Total 69,213 (152,589)
*by difference
4.3.3 Sulfur Balance
The sulfur in the natural gas is assumed to be a very low concentration (6 ppmv). Virtually all
the sulfur is removed in the zinc oxide guard bed and the supplemental firing emissions are
negligible.
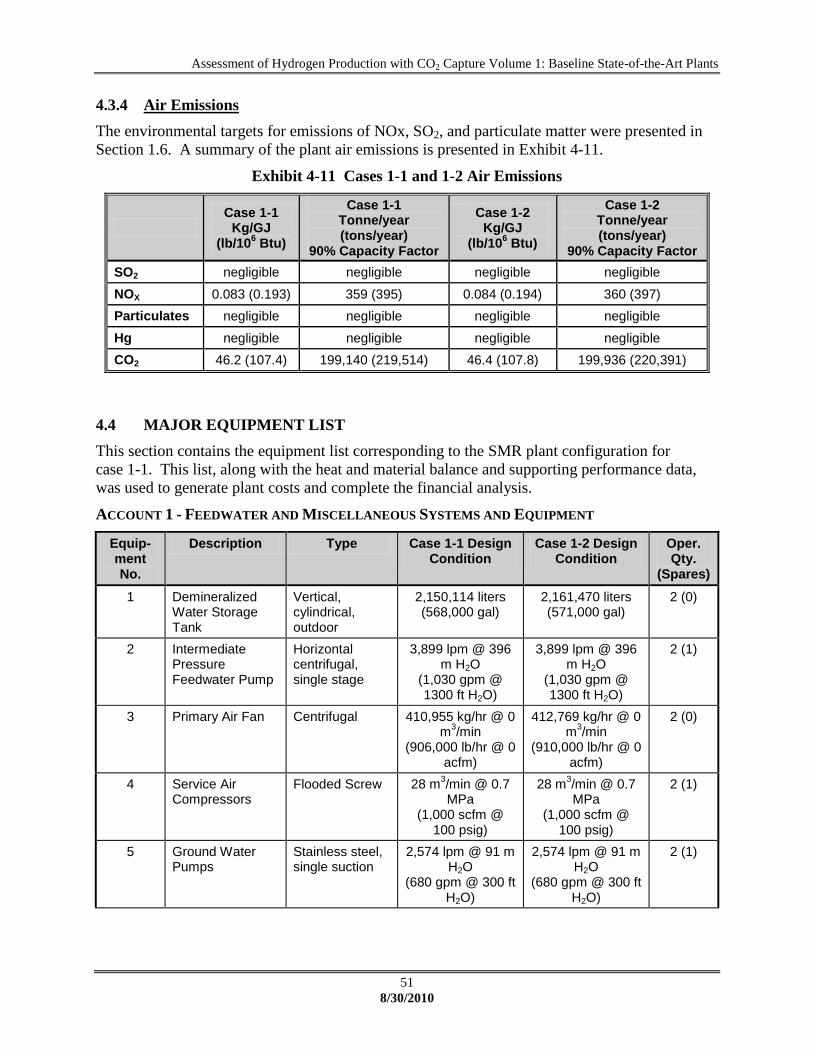
Assessment of Hydrogen Production with CO2 Capture Volume 1: Baseline State-of-the-Art Plants
51
8/30/2010
4.3.4 Air Emissions
The environmental targets for emissions of NOx, SO2, and particulate matter were presented in
Section 1.6. A summary of the plant air emissions is presented in Exhibit 4-11.
Exhibit 4-11 Cases 1-1 and 1-2 Air Emissions
Case 1-1
Kg/GJ (lb/10
6 Btu)
Case 1-1 Tonne/year (tons/year)
90% Capacity Factor
Case 1-2 Kg/GJ
(lb/106 Btu)
Case 1-2 Tonne/year (tons/year)
90% Capacity Factor
SO2 negligible negligible negligible negligible
NOX 0.083 (0.193) 359 (395) 0.084 (0.194) 360 (397)
Particulates negligible negligible negligible negligible
Hg negligible negligible negligible negligible
CO2 46.2 (107.4) 199,140 (219,514) 46.4 (107.8) 199,936 (220,391)
4.4 MAJOR EQUIPMENT LIST
This section contains the equipment list corresponding to the SMR plant configuration for
case 1-1. This list, along with the heat and material balance and supporting performance data,
was used to generate plant costs and complete the financial analysis.
ACCOUNT 1 - FEEDWATER AND MISCELLANEOUS SYSTEMS AND EQUIPMENT
Equip-ment No.
Description Type Case 1-1 Design Condition
Case 1-2 Design Condition
Oper. Qty.
(Spares)
1 Demineralized Water Storage Tank
Vertical, cylindrical, outdoor
2,150,114 liters (568,000 gal)
2,161,470 liters (571,000 gal)
2 (0)
2 Intermediate Pressure Feedwater Pump
Horizontal centrifugal, single stage
3,899 lpm @ 396 m H2O
(1,030 gpm @ 1300 ft H2O)
3,899 lpm @ 396 m H2O
(1,030 gpm @ 1300 ft H2O)
2 (1)
3 Primary Air Fan Centrifugal 410,955 kg/hr @ 0 m
3/min
(906,000 lb/hr @ 0 acfm)
412,769 kg/hr @ 0 m
3/min
(910,000 lb/hr @ 0 acfm)
2 (0)
4 Service Air Compressors
Flooded Screw 28 m3/min @ 0.7 MPa
(1,000 scfm @ 100 psig)
28 m3/min @ 0.7 MPa
(1,000 scfm @ 100 psig)
2 (1)
5 Ground Water Pumps
Stainless steel, single suction
2,574 lpm @ 91 m H2O
(680 gpm @ 300 ft H2O)
2,574 lpm @ 91 m H2O
(680 gpm @ 300 ft H2O)
2 (1)

Assessment of Hydrogen Production with CO2 Capture Volume 1: Baseline State-of-the-Art Plants
52
8/30/2010
Equip-ment No.
Description Type Case 1-1 Design Condition
Case 1-2 Design Condition
Oper. Qty.
(Spares)
6 Raw Water Pumps
Stainless steel, single suction
6,814 lpm @ 268 m H2O
(1,800 gpm @ 880 ft H2O)
6,814 lpm @ 268 m H2O
(1,800 gpm @ 880 ft H2O)
2 (2)
ACCOUNT 2 - REFORMER AND ACCESSORIES
Equip-ment No.
Description Type Case 1-1 Design Condition
Case 1-2 Design Condition
Oper. Qty. (Spares)
1 Natural Gas Sulfur Guard
Zinc Oxide Bed 95,270 kg/hr (210,130 lb/hr)
natural gas, 3.1 MPa (450 psia)
95,650 kg/hr (210,870 lb/hr)
natural gas, 3.1 MPa (450 psia)
1 (0)
2 Reformer Single Stage Catalytic, Externally Heated
93,440 kg/hr natural gas
(206,000 lb/hr) natural gas,
373,800 kg/hr (824,000 lb/hr)
3.1 MPa (450 psia)
93,870 kg/hr natural gas
(206,930 lb/hr) natural gas,
375,400 kg/hr (827,700 lb/hr)
3.1 MPa (450 psia)
1 (0)
3 Synthesis Gas Cooler
Fire-tube boiler 233,600 kg/hr (515,000 lb/hr)
syngas, 3.0 MPa (440 psia)
234,500 kg/hr (517,000 lb/hr)
syngas, 3.0 MPa (440 psia)
1 (0)
4 Stack Gas Cooler
Fire-tube boiler 352,900 kg/hr (777,960 lb/hr)
stack gas, 0.1 MPa (16 psia),
354,300 kg/hr (781,160 lb/hr)
stack gas, 0.1 MPa (16 psia)
1 (0)
5 Stack CS plate, type 409SS liner
15 m (50 ft) high x 2.6 m (9 ft) diameter
15 m (50 ft) high x 2.6 m (9 ft) diameter
1 (0)

Assessment of Hydrogen Production with CO2 Capture Volume 1: Baseline State-of-the-Art Plants
53
8/30/2010
ACCOUNT 3A - WATER GAS SHIFT, SYNGAS CLEANUP AND HYDROGEN PURIFICATION
Equip-ment No.
Description Type Case 1-1 Design Condition
Case 1-2 Design Condition
Oper Qty.
(Spares)
1 WGS Reactors Fixed bed, catalytic
233,600 kg/hr (515,000 lb/hr) 204°C (400°F)
3.0 MPa (440 psia)
234,500 kg/hr (517,000 lb/hr) 204°C (400°F)
3.0 MPa (440 psia)
4 (0)
2 Shift Reactor Heat Recovery Exchangers
Shell and Tube
Exchanger 1: 45 GJ/hr
(43 MMBtu/hr) Exchanger 2:
363 GJ/hr (344 MMBtu/hr)
Exchanger 1: 43 GJ/hr
(45 MMBtu/hr) Exchanger 2:
364 GJ/hr (345 MMBtu/hr)
4 (0)
3 Acid Gas Removal Plant-Syngas Stream
Proprietary MDEA Process
233,600 kg/hr (515,000 lb/hr) 39°C (103°F)
2.8 MPa (405 psia)
234,500 kg/hr (517,000 lb/hr) 39°C (103°F)
2.8 MPa (405 psia)
2 (0)
4 Pressure Swing Adsorber
Polybed Proprietary
32,990 kg/hr (72,735 lb/hr) Syngas
38°C (100°F) 2.7 MPa (390. psia)
14,130 kg/hr (31,150 lb/hr)
Hydrogen 38°C (100°F)
2.6 MPa (380. psia) 18,860 kg/hr
(41,585 lb/hr) Off Gas 38°C (100°F)
0.1 MPa (20. psia)
33,146 kg/hr (73,075 lb/hr) Syngas
38°C (100°F) 2.7 MPa (390. psia)
14,184 kg/hr (31,270 lb/hr)
Hydrogen 38°C (100°F)
2.6 MPa (380. psia) 18,960 kg/hr
(41,805 lb/hr) Off Gas 38°C (100°F)
0.1 MPa (20. psia)
2 (0)
5 Acid Gas Removal Plant-Stack Gas
Proprietary MEA Process
435,450 kg/hr (960,000 lb/hr)
stack gas, 0.1 MPa (15 psia), 90% CO2 removal
437,260 kg/hr (964,000 lb/hr)
stack gas, 0.1 MPa (15 psia), 90% CO2 removal
2 (0)
ACCOUNT 3B - CO2 COMPRESSION
Equip-ment No.
Description Type Case 1-1 Design Condition
Case 1-2 Design Condition
Oper Qty.
(Spares)
1 CO2 Compressor
Integrally geared, multi-stage centrifugal
564 m3/min @
15.3 MPa (19,900 scfm @
2,215 psia)
566 m3/min @
15.3 MPa (20,000 scfm @
2,215 psia)
4 (1)
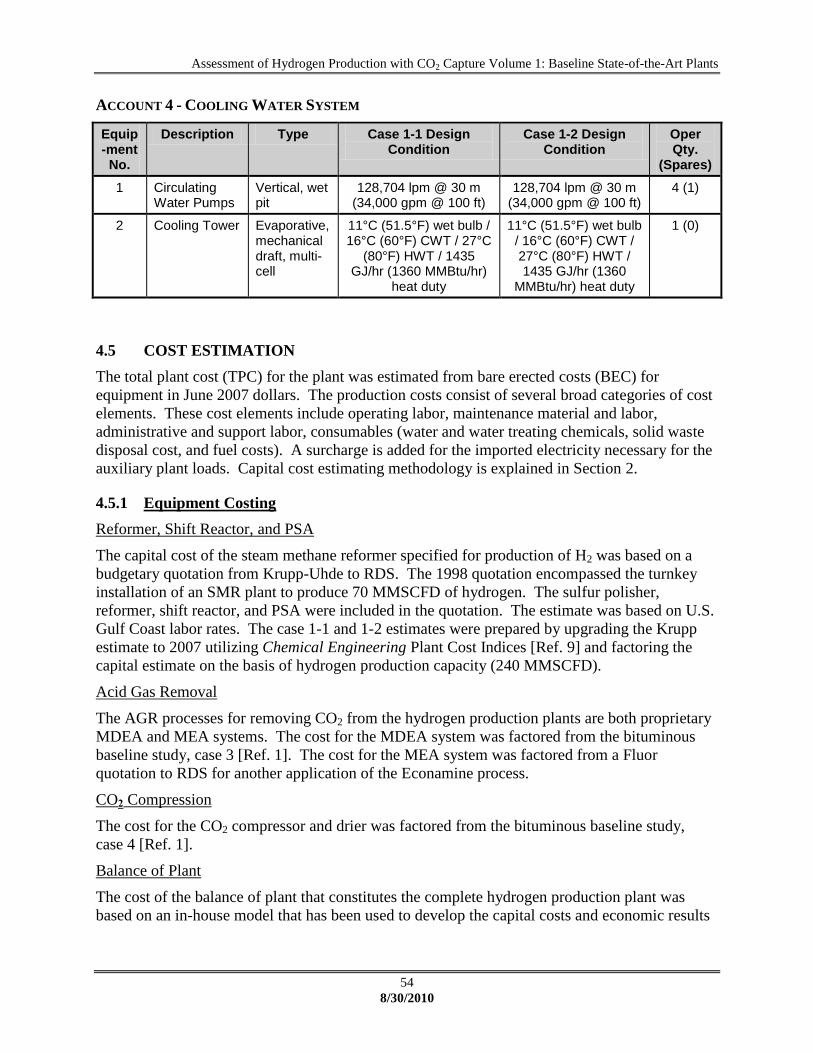
Assessment of Hydrogen Production with CO2 Capture Volume 1: Baseline State-of-the-Art Plants
54
8/30/2010
ACCOUNT 4 - COOLING WATER SYSTEM
Equip-ment No.
Description Type Case 1-1 Design Condition
Case 1-2 Design Condition
Oper Qty.
(Spares)
1 Circulating Water Pumps
Vertical, wet pit
128,704 lpm @ 30 m (34,000 gpm @ 100 ft)
128,704 lpm @ 30 m (34,000 gpm @ 100 ft)
4 (1)
2 Cooling Tower Evaporative, mechanical draft, multi-cell
11°C (51.5°F) wet bulb / 16°C (60°F) CWT / 27°C
(80°F) HWT / 1435 GJ/hr (1360 MMBtu/hr)
heat duty
11°C (51.5°F) wet bulb / 16°C (60°F) CWT / 27°C (80°F) HWT / 1435 GJ/hr (1360
MMBtu/hr) heat duty
1 (0)
4.5 COST ESTIMATION
The total plant cost (TPC) for the plant was estimated from bare erected costs (BEC) for
equipment in June 2007 dollars. The production costs consist of several broad categories of cost
elements. These cost elements include operating labor, maintenance material and labor,
administrative and support labor, consumables (water and water treating chemicals, solid waste
disposal cost, and fuel costs). A surcharge is added for the imported electricity necessary for the
auxiliary plant loads. Capital cost estimating methodology is explained in Section 2.
4.5.1 Equipment Costing
Reformer, Shift Reactor, and PSA
The capital cost of the steam methane reformer specified for production of H2 was based on a
budgetary quotation from Krupp-Uhde to RDS. The 1998 quotation encompassed the turnkey
installation of an SMR plant to produce 70 MMSCFD of hydrogen. The sulfur polisher,
reformer, shift reactor, and PSA were included in the quotation. The estimate was based on U.S.
Gulf Coast labor rates. The case 1-1 and 1-2 estimates were prepared by upgrading the Krupp
estimate to 2007 utilizing Chemical Engineering Plant Cost Indices [Ref. 9] and factoring the
capital estimate on the basis of hydrogen production capacity (240 MMSCFD).
Acid Gas Removal
The AGR processes for removing CO2 from the hydrogen production plants are both proprietary
MDEA and MEA systems. The cost for the MDEA system was factored from the bituminous
baseline study, case 3 [Ref. 1]. The cost for the MEA system was factored from a Fluor
quotation to RDS for another application of the Econamine process.
CO2 Compression
The cost for the CO2 compressor and drier was factored from the bituminous baseline study,
case 4 [Ref. 1].
Balance of Plant
The cost of the balance of plant that constitutes the complete hydrogen production plant was
based on an in-house model that has been used to develop the capital costs and economic results

Assessment of Hydrogen Production with CO2 Capture Volume 1: Baseline State-of-the-Art Plants
55
8/30/2010
for many process applications. The costs attributed to balance of plant components amount to 15
percent of the installed plant equipment cost.
Contingency
A 20 percent project contingency was added to all equipment capital cost accounts for this case.
Project contingencies were added to cover project uncertainty and the cost of additional
equipment that could result from a more detailed design. The project contingencies represent
costs that are expected to occur. A 20 percent process contingency was added for the CO2
removal systems for this case based on the relative unproven status of the technologies at
commercial scale for power plant and hydrogen production applications.
4.5.2 O&M Costs
Fixed and variable operating costs were estimated for each case. The natural gas price used for
this study was $6.21/GJ ($6.55/MMBtu) on a HHV basis. All other consumable costs were
assumed to match those used in the baseline reference report [Ref. 1]. An emissions value of
$30/tonne of CO2 emitted was also applied to reflect potential environmental regulations. A
value of $105/MWh was applied for the power requirements for each case. This value is
consistent with the cost of electricity (COE) generated in an environment where coal-based
power plants are built with carbon capture and sequestration systems.
4.5.3 Cost Estimation Results
The total overnight cost (TOC) for the case 1-1 plant producing 242 MMSCFD (617 metric tons)
of hydrogen (99.6 percent H2 by volume) per day from natural gas with CO2 capture is estimated
to be $611.2 million in June 2007 dollars resulting in a first year cost of hydrogen (COH) of
$2.07/kg H2 for this case of hydrogen production from natural gas with CO2 capture.
Exhibit 4-12 and Exhibit 4-13 show the capital and operating costs for this SMR plant.
The TOC for the case 1-2 plant producing 243 MMSCFD (619 metric tons) of hydrogen
(99.6 percent H2 by volume) per day from natural gas with CO2 capture is estimated to be
$612.6 million in June 2007 dollars resulting in a COH of $2.07/kg H2 for this case also.
Exhibit 4-14 and Exhibit 4-15 show the capital and operating costs for this SMR plant.
The additional cost of CO2 TS&M is estimated to be $0.09/kg H2 for both cases bringing the
total COH with CO2 capture to $2.16/kg H2. The additional costs for CO2 TS&M are shown in
Exhibit 4-16.
The small differences in the scale of the two plants are reflected in the consistency of the final
COH values between these two cases.
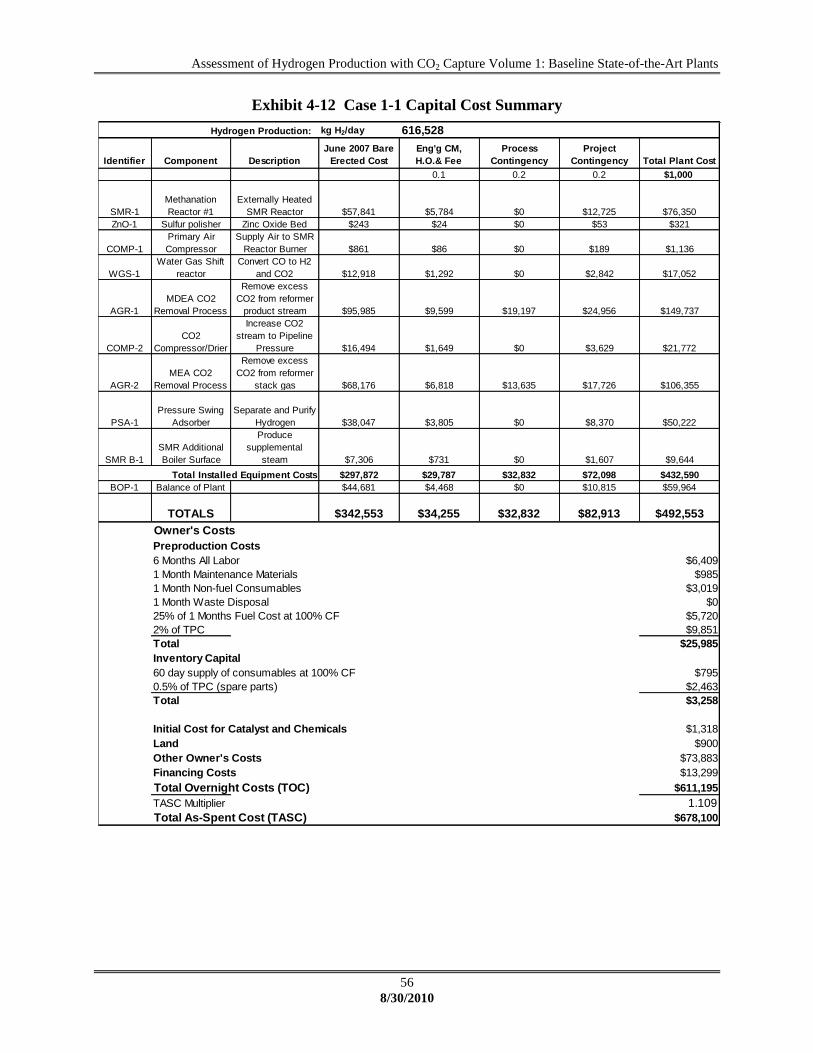
Assessment of Hydrogen Production with CO2 Capture Volume 1: Baseline State-of-the-Art Plants
56
8/30/2010
Exhibit 4-12 Case 1-1 Capital Cost Summary
kg H2/day
Identifier Component Description
June 2007 Bare
Erected Cost
Eng'g CM,
H.O.& Fee
Process
Contingency
Project
Contingency Total Plant Cost
0.1 0.2 0.2 $1,000
SMR-1
Methanation
Reactor #1
Externally Heated
SMR Reactor $57,841 $5,784 $0 $12,725 $76,350
ZnO-1 Sulfur polisher Zinc Oxide Bed $243 $24 $0 $53 $321
COMP-1
Primary Air
Compressor
Supply Air to SMR
Reactor Burner $861 $86 $0 $189 $1,136
WGS-1
Water Gas Shift
reactor
Convert CO to H2
and CO2 $12,918 $1,292 $0 $2,842 $17,052
AGR-1
MDEA CO2
Removal Process
Remove excess
CO2 from reformer
product stream $95,985 $9,599 $19,197 $24,956 $149,737
COMP-2
CO2
Compressor/Drier
Increase CO2
stream to Pipeline
Pressure $16,494 $1,649 $0 $3,629 $21,772
AGR-2
MEA CO2
Removal Process
Remove excess
CO2 from reformer
stack gas $68,176 $6,818 $13,635 $17,726 $106,355
PSA-1
Pressure Swing
Adsorber
Separate and Purify
Hydrogen $38,047 $3,805 $0 $8,370 $50,222
SMR B-1
SMR Additional
Boiler Surface
Produce
supplemental
steam $7,306 $731 $0 $1,607 $9,644
$297,872 $29,787 $32,832 $72,098 $432,590
BOP-1 Balance of Plant $44,681 $4,468 $0 $10,815 $59,964
TOTALS $342,553 $34,255 $32,832 $82,913 $492,553
Owner's Costs
Preproduction Costs
6 Months All Labor $6,409
1 Month Maintenance Materials $985
1 Month Non-fuel Consumables $3,019
1 Month Waste Disposal $0
25% of 1 Months Fuel Cost at 100% CF $5,720
2% of TPC $9,851
Total $25,985
Inventory Capital
60 day supply of consumables at 100% CF $795
0.5% of TPC (spare parts) $2,463
Total $3,258
Initial Cost for Catalyst and Chemicals $1,318
Land $900
Other Owner's Costs $73,883
Financing Costs $13,299
Total Overnight Costs (TOC) $611,195
TASC Multiplier 1.109
Total As-Spent Cost (TASC) $678,100
Hydrogen Production: 616,528
Total Installed Equipment Costs
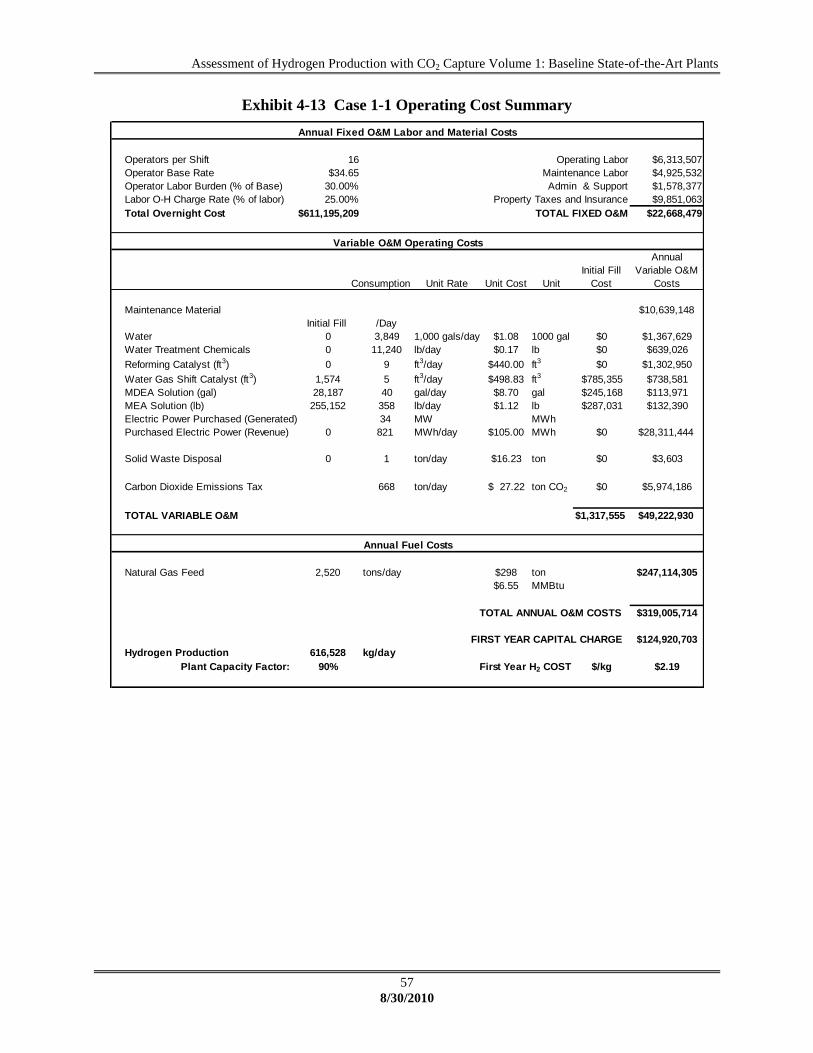
Assessment of Hydrogen Production with CO2 Capture Volume 1: Baseline State-of-the-Art Plants
57
8/30/2010
Exhibit 4-13 Case 1-1 Operating Cost Summary
Operators per Shift 16 Operating Labor $6,313,507
Operator Base Rate $34.65 Maintenance Labor $4,925,532
Operator Labor Burden (% of Base) 30.00% Admin & Support $1,578,377
Labor O-H Charge Rate (% of labor) 25.00% Property Taxes and Insurance $9,851,063
Total Overnight Cost $611,195,209 TOTAL FIXED O&M $22,668,479
Consumption Unit Rate Unit Cost Unit
Initial Fill
Cost
Annual
Variable O&M
Costs
Maintenance Material $10,639,148
Initial Fill /Day
Water 0 3,849 1,000 gals/day $1.08 1000 gal $0 $1,367,629
Water Treatment Chemicals 0 11,240 lb/day $0.17 lb $0 $639,026
Reforming Catalyst (ft3) 0 9 ft3/day $440.00 ft3 $0 $1,302,950
Water Gas Shift Catalyst (ft3) 1,574 5 ft3/day $498.83 ft3 $785,355 $738,581
MDEA Solution (gal) 28,187 40 gal/day $8.70 gal $245,168 $113,971
MEA Solution (lb) 255,152 358 lb/day $1.12 lb $287,031 $132,390
Electric Power Purchased (Generated) 34 MW MWh
Purchased Electric Power (Revenue) 0 821 MWh/day $105.00 MWh $0 $28,311,444
Solid Waste Disposal 0 1 ton/day $16.23 ton $0 $3,603
Carbon Dioxide Emissions Tax 668 ton/day 27.22$ ton CO2 $0 $5,974,186
TOTAL VARIABLE O&M $1,317,555 $49,222,930
Natural Gas Feed 2,520 tons/day $298 ton $247,114,305
$6.55 MMBtu
TOTAL ANNUAL O&M COSTS $319,005,714
FIRST YEAR CAPITAL CHARGE $124,920,703
Hydrogen Production 616,528 kg/day
Plant Capacity Factor: 90% First Year H2 COST $/kg $2.19
Variable O&M Operating Costs
Annual Fixed O&M Labor and Material Costs
Annual Fuel Costs

Assessment of Hydrogen Production with CO2 Capture Volume 1: Baseline State-of-the-Art Plants
58
8/30/2010
Exhibit 4-14 Case 1-2 Capital Cost Summary
kg H2/day
Identifier Component Description
June 2007 Bare
Erected Cost
Eng'g CM,
H.O.& Fee
Process
Contingency
Project
Contingency Total Plant Cost
0.1 0.2 0.2 $1,000
SMR-1
Methanation
Reactor #1
Externally Heated
SMR Reactor $57,976 $5,798 $0 $12,755 $76,528
ZnO-1 Sulfur polisher Zinc Oxide Bed $244 $24 $0 $54 $322
COMP-1
Primary Air
Compressor
Supply Air to SMR
Reactor Burner $863 $86 $0 $190 $1,139
WGS-1
Water Gas Shift
reactor
Convert CO to H2
and CO2 $12,949 $1,295 $0 $2,849 $17,092
AGR-1
MDEA CO2
Removal Process
Remove excess
CO2 from reformer
product stream $96,210 $9,621 $19,242 $25,015 $150,088
COMP-2
CO2
Compressor/Drier
Increase CO2
stream to Pipeline
Pressure $16,533 $1,653 $0 $3,637 $21,823
AGR-2
MEA CO2
Removal Process
Remove excess
CO2 from reformer
stack gas $68,336 $6,834 $13,667 $17,767 $106,604
PSA-1
Pressure Swing
Adsorber
Separate and Purify
Hydrogen $38,136 $3,814 $0 $8,390 $50,340
SMR B-1
SMR Additional
Boiler Surface
Produce
supplemental
steam $7,323 $732 $0 $1,611 $9,667
$298,569 $29,857 $32,909 $72,267 $433,602
BOP-1 Balance of Plant $44,785 $4,479 $0 $10,840 $60,104
TOTALS $343,355 $34,335 $32,909 $83,107 $493,706
Owner's Costs
Preproduction Costs
6 Months All Labor $6,414
1 Month Maintenance Materials $987
1 Month Non-fuel Consumables $3,031
1 Month Waste Disposal $0
25% of 1 Months Fuel Cost at 100% CF $5,743
2% of TPC $9,874
Total $26,050
Inventory Capital
60 day supply of consumables at 100% CF $798
0.5% of TPC (spare parts) $2,469
Total $3,267
Initial Cost for Catalyst and Chemicals $1,323
Land $900
Other Owner's Costs $74,056
Financing Costs $13,330
Total Overnight Costs (TOC) $612,632
TASC Multiplier 1.109
Total As-Spent Cost (TASC) $679,694
Hydrogen Production: 618,936
Total Installed Equipment Costs

Assessment of Hydrogen Production with CO2 Capture Volume 1: Baseline State-of-the-Art Plants
59
8/30/2010
Exhibit 4-15 Case 1-2 Operating Cost Summary
Operators per Shift 16 Operating Labor $6,313,507
Operator Base Rate $34.65 Maintenance Labor $4,937,064
Operator Labor Burden (% of Base) 30.00% Admin & Support $1,578,377
Labor O-H Charge Rate (% of labor) 25.00% Property Taxes and Insurance $9,874,127
Total Overnight Cost $612,632,020 TOTAL FIXED O&M $22,703,075
Consumption Unit Rate Unit Cost Unit
Initial Fill
Cost
Annual
Variable O&M
Costs
Maintenance Material $10,664,058
Initial Fill /Day
Water 0 3,864 1,000 gals/day $1.08 1000 gal $0 $1,373,004
Water Treatment Chemicals 0 11,280 lb/day $0.17 lb $0 $641,300
Reforming Catalyst (ft3) 0 9 ft3/day $440.00 ft3 $0 $1,308,038
Water Gas Shift Catalyst (ft3) 1,581 5 ft3/day $498.83 ft3 $788,422 $741,466
MDEA Solution (gal) 28,298 40 gal/day $8.70 gal $246,125 $114,416
MEA Solution (lb) 256,148 360 lb/day $1.12 lb $288,152 $132,907
Electric Power Purchased (Generated) 34 MW MWh
Purchased Electric Power (Revenue) 0 824 MWh/day $105.00 MWh $0 $28,419,061
Solid Waste Disposal 0 1 ton/day $16.23 ton $0 $3,618
Carbon Dioxide Emissions Tax 671 ton/day 27.22$ ton CO2 $0 $5,998,070
TOTAL VARIABLE O&M $1,322,700 $49,395,938
Natural Gas Feed 2,530 tons/day $298 ton $248,102,221
$6.55 MMBtu
TOTAL ANNUAL O&M COSTS $320,201,234
FIRST YEAR CAPITAL CHARGE $125,214,495
Hydrogen Production 618,936 kg/day
Plant Capacity Factor: 90% First Year H2 COST $/kg $2.19
Annual Fixed O&M Labor and Material Costs
Variable O&M Operating Costs
Annual Fuel Costs
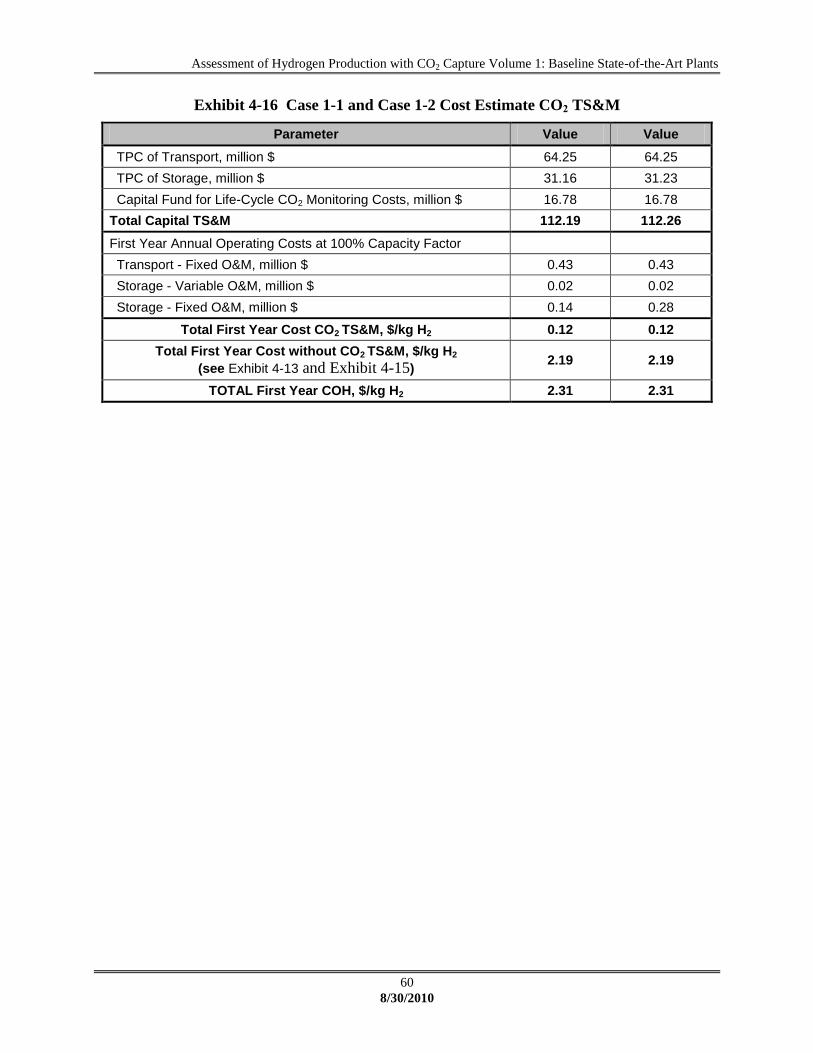
Assessment of Hydrogen Production with CO2 Capture Volume 1: Baseline State-of-the-Art Plants
60
8/30/2010
Exhibit 4-16 Case 1-1 and Case 1-2 Cost Estimate CO2 TS&M
Parameter Value Value
TPC of Transport, million $ 64.25 64.25
TPC of Storage, million $ 31.16 31.23
Capital Fund for Life-Cycle CO2 Monitoring Costs, million $ 16.78 16.78
Total Capital TS&M 112.19 112.26
First Year Annual Operating Costs at 100% Capacity Factor
Transport - Fixed O&M, million $ 0.43 0.43
Storage - Variable O&M, million $ 0.02 0.02
Storage - Fixed O&M, million $ 0.14 0.28
Total First Year Cost CO2 TS&M, $/kg H2 0.12 0.12
Total First Year Cost without CO2 TS&M, $/kg H2
(see Exhibit 4-13 and Exhibit 4-15) 2.19 2.19
TOTAL First Year COH, $/kg H2 2.31 2.31

Assessment of Hydrogen Production with CO2 Capture Volume 1: Baseline State-of-the-Art Plants
61
8/30/2010
5. CASES 2-1 AND 2-2 RESULTS: COAL GASIFICATION WITH H2 SEPARATION
BY PSA
Certain design considerations that represent a change in the original scope of work for the
baseline cases are presented in this section of the report. Changes to the scope of work from the
original H2A basis as requested in technical direction from NETL include: changing the design
coal to Illinois #6, expanding the plant capacity to two gasifiers, adjusting the radiant cooler
outlet temperature to 1250°F, and increasing the scrubber/quench blowdown to appropriately
limit chloride concentration. Also, the form of recovered sulfur was changed from sulfuric acid
to elemental sulfur. As appropriate, these changes are discussed below.
GE Energy Gasifier
Case 2-1 Radiant-Only: The original H2A design was based on a plant utilizing the E-Gas
gasifier which has a relatively low operating pressure. This approach was satisfactory for
applications which do not require high pressure syngas applications downstream. Future
advanced cases to be evaluated will utilize membrane separations for hydrogen recovery that
operate more effectively at higher pressure. For this reason, the revised plant design features the
GE Energy slurry fed gasifier in the radiant-only mode. In this mode, the hot gas from the
gasifier outlet is cooled in a radiant syngas cooler to 1,250°F before flowing through a water-
filled quench chamber. This gasifier is offered commercially to operate at pressures greater than
900 psia.
Case 2-2 Full Quench: Case 2-1 was based on the GEE radiant-only gasifier which produced
high pressure steam for power production, albeit at a higher capital cost. Case 2-2 differs from
case 2-1 by eliminating the radiant cooler and is based on the GEE gasification technology with
the quench gasifier option operating at approximately 965 psia. In this mode, the hot gas from
the gasifier outlet is cooled by flowing through a water-filled quench chamber without raising
high pressure steam. The objective of this case is to test the assumption that this configuration
will not produce enough power to supply auxiliary loads.
CO2 Recovery
Previous H2A designs fired the off-gas from the PSA with oxygen in an oxy-combustion mode
to recover maximum CO2 from the plant. The design utilized shift reactors which had a CO
conversion of about 75 percent and it was necessary to fire the PSA off-gas with oxygen to
recover the CO2 and achieve the 90 percent recovery target. The more recent designs utilize
equilibrium shift reactors in series to achieve CO conversions in the 80 percent range. As such,
the syngas contains sufficient CO2 from both the raw gas and the shift reaction to achieve the
90 percent recovery target without firing the off-gas in an oxy-combustion mode.
Recovery of elemental sulfur, rather than H2SO4
The original H2A design produced sulfuric acid as a byproduct. Since sulfur is less expensive to
produce and transport, the revised design for this plant and subsequent plants in this series will
produce elemental sulfur as a byproduct.
Limit chloride concentration
Case 2-1 Radiant-Only: The high chlorine content of Illinois No. 6 coal (0.29 percent as
received) raises concern over potential chloride corrosion in the quench chamber and
downstream piping. The shift catalyst is not affected by the presence of chloride or sulfur. The

Assessment of Hydrogen Production with CO2 Capture Volume 1: Baseline State-of-the-Art Plants
62
8/30/2010
raw syngas leaves the gasifier syngas cooler and enters the quench chamber at 1,250°F with a
hydrogen chloride (HCl) concentration of 768 ppmv. 756,000 lb/hr of water enters the quench
chamber and 378,000 lb/hr of water are evaporated to the gas while cooling the gas to 415°F.
95 percent of the chloride is removed from the syngas in the quench chamber, necessitating a
high water flow rate to achieve an equilibrium HCl concentration of 794 ppmw to avoid quench
chamber material issues. The remaining chloride in the syngas eventually drops out with
condensed water downstream. A total of 472,000 lb/hr knockout from the downstream
condensers is recycled back to the quench chamber to augment the quench inventory to control
chloride concentration.
Case 2-2 Full Quench: The raw syngas leaves the gasifier and enters the quench chamber at
2,250°F with a hydrogen chloride (HCl) concentration of 768 ppmv. 1,665,000 lb/hr of water
enters the quench chamber and 878,000 lb/hr of water are evaporated to the gas while cooling the
gas to 520°F. 95 percent of the chloride is removed from the syngas in the quench chamber,
necessitating a high water flow rate to achieve an equilibrium HCl concentration of 804 ppmw to
avoid quench chamber material issues. The remaining chloride in the syngas eventually drops
out with condensed water downstream. A total of 1,031,000 lb/hr knockout from the
downstream condensers is recycled back to the quench chamber to augment the quench
inventory to control chloride concentration.
The quench outlet streams are sent to a treatment plant where calcium hydroxide is used to
precipitate calcium chloride as a byproduct. The stream then goes to a sour water stripper and
the stripper bottoms are recycled to satisfy the water makeup for the quench.
A block flow diagram of the case 2-1 process is shown in Exhibit 5-1 with the corresponding
stream table shown in Exhibit 5-2.
A block flow diagram of the case 2-2 process is shown in Exhibit 5-3 with the corresponding
stream table shown in Exhibit 5-4.

Assessment of Hydrogen Production with CO2 Capture Volume 1: Baseline State-of-the-Art Plants
63
8/30/2010
Exhibit 5-1 Case 2-1 Block Flow Diagram: Baseline Coal to Hydrogen with CO2 Capture
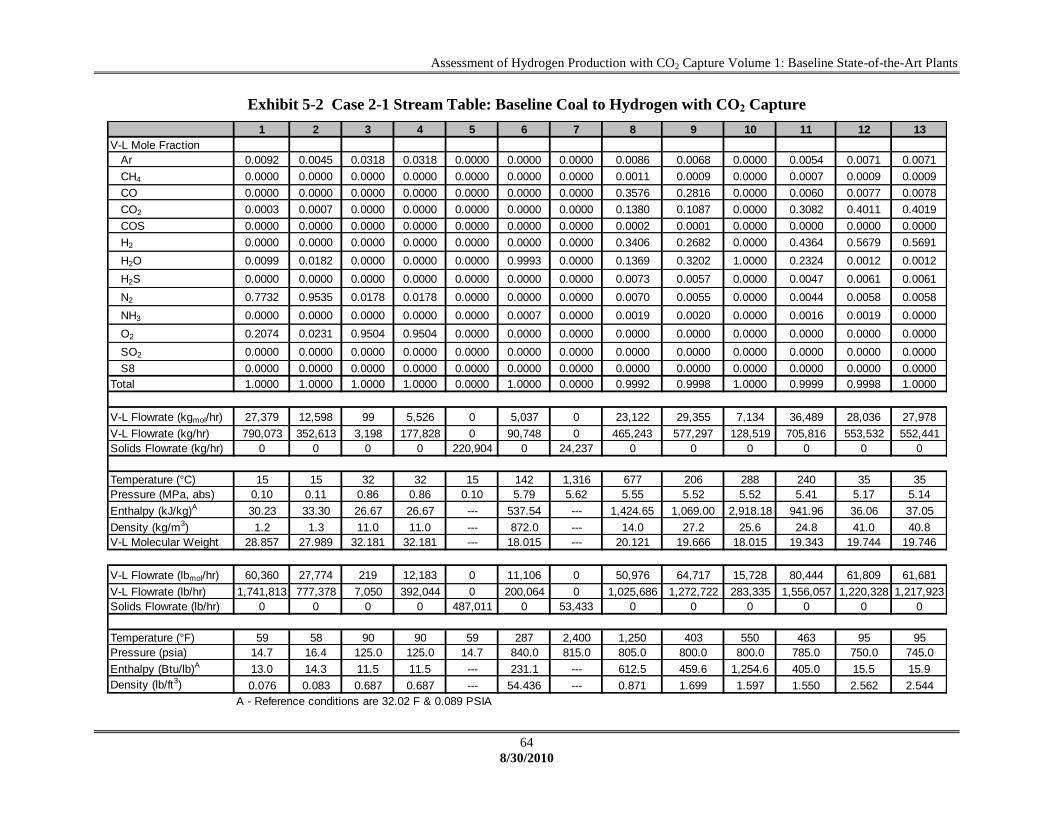
Assessment of Hydrogen Production with CO2 Capture Volume 1: Baseline State-of-the-Art Plants
64
8/30/2010
Exhibit 5-2 Case 2-1 Stream Table: Baseline Coal to Hydrogen with CO2 Capture
1 2 3 4 5 6 7 8 9 10 11 12 13
V-L Mole Fraction
Ar 0.0092 0.0045 0.0318 0.0318 0.0000 0.0000 0.0000 0.0086 0.0068 0.0000 0.0054 0.0071 0.0071
CH4 0.0000 0.0000 0.0000 0.0000 0.0000 0.0000 0.0000 0.0011 0.0009 0.0000 0.0007 0.0009 0.0009
CO 0.0000 0.0000 0.0000 0.0000 0.0000 0.0000 0.0000 0.3576 0.2816 0.0000 0.0060 0.0077 0.0078
CO2 0.0003 0.0007 0.0000 0.0000 0.0000 0.0000 0.0000 0.1380 0.1087 0.0000 0.3082 0.4011 0.4019
COS 0.0000 0.0000 0.0000 0.0000 0.0000 0.0000 0.0000 0.0002 0.0001 0.0000 0.0000 0.0000 0.0000
H2 0.0000 0.0000 0.0000 0.0000 0.0000 0.0000 0.0000 0.3406 0.2682 0.0000 0.4364 0.5679 0.5691
H2O 0.0099 0.0182 0.0000 0.0000 0.0000 0.9993 0.0000 0.1369 0.3202 1.0000 0.2324 0.0012 0.0012
H2S 0.0000 0.0000 0.0000 0.0000 0.0000 0.0000 0.0000 0.0073 0.0057 0.0000 0.0047 0.0061 0.0061
N2 0.7732 0.9535 0.0178 0.0178 0.0000 0.0000 0.0000 0.0070 0.0055 0.0000 0.0044 0.0058 0.0058
NH3 0.0000 0.0000 0.0000 0.0000 0.0000 0.0007 0.0000 0.0019 0.0020 0.0000 0.0016 0.0019 0.0000
O2 0.2074 0.0231 0.9504 0.9504 0.0000 0.0000 0.0000 0.0000 0.0000 0.0000 0.0000 0.0000 0.0000
SO2 0.0000 0.0000 0.0000 0.0000 0.0000 0.0000 0.0000 0.0000 0.0000 0.0000 0.0000 0.0000 0.0000
S8 0.0000 0.0000 0.0000 0.0000 0.0000 0.0000 0.0000 0.0000 0.0000 0.0000 0.0000 0.0000 0.0000
Total 1.0000 1.0000 1.0000 1.0000 0.0000 1.0000 0.0000 0.9992 0.9998 1.0000 0.9999 0.9998 1.0000
V-L Flowrate (kgmol/hr) 27,379 12,598 99 5,526 0 5,037 0 23,122 29,355 7,134 36,489 28,036 27,978
V-L Flowrate (kg/hr) 790,073 352,613 3,198 177,828 0 90,748 0 465,243 577,297 128,519 705,816 553,532 552,441
Solids Flowrate (kg/hr) 0 0 0 0 220,904 0 24,237 0 0 0 0 0 0
Temperature (°C) 15 15 32 32 15 142 1,316 677 206 288 240 35 35
Pressure (MPa, abs) 0.10 0.11 0.86 0.86 0.10 5.79 5.62 5.55 5.52 5.52 5.41 5.17 5.14
Enthalpy (kJ/kg)A 30.23 33.30 26.67 26.67 --- 537.54 --- 1,424.65 1,069.00 2,918.18 941.96 36.06 37.05
Density (kg/m3) 1.2 1.3 11.0 11.0 --- 872.0 --- 14.0 27.2 25.6 24.8 41.0 40.8
V-L Molecular Weight 28.857 27.989 32.181 32.181 --- 18.015 --- 20.121 19.666 18.015 19.343 19.744 19.746
V-L Flowrate (lbmol/hr) 60,360 27,774 219 12,183 0 11,106 0 50,976 64,717 15,728 80,444 61,809 61,681
V-L Flowrate (lb/hr) 1,741,813 777,378 7,050 392,044 0 200,064 0 1,025,686 1,272,722 283,335 1,556,057 1,220,328 1,217,923
Solids Flowrate (lb/hr) 0 0 0 0 487,011 0 53,433 0 0 0 0 0 0
Temperature (°F) 59 58 90 90 59 287 2,400 1,250 403 550 463 95 95
Pressure (psia) 14.7 16.4 125.0 125.0 14.7 840.0 815.0 805.0 800.0 800.0 785.0 750.0 745.0
Enthalpy (Btu/lb)A 13.0 14.3 11.5 11.5 --- 231.1 --- 612.5 459.6 1,254.6 405.0 15.5 15.9
Density (lb/ft3) 0.076 0.083 0.687 0.687 --- 54.436 --- 0.871 1.699 1.597 1.550 2.562 2.544
A - Reference conditions are 32.02 F & 0.089 PSIA
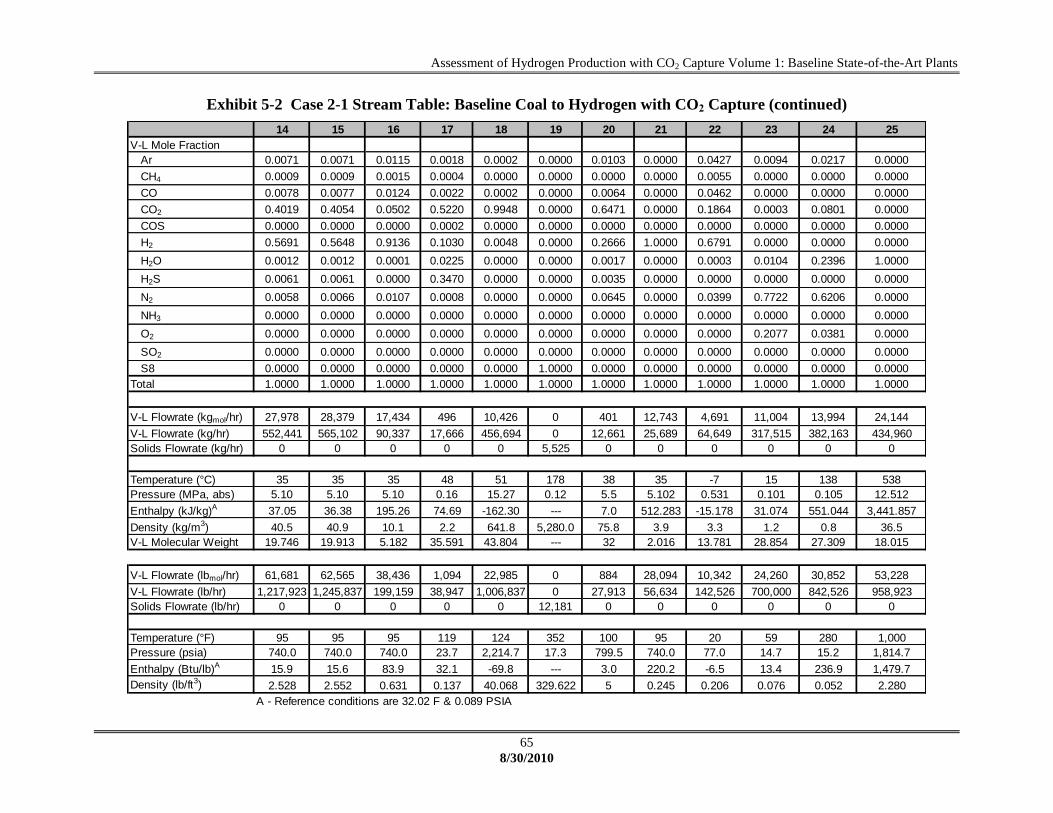
Assessment of Hydrogen Production with CO2 Capture Volume 1: Baseline State-of-the-Art Plants
65
8/30/2010
Exhibit 5-2 Case 2-1 Stream Table: Baseline Coal to Hydrogen with CO2 Capture (continued)
14 15 16 17 18 19 20 21 22 23 24 25
V-L Mole Fraction
Ar 0.0071 0.0071 0.0115 0.0018 0.0002 0.0000 0.0103 0.0000 0.0427 0.0094 0.0217 0.0000
CH4 0.0009 0.0009 0.0015 0.0004 0.0000 0.0000 0.0000 0.0000 0.0055 0.0000 0.0000 0.0000
CO 0.0078 0.0077 0.0124 0.0022 0.0002 0.0000 0.0064 0.0000 0.0462 0.0000 0.0000 0.0000
CO2 0.4019 0.4054 0.0502 0.5220 0.9948 0.0000 0.6471 0.0000 0.1864 0.0003 0.0801 0.0000
COS 0.0000 0.0000 0.0000 0.0002 0.0000 0.0000 0.0000 0.0000 0.0000 0.0000 0.0000 0.0000
H2 0.5691 0.5648 0.9136 0.1030 0.0048 0.0000 0.2666 1.0000 0.6791 0.0000 0.0000 0.0000
H2O 0.0012 0.0012 0.0001 0.0225 0.0000 0.0000 0.0017 0.0000 0.0003 0.0104 0.2396 1.0000
H2S 0.0061 0.0061 0.0000 0.3470 0.0000 0.0000 0.0035 0.0000 0.0000 0.0000 0.0000 0.0000
N2 0.0058 0.0066 0.0107 0.0008 0.0000 0.0000 0.0645 0.0000 0.0399 0.7722 0.6206 0.0000
NH3 0.0000 0.0000 0.0000 0.0000 0.0000 0.0000 0.0000 0.0000 0.0000 0.0000 0.0000 0.0000
O2 0.0000 0.0000 0.0000 0.0000 0.0000 0.0000 0.0000 0.0000 0.0000 0.2077 0.0381 0.0000
SO2 0.0000 0.0000 0.0000 0.0000 0.0000 0.0000 0.0000 0.0000 0.0000 0.0000 0.0000 0.0000
S8 0.0000 0.0000 0.0000 0.0000 0.0000 1.0000 0.0000 0.0000 0.0000 0.0000 0.0000 0.0000
Total 1.0000 1.0000 1.0000 1.0000 1.0000 1.0000 1.0000 1.0000 1.0000 1.0000 1.0000 1.0000
V-L Flowrate (kgmol/hr) 27,978 28,379 17,434 496 10,426 0 401 12,743 4,691 11,004 13,994 24,144
V-L Flowrate (kg/hr) 552,441 565,102 90,337 17,666 456,694 0 12,661 25,689 64,649 317,515 382,163 434,960
Solids Flowrate (kg/hr) 0 0 0 0 0 5,525 0 0 0 0 0 0
Temperature (°C) 35 35 35 48 51 178 38 35 -7 15 138 538
Pressure (MPa, abs) 5.10 5.10 5.10 0.16 15.27 0.12 5.5 5.102 0.531 0.101 0.105 12.512
Enthalpy (kJ/kg)A 37.05 36.38 195.26 74.69 -162.30 --- 7.0 512.283 -15.178 31.074 551.044 3,441.857
Density (kg/m3) 40.5 40.9 10.1 2.2 641.8 5,280.0 75.8 3.9 3.3 1.2 0.8 36.5
V-L Molecular Weight 19.746 19.913 5.182 35.591 43.804 --- 32 2.016 13.781 28.854 27.309 18.015
V-L Flowrate (lbmol/hr) 61,681 62,565 38,436 1,094 22,985 0 884 28,094 10,342 24,260 30,852 53,228
V-L Flowrate (lb/hr) 1,217,923 1,245,837 199,159 38,947 1,006,837 0 27,913 56,634 142,526 700,000 842,526 958,923
Solids Flowrate (lb/hr) 0 0 0 0 0 12,181 0 0 0 0 0 0
Temperature (°F) 95 95 95 119 124 352 100 95 20 59 280 1,000
Pressure (psia) 740.0 740.0 740.0 23.7 2,214.7 17.3 799.5 740.0 77.0 14.7 15.2 1,814.7
Enthalpy (Btu/lb)A 15.9 15.6 83.9 32.1 -69.8 --- 3.0 220.2 -6.5 13.4 236.9 1,479.7
Density (lb/ft3) 2.528 2.552 0.631 0.137 40.068 329.622 5 0.245 0.206 0.076 0.052 2.280
A - Reference conditions are 32.02 F & 0.089 PSIA

Assessment of Hydrogen Production with CO2 Capture Volume 1: Baseline State-of-the-Art Plants
66
8/30/2010
Exhibit 5-3 Case 2-2 Block Flow Diagram: Baseline Coal to Hydrogen with CO2 Capture

Assessment of Hydrogen Production with CO2 Capture Volume 1: Baseline State-of-the-Art Plants
67
8/30/2010
Exhibit 5-4 Case 2-2 Stream Table: Baseline Coal to Hydrogen with CO2 Capture
1 2 3 4 5 6 7 8 9 10 11 12 13
V-L Mole Fraction
Ar 0.0092 0.0045 0.0318 0.0318 0.0000 0.0000 0.0000 0.0085 0.0052 0.0000 0.0052 0.0070 0.0070
CH4 0.0000 0.0000 0.0000 0.0000 0.0000 0.0000 0.0000 0.0012 0.0007 0.0000 0.0007 0.0010 0.0010
CO 0.0000 0.0000 0.0000 0.0000 0.0000 0.0000 0.0000 0.3590 0.2192 0.0000 0.0059 0.0080 0.0080
CO2 0.0003 0.0007 0.0000 0.0000 0.0000 0.0000 0.0000 0.1366 0.0836 0.0000 0.2970 0.3999 0.4010
COS 0.0000 0.0000 0.0000 0.0000 0.0000 0.0000 0.0000 0.0002 0.0001 0.0000 0.0000 0.0000 0.0000
H2 0.0000 0.0000 0.0000 0.0000 0.0000 0.0000 0.0000 0.3420 0.2088 0.0000 0.4221 0.5684 0.5699
H2O 0.0099 0.0183 0.0000 0.0000 0.0000 0.9995 0.0000 0.1355 0.4714 0.9995 0.2580 0.0012 0.0012
H2S 0.0000 0.0000 0.0000 0.0000 0.0000 0.0000 0.0000 0.0073 0.0045 0.0000 0.0046 0.0061 0.0061
N2 0.7732 0.9533 0.0178 0.0178 0.0000 0.0000 0.0000 0.0070 0.0043 0.0000 0.0043 0.0057 0.0058
NH3 0.0000 0.0000 0.0000 0.0000 0.0000 0.0005 0.0000 0.0019 0.0020 0.0005 0.0020 0.0025 0.0000
O2 0.2074 0.0232 0.9504 0.9504 0.0000 0.0000 0.0000 0.0000 0.0000 0.0000 0.0000 0.0000 0.0000
SO2 0.0000 0.0000 0.0000 0.0000 0.0000 0.0000 0.0000 0.0000 0.0000 0.0000 0.0000 0.0000 0.0000
S8 0.0000 0.0000 0.0000 0.0000 0.0000 0.0000 0.0000 0.0000 0.0000 0.0000 0.0000 0.0000 0.0000
Total 1.0000 1.0000 1.0000 1.0000 0.0000 1.0000 0.0000 0.9992 0.9999 1.0000 0.9999 0.9999 1.0000
V-L Flowrate (kgmol/hr) 27,248 12,467 107 5,491 0 5,037 0 23,117 37,845 22,116 37,845 28,106 28,032
V-L Flowrate (kg/hr) 786,301 348,938 3,451 176,711 0 90,741 0 464,105 729,291 398,414 729,291 553,834 552,497
Solids Flowrate (kg/hr) 0 0 0 0 220,889 0 24,235 0 0 0 0 0 0
Temperature (°C) 15 15 32 32 15 146 1,316 1,316 227 188 249 35 35
Pressure (MPa, abs) 0.10 0.11 0.86 0.86 0.10 5.79 5.62 5.62 5.58 8.27 5.45 5.21 5.17
Enthalpy (kJ/kg)A 30.23 33.30 26.67 26.67 --- 558.85 --- 2,632.17 1,485.52 764.86 1,022.09 36.21 36.96
Density (kg/m3) 1.2 1.3 11.0 11.0 --- 867.0 --- 8.5 25.9 816.7 24.5 41.2 41.0
V-L Molecular Weight 28.857 27.989 32.181 32.181 --- 18.015 --- 20.076 19.270 18.015 19.270 19.705 19.710
V-L Flowrate (lbmol/hr) 60,072 27,485 236 12,106 0 11,105 0 50,965 83,435 48,757 83,435 61,964 61,800
V-L Flowrate (lb/hr) 1,733,496 769,276 7,607 389,581 0 200,050 0 1,023,177 1,607,812 878,352 1,607,812 1,220,994 1,218,046
Solids Flowrate (lb/hr) 0 0 0 0 486,976 0 53,430 0 0 0 0 0 0
Temperature (°F) 59 58 90 90 59 295 2,400 2,400 440 371 481 95 95
Pressure (psia) 14.7 16.4 125.0 125.0 14.7 840.0 815.0 815.0 810.0 1,200.0 790.0 755.0 750.0
Enthalpy (Btu/lb)A 13.0 14.3 11.5 11.5 --- 240.3 --- 1,131.6 638.7 328.8 439.4 15.6 15.9
Density (lb/ft3) 0.076 0.083 0.687 0.687 --- 54.126 --- 0.529 1.616 50.988 1.528 2.574 2.557
A - Reference conditions are 32.02 F & 0.089 PSIA

Assessment of Hydrogen Production with CO2 Capture Volume 1: Baseline State-of-the-Art Plants
68
8/30/2010
Exhibit 5-4 Case 2-2 Stream Table: Baseline Coal to Hydrogen with CO2 Capture (continued)
14 15 16 17 18 19 20 21 22 23 24 25
V-L Mole Fraction
Ar 0.0070 0.0071 0.0114 0.0018 0.0002 0.0000 0.0104 0.0000 0.0422 0.0094 0.0216 0.0000
CH4 0.0010 0.0010 0.0015 0.0004 0.0001 0.0000 0.0000 0.0000 0.0056 0.0000 0.0000 0.0000
CO 0.0080 0.0080 0.0128 0.0023 0.0002 0.0000 0.0061 0.0000 0.0475 0.0000 0.0000 0.0000
CO2 0.4010 0.4042 0.0499 0.5191 0.9947 0.0000 0.6162 0.0000 0.1853 0.0003 0.0805 0.0000
COS 0.0000 0.0000 0.0000 0.0002 0.0000 0.0000 0.0000 0.0000 0.0000 0.0000 0.0000 0.0000
H2 0.5699 0.5655 0.9132 0.1028 0.0048 0.0000 0.2768 1.0000 0.6779 0.0000 0.0000 0.0000
H2O 0.0012 0.0012 0.0001 0.0220 0.0000 0.0000 0.0016 0.0000 0.0003 0.0104 0.2403 1.0000
H2S 0.0061 0.0062 0.0000 0.3505 0.0000 0.0000 0.0091 0.0000 0.0000 0.0000 0.0000 0.0000
N2 0.0058 0.0069 0.0111 0.0008 0.0000 0.0000 0.0799 0.0000 0.0412 0.7722 0.6204 0.0000
NH3 0.0000 0.0000 0.0000 0.0000 0.0000 0.0000 0.0000 0.0000 0.0000 0.0000 0.0000 0.0000
O2 0.0000 0.0000 0.0000 0.0000 0.0000 0.0000 0.0000 0.0000 0.0000 0.2077 0.0372 0.0000
SO2 0.0000 0.0000 0.0000 0.0000 0.0000 0.0000 0.0000 0.0000 0.0000 0.0000 0.0000 0.0000
S8 0.0000 0.0000 0.0000 0.0000 0.0000 1.0000 0.0000 0.0000 0.0000 0.0000 0.0000 0.0000
Total 1.0000 1.0000 1.0000 1.0000 1.0000 1.0000 1.0000 1.0000 1.0000 1.0000 1.0000 1.0000
V-L Flowrate (kgmol/hr) 28,032 28,455 17,511 499 10,423 0 423 12,793 4,718 11,004 14,011 12,980
V-L Flowrate (kg/hr) 552,497 565,529 90,833 17,752 456,545 0 13,033 25,789 65,044 317,515 382,558 233,831
Solids Flowrate (kg/hr) 0 0 0 0 0 5,540 0 0 0 0 0 0
Temperature (°C) 35 35 35 48 51 179 38 35 -7 15 138 538
Pressure (MPa, abs) 5.14 5.14 5.14 0.16 15.27 0.12 5.5 5.137 0.531 0.101 0.105 12.512
Enthalpy (kJ/kg)A 36.96 36.32 194.98 74.17 -162.26 --- 9.0 512.243 -15.188 31.074 552.341 3,441.857
Density (kg/m3) 40.7 41.1 10.2 2.2 641.7 5,277.8 73.4 3.9 3.3 1.2 0.8 36.5
V-L Molecular Weight 19.710 19.875 5.187 35.573 43.803 --- 31 2.016 13.787 28.854 27.305 18.015
V-L Flowrate (lbmol/hr) 61,800 62,732 38,605 1,100 22,978 0 932 28,204 10,401 24,260 30,888 28,615
V-L Flowrate (lb/hr) 1,218,046 1,246,778 200,252 39,136 1,006,510 0 28,732 56,855 143,397 700,000 843,397 515,508
Solids Flowrate (lb/hr) 0 0 0 0 0 12,214 0 0 0 0 0 0
Temperature (°F) 95 95 95 119 124 354 100 95 20 59 280 1,000
Pressure (psia) 745.0 745.0 745.0 23.7 2,214.7 17.3 799.5 745.0 77.0 14.7 15.2 1,814.7
Enthalpy (Btu/lb)A 15.9 15.6 83.8 31.9 -69.8 --- 3.9 220.2 -6.5 13.4 237.5 1,479.7
Density (lb/ft3) 2.540 2.564 0.636 0.137 40.059 329.483 5 0.246 0.206 0.076 0.052 2.280
A - Reference conditions are 32.02 F & 0.089 PSIA

Assessment of Hydrogen Production with CO2 Capture Volume 1: Baseline State-of-the-Art Plants
69
8/30/2010
5.1 COMPONENT TABLES
The component tables below contain general specifications and overall process data for the
major process component systems for cases 2-1 and 2-2.
GASIFIER
Case 2-1 2-2
Technology Type GE Energy Slurry Feed,
Oxygen Blown Radiant-Only
Gasifier
GE Energy Slurry Feed, Oxygen
Blown Quench Gasifier
Basis for Design and
Performance
Vendor furnished data –
upgrade from Polk IGCC
Vendor furnished data – upgrade
from Polk IGCC
Operating Conditions
Inlet – Coal
Inlet – Slurry Water
220,904 kg/hr (487,011 lb/hr)
Illinois No. 6
90,748 kg/hr (200,064 lb/hr) 5.8
MPa (840.0 psia), 142°C
(287°F) Slurry Water
220,889 kg/hr (486,976 lb/hr)
Illinois No. 6
90,741 kg/hr (200,050 lb/hr) 5.8
MPa (840.0 psia), 146°C (295°F)
Slurry Water
Operating Conditions
Outlet – Gas
465,243 kg/hr (1,025,686 lb/hr)
raw syngas
5.6 MPa (815.0 psia), 1,316°C
(2,400°F)
464,105 kg/hr (1,023,177 lb/hr)
raw syngas
5.6 MPa (815.0 psia), 1,316°C
(2,400°F)
Assumed or Specified
Performance
Characteristics
Operating pressure, slurry
concentration, oxygen/coal
ratio, cold gas efficiency,
carbon conversion, outlet
temperature and syngas
composition, all based on
proprietary information
provided by vendor
Operating pressure, slurry
concentration, oxygen/coal ratio,
cold gas efficiency, carbon
conversion, outlet temperature and
syngas composition, all based on
proprietary information provided
by vendor
Calculated
Performance
Characteristics
Overall heat and material
balance modeled from vendor
information
Overall heat and material balance
modeled from vendor information
Contaminant
Removed, %
N/A N/A
Assumptions
Regarding Anticipated
Application Issues
Gasifier performance is based
on projected technology
improvements beyond current
Polk IGCC operation.
Gasifier performance is based on
projected technology
improvements beyond current Polk
IGCC operation.

Assessment of Hydrogen Production with CO2 Capture Volume 1: Baseline State-of-the-Art Plants
70
8/30/2010
SYNGAS COOLER
Case 2-1 2-2
Technology Type High pressure radiant heat
exchanger followed with water
quench
N/A
Basis for Design
and Performance
Vendor data – future design
Operating
Conditions
Inlet – Gas
465,243 kg/hr (1,025,686 lb/hr)
raw syngas
5.6 MPa (815.0 psia), 1,316°C
(2,400°F)
Operating
Conditions
Outlet – Gas
465,243 kg/hr (1,025,686 lb/hr)
raw syngas
5.6 MPa (805.0 psia), 677°C
(1,250°F)
Assumed or
Specified
Performance
Characteristics
BFW pressure based on design
IGCC
Calculated
Performance
Characteristics
Steam generation 562 GJ/hr
(532 MMBtu/hr) calculated from
syngas flow and temperatures
Contaminant
Removed, %
N/A
Assumptions
Regarding
Anticipated
Application Issues
Commercial gasifier-based

Assessment of Hydrogen Production with CO2 Capture Volume 1: Baseline State-of-the-Art Plants
71
8/30/2010
GASIFIER QUENCH AND SYNGAS SCRUBBER
Case 2-1 2-2
Technology Type Gasifier Quench Chamber and
Counter-Current Spray Tower
Gasifier Quench Chamber and
Counter-Current Spray Tower
Basis for Design
and Performance
Vendor data – future design Vendor data – future design
Operating
Conditions
Inlet – Gas
465,243 kg/hr (1,025,686 lb/hr)
raw syngas
5.6 MPa (805.0 psia), 677°C
(1,250°F)
464,105 kg/hr (1,023,177 lb/hr)
raw syngas
5.6 MPa (815.0 psia), 1,316°C
(2,400°F)
Operating
Conditions
Outlet – Gas
636,837 kg/hr (1,403,986 lb/hr)
raw syngas
5.6 MPa (805.0 psia), 232°C
(450°F)
862,519 kg/hr (1,901,529 lb/hr)
raw syngas
5.6 MPa (815.0 psia), 288°C
(550°F)
Assumed or
Specified
Performance
Characteristics
Quench and spray tower
equilibrium with exiting gas
stream. Particulate, chloride, and
alkali removal
Quench and spray tower
equilibrium with exiting gas
stream. Particulate, chloride, and
alkali removal
Calculated
Performance
Characteristics
Calculated 99.9% particulate
removal, 90% HCl and complete
alkali removal
Calculated 99.9% particulate
removal, 90% HCl and complete
alkali removal
Contaminant
Removed, %
Particulate, 99.9%; chloride, 90% Particulate, 99.9%; chloride, 90%
Assumptions
Regarding
Anticipated
Application Issues
Commercial gasifier-based Commercial gasifier-based

Assessment of Hydrogen Production with CO2 Capture Volume 1: Baseline State-of-the-Art Plants
72
8/30/2010
ASU
Case 2-1 2-2
Technology Type Cryogenic Distillation Cryogenic Distillation
Basis for Design
and Performance
Vendor data – commercial design Vendor data – commercial design
Operating
Conditions
Inlet – Gas
789,368 kg/hr (1,740,258 lb/hr)
Air
1.3 MPa (189.5 psia), 38°C
(100°F)
785,599 kg/hr (1,731,949 lb/hr)
Air
1.3 MPa (189.5 psia), 38°C
(100°F)
Operating
Conditions
Outlet – Gas
181,026 kg/hr (399,094 lb/hr) 95%
Oxygen
0.9 MPa (125.0 psia), 32°C (90°F)
255,729 kg/hr (563,786 lb/hr)
100% Nitrogen
1.3 MPa (182.0 psia), 10°C (50°F)
180,161 kg/hr (397,188 lb/hr) 95%
Oxygen
0.9 MPa (125.0 psia), 32°C (90°F)
256,499 kg/hr (565,484 lb/hr)
100% Nitrogen
1.3 MPa (182.0 psia), 10°C (50°F)
Assumed or
Specified
Performance
Characteristics
Specified plant production to
produce 95% purity oxygen, and
air compressor and oxygen
compressor performance. There is
no gas turbine integration.
Specified plant production to
produce 95% purity oxygen, and
air compressor and oxygen
compressor performance. There is
no gas turbine integration.
Calculated
Performance
Characteristics
Modeled performance based on
gasifier and sulfur plant
requirements.
Modeled performance based on
gasifier and sulfur plant
requirements.
Contaminant
Removed, %
100% inlet CO2 with adsorption 100% inlet CO2 with adsorption
Assumptions
Regarding
Anticipated
Application Issues
Commercial plant – no issues. Commercial plant – no issues.

Assessment of Hydrogen Production with CO2 Capture Volume 1: Baseline State-of-the-Art Plants
73
8/30/2010
WATER GAS SHIFT REACTOR
Case 2-1 2-2
Technology Type Haldor Topsoe Two Stage Shift
Catalyst
Haldor Topsoe Two Stage Shift
Catalyst
Basis for Design
and Performance
Vendor data – commercial design Vendor data – commercial design
Operating
Conditions
Inlet – Gas
Inlet Steam
705,816 kg/hr (1,556,057 lb/hr)
syngas
5.5 MPa (795.0 psia), 225°C
(436°F)
128,519 kg/hr (283,335 lb/hr)
steam
5.5 MPa (800.0 psia), 288°C
(550°F)
729,291 kg/hr (1,607,812 lb/hr)
syngas
5.5 MPa (800.0 psia), 232°C
(450°F)
0 kg/hr (0 lb/hr) steam
5.5 MPa (800.0 psia), 288°C
(550°F)
Operating
Conditions
Outlet - Syngas
705,816 kg/hr (1,556,057 lb/hr)
syngas
5.4 MPa (780.0 psia), 235°C
(456°F)
729,291 kg/hr (1,607,812 lb/hr)
syngas
5.4 MPa (785.0 psia), 244°C
(470°F)
Assumed or
Specified
Performance
Characteristics
Specified shift catalyst which also
promotes COS hydrolysis; Assume
minimum H2O/CO ratio of 2.0 at
inlet; Interstage cooling; Assume
two stages required to achieve ~80
percent CO conversion
Specified shift catalyst which also
promotes COS hydrolysis; Assume
minimum H2O/CO ratio of 2.0 at
inlet; Interstage cooling; Assume
two stages required to achieve ~80
percent CO conversion
Calculated
Performance
Characteristics
Modeled WGS reaction based on
equilibrium to ~80% CO
conversion
Modeled WGS reaction based on
equilibrium to ~80% CO
conversion
Contaminant
Removed, %
N/A N/A
Assumptions
Regarding
Anticipated
Application Issues
Commercial design; no issues Commercial design; no issues
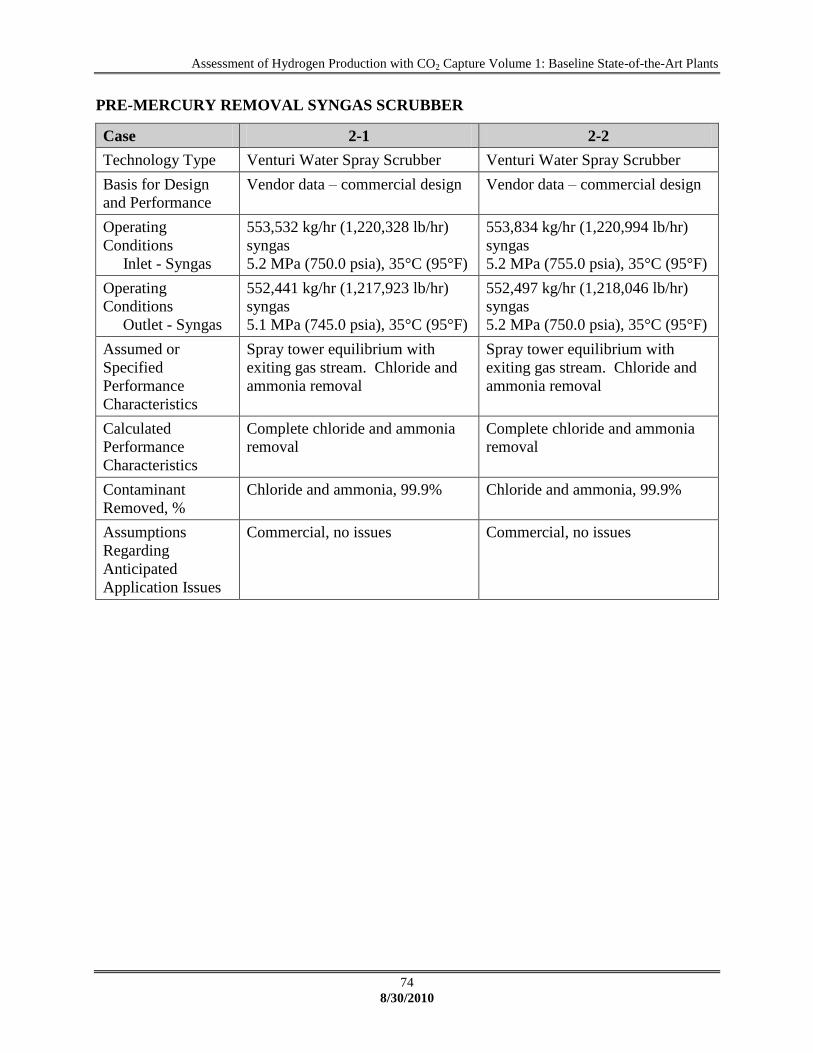
Assessment of Hydrogen Production with CO2 Capture Volume 1: Baseline State-of-the-Art Plants
74
8/30/2010
PRE-MERCURY REMOVAL SYNGAS SCRUBBER
Case 2-1 2-2
Technology Type Venturi Water Spray Scrubber Venturi Water Spray Scrubber
Basis for Design
and Performance
Vendor data – commercial design Vendor data – commercial design
Operating
Conditions
Inlet - Syngas
553,532 kg/hr (1,220,328 lb/hr)
syngas
5.2 MPa (750.0 psia), 35°C (95°F)
553,834 kg/hr (1,220,994 lb/hr)
syngas
5.2 MPa (755.0 psia), 35°C (95°F)
Operating
Conditions
Outlet - Syngas
552,441 kg/hr (1,217,923 lb/hr)
syngas
5.1 MPa (745.0 psia), 35°C (95°F)
552,497 kg/hr (1,218,046 lb/hr)
syngas
5.2 MPa (750.0 psia), 35°C (95°F)
Assumed or
Specified
Performance
Characteristics
Spray tower equilibrium with
exiting gas stream. Chloride and
ammonia removal
Spray tower equilibrium with
exiting gas stream. Chloride and
ammonia removal
Calculated
Performance
Characteristics
Complete chloride and ammonia
removal
Complete chloride and ammonia
removal
Contaminant
Removed, %
Chloride and ammonia, 99.9% Chloride and ammonia, 99.9%
Assumptions
Regarding
Anticipated
Application Issues
Commercial, no issues Commercial, no issues

Assessment of Hydrogen Production with CO2 Capture Volume 1: Baseline State-of-the-Art Plants
75
8/30/2010
MERCURY REMOVAL
Case 2-1 2-2
Technology Type Low temperature Activated
Carbon
Low temperature Activated
Carbon
Basis for Design
and Performance
Vendor data – commercial design Vendor data – commercial design
Operating
Conditions
Inlet - Syngas
552,441 kg/hr (1,217,923 lb/hr)
syngas
5.1 MPa (745.0 psia), 35°C (95°F)
552,497 kg/hr (1,218,046 lb/hr)
syngas
5.2 MPa (750.0 psia), 35°C (95°F)
Operating
Conditions
Outlet - Syngas
565,102 kg/hr (1,245,837 lb/hr)
syngas
5.1 MPa (740.0 psia), 35°C (95°F)
565,529 kg/hr (1,246,778 lb/hr)
syngas
5.1 MPa (745.0 psia), 35°C (95°F)
Assumed or
Specified
Performance
Characteristics
95% performance based on
Eastman Chemical experience;
Specified gas velocity, 20 sec.
retention time, operating
temperature, 69 kPa drop (10 psi),
pressure drop
95% performance based on
Eastman Chemical experience;
Specified gas velocity, 20 sec.
retention time, operating
temperature, 69 kPa drop (10 psi),
pressure drop
Calculated
Performance
Characteristics
Model results reflect design
assumptions
Model results reflect design
assumptions
Contaminant
Removed, %
Mercury, 95% removal Mercury, 95% removal
Assumptions
Regarding
Anticipated
Application Issues
Commercial, no issues Commercial, no issues

Assessment of Hydrogen Production with CO2 Capture Volume 1: Baseline State-of-the-Art Plants
76
8/30/2010
SELEXOL H2S REMOVAL
Case 2-1 2-2
Technology Type Refrigerated Selexol Physical
solvent
Refrigerated Selexol Physical
solvent
Basis for Design
and Performance
Vendor Data – Commercial
Design
Vendor Data – Commercial
Design
Operating
Conditions
Inlet - Syngas
565,102 kg/hr (1,245,837 lb/hr)
syngas
5.1 MPa (740.0 psia), 35°C (95°F)
565,529 kg/hr (1,246,778 lb/hr)
syngas
5.1 MPa (745.0 psia), 35°C (95°F)
Operating
Conditions
Regenerated
Sulfur Stream
17,666 kg/hr (38,947 lb/hr)
• 52% CO2
• 2% H2O
• 35% H2S
• 9% H2
0.2 MPa (23.7 psia),
49°C (119°F)
17,752 kg/hr (39,136 lb/hr)
• 52% CO2
• 2% H2O
• 35% H2S
• 9% H2
0.2 MPa (23.7 psia),
49°C (119°F)
Assumed or
Specified
Performance
Characteristics
Specified 99.9% specific to H2S Specified 99.9% specific to H2S
Calculated
Performance
Characteristics
Model results reflect design
assumptions
Model results reflect design
assumptions
Contaminant
Removed, %
H2S, 99.9% H2S, 99.9%
Assumptions
Regarding
Anticipated
Application Issues
Vendor design specifically
provided for GEE syngas
conditions
Vendor design specifically
provided for GEE syngas
conditions

Assessment of Hydrogen Production with CO2 Capture Volume 1: Baseline State-of-the-Art Plants
77
8/30/2010
SELEXOL CO2 REMOVAL
Case 2-1 2-2
Technology Type Refrigerated Selexol Physical
solvent
Refrigerated Selexol Physical
solvent
Basis for Design
and Performance
Vendor data – commercial design Vendor data – commercial design
Operating
Conditions
Inlet - Syngas
1,022,201 kg/hr (2,253,567 lb/hr)
syngas
5.1 MPa (740.0 psia), 35°C (95°F)
1,022,474 kg/hr (2,254,169 lb/hr)
syngas
5.1 MPa (745.0 psia), 35°C (95°F)
Operating
Conditions
Outlet - CO2
457,099 kg/hr (1,007,730 lb/hr)
CO2
0.9 MPa (135.0 psia), 16°C (60°F)
17,666 kg/hr (38,947 lb/hr) Claus
Feed Gas
0.2 MPa (23.7 psia), 48°C (119°F)
456,945 kg/hr (1,007,390 lb/hr)
CO2
0.9 MPa (135.0 psia), 16°C (60°F)
17,752 kg/hr (39,136 lb/hr) Claus
Feed Gas
0.2 MPa (23.7 psia), 48°C (119°F)
Assumed or
Specified
Performance
Characteristics
Specified 91.7% CO2 removal to
achieve overall system reduction
of 90%
Specified 91.5% CO2 removal to
achieve overall system reduction
of 90%
Calculated
Performance
Characteristics
Model results reflect design
assumptions
Model results reflect design
assumptions
Contaminant
Removed, %
91.7% CO2 from syngas 91.5% CO2 from syngas
Assumptions
Regarding
Anticipated
Application Issues
Vendor design specifically
provided for GEE syngas
conditions
Vendor design specifically
provided for GEE syngas
conditions

Assessment of Hydrogen Production with CO2 Capture Volume 1: Baseline State-of-the-Art Plants
78
8/30/2010
CO2 COMPRESSION
Case 2-1 2-2
Technology Type Multi-Stage Integral Gear
Compressor
Multi-Stage Integral Gear
Compressor
Basis for Design
and Performance
Vendor data – commercial design Vendor data – commercial design
Operating
Conditions
Inlet - CO2
457,099 kg/hr (1,007,730 lb/hr)
CO2
0.9 MPa (135.0 psia), 16°C (60°F)
456,945 kg/hr (1,007,390 lb/hr)
CO2
0.9 MPa (135.0 psia), 16°C (60°F)
Operating
Conditions
Outlet - CO2
456,694 kg/hr (1,006,837 lb/hr)
CO2
15.3 MPa (2,214.7 psia), 51°C
(124°F)
456,545 kg/hr (1,006,510 lb/hr)
CO2
15.3 MPa (2,214.7 psia), 51°C
(124°F)
Assumed or
Specified
Performance
Characteristics
Replicated Great Plains
Gasification installation; assumed
75% adiabatic efficiency with
intercooled stages
Replicated Great Plains
Gasification installation; assumed
75% adiabatic efficiency with
intercooled stages
Calculated
Performance
Characteristics
Model results reflect design
assumptions
Model results reflect design
assumptions
Contaminant
Removed, %
Dehydrated to –40º dew point Dehydrated to –40º dew point
Assumptions
Regarding
Anticipated
Application Issues
Commercial, no issues Commercial, no issues

Assessment of Hydrogen Production with CO2 Capture Volume 1: Baseline State-of-the-Art Plants
79
8/30/2010
CLAUS SULFUR RECOVERY
Case 2-1 2-2
Technology Type Oxygen Enriched Claus Plant with
Recycled Tail Gas to Gasifier
Oxygen Enriched Claus Plant with
Recycled Tail Gas to Gasifier
Basis for Design
and Performance
Vendor data – commercial design Vendor data – commercial design
Operating
Conditions
Inlet - Gas
Inlet - Oxygen
18,955 kg/hr (41,789 lb/hr)
• 52% CO2
• 2% H2O
• 35% H2S
0.2 MPa (23.7 psia), 48°C (119°F)
19,498 kg/hr (42,986 lb/hr)
• 52% CO2
• 2% H2O
• 35% H2S
0.2 MPa (23.7 psia), 48°C (119°F)
Operating
Conditions
Outlet -Sulfur
5,525 kg/hr (12,181 lb/hr) sulfur
0.1 MPa (17.3 psia), 178°C
(352°F)
5,540 kg/hr (12,214 lb/hr) sulfur
0.1 MPa (17.3 psia), 179°C
(354°F)
Assumed or
Specified
Performance
Characteristics
Assumed >97% conversion;
3 trains
Assumed >97% conversion;
3 trains
Calculated
Performance
Characteristics
Model calculated sulfur production
and tail gas composition based on
design assumptions
Model calculated sulfur production
and tail gas composition based on
design assumptions
Contaminant
Removed, %
N/A N/A
Assumptions
Regarding
Anticipated
Application Issues
Commercial, no issues Commercial, no issues

Assessment of Hydrogen Production with CO2 Capture Volume 1: Baseline State-of-the-Art Plants
80
8/30/2010
PRESSURE SWING ADSORBER
Case 2-1 2-2
Technology Type Pressure Swing Adsorption Pressure Swing Adsorption
Basis for Design
and Performance
Vendor data – commercial design Vendor data – commercial design
Operating
Conditions
Inlet - Syngas
90,337 kg/hr (199,159 lb/hr)
Syngas
5.1 MPa (740.0 psia), 35°C (95°F)
90,833 kg/hr (200,252 lb/hr)
Syngas
5.1 MPa (745.0 psia), 35°C (95°F)
Operating
Conditions
Outlet - H2
Outlet – Off-Gas
25,689 kg/hr (56,634 lb/hr) H2
5.1 MPa (740.0 psia), 35°C (95°F)
64,649 kg/hr (142,526 lb/hr) Off
Gas
0.5 MPa (77.0 psia), -7°C (20°F)
25,789 kg/hr (56,855 lb/hr) H2
5.1 MPa (745.0 psia), 35°C (95°F)
65,044 kg/hr (143,397 lb/hr) Off
Gas
0.5 MPa (77.0 psia), -7°C (20°F)
Assumed or
Specified
Performance
Characteristics
PSA operates at 80% hydrogen
removal efficiency. Off-gas is
sent to auxiliary boiler as fuel
PSA operates at 80% hydrogen
removal efficiency. Off-gas is
sent to auxiliary boiler as fuel
Calculated
Performance
Characteristics
>99.9 % Purity H2 >99.9 % Purity H2
Contaminant
Removed, %
N/A N/A
Assumptions
Regarding
Anticipated
Application Issues
Commercial, no issues Commercial, no issues

Assessment of Hydrogen Production with CO2 Capture Volume 1: Baseline State-of-the-Art Plants
81
8/30/2010
OFF-GAS FIRED BOILER
Case 2-1 2-2
Technology Type Sub-Critical Drum Sub-Critical Drum
Basis for Design
and Performance
Vendor data – commercial design Vendor data – commercial design
Operating
Conditions
Inlet - Flue Gas
Inlet Air
64,649 kg/hr (142,526 lb/hr) waste
gas
0.5 MPa (77.0 psia), -7°C (20°F)
317,515 kg/hr (700,000 lb/hr) air
0.1 MPa (14.7 psia), 15°C (59°F)
65,044 kg/hr (143,397 lb/hr) waste
gas
0.5 MPa (77.0 psia), -7°C (20°F)
317,515 kg/hr (700,000 lb/hr) air
0.1 MPa (14.7 psia), 15°C (59°F)
Operating
Conditions
Outlet -Flue Gas
382,163 kg/hr (842,526 lb/hr)
stack gas
0.1 MPa (15.2 psia), 138°C
(280°F)
382,558 kg/hr (843,397 lb/hr)
stack gas
0.1 MPa (15.2 psia), 138°C
(280°F)
Assumed or
Specified
Performance
Characteristics
Specified BFW pressure and steam
from syngas cooler
Specified BFW pressure and steam
from syngas cooler
Calculated
Performance
Characteristics
796 GJ/hr (754 MMBtu/hr) 801 GJ/hr (759 MMBtu/hr)
Contaminant
Removed, %
N/A N/A
Assumptions
Regarding
Anticipated
Application Issues
Commercial, no issues Commercial, no issues

Assessment of Hydrogen Production with CO2 Capture Volume 1: Baseline State-of-the-Art Plants
82
8/30/2010
STEAM TURBINE GENERATOR AND AUXILIARIES
Case 2-1 2-2
Technology Type GE Steam Turbine GE Steam Turbine
Basis for Design
and Performance
Vendor data – commercial design Vendor data – commercial design
Operating
Conditions - Inlet
Multi-pressure steam Multi-pressure steam
Operating
Conditions - Outlet
Condensate - 0.005 MPa
(0.70 psia), 32°C (90°F)
Condensate - 0.005 MPa
(0.70 psia), 32°C (90°F)
Assumed or
Specified
Performance
Characteristics
Specified Specified
Calculated
Performance
Characteristics
155,600 kWe (at generator
terminals)
112,700 kWe (at generator
terminals)
Contaminant
Removed, %
N/A N/A
Assumptions
Regarding
Anticipated
Application Issues
Commercial, no issues Commercial, no issues

Assessment of Hydrogen Production with CO2 Capture Volume 1: Baseline State-of-the-Art Plants
83
8/30/2010
SLAG RECOVERY AND HANDLING
Case 2-1 2-2
Technology Type Proprietary General Electric Proprietary General Electric
Basis for Design
and Performance
Vendor data – commercial design Vendor data – commercial design
Operating
Conditions
Inlet – Slag
24,237 kg/hr (53,433 lb/hr) slag
5.6 MPa (815.0 psia), 1,316°C
(2,400°F)
24,235 kg/hr (53,430 lb/hr) slag
5.6 MPa (815.0 psia), 1,316°C
(2,400°F)
Operating
Conditions
Outlet -Slag
24,237 kg/hr (53,433 lb/hr) slag
0.1 MPa (14.7 psia), 15°C (59°F)
24,235 kg/hr (53,430 lb/hr) slag
0.1 MPa (14.7 psia), 15°C (59°F)
Assumed or
Specified
Performance
Characteristics
Specified as commercial
equipment
Specified as commercial
equipment
Calculated
Performance
Characteristics
Model based on percentage of coal
flow
Model based on percentage of coal
flow
Contaminant
Removed, %
N/A N/A
Assumptions
Regarding
Anticipated
Application Issues
Commercial slag removal as
utilized at commercial IGCC. No
issues
Commercial slag removal as
utilized at commercial IGCC. No
issues
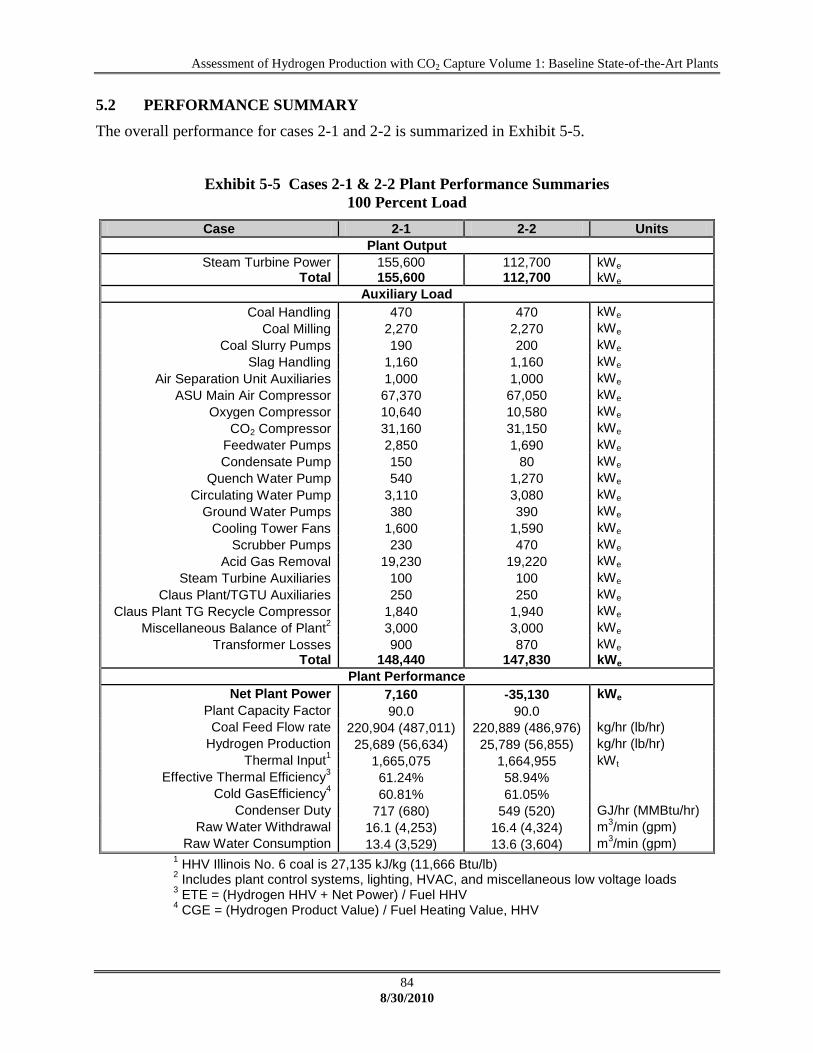
Assessment of Hydrogen Production with CO2 Capture Volume 1: Baseline State-of-the-Art Plants
84
8/30/2010
5.2 PERFORMANCE SUMMARY
The overall performance for cases 2-1 and 2-2 is summarized in Exhibit 5-5.
Exhibit 5-5 Cases 2-1 & 2-2 Plant Performance Summaries
100 Percent Load
Case 2-1 2-2 Units
Plant Output
Steam Turbine Power 155,600 112,700 kWe Total 155,600 112,700 kWe
Auxiliary Load
Coal Handling 470 470 kWe
Coal Milling 2,270 2,270 kWe
Coal Slurry Pumps 190 200 kWe
Slag Handling 1,160 1,160 kWe
Air Separation Unit Auxiliaries 1,000 1,000 kWe
ASU Main Air Compressor 67,370 67,050 kWe
Oxygen Compressor 10,640 10,580 kWe
CO2 Compressor 31,160 31,150 kWe
Feedwater Pumps 2,850 1,690 kWe
Condensate Pump 150 80 kWe
Quench Water Pump 540 1,270 kWe
Circulating Water Pump 3,110 3,080 kWe
Ground Water Pumps 380 390 kWe
Cooling Tower Fans 1,600 1,590 kWe
Scrubber Pumps 230 470 kWe
Acid Gas Removal 19,230 19,220 kWe
Steam Turbine Auxiliaries 100 100 kWe
Claus Plant/TGTU Auxiliaries 250 250 kWe
Claus Plant TG Recycle Compressor 1,840 1,940 kWe
Miscellaneous Balance of Plant2 3,000 3,000 kWe
Transformer Losses 900 870 kWe
Total 148,440 147,830 kWe
Plant Performance
Net Plant Power 7,160 -35,130 kWe
Plant Capacity Factor 90.0 90.0
Coal Feed Flow rate 220,904 (487,011) 220,889 (486,976) kg/hr (lb/hr)
Hydrogen Production 25,689 (56,634) 25,789 (56,855) kg/hr (lb/hr)
Thermal Input1 1,665,075 1,664,955 kWt
Effective Thermal Efficiency3 61.24% 58.94%
Cold GasEfficiency4 60.81% 61.05%
Condenser Duty 717 (680) 549 (520) GJ/hr (MMBtu/hr)
Raw Water Withdrawal 16.1 (4,253) 16.4 (4,324) m3/min (gpm)
Raw Water Consumption 13.4 (3,529) 13.6 (3,604) m3/min (gpm)
1 HHV Illinois No. 6 coal is 27,135 kJ/kg (11,666 Btu/lb)
2 Includes plant control systems, lighting, HVAC, and miscellaneous low voltage loads
3 ETE = (Hydrogen HHV + Net Power) / Fuel HHV
4 CGE = (Hydrogen Product Value) / Fuel Heating Value, HHV
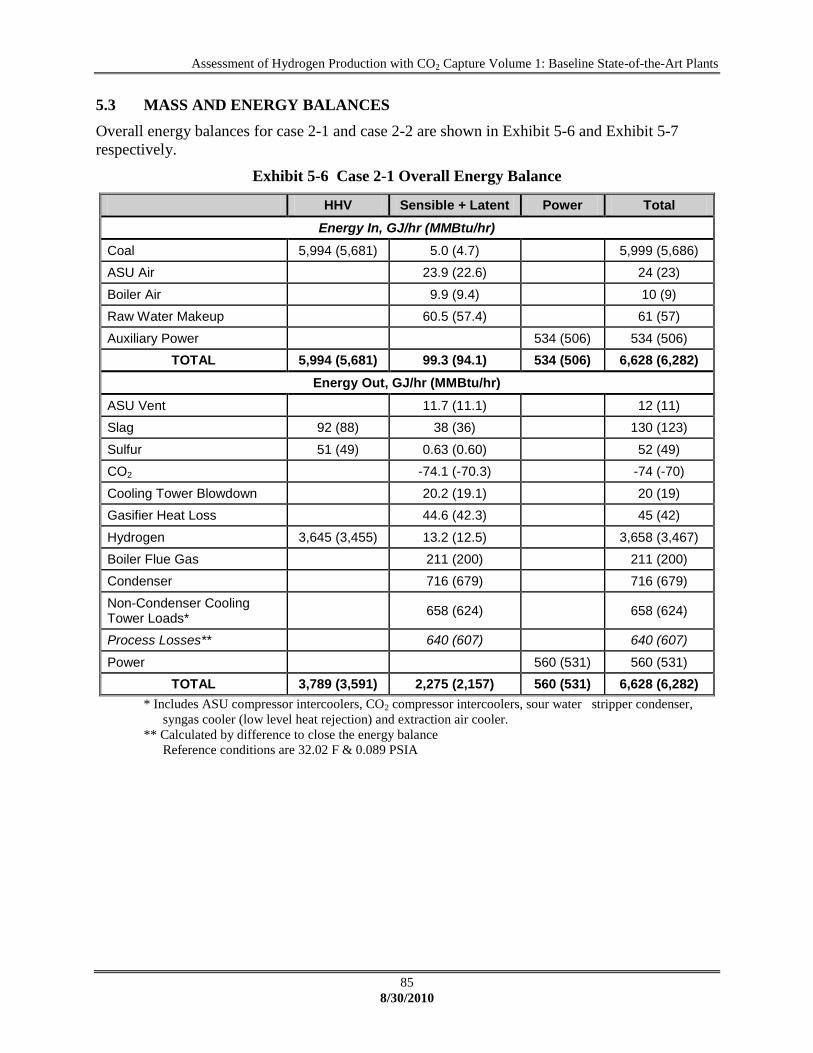
Assessment of Hydrogen Production with CO2 Capture Volume 1: Baseline State-of-the-Art Plants
85
8/30/2010
5.3 MASS AND ENERGY BALANCES
Overall energy balances for case 2-1 and case 2-2 are shown in Exhibit 5-6 and Exhibit 5-7
respectively.
Exhibit 5-6 Case 2-1 Overall Energy Balance
HHV Sensible + Latent Power Total
Energy In, GJ/hr (MMBtu/hr)
Coal 5,994 (5,681) 5.0 (4.7) 5,999 (5,686)
ASU Air 23.9 (22.6) 24 (23)
Boiler Air 9.9 (9.4) 10 (9)
Raw Water Makeup 60.5 (57.4) 61 (57)
Auxiliary Power 534 (506) 534 (506)
TOTAL 5,994 (5,681) 99.3 (94.1) 534 (506) 6,628 (6,282)
Energy Out, GJ/hr (MMBtu/hr)
ASU Vent 11.7 (11.1) 12 (11)
Slag 92 (88) 38 (36) 130 (123)
Sulfur 51 (49) 0.63 (0.60) 52 (49)
CO2 -74.1 (-70.3) -74 (-70)
Cooling Tower Blowdown 20.2 (19.1) 20 (19)
Gasifier Heat Loss 44.6 (42.3) 45 (42)
Hydrogen 3,645 (3,455) 13.2 (12.5) 3,658 (3,467)
Boiler Flue Gas 211 (200) 211 (200)
Condenser 716 (679) 716 (679)
Non-Condenser Cooling Tower Loads*
658 (624) 658 (624)
Process Losses** 640 (607) 640 (607)
Power 560 (531) 560 (531)
TOTAL 3,789 (3,591) 2,275 (2,157) 560 (531) 6,628 (6,282)
* Includes ASU compressor intercoolers, CO2 compressor intercoolers, sour water stripper condenser,
syngas cooler (low level heat rejection) and extraction air cooler.
** Calculated by difference to close the energy balance
Reference conditions are 32.02 F & 0.089 PSIA
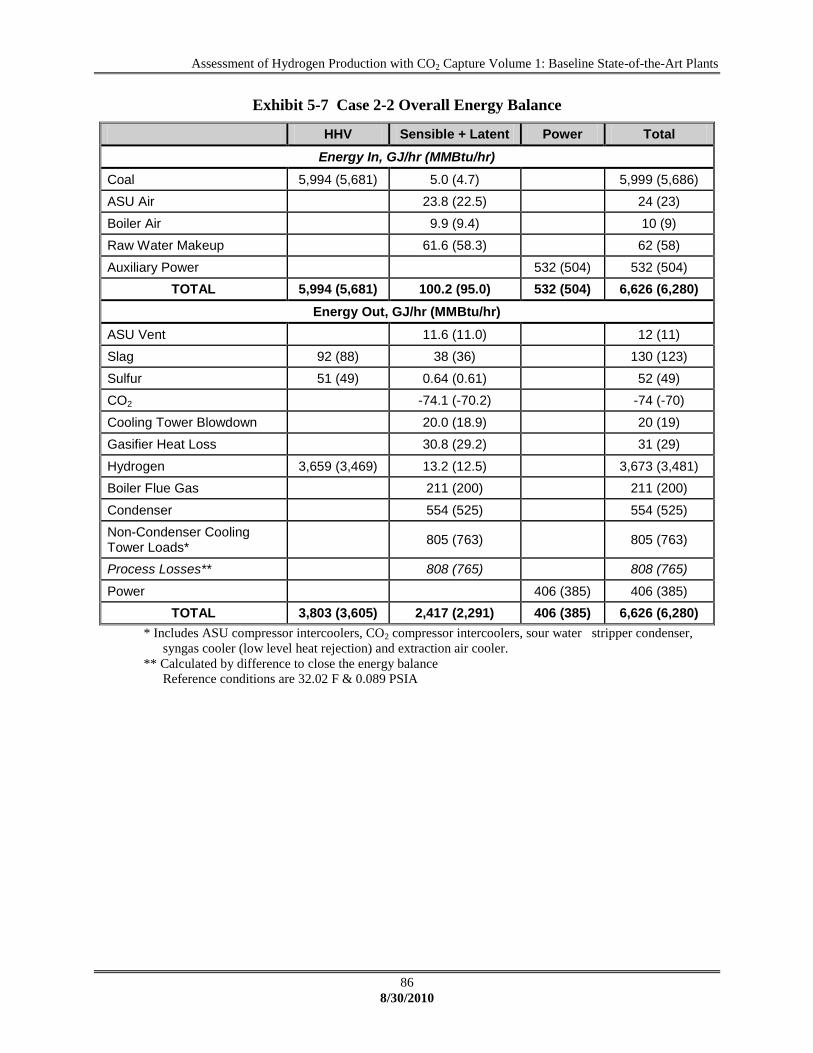
Assessment of Hydrogen Production with CO2 Capture Volume 1: Baseline State-of-the-Art Plants
86
8/30/2010
Exhibit 5-7 Case 2-2 Overall Energy Balance
HHV Sensible + Latent Power Total
Energy In, GJ/hr (MMBtu/hr)
Coal 5,994 (5,681) 5.0 (4.7) 5,999 (5,686)
ASU Air 23.8 (22.5) 24 (23)
Boiler Air 9.9 (9.4) 10 (9)
Raw Water Makeup 61.6 (58.3) 62 (58)
Auxiliary Power 532 (504) 532 (504)
TOTAL 5,994 (5,681) 100.2 (95.0) 532 (504) 6,626 (6,280)
Energy Out, GJ/hr (MMBtu/hr)
ASU Vent 11.6 (11.0) 12 (11)
Slag 92 (88) 38 (36) 130 (123)
Sulfur 51 (49) 0.64 (0.61) 52 (49)
CO2 -74.1 (-70.2) -74 (-70)
Cooling Tower Blowdown 20.0 (18.9) 20 (19)
Gasifier Heat Loss 30.8 (29.2) 31 (29)
Hydrogen 3,659 (3,469) 13.2 (12.5) 3,673 (3,481)
Boiler Flue Gas 211 (200) 211 (200)
Condenser 554 (525) 554 (525)
Non-Condenser Cooling Tower Loads*
805 (763) 805 (763)
Process Losses** 808 (765) 808 (765)
Power 406 (385) 406 (385)
TOTAL 3,803 (3,605) 2,417 (2,291) 406 (385) 6,626 (6,280)
* Includes ASU compressor intercoolers, CO2 compressor intercoolers, sour water stripper condenser,
syngas cooler (low level heat rejection) and extraction air cooler.
** Calculated by difference to close the energy balance
Reference conditions are 32.02 F & 0.089 PSIA
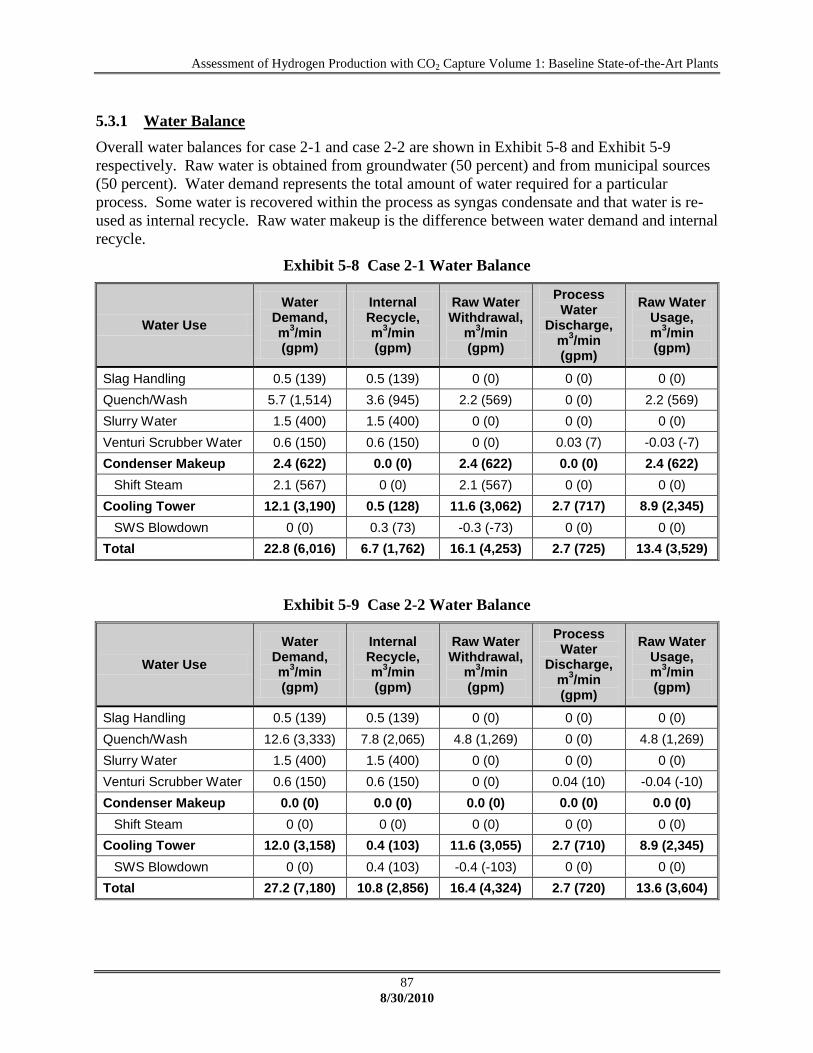
Assessment of Hydrogen Production with CO2 Capture Volume 1: Baseline State-of-the-Art Plants
87
8/30/2010
5.3.1 Water Balance
Overall water balances for case 2-1 and case 2-2 are shown in Exhibit 5-8 and Exhibit 5-9
respectively. Raw water is obtained from groundwater (50 percent) and from municipal sources
(50 percent). Water demand represents the total amount of water required for a particular
process. Some water is recovered within the process as syngas condensate and that water is re-
used as internal recycle. Raw water makeup is the difference between water demand and internal
recycle.
Exhibit 5-8 Case 2-1 Water Balance
Water Use
Water Demand, m
3/min
(gpm)
Internal Recycle, m
3/min
(gpm)
Raw Water Withdrawal,
m3/min
(gpm)
Process Water
Discharge, m
3/min
(gpm)
Raw Water Usage, m
3/min
(gpm)
Slag Handling 0.5 (139) 0.5 (139) 0 (0) 0 (0) 0 (0)
Quench/Wash 5.7 (1,514) 3.6 (945) 2.2 (569) 0 (0) 2.2 (569)
Slurry Water 1.5 (400) 1.5 (400) 0 (0) 0 (0) 0 (0)
Venturi Scrubber Water 0.6 (150) 0.6 (150) 0 (0) 0.03 (7) -0.03 (-7)
Condenser Makeup 2.4 (622) 0.0 (0) 2.4 (622) 0.0 (0) 2.4 (622)
Shift Steam 2.1 (567) 0 (0) 2.1 (567) 0 (0) 0 (0)
Cooling Tower 12.1 (3,190) 0.5 (128) 11.6 (3,062) 2.7 (717) 8.9 (2,345)
SWS Blowdown 0 (0) 0.3 (73) -0.3 (-73) 0 (0) 0 (0)
Total 22.8 (6,016) 6.7 (1,762) 16.1 (4,253) 2.7 (725) 13.4 (3,529)
Exhibit 5-9 Case 2-2 Water Balance
Water Use
Water Demand, m
3/min
(gpm)
Internal Recycle, m
3/min
(gpm)
Raw Water Withdrawal,
m3/min
(gpm)
Process Water
Discharge, m
3/min
(gpm)
Raw Water Usage, m
3/min
(gpm)
Slag Handling 0.5 (139) 0.5 (139) 0 (0) 0 (0) 0 (0)
Quench/Wash 12.6 (3,333) 7.8 (2,065) 4.8 (1,269) 0 (0) 4.8 (1,269)
Slurry Water 1.5 (400) 1.5 (400) 0 (0) 0 (0) 0 (0)
Venturi Scrubber Water 0.6 (150) 0.6 (150) 0 (0) 0.04 (10) -0.04 (-10)
Condenser Makeup 0.0 (0) 0.0 (0) 0.0 (0) 0.0 (0) 0.0 (0)
Shift Steam 0 (0) 0 (0) 0 (0) 0 (0) 0 (0)
Cooling Tower 12.0 (3,158) 0.4 (103) 11.6 (3,055) 2.7 (710) 8.9 (2,345)
SWS Blowdown 0 (0) 0.4 (103) -0.4 (-103) 0 (0) 0 (0)
Total 27.2 (7,180) 10.8 (2,856) 16.4 (4,324) 2.7 (720) 13.6 (3,604)

Assessment of Hydrogen Production with CO2 Capture Volume 1: Baseline State-of-the-Art Plants
88
8/30/2010
5.3.2 Carbon Balance
Carbon balances for case 2-1 and case 2-2 are shown in Exhibit 5-10 and Exhibit 5-11
respectively. The carbon input to the plant consists of carbon in the air in addition to carbon in
the coal. Carbon leaves the plant as unburned carbon in the slag, CO2 in the boiler stack gas, and
CO2 product. Gray wastewater is recycled within the plant as slurry water. The percent of total
carbon sequestered is defined as the amount of carbon product produced (as sequestration-ready
CO2) divided by the carbon in the coal feedstock, less carbon contained in solid byproducts
(slag), expressed as a percentage:
(Carbon in Product for Sequestration) / (Carbon in Feed – Carbon in Slag) * 100 or
Case 2-1: 274,699/(310,444-6,209)*100 = 90%
Case 2-2: 274,610/(310,422-6,208)*100 = 90%
Exhibit 5-10 Case 2-1 Carbon Balance
Carbon In, kg/hr (lb/hr) Carbon Out, kg/hr (lb/hr)
Coal 140,815 (310,444) Slag 2,816 (6,209)
Air (CO2) 107 (237) Boiler Stack Gas 13,456 (29,665)
ASU Vent 107 (237)
CO2 Product 124,601 (274,699)
Convergence Tolerance* -59 (-129)
Total 140,922 (310,681) Total 140,922 (310,681)
*by difference
Exhibit 5-11 Case 2-2 Carbon Balance
Carbon In, kg/hr (lb/hr) Carbon Out, kg/hr (lb/hr)
Coal 140,805 (310,422) Slag 2,816 (6,208)
Air (CO2) 107 (236) Boiler Stack Gas 13,550 (29,873)
ASU Vent 107 (236)
CO2 Product 124,561 (274,610)
Convergence Tolerance* -122 (-269)
Total 140,912 (310,657) Total 140,912 (310,657)
*by difference
5.3.3 Sulfur Balance
Exhibit 5-12 and Exhibit 5-13 show the sulfur balances for case 2-1 and case 2-2 respectively.
Sulfur input is the sulfur in the coal. Sulfur output is the sulfur recovered in the Claus plant and
SO2 in the stack gas. Sulfur in the slag and sulfur stripped from the wastewater streams are
considered negligible. The convergence tolerance is split between sulfur product and stack gas
in proportion to the amounts shown for those two categories to calculate sulfur capture. The
total sulfur capture is represented by the following fraction:

Assessment of Hydrogen Production with CO2 Capture Volume 1: Baseline State-of-the-Art Plants
89
8/30/2010
Sulfur byproduct/Sulfur in the coal or
Case 2-1: 12,181/12,207 = 99.8%
Case 2-2: 12,485/12,492 = 99.9%
Exhibit 5-12 Case 2-1 Sulfur Balance
Sulfur In, kg/hr (lb/hr) Sulfur Out, kg/hr (lb/hr)
Coal 5,537(12,207) Elemental Sulfur 5,525 (12,181)
Stack Gas 3 (6)
CO2 Product 10 (22)
Convergence Tolerance* -2 (-4)
Total 5,537 (12,207) Total 5,537 (12,207)
*by difference
Exhibit 5-13 Case 2-2 Sulfur Balance
Sulfur In, kg/hr (lb/hr) Sulfur Out, kg/hr (lb/hr)
Coal 5,536 (12,206) Elemental Sulfur 5,540 (12,214)
Stack Gas 3 (6)
CO2 Product 10 (23)
Convergence Tolerance* -17 (-38)
Total 5,536 (12,206) Total 5,536 (12,206)
*by difference
5.3.4 Air Emissions
The environmental targets for emissions were presented in Section 1.6. A summary of the plant
air emissions for cases 2-1 and 2-2 are presented in Exhibit 5-14.
Exhibit 5-14 Cases 2-1 and 2-2 Air Emissions
kg/GJ
(lb/106 Btu)
Tonne/year (tons/year)
90% Capacity Factor
kg/GJ (lb/10
6 Btu)
Tonne/year (tons/year)
90% Capacity Factor
SO2 0.001 (0.002) 44 (49) 0.001 (0.002) 44 (49)
NOX 0.003 (0.008) 154 (170) 0.003 (0.008) 155 (171)
Particulates 0.003 (0.007) 144 (159) 0.003 (0.007) 144 (159)
Hg 2.46E-7
(5.71E-7) 0.012 (0.013)
2.46E-7 (5.71E-7)
0.012 (0.013)
CO2 8.2 (19.1) 388,717 (428,487) 8.3 (19.3) 391,432 (431,480)
5.4 MAJOR EQUIPMENT LISTS
This section contains the equipment lists corresponding to the plant configurations for cases 2-1
and 2-2. These lists, along with the heat and material balances and supporting performance data,
were used to generate plant costs and complete the financial analysis.
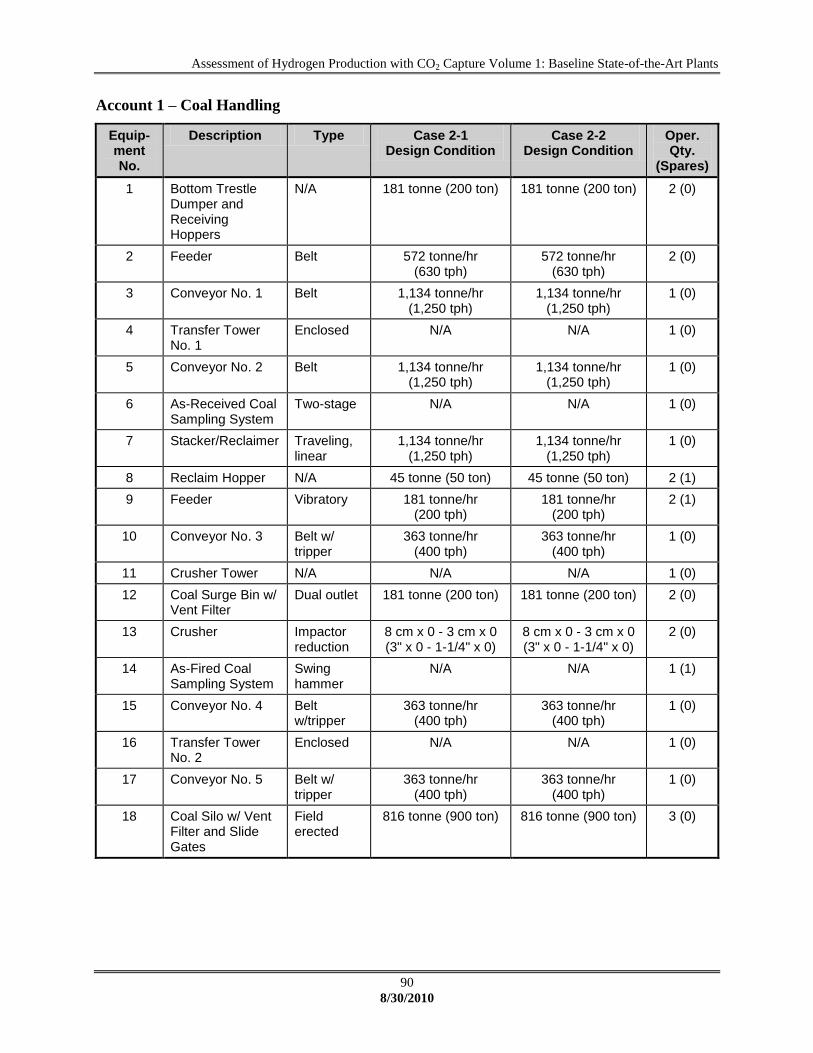
Assessment of Hydrogen Production with CO2 Capture Volume 1: Baseline State-of-the-Art Plants
90
8/30/2010
Account 1 – Coal Handling
Equip-ment No.
Description Type Case 2-1 Design Condition
Case 2-2 Design Condition
Oper. Qty.
(Spares)
1 Bottom Trestle Dumper and Receiving Hoppers
N/A 181 tonne (200 ton) 181 tonne (200 ton) 2 (0)
2 Feeder Belt 572 tonne/hr (630 tph)
572 tonne/hr (630 tph)
2 (0)
3 Conveyor No. 1 Belt 1,134 tonne/hr (1,250 tph)
1,134 tonne/hr (1,250 tph)
1 (0)
4 Transfer Tower No. 1
Enclosed N/A N/A 1 (0)
5 Conveyor No. 2 Belt 1,134 tonne/hr (1,250 tph)
1,134 tonne/hr (1,250 tph)
1 (0)
6 As-Received Coal Sampling System
Two-stage N/A N/A 1 (0)
7 Stacker/Reclaimer Traveling, linear
1,134 tonne/hr (1,250 tph)
1,134 tonne/hr (1,250 tph)
1 (0)
8 Reclaim Hopper N/A 45 tonne (50 ton) 45 tonne (50 ton) 2 (1)
9 Feeder Vibratory 181 tonne/hr (200 tph)
181 tonne/hr (200 tph)
2 (1)
10 Conveyor No. 3 Belt w/ tripper
363 tonne/hr (400 tph)
363 tonne/hr (400 tph)
1 (0)
11 Crusher Tower N/A N/A N/A 1 (0)
12 Coal Surge Bin w/ Vent Filter
Dual outlet 181 tonne (200 ton) 181 tonne (200 ton) 2 (0)
13 Crusher Impactor reduction
8 cm x 0 - 3 cm x 0 (3" x 0 - 1-1/4" x 0)
8 cm x 0 - 3 cm x 0 (3" x 0 - 1-1/4" x 0)
2 (0)
14 As-Fired Coal Sampling System
Swing hammer
N/A N/A 1 (1)
15 Conveyor No. 4 Belt w/tripper
363 tonne/hr (400 tph)
363 tonne/hr (400 tph)
1 (0)
16 Transfer Tower No. 2
Enclosed N/A N/A 1 (0)
17 Conveyor No. 5 Belt w/ tripper
363 tonne/hr (400 tph)
363 tonne/hr (400 tph)
1 (0)
18 Coal Silo w/ Vent Filter and Slide Gates
Field erected
816 tonne (900 ton) 816 tonne (900 ton) 3 (0)
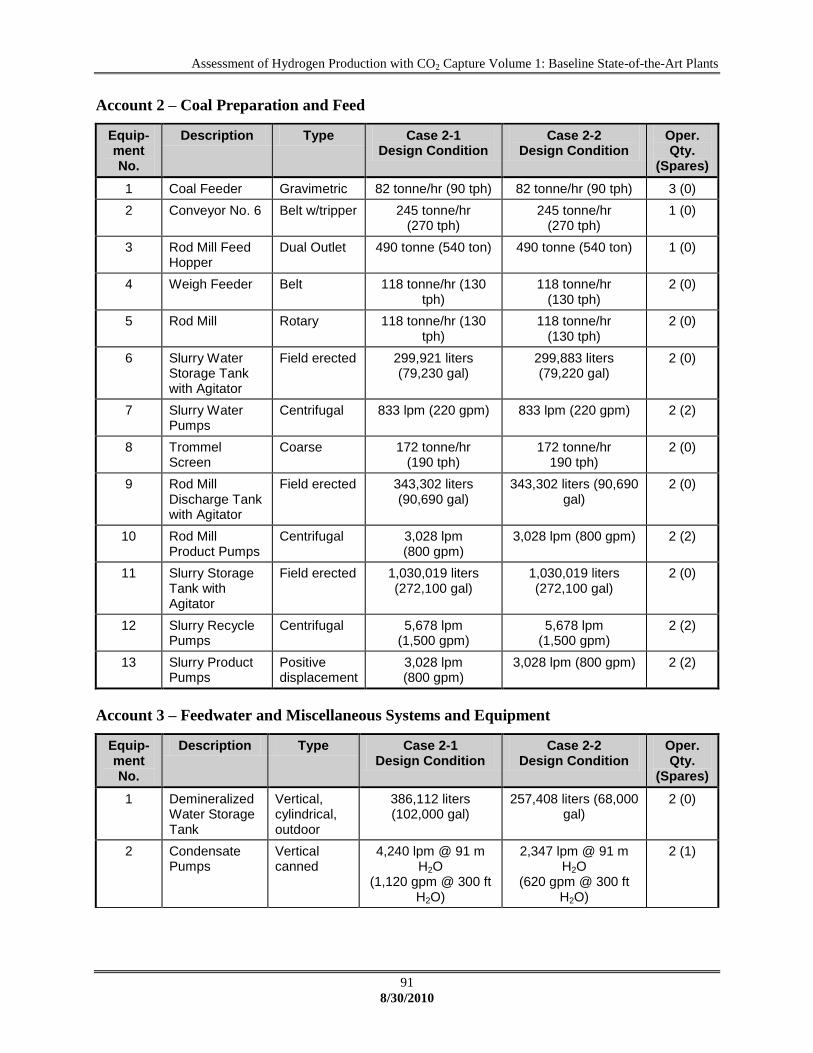
Assessment of Hydrogen Production with CO2 Capture Volume 1: Baseline State-of-the-Art Plants
91
8/30/2010
Account 2 – Coal Preparation and Feed
Equip-ment No.
Description Type Case 2-1 Design Condition
Case 2-2 Design Condition
Oper. Qty.
(Spares)
1 Coal Feeder Gravimetric 82 tonne/hr (90 tph) 82 tonne/hr (90 tph) 3 (0)
2 Conveyor No. 6 Belt w/tripper 245 tonne/hr (270 tph)
245 tonne/hr (270 tph)
1 (0)
3 Rod Mill Feed Hopper
Dual Outlet 490 tonne (540 ton) 490 tonne (540 ton) 1 (0)
4 Weigh Feeder Belt 118 tonne/hr (130 tph)
118 tonne/hr (130 tph)
2 (0)
5 Rod Mill Rotary 118 tonne/hr (130 tph)
118 tonne/hr (130 tph)
2 (0)
6 Slurry Water Storage Tank with Agitator
Field erected 299,921 liters (79,230 gal)
299,883 liters (79,220 gal)
2 (0)
7 Slurry Water Pumps
Centrifugal 833 lpm (220 gpm) 833 lpm (220 gpm) 2 (2)
8 Trommel Screen
Coarse 172 tonne/hr (190 tph)
172 tonne/hr 190 tph)
2 (0)
9 Rod Mill Discharge Tank with Agitator
Field erected 343,302 liters (90,690 gal)
343,302 liters (90,690 gal)
2 (0)
10 Rod Mill Product Pumps
Centrifugal 3,028 lpm (800 gpm)
3,028 lpm (800 gpm) 2 (2)
11 Slurry Storage Tank with Agitator
Field erected 1,030,019 liters (272,100 gal)
1,030,019 liters (272,100 gal)
2 (0)
12 Slurry Recycle Pumps
Centrifugal 5,678 lpm (1,500 gpm)
5,678 lpm (1,500 gpm)
2 (2)
13 Slurry Product Pumps
Positive displacement
3,028 lpm (800 gpm)
3,028 lpm (800 gpm) 2 (2)
Account 3 – Feedwater and Miscellaneous Systems and Equipment
Equip-ment No.
Description Type Case 2-1 Design Condition
Case 2-2 Design Condition
Oper. Qty.
(Spares)
1 Demineralized Water Storage Tank
Vertical, cylindrical, outdoor
386,112 liters (102,000 gal)
257,408 liters (68,000 gal)
2 (0)
2 Condensate Pumps
Vertical canned
4,240 lpm @ 91 m H2O
(1,120 gpm @ 300 ft H2O)
2,347 lpm @ 91 m H2O
(620 gpm @ 300 ft H2O)
2 (1)
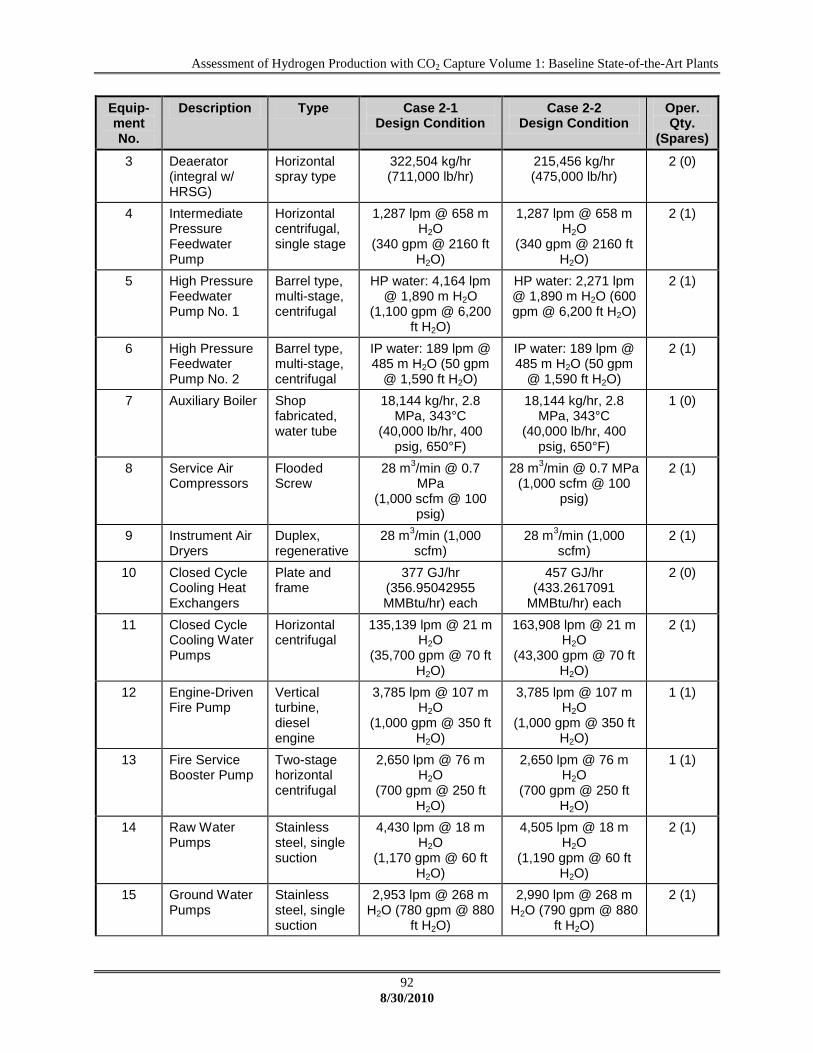
Assessment of Hydrogen Production with CO2 Capture Volume 1: Baseline State-of-the-Art Plants
92
8/30/2010
Equip-ment No.
Description Type Case 2-1 Design Condition
Case 2-2 Design Condition
Oper. Qty.
(Spares)
3 Deaerator (integral w/ HRSG)
Horizontal spray type
322,504 kg/hr (711,000 lb/hr)
215,456 kg/hr (475,000 lb/hr)
2 (0)
4 Intermediate Pressure Feedwater Pump
Horizontal centrifugal, single stage
1,287 lpm @ 658 m H2O
(340 gpm @ 2160 ft H2O)
1,287 lpm @ 658 m H2O
(340 gpm @ 2160 ft H2O)
2 (1)
5 High Pressure Feedwater Pump No. 1
Barrel type, multi-stage, centrifugal
HP water: 4,164 lpm @ 1,890 m H2O
(1,100 gpm @ 6,200 ft H2O)
HP water: 2,271 lpm @ 1,890 m H2O (600 gpm @ 6,200 ft H2O)
2 (1)
6 High Pressure Feedwater Pump No. 2
Barrel type, multi-stage, centrifugal
IP water: 189 lpm @ 485 m H2O (50 gpm
@ 1,590 ft H2O)
IP water: 189 lpm @ 485 m H2O (50 gpm
@ 1,590 ft H2O)
2 (1)
7 Auxiliary Boiler Shop fabricated, water tube
18,144 kg/hr, 2.8 MPa, 343°C
(40,000 lb/hr, 400 psig, 650°F)
18,144 kg/hr, 2.8 MPa, 343°C
(40,000 lb/hr, 400 psig, 650°F)
1 (0)
8 Service Air Compressors
Flooded Screw
28 m3/min @ 0.7 MPa
(1,000 scfm @ 100 psig)
28 m3/min @ 0.7 MPa
(1,000 scfm @ 100 psig)
2 (1)
9 Instrument Air Dryers
Duplex, regenerative
28 m3/min (1,000 scfm)
28 m3/min (1,000 scfm)
2 (1)
10 Closed Cycle Cooling Heat Exchangers
Plate and frame
377 GJ/hr (356.95042955 MMBtu/hr) each
457 GJ/hr (433.2617091
MMBtu/hr) each
2 (0)
11 Closed Cycle Cooling Water Pumps
Horizontal centrifugal
135,139 lpm @ 21 m H2O
(35,700 gpm @ 70 ft H2O)
163,908 lpm @ 21 m H2O
(43,300 gpm @ 70 ft H2O)
2 (1)
12 Engine-Driven Fire Pump
Vertical turbine, diesel engine
3,785 lpm @ 107 m H2O
(1,000 gpm @ 350 ft H2O)
3,785 lpm @ 107 m H2O
(1,000 gpm @ 350 ft H2O)
1 (1)
13 Fire Service Booster Pump
Two-stage horizontal centrifugal
2,650 lpm @ 76 m H2O
(700 gpm @ 250 ft H2O)
2,650 lpm @ 76 m H2O
(700 gpm @ 250 ft H2O)
1 (1)
14 Raw Water Pumps
Stainless steel, single suction
4,430 lpm @ 18 m H2O
(1,170 gpm @ 60 ft H2O)
4,505 lpm @ 18 m H2O
(1,190 gpm @ 60 ft H2O)
2 (1)
15 Ground Water Pumps
Stainless steel, single suction
2,953 lpm @ 268 m H2O (780 gpm @ 880
ft H2O)
2,990 lpm @ 268 m H2O (790 gpm @ 880
ft H2O)
2 (1)

Assessment of Hydrogen Production with CO2 Capture Volume 1: Baseline State-of-the-Art Plants
93
8/30/2010
Equip-ment No.
Description Type Case 2-1 Design Condition
Case 2-2 Design Condition
Oper. Qty.
(Spares)
16 Filtered Water Pumps
Stainless steel, single suction
6,246 lpm @ 49 m H2O
(1,650 gpm @ 160 ft H2O)
7,684 lpm @ 49 m H2O
(2,030 gpm @ 160 ft H2O)
2 (1)
17 Filtered Water Tank
Vertical, cylindrical
2,998,046 liter (792,000 gal)
3,694,562 liter (976,000 gal)
2 (0)
18 Makeup Water Demineralizer
Anion, cation, and mixed bed
1,363 lpm (360 gpm) 151 lpm (40 gpm) 2 (0)
19 Liquid Waste Treatment System
10 years, 24-hour storm
10 years, 24-hour storm
1 (0)
Account 4 – Gasifier, Syngas Cooler, Scrubber, ASU, and Accessories
Equip-ment No.
Description Type Case 2-1 Design Condition
Case 2-2 Design Condition
Oper. Qty.
(Spares)
1 Gasifier Pressurized slurry-feed, entrained bed
2,903 tonne/day, 5.6 MPa
(3,200 tpd, 814.96 psia)
2,903 tonne/day, 5.6 MPa
(3,200 tpd, 814.96 psia)
2 (1)
2 Synthesis Gas Cooler
Vertical downflow radiant heat exchanger
255,826 kg/hr (564,000 lb/hr)
N/A 2 (1)
3 Syngas Quench-Scrubber Including Sour Water Stripper
Quench Chamber and Vertical upflow
350,173 kg/hr (772,000 lb/hr)
474,458 kg/hr (1,046,000 lb/hr)
2 (0)
4 Flare Stack Self-supporting, carbon steel, stainless steel top, pilot ignition
350,173 kg/hr (772,000 lb/hr)
syngas
474,458 kg/hr (1,046,000 lb/hr)
syngas
2 (0)
5 ASU Main Air Compressor
Centrifugal, multi-stage
5,947 m3/min @
1.3 MPa (210,000 scfm @
190 psia)
5,918 m3/min @
1.3 MPa (209,000 scfm @
190 psia)
2 (0)
6 Cold Box Vendor design 2,359 tonne/day (2,600 tpd) of 95%
purity oxygen
2,359 tonne/day (2,600 tpd) of 95%
purity oxygen
2 (0)
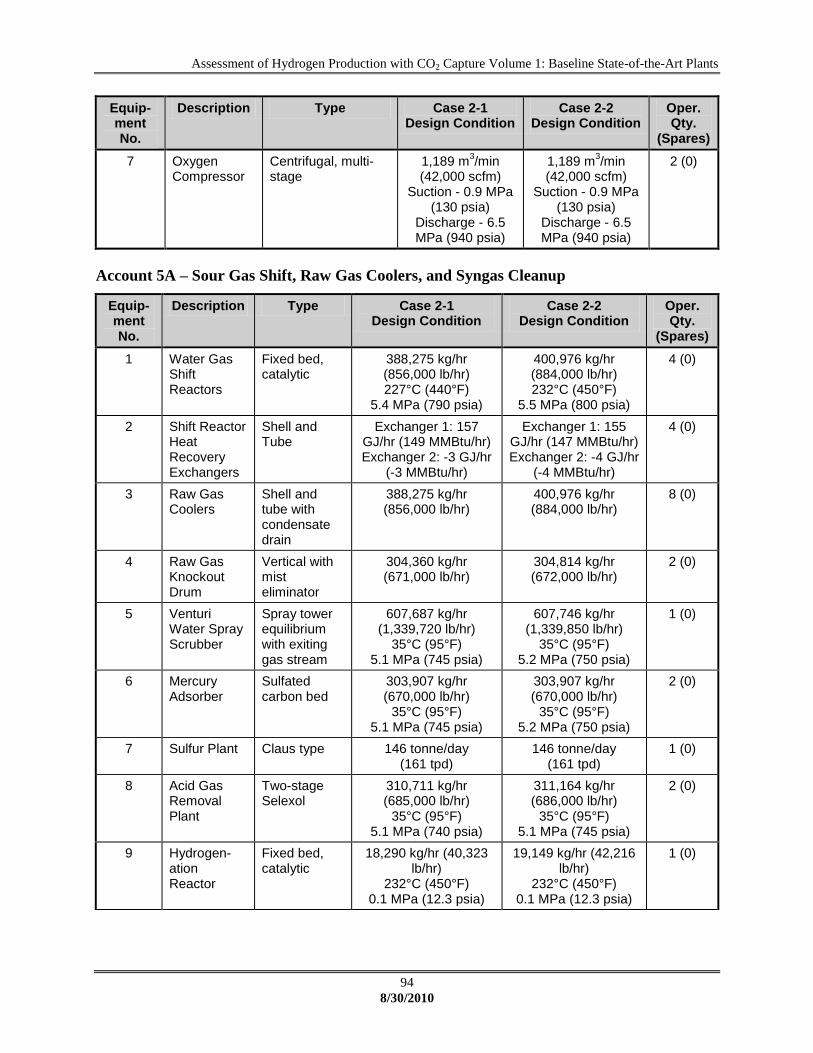
Assessment of Hydrogen Production with CO2 Capture Volume 1: Baseline State-of-the-Art Plants
94
8/30/2010
Equip-ment No.
Description Type Case 2-1 Design Condition
Case 2-2 Design Condition
Oper. Qty.
(Spares)
7 Oxygen Compressor
Centrifugal, multi-stage
1,189 m3/min
(42,000 scfm) Suction - 0.9 MPa
(130 psia) Discharge - 6.5 MPa (940 psia)
1,189 m3/min
(42,000 scfm) Suction - 0.9 MPa
(130 psia) Discharge - 6.5 MPa (940 psia)
2 (0)
Account 5A – Sour Gas Shift, Raw Gas Coolers, and Syngas Cleanup
Equip-ment No.
Description Type Case 2-1 Design Condition
Case 2-2 Design Condition
Oper. Qty.
(Spares)
1 Water Gas Shift Reactors
Fixed bed, catalytic
388,275 kg/hr (856,000 lb/hr) 227°C (440°F)
5.4 MPa (790 psia)
400,976 kg/hr (884,000 lb/hr) 232°C (450°F)
5.5 MPa (800 psia)
4 (0)
2 Shift Reactor Heat Recovery Exchangers
Shell and Tube
Exchanger 1: 157 GJ/hr (149 MMBtu/hr) Exchanger 2: -3 GJ/hr
(-3 MMBtu/hr)
Exchanger 1: 155 GJ/hr (147 MMBtu/hr) Exchanger 2: -4 GJ/hr
(-4 MMBtu/hr)
4 (0)
3 Raw Gas Coolers
Shell and tube with condensate drain
388,275 kg/hr (856,000 lb/hr)
400,976 kg/hr (884,000 lb/hr)
8 (0)
4 Raw Gas Knockout Drum
Vertical with mist eliminator
304,360 kg/hr (671,000 lb/hr)
304,814 kg/hr (672,000 lb/hr)
2 (0)
5 Venturi Water Spray Scrubber
Spray tower equilibrium with exiting gas stream
607,687 kg/hr (1,339,720 lb/hr)
35°C (95°F) 5.1 MPa (745 psia)
607,746 kg/hr (1,339,850 lb/hr)
35°C (95°F) 5.2 MPa (750 psia)
1 (0)
6 Mercury Adsorber
Sulfated carbon bed
303,907 kg/hr (670,000 lb/hr)
35°C (95°F) 5.1 MPa (745 psia)
303,907 kg/hr (670,000 lb/hr)
35°C (95°F) 5.2 MPa (750 psia)
2 (0)
7 Sulfur Plant Claus type 146 tonne/day (161 tpd)
146 tonne/day (161 tpd)
1 (0)
8 Acid Gas Removal Plant
Two-stage Selexol
310,711 kg/hr (685,000 lb/hr)
35°C (95°F) 5.1 MPa (740 psia)
311,164 kg/hr (686,000 lb/hr)
35°C (95°F) 5.1 MPa (745 psia)
2 (0)
9 Hydrogen-ation Reactor
Fixed bed, catalytic
18,290 kg/hr (40,323 lb/hr)
232°C (450°F) 0.1 MPa (12.3 psia)
19,149 kg/hr (42,216 lb/hr)
232°C (450°F) 0.1 MPa (12.3 psia)
1 (0)

Assessment of Hydrogen Production with CO2 Capture Volume 1: Baseline State-of-the-Art Plants
95
8/30/2010
Equip-ment No.
Description Type Case 2-1 Design Condition
Case 2-2 Design Condition
Oper. Qty.
(Spares)
10 Tail Gas Recycle Compressor
Centrifugal 13,942 kg/hr (30,737 lb/hr)
14,351 kg/hr (31,639 lb/hr)
1 (0)
Account 5B – CO2 Compressor
Equip-ment No.
Description Type Case 2-1 Design Condition
Case 2-2 Design Condition
Oper. Qty.
(Spares)
1 CO2 Compressor
Integrally geared, multi-stage centrifugal
1,133 m3/min
@ 15.3 MPa (40,000 scfm @ 2,200 psia)
1,133 m3/min
@ 15.3 MPa (40,000 scfm @ 2,200 psia)
4 (1)
Account 6 – Hydrogen Purification
Equip-ment No.
Description Type Case 2-1 Design Condition
Case 2-2 Design Condition
Oper. Qty.
(Spares)
1 Pressure Swing Adsorber
Polybed Proprietary
99,373 kg/hr (219,080 lb/hr) Syngas
35°C (94.619767°F) 5.1 MPa (740. psia)
28,259 kg/hr (62,300 lb/hr) Hydrogen
35°C (94.619767°F) 5.1 MPa (740. psia)
71,114 kg/hr (156,780 lb/hr) Off Gas
-7°C (20°F) 0.5 MPa (77. psia)
99,917 kg/hr (220,280 lb/hr) Syngas
35°C (94.5996075°F) 5.1 MPa (745. psia) 28,368 kg/hr (62,540
lb/hr) Hydrogen 35°C (94.5996075°F) 5.1 MPa (745. psia)
71,550 kg/hr (157,740 lb/hr) Off Gas
-7°C (20°F) 0.5 MPa (77. psia)
1 (0)
Account 7 – Stack, Ducting, and Off-Gas Fired Boiler
Equip-ment No.
Description
Type Case 2-1 Design Condition
Case 2-2 Design Condition
Oper. Qty.
(Spares)
1 Stack CS plate, type 409SS liner
76 m (250 ft) high x 2.7 m (9 ft) diameter
76 m (250 ft) high x 2.7 m (9 ft) diameter
1 (0)
2 Field-Erected Gas-Fired Boiler
Drum, multi-pressure with economizer section and integral deaerator Air-Fired
71,114 kg/hr (156,780 lb/hr) Off gas
1MPa (77psig) -6.7°C (20°F)
349,266 kg/hr (770,000 lb/hr) Air
3MPa (452.30396psig) 537.8°C (1000°F) 876 GJ/hr (830
MMBtu/hr)
71,550 kg/hr (157,740 lb/hr) Off gas
1MPa (77psig) -6.7°C (20°F)
349,266 kg/hr (770,000 lb/hr) Air
3MPa (452.30396psig) 537.8°C (1000°F) 886 GJ/hr (840
MMBtu/hr)
1 (0)

Assessment of Hydrogen Production with CO2 Capture Volume 1: Baseline State-of-the-Art Plants
96
8/30/2010
Account 8 – Steam turbine Generator and Auxiliaries
Equip-ment No.
Description Type Case 2-1 Design Condition
Case 2-2 Design Condition
Oper. Qty.
(Spares)
1 Steam Turbine
Commercially available advanced steam turbine
164 MW 12.4 MPa/538°C/538°C
(1800 psig/ 1,000°F/1,000°F)
119 MW 12.4
MPa/538°C/538°C (1800 psig/
1,000°F/1,000°F)
1 (0)
2 Steam Turbine Generator
Hydrogen cooled, static excitation
180 MVA @ 0.9 p.f., 24 kV, 60 Hz, 3-phase
130 MVA @ 0.9 p.f., 24 kV, 60 Hz, 3-
phase
1 (0)
3 Steam Bypass
One per HRSG
50% steam flow @ design steam
conditions
50% steam flow @ design steam
conditions
2 (0)
4 Surface Condenser
Single pass, divided waterbox including vacuum pumps
791 GJ/hr (750 MMBtu/hr), Inlet water
temperature 16°C (60°F), Water
temperature rise 11°C (20°F)
612 GJ/hr (580 MMBtu/hr), Inlet
water temperature 16°C (60°F), Water
temperature rise 11°C (20°F)
1 (0)
Account 9 – Cooling water System
Equip-ment No.
Description Type Case 2-1 Design Condition
Case 2-2 Design Condition
Oper. Qty.
(Spares)
1 Circulating Water Pumps
Vertical, wet pit
310,404 lpm @ 30 m (82,000 gpm @ 100
ft)
306,618 lpm @ 30 m (81,000 gpm @ 100 ft)
2 (0)
8 Cooling Tower Evaporative, mechanical draft, multi-cell
11°C (51.5°F) wet bulb / 16°C (60°F) CWT / 27°C (80°F) HWT / 1,730 GJ/hr (1,640 MMBtu/hr)
heat duty
11°C (51.5°F) wet bulb / 16°C (60°F) CWT / 27°C (80°F) HWT / 1,720 GJ/hr (1,630
MMBtu/hr) heat duty
1 (0)
Account 10 – Slag Recovery and Handling
Equip-ment No.
Description Type Case 2-1 Design Condition
Case 2-2 Design Condition
Oper. Qty.
(Spares)
1 Slag Quench Tank
Water bath 253,623 liters (67,000 gal)
253,623 liters (67,000 gal)
2 (1)
2 Slag Crusher Roll 14 tonne/hr (15 tph) 14 tonne/hr (15 tph) 2 (1)
3 Slag Depressurizer
Lock Hopper
14 tonne/hr (15 tph) 14 tonne/hr (15 tph) 2 (1)

Assessment of Hydrogen Production with CO2 Capture Volume 1: Baseline State-of-the-Art Plants
97
8/30/2010
Equip-ment No.
Description Type Case 2-1 Design Condition
Case 2-2 Design Condition
Oper. Qty.
(Spares)
4 Slag Receiving Tank
Horizontal, weir
151,416 liters (40,000 gal)
151,416 liters (40,000 gal)
2 (1)
5 Black Water Overflow Tank
Shop fabricated
68,137 liters (18,000 gal)
68,137 liters (18,000 gal)
2 (0)
6 Slag Conveyor
Drag chain 14 tonne/hr (15 tph) 14 tonne/hr (15 tph) 2 (0)
7 Slag Separation Screen
Vibrating 14 tonne/hr (15 tph) 14 tonne/hr (15 tph) 2 (0)
8 Coarse Slag Conveyor
Belt/bucket 14 tonne/hr (15 tph) 14 tonne/hr (15 tph) 2 (0)
9 Fine Ash Settling Tank
Vertical, gravity
215,768 liters (57,000 gal)
215,768 liters (57,000 gal)
2 (0)
10 Fine Ash Recycle Pumps
Horizontal centrifugal
38 lpm @ 14 m H2O (10 gpm @ 46 ft H2O)
38 lpm @ 14 m H2O (10 gpm @ 46 ft
H2O)
2 (2)
11 Grey Water Storage Tank
Field erected
68,137 liters (18,000 gal)
68,137 liters (18,000 gal)
2 (0)
12 Grey Water Pumps
Centrifugal 227 lpm @ 564 m H2O (60 gpm @ 1,850 ft
H2O)
227 lpm @ 564 m H2O
(60 gpm @ 1,850 ft H2O)
2 (2)
13 Slag Storage Bin
Vertical, field erected
998 tonne (1,100 tons) 998 tonne (1,100 tons)
2 (0)
14 Unloading Equipment
Telescoping chute
109 tonne/hr (120 tph) 109 tonne/hr (120 tph)
1 (0)
Account 11 – Accessory Electric Plant
Equip-ment No.
Description Type Case 2-1 Design Condition
Case 2-2 Design Condition
Oper. Qty.
(Spares)
1 STG Step-up Transformer
Oil-filled 24 kV/345 kV, 180 MVA, 3-ph, 60 Hz
24 kV/345 kV, 130 MVA, 3-ph, 60 Hz
1 (0)
2 High Voltage Auxiliary Transformer
Oil-filled 345 kV/13.8 kV, 61 MVA, 3-ph, 60 Hz
345 kV/13.8 kV, 60 MVA, 3-ph, 60 Hz
2 (0)
3 Medium Voltage Auxiliary Transformer
Oil-filled 24 kV/4.16 kV, 43 MVA, 3-ph, 60 Hz
24 kV/4.16 kV, 42 MVA, 3-ph, 60 Hz
1 (1)
4 Low Voltage Transformer
Dry ventilated 4.16 kV/480 V, 6 MVA, 3-ph, 60 Hz
4.16 kV/480 V, 6 MVA, 3-ph, 60 Hz
1 (1)
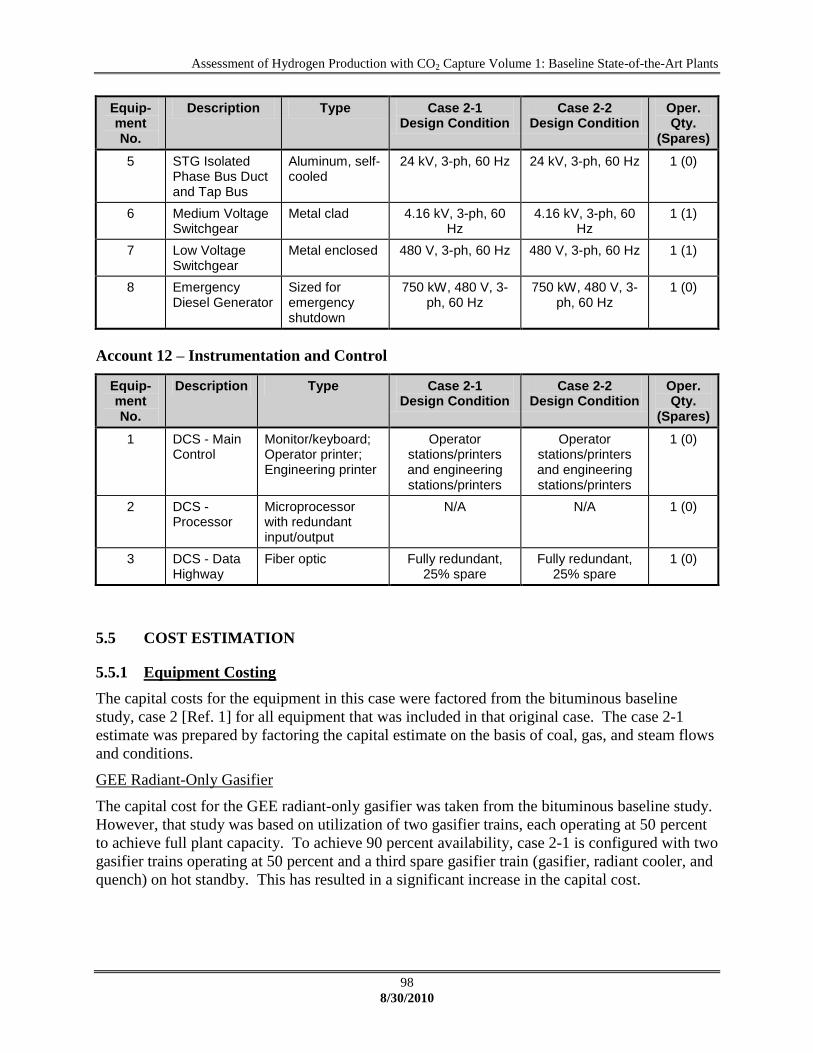
Assessment of Hydrogen Production with CO2 Capture Volume 1: Baseline State-of-the-Art Plants
98
8/30/2010
Equip-ment No.
Description Type Case 2-1 Design Condition
Case 2-2 Design Condition
Oper. Qty.
(Spares)
5 STG Isolated Phase Bus Duct and Tap Bus
Aluminum, self-cooled
24 kV, 3-ph, 60 Hz 24 kV, 3-ph, 60 Hz 1 (0)
6 Medium Voltage Switchgear
Metal clad 4.16 kV, 3-ph, 60 Hz
4.16 kV, 3-ph, 60 Hz
1 (1)
7 Low Voltage Switchgear
Metal enclosed 480 V, 3-ph, 60 Hz 480 V, 3-ph, 60 Hz 1 (1)
8 Emergency Diesel Generator
Sized for emergency shutdown
750 kW, 480 V, 3-ph, 60 Hz
750 kW, 480 V, 3-ph, 60 Hz
1 (0)
Account 12 – Instrumentation and Control
Equip-ment No.
Description Type Case 2-1 Design Condition
Case 2-2 Design Condition
Oper. Qty.
(Spares)
1 DCS - Main Control
Monitor/keyboard; Operator printer; Engineering printer
Operator stations/printers and engineering stations/printers
Operator stations/printers and engineering stations/printers
1 (0)
2 DCS - Processor
Microprocessor with redundant input/output
N/A N/A 1 (0)
3 DCS - Data Highway
Fiber optic Fully redundant, 25% spare
Fully redundant, 25% spare
1 (0)
5.5 COST ESTIMATION
5.5.1 Equipment Costing
The capital costs for the equipment in this case were factored from the bituminous baseline
study, case 2 [Ref. 1] for all equipment that was included in that original case. The case 2-1
estimate was prepared by factoring the capital estimate on the basis of coal, gas, and steam flows
and conditions.
GEE Radiant-Only Gasifier
The capital cost for the GEE radiant-only gasifier was taken from the bituminous baseline study.
However, that study was based on utilization of two gasifier trains, each operating at 50 percent
to achieve full plant capacity. To achieve 90 percent availability, case 2-1 is configured with two
gasifier trains operating at 50 percent and a third spare gasifier train (gasifier, radiant cooler, and
quench) on hot standby. This has resulted in a significant increase in the capital cost.
Assessment of Hydrogen Production with CO2 Capture Volume 1: Baseline State-of-the-Art Plants
99
8/30/2010
GEE Quench Gasifier
The capital cost for the GEE quench gasifier is adapted from the bituminous baseline study and
factored utilizing the relative costs for radiant-only and quench from a detailed Texaco gasifier
cost estimate by Parsons in 2002. Case 2-2 is also configured with two gasifier trains operating
at 50 percent and a third spare gasifier train (gasifier, radiant cooler, and quench) on hot standby.
PSA
The capital cost of the PSA is based on a budgetary quotation from Krupp-Uhde to RDS. The
1998 quotation encompassed the turnkey installation of an SMR plant to produce 70 MMSCFD
of hydrogen. The case 2 estimates were prepared by extracting the PSA cost and upgrading the
Krupp estimate to June 2007 utilizing Chemical Engineering Plant Cost Indices [Ref. 9] and
factoring the capital estimate on the basis of hydrogen production capacity.
Off-Gas Fired Boiler
The cost of the PSA off-gas air fired boiler was based on published estimates for field-erected
boilers.
Balance of Plant
The cost of the balance of plant that constitutes the complete hydrogen production plant was
based on an in-house model that has been used to develop the capital costs and economic results
for many process applications. Cost attributed to balance of plant amounts to 15 percent of the
installed plant equipment cost.
Contingency
Project and process contingencies were added to the estimates for the coal to hydrogen cases
based on values includes in the original reference study [Ref. 1]. Project contingencies were
added to cover project uncertainty and the cost of additional equipment that could result from a
more detailed design. The project contingencies represent costs that are expected to occur. Each
capital account was evaluated against the level of estimate detail, field experience, and the basis
for the equipment pricing to define project contingency. Process contingencies were added for
the gasification and CO2 removal system elements of the technology that are not considered
commercially proven based on the level of detail available and commercially proven status for
the system elements.
5.5.2 O&M Costs
Fixed and variable operating costs were estimated for each case. The coal price used for this
study was $1.55/GJ ($1.64/MMBtu) for Illinois No. 6 on a HHV basis. All other consumable
costs were assumed to match those used in the baseline reference report [Ref. 1]. An emissions
value of $30/tonne of CO2 emitted was also applied to reflect potential environmental
regulations. A credit of $105/MWh for the net electricity generated in case 2-1 and a debit of
$105/MWh for the net electricity consumed in case 2-2 are included in the costs. This value is
consistent with the cost of electricity (COE) generated in an environment where coal-based
power plants are built with carbon capture and sequestration systems.

Assessment of Hydrogen Production with CO2 Capture Volume 1: Baseline State-of-the-Art Plants
100
8/30/2010
5.5.3 Cost Estimating Results
The total overnight cost (TOC) for the case 2-1 plant producing 242 MMSCFD (617 metric tons)
of hydrogen (99.6 percent H2 by volume) per day from coal with CO2 capture is estimated to be
$1,851 million in June 2007 dollars resulting in a first year cost of hydrogen(COH) of
$3.09/kg H2. Exhibit 5-15 and Exhibit 5-16 show the capital and operating costs for this plant.
The TOC for the case 2-2 plant producing 243 MMSCFD of hydrogen (619 metric tons) of
hydrogen (99.6 percent H2 by volume) per day from coal with CO2 capture is estimated to be
$1,597 million in June 2007 dollars resulting in a first year COH of $2.89/kg H2. Exhibit 5-17
and Exhibit 5-18 show the capital and operating costs for this plant. Capital cost estimating
methodology is explained in Section 2.
The additional costs of CO2 TS&M for cases 2-1 and 2-2 are shown in Exhibit 5-19. Both sets of
values are estimated to total $0.20/kg H2, bringing the total cost of hydrogen production with
CO2 capture to $3.29/kg H2 for case 2-1 and $3.09/kg H2 for case 2-2.

Assessment of Hydrogen Production with CO2 Capture Volume 1: Baseline State-of-the-Art Plants
101
8/30/2010
Exhibit 5-15 Case 2-1 Capital Cost Summary
Client: USDOE/NETL Report Date 21-Aug-10
Project: 401.01.04 Activity 5 Assessment of Baseline and Advanced Hydrogen Production Plants
Case: Case 2-1 Baseline Coal-to-Hydrogen with CC&S
Plant Size: 616,527 kg H2/day Cost Base Jun-07
Acct
Bare
Erected Cost Eng'g CM Contingencies
TOTAL PLANT
COST
No. Item/Description $1,000 H.O.& Fee Process Project $1,000
1 COAL HANDLING $28,008 $2,801 $0 $6,162 $36,970
2 COAL PREP & FEED $43,489 $4,349 $1,578 $9,883 $59,300
3 FEEDWATER & MISC. BOP SYSTEMS $18,574 $1,857 $0 $4,840 $25,272
4 GASIFIER ISLAND
4.1 GEE Syngas Cooler Gasifier System $341,298 $34,130 $47,365 $65,956 $488,748
4.2 Syngas Cooler(w/ Gasifier - 4.1 ) $0 $0 $0
4.3 ASU/Oxidant Compression $193,147 $19,315 $0 $21,246 $233,707
4.4 Scrubber & Low Temperature Cooling $16,102 $1,610 $0 $3,542 $21,255
4.4-4.9 Other Gasification Equipment $16,352 $1,635 $0 $4,497 $22,484
SUBTOTAL 4. $566,898 $56,690 $47,365 $95,241 $766,194
5A GAS CLEANUP & PIPING
5A.1 Double Stage Selexol $137,069 $13,707 $27,414 $35,638 $213,828
5A.2 Elemental Sulfur Plant $25,719 $2,572 $0 $5,658 $33,949
5A.3 Mercury Removal $2,436 $244 $122 $560 $3,362
5A.4 Shift Reactors $13,487 $1,349 $0 $2,967 $17,802
5A.7 Fuel Gas Piping $1,080 $108 $0 $238 $1,426
5A.9 HGCU Foundations $1,058 $106 $0 $233 $1,397
SUBTOTAL 5A. $180,849 $18,085 $27,536 $45,294 $271,764
5B CO2 COMPRESSION
5B.1 CO2 Compressor & Drying $29,448 $2,945 $0 $6,479 $38,872
SUBTOTAL 5B. $29,448 $2,945 $0 $6,479 $38,872
6 HYDROGEN PRODUCTION
6.1 Pressure Swing Adsorber $40,412 $4,041 $0 $8,891 $53,344
6.2 Hydrogen Compressor $0 $0 $0 $0 $0
SUBTOTAL 7 $40,412 $4,041 $0 $8,891 $53,344
7 HRSG, DUCTING, STACK
7.1 Off Gas Fired Boiler and Stack $20,309 $2,031 $0 $6,702 $29,042
7.2 Hot Gas Expander $0 $0 $0 $0 $0
SUBTOTAL 6 $20,309 $2,031 $0 $6,702 $29,042
8 STEAM TURBINE GENERATOR
8.1 Steam TG & Accessories $21,606 $2,161 $0 $4,753 $28,521
8.2 Turbine Plant Auxiliaries and Steam Piping $11,976 $1,198 $0 $2,635 $15,808
SUBTOTAL 8 $33,582 $3,358 $0 $7,388 $44,329
9 COOLING WATER SYSTEM $15,715 $1,572 $0 $3,457 $20,744
10 ASH/SPENT SORBENT HANDLING SYS $56,865 $5,687 $0 $9,383 $71,935
11 ACCESSORY ELECTRIC PLANT $20,017 $2,002 $0 $4,404 $26,422
12 INSTRUMENTATION & CONTROL $21,083 $2,108 $1,054 $4,849 $29,095
13 IMPROVEMENTS TO SITE $15,813 $1,581 $0 $5,218 $22,612
14 BUILDINGS & STRUCTURES $16,867 $1,687 $0 $3,711 $22,264
TOTAL COST $1,107,930 $110,793 $77,533 $221,901 $1,518,158

Assessment of Hydrogen Production with CO2 Capture Volume 1: Baseline State-of-the-Art Plants
102
8/30/2010
Exhibit 5-15 Case 2-1 Capital Cost Summary (continued)
Client: USDOE/NETL Report Date 21-Aug-10
Project: 401.01.04 Activity 5 Assessment of Baseline and Advanced Hydrogen Production Plants
Case: Case 2-1 Baseline Coal-to-Hydrogen with CC&S
Plant Size: 616,527 kg H2/day Cost Base Jun-07
Acct
Bare
Erected Cost Eng'g CM Contingencies
TOTAL PLANT
COST
No. Item/Description $1,000 H.O.& Fee Process Project $1,000
TOTAL COST $1,107,930 $110,793 $77,533 $221,901 $1,518,158
Owner's Costs
Preproduction Costs
6 Months All Labor $11,537
1 Month Maintenance Materials $3,036
1 Month Non-fuel Consumables $417
1 Month Waste Disposal $316
25% of 1 Months Fuel Cost at 100% CF $1,697
2% of TPC $30,363
Total $47,367
Inventory Capital
60 day supply of consumables at 100% CF $835
0.5% of TPC (spare parts) $7,591
Total $8,426
Initial Cost for Catalyst and Chemicals $7,218
Land $900
Other Owner's Costs $227,724
Financing Costs $40,990
Total Overnight Costs (TOC) $1,850,782
TASC Multiplier 1.201
Total As-Spent Cost (TASC) $2,223,325

Assessment of Hydrogen Production with CO2 Capture Volume 1: Baseline State-of-the-Art Plants
103
8/30/2010
Exhibit 5-16 Case 2-1 Operating Cost Summary
Skilled Operator 2
Operator 10
Foreman 1
Lab Tech's, etc. 3
TOTAL-O.J.'s 16 Operating Labor $6,313,507
Operator Base Rate $34.65 Maintenance Labor $15,181,578
Operator Labor Burden (% of Base) 30.00% Admin & Support $1,578,377
Labor O-H Charge Rate (% of labor) 25.00% Property Taxes and Insurance $30,363,155
Total Overnight Cost $1,850,781,835 TOTAL FIXED O&M $53,436,617
Consumption Unit Rate Unit Cost Unit
Initial Fill
Cost
Annual
Variable O&M
Costs
Maintenance Material $32,792,208
Initial Fill /Day
Water 5,081 1,000 gals/day $1.08 1000 gal $0 $1,805,574
Water Treatment Chemicals 0 25,410 lb/day $0.17 lb $0 $1,444,631
Carbon (Mercury Removal) (lb) 76,126 104 lb/day $1.05 lb $79,945 $35,878
Water Gas Shift Catalyst (ft3) 6,290 4 ft3/day $498.83 ft3 $3,137,696 $705,659
Selexol Solution (gal) 298,541 95 gal/day $13.40 gal $3,999,928 $418,126
Claus Catalyst(ft3) 0 2 ft3/day $131.27 ft3 $0 $98,008
Electric Power Bought (Generated) (7) MW MWh
Purchased Electric Power (Revenue) (172) MWh/day $105.00 MWh $0 ($5,927,191)
Solid Waste Disposal 641 ton/day $16.23 ton $0 $3,417,849
Carbon Dioxide Emissions Tax 1,304 ton/day 27.22$ ton CO2 $0 $11,661,501
TOTAL VARIABLE O&M $7,217,569 $46,452,244
Coal (Illinois #6) 5,844 tons/day $38.19 ton $73,307,753
$1.64 MMBtu
TOTAL ANNUAL O&M COSTS $173,196,613
FIRST YEAR CAPITAL CHARGE $459,987,842
Hydrogen Production 616,527 kg/day
Plant Capacity Factor: 90% First Year H2 COST $/kg $3.13
Variable O&M Operating Costs
Annual Fixed O&M Labor and Material Costs
Annual Fuel Costs
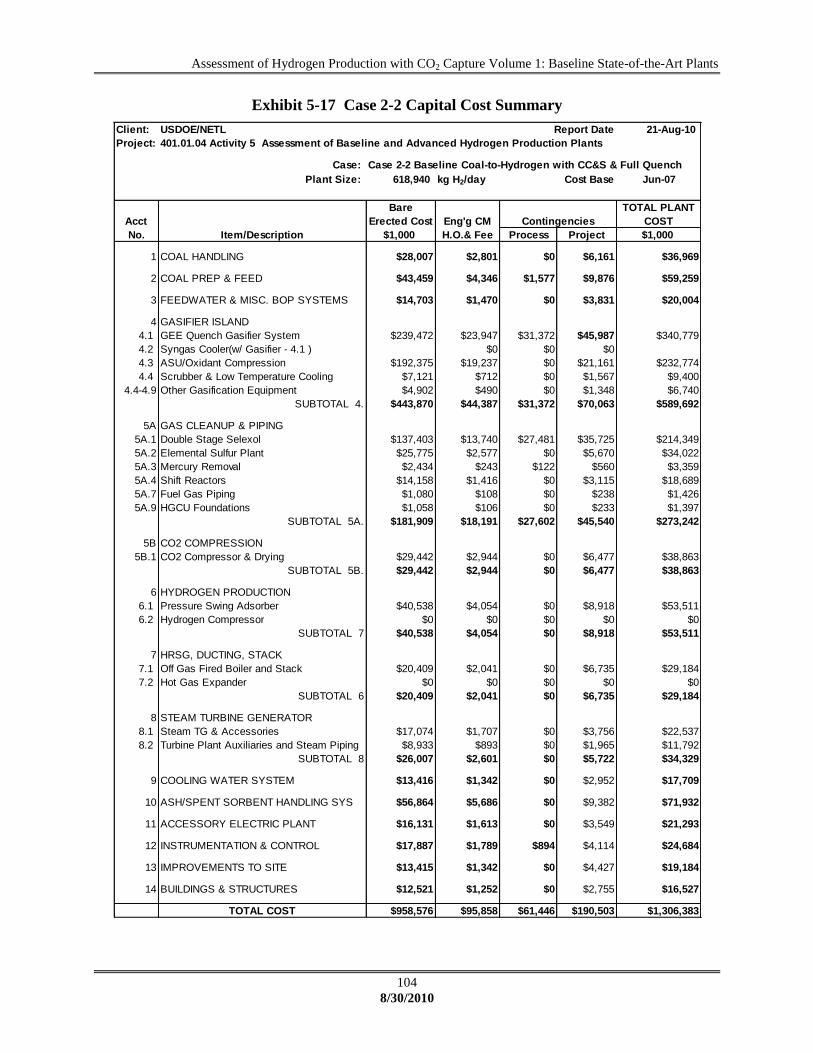
Assessment of Hydrogen Production with CO2 Capture Volume 1: Baseline State-of-the-Art Plants
104
8/30/2010
Exhibit 5-17 Case 2-2 Capital Cost Summary
Client: USDOE/NETL Report Date 21-Aug-10
Project: 401.01.04 Activity 5 Assessment of Baseline and Advanced Hydrogen Production Plants
Case: Case 2-2 Baseline Coal-to-Hydrogen with CC&S & Full Quench
Plant Size: 618,940 kg H2/day Cost Base Jun-07
Acct
Bare
Erected Cost Eng'g CM Contingencies
TOTAL PLANT
COST
No. Item/Description $1,000 H.O.& Fee Process Project $1,000
1 COAL HANDLING $28,007 $2,801 $0 $6,161 $36,969
2 COAL PREP & FEED $43,459 $4,346 $1,577 $9,876 $59,259
3 FEEDWATER & MISC. BOP SYSTEMS $14,703 $1,470 $0 $3,831 $20,004
4 GASIFIER ISLAND
4.1 GEE Quench Gasifier System $239,472 $23,947 $31,372 $45,987 $340,779
4.2 Syngas Cooler(w/ Gasifier - 4.1 ) $0 $0 $0
4.3 ASU/Oxidant Compression $192,375 $19,237 $0 $21,161 $232,774
4.4 Scrubber & Low Temperature Cooling $7,121 $712 $0 $1,567 $9,400
4.4-4.9 Other Gasification Equipment $4,902 $490 $0 $1,348 $6,740
SUBTOTAL 4. $443,870 $44,387 $31,372 $70,063 $589,692
5A GAS CLEANUP & PIPING
5A.1 Double Stage Selexol $137,403 $13,740 $27,481 $35,725 $214,349
5A.2 Elemental Sulfur Plant $25,775 $2,577 $0 $5,670 $34,022
5A.3 Mercury Removal $2,434 $243 $122 $560 $3,359
5A.4 Shift Reactors $14,158 $1,416 $0 $3,115 $18,689
5A.7 Fuel Gas Piping $1,080 $108 $0 $238 $1,426
5A.9 HGCU Foundations $1,058 $106 $0 $233 $1,397
SUBTOTAL 5A. $181,909 $18,191 $27,602 $45,540 $273,242
5B CO2 COMPRESSION
5B.1 CO2 Compressor & Drying $29,442 $2,944 $0 $6,477 $38,863
SUBTOTAL 5B. $29,442 $2,944 $0 $6,477 $38,863
6 HYDROGEN PRODUCTION
6.1 Pressure Swing Adsorber $40,538 $4,054 $0 $8,918 $53,511
6.2 Hydrogen Compressor $0 $0 $0 $0 $0
SUBTOTAL 7 $40,538 $4,054 $0 $8,918 $53,511
7 HRSG, DUCTING, STACK
7.1 Off Gas Fired Boiler and Stack $20,409 $2,041 $0 $6,735 $29,184
7.2 Hot Gas Expander $0 $0 $0 $0 $0
SUBTOTAL 6 $20,409 $2,041 $0 $6,735 $29,184
8 STEAM TURBINE GENERATOR
8.1 Steam TG & Accessories $17,074 $1,707 $0 $3,756 $22,537
8.2 Turbine Plant Auxiliaries and Steam Piping $8,933 $893 $0 $1,965 $11,792
SUBTOTAL 8 $26,007 $2,601 $0 $5,722 $34,329
9 COOLING WATER SYSTEM $13,416 $1,342 $0 $2,952 $17,709
10 ASH/SPENT SORBENT HANDLING SYS $56,864 $5,686 $0 $9,382 $71,932
11 ACCESSORY ELECTRIC PLANT $16,131 $1,613 $0 $3,549 $21,293
12 INSTRUMENTATION & CONTROL $17,887 $1,789 $894 $4,114 $24,684
13 IMPROVEMENTS TO SITE $13,415 $1,342 $0 $4,427 $19,184
14 BUILDINGS & STRUCTURES $12,521 $1,252 $0 $2,755 $16,527
TOTAL COST $958,576 $95,858 $61,446 $190,503 $1,306,383

Assessment of Hydrogen Production with CO2 Capture Volume 1: Baseline State-of-the-Art Plants
105
8/30/2010
Exhibit 5-17 Case 2-2 Capital Cost Summary (continued)
Client: USDOE/NETL Report Date 21-Aug-10
Project: 401.01.04 Activity 5 Assessment of Baseline and Advanced Hydrogen Production Plants
Case: Case 2-2 Baseline Coal-to-Hydrogen with CC&S & Full Quench
Plant Size: 618,940 kg H2/day Cost Base Jun-07
Acct
Bare
Erected Cost Eng'g CM Contingencies
TOTAL PLANT
COST
No. Item/Description $1,000 H.O.& Fee Process Project $1,000
Owner's Costs
Preproduction Costs
6 Months All Labor $10,478
1 Month Maintenance Materials $2,613
1 Month Non-fuel Consumables $3,117
1 Month Waste Disposal $316
25% of 1 Months Fuel Cost at 100% CF $1,697
2% of TPC $26,128
Total $44,348
Inventory Capital
60 day supply of consumables at 100% CF $848
0.5% of TPC (spare parts) $6,532
Total $7,380
Initial Cost for Catalyst and Chemicals $7,260
Land $900
Other Owner's Costs $195,957
Financing Costs $35,272
Total Overnight Costs (TOC) $1,597,501
TASC Multiplier 1.201
Total As-Spent Cost (TASC) $1,919,061

Assessment of Hydrogen Production with CO2 Capture Volume 1: Baseline State-of-the-Art Plants
106
8/30/2010
Exhibit 5-18 Case 2-2 Operating Cost Summary
Skilled Operator 2
Operator 10
Foreman 1
Lab Tech's, etc. 3
TOTAL-O.J.'s 16 Operating Labor $6,313,507
Operator Base Rate $34.65 Maintenance Labor $13,063,827
Operator Labor Burden (% of Base) 30.00% Admin & Support $1,578,377
Labor O-H Charge Rate (% of labor) 25.00% Property Taxes and Insurance $26,127,654
Total Overnight Cost $1,597,500,891 TOTAL FIXED O&M $47,083,365
Consumption Unit Rate Unit Cost Unit
Initial Fill
Cost
Annual Variable
O&M Costs
Maintenance Material $28,217,867
Initial Fill /Day
Water 5,189 1,000 gals/day $1.08 1000 gal $0 $1,843,971
Water Treatment Chemicals 0 25,950 lb/day $0.17 lb $0 $1,475,332
Carbon (Mercury Removal) (lb) 76,126 104 lb/day $1.05 lb $79,945 $35,878
Water Gas Shift Catalyst (ft3) 6,290 4 ft3/day $498.83 ft3 $3,137,696 $705,659
Selexol Solution (gal) 301,684 96 gal/day $13.40 gal $4,042,032 $422,527
Claus Catalyst(ft3) 0 2 ft3/day $131.27 ft3 $0 $98,008
Electric Power Bought (Generated) 35 MW
Purchased Electric Power (Revenue) 843 MWh/day $105.00 MWh $0 $29,081,317
Solid Waste Disposal 641 ton/day $16.23 ton $0 $3,417,604
Carbon Dioxide Emissions Tax 1,313 ton/day 27.22$ ton CO2 $0 $11,742,952
TOTAL VARIABLE O&M $7,259,673 $77,041,114
Coal (Illinois #6) 5,844 tons/day $38.19 ton $73,302,484
$1.64 MMBtu
TOTAL ANNUAL O&M COSTS $197,426,964
FIRST YEAR CAPITAL CHARGE $397,140,235
Hydrogen Production 618,940 kg/day
Plant Capacity Factor: 90% First Year H2 COST $/kg $2.92
Variable O&M Operating Costs
Annual Fixed O&M Labor and Material Costs
Annual Fuel Costs

Assessment of Hydrogen Production with CO2 Capture Volume 1: Baseline State-of-the-Art Plants
107
8/30/2010
Exhibit 5-19 Cases 2-1 & 2-2 Cost Estimate CO2 TS&M
Parameter Case 2-1 Case 2-2
TPC of Transport, million $ 80.43 80.43
TPC of Storage, million $ 50.17 50.16
Capital Fund for Life-Cycle CO2 Monitoring Costs, million $ 33.01 33.00
Total Capital TS&M 163.62 163.60
First Year Annual Operating Costs at 100% Capacity Factor
Transport - Fixed O&M, million $ 0.43 0.43
Storage - Variable O&M, million $ 0.04 0.04
Storage - Fixed O&M, million $ 0.21 0.21
Total First Year Cost CO2 TS&M, $/kg H2 0.20 0.20
Total First Year Cost without CO2 TS&M, $/kg H2 (see Exhibit 5-16 and Exhibit 5-18) 3.13 2.92
TOTAL First Year COH, $/kg H2 3.33 3.13

Assessment of Hydrogen Production with CO2 Capture Volume 1: Baseline State-of-the-Art Plants
108
8/30/2010
This page intentionally left blank
Assessment of Hydrogen Production with CO2 Capture Volume 1: Baseline State-of-the-Art Plants
109
8/30/2010
6. SUMMARY
The objective of this study was to analyze potential plant configurations to determine the
baseline performance and cost of producing hydrogen from natural gas and coal. The plants
were assumed to be designed and constructed in the near future based on technologies as they
exist today, with a planned startup year of 2015. This report covers the following cases:
Case 1-1 – Baseline Steam Methane Reforming (SMR) Hydrogen Plant with CO2
Capture and Sequestration matching the hydrogen generation rate of case 2-1
Case 1-2 – Baseline Steam Methane Reforming (SMR) Hydrogen Plant with CO2
Capture and Sequestration matching the hydrogen generation rate of case 2-2
Case 2-1 – Baseline Coal Gasification Hydrogen Plant using GE Energy Radiant-Only
Gasifier with CO2 Capture and Sequestration and Hydrogen Separation by Pressure
Swing Adsorption
Case 2-2 – Baseline Coal Gasification Hydrogen Plant using GE Energy Quench Gasifier
with CO2 Capture and Sequestration and Hydrogen Separation by Pressure Swing
Adsorption
The overall performance results for all four cases are summarized in Exhibit 6-1.
The effective thermal efficiencies (based on HHV) are shown graphically in Exhibit 6-2. The
SMR cases have the highest ETE.

Assessment of Hydrogen Production with CO2 Capture Volume 1: Baseline State-of-the-Art Plants
110
8/30/2010
Exhibit 6-1 Overall Performance
Case 1-1 1-2 2-1 2-2
Steam Turbine Power, kWe 0 0 155,600 112,700
Net Auxiliary Load, kWe 34,200 34,330 148,440 147,830
Net Plant Power, kWe -34,200 -34,330 7,160 -35,130
Natural Gas SMR Feed Flow rate, kg/hr (lb/hr)
84,947 (187,276)
85,328 (188,116)
N/A N/A
Supplemental Natural Gas Feed Flow rate, kg/hr (lb/hr)
10,319 (22,750)
10,319 (22,750)
N/A N/A
Coal Feed Flow rate, kg/hr (lb/hr) N/A N/A 220,904
(487,011) 220,889
(486,976)
Thermal Input1, GJ/hr (MMBtu/hr) 5,051 (4,787) 5,071 (4,806) 5,994 (5,681) 5,994 (5,681)
Hydrogen Production, kg/day 616,528 618,936 616,527 618,940
Hydrogen Production, lb/hr 56,634 56,855 56,634 56,855
Hydrogen Production, million nm3/day
(MMSCFD) 6.9 (242) 6.9 (243) 6.9 (242) 6.9 (243)
Cold Gas Efficiency2 72.18% 72.17% 60.81% 61.05%
Effective Thermal Efficiency3 69.74% 69.73% 61.24% 58.94%
Plant Availability 90.00% 90.00% 90.00% 90.00%
Condenser Duty, GJ/hr (MMBtu/hr) N/A N/A 680 520
CO2 Captured, tonne/day (tpd) 5,456 (6,014) 5,478 (6,038) 10,954
(12,075) 10,951
(12,071)
CO2 Emissions, tonne/day (tpd) 606 (668) 609 (671) 1,183 (1,304) 1,191 (1,313)
Raw Water Withdrawal, m3/min (gpm) 12.4 (3,265) 12.4 (3,278) 16.1 (4,253) 16.4 (4,324)
Raw Water Consumption, m3/min (gpm) 10.1 (2,673) 10.2 (2,683) 13.4 (3,529) 13.6 (3,604)
1 HHV of Natural Gas is 53,014 kJ/kg (22,792 Btu/lb)
& HHV of Illinois No. 6 coal is 27,135 kJ/kg (11,666 Btu/lb) 2 CGE = (Hydrogen Product Heating Value)/ Fuel Heating Value, HHV
3 ETE = (Hydrogen + - Power Heating Value)/ Fuel Heating Value, HHV

Assessment of Hydrogen Production with CO2 Capture Volume 1: Baseline State-of-the-Art Plants
111
8/30/2010
Exhibit 6-2 Effective Thermal Efficiencies
The environmental targets were described in Section 1.6. The projected annual emissions of
SO2, NOx, and particulate matter are shown in Exhibit 6-3 and the projected annual mercury
emissions are shown in Exhibit 6-4. Projected annual CO2 emissions are shown in Exhibit 6-5 .
The following observations can be made:
NOx emissions are highest for the SMR case.
CO2 emissions are lowest for the SMR case.
72.18% 72.17%
60.81% 61.05%
69.74% 69.73%
61.24%58.94%
0.00%
10.00%
20.00%
30.00%
40.00%
50.00%
60.00%
70.00%
80.00%
90.00%
100.00%
1-1 NG SMR 1-2 NG SMR 2-1 GE-RQ & PSA 2-2 GE-Q & PSA
Eff
icie
ncy
Cold Gas Ef f iciency Ef fective Thermal Ef f iciency
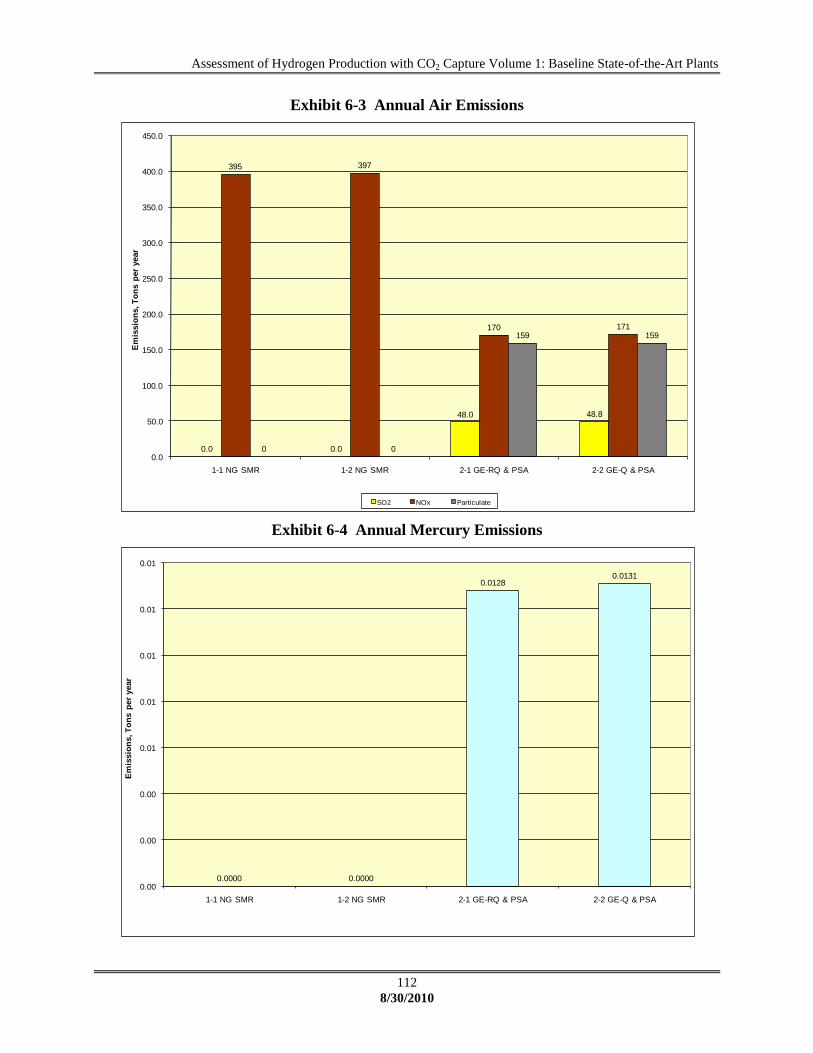
Assessment of Hydrogen Production with CO2 Capture Volume 1: Baseline State-of-the-Art Plants
112
8/30/2010
Exhibit 6-3 Annual Air Emissions
Exhibit 6-4 Annual Mercury Emissions
0.0 0.0
48.0 48.8
395 397
170 171
0 0
159 159
0.0
50.0
100.0
150.0
200.0
250.0
300.0
350.0
400.0
450.0
1-1 NG SMR 1-2 NG SMR 2-1 GE-RQ & PSA 2-2 GE-Q & PSA
Em
issio
ns, T
on
s p
er
year
SO2 NOx Particulate
0.0000 0.0000
0.01280.0131
0.00
0.00
0.00
0.01
0.01
0.01
0.01
0.01
1-1 NG SMR 1-2 NG SMR 2-1 GE-RQ & PSA 2-2 GE-Q & PSA
Em
issio
ns, T
on
s p
er
year
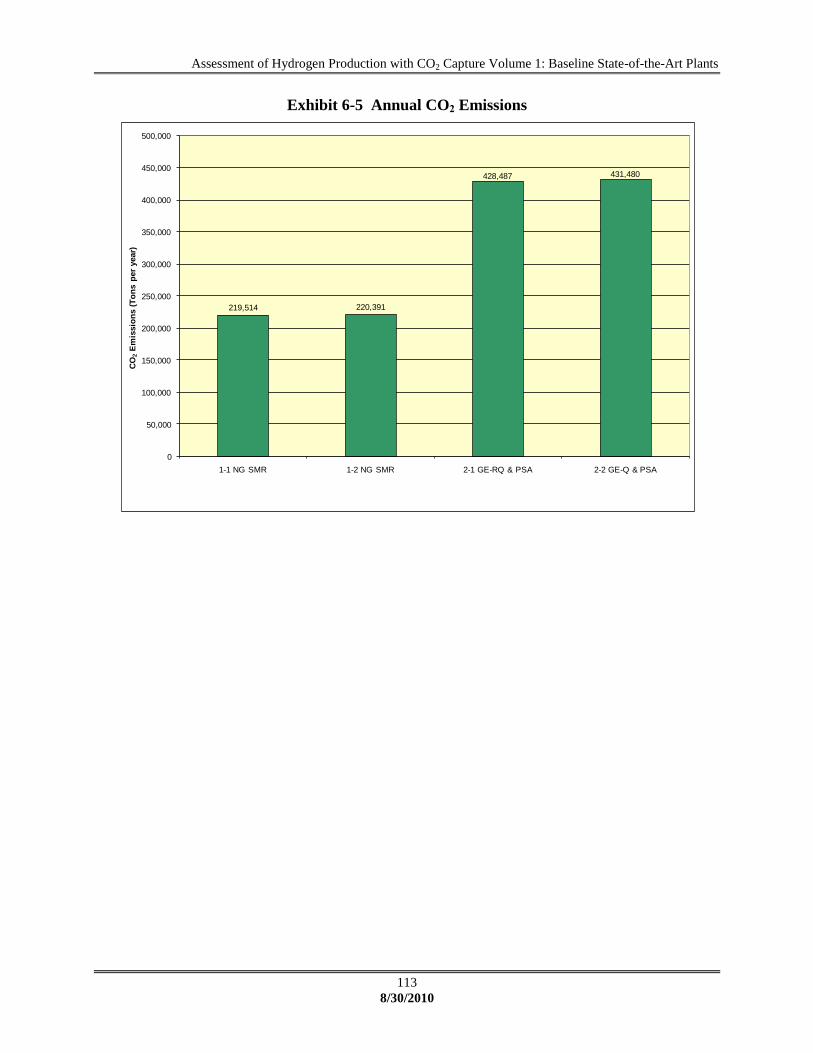
Assessment of Hydrogen Production with CO2 Capture Volume 1: Baseline State-of-the-Art Plants
113
8/30/2010
Exhibit 6-5 Annual CO2 Emissions
219,514 220,391
428,487 431,480
0
50,000
100,000
150,000
200,000
250,000
300,000
350,000
400,000
450,000
500,000
1-1 NG SMR 1-2 NG SMR 2-1 GE-RQ & PSA 2-2 GE-Q & PSA
CO
2E
mis
sio
ns (
To
ns p
er
year)
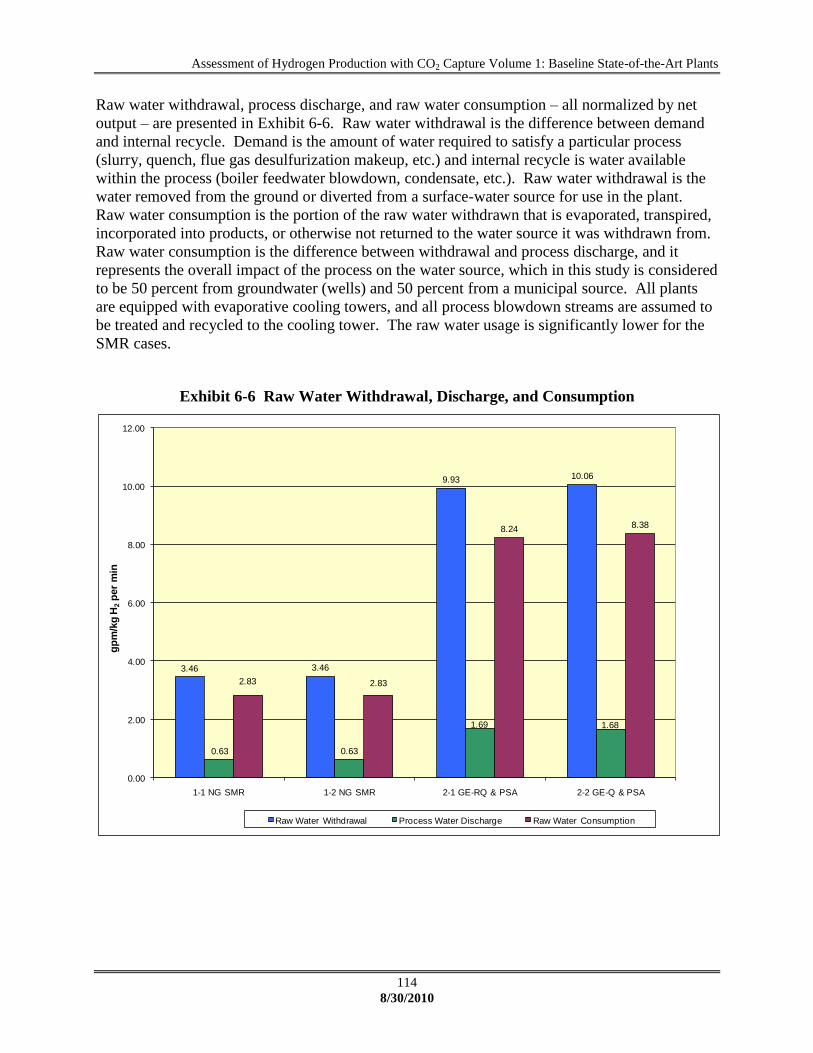
Assessment of Hydrogen Production with CO2 Capture Volume 1: Baseline State-of-the-Art Plants
114
8/30/2010
Raw water withdrawal, process discharge, and raw water consumption – all normalized by net
output – are presented in Exhibit 6-6. Raw water withdrawal is the difference between demand
and internal recycle. Demand is the amount of water required to satisfy a particular process
(slurry, quench, flue gas desulfurization makeup, etc.) and internal recycle is water available
within the process (boiler feedwater blowdown, condensate, etc.). Raw water withdrawal is the
water removed from the ground or diverted from a surface-water source for use in the plant.
Raw water consumption is the portion of the raw water withdrawn that is evaporated, transpired,
incorporated into products, or otherwise not returned to the water source it was withdrawn from.
Raw water consumption is the difference between withdrawal and process discharge, and it
represents the overall impact of the process on the water source, which in this study is considered
to be 50 percent from groundwater (wells) and 50 percent from a municipal source. All plants
are equipped with evaporative cooling towers, and all process blowdown streams are assumed to
be treated and recycled to the cooling tower. The raw water usage is significantly lower for the
SMR cases.
Exhibit 6-6 Raw Water Withdrawal, Discharge, and Consumption
3.46 3.46
9.93 10.06
0.63 0.63
1.69 1.68
2.83 2.83
8.24 8.38
0.00
2.00
4.00
6.00
8.00
10.00
12.00
1-1 NG SMR 1-2 NG SMR 2-1 GE-RQ & PSA 2-2 GE-Q & PSA
gp
m/k
g H
2p
er
min
Raw Water Withdrawal Process Water Discharge Raw Water Consumption

Assessment of Hydrogen Production with CO2 Capture Volume 1: Baseline State-of-the-Art Plants
115
8/30/2010
The cost estimates carry an accuracy of ±30 percent, consistent with the screening study level of
engineering effort expended in the design. The results of the capital estimation calculations are
shown in Exhibit 6-7. All capital and operations and maintenance (O&M) costs are presented as
“overnight costs” expressed in June 2007 dollars. The estimating methodology and calculations
are presented in Section 2.
The total plant cost (TPC) includes all equipment (complete with initial chemical and catalyst
loadings), materials, labor (direct and indirect), engineering and construction management, and
contingencies (process and project). The total overnight cost (TOC) for each plant was
calculated by adding owner’s costs to the TPC. Additional financing costs including escalation
during construction were estimated and added to the TOC to provide the total as-spent cost
(TASC). The TASC normalized on net hydrogen output is shown for each plant configuration in
Exhibit 6-8. The coal to hydrogen cases are substantially more capital intensive than the SMR
cases.
Exhibit 6-7 Capital Cost Estimation Results
Case 1-1 1-2 2-1 2-2
H2 Production (kg H2/day) 616,528 618,936 616,527 618,940
Bare Erected Cost, 1000$ $342,553 $343,355 $1,107,930 $958,576
Eng, CM, HO, Fees, etc., 1000$ $34,255 $34,335 $110,793 $95,858
Project Contingency, 1000$ $82,913 $83,107 $221,901 $190,503
Process Contingency, 1000$ $32,832 $32,909 $77,553 $61,446
Total Plant Cost, 1000$ $492,553 $493,706 $1,518,158 $1,306,383
Total Plant Cost, $/(kg H2/day) $799 $798 $2,462 $2,111
Owner’s Cost, 1000$ $118,642 $118,926 $332,624 $291,118
Total Overnight Cost, 1000$ $611,195 $612,632 $1,850,782 $1,597,501
Total Overnight Cost, $/(kg H2/day) $991 $990 $3,002 $2,581
Financing Cost, 1000$ $66,905 $67,062 $372,543 $321,561
Total As-Spent Cost 1000$ $678,100 $679,694 $2,223,325 $1,918,061
Total As-Spent Cost, $/(kg H2/day) $1,100 $1,098 $3,606 $3,101

Assessment of Hydrogen Production with CO2 Capture Volume 1: Baseline State-of-the-Art Plants
116
8/30/2010
Exhibit 6-8 Total As-Spent Cost Components
Fixed and variable operating costs were estimated for each case. An emissions value of
$30/tonne of CO2 emitted was also applied to reflect potential environmental regulations. A
value of $105/MWh was applied for any excess power generated or required for each case. This
value is consistent with the cost of electricity (COE) generated in an environment where coal-
based power plants are built with carbon capture and sequestration systems.
The first year costs of hydrogen (COH) were derived using the NETL Power Systems Financial
Model (PSFM). COH is assumed to escalate at three percent per year for the thirty-year
economic life of the plant. The project financial structure is representative of a high-risk fuels
project with no loan guarantees or other government subsidies. The annual operating costs and
resulting first year COH values are shown in Exhibit 6-9.
$1,100 $1,098
$3,606
$3,101
$0
$500
$1,000
$1,500
$2,000
$2,500
$3,000
$3,500
$4,000
1-1 NG SMR 1-2 NG SMR 2-1 GE-RQ & PSA 2-2 GE-Q & PSA
To
tal
As-S
pen
t C
ost
Co
mp
on
en
ts,
$/k
g H
2p
er
day
Bare Erected Cost Eng, CM, HO, Fees etc Project Contingency Process Contingency
Owners Costs Financing Costs TASC

Assessment of Hydrogen Production with CO2 Capture Volume 1: Baseline State-of-the-Art Plants
117
8/30/2010
Exhibit 6-9 Cost of Hydrogen Estimation Results
Case 1-1 1-2 2-1 2-2
H2 Production (kg H2/day) 616,528 618,936 616,527 618,940
Fuel Natural Gas Natural Gas Illinois #6 Illinois #6
Natural Gas Price ($/MMBtu) $6.55 $6.55 N/A N/A
Natural Gas Price ($/Ton) $298.47 $298.47 N/A N/A
Natural Gas Consumption, tpd 2,520 2,530 N/A N/A
Coal Price ($/MMBtu) N/A N/A $1.64 $1.64
Coal Price ($/Ton) N/A N/A $38.19 $38.19
Coal Consumption, tpd N/A N/A 5,844 5,844
Capacity Factor, % 90% 90% 90% 90%
First Year Fuel Cost, $/yr $247,114,305 $248,102,221 $73,307,753 $73,302,484
First Year Fixed O&M Cost, $/yr $22,668,479 $22,703,075 $53,436,617 $47,083,365
First Year Variable O&M Cost, $/yr $14,937,300 $14,978,807 $40,717,934 $36,216,846
First Year Electricity Cost (Revenue), $/yr $28,311,444 $28,419,061 ($5,927,191) $29,081,317
First Year Carbon Emissions Value, $/yr $5,974,186 $5,998,070 $11,661,501 $11,742,952
First Year Capital Charges, $/yr $124,920,703 $125,214,495 $459,987,842 $397,140,235
Capital, $/kg H2 0.62 0.62 2.27 1.95
Fixed O&M, $/kg H2 0.11 0.11 0.26 0.23
Variable O&M, $/kg H2 0.07 0.07 0.17 0.18
Power purchased (sold,) $/kg H2 0.14 0.14 0.03 0.14
CO2 Emissions Value, $/kg H2 0.03 0.03 0.06 0.06
Fuel, $/kg H2 1.22 1.22 0.36 0.36
Total First Year COH, $/kg H2 2.19 2.19 3.13 2.92
First year COH, $/1000scf H2 5.59 5.58 7.96 7.45
First Year CO2 TS&M, $/yr $23,520,371 $23,675,800 $41,344,396 $41,349,212
CO2 TS&M, $/kg H2 0.12 0.12 0.20 0.20
First year COH including CO2
TS&M, $/kg H2 2.31 2.31 3.33 3.13
First year COH including CO2
TS&M, $/1000scf H2 5.88 5.88 8.49 7.97
The first year COH results are shown graphically in Exhibit 6-10 with the capital cost, fixed
operating cost, variable operating cost, and fuel cost components shown separately. CO2
Transport, Storage and Monitoring (TS&M) costs are also shown as a separate bar segment. The
following conclusions can be drawn:
The COH is dominated by capital charges in both of the coal cases. The capital cost
component of COH comprises 62-68 percent in the coal cases but only 23 percent in the
natural gas SMR cases.
The fuel cost component is relatively minor in the coal cases, representing 11-12 percent
of the COH, but it dominates the natural gas SMR cases at 53 percent.
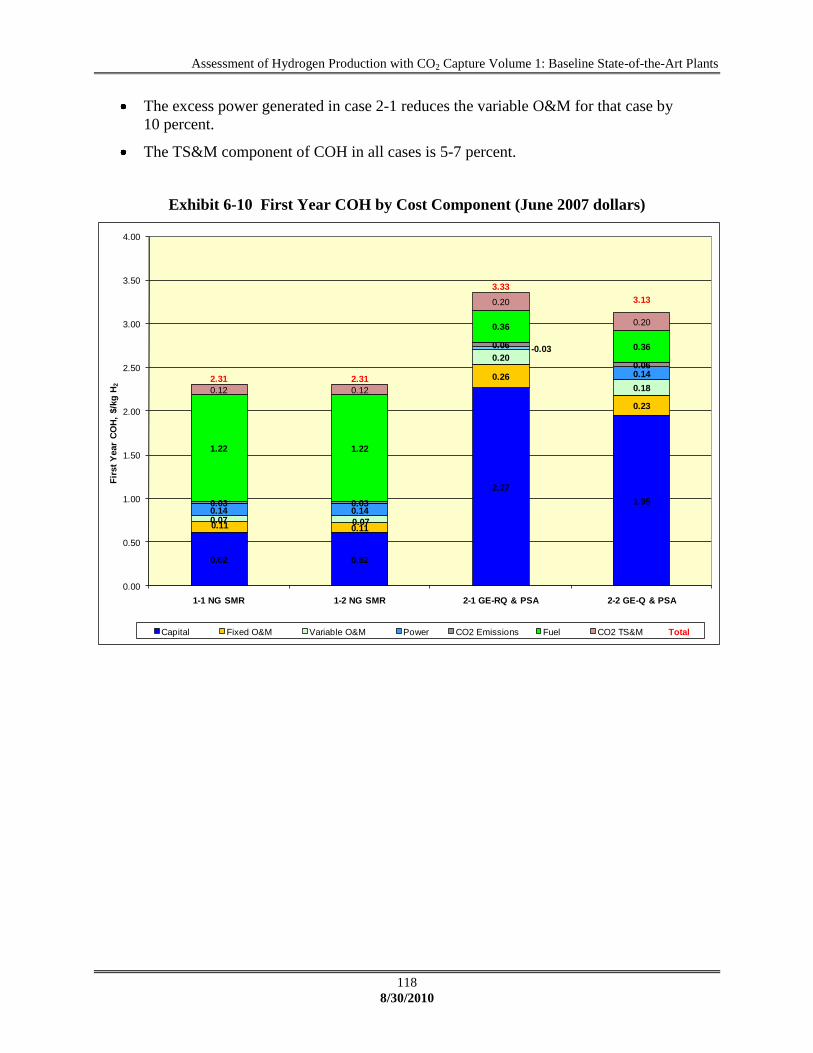
Assessment of Hydrogen Production with CO2 Capture Volume 1: Baseline State-of-the-Art Plants
118
8/30/2010
The excess power generated in case 2-1 reduces the variable O&M for that case by
10 percent.
The TS&M component of COH in all cases is 5-7 percent.
Exhibit 6-10 First Year COH by Cost Component (June 2007 dollars)
0.62 0.62
2.27
1.95
0.11 0.11
0.26
0.23
0.07 0.07
0.20
0.18
0.14 0.14
-0.03
0.14
0.03 0.03
0.06
0.06
1.22 1.22
0.36
0.36
0.12 0.12
0.20
0.20
2.31 2.31
3.33
3.13
0.00
0.50
1.00
1.50
2.00
2.50
3.00
3.50
4.00
1-1 NG SMR 1-2 NG SMR 2-1 GE-RQ & PSA 2-2 GE-Q & PSA
Fir
st
Year
CO
H,
$/k
g H
2
Capital Fixed O&M Variable O&M Power CO2 Emissions Fuel CO2 TS&M Total

Assessment of Hydrogen Production with CO2 Capture Volume 1: Baseline State-of-the-Art Plants
119
8/30/2010
Exhibit 6-11 shows the first year COH sensitivity to the carbon dioxide emissions value. The
COH values calculated for the $30/tonne assumed in this study are shown on each line. As
expected, all cases show a slight linear increase in COH with an increase in the CO2 emissions
value. The natural gas based SMR cases increase by approximately four percent for a
$100/tonne increase in value. The coal to hydrogen cases increase by approximately six percent
for the same $100/tonne increase.
Exhibit 6-11 First Year COH Sensitivity to CO2 Emissions Value (June 2007 dollars)
0.00
0.50
1.00
1.50
2.00
2.50
3.00
3.50
0 5 10 15 20 25 30 35 40 45 50
Fir
st
Ye
ar
CO
H (
$/k
g)
(ex
clu
din
g C
O2
TS
&M
)
CO2 Emissions Value ($/tonne CO2 emission)
1-1 NG SMR 1-2 NG SMR 2-1 GE-RQ & PSA 2-2 GE-Q & PSA
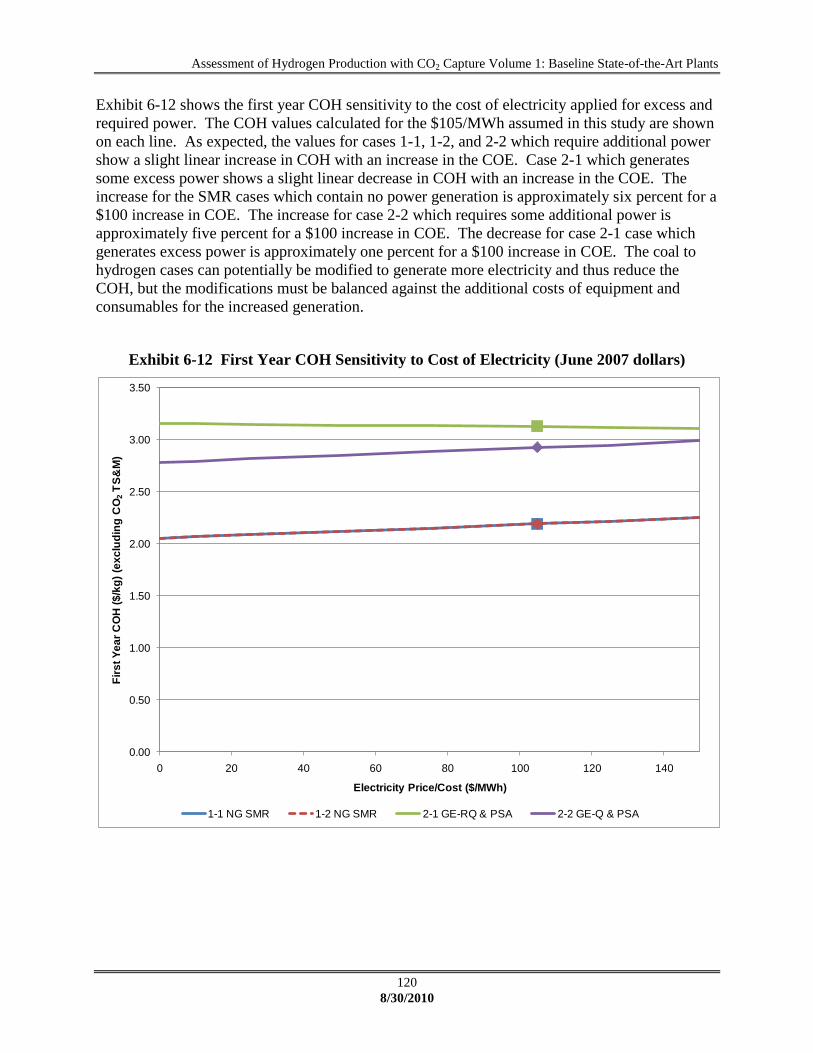
Assessment of Hydrogen Production with CO2 Capture Volume 1: Baseline State-of-the-Art Plants
120
8/30/2010
Exhibit 6-12 shows the first year COH sensitivity to the cost of electricity applied for excess and
required power. The COH values calculated for the $105/MWh assumed in this study are shown
on each line. As expected, the values for cases 1-1, 1-2, and 2-2 which require additional power
show a slight linear increase in COH with an increase in the COE. Case 2-1 which generates
some excess power shows a slight linear decrease in COH with an increase in the COE. The
increase for the SMR cases which contain no power generation is approximately six percent for a
$100 increase in COE. The increase for case 2-2 which requires some additional power is
approximately five percent for a $100 increase in COE. The decrease for case 2-1 case which
generates excess power is approximately one percent for a $100 increase in COE. The coal to
hydrogen cases can potentially be modified to generate more electricity and thus reduce the
COH, but the modifications must be balanced against the additional costs of equipment and
consumables for the increased generation.
Exhibit 6-12 First Year COH Sensitivity to Cost of Electricity (June 2007 dollars)
0.00
0.50
1.00
1.50
2.00
2.50
3.00
3.50
0 20 40 60 80 100 120 140
Fir
st
Ye
ar
CO
H (
$/k
g)
(ex
clu
din
g C
O2
TS
&M
)
Electricity Price/Cost ($/MWh)
1-1 NG SMR 1-2 NG SMR 2-1 GE-RQ & PSA 2-2 GE-Q & PSA
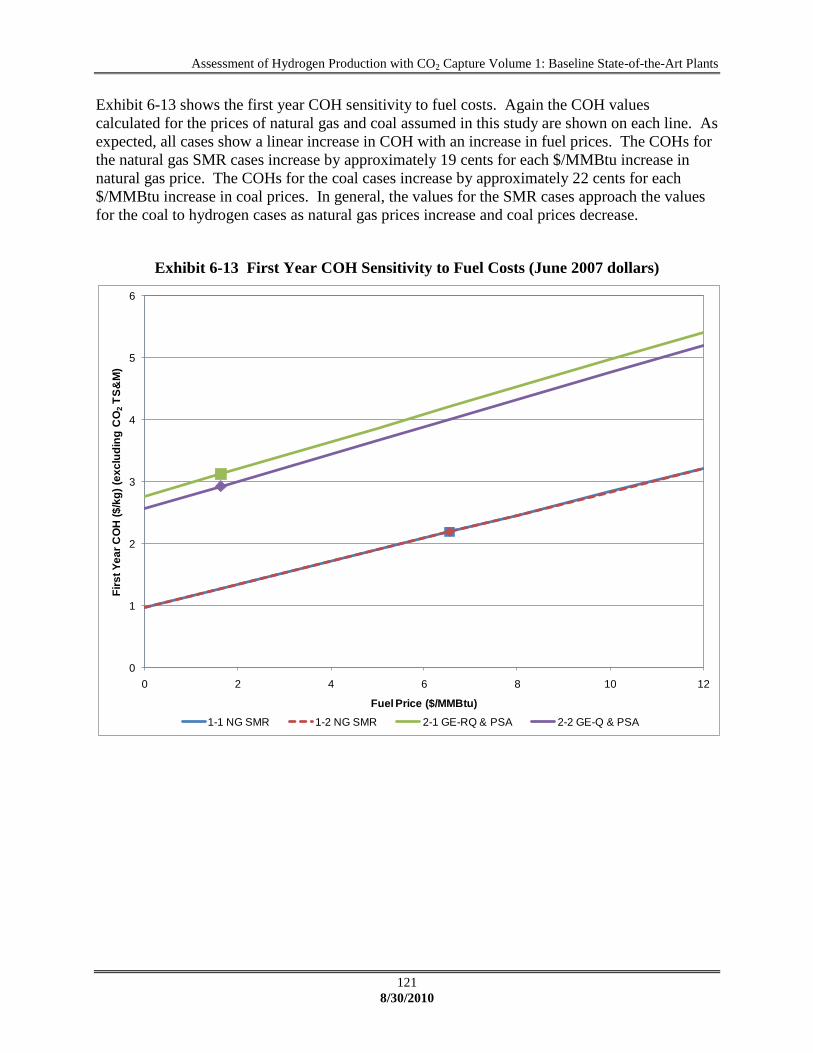
Assessment of Hydrogen Production with CO2 Capture Volume 1: Baseline State-of-the-Art Plants
121
8/30/2010
Exhibit 6-13 shows the first year COH sensitivity to fuel costs. Again the COH values
calculated for the prices of natural gas and coal assumed in this study are shown on each line. As
expected, all cases show a linear increase in COH with an increase in fuel prices. The COHs for
the natural gas SMR cases increase by approximately 19 cents for each $/MMBtu increase in
natural gas price. The COHs for the coal cases increase by approximately 22 cents for each
$/MMBtu increase in coal prices. In general, the values for the SMR cases approach the values
for the coal to hydrogen cases as natural gas prices increase and coal prices decrease.
Exhibit 6-13 First Year COH Sensitivity to Fuel Costs (June 2007 dollars)
0
1
2
3
4
5
6
0 2 4 6 8 10 12
Fir
st
Ye
ar
CO
H (
$/k
g)
(ex
clu
din
g C
O2
TS
&M
)
Fuel Price ($/MMBtu)
1-1 NG SMR 1-2 NG SMR 2-1 GE-RQ & PSA 2-2 GE-Q & PSA

Assessment of Hydrogen Production with CO2 Capture Volume 1: Baseline State-of-the-Art Plants
122
8/30/2010
The sensitivity of first year COH to capacity factor is shown in Exhibit 6-14. Again the COH
values calculated for the capacity factor assumed in this study are shown on each line. At high
capacity factors, the COH value for the coal cases approaches the COH for the natural gas cases.
All cases show a substantial decrease in COH as the capacity factor increases. At very lower
capacity factors (10 to 20 percent), the COH for the natural gas cases are less than one-half that
of the two coal cases.
Exhibit 6-14 First Year COH Sensitivity to Capacity Factor (June 2007 dollars)
The first year COH for coal to hydrogen with CO2 capture cases is estimated to be approximately
$1.08 to $1.35 per kg of hydrogen greater than the COH for hydrogen generated from natural gas
by the current commercial SMR technology with the addition of CO2 capture. As gasification
and CO2 capture technologies become more commercially available, this differential should
decrease and the coal to hydrogen cases would likely become more economically viable. Natural
gas prices above $9.60/MMBtu would also make the coal to hydrogen cases more competitively
attractive.
0
2
4
6
8
10
12
14
16
18
20
10% 20% 30% 40% 50% 60% 70% 80% 90% 100%
Fir
st
Ye
ar
CO
H (
$/k
g)
(ex
clu
din
g C
O2
TS
&M
)
Capacity Factor, %
1-1 NG SMR 1-2 NG SMR 2-1 GE-RQ & PSA 2-2 GE-Q & PSA
Assessment of Hydrogen Production with CO2 Capture Volume 1: Baseline State-of-the-Art Plants
123
8/30/2010
7. REFERENCES
1 “Cost and Performance Baseline for Fossil Energy Plants, Volume 1: Bituminous Coal
and Natural Gas to Electricity.” Report No. DOE/NETL-2007/1281, Final Report
(Original Issue Date, May 2007; Revision 1 Issue Date, August 2007), Revision 2, March
2010 release pending, http://www.netl.doe.gov/technologies/coalpower/refshelf.html
2 “Quality Guidelines for Energy System Studies”, Prepared by: Office of Systems and
Policy Support, Gilbert V. McGurl, Robert E. James, Edward L. Parsons, John A.
Ruether, John G. Wimer; February 24, 2004
http://www.netl.doe.gov/publications/others/pdf/QGESS%20-%209-30-03_3_1.pdf
3 Power Systems Financial Model Version 5.0, September 2006
http://www.netl.doe.gov/technologies/coalpower/gasification/pubs/finance_model.html
4 Wimer, John, “Recommended Project Finance Structures for the Economic Analysis of
Fossil-Based Energy Projects,” September 8, 2008
5 Improvement in Power Generation with Post-Combustion Capture of CO2, IEA
Greenhouse Gas R&D Programme, Report PH4/33, November 2004
6 Smith, Lawrence A., Gupta, Neeraj, Sass, Bruce M. and Bubenik, Thomas A.,
“Engineering and Economic Assessment of Carbon Dioxide Sequestration in Saline
Formations,” Battelle Memorial Institute, 2001
7 Ciferno, Jared P. and McIlvried, Howard, “CO2 Flow Modeling and Pipe Diameter
Determination,” February, 2003.
8 “Economic Evaluation of CO2 Storage and Sink Enhancement Options,” Tennessee
Valley Authority, NETL, EPRI, December 2002.
9 “Chemical Engineering Plant Cost Index;” http://www.che.com/pci/