statistic and pro. b. e. (civil iv_computer_e&c vi)
TRANSCRIPT

8/14/2019 Statistic and PRO. B. E. (Civil IV_Computer_E&C VI)
http://slidepdf.com/reader/full/statistic-and-pro-b-e-civil-ivcomputerec-vi 1/16

8/14/2019 Statistic and PRO. B. E. (Civil IV_Computer_E&C VI)
http://slidepdf.com/reader/full/statistic-and-pro-b-e-civil-ivcomputerec-vi 2/16
Downloaded From: www.bhawesh.com.np
Downloaded From :- www.bhawesh.com.np2
Q. [7] [a] What are the properties of a good estimator? Explain any twoof them. [6][b] A sample of 900 members has a mean 3.4 and s.d 2.61. If thepopulation is normal and its mean is unknown, find the 95% and98% confidence limits of true mean. [6]
Q. [8] [a] What are null and alternative hypothesis? Describe the errorsin hypothesis testing. [6][b] A company claims that its light bulbs are superior to those ofa competitor on the basis of a study which showed that a sample of40 of its bulbs have an average life time of 628 hours of continuoususe with a standard deviation of 27 hours, while a sample of 30bulbs made by the competitor has an average life-time of 619 hoursof continuous use with a standard deviation of 25 hours. Check at5% level of confidence, whether this claim is justified. [6]
Q. [9] [a] What do you mean by t-test ? Write when and how a paired t-test is used. [6][b] Ten individuals are chosen at random from a population andtheir heights in inches are found to be63,63,66,66,67,68,69,70,71,71. In the light of these data discuss thesuggestion that the mean height in the population is 66 inches.[6]
Q. [10] [a] Write down the steps involved in 2 χ -test . [6]
[b] Obtained the equation of two lines of regression for thefollowing data. Also estimate the most likely marks in Statisticswhen marks of Physics are 30. [6]
Marks in Physics 25 28 35 32 31 36 29 38 34 32Marks in Statistics 43 46 49 41 36 32 31 30 33 39

8/14/2019 Statistic and PRO. B. E. (Civil IV_Computer_E&C VI)
http://slidepdf.com/reader/full/statistic-and-pro-b-e-civil-ivcomputerec-vi 3/16

8/14/2019 Statistic and PRO. B. E. (Civil IV_Computer_E&C VI)
http://slidepdf.com/reader/full/statistic-and-pro-b-e-civil-ivcomputerec-vi 4/16

8/14/2019 Statistic and PRO. B. E. (Civil IV_Computer_E&C VI)
http://slidepdf.com/reader/full/statistic-and-pro-b-e-civil-ivcomputerec-vi 5/16

8/14/2019 Statistic and PRO. B. E. (Civil IV_Computer_E&C VI)
http://slidepdf.com/reader/full/statistic-and-pro-b-e-civil-ivcomputerec-vi 6/16

8/14/2019 Statistic and PRO. B. E. (Civil IV_Computer_E&C VI)
http://slidepdf.com/reader/full/statistic-and-pro-b-e-civil-ivcomputerec-vi 7/16

8/14/2019 Statistic and PRO. B. E. (Civil IV_Computer_E&C VI)
http://slidepdf.com/reader/full/statistic-and-pro-b-e-civil-ivcomputerec-vi 8/16
Downloaded From: www.bhawesh.com.np
Downloaded From :- www.bhawesh.com.np8
Obtain the marginal probability of distribution of X and Y andhence their expected values. [6]
GROUP-B
Q. [7] [a] What do you understand by point estimate and intervalestimate? Discuss the properties of a good estimator. [6][b] A random sampler of 500 articles was taken from a largeconsignment and 60 were found to be defective. Obtained the 98%and 99% confidence limits for the percentage number of defectivearticles in the consignment. [6]
Q. [8] [a] Discuss hypothesis. What types of hypothesis do you know?Discuss each of them. [6][b] In a study of ten business houses, it was found that their meanincome is Rs. 6200 per month and standard deviation is Rs. 690.Test statistically the belief that the business houses have an averageincome of Rs. 5500.
Q. [9] [a] How do you test the significance of the difference between themean of two samples? [6][b] Calculate the coefficient of correlation from the followingdata: [6]
X 1 2 3 4 5 6 7 8 9Y 9 8 10 12 11 13 14 16 15
Q. [10] [a] Define chi-square statistic. Discuss the conditions for the
validity of Chi-square test. [6][b] In an industry, 200 workers, employed for a specific job, wereclassified according to their performance ad training receiver/notreceived to test independence of a specific training andperformance. The data is summarized as follows:
[6]
Performance
Good Not Good Total
Trained 100 50 150Untrained 20 30 50Total 120 80 200
Use Chi-square test of independence at 5% level of significanceand write your conclusion.

8/14/2019 Statistic and PRO. B. E. (Civil IV_Computer_E&C VI)
http://slidepdf.com/reader/full/statistic-and-pro-b-e-civil-ivcomputerec-vi 9/16

8/14/2019 Statistic and PRO. B. E. (Civil IV_Computer_E&C VI)
http://slidepdf.com/reader/full/statistic-and-pro-b-e-civil-ivcomputerec-vi 10/16
Downloaded From: www.bhawesh.com.np
Downloaded From :- www.bhawesh.com.np10
-1 0 0.1 0.10 0.2 0.2 0.21 0 0.1 0.1
Obtain the marginal probability of distribution of X and Y andhence their expected values and variance. [6]
GROUP-B
Q. [7]
[a] Find the maximum likely hood estimator of mean ( ) ofPoisson distribution. [6][b] A sample of 4 shift has show that the average quantity of ironextracted to be 36.8 tones per shift and standard deviation of 2.8tones. Construct 90% and 99% confident limit.[6]
Q. [8] [a] What do you mean by hypothesis? What are its types?Describe them with example. [6][b] The average number of articles produced by two machine perday are 200 and 250 respectively with standard deviation 20 & 25on the basis of records of 250 days production. Can you regard boththe machine equally efficient at 1% level of significance?[6]
Q. [9] [a] What do you mean by level of significance? Explain t-test fortesting the significance of the difference between two samplemeans. State clearly the assumption involved. [6][b] A certain stimulus administered to each of 1,2 patients resultedin the following changes in blood pressure: 5,2,8,-1,3,0,-2,1,5,0,4,6.Can it be concluded that the stimulus will in general beaccompanied by an increase in blood pressure?
[6]
Q. [10] [a] Among 64 offspring of a certain cross between guinea pigs, 43were red, 10 were black and 20 were white . According to genericmodel these numbers should be in the ratio 9:3:4. Are the data
consistent with the model at 5% level?[6]
X 73 36 98 55 75 82 90 62 65 39Y 84 51 91 60 68 62 86 58 53 47
Calculate the coefficient of correlation.
8/14/2019 Statistic and PRO. B. E. (Civil IV_Computer_E&C VI)
http://slidepdf.com/reader/full/statistic-and-pro-b-e-civil-ivcomputerec-vi 11/16
8/14/2019 Statistic and PRO. B. E. (Civil IV_Computer_E&C VI)
http://slidepdf.com/reader/full/statistic-and-pro-b-e-civil-ivcomputerec-vi 12/16
Downloaded From: www.bhawesh.com.np
Downloaded From :- www.bhawesh.com.np12
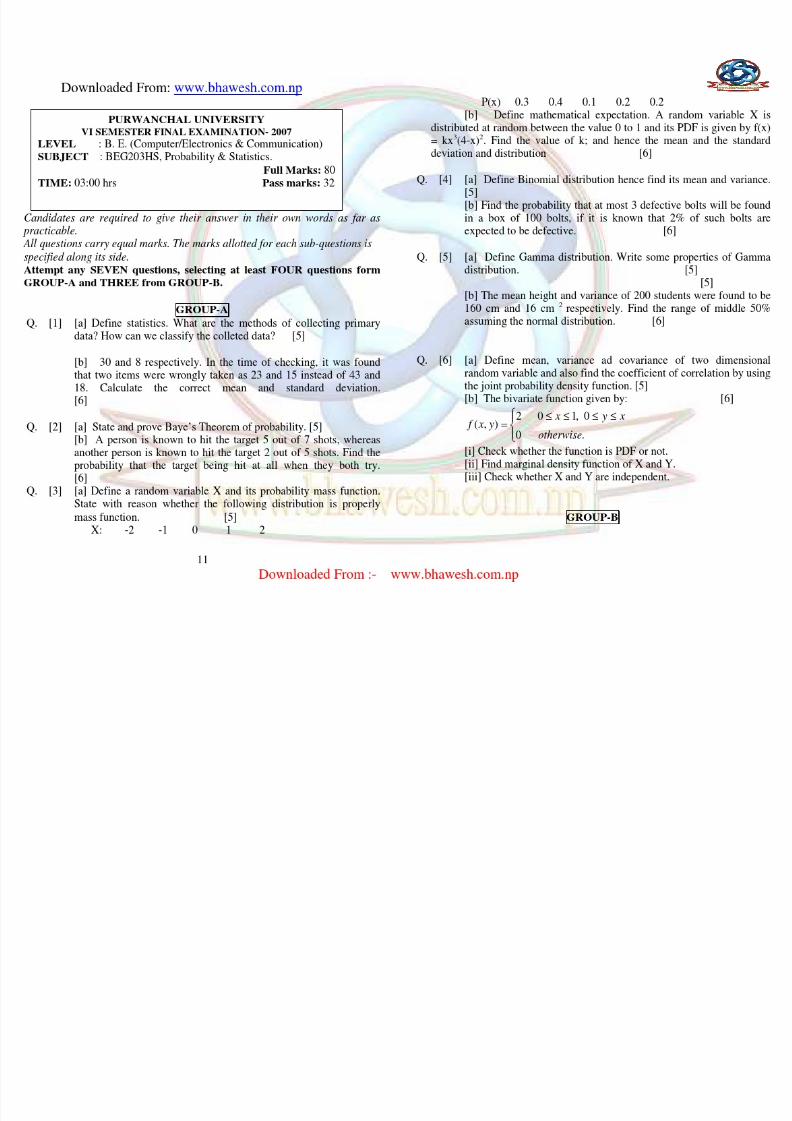
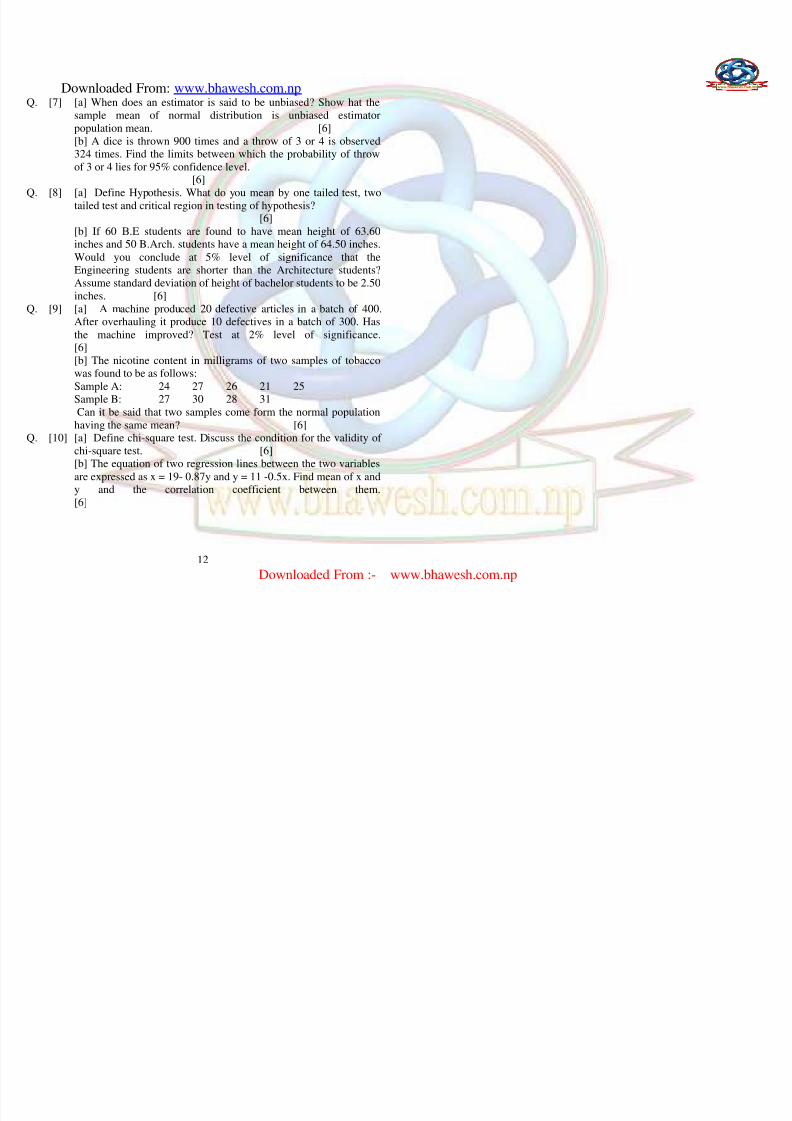
Q. [7] [a] When does an estimator is said to be unbiased? Show hat thesample mean of normal distribution is unbiased estimatorpopulation mean. [6][b] A dice is thrown 900 times and a throw of 3 or 4 is observed324 times. Find the limits between which the probability of throwof 3 or 4 lies for 95% confidence level.
[6]Q. [8] [a] Define Hypothesis. What do you mean by one tailed test, two
tailed test and critical region in testing of hypothesis?[6]
[b] If 60 Β .E students are found to have mean height of 63.60inches and 50 B.Arch. students have a mean height of 64.50 inches.Would you conclude at 5% level of significance that theEngineering students are shorter than the Architecture students?Assume standard deviation of height of bachelor students to be 2.50inches. [6]
Q. [9] [a] A machine produced 20 defective articles in a batch of 400.
After overhauling it produce 10 defectives in a batch of 300. Hasthe machine improved? Test at 2% level of significance.[6][b] The nicotine content in milligrams of two samples of tobaccowas found to be as follows:Sample A: 24 27 26 21 25Sample B: 27 30 28 31Can it be said that two samples come form the normal population
having the same mean? [6]Q. [10] [a] Define chi-square test. Discuss the condition for the validity ofchi-square test. [6][b] The equation of two regression lines between the two variablesare expressed as x = 19- 0.87y and y = 11 -0.5x. Find mean of x andy and the correlation coefficient between them.[6]
8/14/2019 Statistic and PRO. B. E. (Civil IV_Computer_E&C VI)
http://slidepdf.com/reader/full/statistic-and-pro-b-e-civil-ivcomputerec-vi 13/16

8/14/2019 Statistic and PRO. B. E. (Civil IV_Computer_E&C VI)
http://slidepdf.com/reader/full/statistic-and-pro-b-e-civil-ivcomputerec-vi 14/16

8/14/2019 Statistic and PRO. B. E. (Civil IV_Computer_E&C VI)
http://slidepdf.com/reader/full/statistic-and-pro-b-e-civil-ivcomputerec-vi 15/16

8/14/2019 Statistic and PRO. B. E. (Civil IV_Computer_E&C VI)
http://slidepdf.com/reader/full/statistic-and-pro-b-e-civil-ivcomputerec-vi 16/16
Downloaded From: www.bhawesh.com.np
Downloaded From :- www.bhawesh.com.np16
the basis of records of 25 days production can you regard that bothmachines are equally efficient at 1% level of significance. [6]
Q. 10 [a] A set of 5 coins is tossed 640 times and number of head appearingeach time noted. Test the hypothesis that the coins are unbiased.
[6]No. of Heads 0 1 2 3 4 5Frequency 16 114 220 180 100 10
[b] Calculate correlation coefficient hence interpret the result for thefollowing heights of sons and father . [4+1+1]Ht.father 65 63 67 64 68 62 70 66 68 67Ht.Son 68 66 68 65 69 66 68 65 71 67