state accountability report card - california … accountability report card reported using data...
TRANSCRIPT

State Accountability Report Card Reported Using Data from the 2014–15 School Year
The federal Elementary and Secondary Education Act (ESEA) requires each state to produce an annual report card that summarizes assessment results of students statewide and disaggregated by student groups. Information must also be included on high school graduation rates, teacher qualifications, other indicators used in each state’s definition of Adequate Yearly Progress (AYP), and the AYP status of all schools and local educational agencies (LEAs) in the state.
On December 10, 2015, President Obama signed the bipartisan Every Student
Succeeds Act (ESSA), which reauthorizes the ESEA of 1965.
The recent enactment of the ESSA gives states greater discretion to implement academic content standards, administer statewide and local assessments, and
set ambitious performance goals to direct evidence-based improvement strategies and interventions to improve student performance. Until ESSA
requirements are fully operational, each state must continue to implement the state report card requirements specified under Title I, Part A of the ESEA, as
amended by No Child Left Behind.
For further information regarding the ESSA, visit the U.S. Department of Education ESSA Web page at
http://www2.ed.gov/policy/elsec/leg/essa/index.html.
Questions about the State Accountability Report Card (STARC) may be directed to the Data Visualization and Reporting Office at 916-319-0406.
California Department of Education August 2016

Page 2 of 32
Adequate Yearly Progress (AYP)
The federal ESEA requires that all LEAs and schools meet the following AYP criteria (LEA refers to school districts, county offices of education that operate schools, Statewide Benefit Charters, and direct funded charter schools):
• Participation rate on the state’s standards-based assessments in English
language arts/literacy (ELA) and mathematics
• Graduation rate as an additional indicator (for schools, LEAs, and student groups with grade 12 enrollment or at least one graduate in the cohort)
• Attendance rate as an additional indicator (for schools and LEAs with
Transitional Kindergarten through grade eight [TK-8])
Due to the transition to the Smarter Balanced Summative Assessments, the U.S. Department of Education approved the California Department of Education’s (CDE) waiver request to exclude the percent proficient results from AYP determinations. Therefore, the percent proficient information is not reported in the 2014–15 STARC. Information about AYP, including participation rates by student groups can be found on the CDE AYP Web page at http://www.cde.ca.gov/ta/ac/ay/. Further information about AYP can be found in the AYP Information Guide at http://www.cde.ca.gov/ta/ac/ay/documents/aypinfoguide15.pdf.
Statewide AYP, 2014–15
State Number of AYP Criteria Met Out of the Total Number of Criteria Possible State Met All AYP Requirements
Met 26 of 26 Yes
AYP Status of LEAs and Schools, 2014–15
Type Total Number of LEAs/Schools
Number Making AYP
Percent Making AYP
LEAs 1,002 815 81.3 Schools 9,963 8,932 89.7

Page 3 of 32
Participation Rate – ELA
Student Group Enrollment Number of Students Tested Rate
Met 2015 AYP Criteria
Statewide 3,298,149 3,205,026 97 Yes Black or African American 198,688 189,015 95 Yes American Native
Indian or Alaska 19,491 18,409 94 Yes
Asian 293,350 288,695 98 Yes Filipino 81,351 80,013 98 Yes Hispanic or Latino 1,766,161 1,724,031 98 Yes Native Hawaiian or Pacific Islander
16,929 16,460 97 Yes
White 818,184 788,008 96 Yes Two or More Races 95,010 92,217 97 Yes Socioeconomically Disadvantaged 2,039,774 1,988,598 97 Yes
English Learners 975,726 957,922 98 Yes Students with Disabilities 431,318 401,195 93 Yes Note: Socioeconomically disadvantaged students are defined as students: (1) who are eligible for the free or reduced-price lunch program (also known as the National School Lunch Program or NSLP), or have a direct certification for free or reduced-price meals, or (2) who are migrant, homeless, or foster youth, or (3) where neither of the parents were a high school graduate.
Participation Rate – Mathematics
Student Group Enrollment Number of Students Tested
Rate Met 2015 AYP
Criteria Statewide 3,310,486 3,208,346 97 Yes Black or African American 198,762 188,345 95 Yes American Indian or Alaska Native 19,496 18,314 94 Yes
Asian 296,784 291,668 98 Yes Filipino 81,631 80,113 98 Yes Hispanic or Latino 1,773,103 1,726,338 97 Yes Native Hawaiian or Pacific Islander 16,964 16,440 97 Yes
White 819,547 786,574 96 Yes Two or More Races 95,093 92,011 97 Yes Socioeconomically Disadvantaged 2,047,813 1,991,399 97 Yes
English Learners 988,371 967,589 98 Yes Students with Disabilities 431,446 398,570 92 Yes Note: Socioeconomically disadvantaged students are defined as students: (1) who are eligible for the free or reduced-price lunch program (also known as the National School Lunch Program or NSLP), or have a direct certification for free or reduced-price meals, or (2) who are migrant, homeless, or foster youth, or (3) where neither of the parents were a high school graduate.

Page 4 of 32
High School Graduation Rate
The high school graduation rate is a required component of California’s definition of AYP, required under the ESEA. A procedure established by the ESEA was used to set the statewide graduation rate goal of 90 percent. A school or an LEA with grade twelve enrollment or at least one graduate in the cohort must meet one of three graduation rate targets to make AYP: (1) a graduation rate of at least 90 percent, (2) a fixed growth target rate, or (3) a variable growth target rate. The fixed and variable growth target rates are unique to each school and LEA rather than a standard target rate for all. Fixed and variable target graduation rates are calculated for LEAs and schools that have not reached the 90 percent goal.
Further information about graduation rate can be found in the AYP Information Guide at http://www.cde.ca.gov/ta/ac/ay/documents/aypinfoguide15.pdf.
Graduation Rate by Student Group, All Students
Student Group
State 2014 Cohort
Graduation Rate (class of 2012–13)
State 2015 Cohort
Graduation Rate (class of 2013–14)
State 2015
Target Graduation
Rate
State 2015 Graduation
Rate Criteria Met
State 2016 Target
Graduation Rate
(class of 2014–15)
Statewide 80.44 80.95 82.35 Yes 83.21 Black or African American 68.09 68.19 72.47 Yes 73.64 American Indian or Alaska Native 72.83 70.55 76.26 Yes 75.41 Asian 91.59 92.43 89.49 Yes 89.61 Filipino 91.55 92.18 88.68 Yes 89.01 Hispanic or Latino 75.74 76.55 78.60 Yes 79.91 Native Hawaiian or Pacific Islander 78.35 80.40 80.68 Yes 82.80 White 87.67 87.58 86.76 Yes 87.57 Two or More Races 84.47 85.62 85.58 Yes 86.72 Socioeconomically Disadvantaged 74.78 75.58 77.82 Yes 79.19 English Learners 63.05 65.40 68.44 Yes 71.55 Students with Disabilities 61.89 62.33 67.51 Yes 69.25
Note: Socioeconomically disadvantaged students are defined as students: (1) who are eligible for the free or reduced-price lunch program (also known as the National School Lunch Program or NSLP), or have a direct certification for free or reduced-price meals, or (2) who are migrant, homeless, or foster youth, or (3) where neither of the parents were a high school graduate.

Page 5 of 32
Attendance Rate
Based on federal regulations, all states are required to have an additional indicator that schools and LEAs must meet. Due to the suspension of the Academic Performance Index (API) and the ongoing development of a new accountability system, the API was removed as an additional indicator within AYP and was replaced, after approval from the State Board of Education, with attendance rates for the 2015 AYP. Therefore, any school or LEA with a numerically significant student population enrolled in TK-8 (as of the Fall Census Day) must meet the attendance rate target of 90 percent to make AYP. Direct-funded charter schools and LEAs submitted their attendance data to the CDE. At the state level, only average daily attendance (ADA) was calculated and used for accountability purposes.
ADA data represent the 2014–15 ADA data as of the second period (P-2) reporting, which is from July 1 through the last school month that ends before April 15, 2015.
Further information about attendance rates can be found on the CDE DataQuest Web page at http://dq.cde.ca.gov/dataquest/.
School, LEA, and state attendance comparisons can be found on the CDE Find a SARC Web page at http://www.sarconline.org/.
Attendance Rate Target: 90 Percent
Average Daily Attendance Met Criteria 96% Yes

Page 6 of 32
Program Improvement (PI) The state is not subject to PI. As a result there is no state PI report. Schools and LEAs that receive Title I, Part A funds are identified for PI if they do not meet AYP criteria for two reporting cycles in the same subject area or on the same indicator. Because only high schools and high school LEAs received a 2014 AYP report, the two AYP reports used for PI determinations for high schools and high school LEAs were 2014 and 2015. For elementary and middle schools, elementary school districts, and unified school districts, the two AYP reports used for PI determinations were 2013 and 2015. In addition, if an LEA that formerly was not identified for PI failed to make AYP in the same subject area for two reporting cycles, it also would have to fail to make AYP in this subject area for all of its grade spans for these two reporting cycles before the LEA would be identified for PI.
The ESEA requirements for PI schools and LEAs can be found on the CDE PI Web page at http://www.cde.ca.gov/ta/ac/ti/programimprov.asp. The list of schools within LEAs and their PI status can be found on the CDE DataQuest AYP and PI Web page at http://ayp.cde.ca.gov/reports/page2.asp?subject=AYP&level=District&submit1=Submit. On this Web page, type in the name of the district, select submit, then select the desired year of AYP – List of Schools in the District.
PI Status of LEAs and Schools, 2015–16
Type Total Number of Eligible
LEAs/Schools*
Number in PI
Percent in PI
LEAs 912 555 60.86
Schools 6,453 4,740 73.45
*Only schools and LEAs receiving Title I funding are eligible for PI identification and interventions. Single-school districts and direct-funded charter schools are included among the total number of eligible schools rather than the total number of eligible LEAs.

Page 7 of 32
California Assessment of Student Performance and Progress (CAASPP)
The CAASPP System was established on January 1, 2014. The CAASPP System replaced the Standardized Testing and Reporting Program, which became inoperative on July 1, 2013. California has adopted more rigorous academic standards that emphasize not only subject knowledge, but also the critical thinking, analytical writing, and problem-solving skills students need to be successful in college and career. These standards set a higher bar for California students to help ensure they are prepared to succeed in the future. The primary purpose of the CAASPP System is to assist teachers, administrators, students, and parents by promoting high-quality teaching and learning through the use of a variety of assessment approaches and item types. The CAASPP System encompasses the following assessments and student participation requirements:
1. CAASPP for ELA and mathematics in grades three through eight and eleven. 2. CAASPP for Science California Standards Tests (CSTs) assessment in
grades five, eight, and ten.
Four achievement levels are reported for CAASPP Assessment results: Level 1: Standard not met Level 2: Standard nearly met Level 3: Standard met Level 4: Standard exceeded Further CAASPP information can be found on the CDE CAASPP System Web page at http://www.cde.ca.gov/ta/tg/ca/.
The data displayed in the STARC may differ from other data sources because the inclusion and exclusion rules are different for the STARC.

Page 8 of 32
Student Achievement CAASPP Assessment Results
2014–15
ELA – Grades Three through Eight and Eleven
Grade Total
Enrollment Number Tested
Percent Tested
Number Not
Tested
Percent Not
Tested
Percent Standard Not Met
Percent Standard
Nearly Met
Percent Standard
Met
Percent Standard Exceeded
03 488,360 475,953 97.46 13,133 2.69 36.13 26.37 19.90 17.60
04 477,134 466,153 97.70 11,712 2.45 39.13 21.36 20.52 18.98
05 473,661 463,306 97.81 10,987 2.32 33.78 21.45 27.41 17.36
06 470,783 459,972 97.70 11,385 2.42 28.19 29.06 29.47 13.28
07 466,444 454,109 97.36 13,076 2.80 30.94 25.48 31.68 11.90
08 469,247 456,219 97.22 13,754 2.93 25.67 29.16 33.37 11.80
11 479,051 433,593 90.51 46,227 9.65 19.87 24.36 33.20 22.57 Note 1: Due to rounding, the sum of all proficiency levels may not total 100 percent. Note 2: The number of students tested includes students that did not receive a score; however, the number of students tested is not the number that was used to calculate the achievement level percentages. The achievement level percentages are calculated using students with scores. Note 3: Inclusion and exclusion rules are different for the STARC than other public assessment reports.
Mathematics – Grades Three through Eight and Eleven
Grade Total
Enrollment Number Tested
Percent Tested
Number Not
Tested
Percent Not
Tested
Percent Standard Not Met
Percent Standard
Nearly Met
Percent Standard
Met
Percent Standard Exceeded
03 488,334 477,588 97.80 11,290 2.31 33.17 26.61 26.20 14.02
04 477,095 467,482 97.99 10,117 2.12 30.67 34.70 21.87 12.76
05 473,672 464,587 98.08 9,520 2.01 40.95 28.70 15.43 14.92
06 470,751 461,098 97.95 10,128 2.15 36.13 31.00 17.93 14.94
07 466,367 455,087 97.58 11,853 2.54 37.05 29.19 18.95 14.82
08 469,205 456,979 97.39 12,758 2.72 40.63 26.24 16.70 16.43
11 478,738 430,672 89.96 48,511 10.13 45.45 24.89 18.35 11.31 Note 1: Due to rounding, the sum of all proficiency levels may not total 100 percent. Note 2: The number of students tested includes students that did not receive a score; however, the number of students tested is not the number that was used to calculate the achievement level percentages. The achievement level percentages are calculated using students with scores. Note 3: Inclusion and exclusion rules are different for the STARC than other public assessment reports.
Page 9 of 32
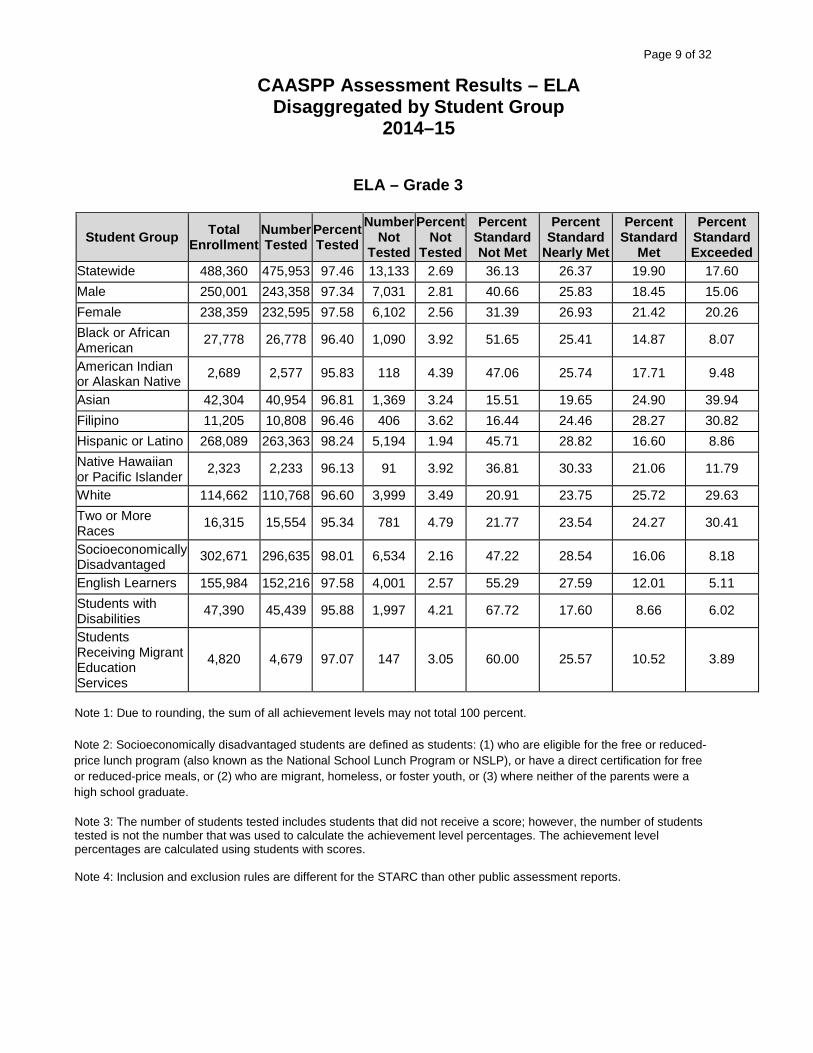
CAASPP Assessment Results – ELA Disaggregated by Student Group
2014–15
ELA – Grade 3
Student Group Total Enrollment
Number Tested
Percent Tested
Number Not
Tested
Percent Not
Tested
Percent Standard Not Met
Percent Standard
Nearly Met
Percent Standard
Met
Percent Standard Exceeded
Statewide 488,360 475,953 97.46 13,133 2.69 36.13 26.37 19.90 17.60 Male 250,001 243,358 97.34 7,031 2.81 40.66 25.83 18.45 15.06 Female 238,359 232,595 97.58 6,102 2.56 31.39 26.93 21.42 20.26 Black or African American 27,778 26,778 96.40 1,090 3.92 51.65 25.41 14.87 8.07
American Indian or Alaskan Native 2,689 2,577 95.83 118 4.39 47.06 25.74 17.71 9.48
Asian 42,304 40,954 96.81 1,369 3.24 15.51 19.65 24.90 39.94 Filipino 11,205 10,808 96.46 406 3.62 16.44 24.46 28.27 30.82 Hispanic or Latino 268,089 263,363 98.24 5,194 1.94 45.71 28.82 16.60 8.86 Native Hawaiian or Pacific Islander 2,323 2,233 96.13 91 3.92 36.81 30.33 21.06 11.79
White 114,662 110,768 96.60 3,999 3.49 20.91 23.75 25.72 29.63 Two or More Races 16,315 15,554 95.34 781 4.79 21.77 23.54 24.27 30.41
Socioeconomically Disadvantaged 302,671 296,635 98.01 6,534 2.16 47.22 28.54 16.06 8.18
English Learners 155,984 152,216 97.58 4,001 2.57 55.29 27.59 12.01 5.11 Students with Disabilities 47,390 45,439 95.88 1,997 4.21 67.72 17.60 8.66 6.02
Students Receiving Migrant Education Services
4,820 4,679 97.07 147 3.05 60.00 25.57 10.52 3.89
Note 1: Due to rounding, the sum of all achievement levels may not total 100 percent. Note 2: Socioeconomically disadvantaged students are defined as students: (1) who are eligible for the free or reduced-price lunch program (also known as the National School Lunch Program or NSLP), or have a direct certification for free or reduced-price meals, or (2) who are migrant, homeless, or foster youth, or (3) where neither of the parents were a high school graduate. Note 3: The number of students tested includes students that did not receive a score; however, the number of students tested is not the number that was used to calculate the achievement level percentages. The achievement level percentages are calculated using students with scores. Note 4: Inclusion and exclusion rules are different for the STARC than other public assessment reports.
Page 10 of 32
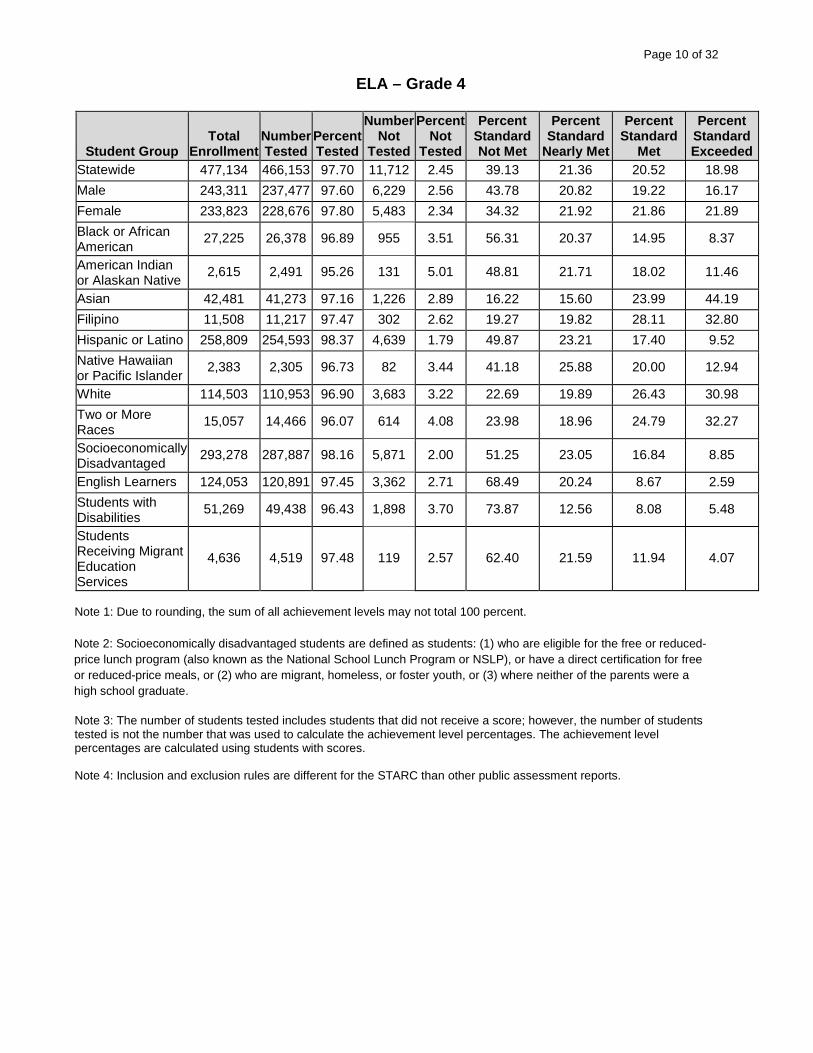
ELA – Grade 4
Student Group Total
Enrollment Number Tested
Percent Tested
Number Not
Tested
Percent Not
Tested
Percent Standard Not Met
Percent Standard
Nearly Met
Percent Standard
Met
Percent Standard Exceeded
Statewide 477,134 466,153 97.70 11,712 2.45 39.13 21.36 20.52 18.98 Male 243,311 237,477 97.60 6,229 2.56 43.78 20.82 19.22 16.17 Female 233,823 228,676 97.80 5,483 2.34 34.32 21.92 21.86 21.89 Black or African American 27,225 26,378 96.89 955 3.51 56.31 20.37 14.95 8.37
American Indian or Alaskan Native 2,615 2,491 95.26 131 5.01 48.81 21.71 18.02 11.46
Asian 42,481 41,273 97.16 1,226 2.89 16.22 15.60 23.99 44.19 Filipino 11,508 11,217 97.47 302 2.62 19.27 19.82 28.11 32.80 Hispanic or Latino 258,809 254,593 98.37 4,639 1.79 49.87 23.21 17.40 9.52 Native Hawaiian or Pacific Islander 2,383 2,305 96.73 82 3.44 41.18 25.88 20.00 12.94
White 114,503 110,953 96.90 3,683 3.22 22.69 19.89 26.43 30.98 Two or More Races 15,057 14,466 96.07 614 4.08 23.98 18.96 24.79 32.27
Socioeconomically Disadvantaged 293,278 287,887 98.16 5,871 2.00 51.25 23.05 16.84 8.85
English Learners 124,053 120,891 97.45 3,362 2.71 68.49 20.24 8.67 2.59 Students with Disabilities 51,269 49,438 96.43 1,898 3.70 73.87 12.56 8.08 5.48
Students Receiving Migrant Education Services
4,636 4,519 97.48 119 2.57 62.40 21.59 11.94 4.07
Note 1: Due to rounding, the sum of all achievement levels may not total 100 percent. Note 2: Socioeconomically disadvantaged students are defined as students: (1) who are eligible for the free or reduced-price lunch program (also known as the National School Lunch Program or NSLP), or have a direct certification for free or reduced-price meals, or (2) who are migrant, homeless, or foster youth, or (3) where neither of the parents were a high school graduate. Note 3: The number of students tested includes students that did not receive a score; however, the number of students tested is not the number that was used to calculate the achievement level percentages. The achievement level percentages are calculated using students with scores. Note 4: Inclusion and exclusion rules are different for the STARC than other public assessment reports.

Page 11 of 32
ELA – Grade 5
Student Group Total Enrollment
Number Tested
Percent Tested
Number Not
Tested
Percent Not
Tested
Percent Standard Not Met
Percent Standard
Nearly Met
Percent Standard
Met
Percent Standard Exceeded
Statewide 473,661 463,306 97.81 10,987 2.32 33.78 21.45 27.41 17.36 Male 242,213 236,638 97.70 5,909 2.44 39.30 21.31 25.26 14.12 Female 231,448 226,668 97.93 5,078 2.19 28.02 21.59 29.65 20.74 Black or African American 27,616 26,771 96.94 937 3.39 50.02 22.06 20.68 7.23
American Indian or Alaskan Native 2,650 2,557 96.49 102 3.85 48.01 22.66 20.93 8.40
Asian 43,485 42,372 97.44 1,133 2.61 13.83 13.87 30.80 41.49 Filipino 12,106 11,842 97.82 270 2.23 15.88 19.09 35.60 29.42 Hispanic or Latino 252,397 248,558 98.48 4,198 1.66 43.33 24.22 24.01 8.44 Native Hawaiian or Pacific Islander 2,472 2,406 97.33 70 2.83 37.08 25.04 26.25 11.63
White 116,673 113,152 96.98 3,634 3.11 19.52 18.59 33.94 27.95 Two or More Races 13,753 13,197 95.96 579 4.21 20.60 18.26 32.20 28.94
Socioeconomically Disadvantaged 286,829 281,852 98.26 5,402 1.88 44.95 23.99 23.18 7.87
English Learners 103,897 101,069 97.28 2,964 2.85 67.27 21.49 9.92 1.30 Students with Disabilities 52,833 51,123 96.76 1,759 3.33 73.16 13.64 9.34 3.87
Students Receiving Migrant Education Services
4,595 4,496 97.85 100 2.18 56.33 22.66 17.32 3.69
Note 1: Due to rounding, the sum of all achievement levels may not total 100 percent. Note 2: Socioeconomically disadvantaged students are defined as students: (1) who are eligible for the free or reduced-price lunch program (also known as the National School Lunch Program or NSLP), or have a direct certification for free or reduced-price meals, or (2) who are migrant, homeless, or foster youth, or (3) where neither of the parents were a high school graduate. Note 3: The number of students tested includes students that did not receive a score; however, the number of students tested is not the number that was used to calculate the achievement level percentages. The achievement level percentages are calculated using students with scores. Note 4: Inclusion and exclusion rules are different for the STARC than other public assessment reports.

Page 12 of 32
ELA – Grade 6
Student Group Total Enrollment
Number Tested
Percent Tested
Number Not
Tested
Percent Not
Tested
Percent Standard Not Met
Percent Standard
Nearly Met
Percent Standard
Met
Percent Standard Exceeded
Statewide 470,783 459,972 97.70 11,385 2.42 28.19 29.06 29.47 13.28 Male 240,745 234,957 97.60 6,091 2.53 33.64 29.20 26.46 10.70 Female 230,038 225,015 97.82 5,294 2.30 22.52 28.91 32.60 15.97 Black or African American 27,891 26,916 96.50 1,061 3.80 43.28 29.96 21.30 5.46
American Indian or Alaskan Native 2,679 2,555 95.37 132 4.93 39.31 30.13 23.61 6.96
Asian 42,904 41,948 97.77 970 2.26 10.44 17.16 36.48 35.92 Filipino 12,765 12,489 97.84 279 2.19 12.37 23.86 40.10 23.65 Hispanic or Latino 249,583 245,441 98.34 4,475 1.79 36.41 33.28 24.44 5.87 Native Hawaiian or Pacific Islander 2,382 2,315 97.19 68 2.85 29.38 32.86 29.12 8.65
White 117,078 113,482 96.93 3,697 3.16 16.07 25.13 37.88 20.92 Two or More Races 12,465 11,866 95.19 621 4.98 17.86 24.35 36.00 21.79
Socioeconomically Disadvantaged 283,760 278,323 98.08 5,819 2.05 37.91 32.90 23.60 5.58
English Learners 79,809 77,034 96.52 2,865 3.59 65.69 26.85 6.82 0.63 Students with Disabilities 50,110 48,265 96.32 1,882 3.76 70.88 19.29 7.83 2.00
Students Receiving Migrant Education Services
4,075 3,959 97.15 118 2.90 48.51 30.83 17.89 2.77
Note 1: Due to rounding, the sum of all achievement levels may not total 100 percent. Note 2: Socioeconomically disadvantaged students are defined as students: (1) who are eligible for the free or reduced-price lunch program (also known as the National School Lunch Program or NSLP), or have a direct certification for free or reduced-price meals, or (2) who are migrant, homeless, or foster youth, or (3) where neither of the parents were a high school graduate. Note 3: The number of students tested includes students that did not receive a score; however, the number of students tested is not the number that was used to calculate the achievement level percentages. The achievement level percentages are calculated using students with scores. Note 4: Inclusion and exclusion rules are different for the STARC than other public assessment reports.
Page 13 of 32
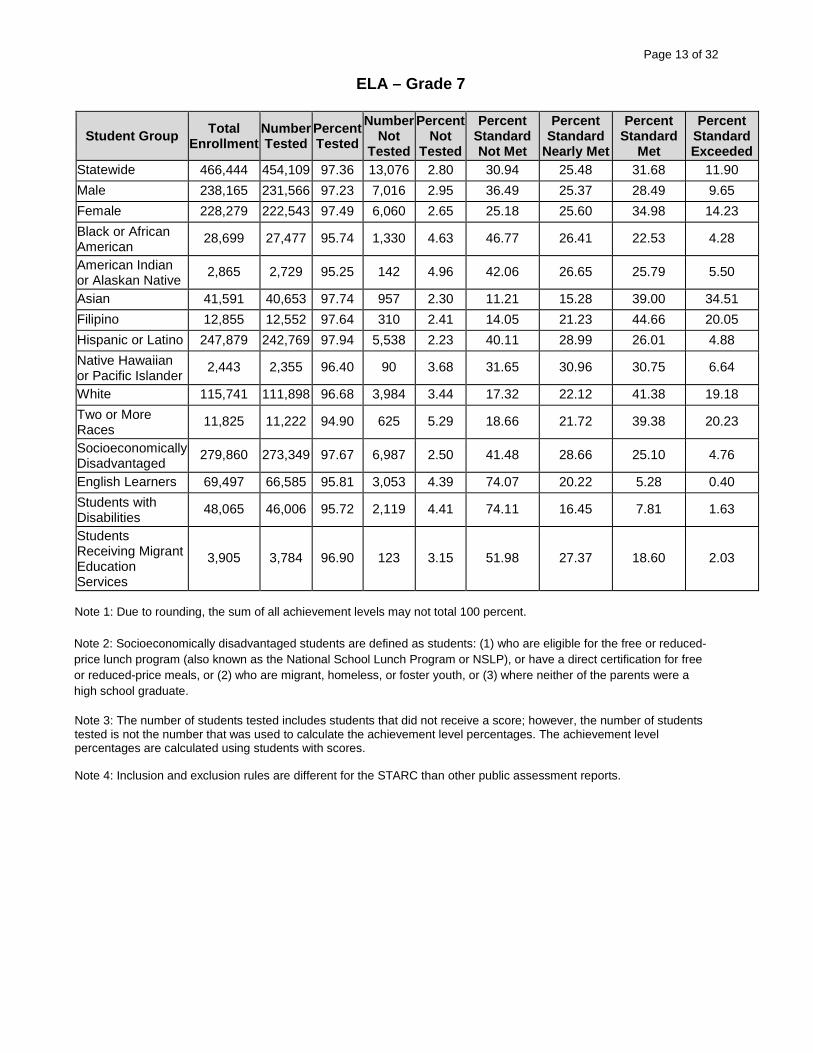
ELA – Grade 7
Student Group Total Enrollment
Number Tested
Percent Tested
Number Not
Tested
Percent Not
Tested
Percent Standard Not Met
Percent Standard
Nearly Met
Percent Standard
Met
Percent Standard Exceeded
Statewide 466,444 454,109 97.36 13,076 2.80 30.94 25.48 31.68 11.90 Male 238,165 231,566 97.23 7,016 2.95 36.49 25.37 28.49 9.65 Female 228,279 222,543 97.49 6,060 2.65 25.18 25.60 34.98 14.23 Black or African American 28,699 27,477 95.74 1,330 4.63 46.77 26.41 22.53 4.28
American Indian or Alaskan Native 2,865 2,729 95.25 142 4.96 42.06 26.65 25.79 5.50
Asian 41,591 40,653 97.74 957 2.30 11.21 15.28 39.00 34.51 Filipino 12,855 12,552 97.64 310 2.41 14.05 21.23 44.66 20.05 Hispanic or Latino 247,879 242,769 97.94 5,538 2.23 40.11 28.99 26.01 4.88 Native Hawaiian or Pacific Islander 2,443 2,355 96.40 90 3.68 31.65 30.96 30.75 6.64
White 115,741 111,898 96.68 3,984 3.44 17.32 22.12 41.38 19.18 Two or More Races 11,825 11,222 94.90 625 5.29 18.66 21.72 39.38 20.23
Socioeconomically Disadvantaged 279,860 273,349 97.67 6,987 2.50 41.48 28.66 25.10 4.76
English Learners 69,497 66,585 95.81 3,053 4.39 74.07 20.22 5.28 0.40 Students with Disabilities 48,065 46,006 95.72 2,119 4.41 74.11 16.45 7.81 1.63
Students Receiving Migrant Education Services
3,905 3,784 96.90 123 3.15 51.98 27.37 18.60 2.03
Note 1: Due to rounding, the sum of all achievement levels may not total 100 percent. Note 2: Socioeconomically disadvantaged students are defined as students: (1) who are eligible for the free or reduced-price lunch program (also known as the National School Lunch Program or NSLP), or have a direct certification for free or reduced-price meals, or (2) who are migrant, homeless, or foster youth, or (3) where neither of the parents were a high school graduate. Note 3: The number of students tested includes students that did not receive a score; however, the number of students tested is not the number that was used to calculate the achievement level percentages. The achievement level percentages are calculated using students with scores. Note 4: Inclusion and exclusion rules are different for the STARC than other public assessment reports.

Page 14 of 32
ELA – Grade 8
Student Group Total Enrollment
Number Tested
Percent Tested
Number Not
Tested
Percent Not
Tested
Percent Standard Not Met
Percent Standard
Nearly Met
Percent Standard
Met
Percent Standard Exceeded
Statewide 469,247 456,219 97.22 13,754 2.93 25.67 29.16 33.37 11.80 Male 239,809 232,972 97.15 7,255 3.03 31.56 29.43 29.72 9.29 Female 229,438 223,247 97.30 6,499 2.83 19.53 28.87 37.18 14.41 Black or African American 29,713 28,400 95.58 1,409 4.74 40.31 31.35 23.73 4.61
American Indian or Alaskan Native 2,823 2,666 94.44 169 5.99 34.31 33.04 26.94 5.72
Asian 41,791 40,913 97.90 889 2.13 9.30 16.64 40.85 33.21 Filipino 13,367 13,038 97.54 333 2.49 10.71 22.89 47.57 18.83 Hispanic or Latino 247,892 242,445 97.80 5,894 2.38 33.14 33.87 27.97 5.02 Native Hawaiian or Pacific Islander 2,407 2,343 97.34 68 2.83 28.95 32.93 31.07 7.05
White 117,443 113,389 96.55 4,182 3.56 14.43 24.21 42.46 18.90 Two or More Races 11,252 10,571 93.95 697 6.19 16.28 23.12 40.40 20.19
Socioeconomically Disadvantaged 277,934 271,079 97.53 7,324 2.64 34.45 33.43 27.16 4.95
English Learners 62,051 59,152 95.33 3,009 4.85 68.33 26.04 5.30 0.32 Students with Disabilities 47,477 45,356 95.53 2,178 4.59 68.89 21.39 8.28 1.44
Students Receiving Migrant Education Services
4,038 3,927 97.25 112 2.77 44.43 32.47 20.41 2.70
Note 1: Due to rounding, the sum of all achievement levels may not total 100 percent. Note 2: Socioeconomically disadvantaged students are defined as students: (1) who are eligible for the free or reduced-price lunch program (also known as the National School Lunch Program or NSLP), or have a direct certification for free or reduced-price meals, or (2) who are migrant, homeless, or foster youth, or (3) where neither of the parents were a high school graduate. Note 3: The number of students tested includes students that did not receive a score; however, the number of students tested is not the number that was used to calculate the achievement level percentages. The achievement level percentages are calculated using students with scores. Note 4: Inclusion and exclusion rules are different for the STARC than other public assessment reports.

Page 15 of 32
ELA – Grade 11
Student Group Total Enrollment
Number Tested
Percent Tested
Number Not
Tested
Percent Not
Tested
Percent Standard Not Met
Percent Standard
Nearly Met
Percent Standard
Met
Percent Standard Exceeded
Statewide 479,051 433,593 90.51 46,227 9.65 19.87 24.36 33.20 22.57 Male 244,603 220,626 90.20 24,483 10.01 24.77 25.07 30.60 19.55 Female 234,448 212,967 90.84 21,744 9.27 14.82 23.63 35.87 25.67 Black or African American 31,213 26,841 85.99 4,483 14.36 32.88 28.21 27.94 10.96
American Indian or Alaskan Native 3,258 2,737 84.01 532 16.33 24.86 26.77 31.47 16.90
Asian 41,510 39,190 94.41 2,340 5.64 8.56 13.51 30.39 47.54 Filipino 14,762 13,973 94.66 800 5.42 8.26 17.56 40.20 33.98 Hispanic or Latino 246,917 225,400 91.29 21,968 8.90 24.90 29.13 32.73 13.23 Native Hawaiian or Pacific Islander 2,694 2,446 90.79 254 9.43 23.64 28.06 32.77 15.52
White 125,158 111,266 88.90 14,030 11.21 12.60 18.95 35.38 33.07 Two or More Races 11,711 10,182 86.94 1,549 13.23 13.11 18.85 35.01 33.02
Socioeconomically Disadvantaged 263,523 239,166 90.76 24,796 9.41 26.12 28.91 31.69 13.28
English Learners 48,954 41,626 85.03 7,457 15.23 62.98 29.04 7.30 0.66 Students with Disabilities 42,914 36,228 84.42 6,752 15.73 59.85 25.67 11.31 3.16
Students Receiving Migrant Education Services
3,681 3,466 94.16 219 5.95 34.13 32.80 25.86 7.21
Note 1: Due to rounding, the sum of all achievement levels may not total 100 percent. Note 2: Socioeconomically disadvantaged students are defined as students: (1) who are eligible for the free or reduced-price lunch program (also known as the National School Lunch Program or NSLP), or have a direct certification for free or reduced-price meals, or (2) who are migrant, homeless, or foster youth, or (3) where neither of the parents were a high school graduate. Note 3: The number of students tested includes students that did not receive a score; however, the number of students tested is not the number that was used to calculate the achievement level percentages. The achievement level percentages are calculated using students with scores. Note 4: Inclusion and exclusion rules are different for the STARC than other public assessment reports.

Page 16 of 32
CAASPP Assessment Results – Mathematics Disaggregated by Student Group
2014–15
Mathematics – Grade 3
Student Group Total Enrollment
Number Tested
Percent Tested
Number Not
Tested
Percent Not
Tested
Percent Standard Not Met
Percent Standard
Nearly Met
Percent Standard
Met
Percent Standard Exceeded
Statewide 488,334 477,588 97.80 11,290 2.31 33.17 26.61 26.20 14.02 Male 249,980 244,223 97.70 6,049 2.42 33.36 25.65 26.03 14.95 Female 238,354 233,365 97.91 5,241 2.20 32.97 27.61 26.38 13.04 Black or African American 27,759 26,763 96.41 1,085 3.91 50.56 27.08 17.69 4.66
American Indian or Alaskan Native 2,687 2,577 95.91 118 4.39 44.00 27.08 22.25 6.67
Asian 42,323 41,497 98.05 839 1.98 11.09 16.61 31.56 40.74 Filipino 11,206 10,906 97.32 306 2.73 14.88 22.92 38.05 24.15 Hispanic or Latino 268,088 264,220 98.56 4,209 1.57 42.39 29.79 21.71 6.11 Native Hawaiian or Pacific Islander 2,320 2,240 96.55 81 3.49 33.69 30.42 25.89 10.00
White 114,639 110,903 96.74 3,804 3.32 18.66 23.42 35.00 22.92 Two or More Races 16,315 15,553 95.33 775 4.75 20.30 23.02 32.30 24.38
Socioeconomically Disadvantaged 302,643 297,502 98.30 5,515 1.82 43.46 29.53 21.04 5.97
English Learners 156,035 153,704 98.51 2,499 1.60 49.20 28.83 17.04 4.94 Students with Disabilities 47,357 45,371 95.81 2,014 4.25 63.62 18.28 12.47 5.62
Students Receiving Migrant Education Services
4,822 4,739 98.28 85 1.76 51.81 29.25 15.99 2.94
Note 1: Due to rounding, the sum of all achievement levels may not total 100 percent. Note 2: Socioeconomically disadvantaged students are defined as students: (1) who are eligible for the free or reduced-price lunch program (also known as the National School Lunch Program or NSLP), or have a direct certification for free or reduced-price meals, or (2) who are migrant, homeless, or foster youth, or (3) where neither of the parents were a high school graduate. Note 3: The number of students tested includes students that did not receive a score; however, the number of students tested is not the number that was used to calculate the achievement level percentages. The achievement level percentages are calculated using students with scores. Note 4: Inclusion and exclusion rules are different for the STARC than other public assessment reports.

Page 17 of 32
Mathematics – Grade 4
Student Group Total Enrollment
Number Tested
Percent Tested
Number Not
Tested
Percent Not
Tested
Percent Standard Not Met
Percent Standard
Nearly Met
Percent Standard
Met
Percent Standard Exceeded
Statewide 477,095 467,482 97.99 10,117 2.12 30.67 34.70 21.87 12.76 Male 243,295 238,196 97.90 5,379 2.21 31.11 33.24 21.78 13.87 Female 233,800 229,286 98.07 4,738 2.03 30.22 26.22 21.96 11.60 Black or African American 27,210 26,317 96.72 963 3.54 47.74 34.85 13.54 3.87
American Indian or Alaskan Native 2,613 2,490 95.29 128 4.90 38.01 37.40 17.72 6.83
Asian 42,509 41,797 98.33 735 1.73 9.39 21.55 28.98 40.07 Filipino 11,505 11,319 98.38 194 1.69 13.26 32.72 32.28 21.74 Hispanic or Latino 258,795 255,294 98.65 3,783 1.46 40.12 38.14 16.75 4.98 Native Hawaiian or Pacific Islander 2,381 2,302 96.68 80 3.36 32.69 40.53 19.47 7.31
White 114,475 110,990 96.96 3,578 3.13 16.22 32.13 31.14 20.51 Two or More Races 15,052 14,472 96.15 596 3.96 17.58 31.11 28.71 22.60
Socioeconomically Disadvantaged 293,248 288,646 98.43 4,941 1.68 40.96 37.82 16.22 4.99
English Learners 124,099 122,263 98.52 1,985 1.60 54.16 34.48 9.00 2.35 Students with Disabilities 51,239 49,329 96.27 1,945 3.80 64.15 22.61 8.80 4.44
Students Receiving Migrant Education Services
4,635 4,556 98.30 81 1.75 50.40 35.13 12.17 2.29
Note 1: Due to rounding, the sum of all achievement levels may not total 100 percent. Note 2: Socioeconomically disadvantaged students are defined as students: (1) who are eligible for the free or reduced-price lunch program (also known as the National School Lunch Program or NSLP), or have a direct certification for free or reduced-price meals, or (2) who are migrant, homeless, or foster youth, or (3) where neither of the parents were a high school graduate. Note 3: The number of students tested includes students that did not receive a score; however, the number of students tested is not the number that was used to calculate the achievement level percentages. The achievement level percentages are calculated using students with scores. Note 4: Inclusion and exclusion rules are different for the STARC than other public assessment reports.

Page 18 of 32
Mathematics – Grade 5
Student Group Total Enrollment
Number Tested
Percent Tested
Number Not
Tested
Percent Not
Tested
Percent Standard Not Met
Percent Standard
Nearly Met
Percent Standard
Met
Percent Standard Exceeded
Statewide 473,672 464,587 98.08 9,520 2.01 40.95 28.70 15.43 14.92 Male 242,210 237,290 97.97 5,142 2.12 41.52 27.14 15.55 15.79 Female 231,462 227,297 98.20 4,378 1.89 40.35 30.32 15.31 14.02 Black or African American 27,598 26,724 96.83 947 3.43 60.41 25.96 8.89 4.74
American Indian or Alaskan Native 2,653 2,557 96.38 102 3.84 54.06 28.75 10.46 6.73
Asian 43,516 42,836 98.44 691 1.59 14.28 20.88 21.22 43.62 Filipino 12,101 11,907 98.40 198 1.64 21.50 30.07 23.47 24.96 Hispanic or Latino 252,409 249,269 98.76 3,380 1.34 52.97 29.61 11.42 5.99 Native Hawaiian or Pacific Islander 2,472 2,410 97.49 65 2.63 45.01 32.00 13.81 9.18
White 116,663 113,220 97.05 3,522 3.02 23.48 30.16 22.21 24.14 Two or More Races 13,752 13,209 96.05 558 4.06 25.73 27.99 21.23 25.04
Socioeconomically Disadvantaged 286,824 282,566 98.52 4,548 1.59 53.73 29.14 11.11 6.02
English Learners 103,951 102,336 98.45 1,709 1.64 72.62 20.87 4.55 1.95 Students with Disabilities 52,811 51,040 96.65 1,807 3.42 75.75 14.90 5.22 4.13
Students Receiving Migrant Education Services
4,596 4,538 98.74 59 1.28 63.17 26.68 7.23 2.92
Note 1: Due to rounding, the sum of all achievement levels may not total 100 percent. Note 2: Socioeconomically disadvantaged students are defined as students: (1) who are eligible for the free or reduced-price lunch program (also known as the National School Lunch Program or NSLP), or have a direct certification for free or reduced-price meals, or (2) who are migrant, homeless, or foster youth, or (3) where neither of the parents were a high school graduate. Note 3: The number of students tested includes students that did not receive a score; however, the number of students tested is not the number that was used to calculate the achievement level percentages. The achievement level percentages are calculated using students with scores. Note 4: Inclusion and exclusion rules are different for the STARC than other public assessment reports.

Page 19 of 32
Mathematics – Grade 6
Student Group Total Enrollment
Number Tested
Percent Tested
Number Not
Tested
Percent Not
Tested
Percent Standard Not Met
Percent Standard
Nearly Met
Percent Standard
Met
Percent Standard Exceeded
Statewide 470,751 461,098 97.95 10,128 2.15 36.13 31.00 17.93 14.94 Male 240,725 235,542 97.85 5,444 2.26 38.20 29.73 17.01 15.06 Female 230,026 225,556 98.06 4,684 2.04 33.98 32.32 18.88 14.82 Black or African American 27,877 26,873 96.40 1,078 3.87 54.73 29.29 10.97 5.01
American Indian or Alaskan Native 2,674 2,545 95.18 135 5.05 46.48 31.97 14.35 7.16
Asian 42,945 42,360 98.64 598 1.39 11.56 20.24 22.89 45.31 Filipino 12,763 12,576 98.53 188 1.47 18.22 30.69 26.02 25.07 Hispanic or Latino 249,557 246,011 98.58 3,803 1.52 46.84 33.24 13.93 5.99 Native Hawaiian or Pacific Islander 2,383 2,324 97.52 63 2.64 37.72 35.50 16.58 10.20
White 117,059 113,576 97.02 3,577 3.06 20.90 30.63 25.00 23.47 Two or More Races 12,458 11,857 95.18 619 4.97 23.06 29.45 23.23 24.25
Socioeconomically Disadvantaged 283,713 278,964 98.33 5,063 1.78 47.82 32.64 13.49 6.05
English Learners 79,848 78,255 98.00 1,676 2.10 73.11 21.29 4.05 1.54 Students with Disabilities 50,079 48,164 96.18 1,960 3.91 77.55 14.85 4.74 2.85
Students Receiving Migrant Education Services
4,077 4,012 98.41 69 1.69 55.83 30.42 10.66 3.09
Note 1: Due to rounding, the sum of all achievement levels may not total 100 percent. Note 2: Socioeconomically disadvantaged students are defined as students: (1) who are eligible for the free or reduced-price lunch program (also known as the National School Lunch Program or NSLP), or have a direct certification for free or reduced-price meals, or (2) who are migrant, homeless, or foster youth, or (3) where neither of the parents were a high school graduate. Note 3: The number of students tested includes students that did not receive a score; however, the number of students tested is not the number that was used to calculate the achievement level percentages. The achievement level percentages are calculated using students with scores. Note 4: Inclusion and exclusion rules are different for the STARC than other public assessment reports.

Page 20 of 32
Mathematics – Grade 7
Student Group Total Enrollment
Number Tested
Percent Tested
Number Not
Tested
Percent Not
Tested
Percent Standard Not Met
Percent Standard
Nearly Met
Percent Standard
Met
Percent Standard Exceeded
Statewide 466,367 455,087 97.58 11,853 2.54 37.05 29.19 18.95 14.82 Male 238,117 232,084 97.47 6,367 2.67 38.77 27.73 18.43 15.08 Female 228,250 223,003 97.70 5,486 2.40 35.27 30.70 19.48 14.54 Black or African American 28,670 27,388 95.53 1,359 4.74 56.01 27.88 11.73 4.38
American Indian or Alaskan Native 2,865 2,733 95.39 140 4.89 46.51 31.57 14.49 7.43
Asian 41,622 41,055 98.64 577 1.39 10.96 18.06 23.84 47.14 Filipino 12,854 12,625 98.22 233 1.81 18.39 28.47 28.41 24.74 Hispanic or Latino 247,843 243,381 98.20 4,792 1.93 48.08 31.45 14.70 5.77 Native Hawaiian or Pacific Islander 2,442 2,357 96.52 87 3.56 38.29 33.40 19.10 9.21
White 115,703 111,865 96.68 3,955 3.42 21.44 28.78 26.50 23.28 Two or More Races 11,822 11,211 94.83 629 5.32 23.27 27.51 25.04 24.18
Socioeconomically Disadvantaged 279,787 273,947 97.91 6,202 2.22 48.67 30.89 14.40 6.04
English Learners 69,535 67,777 97.47 1,859 2.67 76.24 17.98 4.11 1.66 Students with Disabilities 48,031 45,875 95.51 2,202 4.58 78.24 14.38 4.84 2.53
Students Receiving Migrant Education Services
3,906 3,843 98.39 64 1.64 55.14 30.54 11.12 3.20
Note 1: Due to rounding, the sum of all achievement levels may not total 100 percent. Note 2: Socioeconomically disadvantaged students are defined as students: (1) who are eligible for the free or reduced-price lunch program (also known as the National School Lunch Program or NSLP), or have a direct certification for free or reduced-price meals, or (2) who are migrant, homeless, or foster youth, or (3) where neither of the parents were a high school graduate. Note 3: The number of students tested includes students that did not receive a score; however, the number of students tested is not the number that was used to calculate the achievement level percentages. The achievement level percentages are calculated using students with scores. Note 4: Inclusion and exclusion rules are different for the STARC than other public assessment reports.

Page 21 of 32
Mathematics – Grade 8
Student Group Total Enrollment
Number Tested
Percent Tested
Number Not
Tested
Percent Not
Tested
Percent Standard Not Met
Percent Standard
Nearly Met
Percent Standard
Met
Percent Standard Exceeded
Statewide 469,205 456,979 97.39 12,758 2.72 40.63 26.24 16.70 16.43 Male 239,785 233,369 97.32 6,732 2.81 43.10 24.69 15.73 16.48 Female 229,420 223,610 97.47 6,026 2.63 38.07 27.85 17.70 16.38 Black or African American 29,688 28,293 95.30 1,477 4.98 60.90 23.44 10.27 5.39
American Indian or Alaskan Native 2,821 2,660 94.29 169 5.99 51.99 26.69 13.21 8.11
Asian 41,829 41,281 98.69 560 1.34 12.88 16.72 20.15 50.26 Filipino 13,367 13,137 98.28 235 1.76 20.49 26.55 25.59 27.37 Hispanic or Latino 247,872 242,959 98.02 5,228 2.11 51.65 28.12 13.26 6.97 Native Hawaiian or Pacific Islander 2,406 2,344 97.42 64 2.66 44.08 29.62 15.80 10.49
White 117,415 113,269 96.47 4,236 3.61 25.48 26.43 23.02 25.07 Two or More Races 11,248 10,560 93.88 698 6.21 27.82 24.98 20.61 26.58
Socioeconomically Disadvantaged 277,882 271,565 97.73 6,658 2.40 52.30 27.16 13.05 7.50
English Learners 62,104 60,292 97.08 1,901 3.06 79.55 14.53 3.70 2.21 Students with Disabilities 47,449 45,207 95.27 2,292 4.83 81.41 12.01 3.94 2.65
Students Receiving Migrant Education Services
4,042 3,980 98.47 62 1.53 59.48 25.40 10.51 4.61
Note 1: Due to rounding, the sum of all achievement levels may not total 100 percent. Note 2: Socioeconomically disadvantaged students are defined as students: (1) who are eligible for the free or reduced-price lunch program (also known as the National School Lunch Program or NSLP), or have a direct certification for free or reduced-price meals, or (2) who are migrant, homeless, or foster youth, or (3) where neither of the parents were a high school graduate. Note 3: The number of students tested includes students that did not receive a score; however, the number of students tested is not the number that was used to calculate the achievement level percentages. The achievement level percentages are calculated using students with scores. Note 4: Inclusion and exclusion rules are different for the STARC than other public assessment reports.

Page 22 of 32
Mathematics – Grade 11
Student Group Total Enrollment
Number Tested
Percent Tested
Number Not
Tested
Percent Not
Tested
Percent Standard Not Met
Percent Standard
Nearly Met
Percent Standard
Met
Percent Standard Exceeded
Statewide 478,738 430,672 89.96 48,511 10.13 45.45 24.89 18.35 11.31 Male 244,408 219,212 89.69 25,486 10.43 47.80 22.94 17.03 12.23 Female 234,330 211,460 90.24 23,025 9.83 43.01 26.91 19.71 10.36 Black or African American 31,138 26,483 85.05 4,723 15.17 64.60 21.81 10.62 2.98
American Indian or Alaskan Native 3,254 2,696 82.85 566 17.39 55.54 23.81 14.79 5.85
Asian 41,532 39,241 94.48 2,297 5.53 15.61 17.72 26.82 39.85 Filipino 14,753 13,948 94.54 811 5.50 26.35 27.56 30.08 16.00 Hispanic or Latino 246,778 223,715 90.65 23,305 9.44 56.36 25.87 13.74 4.03 Native Hawaiian or Pacific Islander 2,692 2,432 90.34 264 9.81 49.70 29.36 13.83 7.11
White 125,066 110,514 88.36 14,649 11.71 32.88 25.75 24.63 16.74 Two or More Races 11,698 10,085 86.21 1,626 13.90 33.74 25.45 23.53 17.28
Socioeconomically Disadvantaged 263,319 237,447 90.17 26,129 9.92 56.27 25.05 13.77 4.92
English Learners 48,950 41,614 85.01 7,407 15.13 84.48 10.40 3.50 1.62 Students with Disabilities 42,820 35,561 83.05 7,292 17.03 85.70 9.71 3.28 1.30
Students Receiving Migrant Education Services
3,677 3,457 94.02 222 6.04 62.57 24.38 10.79 2.25
Note 1: Due to rounding, the sum of all achievement levels may not total 100 percent. Note 2: Socioeconomically disadvantaged students are defined as students: (1) who are eligible for the free or reduced-price lunch program (also known as the National School Lunch Program or NSLP), or have a direct certification for free or reduced-price meals, or (2) who are migrant, homeless, or foster youth, or (3) where neither of the parents were a high school graduate. Note 3: The number of students tested includes students that did not receive a score; however, the number of students tested is not the number that was used to calculate the achievement level percentages. The achievement level percentages are calculated using students with scores. Note 4: Inclusion and exclusion rules are different for the STARC than other public assessment reports.

Page 23 of 32
CAASPP Science CST Results
The CAASPP CST for science is required from all students in grades five, eight, and ten unless their Individualized Education Program indicates assessment with a California Modified Assessment (CMA) or California Alternate Performance Assessment (CAPA). Information about science assessments, can be found at the CDE Science Assessments Web page at http://www.cde.ca.gov/ta/tg/ca/caasppscience.asp.
Two-Year Trend in Student Achievement CAASPP CST Results 2013–14 and 2014–15
Science – Grades Five, Eight, and Ten
Grade Year Total
Enrollment Number Tested
Percent Tested
Number Not
Tested
Percent Not
Tested
Percent Far
Below Basic
Percent Below Basic
Percent Basic
Percent Proficient
Percent Advanced
05 2013–14 450,961 447,020 99.13 3,887 0.86 5.97 11.19 24.44 32.54 25.86 05 2014–15 478,610 466,918 97.56 11,707 2.45 6.93 10.40 28.10 34.18 20.38 08 2013–14 446,647 439,099 98.31 7,444 1.67 6.77 9.63 18.65 22.33 42.63 08 2014–15 473,853 457,807 96.61 16,067 3.39 8.39 10.22 19.15 23.03 39.23 10 2013–14 438,781 421,652 96.10 16,979 3.87 7.55 11.33 26.03 27.78 27.31 10 2014–15 488,435 451,089 92.35 37,346 7.65 7.77 10.79 28.73 27.80 24.91
Note 1: Due to rounding, the sum of all achievement levels may not total 100 percent. Note 2: The number of students tested includes students that did not receive a score; however, the number of students tested is not the number that was used to calculate the achievement level percentages. The achievement level percentages are calculated using students with scores. Note 3: Inclusion and exclusion rules are different for the STARC than other public assessment reports.

Page 24 of 32
CAASPP Assessment Results – Science Disaggregated by Student Group
2014–15
Science – Grade 5
Student Group Total Enrollment
Number Tested
Percent Tested
Number Not
Tested
Percent Not
Tested
Percent Far
Below Basic
Percent Below Basic
Percent Basic
Percent Proficient
Percent Advanced
Statewide 478,610 466,918 97.56 11,707 2.45 6.93 10.40 28.10 34.18 20.38 Male 245,565 239,223 97.42 6,356 2.59 7.49 10.13 26.39 34.01 21.97 Female 233,045 227,695 97.70 5,351 2.30 6.34 10.67 29.90 34.37 18.72 Black or African American 28,006 26,794 95.67 1,212 4.33 12.12 15.82 33.82 28.52 9.73
American Indian or Alaska Native 2,682 2,564 95.60 118 4.40 9.37 12.56 33.03 33.07 11.97
Asian 43,895 43,072 98.13 825 1.88 3.07 4.18 14.68 33.81 44.26 Filipino 12,253 11,997 97.91 256 2.09 2.65 4.72 21.73 42.20 28.71 Hispanic or Latino 255,189 250,647 98.22 4,549 1.78 9.46 14.16 34.70 31.08 10.60 Native Hawaiian or Pacific Islander 2,495 2,420 96.99 75 3.01 7.88 12.66 33.86 33.61 11.99
White 117,690 113,737 96.64 3,958 3.36 2.49 4.34 18.83 41.02 33.31 Two or More Races 13,857 13,211 95.34 647 4.67 2.73 5.12 19.34 39.43 33.39
Socioeconomically Disadvantaged 289,930 283,894 97.92 6,041 2.08 9.87 14.38 34.63 30.80 10.32
English Learners 105,655 103,389 97.86 2,269 2.15 17.99 23.02 37.52 17.74 3.74 Students with Disabilities 57,675 55,343 95.96 2,345 4.07 12.09 17.62 28.98 27.84 13.47
Students Receiving Migrant Education Services
4,624 4,536 98.10 88 1.90 18.06 19.68 36.66 21.27 4.33
Note 1: Due to rounding, the sum of all achievement levels may not total 100 percent. Note 2: Socioeconomically disadvantaged students are defined as students: (1) who are eligible for the free or reduced-price lunch program (also known as the National School Lunch Program or NSLP), or have a direct certification for free or reduced-price meals, or (2) who are migrant, homeless, or foster youth, or (3) where neither of the parents were a high school graduate. Note 3: The number of students tested includes students that did not receive a score; however, the number of students tested is not the number that was used to calculate the achievement level percentages. The achievement level percentages are calculated using students with scores. Note 4: Inclusion and exclusion rules are different for the STARC than other public assessment reports.

Page 25 of 32
Science – Grade 8
Student Group Total Enrollment
Number Tested
Percent Tested
Number Not
Tested
Percent Not
Tested
Percent Far
Below Basic
Percent Below Basic
Percent Basic
Percent Proficient
Percent Advanced
Statewide 473,853 457,807 96.61 16,067 3.39 8.39 10.22 19.15 23.03 39.23 Male 242,805 234,208 96.46 8,608 3.55 9.55 9.65 17.53 21.81 41.47 Female 231,048 223,599 96.78 7,459 3.23 7.17 10.81 20.84 24.30 36.88 Black or African American 30,138 28,308 93.93 1,832 6.08 14.69 16.11 24.62 22.81 21.76
American Indian or Alaska Native 2,851 2,623 92.00 228 8.00 11.40 12.48 21.73 26.45 27.95
Asian 42,200 41,327 97.93 874 2.07 2.46 3.67 8.63 15.79 69.45 Filipino 13,519 13,190 97.57 329 2.43 2.57 4.63 13.15 23.53 56.12 Hispanic or Latino 250,311 243,405 97.24 6,920 2.76 11.24 13.46 23.79 24.73 26.77 Native Hawaiian or Pacific Islander 2,429 2,338 96.25 91 3.75 10.37 12.01 21.21 25.04 31.37
White 118,455 113,571 95.88 4,888 4.13 3.79 5.16 12.79 22.07 56.19 Two or More Races 11,359 10,573 93.08 786 6.92 4.79 6.04 14.02 21.13 54.03
Socioeconomically Disadvantaged 280,749 271,847 96.83 8,912 3.17 11.59 13.72 23.71 24.37 26.60
English Learners 63,566 60,992 95.95 2,585 4.07 26.63 24.17 26.26 15.18 7.76 Students with Disabilities 51,987 48,941 94.14 3,064 5.89 19.16 18.01 25.19 21.69 15.94
Students Receiving Migrant Education Services
4,063 3,967 97.64 96 2.36 18.47 18.12 23.80 21.64 17.97
Note 1: Due to rounding, the sum of all achievement levels may not total 100 percent. Note 2: Socioeconomically disadvantaged students are defined as students: (1) who are eligible for the free or reduced-price lunch program (also known as the National School Lunch Program or NSLP), or have a direct certification for free or reduced-price meals, or (2) who are migrant, homeless, or foster youth, or (3) where neither of the parents were a high school graduate. Note 3: The number of students tested includes students that did not receive a score; however, the number of students tested is not the number that was used to calculate the achievement level percentages. The achievement level percentages are calculated using students with scores. Note 4: Inclusion and exclusion rules are different for the STARC than other public assessment reports.
Page 26 of 32
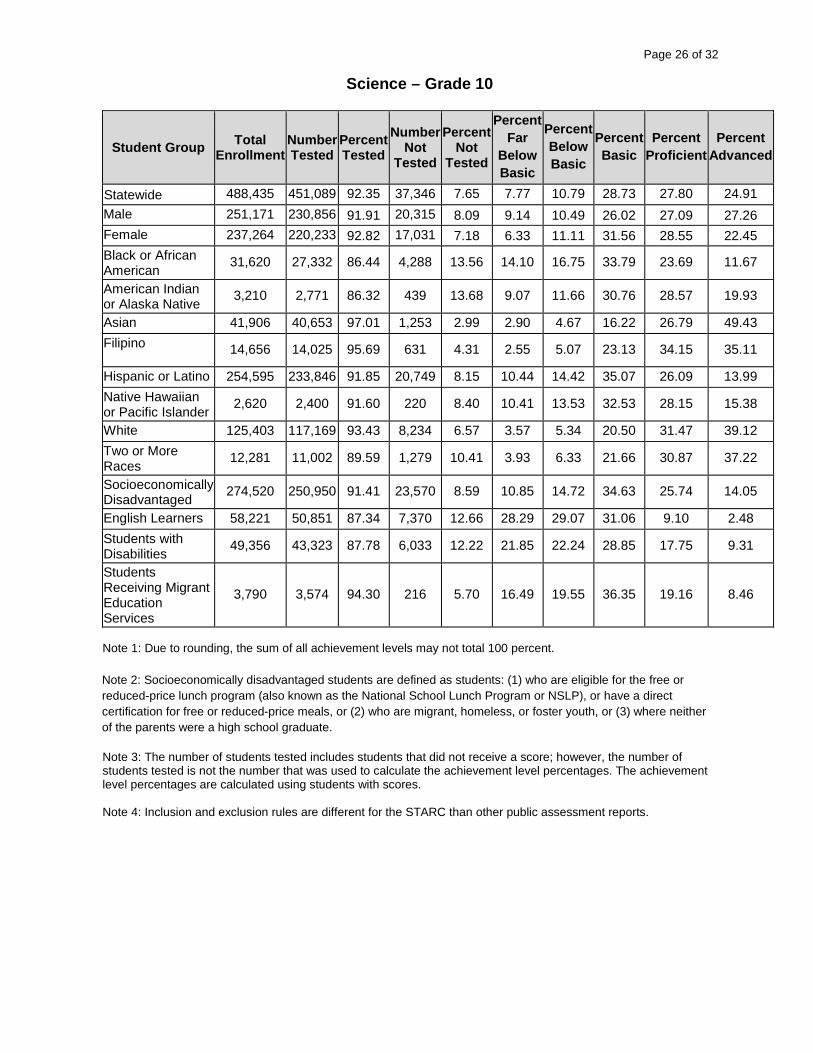
Science – Grade 10
Student Group Total Enrollment
Number Tested
Percent Tested
Number Not
Tested
Percent Not
Tested
Percent Far
Below Basic
Percent Below Basic
Percent Basic
Percent Proficient
Percent Advanced
Statewide 488,435 451,089 92.35 37,346 7.65 7.77 10.79 28.73 27.80 24.91 Male 251,171 230,856 91.91 20,315 8.09 9.14 10.49 26.02 27.09 27.26 Female 237,264 220,233 92.82 17,031 7.18 6.33 11.11 31.56 28.55 22.45 Black or African American 31,620 27,332 86.44 4,288 13.56 14.10 16.75 33.79 23.69 11.67
American Indian or Alaska Native 3,210 2,771 86.32 439 13.68 9.07 11.66 30.76 28.57 19.93
Asian 41,906 40,653 97.01 1,253 2.99 2.90 4.67 16.22 26.79 49.43 Filipino 14,656 14,025 95.69 631 4.31 2.55 5.07 23.13 34.15 35.11
Hispanic or Latino 254,595 233,846 91.85 20,749 8.15 10.44 14.42 35.07 26.09 13.99 Native Hawaiian or Pacific Islander 2,620 2,400 91.60 220 8.40 10.41 13.53 32.53 28.15 15.38
White 125,403 117,169 93.43 8,234 6.57 3.57 5.34 20.50 31.47 39.12 Two or More Races 12,281 11,002 89.59 1,279 10.41 3.93 6.33 21.66 30.87 37.22
Socioeconomically Disadvantaged 274,520 250,950 91.41 23,570 8.59 10.85 14.72 34.63 25.74 14.05
English Learners 58,221 50,851 87.34 7,370 12.66 28.29 29.07 31.06 9.10 2.48 Students with Disabilities 49,356 43,323 87.78 6,033 12.22 21.85 22.24 28.85 17.75 9.31
Students Receiving Migrant Education Services
3,790 3,574 94.30 216 5.70 16.49 19.55 36.35 19.16 8.46
Note 1: Due to rounding, the sum of all achievement levels may not total 100 percent. Note 2: Socioeconomically disadvantaged students are defined as students: (1) who are eligible for the free or reduced-price lunch program (also known as the National School Lunch Program or NSLP), or have a direct certification for free or reduced-price meals, or (2) who are migrant, homeless, or foster youth, or (3) where neither of the parents were a high school graduate. Note 3: The number of students tested includes students that did not receive a score; however, the number of students tested is not the number that was used to calculate the achievement level percentages. The achievement level percentages are calculated using students with scores. Note 4: Inclusion and exclusion rules are different for the STARC than other public assessment reports.

Page 27 of 32
Teacher Qualifications The federal ESEA requires that all teachers teaching in core academic subjects be “highly qualified” by the end of the 2006–07 school year. In general, the ESEA requires that each teacher must have: (1) a bachelor’s degree; (2) a state credential or an Intern Certificate/Credential for no more than three years; and (3) demonstrated subject matter competence for each core subject taught.
Further information on teacher qualifications required by the ESEA can be found at the CDE Improving Teacher and Principal Quality Web page at http://www.cde.ca.gov/nclb/sr/tq/. Detailed information on teacher qualification data can be found on the CDE DataQuest Web page at http://dq.cde.ca.gov/dataquest/.
Teacher Credentials, 2014–15
Type of Credential Percent*
Teachers with Full Credentials 96.4
Teachers with Alternative routes to certification (District Internship/University Internship)**
1.6
Teachers with Emergency Permits (not qualified for a credential or internship but meeting minimum requirements)**
0.1
Teachers with Provisional Internship Permits** 0.1
Teachers with Waivers** 3.0 *Teacher credential data may not have been submitted or a teacher may hold more than one type of
credential. As a result, percentages reported in this table may not add to 100 percent. **Does not have a full credential.
Teacher Education Levels, 2014–15
Education Level Percent Doctorate 10 Master's Degree plus 30 or more semester hours 16 Master's degree 25
Bachelor's degree plus 30 or more semester hours 38 Bachelor's degree 18 Less than Bachelor's Degree 0.1 None Reported 0.7

Page 28 of 32
Core Academic Classes Taught by Highly Qualified Teachers
2014–15
The poverty levels are determined by the percentage of the students who were eligible for the free or reduced-price lunch program (also known as the National School Lunch Program or NSLP).
The poverty quartiles for each elementary and secondary school are calculated separately. The schools in the top 25 percent quartile of poverty percentage are considered high-poverty; the schools in the bottom 25 percent quartile of poverty percentage are considered low-poverty; the schools in the middle 50 percent quartile are neither high nor low.
Location of Classes Percent of Classes in Core
Academic Subjects Taught by an ESEA Highly Qualified Teacher
Percent of Classes in Core Academic Subjects Taught by a
Non-ESEA Highly Qualified Teacher
Statewide 94 5 In High-Poverty Schools 94 5 In Low-Poverty Schools 94 5 Note: ESEA defines core academic subject areas as English, reading/language arts, mathematics, science, foreign languages, civics/government, economics, arts, history, and geography.

Page 29 of 32
National Assessment of Educational Progress (NAEP) Results
The NAEP is a nationally representative assessment of what America's students know and can do in various subject areas. Assessments are conducted periodically in mathematics, reading, science, writing, social studies, technology and engineering literacy, and the arts. Student scores are reported, in the aggregate and disaggregated by student groups, as scale scores and performance levels (i.e., Basic, Proficient, and Advanced). The participation of students with disabilities and English language learners is reported based on the number of students identified, excluded, and assessed. Detailed information regarding the NAEP results for each subject and grade level can be found on the National Center for Education Statistics Web page at http://nces.ed.gov/nationsreportcard/. The U.S. Department of Education administers NAEP assessments in reading and mathematics in January through March of every odd-numbered year, and reports state-level results at the Nation’s Report Card. As of October 2015, the most recent state-level NAEP results in reading and mathematics are from 2015. The data in the following four tables reflect results from NAEP assessments that took place during the 2014–15 school year.
California NAEP Results in Reading and Mathematics by Grade Level, All Students, 2014–15
Subject and
Grade Level
State
Average Scale Score
National Average
Scale Score
State Percent
below Basic Achievement
Level
State Percent at
Basic Achievement
Level
State Percent at Proficient
Achievement Level
State Percent at Advanced
Achievement Level
Reading 2015, Grade 4 213 221 41 31 22 6
Reading 2015, Grade 8 259 264 30 42 26 3
Mathematics 2015, Grade 4 232 240 28 43 25 5
Mathematics 2015, Grade 8 275 281 36 37 21 6

Page 30 of 32
California NAEP Results in Reading by Grade Level Disaggregated by Student Group, 2014–15
Student Group and Grade Level
Percent below Basic Achievement
Level
Percent at Basic
Achievement Level
Percent at Proficient
Achievement Level
Percent at Advanced
Achievement Level
Black, Grade 4 54 33 12 1 Black, Grade 8 40 44 15 1 American Indian/Alaska Native, Grade 4 ** ** ** ** American Indian/Alaska Native, Grade 8 ** ** ** ** Asian/Pacific Islander, Grade 4 17 33 35 15 Asian/Pacific Islander, Grade 8 14 37 41 8 Hispanic, Grade 4 54 30 14 2 Hispanic, Grade 8 39 43 17 1 White, Grade 4 22 32 35 11 White, Grade 8 15 40 40 4 Eligible for National School Lunch, Grade 4 53 31 14 2 Eligible for National School Lunch, Grade 8 40 43 17 1 Not Eligible for National School Lunch, Grade 4 22 31 34 14
Not Eligible for National School Lunch, Grade 8 16 41 38 5
Students with Disabilities, Grade 4 80 12 6 1 Students with Disabilities, Grade 8 77 18 5 # English Learners, Grade 4 73 21 5 # English Learners, Grade 8 79 20 2 # Male, Grade 4 43 31 20 5 Male, Grade 8 34 42 23 2 Female, Grade 4 39 31 23 7 Female, Grade 8 26 42 29 3
**Reporting standards were not met. # Equals less than 1% and rounds to zero.

Page 31 of 32
California NAEP Results in Mathematics by Grade Level Disaggregated by Student Group, 2014–15
Student Group and Grade Level
Percent below Basic Achievement
Level
Percent at Basic
Achievement Level
Percent at Proficient
Achievement Level
Percent at Advanced
Achievement Level
Black, Grade 4 37 45 17 1 Black, Grade 8 55 31 13 1
American Indian/Alaska Native, Grade 4 ** ** ** ** American Indian/Alaska Native, Grade 8 ** ** ** ** Asian/Pacific Islander, Grade 4 11 35 37 17 Asian/Pacific Islander, Grade 8 13 31 34 22 Hispanic, Grade 4 38 46 15 1 Hispanic, Grade 8 48 38 12 2 White, Grade 4 12 41 41 7 White, Grade 8 19 38 34 10 Eligible for National School Lunch, Grade 4 38 46 15 1 Eligible for National School Lunch, Grade 8 47 37 14 2 Not Eligible for National School Lunch, Grade 4 11 38 40 11
Not Eligible for National School Lunch, Grade 8 19 36 32 13
Students with Disabilities, Grade 4 59 30 8 3 Students with Disabilities, Grade 8 79 17 3 1 English Learners, Grade 4 53 38 7 1 English Learners, Grade 8 76 22 2 0 Male, Grade 4 27 42 25 6 Male, Grade 8 36 37 21 6 Female, Grade 4 29 44 24 3 Female, Grade 8 36 37 21 6
**Reporting standards were not met. # Equals less than 1% and rounds to zero.

Page 32 of 32
California NAEP Results in Reading and Mathematics by Grade Level for Students with Disabilities and/or English Language Learners, 2014–15
Subject and
Grade Level
State Participation
Rate Students
With Disabilities
and/or English
Language Learners
State Participation
Rate Students
With Disabilities
State Participation
Rate English
Language Learners
National Participation
Rate Students
With Disabilities
and/or English
Language Learners
National Participation
Rate Students
With Disabilities
National Participation
Rate English
Language Learners
Reading 2015, Grade 4 95 85 97 91 87 93
Reading 2015, Grade 8 93 88 94 89 87 90
Mathematics 2015, Grade 4 95 86 97 93 89 95
Mathematics 2015, Grade 8 94 89 97 91 90 93