standardization of computerized respiratory sound...
TRANSCRIPT
Eur Respir Rev
2000; 10: 77, 585Printed in UK - all rights reserved
Copyright ©ERS Journals Ltd 2000European Respiratory Review
ISSN 0905 - 9180
Standardization of computerized respiratory sound analysis
A.R.A. Sovijärvi, J. Vanderschoot, J.E. Earis
Pulmonary disease is a major cause of ill-health thro-ughout the world. In Europe, chronic obstructive pulmo-nary disease (COPD) and asthma have been estimated toaffect between 10 and 25% of the adult population. Pul-monary infections such as acute bronchitis and pneumoniaare common, and interstitial lung disease is increasing inincidence. The diagnosis of these common chest diseasesis facilitated by pulmonary auscultation using a stetho-scope. This device, invented in 1821 by the French Physi-cian, Laennec, is still the commonest diagnostic tool usedby doctors.
Auscultation with a stethoscope has many limitations. Itis a subjective process that depends on the individual'sown hearing, experience and ability to differentiate betweendifferent sound patterns. It is not easy to produce quantita-tive measurements or make a permanent record of anexamination in documentary form. Long-term monitoringor correlation of respiratory sound with other physiologi-cal signals is also difficult. Moreover, the stethoscope hasa frequency response that attenuates frequency compo-nents of the lung sound signal above about 120 Hz [1],and the human ear is not very sensitive to the lower fre-quency band that remains.
Over the last 30 yrs, computerized methods for therecording and analysis of respiratory sounds have over-come many limitations of simple auscultation. Respiratoryacoustic analysis can now quantify changes in lung so-unds, make permanent records of the measurements madeand produce graphical representations that help with thediagnosis and management of patients suffering from chestdiseases.
Over recent years, the scientific activity within the fieldof respiratory acoustics has increased markedly. However,a lack of guidelines for data acquisition, storage, signalprocessing and analysis of the lung sound signal has madeit difficult to compare results from different laboratoriesand has hampered the commercial development of respira-tory sound analysis equipment. Several efforts have beenundertaken to solve these problems [2–4].
The European Community has financed a BIOMED 1Concerted Action project entitled Computerized Respira-tory Sound Analysis (CORSA). This collaboration, which
was also a task force of the European Respiratory Society,involved research workers in seven European Countries(Belgium, Britain, Finland, France, Germany Italy and theNetherlands). The main objective of the participating cen-tres was to develop guidelines for research and clinical prac-tice in the field of respiratory sound analysis. This issue ofThe European Respiratory Review includes the agreed con-sensus of the CORSA project group. As an introduction, asurvey of current clinical practice and research initiativesin Europe is presented. Because the definitions of termsincluding lung sound nomenclature used in the field arevariable both within and between countries, a paper pre-senting both established and new definitions of medicaland technical terms used in pulmonary acoustics is in-cluded. This paper is deliberately comprehensive in orderto provide easily accessible definitions to all workers involv-ed in this field. Another paper deals with the environmen-tal conditions required and patient management proceduresto be adopted. Further papers deal with the acquisition,pre-processing and digitization and analysis of lung sounds.Guidelines for publishing the results of research and clini-cal trials are given so they can be more easily related toother findings. Finally, a perspective on the future of respi-ratory sound analysis is given.
We would like to express our cordial thanks to the wholeCORSA group, which includes over 20 scientists, for theirvaluable and intensive work resulting in the papers in thisspecial issue. We hope that this issue of the European Res-piratory Review will facilitate the development of standard-ized lung sound analysis equipment and promote researchinto the understanding of respiratory sounds. This willinevitably lead to better and new clinical applications.
References
1. Abella M, Formolo J, Penny DG. Comparison of acousticproperties of six popular stethoscopes.
J Acoust Soc Am
1992; 91: 2224–2228.2. Mussel MJ. The need for standards in recording and ana-
lysing respiratory sounds.
Med Biol Eng Comput
1992;30: 129–139.
3. Gavriely N. Breath Sounds Methodology. Boca Raton,FL, CRC Press 1995.
4. Pasterkamp H, Kraman SS, Wodicka GR. Respiratorysounds. Advances beyond the stethoscope.
Am J RespirCrit Care Med
1997; 156: 974–987.
Correspondence: A.R.A. Sovijärvi, Dept of Clinical Physiology andNuclear Medicine, Helsinki University Hospital, P.O. Box 340, FIN-00029 HUS, Finland. Fax: 358 947174592.

Eur Respir Rev
2000; 10: 77, 586–590Printed in UK - all rights reserved
Copyright ©ERS Journals Ltd 2000European Respiratory Review
ISSN 0905 - 9180
Current methods used for computerized respiratory sound analysis
J.E. Earis
*
, B.M.G. Cheetham
**
With the use of modern digital signal processing tech-niques, the analysis of wave forms by computer hasbecome an established research technique for the investi-gation of respiratory sounds [1, 2]. As research in this areahas developed, many different types of equipment andtechniques have been used. The aims of this paper are toanalyse the activities, in this field, in European and othermain world-wide centres, to assess the degree to whichequipment is standardized and to identify the techniquesused to analyse respiratory sounds. To enable comparisonsto be made between the various types of equipment andtechniques used currently, and recently, for the computer-ized analysis of respiratory sounds, the authors haveundertaken a survey of this area of research.
Methods
The survey was carried out in the main European andworld centres by addressing the published literature, makingsite visits and holding meetings with workers active in thefield. The study was undertaken as part of the concertedaction project, CORSA (Computerized Respiratory SoundAnalysis), included in the BIOMED 1 programme of theEuropean Union.
A study of the world literature over the 10 yrs from Jan-uary 1986 to January 1996 was undertaken using Index
Medicus and the ILSA (International Lung Sounds Asso-ciation) bibliography (http://www.ilsa.cc/referenc.htm) ascurrent in January 1996. The 1,672 papers referring toupper and lower respiratory sounds published world-widewere analysed. Among these, 163 papers were identifiedthat used some form of electronic wave-form analysistechniques (12.6% of the total number of papers). TheILSA bibliography includes all papers that use form ofelectronic analysis published since 1970. The analysistechniques used in each of the main European, North Amer-ican and Israeli centres were identified and cataloguedaccording to the criteria presented in table 1. A detailedanalysis of all papers in the survey originating in Europebetween 1991 and 1996 was undertaken in order to pro-vide a detailed catalogue of the equipment and techniquesused.
Survey of respiratory sounds research
The survey revealed that within Europe, the most activecontributors were from the CORSA groups in Finland,England, France, Italy and The Netherlands who wereresponsible for about 25% of the total published world-wide papers on respiratory sounds. Table 2, producedfrom the literature survey, gives an overall indication ofthe type of work being undertaken in European centres.
Current methods used for computerized respiratory sound analysis J.E. Earis, B.M.G.Cheetham. ©ERS Journals Ltd 2000.
ABSTRACT: The study of respiratory sounds by computer has a considerable his-tory, which spans a time of rapidly evolving technology and changing perceptions ofanalogue and digital signal processing. Much of the knowledge gained in recent yearshas resulted from the use of a wide variety of data acquisition, processing and analy-sis techniques. Details of the techniques used in published research emanating fromEuropean and other world wide centres over the past 10 yrs are surveyed in thispaper. The survey reveals the range of clinical conditions studied, the type of analysisequipment used and the extent to which the engineering parameters of the variousequipment used were similar and/or different. It is clear that, in addition to the well-established analysis of adventitious sounds, there is increasing interest in the analysisof breath sounds as a measure of regional physiology. In addition, over 60% of pub-lished studies over the 10 yrs involve upper airway sounds. Although marked similar-ities in the basic methodology were found, there was considerable variation in the waythat sound was processed and analysed. It is concluded that there is a need for thedevelopment of guidelines for the recording, processing and analysis of respiratorysounds in order to facilitate the easy exchange of data and to enable a meaningfulcomparison of results between research centres.
Eur Respir Rev 2000: 10: 77, 586–590.
*Aintree Chest Centre, University Hospi-tal, Aintree, Liverpool, UK. **School ofEngineering, University of Manchester,Manchester, UK.
Correspondence: J.E. Earis Aintree Chest CentreUniversity HospitalAintreeLongmoor LaneLiverpool L9 7ALUK
Keywords: Computer analysisrespiratory sounds
This study was supported by the EUBIOMED 1 programme (contract BMH1-CT94-0928) and by the European Respira-tory Society (ERS task force).
This paper forms part of the publicationsof the CORSA project.

CURRENT
METHODS
FOR
RESPIRATORY
SOUNDS
587
Papers concerned with the study of upper airway sounds(snoring, cough and stridor) were found to make up 63%of the total. The analysis of wheeze produced 26% of thetotal, and the study of a variety of other respiratory sounds(
e.g.
hoarseness of voice) made up the balance. Bibliogra-phies reviewing the overall literature may be found in the
following papers on snoring [3, 4], cough [5–7], stridor [8],and wheeze [9, 10]. Studies involving an objective analy-sis of respiratory sounds show that lower respiratorysound analysis accounted for 55% of the total and snoringfor the remaining 45%. Overall, 50% of the papers werewritten by CORSA participants. Over the 5 yrs of thisstudy, the evaluation of breath sounds has producedalmost as many publications as the more traditional analy-sis of adventitious lung sounds. Good bibliographies onbreath sound analysis may be found in papers by M
ALM-
BERG
et al
. [11], G
AVRIELY
et al.
[12] and S
CHREUR
et al
.[13].
Although there is a limited amount of commercialequipment specifically designed for the analysis of respi-ratory sounds (for example, the "PNP Fonopneumografo"system from the Carex European Group S.P.A, Arezzo,Italy; The Sleep Sound ELENS-DSA from B.E.A. Medi-cal, Orban, Belgium; The Helsinki Lung Sounds AnalyserHELSA from Pulmer Ltd Helsinki; The RALE systemfrom PixSoft Inc, Winnipeg, Canada and the PulmoTracksystem from Karmel Medical Acoustic Technologies, Israel),most research has been carried out by using customde-signed electronic systems. Various common practiceshave emerged, though substantial differences in approachwere also apparent. The survey reported in this paperrevealed the following similarities and differences, whichhave been characterized under the headings presentedbelow.
Signal acquisition methods
In all applications, sounds recorded from the respira-tory system were captured by microphones or contact sen-sors situated at the mouth (free field), on the chest orelsewhere. Other physiological signals were commonlycaptured alongside the sound for example, airflow, changeof lung volume and/or intra-thoracic pressure and oxygensaturation. All but two European centres and one NorthAmerican Centre have published work where flow, meas-ured with a pneumotachograph, was recorded simultane-ously with the sound recording. Typically, one chest-wallsound channel was used, but in many papers, two andoccasionally multiple channels were used [14, 15]. Upperairway sounds such as snoring and cough were often cap-tured by microphones used in free field at a set distance
Table 1. – Headings used for the survey
Name of institution:Name of researchers
Condition under study (eg. asthma, COPD)
Type of sound studied: a) Wheeze b) Stridor c) Crackles d) Snoring e) Other
Other signals recorded, e.g. flow, volume
Method of sound capture: a) Microphone (type, attachment attributes) b) Other
Storage of respiratory sounds a) Audio cassette tape recorder b) DAT recorder c) Direct digitization d) Other
Analogue pre-filtering and frequencies a) High pass b) Low pass c) Overall band width of signal d) Type of filter
Method of digitization a) Commercial PC card (e.g. Soundblaster b) Commercial A-to-D converter c) Specially designed converter d) Other e) Sampling rate f) Number of bits per sample
Type of computer used a) PC and series (i.e. 486) b) Unix work station c) Other
Signal processing1) Spectral analysis (type e.g. FFT; wavelet) a) Number of points b) Overlap c) Windowing
2) Time domain expanded wave-form3) Modelling and type4) Neural networks5) Digital filtering techniques6) Other
Analysis Techniques a) Frequency b) RMS c) Log power d) Quartiles e) Wave-form measurements (IDW etc.) f) Other
Procedures applied: a) Event identification b) Segmentation c) Other measurement
DisplayNumber of signals displayed(i.e. sound and flow)Time domain display
Spectrograph a) Quasi-three dimensional waterfall b) Colour spectrograph c) Power spectra d) Flow spectra e) Other
OtherGraphs software used: a) Harvard b) Stanford c) Corel Draw d) MATLAB graphics e) Other
Development of dedicated software a) Name b) Language used c) What does it do? d) What is it for? e) Is it commercially available? f) Is it used by others? g) Has it been published? h) References
Table 2. – Type of sound analysed in European countries1991–1996Application area
Subjective analysis
Electronic analysis
Total
SnoringStridorCoughWheezeCracklesBreath soundsOtherTotals
190316
9700
13330
15013781
34
205 (55%)31 (8%)7 (2%)
100 (26%)7 (2%)8 (3%)
14 (4%)364
588
J
.
E
.
EARIS
,
B
.
M
.
G
.
CHEETHAM
from the patient's mouth [7]. Adventitious and breathsounds originating from the lower airways were capturedfrom the chest wall using two types of microphone: 1)electret air-coupled microphones and 2) contact sensors(accelerometers) [1, 16]. Air-coupled microphones wereused in all European Centres, but the size, shape anddimensions of the air cavity between the microphone andchest varied from centre to centre [17]. Microphone hous-ings were generally designed and custom-made by indi-vidual centres according to particular theories and ideas.In North America and Israel, a variety of commerciallyavailable and custom-made contact sensors and acceler-ometers, attached on to the chest wall with either adhesiverings or a rubber belt, were employed [18].
Analogue prefiltering and storage
The analogue filtering applied to the captured soundsignal varied from centre to centre according to estab-lished practice, available technology and the particularapplication. Most researchers employed a high-pass filter[18, 19] with a cut-off frequency chosen somewhere in therange from 30–150 Hz, the norm being around 50–60 Hz[10, 20, 21]. A low-pass filter was always used in the cap-ture of lower airway sounds with the cut-off frequency setbetween ~1600 and 3000 Hz [9, 19–21]. Upper airwaysounds were generally processed with higher cut-off fre-quencies [7]. Until 1990, normal practice was to storesound and flow signals on analogue magnetic recordingtape, for subsequent digitization off line (flow signalswere usually recorded using FM tape recorders). In recentyears, DAT tape recorders have been used for both soundand flow, though normal practice is now direct digitizationand acquisition by computer [20, 22].
Digitization protocols
Analogue-to-digital converters are used with wordlengths of nominally 12, 14 or 16 bits per sample [9, 13,20] A wide range of different sampling rates are in com-mon use, the lowest being around 4 kHz and the highestbeing 22.05 kHz. Three centres used standard multi-mediasound cards
e.g.
"Soundblaster" cards [22], and severalothers used other commercial multi-channel signal acqui-sition cards.
Signal processing
The spectral analysis of respiratory sounds using thediscrete Fourier transform (DFT), invariably making useof a Fast Fourier Transform (FFT) algorithm. [12, 18–20],was universal. The duration of each analysis segment wastypically between 20 and 50 ms, which means that with asampling rate of around 10 kHz, signal block lengths of256, 512 or 1024 samples were commonly used. Zero-padding and overlapping of analysis segments techniqueswere commonly used [9, 20, 23], and windowing was usu-ally by a Hamming, Hann or other universally accepted
type nonrectangular window. The survey revealed thatnewer highly advanced spectral analysis and digital signalprocessing techniques were being increasingly used, theseincluded autoregressive analysis [24, 25], wavelets [26],Pronys method [27], neural networks [28] and higher-orderspectra [29]. The analysis of the signal usually involvedsome of the following elements [18, 19, 30]: short-termpower and power spectral density, spectrographs; averagedpower spectra; estimation of spectral energy distribution(
e.g.
quartiles); flow representation (sometime flow gatingor flow-standardized spectra) [19, 20, 30, 31]; wheezedetection [9, 18, 32–34]; crackle detection [14, 35–38];cough detection [5–7]; snoring detection [3, 4, 39, 40],and a variety of other techniques [16, 19, 28, 30, 33, 41,42].
Displays
Graphical representations of results were usually custom-written. Some of the commoner forms of display werepower plots in the time-domain, three-dimensional spec-trographs and airflow, plot of averaged power spectra andtime expanded waveforms [35–37, 43,]. Many other morespecialized types of display including real-time spectro–graphs were employed specific to individual centres [44].The graphics and programming software used to producesuch displays were very variable but there is increasingusage of the graphic facilities offered by versions of C++and MATLAB.
Discussion
The results of this study show that in earlier years theanalysis of lower airway sounds was directed mainlytowards adventitious sounds such as wheezes and cracklesand in recent years there has been an emphasis on theanalysis of breath sounds [11–13]. The main reason forthis is the increasing evidence that analysis of breath soundsprovides clinically useful information about regional ven-tilation within the lungs [11, 15] (see
Future Perspectives
in this issue). In order for such measurements to be mean-ingful breath sounds must be normalised for air-flow [19,20, 30]. Approximately 65 percent of the total peer reviewpapers during this survey were concerned with upper air-way sounds particularly snoring. This highlights the interestin the possible use of sound as a non-invasive way to mon-itor and diagnose common sleep related breathing disor-ders.
Sound was most commonly recorded with an air-cou-pled microphone, but there appears to be little uniformityin chamber size and method of attachment [16, 17]. Thus,the frequency response of the data-acquisition equipmentis likely to vary significantly between centres, even whenthe analogue electronics are carefully controlled. Although,currently, there appears to be no standardized way ofmeasuring the frequency response of a microphone whenit is attached to the surface of the human body, P
AS-
TERKAMP
et al
. [16, 17] have now published optimumdimensions for air coupled microphones.

CURRENT
METHODS
FOR
RESPIRATORY
SOUNDS
589
Previously, sound was usually recorded on to magnetictape, using either a cassette recorder or an FM recorder (ifflow was also recorded). More recently, with the readyavailability of cheap computer memory, direct storage ona hard disc, read/write CD ROM or other similar mediahas become the norm in most centres. A considerable var-iation in the analogue pre-processing was revealed by thissurvey. A high-pass filter to eliminate muscle, heart andother low-frequency sounds which could otherwise over-load the input amplifier was generally used with a cut-offfrequency range between 50 and 150 Hz, but in Europe,the cut-off frequency was usually between 50 and 60 Hz[10, 20, 21]. Low-pass filtering varies according to theapplication.
A wide range of commercial and custom-designedequipment is used to digitize the sound and flow signals.Such equipment is now readily available and as "multi-channel cards", though there is also a trend towards theuse of multi-media sound cards primarily designed for thedigitizaton of speech and music [22]. There is a trendtowards higher levels of over-sampling and subsequentdecimation to reduce the sampling rate after digitizationand digital filtering. This use of higher sampling rates alsoallows simpler, lower-order analogue low-pass filters to beused with higher cut-off frequencies [22, 26, 27, 44].There is strong feeling and some disagreement about thebandwidths that need to be considered when analysingdifferent types of respiratory sounds. Bandwidths of lessthan 1 kHz with sampling rates of around 2 kHz have beenused in some studies of wheeze, though this is now widelybelieved to be insufficient, and modern technology allowsmuch higher bandwidths and sampling rates to be readilyaccommodated.
Signal processing usually involves some form of time-domain measurement,
e.g.
crackle waveform characteriza-tion, and spectral analysis generally using the fast Fouriertransform (FFT). The order of the discrete Fourier transform(DFT) must be dependent on the sampling frequency, thespectral resolution required and the degree of non-station-arity in the signal. Zero-padding and overlapping of analy-sis segments techniques are commonly used to improvedisplays. Real-time displays of digitized signals and theirspectra are well within the capacity of current technologyand have been implemented in some centres [44]. The realtime aspect makes a spectrograph easier to use as signalcapturing and processing parameters can be rapidly modi-fied and useful data immediately identified (
e.g.
duringovernight monitoring of asthma, or the monitoring of res-piratory patients in intensive care units).
Parametric representation of respiratory sounds usingtechniques such as autoregressive analysis, linear predic-tion and wavelets has been investigated in some centres[18, 24–27]. These modelling techniques are well estab-lished in the analysis of speech and are proving useful inthe analysis of respiratory sound. Specific applications in-clude autoregressive and wavelet modelling of lung sounds[24, 29, 45], adaptive filtering techniques for crackle anal-ysis and filtering of heart sounds [42] and linear predictionfor upper airway sounds [4, 22]. The development of neu-ral networks for lung sound research is in its early stages
but offers the prospect of sophisticated automatic patternrecognition associated with specific disease states.
Various forms of display have been used, usually de-signed in-house, and these had some form of time-domainrepresentation, power spectral display and a quasi-three-dimensional spectrographic display [35–37]. Differentprogramming languages,
e.g
. "C" and s graphics pack-ages,
e.g.
Harvard graphics, have been used to develop thesoftware. MATLAB is now used as a development tool totry out new analysis techniques before incorporating theminto new programmes. There is now some commercialinterest in developing equipment based on these pro-grammes, which would enable more centres to undertakethe analysis of respiratory sounds.
Conclusions
This study shows that there are marked similarities inthe basic methodology of respiratory analysis in the mainworld centres. However, there are many variations in thedetails of sound capture and analysis techniques betweenresearchers, which make comparison of results from thedifferent centres difficult. A clear description of methodol-ogy is essential, and this study has confirmed the necessityfor the development of guidelines for the recording,processing and analysis of respiratory sounds, [18, 46],which are being developed from the results of the CORSAproject. This development will facilitate the easy exchangeof data, and enable meaningful comparison of results bet-ween research centres.
References
1. Pasterkamp H, Kraman S, Wodicka G. Respiratorysounds. Advances beyond the stethoscope.
Am J RespirCrit Care Med
1997, 156: 974–987.2. Earis J. Lung sounds [editorial].
Thorax
1992; 47: 671–672.3. Dalmasso F, Benedetto G, Pogolotti R, Righini G, Spag-
nolo R. Digital processing of snoring sounds.
Eur RespirJ
Suppl 1990; 11: 528s–532s.4. Dalmasso F, Prota R. Snoring: analysis, measurement,
clinical implications and applications.
Eur Respir J
1996;9: 146–159.
5. Salmi T, Sovijärvi A, Brander P, Piirilä P. Long-termrecording and automatic analysis of cough using filteredacoustic signals and movements on static charge sensitivebed.
Chest
1988; 94: 970–975.6. Piirilä P, Sovijärvi A. Objective assessment of cough.
EurRespir J
1995; 8:1949–1956.7. Doherty M, Wang L, Donague S,
et al.
The acoustic prop-erties of capsaicin-induced cough in healthy subjects.
EurRespir J
1997; 10: 202–207.8. Slawinski E, Jamieson D. Studies of respiratory stridor in
young children: Acoustic analysis and tests of theoreticalmodels.
J Paediatr Otorhinolaryngol
1990; 19: 205–222.9. Spence D, Graham D, Jamieson G, Cheetham B, Calver-
ley P, Earis JE. The relationship between wheezing andlung mechanics during methacholine-induced bronchoc-onstriction in asthmatic subjects.
Am J Respir Crit CareMed
1996; 154: 290–294.10. Meslier N, Charbonneau G, Racineux J. Wheezes.
EurRespir J.
1995; 8: 1942–1948.
590
J
.
E
.
EARIS
,
B
.
M
.
G
.
CHEETHAM
11. Malmberg L, Sorva R, Sovijarvi A. Frequency distributionof breath sounds as an indicator of bronchoconstrictionduring histamine challenge test in asthmatic children.
Pediatr Pulmonol
1994; 18: 170–177.12. Gavriely N, Nissan M, Rubin A, Cugell D. Spectral char-
acteristics of chest wall breath sounds in normal subjects.
Thorax
1995, 50: 1292–1300.13. Schreur H, Sterk P, Vanderschoot J,
et al.
Lung soundintensity in patients with emphysema and in normal sub-jects at standardised airflows.
Thorax
1992; 47: 674–679.
14. Benedetto G, Dalmasso F, Spagnolo R. Surface distribu-tion of crackling sounds, IEEE
Trans Biomed Eng
1988;35: 406–412.
15. Pasterkamp H, Consunji-Araneta R, Oh Y, Holbrow J.Chest surface mapping of lung sounds during metha-choline challenge.
Pediatr Pulmonol
1997; 23: 21–30.16. Pasterkamp H, Kraman S, DeFrain P, Wodicka G. Meas-
urement of respiratory acoustical signals. Comparison ofsensors
. Chest
1993; 104: 1518–1525.17. Pasterkamp H, Kraman S, DeFrain P, Wodicka G. Meas-
urement of respiratory acoustical signals. Comparison ofsensors [see comments].
Chest
1993; 104: 1518–1525.18. Gavriely N, Cugell D. Breath Sounds Methodology. Boca
Raton, FL, CRC Press, 1995.19. Pasterkamp H, Carson C, Daien D, Oh Y. Digital
respirosonography. New images of lung sounds.
Chest
1989; 96: 1405–1412.20. Sovijarvi A, Malmberg L, Paajanen E,
et al.
Averagedand time-gated spectral analysis of respiratory sounds.Repeatability of spectral parameters in healthy men andin patients with fibrosing alveolitis.
Chest
1996; 109:1283–1290.
21. Rossi M, Pasquali G, Barnabe-R.
et al.
Pnonopneumog-raphy findings in patients with sarcoidosis and lung fibro-sis.
Sarcoidosis
1993; 10: 156–157.22. Plante F, Kessler H, Cheetham BMG, Earis JE. Speech
monitoring of infectious laryngitis Proc Int Conf for Spo-ken Language Processing, ICLSP 1996; 1: 700–704.
23. Bohadana R, Peslin H, Uffholtz H, Pauli G. Potential forlung sound monitoring during bronchial provication test-ing.
Thorax
1995; 955–961.24. Gavriely N, Herzberg M. Parametric representation of
normal breath sounds.
J Appl Physiol
1992; 73: 1776–1784.
25. Vanderschoot J, Schreur H. AR (q, v) modeling of normallung sounds.
Meth Inf Med
1994; 33: 24–27.26. Ademovic E, Charbonneau G. Time scale segmentation of
respiratory sounds.
Technol Health Care
1998; 6: 53–63.27. Jamieson G, Cheetham B, Morruzzi J, Earis J. Spectral
analysis of pulmonary sounds.
Int J Modell Simul
1994;14: 89–91.
28. Malmberg L, Kallio K, Haltsonen S, Katila T, SovijarviA. Classification of lung sounds in patients with asthma,emphysema, fibrosing alveolitis and healthy lungs by usingself-organizing maps.
Clin Physiol
1996; 16: 115–129.
29. Charbonneau G, Sudraud M, Soufflet P, Attal C, GaultierA. Hierarchial clustering analysis of lung sound spectra.EURSCOP 88 Signal Processing IV 1988; 1257–1297.
30. Rosqvist T, Paajanen E, Kallio K,
et al.
Toolkit for lungsound analysis.
Med Biol Eng Comput
1995, 33: 190–195.31. Schreur H, Diamant Z, Vanderschoot J,
et al.
Lungsounds during allergen-induced asthmatic responses inpatients with asthma.
Am J Respir Crit Care Med
1996;153: 1474–1480.
32. Baughman R, Loudon R. Quantitation of wheezing inacute asthma.
Chest
1984; 86: 718–722.33. Fenton T, Pasterkamp H, Tal A, Chernick, V. Automated
spectral characteristics of wheezing in asthmatic chil-dren.
IEEE Trans Biomed Eng
1985; 32: 50–55.34. Shabtai-Musih Y, Grotberg J, Gavriely N. Spectral con-
tent of forced expiratory wheezes during air, He, and SF6breathing in normal humans.
J Appl Physiol
1992; 72:629–635.
35. Murphy R, Holford S, Knowle W. Visual lung-soundcharacterisation by time-expanded wave-form analysis.
NEng J Med
1977; 296: 2968–2971.36. Piirila P, Sovijarvi A. Crackles: recording, analysis and
clinical significance.
Eur Respir J
1995, 8: 2139–2148.37. Dalmasso F, Guarene M, Spagnolo R, Benedetto G,
Righini G. A computer system for timing and acousticalanalysis of crackles: a study in cryptogenic fibrosingalveolitis.
Bull Eur Physiopathol Respir
1984, 20: 139–144.
38. al-Jerad N, Strickland B, Bothamle G,
et al.
Diagnosis ofasbestosis by a time-expanded wave form analysis, aus-cultation and high resolution computer tomography: acomparative study.
Thorax
1993; 48: 347–353.39. Murphy R, Del-Bono E, Davidson F. Validation of an
automatic crackle (rale) counter.
Am Rev Respir Dis
1989; 140: 1017–1020.40. Gavriely N, Jensen O. Theory and measurements of
snores.
J Appl Physiol
1993; 74: 2828–2837.41. Beck R, Odeh M, Oliven A, Gavriely N. The acoustic
properties of snores.
Eur Respir J
1995; 8: 2120–2128.42. Ono M, Arakawa K, Mori M, Sugimoto T, Harashima H.
Separation of fine crackles from vesicular sounds by anon-linear digital filter.
IEEE Trans Biomed Eng
1989;36: 386–395.
43. Sovijärvi A, Kallio K, Paajanen E,
et al.
A new versatilePC-based lung sound analyser (HeLSA). Repetability ofspectral parameters and sound amplitude in healthy sub-jects.
Technol Health Care
1998; 6: 11–22.44. Cheetham BMG, Sun X, Earis JE. Real-time analysis of
lung sounds
Technology and Health Care
1998, 6: 3–10.45. Iyer V, Ramamoorthy P, Ploysongsang Y. Autoregressive,
modeling of lung sounds: characterisation of source andtransmission.
EEEE Trans Biomed Eng
1989; 36: 11–15.46. Mussell HJ. The need for standards in recording and ana-
lysing respiratory sounds.
Med Biol Eng Comput
1992;30: 129–139.

Eur Respir Rev
2000; 10: 77, 591–596Printed in UK - all rights reserved
Copyright ©ERS Journals Ltd 2000European Respiratory Review
ISSN 0905 - 9180
Characteristics of breath sounds and adventitious respiratory sounds
A.R.A. Sovijärvi
*
, L.P. Malmberg
*
, G. Charbonneau
**
, J. Vanderschoot
+
, F. Dalmasso
++
, C. Sacco
#
, M. Rossi
¶
, J.E. Earis
§
Sounds generated in healthy lungs and airways by nor-mal breathing, differ according to the location where theyare recorded and vary with the ventilatory cycle [1, 2]. Theorigin of sounds generated by ventilation is not completelyclear. Probably, multiple mechanisms are involved. Thelung itself cannot generate sound if there is no airflow;pressure differences between structures within the thoraxor different lung volume levels cannot by themselvesinduce sounds in the absence of airflow. Breath sounds areprobably induced by turbulence of the air at the level oflobar or segmental bronchi. In smaller bronchi, the gasvelocity decreases and becomes less than the criticalvelocity needed to induce turbulence. Therefore, the air-flow in smaller airways is believed to be laminar and silent.
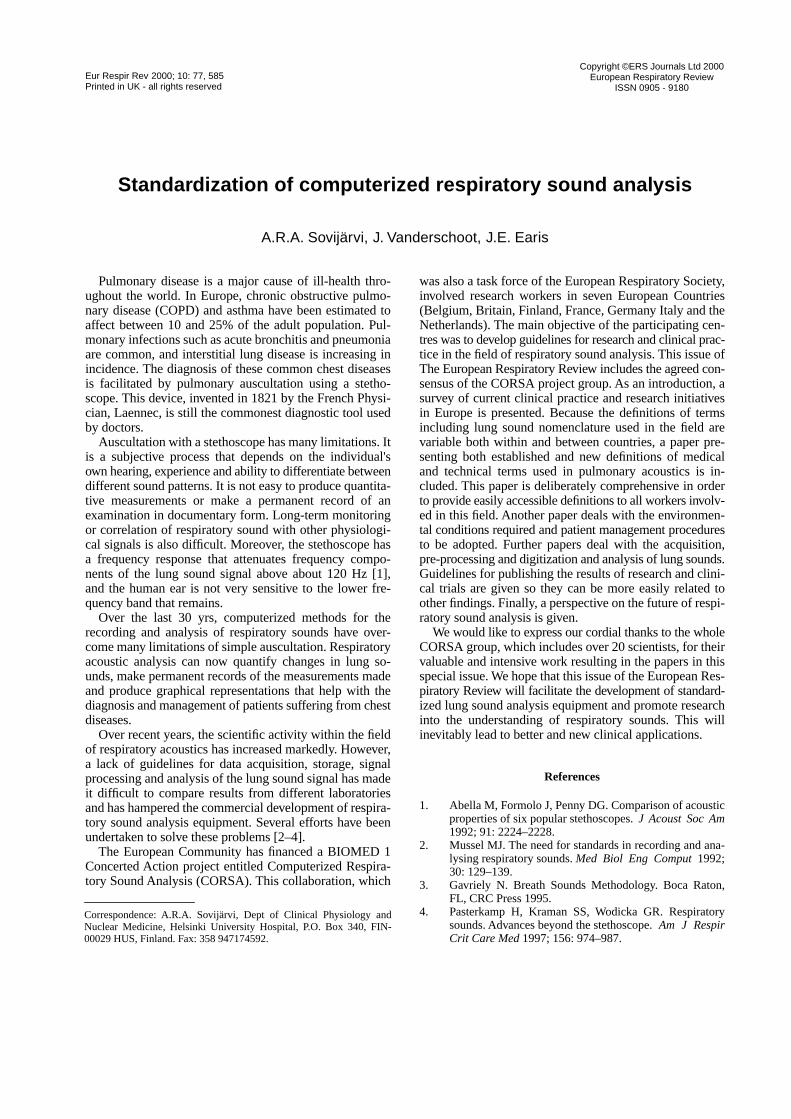
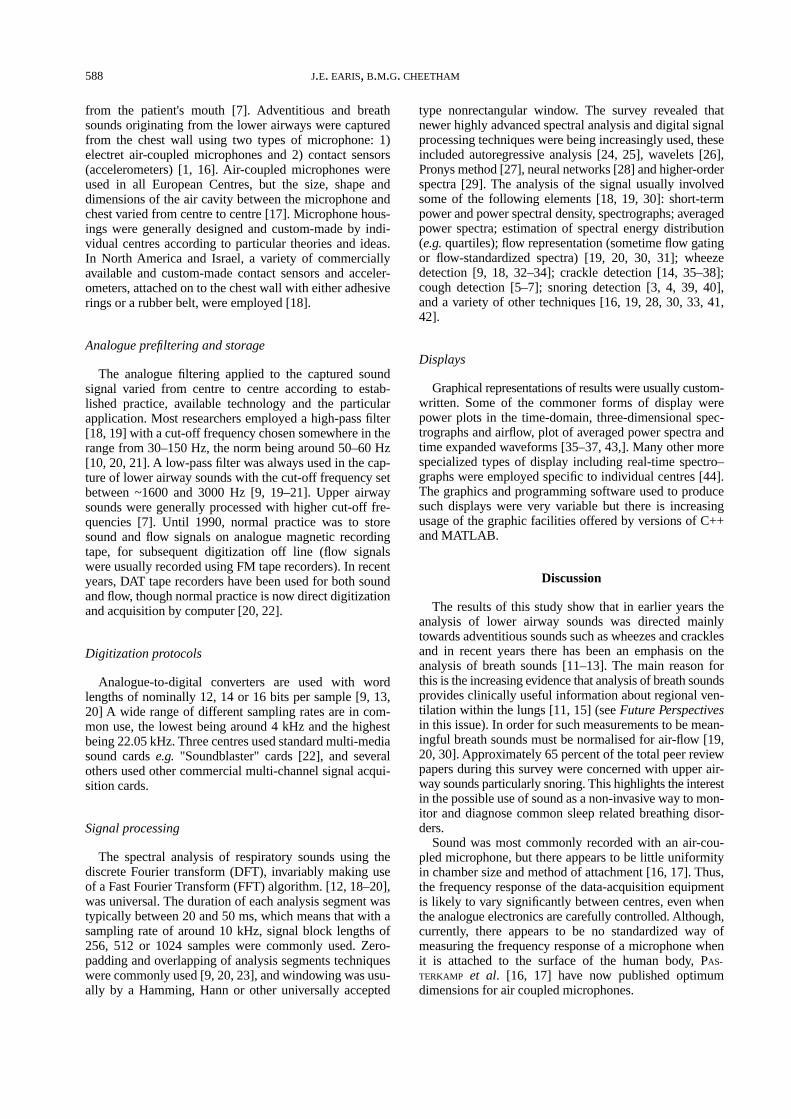
The resulting noise, coming from the larger airways,has a wide frequency spectrum. It is transmitted to theskin, after filtering by the lungs and the chest wall, whichact acoustically as a low-pass filter. Therefore, the nomi-nal breath sounds recorded over the lungs have their mainfrequency band up to 200–250 Hz. Unfortunately, this fre-quency band also contains components from respiratorymuscles and the heart. Above 250 Hz, there is a rapiddecline in energy (fig. 1). When recorded over the trachea,the sound is not (or less) filtered. Therefore, and also dueto resonance phenomena, the frequency spectrum containshigher frequency components as high as 1200 Hz (fig. 2).
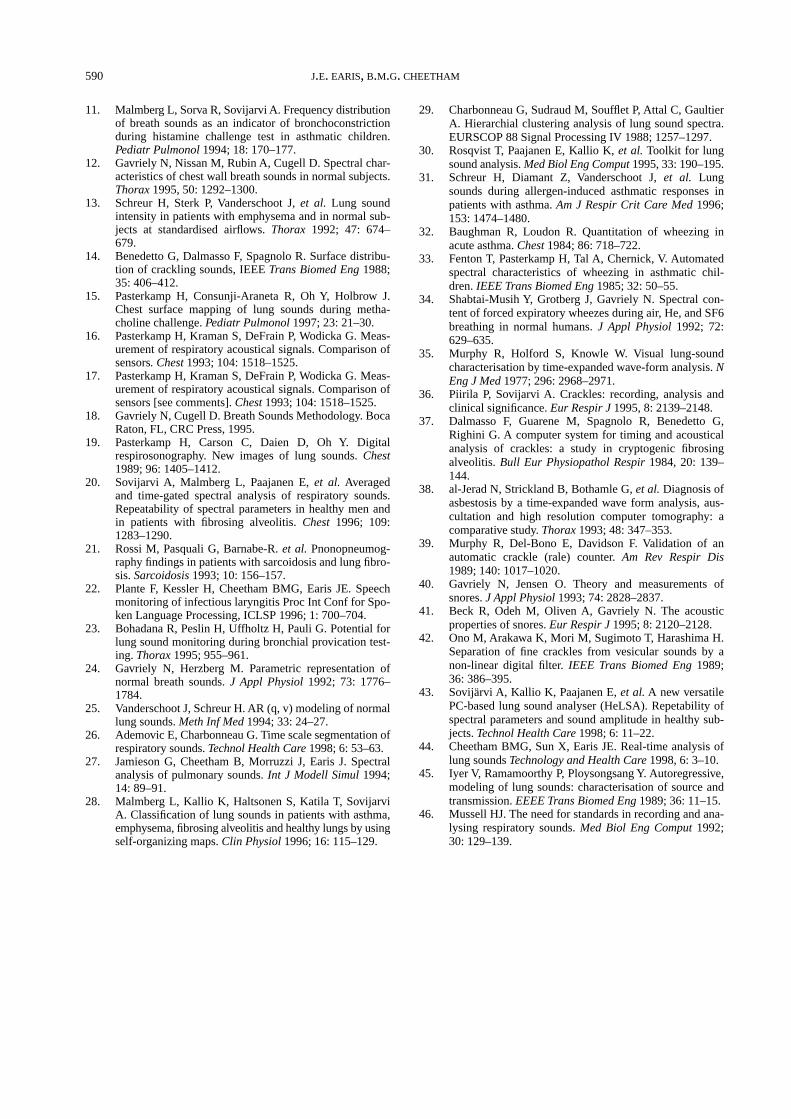
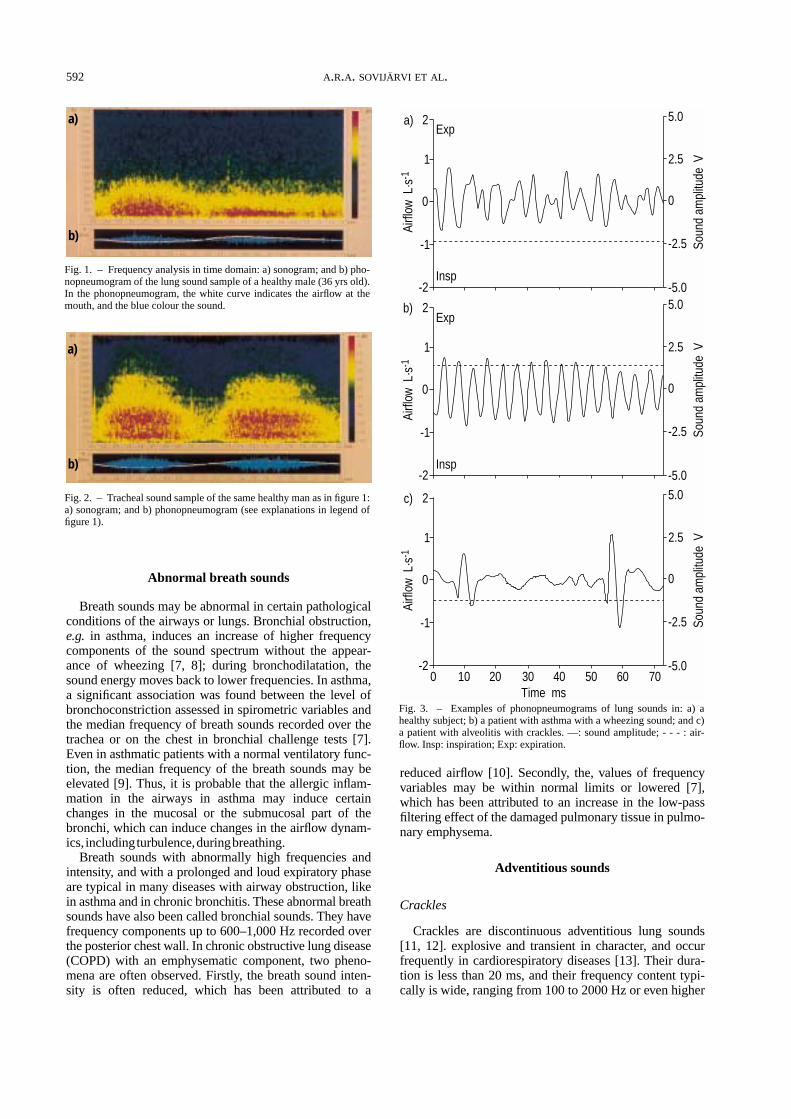
The frequency spectrum is also influenced by rather hightracheal resonance frequencies [3]. The main energy oftracheal sounds extends up to 850–1000 Hz, with a sharpdecrease in power above that frequency (fig. 2). All typesof breath sounds are dependent on turbulence induced byairflow-rate. The resultant waveform of normal breathsound is disorganized (
i.e
. contains many different frequen-cies) as shown in figure 3.
Breath sounds heard close to the chest wall weredescribed by L
AËNNEC
[4] as "a distinct murmur corre-sponding to the flow of air into and out of air cells". Nor-mal breath sound was previously called "vesicular sound"[5]. That term is no longer recommended because, at thealveolar ("vesicular") level, airflow is assumed to be zerowith no possibility of generating breath sounds. Normalbreath sounds have acoustically a soft character. Theinspiratory phase is longer than the expiratory phase, witha ratio inspiration/expiration of about 2/1 during tidalbreathing. Expiration is nearly silent.
Breath sounds are not uniform over the lungs. There areregional variations in sound intensity. At the apex, thesound is less intense during an inspiration performed fromresidual volume. Conversely, at the base, the sound is lessintense at the beginning of the inspiration, then the inten-sity gradually increases and reaches its maximum at about50% of the vital capacity [6].
Characteristics of breath sounds and adventitious respiratory sounds. A.R.A. Sovijärvi,L.P. Malmberg, G. Charbonneau, J. Vanderschoot, F. Dalmasso, C. Sacco, M. Rossi, J.E.Earis. ©ERS Journals Ltd 2000.
ABSTRACT: Respiratory sounds contain significant information on physiology andpathology of the lungs and the airways. The frequency spectrum and the amplitude ofsounds,
i.e
. tracheal or lung sounds without adventitious sound components (cracklesor wheezes), may reflect airway dimension and their pathologic changes (
e.g
. airwayobstruction) or pathologic changes in the pulmonary tissue. Characteristics of crack-les, their timing in a respiratory cycle and their waveform, are significantly differentin pulmonary disorders. Also, the wheezes may have acoustic features indicating notonly the presence of abnormality in the respiratory system but also the severity andlocations of airway obstruction most frequently found in asthma and large-airwaysstenosis.
Eur Respir Rev 2000; 10: 77, 591–596.
*Dept of Clinical Physiology, HelsinkiUniversity Hospital, Helsinki, Finland.**Institut d'Electronique Fondamentale,Université Paris-Sud, Orsay Cedex,France.
+
Dept of Medical Informatics,University of Leiden, Leiden, The Nether-lands.
++
Divisione di Pneumologia,Ospedale Mauriziano Umberto I, Torino,Italy.
#
Clinica del Lavoro Foundation,Veruno, Italy.
¶
U.O. Pneumologia, Arezzo,Italy.
§
Aintree Chest Centre, The Fazaker-ley Hospital, Liverpool, UK.
Correspondence: A. Sovijärvi, Dept ofClinical Physiology and Nuclear MedicineHelsinki University Hospital, P.O. Box340, FIN-00029 HUS, Finland.
Keywords: Adventitious sounds, breathsounds, respiratory sounds
This study was supported by the EUBIOMED I programme (contract BMH1-CT94-0928) and by the European Respira-tory Society (ERS task force). This paperforms part of the publications of theCORSA project.
592
A
.
R
.
A
.
SOVIJÄRVI
ET
AL
.
Abnormal breath sounds
Breath sounds may be abnormal in certain pathologicalconditions of the airways or lungs. Bronchial obstruction,
e.g.
in asthma, induces an increase of higher frequencycomponents of the sound spectrum without the appear-ance of wheezing [7, 8]; during bronchodilatation, thesound energy moves back to lower frequencies. In asthma,a significant association was found between the level ofbronchoconstriction assessed in spirometric variables andthe median frequency of breath sounds recorded over thetrachea or on the chest in bronchial challenge tests [7].Even in asthmatic patients with a normal ventilatory func-tion, the median frequency of the breath sounds may beelevated [9]. Thus, it is probable that the allergic inflam-mation in the airways in asthma may induce certainchanges in the mucosal or the submucosal part of thebronchi, which can induce changes in the airflow dynam-ics, including turbulence, during breathing.
Breath sounds with abnormally high frequencies andintensity, and with a prolonged and loud expiratory phaseare typical in many diseases with airway obstruction, likein asthma and in chronic bronchitis. These abnormal breathsounds have also been called bronchial sounds. They havefrequency components up to 600–1,000 Hz recorded overthe posterior chest wall. In chronic obstructive lung disease(COPD) with an emphysematic component, two pheno-mena are often observed. Firstly, the breath sound inten-sity is often reduced, which has been attributed to a
reduced airflow [10]. Secondly, the, values of frequencyvariables may be within normal limits or lowered [7],which has been attributed to an increase in the low-passfiltering effect of the damaged pulmonary tissue in pulmo-nary emphysema.
Adventitious sounds
Crackles
Crackles are discontinuous adventitious lung sounds[11, 12]. explosive and transient in character, and occurfrequently in cardiorespiratory diseases [13]. Their dura-tion is less than 20 ms, and their frequency content typi-cally is wide, ranging from 100 to 2000 Hz or even higher
Fig. 1. – Frequency analysis in time domain: a) sonogram; and b) pho-nopneumogram of the lung sound sample of a healthy male (36 yrs old).In the phonopneumogram, the white curve indicates the airflow at themouth, and the blue colour the sound.
a)
b)
Fig. 2. – Tracheal sound sample of the same healthy man as in figure 1:a) sonogram; and b) phonopneumogram (see explanations in legend offigure 1).
a)
b)
Soun
d am
plitu
de V
-2
-1
0
1
2
Airfl
ow L
·s-1
5.0
2.5
0
-2.5
-5.0
a)Exp
Insp
-2
-1
0
1
2
Airfl
ow L
·s-1
5.0
2.5
0
-2.5
-5.0
Soun
d am
plitu
de V
c)
0 10 20 30 40 50 60 70Time ms
-2
-1
0
1
2
Airfl
ow L
·s-1
5.0
2.5
0
-2.5
-5.0
Soun
d am
plitu
de V
Exp
Insp
b)
Fig. 3. – Examples of phonopneumograms of lung sounds in: a) ahealthy subject; b) a patient with asthma with a wheezing sound; and c)a patient with alveolitis with crackles. —: sound amplitude; - - - : air-flow. Insp: inspiration; Exp: expiration.
CHARACTERISTICS
OF
RESPIRATORY
SOUNDS
593
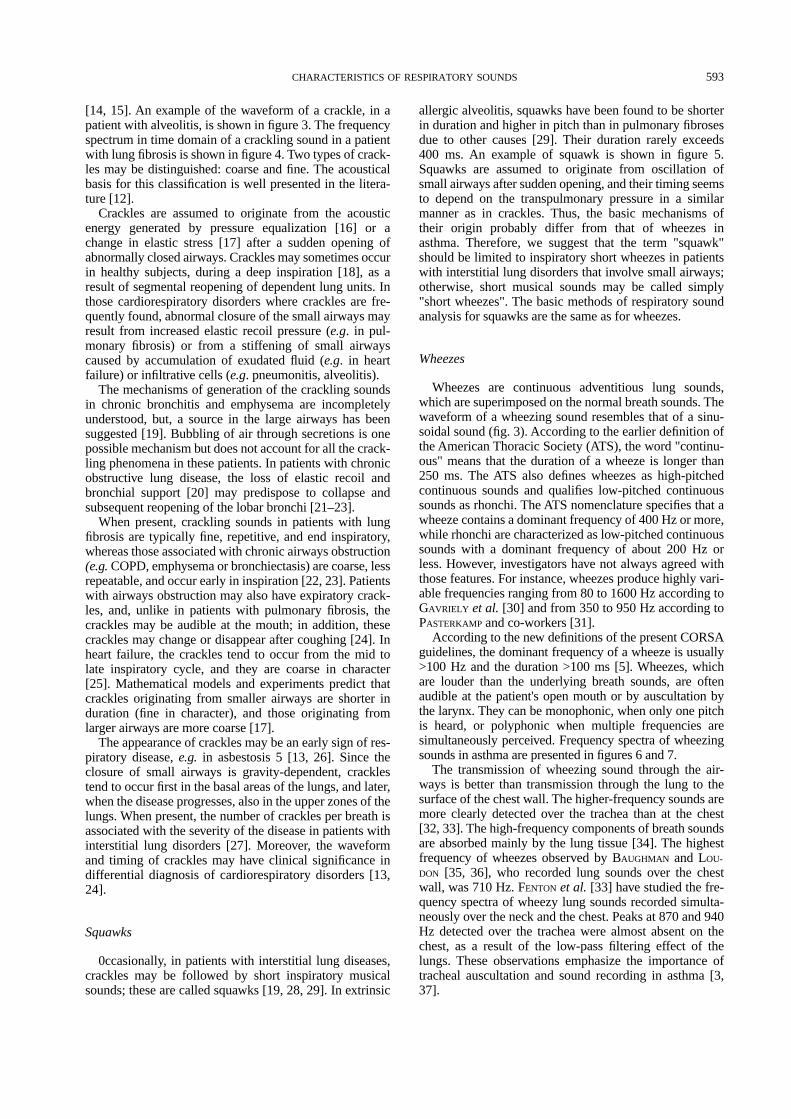
[14, 15]. An example of the waveform of a crackle, in apatient with alveolitis, is shown in figure 3. The frequencyspectrum in time domain of a crackling sound in a patientwith lung fibrosis is shown in figure 4. Two types of crack-les may be distinguished: coarse and fine. The acousticalbasis for this classification is well presented in the litera-ture [12].
Crackles are assumed to originate from the acousticenergy generated by pressure equalization [16] or achange in elastic stress [17] after a sudden opening ofabnormally closed airways. Crackles may sometimes occurin healthy subjects, during a deep inspiration [18], as aresult of segmental reopening of dependent lung units. Inthose cardiorespiratory disorders where crackles are fre-quently found, abnormal closure of the small airways mayresult from increased elastic recoil pressure (
e.g
. in pul-monary fibrosis) or from a stiffening of small airwayscaused by accumulation of exudated fluid (
e.g
. in heartfailure) or infiltrative cells (
e.g
. pneumonitis, alveolitis).The mechanisms of generation of the crackling sounds
in chronic bronchitis and emphysema are incompletelyunderstood, but, a source in the large airways has beensuggested [19]. Bubbling of air through secretions is onepossible mechanism but does not account for all the crack-ling phenomena in these patients. In patients with chronicobstructive lung disease, the loss of elastic recoil andbronchial support [20] may predispose to collapse andsubsequent reopening of the lobar bronchi [21–23].
When present, crackling sounds in patients with lungfibrosis are typically fine, repetitive, and end inspiratory,whereas those associated with chronic airways obstruction
(e.g.
COPD, emphysema or bronchiectasis) are coarse, lessrepeatable, and occur early in inspiration [22, 23]. Patientswith airways obstruction may also have expiratory crack-les, and, unlike in patients with pulmonary fibrosis, thecrackles may be audible at the mouth; in addition, thesecrackles may change or disappear after coughing [24]. Inheart failure, the crackles tend to occur from the mid tolate inspiratory cycle, and they are coarse in character[25]. Mathematical models and experiments predict thatcrackles originating from smaller airways are shorter induration (fine in character), and those originating fromlarger airways are more coarse [17].
The appearance of crackles may be an early sign of res-piratory disease,
e.g.
in asbestosis 5 [13, 26]. Since theclosure of small airways is gravity-dependent, cracklestend to occur first in the basal areas of the lungs, and later,when the disease progresses, also in the upper zones of thelungs. When present, the number of crackles per breath isassociated with the severity of the disease in patients withinterstitial lung disorders [27]. Moreover, the waveformand timing of crackles may have clinical significance indifferential diagnosis of cardiorespiratory disorders [13,24].
Squawks
0ccasionally, in patients with interstitial lung diseases,crackles may be followed by short inspiratory musicalsounds; these are called squawks [19, 28, 29]. In extrinsic
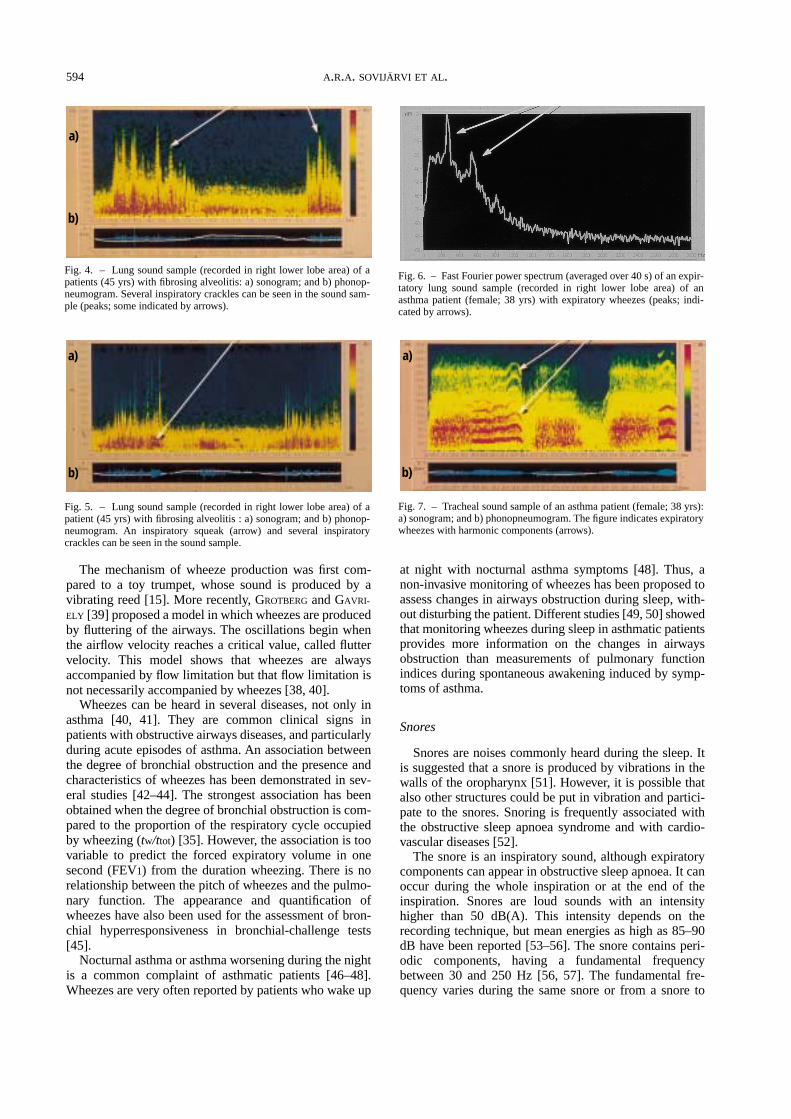
allergic alveolitis, squawks have been found to be shorterin duration and higher in pitch than in pulmonary fibrosesdue to other causes [29]. Their duration rarely exceeds400 ms. An example of squawk is shown in figure 5.Squawks are assumed to originate from oscillation ofsmall airways after sudden opening, and their timing seemsto depend on the transpulmonary pressure in a similarmanner as in crackles. Thus, the basic mechanisms oftheir origin probably differ from that of wheezes inasthma. Therefore, we suggest that the term "squawk"should be limited to inspiratory short wheezes in patientswith interstitial lung disorders that involve small airways;otherwise, short musical sounds may be called simply"short wheezes". The basic methods of respiratory soundanalysis for squawks are the same as for wheezes.
Wheezes
Wheezes are continuous adventitious lung sounds,which are superimposed on the normal breath sounds. Thewaveform of a wheezing sound resembles that of a sinu-soidal sound (fig. 3). According to the earlier definition ofthe American Thoracic Society (ATS), the word "continu-ous" means that the duration of a wheeze is longer than250 ms. The ATS also defines wheezes as high-pitchedcontinuous sounds and qualifies low-pitched continuoussounds as rhonchi. The ATS nomenclature specifies that awheeze contains a dominant frequency of 400 Hz or more,while rhonchi are characterized as low-pitched continuoussounds with a dominant frequency of about 200 Hz orless. However, investigators have not always agreed withthose features. For instance, wheezes produce highly vari-able frequencies ranging from 80 to 1600 Hz according toG
AVRIELY
et al.
[30] and from 350 to 950 Hz according toP
ASTERKAMP
and co-workers [31]. According to the new definitions of the present CORSA
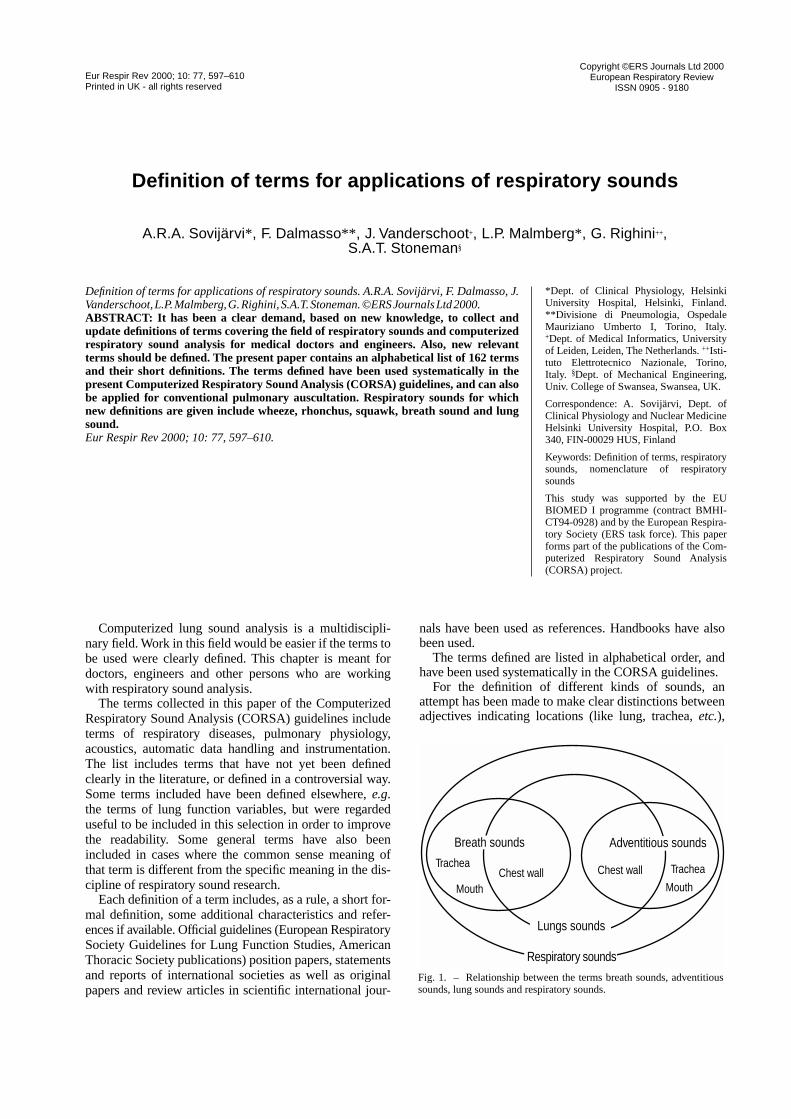
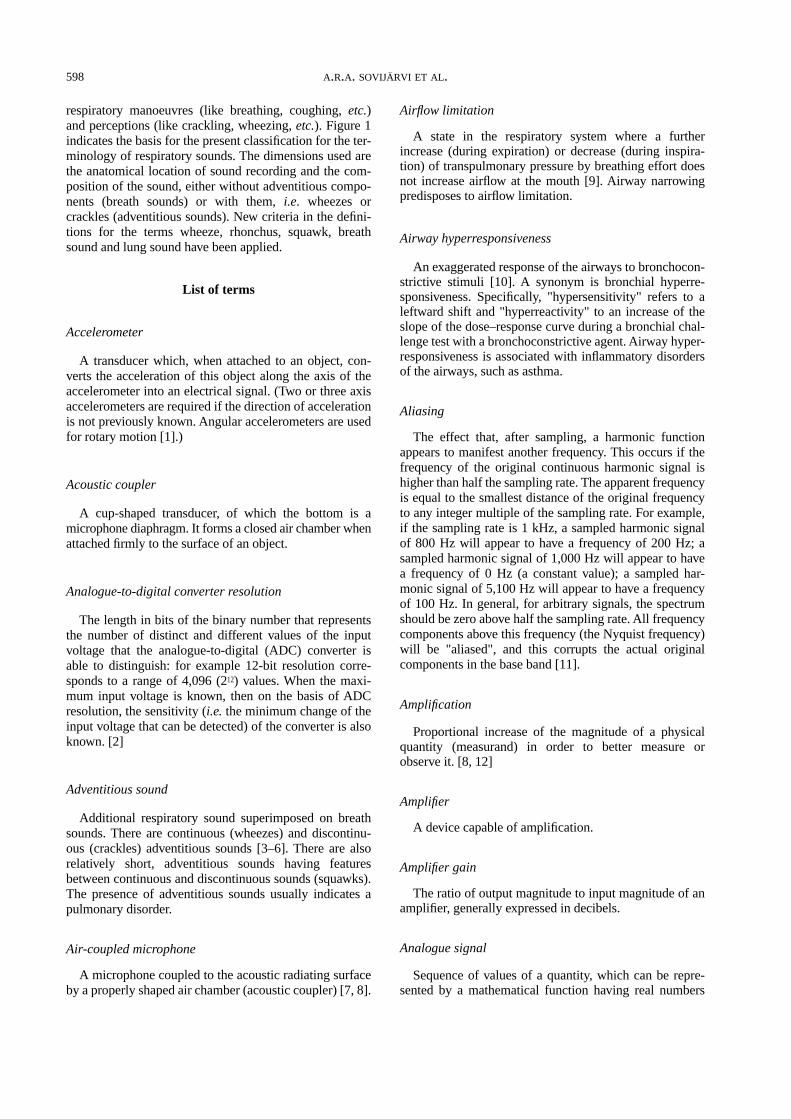
guidelines, the dominant frequency of a wheeze is usually>100 Hz and the duration >100 ms [5]. Wheezes, whichare louder than the underlying breath sounds, are oftenaudible at the patient's open mouth or by auscultation bythe larynx. They can be monophonic, when only one pitchis heard, or polyphonic when multiple frequencies aresimultaneously perceived. Frequency spectra of wheezingsounds in asthma are presented in figures 6 and 7.
The transmission of wheezing sound through the air-ways is better than transmission through the lung to thesurface of the chest wall. The higher-frequency sounds aremore clearly detected over the trachea than at the chest[32, 33]. The high-frequency components of breath soundsare absorbed mainly by the lung tissue [34]. The highestfrequency of wheezes observed by B
AUGHMAN
and L
OU-
DON
[35, 36], who recorded lung sounds over the chestwall, was 710 Hz. F
ENTON
et al.
[33] have studied the fre-quency spectra of wheezy lung sounds recorded simulta-neously over the neck and the chest. Peaks at 870 and 940Hz detected over the trachea were almost absent on thechest, as a result of the low-pass filtering effect of thelungs. These observations emphasize the importance oftracheal auscultation and sound recording in asthma [3,37].
594
A
.
R
.
A
.
SOVIJÄRVI
ET
AL
.
The mechanism of wheeze production was first com-pared to a toy trumpet, whose sound is produced by avibrating reed [15]. More recently, G
ROTBERG
and G
AVRI-
ELY
[39] proposed a model in which wheezes are producedby fluttering of the airways. The oscillations begin whenthe airflow velocity reaches a critical value, called fluttervelocity. This model shows that wheezes are alwaysaccompanied by flow limitation but that flow limitation isnot necessarily accompanied by wheezes [38, 40].
Wheezes can be heard in several diseases, not only inasthma [40, 41]. They are common clinical signs inpatients with obstructive airways diseases, and particularlyduring acute episodes of asthma. An association betweenthe degree of bronchial obstruction and the presence andcharacteristics of wheezes has been demonstrated in sev-eral studies [42–44]. The strongest association has beenobtained when the degree of bronchial obstruction is com-pared to the proportion of the respiratory cycle occupiedby wheezing (
t
w
/t
tot
) [35]. However, the association is toovariable to predict the forced expiratory volume in onesecond (FEV
1
) from the duration wheezing. There is norelationship between the pitch of wheezes and the pulmo-nary function. The appearance and quantification ofwheezes have also been used for the assessment of bron-chial hyperresponsiveness in bronchial-challenge tests[45].
Nocturnal asthma or asthma worsening during the nightis a common complaint of asthmatic patients [46–48].Wheezes are very often reported by patients who wake up
at night with nocturnal asthma symptoms [48]. Thus, anon-invasive monitoring of wheezes has been proposed toassess changes in airways obstruction during sleep, with-out disturbing the patient. Different studies [49, 50] showedthat monitoring wheezes during sleep in asthmatic patientsprovides more information on the changes in airwaysobstruction than measurements of pulmonary functionindices during spontaneous awakening induced by symp-toms of asthma.
Snores
Snores are noises commonly heard during the sleep. Itis suggested that a snore is produced by vibrations in thewalls of the oropharynx [51]. However, it is possible thatalso other structures could be put in vibration and partici-pate to the snores. Snoring is frequently associated withthe obstructive sleep apnoea syndrome and with cardio-vascular diseases [52].
The snore is an inspiratory sound, although expiratorycomponents can appear in obstructive sleep apnoea. It canoccur during the whole inspiration or at the end of theinspiration. Snores are loud sounds with an intensityhigher than 50 dB(A). This intensity depends on therecording technique, but mean energies as high as 85–90dB have been reported [53–56]. The snore contains peri-odic components, having a fundamental frequencybetween 30 and 250 Hz [56, 57]. The fundamental fre-quency varies during the same snore or from a snore to
Fig. 4. – Lung sound sample (recorded in right lower lobe area) of apatients (45 yrs) with fibrosing alveolitis: a) sonogram; and b) phonop-neumogram. Several inspiratory crackles can be seen in the sound sam-ple (peaks; some indicated by arrows).
a)
b)
Fig. 5. – Lung sound sample (recorded in right lower lobe area) of apatient (45 yrs) with fibrosing alveolitis : a) sonogram; and b) phonop-neumogram. An inspiratory squeak (arrow) and several inspiratorycrackles can be seen in the sound sample.
a)
b)
Fig. 6. – Fast Fourier power spectrum (averaged over 40 s) of an expir-tatory lung sound sample (recorded in right lower lobe area) of anasthma patient (female; 38 yrs) with expiratory wheezes (peaks; indi-cated by arrows).
Fig. 7. – Tracheal sound sample of an asthma patient (female; 38 yrs):a) sonogram; and b) phonopneumogram. The figure indicates expiratorywheezes with harmonic components (arrows).
a)
b)

CHARACTERISTICS
OF
RESPIRATORY
SOUNDS
595
another [58]. The snore is associated with an inspiratoryflow limitation, as well as an increase in airways resist-ance. An example of a snoring sound is shown in figure 8.
Stridors
Stridors are very loud wheezes, which are the conse-quence of a morphologic or dynamic obstruction in larynxor trachea. This sound can be heard near the patient with-out a stethoscope. The ear of a trained examiner may rec-ognize the source of the noises: supraglottic, glottic,subglottic or tracheal [59]. Different terms are used tocompare them to known noises: "cluck of turkey", "whis-tle of snake", "foghorn". The stridor usually occurs duringinspiration when it is extrathoracic and during expirationwhen it is intrathoracic unless the obstruction is fixed, inwhich case, stridor may appear in both phases of respira-tion. The principal aetiology of the supraglottic stridor issuctioning of ary-epiglottic folds onto the lumen of theairways during inspiration. These phenomenoma occurbecause of an excess of supraglottic tissue (anatomichypothesis). In the glottic area, the main aetiology of stri-dor is vocal cord paralysis. Stridor is common in infantsand in babies, since the dimensions of the supraglotticarea are small. However, the obstruction in babies is mostoften due to a subglottic viral inflammation (laryngitis).
Stridor is usually characterized by a prominent peak atabout 1,000 Hz in its frequency spectrum. This compo-nent is called the pitch. The envelope of the pitch and thecomplexity of the spectrum (
i.e.
number of peaks or har-monics) is dependent on the disease, the site of obstruc-tion, the airflow and the volume. Moreover, the elasticityof the obstruction and the surrounding tissues influencethe sound generation. A fixed obstruction will generate aconstant pitch, and a dynamic obstruction will modulatethe pitch in frequency as in the case of a laryngomalacia.
Conclusion
There is a large variety of normal and abnormal respira-tory sounds with characteristics, which may be typical for
a disease or for a certain pathological change in the respi-ratory system. The ability to analyse the acoustic patternsof these breathing-induced phenomena will improve theknowledge of the physiology and pathophysiology of res-piratory disorders that can be used in clinical assessment.
References
1. Dalmay F, Antonini MT, Marquet P, Menier R. Acousticproperties of the normal chest.
Eur Respir J
1995; 8:1761–1769.
2. Vanderschoot J, Schreur HJ. AR (q, v) modeling of nor-mal lung sounds.
Meth Inf Med
1994; 33: 24–27.3. Pasterkamp H, Fenton R, Tal A, Chernick V. Tracheal
vs
lung sounds in acute asthma.
Am Rev Respir Dis
1984;129: 256A.
4. Laënnec RTH. A treatise on diseases of the chest, inwhich they are described according to their anatomicalcharacters, and their diagnosis established on a new prin-ciple by means of acoustics instruments. Transl. from theFrench by John Forbes, London, Underwood, 1821.
5. Sovijärvi ARA, Dalmasso F, Vanderschoot J, MalmbergLP, Righini G, Stoneman SAT. Definition of terms forapplications of respiratory sounds.
Eur Respir Rev
2000:10, 597–610.
6. Ploy-Song-Sang Y, Macklem PT, Ross WR. Distributionof regional ventilation measured by breath sounds.
AmRev Respir Dis
1978; 117: 657–664.7. Malmberg LP, Sovijärvi ARA, Paajanen E, Piirilä P,
Haahtela T, Katila T. Changes in frequency spectra ofbreath sounds during histamine challenge test in adultasthmatics and healthy control subjects.
Chest
1994; 105:122–131.
8. Malmberg LP, Sorva R, Sovijärvi ARA. Frequency distri-bution of breath sounds as an indicator of bronchocon-striction during histamine challenge test in asthmaticchildren.
Pediatr Pulmonol
1994; 18: 170–177.9. Schreur HJ, Vanderschoot J, Zwinderman AH, Dijkman
JH, Sterk PJ. Abnormal lung sounds in patients withasthma during episodes with normal lung function.
Chest
1994; 106: 91–99.10. Schreur HJ, Sterk PJ, Vanderschoot J, van Klink HC, van
Vollenhoven E, Dijkman JH. Lung sound intensity inpatients with emphysema and in normal subjects at stand-ardised airflows.
Thorax
1992; 47: 674–679.11. Robertson AJ, Cooper D. Rales, rhonchi and Laënnec.
Lancet
1957; 1: 417–423.12. American Thoracic Society. Updated nomenclature for
membership relation.
ATS News
1977; 3: 5–6.13. Piirilä P, Sovijärvi ARA. Crackles: recording, analysis
and clinical significance.
Eur Respir J
1995; 8: 2139–2148.
14. Murphy RL Jr, Sorensen K. Chest auscultation in thediagnosis of pulmonary asbestosis.
J Occup Med
1973;15: 272–276.
15. Gavriely N, Cugell D. Breath Sounds Methodology. BocaRaton, FL, CRC Press, 1995.
16. Forgacs P. Crackles and wheezes.
Lancet
1967; 2: 203–205.17. Fredberg JJ, Holford SK. Discrete lung sounds: crackles
(rales) as stress-relaxation quadrupoles.
J Acoust Soc Am
1983; 73: 1036–1046.18. Workum P, Holford SK, Delbono EA, Murphy RL. The
prevalence and character of crackles (rales) in youngwomen without significant lung disease.
Am Rev RespirDis
1982; 126: 921–923.
a)
b)
Fig. 8. – Example of waveforms of snoring sounds. a) A time domaincomplex of snoring waveforms consisting of repeating elements each ofwhich is made up of four or five deflections. Each repeating element isthought to represent an individual closure of the upper airway. b) A sim-ple snoring periodic waveform in the time domain. This pattern isthought to occur with airway vibrations without complete airway clo-sure.

596
A
.
R
.
A
.
SOVIJÄRVI
ET
AL
.
19. Forgacs P. Lung Sounds. London, Bailliere Tindall,1978.
20. Malklem PT, Fraser RG, Brown WG. Bronchial pressuremeasurements in emphysema and bronchitis.
J ClinInvest
1965; 44: 897–905.21. Murphy RL. Discontinuous adventitious lung sounds.
Semin Respir Med
1985; 6: 210–218.22. Nath AR, Capel LH. Inspiratory crackles: early and late.
Thorax
1974; 29: 223–227.23. Nath AR, Capel LH. Inspiratory crackles and mechanical
events of breathing.
Thorax
1974; 29: 695–698.24. Forgacs P. Lung sounds.
Br J Dis Chest
1969; 63: 1–12.25. Piirilä P, Sovijärvi ARA, Kaisla T, Rajala HM, Katila T.
Crackles in patients with fibrosing alveolitis, bronchiecta-sis, COPD, and heart failure.
Chest
1991; 99: 1076–1083.
26. al Jarad N, Strickland B, Bothamley G, Lock S,Logan-Sinclair R, Rudd RM. Diagnosis of asbestosis by atime expanded wave form analysis, auscultation and highresolution computed tomography: a comparative study.
Thorax
1993; 48: 347–353.27. Epler GR, Carrington CB, Gaensler EA. Crackles (rales)
in the interstitial pulmonary diseases.
Chest
1978; 73:333–339.
28. Geddes DM, Corrin B, Brewerton DA, Davies RJ,Turner-Warwick M. Progressive airway obliteration inadults and its association with rheumatoid disease.
Q JMed
1977; 46: 427–444.29. Earis JE, Marsh K, Pearson MG, Ogilvie CM. The inspir-
atory "squawk" in extrinsic allergic alveolitis and otherpulmonary fibroses.
Thorax
1982; 37: 923–926.30. Gavriely N, Palti Y, Alroy G, Grotberg JB. Measurement
and theory of wheezing breath sounds.
J Appl Physiol
1984; 57: 481–492.31. Pasterkamp H, Tal A, Leahy F, Fenton R, Chernick V. The
effect of anticholinergic treatment on postexertionalwheezing in asthma studied by phonopneumography andspirometry.
Am Rev Respir Dis
1985; 132: 16–21.32. Takezawa Y, Shirai F, Sawaki S,
et al.
Comparison ofwheezes over the trachea and on the chest wall.
In
: Proc.5th Int Conf Lung Sounds; London; 1980.
33. Fenton TR, Pasterkamp H, Tal A, Chernick V. Automatedspectral characterization of wheezing in asthmatic chil-dren.
IEEE Trans Biomed Eng
1985; 32: 50–55.34. Wodicka GR, Stevens KN, Golub HL, Cravalho EG,
Shannon DC. A model of acoustic transmission in therespiratory system.
IEEE Trans Biomed Eng
1989; 36:925–934.
35. Baughman RP, Loudon RG. Quantitation of wheezing inacute asthma.
Chest
1984; 86: 718–722.36. Baughman RP, Loudon RG. Lung sound analysis for con-
tinuous evaluation of airflow obstruction in asthma.
Chest
1985; 88: 364–368.37. Husodo HOS. Tracheal auscultation in the differentiation
of whistling sounds heard at the chest.
In
: Proc. 7th IntConf Lung Sounds, University of California; 1982.
38. Grotberg JB, Reiss ES. A subsonic flutter anomaly. JSound Vibr 1982; 80: 444–446.
39. Grotberg JB, Gavriely N. Flutter in collapsible tubes: a
theoretical model of wheezes. J Appl Physiol 1989; 66:2262–2273.
40. Waring WW, Beckerman RC, Hopkins RL. Continuousadventitious lung sounds: sites and method of productionand significance. Semin Respir Med 1985; 6: 201–208.
41. Yernault J-C, Lenclud C. Wheezing and Asthma Progressin Asthma and COPD. Amsterdam, Elsevier Science,1989; 61–69.
42. Marini JJ, Pierson DJ, Hudson LD, Lakshminarayan S.The significance of wheezing-in chronic airflow obstruc-tion. Am Rev Respir Dis 1979; 120: 1069–1072.
43. McFadden ER Jr., Kiser R, DeGroot WJ. Acute bronchialasthma. Relations between clinical and physiologic mani-festations. N Engl J Med 1973; 288: 221–225.
44. Shim CS, Williams MH Jr. Relationship of wheezing tothe severity of obstruction in asthma. Arch Intern Med1983; 143: 890–892.
45. Sanchez I, Avital A, Wong I, Tal A, Pasterkamp H.Acoustic vs. spirometric assessment of bronchial respon-siveness to methacholine in children. Pediatr Pulmonol1993; 15: 28–35.
46. Clark TJ, Hetzel MR. Diurnal variation of asthma. Br JDis Chest 1977; 71: 87–92.
47. Connolly CK. Diurnal rhythms in airway obstruction. BrJ Dis Chest 1979; 73: 357–366.
48. Turner-Warwick M. Epidemiology of nocturnal asthma.Am J Med 1989; 85: 6–8.
49. Meslier N, Racineux J-L, Person C, Badatcheff A, Dair-ien T. Nocturnal wheezing and sleep in asthmaticpatients. Bull Eur Physiopathol 1987; 23: Suppl 12:423S.
50. Baughman RP, Loudon RG. The utility of a long-actingsympathomimetic agent, ZD procaterol, for nocturnalasthma. Chest 1988; 93: 285–288.
51. Robin IG. Snoring. Proc R Med 1948; 41: 151–153.52. Young T, Palta M, Dempsey J, Skatrud J, Weber S, Badr
S. The occurrence of sleep-disordered breathing amongmiddle-aged adults. N Engl J Med 1993; 328: 1230–1235.
53. Prazic M. Snoring and presbyacusis. Acta Otolaryngol1973; 75: 216–219.
54. Hoffstein V. Blood pressure, snoring, obesity, and noctur-nal hypoxaemia. Lancet 1994; 344: 643–645.
55. Series F, Marc I, Atton L. Comparison of snoring meas-ured at home and during polysomnographic studies.Chest 1993; 103: 1769–1773.
56. Gavriely N, Jensen O. Theory and measurements ofsnores. J Appl Physiol 1993; 74: 2828–2837.
57. Perez-Padilla JR, Slawinski E, Difrancesco LM, FeigeRR, Remmers JE, Whitelaw WA. Characteristics of thesnoring noise in patients with and without occlusive sleepapnoea. Am Rev Respir Dis 1993; 147: 635–644.
58. Meslier N, Auregan Y, Badatcheff A, Depollier C, Rac-ineux J-L. Spectral analysis of snores in patients withobstructive sleep apnoea syndrome. Am Rev Respir Dis1990; 141: 857A.
59. Cotton R, Reilly JS. Stridor and airway obstruction. In:Bluestone CD, Stool SE, eds. Pediatric Otolaryngology.Philadelphia PA; Saunders, 1983; 1190–1204.
Eur Respir Rev
2000; 10: 77, 597–610Printed in UK - all rights reserved
Copyright ©ERS Journals Ltd 2000European Respiratory Review
ISSN 0905 - 9180
Definition of terms for applications of respiratory sounds
A.R.A. Sovijärvi
*
, F. Dalmasso
**
, J. Vanderschoot
+
, L.P. Malmberg
*
, G. Righini
++
, S.A.T. Stoneman
§
Computerized lung sound analysis is a multidiscipli-nary field. Work in this field would be easier if the terms tobe used were clearly defined. This chapter is meant fordoctors, engineers and other persons who are workingwith respiratory sound analysis.
The terms collected in this paper of the ComputerizedRespiratory Sound Analysis (CORSA) guidelines includeterms of respiratory diseases, pulmonary physiology,acoustics, automatic data handling and instrumentation.The list includes terms that have not yet been definedclearly in the literature, or defined in a controversial way.Some terms included have been defined elsewhere,
e.g
.the terms of lung function variables, but were regardeduseful to be included in this selection in order to improvethe readability. Some general terms have also beenincluded in cases where the common sense meaning ofthat term is different from the specific meaning in the dis-cipline of respiratory sound research.
Each definition of a term includes, as a rule, a short for-mal definition, some additional characteristics and refer-ences if available. Official guidelines (European RespiratorySociety Guidelines for Lung Function Studies, AmericanThoracic Society publications) position papers, statementsand reports of international societies as well as originalpapers and review articles in scientific international jour-
nals have been used as references. Handbooks have alsobeen used.
The terms defined are listed in alphabetical order, andhave been used systematically in the CORSA guidelines.
For the definition of different kinds of sounds, anattempt has been made to make clear distinctions betweenadjectives indicating locations (like lung, trachea,
etc.
),
Definition of terms for applications of respiratory sounds. A.R.A. Sovijärvi, F. Dalmasso, J.Vanderschoot, L.P. Malmberg, G. Righini, S.A.T. Stoneman. ©ERS Journals Ltd 2000.
ABSTRACT: It has been a clear demand, based on new knowledge, to collect andupdate definitions of terms covering the field of respiratory sounds and computerizedrespiratory sound analysis for medical doctors and engineers. Also, new relevantterms should be defined. The present paper contains an alphabetical list of 162 termsand their short definitions. The terms defined have been used systematically in thepresent Computerized Respiratory Sound Analysis (CORSA) guidelines, and can alsobe applied for conventional pulmonary auscultation. Respiratory sounds for whichnew definitions are given include wheeze, rhonchus, squawk, breath sound and lungsound.
Eur Respir Rev 2000; 10: 77, 597–610.
*Dept. of Clinical Physiology, HelsinkiUniversity Hospital, Helsinki, Finland.**Divisione di Pneumologia, OspedaleMauriziano Umberto I, Torino, Italy.
+
Dept. of Medical Informatics, Universityof Leiden, Leiden, The Netherlands.
++
Isti-tuto Elettrotecnico Nazionale, Torino,Italy.
§
Dept. of Mechanical Engineering,Univ. College of Swansea, Swansea, UK.
Correspondence: A. Sovijärvi, Dept. ofClinical Physiology and Nuclear MedicineHelsinki University Hospital, P.O. Box340, FIN-00029 HUS, Finland
Keywords: Definition of terms, respiratorysounds, nomenclature of respiratorysounds
This study was supported by the EUBIOMED I programme (contract BMHI-CT94-0928) and by the European Respira-tory Society (ERS task force). This paperforms part of the publications of the Com-puterized Respiratory Sound Analysis(CORSA) project.
TracheaChest wall
Mouth
Chest wall Trachea
Mouth
Lungs sounds
Respiratory sounds
Adventitious soundsBreath sounds
Fig. 1. – Relationship between the terms breath sounds, adventitioussounds, lung sounds and respiratory sounds.
598
A
.
R
.
A
.
SOVIJÄRVI
ET
AL
.
respiratory manoeuvres (like breathing, coughing,
etc.
)and perceptions (like crackling, wheezing,
etc.
). Figure 1indicates the basis for the present classification for the ter-minology of respiratory sounds. The dimensions used arethe anatomical location of sound recording and the com-position of the sound, either without adventitious compo-nents (breath sounds) or with them,
i.e
. wheezes orcrackles (adventitious sounds). New criteria in the defini-tions for the terms wheeze, rhonchus, squawk, breathsound and lung sound have been applied.
List of terms
Accelerometer
A transducer which, when attached to an object, con-verts the acceleration of this object along the axis of theaccelerometer into an electrical signal. (Two or three axisaccelerometers are required if the direction of accelerationis not previously known. Angular accelerometers are usedfor rotary motion [1].)
Acoustic coupler
A cup-shaped transducer, of which the bottom is amicrophone diaphragm. It forms a closed air chamber whenattached firmly to the surface of an object.
Analogue-to-digital converter resolution
The length in bits of the binary number that representsthe number of distinct and different values of the inputvoltage that the analogue-to-digital (ADC) converter isable to distinguish: for example 12-bit resolution corre-sponds to a range of 4,096 (2
12
) values. When the maxi-mum input voltage is known, then on the basis of ADCresolution, the sensitivity (
i.e.
the minimum change of theinput voltage that can be detected) of the converter is alsoknown. [2]
Adventitious sound
Additional respiratory sound superimposed on breathsounds. There are continuous (wheezes) and discontinu-ous (crackles) adventitious sounds [3–6]. There are alsorelatively short, adventitious sounds having featuresbetween continuous and discontinuous sounds (squawks).The presence of adventitious sounds usually indicates apulmonary disorder.
Air-coupled microphone
A microphone coupled to the acoustic radiating surfaceby a properly shaped air chamber (acoustic coupler) [7, 8].
Airflow limitation
A state in the respiratory system where a furtherincrease (during expiration) or decrease (during inspira-tion) of transpulmonary pressure by breathing effort doesnot increase airflow at the mouth [9]. Airway narrowingpredisposes to airflow limitation.
Airway hyperresponsiveness
An exaggerated response of the airways to bronchocon-strictive stimuli [10]. A synonym is bronchial hyperre-sponsiveness. Specifically, "hypersensitivity" refers to aleftward shift and "hyperreactivity" to an increase of theslope of the dose–response curve during a bronchial chal-lenge test with a bronchoconstrictive agent. Airway hyper-responsiveness is associated with inflammatory disordersof the airways, such as asthma.
Aliasing
The effect that, after sampling, a harmonic functionappears to manifest another frequency. This occurs if thefrequency of the original continuous harmonic signal ishigher than half the sampling rate. The apparent frequencyis equal to the smallest distance of the original frequencyto any integer multiple of the sampling rate. For example,if the sampling rate is 1 kHz, a sampled harmonic signalof 800 Hz will appear to have a frequency of 200 Hz; asampled harmonic signal of 1,000 Hz will appear to havea frequency of 0 Hz (a constant value); a sampled har-monic signal of 5,100 Hz will appear to have a frequencyof 100 Hz. In general, for arbitrary signals, the spectrumshould be zero above half the sampling rate. All frequencycomponents above this frequency (the Nyquist frequency)will be "aliased", and this corrupts the actual originalcomponents in the base band [11].
Amplification
Proportional increase of the magnitude of a physicalquantity (measurand) in order to better measure orobserve it. [8, 12]
Amplifier
A device capable of amplification.
Amplifier gain
The ratio of output magnitude to input magnitude of anamplifier, generally expressed in decibels.
Analogue signal
Sequence of values of a quantity, which can be repre-sented by a mathematical function having real numbers
TERMS
OF
RESPIRATORY
SOUNDS
599
(time) as independent variable and real numbers (value ofthe quantity) as the dependent variable. This is the mostcommon form of output from a transducer. [8]. An ana-logue signal, even from a limited time interval, cannot bestored by digital equipment since it contains an infinitenumber of values.
Analogue-to-digital conversion
The process of sampling an analogue signal at a finitenumber of points in time, and converting the level at eachtime into an integer number. Usually, uniform sampling(
i.e.
equidistant in time) is applied [8].
Analogue-to-digital converter
Equipment which performs analogue to digital conver-sions. [8].
Anti-aliasing filter
A low-pass filter with a cut-off at or below the Nyquistfrequency of the digitizing process to remove those fre-quency components that would generate aliasing. [13, 14].
Apnoea
Cessation of breathing lasting for
≥
10 s [15].
Apnoea index
The number of apnoeas per hour during sleep [15].
Apnoea/hypopnoea index
Number of breathing events per hour during sleep char-acterized by an abnormally low level of ventilation [15].
Autocorrelation function
The mean of the product of a signal (
×
) at time (
t)
withthat at time
t
+
τ
:
1
T
ρ
(
τ
) =lim x(t)x(t +
τ
)d
t
(1) T
→∞
2T -T
Where
τ
is the time delay between two differentinstances of
× (
t
)
and T is the time period of the signal.The autocorrelation is a function of
τ
and is used to inves-tigate the degree of periodicity/randomness of a signal.Moreover, it provides a method for establishing the powerspectral density [16].
Autoregressive process
A stochastic signal (x), for which
p
x(i) = –
∑
a
k
x (i - k)+ u(i), (2)
k
= 1
where i is the consecutive number of the observatory p isthe order of the model, u is a white noise process and a
k
isthe autoregressive (AR) parameter of the process.
x can be considered to result from the application of anall-pole filter (defined by a
k
) to u.
Autoregressive moving average process
A stochastic signal (x), for which
p q
x(i)= -
∑
a
k
x(i - k) +
∑
b
k
u(i – k), (3)
k
=1
k
= 0
where p is the AR order of the model, q
is the movingaverage (MA) order of the model, u is a white noise proc-ess, a
k
is the AR parameter of the process and b
k
is the MAparameter of the process.
x can be considered to result from the application of afilter with a rational transfer function (defined by a
k
andb
k
) to u.
Axillary lines
The anterior axillary line descends from the angle con-stituted by the anterior border of the pectoralis major withthe chest wall. The posterior line descends from the angleconstituted by the latissimus dorsi with the chest wall andis parallel to the anterior axillary line. The middle axillaryline descends parallel to, and between, the other two.
Band-pass filter
A filter that allows components within a specific bandof frequencies to pass while substantially attenuating orstopping all lower and higher frequency components.
Band-stop filter
A filter that attenuates or stops components within aspecific band of frequencies while allowing all lower- andhigher-frequency components to pass.
Bandwidth
The spacing between frequencies at which a band passfilter attenuates the signal by 3 dB.
[ ]
,
∫

600
A
.
R
.
A
.
SOVIJÄRVI
ET
AL
.
Body mass index
The body mass index (BMI) is the ratio between theweight (kg) and the squared height (m
2
). An acceptablemeasure of body fatness [17]. An international classifica-tion of the obesity (World Health Organization) is based onthe following arbitrary ranges of BMI: below 20 (belownormal), 20–24 (normal), 25–29 (slight obesity), 30–40(moderate obesity) and above 40 (morbid obesity) [18].
Breath sound
The sound arising from breathing excluding adventi-tious sounds, heard or recorded over the chest wall, thetrachea or at the mouth. The generation of breath soundsis related to airflow in the respiratory tract. Acoustically,they are characterized by broad spectrum noise with a fre-quency range depending on the pick-up location.
Bronchial sound
This term has been used with two different meanings.1) Normal breath sounds detected at the upper anteriorchest wall. They have approximately similar intensitiesduring inspiratory and expiratory phases. 2) Abnormalbreath sound detected at the posterior chest wall, contain-ing higher-frequency components and a higher intensitythan that of normal breath sounds at the same location.The change from normal to abnormal breath sounds is dueto lung disorders. This abnormal breath sound also has anapproximately similar intensity during the inspiratory andexpiratory phases. Use of this term is not recommendedsince it can be confusing.
Central sleep apnoea
Apnoea caused by a decreased respiratory centre outputcharacterized by the absence of both ribcage and abdomi-nal movements. It is the least common form of sleepapnoea syndrome (SAS) [19].
Coarse crackle
Crackle that is low pitched and with a high amplitudeand long duration. Its total duration (two-cycle duration(2CD)) is >10 ms [20, 21]. (See also
Crackle
section)
Computerized stethoscope
A portable device to monitor, record and analyse bodysounds.
Condenser microphone
A microphone in which the metallic diaphragm is posi-tioned in parallel to a fixed electrode, in such a way that an
electric condenser is formed. The incident sound wavedisplaces the diaphragm and thereby causes electricalcapacitance variations. These capacitance variations maybe converted to voltage variations. For example, by apply-ing a direct current (DC) voltage to the electrodes througha high resistance. [7]
Contact microphone
A microphone that senses directly the vibration of theradiating surface. [1]
Correlation coefficient
If
n pairs of measurements (x
i, yi) of two random varia-bles, X and Y, are made the correlation coefficient r isgiven by:
∑(xi – x) (yi – y) r = . (4) √ [∑(xi – x)2] [∑(yi – y)2] π
This is a measure of any relationship between x and y.A value approaching 1.0 or -1.0 indicates a high probabil-ity that there is a linear (or nearly linear) relationshipbetween the variables, while values close to 0.0 indicateno significant relationship [16].
Cough
A respiratory reflex characterized by sudden expulsionof air at a high velocity accompanied by a transient soundof varying pitch and intensity. Cough is caused by irritat-ing stimuli in the airways or elsewhere in the body. Onesingle cough consists of an inspiratory phase followed byan expiratory effort with the glottis closed (compressivephase) and the sudden opening of the glottis with rapidexpiratory airflows (expulsive phase). [22, 23]. Chroniccough usually indicates a disease in the airways or in thepulmonary tissue.
Cough sound
Transient sound induced by the cough reflex with a fre-quency content between 50 and 3,000 Hz. The character-istics of cough sounds are different in different pulmonarydiseases. Cough sounds containing wheezes are typical inasthma.
Crackle
Adventitious, discontinuous, explosive sound occurringusually during inspiration. It can be characterized on thebasis of its waveform and duration, and timing in a respi-ratory cycle. A crackle can be classified, on the basis of itstotal duration, as fine (short duration) or coarse (long
TERMS OF RESPIRATORY SOUNDS 601
duration); see Fine crackle, and Coarse crackle sections.Occurrences of crackles in lung sounds usually reflect apathological process in pulmonary tissue or airways [20,21, 24–27].
Crackling period
Elapsed time between the beginning of the first cracklein a respiratory phase (inspiration or expiration) and theend of the last crackle within the same phase.
Cross-correlation function
The mean product of a signal at time t with that ofanother signal at time t + τ:
ρxy (τ) = lim 1 T T–∞ 2T x (t)y (t + τ) dt . (5) The cross-correlation is a function of lag τ and provides
a means of investigating the relationship between two sig-nals [16, 28].
Cut-off frequency
The frequency at which the frequency response of a fil-ter (or other circuit) is 3 dB below the maximal value ofthe frequency response.
Data base
A collection of data values, usually organized intorecords and tables following a predefined structure. Adatabase may also contain facilities for querying andreporting.
Decibel
The ratio of two sound levels a and b is expressed indecibels as
20 log10 Pa/Pb
where Pa and Pb are the respective sound pressure lev-els, or, equivalently, as
10 log10 WaWb,
where Wa and Wb are the respective sound intensities[29]. Normally, the notional threshold of hearing (datumlevel) is used as a reference by taking Pb as 20 µPa or,equivalently, Wb as 10-12 W·m-2.
Deterministic signal
The deterministic signal is a signal, the amplitude ofwhich can be described as a mathematical function of
time. This term is frequently used as the opposite of sto-chastic signal.
Digital signal
Sequence of values of a quantity, which can be repre-sented by a mathematical function having integral values(time or sample number) as independent variable and inte-gral values (value of the quantity) as dependent variable.Unlike analogue signals, digital signals can be stored andprocessed by computers (due to their finite nature).
Digital-to-analogue conversion
Digital-to-analogue conversion (DAC) is the process ofconverting a digital signal into an analogue signal. This isdone by first defining the relative timing of the digital timeindex. Then, a continuous interpolation (e.g. zeroth order)between successive values is determined. Finally, somelow-pass filtering is applied to remove higher-frequencycomponents (due to the inaccurate interpolation) [30].
Discrete Fourier series
A series of numbers representing the average level ineach of a series of narrow frequency bands ("bins"), i.e. astepwise representation of a spectrum [31].
Discrete Fourier transform
A version of the Fourier transform (FT) applicable to adiscrete time series (finite sequence of signal samples)[31, 32].
Discrete time series
A series of numbers usually proportional to the valuesof an analogue signal at a series of times (normallyequally spaced) [33].
Distortion
A deformation of the input signal to a system, detectedat its output due to nonlinear behaviour of some systemcomponent, sometimes induced by strong interferencesignal (intermodulation distortion). The distortion can bemeasured in the time domain as lack of linearity or in thecomplex domain as harmonic distortion and/or phase dis-tortion [34].
Dynamic range
The range from the lowest to the highest values of thephysical input to a transducer or of an analogue or digitalsignal at which equipment will function correctly. [8].
∫[ ]-T
602 A.R.A. SOVIJÄRVI ET AL.
Electret material
A material in which, by applying a voltage across twofaces, a permanent charge can be induced. This is an elec-trostatic analogy of a permanent magnet. When the mate-rial is strained, the voltage across the faces changes inproportion to the strain.
Electret microphone
A transducer in which incident sound is applied to adiaphragm made of an electret material sandwichedbetween conducting metal electrodes. When combinedwith a suitable transistor circuit and an energizing battery,it forms a small, highly sensitive microphone. The outputcommonly includes a DC offset voltage. [8, 35].
Electrodynamic microphone
A microphone in which incident sound causes a coil tomove within a magnetic field so that flux through the coilvaries. An electrical voltage related to the velocity is gen-erated across the coil and delivered as an output signal.
Envelope (curve)
A curve, connecting the local extrema (either maximaor minima) of another curve.
Equivalent sound level
The equivalent sound level (Leq) of a given time varia-ble sound (noise) is the level expressed in decibels of ahypothetical constant noise, which, if substituted for thereal noise for the same time interval, would involve thetotal quantity of sound energy. Leq is calculated from
1 PA (t) 2
T P0 dt, (6)
where T is the total measurement time, PA (t) the instanta-neous A-weighted sound pressure and P0 the referenceacoustic pressure of 2×10⁻⁵ N·m2. The use of the equiva-lent level allows the characterization of a noise [36, 37].
Expiratory reserve volume
The expiratory reserve volume (ERV) is the volume oflungs that can be maximally expired from the level of thefunctional residual capacity (FRC) [38].
Fast Fourier transform
The fast Fourier transform (FFT) is a very efficientalgorithm (numerical process) used for calculating the dis-crete FTs [39–41].
Filter
A device that transforms a signal at its input into a sig-nal at its output. Usually, the transformation aims toremove unwanted components [31]. Filters can be classi-fied in analogue filters (e.g. implemented by operationalamplifiers, resistors and capacitors) and digital filters (e.g.implemented by programmable digital hardware).
Fine crackle
Crackle that has a high pitch, low amplitude and shortduration. Its total duration (2CD) is <10 ms [20, 21]. Seealso Crackle section.
Forced expiratory time
The forced expiratory time (FETb) is the time requiredto exhale a specified fraction (b) of the forced vital capac-ity (FVC) [38].
Forced expiratory volume in one second
The forced expirtory volume in one second (FEV1) isthe maximal lung volume expired during the first secondstarting from full inspiration. [38].
Forced inspiratory vital capacity
The forced inspiratory vital capacity (FIVC) is the max-imal lung volume that can be inspired during forced inspi-ration from a position of full expiration [38].
Forced vital capacity
The FVC is the volume of pulmonary gas deliveredduring an expiration made as forcefully and completely aspossible starting from full inspiration [38].
Formant (formants structure)
Term used in phonetics to denote spectrum peak shapedowing to resonances in the voice generating system (vocaltract). A formant is characterized by the frequency of thepeak, the resonance factor and the relative amplitude level[42, 43].
Fourier transform
A mathematical operation for decomposing a timefunction into its frequency components (amplitude andphase). The process is reversible and the signal can bereconstructed from its Fourier components [39, 44].
∫ T
0
Leq = 10 log10

TERMS OF RESPIRATORY SOUNDS 603
Free field
An acoustic space free from reflections. For example,for monitoring of snoring, stridors and cough, a micro-phone is commonly placed near the mouth (5–20 cm).
Frequency
The number of periods in 1 s of a periodic signal x. Theunit is the Hertz (one cycle per second). An example of aperiodic signal is x (t) = sin(ωt), where ω is the angularvelocity, which has a period of T = 2π/ω, and hence a fre-quency (f ) of f = ω/2π [45].
Frequency domain
The space of the variable "frequency" associated to thespace of the variable "time" by an FT. In the frequencydomain, a signal is described by its spectrum [45].
Frequency resolution
The width (frequency range) of the bands correspond-ing to each value in a discrete Fourier series (oftenreferred to as the "bin" width of the transform) [45].
Frequency response
The response of a system to harmonic (sinusoidal) exci-tation of varying frequency. For linear time invariantdynamic systems, if a harmonic signal is presented at theinput, a harmonic signal of the same frequency occurs atthe output (after the decay of a transient phenomenon).Therefore, the steady-state response for every frequencycan be represented by two numbers: the input-to-outputamplitude ratio and the input-to-output phase difference[46, 47].
Functional residual capacity
The functional residual capacity (FRC) is the volume ofgas present in the lungs and airways at tidal end-expiratorylevel. It is the sum of expiratory reserve volume and resid-ual volume [38].
High-pass filter
A filter that allows components above a specific fre-quency to pass while attenuating or stepping all lower-fre-quency components.
Hypopnoea
Episode with an abnormally low level of pulmonaryventilation.
Impedance
The specific acoustic impedance (Zs) is the ratio betweenthe complex representation of the acoustic pressure (P) ina point of the sound wave and the complex representationof the particle velocity (V) in that point:
Zs = P/V. (7)
The acoustic impedance (Za) is the ratio between thecomplex representation of the mean P in an oscillatingsurface (S) and the complex representation of the soundflow (Q'; =VS) through this surface:
Za = P/Q' = Zs/S. (8)
The mechanical impedance (Zm), is the ratio betweenthe complex representation of the force that acts on an Sof a mechanical system and the complex representation ofthe v in that S (or in that point) in the direction of theforce:
Zm = PS/V = ZsS (9)[47, 48].
Impulse response
The response of a system to all impulsive excitation. Ifthe system is linear time-invariant and if the impulse is theideal delta function (Dirac function), the impulse responseand the transfer function are related by an FT.
Inductive microphone
A transducer in which incident sound causes the electri-cal inductance of a coil to change, generally by varyingthe coupling between the coil and a magnetic circuit.
Initial deflection width
The initial deflection width (IDW) is the duration of thefirst deflection in a crackle waveform [20, 21].
Intensity (of a sound wave)
The mean rate of flow of acoustic energy through a unitarea normal to the direction of propagation (W·m-2) [36].
Interference
A deterministic signal, emanating from an externalsource or phenomenon, and disturbing the signal of inter-est. Two kinds of interference are very relevant to respira-tory sounds. 1) Acoustic interference, e.g. heart sounds,flow transduction, noisy wards, slamming doors and dis-tance talking [48]. 2) Electromagnetic interference, e.g.power distribution (50 Hz) and cross-talk.
604 A.R.A. SOVIJÄRVI ET AL.
Internal field
A space of a microphone inside the body (e.g. oesopha-gus, trachea or bronchi). Lung sounds detected within thebody may contain special information on the site and gen-eration of the sound.
Jitter
A phenomenon that accompanies the digital signals allalong their life, from the conversion analogue/digital,through all the transfer and processing phases, up to theconversion digital/analogue. It is constituted by all thecontinuous (and generally small) temporal oscillations ofthe instants of switching around their mean values. Insound analysis, it measures pitch perturbation, i.e. the var-iation in fundamental frequency (F0) [49].
Largest deflection width
The largest deflection width (LDW) is the duration ofthe deflection of the largest amplitude in a crackle wave-form [21].
Linear time invariant system A system that can be described by linear differential or
difference equations with constant parameters. These sys-tems are relatively easy to deal with, both theoretical andpractical. For example, a linear time invariant amplifierexited by a harmonic input signal will deliver at its outputa harmonic signal with the same frequency and with anamplitude proportional to the input amplitude.
Low-pass filter
A filter that allows components below a specific fre-quency to pass while attenuating or stopping all higher-frequency components.
Lung sound
All respiratory sounds heard or detected over the chestwall or within the chest [5, 6] including breath sounds andadventitous sounds detected at this location.
Maximal expiratory flow at a specified lung volume
Maximal instantaneous flow achieved at the designatedlung volume during forced expiratory maneouvre startingfrom full inspiration [38]. Usually, the flow is obtainedwhen a given percentage of FVC remains to be expired.
Maximal inspiratory flow at a specified volume
Maximal instantaneous flow observed when a specifiedpercentage of the FIVC has been inhaled [38].
Maximal mid-expiratory flow
The maximal mid-expiratory flow (MMEF) is the meanmaximal expiratory flow during the middle half of theFVC [38].
Microphone
A transducer that converts incident sound waves into ananalogue signal (usually an electrical voltage). [46, 47].
Mixed sleep apnoea
A type of sleep apnoea characterized by central apnoeaearly in the apnoea followed by obstructive apnoea. [15].
Moving average process
A stochastic signal (x), for which
q
x(i) = ∑ bk u(i - k), (10)
k=0
where i is the consecutive number of the observaqtion, qthe MA order of the model, u a white noise process and bk
is the MA parameter of the process.The signal (x), can be considered to result from the
application of a all-zero filter (defined by the bk) to u.
Muscle sounds
Sounds generated by skeletal muscle contraction. Theyare generally of a low frequency (<20 Hz) and weak inten-sity. The sound amplitude and the frequency are related tothe contraction force [50–52].
Noise
A stochastic signal, emanating from an external sourceor phenomenon and disturbing the signal of interest.
Normal breath sound
A breath sound detected on 1) the chest wall, where it ischaracterized by a quiet low-frequency noisy sound duringinspiration, and where it is hardly audible during expira-tion; and 2) the trachea, where it is characterized by abroader spectrum of noise (i.e. containing higher-frequencycomponents) than the normal breath sounds from thechest wall, and where it is audible both during inspirationand expiration.
Nyquist frequency
The highest frequency component of a signal that canbe correctly measured owing to the aliasing phenomenon:
TERMS OF RESPIRATORY SOUNDS 605
if fs is the sampling frequency, the Nyquist frequency isequal to fs/2 [16].
Obstructive sleep apnoea
Obstructive sleep apnoea (OSA) is a type of sleepapnoea due to upper airway obstruction despite persistentventilatory movements. It is the most common type ofSAS [15].
Obstructive ventilatory defect
A state in the lungs with a pathological airflow limita-tion during breathing. It is characterized by, a decrease inforced expiratory volume, out of proportion to anydecrease in vital capacity (VC), and by low airflows at themouth during forced breathing maneouvres. It occurrscommonly in patients with chronic obstructive pulmonarydisease and asthma [38].
Oral airflow
Airflow measured from the mouth during breathingwith or without the nose closed. [53, 54].
Pack-year
A measure of the amount of smoking. It is the numberof cigarettes smoked per day multiplied by the number ofyears of smoking divided by the number of cigarettes in apacket (usually 20).
Peak expiratory flow
The peak expiratory flow (PEF) is the maximal instan-taneous air flow during a forced expiratory manoeuvrestarting from full inspiration, usually reached at the begin-ning of expiration. [38, 55, 56].
Peak inspiratory flow
The peak inspiratory flow (PIF) is the maximal instan-taneous airflow achieved during an FIVC manoeuvrestarting from full expiration [38, 55].
Peak expiratory flow, diurnal variability
The diurnal variability of PEF is calculated (as a per-centage) according to the formula [56]:
PEFmax – PEFmin 0.5(PEFmax+PEFmin), (11)
where PEFmax is the highest value and PEFmin the lowestvalue in a day.
Percussion sounds
Percussion sounds of the chest are resonant soundsinduced by a direct "thump" on the chest or indirectly bystriking one finger upon another finger applied firmly tothe chest. They have the greatest content of energy in therange of 150–200 Hz. The character of the percussionsounds may change due to pathological processes of thelung. [57, 58].
Periodic signal
Any signal (x(t)) for which there exists a duration (T)such that x(t) = x(t +T), in other words, if a part of thewaveform is repeated over and over again. If such a T existsfor a given signal, then also x(t) = x(t + 2T), etc. However,there is always a smallest possible T; this value is calledthe period of the signal.
Piezoelectric material
Material which, when strained (distorted) by the actionof external forces, becomes electrically polarized and pro-duces voltages linearly related to the mechanical strain.Electrically, it behaves as it capacitance of which thecharge varies with the imposed strain. Piezoelectric trans-ducers are used to measure many variables, includingacceleration, force and sound [47].
Piezoelectric microphone
A microphone in which incident sound acts on a piezo-electric material to generate an output voltage [47].
Pleural friction sound
Coarse crackles arising from parietal and visceralpleura rubbing against each other. Their presence indi-cates inflammatory processes of the pleura. They usuallyprecede the beginning of pleural effusion and disappearwhen the fluid is formed. They are synchronous withbreathing and are modified by posture and breathing pat-tern. [5, 59].
Phonopneumogram
Simultaneous and overlapped display of sound signaland air flow in time domain during breathing [60].
Physical examination
A general examination of a subject performed by a phy-sician including inspection, palpation, percussion and aus-cultation.
Diurnal variability = 100

606 A.R.A. SOVIJÄRVI ET AL.
Polysomnography
Polygraphic recording from a subject during sleep offollowing measures: electroencephalogram, electrocardio-gram, electro-oculogram, electromyogram, nasal and oralairflow, thoracic breathing movements (by strain gauge orby inductive plethysmography) arterial oxygen saturation[61].
Posture
Body position, like supine, sitting and standing.
Power
The rate at which energy is generated/radiated/transmit-ted, etc. (W=J·s-1) [45].
Power spectral density
Mean square value of the signal power in a band 1 Hzwide [31].
Power spectrum
Frequency domain data representing the power distri-bution of a sound with respect to frequency [31].
Quantization
Mapping of the amplitude values of an analogue signalinto a series of binary numbers with a given ADC resolu-tion. [31].
Residual volume
The residual volume (RV) is the volume of gas remain-ing in the lungs at the end of full expiration [38].
Resistance of airways
The resistance of the airways (Raw) is the ratio of driv-ing pressure (P) to airflow (V') (Raw=P/V') [38]. It can bemeasured with a body plethysmograph and is inverselyproportional to the fourth power of airway diameter. It isincreased in patients with airways obstruction.
Respiratory manoeuvre
The sequence of lung volume (V) levels during an inter-val of time. This sequence can be considered as a functionof time (V(t)), of which the derivative dV/dt (or V') is theairflow at the mouth. The airflow at the mouth alone is notsufficient to characterize a certain manoeuvre, unless thelung volume at one instant is also given. Examples ofgeneric manoeuvres are: quiet tidal breathing; forcedexpiratory or inspiratory effort; tidal breathing with target
peak airflows, switching between inspiration and expira-tion at free lung volumes; and breathing with target air-flows, switching between inspiration and expiration atcertain target lung volumes.
Although V(t) completely characterizes the manoeuvre,it is useful to represent manoeuvre by a curve in the flow/volume plane.
Respiratory sounds
All sounds related to respiration including breathsounds, adventitious sounds, cough sounds, snoringsounds, sneezing sounds, and sounds from the respiratorymuscles. Voiced sounds during breathing are not includedin respiratory sounds.
Restrictive ventilatory defect
Reduction of lung volumes, best characterized by areduction in total lung capacity (TLC) [38]. It occurs com-monly in disorders that restrict lung expansion such as lungfibrosis, disorders of the pleural space, chest wall neu-romuscular diseases, and obesity.
Relative crackling period
Crackling period related to the duration of the contain-ing phase.
Rhonchus
A low-pitched wheeze containing rapidly dampingperiodic waveforms with a duration of >100 ms and fre-quency of <300 Hz. Rhonchi can be found, for example,in patients with secretions or narrowing in large airwaysand with abnormal airway collapsibility.
Roll off
The rate at which the signal at the output of a filter (orother system) is attenuated with changes in frequency,generally expressed in decibels per octave (frequency ratioof 2) or decade (frequency ratio of 10).
Sampling frequency
The repetition rate (number of times per second) atwhich the level of the analogue signal is measured andconverted to a digital value [31].
Segmentation
The selection of time intervals with their correspondingwaveforms from a given signal. In spectral density estima-tion, it is usual to allow for overlapping intervals. [8].
TERMS OF RESPIRATORY SOUNDS 607
Signal preprocessing
Modification of an analogue signal by amplification,attenuation, filtering, etc. prior to recording, digitizing,displaying, undergoing analysis, etc.
Signal processing
Signal data manipulation and analysis, generally by adigital computer, in accordance with a given algorithm.The aim of the signal processing can be diverse: e.g. tochange the form, to reduce the amount of data, to extractmeaningful information, to reduce noise and interferencelevels, or to calculate features for pattern recognition.
Skin fold
A measure of the double thickness of the epidermis,underlying fascia, and subcutaneous adipose tissue. [62,63].
Sleep apnoea syndrome
The sleep apnoea syndrome (SAS) is a syndrome withrepeatedly occurring apnoeas during sleep resulting fromupper-airway obstruction (obstructive apnoea), or a lackof respiratory muscle activity (central apnoea), or a com-bination of these factors (mixed apnoea). More than 30apnoeas per 7 h during sleep or greater are diagnostic ofSAS [15].
Snoring sound (snore)
A respiratory low-frequency noisy sound with periodiccomponents (fundamental frequency 30–250 Hz) detectedusually during sleep induced by abnormal vibrations inthe walls of the oropharynx. It is a typical inspiratorysound but a small expiratory component can appear espe-cially in patients with OSA.
Socioeconomic profile
A collection of subject data including occupationalactivity, usual daily activity, hobbies and interest, alimen-tary customs, education and economic situation.
Sonogram
A particular three-dimensional presentation of theresults of the sound spectral analysis, which shows howthe spectrum varies with time. In the sonogram, theincreasing time is associated with the x-axis, the increas-ing frequency to the y-axis and the amplitude of the spec-tral components to the hidden z-axis represented by agrayscale or colour palette. A more common term in sig-nal processing is spectrogram (64, 65].
Sound power level
A measure of sound power, defined as:
W ' W'0 , (12)
where W' is the root-mean-square (RMS) of sound power,and W'0 is equal to 1 pW [36].
Sound pressure level
A measure of sound pressure, defined as:
P P0 (13)
where P is the RMS of the sound pressure, and P0 is equalto 20 µPa [36].
Specific airways conductance
The specific airways conductance (sGaw) is the inverseof Raw divided by thoracic gas volume (TGV) (sGaw = Raw-
1·TGV-l) [38]. It is decreased in patients with airwaysobstruction.
Spectrum
The Cartesian plot of the amplitude of the spectral com-ponents of a signal versus frequency. In sound analysis,the spectral components are generally obtained from theFourier transform of the signal [3l].
Spirometry
A lung-function test, that measures lung volumes andtheir changes during inspiration and expiration. Airflow atmouth or the rate at which the lung volume is changingmay also be measured by spirometry. Spirometry includeseffort-dependent manoeuvres that require good co-ordina-tion and cooperation by the subject.
Squawk
Relatively short inspiratory adventitious sound having amusical character, occasionally found in patients withinterstitial lung disorders. Acoustically, its waveform mayresemble that of short wheezes, but they are often pre-ceded by a crackle. The duration of squawks may varybetween 50 and 400 ms [66]. The basic mechanisms oftheir origin probably differ from those of wheezes inobstructive lung diseases.
Sternal notch
Small anatomical area just above the upper margin ofsternum. This site can be used to monitor breath sounds.
LW '= 10 log10
LP = 20 log10

608 A.R.A. SOVIJÄRVI ET AL.
Stochastic signal
Signal of which the amplitude level cannot be describedas a mathematical function of time. A stochastic signalcan be characterized by means of probability density func-tions. Also called the stochastic process.
Stridor
Very loud low-frequency wheeze originating in the lar-ynx or trachea. It appears most frequently during inspira-tion. It can be audible at the mouth, at the trachea and overthe chest wall. Stridor can appear, for example, in whoop-ing cough, and in laryngeal or tracheal stenosis [67].
Thoracic gas volume
The thoracic gas volume (TGV) is the volume of gas inthe thorax at any point in time and any level of thoraciccompression during breathing. It is usually measured bythe whole-body plethysmograph method from the level oftidal end-expiration [38].
Tidal volume
The tidal volume (VT) is the volume of gas that isinspired or expired during a respiratory cycle. It is dynam-ically changing and commonly measured at the mouth[38].
Timed forced expiratory volume
The volume of gas exhaled in a specified time from thestart of the FVC manoeuvre. Conventionally, the timeused is 1 s (FEV1) [38].
Timed forced inspiratory volume
The volume of air inhaled in a specified time, usually 1 s(FIV1), during the performance of the FIVC manoeuvre[38].
Time domain
The natural space in which the analogue signal is repre-sented as instantaneous amplitude versus time i.e. by itswaveform [45].
Time-expanded waveform
The time-expanded waveform (TEW) is the display of arespiratory sound signal with a time scale of ≥800 mm·s-1.From a visual inspection of such a display, it is possible tostudy the waveforms of normal breath sounds, trachealsounds and adventitious sounds (crackles, wheezes) andto distinguish them from each other [20].
Total lung capacity
The total lung capacity (TLC) is the volume of gas inthe lungs at the end of a full inspiration [38].
Tracheal sound
Sound heard or detected over the extrathoracic part ofthe trachea.
Transducer
A device that converts a measurand (i.e. a physicalinput such as sound, pressure, temperature, etc.) into anelectrical signal. The output may be in the form of ana-logue or digital data [47].
Transfer function
Mathematically, the FT of the impulse response of alinear time-invariant system. Usually, the transfer functionhas the form of a fraction of polynomials of the complexfrequency variable. The zeroes of the denominator areknown as poles of the transfer function. The frequencyresponse of the system can be derived from the transferfunction by substitution of the complex frequency variableby the purely imaginary jω = j2πf [31], where j is an imag-inary unit, ω angular velocity and f frequency.
Triangle of auscultation
An area free of (intervening) muscle fibres of the rhom-boid muscle where breath (or adventitious) sounds canclearly be detected. This triangle is formed by the lateralborder of the trapezius, the upper border of the latissimusdorsi and the medial border of the scapula.
Two-cycle duration
The two cycle duration (2CD) is the time from thebeginning of the initial deflection of a crackle to the pointwhere the waveform of the crackle has completed twocycles [20, 21].
Ventilation
Gas exchange between lungs and the surroundings ofthe body.
Vesicular sound
Normal breath sound detected over the chest wall. Theterm is based on a fallacy that normal breath sounds orgin-ates in the alveoli (vesicles) [68]. Its use is no longerencouraged and should be substituted by the term normalbreath sound.
Vital capacity
The vital capacity (VC) is the lung volume changebetween the positions of full inspiration and completeexpiration by using a slow breathing manoeuvre [38].
TERMS OF RESPIRATORY SOUNDS 609
Voiced sound
Sound generated in vocal cords, like speech and singingsounds.
Waveform
The curve of the instantaneous amplitude values of asignal versus increasing time [45].
Wavelet transform
The wavelet transform is a linear transformation thatconsists of decomposing an arbitrary signal into elemen-tary contributions. Those contributions (called wavelets)are generated by dilation and translation of an analysingfunction called the mother wavelet [69–71].
Wheeze
Adventitious, continuous sound having a musical char-acter. Acoustically, it is characterized by periodic wave-forms [20] with a dominant frequency usually over 100Hz [72] and with a duration of ≥100 ms; hence, the soundmust include at least 10 successive vibrations. Wheezesare usually associated with airways obstruction due to var-ious causes. If the wheeze contains essentially a singlefrequency, the wheeze is called monophonic. If it containsseveral frequencies, it is termed a polyphonic wheeze.
White noise
Stochastic signal of which the power spectral densityfunction is constant.
Window function
A series of factors by which the elements of a discretetime series are multiplied to minimize any errors in theFourier transform of the data that arise because the begin-ning and end of the time series are generally arbitrarilyrelated to the periodic variations of the variable con-cerned. There are several different functions (Bartlett,Blackman, Hamming, Hanning, Gaussian, Kaiser) thatmay be used in various circumstances. The feature com-mon to most is that they taper away to zero at each end. A"square window" is a series of ones and leaves the dataunchanged [31].
References
1. Fenton RT, Pasterkamp H, Tal A, Chernik V. Automatedspectral characterization of wheezing in asthmatic chil-dren. IEEE Trans Biomed Eng 1985; 32: 50–55.
2. Benima D, Barger JR. High-speed, high-resolution A/Dconverters. Electron Des News 1973; 5: 62.
3. Robertson AJ, Cooper D. Rales, rhonchi and Laënnec.Lancet 1957; 1: 417–423.
4. American Thoracic Society. Updated nomenclature formembership reaction. Am Thoracic Soc News 1977; 3: 5–6.
5. Forgacs P. Lung sounds. London, Bailliére Tindall, 1978.
6. Loudon R, Murphy RL, Jr. Lung sounds. Am Rev RespirDis 1984; 130: 663–673.
7. Druzgalski CK, Donnerberg RL, Campbell R. Tech-niques of recording respiratory sounds. J Clin Eng 1981;5: 321–330.
8. Gavriely N, Cugell D. Breath Sounds Methodology. BocaRaton, FL, CRC Press, 1995.
9. Mead J, Turner JM, Macklem PT, Little JB. Significanceof the relationship between lung recoil and maximumexpiratory flow. J Appl Physiol 1967; 22: 95–108.
10. Sterk PJ, Fabbri LM, Quanjer PH, Cockcroft DW,O'Byrne PM, Anderson SD, Juniper EF, Malo JL. Airwayresponsiveness. Standardized challenge testing with pharmacological, physical and sensitizing stimuli inadults. Report Working Party Standardization of LungFunction Tests, European Community for Steel and Coal.Official Statement of the European Respiratory Society.Eur Respir J 1993; 16: Suppl: 53–83.
11. Enochson L. Digital signal analysis and aliasing. SoundVibration 1987; 3: 28–31.
12. Baughman RP, Loudon RG. Quantitation of wheezing inacute asthma. Chest 1984; 86: 718–722.
13. Charbonneau G, Racineux JL, Sudraud M, Tuchais E. Anaccurate recording system and its use in breath soundsspectral analysis. J Appl Physiol 1983; 55: 1120–1127.
14. Kanga JF, Kraman SS. Comparison of the lung sound fre-quency spectra of infants and adults. Pediatr Pulmonol1986; 2: 292–295.
15. Guilleminault C, van den Hoed J, Mitler MM. Clinicaloverview of the sleep apnoea syndrome. In: Guillemin-ault C, Dement WC, eds. Sleep Apnoea Syndromes. NewYork, Alan R Liss, 1978; pp. 1–12.
16. Bendat SJ, Piersol AG. Engineering Applications of Cor-relation and Spectral Analysis. New York, Wiley, 1980.
17. Bray GA. Obesity: definition, diagnosis and disadvan-tages. Med J Aust 1985; 142: S2–8.
18. World Health Organization. Measuring obesity: classifi-cation and description of anthropometric data. In: Reportof a WHO Consultation on the Epiderniology of Obesity.Copenhagen, WHO Regional Office for Europe, Nutri-tion Unit, 1988.
19. American Sleep Disorders Association. The InternationalClassification of Sleep Disorders. Diagnostic and CodingManual. Lawrence, Canada, Allen Press, 1990,
20. Murphy RL, Jr. Holford SK, Knowler WC. Visuallung-sound characterization by time-expandedwave-form analysis. N Engl J Med 1977; 296: 968–971.
21. Hoevers J, Loudon RG. Measuring crackles. Chest 1990;98: 1240–1243.
22. Piirilä P. Acoustic properties of cough and crackling lungsounds in patients with pulmonary diseases [dissertation].Dept. of Pulmonary Medicine, Lung Function Labora-tory, Helsinki University Central Hospital, 1992.
23. Debreczeni LA, Korpas J, Salat D. Spectral analysis ofcough sounds recorded with and without a nose clip. BullEur Physiopathol Respir 1987; 23: Suppl 10: 57s–61s.
24. Piirilä P, Sovijärvi AR, Kaisla T, Rajala HM, Katila T.Crackles in patients with fibrosing alveolitis, bronchiecta-sis, COPD, and heart failure. Chest 1991; 99: 1076–1083.
25. Mori M, Kinoshita K, Morinari H, Shiraishi T, Koike S,Murao S. Waveform and spectral analysis of crackles.Thorax 1980; 35: 843–850.
26. Baughman RP, Shipley RT, Loudon RG, Lower EE.Crackles in interstitial lung disease. Comparison of sar-coidosis and fibrosing alveolitis. Chest 1991; 100: 96–101.
27. Dalmasso F, Righini G, Prota R, Righini P. The

610 A.R.A. SOVIJÄRVI ET AL.
"ultrafine" crackles. 17th Int. Conf. on Lung Sounds, Hel-sinki, Finland; 1992; p. 54.
28. Kraman SS. Speed of low-frequency sound through lungsof normal men. J Appl Physiol 1983; 55: 1862–1867.
29. Beranek LL. Noise and Vibration Control. New York,McGraw Hill, 1971; Chapter 27.
30. Hoeschele D. Analog to Digital/Digital to Analog Con-version Techniques. New York, Wiley, 1968.
31. Stearns SD, Hush DR. Digital Signal Analysis, 2nd Edn.Englewood Cliffs, NJ, Prentice Hall, 1990.
32. Cooley JW, Lewis PAW, Welch PD. The finite Fouriertransform. IEEE Trans Audio Electroacoust 1969; Au-17: 77.
33. Rabiner LR, Radar CM. Digital Signal Processing. NewYork, IEEE Press, 1972.
34. Olson HF. Modern Sound Reproduction. Huntington, NY,Robert Krieger, 1978.
35. Urquhart RB, McGhee J, Macleod JE, Banham SW,Moran F. The diagnostic value of pulmonary sounds: apreliminary study by computer-aided analysis. ComputBiol Med 1981; 11: 129–139.
36. Hassal JR, Zaveri K. Acoustic Noise Measurement.Nerun, Denmark, Bruel & Kjaer, 1979; pp. 53–58.
37. I.S.O. Recommendation R. 532. Procedure for Calculat-ing Loudness Level.
38. Report Working Party "Standardization of lung functiontests". Eur Respir J 1993; 6: Suppl. 16.
39. Cooley JW, Tukey JW. An algorithm for the machine cal-culation of complex Fourier series. Math Comput 1965;19: 297.
40. Yoganathan AP, Gupta R, Corcoran WH. Fast Fouriertransform in the analysis of biomedical data. Med BiolEng 1976; 14: 239–245.
41. Shabtai-Musih Y, Grotberg JB, Gavriely N. Spectral con-tent of forced expiratory wheezes during air, He, and SF6breathing in normal humans. J Appl Physiol 1992; 72: 629–635.
42. Dalmasso F, Prota R. Snoring: analysis, measurement,clinical implications and applications. Eur Respir J 1996;9: 146–159.
43. Fant G. Analysis and synthesis of speech processes. In:Manual of Phonetics. Amsterdam, North-Holland, 1968;pp. 173–277.
44. Cohen A. Biomedical Signal Processing. Boca Raton, FL,CRC Press, 1986.
45. Beranek LL. Acoustics, Acoustical Society of America,1993.
46. IEC-126, International Electrotechnical Commission IECstandard publication 126. IEC Reference Coupler for themeasurement for Hearing Aids Using Earphones Coupledfor the Measurements of Ear Inserts, 2nd Edn. Geneva,IEC, 1973; pp. 1–17.
47. International Electrotechnical Vocabulary, 2nd Edn. Group08, Electroacoustics. Geneva, Central Office of the IEC,1960.
48. Mussell MJ. The need for standards in recording and ana-lysing respiratory sounds. Med Biol Eng Comput 1992;30: 129–139.
49. IEC. Sound System Equipment. Publication 268, 1969.50. Brozovich FV, Pollack GH. Muscle contraction generates
discrete sound bursts. Biophys J 1983; 41: 35–40.51. Oster G, Jaffe JS. Low frequency sounds from sustained
contraction of human skeletal muscle. Biophys J 1980;30: 119–127.
52. Barry DT, Cole NM. Muscle sounds are emitted at theresonant frequencies of skeletal muscle. IEEE TransBiomed Eng 1990; 37: 525–531.
53. Kraman SS. Effects of lung volume and airflow on thefrequency spectrum of vesicular lung sounds. RespirPhysiol 1986; 66: 1–9.
54. Lessard CS, Wong WC. Correlation of constant flow ratewith frequency spectrum of respiratory sounds whenmeasured at the trachea. IEEE Trans Biomed Eng 1986;33: 461–463.
55. Gregg I, Nunn AJ. Peak expiratory flow in normal sub-jects. Br Med J 1973; 3: 282–284.
56. Quanjer PH, Lebowitz MD, Gregg I, Miller MR, Peder-sen OF. Peak expiratory flow: conclusions and recom-mendations of a Working Party of the EuropeanRespiratory Society. Eur Respir J 1997; 24: Suppl. 2S–8S.
57. Murray A, Neilson JM. Diagnostic percussion sounds: 1.A qualitative analysis. Med Biol Eng 1975; 13: 19–28.
58. Murray A, Neilson JM. Diagnostic percussion sounds: 2.Computer-automated parameter measurement for quanti-tative analysis. Med Biol Eng 1975; 13: 29–39.
59. Forgacs P. Lung sounds. Br J Dis Chest 1969; 63: 1–12.60. Banaszak EF, Kory RC, Snider GL. Phonopneumogra-
phy. Am Rev Respir Dis 1973; 107: 449–455.61. Mishoe SC. The diagnosis and treatment of sleep apnoea
syndrome. Respir Care 1987; 32.62. Najjar MF, Rowland M. Anthropometric Reference Data
and Prevalence of Overweight Vital and Health Statistics.Series 11, No. 238. DHEW publication (PHS) 87-1688.Washington, DC, US Govt Printing Office, 1987.
63. Roche AF, Sievogel RM, Chumlea WC, Webb P. Gradingbody fatness from limited anthropometric data. Am J ClinNutr 1981; 34: 2831–2838.
64. Pasterkamp H, Carson C, Daien D, Oh Y. Digitalrespirosonography. New images of lung sounds. Chest1989; 96: 1405–1412.
65. Tal A, Sanchez I, Pasterkamp H. Respirosonography ininfants with acute bronchiolitis. Am J Dis Child 1991;145: 1405–1410.
66. Earis JE, Marsh K, Pearson MG, Ogilvie CM. The inspir-atory "squawk" in extrinsic allergic alveolitis and otherpulmonary fibroses. Thorax 1982; 37: 923–926.
67. Baughman RP, Loudon RG. Stridor: differentiation fromasthma or upper airway noise. Am Rev Respir Dis 1989;139: 1407–1409.
68. Laënnec RTH. A Treatise on Disease of the Chest, inWhich They are Described According to their Anatomi-cal Characters, and their Diagnosis Established on a NewPrinciple by Means of Acoustic Instruments. Transl. fromthe French by John Forbes. London, Underwood, 1821.
69. Grossman A, Holschneider M, Kronland-Martinet R,Morlet J. Detection of Abrupt Changes in Sound Signalswith the Help of Wavelet Transform. Advances in Elec-tronics and Electron Physics, New York, Academic Press,1987.
70. Holschneider M, Kronald-Martinet R, Morlet J, Tchamit-chian P. A real-time algorithm for signal analysis with thehelp of the wavelet transform. In: Combers J, GrossmanA, Tchamitchian P, eds. Wavelet, Time-Frequency Meth-ods and Phase Space. New York, Springer, 1989; pp.286–297.
71. Meyer Y. Orthonormal wavelets. In: Combers J, Gross-man A, Tchamitchian P, Eds. Wavelet, time-frequencymethods and phase space. New York, Springer-Verlag,1989.
72. Pasterkamp H, Kraman SS, Wodicka GR. Respiratorysounds. Advances beyond the stethoscope. Am J RespirCrit Care Med 1997; 156: 974–987.
Eur Respir Rev
2000; 10: 77, 611–615Printed in UK - all rights reserved
Copyright ©ERS Journals Ltd 2000European Respiratory Review
ISSN 0905 - 9180
Environmental and subject conditions and breathing manoeuvres for respiratory sound recordings
M. Rossi
*
, A.R.A. Sovijärvi
**
, P. Piirilä
**
,
***
, L. Vannuccini
+
, F. Dalmasso
++
, J. Vanderschoot
#
aa
Environmental and subject conditions, and breathing ma-noeuvres, may have a marked influence on different varia-bles of respiratory sounds. Therefore, basic standards areneeded for these items to be able to compare the resultsbetween different tests and laboratories. The present guide-lines refer to earlier guidelines for lung function testing[11 and for sleep studies [2].
Experimental applications of respiratory sounds recording
Sleep studies require methods for simultaneous moni-toring of sleep stage, respiratory pattern (both effort andflow), oxygen saturation, electrocardiogram and snoring.Standardized techniques for the monitoring of sleep stageare now well established. However, optimal techniques formonitoring of respiration are still uncertain. For monitor-ing of mouth and nasal air flow, various types of deviceshave been tested. These include rapid response CO
2
ana-lysers, thermistors, laryngeal and tracheal microphonesand impedance pneumography. There have been approa-ches to simplify the method to assess respiration duringpolysomnography. These include tracheal sound recordingand analysis with automated computer techniques. It hasbeen shown that sound monitoring can support the detec-tion of apnoeas and hypopnoeas [3, 4].
Respiratory sounds can be recorded continuously, andanalysed on-line to monitor sleep apnoea, nocturnal chang-
es of bronchial obstruction in asthma (
e.g
. wheezing time)[5], ventilation during anaesthesia [6] and regional distri-bution of ventilation [7].
Respiratory sounds recording and analysis can be usedwhen assessing the response to bronchodilators and tobronchoconstrictors [8, 9] or the variations of airflow ob-struction during acute bronchial challenge tests in children.Respiratory sounds can also be applied to monitoring andanalysing the bronchial response to inhaled nonspecificbronchoconstrictive agents like methacholine or histamineboth in children [10] and in adults [11–13]. During metha-choline challenge, the appearance of wheezing detectedover the trachea has been found to correlate closely withthe concentration of methacholine inducing a fall of 20%in forced expiratory volume in one second in children.Moreover, changes in breath sound frequency distribution,in terms of the median frequency, have been shown toreflect the airway changes during histamine challenge testsin adults and children with asthma [9, 14]. Other authorshave studied the behaviour of breath sounds during exer-cise-induced airway obstruction in children with asthma[15].
Treatment of acute heart failure especially can be as-sessed by means of lung sound analysis. The effects ofbreathing a gas mixture different from air (
e.g.
He 80%–O
2
20%) can be applied to study the mechanisms of gener-ation and transmission of normal and pathological breathsounds [16, 17].
Environmental and subject conditions and breathing manoeuvres for respiratory soundrecordings. M. Rossi, A.R.A. Sovijärvi, P. Piirilä, L. Vannuccini, F. Dalmasso, J. Vander-schoot. ©ERS Journals Ltd 2000.
ABSTRACT: This paper gives recommendations for experimental conditions to befollowed during recording of respiratory sounds, including environmental conditions,subject conditions and interventions (
e.g
. bronchial challenge tests).The optimal experimental conditions and procedures are dependent on the type of
the respiratory sound to be recorded (such as breath sounds, cough or snoring), theindication for the recording (
e.g.
diagnostic, assessment of therapy, monitoring), theage of the subject (baby, child, adult), and the method and application of the record-ing (
e.g
. free field, endobronchial microphone).Short-term recording and analysis for diagnostic, therapeutic and follow-up pur-
poses have different requirements to those for long-term monitoring and analysis ofrespiratory sounds (
e.g
. nocturnal wheezing, cough or snoring).
Eur Respir Rev 2000; 10: 77, 611–615.
*U.O. Pneumologia, Arezzo, Italy. **Deptof Clinical Physiology, Helsinki Univer-sity Hospital, Helsinki, Finland and***Finnish Institute of Occupational Health,Helsinki.
+
Dipartimento di Chimica, Uni-versità di Siena, Italy.
++
Divisione di Pneu-mologia, Ospedale Mauriziano Umberto I,Torino, Italy.
#
Dept of Medical Informatics,University of Leiden, Leiden, the Netherlands.
Correspondence: A. Sovijärvi, Dept of Clini-cal Physiology and Nuclear Medicine, Hel-sinki University Hospital, P.O. Box 340,FIN-00029 HUS, Finland
Keywords: Breathing manoeuvres, environ-mental conditions, respiratory sounds
This paper is part of the publications of theCORSA project supported by the EU BIO-MED I programme (contract BMH1-CT94-0928) and by the European RespiratorySociety (ERS task force).
612
M
.
ROSSI
ET
AL
.
Endobronchial and oesophageal microphones can be usedfor research as well as multimicrophone recordings. Region-al distribution of ventilation [18, 19], subtraction intensityindex [20] and phase-angle test (apex to base intensityratio) [21] are applications of multimicrophone analysis.
Monitoring of ventilation during anaesthesia in emer-gency departments has special needs for microphones andtheir locations. However, in such circumstances, there ispoor control of the environmental noise.
In some cases, it could be useful to use methods forlong-term recording of cough using filtered acoustic sig-nals [22, 23]. Body movements related to the cough canbe recorded by a static charge sensitive bed or by sensorsgiving similar information. The patient can be studied ly-ing or sitting with no transducers or electrodes attached [23].
Environmental conditions
Satisfactory environmental conditions for short-termrespiratory sound recordings, are most often achievable inlaboratories of lung function or clinical physiology, whereit is also possible to combine sound recordings with otherphysiological measurements [24].
Environmental conditions when monitoring and record-ing respiratory sounds in intensive care units and bedsiderecording at home and inpatient departments have specificfeatures and must be adapted to the recording proceduresto avoid artefacts and bias.
Noise interference
Any sound not directly induced by breathing is regard-ed as background noise (BN). There are two types of BN:1) environmental noise: a) continuous noise: generated bymotors, hard disks, air-conditioning ducts, fluorescent lightbulbs, transformers, fans in electronic equipment and com-puters, traffic in the street,
etc
.; and b) transient noise:speech, music, noise from airplanes, trains, cars, slammingdoors, furniture squeaks, phone rings, alarms from moni-tors or other electronic devices; and 2) nonrespiratory soundsand body sounds: a) related to breathing: chest motion,respiratory muscle sounds, skin friction, sounds inducedby airflow in devices, and tubes and valves for monitoringof airflow and volume; and b) not related to breathing:heart sounds and murmurs, vascular sounds, swallowing,burping, bowel sounds, joint crackles, speech or other nois-es from the subjects.
Many methods have been proposed to eliminate envi-ronmental noises. Most of the environmental noises canbe avoided by using a soundproof room. An acousticchamber can reduce ambient background noise by up to30 dB [25], but most frequently, it is not available for clin-ical respiratory sound recordings. For practical purposes,it is recommended to have a room that is free from tran-sient noises and to have lung function devices and com-puters as silent as possible. The background noise level inthe room where respiratory sounds are recorded should bebelow 45 db (A) or 60 dB (linear). Respiratory sound re-cording in a body plethysmograph could be a good choiceto reduce ambient noise.
Shielding of the sensors with sound isolation materialscan be helpful to eliminate environmental noise [26]. Dif-ferent types of sensors (condenser microphone, piezoelec-tric sensor) have different sensitivities to environmentalnoise reaching the microphones directly. Therefore, thissensitivity may be a factor in the selection of a micro-phone.
Transient noises are much more difficult to eliminatethan continuous noise. One method is to identify the sec-tions of a sound recording that contain significant noiseand discard them from the analysis. For ambient noise,this could be done automatically during the recording bymeans of an additional microphone.
The noise at zero airflow (breath holding) picked up onthe chest wall for assessing BN in the frequency domain[27] should be measured in order to assess the quality ofthe recording. In spectral analysis, it can even be used tosubtract the noise spectrum.
The noise generated by the turbulent vortex in flowtransducers while recording the flow at the mouth caninfluence the power spectrum density of the sounds meas-ured at the trachea. This phenomenon is induced even bythe low-flow-resistance transducers [28]. There is no evi-dence that sounds picked up on the chest wall are influ-enced by the use of the flow transducer.
Background noise in specific circumstances
There are specific and varying requirements for theenvironmental shielding in sleep studies, nocturnal moni-toring, bedside recordings, home monitoring, emergencydepartments and intensive care units, as well as duringanaesthesia. However, the principles are the same as thoseduring conventional short-term respiratory sound record-ings.
Other environmental conditions
The temperature, humidity, lighting and ventilation ofthe room must be comfortable.
Subject conditions and procedures
Preparation of the subject before sound recording
The guidelines concerning preparation of the subjectsbefore short-term recording of breath sounds are the sameas those recommended by the European Respiratory Soci-ety [1] to be used before lung function tests.
Body position and location of microphones
The posture of the subject to be recommended for short-term recording of respiratory sounds is a sitting position.The subject should support the hands on the thighs toavoid contact of the arms with the axillary areas. Duringlong-term recordings, the most common body position issupine.
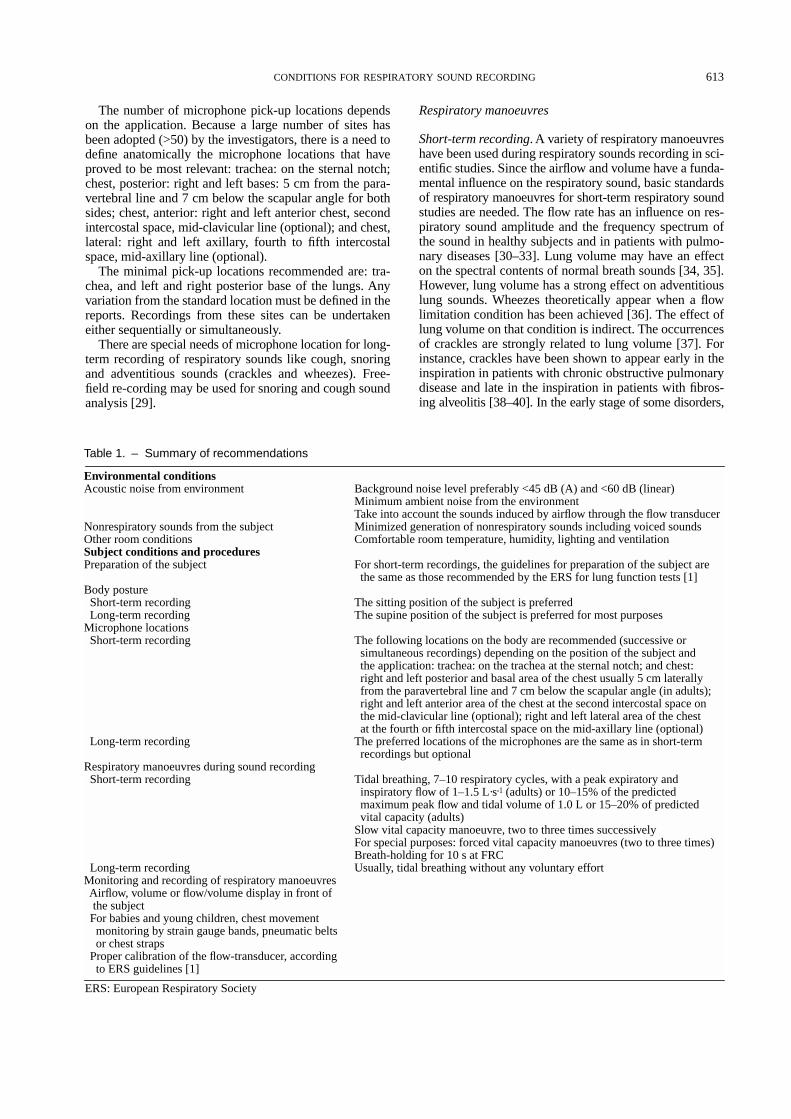
CONDITIONS
FOR
RESPIRATORY
SOUND
RECORDING
613
The number of microphone pick-up locations dependson the application. Because a large number of sites hasbeen adopted (>50) by the investigators, there is a need todefine anatomically the microphone locations that haveproved to be most relevant: trachea: on the sternal notch;chest, posterior: right and left bases: 5 cm from the para-vertebral line and 7 cm below the scapular angle for bothsides; chest, anterior: right and left anterior chest, secondintercostal space, mid-clavicular line (optional); and chest,lateral: right and left axillary, fourth to fifth intercostalspace, mid-axillary line (optional).
The minimal pick-up locations recommended are: tra-chea, and left and right posterior base of the lungs. Anyvariation from the standard location must be defined in thereports. Recordings from these sites can be undertakeneither sequentially or simultaneously.
There are special needs of microphone location for long-term recording of respiratory sounds like cough, snoringand adventitious sounds (crackles and wheezes). Free-field re-cording may be used for snoring and cough soundanalysis [29].
Respiratory manoeuvres
Short-term recording
. A variety of respiratory manoeuvreshave been used during respiratory sounds recording in sci-entific studies. Since the airflow and volume have a funda-mental influence on the respiratory sound, basic standardsof respiratory manoeuvres for short-term respiratory soundstudies are needed. The flow rate has an influence on res-piratory sound amplitude and the frequency spectrum ofthe sound in healthy subjects and in patients with pulmo-nary diseases [30–33]. Lung volume may have an effecton the spectral contents of normal breath sounds [34, 35].However, lung volume has a strong effect on adventitiouslung sounds. Wheezes theoretically appear when a flowlimitation condition has been achieved [36]. The effect oflung volume on that condition is indirect. The occurrencesof crackles are strongly related to lung volume [37]. Forinstance, crackles have been shown to appear early in theinspiration in patients with chronic obstructive pulmonarydisease and late in the inspiration in patients with fibros-ing alveolitis [38–40]. In the early stage of some disorders,
Table 1. – Summary of recommendations
Environmental conditionsAcoustic noise from environment
Nonrespiratory sounds from the subjectOther room conditionsSubject conditions and proceduresPreparation of the subject
Body posture Short-term recording Long-term recordingMicrophone locations Short-term recording
Long-term recording
Respiratory manoeuvres during sound recording Short-term recording
Long-term recordingMonitoring and recording of respiratory manoeuvres Airflow, volume or flow/volume display in front of the subject For babies and young children, chest movement monitoring by strain gauge bands, pneumatic belts or chest straps Proper calibration of the flow-transducer, according to ERS guidelines [1]
Background noise level preferably <45 dB (A) and <60 dB (linear)Minimum ambient noise from the environmentTake into account the sounds induced by airflow through the flow transducerMinimized generation of nonrespiratory sounds including voiced soundsComfortable room temperature, humidity, lighting and ventilation
For short-term recordings, the guidelines for preparation of the subject are the same as those recommended by the ERS for lung function tests [1]
The sitting position of the subject is preferredThe supine position of the subject is preferred for most purposes
The following locations on the body are recommended (successive or simultaneous recordings) depending on the position of the subject and the application: trachea: on the trachea at the sternal notch; and chest: right and left posterior and basal area of the chest usually 5 cm laterally from the paravertebral line and 7 cm below the scapular angle (in adults); right and left anterior area of the chest at the second intercostal space on the mid-clavicular line (optional); right and left lateral area of the chest at the fourth or fifth intercostal space on the mid-axillary line (optional)The preferred locations of the microphones are the same as in short-term recordings but optional
Tidal breathing, 7–10 respiratory cycles, with a peak expiratory and inspiratory flow of 1–1.5 L·s-1 (adults) or 10–15% of the predicted maximum peak flow and tidal volume of 1.0 L or 15–20% of predicted vital capacity (adults)Slow vital capacity manoeuvre, two to three times successivelyFor special purposes: forced vital capacity manoeuvres (two to three times)Breath-holding for 10 s at FRCUsually, tidal breathing without any voluntary effort
ERS: European Respiratory Society

614
M
.
ROSSI
ET
AL
.
crackles appear only at the end of deep inspiration (
e.g
.asbestosis, collagen diseases, extrinsic allergic alveolitis)[41].
The basic standard to be recommended in adults is touse tidal breathing, with an expiratory and inspiratory peakflow of 1.0–1.5 L·s
-1
or 10–15% of the predicted maxi-mum peak expiratory flow for 7–10 respiratory cycles.The volume of tidal breathing recommended is 1.0 L or15–20% of predicted vital capacity in adults.
The route of breathing (nose or mouth) has an effect onoverall intensity of breath sounds. Mouth breathing is rec-ommended for two reasons: flow in the nose breathing ismore difficult to standardize and sufficiently high flowlevels are difficult to obtain [42]. During mouth breathing,a nose clip is recommended.
Deep breathing with slow vital capacity manoeuvres canincrease the sensitivity of the appearance of adventitioussounds like crackles and wheezes in certain diseases; twoto three such manoeuvres successively are usually enoughfor the analysis. For special purposes, forced respiratorymanoeuvres (two to three times successively) are indi-cated.
Long-term recording
. During long-term recording and mon-itoring, voluntary respiratory manoeuvres are not usuallyneeded or not possible (
e.g
. during sleep) for assessmentof respiratory sounds. The dominant type of breathing istidal breathing.
Monitoring of respiratory manoeuvres
. The respiratorymanoeuvre must be monitored and controlled by record-ing the airflow. For scientific purposes, monitoring and re-cording of flow-volume loops are recommended. The bestway is a flow or flow-volume display in front of the sub-ject or a flow-targeting system; the simplest device is alarge centre-zero analogue meter driven by the flow trans-ducer [43].
Flow-gated sampling of breath sounds for the analysis(
e.g.
flow-standardized) is likely to reduce the effect offlow and has been used in many scientific papers [44].
Chest movements during breathing manoeuvres can berecorded by chest- strap pneumographs, pneumatic belt orstrain gauge, but they give only a qualitative signal that al-lows the phases of the respiratory cycles to be distinguished.These methods can be applied to poorly co-operating pa-tients and to children and to babies. Flow thermistors canalso be used, but their signal is semiquantitative.
Summary of recommendations
A summary of recommendations is presented in table 1.
References
1. Report Working Party: Standardisation of Lung FunctionTest. Standardised lung function testing.
Eur Respir J
1993;6: Suppl. 16.
2. Phillipson EA, Remmers JE. Indications and standards forcardiopulmonary sleep studies.
Am Rev Respir Dis
1989;139: 559–568.
3. Beckerman RC, Wegmann MJ. A comparison of trachealbreath sounds, airflow, and impedance pneumography inthe detection of childhood apnea.
Sleep
1985; 8: 342–346.
4. Beckerman RC, Wegmann MJ, Waring WW. Trachealbreath sounds for detection of apnea in infants and chil-dren.
Crit Care Med
1982; 10: 363–366.5. Baughman RP, Loudon RG. Lung sound analysis for con-
tinuous evaluation of airflow obstruction in asthma.
Chest
1985; 88: 364–368.6. Hok B, Bythell V, Bengtsson M. Development of a wire-
less stethoscope for auscultatory monitoring during an-aesthesia
. Med Biol Eng Comput
1988; 26: 317–320.7. Ploy-Song-Sang Y, Macklem PT, Ross WDR. Distribu-
tion of regional ventilation measured by breath sounds.
Am Rev Respir Dis
1978; 117: 657–664. 8. Anderson K, Aitken S, Carter R, MacLeod JES, Moran F.
Variation of breath sound and airway caliber induced byhistamine challenge.
Am Rev Respir Dis
1990; 141:1147–1150.
9. Malmberg LP, Sovijärvi ARA, Paajanen E, Piirilä P,Haahtela T, Katila T. Changes in frequency spectra ofbreath sounds during histamine challenge test in adultasthmatics and healthy control subjects.
Chest
1994; 105:122–131.
10. Tinkelman DG, Lutz C, Conner B. Analysis of breathsounds in normal and asthmatic children and adults usingcomputer digitized airway phonopneumography (CDAP).
Respir Med
1991; 85: 125–131.11. Beck R, Dickson U, Montgomery MD, Mitchell I. Hista-
mine challenge in young children using computerizedlung sounds analysis.
Chest
1992; 102: 759–763. 12. Spence DPS, Bentley S, Evans DH, Morgan MDL. Effect
of methacholine induced bronchoconstrictive on the spec-tral characteristics of breath sounds in asthma.
Thorax
1992; 47: 680–683.13. Sanchez I, Avital A, Wong I, Tal A, Pasterkamp H. Ac-
oustic
versus
spirometric assessment of bronchial respon-siveness to methacholine in children.
Pediatr Pulmonol
1993; 15: 28–35.14. Malmberg PL, Sorva R, Sovijärvi ARA. Frequency distri-
bution of breath sounds as an indicator of bronchocon-striction during histamine challenge test in asthmaticchildren.
Pediatr Pulmonol
1994; 18: 170–177.15. Rietveld S, Dooijes EH. Characteristics and diagnostic
significance of wheezes during exercise-induced airwayobstruction in children with asthma.
Chest
1996; 110:624–631.
16. Forgacs P. Noisy breathing.
Chest
1973; 63:Suppl, 38s–41s.
17. Rossi M, Perinti A, Pasquali G, Palatresi R, Barnabe R.Modifications induced by the respiration of a He 80% –O
2
20% mixture in recording pulmonary sounds. Proc15th Int Lung Sounds Conf, Veruno, Italy, 1991.
18. Ploy-Song-Sang Y, Martin RR, Ross WRD. Breath soundsand regional ventilation.
Am Rev Respir Dis
1997; 116:187–199.
19. Ploy-Song-Sang Y, Pare JAP, Macklem PT. Correlation ofregional breath sounds with regional ventilation in em-physema.
Am Respir Dis
1982; 126: 526–529.20. Ploy-Song-Sang Y, Dosman J, Macklem PT. Demonstra-
tion of regional phase differences in ventilation by breathsounds.
J Appl Physiol: Respir Environ Exerc Physiol
1979; 46: 361–368.21. Kraman SS. Determination of the site of production of
respiratory sounds by subtraction phonopneumography.
Am Rev Respir Dis
1980; 122: 303–309.
CONDITIONS
FOR
RESPIRATORY
SOUND
RECORDING
615
22. Sestini P, Panzardi G, Rossi M, Vagliasindi M. A newmethod for the objective evaluation of cough for longperiod of time. Proc 15th Int Lung Sounds Conf, Veruno,Italy, 1991.
23. Salmi T, Sovijärvi ARA, Brander P, Piirilä P. Long-termrecording and automatic analysis of cough using filteredacoustic signals and movements on static sensitive bed.
Chest
1988; 94: 970–975.24. Mussell MJ. The need for standards in recording and ana-
lysing respiratory sounds.
Med Biol Eng Comput
1992;30: 129–139.
25. Druzgalski C, Donnemberg RL, Campbell RM. Tech-niques of recording respiratory sounds.
J Clin Eng
1980;5: 321–330.
26. Kaisla T, Sovijärvi A, Piirilä P, Rajala HM, Haltsonen S,Rosqvist T. Validated method for automatic detection oflung sound crackles.
Med Biol Eng Comput
1991; 29:517–521.
27. Gavriely N, ed. with contribution by Cugell DM. BreathSounds Methodology. Boca Raton, FL, CRC Press, 1995.
28. Mussell MJ, Nakazono Y, Miyamoto Y. Effect of air flowand flow transducer on tracheal breath sound.
Med BiolEng Comput
1990; 28: 550–554.29. Dalmasso F, Prota R. Snoring: analysis, measurement, cli-
nical implications and applications.
Eur Respir J
1996; 9:146–159.
30. Nishimaki C, Hida W, Miki H, Shimizu Y, Inoue H, Tak-ishima T. Home sleep monitor of sleep apnea by nasalflow and tracheal sound recordings.
Am Rev Respir Dis
1987; 135: A40.31. Forgacs P, Nathoo AR, Richardson HD. Breath sounds.
Thorax
1971; 26: 288–295.32. Shykoff BE, Ploysongsang Y, Chang HK. Airflow and nor-
mal lung sounds.
Am Rev Respir Dis
1988; 137: 872–876.33. Bohadana AB, Kanga JF, Kraman SS. Does airway clo-
sure affect lung sound generation?
Clin Physiol
1988; 8:341–349.
34. Kraman SS. The relationship between airflow and lung
sound amplitude in normal subjects.
Chest
1984; 86:225–229.
35. Vanderschoot J, Schreur HJW. AR (q,v) modeling of nor-mal lung sounds.
Meth Inf Med
1994; 33: 24–27.36. Gavriely N, Kelly KB, Grotberg JB, Loring SH. Forced
expiratory wheezes are a manifestation of airway flowlimitation.
J Appl Physiol
1987; 62: 2398–2403.37. Vanderschoot J, Helistö P, Lipponen P, Piirilä P, Sovijärvi
ARA. Distribution of crackles on the flow-volume planein different pulmonary diseases.
Technol Health Care
1998; 6: 81–89.38. Nath AR, Capel LH. Inspiratory crackles: early and late.
Thorax
1974; 29: 223–227.39. Piirilä P, Sovijärvi RA, Kaisla T, Rajala HM, Katila
T. Crackles in patients with fibrosing alveolitis, bron-chiectasis, COPD, and heart failure.
Chest
1991; 99:1076–1083.
40. Dalmasso F, Guarene MM, Spagnolo R, Benedetto G,Righini G. A computer system for timing and acousticalanalysis of crackles: a study in cryptogenic fibrosing al-veolitis.
Bull Eur Physiopathol Respir
1984; 20: 139–144.
41. Al Jarad N, Strickland B, Bothamley G, Lock S, Logan-Sinclair R, Rudd RM. Diagnosis of asbestosis by a timeexpanded wave form analysis, auscultation and high reso-lution computed tomography: a comparative study.
Tho-rax
1993; 48: 347–353.42. Mahagnah M, Gavriely N. Breath sounds spectra during
nose and mouth breathing. Proc 18th Int Lung SoundConf, 1993.
43. Lessard CS, Wong WC. Correlation of constant flow ratewith frequency spectrum of respiratory sounds whenmeasured at the trachea.
IEEE Trans Biomed Eng
1986;33: 461–463.
44. Schreur HJW, Sterk PJ, Vanderschoot J, van Klink HCJ,van Vollenhoven E, Dijkman JH. Lung sound intensity inpatients with emphysema and in normal subjects at stand-ardised airflows.
Thorax
1992; 47: 674–679.
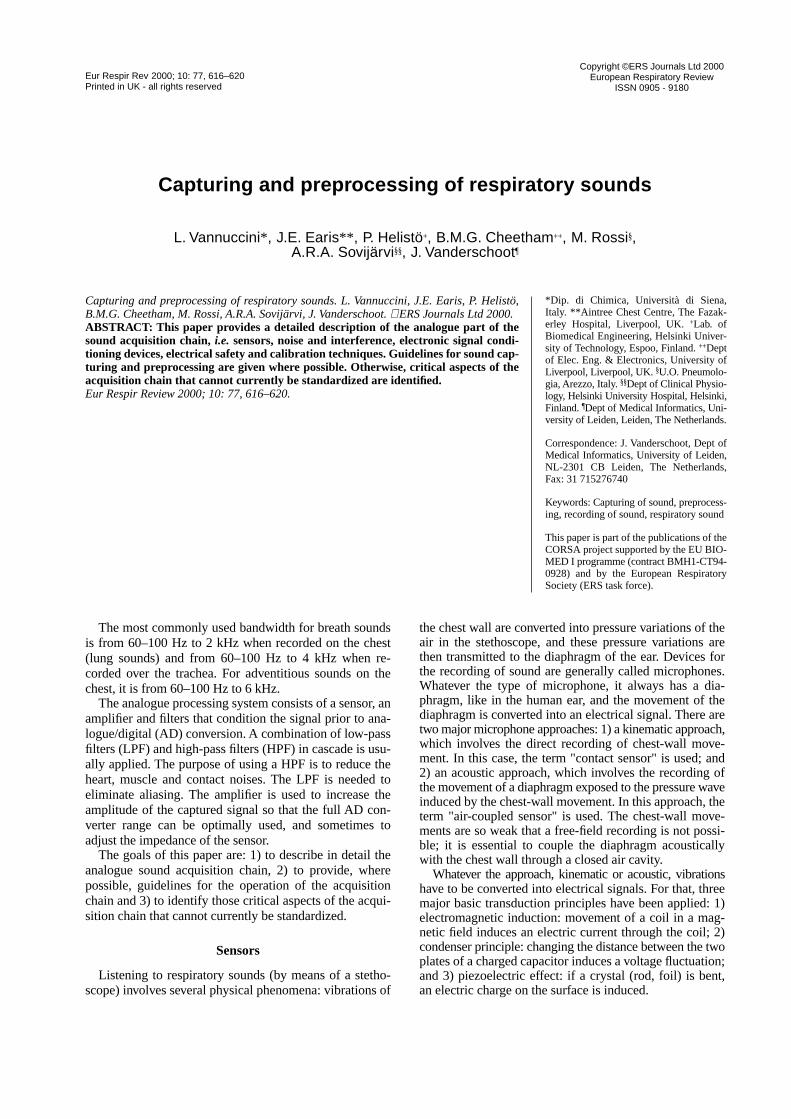
Eur Respir Rev
2000; 10: 77, 616–620Printed in UK - all rights reserved
Copyright ©ERS Journals Ltd 2000European Respiratory Review
ISSN 0905 - 9180
Capturing and preprocessing of respiratory sounds
L. Vannuccini
*
, J.E. Earis
**
, P. Helistö
+
, B.M.G. Cheetham
++
, M. Rossi
§
,A.R.A. Sovijärvi
§§
, J. Vanderschoot
¶
aa
The most commonly used bandwidth for breath soundsis from 60–100 Hz to 2 kHz when recorded on the chest(lung sounds) and from 60–100 Hz to 4 kHz when re-corded over the trachea. For adventitious sounds on thechest, it is from 60–100 Hz to 6 kHz.
The analogue processing system consists of a sensor, anamplifier and filters that condition the signal prior to ana-logue/digital (AD) conversion. A combination of low-passfilters (LPF) and high-pass filters (HPF) in cascade is usu-ally applied. The purpose of using a HPF is to reduce theheart, muscle and contact noises. The LPF is needed toeliminate aliasing. The amplifier is used to increase theamplitude of the captured signal so that the full AD con-verter range can be optimally used, and sometimes toadjust the impedance of the sensor.
The goals of this paper are: 1) to describe in detail theanalogue sound acquisition chain, 2) to provide, wherepossible, guidelines for the operation of the acquisitionchain and 3) to identify those critical aspects of the acqui-sition chain that cannot currently be standardized.
Sensors
Listening to respiratory sounds (by means of a stetho-scope) involves several physical phenomena: vibrations of
the chest wall are converted into pressure variations of theair in the stethoscope, and these pressure variations arethen transmitted to the diaphragm of the ear. Devices forthe recording of sound are generally called microphones.Whatever the type of microphone, it always has a dia-phragm, like in the human ear, and the movement of thediaphragm is converted into an electrical signal. There aretwo major microphone approaches: 1) a kinematic approach,which involves the direct recording of chest-wall move-ment. In this case, the term "contact sensor" is used; and2) an acoustic approach, which involves the recording ofthe movement of a diaphragm exposed to the pressure waveinduced by the chest-wall movement. In this approach, theterm "air-coupled sensor" is used. The chest-wall move-ments are so weak that a free-field recording is not possi-ble; it is essential to couple the diaphragm acousticallywith the chest wall through a closed air cavity.
Whatever the approach, kinematic or acoustic, vibrationshave to be converted into electrical signals. For that, threemajor basic transduction principles have been applied: 1)electromagnetic induction: movement of a coil in a mag-netic field induces an electric current through the coil; 2)condenser principle: changing the distance between the twoplates of a charged capacitor induces a voltage fluctuation;and 3) piezoelectric effect: if a crystal (rod, foil) is bent,an electric charge on the surface is induced.
Capturing and preprocessing of respiratory sounds. L. Vannuccini, J.E. Earis, P. Helistö,B.M.G. Cheetham, M. Rossi, A.R.A. Sovijärvi, J. Vanderschoot.
ERS Journals Ltd 2000.
ABSTRACT: This paper provides a detailed description of the analogue part of thesound acquisition chain,
i.e.
sensors, noise and interference, electronic signal condi-tioning devices, electrical safety and calibration techniques. Guidelines for sound cap-turing and preprocessing are given where possible. Otherwise, critical aspects of theacquisition chain that cannot currently be standardized are identified.
Eur Respir Review 2000; 10: 77, 616–620.
*Dip. di Chimica, Università di Siena,Italy. **Aintree Chest Centre, The Fazak-erley Hospital, Liverpool, UK.
+
Lab. ofBiomedical Engineering, Helsinki Univer-sity of Technology, Espoo, Finland.
++
Deptof Elec. Eng. & Electronics, University ofLiverpool, Liverpool, UK.
§
U.O. Pneumolo-gia, Arezzo, Italy.
§§
Dept of Clinical Physio-logy, Helsinki University Hospital, Helsinki,Finland.
¶
Dept of Medical Informatics, Uni-versity of Leiden, Leiden, The Netherlands.
Correspondence: J. Vanderschoot, Dept ofMedical Informatics, University of Leiden,NL-2301 CB Leiden, The Netherlands,Fax: 31 715276740
Keywords: Capturing of sound, preprocess-ing, recording of sound, respiratory sound
This paper is part of the publications of theCORSA project supported by the EU BIO-MED I programme (contract BMH1-CT94-0928) and by the European RespiratorySociety (ERS task force).
CAPTURING
OF
RESPIRATORY
SOUNDS
617
A dynamic microphone applies electromagnetic induc-tion in such a way that its output voltage is proportional tothe velocity of its diaphragm. This type of microphone isnot recommended because it has a narrow bandwidth andmay introduce distortion due to resonances of the movingcoil. An electret or condenser microphone applies the con-denser principle in such a way that its output voltage isproportional to the displacement of its diaphragm.
A piezoelectric microphone applies the piezoelectriceffect in such a way that the output voltage is proportionalto the displacement of its diaphragm with respect to itshousing. Remarkably enough, this sensor is mostly usedas a contact sensor: the diaphragm is directly applied tothe skin, without any intervening air cavity. Due to the dif-ference in inertia between the diaphragm and the housing,the diaphragm moves with respect to the housing, andtherefore deforms.
A piezoelectric accelerometer applies the piezoelectriceffect in such a way that the output voltage is proportionalto the acceleration of the whole sensor. Early applicationsused heavy-weight sensors; these resulted in a high sensi-tivity and a good signal-to-noise ratio. The disadvantagesdue to its heavy mass are mechanical loading of the chestwall, difficulties with attachment, and a low resonance fre-quency (well within the band of interest). A very-low-mass (1 g) piezoelectric accelerometer, has been appliedsuccessfully in the past, yet it may be so fragile that rou-tine clinical applications may be difficult.
Summarizing, it can be recommended that either a con-denser microphone coupled to the chest wall with an aircavity (condenser microphone), or a piezoelectric micro-phone is applied as a contact sensor (piezoelectric contactsensor). Further support for this recommendation can befound in Refs. [1–6]. Comparisons have been madebetween these two types of sensors. D
RUZGALSKY
et al.
[7]found that the piezoelectric sensors have a higher sensitiv-ity and are less influenced by the ambient noise than con-denser microphones, which show a larger frequencyresponse in a free-field measurement. In a more recentstudy, P
ASTERKAMP
et al.
[8] found a slightly differentresult concerning the frequency response of lung soundsfrom the chest. This is probably due to the use of a bell toattach the condenser sensor. It has been found [8] thatair-coupled and contact sensors, in the frequency range ofrespiratory signals, have a similar signal-to-noise ratio andspectral performance. Although both condenser micro-phones and piezoelectric contact sensors are displacementreceivers, the waveforms that they deliver are differentdue to the coupling differences. The criteria for selectionof a device might also include: size, average lifetime andmaintenance cost. The main disadvantages of both sensorsare: 1) piezoelectric sensors are very sensitive to move-ment artefacts, for example by the connecting wire, andtheir characteristics depend on the static pressure againstthe body surface [2], and they are brittle; and 2) condensermicrophones need mounting elements that change theoverall characteristics of the sound transduction.
Specifications
In this section, the minimal characteristics for a soundsensor are listed. IEC 179 is the standard for precision
sound level meters, but it refers to free-field measurementonly. A set of recommendations exists for sensors in pho-nocardiography [9]. General definitions of frequencyresponse (FR), dynamic range (DR) and distortions havebeen given elsewhere in this issue [10]. These definitionsare applicable to acoustic sensors also.
Frequency response
The frequency response (FR) must be flat in a fre-quency range that includes at least the actual band of res-piratory sounds. A maximum value for deviation can be 6dB. Microphones with a wide frequency range and smalldeviation are easy to find.
Dynamic range
Dynamic range (DR) is the difference between thegreatest and lowest acoustic pressures that a microphonecan capture. A high DR is required because of the shape ofthe power spectrum of respiratory sounds. D
RUZGALSKY
[7]suggested that the DR of microphones used for respiratorysounds should be greater than, or equal to, 40–50 dB; 50dB can be considered as the minimum DR. Moreover, DRof the sensor should match the dynamics of the AD con-verter being used, see Ref. [11]; therefore, we recommend60 dB as the dynamic range for the acoustic sensor.
Sensitivity
Sensitivity (
S
) is defined as the voltage generated by themicrophone when the input sound pressure is 0.1 Pa (1
µ
bar) at a frequency of 1 kHz.
S
must be high when cap-turing low-intensity sounds. The higher it is, the morenoiseless the recording can be. The effective sensitivity isdetermined by the signal-to-noise ratio. The stability of
S
is more important than its numerical value; according tothe statement of the International Electrotechnical Com-mission (IEC) no.179,
S
must be steady for varying fre-quencies and be independent on variations of staticpressure or sound direction. A minimum value cannot begiven. A typical value for
S
of a sound sensor is 1 mV/Pa.
Signal-to-noise ratio
The signal-to-noise ratio (SNR) is the ratio between theoutput voltage of the microphone receiving a signal of 1Pa at 1 kHz and the noise,
i.e.
the output voltage whenthere is no input signal. The SNR of the sensor cannot belower than that of the other parts of the signal chain. Dur-ing lung sound capture, the microphone is not used in itsnominal condition attached to the chest, its characteristicsare modified [8]. The recommendation is to use micro-phones with the highest possible SNR [7, 12]. A micro-phone with a SNR=60 dB, with
S
=1 mV·Pa
-1
on a load of200
Ω
is acceptable for general purposes. Such a micro-phone would introduce a noise of about 1
µ
V. Micro-phones with higher SNRs are recommended for lung-sound capturing. Microphones of a higher quality reachSNR values below 70 dB.
618
L
.
VANNUCCINI
ET
AL
.
P
ASTERKAMP
et al.
[8] have performed noise measure-ments
in situ
, with different microphones attached to thechest. The noise was determined when the airflow was"zero" (0–0.1 L·s
-1
). They have found that the SNR of thewhole system was lower than the free-field specificationsprovided by the manufacturer (from 16.4–42 dB) and thatit varies from subject to subject. SNR in an "
in situ
" meas-urement should not be under 20 dB in the frequency rangeof 100–500 Hz. The recommendation is to report the spec-tral characteristics of the noise at zero flow.
Harmonic distortion
Harmonic distortion is due to the non-linearity of thetransducer. If the input signal is a sinusoidal wave at fre-quency
f
, then, with a linear transducer, a sinusoidal elec-trical signal at the same frequency is obtained. If thetransducer is not linear, sinusoids with frequencies that aremultiples of
f
(harmonics) are obtained. The amplitude ofharmonics generally decreases with increasing frequency.The total harmonic distortion (THD) is a measure of howmuch the input sinusoid is affected by harmonic distor-tion. It is defined as
THD
√
=
D
2
+
D
3
+ … (1)
where
D
2
,
D
3
, ... are the relative amplitudes of each har-monic. The following is the relation between the outputpower (
P
) and the power of the fundamental harmonic(
P
1
):
P
= (1 + THD
2
)
P
1
(2)
If THD of the fundamental harmonic is 10%, then
P
=1.01 times
P
1
, which shows that the power output is only1% higher than the fundamental. In this case, the contribu-tion of higher harmonics to the spectrum is negligible.Data sheets do not always give this specification of themicrophone; they often give the sound pressure value forwhich distortion is greater than a prefixed value (generally0.5%).
Attachment
Coupling and fixing methods
The coupling depends on the kind of device used. Inparticular, condenser microphones are air-coupled, and pie-zoelectric transducers are contact sensors.
Air-coupled sensors.
These sensors are coupled to thebody surface by a closed cavity in which sounds propa-gate. In this way, the vibrations can move the membrane,and the sound can be captured. The presence of this cavityaffects the frequency characteristics of the transmissionbetween the body and the microphones. In particular, aresonance can disturb the flatness of the frequency respon-se. These effects depend on the size, shape and material ofthe sensor. The cavity can be designed to make sure thatits resonance is out of the frequency range of the signal[12–15]. Some work has been done on the effects of thedepth, width and shape of the chamber on the frequencyresponse [14, 15]. It has been found that the chamber must
be shallow (a few millimetres); the width has no effectsunder 500 Hz. Chambers with 10 and 15 mm of diameterare optional between 500 and 1,000 Hz. Conical couplersprovide 5–10 dB more sensitivity than cylindrical cou-plers.
A vent in the chamber can be used to equalize the inter-nal pressure to the ambient one, but the vent transmitsambient noise into the microphonic chamber. The ventmust have a high acoustic impedance by being narrow andlong.
The recommended couplers have a depth of 2.5–5 mmand a conical shape 10–15 mm in diameter at the skin.They can be vented with a tube no wider than 0.35 mm.The sensors can be fixed to the body in different ways.The force of application can alter the characteristic of theair in the chamber, but this effect is minimized by the vent.Sensors can be attached by hand, by an elastic belt or by aself-adhesive coupler. In this last case, the vent is less use-ful. The belt cannot always be used, for example, duringtracheal sound capturing.
Contact sensors
Piezoelectric contact sensors are designed to be useddirectly on the chest without a compressible air buffer be-tween the skin and the sensor. They do not introduce thedistortion due to the coupling chamber, but they haveother kinds of problems, mainly the dependence on theforce of application on to the chest wall. This should bekept constant among different measurements to allow acomparison of data and also during a single acquisition.This condition can not be easily maintained by hand.Also, the use of the elastic belt introduces variations due tothe movement of the thorax during respiration. The use ofan adhesive ring may be a solution to the problem.
Analogue signal processing
Noise and interference
The recording of respiratory sounds is affected by envi-ronmental interference (
e.g.
acoustic and electromagneticnoises) and by chest-wall movement, muscle sounds andheart sounds. Environmental noise is a particular problemwith air-coupled sensors and can be minimized by roominsulation and by shielding caps. However, little can bedone to reduce environmental acoustic noise that reachesthe sensor through the body. Muscle and heart noise canbe reduced by filtering techniques, as discussed later on.The recording equipment should be as quiet as possible inorder to achieve a SNR of at least 20 dB in the frequencyband of interest during breath holding.
Immunity to electromagnetic fields
Shielding from electrical interference can be consideredas part of the analogue signal processing as it may affectsignal quality. A particular problem is the 50–60 Hz
22
CAPTURING
OF
RESPIRATORY
SOUNDS
619
alternating current power line. In order to minimize thisinterference, shielded twisted pair or coaxial cables arerecommended, while ground loops should be avoided. How-ever, coaxial cable might induce signal distortion due to apiezoelectric effect.
Amplifier
The amplifier is described by its frequency bandwidth,noise and dynamic range; they should have the followingproperties: 1) the noise of the amplifier should be belowthat of the sound sensor; 2) the SNR of the amplified sig-nal should be approximately 60 dB in the frequency rangeof interest (SNR of lung sound measurement is usuallyaround 40 dB); 3) the amplifier must be used in accord-ance with its specified maximal voltage or current output(
i.e.
must not be overloaded by excessive amplification orcapacitive loading).
Instrumentation amplifiers are recommended for respi-ratory sounds as they have high input resistance (>100M
Ω
) and extremely high common mode rejection ratio (ofthe order of 100 dB). The latter characteristic is particu-larly important in the amplification of small differentialsignals because the common mode signal can be severalorders of magnitude greater than the differential mode sig-nal.
Filtering
High pass filtering (HPF).
The HPF with a cut-off fre-quency of 60 Hz and a slope greater than 18 dB·oct
-1
isgenerally used in respiratory sound analysis to reducelow-frequency distortion to the signal. Such distortionsare typically produced by changes in the contact pressureof the sensor cup due to patient or sensor motion, by car-diovascular sounds, muscle noise, and external low-fre-quency noise. Without HPF, the dynamic range of therespiratory sound signal may be reduced due to saturationof the AD converter by low-frequency heart and musclesounds. Pass- band ripple is eliminated by the choice ofgain responses. Moreover, it is recommended that linearphase or delay equalized frequency responses be used, asincorrect high-pass filtering can be particularly damagingto waveforms containing crackles or other transient typesignals with a wide bandwidth and short duration [16]. Anapproximately linear phase response can be obtained byusing Bessel filters or by cascading the HPF with a delayequalization stage (allpass filter). In this case, the HPFshould be a Butterworth filter because of its flat frequencyresponse (
i.e.
without ripple). These analogue filters mustbe implemented as active circuits, and a particular hybridtechnology can be used to implement these devices:switched-capacitor filters. These filters are analogue sam-pled-data systems, which are recommended because theyexist in monolithic form and are programmable.
Low pass filtering (LPF).
LPF is used to eliminate aliasingof the digitized signal. Aliasing occurs when the signal
contains frequencies above half the sampling frequency,
f
s
(Nyquist frequency) [11]. The recommended LPF musthave a -3 dB cut-off at the upper frequency of the signaland provide at least 24 dB of attenuation at that frequencyproducing aliasing in the band of the signal (see the exam-ple in Ref. [11]). Moreover, no bandpass ripple is allowed(
e.g.
Butterworth filter). The minimum for the order of thefilter depends on
f
s
: the higher the
f
s
, the smaller the ordercan be. Details on
f
s
and the order can be found in Ref.[11]. Sometimes, anti-aliasing filtering is not needed inthe analogue part of the chain because the AD board hasits own filter. However, the behaviour of the filter is oftenunknown, and the testing of the frequency response is rec-ommended using the procedure described in Ref. [17]. Ifthe analogue signal processing chain is not known ac-curately or if there is any doubt that the signal may bedistorted, the whole system should be calibrated by theprocedure described in Ref. [11].
Electrical safety
Although no specific standard for safety in biomedicalsounds recording exists, devices for respiratory soundscapturing must conform to EN 60 601-1, concerningsafety in electromedical devices. The whole chain of ac-quisition (sensor, amplifier filters, AD converter, computer)must be designed to prevent the risk of direct and indirectcontacts during normal use and under first damage con-ditions [18]. The sensor, brought into contact with the pa-tient, is in "applied part", and it can be a critical aspect forsafety. The recommended sensors do conform to this normsince they are passive transducers,
i.e.
they do not absorbcurrent from an external source. The biasing voltage islow and comes from a battery (the "low safety voltage"must be less than 60 V d.c.); the condenser, if present,must have a very low capacity (from 20 to 100 pF). Theonly current that might reach the patient is a dispersioncurrent coming from the amplifier, which is avoided if theamplifier conforms to the TEC guideline [18].
Calibration procedures and system response
Although the absolute magnitudes of respiratory soundsare not very important, the relative magnitude and the shapeof the frequency components are of great importance,and a method for calibration and verification of the systemresponse is needed. However, there is no ideal referencesensor or reference input signal available to calibrate thesystem. G
AVRIELY
[13] has developed a system to calibratecontact sensors, which is very complicated and is not eas-ily used in a clinical setting. Another approach is to send areference signal to the sensor through a simulated chest.
Summary of recommendations
A summary of recommendations for piezoelectric-or-condenser-type sensors is presented in table 1.

620
L
.
VANNUCCINI
ET
AL
.
References
1. Fenton TR, Pasterkamp H, Tal A, Chernick V. Automatedspectral characterization of wheezing in asthmatic chil-dren.
IEEE Trans Biomed Eng
1985; 32: 50–55.
2. Mussell MJ. The need for standards in recording and ana-lysing respiratory sounds.
Med Biol Eng Comput
1992;30: 129–139.
3. Druzgalski CK. Techniques of recording respiratorysounds.
J Clin Eng
1980.4. Mahagnah M, Gavriely N. Repeatability of measure-
ments of normal lung sounds.
Am J Respir Crit Care Med
1994; 149: 477–481.5. Gavriely N, Palti Y, Alroy G. Spectral characteristics of
normal breath sounds.
J Appl Physiol
1981; 50: 307–314.6. Hallgrenat RC. Breath sounds: development of a system
for measurement & analysis.
J Clin Eng
1982; 7.7. Ploysongsang Y, Iyer VK, Ramamoorthy PA. Reproduci-
bility of the vesicular breath sounds in normal subjects.
Respiration
1991; 58: 158–162.8. Kraman SS. The forced expiratory wheeze. Its site of ori-
gin and possible association with lung compliance.
Res-piration
1983; 44: 189–196.9. Charbonneau G, Racineux JL, Sudraud M, Tuchais E.
Digital processing techniques of breath sounds for objec-tive assistance of asthma diagnosis.
IEEE Trans BiomedEng 1982; 29: 736–738.
10. Pasterkamp H, Kraman SS, DeFrain PD, Wodicka GR.Measurement of respiratory acoustical signals. Compari-son of sensors. Chest 1993; 104: 1518–1525.
11. Groom D. Standardization in phonocardiography. Themicrophone pickup. Cardiology 1970; 55: 129–135.
12. Cheetham BMG, Charbonneau G, Giordano A, Helisto P,Vanderschoot J. Digitisation of data for respiratory soundrecordings. Eur Respir Rev 2000; 10: 77, 621–624.
13. Gavriely N. Breath Sounds Methodology. Boca Raton,FL, CRC Press, 1995.
14. Wodicka GR, Kraman SS, Zenk GM, Pasterkamp H.Measurement of respiratory acoustic signals. Effect ofmicrophone air cavity depth. Chest 1994; 106: 1140–1144.
15. Kraman SS, Wodicka GR, Oh Y, Pasterkamp H. Measure-ment of respiratory acoustic signals. Effect of micro-phone air cavity width, shape, and venting. Chest 1995;108: 1004–1008.
16. Katila T, Piirilä P, Kallio K, Paajanen E, Rosqvist T, Sov-ijärvi AR. Original waveform of lung sound crackles: acase study of the effect of high-pass filtration. J ApplPhysiol 1991; 71: 2173–2177.
17. Sun XQ, Cheetham BM, Evans KG, Earls JE. Estimationof analogue pre-filtering characteristics for CORSA stan-dardisation. Technol Health Care 1998; 6: 275–283.
18. IEC 601-1 Concerning Safety in Electromedical devices.1988.
Table 1. – Summary of recommendations*
Sensor specifications Frequency response
Dynamic range Sensitivity
Signal-to-noise ratio Directional characteristicCoupling Piezoelectric contact Condenser air-coupled
Fixing methods Piezoelectric Condenser
Noise and interferences Acoustic
Electromagnetic
Amplifier Frequency response Dynamic range Noise
High-pass filtering
Low-pass filtering
Flat in the frequency range of the soundMaximum deviation allowed 6 dB>60 dBMust be independent of: frequency; static pressure; and sound direction>60 dB (S=1 mV·Pa-1)Omnidirectional
Shape: conicalDepth: 2.5–5 mmDiameter at skin: 10–25 mmVented
Adhesive ringEither elastic belt or adhesive ring
Shielded microphonesProtection from mechanical vibrationsShielded twisted pair or coaxial cable
Constant gain and linear phase in the band of interest>60 dBLess than that introduced by the sensorCut-off frequency 60 HzRoll-off >18 dB·octave-1
Phase as linear as possibleMinimized rippleCut-off frequency above the upper frequency of the signalRoll-off >24 dB·octave-1
Minimized ripple
*: applied for piezoelectric or condenser sensors

Eur Respir Rev
2000; 10: 77, 621–624Printed in UK - all rights reserved
Copyright ©ERS Journals Ltd 2000European Respiratory Review
ISSN 0905 - 9180
Digitization of data for respiratory sound recordings
B.M.G. Cheetham
*
, G. Charbonneau
**
, A. Giordano
+
, P. Helistö
++
, J. Vanderschoot
§
aa
The purpose of this paper is to discuss the digitizationof particular types of sound,
i.e.
lung sounds as would beconventionally monitored by doctors using the stetho-scope. Related problems of data and file formats for thedigital storage and the transmission of these sounds overtelecommunication networks will not be addressed indetail. Background material for this chapter is comprehen-sively covered [1–4]. The advantage of representing pulmo-nary signals in digital form is worth restating so that wecan take care to preserve these when proposing standards.
Advantages of digitization
1) A high-quality representation of the sound is obtaina-ble, which is potentially more accurate than an analoguerecording.2) A digital representation is more permanent than a tape-recording, for example.3) Data stored digitally can be easily accessed.4) Digital records may be conveniently documented andlabelled.5) Data may be duplicated without loss of quality.6) Signal data are compatible with other data,
e.g.
patientrecords.7) Data are easily communicated from one establishmentto another.8) The characteristics of a recording may be preciselydefined (recording levels, bandwidth,
etc
.)9) Digitized signals are compatible with digital signalprocessing techniques for analysis, making comparisons,statistical surveys, drawing graphs,
etc
.
Sampling frequency
A sampling frequency specification must depend on thetype of signal being studied and the characteristics of theanalogue pre-processing circuitry. Perhaps the most im-portant consideration is the bandwidth of the signal.
A survey of the literature [5] reveals that in the study ofadventitious sounds, much information about wheezes hasbeen found within frequency bands below about 2 kHz.The upper limit has often been placed well below 2 kHz.A bandwidth extending up to 2 kHz would thereforeappear to have been sufficient for many studies of wheeze,though there is evidence that useful information may befound at frequencies higher than 2 kHz. If a 2-kHz maxi-mum frequency is taken as a working assumption, then thesampling rate should be above 4 kHz.
Although a 2-kHz bandwidth may also be reasonablefor many studies of other adventitious sounds, such ascrackles, the frequency content may extend beyond 2 kHz.There is likely to be useful information in crackles beyond2 kHz, and upper airway sounds such as cough, snore andspeech-like sounds certainly contain significant energybeyond 4 kHz and even beyond 10 kHz.
Clearly, a range of different recommendations for thesampling frequency must be considered in view of the dif-ferent applications. Since there are no other theoreticalconstraints, there is a broad range in which the samplingfrequency can be chosen for a given application. There ap-pears to be no theoretical reason for preferring the samplingfrequency used by any particular researcher. Therefore, it
Digitization of data for respiratory sound recordings. B.M.G. Cheetham, G. Charbonneau,A. Giordano, P. Helistö, J. Vanderschoot. ©ERS Journals Ltd 2000.
ABSTRACT: This paper provides for a detailed discussion of the issues concerningdigitization of respiratory sound recordings. Most important are guidelines for theselection of sampling frequency, filtering, analogue/digital resolution, analogue/dig-ital input range, test and calibration procedures. It is not the goal of this paper topresent standards for the data exchange format.
Eur Respir Rev 2000; 10: 77, 621–624.
*Dept of Elec Eng. & Electronics, Universityof Liverpool, Liverpool, UK. **Institutd'Electronique Fondamentale, UniversitéParis-Sud, Orsay Cedex, France.
+
Serviziodi Bioingegneria, Clinica del LavoroFoundation, Veruno, Italy.
++
Lab. of Bio-medical Engineering, Helsinki Universityof Technology, Espoo, Finland.
§
Dept ofMedical Informatics, University of Lei-den, Leiden, The Netherlands.
Correspondence: J. Vanderschoot, Dept ofMedical Informatics, University of Leiden,NL-2301 CB Leiden, The Netherlands.
Keywords: Digitization of sound, respira-tory sounds
This paper is part of the publications of theCORSA project supported by the EUBIOMED I programme (contract BMH1-CT94-0928) and by the European Respira-tory Society (ERS task force).

622
B
.
M
.
G
.
CHEETHAM
ET
AL
.
is useful to investigate the applicability of existing com-mercial standards.
A standardized sampling frequency applied in manyindustry standard sound facilities, for example for CDformats, is 44.1 kHz. In principle, this accommodates asignal bandwidth of 20 kHz, which is rather high forpulmonary sounds. Application of a universal 44.1 kHzsampling rate standard for the digitization of pulmonarysounds could result in a waste of digital storage and, per-haps more importantly, processing capacity for manyapplications. However, there are clear advantages in ado-pting sub-multiples of 44.1 kHz,
i.e
. 22.05, 11.025 or5.5125 kHz. Many researchers have been using suchstandards [5].
When the sampling rate is 11.025 kHz, any input signalcontent above 9.025 kHz will cause aliasing in the fre-quency band 0 Hz to 2 kHz. This signal content must beeffectively removed by an "anti-aliasing" low-pass filterbefore digitization. If the anti-aliasing filter is an analoguelow-pass filter with 3-dB cut-off frequency at 2 kHz, andat least 24-dB attenuation is required for any aliasing, theorder of the filter can be as low as two. A fourth-orderButterworth low-pass filter with a cut-off frequency of 2kHz would give 52-dB attenuation at 9.025 kHz.
When the sampling rate is 5.125 kHz, any input signalcontent above 3.125 kHz will cause aliasing distortion inthe frequency band 0 Hz to 2 kHz. If the analogue low-pass filter with 3-dB cut-off frequency at 2 kHz is requiredto have at least 24-dB attenuation at 3.125 kHz and above,the order of the filter must be at least six. A fourth-orderButterworth low-pass filter with a cut-off frequency of 2kHz would give only about 16-dB attenuation at 3.125kHz.
For current studies, there appear to be many advantagesin adopting a standard of 11.025 kHz as the preferredsampling frequency. Among these advantages are the factthat this sampling frequency is accommodated by anextremely wide range of commercial and relatively inex-pensive equipment, it allows a relatively relaxed analogueanti-aliasing filtering specification to be adopted, and itdoes not make excessive demands on digital storagecapacity. Where storage capacity is at a premium, or pos-sibly transmission capacity (over the internet for exam-ple), a standardized decimation strategy for reducing thesampling rate, digitally, to say 5.125 kHz could be used.
It is possible that researchers may wish to extend thebandwidth of interest to 4 kHz or even higher for studyinglower-airways phenomena not so far widely recognized.Such bandwidths will clearly be of interest in the study ofupper-airways sound. In these cases, it is recommendedthat sampling rates of 22.05 and 44.1 kHz be adopted. Fora 4-kHz bandwidth with a sampling rate of 22.05 kHz, asecond-order Butterworth low-pass filter (with 3-dB cut-off frequency at 4 kHz) would attenuate any aliased com-ponents by at least 24 dB; fourth order would give at least52 dB attenuation. For an 8-kHz bandwidth, it may be bestto use a sampling rate of 44.1 kHz with second-order (atleast 24 dB attenuation of aliasing) or fourth-order (atleast 52 dB) Butterworth low-pass analogue pre-filters.
Digitization of airflow-signal
For practical reasons, the airflow-signal during breathingwill normally be digitized at the same sampling frequencyas the sound. However, the analogue pre-processing mustbe different in that a high-pass filter should not be appliedto the flow signal whose frequency content may beassumed to be band-limited well below 50 Hz. The 3-dBcut-off frequency of the analogue low-pass anti-aliasingfilter can therefore be as low as 50 Hz. Alternatively, andperhaps more conveniently, the same low-pass filter speci-fication used for the sound signal may be used, therequired low-pass anti-aliasing filtering being carried outdigitally. Once digitized at say 11.025 kHz, the samplingrate of the flow signal may be reduced by decimation tosay 551.25 Hz by omitting 19 samples out of every 20. Ifthe signal contains noise above 200 kHz, it may bereduced by low-pass filtering prior to the decimation proc-ess. The signal should be digitally low-pass-filtered with a3-dB point at 20 Hz and decimated to a sampling rate of110.25 Hz by omitting four samples out of every five. Thissampling rate has been recommended as it is close to the100 Hz used by many researchers and is a sub-multiple of11.025 kHz.
In some systems, it may be difficult or undesirable toeliminate a high-pass filter from the channel sampling theflow signal. In this case, the flow-signal may be amplitudemodulated (large carrier) on to say a 3-kHz carrier. A sim-ple envelope detection algorithm may be used to digitallydemodulate the flow signal, which is then filtered and dec-imated as described above.
Analogue-to-digital converter resolution(quantization error)
An ADC resolution of at least 12 bits is normally rec-ommended for the digitization of lung sounds. In princi-ple, this gives a dynamic range of about 35 dB forGaussian-like signals with a signal-to-quantization noiseratio (SQNR) of at least 30 dB. (This is the ratio of thelargest signal power that can be accommodated withoutoverflow to the smallest signal power with a signal-to-quantization ratio of at least 30 dB.) Uniform quantizationis assumed.
There are now strong reasons for adopting a standard of16 bits for the ADC resolution. With highly accurateequipment, this allows a 59-dB dynamic range (with atleast 30-dB SQNR), though in practice, less expensivecommercial equipment will not achieve this accuracy.Nevertheless, the adoption of a 16-bit ADC word lengthconforms to a common commercial standard for uniformquantization and should make the achievement of true 12-bit resolution, and a little more, readily achievable in prac-tice.
It is recommended that the 16-bit samples be stored asfollows: two bytes per sample, each pair of bytes repre-senting a 16-bit signed integer in the range -32,768 to32,767. The least significant byte is first, followed by themost significant byte (large endian) 16-bit "two's comple-ment" form, is used for the 16-bit signed integer.
DIGITIZATION
OF
RESPIRATORY
SOUNDS
623
Note that 16-bit two's complement can be converted to16-bit "offset binary" (another common standard) or viceversa simply by negating the most significant (or "sign"bit). Offset binary is a representation which maps therange (-32,768 to 32,767) to (0–65,535) by adding 32,768to all integers.
The use of professional multi-channel data acquisitioncards with 12-bit analogue-to-digital conversion (ADC) iswidespread and quite satisfactory as the quality of thesecards is generally very high. It is recommended that the12-bit integers obtained be converted to 16-bit integers in16-bit two's complement form occupying the most signifi-cant 12 bits of the available 16, the least significant fourbits being made zero.
Input gain control characteristics
If the range of the ADC is assumed to be -
V
to +
V
, andthe input signal is assumed approximately Gaussian withzero mean and RMS value,
S
, overflow may be consideredsufficiently unlikely if
S
is less than about
V
/4 (four stand-ard deviations away from the norm are considered "suffi-ciently unlikely" here). Hence, the maximum allowed signalpower should be about
V
2
/16, and the maximum signal-to-quantitation noise ratio (SQNR) will be about 65 dB. Theinput amplifier should therefore be set to produce an ADCinput with a maximum power of
V
2
/16, and a minimumpower of 35 dB less than this.
Inter-channel delay
This depends on the sampling equipment used andshould not cause any difficulty as long as it is known. Thedelay can be made zero using a "fractional sampling inter-val delay" method, accomplished with a Finite ImpulseResponse (FIR) digital filter to each delayed channel.
Verification (test) procedures
Procedures are suggested for verifying that the recom-mended standards are being adhered to. The use of a 600-Hz (say) sinusoidal test signal is recommended with a testprogram running on the computer. The test programshould be capable of displaying a section of the capturedtime-domain waveform, performing a 1,024-point Han-ning windowed FFT (Fast Fourier Transformation) anddisplaying the resulting power spectrum. An average of alarge number of such power spectra should also be a dis-play option. A sinusoidal amplitude of up to
V
should notproduce any visible overload distortion (clipping or wrap-around). In principle, the average of a number of powerspectra with a sinusoid of amplitude say
V
/128 (minimumto give a SQNR of about 30 dB) should produce a charac-teristic power spectrum with a noise floor that is flat andabout 60 dB lower than the frequency sample at 600 Hz.The graph obtained in practice should be recorded as anindication of how close to the ideal the system is.
It is also recommended that a range of higher-frequencysine-wave measurements be made to evaluate and verifythe effect of the anti-aliasing input filters.
Calibration procedures
Interesting problems arise in relation to the characteri-zation of the frequency response of the analogue pre-fil-ters that precede the digitization process. This filteringmay be realised partly by components on a commercialacquisition card and partly by custom-designed externalanalogue equipment. For various reasons, the precisedetails of the pre-filters may not be known and may evenbe variable due, for example, to temperature variations,impedance matching and programmability. The low-passanti-aliasing filter characteristics are not likely to be toocritical, especially when a sampling rate is used that ishigh enough to allow a relaxed specification. However, itis the practice, particularly when analysing adventitiouslung sounds, to include a high-pass analogue filter, with acut-off frequency typically between 50 and 100 Hz, toremove heart sounds and extraneous microphone pick-upthat could otherwise cause non-linearities due to overloadand amplifier clipping. Further, it is not unreasonable forsome experimental work to use commercial "sound cards"for lung-sound digitization, and such cards, being prima-rily designed for speech and music, generally include ahigh-pass filter whose frequency response may not bereadily ascertained.
The effect of the high-pass filter may be considerable.The gain response will strongly affect spectrographs, forexample. Also, non-linearities in the phase response willaffect the time-domain wave shapes, and this may affectmeasurements made of crackles, for example. The lung-sound researcher, therefore, needs a means of measuringand documenting the frequency response, particularly ofthe high-pass filter. A calibration procedure is requiredthat is easily carried out using laboratory equipment read-ily available to all researchers. The frequency responsemust be determined solely from the response of the pre-filters to some agreed analogue test signal. This pre-filterresponse will be stored in a computer file in digitizedform. The test signal itself will be assumed to be unavaila-ble because digitizing it would require a second channelthat would also have a partially unknown analogue filter.Further, it is assumed that the test signal must be capableof being generated from an unsophisticated standard labo-ratory function generator so that all researchers can easilycarry out the test procedure. The test signal can thereforebe specified only in general terms. The use of a Gaussianwhite noise source as an analogue test signal is ruled outby the above specification if the phase response of theinput filter is to be measured as well as the gain response.This is because an exact version of the source would beneeded for the phase response analysis.
Four possible solutions to this problem have beeninvestigated and are described in [6]. It was concludedthat the "square wave response method" [6] is satisfactoryfor the measurements required. This method is based onthe discrete Fourier transform (DFT) analysis of the res-ponse of the pre-filter to a complete cycle of a 1 Hz squarewave. Full details will be published separately.
Summary of recommendations
1) Sampling frequency for sound channel:

624
B
.
M
.
G
.
CHEETHAM
ET
AL
.
main 11.025 kHz;subsidiary 5.5125, 22.05, 44.1 kHz.2) Anti-aliasing analogue filter for main recommendation:fourth-order Butterworth low-pass filter with 3-dB cut-offfrequency at 2 kHz. The cut-off frequency must be incre-ased to 4 or 8 kHz for subsidiary recommendations of22.05 or 44.1 kHz, respectively. Digitally low-pass filter-ing to 2 kHz or below before decimating to 5.5125 kHz.3) Sampling frequency for flow channel: as for soundchannel.4) Filtering and decimation for flow signal: digitally low-pass filtering to 20 Hz and decimation to achieve a110.25-Hz sampling frequency.5) Word length: 16 bits per channel, two's complement,large endian.6) Given the ADC voltage range -
V
to +
V
, the maximumtrue signal power should be about
V
2
/16 squared volts, or101og
10
(
V
/4) dB as measured by a "true RMS" meter.7) The inter-channel delay should be known.8) Verification procedures should be applied to check thatclipping/overload will not occur, that channel noise or
pick-up is not excessive, and that the anti-aliasing filtersare working correctly.9) Calibration procedures are available for determiningthe gain and phase responses of analogue pre-conditioningfilters and should be used.
References
1. Oppenheim A, Willsky AS, Nawab SH. Signals and Sys-tems, Upper Sadde River, NJ, Prentice-Hall, 1996.
2. Lynn PA. Electronic Signals and Systems, London, Mac-millan, 1986.
3. Brigham EO. The Fast Fourier Transform and its Appli-cations, Engelwood Cliffs, NJ, Prentice-Hall, 1988.
4. Chen WK. Passive and Active Filters, New York,Wiley,1986.
5. Sovijärvi ARA, Malmberg LP, Charbonneau G, Vander-schoot J, Dalmasso F, Earis JE. Characteristics of breathsounds and adventitious respiratory sounds.
Eur RespirRev
2000; 10: 77, 591–596.6. Sun XQ, Cheetham BMG, Evans KG, Earis JE. Estima-
tion of analogue prefiltering characteristics for CORSAstandardisation.
Technol Health Care
1998; 6: 275–283.
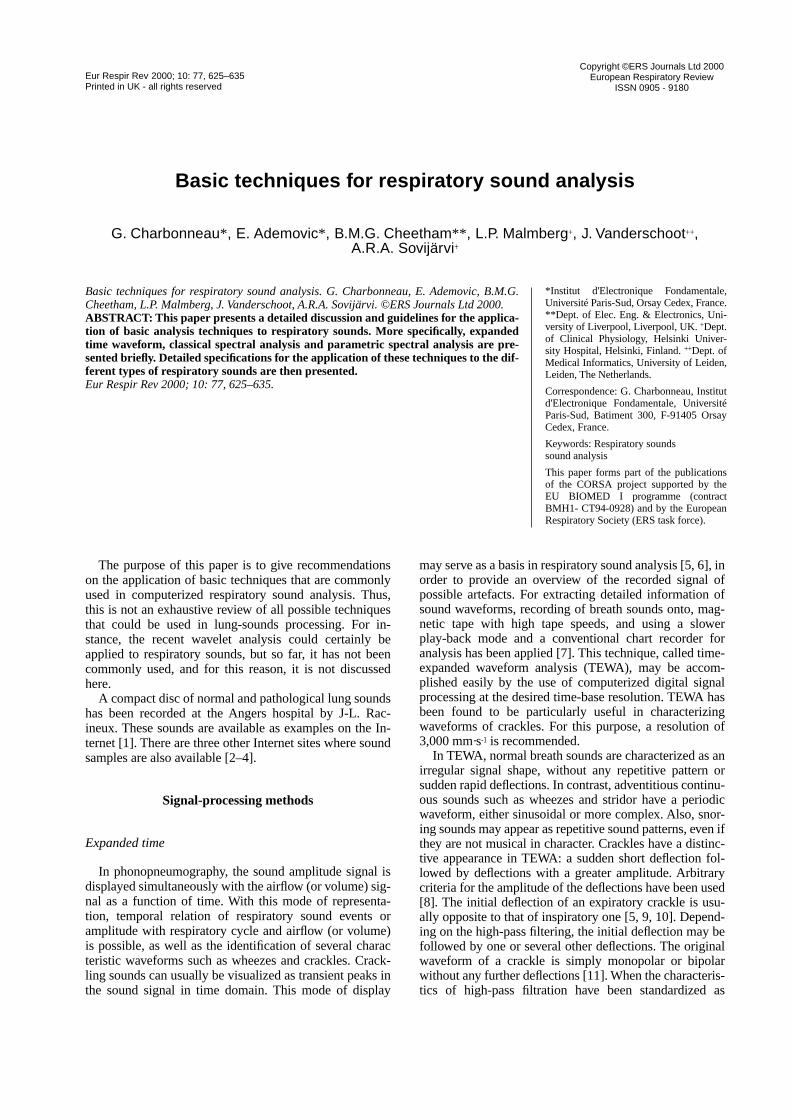
Eur Respir Rev
2000; 10: 77, 625–635Printed in UK - all rights reserved
Copyright ©ERS Journals Ltd 2000European Respiratory Review
ISSN 0905 - 9180
Basic techniques for respiratory sound analysis
G. Charbonneau
*
, E. Ademovic
*
, B.M.G. Cheetham
**
, L.P. Malmberg
+
, J. Vanderschoot
++
, A.R.A. Sovijärvi
+
The purpose of this paper is to give recommendationson the application of basic techniques that are commonlyused in computerized respiratory sound analysis. Thus,this is not an exhaustive review of all possible techniquesthat could be used in lung-sounds processing. For in-stance, the recent wavelet analysis could certainly beapplied to respiratory sounds, but so far, it has not beencommonly used, and for this reason, it is not discussedhere.
A compact disc of normal and pathological lung soundshas been recorded at the Angers hospital by J-L. Rac-ineux. These sounds are available as examples on the In-ternet [1]. There are three other Internet sites where soundsamples are also available [2–4].
Signal-processing methods
Expanded time
In phonopneumography, the sound amplitude signal isdisplayed simultaneously with the airflow (or volume) sig-nal as a function of time. With this mode of representa-tion, temporal relation of respiratory sound events oramplitude with respiratory cycle and airflow (or volume)is possible, as well as the identification of several characteristic waveforms such as wheezes and crackles. Crack-ling sounds can usually be visualized as transient peaks inthe sound signal in time domain. This mode of display
may serve as a basis in respiratory sound analysis [5, 6], inorder to provide an overview of the recorded signal ofpossible artefacts. For extracting detailed information ofsound waveforms, recording of breath sounds onto, mag-netic tape with high tape speeds, and using a slowerplay-back mode and a conventional chart recorder foranalysis has been applied [7]. This technique, called time-expanded waveform analysis (TEWA), may be accom-plished easily by the use of computerized digital signalprocessing at the desired time-base resolution. TEWA hasbeen found to be particularly useful in characterizingwaveforms of crackles. For this purpose, a resolution of3,000 mm·s
-1
is recommended.In TEWA, normal breath sounds are characterized as an
irregular signal shape, without any repetitive pattern orsudden rapid deflections. In contrast, adventitious continu-ous sounds such as wheezes and stridor have a periodicwaveform, either sinusoidal or more complex. Also, snor-ing sounds may appear as repetitive sound patterns, even ifthey are not musical in character. Crackles have a distinc-tive appearance in TEWA: a sudden short deflection fol-lowed by deflections with a greater amplitude. Arbitrarycriteria for the amplitude of the deflections have been used[8]. The initial deflection of an expiratory crackle is usu-ally opposite to that of inspiratory one [5, 9, 10]. Depend-ing on the high-pass filtering, the initial deflection may befollowed by one or several other deflections. The originalwaveform of a crackle is simply monopolar or bipolarwithout any further deflections [11]. When the characteris-tics of high-pass filtration have been standardized as
Basic techniques for respiratory sound analysis. G. Charbonneau, E. Ademovic, B.M.G.Cheetham, L.P. Malmberg, J. Vanderschoot, A.R.A. Sovijärvi. ©ERS Journals Ltd 2000.
ABSTRACT: This paper presents a detailed discussion and guidelines for the applica-tion of basic analysis techniques to respiratory sounds. More specifically, expandedtime waveform, classical spectral analysis and parametric spectral analysis are pre-sented briefly. Detailed specifications for the application of these techniques to the dif-ferent types of respiratory sounds are then presented.
Eur Respir Rev 2000; 10: 77, 625–635.
*Institut d'Electronique Fondamentale,Université Paris-Sud, Orsay Cedex, France.**Dept. of Elec. Eng. & Electronics, Uni-versity of Liverpool, Liverpool, UK.
+
Dept.of Clinical Physiology, Helsinki Univer-sity Hospital, Helsinki, Finland.
++
Dept. ofMedical Informatics, University of Leiden,Leiden, The Netherlands.
Correspondence: G. Charbonneau, Institutd'Electronique Fondamentale, UniversitéParis-Sud, Batiment 300, F-91405 OrsayCedex, France.
Keywords: Respiratory soundssound analysis
This paper forms part of the publicationsof the CORSA project supported by theEU BIOMED I programme (contractBMH1- CT94-0928) and by the EuropeanRespiratory Society (ERS task force).

626
G
.
CHARBONNEAU
ET
AL
.
described in [12], the crackle waveform may be subjectedto further analysis by determining several morphologicalfeatures, that correlate with the clinical classification offine and coarse crackle (see below). Figure 1 depicts anexample of a crackle waveform in TEWA.
Classical spectral analysis
The representation of a phenomenon in the time do-main may hide some important characteristics and therebymake any comparison difficult. The Fourier transform(FT) is a mathematical tool that decomposes a time signalin another representation introducing the concept of fre-quency. This idea, first introduced by J.B. Fourier, is veryuseful because it can be easily related to physical pheno-mena (time, vibrations in mechanics or acoustics, light-waves). FT has become an outstandingly useful techniqueto analyse and detect hidden periodicities. Nowadays,nonparametric analysis is still used widely, even thoughnew techniques,
e.g.
modelling or wavelets, have beendeveloped. This analysis is very simple to set up and doesnot require much knowledge on the statistics of theobserved phenomena. Because fast computational algo-rithms have been developed, it is used in real-time sys-tems. The basis of the FT will be reviewed and itsapplication to respiratory sound analysis presented. Anextension of this technique, the short-time fourier trans-form (STFT), is also discussed.
Definition and limitations
.
The FT (
X
(
f
)) of a finiteenergy function (
x
(
t
)) is defined as its decomposition onto a set of trigonometric basis functions
(ψ
(
t, f
)) [13]:
ψ
f
(
t
)=
e
j2
π
ft
, (
t
,
f
)
∈
R
2
, and (1)
X
(
f
)=
∫
x
(
t
)
ψ
f
(
t
)d
t
, (2)
where
ψ
(.) denotes the complex conjugate of
ψ
(.),
t
denotes the time,
f
the frequency and R the real numbersensemble.
A major property of this transform relies on the Parse-val theorem, which insures that the energy is the same inboth representations:
||
x
||
2
= ||
X
||
2
. (3)
From Equation 2 it can be seen that computation of theFT requires the whole scope (past and future) of a signal.The signal is decomposed as a linear combination of con-tinuous pure waves, without any idea of occurrence intime. All the tones are simultaneously produced with aconstant amplitude (
X
(
f
)), and, because of the interfer-ence combinations (destructions or reinforcements), thereconstruction is made perfect [13]. Such a presentationhas no physical sense.
Another intrinsic limitation of the Fourier analysis con-cerns the resolution. It can be demonstrated that theexpected resolution is controlled by the Gabor-Heisenberginequality [4]: 1
∆
f
∆
t
≥
––, (4) 4
π
where
∆
f
and
∆
τ
are the dispersion measures of
X
(
f
) and
x
(
t
). This expresses the impossibility of obtaining any rea-sonable resolution simultaneously in time and in fre-quency. A fine analysis in frequency needs observationover a long period of time, and only a coarse analysis ispossible on a short-period observation.
Discrete Fourier transform
.
Continuous transformationsof analogue recordings cannot be calculated, so data haveto be presented in discrete form in order to estimate the FTon computers. Instead of dealing with
x
(
t
), a finite seriesof the signal is worked with if
N
equally spaced samplesof the continuous signal are considered:
x
(
nT
)=
x
[
n
]=
x
n
, 0
≤
n
<
N
, (5)
and the discrete basis, expressed as:
ψ
N
[
n
]=
e
j2
π
k
n
where
k
∈
[0,
…
,
N
), and (6)
N
–1
X
k
=
∑
x
n
ψ
N
[
n
]. (7)
n
=0
The discrete Fourier transform (DFT) (Equation 7) canbe found from Equation 2 by a discretization in both timeand frequency.
Subsequently, this discretization imposes constraints onthe sampling frequency (
F
s
):
F
s
= 1/
T
(8)
.
This is known asthe Shanon-Nyquist theorem (see section
Digitisation ofdata
). The signal has to be band-limited, and the upperboundary must
≤
F
s
/2
to avoid aliasing phenomena.In conclusion, the discrete spectrum is computed on the
same number of points comprising the time series, andonly half of them are relevant for the spectral analysis dueto the symmetry of the trigonometric analysis. The result-ing spectrum describes the analysed sequence on thebandwidth
F
s
/2 corresponding to the discrete indices [0;
N
/2 Hence, we can express the resolution (R) as:
x1042
1.5
1
0.5
0
-0.5
-1
-1.50 2 4 6 8 10 12 14 16 18 20
2CD
IDW
Time ms
Sig
nal a
mpl
itude
au
Fig. 1. – Crackle in the time domain. 2CD: two-cycle duration; IDW:initial deflection width.
k N
k

RESPIRATORY
SOUND
ANALYSIS
627
F
s
/2
F
s
R
= –––=–––. (9) N/2
N
Estimation of the power spectral density
.
Let x be a dis-crete time stochastic process composed of a deterministicsignal (y) disturbed with an additive noise (w):
xn=yn+wn . (10)
If it is supposed that this process is stationary up toorder 2 and ergodic, then the power spectral density (PSD)of x is defined as the FT of the correlation function (ρx)(Wiener-Khintchine theorem) [14]:
1 Sx [k]=∑ρx [n] ψ N [n]=lim EN |Xk|2. (11) n
Ergodicity is a property that is difficult to verify. Thus,it is generally assumed to be true. Stationariness of thesignal is difficult to check too, but this problem can bealleviated by paying attention to the choice of the durationof observation. Thus it is very easy to respect this condi-tion if a small time window is chosen. The theorem ofWiener-Khintchine (Equation 11) ensures that the FT ofthe analysed series Xk converges toward the PSD of theprocess.
Periodogram. This PSD estimator (periodogram Πx) isdirectly inspired by Equation 11.
1 Πx [k] = N |Xk
2. (12)
It can be seen that its implementation requires only thecomputation of the FT on the time series without consid-ering the auto correlation function [15–17].
This estimator is asymptotically unbiased (see Equation12). Because of its very important variance, several meth-ods to improve the periodogram have been proposed. Anexample of a wheeze periodogram is shown in Figure 2a.
Window influence. Computing the FT on the raw signal,i.e. a limited time series, is equivalent to applying a rec-
tangular window on to the data. This windowing intro-duces discontinuities on the boundaries of the analysedsequence (side-effects), leading to artefacts in the decom-position coefficients. In order to reduce these boundaryeffects, a window can be applied on the analysed timeseries. This operation is not always relevant. Moreover, itcan easily be demonstrated that no gain can be observedon the variance of the estimator and that, in any case, theresolution is lowered since this operation corresponds to aconvolution. Windows are also used for other reasons, forinstance in methods where analysed segments overlap(Welsh method) or to introduce a time dependence in theanalysis, e.g. STFT (see [18]). Generally, the Hanningwindow (Equation 14) is commonly used in such an esti-mation. Figure 2b illustrates the use of Hanning's windowapplied to the same signal as in figure 2a.
xw [n]=x [n]w[n] (13)
n+1 w [n] = o.5[1 - cos (2π –––– )], n = 0, … , N - 1. (14)
N+1In [19], a presentation of the most used windows is
given with a comparison of their performances in thespectral analysis.
Averaged periodogram. Instead of performing the estima-tion on the whole scope, the sequence is divided into Psubsequences of length, M (the sequences may overlap).On each segment, a periodogram is computed, and the Pperiodograms are averaged. The variance is reduced by aratio equal to P. Improvements brought by such averagingis demonstrated in figure 3, using the same signal as in theprevious figures.
1 P Πx
avg [k]= –– ∑ Πx(j) [k]. (15) P j=1
Conclusion of the non-classical spectral analysis. Applyingone of the enhanced periodogram techniques can reducethe variance of the estimated value, at the expense of fre-quency resolution. Therefore, application requirements
0-10-20-30-40-50-60-70-80-90
-100
Pow
er s
pect
rum
mag
nitu
de d
B
a)
0 500 1000 1500 2000 2500 3000
Frequency
2500 30002000150010005000
Frequency
b)
Fig. 2. – Power spectral density estimate of a wheeze with: a) the periodogram technique; and b) the effect of Hanning window preprocessing.
k N→∞
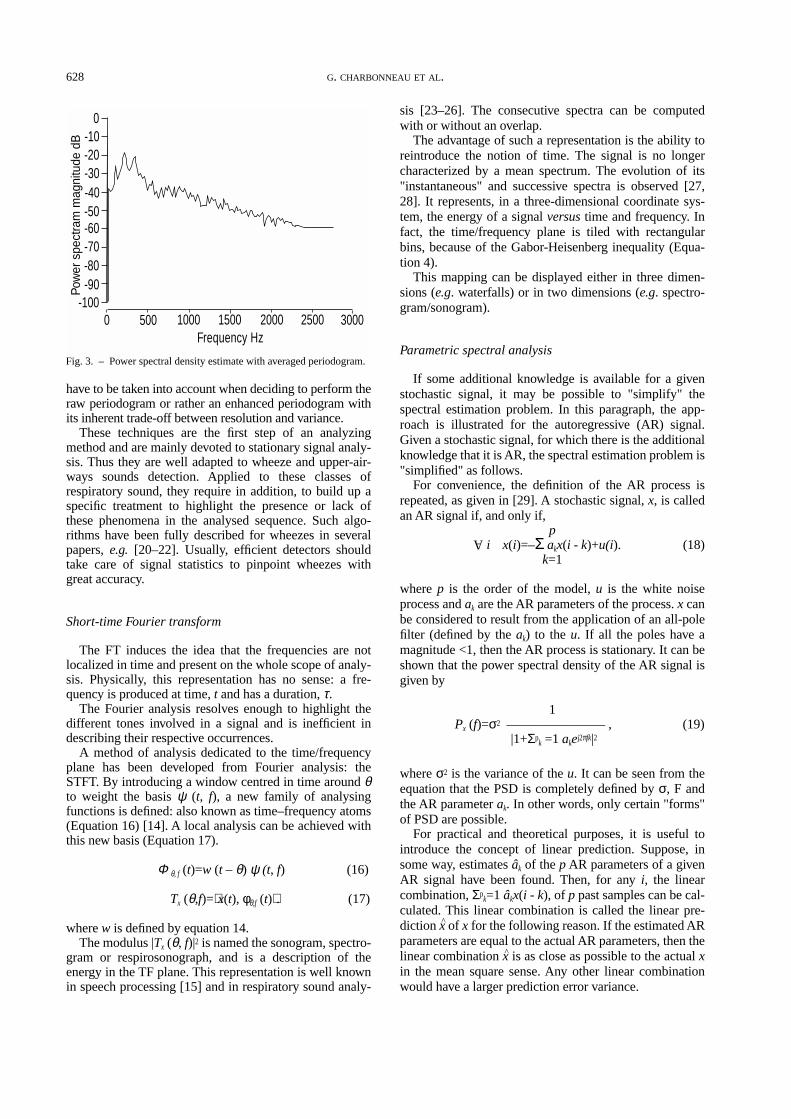
628 G. CHARBONNEAU ET AL.
have to be taken into account when deciding to perform theraw periodogram or rather an enhanced periodogram withits inherent trade-off between resolution and variance.
These techniques are the first step of an analyzingmethod and are mainly devoted to stationary signal analy-sis. Thus they are well adapted to wheeze and upper-air-ways sounds detection. Applied to these classes ofrespiratory sound, they require in addition, to build up aspecific treatment to highlight the presence or lack ofthese phenomena in the analysed sequence. Such algo-rithms have been fully described for wheezes in severalpapers, e.g. [20–22]. Usually, efficient detectors shouldtake care of signal statistics to pinpoint wheezes withgreat accuracy.
Short-time Fourier transform
The FT induces the idea that the frequencies are notlocalized in time and present on the whole scope of analy-sis. Physically, this representation has no sense: a fre-quency is produced at time, t and has a duration, τ.
The Fourier analysis resolves enough to highlight thedifferent tones involved in a signal and is inefficient indescribing their respective occurrences.
A method of analysis dedicated to the time/frequencyplane has been developed from Fourier analysis: theSTFT. By introducing a window centred in time around θto weight the basis ψ (t, f), a new family of analysingfunctions is defined: also known as time–frequency atoms(Equation 16) [14]. A local analysis can be achieved withthis new basis (Equation 17).
Φ θ, f (t)=w (t – θ) ψ (t, f) (16)
Tx (θ,f)=⟨x(t), φθ,f (t)⟩. (17)
where w is defined by equation 14.The modulus |Tx (θ, f)|2 is named the sonogram, spectro-
gram or respirosonograph, and is a description of theenergy in the TF plane. This representation is well knownin speech processing [15] and in respiratory sound analy-
sis [23–26]. The consecutive spectra can be computedwith or without an overlap.
The advantage of such a representation is the ability toreintroduce the notion of time. The signal is no longercharacterized by a mean spectrum. The evolution of its"instantaneous" and successive spectra is observed [27,28]. It represents, in a three-dimensional coordinate sys-tem, the energy of a signal versus time and frequency. Infact, the time/frequency plane is tiled with rectangularbins, because of the Gabor-Heisenberg inequality (Equa-tion 4).
This mapping can be displayed either in three dimen-sions (e.g. waterfalls) or in two dimensions (e.g. spectro-gram/sonogram).
Parametric spectral analysis
If some additional knowledge is available for a givenstochastic signal, it may be possible to "simplify" thespectral estimation problem. In this paragraph, the app-roach is illustrated for the autoregressive (AR) signal.Given a stochastic signal, for which there is the additionalknowledge that it is AR, the spectral estimation problem is"simplified" as follows.
For convenience, the definition of the AR process isrepeated, as given in [29]. A stochastic signal, x, is calledan AR signal if, and only if,
p i x(i)=–Σ akx(i - k)+u(i). (18)
k=1
where p is the order of the model, u is the white noiseprocess and ak are the AR parameters of the process. x canbe considered to result from the application of an all-polefilter (defined by the ak) to the u. If all the poles have amagnitude <1, then the AR process is stationary. It can beshown that the power spectral density of the AR signal isgiven by
1 Px (f)=σ2 ––––––––––––––– , (19)
|1+Σpk =1 akej2πfk|2
where σ2 is the variance of the u. It can be seen from theequation that the PSD is completely defined by σ, F andthe AR parameter ak. In other words, only certain "forms"of PSD are possible.
For practical and theoretical purposes, it is useful tointroduce the concept of linear prediction. Suppose, insome way, estimates âk of the p AR parameters of a givenAR signal have been found. Then, for any i, the linearcombination, Σp
k=1 âkx(i - k), of p past samples can be cal-culated. This linear combination is called the linear pre-diction x of x for the following reason. If the estimated ARparameters are equal to the actual AR parameters, then thelinear combination x is as close as possible to the actual xin the mean square sense. Any other linear combinationwould have a larger prediction error variance.
Pow
er s
pect
ram
mag
nitu
de d
B
0
-20-10
-30-40-50-60-70-80-90
Frequency Hz
-100500 1000 1500 2000 25000 3000
Fig. 3. – Power spectral density estimate with averaged periodogram.
A
^
^

RESPIRATORY SOUND ANALYSIS 629
An outline of the practical approach is as follows. 1)Select a set of N samples, say N=50. 2) Make an educatedguess of p. 3) Estimate the p AR parameters. This can bedone by several techniques, as explained below. 4) Ifneeded, adjust p, and go to step 3. This is really the orderestimation problem, explained below. 5) If needed, adjustthe N, and go to step 2. This is the sample size problem,explained below. 6) Verify that the signal is indeed an ARsignal. This is the model validation problem. From thisoutline, one can see that several (closely related) subprob-lems have to be solved.
Estimation of the AR parameters, given the p and a setof N samples, is the simplest problem to tackle. Depend-ing on the signal (e.g. normally distributed or not), or thecontext of the application (e.g. on-line or off-line), differ-ent algorithms can be opted for. Theoretically, all thesemethods are based on the minimization of the predictionerror over all possible models with the given p. Availablemethods are, for example, the autocorrelation method, thecovariance method, the modified covariance method, andthe Burg method.
The order estimation problem is difficult and controver-sial. Suppose we have calculated for each of the possiblep, the best AR model in the prediction error sense. A naiveapproach would be to select the order that results in thesmallest prediction error variance. The caveat is that theprediction error variance will always decrease if the orderis increased. The result would be the selection of N, as the"best" order. Several statistical order selection techniqueshave been proposed in the past. They all introduce a pen-alty for overestimation of the order.
The required sample size determination is not so diffi-cult once the order is known. Indeed, basic rules of thumbcan be applied for the statistical estimation of p + 1parameters. For example, a sample size of N=50 for athird-order AR model would be quite sufficient.
The model validation problem involves verifying thatthe actual signal is indeed an AR signal. If it is not, thecalculated results make no sense whatsoever. The verifica-tion can be based on the fact that the resulting predictionerror signal should be a white noise (or purely random)signal. In other words, the autocorrelation function of theprediction error should be a delta function, and its PSDshould be constant.
Specifications for respiratory sound analysis
Analysis of breath sounds
Somewhat varying frequency bands have been obtainedin studies on normal breath sounds. Averaged spectracomputed on tracheal sounds (inspiration and expirationphases) have shown that the log amplitude response curveremained approximately flat in the range 75–~900 Hz,before rapidly falling away at higher frequencies [25, 30].Several other authors measured spectra of lung sounds ona linear plot with maximum amplitudes of 140 –200 Hz,followed by an exponential decay to insignificant levels at~400 Hz [31]. Such differences are partly the result of
using different representation of data, a linear scale beingmore likely to overaccentuate high-amplitude responsesand underestimate weaker signals.
However, even though some investigators have meas-ured an upper limit frequency as high as 3,000 Hz for tra-cheal sounds [32], it is commonly admitted that normalrespiratory sounds contain components among which themost significant have a frequency of 50–1,200 Hz. Thefrequency spectra of tracheal sounds decline rapidly at>850–900 Hz. Due to muscle sounds and heart sounds[33], respiratory sounds are not usually studied at <50–60Hz and the range 0–60 Hz should be filtered by a high-pass filter. Due to the dependence of breath sounds on air-flow rate, respiratory sound spectra should be reported at aknown airflow. Moreover, the frequency spectra at zeroflow should be given in order to determine the backgroundnoise [34].
Relationship with flow rate. Sound spectra are clearlylinked to respiratory airflow rate. Sound increases with theair flow, engendering a marked upward shift in frequen-cies [35] in the spectra. Other recent studies revealed thatflow modifies both the intensity and the frequency distri-bution in the spectrum [32, 36, 37]. The relationshipbetween flow and sound depends on many factors, includ-ing upper-airways configuration and, especially, the sub-ject themselves. However, for every subject, the meanamplitude and the mean frequency are increasing func-tions of the flow [35, 38]. For this reason, it is possible toevaluate the flow approximately from the tracheal sound[38, 39].
Spectral parameters and their repeatability. A very com-mon way to characterize a frequency spectrum is to divideit into parts, so that each part represents the same amountof energy. The fractions can be halves (medians), quarters(quartiles) or any percentage (percentiles) of the totalspectrum energy [40]. The percentile, i, is determined incomputing the frequency (fi) limiting the specified portion.For instance, the median frequency (f50) is the frequencydividing the power spectrum into two parts of equalenergy. The quartiles f25, f50 and f75, which divide the spec-trum into four equal parts are the most often used byinvestigators. They give an evaluation of how the spec-trum is balanced between low and high frequencies, and,for this reason, can be used to characterize global changesin breath sounds.
The repeatability of the mean f50 obtained from oneshort-term recording session has been shown to be good[40]. The intra-individual coefficient of variation of f50 inhealthy subjects of recordings with an interval of 15 minwas 2.6–4.4%, and, with an interval of 1–3 days, was 5.0–8.5%. In patients with fibrosing alveolitis, the results weresimilar. The variation of power spectra of normal lungsounds has been shown to be small, even between subjects[41], although this might be due to the fact that this studywas mainly interested in low frequencies.
Another tool for evaluating the power spectrum shapeof breath sounds is to calculate regression lines in a log/log coordinates presentation. This technique is mainly
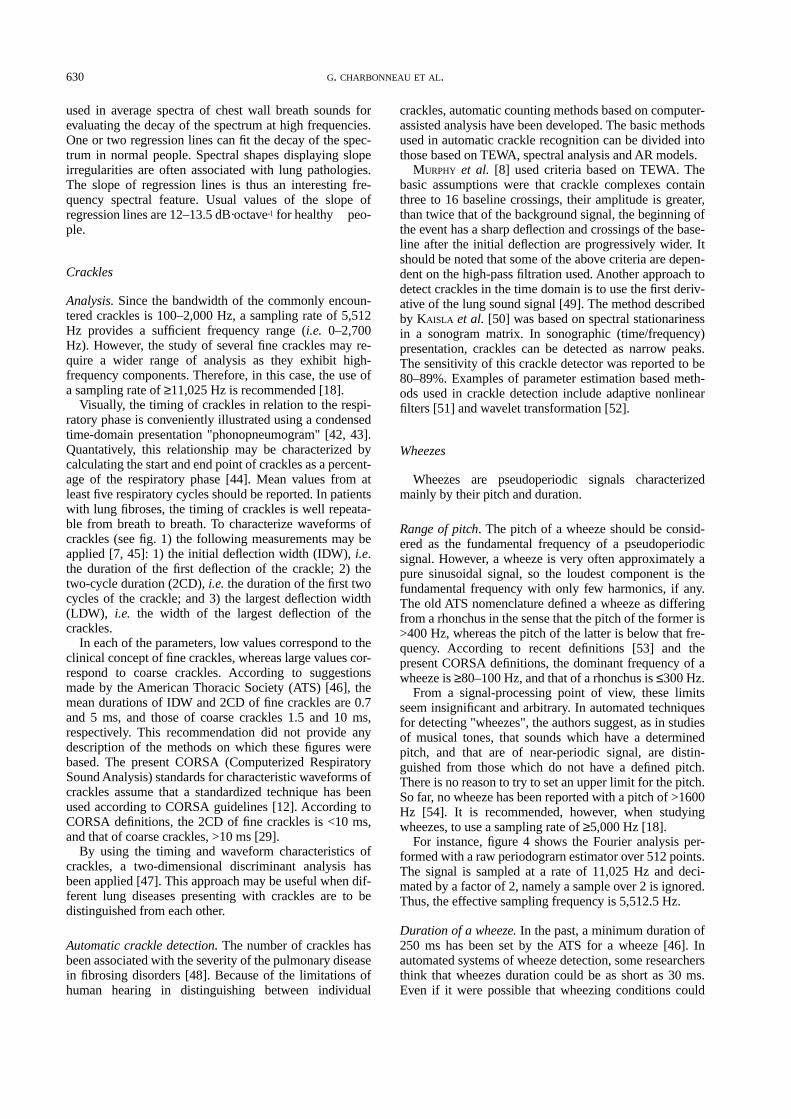
630 G. CHARBONNEAU ET AL.
used in average spectra of chest wall breath sounds forevaluating the decay of the spectrum at high frequencies.One or two regression lines can fit the decay of the spec-trum in normal people. Spectral shapes displaying slopeirregularities are often associated with lung pathologies.The slope of regression lines is thus an interesting fre-quency spectral feature. Usual values of the slope ofregression lines are 12–13.5 dB·octave-1 for healthy peo-ple.
Crackles
Analysis. Since the bandwidth of the commonly encoun-tered crackles is 100–2,000 Hz, a sampling rate of 5,512Hz provides a sufficient frequency range (i.e. 0–2,700Hz). However, the study of several fine crackles may re-quire a wider range of analysis as they exhibit high-frequency components. Therefore, in this case, the use ofa sampling rate of ≥11,025 Hz is recommended [18].
Visually, the timing of crackles in relation to the respi-ratory phase is conveniently illustrated using a condensedtime-domain presentation "phonopneumogram" [42, 43].Quantatively, this relationship may be characterized bycalculating the start and end point of crackles as a percent-age of the respiratory phase [44]. Mean values from atleast five respiratory cycles should be reported. In patientswith lung fibroses, the timing of crackles is well repeata-ble from breath to breath. To characterize waveforms ofcrackles (see fig. 1) the following measurements may beapplied [7, 45]: 1) the initial deflection width (IDW), i.e.the duration of the first deflection of the crackle; 2) thetwo-cycle duration (2CD), i.e. the duration of the first twocycles of the crackle; and 3) the largest deflection width(LDW), i.e. the width of the largest deflection of thecrackles.
In each of the parameters, low values correspond to theclinical concept of fine crackles, whereas large values cor-respond to coarse crackles. According to suggestionsmade by the American Thoracic Society (ATS) [46], themean durations of IDW and 2CD of fine crackles are 0.7and 5 ms, and those of coarse crackles 1.5 and 10 ms,respectively. This recommendation did not provide anydescription of the methods on which these figures werebased. The present CORSA (Computerized RespiratorySound Analysis) standards for characteristic waveforms ofcrackles assume that a standardized technique has beenused according to CORSA guidelines [12]. According toCORSA definitions, the 2CD of fine crackles is <10 ms,and that of coarse crackles, >10 ms [29].
By using the timing and waveform characteristics ofcrackles, a two-dimensional discriminant analysis hasbeen applied [47]. This approach may be useful when dif-ferent lung diseases presenting with crackles are to bedistinguished from each other.
Automatic crackle detection. The number of crackles hasbeen associated with the severity of the pulmonary diseasein fibrosing disorders [48]. Because of the limitations ofhuman hearing in distinguishing between individual
crackles, automatic counting methods based on computer-assisted analysis have been developed. The basic methodsused in automatic crackle recognition can be divided intothose based on TEWA, spectral analysis and AR models.
MURPHY et al. [8] used criteria based on TEWA. Thebasic assumptions were that crackle complexes containthree to 16 baseline crossings, their amplitude is greater,than twice that of the background signal, the beginning ofthe event has a sharp deflection and crossings of the base-line after the initial deflection are progressively wider. Itshould be noted that some of the above criteria are depen-dent on the high-pass filtration used. Another approach todetect crackles in the time domain is to use the first deriv-ative of the lung sound signal [49]. The method describedby KAISLA et al. [50] was based on spectral stationarinessin a sonogram matrix. In sonographic (time/frequency)presentation, crackles can be detected as narrow peaks.The sensitivity of this crackle detector was reported to be80–89%. Examples of parameter estimation based meth-ods used in crackle detection include adaptive nonlinearfilters [51] and wavelet transformation [52].
Wheezes
Wheezes are pseudoperiodic signals characterizedmainly by their pitch and duration.
Range of pitch. The pitch of a wheeze should be consid-ered as the fundamental frequency of a pseudoperiodicsignal. However, a wheeze is very often approximately apure sinusoidal signal, so the loudest component is thefundamental frequency with only few harmonics, if any.The old ATS nomenclature defined a wheeze as differingfrom a rhonchus in the sense that the pitch of the former is>400 Hz, whereas the pitch of the latter is below that fre-quency. According to recent definitions [53] and thepresent CORSA definitions, the dominant frequency of awheeze is ≥80–100 Hz, and that of a rhonchus is ≤300 Hz.
From a signal-processing point of view, these limitsseem insignificant and arbitrary. In automated techniquesfor detecting "wheezes", the authors suggest, as in studiesof musical tones, that sounds which have a determinedpitch, and that are of near-periodic signal, are distin-guished from those which do not have a defined pitch.There is no reason to try to set an upper limit for the pitch.So far, no wheeze has been reported with a pitch of >1600Hz [54]. It is recommended, however, when studyingwheezes, to use a sampling rate of ≥5,000 Hz [18].
For instance, figure 4 shows the Fourier analysis per-formed with a raw periodograrn estimator over 512 points.The signal is sampled at a rate of 11,025 Hz and deci-mated by a factor of 2, namely a sample over 2 is ignored.Thus, the effective sampling frequency is 5,512.5 Hz.
Duration of a wheeze. In the past, a minimum duration of250 ms has been set by the ATS for a wheeze [46]. Inautomated systems of wheeze detection, some researchersthink that wheezes duration could be as short as 30 ms.Even if it were possible that wheezing conditions could

RESPIRATORY SOUND ANALYSIS 631
occur for such a short time, there is no evident interest inconsidering such an event as a wheeze. However, 250 msseems too long, and, in systems of automatic recognition,shorter events can be detected and subjectively heard aswheezes. Therefore, the present CORSA guidelines definethe shortest acceptable duration of a wheeze as 100 ms[29]. Similar minimum duration for a wheeze (80 ms) hasbeen suggested recently [53] (see [29]).
Automatic wheeze recognition. In addition to the pitch andduration, it is necessary to determine an amplitude crite-rion to make possible the automatic detection of a wheeze.Automated analyses of wheezes are usually based on theirspectral appearance, and they rely on identification of thepresence of at least a peak with a sufficiently strong am-plitude. In order for a peak to be accepted or rejected, itmust be in the appropriate frequency range, as definedabove, and have an amplitude greater than a thresholdvalue, which can be either absolute or relative.
An absolute threshold needs a calibration phase of theautomated system before a monitoring phase is started.Unfortunately, any calibration depends on both the patientand the operator particularly the latter. Conversely, a rela-tive threshold can be determined with parameters com-puted simultaneously and is thus independent of theoperator and more flexible. The authors recommend useof the latter. The total energy of the spectrum computedfor a given duration is a good starting point for defining areliable threshold.
Relevant measurements. Automated systems of wheezerecognition may bring the physician interesting statisticalresults that cannot otherwise be assessed. Among variousmeasurements for quantification of wheezing, severalresearchers [55, 56] have proposed calculation of the dur-ation of wheezes as a percentage of the respiratory cycleduration. Additional measurements can also be relevant.For instance, it is recommended that the number ofwheezing episodes be computed in long-term recordings.A wheezing episode is an interval of time in which awheeze is present over consecutive respiratory cycles.Computing the mean frequency of the wheezes, and label-
ling them respectively to the respiratory phase, e.g. theflow/volume curve [57], may be interesting as well.
Snores
Numerous studies concerning snores have been carriedout, but are generally related to nocturnal breathing disor-ders rather than to the analysis of the snore itself. How-ever, researchers, have already pointed out the mostsignificant features and difficulties encountered with thistype of sound. The first observation concerns the intensityof this signal. The snore can be much louder than anyother respiratory sounds, and can also be weak in certaincircumstances. Thus in order to avoid possible saturations,it is necessary to use sensors with a very large dynamicintensity scale. Sensors with a linear intensity response of≥100 dB are recommended.
The frequency spectrum of snores also has specificcharacteristics compared to the spectra of other respira-tory sounds. The snore is usually a pseudoperiodic signalwith energy mainly concentrated in a fundamental fre-quency and its harmonics. The fundamental has beenreported to be as low as 30 Hz and may be >250 Hz insome cases [58]. Thus in the high-pass filtering recom-mended for most lung sounds, the cut-off frequency of 60Hz should be lowered to 25 Hz, or even lower, but theheart noise may then interfere with the snore signal.
The snore is produced in the upper airways, and thesound is modified by the resonating cavities of the opennose and mouth, which act as pass-band filters. For thisreason, the frequency spectrum of a snore depends onwhether the patient demonstrates nasal or oronasal snor-ing. In nasal snoring, the upper limit of the spectrumdefined as the last peak maximum frequency (Fmax) with apower >3% of the peak power is reported to be ~550 Hz[59]. For oronasal snoring, the same peak Fmax is ~850Hz. These limits can be increased in the case of obstruc-tive sleep apnoea. When studying frequency spectra ofsnoring sounds, it is recommended that the range 30–2,000 Hz be considered, even if there is only a small
-0.05-0.04-0.03-0.02-0.01
0
0.020.01
0.030.040.05a)
0 0.05 0.1 0.15 0.2 0.25 0.3 0.35 0.4Time s
0
0.1
0.2
0.3
0.4
0.5
0.6
0 500 1000 1000 2000 2500Frequency Hz
b)Si
gnal
am
plitu
de a
u
Sign
al a
mpl
itude
au
Fig. 4. – Example of : a) a wheeze segment; and b) its periodogram.
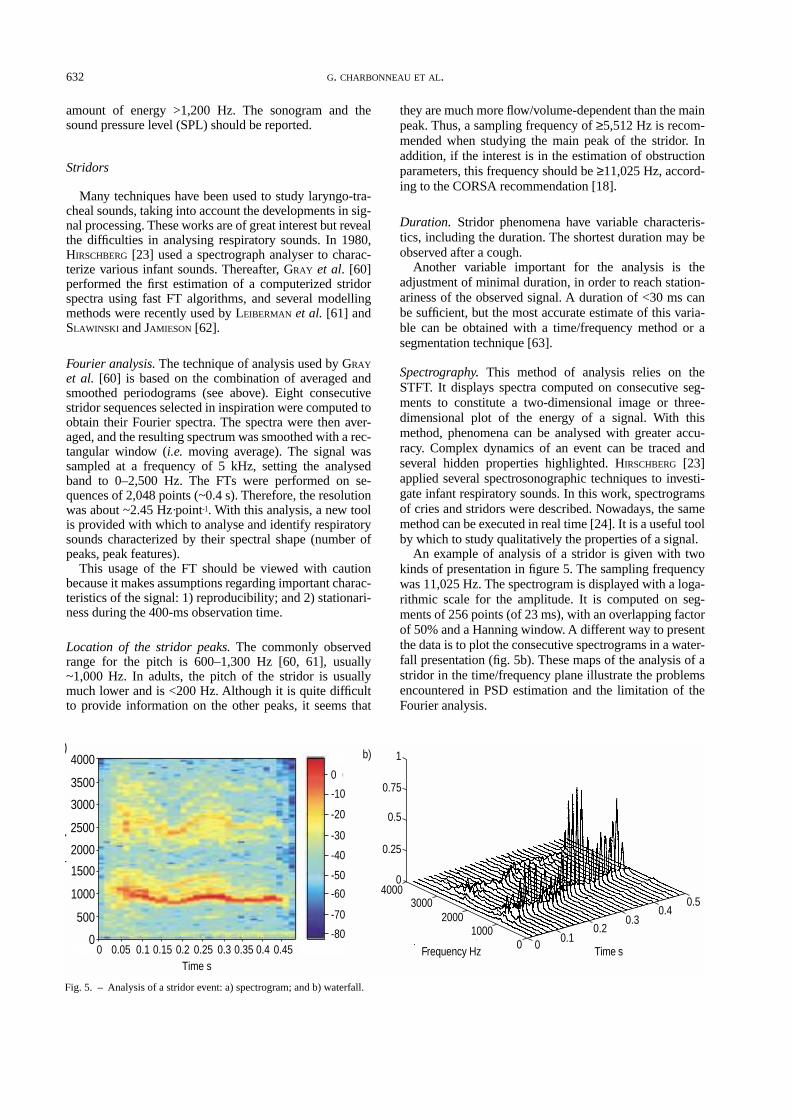
632 G. CHARBONNEAU ET AL.
amount of energy >1,200 Hz. The sonogram and thesound pressure level (SPL) should be reported.
Stridors
Many techniques have been used to study laryngo-tra-cheal sounds, taking into account the developments in sig-nal processing. These works are of great interest but revealthe difficulties in analysing respiratory sounds. In 1980,HIRSCHBERG [23] used a spectrograph analyser to charac-terize various infant sounds. Thereafter, GRAY et al. [60]performed the first estimation of a computerized stridorspectra using fast FT algorithms, and several modellingmethods were recently used by LEIBERMAN et al. [61] andSLAWINSKI and JAMIESON [62].
Fourier analysis. The technique of analysis used by GRAY
et al. [60] is based on the combination of averaged andsmoothed periodograms (see above). Eight consecutivestridor sequences selected in inspiration were computed toobtain their Fourier spectra. The spectra were then aver-aged, and the resulting spectrum was smoothed with a rec-tangular window (i.e. moving average). The signal wassampled at a frequency of 5 kHz, setting the analysedband to 0–2,500 Hz. The FTs were performed on se-quences of 2,048 points (~0.4 s). Therefore, the resolutionwas about ~2.45 Hz·point-1. With this analysis, a new toolis provided with which to analyse and identify respiratorysounds characterized by their spectral shape (number ofpeaks, peak features).
This usage of the FT should be viewed with cautionbecause it makes assumptions regarding important charac-teristics of the signal: 1) reproducibility; and 2) stationari-ness during the 400-ms observation time.
Location of the stridor peaks. The commonly observedrange for the pitch is 600–1,300 Hz [60, 61], usually~1,000 Hz. In adults, the pitch of the stridor is usuallymuch lower and is <200 Hz. Although it is quite difficultto provide information on the other peaks, it seems that
they are much more flow/volume-dependent than the mainpeak. Thus, a sampling frequency of ≥5,512 Hz is recom-mended when studying the main peak of the stridor. Inaddition, if the interest is in the estimation of obstructionparameters, this frequency should be ≥11,025 Hz, accord-ing to the CORSA recommendation [18].
Duration. Stridor phenomena have variable characteris-tics, including the duration. The shortest duration may beobserved after a cough.
Another variable important for the analysis is theadjustment of minimal duration, in order to reach station-ariness of the observed signal. A duration of <30 ms canbe sufficient, but the most accurate estimate of this varia-ble can be obtained with a time/frequency method or asegmentation technique [63].
Spectrography. This method of analysis relies on theSTFT. It displays spectra computed on consecutive seg-ments to constitute a two-dimensional image or three-dimensional plot of the energy of a signal. With thismethod, phenomena can be analysed with greater accu-racy. Complex dynamics of an event can be traced andseveral hidden properties highlighted. HIRSCHBERG [23]applied several spectrosonographic techniques to investi-gate infant respiratory sounds. In this work, spectrogramsof cries and stridors were described. Nowadays, the samemethod can be executed in real time [24]. It is a useful toolby which to study qualitatively the properties of a signal.
An example of analysis of a stridor is given with twokinds of presentation in figure 5. The sampling frequencywas 11,025 Hz. The spectrogram is displayed with a loga-rithmic scale for the amplitude. It is computed on seg-ments of 256 points (of 23 ms), with an overlapping factorof 50% and a Hanning window. A different way to presentthe data is to plot the consecutive spectrograms in a water-fall presentation (fig. 5b). These maps of the analysis of astridor in the time/frequency plane illustrate the problemsencountered in PSD estimation and the limitation of theFourier analysis.
0
500
1000
1500
2000
2500
3000
3500
4000
qy
)
0 0.05 0.1 0.15 0.2 0.25 0.3 0.35 0.4 0.45Time s
0
-10
-20
-30
-40
-50
-60
-70
-800
10002000
30004000
0
0.25
0.5
0.75
1b)
Frequency Hz
0.40.3
0.20.1
Time s0
0.5
Fig. 5. – Analysis of a stridor event: a) spectrogram; and b) waterfall.

RESPIRATORY SOUND ANALYSIS 633
Presentation of the results
Graphical representations
In the time domain, respiratory sounds have to be pre-sented graphically, amplitude versus time, on a linearscale and, if possible, with the flow [64]. The choice oftime scale is not critical, except in the case of crackles, asindicated before.
In the frequency domain, the sound is represented by itsaverage power spectrum (intensity versus frequency). Thescale can be linear or logarithmic for the amplitude andlinear or more rarely, logarithmic for the frequency,depending on what is being looked for. Because respira-tory sound is a continuously varying signal, it is often use-ful to display consecutive short-time power spectra(obtained with or without overlapping) versus time in athree-dimensional coordinate system. In a sonogram, therepresentation is in the plane frequency versus time, theintensity being simulated by the blackness or the colour ofthe dots (see, for instance, fig. 5). Another way to repre-sent the three dimensions intensity, frequency and time is
the so-called "waterfall" display in which the successivepower spectra are plotted in perspective (see fig. 5).
Presentation of measured and calculated parameters
For numerical values, the presentation of the resultsshould appear as a table containing the items indicated intable 1. A column could be omitted (i.e. is optional) basedon the relevance of the corresponding item. For instance,squawks are only inspiratory sounds, so only one columnis needed to indicate a parameter.
The acronyms should be explicitly listed below thetable, for example "COPD: chronic obstructive pulmonarydisease". The authors recommend that only acronymsadopted by the ATS are used.
The authors also recommend that the way in which theconfidence interval has been obtained is specified.
Acknowledgements: The authors would like tothank P. Attal, F. Dalmay, E. Lens, G. Postiaux, N.Meslier and J-L. Racineux for their contributions tothis document.
References
1. http://www.ief.u-psud.fr/~gc/sounds.html2. http://www.meddean.luc.edu/lumen/MedEd/medicine/
pulmonar/pd/auditory.htm3. http://www.medicus.marshall.edu/exam/ausculta.htm4. http://www.RALE.ca5. Dalmasso F, Guarene MM, Spagnolo R, Benedetto G,
Righini G. A computer system for timing and acousticalanalysis of crackles: a study in cryptogenic fibrosingalveolitis. Bull Eur Physiopathol Respir 1984; 20: 139–144.
6. Rosqvist T, Paajanen E, Kallio K, Rajala HM, Katila T,Piirilä P. Toolkit for lung sound analysis. Med Biol EngComput 1995; 33: 190–195.
7. Murphy RL Jr, Holford SK, Knowler WC. Visuallung-sound characterization by time-expandedwave-form analysis. N Engl J Med 1977; 296: 968–971.
8. Murphy RL Jr, Del Bono EA, Davidson F. Validation ofan automatic crackle (rale) counter. Am Rev Respir Dis1989; 140: 1017–1020.
9. Munakata M, Ukita H, Doi I, et al. Spectral and wave-form characteristics of fine and coarse crackles. Thorax1991; 46: 651–657.
10. Walshaw MJ, Nisar M, Pearson MG, Calverley PM, EarisJE. Expiratory lung crackles in patients with fibrosingalveolitis. Chest 1990; 97: 407–409.
11. Katila T, Piirilä P, Kallio K, Paajanen E, Rosqvist T, Sov-ijärvi AR. Original waveform of lung sound crackles: acase study of the effect of high-pass filtration. J ApplPhysiol 1991; 71: 2173–2177.
12. Vannuccini L, Earis JE, Helistö P, et al. Capturing andpreprocessing of respiratory sounds. Eur Respir Rev2000; 10: 77, 616–620.
13. Gasquet C, Witomski P. Analyse de Fourier et applica-tions. Paris, Masson, 1990.
14. Flandrin P. Temps-fréquence traité des nouvelles technol-ogies. Paris: Hermès, 1993.
15. Boite R, Kunt M. Traitement de la parole Presses poly-techniques romandes, 1987.
16. Brillinger DR. Time Series. Data Analysis and Theory,
Table 1. – Summary of recommendations
Breath sounds
Features:
Presentation of result:CracklesMethods:Features:
Presentation of results:WheezesMethods:Features:
Presentation of results:
SnoresMethods:
Features:
Presentation of results:
StridorsMethods:
Features:
Presentation of results:
Methods: Periodograms, autoregressive models
Spectral slopes, quartile frequencies, octave band analysis
PSD plot, tables of parameters
Time-expanded waveform analysisTime parameters (IDW, 2CD, LDW),
number of crackles and timingTime plots, tables of parameters
Periodograms, STFTPitch location in frequency, wheeze duration and timing, histogram of wheezing episodes, mean frequency, balance between inspiratory and expiratory wheezes
PSD plot, sonogram plot, tables of parameters
Time-expanded waveform analysis, periodograms
Amplitude in time domain, main peak location and energy in frequency
PSD plot, tables of parameters, sound-pressure level, sonogram
Periodograms: STFT autoregressive models
Pitch location, duration of the event, number and location of high-frequency peaks
PSD, plots, sonogram plots, tables of parameters
PSD: power spectral density; IDW: initial deflection width;2CD: two-cycle duration; LDW: largest deflection width; STFT:short-time Fourier transform.

634 G. CHARBONNEAU ET AL.
1975.17. Priestley MB. Spectral Analysis and Time Series. New
York, Academic Press, 1981. 18. Cheetham BMG, Giordano A, Helistö P, Vanderschoot J.
Digitisation of data for respiratory sound recordings. EurRespir Rev 2000; 10: 77, 625–635.
19. Harris FJ. On the use of windows for harmonic analysiswith the discrete Fourier. IEEE 1978; 66: 51–83.
20. Charbonneau G, Meslier N, Racineux J-L, Qian Y. Ana-lyse des sons Respiratoires au cours du sommeil. Work-shop INSERM Nouvelles Techniques non invasivesd'Investigation cardiorespiratoire au cours du Sommeil.INSERM, Paris, 27–28 October 1992.
21. Li D, Haltsonen S, Kallio K, Helistö P, Katila T. Filteredspectrum in the detection of the wheezing sound. In:Proc. CORSA WPIII symposium on Signal Processing in Lung Sound Analysis; Helsinki, University of Technol-ogy 1996.
22. Waris M, Helistö P, Haltsonen S, Saainen A, SovijärviARA, A new method for wheeze detection. TechnolHealth Care 1998; 6: 33–40.
23. Hirschberg J. Acoustic analysis of pathological cries, stri-dors and coughing sound in infancy Int J Pediatr Otorhi-nolaryngol 1980; 2: 287–300.
24. Sun X, Cheetham BM, Earis JE. Real-time analysis oflung sounds. Technol Heath Care 1998; 6: 3–10.
25. Pasterkamp H, Carson C, Daien D, Oh Y. Digitalrespirosonography. New images of lung sounds. Chest1989; 96: 1405–1412.
26. Gavriely N, Nissan M, Rubin AH, Cugell DW. Spectralcharacteristics of chest wall breath sounds in normal sub-jects. Thorax 1995; 50: 1292–1300.
27. Cohen L. Time-frequency distribution - a review. IEEE1989; 77: 941–979.
28. Altes RA. Detection, estimation, and classification withspectrograms. J Acoust Soc Am 1980; 67: 1232–1246.
29. Sovijärvi AR, Dalmasso F, Vanderschoot J, Malmberg LP,Righini G, Stoneman SAT. Definition of terms for appli-cations of respiratory sounds. Eur Respir Rev 2000; 10:77, 597–610.
30. Gavriely N, Palti Y, Alroy G. Spectral characteristics ofnormal breath sounds. J Appl Physiol 1981; 50: 307–314.
31. Charbonneau G, Racineux JL, Sudraud M, Tuchais E. Anaccurate recording system and its use in breath soundsspectral analysis. J Appl Physiol 1983; 55: 1120–1127.
32. Kraman SS, Pasterkamp H, Kompis M, Takase M, Wod-icka GR. Effects of breathing pathways on tracheal soundspectral features. Respir Physiol 1998; 111: 295–300.
33. Iyer VK, Ramamoorthy PA, Ploysongsang Y. Quantifica-tion of heart sounds interference with lung sounds. JBiomed Eng 1989; 11: 164–165.
34. Gavriely N, Cugell D. Breath sounds methodology. BocaRaton, FL, CRC Press, 1995.
35. Charbonneau G, Sudraud M, Soufflet G. Method for theevaluation of flow rate from pulmonary sounds. Bull EurPhysiopathol Respir 1987; 23: 265–270.
36. Lessard CS, Wong WC. Correlation of constant flow ratewith frequency spectrum of respiratory sounds whenmeasured at the trachea. IEEE Trans Biomed Eng 1986;33: 461–463.
37. Ploysongsang Y, Pare JA, Macklem PT. Correlation ofregional breath sound with regional ventilation in emphy-sema. Am Rev Respir Dis 1982; 126: 526–529.
38. Soufflet G, Charbonneau G, Polit M, et al. Interactionbetween tracheal sound and flow rate: a comparison ofsome different flow evaluations from lung sounds. IEEETrans Biomed Eng 1990; 37: 384–391.
39. Pasterkamp H, Schafer J, Wodicka GR. Posture-depend-
ent change of tracheal sounds at standardized flows inpatients with obstructive sleep apnoea. Chest 1996; 110:1493–1498.
40. Sovijärvi ARA, Malmberg LP, Paajanen E, Piirilä P,Kallio K, Katila T. Averaged and time-gated spectralanalysis of respiratory sounds. Repeatability of spectralparameters in healthy men and in patients with fibrosingalveolitis. Chest 1996; 109: 1283–1290.
41. Ploysongsang Y, Iyer VK, Ramamoorthy PA. Reproduci-bility of the vesicular breath sounds in normal subjects.Respiration 1991; 58: 158–162.
42. Nath AR, Capel LH. Inspiratory crackles: early and late.Thorax 1974; 29: 223–227.
43. Nath AR, Capel LH. Inspiratory crackles and mechanicalevents of breathing. Thorax 1974; 29: 695–698.
44. Piirilä P, Sovijärvi AR, Kaisla T, Rajala HM, Katila T.Crackles in patients with fibrosing alveolitis, bron-chiectasis, COPD, and heart failure. Chest 1991; 99:1076–1083.
45. Hoevers J, Loudon RG. Measuring crackles. Chest 1990;98: 1240–1243.
46. American Thoracic Society. Updated nomenclature formembership relation. ATS News 1977; 3: 5–6.
47. Sovijärvi ARA, Piirilä P, Luukkonen R. Separation ofpulmonary disorders with two-dimensional discriminantanalysis of crackles. Clin Physiol 1996; 16: 171–181.
48. Epler GR, Carrington CB, Gaensler EA. Crackles (rales)in the interstitial pulmonary diseases. Chest 1978; 73:333–339.
49. Vannuccini L, Rossi M, Pasquali G. A new method todetect crackles in respiratory sounds. Technol HealthCare 1998; 6: 75–80.
50. Kaisla T, Sovijärvi A, Piirilä P, Rajala HM, Haltsonen S,Rosqvist T. Validated method for automatic detection oflung sound crackles. Med Biol Eng Comput 1991; 29:517–521.
51. Ono M, Arakawa K, Mori M, Sugimoto T, Harashima H.Separation of fine crackles from, vesicular sounds by anonlinear digital filter. IEEE Trans Biomed Eng 1989; 36:286–291.
52. Sankur B, Guler EC, Kahya YP. Multiresolution biologi-cal transient extraction applied to respiratory crackles.Comput Biol Med 1996; 26: 25–39.
53. Pasterkamp H, Kraman SS, Wodicka GR. Respiratorysounds. Advances beyond the stethoscope. Am J RespirCrit Care Med 1997; 156: 974–987.
54. Gavriely N, Palti Y, Alroy G, Grotberg JB. Measurementand theory of wheezing breath sounds. J Appl Physiol1984; 57: 481–492.
55. Baughman RP, Loudon RG. Quantitation of wheezing inacute asthma. Chest 1984; 86: 718–22.
56. Pasterkamp H, Asher T, Leahy F, Fenton R, Chernick V.The effect of anticholinergic treatment on postexertionalwheezing in asthma studied by phonopneumography andspirometry. Am Rev Respir Dis 1985; 132: 16–21.
57. Vanderschoot J, Helistö P, Lipponen P, Piirilä P, SovijärviAR. Distribution of crackles on the flow-volume plane indifferent pulmonary diseases. Technol Health Care 1998;6: 81–89.
58. Sovijärvi ARA, Malmberg LP, Charbonneau G, Vander-schoot J, Dalmasso F, Earis JE. Characteristics of breathsounds and adventitious sounds. Eur Respir Rev 2000; 10:77, 591–596.
59. Perez-Padilla JR, Slawinski E, Difrancesco LM, FeigeRR, Remmers JE, Whitelaw WA. Characteristics of thesnoring noise in patients with and without occlusive sleepapnoea. Am Rev Respir Dis 1993; 147: 635–644.
60. Gray L, Denneny JC, Carvajal H, Jahrsdoerfer R. Fourier

RESPIRATORY SOUND ANALYSIS 635
analysis of infantile stridor: preliminary data. Int J Pedi-atr Otorhinolaryngol 1985; 10: 191–199.
61. Leiberman A, Cohen A, Tal A. Digital signal processingof stridor and snoring in children. Int J Pediatr Otorhi-nolaryngol 1986; 12: 173–185.
62. Slawinski EB, Jamieson DG. Studies of respiratory stri-dor in young children: acoustical analyses and tests of atheoretical model. Int J Pediatr Otorhinolaryngol 1990;
19: 205–222.63. Ademovic E, Pesquet JC, Charbonneau G. Wheezing
lung sounds analysis with adaptive local trigonometrictransform. Technol Health Care 1998; 6: 41–51.
64. Rossi M, Sovijärvi ARA, Piirilä P, Vannuccini L, Dal-masso F, Vanderschoot J. Environmental and subject con-ditions and breathing manoeuvres for respiratory soundrecordings. Eur Respir Rev 2000; 10: 77, 611–615.
Eur Respir Rev
2000; 10: 77, 636–640Printed in UK - all rights reserved
Copyright ©ERS Journals Ltd 2000European Respiratory Review
ISSN 0905 - 9180
Reporting results of respiratory sound analysis
P. Piirilä
*
,
***
, A.R.A. Sovijärvi
*
, J.E. Earis
**
, M. Rossi
+
, F. Dalmasso
++
,S.A.T. Stoneman
§
, J. Vanderschoot
§§
aa
The check-list of items to be included in a scientific re-port is at the end of the paper.
Subjects and environmental conditions
Patients and subjects
The number of subjects, their sex and the selection cri-teria adopted have to be defined. The smoking history ofthe subjects must be described.
Environment
The environmental conditions, such as acoustic proper-ties, frequency spectrum and intensity of background noiseof the room must be indicated, especially if the signal-of-interest-to-noise ratio is less than 15 dB. If a soundproofroom or some special sound insulation is used, those haveto be specified in the report.
If noise-shielding of the microphones is applied, it hasto be described.
The subject background noise-level spectrum duringbreath-holding should be reported, especially if the signal-of-interest-to-noise ratio is less than 15 dB. In cases where
constant frequency peaks of background noise due tonoise from external sources (
e.g.
from computer, air con-ditioning device, or lighting) have not been avoided, theirfrequencies have to be reported.
Experimental procedure
Body posture, the status of vigilance (sleep studies),and route of breathing during recording have to be defin-ed. If mechanical ventilation is used, details of this have tobe reported.
The breathing manoeuvre during sound recording mustbe described in detail. The feedback procedures of breath-ing pattern,
e.g.
monitoring of air flow or volume using avisual signal seen by the subject must be explained. Peakinspiratory and expiratory flow during recording must bereported.
The data collection has to be explained in detail includinginformation on the duration of the samples or recordingperiods, as well as the number of inspirations and expira-tions recorded, and the actual time. The method of datacollection,
i.e.
continuous or segmental, has to be report-ed, and the selection criteria for segmental sound sampleshave to be indicated. It should be mentioned whether theanalysis has been made on-line or off-line.
Reporting results of respiratory sound analysis. P. Piirilä, A.R.A. Sovijärvi, J.E. Earis, M.Rossi, F. Dalmasso, S.A.T. Stoneman, J. Vanderschoot
.
ERS Journals Ltd 2000.
ABSTRACT: Breath sound studies performed in different laboratories have a varietyof methodological differences in respiratory manoeuvres used as well as in the signalcapture and processing techniques that are employed. It is a fundamental tenet ofreporting scientific work that sufficient information about the techniques used andthe assumptions made are provided in such a way that the work could be repeated inanother research centre. Therefore, accurate and detailed reporting of the experi-mental procedures used for measurement and analysis of breath sounds are necessaryboth in scientific reports and in clinical documents. This paper gives recommenda-tions for the contents of scientific and clinical reports, respectively.
Eur Respir Rev 2000; 10: 77, 636–640.
*Dept. of Clinical Physiology, HelsinkiUniversity Hospital, Helsinki, Finland and***Finnish Institute of Occupational Health,Helsinki, Finland. **Aintree Chest Centre,The Fazakerley Hospital, Liverpool, UK.
+
U.O. Pneumologia, Arezzo, Italy.
++
Divi-sione di Pneumologia, Ospedale Mau-riziano Umberto I, Torino, Italy.
§
Dept ofMechanical Engineering, University Col-lege of Swansea, Swansea, UK.
§§
Dept. ofMedical Informatics, University of Leiden,Leiden, The Netherlands.
Correspondence: A. Sovijärvi, Dept of Cli-nical Physiology and Nuclear Medicine,Helsinki University Hospital, P.O. Box340, FIN-00029 HUS, Finland. Fax: 358947174592
Keywords: Reports of analysis, respiratorysounds, sound analysis
This paper is part of the publications of theCORSA project supported by the EU BIO-MED I programme (contract BMH1-CT94-0928) and by the European RespiratorySociety (ERS task force).

SOUND
ANALYSIS
REPORTS
637
Simultaneous physiological measurements
Air-flow and volume measurements
. The method of mea-suring air flow and volume during sound recording mustbe described. Define the measuring equipment, type of theflow sensor and spirometer. It is important that the methodof digitization of the signal is described. Also, the flowcalibration procedure must be indicated. If a window forair flow is used, its characteristics have to be described.
Mouth pressure
. The measuring equipment and the signaldigitization must be explained.
Oesophageal pressure measurement.
The method of re-cording and digitization must be explained.
Electrocardiography
. The equipment and method of pos-sible electrocardiographic gating must be reported.
Sound capturing
Microphone location and attachment
The location of microphones during sound recordinghas to be defined. The use of anatomic description of thepick-up locations is recommended [1]. Sometimes, it isreasonable to record the lung sounds on the locationwhere the breath sounds or adventitious lung sounds arebest heard. If the exact recording location has not beenspecified in the study protocol, the measurement of themicrophone location during every single recording has tobe defined. For example, indicate the distance of the mi-crophone from the vertebral column, and from the shoul-der or lower line of the scapula.
The mode of attachment of the microphones or sensorson or in the body has to be explained,
e.g.
adhesive tapefixation, belt fixation or hand-held sensor. Any attachmentsettings need to be defined.
Pick-up sensors
The type of sensor,
i.e.
contact sensor (accelerometer ordeformable piezoelectric elements) or air-coupled acous-tic sensor (condenser or piezoelectric microphone), as wellas the manufacturer of the sensor have to be defined [2, 3].Also, the sensitivity, dynamic range, frequency range andsignal-to-noise ratio of the sensor must be indicated [1].
When an air-coupled sensor is used, the dimensions ofthe coupling volume, the free area on the chest wall underthe air-coupling space, and the distance of the sensor frombody surface must be reported.
The calibration procedure of the sensor and the frequen-cy response in actual use have to be indicated, if possible.
If more than one sensor is used, a balancing procedurebetween the sensors has to be indicated.
Report also whether any analogue noise compensationwithin the microphone is used.
Sound recording
Analogue recording
The method of the magnetic tape recording (amplitudemodulation, frequency modulation or other) and the line-arity of the recorder have to be defined.
Tape speed during the recording and its frequency re-sponse range and linearity have to be indicated. Also, thelow-frequency range should be described because somerecorders may act as a high-pass filter [4]. The stability ofthe tape speed and the signal-to-noise ratio should also beindicated.
Report also which simultaneous physiological measure-ments are recorded: air flow, inspired and expired volume,mouth pressure or electrocardiogram.
The method of analogue-to-digital conversion, the sam-pling rate and period, and the dynamic range (in dB) haveto be defined.
Digital sound recording
The sampling rate and amplitude resolution (dynamicrange) of digitization should be indicated.
The digitization of parallel physiological data as airflow, mouth pressure, inspired or expired volume shouldbe indicated.
Report the method of signal storage. Specify which datawere stored and the mode of digital data storage. Specifythe mode of signal compression, if used.
Amplification
Report the frequency range and linearity of response ofthe amplifier and the gain of the microphones. If more thanone sensor is used, report how the amplifiers were bal-anced.
Sound filtering
The cut-off frequency of high-pass or low-pass filter-ing,
i.e.
the frequency at which the signal is reduced by 3dB (the so-called 3 dB point), and the roll-off or the slopeof filtering (in dB·octave
-1
) as well as the type of the filterhave to be defined. Explain the properties of analogue (
e.g.
Butterworth, passive,
etc.
) or digital filters used in detailbecause the filtering type may significantly influence eventhe sound morphology concerning short-duration sounds[4].
Sound analysis
Data selection
Selection of the sound data for analysis must be report-ed,
e.g.
whole recorded sound or only a subset of soundsamples. If a subset of sound samples are used, report theselection criteria,
e.g.
fractions of inspiratory or expiratorysound selected by some definite flow gate.
638
P
.
PIIRILÄ
ET
AL
.
Timing of respiratory sounds
In breath-sound analysis, determination of timing of ad-ventitious sounds is important. It should be reported howthe time domain analysis is performed. Are the respiratoryevents counted and timed related to the whole duration ofthe respiratory cycle [5], related to the inspiratory or ex-piratory volume [6] or oesophageal pressure? If the oc-currence of adventitious sound events is defined on theflow-volume plane, specify the method.
Sound waveform morphology analysis
Report the time scale. The direction of the initial deflec-tion of a crackle may be the opposite in inspiration and inexpiration [4, 7]; therefore, the direction of increasing anddecreasing sound pressure must be specified at least in thefigures.
Report also the criteria used in waveform morphologyanalysis. What are the criteria used for crackles [8] andwheezing sounds [9]? Define the quantitative parametersused.
Report the criteria for the onset [8] of a crackle or awheeze. If automatic detection is used, which criteria andmethods are used to detect crackles or wheezes?
Frequency domain analysis
Define the window used,
e.g.
Hanning, Hamming, rec-tangular, Blackman, as well as number of points used inthe fast Fourier transform analysis. The sample size andthe possible averaging of spectra have to be explained.
Presentation
Presentation of results has been dealt with in [10].
Graphical presentation
The graphical monitoring during recording and analysishave to be defined. The resolution of time, frequency andamplitude presentation of the graphics used in scientificreporting have to be defined. The expansion used in thetime-expanded wave-form display has to be indicated.
Parametric analysis
The parameters and their measured values from the lungsound analysis should be reported as related to the anat-omy and location. Also, average values and variations ofthe parameters have to be calculated. It has been shownthat average values of power spectral parameters are veryrepeatable [11].
Normal chest wall sounds.
Maximal frequency (
f
max
) inHz (the frequency of maximal amplitude in the spectrum),
total power (
P
total
) (the intensity of the sound of interest)in dB [12], the quartile frequencies in the power spectra(F75, F50, F25) [12, 13]. If slope and deflection point [12]are measured, report them.
In addition for tracheal sounds.
The frequency range andmajor peaks have to be measured.
In addition for wheezes
. The number of wheezing peaks,their maximal frequencies, duration, timing in respiratorycycle and location of recording on the chest wall or tra-chea should be indicated if possible.
In addition for crackles
. The following durations of thetime-expanded waveform of crackling sounds have to beindicated: the initial deflection width [14]; two-cycle dura-tion [14] and largest deflection width [15]. In addition, thetiming of crackles related to the respiratory cycle, their num-ber, distribution, and possibly effect of posture, coughingor deep inspirations on their occurrence have to be de-fined.
Quality assurance
Refer to the standard publications or references. Detailsof specific analysis methods or statistical methods have tobe indicated. The variances of measured variables have tobe given,
e.g.
the variances of averaged spectra.
Clinical report
The results of lung sound data recorded and analysedwith respect to an individual patient are given as a clinicalreport containing both graphical and numerical data. Itshould contain the information that is needed for patientidentification, as well as the recording and analysis set-upneeded for a clinician. The clinical report may also serveas the basis for collection of scientific data.
Patient data
In every single recording, anthropometric data must beknown about each patient.
The preparation of the patients before the test should beindicated: smoking, eating, drinking and especially drugintake. Which drugs are used, and when was the last dosetaken? The detailed knowledge of treatments with asthmadrugs is of great importance.
Experimental procedure
The essentials about sound recording have to be defin-ed,
e.g.
the recording site and the position of the subject(supine/sitting).
The gain of the microphones has to be indicated if thegain is going to be fitted to each patient recording individ-ually.
The breathing patterns and the maximum flows and vol-umes during breathing have to be defined.

SOUND
ANALYSIS
REPORTS
639
Graphical presentation
At least some samples of the phonopneumogram (soundamplitude, flow display) should be presented graphically.This gives a visual impression of the signal-to-noise ratioof the recording and the presence or lack of adventitious
sounds. Frequency-time presentation (sonogram) of soundis informative, especially on the adventitious sounds. Ifcrackles are present, examples of crackle waveformsshould also be presented.
Numerical results
The maximum frequency of the power spectrum of thesound, frequency of wheezing and the timing of adventi-tious sounds should be reported. If quartiles [12, 13],slope or deflection points [12] of the spectrum are meas-ured, report them. The (mean) duration of inspiratory andexpiratory phases and the maximum inspiratory and expir-atory flow must be indicated. If flow-volume recording isused, the flow-volume curve should be described. Reportalso the duration of crackle indices, IDW, 2CD, LDW, du-ration of crackling and the period of timing of cracklingby indicating the beginning and end point of crackling as apercentage of the duration of the whole respiratory cycle.
Table 1. – Check-list for a lung sound recording andanalysis report for research
Subjects
Environment
Experimental procedure
Air flow and volume
Sound signal capture
Analogue recording
Digital recording
Signal processing
Sound analysis
Graphical presentationNumerical presentation
Number of subjectsSexDiagnostic criteriaSelection criteriaAnthropometric dataDrugs and smokingSpectrum of background noise level of room, free fieldSubject background noise, spectrum during breath-holdingBody postureRoute of breathingSensor locationBreathing manoeuvresNumber of respiratory cycles recordedSensorEquipmentCalibrationDigitizationSensor typeSensitivityFrequency responseDimensions of air-coupling volumeKind of venting of sensorCalibration of the sensorMagnetic tape (FM/DM)Linearity of recorderTape speedFrequency rangeSampling rateDynamic rangeSample sizeMethod of signal storageNumber of bitsFrequency range of amplifierGain of amplifierAmplifier balancingFilter type applied in sound channelHigh-pass cut-off frequencyLow-pass cut-off frequencyRoll-off of filtering (in dB·Oct-1)Data selectionConditions of analysisScales with units of time, frequency and amplitude axesMaximal frequencySound-pressure levelPresence of adventitious sounds (number per respiratory cycle)Quartile frequencies or slopeWheezing: number of wheezing peaks, duration, timing, frequenciesCrackles: number per cycle, timing, distribution, crackle duration, IDW, 2CD, LDW (ms).
FM: frequency modulation; DM: direct mode; IDW: initial de-flection width; 2CD: two-cycle duration; LDW: largest deflec-tion width.
Table 2. – Check-list for lung sound recording andanalysis for a clinical report
Patient data
Preparation of the patient for the testExperimental procedure
Graphical presentation of results
Numerical presentation
Clinical interpretation
Identification codeAge, sex, height, weightPrevious lung function study resultsClinical diagnosis or clinical problemIndication for lung-sound analysisSmoking, eating, drinkingDrug intakeMicrophone locationsPosture of the patientBreathing manoeuvresTarget inspiratory and expiratory flow and volumeGain of the sound channelExamples of representative phonopneu- mogramsExamples of frequency/time presentations (sonogram)Examples of power spectraExamples of single cracklesFlow-volume curveMean quartile frequencies of inspiratory and expiratory phasesMean durations and number of ins- piratory and expiratory phasesMean maximum inspiratory and ex- piratory flowsMean sound pressure level (RMS) in expiratory and inspiratory phasesMean and SD of crackle variables (IDW, 2CD, LDW)Mean and SD of the timing variables of adventitious soundsMean relative crackling and wheezing periodsFrequency of wheezing peaksSpectral slope data (optional)
RMS: root mean square of sound pressure; IDW: initial deflec-tion width; 2CD: two-cycle duration; FM: frequency modula-tion; DM: direct mode; IDW: initial deflection width; 2CD:two-cycle duration; LDW: largest deflection width
640
P
.
PIIRILÄ
ET
AL
.
Summary of recommendations
In reporting scientific work on lung sounds, the descrip-tion of the experimental procedure and methods for record-ing and analysis is important because of methodologicaldifferences in different laboratories. Essential data to bereported in scientific work as well as clinical work aredealt with and collected as check lists (tables 1 and 2).
References
1. Vannuccini L, Earis J, Helistö P, Cheetham B, Rossi M,Sovijärvi A, Vanderschoot J. Capturing and preprocess-ing of respiratory sounds.
Eur Respir Rev
2000; 10: 77,616–620.
2. Druzgalski CK, Donnerberg RL, Campbell RM. Tech-niques of recording respiratory sounds.
J Clin Eng
1980;5: 321–330.
3. Pasterkamp H, Kraman SS, DeFrain PD, Wodicka GR.Measurement of respiratory acoustical signals. Compari-son of sensors.
Chest
1993; 104: 1518–1525.4. Katila T, Piirilä P, Kallio K, Paajanen E, Rosqvist T, Sov-
ijärvi ARA. Original waveform of lung sound crackles: acase study of the effect of high-pass filtration.
J ApplPhysiol
1991; 71: 2173–2177.5. Piirilä P, Sovijärvi AR, Kaisla T, Rajala HM, Katila T.
Crackles in patients with fibrosing alveolitis, bronchiecta-sis, COPD, and heart failure.
Chest
1991; 99: 1076–1083.6. Nath AR, Capel LH. Inspiratory crackles and mechanical
events of breathing.
Thorax
1974; 29: 695–698.
7. Matsuzaki M. Polarity of crackle waveforms: a new indexfor crackle differentiation.
Hokkaido J Med Sci
1985; 60:103–113.
8. Murphy RL Jr, Del Bono EA, Davidson F. Validation ofan automatic crackle (rale) counter.
Am Rev Respir Dis
1989; 140: 1017–1020.9. American Thoracic Society. Updated nomenclature for
membership reaction. Reports of the ATS-ACCP
ad hoc
Com.
Am Thoracic Soc News
1977; 3: 5–6.10. Charbonneau G, Ademovic E, Cheetham BMG, Malm-
berg LP, Vanderschoot J, Sovijärvi ARA. Basic Tech-niques for respiratory sound analysis.
Eur Respir Rev
2000; 10: 77, 625–635.11. Sovijärvi ARA, Malmberg LP, Paajanen E, Piirilä P,
Kallio K, Katila T. Averaged and time-gated spectralanalysis of respiratory sounds. Repeatability of spectralparameters in healthy men and in patients with fibrosingalveolitis.
Chest
1996; 109: 1283–1290.12. Gavriely N. Breath Sound Methodology. London, CRC
Press, 1995.13. Malmberg LP, Sovijärvi ARA, Paajanen E,
et al.
Changesin frequency spectra of breath sounds during histaminechallenge test in adult asthmatics and healthy control sub-jects.
Chest
1994; 105: 122–131.14. Holford SK. Discontinuous adventitious lung sounds:
measurement, classification and modelling [Doctoral the-sis]. Cambridge, MA, Massachusetts Institute of Technol-ogy, 1982.
15. Hoevers J, Loudon RG. Measuring crackles.
Chest
1990;98: 1240–1243.

Eur Respir Rev
2000; 10: 77, 641–646Printed in UK - all rights reserved
Copyright ©ERS Journals Ltd 2000European Respiratory Review
ISSN 0905 - 9180
Future perspectives for respiratory sound research
J.E. Earis
*
, B.M.G. Cheetham
**
aa
Although respiratory sound analysis by computer hasseen major innovations over the past 30 yrs [1–4] it hasnot, as yet, found a major place in clinical medicine. It isself-evident that modern technology offers immense ad-vantages with respect to the capture, storage, analysis andcommunication of sounds that are normally heard througha stethoscope, but it remains to be conclusively estab-lished how these facilities can routinely and effectively beemployed to aid the day-to-day diagnosis and manage-ment of patients with respiratory diseases.
Among the commonly reported applications of compu-terized respiratory sound analysis are the graphical pres-entation of features of importance [4–6], the making ofpermanent records of such features, correlation of respira-tory sound with other physiological signals (particularlyairflow at the mouth) [5, 7], comparison of data obtainedat different times during the progression of respiratory dise-ases or their treatment [8], long-term monitoring of asthma[9, 10], monitoring of breathing patterns of infants [11],monitoring of respiratory sounds of adults in critical caresettings [12] and detection of features and patterns that arenot easily recognized by the human ear [13–15]. A per-spective on the future for computerized sound analysis canbe gained by considering its potential for these applica-tions.
Technical perspectives
One of the problems that is limiting the wider use oflung sounds is the technical difficulty of capturing soundfrom the surface of the body. No sensor is ideal, and it isonly in recent years that the responses of microphones
when attached to the chest in various ways have beenextensively analysed [16]. Small air-coupled electret micro-phones in light-weight housings are commonly used, par-ticularly in Europe. Contact accelerometers are used moreoften in North American centres (see Current Methodsused for Computerized Respiratory Sound Analysis in thisissue). Ideal sizes and shapes for air-coupled microphonehousings have recently been proposed [17], taking intoconsideration that the frequency responses obtained willbe very different from what would be obtained from thesame microphones in free field. It is clear that the soundwill be strongly attenuated at higher frequencies,
i.e.
aboveabout 1 kHz [5], and the loss of this higher frequencyinformation is considered by some researchers to be aconsiderable disadvantage. Contact sensors are fragile,have a limited bandwidth and exhibit internal resonancesat frequencies within the bandwidth of interest for lungsounds. Many technical problems of signal capture fromthe surface of the body remain to be solved. An idealsensor should be of minimal mass, as wide a bandwidthas possible and be relatively insensitive to environmentalnoise. Arrays of such sensors may be connected togetherto allow acoustic mapping of the chest wall. Innovationssuch as laser microphones, piezo-electric membranes andhighly directional microphone elements should, in future,provide more efficient methods of capturing lung sounds.
The problem of environmental background noise is ofparticular importance in normal clinical environments.Clearly, its effect must be reduced as far as possible byacoustic shielding and the use of suitable sensors. Newerdigital signal processing techniques, employing adaptivedigital filtering by computer or microprocessor, are beingsuccessfully applied [18] to further reduce the effect of
Future perspectives for respiratory sound research. J.E. Earis, B.M.G. Cheetham. ©ERSJournals Ltd 2000.
ABSTRACT: Modern technology may now be used to great advantage for the cap-ture, storage, analysis and communication of sounds that are normally heard througha stethoscope. State-of-the-art digital signal processing equipment is already beingused for such purposes in clinical medicine, but the advantages of computerizedsound analysis remain to be fully explored. This paper aims to give some perspectiveon how modern digital signal processing technology is likely to be exploited for clini-cal use in the future. Applications, including diagnostic evaluation, remote monitor-ing and data exchange by Internet, are considered. It is concluded that the limitingfactor is no longer the power, storage capacity, capability or speed of readily availablepersonal computers. The further development of sound acquisition techniques, signalprocessing algorithms and software packages that exploit existing technology effec-tively will be the key to further progress.
Eur Respir Rev 2000; 10: 77, 641–646.
*Aintree Chest Centre, University Hospi-tal Aintree, Liverpool, UK. **Dept ofComputer Science, University of Man-chester, Oxford Rd, Manchester, UK.
Correspondence: J.E. Earis, Aintree ChestCentre, University Hospital Aintree, Long-moor Lane, Liverpool L9 7AL, UK.
Keywords: Respiratory soundssound research
This paper is part of the publications of theCORSA project supported by the EUBIOMED I programme (contract BMH1-CT94-0928) and by the European Respira-tory Society (ERS task force).
642
J
.
E
.
EARIS
,
B
.
M
.
G
.
CHEETHAM
background noise and other interfering signals. Thereduction of interfering sound from intercostal muscles,chest-wall movement and the heart can be more difficultto achieve without significantly disturbing the waveformsthat are of interest. This interference is predominantly atlow frequencies,
i.e.
below about 100 Hz, and is often sohigh in amplitude that saturation of the analogue-to-digitalconversion will occur resulting in non-linearity of theamplification process. A high-pass analogue filter, with acut-off frequency of between about 70 and 100 Hz is com-monly used to attenuate this interference before the micro-phone signal is amplified and digitized [19]. Alternativestrategies for reducing the heart signal include ECG gat-ing where sounds are only recorded during diastole [20].Once the signal has been digitized without amplifier satu-ration, "active" cancellation of various types of interfer-ence or artefacts,
e.g.
heart sounds, may be achieved bymeans of adaptive digital filters [18]. Artefact recognitionand cancellation may in future become an in-built androutine part of the sound capture and digitization process.
A survey of the technology and methods used overrecent years for the capture, pre-filtering, digitization andanalysis of lung sounds, undertaken as part of the CORSAproject, reveals that a variety of approaches have beenadopted with relatively few comparisons or discussionsgiven of advantages and/or disadvantages of the differentapproaches (see "Current Methods of Lung Sound Analy-sis" in this journal). Recommendations have been madeby CORSA for acquisition and digitization techniques forrespiratory sounds, which will not only guarantee signalswith an acceptable standard of fidelity for research workwithin an individual centre, but also enable data from dif-ferent centres to be freely exchanged, pooled and compa-red. Acoustic analysis applied to lung sounds is a rapidlydeveloping field, and rigid standardization must not beimposed on the research community in such a way that thedevelopment of new techniques is inhibited. However, it isvital for the development of the research area that accepta-ble standards of documentation and repeatability be main-tained in reports and research publications.
The processing power of readily available equipment isnow so great that it is rarely a limiting factor in the field oflung sounds analysis. Computations that may have takenminutes or hours on desktop computers some years agoare now performed apparently instantaneously. For exam-ple, spectrographs can be readily produced in real time forrespiratory sounds [21] in a frequency range up to, andbeyond, 4 kHz. In future, even highly sophisticated ana-lysis and monitoring procedures will most likely be imple-mented in real time, eliminating the tedious process ofrecording signal files and processing selected portions inbatch mode.
Current analysis techniques have recently been revie-wed by S
OVIJARVI
et al
. (see "Characteristics of breathsounds and adventitious sounds" in this issue) and others[4–6]. One important development is the widespread useof flexible signal processing tools, such as those providedby the MATLAB software package, allowing signal pro-cessing algorithms to be conveniently tried out before theyare incorporated into dedicated analysis packages or hard-ware. The capacity and convenience of storage media have
increased rapidly in parallel with the huge increases inprocessing power. Inexpensive magnetic disks are nowcapable of storing data representing enormous quantitiesof respiratory sound, to an extent unimagined by mostresearchers a few years ago. Limitations of available stor-age capacity are unlikely to be major factors in the futuredevelopment of respiratory sound analysis.
The impact of the Internet on future developments inrespiratory sounds analysis should not be underestimated.It is a vehicle for the exchange of software, databases andsound and video files. It is also a platform for remotemonitoring and a powerful educational tool. Already,websites exist that provide information about respiratorysounds. Two such websites are the International LungSounds Association (ILSA) site (http://www.ilsa.cc/) andthe R.A.L.E. site (http://www.rale.ca/), which supply de-tails of current world-wide research in lung sounds andrelated areas, a comprehensive database of publishedpapers, details of how to contact others interested in thisfield and links to other research sites involved in acousticanalysis. The R.A.L.E. site also exploits multi-media com-munications technology to provide examples of respira-tory sound signals that may be downloaded, listened to byany computer user and used by researchers as representa-tive data. This development surely signposts immense pos-sibilities in the future for the use of Internet technology.
One goal of current technological developments is tocombine processing power, storage, miniaturization of com-ponents and analysis programmes into a small hand-heldcomputerized stethoscope that will provide the clinicianwith much more useful information than the current sim-ple mechanical stethoscope.
Clinical applications
Analysis by computer is more likely to be successful inclinical applications when it is based on mathematicalmodels of the underlying physical mechanisms of respira-tory sound production. Such models allow the interactionof mechanical forces, airflow and sound transmissionwithin the respiratory tract to be understood and related todifferent disease processes The following clinical applica-tions have benefited from this approach.
Diagnosis based on breath sounds
There is much evidence that breath sounds originatepredominantly in larger airways (inspiration in lobar air-ways and expiration in more proximal airways) [22] andthus, when heard on the chest wall, they contain informa-tion about their origin and the way they have been trans-mitted through the lung. The fact that, even in normalindividuals, their amplitudes and frequency spectra varybetween different chest wall sites [23, 24] is further evi-dence that they contain regional information. Moreover,it is now known from phase-delay measurements andair-density studies that the sound transmission at lowerfrequencies (below 300 Hz) is mainly due to parenchymawave propagation, while higher frequency sounds are

PERSPECTIVES
OF
RESPIRATORY
SOUND
RESEARCH
643
propagated more through airways [25]. Thus, newer ins-trumentation capable of acquiring higher-frequency soundmay provide more information about different structureswithin.the lungs than was possible previously, using morerestricted bandwidths. Clearly, the intensity and frequencyspectrum of breath sound are related to the airflow meas-ured at the mouth [23, 26]. A series of recent experiments,using bronchial challenge, showed that even in the absenceof wheeze, significant changes in the intensity and fre-quency spectra of breath sounds occur with fairly smallchanges in forced expiratory volume in one second(FEV
1
),
i.e.
changes of as little as 10% [13, 15]. In a pop-ulation study, G
AVRIELLY
et al
. [27] showed that changesin lung sounds spectra can be used as a means of detectingthe early stages of airways disease. The future holds theprospect of using acoustic mapping of the surface of thechest wall to noninvasively measure regional ventilationand airflow obstruction within the lungs. This prospect isof particular importance in the treatment of children andthe evaluation of the pulmonary functions of patients incritical care settings. Monitoring abnormal breath soundsmay also reveal a variety of other applications; for exam-ple, bronchial breathing could be monitored in the treat-ment of pneumonia.
Breath sounds acquired at the trachea are higher inintensity, observable over a wider frequency range andeasier to capture than sounds from the chest wall [4, 5].There is a strong correlation between airflow, sound inten-sity and mean frequency [28]. Measurements of intensityand spectral shape have already been used to provide anoninvasive indication of airflow in sleep studies [8] andas the basis of apnoea monitoring [29]. There is also evi-dence that such measurements may be of value in diag-nosing and monitoring tracheal obstruction, and it shouldbe possible to use tracheal breath-sound analysis as ameans of indicating the occurrence of structural and dy-namic changes in the upper airway [30]. Finally, the ana-lysis of breath sounds detected simultaneously at both thetrachea and the chest wall should be further investigatedas the two signals will contain different, but complimen-tary, information that may be useful in studying underly-ing pathophysiology in the lung.
Diagnosis based on adventitious lung sounds
When acoustic analysis was first applied electronicallyto lung sounds, wheezes and crackles seemed to be thephenomena most likely to yield useful clinical informa-tion [1, 3, 4]. Wheezes had been the most common type ofadventitious sounds investigated for diagnostic purposesusing the stethoscope, and it was natural to seek ways ofapplying computer analysis to improve our understandingof these sounds and their significance. Fundamental stud-ies of the underlying mechanisms of wheeze suggestedthat "flutter" in bronchi is largely responsible, althoughthere is still debate about some aspects of this underlyingmechanism [31, 32]. Computational models based on thetheoretical equations governing airflow in floppy tubeshave been proposed and implemented in software as a
means of increasing and testing our understanding oflikely sound production mechanisms.
Clearly, audible wheezes can be easily detected andanalysed by computer, and procedures such as event re-cognition, spectral analysis, classification and countingrequire only straightforward [5] software to be implemen-ted. This software becomes slightly more complicated whenquieter wheezes need to be extracted from the accompa-nying breath sounds. The software can be used for long-term monitoring of asthmatic patients, particularly atnight, to assess the severity of symptoms and the efficacyof treatments. Wheeze analysis can provide informationabout the degree of airflow obstruction,
e.g.
by determin-ing what proportion of each expiration cycle containswheeze [9]. Such analysis may give early warning of the"silent chest" in acute severe asthma. The monitoring ofadventitious wheezing sounds has a place in the treatmentof adults and is likely to be of even greater use in theassessment of babies and infants who cannot perform res-piratory function tests such as peak-flow measurements.
Crackles, the other main type of adventitious pulmo-nary sound, have also been subjected to extensive investi-gation [3, 4, 33] by various means. Using a stethoscope,these sounds can be detected, categorized as "fine" or"coarse" and observed as occurring at particular phases ofthe inspiratory or expiratory [34] cycle. These attributes ofcrackles have been found to correlate with different dis-ease processes and are routinely used to assist in clinicaldiagnosis [35]. With modern technology, it is now possi-ble to analyse crackles to determine their attributes moreaccurately and objectively. Identifying crackles and count-ing the average number of crackles within each breathcycle to a reasonable degree of accuracy [36, 37] is anideal task for a computer. The use of linear and non-lineardigital filters, artificial neural networks and newer meth-ods of parametric spectral analysis should enable evenmore accurate automatic recognition and characterizationof crackles [38]. Crackles heard at the surface of the chestare likely to come from lung tissue adjacent to the micro-phone and hence represent local pathology involving theopening of smaller airways [4]. Using mapping procedu-res similar to those employed in the science of seismology,the sources of crackles may be localized within the lungparenchyma. In asbestosis, the number of crackles perbreath cycle has been found to be indicative of the severityof disease [39]. Similar relationships may also be presentin other interstitial processes. Thus, there may be scopefor monitoring interstitial disease, particularly if surfacemapping becomes a practical proposition. Such monitor-ing could be used, for example, for assessing the effect oftreatment on fibrosing alveolitis and monitoring the pro-gression of asbestosis. In hospitals, monitoring of heartfailure and pneumonia by crackle counting [40] and mapp-ing is also on the horizon, though the problem of reducingbackground noise must be solved to make this practical.Similar approaches may be adopted for monitoring thedevelopment of pulmonary oedema or interstitial lung dis-ease in critical care settings. New algorithms for identify-ing and measuring adventitious lung sounds are beingdeveloped in various research centres and will affect thefuture of medical practice in many ways.
644
J
.
E
.
EARIS
,
B
.
M
.
G
.
CHEETHAM
Diagnosis based on upper-airway sounds
The analysis by computer of upper airway sounds formedical diagnostic purposes has been an area of activeresearch for many years and has been the subject of manypublications over the past five years [41]. These sounds,which include speech and speech-like signals, snoring,stridor and cough, are amenable not only to acoustic anal-ysis as used traditionally in medicine for lung sounds butalso to advanced signal processing techniques, as appliedin speech technology (recognition, compression, model-ling,
etc.
) applied to the rapidly developing fields of tele-communications [30].
Sleep apnoea syndromes occur in up to 5% of the popu-lation, and diagnosis depends on monitoring multiple phy-siological signals (polysomnography). It is expensive tofully investigate a sufferer, and alternative diagnostic tech-niques are needed. Acoustic differences between post-apnoeic and simple snoring sounds have been identifiedelectronically [42], and this may be useful for assessingpatients and studying the fundamental nature of these phe-nomena.
Clinically relevant acoustic analysis of snoring has beenconfined mainly to measurements of duration and inten-sity and is possible using several types of commerciallyavailable monitoring equipment [43]. Wave-form analysisusing sonograms, has been difficult to relate to clinicalobservations [44]. It is known that upper airway surgery asa treatment for simple snoring alters the frequency spec-trum of the sound produced but is not always successful inreducing its incidence or loudness, especially in the long-term. Theoretical models of upper airway function havebeen proposed for understanding the sound generationmechanism [45]. Research in this area may be expected tolead to routine methods of using acoustic analysis to diag-nose sleep-related syndromes and monitor the effect oftreatment such as surgery and continuous positive airwaypressure (CPAP).
The characteristics of the sound produced by differentforms of cough have been studied by many researchers[46–48] and instrumentation measuring the rate of cough-ing has been proposed for monitoring the effectiveness oftreatments, particularly in children [49]. There is evidencethat differences in the characteristics of coughing fromone pathological condition to another will be measurableand show a useful degree of consistency [50]. The clinicalvalue of such observations needs further evaluation.
The analysis of speech and speech-like sounds has longbeen used as a means of detecting disease or abnormalitiesin the vocal cords. Abnormalities caused by acute infectivelaryngitis, chronic non-specific laryngitis, benign and ma-lignant tumours, vocal-cord paralysis and laryngeal myo-pathy secondary to inhaled steroids may be investigatedand monitored in this way. Such analysis has also beenproposed as a convenient means of assessing the suscepti-bility of patients to sleep apnoea and snoring. Fortunately,such analysis benefits from a vast amount of knowledgeand processing expertise gained from applications in thespeech technology and telecommunications industry.
Remote monitoring
Remote monitoring in medicine is an active and ex-panding field. Telemetry is commonly used to monitorcardiac rhythm disturbances in ambulatory patients recov-ering from myocardial infarctions. Remote monitoring ofother physiological signals in patients at home or at workhas many clinical, economic and social benefits. It is espe-cially applicable to conditions such as sleep apnoea and"brittle" asthma. Simple sound acquisition equipment anda means of transmitting data
via
fixed or mobile tele-phone, possibly
via
the Internet, has many possible usesin this area. Unintelligent collection of signals could resultin vast amounts of useless data, so intelligence is neededto decide what to preserve and when to transmit it. Theintelligence could be based simply on sound intensitymeasurements though more sophisticated decisions wouldprobably be needed, based, for example, on wheeze det-ection, breath-sound quality as an indication of airflowobstruction, episodes of snoring, coughing and the nonin-vasive detection apnoea episodes. Once a segment ofsound has been captured, the remote intelligence can havethe capability of carrying out a further analysis in non-realtime to decide whether the data really do have only fea-tures of interest.
Portable equipment for remote monitoring would usethe technology developed for portable computers, theInternet and mobile phones [50] and can now be mass-produced at reasonable cost. The cost of transmission canbe made relatively cheap for fixed telephone links and isfalling rapidly in the mobile field. The more extensive useof respiratory sound monitoring, especially within criticalcare environments, is therefore becoming more likely witha greater understanding of the information within thesesounds.
Education
There is great potential for the results of research anddevelopment discussed in this paper to be used in the edu-cation of medical students and trainees. There is equalscope for the continuing education of qualified staff whouse auscultation in the day-to-day evaluation of patients.Remote teaching and learning, virtual universities and con-tinuing education,
via
modern communication media suchas the Internet, are becoming major initiatives in manyspheres of activity, including medicine, nursing and alliedprofessions. The universal availability of powerful personalcomputers with high-quality multi-media equipment link-ed to the Internet [52, 53] (and private intranet systemsas being proposed for health services) makes it straight-forward for educational establishments to distributeeducational material in the form of sounds, pictures, ani-mation and software as well as accessible supporting text.As electronic commerce in all fields develops, the com-mercial marketing of educational packages will becomemore and more routine. On-line tutorials, "virtual semi-nars", coursework, assessment and examinations will beoffered
via
the Internet or similar electronic means. Mar-kets for such educational material will be worldwide, thus

PERSPECTIVES
OF
RESPIRATORY
SOUND
RESEARCH
645
giving great incentive for educational establishments todevelop high-quality, stimulating and exciting courses. Inthe future, the majority of higher educational establish-ments in most disciplines, including medicine, may servemainly to provide supportive environments, whereby stu-dents study courses prepared by a small number of estab-lishment specializing in course preparation. Courses usingmulti-media facilities to demonstrate the principles of aus-cultation would be a small, but interesting, part of thisoverall scenario. The advantages of such an approach tothe study of lung sounds have already been demonstratedby the material made available on the Internet by ILSA(http://www.ilsa.cc/) and R.A.L.E. (http://www.rale.ca/).
Conclusions
It is clear that digital signal processing techniques andmodern communications may be applied to study lungand upper-airway sounds as an aid to clinical diagnosis.Compared with the ubiquitous acoustic stethoscope, a com-puter equipped with sound acquisition equipment offerssubjectivity, quantitative results in graphical form, long-term storage, instant communications and many otheradvantages. Disadvantages such as increased cost andphysical size are disappearing with the reducing cost ofcomputer hardware, portable computing and mobiletelephony. Useful investigations may be performed usingstandard personal computers, as installed in most doctors'surgeries, and can therefore be of particular value to pri-mary care physicians who do not have easy access tosophisticated diagnostic equipment. There may be extraadvantages in devising computer-based examination pro-cedures specifically for children and babies who may beuncooperative with standard procedures. Computerizedanalysis is ideally suited to the long-term monitoring ofpatients either in hospital or in the community, and shouldalso be of value in less-developed countries and remotecommunities. This paper mentions some of the areaswhere the computer analysis of respiratory sounds isknown to be of clinical value. The most likely areas forearly exploitation are the study of upper-airway problemsin patients with sleep apnoea and heavy snoring, coughand wheeze monitoring, the evaluation of lower-airwaydynamics including the recognition of early manifesta-tions of airway disease and the use of remote monitoringof interstitial and airway disease (particularly in a criticalcare environment). An exciting prospect for the futurewould be the routine availability of a miniaturized porta-ble apparatus with the ability to capture both sound andairflow, implement simple and clinically useful analysispackages and, when necessary, communicate data
via
mobile telephony to a specialist centre in a local hospital.This could be mass-produced as a multipurpose "compu-terized stethoscope" and may replace the current acousticstethoscope as a basic tool for future doctors.
References
1. Earis J. Lung sounds [editorial].
Thorax
1992; 47: 671–672.2. Forgacs P. Breath sounds.
Thorax
1970; 25: 255.
3. Loudon R, Murphy R. Lung sounds.
Am Rev Respir Dis
1984; 130: 663–673.4. Pasterkamp H, Kraman S, Wodicka G. Respiratory
sounds. Advances beyond the stethoscope.
Am J RespirCrit Care Med
1997; 156: 974–987.5. Gavriely N, Cugell D. Breath Sound Methodology. Boca
Raton, CRS Press, 1995.6. Pasterkamp H, Carson C, Daien D, Oh Y. Digital respiro–
sonography. New images of lung sounds.
Chest
1989; 96:1405–1412.
7. Pasterkamp H. New developments and knowledge in res-earch of respiratory sounds.
Pneumologie
1992; 46: 602–611.8. Cummiskey J, Williams T, Krumpe P, Guilleminault C.
The detection and quantification of sleep apnea by tra-cheal sound recordings.
Am Rev Respir Dis
1982; 126:221–224.
9. Baughman R, Loudon R. Lung sound analysis for contin-uous evaluation of airflow obstruction in asthma.
Chest
1985; 88: 364–368.10. Lenclud C, Cuttitta G, Van GD,
et al
. Evaluation of noc-turnal bronchoconstriction by all night tracheal soundmonitoring.
Thorax
1996; 51: 694–698.11. Werthammer J, Krasner J, DiBenedetto J, Stark A. Apnea
monitoring by acoustic detection of airflow.
Pediatrics
1983; 71: 53–55.12. Krumpe P, Cummiskey J. Use of laryngeal sound recordings
to monitor apnea.
Am Rev Respir Dis
1980; 122: 797–801.13. Anderson K, Aitken S, Carter R, MacLeod J, Moran F.
Variation of breath sound and airway caliber induced byhistamine challenge.
Am Rev Respir Dis
1990; 141:1147–1150.
14. Malmberg L, Sovijarvi A, Paajanen E, Piirila P, HaahtelaT, Katila T. Changes in frequency spectra of breath sou-nds during histamine challenge test in adult asthmaticsand healthy control subjects.
Chest
1994; 105: 122–131.15. Pasterkamp H, Consunji-Araneta R, Oh Y, Holbrow J.
Chest surface mapping of lung sounds during metha-choline challenge.
Pediatr Pulmonol
1997; 23: 21–30.16. Pasterkamp H, Kraman S, DeFrain P, Wodicka G. Meas-
urement of respiratory acoustical signals. Comparison ofsensors [see comments].
Chest
1993; 104: 1518–1525.17. Kraman S, Wodicka G, Oh Y, Pasterkamp H. Measure-
ment of respiratory acoustic signals. Effect of micro-phone air cavity width, shape, and venting.
Chest
1995;108: 1004–1008.
18. Suzuki A, Sumi C, Nakayama K, Mori M. Real-timeadaptive cancelling of ambient noise in lung sound meas-urement.
Med Biol Eng Comput
1995; 33: 704–708.19. Vannuctini L, Earis JE, Helistö P,
et al
. Capturing andpreprocessing of respiratory sounds.
Eur Respir Rev
2000; 10: 77, 616–620.20. Pasterkamp H, Fenton R, Tal A, Chernick V. Interference
of cardiovascular sounds with phonopneumography inchildren.
Am Rev Respir Dis
1985; 131: 61–64.21. Sun XQ, Cheetham BMG, Earis JE. Real-time analysis of
lung sounds.
Technol Healthcare
1998; 6: 3–10. 22. Kraman S, Wang P. Airflow-generated sound in a hollow
canine airway cast.
Chest
1990; 97: 461–466. 23. Gavriely N, Nissan M, Rubin A, Cugell D. Spectral char-
acteristics of chest wall breath sounds in normal subjects.
Thorax
1995; 50: 1292–1300.24. Dosani R, Kraman S. Lung sound intensity variability in
normal men. A contour phonopneumographic study.
Chest
1983; 83: 628–631.25. Patel S, Lu S, Doerschuk P, Wodicka G. Sonic phase
delay from trachea to chest wall: spatial and inhaled gasdependency.
Med Biol Eng Comput
1995; 33: 571–574.
646
J
.
E
.
EARIS
,
B
.
M
.
G
.
CHEETHAM
26. Shykoff B, Ploysongsang Y, Chang H. Airflow and nor-mal lung sounds.
Am Rev Respir Dis
1988; 137: 872–876.27. Gavriely N, Nissan M, Cugell D, Rubin A. Respiratory
health screening using pulmonary function tests and lungsound analysis.
Eur Respir J
1994; 7: 35–42.28. Charbonneau G, Sudraud M, Soufflet G. Method for the
evaluation of flow rate from pulmonary sounds.
Bull EurPhysiopathol Respir
1987; 23: 265–270.29. Beckerman R, Wegmann M. A comparison of tracheal
breath sounds, airflow, and impedance pneumography inthe detection of childhood apnea.
Sleep
1985; 8: 342–346.
30. Plante F, Kessler H, Sun XQ, Cheetham BMG, Earis JE.Inverse filtering applied to upper airway sounds.
TechnolHealthcare
1998; 6: 23–32.31. Spence D, Bentley S, Evans D, Morgan M. Effect of
methacholine induced bronchoconstriction on the spec-tral characteristics of breath sounds in asthma.
Thorax
1992; 47: 680–683.32. Gavriely N, Shee T, Cugell D, Grotberg J. Flutter in flow-
limited collapsible tubes: a mechanism for generation ofwheezes.
J Appl Physiol
1989; 66: 2251–2261.33. Murphy R. Crackles: methods of assessment.
MonaldiArch Chest Dis
1993; 48: 586–587.34. Munakata M, Ukita H, Doi I,
et al
. Spectral and wave-form characteristics of fine and coarse crackles.
Thorax
1991; 46: 651–657.35. Murphy R, Sorensen K. Chest auscultation in the diagno-
sis of pulmonary asbestosis.
J Occup Med
1973; 15: 272–276.
36. Murphy R, Del BE, Davidson F. Validation of an auto-matic crackle (rale) counter.
Am Rev Respir Dis
1989;140: 1017–1020.
37. Kaisla T, Sovijärvi ARA, Piirilä P, Rajala H, Haltsonen S,Rosqvist T. Validated method for automatic detection oflung sound crackles.
Med Biol Eng Comput
1991; 29:517–521.
38. Arakawa K, Harashima H, Ono M, Mori M. Non-lineardigital filters for extracting crackles from lung sounds.
Front Med Biol Eng
1991; 3: 245–257.39. Murphy R, Gaensler E, Holford S, Del BE, Epler G.
Crackles in the early detection of asbestosis.
Am RevRespir Dis
1984; 129: 375–379.
40. Piirilä P. Changes in crackle characteristics during theclinical course of pneumonia.
Chest
1992; 102: 176–183.41. Earis JE, Cheetham BMG. Current methods used for
computerized respiratory sound analysis.
Eur Respir Rev
2000; 10: 77, 586–590.42. Perez-Padilla J, Slawinski E, Difrancesco L, Feige R,
Remmers J, Whitelaw W. Characteristics of the snoringnoise in patients with and without occlusive sleep apnea.
Am Rev Respir Dis
1993; 147: 635–644.43. Penzel T, Amend G, Meinzer K, Peter J, von WP.
MESAM: a heart rate and snoring recorder for detectionof obstructive sleep apnea.
Sleep
1990; 13: 175–182.44. Fiz J, Abad J, Jane R,
et al
. Acoustic analysis of snoringsound in patients with simple snoring and obstructivesleep apnoea.
Eur Respir J
1996; 9: 2365–2370.45. Beck R, Odeh M, Oliven A, Gavriely N. The acoustic
properties of snores.
Eur Respir J
1995; 8: 2120–2128.46. Toop L, Thorpe C, Fright R. Cough sound analysis: a new
tool for the diagnosis of asthma?
Fam Pract
1989; 6: 83–85.
47. Piirilä P, Sovijärvi A. Objective assessment of cough.
EurRespir J
1995; 8: 1949–1956.48. Doherty M, Wang L, Donague S,
et al
. The acoustic prop-erties of capsaicin-induced cough in healthy subjects.
EurRespir J
1997; 10: 202–207.49. Thorpe C, Fright W, Toop L, Dawson K. A microcom-
puter-based interactive cough sound analysis system.
Comput Meth Prog Biomed
1991; 36: 33–43.50. Piirilä P, Sovijärvi A. Differences in acoustic and
dynamic characteristics of spontaneous cough in pulmo-nary diseases.
Chest
1989; 96: 46–53.51. Bhat K, Scott P, Eigen H, Boggs P. Evaluation of lung
sounds by telephone.
Ann Allergy
1985; 54: 109–111.52. Pasterkamp H. Computer assited learning of chest auscul-
tation: the Respiratory Acoustics Laboratory Environ-ment.
In: Van Bemmel JH, Zvarova J, eds. Informationand Medical Education. Elsevier North Holland, NewYork, NY, 1995; pp. 244–251.
53. Mangione S, Nieman L, Gracely E. Comparison of com-puter-based learning and seminar teaching of pulmonaryauscultation to first-year medical students. Acad Med1992; 67: S63–S65.

Eur Respir Rev
2000; 10: 77, 647–649Printed in UK - all rights reserved
Copyright ©ERS Journals Ltd 2000European Respiratory Review
ISSN 0905 - 9180
Appendix: Abbreviations and acronyms for terms involved in computerized respiratory sound studies
A.R.A. Sovijärvi, F. Dalmasso, J. Vanderschoot, L.P. Malmberg, G. Righini, S.A.T. Stoneman
aaA
A
A ampere (unit of electric current intensity)
AC alternating current
ADC Analogue-to-digital converter
AI apnoea index
AM amplitude modulation
ANSI American National Standards Institute
AR autoregressive
ARMA autoregressive moving average
ASCII American Standard Code for InformationInterchange
ATP ambient temperature and barometricpressure
ATPS Ambient temperature and barometricpressure saturated (with water vapour)
B
BMI body mass index
BPT bronchial provocation test
C
CD compact disc
CDR compact disc recordable
CD-ROM compact disc-read only memory
COPD chronic obstructive pulmonary disease
CPAP continuous positive airway pressure
CSA central sleep apnoea
CT computed tomography
D
DAC digital-to-analogue converter
DAT digital audio tape
dB decibel
DC direct current
DFT discrete Fourier transform
DSP digital signal processor
E
ECG electrocardiogram
EEG electroencephalogram
EMG electromyogram
EOG electro-oculogram
EPP equal pressure point
ERS European Respiratory Society
ERV expiratory reserve volume
ETCO
2
end-tidal carbon dioxide
This study was supported by the EU BIOMED I programme (contact BMH1-CT94-0928) and by the European Respiratory Society (ERS task force).
This paper forms part of the publications of the CORSA project.

648
A
.
R
.
A
.
SOVIJÄRVI
ET
AL
.
F
f
frequency
FEV
1
forced expiratory volume in one second
FET
b
forced expiratory time at a specifiedportion b of the FVC
FEW forced expiratory wheeze
FFT fast Fourier transform
F
I,O
2
inspiratory oxygen fraction
FIR finite impulse response
FIV
1
forced inspiratory volume in one second
FIVC forced inspiratory vital capacity
FM frequency modulation
FRC functional residual capacity
FVC forced vital capacity
H
H height
I
IC inspiratory capacity
IDW initial deflection width (crackles)
I:E inspiratory-to-expiratory ratio
IFT inverse Fourier transform
IIR infinite impulse response
I/O input/output
K
kg kilogram (unit of mass)
L
LDW Largest deflection width (crackles)
L
eq
equivalent sound level
LPC linear prediction code
LSA lung sound analysis
M
M (m) mass
m meter (unit of length)
MA moving average
MDU metered-dose inhaler
MMEF maximal mid-expiratory flow
modem modulator/demodulator
mol mole (unit of quantity of substance)
MSA mixed sleep apnoea
MVV maximal voluntary ventilation
N
N newton (unit of force)
O
OSA obstructive sleep apnoea
OSAS obstructive sleep apnoea syndrome
P
P
A,O
2
alveolar oxygen tension
P
a,O
2
arterial oxygen tension
P
a,CO
2
arterial carbon dioxide tension
PEEP positive end-expiratory pressure
PEF peak expiratory flow
PEFR peak expiratory flow rate
PIF peak inspiratory flow
P
oes
oesophageal pressure
PPG phonopneumography
PSD power spectral density
R
RAM random-access memory
Raw airway resistance

APPENDIX
:
ABBREVIATIONS
AND
ACRONYMS
649
REM rapid eye movement
ROM read-only memory
RMS root-mean-square
RV residual volume
S
s second (unit of time)
SA sleep apnoea
S
a,O
2
arterial oxygen saturation
SAS sleep apnoea syndrome
s
G
aw
specific airways conductance
SI International System of Unity
SNR (S/N) signal-to-noise ratio
SOM self-organizing map
SPL Sound pressure level
S
p,O
2
arterial oxygen saturation measured bypulse oximetry
STPD standard temperature pressure dry
STFT short-time Fourier transform
T
T
L,CO
transfer factor of the lung for carbon monoxide
TEW time-expanded waveform
TGV thoracic gas volume
TLC total lung capacity
TV tidal volume
2CD two-cycle duration (crackles)
V
VC vital capacity
W
W watt (unit of power)
W weight
Z
Z impedance