standardised level difference data sheets (d ,...
TRANSCRIPT
THE BUILDING PERFORMANCE CENTRE
SCHOOL OF THE BUILT ENVIRONMENT
NAPIER UNIVERSITY
Standardised Level Difference Data Sheets
(D2m,nT, D0.01m,nT)
NANR116: ‘OPEN/CLOSED WINDOW RESEARCH’
SOUND INSULATION THROUGH VENTILATED DOMESTIC WINDOWS
April 2007
Research Study Conducted for Department for
Environment, Food and Rural Affairs (Defra)
Submitted by
The Building Performance Centre
School of the Built Environment
Napier University
10 Colinton Road
Edinburgh EH10 5DT
Tel: 0131 455 2569
Fax: 0131 455 2563
email: [email protected]
Web: sbe.napier.ac.uk/bpc
The view expressed in this report are those of the
researchers and do not necessarily reflect those of the Project Sponsors.

iii
Chapter 1 Introduction ........................................................................................... 6
1.1 Introduction to study ..................................................................................... 6
Chapter 2 Test Methodology.................................................................................. 7
2.1 Experimental Details .................................................................................... 7
2.2 Test Procedure............................................................................................. 7
2.3 Filler Wall ..................................................................................................... 9
2.4 Window Assemblies ................................................................................... 10
2.5 - Window test arrangements ..................................................................... 12
Appendix A. Receiving Room Reverberation Time ............................................... 13
Appendix B. Closed Window Results (L6, S1) ...................................................... 14
Appendix C. ‘Untensioned’ Open Window (L6, S1)............................................... 23
Appendix D. Open Window (0.05 m2) Results (L6, S1)......................................... 31
Appendix E. Open Window (0.10 m2) Results (L6, S1) ......................................... 41
Appendix F. Open Window (0.20 m2) Results (L6, S1) ......................................... 51
Appendix G. Ventilator (Closed Window) Results (L6, S1) ................................... 61
Appendix H. Absorbent Room Condition Results (L6, S1) .................................... 89
Appendix I. Alterations to Window Sealing Condition (L6, S1)............................ 103
Appendix J. Closed Window Condition (L1 – L7, S3).......................................... 108
J1 Source Located at Position L1.............................................................. 108
J2 Source Located at Position L2.............................................................. 116
J3 Source Located at Position L3.............................................................. 123

iv
J4 Source Located at Position L4.............................................................. 129
J5 Source Located at Position L5.............................................................. 137
J6 Source Located at Position L6.............................................................. 143
J7 Source Located at Position L7.............................................................. 152
Appendix K. ‘Untensioned’ Open Window Condition (L1 – L7, S3)..................... 159
K1 Source Located at Position L1.............................................................. 159
K2 Source Located at Position L2.............................................................. 170
K3 Source Located at Position L3.............................................................. 179
K4 Source Located at Position L4.............................................................. 187
K5 Source Located at Position L5.............................................................. 197
K6 Source Located at Position L6.............................................................. 206
K7 Source Located at Position L7.............................................................. 217
Appendix L. Open Window (0.05 m2) Window Condition (L1 – L7, S3)............... 227
L1 Source Located at Position L1.............................................................. 227
L2 Source Located at Position L2.............................................................. 241
L3 Source Located at Position L3.............................................................. 250
L4 Source Located at Position L4.............................................................. 258
L5 Source Located at Position L5.............................................................. 266
L6 Source Located at Position L6.............................................................. 275
L7 Source Located at Position L7.............................................................. 286
Appendix M. Open Window (0.10 m2) Window Condition (L1 – L7, S3) ............. 296

v
M1 Source Located at Position L1.............................................................. 298
M2 Source Located at Position L2.............................................................. 398
M3 Source Located at Position L3.............................................................. 321
M4 Source Located at Position L4.............................................................. 329
M5 Source Located at Position L5.............................................................. 337
M6 Source Located at Position L6.............................................................. 346
M7 Source Located at Position L7.............................................................. 357
Appendix N. Open Window (0.20 m2) Window Condition (L1 – L7, S3) .............. 369
N1 Source Located at Position L1.............................................................. 369
N2 Source Located at Position L2.............................................................. 383
N3 Source Located at Position L3.............................................................. 392
N4 Source Located at Position L4.............................................................. 400
N5 Source Located at Position L5.............................................................. 408
N6 Source Located at Position L6.............................................................. 417
N7 Source Located at Position L7.............................................................. 428

Page 6
C h a p t e r 1 I n t r o d u c t i o n
1.1 Introduction to study
This publication presents measured data from a set of laboratory measurements
made in support of the Defra (Department for Environment, Food and Rural Affairs)
Research Contract NANR 116 ‘Open/Closed Window Research: Sound Insulation
Through Ventilated Domestic Windows’.
The data presented are the laboratory measured standardised level difference,
defined for the data-sets presented as:
+−=
0
10
'
22,210
T
TLogLLD mnTm
+−=
0
10
'
201.0,01.010
T
TLogLLD mnTm
where L1, 2m (dB) is the temporally averaged non-diffuse sound pressure level 2 m in
front of the façade (S1 microphone position) whilst L0.01m is the sound pressure level
measured with a microphone attached to, or located approximately 0.01 m from the
façade line (S3 microphone position). L2 is the averaged sound pressure level in the
receiving room (dB), T is the reverberation time in the receiving room (s) and T0 is a
reverberation time reference (0.5 s).

Page 7
C h a p t e r 2 T e s t M e t h o d o l o g y
2.1 Experimental Details
The test laboratory consisted of a 300 m3 anechoic ‘Source’ chamber, connected via
a 12 m2 test aperture, to a 210 m3 reverberation chamber into which new partitions
had been built to create a 38 m3 ‘residential’ room (4.4 x 3.6 x 2.4 m).
Figure 2-1. Section through laboratory
2.2 Test Procedure
A Brüel & Kjær Pulse nine channel data acquisition system was used with 3 fixed
‘Source’ microphones and 6 fixed ‘Receiver’ microphones.
The source signal was pink noise generated by the data acquisition system over a 30
second period. The signal was reproduced through amplifying cabinet loudspeakers.
Five loudspeaker configurations (L1-L5) were set at a distance of 2.72 m from the
centre of the window specimen and at angles of 15º, 55º, 90º, 125º and 165º to the
facade. Loudspeaker position, L6, was located 5 m normal to the centre of the test

Page 8
specimen. A coherent line source, provided by four parallel loudspeakers, was
positioned opposite the façade at a separation of 2.72 m.
The three ‘Source’ microphones S1 to S3, were positioned at heights between 1.2 m
and 1.5 m. These microphones were rotated around the centre of the test window at
fixed radii, depending on the location of the source loudspeaker.
Figure 2-2 Plan of source room microphone and loudspeaker positions
zone of test windows
Page 9
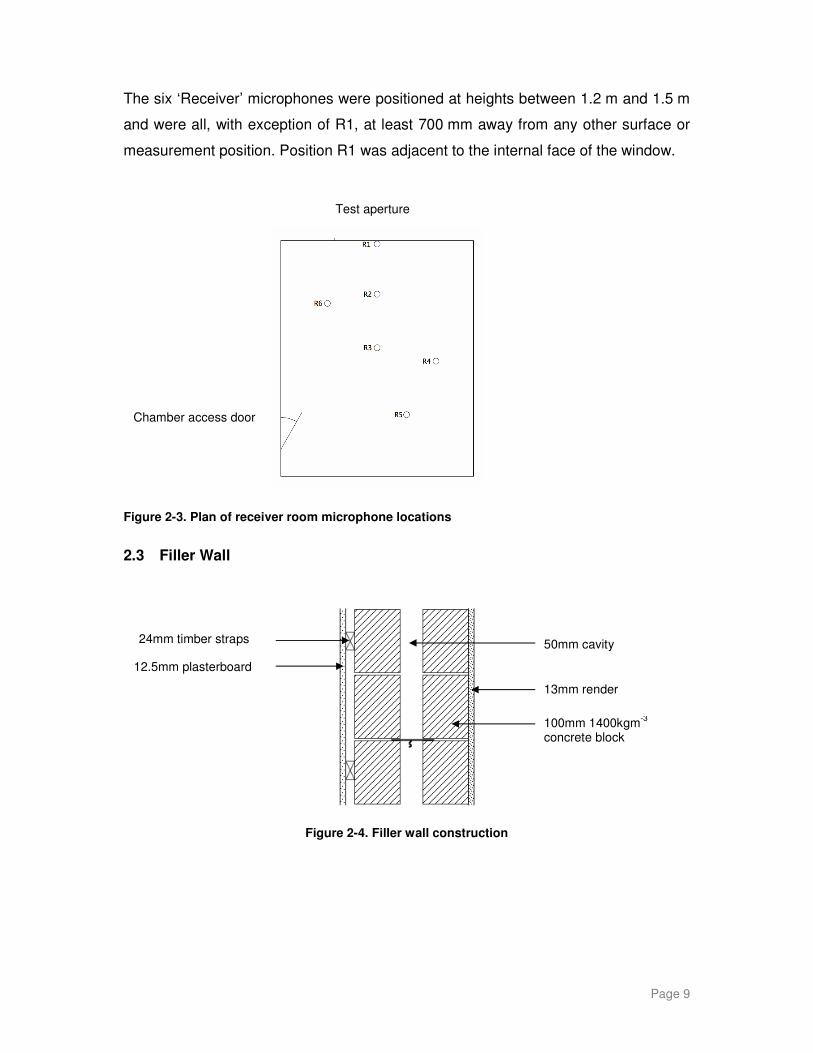
The six ‘Receiver’ microphones were positioned at heights between 1.2 m and 1.5 m
and were all, with exception of R1, at least 700 mm away from any other surface or
measurement position. Position R1 was adjacent to the internal face of the window.
Figure 2-3. Plan of receiver room microphone locations
2.3 Filler Wall
Figure 2-4. Filler wall construction
Test aperture
Chamber access door
50mm cavity
13mm render
100mm 1400kgm-3
concrete block
24mm timber straps
12.5mm plasterboard

Page 10
2.4 Window Assemblies
Sample Description
Frame dimensions
(mm)
(area)
Frame depth (mm)
Glass dimensions
(mm) Mass (kg) Seals
A Vent + side hung (double)
2400 x 1050
(2.52 m2)
60
424 x 834 560 x 600 464 x 194 424 x 834 560 x 600 464 x 194
75.6 Foam
B Reversible 1200 x 1050
(1.26 m2)
71 1004 x 854 35.2 Rubber
C Tilt & turn (inwards)
900 x 1050
(0.95 m2)
70 696 x 846 29.2 Rubber
D Sliding sash 900 x 1200
(1.08 m2)
135 725 x 485 725 x 485
34.8 double brush
E Top hung London
600 x 1050
(0.63 m2)
70 452 x 493 403 x 362
16.9 Rubber
F Top hung London (Aluminium)
600 x 1050
(0.63 m2)
48 530 x 473 487 x 430
16.9 Rubber
G Side hung (Timber)
600 x 900
(0.54 m2)
94 414 x 695 18 foam, nylon sheath
Table 2-1. Physical specification of window test samples
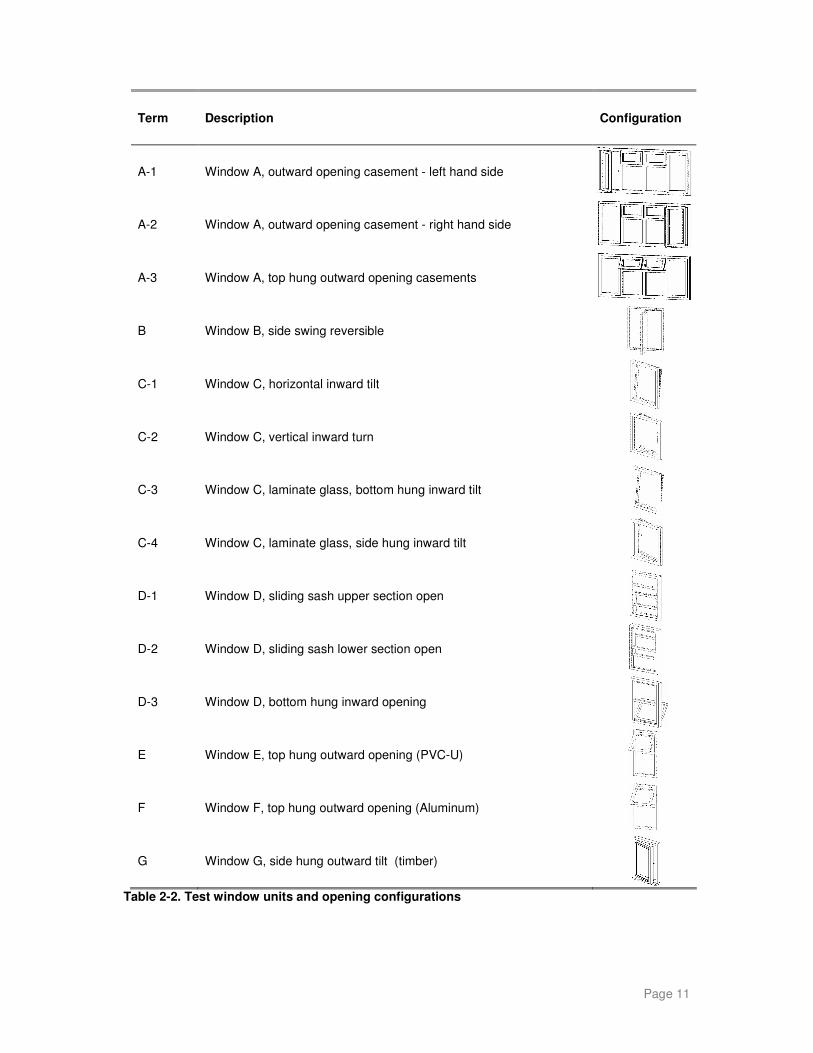
Page 11
Term Description Configuration
A-1 Window A, outward opening casement - left hand side
A-2 Window A, outward opening casement - right hand side
A-3 Window A, top hung outward opening casements
B Window B, side swing reversible
C-1 Window C, horizontal inward tilt
C-2 Window C, vertical inward turn
C-3 Window C, laminate glass, bottom hung inward tilt
C-4 Window C, laminate glass, side hung inward tilt
D-1 Window D, sliding sash upper section open
D-2 Window D, sliding sash lower section open
D-3 Window D, bottom hung inward opening
E Window E, top hung outward opening (PVC-U)
F Window F, top hung outward opening (Aluminum)
G Window G, side hung outward tilt (timber)
Table 2-2. Test window units and opening configurations

Page 12
2.5 - Window test arrangements
The window opening areas are calculated from the combined plane areas between
the opening light and static frame, perpendicular to the plane of the open window.
Term Description
Closed Window was closed.
UT The window catch was released such that the window seals were not compressed.
50K The window was opened to an open area value of approximately 50,000 mm
2.
100K The window was opened to an open area value of approximately 100,000 mm
2.
200K The window was opened to an open area value of approximately 200,000 mm
2.
Table 2-3. Window test conditions descriptors
Test Unit Source Location
Window Opening Source Measurement
Wall A-1 A-2 A-3
B L1 Closed C-1 L2 Untensioned
C-2 L3 S1 C-3 L4 50,000 mm
2 Open S2
C-4 L5 100,000 mm2 Open S3
D-1 L6 200,000 mm2 Open
D-2 Line
D-3 E F G
Table 2-4. Primary Variables Investigated
Investigation was also undertaken of the reverberation time characteristics of the
receiving room, which was varied through the inclusion of progressively greater
quantities of acoustically absorbent material. The resulting reverberation times are
presented in Appendix A.

APPENDIX A
Page 13
Appendix A. Receiving Room Reverberation Time
Condition
D0
Condition
D1
Condition
D2
Condition
D3
Condition
D4
100 0.73 0.77 0.85 0.88 0.67
125 0.75 0.74 0.74 0.69 0.39
160 0.77 0.89 0.85 0.84 0.43
200 0.72 0.58 0.55 0.55 0.29
250 1.26 0.73 0.67 0.65 0.27
315 1.18 0.68 0.60 0.59 0.28
400 1.52 0.62 0.61 0.58 0.26
500 1.44 0.53 0.49 0.48 0.32
630 1.44 0.62 0.52 0.52 0.33
800 1.52 0.73 0.61 0.58 0.37
1000 1.46 0.74 0.70 0.64 0.36
1250 1.48 0.84 0.73 0.70 0.35
1600 1.50 0.84 0.67 0.69 0.32
2000 1.35 0.79 0.61 0.59 0.30
2500 1.17 0.73 0.59 0.57 0.31
3150 0.98 0.61 0.49 0.49 0.28
Table A.1 Reverberation time of receiver room (s)

OPEN/CLOSED WINDOW RESEARCH Defra Research Contract: NANR116
Airborne Sound Insulation. Laboratory measurements with non-diffuse source conditions
Standardised Level Difference. Simulated residential receiver environment
Date: 22/6/2005 Test Sample: Wall
Air temperature: 20.1 ºC Area of window unit, S: 8.64 m2
Air humidity: 31.2 % Window mass per unit area: 289.35 kg/m2
Atmospheric pressure: 1.0106 Bar
Receiving room volume: 31.2 m3
Glass Specification: 4 -16 - 4 mm
Source room volume: 343.1 m3
Canopy: n/a
Vent: n/a
Test ID: 622006 Loudspeaker Configuration: L6
Frequency D2m,nT
Hz dB
50 31.4
63 49.9
80 48.7
100 46.9 31
125 34.3 34
160 34.7 37
200 42.0 40
250 41.5 43
315 43.0 46
400 49.9 49
500 55.6 50
630 61.3 51
800 61.0 52
1k 63.8 53
1.25k 63.4 54
1.6k 69.4 54
2k 74.3 b 54
2.5k 76.7 b 54
3.15k 73.1 b 54
4k 74.4 B
5k 73.4 B
D 2 m,nT,w (C;Ctr ) 54 (-2; -6) dB
Tested by Building Performance Centre, Napier University, Edinburgh.
Measured D2m,nT dB
30.0
40.0
50.0
60.0
70.0
80.0
90.0
63 125 250 500 1k 2k 4kFrequency (Hz)
Sta
nd
ard
ise
d L
eve
l D
iffe
ren
ce
, D
2m
,nT
(d
B)
Measured values Shifted Reference Curve
B-1
OPEN/CLOSED WINDOW RESEARCH Defra Research Contract: NANR116
Airborne Sound Insulation. Laboratory measurements with non-diffuse source conditions
Standardised Level Difference. Simulated residential receiver environment
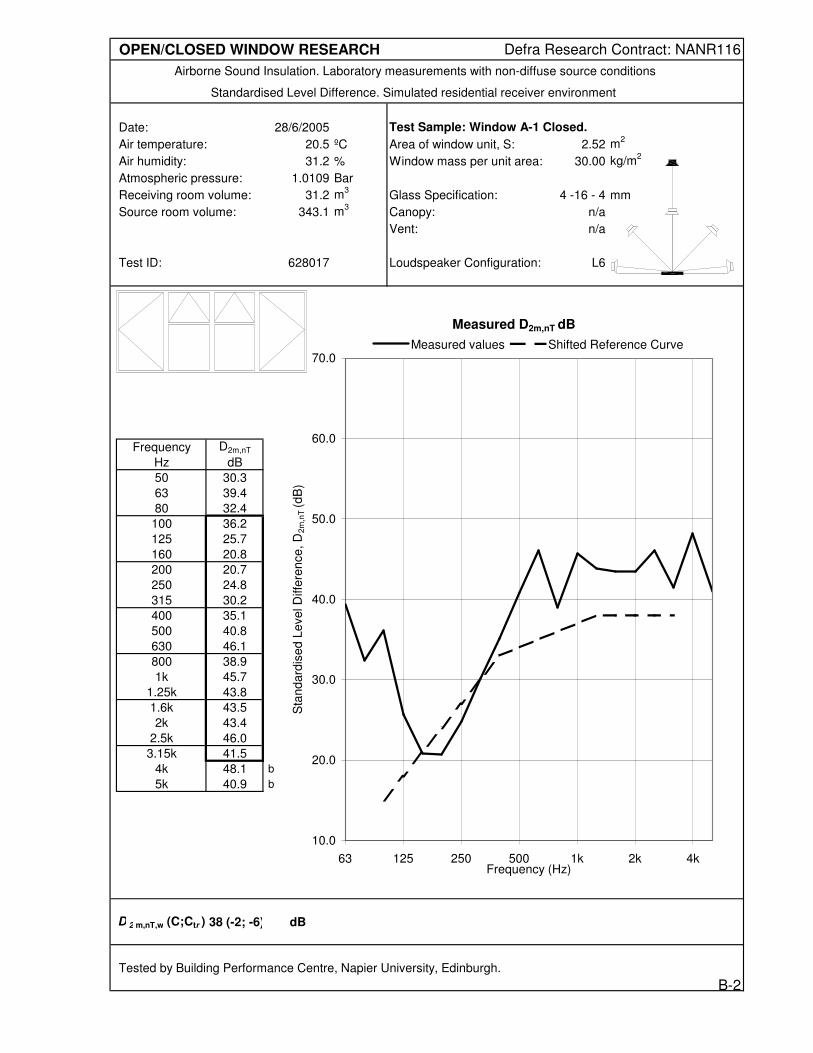
Date: 28/6/2005 Test Sample: Window A-1 Closed.
Air temperature: 20.5 ºC Area of window unit, S: 2.52 m2
Air humidity: 31.2 % Window mass per unit area: 30.00 kg/m2
Atmospheric pressure: 1.0109 Bar
Receiving room volume: 31.2 m3
Glass Specification: 4 -16 - 4 mm
Source room volume: 343.1 m3
Canopy: n/a
Vent: n/a
Test ID: 628017 Loudspeaker Configuration: L6
Frequency D2m,nT
Hz dB
50 30.3
63 39.4
80 32.4
100 36.2 15
125 25.7 18
160 20.8 21
200 20.7 24
250 24.8 27
315 30.2 30
400 35.1 33
500 40.8 34
630 46.1 35
800 38.9 36
1k 45.7 37
1.25k 43.8 38
1.6k 43.5 38
2k 43.4 38
2.5k 46.0 38
3.15k 41.5 38
4k 48.1 b
5k 40.9 b
D 2 m,nT,w (C;Ctr ) 38 (-2; -6) dB
Tested by Building Performance Centre, Napier University, Edinburgh.
Measured D2m,nT dB
10.0
20.0
30.0
40.0
50.0
60.0
70.0
63 125 250 500 1k 2k 4kFrequency (Hz)
Sta
nd
ard
ise
d L
eve
l D
iffe
ren
ce
, D
2m
,nT
(d
B)
Measured values Shifted Reference Curve
B-2
OPEN/CLOSED WINDOW RESEARCH Defra Research Contract: NANR116
Airborne Sound Insulation. Laboratory measurements with non-diffuse source conditions
Standardised Level Difference. Simulated residential receiver environment
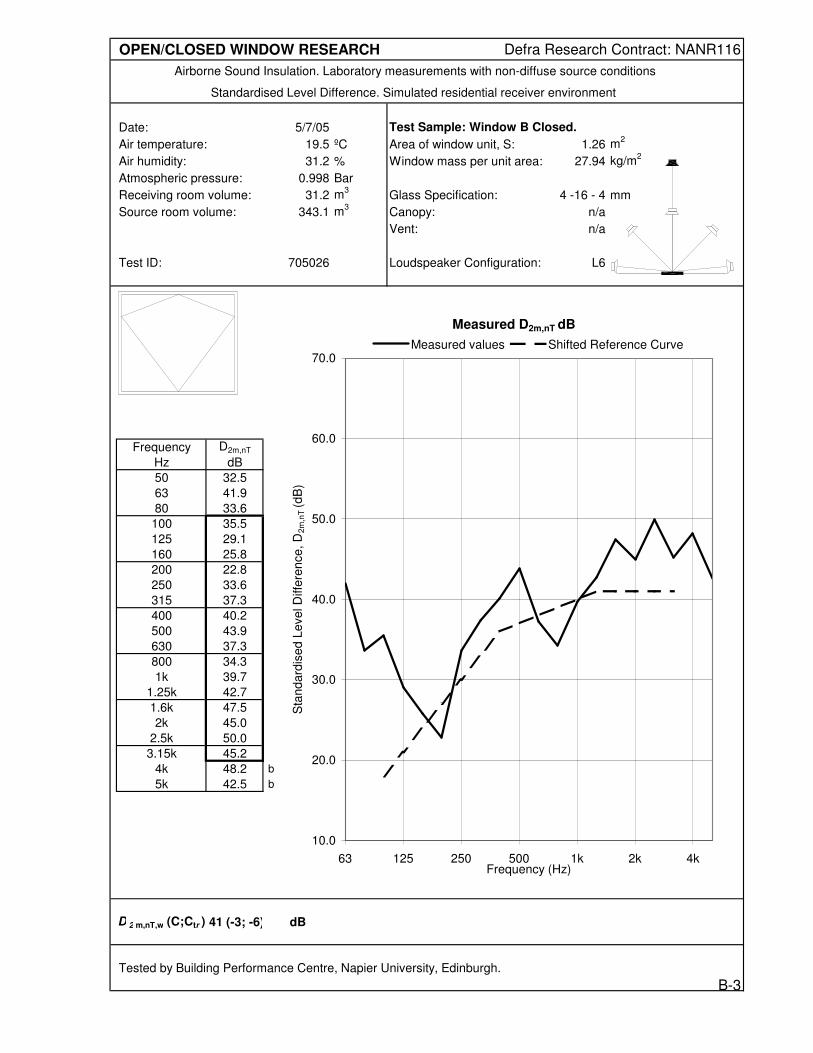
Date: 5/7/05 Test Sample: Window B Closed.
Air temperature: 19.5 ºC Area of window unit, S: 1.26 m2
Air humidity: 31.2 % Window mass per unit area: 27.94 kg/m2
Atmospheric pressure: 0.998 Bar
Receiving room volume: 31.2 m3
Glass Specification: 4 -16 - 4 mm
Source room volume: 343.1 m3
Canopy: n/a
Vent: n/a
Test ID: 705026 Loudspeaker Configuration: L6
Frequency D2m,nT
Hz dB
50 32.5
63 41.9
80 33.6
100 35.5 18
125 29.1 21
160 25.8 24
200 22.8 27
250 33.6 30
315 37.3 33
400 40.2 36
500 43.9 37
630 37.3 38
800 34.3 39
1k 39.7 40
1.25k 42.7 41
1.6k 47.5 41
2k 45.0 41
2.5k 50.0 41
3.15k 45.2 41
4k 48.2 b
5k 42.5 b
D 2 m,nT,w (C;Ctr ) 41 (-3; -6) dB
Tested by Building Performance Centre, Napier University, Edinburgh.
Measured D2m,nT dB
10.0
20.0
30.0
40.0
50.0
60.0
70.0
63 125 250 500 1k 2k 4kFrequency (Hz)
Sta
nd
ard
ise
d L
eve
l D
iffe
ren
ce
, D
2m
,nT
(d
B)
Measured values Shifted Reference Curve
B-3

OPEN/CLOSED WINDOW RESEARCH Defra Research Contract: NANR116
Airborne Sound Insulation. Laboratory measurements with non-diffuse source conditions
Standardised Level Difference. Simulated residential receiver environment
Date: 11/7/05 Test Sample: Window C-1 Closed.
Air temperature: 20.6 ºC Area of window unit, S: 0.945 m2
Air humidity: 31.2 % Window mass per unit area: 36.83 kg/m2
Atmospheric pressure: 1.0279 Bar
Receiving room volume: 31.2 m3
Glass Specification: 4 -16 - 4 mm
Source room volume: 343.1 m3
Canopy: Original
Vent: Closed
Test ID: 711014 Loudspeaker Configuration: L6
Frequency D2m,nT
Hz dB
50 30.4 B
63 43.9 b
80 35.1
100 35.2 17
125 25.9 20
160 28.7 23
200 33.1 26
250 26.4 29
315 37.4 32
400 39.2 35
500 40.5 36
630 37.5 37
800 39.8 38
1k 36.2 39
1.25k 39.4 40
1.6k 43.9 40
2k 43.5 40
2.5k 43.8 40
3.15k 41.8 40
4k 44.2 b
5k 38.3 b
D 2 m,nT,w (C;Ctr ) 40 (-1; -4) dB
Tested by Building Performance Centre, Napier University, Edinburgh.
Measured D2m,nT dB
10.0
20.0
30.0
40.0
50.0
60.0
70.0
63 125 250 500 1k 2k 4kFrequency (Hz)
Sta
nd
ard
ise
d L
eve
l D
iffe
ren
ce
, D
2m
,nT
(d
B)
Measured values Shifted Reference Curve
B-4

OPEN/CLOSED WINDOW RESEARCH Defra Research Contract: NANR116
Airborne Sound Insulation. Laboratory measurements with non-diffuse source conditions
Standardised Level Difference. Simulated residential receiver environment
Date: 17/7/2005 Test Sample: Window C-3 Closed.
Air temperature: 21 ºC Area of window unit, S: 0.995 m2
Air humidity: 31.2 % Window mass per unit area: 39.20 kg/m2
Atmospheric pressure: 1.0044 Bar
Receiving room volume: 31.2 m3
Glass Specification: 4 -18 - 6.4(lam) mm
Source room volume: 343.1 m3
Canopy: n/a
Vent: Blocked
Test ID: 717073 Loudspeaker Configuration: L6
Frequency D2m,nT
Hz dB
50 33.2 b
63 42.9
80 35.5
100 37.7 22
125 29.5 25
160 32.2 28
200 39.6 31
250 42.7 34
315 44.2 37
400 40.9 40
500 38.9 41
630 38.1 42
800 43.2 43
1k 47.9 44
1.25k 50.7 45
1.6k 50.4 45
2k 45.6 45
2.5k 47.1 45
3.15k 48.5 45
4k 50.3
5k 59.6
D 2 m,nT,w (C;Ctr ) 45 (-1; -3) dB
Tested by Building Performance Centre, Napier University, Edinburgh.
Measured D2m,nT dB
20.0
30.0
40.0
50.0
60.0
70.0
80.0
63 125 250 500 1k 2k 4kFrequency (Hz)
Sta
nd
ard
ise
d L
eve
l D
iffe
ren
ce
, D
2m
,nT
(d
B)
Measured values Shifted Reference Curve
B-5

OPEN/CLOSED WINDOW RESEARCH Defra Research Contract: NANR116
Airborne Sound Insulation. Laboratory measurements with non-diffuse source conditions
Standardised Level Difference. Simulated residential receiver environment
Date: 13/7/2005 Test Sample: Window D-1 Closed.
Air temperature: 21.8 ºC Area of window unit, S: 1.26 m2
Air humidity: 31.2 % Window mass per unit area: 27.94 kg/m2
Atmospheric pressure: 1.0185 Bar
Receiving room volume: 31.2 m3
Glass Specification: 4 -16 - 4 mm
Source room volume: 343.1 m3
Canopy: n/a
Vent: n/a
Test ID: 713015 Loudspeaker Configuration: L6
Frequency D2m,nT
Hz dB
50 28.3 B
63 43.0 b
80 35.0
100 37.3 21
125 30.0 24
160 26.5 27
200 33.8 30
250 31.8 33
315 39.6 36
400 43.9 39
500 43.2 40
630 40.8 41
800 39.6 42
1k 44.0 43
1.25k 43.5 44
1.6k 49.7 44
2k 50.9 44
2.5k 47.8 44
3.15k 48.5 44
4k 45.3
5k 41.6 b
D 2 m,nT,w (C;Ctr ) 44 (-2; -5) dB
Tested by Building Performance Centre, Napier University, Edinburgh.
Measured D2m,nT dB
20.0
30.0
40.0
50.0
60.0
70.0
80.0
63 125 250 500 1k 2k 4kFrequency (Hz)
Sta
nd
ard
ise
d L
eve
l D
iffe
ren
ce
, D
2m
,nT
(d
B)
Measured values Shifted Reference Curve
B-6

OPEN/CLOSED WINDOW RESEARCH Defra Research Contract: NANR116
Airborne Sound Insulation. Laboratory measurements with non-diffuse source conditions
Standardised Level Difference. Simulated residential receiver environment
Date: 18/7/2005 Test Sample: Window E Closed.
Air temperature: 20.5 ºC Area of window unit, S: 0.63 m2
Air humidity: 31.2 % Window mass per unit area: 26.83 kg/m2
Atmospheric pressure: 0.9959 Bar
Receiving room volume: 31.2 m3
Glass Specification: 4 -16 - 4 mm
Source room volume: 343.1 m3
Canopy: n/a
Vent: n/a
Test ID: 718028 Loudspeaker Configuration: L6
Frequency D2m,nT
Hz dB
50 32.5
63 38.3
80 35.0
100 40.7 26
125 35.2 29
160 30.9 32
200 26.5 35
250 39.9 38
315 48.4 41
400 51.2 44
500 50.9 45
630 48.8 46
800 48.9 47
1k 54.3 48
1.25k 52.0 49
1.6k 53.7 49
2k 49.8 49
2.5k 51.4 49
3.15k 52.1 49
4k 56.2
5k 59.3
D 2 m,nT,w (C;Ctr ) 49 (-4; -8) dB
Tested by Building Performance Centre, Napier University, Edinburgh.
Measured D2m,nT dB
20.0
30.0
40.0
50.0
60.0
70.0
80.0
63 125 250 500 1k 2k 4kFrequency (Hz)
Sta
nd
ard
ise
d L
eve
l D
iffe
ren
ce
, D
2m
,nT
(d
B)
Measured values Shifted Reference Curve
B-7

OPEN/CLOSED WINDOW RESEARCH Defra Research Contract: NANR116
Airborne Sound Insulation. Laboratory measurements with non-diffuse source conditions
Standardised Level Difference. Simulated residential receiver environment
Date: 19/7/2005 Test Sample: Window F Closed.
Air temperature: 19.9 ºC Area of window unit, S: 0.63 m2
Air humidity: 31.2 % Window mass per unit area: 26.83 kg/m2
Atmospheric pressure: 1.0019 Bar
Receiving room volume: 31.2 m3
Glass Specification: 4 -16 - 4 mm
Source room volume: 343.1 m3
Canopy: n/a
Vent: n/a
Test ID: 719001 Loudspeaker Configuration: L6
Frequency D2m,nT
Hz dB
50 34.5
63 43.6
80 33.3
100 37.4 24
125 32.8 27
160 29.3 30
200 23.3 33
250 41.2 36
315 44.1 39
400 46.4 42
500 46.7 43
630 43.1 44
800 44.3 45
1k 49.7 46
1.25k 50.7 47
1.6k 56.1 47
2k 54.0 47
2.5k 53.6 47
3.15k 48.9 47
4k 53.2
5k 59.5
D 2 m,nT,w (C;Ctr ) 47 (-5; -9) dB
Tested by Building Performance Centre, Napier University, Edinburgh.
Measured D2m,nT dB
20.0
30.0
40.0
50.0
60.0
70.0
80.0
63 125 250 500 1k 2k 4kFrequency (Hz)
Sta
nd
ard
ise
d L
eve
l D
iffe
ren
ce
, D
2m
,nT
(d
B)
Measured values Shifted Reference Curve
B-8

OPEN/CLOSED WINDOW RESEARCH Defra Research Contract: NANR116
Airborne Sound Insulation. Laboratory measurements with non-diffuse source conditions
Standardised Level Difference. Simulated residential receiver environment
Date: 20/7/2005 Test Sample: Window G Closed.
Air temperature: 20.3 ºC Area of window unit, S: 0.54 m2
Air humidity: 31.2 % Window mass per unit area: 33.33 kg/m2
Atmospheric pressure: 1.0032 Bar
Receiving room volume: 31.2 m3
Glass Specification: 4 -16 - 4 mm
Source room volume: 343.1 m3
Canopy: n/a
Vent: Blocked
Test ID: 720001 Loudspeaker Configuration: L6
Frequency D2m,nT
Hz dB
50 33.6
63 38.7
80 36.8
100 41.1 24
125 35.8 27
160 30.6 30
200 35.2 33
250 36.6 36
315 47.7 39
400 50.9 42
500 48.7 43
630 40.2 44
800 43.4 45
1k 48.8 46
1.25k 53.8 47
1.6k 53.6 47
2k 53.2 47
2.5k 51.4 47
3.15k 45.3 47
4k 51.3
5k 52.7
D 2 m,nT,w (C;Ctr ) 47 (-2; -4) dB
Tested by Building Performance Centre, Napier University, Edinburgh.
Measured D2m,nT dB
20.0
30.0
40.0
50.0
60.0
70.0
80.0
63 125 250 500 1k 2k 4kFrequency (Hz)
Sta
nd
ard
ise
d L
eve
l D
iffe
ren
ce
, D
2m
,nT
(d
B)
Measured values Shifted Reference Curve
B-9

OPEN/CLOSED WINDOW RESEARCH Defra Research Contract: NANR116
Airborne Sound Insulation. Laboratory measurements with non-diffuse source conditions
Standardised Level Difference. Simulated residential receiver environment
Date: 28/6/2005 Test Sample: Window A-1 Untensioned.
Air temperature: 20.5 ºC Area of window unit, S: 2.52 m2
Air humidity: 31.2 % Window mass per unit area: 30.00 kg/m2
Atmospheric pressure: 1.0109 Bar
Receiving room volume: 31.2 m3
Glass Specification: 4 -16 - 4 mm
Source room volume: 343.1 m3
Canopy: n/a
Vent: n/a
Test ID: 628028 Loudspeaker Configuration: L6
Frequency D2m,nT
Hz dB
50 27.2
63 35.4
80 28.7
100 33.1 10
125 22.7 13
160 19.7 16
200 20.3 19
250 25.1 22
315 28.9 25
400 32.4 28
500 34.5 29
630 32.9 30
800 27.2 31
1k 29.4 32
1.25k 31.7 33
1.6k 38.6 33
2k 39.4 33
2.5k 39.7 33
3.15k 32.0 33
4k 38.0
5k 39.1 b
D 2 m,nT,w (C;Ctr ) 33 (-2; -4) dB
Tested by Building Performance Centre, Napier University, Edinburgh.
Measured D2m,nT dB
10.0
20.0
30.0
40.0
50.0
60.0
70.0
63 125 250 500 1k 2k 4kFrequency (Hz)
Sta
nd
ard
ise
d L
eve
l D
iffe
ren
ce
, D
2m
,nT
(d
B)
Measured values Shifted Reference Curve
C-1

OPEN/CLOSED WINDOW RESEARCH Defra Research Contract: NANR116
Airborne Sound Insulation. Laboratory measurements with non-diffuse source conditions
Standardised Level Difference. Simulated residential receiver environment
Date: 5/7/05 Test Sample: Window B Untensioned.
Air temperature: 19.5 ºC Area of window unit, S: 1.26 m2
Air humidity: 31.2 % Window mass per unit area: 27.94 kg/m2
Atmospheric pressure: 0.998 Bar
Receiving room volume: 31.2 m3
Glass Specification: 4 -16 - 4 mm
Source room volume: 343.1 m3
Canopy: n/a
Vent: n/a
Test ID: 705027 Loudspeaker Configuration: L6
Frequency D2m,nT
Hz dB
50 29.3
63 36.9
80 27.6
100 29.1 5
125 22.6 8
160 21.3 11
200 23.6 14
250 25.9 17
315 28.4 20
400 31.4 23
500 35.7 24
630 27.3 25
800 22.2 26
1k 23.8 27
1.25k 24.3 28
1.6k 31.6 28
2k 30.9 28
2.5k 34.8 28
3.15k 30.2 28
4k 37.2
5k 39.8 b
D 2 m,nT,w (C;Ctr ) 28 (-1; -2) dB
Tested by Building Performance Centre, Napier University, Edinburgh.
Measured D2m,nT dB
0.0
10.0
20.0
30.0
40.0
50.0
60.0
63 125 250 500 1k 2k 4kFrequency (Hz)
Sta
nd
ard
ise
d L
eve
l D
iffe
ren
ce
, D
2m
,nT
(d
B)
Measured values Shifted Reference Curve
C-2

OPEN/CLOSED WINDOW RESEARCH Defra Research Contract: NANR116
Airborne Sound Insulation. Laboratory measurements with non-diffuse source conditions
Standardised Level Difference. Simulated residential receiver environment
Date: 11/7/05 Test Sample: Window C-1 Untensioned.
Air temperature: 20.6 ºC Area of window unit, S: 0.945 m2
Air humidity: 31.2 % Window mass per unit area: 36.83 kg/m2
Atmospheric pressure: 1.0279 Bar
Receiving room volume: 31.2 m3
Glass Specification: 4 -16 - 4 mm
Source room volume: 343.1 m3
Canopy: Original
Vent: Closed
Test ID: 711018 Loudspeaker Configuration: L6
Frequency D2m,nT
Hz dB
50 27.6 B
63 35.6
80 26.9
100 28.5 3
125 21.9 6
160 23.2 9
200 27.2 12
250 25.3 15
315 30.0 18
400 27.5 21
500 24.7 22
630 23.7 23
800 22.8 24
1k 22.1 25
1.25k 20.1 26
1.6k 27.1 26
2k 29.0 26
2.5k 30.7 26
3.15k 29.0 26
4k 30.5
5k 35.5 b
D 2 m,nT,w (C;Ctr ) 26 (-1; -2) dB
Tested by Building Performance Centre, Napier University, Edinburgh.
Measured D2m,nT dB
0.0
10.0
20.0
30.0
40.0
50.0
60.0
63 125 250 500 1k 2k 4kFrequency (Hz)
Sta
nd
ard
ise
d L
eve
l D
iffe
ren
ce
, D
2m
,nT
(d
B)
Measured values Shifted Reference Curve
C-3

OPEN/CLOSED WINDOW RESEARCH Defra Research Contract: NANR116
Airborne Sound Insulation. Laboratory measurements with non-diffuse source conditions
Standardised Level Difference. Simulated residential receiver environment
Date: 11/7/05 Test Sample: Window C-2 Untensioned.
Air temperature: 20.6 ºC Area of window unit, S: 0.945 m2
Air humidity: 31.2 % Window mass per unit area: 36.83 kg/m2
Atmospheric pressure: 1.0278 Bar
Receiving room volume: 31.2 m3
Glass Specification: 4 -16 - 4 mm
Source room volume: 343.1 m3
Canopy: Original
Vent: Closed
Test ID: 711022 Loudspeaker Configuration: L6
Frequency D2m,nT
Hz dB
50 26.7 B
63 36.4
80 27.8
100 28.5 4
125 21.6 7
160 23.6 10
200 27.4 13
250 24.8 16
315 30.2 19
400 29.6 22
500 27.2 23
630 26.0 24
800 23.2 25
1k 23.2 26
1.25k 21.8 27
1.6k 27.9 27
2k 29.9 27
2.5k 32.6 27
3.15k 30.0 27
4k 31.8
5k 36.1 b
D 2 m,nT,w (C;Ctr ) 27 (-1; -2) dB
Tested by Building Performance Centre, Napier University, Edinburgh.
Measured D2m,nT dB
0.0
10.0
20.0
30.0
40.0
50.0
60.0
63 125 250 500 1k 2k 4kFrequency (Hz)
Sta
nd
ard
ise
d L
eve
l D
iffe
ren
ce
, D
2m
,nT
(d
B)
Measured values Shifted Reference Curve
C-4

OPEN/CLOSED WINDOW RESEARCH Defra Research Contract: NANR116
Airborne Sound Insulation. Laboratory measurements with non-diffuse source conditions
Standardised Level Difference. Simulated residential receiver environment
Date: 13/7/2005 Test Sample: Window D-1 Untensioned.
Air temperature: 21.8 ºC Area of window unit, S: 1.26 m2
Air humidity: 31.2 % Window mass per unit area: 27.94 kg/m2
Atmospheric pressure: 1.0185 Bar
Receiving room volume: 31.2 m3
Glass Specification: 4 -16 - 4 mm
Source room volume: 343.1 m3
Canopy: n/a
Vent: n/a
Test ID: 713016 Loudspeaker Configuration: L6
Frequency D2m,nT
Hz dB
50 29.1 B
63 43.2 b
80 35.1
100 37.3 21
125 30.0 24
160 26.5 27
200 33.9 30
250 31.8 33
315 39.5 36
400 43.9 39
500 43.1 40
630 40.8 41
800 39.6 42
1k 43.9 43
1.25k 43.5 44
1.6k 49.6 44
2k 51.0 44
2.5k 47.7 44
3.15k 48.5 44
4k 45.5
5k 41.6 b
D 2 m,nT,w (C;Ctr ) 44 (-2; -5) dB
Tested by Building Performance Centre, Napier University, Edinburgh.
Measured D2m,nT dB
20.0
30.0
40.0
50.0
60.0
70.0
80.0
63 125 250 500 1k 2k 4kFrequency (Hz)
Sta
nd
ard
ise
d L
eve
l D
iffe
ren
ce
, D
2m
,nT
(d
B)
Measured values Shifted Reference Curve
C-5
OPEN/CLOSED WINDOW RESEARCH Defra Research Contract: NANR116
Airborne Sound Insulation. Laboratory measurements with non-diffuse source conditions
Standardised Level Difference. Simulated residential receiver environment
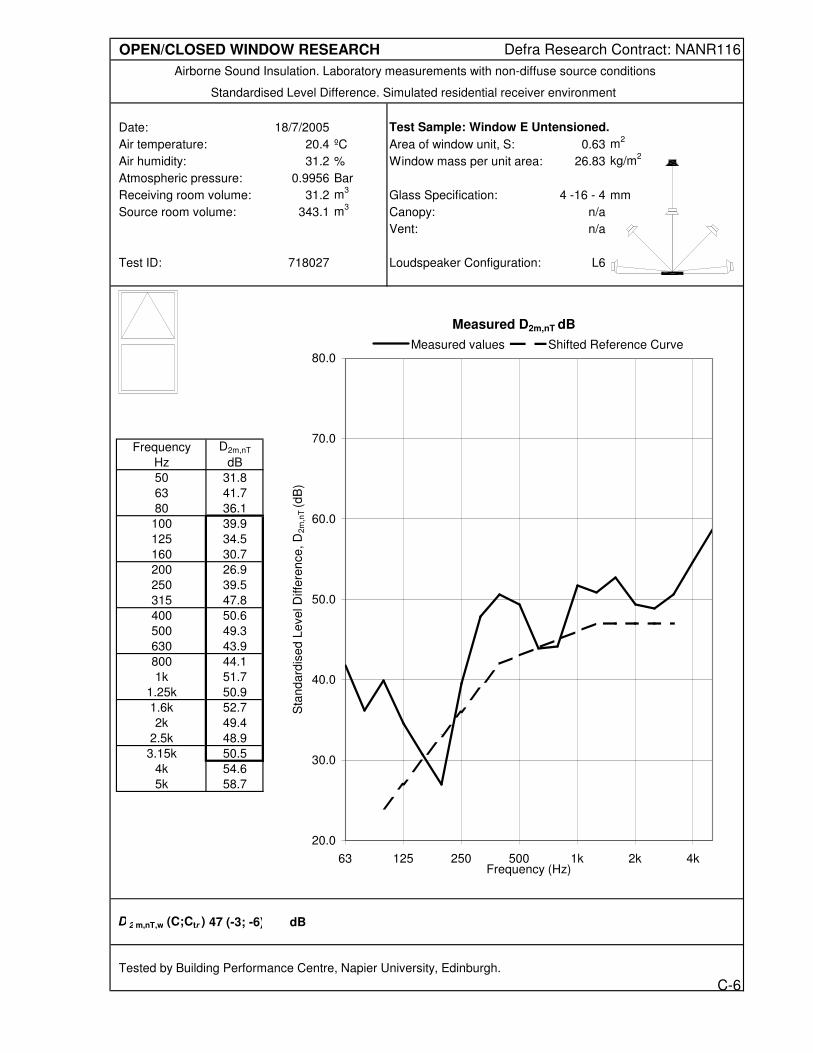
Date: 18/7/2005 Test Sample: Window E Untensioned.
Air temperature: 20.4 ºC Area of window unit, S: 0.63 m2
Air humidity: 31.2 % Window mass per unit area: 26.83 kg/m2
Atmospheric pressure: 0.9956 Bar
Receiving room volume: 31.2 m3
Glass Specification: 4 -16 - 4 mm
Source room volume: 343.1 m3
Canopy: n/a
Vent: n/a
Test ID: 718027 Loudspeaker Configuration: L6
Frequency D2m,nT
Hz dB
50 31.8
63 41.7
80 36.1
100 39.9 24
125 34.5 27
160 30.7 30
200 26.9 33
250 39.5 36
315 47.8 39
400 50.6 42
500 49.3 43
630 43.9 44
800 44.1 45
1k 51.7 46
1.25k 50.9 47
1.6k 52.7 47
2k 49.4 47
2.5k 48.9 47
3.15k 50.5 47
4k 54.6
5k 58.7
D 2 m,nT,w (C;Ctr ) 47 (-3; -6) dB
Tested by Building Performance Centre, Napier University, Edinburgh.
Measured D2m,nT dB
20.0
30.0
40.0
50.0
60.0
70.0
80.0
63 125 250 500 1k 2k 4kFrequency (Hz)
Sta
nd
ard
ise
d L
eve
l D
iffe
ren
ce
, D
2m
,nT
(d
B)
Measured values Shifted Reference Curve
C-6

OPEN/CLOSED WINDOW RESEARCH Defra Research Contract: NANR116
Airborne Sound Insulation. Laboratory measurements with non-diffuse source conditions
Standardised Level Difference. Simulated residential receiver environment
Date: 19/7/2005 Test Sample: Window F Untensioned.
Air temperature: 19.9 ºC Area of window unit, S: 0.63 m2
Air humidity: 31.2 % Window mass per unit area: 26.83 kg/m2
Atmospheric pressure: 1.0019 Bar
Receiving room volume: 31.2 m3
Glass Specification: 4 -16 - 4 mm
Source room volume: 343.1 m3
Canopy: n/a
Vent: n/a
Test ID: 719002 Loudspeaker Configuration: L6
Frequency D2m,nT
Hz dB
50 34.3
63 44.8
80 31.2
100 34.2 15
125 29.2 18
160 27.3 21
200 23.3 24
250 40.8 27
315 40.8 30
400 41.7 33
500 41.9 34
630 33.3 35
800 34.3 36
1k 36.3 37
1.25k 36.8 38
1.6k 44.2 38
2k 46.3 38
2.5k 47.3 38
3.15k 41.4 38
4k 42.6
5k 51.2
D 2 m,nT,w (C;Ctr ) 38 (-1; -3) dB
Tested by Building Performance Centre, Napier University, Edinburgh.
Measured D2m,nT dB
10.0
20.0
30.0
40.0
50.0
60.0
70.0
63 125 250 500 1k 2k 4kFrequency (Hz)
Sta
nd
ard
ise
d L
eve
l D
iffe
ren
ce
, D
2m
,nT
(d
B)
Measured values Shifted Reference Curve
C-7

OPEN/CLOSED WINDOW RESEARCH Defra Research Contract: NANR116
Airborne Sound Insulation. Laboratory measurements with non-diffuse source conditions
Standardised Level Difference. Simulated residential receiver environment
Date: 20/7/2005 Test Sample: Window G Untensioned.
Air temperature: 20.3 ºC Area of window unit, S: 0.54 m2
Air humidity: 31.2 % Window mass per unit area: 33.33 kg/m2
Atmospheric pressure: 1.0032 Bar
Receiving room volume: 31.2 m3
Glass Specification: 4 -16 - 4 mm
Source room volume: 343.1 m3
Canopy: n/a
Vent: Blocked
Test ID: 720002 Loudspeaker Configuration: L6
Frequency D2m,nT
Hz dB
50 32.5
63 40.4
80 39.2
100 40.7 21
125 35.3 24
160 30.5 27
200 35.6 30
250 36.7 33
315 46.2 36
400 47.6 39
500 43.8 40
630 37.4 41
800 41.9 42
1k 46.3 43
1.25k 48.7 44
1.6k 50.1 44
2k 49.3 44
2.5k 46.4 44
3.15k 38.5 44
4k 48.6
5k 48.7
D 2 m,nT,w (C;Ctr ) 44 (-2; -3) dB
Tested by Building Performance Centre, Napier University, Edinburgh.
Measured D2m,nT dB
20.0
30.0
40.0
50.0
60.0
70.0
80.0
63 125 250 500 1k 2k 4kFrequency (Hz)
Sta
nd
ard
ise
d L
eve
l D
iffe
ren
ce
, D
2m
,nT
(d
B)
Measured values Shifted Reference Curve
C-8

OPEN/CLOSED WINDOW RESEARCH Defra Research Contract: NANR116
Airborne Sound Insulation. Laboratory measurements with non-diffuse source conditions
Standardised Level Difference. Simulated residential receiver environment
Date: 28/6/2005 Test Sample: Window A-1 Open 0.05 m2
Air temperature: 20.5 ºC Area of window unit, S: 2.52 m2
Air humidity: 31.2 % Window mass per unit area: 30.00 kg/m2
Atmospheric pressure: 1.0106 Bar
Receiving room volume: 31.2 m3
Glass Specification: 4 -16 - 4 mm
Source room volume: 343.1 m3
Canopy: n/a
Vent: n/a
Test ID: 628030 Loudspeaker Configuration: L6
Frequency D2m,nT
Hz dB
50 20.5
63 27.5
80 22.0
100 25.9 -1
125 16.6 2
160 15.2 5
200 16.9 8
250 17.2 11
315 20.7 14
400 23.7 17
500 22.4 18
630 21.4 19
800 18.4 20
1k 21.3 21
1.25k 19.7 22
1.6k 23.7 22
2k 23.0 22
2.5k 25.2 22
3.15k 23.4 22
4k 26.4
5k 27.2
D 2 m,nT,w (C;Ctr ) 22 ( 0; -1) dB
Tested by Building Performance Centre, Napier University, Edinburgh.
Measured D2m,nT dB
0.0
10.0
20.0
30.0
40.0
50.0
60.0
63 125 250 500 1k 2k 4kFrequency (Hz)
Sta
nd
ard
ise
d L
eve
l D
iffe
ren
ce
, D
2m
,nT
(d
B)
Measured values Shifted Reference Curve
D-1

OPEN/CLOSED WINDOW RESEARCH Defra Research Contract: NANR116
Airborne Sound Insulation. Laboratory measurements with non-diffuse source conditions
Standardised Level Difference. Simulated residential receiver environment
Date: 5/7/05 Test Sample: Window B Open 0.05 m2
Air temperature: 19.5 ºC Area of window unit, S: 1.26 m2
Air humidity: 31.2 % Window mass per unit area: 27.94 kg/m2
Atmospheric pressure: 0.998 Bar
Receiving room volume: 31.2 m3
Glass Specification: 4 -16 - 4 mm
Source room volume: 343.1 m3
Canopy: n/a
Vent: n/a
Test ID: 705028 Loudspeaker Configuration: L6
Frequency D2m,nT
Hz dB
50 25.0
63 30.2
80 21.0
100 22.3 -4
125 16.1 -1
160 15.2 2
200 21.0 5
250 16.5 8
315 18.1 11
400 21.7 14
500 24.2 15
630 19.4 16
800 12.3 17
1k 17.7 18
1.25k 16.0 19
1.6k 21.0 19
2k 19.1 19
2.5k 24.6 19
3.15k 21.7 19
4k 25.2
5k 29.5
D 2 m,nT,w (C;Ctr ) 19 (-1; -2) dB
Tested by Building Performance Centre, Napier University, Edinburgh.
Measured D2m,nT dB
0.0
10.0
20.0
30.0
40.0
50.0
60.0
63 125 250 500 1k 2k 4kFrequency (Hz)
Sta
nd
ard
ise
d L
eve
l D
iffe
ren
ce
, D
2m
,nT
(d
B)
Measured values Shifted Reference Curve
D-2

OPEN/CLOSED WINDOW RESEARCH Defra Research Contract: NANR116
Airborne Sound Insulation. Laboratory measurements with non-diffuse source conditions
Standardised Level Difference. Simulated residential receiver environment
Date: 11/7/05 Test Sample: Window C-1 Open 0.05 m2
Air temperature: 20.6 ºC Area of window unit, S: 0.945 m2
Air humidity: 31.2 % Window mass per unit area: 36.83 kg/m2
Atmospheric pressure: 1.0279 Bar
Receiving room volume: 31.2 m3
Glass Specification: 4 -16 - 4 mm
Source room volume: 343.1 m3
Canopy: Original
Vent: Closed
Test ID: 711019 Loudspeaker Configuration: L6
Frequency D2m,nT
Hz dB
50 26.4 B
63 32.8
80 23.9
100 25.2 -2
125 18.6 1
160 20.2 4
200 23.7 7
250 23.6 10
315 27.3 13
400 24.6 16
500 21.2 17
630 19.3 18
800 18.1 19
1k 20.5 20
1.25k 18.1 21
1.6k 21.7 21
2k 22.8 21
2.5k 24.5 21
3.15k 24.9 21
4k 27.7
5k 30.8 b
D 2 m,nT,w (C;Ctr ) 21 ( 0; 0) dB
Tested by Building Performance Centre, Napier University, Edinburgh.
Measured D2m,nT dB
0.0
10.0
20.0
30.0
40.0
50.0
60.0
63 125 250 500 1k 2k 4kFrequency (Hz)
Sta
nd
ard
ise
d L
eve
l D
iffe
ren
ce
, D
2m
,nT
(d
B)
Measured values Shifted Reference Curve
D-3

OPEN/CLOSED WINDOW RESEARCH Defra Research Contract: NANR116
Airborne Sound Insulation. Laboratory measurements with non-diffuse source conditions
Standardised Level Difference. Simulated residential receiver environment
Date: 11/7/05 Test Sample: Window C-2 Open 0.05 m2
Air temperature: 20.6 ºC Area of window unit, S: 0.945 m2
Air humidity: 31.2 % Window mass per unit area: 36.83 kg/m2
Atmospheric pressure: 1.0278 Bar
Receiving room volume: 31.2 m3
Glass Specification: 4 -16 - 4 mm
Source room volume: 343.1 m3
Canopy: Original
Vent: Closed
Test ID: 711023 Loudspeaker Configuration: L6
Frequency D2m,nT
Hz dB
50 26.3 B
63 33.2
80 24.6
100 25.4 0
125 18.8 3
160 20.1 6
200 23.3 9
250 22.0 12
315 25.5 15
400 26.1 18
500 23.4 19
630 21.6 20
800 18.1 21
1k 21.2 22
1.25k 20.5 23
1.6k 23.7 23
2k 22.7 23
2.5k 26.9 23
3.15k 26.5 23
4k 29.7
5k 31.1 b
D 2 m,nT,w (C;Ctr ) 23 (-1; -1) dB
Tested by Building Performance Centre, Napier University, Edinburgh.
Measured D2m,nT dB
0.0
10.0
20.0
30.0
40.0
50.0
60.0
63 125 250 500 1k 2k 4kFrequency (Hz)
Sta
nd
ard
ise
d L
eve
l D
iffe
ren
ce
, D
2m
,nT
(d
B)
Measured values Shifted Reference Curve
D-4

OPEN/CLOSED WINDOW RESEARCH Defra Research Contract: NANR116
Airborne Sound Insulation. Laboratory measurements with non-diffuse source conditions
Standardised Level Difference. Simulated residential receiver environment
Date: 13/7/2005 Test Sample: Window D-1 Open 0.05 m2
Air temperature: 21.8 ºC Area of window unit, S: 1.26 m2
Air humidity: 31.2 % Window mass per unit area: 27.94 kg/m2
Atmospheric pressure: 1.0183 Bar
Receiving room volume: 31.2 m3
Glass Specification: 4 -16 - 4 mm
Source room volume: 343.1 m3
Canopy: n/a
Vent: n/a
Test ID: 713025 Loudspeaker Configuration: L6
Frequency D2m,nT
Hz dB
50 26.3 B
63 32.4
80 23.3
100 24.8 -1
125 17.6 2
160 19.2 5
200 24.9 8
250 23.8 11
315 22.8 14
400 21.1 17
500 19.9 18
630 18.9 19
800 16.6 20
1k 21.0 21
1.25k 22.4 22
1.6k 27.4 22
2k 24.2 22
2.5k 22.7 22
3.15k 23.8 22
4k 25.4
5k 27.7
D 2 m,nT,w (C;Ctr ) 22 ( 0; -1) dB
Tested by Building Performance Centre, Napier University, Edinburgh.
Measured D2m,nT dB
0.0
10.0
20.0
30.0
40.0
50.0
60.0
63 125 250 500 1k 2k 4kFrequency (Hz)
Sta
nd
ard
ise
d L
eve
l D
iffe
ren
ce
, D
2m
,nT
(d
B)
Measured values Shifted Reference Curve
D-5

OPEN/CLOSED WINDOW RESEARCH Defra Research Contract: NANR116
Airborne Sound Insulation. Laboratory measurements with non-diffuse source conditions
Standardised Level Difference. Simulated residential receiver environment
Date: 13/7/2005 Test Sample: Window D-2 Open 0.05 m2
Air temperature: 21.8 ºC Area of window unit, S: 1.26 m2
Air humidity: 31.2 % Window mass per unit area: 27.94 kg/m2
Atmospheric pressure: 1.0185 Bar
Receiving room volume: 31.2 m3
Glass Specification: 4 -16 - 4 mm
Source room volume: 343.1 m3
Canopy: n/a
Vent: n/a
Test ID: 713017 Loudspeaker Configuration: L6
Frequency D2m,nT
Hz dB
50 26.7 B
63 33.1
80 24.6
100 24.4 -3
125 17.3 0
160 17.6 3
200 21.6 6
250 16.5 9
315 16.9 12
400 23.2 15
500 27.9 16
630 23.8 17
800 13.0 18
1k 21.3 19
1.25k 18.6 20
1.6k 24.0 20
2k 21.1 20
2.5k 17.9 20
3.15k 21.0 20
4k 21.7
5k 25.3
D 2 m,nT,w (C;Ctr ) 20 (-1; -2) dB
Tested by Building Performance Centre, Napier University, Edinburgh.
Measured D2m,nT dB
0.0
10.0
20.0
30.0
40.0
50.0
60.0
63 125 250 500 1k 2k 4kFrequency (Hz)
Sta
nd
ard
ise
d L
eve
l D
iffe
ren
ce
, D
2m
,nT
(d
B)
Measured values Shifted Reference Curve
D-6

OPEN/CLOSED WINDOW RESEARCH Defra Research Contract: NANR116
Airborne Sound Insulation. Laboratory measurements with non-diffuse source conditions
Standardised Level Difference. Simulated residential receiver environment
Date: 13/7/2005 Test Sample: Window D-3 Open 0.05 m2
Air temperature: 21.8 ºC Area of window unit, S: 1.26 m2
Air humidity: 31.2 % Window mass per unit area: 27.94 kg/m2
Atmospheric pressure: 1.0183 Bar
Receiving room volume: 31.2 m3
Glass Specification: 4 -16 - 4 mm
Source room volume: 343.1 m3
Canopy: n/a
Vent: n/a
Test ID: 713021 Loudspeaker Configuration: L6
Frequency D2m,nT
Hz dB
50 27.6 B
63 34.0
80 25.0
100 25.4 1
125 18.1 4
160 18.8 7
200 21.6 10
250 17.6 13
315 21.5 16
400 26.2 19
500 24.5 20
630 21.1 21
800 14.0 22
1k 23.9 23
1.25k 26.7 24
1.6k 27.0 24
2k 26.5 24
2.5k 27.0 24
3.15k 23.6 24
4k 25.3
5k 29.4
D 2 m,nT,w (C;Ctr ) 24 (-2; -3) dB
Tested by Building Performance Centre, Napier University, Edinburgh.
Measured D2m,nT dB
0.0
10.0
20.0
30.0
40.0
50.0
60.0
63 125 250 500 1k 2k 4kFrequency (Hz)
Sta
nd
ard
ise
d L
eve
l D
iffe
ren
ce
, D
2m
,nT
(d
B)
Measured values Shifted Reference Curve
D-7

OPEN/CLOSED WINDOW RESEARCH Defra Research Contract: NANR116
Airborne Sound Insulation. Laboratory measurements with non-diffuse source conditions
Standardised Level Difference. Simulated residential receiver environment
Date: 18/7/2005 Test Sample: Window E Open 0.05 m2
Air temperature: 20.4 ºC Area of window unit, S: 0.63 m2
Air humidity: 31.2 % Window mass per unit area: 26.83 kg/m2
Atmospheric pressure: 0.9956 Bar
Receiving room volume: 31.2 m3
Glass Specification: 4 -16 - 4 mm
Source room volume: 343.1 m3
Canopy: n/a
Vent: n/a
Test ID: 718025 Loudspeaker Configuration: L6
Frequency D2m,nT
Hz dB
50 26.3
63 32.8
80 23.5
100 25.7 -1
125 19.5 2
160 19.3 5
200 21.3 8
250 22.0 11
315 23.1 14
400 24.7 17
500 22.3 18
630 18.6 19
800 18.5 20
1k 21.5 21
1.25k 20.7 22
1.6k 23.5 22
2k 21.7 22
2.5k 23.7 22
3.15k 24.2 22
4k 23.4
5k 25.9
D 2 m,nT,w (C;Ctr ) 22 ( 0; -1) dB
Tested by Building Performance Centre, Napier University, Edinburgh.
Measured D2m,nT dB
0.0
10.0
20.0
30.0
40.0
50.0
60.0
63 125 250 500 1k 2k 4kFrequency (Hz)
Sta
nd
ard
ise
d L
eve
l D
iffe
ren
ce
, D
2m
,nT
(d
B)
Measured values Shifted Reference Curve
D-8

OPEN/CLOSED WINDOW RESEARCH Defra Research Contract: NANR116
Airborne Sound Insulation. Laboratory measurements with non-diffuse source conditions
Standardised Level Difference. Simulated residential receiver environment
Date: 19/7/2005 Test Sample: Window F Open 0.05 m2
Air temperature: 19.9 ºC Area of window unit, S: 0.63 m2
Air humidity: 31.2 % Window mass per unit area: 26.83 kg/m2
Atmospheric pressure: 1.0019 Bar
Receiving room volume: 31.2 m3
Glass Specification: 4 -16 - 4 mm
Source room volume: 343.1 m3
Canopy: n/a
Vent: n/a
Test ID: 719004 Loudspeaker Configuration: L6
Frequency D2m,nT
Hz dB
50 27.0
63 33.8
80 24.9
100 25.4 -1
125 19.0 2
160 18.8 5
200 19.8 8
250 23.6 11
315 25.3 14
400 27.4 17
500 21.8 18
630 18.4 19
800 19.2 20
1k 23.0 21
1.25k 22.7 22
1.6k 23.7 22
2k 22.4 22
2.5k 24.2 22
3.15k 25.1 22
4k 26.2
5k 26.6
D 2 m,nT,w (C;Ctr ) 22 ( 0; 0) dB
Tested by Building Performance Centre, Napier University, Edinburgh.
Measured D2m,nT dB
0.0
10.0
20.0
30.0
40.0
50.0
60.0
63 125 250 500 1k 2k 4kFrequency (Hz)
Sta
nd
ard
ise
d L
eve
l D
iffe
ren
ce
, D
2m
,nT
(d
B)
Measured values Shifted Reference Curve
D-9

OPEN/CLOSED WINDOW RESEARCH Defra Research Contract: NANR116
Airborne Sound Insulation. Laboratory measurements with non-diffuse source conditions
Standardised Level Difference. Simulated residential receiver environment
Date: 20/7/2005 Test Sample: Window G Open 0.05 m2
Air temperature: 20.3 ºC Area of window unit, S: 0.54 m2
Air humidity: 31.2 % Window mass per unit area: 33.33 kg/m2
Atmospheric pressure: 1.0032 Bar
Receiving room volume: 31.2 m3
Glass Specification: 4 -16 - 4 mm
Source room volume: 343.1 m3
Canopy: n/a
Vent: Blocked
Test ID: 720004 Loudspeaker Configuration: L6
Frequency D2m,nT
Hz dB
50 25.9
63 31.8
80 22.9
100 23.9 -4
125 18.5 -1
160 17.8 2
200 20.5 5
250 20.9 8
315 22.9 11
400 24.7 14
500 22.8 15
630 17.2 16
800 18.7 17
1k 20.2 18
1.25k 19.8 19
1.6k 19.4 19
2k 17.5 19
2.5k 19.8 19
3.15k 19.6 19
4k 22.6
5k 21.3
D 2 m,nT,w (C;Ctr ) 19 ( 0; 1) dB
Tested by Building Performance Centre, Napier University, Edinburgh.
Measured D2m,nT dB
0.0
10.0
20.0
30.0
40.0
50.0
60.0
63 125 250 500 1k 2k 4kFrequency (Hz)
Sta
nd
ard
ise
d L
eve
l D
iffe
ren
ce
, D
2m
,nT
(d
B)
Measured values Shifted Reference Curve
D-10

OPEN/CLOSED WINDOW RESEARCH Defra Research Contract: NANR116
Airborne Sound Insulation. Laboratory measurements with non-diffuse source conditions
Standardised Level Difference. Simulated residential receiver environment
Date: 28/6/2005 Test Sample: Window A-1 Open 0.10 m2
Air temperature: 20.5 ºC Area of window unit, S: 2.52 m2
Air humidity: 31.2 % Window mass per unit area: 30.00 kg/m2
Atmospheric pressure: 1.0106 Bar
Receiving room volume: 31.2 m3
Glass Specification: 4 -16 - 4 mm
Source room volume: 343.1 m3
Canopy: n/a
Vent: n/a
Test ID: 628031 Loudspeaker Configuration: L6
Frequency D2m,nT
Hz dB
50 19.3
63 26.4
80 21.0
100 24.8 -1
125 15.7 2
160 14.3 5
200 16.0 8
250 15.1 11
315 18.7 14
400 21.9 17
500 21.0 18
630 20.5 19
800 18.0 20
1k 21.7 21
1.25k 19.6 22
1.6k 22.7 22
2k 22.1 22
2.5k 24.0 22
3.15k 22.5 22
4k 23.9
5k 25.8
D 2 m,nT,w (C;Ctr ) 22 (-1; -2) dB
Tested by Building Performance Centre, Napier University, Edinburgh.
Measured D2m,nT dB
0.0
10.0
20.0
30.0
40.0
50.0
60.0
63 125 250 500 1k 2k 4kFrequency (Hz)
Sta
nd
ard
ise
d L
eve
l D
iffe
ren
ce
, D
2m
,nT
(d
B)
Measured values Shifted Reference Curve
E-1
OPEN/CLOSED WINDOW RESEARCH Defra Research Contract: NANR116
Airborne Sound Insulation. Laboratory measurements with non-diffuse source conditions
Standardised Level Difference. Simulated residential receiver environment
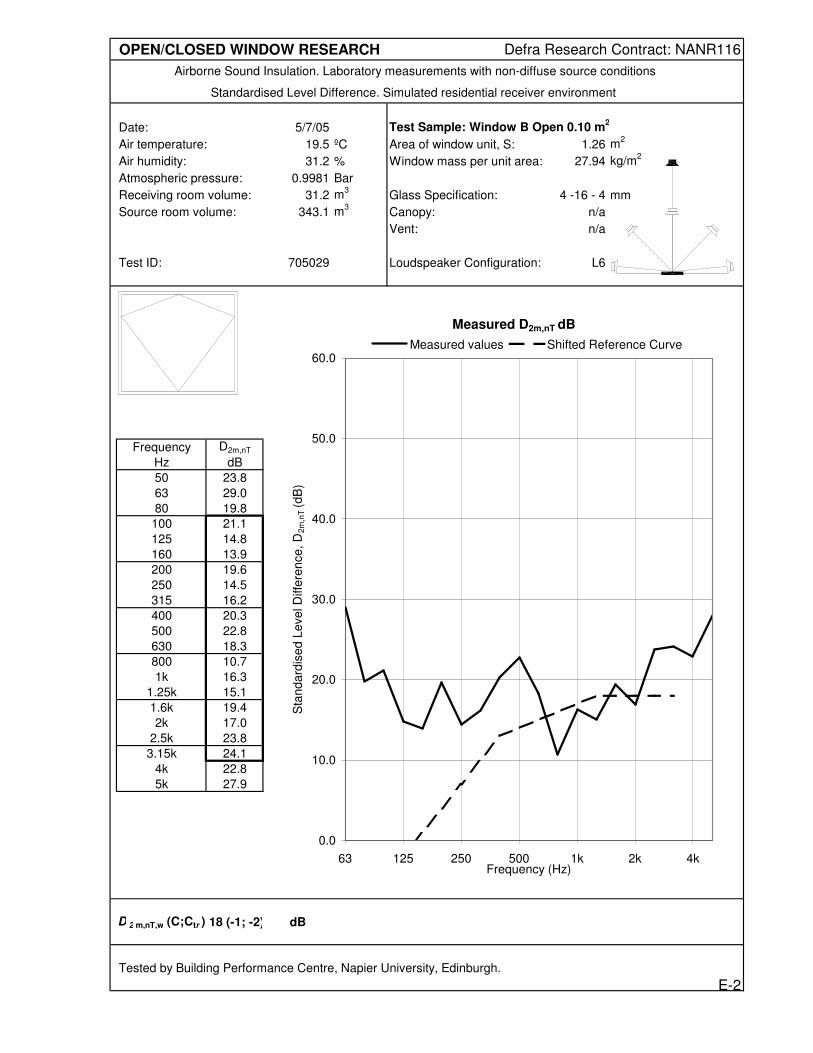
Date: 5/7/05 Test Sample: Window B Open 0.10 m2
Air temperature: 19.5 ºC Area of window unit, S: 1.26 m2
Air humidity: 31.2 % Window mass per unit area: 27.94 kg/m2
Atmospheric pressure: 0.9981 Bar
Receiving room volume: 31.2 m3
Glass Specification: 4 -16 - 4 mm
Source room volume: 343.1 m3
Canopy: n/a
Vent: n/a
Test ID: 705029 Loudspeaker Configuration: L6
Frequency D2m,nT
Hz dB
50 23.8
63 29.0
80 19.8
100 21.1 -5
125 14.8 -2
160 13.9 1
200 19.6 4
250 14.5 7
315 16.2 10
400 20.3 13
500 22.8 14
630 18.3 15
800 10.7 16
1k 16.3 17
1.25k 15.1 18
1.6k 19.4 18
2k 17.0 18
2.5k 23.8 18
3.15k 24.1 18
4k 22.8
5k 27.9
D 2 m,nT,w (C;Ctr ) 18 (-1; -2) dB
Tested by Building Performance Centre, Napier University, Edinburgh.
Measured D2m,nT dB
0.0
10.0
20.0
30.0
40.0
50.0
60.0
63 125 250 500 1k 2k 4kFrequency (Hz)
Sta
nd
ard
ise
d L
eve
l D
iffe
ren
ce
, D
2m
,nT
(d
B)
Measured values Shifted Reference Curve
E-2

OPEN/CLOSED WINDOW RESEARCH Defra Research Contract: NANR116
Airborne Sound Insulation. Laboratory measurements with non-diffuse source conditions
Standardised Level Difference. Simulated residential receiver environment
Date: 11/7/05 Test Sample: Window C-1 Open 0.10 m2
Air temperature: 20.6 ºC Area of window unit, S: 0.945 m2
Air humidity: 31.2 % Window mass per unit area: 36.83 kg/m2
Atmospheric pressure: 1.0279 Bar
Receiving room volume: 31.2 m3
Glass Specification: 4 -16 - 4 mm
Source room volume: 343.1 m3
Canopy: Original
Vent: Closed
Test ID: 711020 Loudspeaker Configuration: L6
Frequency D2m,nT
Hz dB
50 25.2 b
63 31.4
80 22.5
100 23.9 -3
125 17.2 0
160 18.9 3
200 22.4 6
250 22.6 9
315 25.9 12
400 22.6 15
500 19.2 16
630 16.4 17
800 14.9 18
1k 20.4 19
1.25k 18.3 20
1.6k 22.3 20
2k 22.4 20
2.5k 23.4 20
3.15k 23.9 20
4k 26.8
5k 28.7
D 2 m,nT,w (C;Ctr ) 20 ( 0; -1) dB
Tested by Building Performance Centre, Napier University, Edinburgh.
Measured D2m,nT dB
0.0
10.0
20.0
30.0
40.0
50.0
60.0
63 125 250 500 1k 2k 4kFrequency (Hz)
Sta
nd
ard
ise
d L
eve
l D
iffe
ren
ce
, D
2m
,nT
(d
B)
Measured values Shifted Reference Curve
E-3

OPEN/CLOSED WINDOW RESEARCH Defra Research Contract: NANR116
Airborne Sound Insulation. Laboratory measurements with non-diffuse source conditions
Standardised Level Difference. Simulated residential receiver environment
Date: 11/7/05 Test Sample: Window C-2 Open 0.10 m2
Air temperature: 20.6 ºC Area of window unit, S: 0.945 m2
Air humidity: 31.2 % Window mass per unit area: 36.83 kg/m2
Atmospheric pressure: 1.0278 Bar
Receiving room volume: 31.2 m3
Glass Specification: 4 -16 - 4 mm
Source room volume: 343.1 m3
Canopy: Original
Vent: Closed
Test ID: 711024 Loudspeaker Configuration: L6
Frequency D2m,nT
Hz dB
50 25.4 B
63 31.5
80 23.0
100 23.9 -1
125 17.3 2
160 18.3 5
200 21.4 8
250 20.2 11
315 22.9 14
400 24.3 17
500 21.0 18
630 18.9 19
800 13.3 20
1k 20.1 21
1.25k 20.6 22
1.6k 24.0 22
2k 22.1 22
2.5k 26.5 22
3.15k 26.9 22
4k 27.2
5k 29.6
D 2 m,nT,w (C;Ctr ) 22 (-2; -3) dB
Tested by Building Performance Centre, Napier University, Edinburgh.
Measured D2m,nT dB
0.0
10.0
20.0
30.0
40.0
50.0
60.0
63 125 250 500 1k 2k 4kFrequency (Hz)
Sta
nd
ard
ise
d L
eve
l D
iffe
ren
ce
, D
2m
,nT
(d
B)
Measured values Shifted Reference Curve
E-4

OPEN/CLOSED WINDOW RESEARCH Defra Research Contract: NANR116
Airborne Sound Insulation. Laboratory measurements with non-diffuse source conditions
Standardised Level Difference. Simulated residential receiver environment
Date: 13/7/2005 Test Sample: Window D-1 Open 0.10 m2
Air temperature: 21.8 ºC Area of window unit, S: 1.26 m2
Air humidity: 31.2 % Window mass per unit area: 27.94 kg/m2
Atmospheric pressure: 1.0183 Bar
Receiving room volume: 31.2 m3
Glass Specification: 4 -16 - 4 mm
Source room volume: 343.1 m3
Canopy: n/a
Vent: n/a
Test ID: 713026 Loudspeaker Configuration: L6
Frequency D2m,nT
Hz dB
50 25.5 B
63 30.9
80 21.8
100 23.3 -3
125 16.0 0
160 17.8 3
200 23.2 6
250 22.2 9
315 19.9 12
400 18.7 15
500 17.9 16
630 16.9 17
800 18.6 18
1k 21.8 19
1.25k 22.0 20
1.6k 21.5 20
2k 21.8 20
2.5k 19.1 20
3.15k 20.2 20
4k 22.9
5k 23.6
D 2 m,nT,w (C;Ctr ) 20 ( 0; 0) dB
Tested by Building Performance Centre, Napier University, Edinburgh.
Measured D2m,nT dB
0.0
10.0
20.0
30.0
40.0
50.0
60.0
63 125 250 500 1k 2k 4kFrequency (Hz)
Sta
nd
ard
ise
d L
eve
l D
iffe
ren
ce
, D
2m
,nT
(d
B)
Measured values Shifted Reference Curve
E-5
OPEN/CLOSED WINDOW RESEARCH Defra Research Contract: NANR116
Airborne Sound Insulation. Laboratory measurements with non-diffuse source conditions
Standardised Level Difference. Simulated residential receiver environment
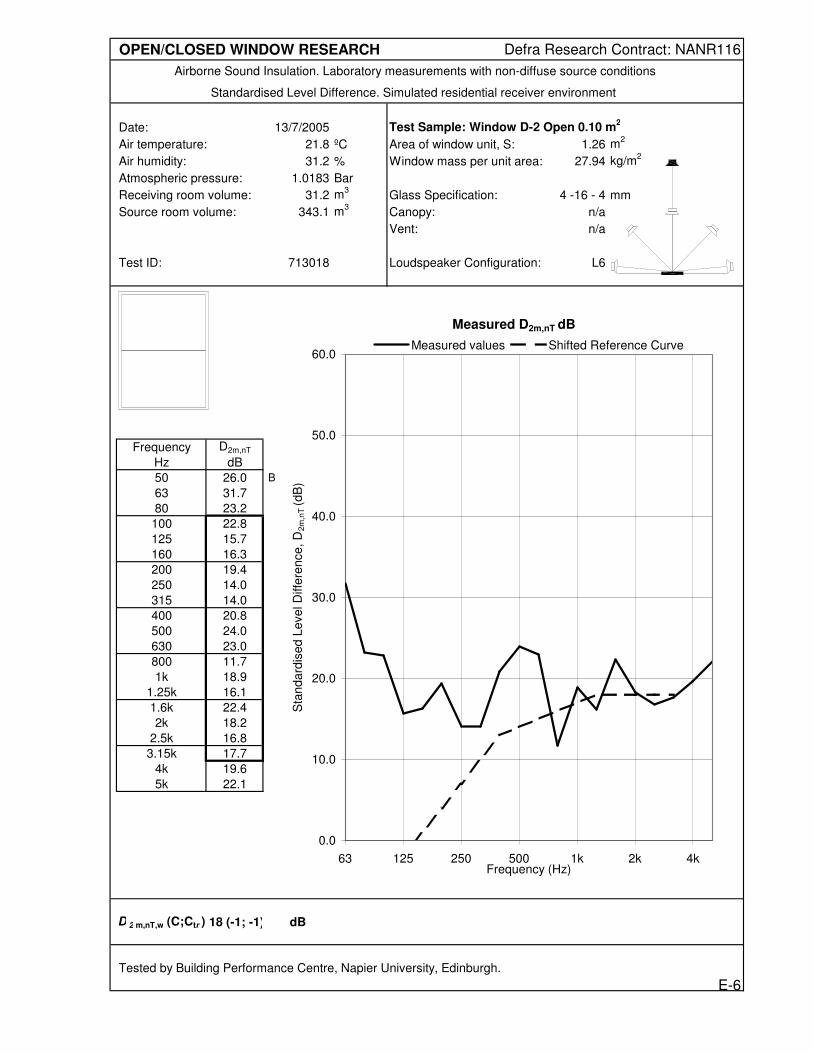
Date: 13/7/2005 Test Sample: Window D-2 Open 0.10 m2
Air temperature: 21.8 ºC Area of window unit, S: 1.26 m2
Air humidity: 31.2 % Window mass per unit area: 27.94 kg/m2
Atmospheric pressure: 1.0183 Bar
Receiving room volume: 31.2 m3
Glass Specification: 4 -16 - 4 mm
Source room volume: 343.1 m3
Canopy: n/a
Vent: n/a
Test ID: 713018 Loudspeaker Configuration: L6
Frequency D2m,nT
Hz dB
50 26.0 B
63 31.7
80 23.2
100 22.8 -5
125 15.7 -2
160 16.3 1
200 19.4 4
250 14.0 7
315 14.0 10
400 20.8 13
500 24.0 14
630 23.0 15
800 11.7 16
1k 18.9 17
1.25k 16.1 18
1.6k 22.4 18
2k 18.2 18
2.5k 16.8 18
3.15k 17.7 18
4k 19.6
5k 22.1
D 2 m,nT,w (C;Ctr ) 18 (-1; -1) dB
Tested by Building Performance Centre, Napier University, Edinburgh.
Measured D2m,nT dB
0.0
10.0
20.0
30.0
40.0
50.0
60.0
63 125 250 500 1k 2k 4kFrequency (Hz)
Sta
nd
ard
ise
d L
eve
l D
iffe
ren
ce
, D
2m
,nT
(d
B)
Measured values Shifted Reference Curve
E-6

OPEN/CLOSED WINDOW RESEARCH Defra Research Contract: NANR116
Airborne Sound Insulation. Laboratory measurements with non-diffuse source conditions
Standardised Level Difference. Simulated residential receiver environment
Date: 13/7/2005 Test Sample: Window D-3 Open 0.10 m2
Air temperature: 21.8 ºC Area of window unit, S: 1.26 m2
Air humidity: 31.2 % Window mass per unit area: 27.94 kg/m2
Atmospheric pressure: 1.0183 Bar
Receiving room volume: 31.2 m3
Glass Specification: 4 -16 - 4 mm
Source room volume: 343.1 m3
Canopy: n/a
Vent: n/a
Test ID: 713022 Loudspeaker Configuration: L6
Frequency D2m,nT
Hz dB
50 27.0 B
63 32.1
80 22.9
100 23.3 -2
125 15.8 1
160 16.7 4
200 18.6 7
250 14.4 10
315 17.4 13
400 23.3 16
500 23.9 17
630 19.6 18
800 15.2 19
1k 23.2 20
1.25k 23.7 21
1.6k 21.2 21
2k 22.4 21
2.5k 19.8 21
3.15k 21.3 21
4k 22.6
5k 26.2
D 2 m,nT,w (C;Ctr ) 21 (-1; -2) dB
Tested by Building Performance Centre, Napier University, Edinburgh.
Measured D2m,nT dB
0.0
10.0
20.0
30.0
40.0
50.0
60.0
63 125 250 500 1k 2k 4kFrequency (Hz)
Sta
nd
ard
ise
d L
eve
l D
iffe
ren
ce
, D
2m
,nT
(d
B)
Measured values Shifted Reference Curve
E-7

OPEN/CLOSED WINDOW RESEARCH Defra Research Contract: NANR116
Airborne Sound Insulation. Laboratory measurements with non-diffuse source conditions
Standardised Level Difference. Simulated residential receiver environment
Date: 18/7/2005 Test Sample: Window E Open 0.10 m2
Air temperature: 20.4 ºC Area of window unit, S: 0.63 m2
Air humidity: 31.2 % Window mass per unit area: 26.83 kg/m2
Atmospheric pressure: 0.9956 Bar
Receiving room volume: 31.2 m3
Glass Specification: 4 -16 - 4 mm
Source room volume: 343.1 m3
Canopy: n/a
Vent: n/a
Test ID: 718024 Loudspeaker Configuration: L6
Frequency D2m,nT
Hz dB
50 25.1
63 31.6
80 22.3
100 24.5 -2
125 18.1 1
160 18.1 4
200 20.2 7
250 20.1 10
315 21.0 13
400 21.9 16
500 19.8 17
630 17.8 18
800 19.0 19
1k 21.2 20
1.25k 19.5 21
1.6k 21.7 21
2k 20.3 21
2.5k 22.6 21
3.15k 22.2 21
4k 22.8
5k 23.3
D 2 m,nT,w (C;Ctr ) 21 ( 0; -1) dB
Tested by Building Performance Centre, Napier University, Edinburgh.
Measured D2m,nT dB
0.0
10.0
20.0
30.0
40.0
50.0
60.0
63 125 250 500 1k 2k 4kFrequency (Hz)
Sta
nd
ard
ise
d L
eve
l D
iffe
ren
ce
, D
2m
,nT
(d
B)
Measured values Shifted Reference Curve
E-8

OPEN/CLOSED WINDOW RESEARCH Defra Research Contract: NANR116
Airborne Sound Insulation. Laboratory measurements with non-diffuse source conditions
Standardised Level Difference. Simulated residential receiver environment
Date: 19/7/2005 Test Sample: Window F Open 0.10 m2
Air temperature: 19.9 ºC Area of window unit, S: 0.63 m2
Air humidity: 31.2 % Window mass per unit area: 26.83 kg/m2
Atmospheric pressure: 1.0019 Bar
Receiving room volume: 31.2 m3
Glass Specification: 4 -16 - 4 mm
Source room volume: 343.1 m3
Canopy: n/a
Vent: n/a
Test ID: 719005 Loudspeaker Configuration: L6
Frequency D2m,nT
Hz dB
50 25.0
63 31.6
80 22.8
100 23.8 -2
125 17.2 1
160 17.3 4
200 18.8 7
250 20.3 10
315 21.3 13
400 22.2 16
500 19.6 17
630 17.6 18
800 19.8 19
1k 22.6 20
1.25k 19.6 21
1.6k 20.3 21
2k 20.9 21
2.5k 22.2 21
3.15k 23.2 21
4k 23.0
5k 24.3
D 2 m,nT,w (C;Ctr ) 21 ( 0; -1) dB
Tested by Building Performance Centre, Napier University, Edinburgh.
Measured D2m,nT dB
0.0
10.0
20.0
30.0
40.0
50.0
60.0
63 125 250 500 1k 2k 4kFrequency (Hz)
Sta
nd
ard
ise
d L
eve
l D
iffe
ren
ce
, D
2m
,nT
(d
B)
Measured values Shifted Reference Curve
E-9

OPEN/CLOSED WINDOW RESEARCH Defra Research Contract: NANR116
Airborne Sound Insulation. Laboratory measurements with non-diffuse source conditions
Standardised Level Difference. Simulated residential receiver environment
Date: 20/7/2005 Test Sample: Window G Open 0.10 m2
Air temperature: 20.3 ºC Area of window unit, S: 0.54 m2
Air humidity: 31.2 % Window mass per unit area: 33.33 kg/m2
Atmospheric pressure: 1.0032 Bar
Receiving room volume: 31.2 m3
Glass Specification: 4 -16 - 4 mm
Source room volume: 343.1 m3
Canopy: n/a
Vent: Blocked
Test ID: 720005 Loudspeaker Configuration: L6
Frequency D2m,nT
Hz dB
50 24.8
63 30.8
80 21.9
100 22.9 -4
125 17.4 -1
160 16.8 2
200 18.9 5
250 19.2 8
315 21.2 11
400 22.6 14
500 20.8 15
630 16.0 16
800 18.8 17
1k 20.3 18
1.25k 19.2 19
1.6k 18.5 19
2k 17.8 19
2.5k 19.3 19
3.15k 18.9 19
4k 21.6
5k 21.2
D 2 m,nT,w (C;Ctr ) 19 ( 0; 0) dB
Tested by Building Performance Centre, Napier University, Edinburgh.
Measured D2m,nT dB
0.0
10.0
20.0
30.0
40.0
50.0
60.0
63 125 250 500 1k 2k 4kFrequency (Hz)
Sta
nd
ard
ise
d L
eve
l D
iffe
ren
ce
, D
2m
,nT
(d
B)
Measured values Shifted Reference Curve
E-10

OPEN/CLOSED WINDOW RESEARCH Defra Research Contract: NANR116
Airborne Sound Insulation. Laboratory measurements with non-diffuse source conditions
Standardised Level Difference. Simulated residential receiver environment
Date: 28/6/2005 Test Sample: Window A-1 Open 0.20 m2
Air temperature: 20.5 ºC Area of window unit, S: 2.52 m2
Air humidity: 31.2 % Window mass per unit area: 30.00 kg/m2
Atmospheric pressure: 1.0106 Bar
Receiving room volume: 31.2 m3
Glass Specification: 4 -16 - 4 mm
Source room volume: 343.1 m3
Canopy: n/a
Vent: n/a
Test ID: 628032 Loudspeaker Configuration: L6
Frequency D2m,nT
Hz dB
50 17.3
63 24.3
80 19.3
100 22.7 -3
125 14.1 0
160 12.6 3
200 13.8 6
250 10.8 9
315 15.4 12
400 19.5 15
500 19.5 16
630 19.8 17
800 18.2 18
1k 21.7 19
1.25k 16.4 20
1.6k 20.1 20
2k 20.2 20
2.5k 22.1 20
3.15k 20.7 20
4k 22.9
5k 23.8
D 2 m,nT,w (C;Ctr ) 20 (-1; -2) dB
Tested by Building Performance Centre, Napier University, Edinburgh.
Measured D2m,nT dB
0.0
10.0
20.0
30.0
40.0
50.0
60.0
63 125 250 500 1k 2k 4kFrequency (Hz)
Sta
nd
ard
ise
d L
eve
l D
iffe
ren
ce
, D
2m
,nT
(d
B)
Measured values Shifted Reference Curve
F-1

OPEN/CLOSED WINDOW RESEARCH Defra Research Contract: NANR116
Airborne Sound Insulation. Laboratory measurements with non-diffuse source conditions
Standardised Level Difference. Simulated residential receiver environment
Date: 5/7/05 Test Sample: Window B Open 0.20 m2
Air temperature: 19.5 ºC Area of window unit, S: 1.26 m2
Air humidity: 31.2 % Window mass per unit area: 27.94 kg/m2
Atmospheric pressure: 0.9981 Bar
Receiving room volume: 31.2 m3
Glass Specification: 4 -16 - 4 mm
Source room volume: 343.1 m3
Canopy: n/a
Vent: n/a
Test ID: 705030 Loudspeaker Configuration: L6
Frequency D2m,nT
Hz dB
50 22.7
63 27.7
80 18.5
100 19.6 -6
125 13.4 -3
160 12.2 0
200 17.2 3
250 11.8 6
315 13.6 9
400 18.8 12
500 21.6 13
630 17.5 14
800 11.0 15
1k 15.5 16
1.25k 13.0 17
1.6k 18.7 17
2k 17.9 17
2.5k 22.0 17
3.15k 19.4 17
4k 21.0
5k 25.3
D 2 m,nT,w (C;Ctr ) 17 (-1; -2) dB
Tested by Building Performance Centre, Napier University, Edinburgh.
Measured D2m,nT dB
0.0
10.0
20.0
30.0
40.0
50.0
60.0
63 125 250 500 1k 2k 4kFrequency (Hz)
Sta
nd
ard
ise
d L
eve
l D
iffe
ren
ce
, D
2m
,nT
(d
B)
Measured values Shifted Reference Curve
F-2

OPEN/CLOSED WINDOW RESEARCH Defra Research Contract: NANR116
Airborne Sound Insulation. Laboratory measurements with non-diffuse source conditions
Standardised Level Difference. Simulated residential receiver environment
Date: 11/7/05 Test Sample: Window C-1 Open 0.20 m2
Air temperature: 20.6 ºC Area of window unit, S: 0.945 m2
Air humidity: 31.2 % Window mass per unit area: 36.83 kg/m2
Atmospheric pressure: 1.0278 Bar
Receiving room volume: 31.2 m3
Glass Specification: 4 -16 - 4 mm
Source room volume: 343.1 m3
Canopy: Original
Vent: Closed
Test ID: 711021 Loudspeaker Configuration: L6
Frequency D2m,nT
Hz dB
50 24.5 b
63 30.1
80 21.1
100 22.8 -3
125 15.8 0
160 17.4 3
200 20.9 6
250 21.3 9
315 24.9 12
400 21.1 15
500 18.1 16
630 15.9 17
800 12.8 18
1k 20.9 19
1.25k 19.3 20
1.6k 21.2 20
2k 21.2 20
2.5k 24.3 20
3.15k 25.1 20
4k 27.4
5k 27.2
D 2 m,nT,w (C;Ctr ) 20 (-1; -2) dB
Tested by Building Performance Centre, Napier University, Edinburgh.
Measured D2m,nT dB
0.0
10.0
20.0
30.0
40.0
50.0
60.0
63 125 250 500 1k 2k 4kFrequency (Hz)
Sta
nd
ard
ise
d L
eve
l D
iffe
ren
ce
, D
2m
,nT
(d
B)
Measured values Shifted Reference Curve
F-3

OPEN/CLOSED WINDOW RESEARCH Defra Research Contract: NANR116
Airborne Sound Insulation. Laboratory measurements with non-diffuse source conditions
Standardised Level Difference. Simulated residential receiver environment
Date: 11/7/05 Test Sample: Window C-2 Open 0.20 m2
Air temperature: 20.6 ºC Area of window unit, S: 0.945 m2
Air humidity: 31.2 % Window mass per unit area: 36.83 kg/m2
Atmospheric pressure: 1.0278 Bar
Receiving room volume: 31.2 m3
Glass Specification: 4 -16 - 4 mm
Source room volume: 343.1 m3
Canopy: Original
Vent: Closed
Test ID: 711025 Loudspeaker Configuration: L6
Frequency D2m,nT
Hz dB
50 23.2 b
63 29.4
80 20.8
100 22.0 -3
125 15.3 0
160 15.8 3
200 18.9 6
250 17.7 9
315 19.6 12
400 22.5 15
500 19.5 16
630 17.1 17
800 12.3 18
1k 20.2 19
1.25k 19.6 20
1.6k 20.9 20
2k 19.8 20
2.5k 24.3 20
3.15k 24.4 20
4k 26.4
5k 27.4
D 2 m,nT,w (C;Ctr ) 20 (-1; -2) dB
Tested by Building Performance Centre, Napier University, Edinburgh.
Measured D2m,nT dB
0.0
10.0
20.0
30.0
40.0
50.0
60.0
63 125 250 500 1k 2k 4kFrequency (Hz)
Sta
nd
ard
ise
d L
eve
l D
iffe
ren
ce
, D
2m
,nT
(d
B)
Measured values Shifted Reference Curve
F-4

OPEN/CLOSED WINDOW RESEARCH Defra Research Contract: NANR116
Airborne Sound Insulation. Laboratory measurements with non-diffuse source conditions
Standardised Level Difference. Simulated residential receiver environment
Date: 13/7/2005 Test Sample: Window D-1 Open 0.20 m2
Air temperature: 21.8 ºC Area of window unit, S: 1.26 m2
Air humidity: 31.2 % Window mass per unit area: 27.94 kg/m2
Atmospheric pressure: 1.0183 Bar
Receiving room volume: 31.2 m3
Glass Specification: 4 -16 - 4 mm
Source room volume: 343.1 m3
Canopy: n/a
Vent: n/a
Test ID: 713027 Loudspeaker Configuration: L6
Frequency D2m,nT
Hz dB
50 24.0 B
63 29.1
80 19.9
100 21.4 -6
125 13.9 -3
160 15.6 0
200 20.5 3
250 19.2 6
315 16.4 9
400 16.1 12
500 15.9 13
630 15.5 14
800 14.0 15
1k 19.5 16
1.25k 15.9 17
1.6k 18.9 17
2k 17.3 17
2.5k 17.9 17
3.15k 19.1 17
4k 19.7
5k 20.2
D 2 m,nT,w (C;Ctr ) 17 ( 0; 0) dB
Tested by Building Performance Centre, Napier University, Edinburgh.
Measured D2m,nT dB
0.0
10.0
20.0
30.0
40.0
50.0
60.0
63 125 250 500 1k 2k 4kFrequency (Hz)
Sta
nd
ard
ise
d L
eve
l D
iffe
ren
ce
, D
2m
,nT
(d
B)
Measured values Shifted Reference Curve
F-5

OPEN/CLOSED WINDOW RESEARCH Defra Research Contract: NANR116
Airborne Sound Insulation. Laboratory measurements with non-diffuse source conditions
Standardised Level Difference. Simulated residential receiver environment
Date: 13/7/2005 Test Sample: Window D-2 Open 0.20 m2
Air temperature: 21.8 ºC Area of window unit, S: 1.26 m2
Air humidity: 31.2 % Window mass per unit area: 27.94 kg/m2
Atmospheric pressure: 1.0183 Bar
Receiving room volume: 31.2 m3
Glass Specification: 4 -16 - 4 mm
Source room volume: 343.1 m3
Canopy: n/a
Vent: n/a
Test ID: 713019 Loudspeaker Configuration: L6
Frequency D2m,nT
Hz dB
50 24.9 B
63 29.9
80 21.3
100 20.9 -9
125 13.7 -6
160 14.5 -3
200 16.5 0
250 11.3 3
315 11.1 6
400 18.8 9
500 26.6 10
630 22.1 11
800 7.8 12
1k 15.0 13
1.25k 14.0 14
1.6k 20.4 14
2k 14.2 14
2.5k 14.8 14
3.15k 13.1 14
4k 15.4
5k 18.4
D 2 m,nT,w (C;Ctr ) 14 ( 0; -1) dB
Tested by Building Performance Centre, Napier University, Edinburgh.
Measured D2m,nT dB
0.0
10.0
20.0
30.0
40.0
50.0
60.0
63 125 250 500 1k 2k 4kFrequency (Hz)
Sta
nd
ard
ise
d L
eve
l D
iffe
ren
ce
, D
2m
,nT
(d
B)
Measured values Shifted Reference Curve
F-6
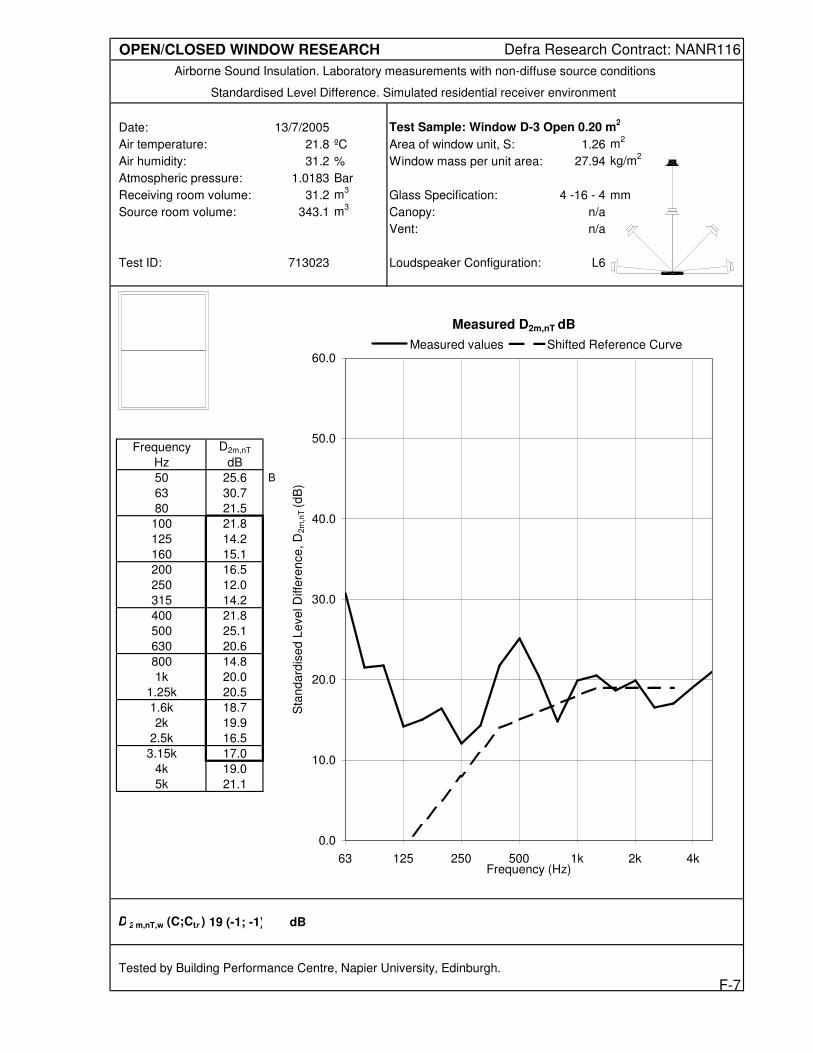
OPEN/CLOSED WINDOW RESEARCH Defra Research Contract: NANR116
Airborne Sound Insulation. Laboratory measurements with non-diffuse source conditions
Standardised Level Difference. Simulated residential receiver environment
Date: 13/7/2005 Test Sample: Window D-3 Open 0.20 m2
Air temperature: 21.8 ºC Area of window unit, S: 1.26 m2
Air humidity: 31.2 % Window mass per unit area: 27.94 kg/m2
Atmospheric pressure: 1.0183 Bar
Receiving room volume: 31.2 m3
Glass Specification: 4 -16 - 4 mm
Source room volume: 343.1 m3
Canopy: n/a
Vent: n/a
Test ID: 713023 Loudspeaker Configuration: L6
Frequency D2m,nT
Hz dB
50 25.6 B
63 30.7
80 21.5
100 21.8 -4
125 14.2 -1
160 15.1 2
200 16.5 5
250 12.0 8
315 14.2 11
400 21.8 14
500 25.1 15
630 20.6 16
800 14.8 17
1k 20.0 18
1.25k 20.5 19
1.6k 18.7 19
2k 19.9 19
2.5k 16.5 19
3.15k 17.0 19
4k 19.0
5k 21.1
D 2 m,nT,w (C;Ctr ) 19 (-1; -1) dB
Tested by Building Performance Centre, Napier University, Edinburgh.
Measured D2m,nT dB
0.0
10.0
20.0
30.0
40.0
50.0
60.0
63 125 250 500 1k 2k 4kFrequency (Hz)
Sta
nd
ard
ise
d L
eve
l D
iffe
ren
ce
, D
2m
,nT
(d
B)
Measured values Shifted Reference Curve
F-7

OPEN/CLOSED WINDOW RESEARCH Defra Research Contract: NANR116
Airborne Sound Insulation. Laboratory measurements with non-diffuse source conditions
Standardised Level Difference. Simulated residential receiver environment
Date: 18/7/2005 Test Sample: Window E Open 0.20 m2
Air temperature: 20.4 ºC Area of window unit, S: 0.63 m2
Air humidity: 31.2 % Window mass per unit area: 26.83 kg/m2
Atmospheric pressure: 0.9956 Bar
Receiving room volume: 31.2 m3
Glass Specification: 4 -16 - 4 mm
Source room volume: 343.1 m3
Canopy: n/a
Vent: n/a
Test ID: 718023 Loudspeaker Configuration: L6
Frequency D2m,nT
Hz dB
50 23.8
63 30.3
80 21.1
100 23.2 -4
125 16.7 -1
160 17.0 2
200 19.2 5
250 18.9 8
315 19.6 11
400 19.5 14
500 17.8 15
630 17.1 16
800 17.9 17
1k 18.9 18
1.25k 18.9 19
1.6k 20.6 19
2k 19.4 19
2.5k 19.9 19
3.15k 20.4 19
4k 20.2
5k 20.4
D 2 m,nT,w (C;Ctr ) 19 ( 0; 0) dB
Tested by Building Performance Centre, Napier University, Edinburgh.
Measured D2m,nT dB
0.0
10.0
20.0
30.0
40.0
50.0
60.0
63 125 250 500 1k 2k 4kFrequency (Hz)
Sta
nd
ard
ise
d L
eve
l D
iffe
ren
ce
, D
2m
,nT
(d
B)
Measured values Shifted Reference Curve
F-8

OPEN/CLOSED WINDOW RESEARCH Defra Research Contract: NANR116
Airborne Sound Insulation. Laboratory measurements with non-diffuse source conditions
Standardised Level Difference. Simulated residential receiver environment
Date: 19/7/2005 Test Sample: Window F Open 0.20 m2
Air temperature: 19.9 ºC Area of window unit, S: 0.63 m2
Air humidity: 31.2 % Window mass per unit area: 26.83 kg/m2
Atmospheric pressure: 1.0019 Bar
Receiving room volume: 31.2 m3
Glass Specification: 4 -16 - 4 mm
Source room volume: 343.1 m3
Canopy: n/a
Vent: n/a
Test ID: 719006 Loudspeaker Configuration: L6
Frequency D2m,nT
Hz dB
50 23.6
63 30.1
80 21.5
100 22.7 -4
125 15.8 -1
160 16.1 2
200 17.8 5
250 18.9 8
315 19.7 11
400 19.2 14
500 17.5 15
630 17.0 16
800 18.1 17
1k 19.2 18
1.25k 19.7 19
1.6k 19.8 19
2k 19.1 19
2.5k 19.7 19
3.15k 20.6 19
4k 21.7
5k 22.2
D 2 m,nT,w (C;Ctr ) 19 ( 0; 0) dB
Tested by Building Performance Centre, Napier University, Edinburgh.
Measured D2m,nT dB
0.0
10.0
20.0
30.0
40.0
50.0
60.0
63 125 250 500 1k 2k 4kFrequency (Hz)
Sta
nd
ard
ise
d L
eve
l D
iffe
ren
ce
, D
2m
,nT
(d
B)
Measured values Shifted Reference Curve
F-9

OPEN/CLOSED WINDOW RESEARCH Defra Research Contract: NANR116
Airborne Sound Insulation. Laboratory measurements with non-diffuse source conditions
Standardised Level Difference. Simulated residential receiver environment
Date: 20/7/2005 Test Sample: Window G Open 0.20 m2
Air temperature: 20.3 ºC Area of window unit, S: 0.54 m2
Air humidity: 31.2 % Window mass per unit area: 33.33 kg/m2
Atmospheric pressure: 1.0032 Bar
Receiving room volume: 31.2 m3
Glass Specification: 4 -16 - 4 mm
Source room volume: 343.1 m3
Canopy: n/a
Vent: Blocked
Test ID: 720006 Loudspeaker Configuration: L6
Frequency D2m,nT
Hz dB
50 23.5
63 29.5
80 20.8
100 21.7 -5
125 16.1 -2
160 15.4 1
200 16.8 4
250 17.0 7
315 18.9 10
400 20.2 13
500 19.1 14
630 16.1 15
800 18.8 16
1k 20.2 17
1.25k 19.1 18
1.6k 17.7 18
2k 16.5 18
2.5k 18.5 18
3.15k 18.0 18
4k 18.9
5k 19.3
D 2 m,nT,w (C;Ctr ) 18 ( 0; 0) dB
Tested by Building Performance Centre, Napier University, Edinburgh.
Measured D2m,nT dB
0.0
10.0
20.0
30.0
40.0
50.0
60.0
63 125 250 500 1k 2k 4kFrequency (Hz)
Sta
nd
ard
ise
d L
eve
l D
iffe
ren
ce
, D
2m
,nT
(d
B)
Measured values Shifted Reference Curve
F-10

OPEN/CLOSED WINDOW RESEARCH Defra Research Contract: NANR116
Airborne Sound Insulation. Laboratory measurements with non-diffuse source conditions
Standardised Level Difference. Simulated residential receiver environment
Date: 17/7/2005 Test Sample: Window C-3 Closed.
Air temperature: 21 ºC Area of window unit, S: 0.995 m2
Air humidity: 31.2 % Window mass per unit area: 39.20 kg/m2
Atmospheric pressure: 1.0047 Bar
Receiving room volume: 31.2 m3
Glass Specification: 4 -18 - 6.4(lam) mm
Source room volume: 343.1 m3
Canopy: n/a
Vent: Half slot
Test ID: 717071 Loudspeaker Configuration: L6
Frequency D2m,nT
Hz dB
50 30.0
63 36.0
80 28.0
100 30.5 6
125 24.6 9
160 25.1 12
200 31.5 15
250 34.6 18
315 32.6 21
400 29.4 24
500 27.6 25
630 26.9 26
800 27.6 27
1k 26.2 28
1.25k 26.8 29
1.6k 30.8 29
2k 29.8 29
2.5k 36.9 29
3.15k 31.8 29
4k 32.3
5k 37.9
D 2 m,nT,w (C;Ctr ) 29 ( 0; -1) dB
Tested by Building Performance Centre, Napier University, Edinburgh.
Measured D2m,nT dB
0.0
10.0
20.0
30.0
40.0
50.0
60.0
63 125 250 500 1k 2k 4kFrequency (Hz)
Sta
nd
ard
ise
d L
eve
l D
iffe
ren
ce
, D
2m
,nT
(d
B)
Measured values Shifted Reference Curve
G-1
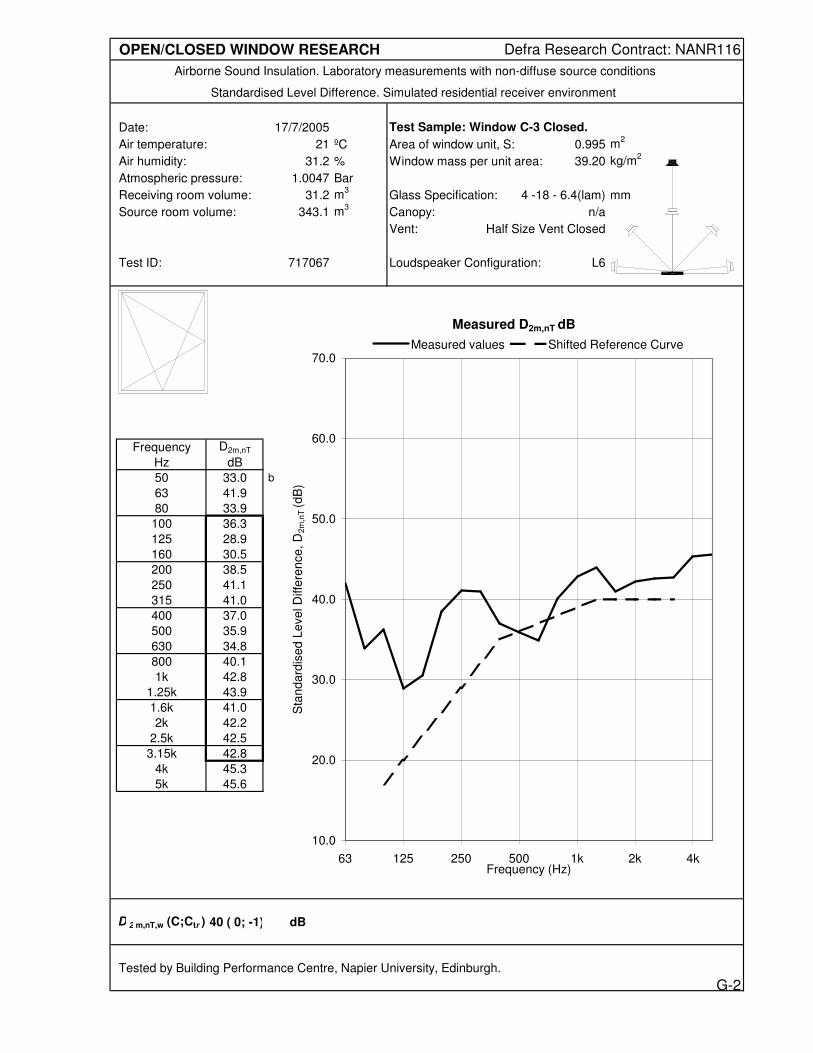
OPEN/CLOSED WINDOW RESEARCH Defra Research Contract: NANR116
Airborne Sound Insulation. Laboratory measurements with non-diffuse source conditions
Standardised Level Difference. Simulated residential receiver environment
Date: 17/7/2005 Test Sample: Window C-3 Closed.
Air temperature: 21 ºC Area of window unit, S: 0.995 m2
Air humidity: 31.2 % Window mass per unit area: 39.20 kg/m2
Atmospheric pressure: 1.0047 Bar
Receiving room volume: 31.2 m3
Glass Specification: 4 -18 - 6.4(lam) mm
Source room volume: 343.1 m3
Canopy: n/a
Vent: Half Size Vent Closed
Test ID: 717067 Loudspeaker Configuration: L6
Frequency D2m,nT
Hz dB
50 33.0 b
63 41.9
80 33.9
100 36.3 17
125 28.9 20
160 30.5 23
200 38.5 26
250 41.1 29
315 41.0 32
400 37.0 35
500 35.9 36
630 34.8 37
800 40.1 38
1k 42.8 39
1.25k 43.9 40
1.6k 41.0 40
2k 42.2 40
2.5k 42.5 40
3.15k 42.8 40
4k 45.3
5k 45.6
D 2 m,nT,w (C;Ctr ) 40 ( 0; -1) dB
Tested by Building Performance Centre, Napier University, Edinburgh.
Measured D2m,nT dB
10.0
20.0
30.0
40.0
50.0
60.0
70.0
63 125 250 500 1k 2k 4kFrequency (Hz)
Sta
nd
ard
ise
d L
eve
l D
iffe
ren
ce
, D
2m
,nT
(d
B)
Measured values Shifted Reference Curve
G-2

OPEN/CLOSED WINDOW RESEARCH Defra Research Contract: NANR116
Airborne Sound Insulation. Laboratory measurements with non-diffuse source conditions
Standardised Level Difference. Simulated residential receiver environment
Date: 17/7/2005 Test Sample: Window C-3 Closed.
Air temperature: 21 ºC Area of window unit, S: 0.995 m2
Air humidity: 31.2 % Window mass per unit area: 39.20 kg/m2
Atmospheric pressure: 1.0047 Bar
Receiving room volume: 31.2 m3
Glass Specification: 4 -18 - 6.4(lam) mm
Source room volume: 343.1 m3
Canopy: n/a
Vent: Half Size Vent Open
Test ID: 717068 Loudspeaker Configuration: L6
Frequency D2m,nT
Hz dB
50 32.6 b
63 40.8
80 32.9
100 35.4 15
125 28.2 18
160 29.5 21
200 37.9 24
250 40.2 27
315 39.6 30
400 35.8 33
500 35.0 34
630 34.0 35
800 39.2 36
1k 40.9 37
1.25k 41.8 38
1.6k 36.3 38
2k 37.4 38
2.5k 39.4 38
3.15k 35.5 38
4k 36.7
5k 39.7
D 2 m,nT,w (C;Ctr ) 38 (-1; -1) dB
Tested by Building Performance Centre, Napier University, Edinburgh.
Measured D2m,nT dB
10.0
20.0
30.0
40.0
50.0
60.0
70.0
63 125 250 500 1k 2k 4kFrequency (Hz)
Sta
nd
ard
ise
d L
eve
l D
iffe
ren
ce
, D
2m
,nT
(d
B)
Measured values Shifted Reference Curve
G-3

OPEN/CLOSED WINDOW RESEARCH Defra Research Contract: NANR116
Airborne Sound Insulation. Laboratory measurements with non-diffuse source conditions
Standardised Level Difference. Simulated residential receiver environment
Date: 17/7/2005 Test Sample: Window C-3 Closed.
Air temperature: 20.4 ºC Area of window unit, S: 0.995 m2
Air humidity: 31.2 % Window mass per unit area: 39.20 kg/m2
Atmospheric pressure: 1.0076 Bar
Receiving room volume: 31.2 m3
Glass Specification: 4 -18 - 6.4(lam) mm
Source room volume: 343.1 m3
Canopy: n/a
Vent: Slot only
Test ID: 717018 Loudspeaker Configuration: L6
Frequency D2m,nT
Hz dB
50 32.3 b
63 39.2
80 30.5
100 33.4 10
125 27.2 13
160 28.5 16
200 36.2 19
250 37.1 22
315 35.1 25
400 32.4 28
500 31.9 29
630 30.6 30
800 35.9 31
1k 35.0 32
1.25k 33.5 33
1.6k 31.9 33
2k 32.8 33
2.5k 35.4 33
3.15k 31.1 33
4k 29.9
5k 35.0
D 2 m,nT,w (C;Ctr ) 33 ( 0; 0) dB
Tested by Building Performance Centre, Napier University, Edinburgh.
Measured D2m,nT dB
10.0
20.0
30.0
40.0
50.0
60.0
70.0
63 125 250 500 1k 2k 4kFrequency (Hz)
Sta
nd
ard
ise
d L
eve
l D
iffe
ren
ce
, D
2m
,nT
(d
B)
Measured values Shifted Reference Curve
G-4

OPEN/CLOSED WINDOW RESEARCH Defra Research Contract: NANR116
Airborne Sound Insulation. Laboratory measurements with non-diffuse source conditions
Standardised Level Difference. Simulated residential receiver environment
Date: 12/7/05 Test Sample: Window C-3 Closed.
Air temperature: 20.9 ºC Area of window unit, S: 0.945 m2
Air humidity: 31.2 % Window mass per unit area: 36.83 kg/m2
Atmospheric pressure: 1.0254 Bar
Receiving room volume: 31.2 m3
Glass Specification: 4 -18 - 6.4(lam) mm
Source room volume: 343.1 m3
Canopy: n/a
Vent: Vent 1 closed
Test ID: 712014 Loudspeaker Configuration: L6
Frequency D2m,nT
Hz dB
50 29.6 B
63 44.5 b
80 35.9
100 37.0 16
125 28.3 19
160 29.9 22
200 38.3 25
250 38.1 28
315 41.3 31
400 38.0 34
500 39.0 35
630 37.4 36
800 38.3 37
1k 32.9 38
1.25k 34.8 39
1.6k 43.1 39
2k 43.2 39
2.5k 43.6 39
3.15k 42.0 39
4k 45.1 b
5k 40.9 b
D 2 m,nT,w (C;Ctr ) 39 (-1; -3) dB
Tested by Building Performance Centre, Napier University, Edinburgh.
Measured D2m,nT dB
10.0
20.0
30.0
40.0
50.0
60.0
70.0
63 125 250 500 1k 2k 4kFrequency (Hz)
Sta
nd
ard
ise
d L
eve
l D
iffe
ren
ce
, D
2m
,nT
(d
B)
Measured values Shifted Reference Curve
G-5

OPEN/CLOSED WINDOW RESEARCH Defra Research Contract: NANR116
Airborne Sound Insulation. Laboratory measurements with non-diffuse source conditions
Standardised Level Difference. Simulated residential receiver environment
Date: 17/7/2005 Test Sample: Window C-3 Closed.
Air temperature: 21.1 ºC Area of window unit, S: 0.995 m2
Air humidity: 31.2 % Window mass per unit area: 39.20 kg/m2
Atmospheric pressure: 1.0049 Bar
Receiving room volume: 31.2 m3
Glass Specification: 4 -18 - 6.4(lam) mm
Source room volume: 343.1 m3
Canopy: n/a
Vent: Vent 1 closed
Test ID: 717058 Loudspeaker Configuration: L6
Frequency D2m,nT
Hz dB
50 33.1 b
63 42.0
80 34.1
100 36.5 17
125 29.2 20
160 31.0 23
200 38.6 26
250 40.4 29
315 40.4 32
400 36.5 35
500 35.6 36
630 35.2 37
800 39.3 38
1k 38.4 39
1.25k 42.5 40
1.6k 41.8 40
2k 40.9 40
2.5k 42.9 40
3.15k 42.1 40
4k 44.6
5k 48.1
D 2 m,nT,w (C;Ctr ) 40 (-1; -2) dB
Tested by Building Performance Centre, Napier University, Edinburgh.
Measured D2m,nT dB
10.0
20.0
30.0
40.0
50.0
60.0
70.0
63 125 250 500 1k 2k 4kFrequency (Hz)
Sta
nd
ard
ise
d L
eve
l D
iffe
ren
ce
, D
2m
,nT
(d
B)
Measured values Shifted Reference Curve
G-6
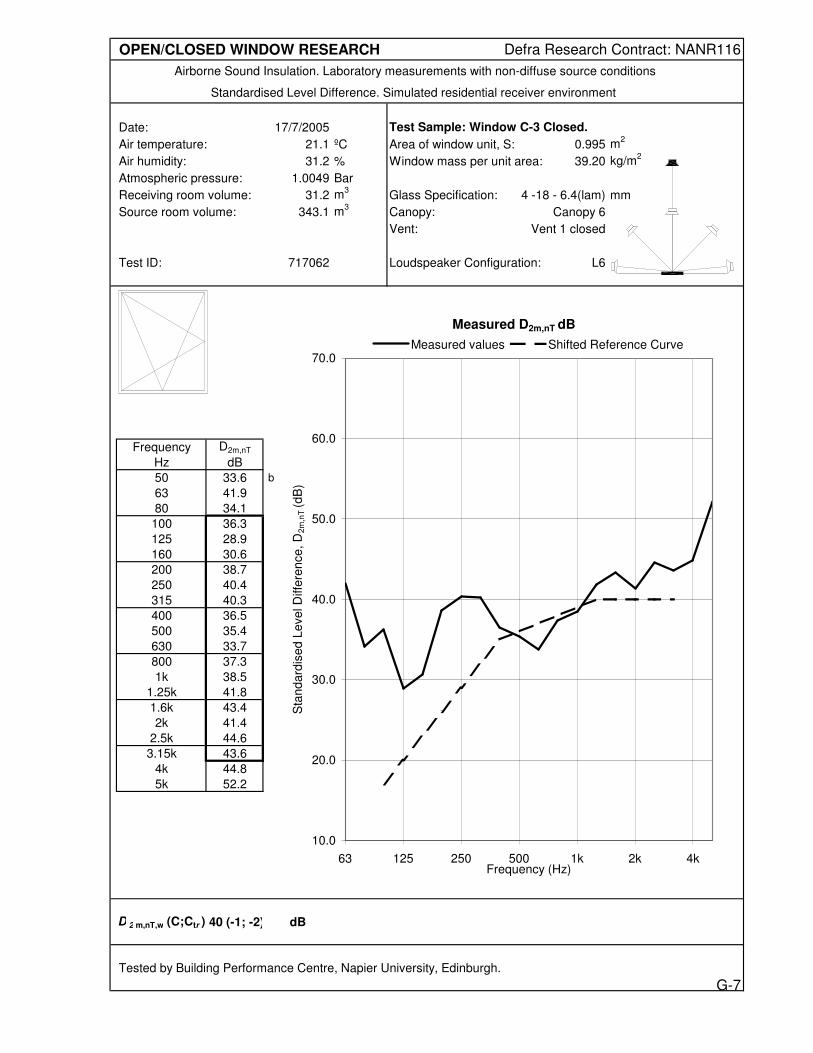
OPEN/CLOSED WINDOW RESEARCH Defra Research Contract: NANR116
Airborne Sound Insulation. Laboratory measurements with non-diffuse source conditions
Standardised Level Difference. Simulated residential receiver environment
Date: 17/7/2005 Test Sample: Window C-3 Closed.
Air temperature: 21.1 ºC Area of window unit, S: 0.995 m2
Air humidity: 31.2 % Window mass per unit area: 39.20 kg/m2
Atmospheric pressure: 1.0049 Bar
Receiving room volume: 31.2 m3
Glass Specification: 4 -18 - 6.4(lam) mm
Source room volume: 343.1 m3
Canopy: Canopy 6
Vent: Vent 1 closed
Test ID: 717062 Loudspeaker Configuration: L6
Frequency D2m,nT
Hz dB
50 33.6 b
63 41.9
80 34.1
100 36.3 17
125 28.9 20
160 30.6 23
200 38.7 26
250 40.4 29
315 40.3 32
400 36.5 35
500 35.4 36
630 33.7 37
800 37.3 38
1k 38.5 39
1.25k 41.8 40
1.6k 43.4 40
2k 41.4 40
2.5k 44.6 40
3.15k 43.6 40
4k 44.8
5k 52.2
D 2 m,nT,w (C;Ctr ) 40 (-1; -2) dB
Tested by Building Performance Centre, Napier University, Edinburgh.
Measured D2m,nT dB
10.0
20.0
30.0
40.0
50.0
60.0
70.0
63 125 250 500 1k 2k 4kFrequency (Hz)
Sta
nd
ard
ise
d L
eve
l D
iffe
ren
ce
, D
2m
,nT
(d
B)
Measured values Shifted Reference Curve
G-7

OPEN/CLOSED WINDOW RESEARCH Defra Research Contract: NANR116
Airborne Sound Insulation. Laboratory measurements with non-diffuse source conditions
Standardised Level Difference. Simulated residential receiver environment
Date: 17/7/2005 Test Sample: Window C-3 Closed.
Air temperature: 20.3 ºC Area of window unit, S: 0.995 m2
Air humidity: 31.2 % Window mass per unit area: 39.20 kg/m2
Atmospheric pressure: 1.0079 Bar
Receiving room volume: 31.2 m3
Glass Specification: 4 -18 - 6.4(lam) mm
Source room volume: 343.1 m3
Canopy: Canopy 1
Vent: Vent 1 closed
Test ID: 717010 Loudspeaker Configuration: L6
Frequency D2m,nT
Hz dB
50 33.5 b
63 42.4
80 34.2
100 36.9 17
125 29.7 20
160 31.1 23
200 38.5 26
250 40.6 29
315 40.7 32
400 36.8 35
500 35.4 36
630 33.3 37
800 39.0 38
1k 39.7 39
1.25k 44.1 40
1.6k 43.2 40
2k 41.8 40
2.5k 40.9 40
3.15k 43.6 40
4k 45.6
5k 50.0
D 2 m,nT,w (C;Ctr ) 40 (-1; -2) dB
Tested by Building Performance Centre, Napier University, Edinburgh.
Measured D2m,nT dB
10.0
20.0
30.0
40.0
50.0
60.0
70.0
63 125 250 500 1k 2k 4kFrequency (Hz)
Sta
nd
ard
ise
d L
eve
l D
iffe
ren
ce
, D
2m
,nT
(d
B)
Measured values Shifted Reference Curve
G-8
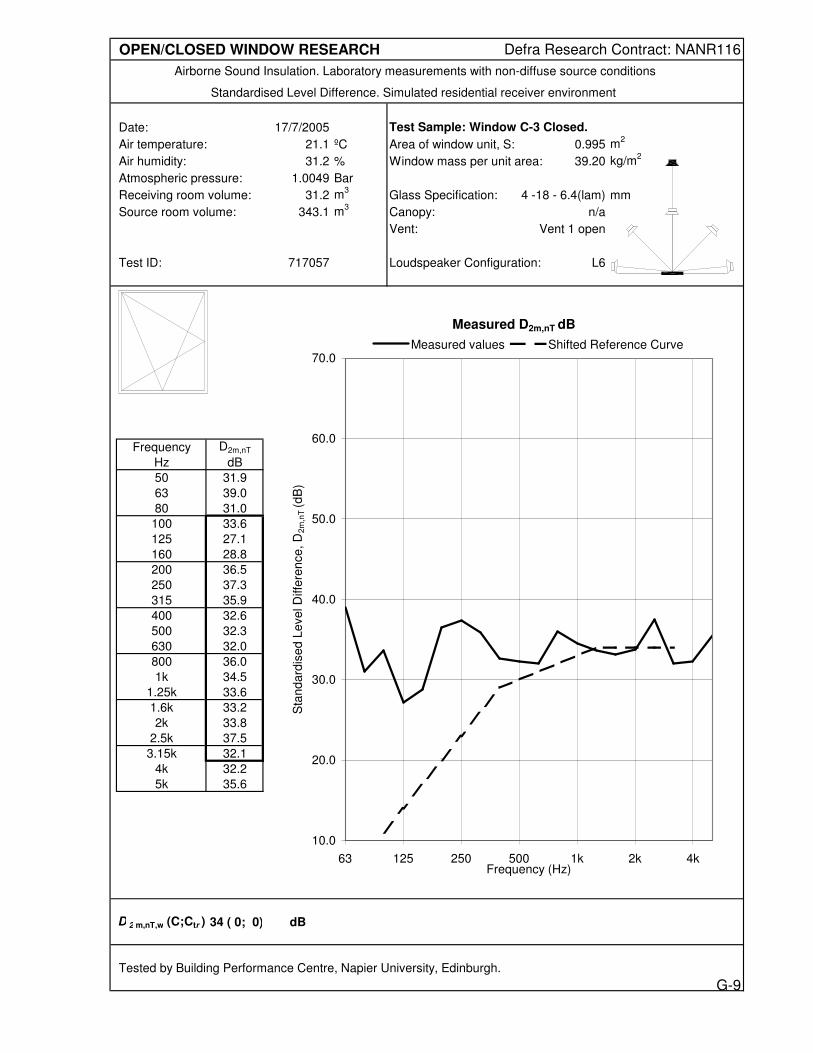
OPEN/CLOSED WINDOW RESEARCH Defra Research Contract: NANR116
Airborne Sound Insulation. Laboratory measurements with non-diffuse source conditions
Standardised Level Difference. Simulated residential receiver environment
Date: 17/7/2005 Test Sample: Window C-3 Closed.
Air temperature: 21.1 ºC Area of window unit, S: 0.995 m2
Air humidity: 31.2 % Window mass per unit area: 39.20 kg/m2
Atmospheric pressure: 1.0049 Bar
Receiving room volume: 31.2 m3
Glass Specification: 4 -18 - 6.4(lam) mm
Source room volume: 343.1 m3
Canopy: n/a
Vent: Vent 1 open
Test ID: 717057 Loudspeaker Configuration: L6
Frequency D2m,nT
Hz dB
50 31.9
63 39.0
80 31.0
100 33.6 11
125 27.1 14
160 28.8 17
200 36.5 20
250 37.3 23
315 35.9 26
400 32.6 29
500 32.3 30
630 32.0 31
800 36.0 32
1k 34.5 33
1.25k 33.6 34
1.6k 33.2 34
2k 33.8 34
2.5k 37.5 34
3.15k 32.1 34
4k 32.2
5k 35.6
D 2 m,nT,w (C;Ctr ) 34 ( 0; 0) dB
Tested by Building Performance Centre, Napier University, Edinburgh.
Measured D2m,nT dB
10.0
20.0
30.0
40.0
50.0
60.0
70.0
63 125 250 500 1k 2k 4kFrequency (Hz)
Sta
nd
ard
ise
d L
eve
l D
iffe
ren
ce
, D
2m
,nT
(d
B)
Measured values Shifted Reference Curve
G-9

OPEN/CLOSED WINDOW RESEARCH Defra Research Contract: NANR116
Airborne Sound Insulation. Laboratory measurements with non-diffuse source conditions
Standardised Level Difference. Simulated residential receiver environment
Date: 17/7/2005 Test Sample: Window C-3 Closed.
Air temperature: 21.1 ºC Area of window unit, S: 0.995 m2
Air humidity: 31.2 % Window mass per unit area: 39.20 kg/m2
Atmospheric pressure: 1.0049 Bar
Receiving room volume: 31.2 m3
Glass Specification: 4 -18 - 6.4(lam) mm
Source room volume: 343.1 m3
Canopy: Canopy 6
Vent: Vent 1 open
Test ID: 717061 Loudspeaker Configuration: L6
Frequency D2m,nT
Hz dB
50 32.5
63 39.6
80 31.6
100 34.1 11
125 27.4 14
160 29.2 17
200 36.8 20
250 38.2 23
315 36.9 26
400 33.6 29
500 33.1 30
630 31.8 31
800 34.4 32
1k 31.3 33
1.25k 29.4 34
1.6k 35.4 34
2k 35.5 34
2.5k 41.0 34
3.15k 34.6 34
4k 33.6
5k 41.2
D 2 m,nT,w (C;Ctr ) 34 (-1; -1) dB
Tested by Building Performance Centre, Napier University, Edinburgh.
Measured D2m,nT dB
10.0
20.0
30.0
40.0
50.0
60.0
70.0
63 125 250 500 1k 2k 4kFrequency (Hz)
Sta
nd
ard
ise
d L
eve
l D
iffe
ren
ce
, D
2m
,nT
(d
B)
Measured values Shifted Reference Curve
G-10

OPEN/CLOSED WINDOW RESEARCH Defra Research Contract: NANR116
Airborne Sound Insulation. Laboratory measurements with non-diffuse source conditions
Standardised Level Difference. Simulated residential receiver environment
Date: 17/7/2005 Test Sample: Window C-3 Closed.
Air temperature: 20.3 ºC Area of window unit, S: 0.995 m2
Air humidity: 31.2 % Window mass per unit area: 39.20 kg/m2
Atmospheric pressure: 1.0079 Bar
Receiving room volume: 31.2 m3
Glass Specification: 4 -18 - 6.4(lam) mm
Source room volume: 343.1 m3
Canopy: Canopy 1
Vent: Vent 1 open
Test ID: 717009 Loudspeaker Configuration: L6
Frequency D2m,nT
Hz dB
50 32.1 b
63 39.6
80 31.1
100 34.0 11
125 27.7 14
160 28.8 17
200 36.5 20
250 37.7 23
315 36.1 26
400 33.0 29
500 32.4 30
630 30.7 31
800 35.8 32
1k 33.8 33
1.25k 31.4 34
1.6k 34.3 34
2k 34.5 34
2.5k 37.5 34
3.15k 33.5 34
4k 34.8
5k 36.7
D 2 m,nT,w (C;Ctr ) 34 ( 0; -1) dB
Tested by Building Performance Centre, Napier University, Edinburgh.
Measured D2m,nT dB
10.0
20.0
30.0
40.0
50.0
60.0
70.0
63 125 250 500 1k 2k 4kFrequency (Hz)
Sta
nd
ard
ise
d L
eve
l D
iffe
ren
ce
, D
2m
,nT
(d
B)
Measured values Shifted Reference Curve
G-11

OPEN/CLOSED WINDOW RESEARCH Defra Research Contract: NANR116
Airborne Sound Insulation. Laboratory measurements with non-diffuse source conditions
Standardised Level Difference. Simulated residential receiver environment
Date: 12/7/05 Test Sample: Window C-3 Closed.
Air temperature: 21 ºC Area of window unit, S: 0.945 m2
Air humidity: 31.2 % Window mass per unit area: 36.83 kg/m2
Atmospheric pressure: 1.0252 Bar
Receiving room volume: 31.2 m3
Glass Specification: 4 -18 - 6.4(lam) mm
Source room volume: 343.1 m3
Canopy: n/a
Vent: Vent 1 open
Test ID: 712017 Loudspeaker Configuration: L6
Frequency D2m,nT
Hz dB
50 29.3 B
63 42.2 b
80 33.7
100 34.9 11
125 27.0 14
160 28.6 17
200 36.6 20
250 37.2 23
315 38.6 26
400 34.7 29
500 35.9 30
630 34.6 31
800 36.4 32
1k 29.2 33
1.25k 26.0 34
1.6k 37.0 34
2k 38.6 34
2.5k 38.4 34
3.15k 33.7 34
4k 36.7
5k 37.6 b
D 2 m,nT,w (C;Ctr ) 34 (-2; -3) dB
Tested by Building Performance Centre, Napier University, Edinburgh.
Measured D2m,nT dB
10.0
20.0
30.0
40.0
50.0
60.0
70.0
63 125 250 500 1k 2k 4kFrequency (Hz)
Sta
nd
ard
ise
d L
eve
l D
iffe
ren
ce
, D
2m
,nT
(d
B)
Measured values Shifted Reference Curve
G-12

OPEN/CLOSED WINDOW RESEARCH Defra Research Contract: NANR116
Airborne Sound Insulation. Laboratory measurements with non-diffuse source conditions
Standardised Level Difference. Simulated residential receiver environment
Date: 12/7/05 Test Sample: Window C-3 Closed.
Air temperature: 21.4 ºC Area of window unit, S: 0.945 m2
Air humidity: 31.2 % Window mass per unit area: 36.83 kg/m2
Atmospheric pressure: 1.023 Bar
Receiving room volume: 31.2 m3
Glass Specification: 4 -18 - 6.4(lam) mm
Source room volume: 343.1 m3
Canopy: n/a
Vent: Vent 2 closed
Test ID: 712083 Loudspeaker Configuration: L6
Frequency D2m,nT
Hz dB
50 30.2 B
63 45.0 b
80 36.4
100 38.1 19
125 29.4 22
160 30.1 25
200 39.3 28
250 36.8 31
315 40.4 34
400 40.9 37
500 42.9 38
630 39.9 39
800 41.1 40
1k 38.0 41
1.25k 43.0 42
1.6k 44.9 42
2k 44.6 42
2.5k 43.5 42
3.15k 41.9 42
4k 49.5 b
5k 42.7 b
D 2 m,nT,w (C;Ctr ) 42 (-1; -2) dB
Tested by Building Performance Centre, Napier University, Edinburgh.
Measured D2m,nT dB
10.0
20.0
30.0
40.0
50.0
60.0
70.0
63 125 250 500 1k 2k 4kFrequency (Hz)
Sta
nd
ard
ise
d L
eve
l D
iffe
ren
ce
, D
2m
,nT
(d
B)
Measured values Shifted Reference Curve
G-13

OPEN/CLOSED WINDOW RESEARCH Defra Research Contract: NANR116
Airborne Sound Insulation. Laboratory measurements with non-diffuse source conditions
Standardised Level Difference. Simulated residential receiver environment
Date: 17/7/2005 Test Sample: Window C-3 Closed.
Air temperature: 20.4 ºC Area of window unit, S: 0.995 m2
Air humidity: 31.2 % Window mass per unit area: 39.20 kg/m2
Atmospheric pressure: 1.0076 Bar
Receiving room volume: 31.2 m3
Glass Specification: 4 -18 - 6.4(lam) mm
Source room volume: 343.1 m3
Canopy: n/a
Vent: Vent 2 closed
Test ID: 717019 Loudspeaker Configuration: L6
Frequency D2m,nT
Hz dB
50 33.7 b
63 41.6
80 33.2
100 35.9 16
125 28.9 19
160 30.5 22
200 38.1 25
250 40.0 28
315 39.6 31
400 36.2 34
500 35.0 35
630 33.1 36
800 39.1 37
1k 37.4 38
1.25k 40.6 39
1.6k 42.3 39
2k 40.4 39
2.5k 41.1 39
3.15k 42.7 39
4k 44.3
5k 47.9
D 2 m,nT,w (C;Ctr ) 39 (-1; -2) dB
Tested by Building Performance Centre, Napier University, Edinburgh.
Measured D2m,nT dB
10.0
20.0
30.0
40.0
50.0
60.0
70.0
63 125 250 500 1k 2k 4kFrequency (Hz)
Sta
nd
ard
ise
d L
eve
l D
iffe
ren
ce
, D
2m
,nT
(d
B)
Measured values Shifted Reference Curve
G-14

OPEN/CLOSED WINDOW RESEARCH Defra Research Contract: NANR116
Airborne Sound Insulation. Laboratory measurements with non-diffuse source conditions
Standardised Level Difference. Simulated residential receiver environment
Date: 17/7/2005 Test Sample: Window C-3 Closed.
Air temperature: 20.5 ºC Area of window unit, S: 0.995 m2
Air humidity: 31.2 % Window mass per unit area: 39.20 kg/m2
Atmospheric pressure: 1.0075 Bar
Receiving room volume: 31.2 m3
Glass Specification: 4 -18 - 6.4(lam) mm
Source room volume: 343.1 m3
Canopy: Canopy 2
Vent: Vent 2 closed
Test ID: 717023 Loudspeaker Configuration: L6
Frequency D2m,nT
Hz dB
50 33.2 b
63 41.9
80 33.8
100 36.5 17
125 29.3 20
160 30.9 23
200 38.3 26
250 40.6 29
315 40.6 32
400 37.1 35
500 35.6 36
630 33.1 37
800 38.6 38
1k 40.4 39
1.25k 44.5 40
1.6k 44.4 40
2k 41.8 40
2.5k 41.6 40
3.15k 45.4 40
4k 46.4
5k 52.1
D 2 m,nT,w (C;Ctr ) 40 ( 0; -2) dB
Tested by Building Performance Centre, Napier University, Edinburgh.
Measured D2m,nT dB
10.0
20.0
30.0
40.0
50.0
60.0
70.0
63 125 250 500 1k 2k 4kFrequency (Hz)
Sta
nd
ard
ise
d L
eve
l D
iffe
ren
ce
, D
2m
,nT
(d
B)
Measured values Shifted Reference Curve
G-15

OPEN/CLOSED WINDOW RESEARCH Defra Research Contract: NANR116
Airborne Sound Insulation. Laboratory measurements with non-diffuse source conditions
Standardised Level Difference. Simulated residential receiver environment
Date: 12/7/05 Test Sample: Window C-3 Closed.
Air temperature: 21.4 ºC Area of window unit, S: 0.945 m2
Air humidity: 31.2 % Window mass per unit area: 36.83 kg/m2
Atmospheric pressure: 1.023 Bar
Receiving room volume: 31.2 m3
Glass Specification: 4 -18 - 6.4(lam) mm
Source room volume: 343.1 m3
Canopy: n/a
Vent: Vent 2 open
Test ID: 712082 Loudspeaker Configuration: L6
Frequency D2m,nT
Hz dB
50 30.1 B
63 41.2 b
80 32.7
100 34.7 10
125 27.4 13
160 27.9 16
200 36.5 19
250 35.0 22
315 35.0 25
400 34.5 28
500 36.4 29
630 33.9 30
800 36.8 31
1k 29.9 32
1.25k 27.7 33
1.6k 34.5 33
2k 34.6 33
2.5k 35.2 33
3.15k 32.1 33
4k 38.4
5k 37.4 b
D 2 m,nT,w (C;Ctr ) 33 (-1; -1) dB
Tested by Building Performance Centre, Napier University, Edinburgh.
Measured D2m,nT dB
10.0
20.0
30.0
40.0
50.0
60.0
70.0
63 125 250 500 1k 2k 4kFrequency (Hz)
Sta
nd
ard
ise
d L
eve
l D
iffe
ren
ce
, D
2m
,nT
(d
B)
Measured values Shifted Reference Curve
G-16

OPEN/CLOSED WINDOW RESEARCH Defra Research Contract: NANR116
Airborne Sound Insulation. Laboratory measurements with non-diffuse source conditions
Standardised Level Difference. Simulated residential receiver environment
Date: 17/7/2005 Test Sample: Window C-3 Closed.
Air temperature: 20.4 ºC Area of window unit, S: 0.995 m2
Air humidity: 31.2 % Window mass per unit area: 39.20 kg/m2
Atmospheric pressure: 1.0076 Bar
Receiving room volume: 31.2 m3
Glass Specification: 4 -18 - 6.4(lam) mm
Source room volume: 343.1 m3
Canopy: n/a
Vent: Vent 2 open
Test ID: 717020 Loudspeaker Configuration: L6
Frequency D2m,nT
Hz dB
50 32.6 b
63 39.4
80 30.7
100 33.6 10
125 27.3 13
160 28.6 16
200 36.4 19
250 37.3 22
315 35.5 25
400 32.6 28
500 32.1 29
630 30.7 30
800 36.1 31
1k 34.8 32
1.25k 33.0 33
1.6k 32.6 33
2k 33.5 33
2.5k 36.1 33
3.15k 31.0 33
4k 31.3
5k 34.9
D 2 m,nT,w (C;Ctr ) 33 ( 0; 0) dB
Tested by Building Performance Centre, Napier University, Edinburgh.
Measured D2m,nT dB
10.0
20.0
30.0
40.0
50.0
60.0
70.0
63 125 250 500 1k 2k 4kFrequency (Hz)
Sta
nd
ard
ise
d L
eve
l D
iffe
ren
ce
, D
2m
,nT
(d
B)
Measured values Shifted Reference Curve
G-17
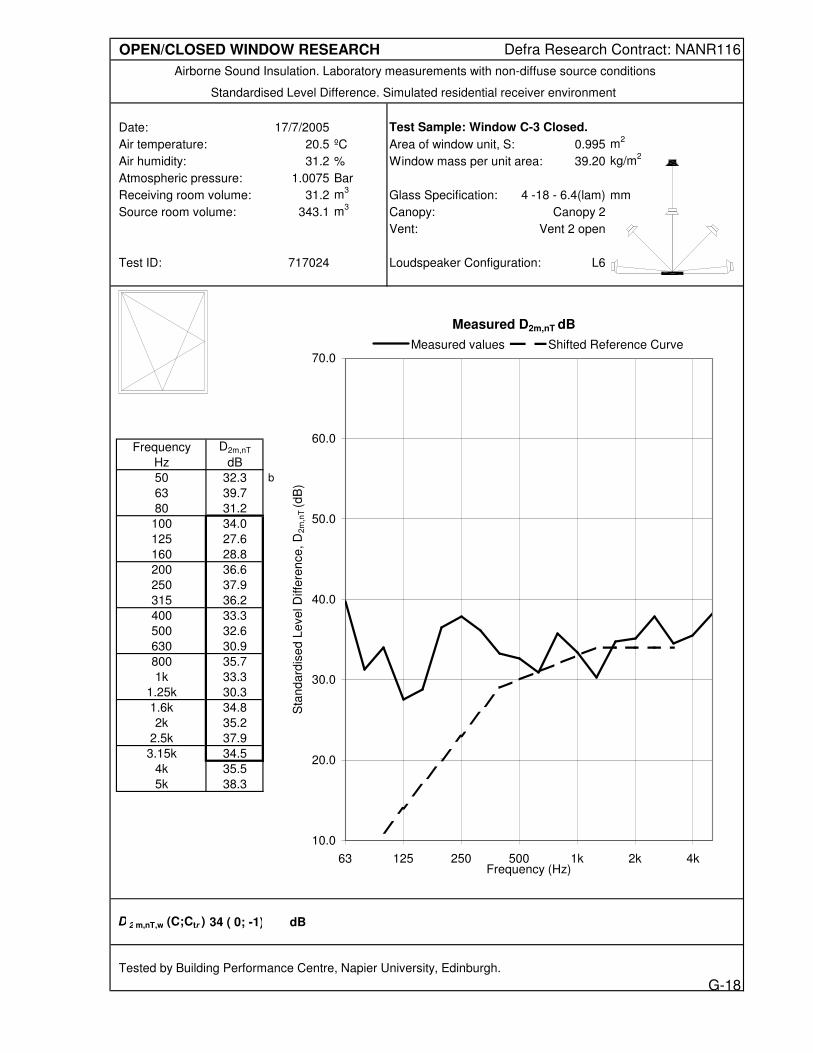
OPEN/CLOSED WINDOW RESEARCH Defra Research Contract: NANR116
Airborne Sound Insulation. Laboratory measurements with non-diffuse source conditions
Standardised Level Difference. Simulated residential receiver environment
Date: 17/7/2005 Test Sample: Window C-3 Closed.
Air temperature: 20.5 ºC Area of window unit, S: 0.995 m2
Air humidity: 31.2 % Window mass per unit area: 39.20 kg/m2
Atmospheric pressure: 1.0075 Bar
Receiving room volume: 31.2 m3
Glass Specification: 4 -18 - 6.4(lam) mm
Source room volume: 343.1 m3
Canopy: Canopy 2
Vent: Vent 2 open
Test ID: 717024 Loudspeaker Configuration: L6
Frequency D2m,nT
Hz dB
50 32.3 b
63 39.7
80 31.2
100 34.0 11
125 27.6 14
160 28.8 17
200 36.6 20
250 37.9 23
315 36.2 26
400 33.3 29
500 32.6 30
630 30.9 31
800 35.7 32
1k 33.3 33
1.25k 30.3 34
1.6k 34.8 34
2k 35.2 34
2.5k 37.9 34
3.15k 34.5 34
4k 35.5
5k 38.3
D 2 m,nT,w (C;Ctr ) 34 ( 0; -1) dB
Tested by Building Performance Centre, Napier University, Edinburgh.
Measured D2m,nT dB
10.0
20.0
30.0
40.0
50.0
60.0
70.0
63 125 250 500 1k 2k 4kFrequency (Hz)
Sta
nd
ard
ise
d L
eve
l D
iffe
ren
ce
, D
2m
,nT
(d
B)
Measured values Shifted Reference Curve
G-18

OPEN/CLOSED WINDOW RESEARCH Defra Research Contract: NANR116
Airborne Sound Insulation. Laboratory measurements with non-diffuse source conditions
Standardised Level Difference. Simulated residential receiver environment
Date: 17/7/2005 Test Sample: Window C-3 Closed.
Air temperature: 20.5 ºC Area of window unit, S: 0.995 m2
Air humidity: 31.2 % Window mass per unit area: 39.20 kg/m2
Atmospheric pressure: 1.0075 Bar
Receiving room volume: 31.2 m3
Glass Specification: 4 -18 - 6.4(lam) mm
Source room volume: 343.1 m3
Canopy: Canopy 3
Vent: Vent 3 closed
Test ID: 717027 Loudspeaker Configuration: L6
Frequency D2m,nT
Hz dB
50 33.4 b
63 41.5
80 33.1
100 35.8 14
125 28.9 17
160 30.3 20
200 37.9 23
250 39.8 26
315 38.8 29
400 35.2 32
500 34.1 33
630 31.7 34
800 36.2 35
1k 35.7 36
1.25k 38.5 37
1.6k 39.8 37
2k 36.8 37
2.5k 41.9 37
3.15k 45.4 37
4k 46.4
5k 51.2
D 2 m,nT,w (C;Ctr ) 37 ( 0; -1) dB
Tested by Building Performance Centre, Napier University, Edinburgh.
Measured D2m,nT dB
10.0
20.0
30.0
40.0
50.0
60.0
70.0
63 125 250 500 1k 2k 4kFrequency (Hz)
Sta
nd
ard
ise
d L
eve
l D
iffe
ren
ce
, D
2m
,nT
(d
B)
Measured values Shifted Reference Curve
G-19

OPEN/CLOSED WINDOW RESEARCH Defra Research Contract: NANR116
Airborne Sound Insulation. Laboratory measurements with non-diffuse source conditions
Standardised Level Difference. Simulated residential receiver environment
Date: 17/7/2005 Test Sample: Window C-3 Closed.
Air temperature: 20.5 ºC Area of window unit, S: 0.995 m2
Air humidity: 31.2 % Window mass per unit area: 39.20 kg/m2
Atmospheric pressure: 1.0075 Bar
Receiving room volume: 31.2 m3
Glass Specification: 4 -18 - 6.4(lam) mm
Source room volume: 343.1 m3
Canopy: Canopy 3
Vent: Vent 3 open
Test ID: 717028 Loudspeaker Configuration: L6
Frequency D2m,nT
Hz dB
50 32.3 b
63 40.0
80 31.5
100 34.3 11
125 27.8 14
160 29.0 17
200 36.8 20
250 38.2 23
315 36.6 26
400 33.7 29
500 32.8 30
630 31.1 31
800 35.7 32
1k 33.2 33
1.25k 31.4 34
1.6k 34.2 34
2k 34.0 34
2.5k 38.5 34
3.15k 36.9 34
4k 33.9
5k 35.0
D 2 m,nT,w (C;Ctr ) 34 ( 0; -1) dB
Tested by Building Performance Centre, Napier University, Edinburgh.
Measured D2m,nT dB
10.0
20.0
30.0
40.0
50.0
60.0
70.0
63 125 250 500 1k 2k 4kFrequency (Hz)
Sta
nd
ard
ise
d L
eve
l D
iffe
ren
ce
, D
2m
,nT
(d
B)
Measured values Shifted Reference Curve
G-20

OPEN/CLOSED WINDOW RESEARCH Defra Research Contract: NANR116
Airborne Sound Insulation. Laboratory measurements with non-diffuse source conditions
Standardised Level Difference. Simulated residential receiver environment
Date: 17/7/2005 Test Sample: Window C-3 Closed.
Air temperature: 20.6 ºC Area of window unit, S: 0.995 m2
Air humidity: 31.2 % Window mass per unit area: 39.20 kg/m2
Atmospheric pressure: 1.007 Bar
Receiving room volume: 31.2 m3
Glass Specification: 4 -18 - 6.4(lam) mm
Source room volume: 343.1 m3
Canopy: n/a
Vent: Vent 4 closed
Test ID: 717031 Loudspeaker Configuration: L6
Frequency D2m,nT
Hz dB
50 33.3 b
63 42.6
80 34.6
100 37.4 17
125 29.7 20
160 31.8 23
200 39.3 26
250 41.5 29
315 42.7 32
400 38.3 35
500 36.5 36
630 34.9 37
800 39.8 38
1k 40.0 39
1.25k 43.5 40
1.6k 44.1 40
2k 41.7 40
2.5k 41.0 40
3.15k 42.3 40
4k 44.2
5k 43.7
D 2 m,nT,w (C;Ctr ) 40 ( 0; -1) dB
Tested by Building Performance Centre, Napier University, Edinburgh.
Measured D2m,nT dB
10.0
20.0
30.0
40.0
50.0
60.0
70.0
63 125 250 500 1k 2k 4kFrequency (Hz)
Sta
nd
ard
ise
d L
eve
l D
iffe
ren
ce
, D
2m
,nT
(d
B)
Measured values Shifted Reference Curve
G-21

OPEN/CLOSED WINDOW RESEARCH Defra Research Contract: NANR116
Airborne Sound Insulation. Laboratory measurements with non-diffuse source conditions
Standardised Level Difference. Simulated residential receiver environment
Date: 17/7/2005 Test Sample: Window C-3 Closed.
Air temperature: 20.6 ºC Area of window unit, S: 0.995 m2
Air humidity: 31.2 % Window mass per unit area: 39.20 kg/m2
Atmospheric pressure: 1.007 Bar
Receiving room volume: 31.2 m3
Glass Specification: 4 -18 - 6.4(lam) mm
Source room volume: 343.1 m3
Canopy: Canopy 4
Vent: Vent 4 closed
Test ID: 717035 Loudspeaker Configuration: L6
Frequency D2m,nT
Hz dB
50 33.4 b
63 42.7
80 35.1
100 37.6 18
125 29.7 21
160 31.9 24
200 39.1 27
250 41.4 30
315 42.4 33
400 38.1 36
500 36.4 37
630 34.0 38
800 39.3 39
1k 41.6 40
1.25k 44.0 41
1.6k 44.5 41
2k 42.2 41
2.5k 43.8 41
3.15k 45.4 41
4k 46.1
5k 46.3
D 2 m,nT,w (C;Ctr ) 41 (-1; -2) dB
Tested by Building Performance Centre, Napier University, Edinburgh.
Measured D2m,nT dB
10.0
20.0
30.0
40.0
50.0
60.0
70.0
63 125 250 500 1k 2k 4kFrequency (Hz)
Sta
nd
ard
ise
d L
eve
l D
iffe
ren
ce
, D
2m
,nT
(d
B)
Measured values Shifted Reference Curve
G-22

OPEN/CLOSED WINDOW RESEARCH Defra Research Contract: NANR116
Airborne Sound Insulation. Laboratory measurements with non-diffuse source conditions
Standardised Level Difference. Simulated residential receiver environment
Date: 17/7/2005 Test Sample: Window C-3 Closed.
Air temperature: 20.6 ºC Area of window unit, S: 0.995 m2
Air humidity: 31.2 % Window mass per unit area: 39.20 kg/m2
Atmospheric pressure: 1.007 Bar
Receiving room volume: 31.2 m3
Glass Specification: 4 -18 - 6.4(lam) mm
Source room volume: 343.1 m3
Canopy: Canopy 4
Vent: Vent 4 open
Test ID: 717036 Loudspeaker Configuration: L6
Frequency D2m,nT
Hz dB
50 32.5
63 40.3
80 31.9
100 34.5 12
125 27.7 15
160 29.3 18
200 37.1 21
250 38.6 24
315 36.9 27
400 33.9 30
500 33.1 31
630 31.3 32
800 35.2 33
1k 31.8 34
1.25k 29.6 35
1.6k 36.8 35
2k 36.9 35
2.5k 39.6 35
3.15k 37.4 35
4k 39.0
5k 39.9
D 2 m,nT,w (C;Ctr ) 35 (-1; -2) dB
Tested by Building Performance Centre, Napier University, Edinburgh.
Measured D2m,nT dB
10.0
20.0
30.0
40.0
50.0
60.0
70.0
63 125 250 500 1k 2k 4kFrequency (Hz)
Sta
nd
ard
ise
d L
eve
l D
iffe
ren
ce
, D
2m
,nT
(d
B)
Measured values Shifted Reference Curve
G-23

OPEN/CLOSED WINDOW RESEARCH Defra Research Contract: NANR116
Airborne Sound Insulation. Laboratory measurements with non-diffuse source conditions
Standardised Level Difference. Simulated residential receiver environment
Date: 17/7/2005 Test Sample: Window C-3 Closed.
Air temperature: 20.6 ºC Area of window unit, S: 0.995 m2
Air humidity: 31.2 % Window mass per unit area: 39.20 kg/m2
Atmospheric pressure: 1.007 Bar
Receiving room volume: 31.2 m3
Glass Specification: 4 -18 - 6.4(lam) mm
Source room volume: 343.1 m3
Canopy: n/a
Vent: Vent 5 open
Test ID: 717032 Loudspeaker Configuration: L6
Frequency D2m,nT
Hz dB
50 32.2 b
63 39.7
80 31.2
100 34.0 11
125 27.5 14
160 29.0 17
200 36.9 20
250 38.1 23
315 36.2 26
400 33.3 29
500 32.6 30
630 31.2 31
800 36.3 32
1k 34.5 33
1.25k 33.1 34
1.6k 35.3 34
2k 35.2 34
2.5k 37.0 34
3.15k 32.9 34
4k 35.3
5k 37.0
D 2 m,nT,w (C;Ctr ) 34 ( 0; 0) dB
Tested by Building Performance Centre, Napier University, Edinburgh.
Measured D2m,nT dB
10.0
20.0
30.0
40.0
50.0
60.0
70.0
63 125 250 500 1k 2k 4kFrequency (Hz)
Sta
nd
ard
ise
d L
eve
l D
iffe
ren
ce
, D
2m
,nT
(d
B)
Measured values Shifted Reference Curve
G-24

OPEN/CLOSED WINDOW RESEARCH Defra Research Contract: NANR116
Airborne Sound Insulation. Laboratory measurements with non-diffuse source conditions
Standardised Level Difference. Simulated residential receiver environment
Date: 17/7/2005 Test Sample: Window C-3 Closed.
Air temperature: 20.6 ºC Area of window unit, S: 0.995 m2
Air humidity: 31.2 % Window mass per unit area: 39.20 kg/m2
Atmospheric pressure: 1.0067 Bar
Receiving room volume: 31.2 m3
Glass Specification: 4 -18 - 6.4(lam) mm
Source room volume: 343.1 m3
Canopy: Canopy 5
Vent: Vent 6 closed
Test ID: 717041 Loudspeaker Configuration: L6
Frequency D2m,nT
Hz dB
50 32.9 b
63 42.5
80 34.7
100 37.3 17
125 29.7 20
160 31.2 23
200 38.9 26
250 41.3 29
315 41.1 32
400 37.0 35
500 36.2 36
630 34.6 37
800 38.5 38
1k 38.5 39
1.25k 41.4 40
1.6k 43.1 40
2k 41.7 40
2.5k 42.7 40
3.15k 43.9 40
4k 45.9
5k 47.0
D 2 m,nT,w (C;Ctr ) 40 ( 0; -2) dB
Tested by Building Performance Centre, Napier University, Edinburgh.
Measured D2m,nT dB
10.0
20.0
30.0
40.0
50.0
60.0
70.0
63 125 250 500 1k 2k 4kFrequency (Hz)
Sta
nd
ard
ise
d L
eve
l D
iffe
ren
ce
, D
2m
,nT
(d
B)
Measured values Shifted Reference Curve
G-25
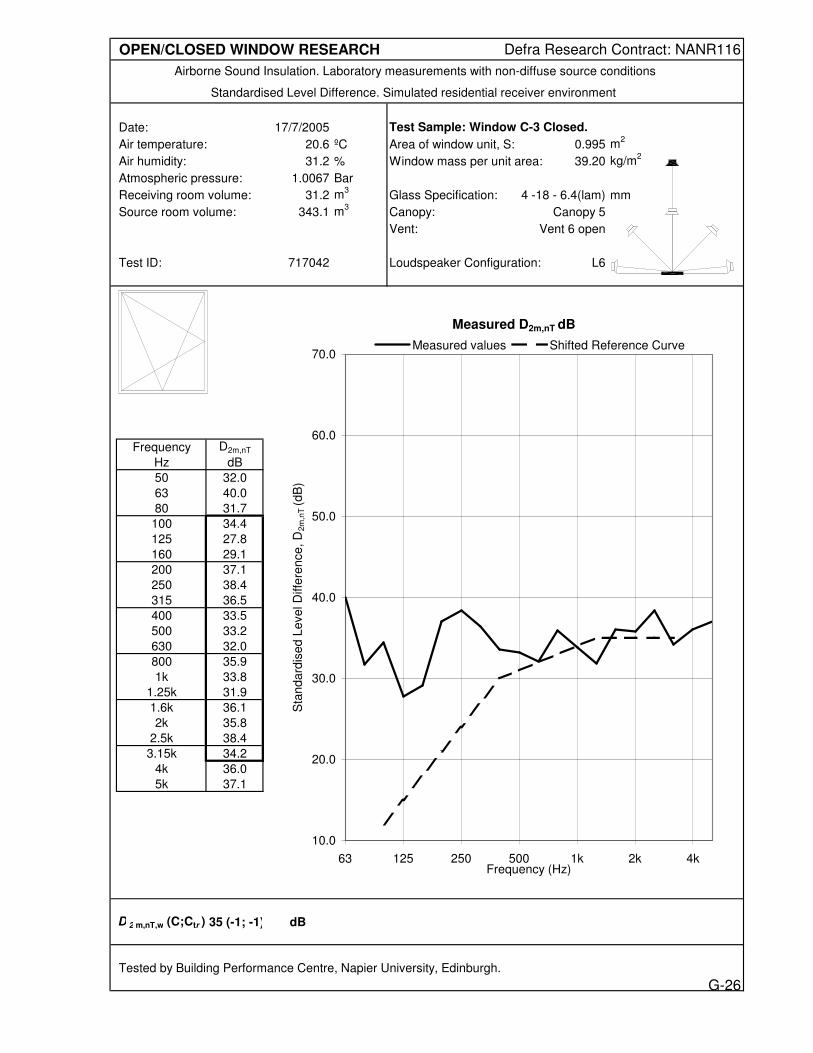
OPEN/CLOSED WINDOW RESEARCH Defra Research Contract: NANR116
Airborne Sound Insulation. Laboratory measurements with non-diffuse source conditions
Standardised Level Difference. Simulated residential receiver environment
Date: 17/7/2005 Test Sample: Window C-3 Closed.
Air temperature: 20.6 ºC Area of window unit, S: 0.995 m2
Air humidity: 31.2 % Window mass per unit area: 39.20 kg/m2
Atmospheric pressure: 1.0067 Bar
Receiving room volume: 31.2 m3
Glass Specification: 4 -18 - 6.4(lam) mm
Source room volume: 343.1 m3
Canopy: Canopy 5
Vent: Vent 6 open
Test ID: 717042 Loudspeaker Configuration: L6
Frequency D2m,nT
Hz dB
50 32.0
63 40.0
80 31.7
100 34.4 12
125 27.8 15
160 29.1 18
200 37.1 21
250 38.4 24
315 36.5 27
400 33.5 30
500 33.2 31
630 32.0 32
800 35.9 33
1k 33.8 34
1.25k 31.9 35
1.6k 36.1 35
2k 35.8 35
2.5k 38.4 35
3.15k 34.2 35
4k 36.0
5k 37.1
D 2 m,nT,w (C;Ctr ) 35 (-1; -1) dB
Tested by Building Performance Centre, Napier University, Edinburgh.
Measured D2m,nT dB
10.0
20.0
30.0
40.0
50.0
60.0
70.0
63 125 250 500 1k 2k 4kFrequency (Hz)
Sta
nd
ard
ise
d L
eve
l D
iffe
ren
ce
, D
2m
,nT
(d
B)
Measured values Shifted Reference Curve
G-26

OPEN/CLOSED WINDOW RESEARCH Defra Research Contract: NANR116
Airborne Sound Insulation. Laboratory measurements with non-diffuse source conditions
Standardised Level Difference. Simulated residential receiver environment
Date: 17/7/2005 Test Sample: Window C-3 Closed.
Air temperature: 21 ºC Area of window unit, S: 0.995 m2
Air humidity: 31.2 % Window mass per unit area: 39.20 kg/m2
Atmospheric pressure: 1.0044 Bar
Receiving room volume: 31.2 m3
Glass Specification: 4 -18 - 6.4(lam) mm
Source room volume: 343.1 m3
Canopy: n/a
Vent: Overframe A closed
Test ID: 717074 Loudspeaker Configuration: L6
Frequency D2m,nT
Hz dB
50 33.2 b
63 41.4
80 33.2
100 35.3 18
125 27.9 21
160 31.1 24
200 38.5 27
250 39.0 30
315 40.9 33
400 38.3 36
500 35.7 37
630 31.4 38
800 37.0 39
1k 38.8 40
1.25k 48.3 41
1.6k 48.6 41
2k 44.6 41
2.5k 45.9 41
3.15k 47.7 41
4k 43.4
5k 54.0
D 2 m,nT,w (C;Ctr ) 41 (-2; -4) dB
Tested by Building Performance Centre, Napier University, Edinburgh.
Measured D2m,nT dB
10.0
20.0
30.0
40.0
50.0
60.0
70.0
63 125 250 500 1k 2k 4kFrequency (Hz)
Sta
nd
ard
ise
d L
eve
l D
iffe
ren
ce
, D
2m
,nT
(d
B)
Measured values Shifted Reference Curve
G-27

OPEN/CLOSED WINDOW RESEARCH Defra Research Contract: NANR116
Airborne Sound Insulation. Laboratory measurements with non-diffuse source conditions
Standardised Level Difference. Simulated residential receiver environment
Date: 17/7/2005 Test Sample: Window C-3 Closed.
Air temperature: 21 ºC Area of window unit, S: 0.995 m2
Air humidity: 31.2 % Window mass per unit area: 39.20 kg/m2
Atmospheric pressure: 1.0044 Bar
Receiving room volume: 31.2 m3
Glass Specification: 4 -18 - 6.4(lam) mm
Source room volume: 343.1 m3
Canopy: n/a
Vent: Overframe A open
Test ID: 717075 Loudspeaker Configuration: L6
Frequency D2m,nT
Hz dB
50 32.2
63 39.0
80 30.7
100 33.0 13
125 26.4 16
160 29.4 19
200 37.0 22
250 33.7 25
315 29.5 28
400 27.8 31
500 30.1 32
630 30.1 33
800 34.3 34
1k 35.2 35
1.25k 42.6 36
1.6k 44.4 36
2k 42.4 36
2.5k 45.7 36
3.15k 47.7 36
4k 43.5
5k 53.9
D 2 m,nT,w (C;Ctr ) 36 (-1; -2) dB
Tested by Building Performance Centre, Napier University, Edinburgh.
Measured D2m,nT dB
10.0
20.0
30.0
40.0
50.0
60.0
70.0
63 125 250 500 1k 2k 4kFrequency (Hz)
Sta
nd
ard
ise
d L
eve
l D
iffe
ren
ce
, D
2m
,nT
(d
B)
Measured values Shifted Reference Curve
G-28

OPEN/CLOSED WINDOW RESEARCH Defra Research Contract: NANR116
Airborne Sound Insulation. Laboratory measurements with non-diffuse source conditions
Standardised Level Difference. Simulated residential receiver environment
Date: 14/7/2005 Test Sample: Window D Closed.
Air temperature: 21.6 ºC Area of window unit, S: 1.26 m2
Air humidity: 31.2 % Window mass per unit area: 27.94 kg/m2
Atmospheric pressure: 1.0096 Bar
Receiving room volume: 31.2 m3
Glass Specification: 4 -16 - 4 mm
Source room volume: 343.1 m3
Canopy: n/a
Vent: n/a
(Condition D1)
Test ID: 714025 Loudspeaker Configuration: L6
Frequency D2m,nT
Hz dB
50 29.9 B
63 42.5
80 34.8
100 37.0 17
125 30.6 20
160 26.1 23
200 33.8 26
250 30.1 29
315 36.8 32
400 40.3 35
500 43.8 36
630 44.7 37
800 36.8 38
1k 39.5 39
1.25k 37.1 40
1.6k 41.9 40
2k 42.3 40
2.5k 42.4 40
3.15k 43.0 40
4k 43.7
5k 42.0
D 2 m,nT,w (C;Ctr ) 40 (-1; -3) dB
Tested by Building Performance Centre, Napier University, Edinburgh.
Measured D2m,nT dB
10.0
20.0
30.0
40.0
50.0
60.0
70.0
63 125 250 500 1k 2k 4kFrequency (Hz)
Sta
nd
ard
ise
d L
eve
l D
iffe
ren
ce
, D
2m
,nT
(d
B)
Measured values Shifted Reference Curve
H-1

OPEN/CLOSED WINDOW RESEARCH Defra Research Contract: NANR116
Airborne Sound Insulation. Laboratory measurements with non-diffuse source conditions
Standardised Level Difference. Simulated residential receiver environment
Date: 14/7/2005 Test Sample: Window D Closed.
Air temperature: 21.7 ºC Area of window unit, S: 1.26 m2
Air humidity: 31.2 % Window mass per unit area: 27.94 kg/m2
Atmospheric pressure: 1.009 Bar
Receiving room volume: 31.2 m3
Glass Specification: 4 -16 - 4 mm
Source room volume: 343.1 m3
Canopy: n/a
Vent: n/a
(Condition D2)
Test ID: 714031 Loudspeaker Configuration: L6
Frequency D2m,nT
Hz dB
50 29.3 B
63 43.4 b
80 34.8
100 37.5 21
125 31.1 24
160 26.6 27
200 33.5 30
250 30.3 33
315 39.0 36
400 43.7 39
500 44.8 40
630 46.9 41
800 41.8 42
1k 44.9 43
1.25k 43.5 44
1.6k 48.0 44
2k 48.9 44
2.5k 47.3 44
3.15k 45.0 44
4k 47.3
5k 50.5
D 2 m,nT,w (C;Ctr ) 44 (-2; -5) dB
Tested by Building Performance Centre, Napier University, Edinburgh.
Measured D2m,nT dB
20.0
30.0
40.0
50.0
60.0
70.0
80.0
63 125 250 500 1k 2k 4kFrequency (Hz)
Sta
nd
ard
ise
d L
eve
l D
iffe
ren
ce
, D
2m
,nT
(d
B)
Measured values Shifted Reference Curve
H-2

OPEN/CLOSED WINDOW RESEARCH Defra Research Contract: NANR116
Airborne Sound Insulation. Laboratory measurements with non-diffuse source conditions
Standardised Level Difference. Simulated residential receiver environment
Date: 14/7/2005 Test Sample: Window D Closed.
Air temperature: 22.1 ºC Area of window unit, S: 1.26 m2
Air humidity: 31.2 % Window mass per unit area: 27.94 kg/m2
Atmospheric pressure: 1.0078 Bar
Receiving room volume: 31.2 m3
Glass Specification: 4 -16 - 4 mm
Source room volume: 343.1 m3
Canopy: n/a
Vent: n/a
(Condition D3)
Test ID: 714080 Loudspeaker Configuration: L6
Frequency D2m,nT
Hz dB
50 28.0 B
63 43.2 b
80 35.0
100 38.0 22
125 31.1 25
160 26.7 28
200 33.9 31
250 31.2 34
315 39.6 37
400 44.5 40
500 47.4 41
630 48.0 42
800 43.2 43
1k 45.8 44
1.25k 45.6 45
1.6k 50.4 45
2k 51.0 45
2.5k 49.3 45
3.15k 47.0 45
4k 49.2
5k 53.3
D 2 m,nT,w (C;Ctr ) 45 (-2; -5) dB
Tested by Building Performance Centre, Napier University, Edinburgh.
Measured D2m,nT dB
20.0
30.0
40.0
50.0
60.0
70.0
80.0
63 125 250 500 1k 2k 4kFrequency (Hz)
Sta
nd
ard
ise
d L
eve
l D
iffe
ren
ce
, D
2m
,nT
(d
B)
Measured values Shifted Reference Curve
H-3

OPEN/CLOSED WINDOW RESEARCH Defra Research Contract: NANR116
Airborne Sound Insulation. Laboratory measurements with non-diffuse source conditions
Standardised Level Difference. Simulated residential receiver environment
Date: 14/7/2005 Test Sample: Window D Closed.
Air temperature: 22.1 ºC Area of window unit, S: 1.26 m2
Air humidity: 31.2 % Window mass per unit area: 27.94 kg/m2
Atmospheric pressure: 1.008 Bar
Receiving room volume: 31.2 m3
Glass Specification: 4 -16 - 4 mm
Source room volume: 343.1 m3
Canopy: n/a
Vent: n/a
(Condition D4)
Test ID: 714086 Loudspeaker Configuration: L6
Frequency D2m,nT
Hz dB
50 30.6 B
63 43.0 b
80 40.1
100 40.1 19
125 32.8 22
160 25.8 25
200 33.8 28
250 29.5 31
315 38.6 34
400 40.3 37
500 43.2 38
630 45.9 39
800 39.9 40
1k 42.2 41
1.25k 41.3 42
1.6k 46.3 42
2k 45.4 42
2.5k 44.1 42
3.15k 42.9 42
4k 44.3
5k 45.6
D 2 m,nT,w (C;Ctr ) 42 (-1; -4) dB
Tested by Building Performance Centre, Napier University, Edinburgh.
Measured D2m,nT dB
10.0
20.0
30.0
40.0
50.0
60.0
70.0
63 125 250 500 1k 2k 4kFrequency (Hz)
Sta
nd
ard
ise
d L
eve
l D
iffe
ren
ce
, D
2m
,nT
(d
B)
Measured values Shifted Reference Curve
H-4

OPEN/CLOSED WINDOW RESEARCH Defra Research Contract: NANR116
Airborne Sound Insulation. Laboratory measurements with non-diffuse source conditions
Standardised Level Difference. Simulated residential receiver environment
Date: 14/7/2005 Test Sample: Window D-2 Open 0.05 m2
Air temperature: 21.6 ºC Area of window unit, S: 1.26 m2
Air humidity: 31.2 % Window mass per unit area: 27.94 kg/m2
Atmospheric pressure: 1.0096 Bar
Receiving room volume: 31.2 m3
Glass Specification: 4 -16 - 4 mm
Source room volume: 343.1 m3
Canopy: n/a
Vent: n/a
(Condition D1)
Test ID: 714027 Loudspeaker Configuration: L6
Frequency D2m,nT
Hz dB
50 26.9 B
63 33.3
80 24.3
100 24.6 -4
125 18.2 -1
160 17.8 2
200 21.3 5
250 15.0 8
315 16.1 11
400 21.6 14
500 26.5 15
630 24.1 16
800 14.1 17
1k 19.4 18
1.25k 17.9 19
1.6k 22.8 19
2k 18.6 19
2.5k 16.8 19
3.15k 18.3 19
4k 21.5
5k 22.9
D 2 m,nT,w (C;Ctr ) 19 (-1; -1) dB
Tested by Building Performance Centre, Napier University, Edinburgh.
Measured D2m,nT dB
0.0
10.0
20.0
30.0
40.0
50.0
60.0
63 125 250 500 1k 2k 4kFrequency (Hz)
Sta
nd
ard
ise
d L
eve
l D
iffe
ren
ce
, D
2m
,nT
(d
B)
Measured values Shifted Reference Curve
H-5
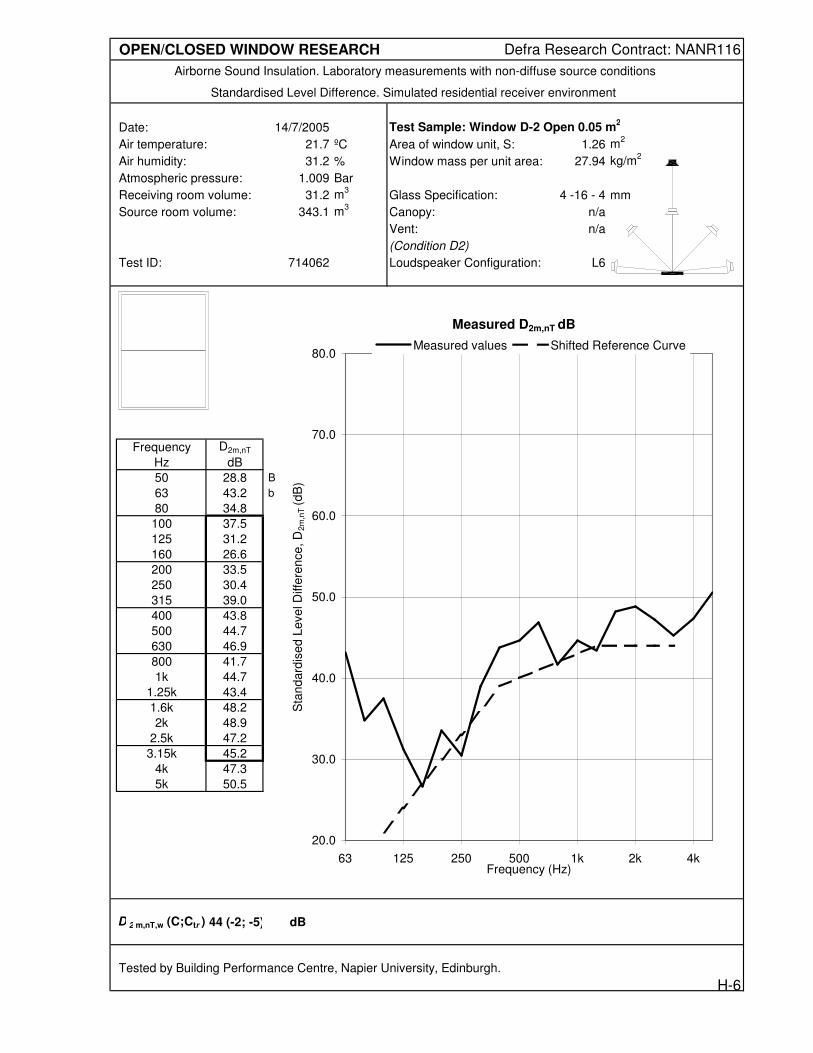
OPEN/CLOSED WINDOW RESEARCH Defra Research Contract: NANR116
Airborne Sound Insulation. Laboratory measurements with non-diffuse source conditions
Standardised Level Difference. Simulated residential receiver environment
Date: 14/7/2005 Test Sample: Window D-2 Open 0.05 m2
Air temperature: 21.7 ºC Area of window unit, S: 1.26 m2
Air humidity: 31.2 % Window mass per unit area: 27.94 kg/m2
Atmospheric pressure: 1.009 Bar
Receiving room volume: 31.2 m3
Glass Specification: 4 -16 - 4 mm
Source room volume: 343.1 m3
Canopy: n/a
Vent: n/a
(Condition D2)
Test ID: 714062 Loudspeaker Configuration: L6
Frequency D2m,nT
Hz dB
50 28.8 B
63 43.2 b
80 34.8
100 37.5 21
125 31.2 24
160 26.6 27
200 33.5 30
250 30.4 33
315 39.0 36
400 43.8 39
500 44.7 40
630 46.9 41
800 41.7 42
1k 44.7 43
1.25k 43.4 44
1.6k 48.2 44
2k 48.9 44
2.5k 47.2 44
3.15k 45.2 44
4k 47.3
5k 50.5
D 2 m,nT,w (C;Ctr ) 44 (-2; -5) dB
Tested by Building Performance Centre, Napier University, Edinburgh.
Measured D2m,nT dB
20.0
30.0
40.0
50.0
60.0
70.0
80.0
63 125 250 500 1k 2k 4kFrequency (Hz)
Sta
nd
ard
ise
d L
eve
l D
iffe
ren
ce
, D
2m
,nT
(d
B)
Measured values Shifted Reference Curve
H-6

OPEN/CLOSED WINDOW RESEARCH Defra Research Contract: NANR116
Airborne Sound Insulation. Laboratory measurements with non-diffuse source conditions
Standardised Level Difference. Simulated residential receiver environment
Date: 14/7/2005 Test Sample: Window D-2 Open 0.05 m2
Air temperature: 22 ºC Area of window unit, S: 1.26 m2
Air humidity: 31.2 % Window mass per unit area: 27.94 kg/m2
Atmospheric pressure: 1.008 Bar
Receiving room volume: 31.2 m3
Glass Specification: 4 -16 - 4 mm
Source room volume: 343.1 m3
Canopy: n/a
Vent: n/a
(Condition D3)
Test ID: 714072 Loudspeaker Configuration: L6
Frequency D2m,nT
Hz dB
50 20.9 b
63 33.3
80 24.5
100 25.1 -3
125 18.0 0
160 18.0 3
200 21.4 6
250 15.3 9
315 16.3 12
400 22.5 15
500 27.5 16
630 24.7 17
800 14.7 18
1k 20.4 19
1.25k 19.6 20
1.6k 24.0 20
2k 19.8 20
2.5k 17.6 20
3.15k 19.1 20
4k 23.0
5k 24.5
D 2 m,nT,w (C;Ctr ) 20 (-1; -1) dB
Tested by Building Performance Centre, Napier University, Edinburgh.
Measured D2m,nT dB
0.0
10.0
20.0
30.0
40.0
50.0
60.0
63 125 250 500 1k 2k 4kFrequency (Hz)
Sta
nd
ard
ise
d L
eve
l D
iffe
ren
ce
, D
2m
,nT
(d
B)
Measured values Shifted Reference Curve
H-7

OPEN/CLOSED WINDOW RESEARCH Defra Research Contract: NANR116
Airborne Sound Insulation. Laboratory measurements with non-diffuse source conditions
Standardised Level Difference. Simulated residential receiver environment
Date: 14/7/2005 Test Sample: Window D-2 Open 0.05 m2
Air temperature: 22.1 ºC Area of window unit, S: 1.26 m2
Air humidity: 31.2 % Window mass per unit area: 27.94 kg/m2
Atmospheric pressure: 1.008 Bar
Receiving room volume: 31.2 m3
Glass Specification: 4 -16 - 4 mm
Source room volume: 343.1 m3
Canopy: n/a
Vent: n/a
(Condition D4)
Test ID: 714088 Loudspeaker Configuration: L6
Frequency D2m,nT
Hz dB
50 28.9 B
63 33.3
80 29.7
100 27.1 -5
125 19.7 -2
160 19.5 1
200 20.5 4
250 13.3 7
315 14.7 10
400 20.0 13
500 26.4 14
630 22.5 15
800 13.9 16
1k 18.9 17
1.25k 17.7 18
1.6k 20.6 18
2k 17.3 18
2.5k 15.1 18
3.15k 16.7 18
4k 20.5
5k 21.6
D 2 m,nT,w (C;Ctr ) 18 (-1; -1) dB
Tested by Building Performance Centre, Napier University, Edinburgh.
Measured D2m,nT dB
0.0
10.0
20.0
30.0
40.0
50.0
60.0
63 125 250 500 1k 2k 4kFrequency (Hz)
Sta
nd
ard
ise
d L
eve
l D
iffe
ren
ce
, D
2m
,nT
(d
B)
Measured values Shifted Reference Curve
H-8

OPEN/CLOSED WINDOW RESEARCH Defra Research Contract: NANR116
Airborne Sound Insulation. Laboratory measurements with non-diffuse source conditions
Standardised Level Difference. Simulated residential receiver environment
Date: 14/7/2005 Test Sample: Window D-3 Open 0.05 m2
Air temperature: 21.6 ºC Area of window unit, S: 1.26 m2
Air humidity: 31.2 % Window mass per unit area: 27.94 kg/m2
Atmospheric pressure: 1.0096 Bar
Receiving room volume: 31.2 m3
Glass Specification: 4 -16 - 4 mm
Source room volume: 343.1 m3
Canopy: n/a
Vent: n/a
(Condition D1)
Test ID: 714024 Loudspeaker Configuration: L6
Frequency D2m,nT
Hz dB
50 27.5 B
63 33.8
80 24.4
100 25.1 -1
125 18.4 2
160 18.3 5
200 21.0 8
250 15.5 11
315 19.0 14
400 24.7 17
500 25.4 18
630 20.1 19
800 14.5 20
1k 20.7 21
1.25k 25.8 22
1.6k 24.3 22
2k 23.8 22
2.5k 24.1 22
3.15k 21.0 22
4k 23.7
5k 28.0
D 2 m,nT,w (C;Ctr ) 22 (-1; -2) dB
Tested by Building Performance Centre, Napier University, Edinburgh.
Measured D2m,nT dB
0.0
10.0
20.0
30.0
40.0
50.0
60.0
63 125 250 500 1k 2k 4kFrequency (Hz)
Sta
nd
ard
ise
d L
eve
l D
iffe
ren
ce
, D
2m
,nT
(d
B)
Measured values Shifted Reference Curve
H-9

OPEN/CLOSED WINDOW RESEARCH Defra Research Contract: NANR116
Airborne Sound Insulation. Laboratory measurements with non-diffuse source conditions
Standardised Level Difference. Simulated residential receiver environment
Date: 14/7/2005 Test Sample: Window D-3 Open 0.05 m2
Air temperature: 21.7 ºC Area of window unit, S: 1.26 m2
Air humidity: 31.2 % Window mass per unit area: 27.94 kg/m2
Atmospheric pressure: 1.009 Bar
Receiving room volume: 31.2 m3
Glass Specification: 4 -16 - 4 mm
Source room volume: 343.1 m3
Canopy: n/a
Vent: n/a
(Condition D2)
Test ID: 714066 Loudspeaker Configuration: L6
Frequency D2m,nT
Hz dB
50 28.1 B
63 34.2
80 24.8
100 25.2 0
125 18.6 3
160 18.8 6
200 21.4 9
250 16.2 12
315 20.1 15
400 25.9 18
500 26.0 19
630 20.5 20
800 14.8 21
1k 21.6 22
1.25k 28.8 23
1.6k 25.9 23
2k 25.0 23
2.5k 25.0 23
3.15k 21.2 23
4k 23.8
5k 28.3
D 2 m,nT,w (C;Ctr ) 23 (-1; -3) dB
Tested by Building Performance Centre, Napier University, Edinburgh.
Measured D2m,nT dB
0.0
10.0
20.0
30.0
40.0
50.0
60.0
63 125 250 500 1k 2k 4kFrequency (Hz)
Sta
nd
ard
ise
d L
eve
l D
iffe
ren
ce
, D
2m
,nT
(d
B)
Measured values Shifted Reference Curve
H-10

OPEN/CLOSED WINDOW RESEARCH Defra Research Contract: NANR116
Airborne Sound Insulation. Laboratory measurements with non-diffuse source conditions
Standardised Level Difference. Simulated residential receiver environment
Date: 14/7/2005 Test Sample: Window D-3 Open 0.05 m2
Air temperature: 22 ºC Area of window unit, S: 1.26 m2
Air humidity: 31.2 % Window mass per unit area: 27.94 kg/m2
Atmospheric pressure: 1.008 Bar
Receiving room volume: 31.2 m3
Glass Specification: 4 -16 - 4 mm
Source room volume: 343.1 m3
Canopy: n/a
Vent: n/a
(Condition D3)
Test ID: 714076 Loudspeaker Configuration: L6
Frequency D2m,nT
Hz dB
50 27.4 B
63 34.3
80 24.9
100 26.0 1
125 18.7 4
160 19.0 7
200 21.5 10
250 16.5 13
315 20.6 16
400 26.2 19
500 26.6 20
630 20.9 21
800 14.9 22
1k 22.5 23
1.25k 29.2 24
1.6k 26.3 24
2k 25.8 24
2.5k 26.3 24
3.15k 22.9 24
4k 24.9
5k 29.2
D 2 m,nT,w (C;Ctr ) 24 (-2; -3) dB
Tested by Building Performance Centre, Napier University, Edinburgh.
Measured D2m,nT dB
0.0
10.0
20.0
30.0
40.0
50.0
60.0
63 125 250 500 1k 2k 4kFrequency (Hz)
Sta
nd
ard
ise
d L
eve
l D
iffe
ren
ce
, D
2m
,nT
(d
B)
Measured values Shifted Reference Curve
H-11

OPEN/CLOSED WINDOW RESEARCH Defra Research Contract: NANR116
Airborne Sound Insulation. Laboratory measurements with non-diffuse source conditions
Standardised Level Difference. Simulated residential receiver environment
Date: 14/7/2005 Test Sample: Window D-3 Open 0.05 m2
Air temperature: 22.1 ºC Area of window unit, S: 1.26 m2
Air humidity: 31.2 % Window mass per unit area: 27.94 kg/m2
Atmospheric pressure: 1.008 Bar
Receiving room volume: 31.2 m3
Glass Specification: 4 -16 - 4 mm
Source room volume: 343.1 m3
Canopy: n/a
Vent: n/a
(Condition D4)
Test ID: 714092 Loudspeaker Configuration: L6
Frequency D2m,nT
Hz dB
50 29.6 B
63 34.2
80 30.8
100 28.8 -1
125 20.5 2
160 19.0 5
200 20.7 8
250 13.2 11
315 17.9 14
400 23.6 17
500 24.8 18
630 18.9 19
800 14.6 20
1k 20.6 21
1.25k 27.8 22
1.6k 24.3 22
2k 23.7 22
2.5k 24.2 22
3.15k 20.6 22
4k 22.3
5k 26.6
D 2 m,nT,w (C;Ctr ) 22 (-1; -3) dB
Tested by Building Performance Centre, Napier University, Edinburgh.
Measured D2m,nT dB
0.0
10.0
20.0
30.0
40.0
50.0
60.0
63 125 250 500 1k 2k 4kFrequency (Hz)
Sta
nd
ard
ise
d L
eve
l D
iffe
ren
ce
, D
2m
,nT
(d
B)
Measured values Shifted Reference Curve
H-12

OPEN/CLOSED WINDOW RESEARCH Defra Research Contract: NANR116
Airborne Sound Insulation. Laboratory measurements with non-diffuse source conditions
Standardised Level Difference. Simulated residential receiver environment
Date: 14/7/2005 Test Sample: Window D-2 Open 0.10 m2
Air temperature: 21.6 ºC Area of window unit, S: 1.26 m2
Air humidity: 31.2 % Window mass per unit area: 27.94 kg/m2
Atmospheric pressure: 1.0096 Bar
Receiving room volume: 31.2 m3
Glass Specification: 4 -16 - 4 mm
Source room volume: 343.1 m3
Canopy: n/a
Vent: n/a
(Condition D1)
Test ID: 714028 Loudspeaker Configuration: L6
Frequency D2m,nT
Hz dB
50 26.4 B
63 32.0
80 22.9
100 23.0 -6
125 16.5 -3
160 16.4 0
200 19.1 3
250 12.6 6
315 13.1 9
400 19.0 12
500 22.3 13
630 23.5 14
800 13.8 15
1k 17.0 16
1.25k 15.2 17
1.6k 20.9 17
2k 15.7 17
2.5k 15.6 17
3.15k 16.1 17
4k 18.7
5k 19.1
D 2 m,nT,w (C;Ctr ) 17 (-1; -1) dB
Tested by Building Performance Centre, Napier University, Edinburgh.
Measured D2m,nT dB
0.0
10.0
20.0
30.0
40.0
50.0
60.0
63 125 250 500 1k 2k 4kFrequency (Hz)
Sta
nd
ard
ise
d L
eve
l D
iffe
ren
ce
, D
2m
,nT
(d
B)
Measured values Shifted Reference Curve
H-13
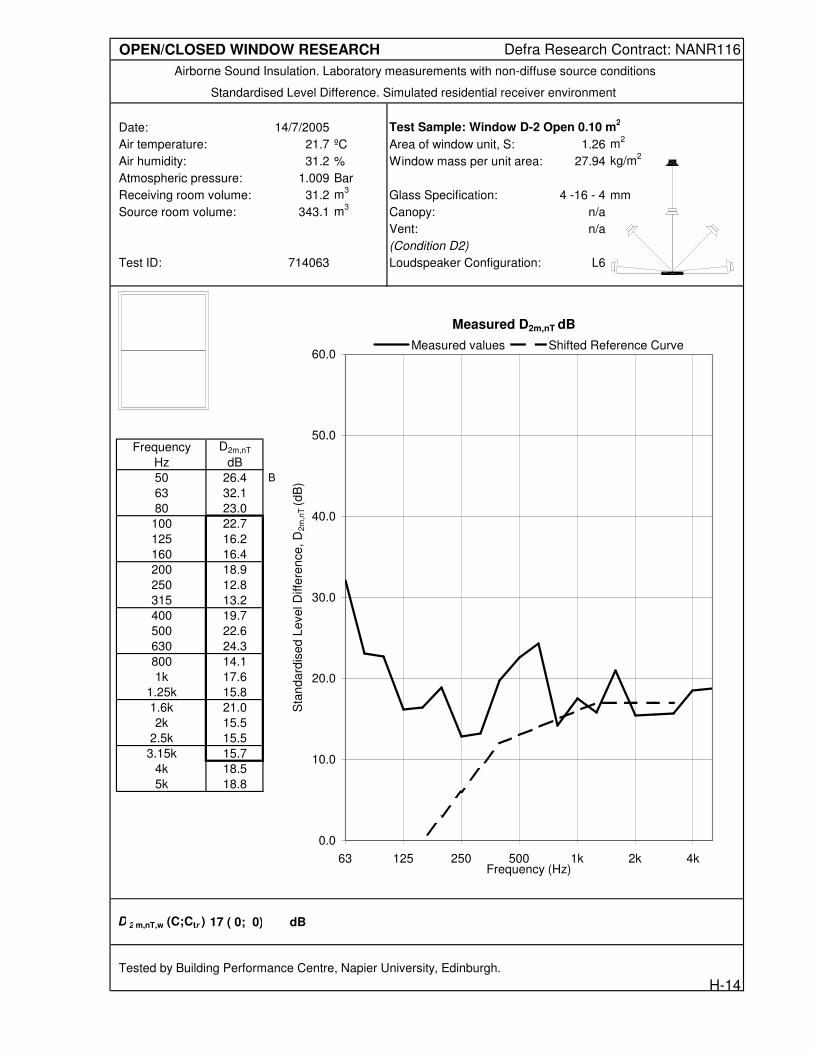
OPEN/CLOSED WINDOW RESEARCH Defra Research Contract: NANR116
Airborne Sound Insulation. Laboratory measurements with non-diffuse source conditions
Standardised Level Difference. Simulated residential receiver environment
Date: 14/7/2005 Test Sample: Window D-2 Open 0.10 m2
Air temperature: 21.7 ºC Area of window unit, S: 1.26 m2
Air humidity: 31.2 % Window mass per unit area: 27.94 kg/m2
Atmospheric pressure: 1.009 Bar
Receiving room volume: 31.2 m3
Glass Specification: 4 -16 - 4 mm
Source room volume: 343.1 m3
Canopy: n/a
Vent: n/a
(Condition D2)
Test ID: 714063 Loudspeaker Configuration: L6
Frequency D2m,nT
Hz dB
50 26.4 B
63 32.1
80 23.0
100 22.7 -6
125 16.2 -3
160 16.4 0
200 18.9 3
250 12.8 6
315 13.2 9
400 19.7 12
500 22.6 13
630 24.3 14
800 14.1 15
1k 17.6 16
1.25k 15.8 17
1.6k 21.0 17
2k 15.5 17
2.5k 15.5 17
3.15k 15.7 17
4k 18.5
5k 18.8
D 2 m,nT,w (C;Ctr ) 17 ( 0; 0) dB
Tested by Building Performance Centre, Napier University, Edinburgh.
Measured D2m,nT dB
0.0
10.0
20.0
30.0
40.0
50.0
60.0
63 125 250 500 1k 2k 4kFrequency (Hz)
Sta
nd
ard
ise
d L
eve
l D
iffe
ren
ce
, D
2m
,nT
(d
B)
Measured values Shifted Reference Curve
H-14

OPEN/CLOSED WINDOW RESEARCH Defra Research Contract: NANR116
Airborne Sound Insulation. Laboratory measurements with non-diffuse source conditions
Standardised Level Difference. Simulated residential receiver environment
Date: 18/7/2005 Test Sample: Window E Untensioned.
Air temperature: 20.5 ºC Area of window unit, S: 0.63 m2
Air humidity: 31.2 % Window mass per unit area: 26.83 kg/m2
Atmospheric pressure: 0.9961 Bar
Receiving room volume: 31.2 m3
Glass Specification: 4 -16 - 4 mm
Source room volume: 343.1 m3
Canopy: n/a
Vent: n/a
(Frame and light seals removed)
Test ID: 718042 Loudspeaker Configuration: L6
Frequency D2m,nT
Hz dB
50 30.7
63 38.4
80 31.7
100 32.5 7
125 27.0 10
160 26.3 13
200 25.7 16
250 32.4 19
315 31.7 22
400 32.0 25
500 31.8 26
630 28.1 27
800 26.7 28
1k 26.0 29
1.25k 28.6 30
1.6k 34.8 30
2k 35.1 30
2.5k 31.4 30
3.15k 29.7 30
4k 31.7
5k 38.5
D 2 m,nT,w (C;Ctr ) 30 ( 0; -1) dB
Tested by Building Performance Centre, Napier University, Edinburgh.
Measured D2m,nT dB
0.0
10.0
20.0
30.0
40.0
50.0
60.0
63 125 250 500 1k 2k 4kFrequency (Hz)
Sta
nd
ard
ise
d L
eve
l D
iffe
ren
ce
, D
2m
,nT
(d
B)
Measured values Shifted Reference Curve
I-1

OPEN/CLOSED WINDOW RESEARCH Defra Research Contract: NANR116
Airborne Sound Insulation. Laboratory measurements with non-diffuse source conditions
Standardised Level Difference. Simulated residential receiver environment
Date: 19/7/2005 Test Sample: Window F Untensioned.
Air temperature: 20.4 ºC Area of window unit, S: 0.63 m2
Air humidity: 31.2 % Window mass per unit area: 26.83 kg/m2
Atmospheric pressure: 1.0024 Bar
Receiving room volume: 31.2 m3
Glass Specification: 4 -16 - 4 mm
Source room volume: 343.1 m3
Canopy: n/a
Vent: n/a
(Bottom light seal removed)
Test ID: 719036 Loudspeaker Configuration: L6
Frequency D2m,nT
Hz dB
50 33.6
63 44.0
80 30.3
100 33.5 13
125 29.2 16
160 25.4 19
200 23.0 22
250 39.7 25
315 39.2 28
400 40.8 31
500 40.0 32
630 32.4 33
800 33.3 34
1k 34.4 35
1.25k 32.1 36
1.6k 38.5 36
2k 43.1 36
2.5k 43.6 36
3.15k 36.9 36
4k 38.0
5k 47.3
D 2 m,nT,w (C;Ctr ) 36 (-1; -3) dB
Tested by Building Performance Centre, Napier University, Edinburgh.
Measured D2m,nT dB
10.0
20.0
30.0
40.0
50.0
60.0
70.0
63 125 250 500 1k 2k 4kFrequency (Hz)
Sta
nd
ard
ise
d L
eve
l D
iffe
ren
ce
, D
2m
,nT
(d
B)
Measured values Shifted Reference Curve
I-2

OPEN/CLOSED WINDOW RESEARCH Defra Research Contract: NANR116
Airborne Sound Insulation. Laboratory measurements with non-diffuse source conditions
Standardised Level Difference. Simulated residential receiver environment
Date: 19/7/2005 Test Sample: Window F Untensioned.
Air temperature: 20.4 ºC Area of window unit, S: 0.63 m2
Air humidity: 31.2 % Window mass per unit area: 26.83 kg/m2
Atmospheric pressure: 1.0024 Bar
Receiving room volume: 31.2 m3
Glass Specification: 4 -16 - 4 mm
Source room volume: 343.1 m3
Canopy: n/a
Vent: n/a
(Top and bottom light seals removed)
Test ID: 719038 Loudspeaker Configuration: L6
Frequency D2m,nT
Hz dB
50 33.1
63 43.2
80 30.3
100 32.7 11
125 28.3 14
160 24.4 17
200 22.8 20
250 38.0 23
315 37.5 26
400 39.4 29
500 38.5 30
630 32.6 31
800 32.5 32
1k 32.9 33
1.25k 29.0 34
1.6k 35.9 34
2k 40.7 34
2.5k 41.3 34
3.15k 34.1 34
4k 36.4
5k 44.8
D 2 m,nT,w (C;Ctr ) 34 (-1; -2) dB
Tested by Building Performance Centre, Napier University, Edinburgh.
Measured D2m,nT dB
10.0
20.0
30.0
40.0
50.0
60.0
70.0
63 125 250 500 1k 2k 4kFrequency (Hz)
Sta
nd
ard
ise
d L
eve
l D
iffe
ren
ce
, D
2m
,nT
(d
B)
Measured values Shifted Reference Curve
I-3

OPEN/CLOSED WINDOW RESEARCH Defra Research Contract: NANR116
Airborne Sound Insulation. Laboratory measurements with non-diffuse source conditions
Standardised Level Difference. Simulated residential receiver environment
Date: 19/7/2005 Test Sample: Window F Untensioned.
Air temperature: 20.4 ºC Area of window unit, S: 0.63 m2
Air humidity: 31.2 % Window mass per unit area: 26.83 kg/m2
Atmospheric pressure: 1.0026 Bar
Receiving room volume: 31.2 m3
Glass Specification: 4 -16 - 4 mm
Source room volume: 343.1 m3
Canopy: n/a
Vent: n/a
(Light seals removed)
Test ID: 719040 Loudspeaker Configuration: L6
Frequency D2m,nT
Hz dB
50 33.1
63 43.4
80 30.2
100 32.9 11
125 28.5 14
160 24.7 17
200 22.9 20
250 38.2 23
315 38.0 26
400 39.9 29
500 38.4 30
630 31.0 31
800 32.9 32
1k 34.2 33
1.25k 29.2 34
1.6k 34.6 34
2k 39.1 34
2.5k 40.3 34
3.15k 34.4 34
4k 34.9
5k 43.0
D 2 m,nT,w (C;Ctr ) 34 (-1; -2) dB
Tested by Building Performance Centre, Napier University, Edinburgh.
Measured D2m,nT dB
10.0
20.0
30.0
40.0
50.0
60.0
70.0
63 125 250 500 1k 2k 4kFrequency (Hz)
Sta
nd
ard
ise
d L
eve
l D
iffe
ren
ce
, D
2m
,nT
(d
B)
Measured values Shifted Reference Curve
I-4

OPEN/CLOSED WINDOW RESEARCH Defra Research Contract: NANR116
Airborne Sound Insulation. Laboratory measurements with non-diffuse source conditions
Standardised Level Difference. Simulated residential receiver environment
Date: 19/7/2005 Test Sample: Window F Untensioned.
Air temperature: 20.4 ºC Area of window unit, S: 0.63 m2
Air humidity: 31.2 % Window mass per unit area: 26.83 kg/m2
Atmospheric pressure: 1.0026 Bar
Receiving room volume: 31.2 m3
Glass Specification: 4 -16 - 4 mm
Source room volume: 343.1 m3
Canopy: n/a
Vent: n/a
(Frame and light seals removed)
Test ID: 719042 Loudspeaker Configuration: L6
Frequency D2m,nT
Hz dB
50 31.9
63 41.3
80 30.0
100 31.7 10
125 26.9 13
160 23.8 16
200 22.5 19
250 33.7 22
315 33.3 25
400 33.6 28
500 34.7 29
630 29.6 30
800 30.2 31
1k 29.1 32
1.25k 28.9 33
1.6k 36.1 33
2k 40.0 33
2.5k 40.2 33
3.15k 35.9 33
4k 34.3
5k 43.9
D 2 m,nT,w (C;Ctr ) 33 (-1; -3) dB
Tested by Building Performance Centre, Napier University, Edinburgh.
Measured D2m,nT dB
10.0
20.0
30.0
40.0
50.0
60.0
70.0
63 125 250 500 1k 2k 4kFrequency (Hz)
Sta
nd
ard
ise
d L
eve
l D
iffe
ren
ce
, D
2m
,nT
(d
B)
Measured values Shifted Reference Curve
I-5
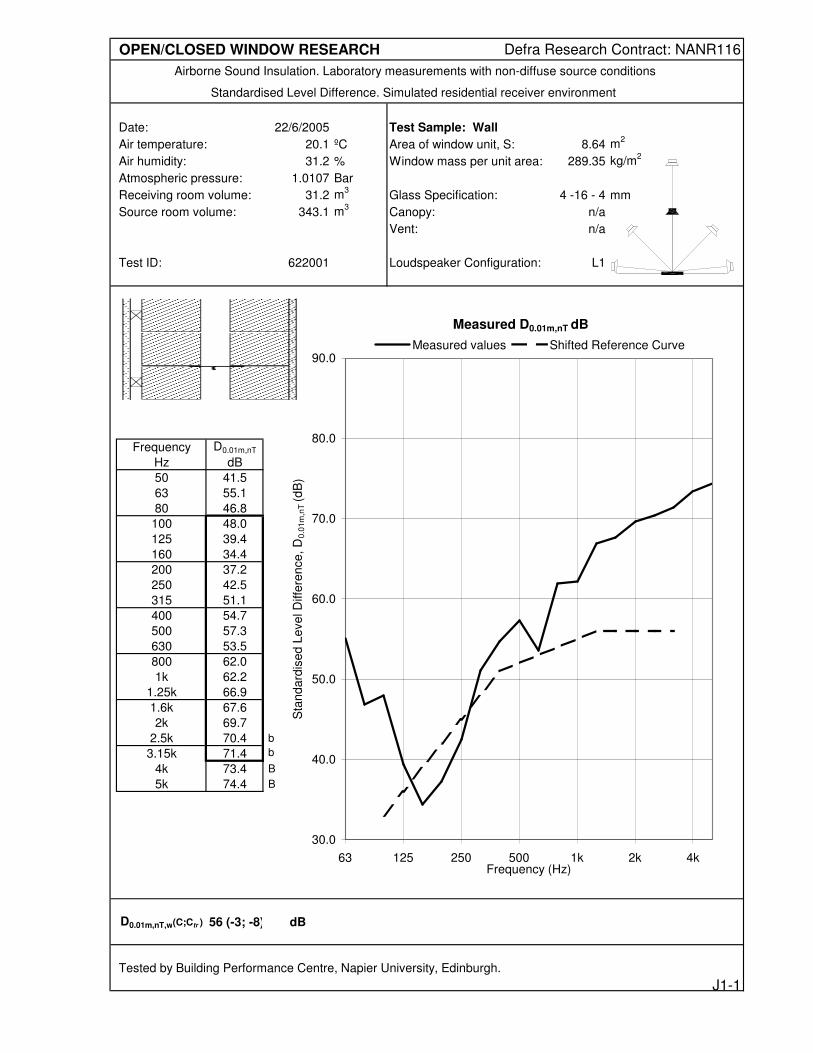
OPEN/CLOSED WINDOW RESEARCH Defra Research Contract: NANR116
Airborne Sound Insulation. Laboratory measurements with non-diffuse source conditions
Standardised Level Difference. Simulated residential receiver environment
Date: 22/6/2005 Test Sample: Wall
Air temperature: 20.1 ºC Area of window unit, S: 8.64 m2
Air humidity: 31.2 % Window mass per unit area: 289.35 kg/m2
Atmospheric pressure: 1.0107 Bar
Receiving room volume: 31.2 m3
Glass Specification: 4 -16 - 4 mm
Source room volume: 343.1 m3
Canopy: n/a
Vent: n/a
Test ID: 622001 Loudspeaker Configuration: L1
Frequency D0.01m,nT
Hz dB
50 41.5
63 55.1
80 46.8
100 48.0 33
125 39.4 36
160 34.4 39
200 37.2 42
250 42.5 45
315 51.1 48
400 54.7 51
500 57.3 52
630 53.5 53
800 62.0 54
1k 62.2 55
1.25k 66.9 56
1.6k 67.6 56
2k 69.7 56
2.5k 70.4 b 56
3.15k 71.4 b 56
4k 73.4 B
5k 74.4 B
D0.01m,nT,w(C;Ctr ) 56 (-3; -8) dB
Tested by Building Performance Centre, Napier University, Edinburgh.
Measured D0.01m,nT dB
30.0
40.0
50.0
60.0
70.0
80.0
90.0
63 125 250 500 1k 2k 4kFrequency (Hz)
Sta
nd
ard
ise
d L
eve
l D
iffe
ren
ce
, D
0.0
1m
,nT
(d
B)
Measured values Shifted Reference Curve
J1-1

OPEN/CLOSED WINDOW RESEARCH Defra Research Contract: NANR116
Airborne Sound Insulation. Laboratory measurements with non-diffuse source conditions
Standardised Level Difference. Simulated residential receiver environment
Date: 28/6/2005 Test Sample: Window A Closed.
Air temperature: 20.5 ºC Area of window unit, S: 2.52 m2
Air humidity: 31.2 % Window mass per unit area: 30.00 kg/m2
Atmospheric pressure: 1.0112 Bar
Receiving room volume: 31.2 m3
Glass Specification: 4 -16 - 4 mm
Source room volume: 343.1 m3
Canopy: n/a
Vent: n/a
Test ID: 628001 Loudspeaker Configuration: L1
Frequency D0.01m,nT
Hz dB
50 34.4
63 40.1
80 32.2
100 39.1 17
125 32.9 20
160 23.7 23
200 24.1 26
250 33.1 29
315 33.1 32
400 34.3 35
500 40.5 36
630 41.7 37
800 44.9 38
1k 44.8 39
1.25k 44.1 40
1.6k 41.8 40
2k 40.4 40
2.5k 39.4 40
3.15k 42.4 40
4k 48.6
5k 49.8
D0.01m,nT,w(C;Ctr ) 40 (-2; -4) dB
Tested by Building Performance Centre, Napier University, Edinburgh.
Measured D0.01m,nT dB
10.0
20.0
30.0
40.0
50.0
60.0
70.0
63 125 250 500 1k 2k 4kFrequency (Hz)
Sta
nd
ard
ise
d L
eve
l D
iffe
ren
ce
, D
0.0
1m
,nT
(d
B)
Measured values Shifted Reference Curve
J1-2

OPEN/CLOSED WINDOW RESEARCH Defra Research Contract: NANR116
Airborne Sound Insulation. Laboratory measurements with non-diffuse source conditions
Standardised Level Difference. Simulated residential receiver environment
Date: 5/7/05 Test Sample: Window B Closed.
Air temperature: 18.8 ºC Area of window unit, S: 1.26 m2
Air humidity: 31.2 % Window mass per unit area: 27.94 kg/m2
Atmospheric pressure: 0.9984 Bar
Receiving room volume: 31.2 m3
Glass Specification: 4 -16 - 4 mm
Source room volume: 343.1 m3
Canopy: n/a
Vent: n/a
Test ID: 705001 Loudspeaker Configuration: L1
Frequency D0.01m,nT
Hz dB
50 40.5
63 42.3
80 33.5
100 39.5 18
125 37.5 21
160 31.4 24
200 24.6 27
250 32.1 30
315 32.8 33
400 41.8 36
500 42.7 37
630 36.3 38
800 41.9 39
1k 44.3 40
1.25k 48.6 41
1.6k 46.3 41
2k 46.5 41
2.5k 41.5 41
3.15k 39.7 41
4k 48.4
5k 54.6
D0.01m,nT,w(C;Ctr ) 41 (-1; -4) dB
Tested by Building Performance Centre, Napier University, Edinburgh.
Measured D0.01m,nT dB
10.0
20.0
30.0
40.0
50.0
60.0
70.0
63 125 250 500 1k 2k 4kFrequency (Hz)
Sta
nd
ard
ise
d L
eve
l D
iffe
ren
ce
, D
0.0
1m
,nT
(d
B)
Measured values Shifted Reference Curve
J1-3

OPEN/CLOSED WINDOW RESEARCH Defra Research Contract: NANR116
Airborne Sound Insulation. Laboratory measurements with non-diffuse source conditions
Standardised Level Difference. Simulated residential receiver environment
Date: 11/7/05 Test Sample: Window C Closed.
Air temperature: 20.4 ºC Area of window unit, S: 0.945 m2
Air humidity: 31.2 % Window mass per unit area: 36.83 kg/m2
Atmospheric pressure: 1.0282 Bar
Receiving room volume: 31.2 m3
Glass Specification: 4 -16 - 4 mm
Source room volume: 343.1 m3
Canopy: Original
Vent: Closed
Test ID: 711001 Loudspeaker Configuration: L1
Frequency D0.01m,nT
Hz dB
50 38.6 B
63 45.4
80 35.4
100 39.1 17
125 32.1 20
160 35.9 23
200 35.7 26
250 30.6 29
315 35.3 32
400 37.8 35
500 39.6 36
630 31.6 37
800 41.3 38
1k 38.2 39
1.25k 44.8 40
1.6k 43.2 40
2k 44.1 40
2.5k 38.6 40
3.15k 39.7 40
4k 43.4
5k 41.5
D0.01m,nT,w(C;Ctr ) 40 (-2; -3) dB
Tested by Building Performance Centre, Napier University, Edinburgh.
Measured D0.01m,nT dB
10.0
20.0
30.0
40.0
50.0
60.0
70.0
63 125 250 500 1k 2k 4kFrequency (Hz)
Sta
nd
ard
ise
d L
eve
l D
iffe
ren
ce
, D
0.0
1m
,nT
(d
B)
Measured values Shifted Reference Curve
J1-4

OPEN/CLOSED WINDOW RESEARCH Defra Research Contract: NANR116
Airborne Sound Insulation. Laboratory measurements with non-diffuse source conditions
Standardised Level Difference. Simulated residential receiver environment
Date: 13/7/2005 Test Sample: Window D Closed.
Air temperature: 21.8 ºC Area of window unit, S: 1.26 m2
Air humidity: 31.2 % Window mass per unit area: 27.94 kg/m2
Atmospheric pressure: 1.0185 Bar
Receiving room volume: 31.2 m3
Glass Specification: 4 -16 - 4 mm
Source room volume: 343.1 m3
Canopy: n/a
Vent: n/a
Test ID: 713002 Loudspeaker Configuration: L1
Frequency D0.01m,nT
Hz dB
50 34.1 B
63 44.3 b
80 34.2
100 40.7 16
125 38.7 19
160 32.8 22
200 36.3 25
250 30.3 28
315 42.0 31
400 41.4 34
500 34.3 35
630 41.7 36
800 42.2 37
1k 39.4 38
1.25k 38.7 39
1.6k 34.5 39
2k 41.3 39
2.5k 40.4 39
3.15k 45.5 39
4k 46.0
5k 46.8
D0.01m,nT,w(C;Ctr ) 39 (-1; -1) dB
Tested by Building Performance Centre, Napier University, Edinburgh.
Measured D0.01m,nT dB
10.0
20.0
30.0
40.0
50.0
60.0
70.0
63 125 250 500 1k 2k 4kFrequency (Hz)
Sta
nd
ard
ise
d L
eve
l D
iffe
ren
ce
, D
0.0
1m
,nT
(d
B)
Measured values Shifted Reference Curve
J1-5

OPEN/CLOSED WINDOW RESEARCH Defra Research Contract: NANR116
Airborne Sound Insulation. Laboratory measurements with non-diffuse source conditions
Standardised Level Difference. Simulated residential receiver environment
Date: 18/7/2005 Test Sample: Window E Closed.
Air temperature: 20.2 ºC Area of window unit, S: 0.63 m2
Air humidity: 31.2 % Window mass per unit area: 26.83 kg/m2
Atmospheric pressure: 0.996 Bar
Receiving room volume: 31.2 m3
Glass Specification: 4 -16 - 4 mm
Source room volume: 343.1 m3
Canopy: n/a
Vent: n/a
Test ID: 718001 Loudspeaker Configuration: L1
Frequency D0.01m,nT
Hz dB
50 44.6 B
63 40.1
80 35.3
100 43.2 26
125 43.0 29
160 39.2 32
200 30.5 35
250 36.2 38
315 49.0 41
400 51.8 44
500 50.6 45
630 51.6 46
800 53.3 47
1k 52.8 48
1.25k 53.8 49
1.6k 52.1 49
2k 47.7 49
2.5k 47.4 49
3.15k 52.2 49
4k 57.0
5k 58.0
D0.01m,nT,w(C;Ctr ) 49 (-2; -5) dB
Tested by Building Performance Centre, Napier University, Edinburgh.
Measured D0.01m,nT dB
20.0
30.0
40.0
50.0
60.0
70.0
80.0
63 125 250 500 1k 2k 4kFrequency (Hz)
Sta
nd
ard
ise
d L
eve
l D
iffe
ren
ce
, D
0.0
1m
,nT
(d
B)
Measured values Shifted Reference Curve
J1-6

OPEN/CLOSED WINDOW RESEARCH Defra Research Contract: NANR116
Airborne Sound Insulation. Laboratory measurements with non-diffuse source conditions
Standardised Level Difference. Simulated residential receiver environment
Date: 19/7/2005 Test Sample: Window F Closed.
Air temperature: 20.3 ºC Area of window unit, S: 0.63 m2
Air humidity: 31.2 % Window mass per unit area: 26.83 kg/m2
Atmospheric pressure: 1.0023 Bar
Receiving room volume: 31.2 m3
Glass Specification: 4 -16 - 4 mm
Source room volume: 343.1 m3
Canopy: n/a
Vent: n/a
Test ID: 719015 Loudspeaker Configuration: L1
Frequency D0.01m,nT
Hz dB
50 45.5 B
63 44.7
80 33.1
100 40.4 26
125 40.9 29
160 37.3 32
200 28.4 35
250 40.9 38
315 45.7 41
400 47.6 44
500 48.1 45
630 48.9 46
800 49.2 47
1k 52.6 48
1.25k 53.7 49
1.6k 57.3 49
2k 55.5 49
2.5k 50.3 49
3.15k 43.3 49
4k 49.1
5k 52.4
D0.01m,nT,w(C;Ctr ) 49 (-3; -6) dB
Tested by Building Performance Centre, Napier University, Edinburgh.
Measured D0.01m,nT dB
20.0
30.0
40.0
50.0
60.0
70.0
80.0
63 125 250 500 1k 2k 4kFrequency (Hz)
Sta
nd
ard
ise
d L
eve
l D
iffe
ren
ce
, D
0.0
1m
,nT
(d
B)
Measured values Shifted Reference Curve
J1-7

OPEN/CLOSED WINDOW RESEARCH Defra Research Contract: NANR116
Airborne Sound Insulation. Laboratory measurements with non-diffuse source conditions
Standardised Level Difference. Simulated residential receiver environment
Date: 20/7/2005 Test Sample: Window G Closed.
Air temperature: 20.3 ºC Area of window unit, S: 0.54 m2
Air humidity: 31.2 % Window mass per unit area: 33.33 kg/m2
Atmospheric pressure: 1.0032 Bar
Receiving room volume: 31.2 m3
Glass Specification: 4 -16 - 4 mm
Source room volume: 343.1 m3
Canopy: n/a
Vent: n/a
Test ID: 720014 Loudspeaker Configuration: L1
Frequency D0.01m,nT
Hz dB
50 45.5 B
63 40.0
80 37.1
100 44.0 24
125 42.0 27
160 38.1 30
200 36.6 33
250 34.2 36
315 45.3 39
400 46.7 42
500 50.5 43
630 45.0 44
800 42.8 45
1k 43.4 46
1.25k 53.4 47
1.6k 55.6 47
2k 54.0 47
2.5k 48.3 47
3.15k 44.3 47
4k 47.6
5k 52.9
D0.01m,nT,w(C;Ctr ) 47 (-1; -3) dB
Tested by Building Performance Centre, Napier University, Edinburgh.
Measured D0.01m,nT dB
20.0
30.0
40.0
50.0
60.0
70.0
80.0
63 125 250 500 1k 2k 4kFrequency (Hz)
Sta
nd
ard
ise
d L
eve
l D
iffe
ren
ce
, D
0.0
1m
,nT
(d
B)
Measured values Shifted Reference Curve
J1-8

OPEN/CLOSED WINDOW RESEARCH Defra Research Contract: NANR116
Airborne Sound Insulation. Laboratory measurements with non-diffuse source conditions
Standardised Level Difference. Simulated residential receiver environment
Date: 22/6/2005 Test Sample: Wall
Air temperature: 20.1 ºC Area of window unit, S: 8.64 m2
Air humidity: 31.2 % Window mass per unit area: 289.35 kg/m2
Atmospheric pressure: 1.0107 Bar
Receiving room volume: 31.2 m3
Glass Specification: 4 -16 - 4 mm
Source room volume: 343.1 m3
Canopy: n/a
Vent: n/a
Test ID: 622002 Loudspeaker Configuration: L2
Frequency D0.01m,nT
Hz dB
50 39.2
63 43.4
80 44.9
100 43.6 35
125 42.6 38
160 39.7 41
200 41.5 44
250 42.9 47
315 46.5 50
400 53.4 53
500 57.1 54
630 59.9 55
800 66.1 56
1k 65.5 57
1.25k 67.9 58
1.6k 71.7 58
2k 73.6 58
2.5k 74.8 58
3.15k 75.7 58
4k 78.0
5k 78.7 b
D0.01m,nT,w(C;Ctr ) 58 (-2; -7) dB
Tested by Building Performance Centre, Napier University, Edinburgh.
Measured D0.01m,nT dB
30.0
40.0
50.0
60.0
70.0
80.0
90.0
63 125 250 500 1k 2k 4kFrequency (Hz)
Sta
nd
ard
ise
d L
eve
l D
iffe
ren
ce
, D
0.0
1m
,nT
(d
B)
Measured values Shifted Reference Curve
J2-1

OPEN/CLOSED WINDOW RESEARCH Defra Research Contract: NANR116
Airborne Sound Insulation. Laboratory measurements with non-diffuse source conditions
Standardised Level Difference. Simulated residential receiver environment
Date: 28/6/2005 Test Sample: Window A Closed.
Air temperature: 20.6 ºC Area of window unit, S: 2.52 m2
Air humidity: 31.2 % Window mass per unit area: 30.00 kg/m2
Atmospheric pressure: 1.0102 Bar
Receiving room volume: 31.2 m3
Glass Specification: 4 -16 - 4 mm
Source room volume: 343.1 m3
Canopy: n/a
Vent: n/a
Test ID: 628033 Loudspeaker Configuration: L2
Frequency D0.01m,nT
Hz dB
50 28.4
63 37.2
80 36.5
100 37.0 20
125 34.3 23
160 28.2 26
200 25.9 29
250 33.2 32
315 39.3 35
400 37.6 38
500 40.1 39
630 41.2 40
800 43.1 41
1k 46.0 42
1.25k 46.0 43
1.6k 46.7 43
2k 48.3 43
2.5k 46.1 43
3.15k 40.9 43
4k 46.5
5k 50.3
D0.01m,nT,w(C;Ctr ) 43 (-2; -5) dB
Tested by Building Performance Centre, Napier University, Edinburgh.
Measured D0.01m,nT dB
20.0
30.0
40.0
50.0
60.0
70.0
80.0
63 125 250 500 1k 2k 4kFrequency (Hz)
Sta
nd
ard
ise
d L
eve
l D
iffe
ren
ce
, D
0.0
1m
,nT
(d
B)
Measured values Shifted Reference Curve
J2-2
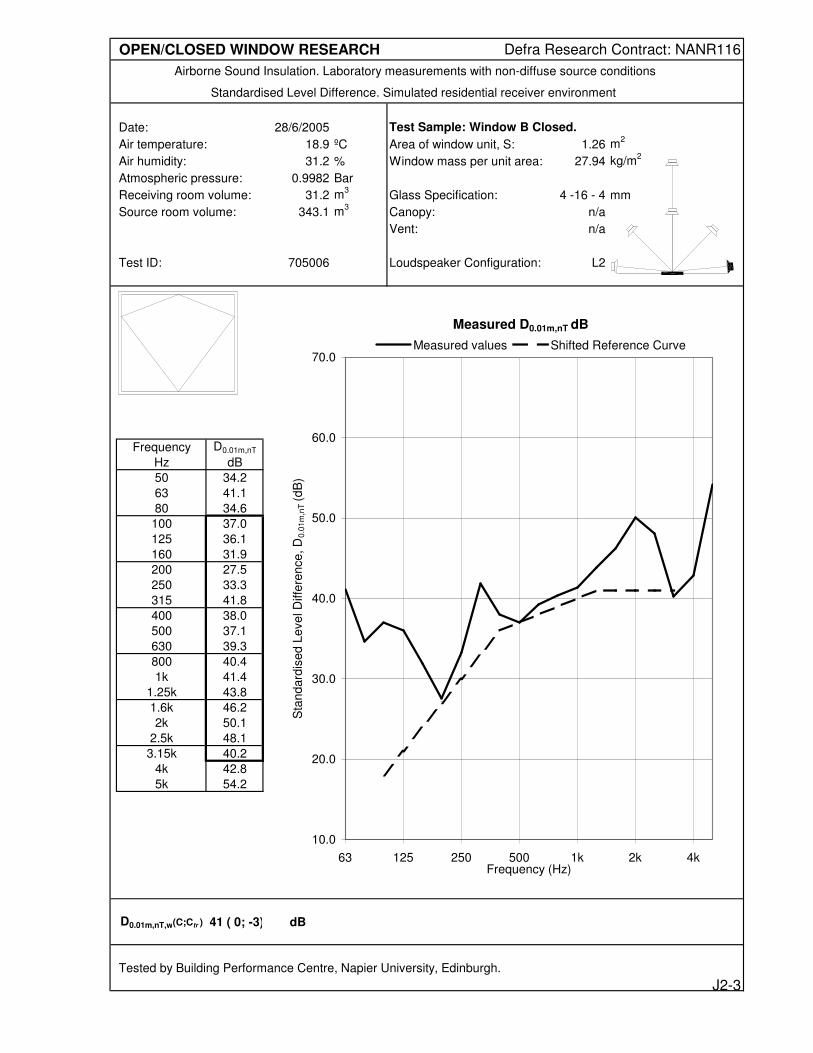
OPEN/CLOSED WINDOW RESEARCH Defra Research Contract: NANR116
Airborne Sound Insulation. Laboratory measurements with non-diffuse source conditions
Standardised Level Difference. Simulated residential receiver environment
Date: 28/6/2005 Test Sample: Window B Closed.
Air temperature: 18.9 ºC Area of window unit, S: 1.26 m2
Air humidity: 31.2 % Window mass per unit area: 27.94 kg/m2
Atmospheric pressure: 0.9982 Bar
Receiving room volume: 31.2 m3
Glass Specification: 4 -16 - 4 mm
Source room volume: 343.1 m3
Canopy: n/a
Vent: n/a
Test ID: 705006 Loudspeaker Configuration: L2
Frequency D0.01m,nT
Hz dB
50 34.2
63 41.1
80 34.6
100 37.0 18
125 36.1 21
160 31.9 24
200 27.5 27
250 33.3 30
315 41.8 33
400 38.0 36
500 37.1 37
630 39.3 38
800 40.4 39
1k 41.4 40
1.25k 43.8 41
1.6k 46.2 41
2k 50.1 41
2.5k 48.1 41
3.15k 40.2 41
4k 42.8
5k 54.2
D0.01m,nT,w(C;Ctr ) 41 ( 0; -3) dB
Tested by Building Performance Centre, Napier University, Edinburgh.
Measured D0.01m,nT dB
10.0
20.0
30.0
40.0
50.0
60.0
70.0
63 125 250 500 1k 2k 4kFrequency (Hz)
Sta
nd
ard
ise
d L
eve
l D
iffe
ren
ce
, D
0.0
1m
,nT
(d
B)
Measured values Shifted Reference Curve
J2-3

OPEN/CLOSED WINDOW RESEARCH Defra Research Contract: NANR116
Airborne Sound Insulation. Laboratory measurements with non-diffuse source conditions
Standardised Level Difference. Simulated residential receiver environment
Date: 28/6/2005 Test Sample: Window C Closed.
Air temperature: 20.6 ºC Area of window unit, S: 0.945 m2
Air humidity: 31.2 % Window mass per unit area: 36.83 kg/m2
Atmospheric pressure: 1.0278 Bar
Receiving room volume: 31.2 m3
Glass Specification: 4 -16 - 4 mm
Source room volume: 343.1 m3
Canopy: Original
Vent: Closed
Test ID: 711027 Loudspeaker Configuration: L2
Frequency D0.01m,nT
Hz dB
50 33.1
63 41.8
80 35.0
100 37.1 19
125 33.9 22
160 33.4 25
200 36.6 28
250 34.9 31
315 38.7 34
400 38.6 37
500 40.2 38
630 35.4 39
800 41.5 40
1k 40.9 41
1.25k 45.0 42
1.6k 44.9 42
2k 45.3 42
2.5k 45.3 42
3.15k 43.5 42
4k 42.1
5k 40.1
D0.01m,nT,w(C;Ctr ) 42 (-1; -2) dB
Tested by Building Performance Centre, Napier University, Edinburgh.
Measured D0.01m,nT dB
10.0
20.0
30.0
40.0
50.0
60.0
70.0
63 125 250 500 1k 2k 4kFrequency (Hz)
Sta
nd
ard
ise
d L
eve
l D
iffe
ren
ce
, D
0.0
1m
,nT
(d
B)
Measured values Shifted Reference Curve
J2-4

OPEN/CLOSED WINDOW RESEARCH Defra Research Contract: NANR116
Airborne Sound Insulation. Laboratory measurements with non-diffuse source conditions
Standardised Level Difference. Simulated residential receiver environment
Date: 18/7/2005 Test Sample: Window E Closed.
Air temperature: 20.4 ºC Area of window unit, S: 0.63 m2
Air humidity: 31.2 % Window mass per unit area: 26.83 kg/m2
Atmospheric pressure: 0.9956 Bar
Receiving room volume: 31.2 m3
Glass Specification: 4 -16 - 4 mm
Source room volume: 343.1 m3
Canopy: n/a
Vent: n/a
Test ID: 718015 Loudspeaker Configuration: L2
Frequency D0.01m,nT
Hz dB
50 40.1
63 42.5
80 37.2
100 40.8 28
125 39.2 31
160 39.3 34
200 33.1 37
250 38.5 40
315 47.6 43
400 44.9 46
500 46.1 47
630 52.8 48
800 55.9 49
1k 51.4 50
1.25k 59.7 51
1.6k 54.3 51
2k 53.9 51
2.5k 54.1 51
3.15k 52.4 51
4k 52.7
5k 54.7
D0.01m,nT,w(C;Ctr ) 51 (-2; -5) dB
Tested by Building Performance Centre, Napier University, Edinburgh.
Measured D0.01m,nT dB
20.0
30.0
40.0
50.0
60.0
70.0
80.0
63 125 250 500 1k 2k 4kFrequency (Hz)
Sta
nd
ard
ise
d L
eve
l D
iffe
ren
ce
, D
0.0
1m
,nT
(d
B)
Measured values Shifted Reference Curve
J2-5

OPEN/CLOSED WINDOW RESEARCH Defra Research Contract: NANR116
Airborne Sound Insulation. Laboratory measurements with non-diffuse source conditions
Standardised Level Difference. Simulated residential receiver environment
Date: 19/7/2005 Test Sample: Window F Closed.
Air temperature: 20.4 ºC Area of window unit, S: 0.63 m2
Air humidity: 31.2 % Window mass per unit area: 26.83 kg/m2
Atmospheric pressure: 1.0024 Bar
Receiving room volume: 31.2 m3
Glass Specification: 4 -16 - 4 mm
Source room volume: 343.1 m3
Canopy: n/a
Vent: n/a
Test ID: 719029 Loudspeaker Configuration: L2
Frequency D0.01m,nT
Hz dB
50 39.9
63 44.4
80 33.2
100 39.1 25
125 37.7 28
160 37.1 31
200 29.3 34
250 42.1 37
315 47.7 40
400 42.2 43
500 45.1 44
630 47.4 45
800 50.2 46
1k 51.6 47
1.25k 56.9 48
1.6k 54.5 48
2k 57.4 48
2.5k 52.6 48
3.15k 44.3 48
4k 48.6
5k 58.8
D0.01m,nT,w(C;Ctr ) 48 (-2; -5) dB
Tested by Building Performance Centre, Napier University, Edinburgh.
Measured D0.01m,nT dB
20.0
30.0
40.0
50.0
60.0
70.0
80.0
63 125 250 500 1k 2k 4kFrequency (Hz)
Sta
nd
ard
ise
d L
eve
l D
iffe
ren
ce
, D
0.0
1m
,nT
(d
B)
Measured values Shifted Reference Curve
J2-6

OPEN/CLOSED WINDOW RESEARCH Defra Research Contract: NANR116
Airborne Sound Insulation. Laboratory measurements with non-diffuse source conditions
Standardised Level Difference. Simulated residential receiver environment
Date: 20/7/2005 Test Sample: Window G Closed.
Air temperature: 20.3 ºC Area of window unit, S: 0.54 m2
Air humidity: 31.2 % Window mass per unit area: 33.33 kg/m2
Atmospheric pressure: 1.0032 Bar
Receiving room volume: 31.2 m3
Glass Specification: 4 -16 - 4 mm
Source room volume: 343.1 m3
Canopy: n/a
Vent: n/a
Test ID: 720042 Loudspeaker Configuration: L2
Frequency D0.01m,nT
Hz dB
50 39.9
63 40.4
80 38.7
100 42.2 23
125 38.5 26
160 36.5 29
200 38.4 32
250 36.7 35
315 46.8 38
400 49.9 41
500 44.4 42
630 46.6 43
800 41.8 44
1k 42.6 45
1.25k 54.6 46
1.6k 54.2 46
2k 54.2 46
2.5k 49.5 46
3.15k 41.8 46
4k 50.3
5k 48.9
D0.01m,nT,w(C;Ctr ) 46 (-1; -2) dB
Tested by Building Performance Centre, Napier University, Edinburgh.
Measured D0.01m,nT dB
20.0
30.0
40.0
50.0
60.0
70.0
80.0
63 125 250 500 1k 2k 4kFrequency (Hz)
Sta
nd
ard
ise
d L
eve
l D
iffe
ren
ce
, D
0.0
1m
,nT
(d
B)
Measured values Shifted Reference Curve
J2-7

OPEN/CLOSED WINDOW RESEARCH Defra Research Contract: NANR116
Airborne Sound Insulation. Laboratory measurements with non-diffuse source conditions
Standardised Level Difference. Simulated residential receiver environment
Date: 22/6/2005 Test Sample: Wall
Air temperature: 20.1 ºC Area of window unit, S: 8.64 m2
Air humidity: 31.2 % Window mass per unit area: 289.35 kg/m2
Atmospheric pressure: 1.0107 Bar
Receiving room volume: 31.2 m3
Glass Specification: 4 -16 - 4 mm
Source room volume: 343.1 m3
Canopy: n/a
Vent: n/a
Test ID: 622003 Loudspeaker Configuration: L3
Frequency D0.01m,nT
Hz dB
50 39.3
63 40.8
80 46.6
100 42.9 34
125 37.8 37
160 40.0 40
200 42.1 43
250 42.2 46
315 45.5 49
400 52.1 52
500 56.4 53
630 59.7 54
800 67.7 55
1k 67.3 56
1.25k 69.1 57
1.6k 72.1 57
2k 73.7 57
2.5k 74.2 57
3.15k 75.1 57
4k 77.5 b
5k 78.0 b
D0.01m,nT,w(C;Ctr ) 57 (-2; -7) dB
Tested by Building Performance Centre, Napier University, Edinburgh.
Measured D0.01m,nT dB
30.0
40.0
50.0
60.0
70.0
80.0
90.0
63 125 250 500 1k 2k 4kFrequency (Hz)
Sta
nd
ard
ise
d L
eve
l D
iffe
ren
ce
, D
0.0
1m
,nT
(d
B)
Measured values Shifted Reference Curve
J3-1
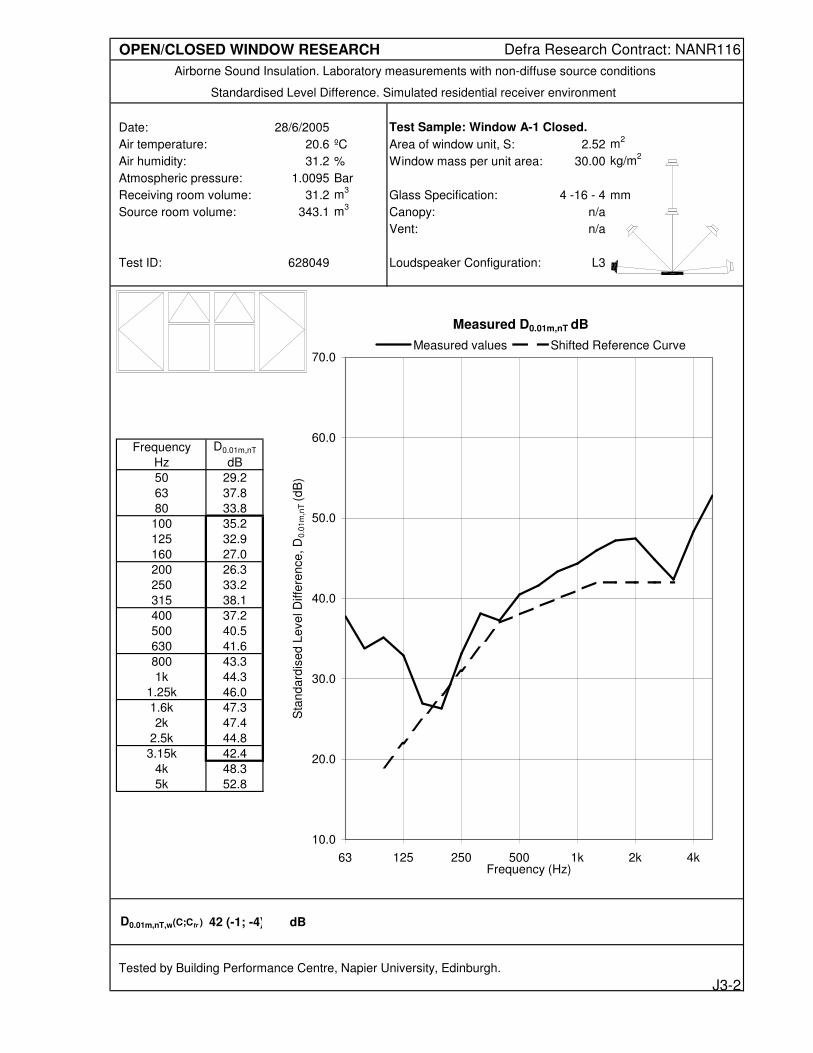
OPEN/CLOSED WINDOW RESEARCH Defra Research Contract: NANR116
Airborne Sound Insulation. Laboratory measurements with non-diffuse source conditions
Standardised Level Difference. Simulated residential receiver environment
Date: 28/6/2005 Test Sample: Window A-1 Closed.
Air temperature: 20.6 ºC Area of window unit, S: 2.52 m2
Air humidity: 31.2 % Window mass per unit area: 30.00 kg/m2
Atmospheric pressure: 1.0095 Bar
Receiving room volume: 31.2 m3
Glass Specification: 4 -16 - 4 mm
Source room volume: 343.1 m3
Canopy: n/a
Vent: n/a
Test ID: 628049 Loudspeaker Configuration: L3
Frequency D0.01m,nT
Hz dB
50 29.2
63 37.8
80 33.8
100 35.2 19
125 32.9 22
160 27.0 25
200 26.3 28
250 33.2 31
315 38.1 34
400 37.2 37
500 40.5 38
630 41.6 39
800 43.3 40
1k 44.3 41
1.25k 46.0 42
1.6k 47.3 42
2k 47.4 42
2.5k 44.8 42
3.15k 42.4 42
4k 48.3
5k 52.8
D0.01m,nT,w(C;Ctr ) 42 (-1; -4) dB
Tested by Building Performance Centre, Napier University, Edinburgh.
Measured D0.01m,nT dB
10.0
20.0
30.0
40.0
50.0
60.0
70.0
63 125 250 500 1k 2k 4kFrequency (Hz)
Sta
nd
ard
ise
d L
eve
l D
iffe
ren
ce
, D
0.0
1m
,nT
(d
B)
Measured values Shifted Reference Curve
J3-2

OPEN/CLOSED WINDOW RESEARCH Defra Research Contract: NANR116
Airborne Sound Insulation. Laboratory measurements with non-diffuse source conditions
Standardised Level Difference. Simulated residential receiver environment
Date: 5/7/05 Test Sample: Window B Closed.
Air temperature: 19.3 ºC Area of window unit, S: 1.26 m2
Air humidity: 31.2 % Window mass per unit area: 27.94 kg/m2
Atmospheric pressure: 0.9974 Bar
Receiving room volume: 31.2 m3
Glass Specification: 4 -16 - 4 mm
Source room volume: 343.1 m3
Canopy: n/a
Vent: n/a
Test ID: 705011 Loudspeaker Configuration: L3
Frequency D0.01m,nT
Hz dB
50 37.0
63 41.4
80 34.5
100 36.0 17
125 36.0 20
160 31.8 23
200 27.9 26
250 32.1 29
315 41.2 32
400 39.0 35
500 36.2 36
630 37.1 37
800 37.8 38
1k 38.3 39
1.25k 40.3 40
1.6k 45.7 40
2k 48.2 40
2.5k 47.9 40
3.15k 40.5 40
4k 45.0
5k 56.8
D0.01m,nT,w(C;Ctr ) 40 (-1; -3) dB
Tested by Building Performance Centre, Napier University, Edinburgh.
Measured D0.01m,nT dB
10.0
20.0
30.0
40.0
50.0
60.0
70.0
63 125 250 500 1k 2k 4kFrequency (Hz)
Sta
nd
ard
ise
d L
eve
l D
iffe
ren
ce
, D
0.0
1m
,nT
(d
B)
Measured values Shifted Reference Curve
J3-3

OPEN/CLOSED WINDOW RESEARCH Defra Research Contract: NANR116
Airborne Sound Insulation. Laboratory measurements with non-diffuse source conditions
Standardised Level Difference. Simulated residential receiver environment
Date: 11/7/05 Test Sample: Window C Closed.
Air temperature: 20.6 ºC Area of window unit, S: 0.945 m2
Air humidity: 31.2 % Window mass per unit area: 36.83 kg/m2
Atmospheric pressure: 1.0276 Bar
Receiving room volume: 31.2 m3
Glass Specification: 4 -16 - 4 mm
Source room volume: 343.1 m3
Canopy: Original
Vent: Closed
Test ID: 711040 Loudspeaker Configuration: L3
Frequency D0.01m,nT
Hz dB
50 34.8
63 42.4
80 35.6
100 36.6 19
125 33.6 22
160 33.9 25
200 37.0 28
250 35.3 31
315 38.5 34
400 40.9 37
500 40.5 38
630 36.0 39
800 41.9 40
1k 41.0 41
1.25k 45.1 42
1.6k 44.5 42
2k 43.6 42
2.5k 43.8 42
3.15k 42.3 42
4k 41.7
5k 45.1
D0.01m,nT,w(C;Ctr ) 42 (-1; -2) dB
Tested by Building Performance Centre, Napier University, Edinburgh.
Measured D0.01m,nT dB
10.0
20.0
30.0
40.0
50.0
60.0
70.0
63 125 250 500 1k 2k 4kFrequency (Hz)
Sta
nd
ard
ise
d L
eve
l D
iffe
ren
ce
, D
0.0
1m
,nT
(d
B)
Measured values Shifted Reference Curve
J3-4

OPEN/CLOSED WINDOW RESEARCH Defra Research Contract: NANR116
Airborne Sound Insulation. Laboratory measurements with non-diffuse source conditions
Standardised Level Difference. Simulated residential receiver environment
Date: 13/7/2005 Test Sample: Window D Closed.
Air temperature: 21.8 ºC Area of window unit, S: 1.26 m2
Air humidity: 31.2 % Window mass per unit area: 27.94 kg/m2
Atmospheric pressure: 1.0176 Bar
Receiving room volume: 31.2 m3
Glass Specification: 4 -16 - 4 mm
Source room volume: 343.1 m3
Canopy: n/a
Vent: n/a
Test ID: 713043 Loudspeaker Configuration: L3
Frequency D0.01m,nT
Hz dB
50 28.2
63 42.0
80 36.3
100 37.5 19
125 35.3 22
160 33.2 25
200 38.9 28
250 37.8 31
315 43.4 34
400 45.6 37
500 43.5 38
630 39.3 39
800 46.8 40
1k 43.7 41
1.25k 38.8 42
1.6k 43.0 42
2k 43.2 42
2.5k 43.3 42
3.15k 37.0 42
4k 34.2
5k 42.3
D0.01m,nT,w(C;Ctr ) 42 (-1; -1) dB
Tested by Building Performance Centre, Napier University, Edinburgh.
Measured D0.01m,nT dB
10.0
20.0
30.0
40.0
50.0
60.0
70.0
63 125 250 500 1k 2k 4kFrequency (Hz)
Sta
nd
ard
ise
d L
eve
l D
iffe
ren
ce
, D
0.0
1m
,nT
(d
B)
Measured values Shifted Reference Curve
J3-5

OPEN/CLOSED WINDOW RESEARCH Defra Research Contract: NANR116
Airborne Sound Insulation. Laboratory measurements with non-diffuse source conditions
Standardised Level Difference. Simulated residential receiver environment
Date: 20/7/2005 Test Sample: Window G Closed.
Air temperature: 20.3 ºC Area of window unit, S: 0.54 m2
Air humidity: 31.2 % Window mass per unit area: 33.33 kg/m2
Atmospheric pressure: 1.0032 Bar
Receiving room volume: 31.2 m3
Glass Specification: 4 -16 - 4 mm
Source room volume: 343.1 m3
Canopy: n/a
Vent: n/a
Test ID: 720041 Loudspeaker Configuration: L3
Frequency D0.01m,nT
Hz dB
50 42.0
63 37.9
80 39.3
100 40.7 26
125 39.6 29
160 37.7 32
200 40.9 35
250 39.4 38
315 50.8 41
400 50.8 44
500 49.2 45
630 53.0 46
800 48.2 47
1k 50.0 48
1.25k 61.4 49
1.6k 55.5 49
2k 48.5 49
2.5k 46.9 49
3.15k 42.7 49
4k 51.6
5k 55.5
D0.01m,nT,w(C;Ctr ) 49 (-2; -2) dB
Tested by Building Performance Centre, Napier University, Edinburgh.
Measured D0.01m,nT dB
20.0
30.0
40.0
50.0
60.0
70.0
80.0
63 125 250 500 1k 2k 4kFrequency (Hz)
Sta
nd
ard
ise
d L
eve
l D
iffe
ren
ce
, D
0.0
1m
,nT
(d
B)
Measured values Shifted Reference Curve
J3-6

OPEN/CLOSED WINDOW RESEARCH Defra Research Contract: NANR116
Airborne Sound Insulation. Laboratory measurements with non-diffuse source conditions
Standardised Level Difference. Simulated residential receiver environment
Date: 22/6/2005 Test Sample: Wall
Air temperature: 20.1 ºC Area of window unit, S: 8.64 m2
Air humidity: 31.2 % Window mass per unit area: 289.35 kg/m2
Atmospheric pressure: 1.0106 Bar
Receiving room volume: 31.2 m3
Glass Specification: 4 -16 - 4 mm
Source room volume: 343.1 m3
Canopy: n/a
Vent: n/a
Test ID: 622004 Loudspeaker Configuration: L4
Frequency D0.01m,nT
Hz dB
50 41.0
63 50.9
80 46.5
100 47.4 34
125 42.8 37
160 35.7 40
200 39.5 43
250 45.8 46
315 52.9 49
400 54.9 52
500 53.7 53
630 52.8 54
800 65.9 55
1k 64.8 56
1.25k 66.9 57
1.6k 66.8 57
2k 69.2 57
2.5k 69.6 b 57
3.15k 70.7 b 57
4k 72.9 b
5k 73.5 B
D0.01m,nT,w(C;Ctr ) 57 (-3; -7) dB
Tested by Building Performance Centre, Napier University, Edinburgh.
Measured D0.01m,nT dB
30.0
40.0
50.0
60.0
70.0
80.0
90.0
63 125 250 500 1k 2k 4kFrequency (Hz)
Sta
nd
ard
ise
d L
eve
l D
iffe
ren
ce
, D
0.0
1m
,nT
(d
B)
Measured values Shifted Reference Curve
J4-1

OPEN/CLOSED WINDOW RESEARCH Defra Research Contract: NANR116
Airborne Sound Insulation. Laboratory measurements with non-diffuse source conditions
Standardised Level Difference. Simulated residential receiver environment
Date: 28/6/2005 Test Sample: Window A-1 Closed.
Air temperature: 20.6 ºC Area of window unit, S: 2.52 m2
Air humidity: 31.2 % Window mass per unit area: 30.00 kg/m2
Atmospheric pressure: 1.0091 Bar
Receiving room volume: 31.2 m3
Glass Specification: 4 -16 - 4 mm
Source room volume: 343.1 m3
Canopy: n/a
Vent: n/a
Test ID: 628065 Loudspeaker Configuration: L4
Frequency D0.01m,nT
Hz dB
50 32.5
63 39.1
80 33.7
100 37.7 18
125 34.3 21
160 26.1 24
200 30.0 27
250 34.0 30
315 34.2 33
400 40.5 36
500 38.5 37
630 40.2 38
800 46.4 39
1k 46.6 40
1.25k 47.3 41
1.6k 43.9 41
2k 41.4 41
2.5k 38.7 41
3.15k 42.4 41
4k 48.7
5k 48.8
D0.01m,nT,w(C;Ctr ) 41 (-1; -3) dB
Tested by Building Performance Centre, Napier University, Edinburgh.
Measured D0.01m,nT dB
10.0
20.0
30.0
40.0
50.0
60.0
70.0
63 125 250 500 1k 2k 4kFrequency (Hz)
Sta
nd
ard
ise
d L
eve
l D
iffe
ren
ce
, D
0.0
1m
,nT
(d
B)
Measured values Shifted Reference Curve
J4-2
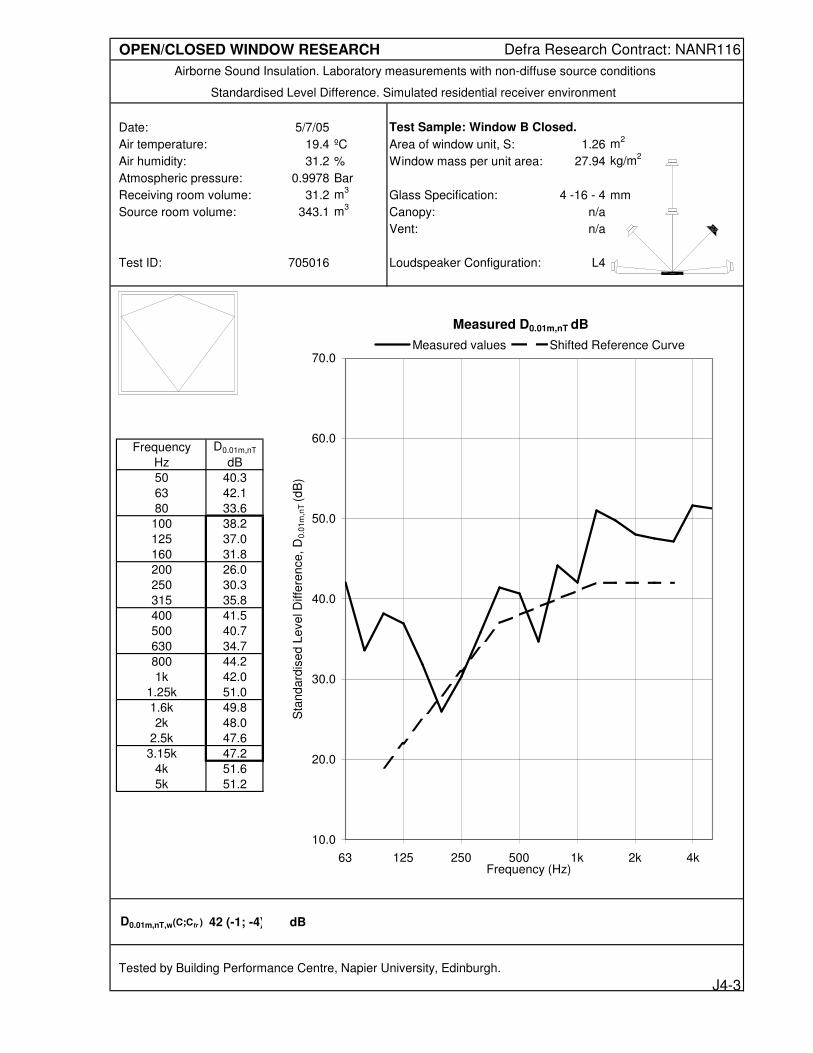
OPEN/CLOSED WINDOW RESEARCH Defra Research Contract: NANR116
Airborne Sound Insulation. Laboratory measurements with non-diffuse source conditions
Standardised Level Difference. Simulated residential receiver environment
Date: 5/7/05 Test Sample: Window B Closed.
Air temperature: 19.4 ºC Area of window unit, S: 1.26 m2
Air humidity: 31.2 % Window mass per unit area: 27.94 kg/m2
Atmospheric pressure: 0.9978 Bar
Receiving room volume: 31.2 m3
Glass Specification: 4 -16 - 4 mm
Source room volume: 343.1 m3
Canopy: n/a
Vent: n/a
Test ID: 705016 Loudspeaker Configuration: L4
Frequency D0.01m,nT
Hz dB
50 40.3
63 42.1
80 33.6
100 38.2 19
125 37.0 22
160 31.8 25
200 26.0 28
250 30.3 31
315 35.8 34
400 41.5 37
500 40.7 38
630 34.7 39
800 44.2 40
1k 42.0 41
1.25k 51.0 42
1.6k 49.8 42
2k 48.0 42
2.5k 47.6 42
3.15k 47.2 42
4k 51.6
5k 51.2
D0.01m,nT,w(C;Ctr ) 42 (-1; -4) dB
Tested by Building Performance Centre, Napier University, Edinburgh.
Measured D0.01m,nT dB
10.0
20.0
30.0
40.0
50.0
60.0
70.0
63 125 250 500 1k 2k 4kFrequency (Hz)
Sta
nd
ard
ise
d L
eve
l D
iffe
ren
ce
, D
0.0
1m
,nT
(d
B)
Measured values Shifted Reference Curve
J4-3
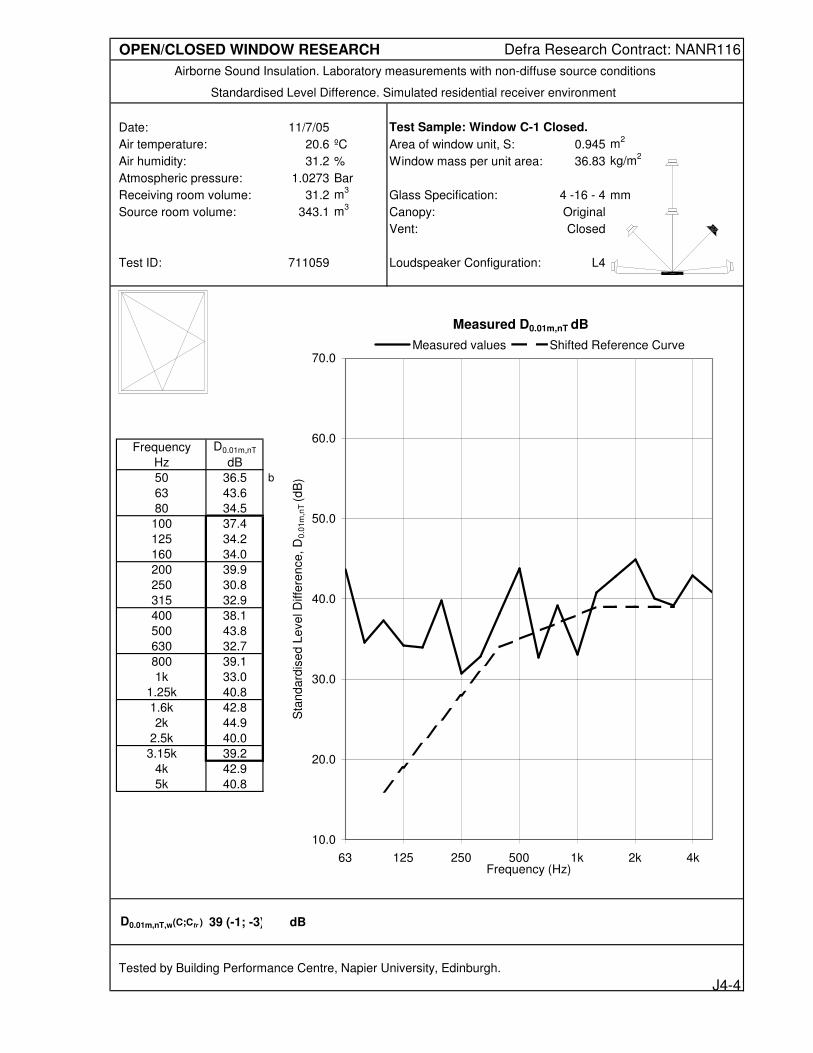
OPEN/CLOSED WINDOW RESEARCH Defra Research Contract: NANR116
Airborne Sound Insulation. Laboratory measurements with non-diffuse source conditions
Standardised Level Difference. Simulated residential receiver environment
Date: 11/7/05 Test Sample: Window C-1 Closed.
Air temperature: 20.6 ºC Area of window unit, S: 0.945 m2
Air humidity: 31.2 % Window mass per unit area: 36.83 kg/m2
Atmospheric pressure: 1.0273 Bar
Receiving room volume: 31.2 m3
Glass Specification: 4 -16 - 4 mm
Source room volume: 343.1 m3
Canopy: Original
Vent: Closed
Test ID: 711059 Loudspeaker Configuration: L4
Frequency D0.01m,nT
Hz dB
50 36.5 b
63 43.6
80 34.5
100 37.4 16
125 34.2 19
160 34.0 22
200 39.9 25
250 30.8 28
315 32.9 31
400 38.1 34
500 43.8 35
630 32.7 36
800 39.1 37
1k 33.0 38
1.25k 40.8 39
1.6k 42.8 39
2k 44.9 39
2.5k 40.0 39
3.15k 39.2 39
4k 42.9
5k 40.8
D0.01m,nT,w(C;Ctr ) 39 (-1; -3) dB
Tested by Building Performance Centre, Napier University, Edinburgh.
Measured D0.01m,nT dB
10.0
20.0
30.0
40.0
50.0
60.0
70.0
63 125 250 500 1k 2k 4kFrequency (Hz)
Sta
nd
ard
ise
d L
eve
l D
iffe
ren
ce
, D
0.0
1m
,nT
(d
B)
Measured values Shifted Reference Curve
J4-4
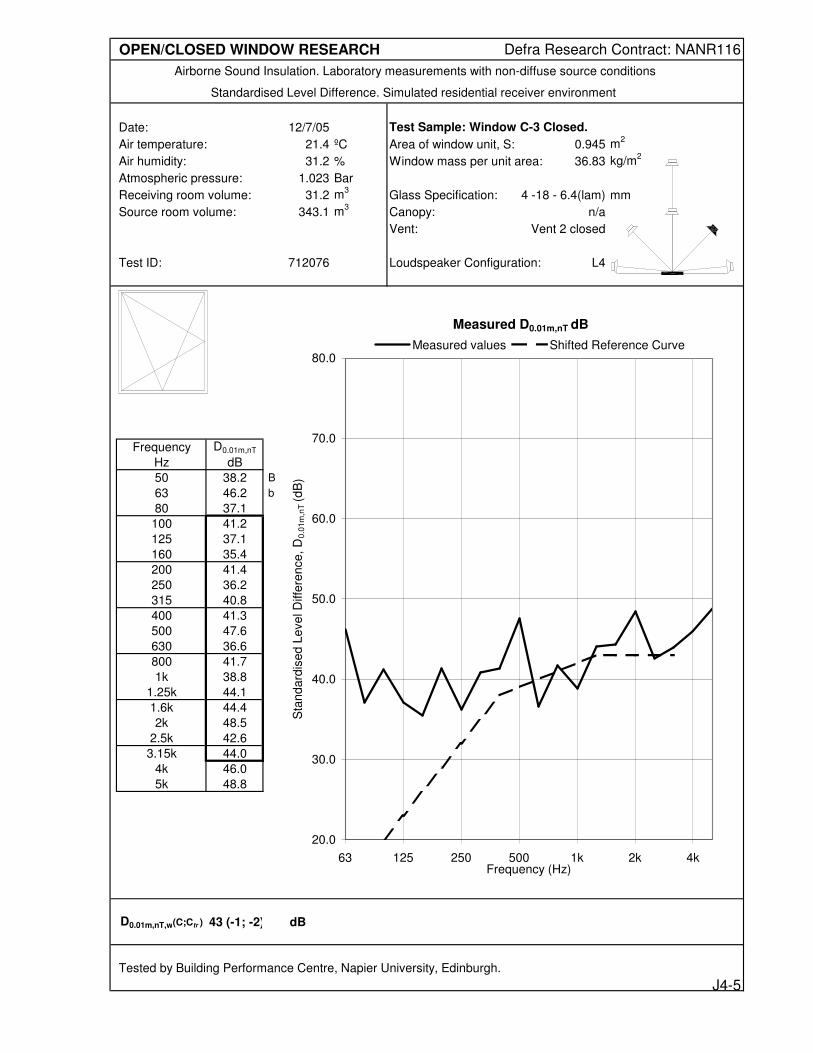
OPEN/CLOSED WINDOW RESEARCH Defra Research Contract: NANR116
Airborne Sound Insulation. Laboratory measurements with non-diffuse source conditions
Standardised Level Difference. Simulated residential receiver environment
Date: 12/7/05 Test Sample: Window C-3 Closed.
Air temperature: 21.4 ºC Area of window unit, S: 0.945 m2
Air humidity: 31.2 % Window mass per unit area: 36.83 kg/m2
Atmospheric pressure: 1.023 Bar
Receiving room volume: 31.2 m3
Glass Specification: 4 -18 - 6.4(lam) mm
Source room volume: 343.1 m3
Canopy: n/a
Vent: Vent 2 closed
Test ID: 712076 Loudspeaker Configuration: L4
Frequency D0.01m,nT
Hz dB
50 38.2 B
63 46.2 b
80 37.1
100 41.2 20
125 37.1 23
160 35.4 26
200 41.4 29
250 36.2 32
315 40.8 35
400 41.3 38
500 47.6 39
630 36.6 40
800 41.7 41
1k 38.8 42
1.25k 44.1 43
1.6k 44.4 43
2k 48.5 43
2.5k 42.6 43
3.15k 44.0 43
4k 46.0
5k 48.8
D0.01m,nT,w(C;Ctr ) 43 (-1; -2) dB
Tested by Building Performance Centre, Napier University, Edinburgh.
Measured D0.01m,nT dB
20.0
30.0
40.0
50.0
60.0
70.0
80.0
63 125 250 500 1k 2k 4kFrequency (Hz)
Sta
nd
ard
ise
d L
eve
l D
iffe
ren
ce
, D
0.0
1m
,nT
(d
B)
Measured values Shifted Reference Curve
J4-5

OPEN/CLOSED WINDOW RESEARCH Defra Research Contract: NANR116
Airborne Sound Insulation. Laboratory measurements with non-diffuse source conditions
Standardised Level Difference. Simulated residential receiver environment
Date: 18/7/2005 Test Sample: Window E Closed.
Air temperature: 20.3 ºC Area of window unit, S: 0.63 m2
Air humidity: 31.2 % Window mass per unit area: 26.83 kg/m2
Atmospheric pressure: 0.9956 Bar
Receiving room volume: 31.2 m3
Glass Specification: 4 -16 - 4 mm
Source room volume: 343.1 m3
Canopy: n/a
Vent: n/a
Test ID: 718014 Loudspeaker Configuration: L4
Frequency D0.01m,nT
Hz dB
50 44.0 B
63 41.4
80 36.5
100 41.5 27
125 39.9 30
160 40.6 33
200 31.8 36
250 37.5 39
315 46.1 42
400 49.4 45
500 48.6 46
630 48.9 47
800 53.6 48
1k 55.9 49
1.25k 56.1 50
1.6k 53.4 50
2k 50.9 50
2.5k 51.2 50
3.15k 53.1 50
4k 54.6
5k 57.7
D0.01m,nT,w(C;Ctr ) 50 (-2; -5) dB
Tested by Building Performance Centre, Napier University, Edinburgh.
Measured D0.01m,nT dB
20.0
30.0
40.0
50.0
60.0
70.0
80.0
63 125 250 500 1k 2k 4kFrequency (Hz)
Sta
nd
ard
ise
d L
eve
l D
iffe
ren
ce
, D
0.0
1m
,nT
(d
B)
Measured values Shifted Reference Curve
J4-6

OPEN/CLOSED WINDOW RESEARCH Defra Research Contract: NANR116
Airborne Sound Insulation. Laboratory measurements with non-diffuse source conditions
Standardised Level Difference. Simulated residential receiver environment
Date: 19/7/2005 Test Sample: Window F Closed.
Air temperature: 20.3 ºC Area of window unit, S: 0.63 m2
Air humidity: 31.2 % Window mass per unit area: 26.83 kg/m2
Atmospheric pressure: 1.0023 Bar
Receiving room volume: 31.2 m3
Glass Specification: 4 -16 - 4 mm
Source room volume: 343.1 m3
Canopy: n/a
Vent: n/a
Test ID: 719028 Loudspeaker Configuration: L4
Frequency D0.01m,nT
Hz dB
50 44.6 B
63 45.0
80 32.8
100 40.3 26
125 40.3 29
160 37.1 32
200 27.7 35
250 38.2 38
315 45.3 41
400 46.1 44
500 46.5 45
630 45.7 46
800 47.7 47
1k 54.8 48
1.25k 52.6 49
1.6k 53.5 49
2k 55.1 49
2.5k 52.9 49
3.15k 49.2 49
4k 49.2
5k 53.2
D0.01m,nT,w(C;Ctr ) 49 (-3; -7) dB
Tested by Building Performance Centre, Napier University, Edinburgh.
Measured D0.01m,nT dB
20.0
30.0
40.0
50.0
60.0
70.0
80.0
63 125 250 500 1k 2k 4kFrequency (Hz)
Sta
nd
ard
ise
d L
eve
l D
iffe
ren
ce
, D
0.0
1m
,nT
(d
B)
Measured values Shifted Reference Curve
J4-7

OPEN/CLOSED WINDOW RESEARCH Defra Research Contract: NANR116
Airborne Sound Insulation. Laboratory measurements with non-diffuse source conditions
Standardised Level Difference. Simulated residential receiver environment
Date: 20/7/2005 Test Sample: Window G Closed.
Air temperature: 20.3 ºC Area of window unit, S: 0.54 m2
Air humidity: 31.2 % Window mass per unit area: 33.33 kg/m2
Atmospheric pressure: 1.0032 Bar
Receiving room volume: 31.2 m3
Glass Specification: 4 -16 - 4 mm
Source room volume: 343.1 m3
Canopy: n/a
Vent: n/a
Test ID: 720028 Loudspeaker Configuration: L4
Frequency D0.01m,nT
Hz dB
50 36.7 b
63 40.0
80 36.6
100 44.2 23
125 40.9 26
160 38.0 29
200 36.7 32
250 32.7 35
315 44.0 38
400 49.0 41
500 48.6 42
630 44.3 43
800 44.0 44
1k 42.0 45
1.25k 54.4 46
1.6k 54.5 46
2k 53.9 46
2.5k 48.8 46
3.15k 44.8 46
4k 48.7
5k 48.7
D0.01m,nT,w(C;Ctr ) 46 (-1; -3) dB
Tested by Building Performance Centre, Napier University, Edinburgh.
Measured D0.01m,nT dB
20.0
30.0
40.0
50.0
60.0
70.0
80.0
63 125 250 500 1k 2k 4kFrequency (Hz)
Sta
nd
ard
ise
d L
eve
l D
iffe
ren
ce
, D
0.0
1m
,nT
(d
B)
Measured values Shifted Reference Curve
J4-8

OPEN/CLOSED WINDOW RESEARCH Defra Research Contract: NANR116
Airborne Sound Insulation. Laboratory measurements with non-diffuse source conditions
Standardised Level Difference. Simulated residential receiver environment
Date: 22/6/2005 Test Sample: Wall
Air temperature: 20.1 ºC Area of window unit, S: 8.64 m2
Air humidity: 31.2 % Window mass per unit area: 289.35 kg/m2
Atmospheric pressure: 1.0106 Bar
Receiving room volume: 31.2 m3
Glass Specification: 4 -16 - 4 mm
Source room volume: 343.1 m3
Canopy: n/a
Vent: n/a
Test ID: 622005 Loudspeaker Configuration: L5
Frequency D0.01m,nT
Hz dB
50 39.4
63 48.2
80 47.4
100 45.8 33
125 40.4 36
160 38.8 39
200 40.5 42
250 41.3 45
315 48.6 48
400 55.5 51
500 54.6 52
630 49.9 53
800 65.2 54
1k 62.8 55
1.25k 67.5 56
1.6k 65.9 56
2k 72.8 56
2.5k 73.4 b 56
3.15k 74.2 b 56
4k 76.4 B
5k 76.8 B
D0.01m,nT,w(C;Ctr ) 56 (-2; -6) dB
Tested by Building Performance Centre, Napier University, Edinburgh.
Measured D0.01m,nT dB
30.0
40.0
50.0
60.0
70.0
80.0
90.0
63 125 250 500 1k 2k 4kFrequency (Hz)
Sta
nd
ard
ise
d L
eve
l D
iffe
ren
ce
, D
0.0
1m
,nT
(d
B)
Measured values Shifted Reference Curve
J5-1

OPEN/CLOSED WINDOW RESEARCH Defra Research Contract: NANR116
Airborne Sound Insulation. Laboratory measurements with non-diffuse source conditions
Standardised Level Difference. Simulated residential receiver environment
Date: 28/6/2005 Test Sample: Window A-1 Closed.
Air temperature: 20.7 ºC Area of window unit, S: 2.52 m2
Air humidity: 31.2 % Window mass per unit area: 30.00 kg/m2
Atmospheric pressure: 1.0091 Bar
Receiving room volume: 31.2 m3
Glass Specification: 4 -16 - 4 mm
Source room volume: 343.1 m3
Canopy: n/a
Vent: n/a
Test ID: 628081 Loudspeaker Configuration: L5
Frequency D0.01m,nT
Hz dB
50 33.8
63 39.4
80 32.2
100 36.8 18
125 34.1 21
160 25.6 24
200 28.9 27
250 31.8 30
315 34.0 33
400 40.5 36
500 40.0 37
630 39.7 38
800 47.2 39
1k 46.6 40
1.25k 47.8 41
1.6k 41.8 41
2k 42.2 41
2.5k 42.5 41
3.15k 43.3 41
4k 50.2
5k 51.0
D0.01m,nT,w(C;Ctr ) 41 (-1; -3) dB
Tested by Building Performance Centre, Napier University, Edinburgh.
Measured D0.01m,nT dB
10.0
20.0
30.0
40.0
50.0
60.0
70.0
63 125 250 500 1k 2k 4kFrequency (Hz)
Sta
nd
ard
ise
d L
eve
l D
iffe
ren
ce
, D
0.0
1m
,nT
(d
B)
Measured values Shifted Reference Curve
J5-2

OPEN/CLOSED WINDOW RESEARCH Defra Research Contract: NANR116
Airborne Sound Insulation. Laboratory measurements with non-diffuse source conditions
Standardised Level Difference. Simulated residential receiver environment
Date: 5/7/05 Test Sample: Window B Closed.
Air temperature: 19.5 ºC Area of window unit, S: 1.26 m2
Air humidity: 31.2 % Window mass per unit area: 27.94 kg/m2
Atmospheric pressure: 0.9981 Bar
Receiving room volume: 31.2 m3
Glass Specification: 4 -16 - 4 mm
Source room volume: 343.1 m3
Canopy: n/a
Vent: n/a
Test ID: 705021 Loudspeaker Configuration: L5
Frequency D0.01m,nT
Hz dB
50 38.0
63 42.3
80 33.5
100 37.6 18
125 36.9 21
160 31.5 24
200 26.0 27
250 29.2 30
315 36.3 33
400 42.2 36
500 40.3 37
630 31.8 38
800 37.7 39
1k 40.6 40
1.25k 45.9 41
1.6k 46.2 41
2k 45.2 41
2.5k 46.0 41
3.15k 44.5 41
4k 51.5
5k 52.9
D0.01m,nT,w(C;Ctr ) 41 (-2; -5) dB
Tested by Building Performance Centre, Napier University, Edinburgh.
Measured D0.01m,nT dB
10.0
20.0
30.0
40.0
50.0
60.0
70.0
63 125 250 500 1k 2k 4kFrequency (Hz)
Sta
nd
ard
ise
d L
eve
l D
iffe
ren
ce
, D
0.0
1m
,nT
(d
B)
Measured values Shifted Reference Curve
J5-3

OPEN/CLOSED WINDOW RESEARCH Defra Research Contract: NANR116
Airborne Sound Insulation. Laboratory measurements with non-diffuse source conditions
Standardised Level Difference. Simulated residential receiver environment
Date: 11/7/05 Test Sample: Window C-1 Closed.
Air temperature: 20.6 ºC Area of window unit, S: 0.945 m2
Air humidity: 31.2 % Window mass per unit area: 36.83 kg/m2
Atmospheric pressure: 1.0276 Bar
Receiving room volume: 31.2 m3
Glass Specification: 4 -16 - 4 mm
Source room volume: 343.1 m3
Canopy: Original
Vent: Closed
Test ID: 711046 Loudspeaker Configuration: L5
Frequency D0.01m,nT
Hz dB
50 37.6 b
63 44.2
80 35.2
100 37.1 16
125 32.6 19
160 35.7 22
200 38.5 25
250 27.1 28
315 32.1 31
400 39.4 34
500 44.2 35
630 32.9 36
800 37.7 37
1k 33.6 38
1.25k 41.4 39
1.6k 43.3 39
2k 45.3 39
2.5k 42.7 39
3.15k 41.0 39
4k 41.7
5k 40.1
D0.01m,nT,w(C;Ctr ) 39 (-1; -3) dB
Tested by Building Performance Centre, Napier University, Edinburgh.
Measured D0.01m,nT dB
10.0
20.0
30.0
40.0
50.0
60.0
70.0
63 125 250 500 1k 2k 4kFrequency (Hz)
Sta
nd
ard
ise
d L
eve
l D
iffe
ren
ce
, D
0.0
1m
,nT
(d
B)
Measured values Shifted Reference Curve
J5-4

OPEN/CLOSED WINDOW RESEARCH Defra Research Contract: NANR116
Airborne Sound Insulation. Laboratory measurements with non-diffuse source conditions
Standardised Level Difference. Simulated residential receiver environment
Date: 13/7/2005 Test Sample: Window D-1 Closed.
Air temperature: 21.8 ºC Area of window unit, S: 1.26 m2
Air humidity: 31.2 % Window mass per unit area: 27.94 kg/m2
Atmospheric pressure: 1.018 Bar
Receiving room volume: 31.2 m3
Glass Specification: 4 -16 - 4 mm
Source room volume: 343.1 m3
Canopy: n/a
Vent: n/a
Test ID: 713029 Loudspeaker Configuration: L5
Frequency D0.01m,nT
Hz dB
50 30.6 B
63 43.6 b
80 34.7
100 39.2 17
125 38.3 20
160 32.6 23
200 37.6 26
250 29.3 29
315 41.9 32
400 43.5 35
500 44.2 36
630 40.2 37
800 42.4 38
1k 36.9 39
1.25k 42.2 40
1.6k 41.2 40
2k 38.2 40
2.5k 38.6 40
3.15k 41.7 40
4k 47.4
5k 46.3
D0.01m,nT,w(C;Ctr ) 40 (-1; -2) dB
Tested by Building Performance Centre, Napier University, Edinburgh.
Measured D0.01m,nT dB
10.0
20.0
30.0
40.0
50.0
60.0
70.0
63 125 250 500 1k 2k 4kFrequency (Hz)
Sta
nd
ard
ise
d L
eve
l D
iffe
ren
ce
, D
0.0
1m
,nT
(d
B)
Measured values Shifted Reference Curve
J5-5

OPEN/CLOSED WINDOW RESEARCH Defra Research Contract: NANR116
Airborne Sound Insulation. Laboratory measurements with non-diffuse source conditions
Standardised Level Difference. Simulated residential receiver environment
Date: 20/7/2005 Test Sample: Window G Closed.
Air temperature: 20.3 ºC Area of window unit, S: 0.54 m2
Air humidity: 31.2 % Window mass per unit area: 33.33 kg/m2
Atmospheric pressure: 1.0032 Bar
Receiving room volume: 31.2 m3
Glass Specification: 4 -16 - 4 mm
Source room volume: 343.1 m3
Canopy: n/a
Vent: n/a
Test ID: 720027 Loudspeaker Configuration: L5
Frequency D0.01m,nT
Hz dB
50 43.4 B
63 39.7
80 38.2
100 41.9 26
125 43.2 29
160 38.4 32
200 39.4 35
250 35.1 38
315 46.6 41
400 49.2 44
500 49.7 45
630 48.8 46
800 41.7 47
1k 46.0 48
1.25k 57.7 49
1.6k 55.9 49
2k 57.1 49
2.5k 53.6 49
3.15k 45.7 49
4k 49.2
5k 50.2
D0.01m,nT,w(C;Ctr ) 49 (-2; -4) dB
Tested by Building Performance Centre, Napier University, Edinburgh.
Measured D0.01m,nT dB
20.0
30.0
40.0
50.0
60.0
70.0
80.0
63 125 250 500 1k 2k 4kFrequency (Hz)
Sta
nd
ard
ise
d L
eve
l D
iffe
ren
ce
, D
0.0
1m
,nT
(d
B)
Measured values Shifted Reference Curve
J5-6

OPEN/CLOSED WINDOW RESEARCH Defra Research Contract: NANR116
Airborne Sound Insulation. Laboratory measurements with non-diffuse source conditions
Standardised Level Difference. Simulated residential receiver environment
Date: 22/6/2005 Test Sample: Wall
Air temperature: 20.1 ºC Area of window unit, S: 8.64 m2
Air humidity: 31.2 % Window mass per unit area: 289.35 kg/m2
Atmospheric pressure: 1.0106 Bar
Receiving room volume: 31.2 m3
Glass Specification: 4 -16 - 4 mm
Source room volume: 343.1 m3
Canopy: n/a
Vent: n/a
Test ID: 622006 Loudspeaker Configuration: L6
Frequency D0.01m,nT
Hz dB
50 32.3
63 49.9
80 48.1
100 48.3 32
125 41.8 35
160 39.8 38
200 43.2 41
250 42.2 44
315 41.6 47
400 44.2 50
500 55.5 51
630 62.9 52
800 67.6 53
1k 61.7 54
1.25k 66.4 55
1.6k 69.2 55
2k 72.1 b 55
2.5k 72.2 b 55
3.15k 73.2 b 55
4k 75.3 B
5k 75.9 B
D0.01m,nT,w(C;Ctr ) 55 (-2; -5) dB
Tested by Building Performance Centre, Napier University, Edinburgh.
Measured D0.01m,nT dB
30.0
40.0
50.0
60.0
70.0
80.0
90.0
63 125 250 500 1k 2k 4kFrequency (Hz)
Sta
nd
ard
ise
d L
eve
l D
iffe
ren
ce
, D
0.0
1m
,nT
(d
B)
Measured values Shifted Reference Curve
J6-1

OPEN/CLOSED WINDOW RESEARCH Defra Research Contract: NANR116
Airborne Sound Insulation. Laboratory measurements with non-diffuse source conditions
Standardised Level Difference. Simulated residential receiver environment
Date: 28/6/2005 Test Sample: Window A-1 Closed.
Air temperature: 20.5 ºC Area of window unit, S: 2.52 m2
Air humidity: 31.2 % Window mass per unit area: 30.00 kg/m2
Atmospheric pressure: 1.0109 Bar
Receiving room volume: 31.2 m3
Glass Specification: 4 -16 - 4 mm
Source room volume: 343.1 m3
Canopy: n/a
Vent: n/a
Test ID: 628017 Loudspeaker Configuration: L6
Frequency D0.01m,nT
Hz dB
50 31.9
63 40.0
80 32.7
100 38.6 15
125 34.4 18
160 26.6 21
200 22.6 24
250 26.9 27
315 31.2 30
400 26.8 33
500 40.7 34
630 49.7 35
800 46.2 36
1k 42.1 37
1.25k 45.9 38
1.6k 37.7 38
2k 38.6 38
2.5k 44.5 38
3.15k 43.4 38
4k 45.7 b
5k 34.8 b
D0.01m,nT,w(C;Ctr ) 38 (-2; -4) dB
Tested by Building Performance Centre, Napier University, Edinburgh.
Measured D0.01m,nT dB
10.0
20.0
30.0
40.0
50.0
60.0
70.0
63 125 250 500 1k 2k 4kFrequency (Hz)
Sta
nd
ard
ise
d L
eve
l D
iffe
ren
ce
, D
0.0
1m
,nT
(d
B)
Measured values Shifted Reference Curve
J6-2

OPEN/CLOSED WINDOW RESEARCH Defra Research Contract: NANR116
Airborne Sound Insulation. Laboratory measurements with non-diffuse source conditions
Standardised Level Difference. Simulated residential receiver environment
Date: 5/7/05 Test Sample: Window B Closed.
Air temperature: 19.5 ºC Area of window unit, S: 1.26 m2
Air humidity: 31.2 % Window mass per unit area: 27.94 kg/m2
Atmospheric pressure: 0.998 Bar
Receiving room volume: 31.2 m3
Glass Specification: 4 -16 - 4 mm
Source room volume: 343.1 m3
Canopy: n/a
Vent: n/a
Test ID: 705026 Loudspeaker Configuration: L6
Frequency D0.01m,nT
Hz dB
50 33.9
63 42.4
80 34.2
100 38.2 20
125 38.0 23
160 32.9 26
200 26.5 29
250 37.0 32
315 37.2 35
400 36.5 38
500 44.5 39
630 39.9 40
800 41.5 41
1k 37.8 42
1.25k 49.2 43
1.6k 46.9 43
2k 47.9 43
2.5k 50.7 43
3.15k 45.3 43
4k 45.0 b
5k 34.2 b
D0.01m,nT,w(C;Ctr ) 43 (-2; -5) dB
Tested by Building Performance Centre, Napier University, Edinburgh.
Measured D0.01m,nT dB
20.0
30.0
40.0
50.0
60.0
70.0
80.0
63 125 250 500 1k 2k 4kFrequency (Hz)
Sta
nd
ard
ise
d L
eve
l D
iffe
ren
ce
, D
0.0
1m
,nT
(d
B)
Measured values Shifted Reference Curve
J6-3

OPEN/CLOSED WINDOW RESEARCH Defra Research Contract: NANR116
Airborne Sound Insulation. Laboratory measurements with non-diffuse source conditions
Standardised Level Difference. Simulated residential receiver environment
Date: 11/7/05 Test Sample: Window C-1 Closed.
Air temperature: 20.6 ºC Area of window unit, S: 0.945 m2
Air humidity: 31.2 % Window mass per unit area: 36.83 kg/m2
Atmospheric pressure: 1.0279 Bar
Receiving room volume: 31.2 m3
Glass Specification: 4 -16 - 4 mm
Source room volume: 343.1 m3
Canopy: Original
Vent: Closed
Test ID: 711014 Loudspeaker Configuration: L6
Frequency D0.01m,nT
Hz dB
50 32.0 B
63 44.7 b
80 36.0
100 38.3 17
125 34.5 20
160 36.5 23
200 37.3 26
250 31.3 29
315 39.2 32
400 31.8 35
500 37.9 36
630 37.4 37
800 46.9 38
1k 34.9 39
1.25k 44.9 40
1.6k 43.7 40
2k 46.0 40
2.5k 45.2 40
3.15k 40.0 40
4k 43.3 b
5k 36.1 b
D0.01m,nT,w(C;Ctr ) 40 (-1; -2) dB
Tested by Building Performance Centre, Napier University, Edinburgh.
Measured D0.01m,nT dB
10.0
20.0
30.0
40.0
50.0
60.0
70.0
63 125 250 500 1k 2k 4kFrequency (Hz)
Sta
nd
ard
ise
d L
eve
l D
iffe
ren
ce
, D
0.0
1m
,nT
(d
B)
Measured values Shifted Reference Curve
J6-4

OPEN/CLOSED WINDOW RESEARCH Defra Research Contract: NANR116
Airborne Sound Insulation. Laboratory measurements with non-diffuse source conditions
Standardised Level Difference. Simulated residential receiver environment
Date: 17/7/2005 Test Sample: Window C-3 Closed.
Air temperature: 21 ºC Area of window unit, S: 0.995 m2
Air humidity: 31.2 % Window mass per unit area: 39.20 kg/m2
Atmospheric pressure: 1.0044 Bar
Receiving room volume: 31.2 m3
Glass Specification: 4 -18 - 6.4(lam) mm
Source room volume: 343.1 m3
Canopy: n/a
Vent: Blocked
Test ID: 717073 Loudspeaker Configuration: L6
Frequency D0.01m,nT
Hz dB
50 35.7 b
63 45.4
80 37.7
100 41.3 20
125 37.9 23
160 41.5 26
200 43.8 29
250 43.1 32
315 45.8 35
400 34.3 38
500 35.3 39
630 38.8 40
800 46.2 41
1k 48.4 42
1.25k 50.6 43
1.6k 50.1 43
2k 48.7 43
2.5k 41.0 43
3.15k 42.9 43
4k 49.3
5k 57.9
D0.01m,nT,w(C;Ctr ) 43 (-1; -1) dB
Tested by Building Performance Centre, Napier University, Edinburgh.
Measured D0.01m,nT dB
20.0
30.0
40.0
50.0
60.0
70.0
80.0
63 125 250 500 1k 2k 4kFrequency (Hz)
Sta
nd
ard
ise
d L
eve
l D
iffe
ren
ce
, D
0.0
1m
,nT
(d
B)
Measured values Shifted Reference Curve
J6-5

OPEN/CLOSED WINDOW RESEARCH Defra Research Contract: NANR116
Airborne Sound Insulation. Laboratory measurements with non-diffuse source conditions
Standardised Level Difference. Simulated residential receiver environment
Date: 13/7/2005 Test Sample: Window D-1 Closed.
Air temperature: 21.8 ºC Area of window unit, S: 1.26 m2
Air humidity: 31.2 % Window mass per unit area: 27.94 kg/m2
Atmospheric pressure: 1.0185 Bar
Receiving room volume: 31.2 m3
Glass Specification: 4 -16 - 4 mm
Source room volume: 343.1 m3
Canopy: n/a
Vent: n/a
Test ID: 713015 Loudspeaker Configuration: L6
Frequency D0.01m,nT
Hz dB
50 29.1 B
63 43.2 b
80 35.2
100 39.8 18
125 38.6 21
160 34.0 24
200 37.9 27
250 36.4 30
315 37.9 33
400 32.9 36
500 37.3 37
630 38.8 38
800 46.1 39
1k 38.3 40
1.25k 40.1 41
1.6k 39.5 41
2k 46.6 41
2.5k 45.7 41
3.15k 46.5 41
4k 41.6
5k 36.7 b
D0.01m,nT,w(C;Ctr ) 41 (-1; -2) dB
Tested by Building Performance Centre, Napier University, Edinburgh.
Measured D0.01m,nT dB
10.0
20.0
30.0
40.0
50.0
60.0
70.0
63 125 250 500 1k 2k 4kFrequency (Hz)
Sta
nd
ard
ise
d L
eve
l D
iffe
ren
ce
, D
0.0
1m
,nT
(d
B)
Measured values Shifted Reference Curve
J6-6

OPEN/CLOSED WINDOW RESEARCH Defra Research Contract: NANR116
Airborne Sound Insulation. Laboratory measurements with non-diffuse source conditions
Standardised Level Difference. Simulated residential receiver environment
Date: 18/7/2005 Test Sample: Window E Closed.
Air temperature: 20.5 ºC Area of window unit, S: 0.63 m2
Air humidity: 31.2 % Window mass per unit area: 26.83 kg/m2
Atmospheric pressure: 0.9959 Bar
Receiving room volume: 31.2 m3
Glass Specification: 4 -16 - 4 mm
Source room volume: 343.1 m3
Canopy: n/a
Vent: n/a
Test ID: 718028 Loudspeaker Configuration: L6
Frequency D0.01m,nT
Hz dB
50 34.2
63 40.1
80 36.4
100 43.4 27
125 43.1 30
160 39.2 33
200 31.1 36
250 43.2 39
315 50.2 42
400 46.2 45
500 51.0 46
630 52.6 47
800 50.1 48
1k 53.6 49
1.25k 54.7 50
1.6k 58.0 50
2k 51.9 50
2.5k 48.1 50
3.15k 47.1 50
4k 56.9
5k 59.4
D0.01m,nT,w(C;Ctr ) 50 (-2; -5) dB
Tested by Building Performance Centre, Napier University, Edinburgh.
Measured D0.01m,nT dB
20.0
30.0
40.0
50.0
60.0
70.0
80.0
63 125 250 500 1k 2k 4kFrequency (Hz)
Sta
nd
ard
ise
d L
eve
l D
iffe
ren
ce
, D
0.0
1m
,nT
(d
B)
Measured values Shifted Reference Curve
J6-7

OPEN/CLOSED WINDOW RESEARCH Defra Research Contract: NANR116
Airborne Sound Insulation. Laboratory measurements with non-diffuse source conditions
Standardised Level Difference. Simulated residential receiver environment
Date: 19/7/2005 Test Sample: Window F Closed.
Air temperature: 19.9 ºC Area of window unit, S: 0.63 m2
Air humidity: 31.2 % Window mass per unit area: 26.83 kg/m2
Atmospheric pressure: 1.0019 Bar
Receiving room volume: 31.2 m3
Glass Specification: 4 -16 - 4 mm
Source room volume: 343.1 m3
Canopy: n/a
Vent: n/a
Test ID: 719001 Loudspeaker Configuration: L6
Frequency D0.01m,nT
Hz dB
50 35.7
63 45.1
80 34.7
100 40.1 24
125 41.2 27
160 37.0 30
200 27.9 33
250 43.9 36
315 45.3 39
400 40.3 42
500 46.4 43
630 45.5 44
800 46.5 45
1k 48.0 46
1.25k 54.1 47
1.6k 59.1 47
2k 54.0 47
2.5k 51.7 47
3.15k 48.2 47
4k 50.3
5k 54.1
D0.01m,nT,w(C;Ctr ) 47 (-2; -5) dB
Tested by Building Performance Centre, Napier University, Edinburgh.
Measured D0.01m,nT dB
20.0
30.0
40.0
50.0
60.0
70.0
80.0
63 125 250 500 1k 2k 4kFrequency (Hz)
Sta
nd
ard
ise
d L
eve
l D
iffe
ren
ce
, D
0.0
1m
,nT
(d
B)
Measured values Shifted Reference Curve
J6-8

OPEN/CLOSED WINDOW RESEARCH Defra Research Contract: NANR116
Airborne Sound Insulation. Laboratory measurements with non-diffuse source conditions
Standardised Level Difference. Simulated residential receiver environment
Date: 20/7/2005 Test Sample: Window G Closed.
Air temperature: 20.3 ºC Area of window unit, S: 0.54 m2
Air humidity: 31.2 % Window mass per unit area: 33.33 kg/m2
Atmospheric pressure: 1.0032 Bar
Receiving room volume: 31.2 m3
Glass Specification: 4 -16 - 4 mm
Source room volume: 343.1 m3
Canopy: n/a
Vent: Blocked
Test ID: 720001 Loudspeaker Configuration: L6
Frequency D0.01m,nT
Hz dB
50 35.2
63 40.6
80 37.9
100 43.9 25
125 43.7 28
160 38.6 31
200 38.8 34
250 38.1 37
315 48.2 40
400 46.9 43
500 46.6 44
630 41.9 45
800 50.0 46
1k 46.7 47
1.25k 56.7 48
1.6k 53.4 48
2k 51.0 48
2.5k 46.9 48
3.15k 45.4 48
4k 52.2
5k 55.2
D0.01m,nT,w(C;Ctr ) 48 (-1; -2) dB
Tested by Building Performance Centre, Napier University, Edinburgh.
Measured D0.01m,nT dB
20.0
30.0
40.0
50.0
60.0
70.0
80.0
63 125 250 500 1k 2k 4kFrequency (Hz)
Sta
nd
ard
ise
d L
eve
l D
iffe
ren
ce
, D
0.0
1m
,nT
(d
B)
Measured values Shifted Reference Curve
J6-9

OPEN/CLOSED WINDOW RESEARCH Defra Research Contract: NANR116
Airborne Sound Insulation. Laboratory measurements with non-diffuse source conditions
Standardised Level Difference. Simulated residential receiver environment
Date: 22/6/2005 Test Sample: Wall
Air temperature: 20.2 ºC Area of window unit, S: 8.64 m2
Air humidity: 31.2 % Window mass per unit area: 289.35 kg/m2
Atmospheric pressure: 1.0103 Bar
Receiving room volume: 31.2 m3
Glass Specification: 4 -16 - 4 mm
Source room volume: 343.1 m3
Canopy: n/a
Vent: n/a
Test ID: 622007 Loudspeaker Configuration: Line
Frequency D0.01m,nT
Hz dB
50 44.5
63 55.5
80 46.8
100 48.5 36
125 40.8 39
160 37.2 42
200 39.2 45
250 46.4 48
315 54.3 51
400 60.0 54
500 60.0 55
630 56.5 56
800 66.8 57
1k 63.9 58
1.25k 68.4 59
1.6k 71.4 59
2k 73.7 b 59
2.5k 74.1 b 59
3.15k 74.4 b 59
4k 77.6 B
5k 77.9 B
D0.01m,nT,w(C;Ctr ) 59 (-4; -8) dB
Tested by Building Performance Centre, Napier University, Edinburgh.
Measured D0.01m,nT dB
30.0
40.0
50.0
60.0
70.0
80.0
90.0
63 125 250 500 1k 2k 4kFrequency (Hz)
Sta
nd
ard
ise
d L
eve
l D
iffe
ren
ce
, D
0.0
1m
,nT
(d
B)
Measured values Shifted Reference Curve
J7-1

OPEN/CLOSED WINDOW RESEARCH Defra Research Contract: NANR116
Airborne Sound Insulation. Laboratory measurements with non-diffuse source conditions
Standardised Level Difference. Simulated residential receiver environment
Date: 28/6/2005 Test Sample: Window A-1 Closed.
Air temperature: 20.7 ºC Area of window unit, S: 2.52 m2
Air humidity: 31.2 % Window mass per unit area: 30.00 kg/m2
Atmospheric pressure: 1.009 Bar
Receiving room volume: 31.2 m3
Glass Specification: 4 -16 - 4 mm
Source room volume: 343.1 m3
Canopy: n/a
Vent: n/a
Test ID: 628097 Loudspeaker Configuration: Line
Frequency D0.01m,nT
Hz dB
50 34.5
63 40.3
80 32.4
100 39.3 16
125 33.6 19
160 24.8 22
200 27.4 25
250 34.7 28
315 34.7 31
400 37.4 34
500 43.3 35
630 43.7 36
800 47.5 37
1k 45.9 38
1.25k 41.5 39
1.6k 35.5 39
2k 36.7 39
2.5k 39.3 39
3.15k 42.7 39
4k 49.0
5k 47.5
D0.01m,nT,w(C;Ctr ) 39 (-1; -2) dB
Tested by Building Performance Centre, Napier University, Edinburgh.
Measured D0.01m,nT dB
10.0
20.0
30.0
40.0
50.0
60.0
70.0
63 125 250 500 1k 2k 4kFrequency (Hz)
Sta
nd
ard
ise
d L
eve
l D
iffe
ren
ce
, D
0.0
1m
,nT
(d
B)
Measured values Shifted Reference Curve
J7-2
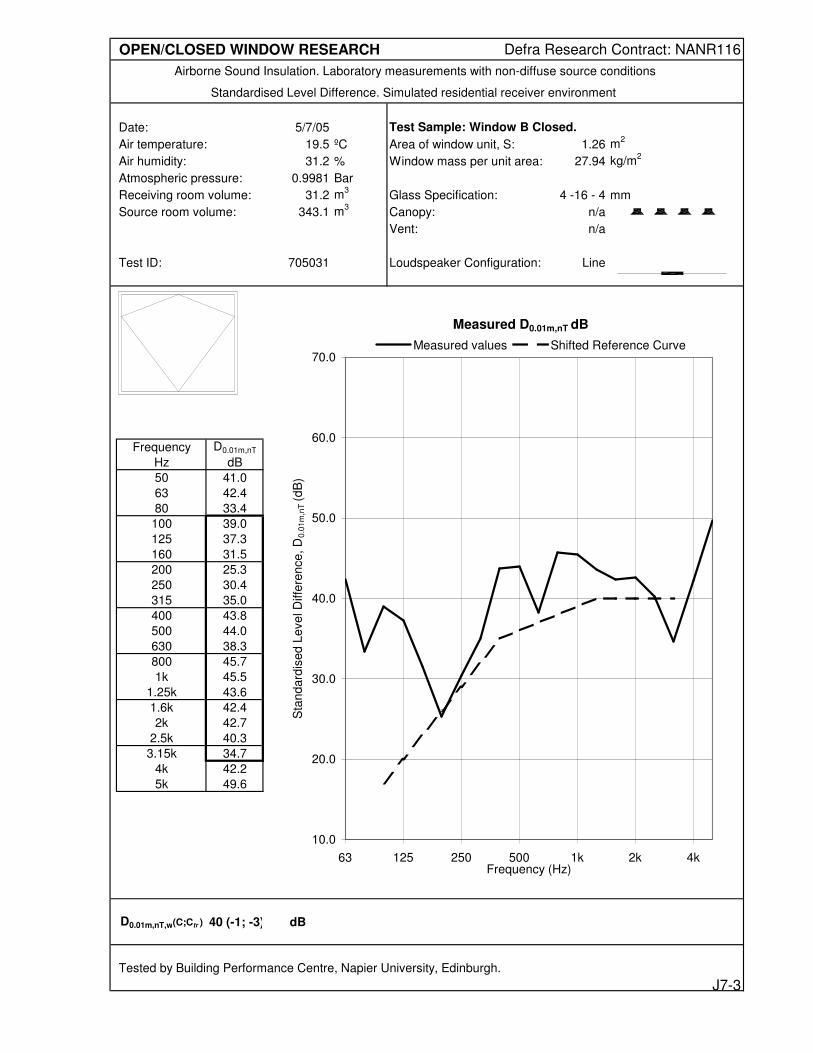
OPEN/CLOSED WINDOW RESEARCH Defra Research Contract: NANR116
Airborne Sound Insulation. Laboratory measurements with non-diffuse source conditions
Standardised Level Difference. Simulated residential receiver environment
Date: 5/7/05 Test Sample: Window B Closed.
Air temperature: 19.5 ºC Area of window unit, S: 1.26 m2
Air humidity: 31.2 % Window mass per unit area: 27.94 kg/m2
Atmospheric pressure: 0.9981 Bar
Receiving room volume: 31.2 m3
Glass Specification: 4 -16 - 4 mm
Source room volume: 343.1 m3
Canopy: n/a
Vent: n/a
Test ID: 705031 Loudspeaker Configuration: Line
Frequency D0.01m,nT
Hz dB
50 41.0
63 42.4
80 33.4
100 39.0 17
125 37.3 20
160 31.5 23
200 25.3 26
250 30.4 29
315 35.0 32
400 43.8 35
500 44.0 36
630 38.3 37
800 45.7 38
1k 45.5 39
1.25k 43.6 40
1.6k 42.4 40
2k 42.7 40
2.5k 40.3 40
3.15k 34.7 40
4k 42.2
5k 49.6
D0.01m,nT,w(C;Ctr ) 40 (-1; -3) dB
Tested by Building Performance Centre, Napier University, Edinburgh.
Measured D0.01m,nT dB
10.0
20.0
30.0
40.0
50.0
60.0
70.0
63 125 250 500 1k 2k 4kFrequency (Hz)
Sta
nd
ard
ise
d L
eve
l D
iffe
ren
ce
, D
0.0
1m
,nT
(d
B)
Measured values Shifted Reference Curve
J7-3

OPEN/CLOSED WINDOW RESEARCH Defra Research Contract: NANR116
Airborne Sound Insulation. Laboratory measurements with non-diffuse source conditions
Standardised Level Difference. Simulated residential receiver environment
Date: 13/7/2005 Test Sample: Window D-1 Closed.
Air temperature: 21.8 ºC Area of window unit, S: 1.26 m2
Air humidity: 31.2 % Window mass per unit area: 27.94 kg/m2
Atmospheric pressure: 1.0175 Bar
Receiving room volume: 31.2 m3
Glass Specification: 4 -16 - 4 mm
Source room volume: 343.1 m3
Canopy: n/a
Vent: n/a
Test ID: 713057 Loudspeaker Configuration: Line
Frequency D0.01m,nT
Hz dB
50 34.7 b
63 43.8
80 34.5
100 40.2 16
125 38.2 19
160 32.9 22
200 37.2 25
250 29.5 28
315 42.3 31
400 42.7 34
500 36.5 35
630 37.3 36
800 38.1 37
1k 37.7 38
1.25k 42.8 39
1.6k 40.5 39
2k 43.1 39
2.5k 37.6 39
3.15k 42.1 39
4k 43.7
5k 46.8
D0.01m,nT,w(C;Ctr ) 39 ( 0; -1) dB
Tested by Building Performance Centre, Napier University, Edinburgh.
Measured D0.01m,nT dB
10.0
20.0
30.0
40.0
50.0
60.0
70.0
63 125 250 500 1k 2k 4kFrequency (Hz)
Sta
nd
ard
ise
d L
eve
l D
iffe
ren
ce
, D
0.0
1m
,nT
(d
B)
Measured values Shifted Reference Curve
J7-4

OPEN/CLOSED WINDOW RESEARCH Defra Research Contract: NANR116
Airborne Sound Insulation. Laboratory measurements with non-diffuse source conditions
Standardised Level Difference. Simulated residential receiver environment
Date: 18/7/2005 Test Sample: Window E Closed.
Air temperature: 20.5 ºC Area of window unit, S: 0.63 m2
Air humidity: 31.2 % Window mass per unit area: 26.83 kg/m2
Atmospheric pressure: 0.9959 Bar
Receiving room volume: 31.2 m3
Glass Specification: 4 -16 - 4 mm
Source room volume: 343.1 m3
Canopy: n/a
Vent: n/a
Test ID: 718029 Loudspeaker Configuration: Line
Frequency D0.01m,nT
Hz dB
50 44.8 b
63 40.3
80 35.0
100 43.3 27
125 43.1 30
160 39.4 33
200 30.6 36
250 35.9 39
315 51.5 42
400 52.8 45
500 50.8 46
630 51.7 47
800 53.6 48
1k 50.5 49
1.25k 55.0 50
1.6k 54.8 50
2k 51.3 50
2.5k 51.7 50
3.15k 48.2 50
4k 50.5
5k 58.9
D0.01m,nT,w(C;Ctr ) 50 (-3; -6) dB
Tested by Building Performance Centre, Napier University, Edinburgh.
Measured D0.01m,nT dB
20.0
30.0
40.0
50.0
60.0
70.0
80.0
63 125 250 500 1k 2k 4kFrequency (Hz)
Sta
nd
ard
ise
d L
eve
l D
iffe
ren
ce
, D
0.0
1m
,nT
(d
B)
Measured values Shifted Reference Curve
J7-5

OPEN/CLOSED WINDOW RESEARCH Defra Research Contract: NANR116
Airborne Sound Insulation. Laboratory measurements with non-diffuse source conditions
Standardised Level Difference. Simulated residential receiver environment
Date: 19/7/2005 Test Sample: Window F Closed.
Air temperature: 20.1 ºC Area of window unit, S: 0.63 m2
Air humidity: 31.2 % Window mass per unit area: 26.83 kg/m2
Atmospheric pressure: 1.0023 Bar
Receiving room volume: 31.2 m3
Glass Specification: 4 -16 - 4 mm
Source room volume: 343.1 m3
Canopy: n/a
Vent: n/a
Test ID: 719014 Loudspeaker Configuration: Line
Frequency D0.01m,nT
Hz dB
50 45.4 b
63 45.2
80 33.9
100 40.5 26
125 41.5 29
160 37.4 32
200 27.8 35
250 38.7 38
315 46.9 41
400 48.2 44
500 48.8 45
630 49.2 46
800 48.4 47
1k 51.2 48
1.25k 52.7 49
1.6k 54.8 49
2k 51.5 49
2.5k 48.0 49
3.15k 47.8 49
4k 44.8
5k 54.5
D0.01m,nT,w(C;Ctr ) 49 (-3; -7) dB
Tested by Building Performance Centre, Napier University, Edinburgh.
Measured D0.01m,nT dB
20.0
30.0
40.0
50.0
60.0
70.0
80.0
63 125 250 500 1k 2k 4kFrequency (Hz)
Sta
nd
ard
ise
d L
eve
l D
iffe
ren
ce
, D
0.0
1m
,nT
(d
B)
Measured values Shifted Reference Curve
J7-6

OPEN/CLOSED WINDOW RESEARCH Defra Research Contract: NANR116
Airborne Sound Insulation. Laboratory measurements with non-diffuse source conditions
Standardised Level Difference. Simulated residential receiver environment
Date: 11/7/05 Test Sample: Window C-1 Closed.
Air temperature: 20.6 ºC Area of window unit, S: 0.945 m2
Air humidity: 31.2 % Window mass per unit area: 36.83 kg/m2
Atmospheric pressure: 1.0273 Bar
Receiving room volume: 31.2 m3
Glass Specification: 4 -16 - 4 mm
Source room volume: 343.1 m3
Canopy: Original
Vent: Closed
Test ID: 711065 Loudspeaker Configuration: Line
Frequency D0.01m,nT
Hz dB
50 38.1 b
63 44.5
80 35.5
100 38.7 17
125 37.5 20
160 34.5 23
200 39.8 26
250 28.0 29
315 32.5 32
400 37.2 35
500 44.7 36
630 37.4 37
800 36.4 38
1k 37.7 39
1.25k 45.1 40
1.6k 45.2 40
2k 49.2 40
2.5k 41.3 40
3.15k 40.2 40
4k 42.1
5k 40.2
D0.01m,nT,w(C;Ctr ) 40 (-1; -3) dB
Tested by Building Performance Centre, Napier University, Edinburgh.
Measured D0.01m,nT dB
10.0
20.0
30.0
40.0
50.0
60.0
70.0
63 125 250 500 1k 2k 4kFrequency (Hz)
Sta
nd
ard
ise
d L
eve
l D
iffe
ren
ce
, D
0.0
1m
,nT
(d
B)
Measured values Shifted Reference Curve
J7-7

OPEN/CLOSED WINDOW RESEARCH Defra Research Contract: NANR116
Airborne Sound Insulation. Laboratory measurements with non-diffuse source conditions
Standardised Level Difference. Simulated residential receiver environment
Date: 28/6/2005 Test Sample: Window A-1 Untensioned.
Air temperature: 20.5 ºC Area of window unit, S: 2.52 m2
Air humidity: 31.2 % Window mass per unit area: 30.00 kg/m2
Atmospheric pressure: 1.0109 Bar
Receiving room volume: 31.2 m3
Glass Specification: 4 -16 - 4 mm
Source room volume: 343.1 m3
Canopy: n/a
Vent: n/a
Test ID: 628012 Loudspeaker Configuration: L1
Frequency D0.01m,nT
Hz dB
50 29.7
63 36.1
80 28.6
100 36.3 11
125 30.3 14
160 22.9 17
200 23.9 20
250 31.6 23
315 31.9 26
400 32.0 29
500 35.4 30
630 30.7 31
800 35.0 32
1k 29.5 33
1.25k 35.5 34
1.6k 37.6 34
2k 37.5 34
2.5k 33.8 34
3.15k 34.5 34
4k 37.7
5k 40.2
D0.01m,nT,w(C;Ctr ) 34 (-1; -2) dB
Tested by Building Performance Centre, Napier University, Edinburgh.
Measured D0.01m,nT dB
10.0
20.0
30.0
40.0
50.0
60.0
70.0
63 125 250 500 1k 2k 4kFrequency (Hz)
Sta
nd
ard
ise
d L
eve
l D
iffe
ren
ce
, D
0.0
1m
,nT
(d
B)
Measured values Shifted Reference Curve
K1-1

OPEN/CLOSED WINDOW RESEARCH Defra Research Contract: NANR116
Airborne Sound Insulation. Laboratory measurements with non-diffuse source conditions
Standardised Level Difference. Simulated residential receiver environment
Date: 28/6/2005 Test Sample: Window A-2 Untensioned.
Air temperature: 20.5 ºC Area of window unit, S: 2.52 m2
Air humidity: 31.2 % Window mass per unit area: 30.00 kg/m2
Atmospheric pressure: 1.0112 Bar
Receiving room volume: 31.2 m3
Glass Specification: 4 -16 - 4 mm
Source room volume: 343.1 m3
Canopy: n/a
Vent: n/a
Test ID: 628007 Loudspeaker Configuration: L1
Frequency D0.01m,nT
Hz dB
50 30.1
63 35.5
80 27.9
100 34.5 9
125 29.6 12
160 22.8 15
200 23.7 18
250 30.1 21
315 31.2 24
400 31.0 27
500 34.0 28
630 29.7 29
800 35.3 30
1k 27.1 31
1.25k 31.3 32
1.6k 34.1 32
2k 35.3 32
2.5k 31.3 32
3.15k 32.3 32
4k 34.7
5k 36.1
D0.01m,nT,w(C;Ctr ) 32 (-1; -2) dB
Tested by Building Performance Centre, Napier University, Edinburgh.
Measured D0.01m,nT dB
0.0
10.0
20.0
30.0
40.0
50.0
60.0
63 125 250 500 1k 2k 4kFrequency (Hz)
Sta
nd
ard
ise
d L
eve
l D
iffe
ren
ce
, D
0.0
1m
,nT
(d
B)
Measured values Shifted Reference Curve
K1-2

OPEN/CLOSED WINDOW RESEARCH Defra Research Contract: NANR116
Airborne Sound Insulation. Laboratory measurements with non-diffuse source conditions
Standardised Level Difference. Simulated residential receiver environment
Date: 28/6/2005 Test Sample: Window A-3 Untensioned.
Air temperature: 20.5 ºC Area of window unit, S: 2.52 m2
Air humidity: 31.2 % Window mass per unit area: 30.00 kg/m2
Atmospheric pressure: 1.0112 Bar
Receiving room volume: 31.2 m3
Glass Specification: 4 -16 - 4 mm
Source room volume: 343.1 m3
Canopy: n/a
Vent: n/a
Test ID: 628002 Loudspeaker Configuration: L1
Frequency D0.01m,nT
Hz dB
50 31.2
63 36.6
80 27.9
100 35.1 13
125 29.8 16
160 22.9 19
200 23.6 22
250 29.6 25
315 30.8 28
400 31.5 31
500 38.4 32
630 34.5 33
800 31.6 34
1k 34.8 35
1.25k 38.8 36
1.6k 39.1 36
2k 38.1 36
2.5k 37.0 36
3.15k 35.6 36
4k 40.1
5k 41.5
D0.01m,nT,w(C;Ctr ) 36 (-1; -3) dB
Tested by Building Performance Centre, Napier University, Edinburgh.
Measured D0.01m,nT dB
10.0
20.0
30.0
40.0
50.0
60.0
70.0
63 125 250 500 1k 2k 4kFrequency (Hz)
Sta
nd
ard
ise
d L
eve
l D
iffe
ren
ce
, D
0.0
1m
,nT
(d
B)
Measured values Shifted Reference Curve
K1-3

OPEN/CLOSED WINDOW RESEARCH Defra Research Contract: NANR116
Airborne Sound Insulation. Laboratory measurements with non-diffuse source conditions
Standardised Level Difference. Simulated residential receiver environment
Date: 5/7/05 Test Sample: Window B Untensioned.
Air temperature: 18.8 ºC Area of window unit, S: 1.26 m2
Air humidity: 31.2 % Window mass per unit area: 27.94 kg/m2
Atmospheric pressure: 0.9984 Bar
Receiving room volume: 31.2 m3
Glass Specification: 4 -16 - 4 mm
Source room volume: 343.1 m3
Canopy: n/a
Vent: n/a
Test ID: 705002 Loudspeaker Configuration: L1
Frequency D0.01m,nT
Hz dB
50 32.4
63 37.3
80 27.2
100 32.3 5
125 30.3 8
160 26.7 11
200 25.0 14
250 29.3 17
315 27.0 20
400 28.1 23
500 28.9 24
630 24.1 25
800 29.2 26
1k 23.0 27
1.25k 29.1 28
1.6k 29.8 28
2k 30.9 28
2.5k 27.4 28
3.15k 27.3 28
4k 35.0
5k 40.2
D0.01m,nT,w(C;Ctr ) 28 (-1; -1) dB
Tested by Building Performance Centre, Napier University, Edinburgh.
Measured D0.01m,nT dB
0.0
10.0
20.0
30.0
40.0
50.0
60.0
63 125 250 500 1k 2k 4kFrequency (Hz)
Sta
nd
ard
ise
d L
eve
l D
iffe
ren
ce
, D
0.0
1m
,nT
(d
B)
Measured values Shifted Reference Curve
K1-4

OPEN/CLOSED WINDOW RESEARCH Defra Research Contract: NANR116
Airborne Sound Insulation. Laboratory measurements with non-diffuse source conditions
Standardised Level Difference. Simulated residential receiver environment
Date: 11/7/05 Test Sample: Window C-1 Untensioned.
Air temperature: 20.4 ºC Area of window unit, S: 0.945 m2
Air humidity: 31.2 % Window mass per unit area: 36.83 kg/m2
Atmospheric pressure: 1.0282 Bar
Receiving room volume: 31.2 m3
Glass Specification: 4 -16 - 4 mm
Source room volume: 343.1 m3
Canopy: Original
Vent: Vent 1 closed
Test ID: 711003 Loudspeaker Configuration: L1
Frequency D0.01m,nT
Hz dB
50 32.3 b
63 37.8
80 28.6
100 32.9 4
125 28.9 7
160 32.9 10
200 31.4 13
250 24.6 16
315 25.9 19
400 27.1 22
500 24.8 23
630 19.9 24
800 27.2 25
1k 25.1 26
1.25k 27.8 27
1.6k 28.9 27
2k 33.2 27
2.5k 30.9 27
3.15k 29.0 27
4k 33.3
5k 37.8
D0.01m,nT,w(C;Ctr ) 27 ( 0; -1) dB
Tested by Building Performance Centre, Napier University, Edinburgh.
Measured D0.01m,nT dB
0.0
10.0
20.0
30.0
40.0
50.0
60.0
63 125 250 500 1k 2k 4kFrequency (Hz)
Sta
nd
ard
ise
d L
eve
l D
iffe
ren
ce
, D
0.0
1m
,nT
(d
B)
Measured values Shifted Reference Curve
K1-5

OPEN/CLOSED WINDOW RESEARCH Defra Research Contract: NANR116
Airborne Sound Insulation. Laboratory measurements with non-diffuse source conditions
Standardised Level Difference. Simulated residential receiver environment
Date: 11/7/05 Test Sample: Window C-2 Untensioned.
Air temperature: 20.5 ºC Area of window unit, S: 0.945 m2
Air humidity: 31.2 % Window mass per unit area: 36.83 kg/m2
Atmospheric pressure: 1.0281 Bar
Receiving room volume: 31.2 m3
Glass Specification: 4 -16 - 4 mm
Source room volume: 343.1 m3
Canopy: Original
Vent: Vent 1 closed
Test ID: 711009 Loudspeaker Configuration: L1
Frequency D0.01m,nT
Hz dB
50 31.7 b
63 37.2
80 28.0
100 32.1 4
125 28.5 7
160 31.4 10
200 29.6 13
250 26.2 16
315 26.7 19
400 28.3 22
500 24.7 23
630 20.1 24
800 28.8 25
1k 26.3 26
1.25k 26.8 27
1.6k 25.5 27
2k 31.0 27
2.5k 29.7 27
3.15k 27.2 27
4k 32.4
5k 37.1
D0.01m,nT,w(C;Ctr ) 27 (-1; -1) dB
Tested by Building Performance Centre, Napier University, Edinburgh.
Measured D0.01m,nT dB
0.0
10.0
20.0
30.0
40.0
50.0
60.0
63 125 250 500 1k 2k 4kFrequency (Hz)
Sta
nd
ard
ise
d L
eve
l D
iffe
ren
ce
, D
0.0
1m
,nT
(d
B)
Measured values Shifted Reference Curve
K1-6

OPEN/CLOSED WINDOW RESEARCH Defra Research Contract: NANR116
Airborne Sound Insulation. Laboratory measurements with non-diffuse source conditions
Standardised Level Difference. Simulated residential receiver environment
Date: 12/7/05 Test Sample: Window C-3 Untensioned.
Air temperature: 21 ºC Area of window unit, S: 0.945 m2
Air humidity: 31.2 % Window mass per unit area: 36.83 kg/m2
Atmospheric pressure: 1.0252 Bar
Receiving room volume: 31.2 m3
Glass Specification: 4 -18 - 6.4(lam) mm
Source room volume: 343.1 m3
Canopy: n/a
Vent: Vent 1 closed
Test ID: 712031 Loudspeaker Configuration: L1
Frequency D0.01m,nT
Hz dB
50 30.9 b
63 37.2
80 28.1
100 33.2 3
125 30.5 6
160 34.3 9
200 32.8 12
250 26.7 15
315 26.6 18
400 25.9 21
500 24.5 22
630 18.9 23
800 28.4 24
1k 23.3 25
1.25k 26.6 26
1.6k 27.7 26
2k 29.2 26
2.5k 27.6 26
3.15k 27.4 26
4k 30.1
5k 36.3
D0.01m,nT,w(C;Ctr ) 26 (-1; -1) dB
Tested by Building Performance Centre, Napier University, Edinburgh.
Measured D0.01m,nT dB
0.0
10.0
20.0
30.0
40.0
50.0
60.0
63 125 250 500 1k 2k 4kFrequency (Hz)
Sta
nd
ard
ise
d L
eve
l D
iffe
ren
ce
, D
0.0
1m
,nT
(d
B)
Measured values Shifted Reference Curve
K1-7

OPEN/CLOSED WINDOW RESEARCH Defra Research Contract: NANR116
Airborne Sound Insulation. Laboratory measurements with non-diffuse source conditions
Standardised Level Difference. Simulated residential receiver environment
Date: 12/7/05 Test Sample: Window C-4 Untensioned.
Air temperature: 21.1 ºC Area of window unit, S: 0.945 m2
Air humidity: 31.2 % Window mass per unit area: 36.83 kg/m2
Atmospheric pressure: 1.025 Bar
Receiving room volume: 31.2 m3
Glass Specification: 4 -18 - 6.4(lam) mm
Source room volume: 343.1 m3
Canopy: n/a
Vent: Vent 1 closed
Test ID: 712035 Loudspeaker Configuration: L1
Frequency D0.01m,nT
Hz dB
50 31.7 b
63 37.9
80 29.0
100 33.8 4
125 31.3 7
160 34.5 10
200 32.9 13
250 28.7 16
315 27.9 19
400 27.5 22
500 25.6 23
630 20.1 24
800 29.9 25
1k 25.2 26
1.25k 27.9 27
1.6k 28.9 27
2k 30.5 27
2.5k 29.3 27
3.15k 28.2 27
4k 31.3
5k 36.8
D0.01m,nT,w(C;Ctr ) 27 ( 0; -1) dB
Tested by Building Performance Centre, Napier University, Edinburgh.
Measured D0.01m,nT dB
0.0
10.0
20.0
30.0
40.0
50.0
60.0
63 125 250 500 1k 2k 4kFrequency (Hz)
Sta
nd
ard
ise
d L
eve
l D
iffe
ren
ce
, D
0.0
1m
,nT
(d
B)
Measured values Shifted Reference Curve
K1-8

OPEN/CLOSED WINDOW RESEARCH Defra Research Contract: NANR116
Airborne Sound Insulation. Laboratory measurements with non-diffuse source conditions
Standardised Level Difference. Simulated residential receiver environment
Date: 18/7/2005 Test Sample: Window E Untensioned.
Air temperature: 20.2 ºC Area of window unit, S: 0.63 m2
Air humidity: 31.2 % Window mass per unit area: 26.83 kg/m2
Atmospheric pressure: 0.9956 Bar
Receiving room volume: 31.2 m3
Glass Specification: 4 -16 - 4 mm
Source room volume: 343.1 m3
Canopy: n/a
Vent: n/a
Test ID: 718002 Loudspeaker Configuration: L1
Frequency D0.01m,nT
Hz dB
50 42.4 b
63 43.8
80 34.8
100 41.0 21
125 40.6 24
160 37.8 27
200 30.5 30
250 36.1 33
315 44.6 36
400 47.3 39
500 47.8 40
630 46.3 41
800 38.3 42
1k 42.0 43
1.25k 47.2 44
1.6k 48.2 44
2k 45.6 44
2.5k 44.0 44
3.15k 45.8 44
4k 53.6
5k 55.9
D0.01m,nT,w(C;Ctr ) 44 (-1; -3) dB
Tested by Building Performance Centre, Napier University, Edinburgh.
Measured D0.01m,nT dB
20.0
30.0
40.0
50.0
60.0
70.0
80.0
63 125 250 500 1k 2k 4kFrequency (Hz)
Sta
nd
ard
ise
d L
eve
l D
iffe
ren
ce
, D
0.0
1m
,nT
(d
B)
Measured values Shifted Reference Curve
K1-9

OPEN/CLOSED WINDOW RESEARCH Defra Research Contract: NANR116
Airborne Sound Insulation. Laboratory measurements with non-diffuse source conditions
Standardised Level Difference. Simulated residential receiver environment
Date: 19/7/2005 Test Sample: Window F Untensioned.
Air temperature: 20.3 ºC Area of window unit, S: 0.63 m2
Air humidity: 31.2 % Window mass per unit area: 26.83 kg/m2
Atmospheric pressure: 1.0023 Bar
Receiving room volume: 31.2 m3
Glass Specification: 4 -16 - 4 mm
Source room volume: 343.1 m3
Canopy: n/a
Vent: n/a
Test ID: 719016 Loudspeaker Configuration: L1
Frequency D0.01m,nT
Hz dB
50 37.9 b
63 43.2
80 30.7
100 34.1 10
125 33.7 13
160 32.7 16
200 27.4 19
250 33.4 22
315 33.8 25
400 36.9 28
500 39.6 29
630 37.4 30
800 32.8 31
1k 35.6 32
1.25k 28.6 33
1.6k 32.8 33
2k 36.8 33
2.5k 33.6 33
3.15k 25.6 33
4k 31.1
5k 35.7
D0.01m,nT,w(C;Ctr ) 33 (-2; -1) dB
Tested by Building Performance Centre, Napier University, Edinburgh.
Measured D0.01m,nT dB
10.0
20.0
30.0
40.0
50.0
60.0
70.0
63 125 250 500 1k 2k 4kFrequency (Hz)
Sta
nd
ard
ise
d L
eve
l D
iffe
ren
ce
, D
0.0
1m
,nT
(d
B)
Measured values Shifted Reference Curve
K1-10

OPEN/CLOSED WINDOW RESEARCH Defra Research Contract: NANR116
Airborne Sound Insulation. Laboratory measurements with non-diffuse source conditions
Standardised Level Difference. Simulated residential receiver environment
Date: 20/7/2005 Test Sample: Window G Untensioned.
Air temperature: 20.3 ºC Area of window unit, S: 0.54 m2
Air humidity: 31.2 % Window mass per unit area: 33.33 kg/m2
Atmospheric pressure: 1.0032 Bar
Receiving room volume: 31.2 m3
Glass Specification: 4 -16 - 4 mm
Source room volume: 343.1 m3
Canopy: n/a
Vent: n/a
Test ID: 720015 Loudspeaker Configuration: L1
Frequency D0.01m,nT
Hz dB
50 41.2 b
63 44.2
80 38.5
100 42.1 17
125 40.8 20
160 37.5 23
200 36.9 26
250 34.3 29
315 42.6 32
400 44.6 35
500 44.1 36
630 38.8 37
800 33.2 38
1k 35.3 39
1.25k 45.1 40
1.6k 49.1 40
2k 46.5 40
2.5k 40.7 40
3.15k 35.6 40
4k 41.2
5k 46.9
D0.01m,nT,w(C;Ctr ) 40 (-1; -2) dB
Tested by Building Performance Centre, Napier University, Edinburgh.
Measured D0.01m,nT dB
10.0
20.0
30.0
40.0
50.0
60.0
70.0
63 125 250 500 1k 2k 4kFrequency (Hz)
Sta
nd
ard
ise
d L
eve
l D
iffe
ren
ce
, D
0.0
1m
,nT
(d
B)
Measured values Shifted Reference Curve
K1-11

OPEN/CLOSED WINDOW RESEARCH Defra Research Contract: NANR116
Airborne Sound Insulation. Laboratory measurements with non-diffuse source conditions
Standardised Level Difference. Simulated residential receiver environment
Date: 28/6/2005 Test Sample: Window A-1 Untensioned.
Air temperature: 20.6 ºC Area of window unit, S: 2.52 m2
Air humidity: 31.2 % Window mass per unit area: 30.00 kg/m2
Atmospheric pressure: 1.0102 Bar
Receiving room volume: 31.2 m3
Glass Specification: 4 -16 - 4 mm
Source room volume: 343.1 m3
Canopy: n/a
Vent: n/a
Test ID: 628044 Loudspeaker Configuration: L2
Frequency D0.01m,nT
Hz dB
50 24.8
63 33.5
80 29.7
100 33.2 13
125 30.5 16
160 27.6 19
200 24.6 22
250 31.2 25
315 34.5 28
400 33.5 31
500 33.4 32
630 32.7 33
800 31.5 34
1k 32.5 35
1.25k 36.3 36
1.6k 40.8 36
2k 44.3 36
2.5k 43.4 36
3.15k 37.9 36
4k 43.2
5k 39.8
D0.01m,nT,w(C;Ctr ) 36 (-1; -3) dB
Tested by Building Performance Centre, Napier University, Edinburgh.
Measured D0.01m,nT dB
10.0
20.0
30.0
40.0
50.0
60.0
70.0
63 125 250 500 1k 2k 4kFrequency (Hz)
Sta
nd
ard
ise
d L
eve
l D
iffe
ren
ce
, D
0.0
1m
,nT
(d
B)
Measured values Shifted Reference Curve
K2-1

OPEN/CLOSED WINDOW RESEARCH Defra Research Contract: NANR116
Airborne Sound Insulation. Laboratory measurements with non-diffuse source conditions
Standardised Level Difference. Simulated residential receiver environment
Date: 5/7/05 Test Sample: Window B Untensioned.
Air temperature: 19.1 ºC Area of window unit, S: 1.26 m2
Air humidity: 31.2 % Window mass per unit area: 27.94 kg/m2
Atmospheric pressure: 0.998 Bar
Receiving room volume: 31.2 m3
Glass Specification: 4 -16 - 4 mm
Source room volume: 343.1 m3
Canopy: n/a
Vent: n/a
Test ID: 705007 Loudspeaker Configuration: L2
Frequency D0.01m,nT
Hz dB
50 26.7
63 36.7
80 28.5
100 31.6 6
125 30.7 9
160 28.6 12
200 26.6 15
250 30.7 18
315 32.3 21
400 28.5 24
500 27.4 25
630 26.6 26
800 25.9 27
1k 21.7 28
1.25k 26.1 29
1.6k 32.1 29
2k 36.3 29
2.5k 39.3 29
3.15k 36.6 29
4k 37.6
5k 42.5
D0.01m,nT,w(C;Ctr ) 29 (-1; -3) dB
Tested by Building Performance Centre, Napier University, Edinburgh.
Measured D0.01m,nT dB
0.0
10.0
20.0
30.0
40.0
50.0
60.0
63 125 250 500 1k 2k 4kFrequency (Hz)
Sta
nd
ard
ise
d L
eve
l D
iffe
ren
ce
, D
0.0
1m
,nT
(d
B)
Measured values Shifted Reference Curve
K2-2

OPEN/CLOSED WINDOW RESEARCH Defra Research Contract: NANR116
Airborne Sound Insulation. Laboratory measurements with non-diffuse source conditions
Standardised Level Difference. Simulated residential receiver environment
Date: 11/7/05 Test Sample: Window C-1 Untensioned.
Air temperature: 20.6 ºC Area of window unit, S: 0.945 m2
Air humidity: 31.2 % Window mass per unit area: 36.83 kg/m2
Atmospheric pressure: 1.0278 Bar
Receiving room volume: 31.2 m3
Glass Specification: 4 -16 - 4 mm
Source room volume: 343.1 m3
Canopy: Original
Vent: Closed
Test ID: 711031 Loudspeaker Configuration: L2
Frequency D0.01m,nT
Hz dB
50 26.0
63 36.8
80 28.7
100 32.0 8
125 30.2 11
160 30.2 14
200 30.8 17
250 29.0 20
315 27.9 23
400 29.7 26
500 29.4 27
630 25.6 28
800 29.8 29
1k 29.2 30
1.25k 31.6 31
1.6k 32.2 31
2k 32.8 31
2.5k 33.3 31
3.15k 32.2 31
4k 34.4
5k 32.6
D0.01m,nT,w(C;Ctr ) 31 (-1; -1) dB
Tested by Building Performance Centre, Napier University, Edinburgh.
Measured D0.01m,nT dB
0.0
10.0
20.0
30.0
40.0
50.0
60.0
63 125 250 500 1k 2k 4kFrequency (Hz)
Sta
nd
ard
ise
d L
eve
l D
iffe
ren
ce
, D
0.0
1m
,nT
(d
B)
Measured values Shifted Reference Curve
K2-3

OPEN/CLOSED WINDOW RESEARCH Defra Research Contract: NANR116
Airborne Sound Insulation. Laboratory measurements with non-diffuse source conditions
Standardised Level Difference. Simulated residential receiver environment
Date: 11/7/05 Test Sample: Window C-2 Untensioned.
Air temperature: 20.6 ºC Area of window unit, S: 0.945 m2
Air humidity: 31.2 % Window mass per unit area: 36.83 kg/m2
Atmospheric pressure: 1.0278 Bar
Receiving room volume: 31.2 m3
Glass Specification: 4 -16 - 4 mm
Source room volume: 343.1 m3
Canopy: Original
Vent: Closed
Test ID: 711035 Loudspeaker Configuration: L2
Frequency D0.01m,nT
Hz dB
50 27.0
63 37.6
80 29.5
100 32.9 10
125 31.2 13
160 30.8 16
200 32.7 19
250 30.4 22
315 29.9 25
400 32.5 28
500 32.3 29
630 28.1 30
800 31.6 31
1k 30.2 32
1.25k 32.9 33
1.6k 34.2 33
2k 35.3 33
2.5k 36.9 33
3.15k 35.7 33
4k 36.6
5k 35.7
D0.01m,nT,w(C;Ctr ) 33 ( 0; -1) dB
Tested by Building Performance Centre, Napier University, Edinburgh.
Measured D0.01m,nT dB
10.0
20.0
30.0
40.0
50.0
60.0
70.0
63 125 250 500 1k 2k 4kFrequency (Hz)
Sta
nd
ard
ise
d L
eve
l D
iffe
ren
ce
, D
0.0
1m
,nT
(d
B)
Measured values Shifted Reference Curve
K2-4

OPEN/CLOSED WINDOW RESEARCH Defra Research Contract: NANR116
Airborne Sound Insulation. Laboratory measurements with non-diffuse source conditions
Standardised Level Difference. Simulated residential receiver environment
Date: 12/7/05 Test Sample: Window C-3 Untensioned.
Air temperature: 21.1 ºC Area of window unit, S: 0.945 m2
Air humidity: 31.2 % Window mass per unit area: 36.83 kg/m2
Atmospheric pressure: 1.0247 Bar
Receiving room volume: 31.2 m3
Glass Specification: 4 -18 - 6.4(lam) mm
Source room volume: 343.1 m3
Canopy: n/a
Vent: Vent 1 closed
Test ID: 712044 Loudspeaker Configuration: L2
Frequency D0.01m,nT
Hz dB
50 27.6
63 38.3
80 30.8
100 34.4 11
125 33.3 14
160 33.9 17
200 34.1 20
250 34.2 23
315 31.6 26
400 31.9 29
500 32.3 30
630 28.9 31
800 31.0 32
1k 32.4 33
1.25k 34.7 34
1.6k 35.7 34
2k 36.4 34
2.5k 36.0 34
3.15k 36.1 34
4k 35.6
5k 36.9
D0.01m,nT,w(C;Ctr ) 34 ( 0; -1) dB
Tested by Building Performance Centre, Napier University, Edinburgh.
Measured D0.01m,nT dB
10.0
20.0
30.0
40.0
50.0
60.0
70.0
63 125 250 500 1k 2k 4kFrequency (Hz)
Sta
nd
ard
ise
d L
eve
l D
iffe
ren
ce
, D
0.0
1m
,nT
(d
B)
Measured values Shifted Reference Curve
K2-5

OPEN/CLOSED WINDOW RESEARCH Defra Research Contract: NANR116
Airborne Sound Insulation. Laboratory measurements with non-diffuse source conditions
Standardised Level Difference. Simulated residential receiver environment
Date: 12/7/05 Test Sample: Window C-4 Untensioned.
Air temperature: 21.1 ºC Area of window unit, S: 0.945 m2
Air humidity: 31.2 % Window mass per unit area: 36.83 kg/m2
Atmospheric pressure: 1.0247 Bar
Receiving room volume: 31.2 m3
Glass Specification: 4 -18 - 6.4(lam) mm
Source room volume: 343.1 m3
Canopy: n/a
Vent: Vent 1 closed
Test ID: 712048 Loudspeaker Configuration: L2
Frequency D0.01m,nT
Hz dB
50 27.3
63 38.1
80 30.3
100 34.2 10
125 33.1 13
160 33.4 16
200 34.3 19
250 33.7 22
315 31.5 25
400 32.0 28
500 32.6 29
630 29.7 30
800 31.2 31
1k 31.6 32
1.25k 33.1 33
1.6k 34.3 33
2k 35.6 33
2.5k 35.2 33
3.15k 35.0 33
4k 35.0
5k 37.1
D0.01m,nT,w(C;Ctr ) 33 ( 0; -1) dB
Tested by Building Performance Centre, Napier University, Edinburgh.
Measured D0.01m,nT dB
10.0
20.0
30.0
40.0
50.0
60.0
70.0
63 125 250 500 1k 2k 4kFrequency (Hz)
Sta
nd
ard
ise
d L
eve
l D
iffe
ren
ce
, D
0.0
1m
,nT
(d
B)
Measured values Shifted Reference Curve
K2-6
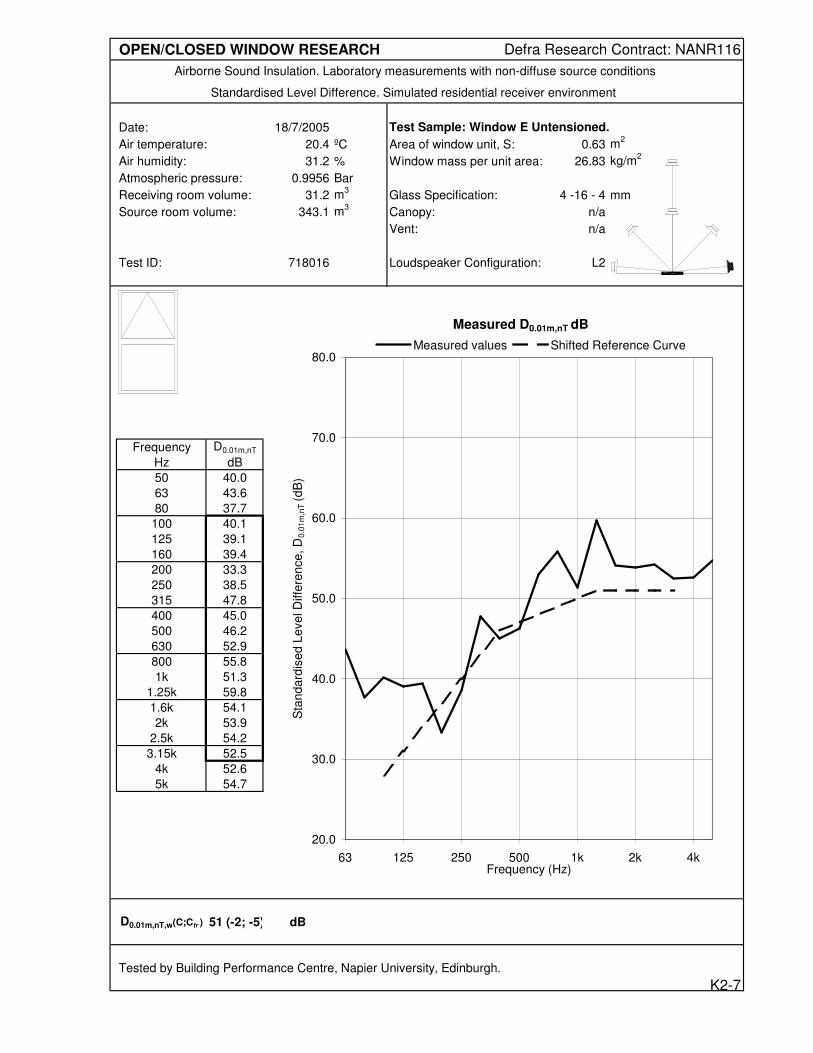
OPEN/CLOSED WINDOW RESEARCH Defra Research Contract: NANR116
Airborne Sound Insulation. Laboratory measurements with non-diffuse source conditions
Standardised Level Difference. Simulated residential receiver environment
Date: 18/7/2005 Test Sample: Window E Untensioned.
Air temperature: 20.4 ºC Area of window unit, S: 0.63 m2
Air humidity: 31.2 % Window mass per unit area: 26.83 kg/m2
Atmospheric pressure: 0.9956 Bar
Receiving room volume: 31.2 m3
Glass Specification: 4 -16 - 4 mm
Source room volume: 343.1 m3
Canopy: n/a
Vent: n/a
Test ID: 718016 Loudspeaker Configuration: L2
Frequency D0.01m,nT
Hz dB
50 40.0
63 43.6
80 37.7
100 40.1 28
125 39.1 31
160 39.4 34
200 33.3 37
250 38.5 40
315 47.8 43
400 45.0 46
500 46.2 47
630 52.9 48
800 55.8 49
1k 51.3 50
1.25k 59.8 51
1.6k 54.1 51
2k 53.9 51
2.5k 54.2 51
3.15k 52.5 51
4k 52.6
5k 54.7
D0.01m,nT,w(C;Ctr ) 51 (-2; -5) dB
Tested by Building Performance Centre, Napier University, Edinburgh.
Measured D0.01m,nT dB
20.0
30.0
40.0
50.0
60.0
70.0
80.0
63 125 250 500 1k 2k 4kFrequency (Hz)
Sta
nd
ard
ise
d L
eve
l D
iffe
ren
ce
, D
0.0
1m
,nT
(d
B)
Measured values Shifted Reference Curve
K2-7

OPEN/CLOSED WINDOW RESEARCH Defra Research Contract: NANR116
Airborne Sound Insulation. Laboratory measurements with non-diffuse source conditions
Standardised Level Difference. Simulated residential receiver environment
Date: 19/7/2005 Test Sample: Window F Untensioned.
Air temperature: 20.4 ºC Area of window unit, S: 0.63 m2
Air humidity: 31.2 % Window mass per unit area: 26.83 kg/m2
Atmospheric pressure: 1.0024 Bar
Receiving room volume: 31.2 m3
Glass Specification: 4 -16 - 4 mm
Source room volume: 343.1 m3
Canopy: n/a
Vent: n/a
Test ID: 719030 Loudspeaker Configuration: L2
Frequency D0.01m,nT
Hz dB
50 36.3
63 45.6
80 31.8
100 36.1 16
125 34.8 19
160 34.6 22
200 29.0 25
250 40.6 28
315 40.4 31
400 36.0 34
500 36.8 35
630 39.7 36
800 38.7 37
1k 33.5 38
1.25k 37.4 39
1.6k 39.9 39
2k 46.4 39
2.5k 46.6 39
3.15k 41.4 39
4k 44.7
5k 53.8
D0.01m,nT,w(C;Ctr ) 39 (-1; -2) dB
Tested by Building Performance Centre, Napier University, Edinburgh.
Measured D0.01m,nT dB
10.0
20.0
30.0
40.0
50.0
60.0
70.0
63 125 250 500 1k 2k 4kFrequency (Hz)
Sta
nd
ard
ise
d L
eve
l D
iffe
ren
ce
, D
0.0
1m
,nT
(d
B)
Measured values Shifted Reference Curve
K2-8

OPEN/CLOSED WINDOW RESEARCH Defra Research Contract: NANR116
Airborne Sound Insulation. Laboratory measurements with non-diffuse source conditions
Standardised Level Difference. Simulated residential receiver environment
Date: 20/7/2005 Test Sample: Window G Untensioned.
Air temperature: 20.3 ºC Area of window unit, S: 0.54 m2
Air humidity: 31.2 % Window mass per unit area: 33.33 kg/m2
Atmospheric pressure: 1.0032 Bar
Receiving room volume: 31.2 m3
Glass Specification: 4 -16 - 4 mm
Source room volume: 343.1 m3
Canopy: n/a
Vent: n/a
Test ID: 720043 Loudspeaker Configuration: L2
Frequency D0.01m,nT
Hz dB
50 39.0
63 39.0
80 40.2
100 41.3 18
125 37.8 21
160 36.3 24
200 38.4 27
250 35.7 30
315 42.7 33
400 41.9 36
500 39.1 37
630 41.3 38
800 34.6 39
1k 37.1 40
1.25k 44.3 41
1.6k 45.9 41
2k 49.2 41
2.5k 45.0 41
3.15k 38.5 41
4k 47.4
5k 44.1
D0.01m,nT,w(C;Ctr ) 41 (-1; -2) dB
Tested by Building Performance Centre, Napier University, Edinburgh.
Measured D0.01m,nT dB
10.0
20.0
30.0
40.0
50.0
60.0
70.0
63 125 250 500 1k 2k 4kFrequency (Hz)
Sta
nd
ard
ise
d L
eve
l D
iffe
ren
ce
, D
0.0
1m
,nT
(d
B)
Measured values Shifted Reference Curve
K2-9

OPEN/CLOSED WINDOW RESEARCH Defra Research Contract: NANR116
Airborne Sound Insulation. Laboratory measurements with non-diffuse source conditions
Standardised Level Difference. Simulated residential receiver environment
Date: 28/6/2005 Test Sample: Window A-1 Untensioned.
Air temperature: 20.6 ºC Area of window unit, S: 2.52 m2
Air humidity: 31.2 % Window mass per unit area: 30.00 kg/m2
Atmospheric pressure: 1.0095 Bar
Receiving room volume: 31.2 m3
Glass Specification: 4 -16 - 4 mm
Source room volume: 343.1 m3
Canopy: n/a
Vent: n/a
Test ID: 628060 Loudspeaker Configuration: L3
Frequency D0.01m,nT
Hz dB
50 26.2
63 34.9
80 31.5
100 33.7 12
125 32.5 15
160 26.4 18
200 26.1 21
250 32.7 24
315 35.2 27
400 34.7 30
500 36.7 31
630 33.8 32
800 31.8 33
1k 28.1 34
1.25k 34.0 35
1.6k 37.4 35
2k 41.4 35
2.5k 40.1 35
3.15k 35.4 35
4k 42.6
5k 40.0
D0.01m,nT,w(C;Ctr ) 35 (-1; -3) dB
Tested by Building Performance Centre, Napier University, Edinburgh.
Measured D0.01m,nT dB
10.0
20.0
30.0
40.0
50.0
60.0
70.0
63 125 250 500 1k 2k 4kFrequency (Hz)
Sta
nd
ard
ise
d L
eve
l D
iffe
ren
ce
, D
0.0
1m
,nT
(d
B)
Measured values Shifted Reference Curve
K3-1

OPEN/CLOSED WINDOW RESEARCH Defra Research Contract: NANR116
Airborne Sound Insulation. Laboratory measurements with non-diffuse source conditions
Standardised Level Difference. Simulated residential receiver environment
Date: 28/6/2005 Test Sample: Window A-2 Untensioned.
Air temperature: 20.6 ºC Area of window unit, S: 2.52 m2
Air humidity: 31.2 % Window mass per unit area: 30.00 kg/m2
Atmospheric pressure: 1.0095 Bar
Receiving room volume: 31.2 m3
Glass Specification: 4 -16 - 4 mm
Source room volume: 343.1 m3
Canopy: n/a
Vent: n/a
Test ID: 628055 Loudspeaker Configuration: L3
Frequency D0.01m,nT
Hz dB
50 25.6
63 33.1
80 27.3
100 30.7 12
125 29.2 15
160 26.5 18
200 24.8 21
250 31.8 24
315 33.1 27
400 32.1 30
500 32.1 31
630 32.7 32
800 32.1 33
1k 29.0 34
1.25k 32.7 35
1.6k 37.9 35
2k 40.7 35
2.5k 40.4 35
3.15k 37.1 35
4k 43.6
5k 41.2
D0.01m,nT,w(C;Ctr ) 35 (-2; -3) dB
Tested by Building Performance Centre, Napier University, Edinburgh.
Measured D0.01m,nT dB
10.0
20.0
30.0
40.0
50.0
60.0
70.0
63 125 250 500 1k 2k 4kFrequency (Hz)
Sta
nd
ard
ise
d L
eve
l D
iffe
ren
ce
, D
0.0
1m
,nT
(d
B)
Measured values Shifted Reference Curve
K3-2

OPEN/CLOSED WINDOW RESEARCH Defra Research Contract: NANR116
Airborne Sound Insulation. Laboratory measurements with non-diffuse source conditions
Standardised Level Difference. Simulated residential receiver environment
Date: 28/6/2005 Test Sample: Window A-3 Untensioned.
Air temperature: 20.6 ºC Area of window unit, S: 2.52 m2
Air humidity: 31.2 % Window mass per unit area: 30.00 kg/m2
Atmospheric pressure: 1.0095 Bar
Receiving room volume: 31.2 m3
Glass Specification: 4 -16 - 4 mm
Source room volume: 343.1 m3
Canopy: n/a
Vent: n/a
Test ID: 628050 Loudspeaker Configuration: L3
Frequency D0.01m,nT
Hz dB
50 26.1
63 35.8
80 29.4
100 32.8 16
125 30.6 19
160 26.3 22
200 26.0 25
250 32.3 28
315 34.7 31
400 35.1 34
500 36.6 35
630 37.6 36
800 36.0 37
1k 37.1 38
1.25k 41.7 39
1.6k 44.2 39
2k 45.1 39
2.5k 44.0 39
3.15k 41.3 39
4k 46.4
5k 46.1
D0.01m,nT,w(C;Ctr ) 39 (-1; -3) dB
Tested by Building Performance Centre, Napier University, Edinburgh.
Measured D0.01m,nT dB
10.0
20.0
30.0
40.0
50.0
60.0
70.0
63 125 250 500 1k 2k 4kFrequency (Hz)
Sta
nd
ard
ise
d L
eve
l D
iffe
ren
ce
, D
0.0
1m
,nT
(d
B)
Measured values Shifted Reference Curve
K3-3

OPEN/CLOSED WINDOW RESEARCH Defra Research Contract: NANR116
Airborne Sound Insulation. Laboratory measurements with non-diffuse source conditions
Standardised Level Difference. Simulated residential receiver environment
Date: 5/7/05 Test Sample: Window B Untensioned.
Air temperature: 19.3 ºC Area of window unit, S: 1.26 m2
Air humidity: 31.2 % Window mass per unit area: 27.94 kg/m2
Atmospheric pressure: 0.9974 Bar
Receiving room volume: 31.2 m3
Glass Specification: 4 -16 - 4 mm
Source room volume: 343.1 m3
Canopy: n/a
Vent: n/a
Test ID: 705012 Loudspeaker Configuration: L3
Frequency D0.01m,nT
Hz dB
50 27.8
63 37.1
80 28.2
100 30.7 6
125 30.3 9
160 28.3 12
200 26.6 15
250 28.5 18
315 31.1 21
400 28.5 24
500 27.1 25
630 25.9 26
800 25.5 27
1k 20.0 28
1.25k 26.5 29
1.6k 32.0 29
2k 35.9 29
2.5k 37.2 29
3.15k 35.2 29
4k 37.7
5k 43.9
D0.01m,nT,w(C;Ctr ) 29 (-2; -4) dB
Tested by Building Performance Centre, Napier University, Edinburgh.
Measured D0.01m,nT dB
0.0
10.0
20.0
30.0
40.0
50.0
60.0
63 125 250 500 1k 2k 4kFrequency (Hz)
Sta
nd
ard
ise
d L
eve
l D
iffe
ren
ce
, D
0.0
1m
,nT
(d
B)
Measured values Shifted Reference Curve
K3-4

OPEN/CLOSED WINDOW RESEARCH Defra Research Contract: NANR116
Airborne Sound Insulation. Laboratory measurements with non-diffuse source conditions
Standardised Level Difference. Simulated residential receiver environment
Date: 11/7/05 Test Sample: Window C-2 Untensioned.
Air temperature: 20.6 ºC Area of window unit, S: 0.945 m2
Air humidity: 31.2 % Window mass per unit area: 36.83 kg/m2
Atmospheric pressure: 1.0276 Bar
Receiving room volume: 31.2 m3
Glass Specification: 4 -16 - 4 mm
Source room volume: 343.1 m3
Canopy: Original
Vent: Closed
Test ID: 711041 Loudspeaker Configuration: L3
Frequency D0.01m,nT
Hz dB
50 29.0
63 38.3
80 30.7
100 32.8 7
125 30.5 10
160 30.4 13
200 31.1 16
250 28.7 19
315 29.0 22
400 30.5 25
500 29.0 26
630 24.9 27
800 28.0 28
1k 29.4 29
1.25k 32.2 30
1.6k 32.1 30
2k 30.5 30
2.5k 32.0 30
3.15k 32.0 30
4k 34.1
5k 38.4
D0.01m,nT,w(C;Ctr ) 30 ( 0; -1) dB
Tested by Building Performance Centre, Napier University, Edinburgh.
Measured D0.01m,nT dB
0.0
10.0
20.0
30.0
40.0
50.0
60.0
63 125 250 500 1k 2k 4kFrequency (Hz)
Sta
nd
ard
ise
d L
eve
l D
iffe
ren
ce
, D
0.0
1m
,nT
(d
B)
Measured values Shifted Reference Curve
K3-5

OPEN/CLOSED WINDOW RESEARCH Defra Research Contract: NANR116
Airborne Sound Insulation. Laboratory measurements with non-diffuse source conditions
Standardised Level Difference. Simulated residential receiver environment
Date: 12/7/05 Test Sample: Window C-4 Untensioned.
Air temperature: 21.2 ºC Area of window unit, S: 0.945 m2
Air humidity: 31.2 % Window mass per unit area: 36.83 kg/m2
Atmospheric pressure: 1.0243 Bar
Receiving room volume: 31.2 m3
Glass Specification: 4 -18 - 6.4(lam) mm
Source room volume: 343.1 m3
Canopy: n/a
Vent: Vent 1 closed
Test ID: 712071 Loudspeaker Configuration: L3
Frequency D0.01m,nT
Hz dB
50 28.6
63 38.3
80 31.1
100 33.5 6
125 31.5 9
160 32.1 12
200 31.7 15
250 31.2 18
315 30.1 21
400 29.9 24
500 28.7 25
630 24.4 26
800 28.1 27
1k 28.9 28
1.25k 29.9 29
1.6k 29.6 29
2k 28.5 29
2.5k 30.5 29
3.15k 30.8 29
4k 33.1
5k 39.3
D0.01m,nT,w(C;Ctr ) 29 ( 0; 0) dB
Tested by Building Performance Centre, Napier University, Edinburgh.
Measured D0.01m,nT dB
0.0
10.0
20.0
30.0
40.0
50.0
60.0
63 125 250 500 1k 2k 4kFrequency (Hz)
Sta
nd
ard
ise
d L
eve
l D
iffe
ren
ce
, D
0.0
1m
,nT
(d
B)
Measured values Shifted Reference Curve
K3-6

OPEN/CLOSED WINDOW RESEARCH Defra Research Contract: NANR116
Airborne Sound Insulation. Laboratory measurements with non-diffuse source conditions
Standardised Level Difference. Simulated residential receiver environment
Date: 13/7/2005 Test Sample: Window D-1 Untensioned.
Air temperature: 21.8 ºC Area of window unit, S: 1.26 m2
Air humidity: 31.2 % Window mass per unit area: 27.94 kg/m2
Atmospheric pressure: 1.0176 Bar
Receiving room volume: 31.2 m3
Glass Specification: 4 -16 - 4 mm
Source room volume: 343.1 m3
Canopy: n/a
Vent: n/a
Test ID: 713044 Loudspeaker Configuration: L3
Frequency D0.01m,nT
Hz dB
50 28.6
63 41.9
80 36.2
100 37.6 19
125 35.4 22
160 33.2 25
200 38.9 28
250 37.7 31
315 43.4 34
400 45.6 37
500 43.6 38
630 39.3 39
800 46.8 40
1k 43.5 41
1.25k 38.8 42
1.6k 43.0 42
2k 43.2 42
2.5k 43.3 42
3.15k 36.9 42
4k 34.2
5k 42.3
D0.01m,nT,w(C;Ctr ) 42 (-1; -1) dB
Tested by Building Performance Centre, Napier University, Edinburgh.
Measured D0.01m,nT dB
10.0
20.0
30.0
40.0
50.0
60.0
70.0
63 125 250 500 1k 2k 4kFrequency (Hz)
Sta
nd
ard
ise
d L
eve
l D
iffe
ren
ce
, D
0.0
1m
,nT
(d
B)
Measured values Shifted Reference Curve
K3-7

OPEN/CLOSED WINDOW RESEARCH Defra Research Contract: NANR116
Airborne Sound Insulation. Laboratory measurements with non-diffuse source conditions
Standardised Level Difference. Simulated residential receiver environment
Date: 20/7/2005 Test Sample: Window G Untensioned.
Air temperature: 20.3 ºC Area of window unit, S: 0.54 m2
Air humidity: 31.2 % Window mass per unit area: 33.33 kg/m2
Atmospheric pressure: 1.0032 Bar
Receiving room volume: 31.2 m3
Glass Specification: 4 -16 - 4 mm
Source room volume: 343.1 m3
Canopy: n/a
Vent: n/a
Test ID: 720040 Loudspeaker Configuration: L3
Frequency D0.01m,nT
Hz dB
50 35.5
63 39.3
80 36.3
100 36.4 15
125 35.8 18
160 35.6 21
200 41.1 24
250 38.8 27
315 43.4 30
400 40.0 33
500 41.6 34
630 45.1 35
800 36.2 36
1k 34.4 37
1.25k 44.9 38
1.6k 39.4 38
2k 39.1 38
2.5k 37.7 38
3.15k 35.7 38
4k 45.9
5k 46.0
D0.01m,nT,w(C;Ctr ) 38 ( 0; 0) dB
Tested by Building Performance Centre, Napier University, Edinburgh.
Measured D0.01m,nT dB
10.0
20.0
30.0
40.0
50.0
60.0
70.0
63 125 250 500 1k 2k 4kFrequency (Hz)
Sta
nd
ard
ise
d L
eve
l D
iffe
ren
ce
, D
0.0
1m
,nT
(d
B)
Measured values Shifted Reference Curve
K3-8

OPEN/CLOSED WINDOW RESEARCH Defra Research Contract: NANR116
Airborne Sound Insulation. Laboratory measurements with non-diffuse source conditions
Standardised Level Difference. Simulated residential receiver environment
Date: 28/6/2005 Test Sample: Window A-1 Untensioned.
Air temperature: 20.6 ºC Area of window unit, S: 2.52 m2
Air humidity: 31.2 % Window mass per unit area: 30.00 kg/m2
Atmospheric pressure: 1.0091 Bar
Receiving room volume: 31.2 m3
Glass Specification: 4 -16 - 4 mm
Source room volume: 343.1 m3
Canopy: n/a
Vent: n/a
Test ID: 628076 Loudspeaker Configuration: L4
Frequency D0.01m,nT
Hz dB
50 28.3
63 35.3
80 29.4
100 33.9 10
125 30.8 13
160 25.2 16
200 28.6 19
250 29.2 22
315 30.3 25
400 36.2 28
500 32.1 29
630 27.7 30
800 34.4 31
1k 29.1 32
1.25k 35.2 33
1.6k 38.4 33
2k 38.5 33
2.5k 32.8 33
3.15k 30.2 33
4k 38.1
5k 38.9
D0.01m,nT,w(C;Ctr ) 33 (-1; -2) dB
Tested by Building Performance Centre, Napier University, Edinburgh.
Measured D0.01m,nT dB
10.0
20.0
30.0
40.0
50.0
60.0
70.0
63 125 250 500 1k 2k 4kFrequency (Hz)
Sta
nd
ard
ise
d L
eve
l D
iffe
ren
ce
, D
0.0
1m
,nT
(d
B)
Measured values Shifted Reference Curve
K4-1

OPEN/CLOSED WINDOW RESEARCH Defra Research Contract: NANR116
Airborne Sound Insulation. Laboratory measurements with non-diffuse source conditions
Standardised Level Difference. Simulated residential receiver environment
Date: 28/6/2005 Test Sample: Window A-2 Untensioned.
Air temperature: 20.6 ºC Area of window unit, S: 2.52 m2
Air humidity: 31.2 % Window mass per unit area: 30.00 kg/m2
Atmospheric pressure: 1.0091 Bar
Receiving room volume: 31.2 m3
Glass Specification: 4 -16 - 4 mm
Source room volume: 343.1 m3
Canopy: n/a
Vent: n/a
Test ID: 628071 Loudspeaker Configuration: L4
Frequency D0.01m,nT
Hz dB
50 29.7
63 34.7
80 29.1
100 34.9 11
125 31.8 14
160 25.5 17
200 28.9 20
250 32.2 23
315 32.1 26
400 36.5 29
500 33.0 30
630 33.2 31
800 34.9 32
1k 30.1 33
1.25k 34.1 34
1.6k 35.7 34
2k 35.6 34
2.5k 32.5 34
3.15k 32.2 34
4k 36.9
5k 36.3
D0.01m,nT,w(C;Ctr ) 34 (-1; -1) dB
Tested by Building Performance Centre, Napier University, Edinburgh.
Measured D0.01m,nT dB
10.0
20.0
30.0
40.0
50.0
60.0
70.0
63 125 250 500 1k 2k 4kFrequency (Hz)
Sta
nd
ard
ise
d L
eve
l D
iffe
ren
ce
, D
0.0
1m
,nT
(d
B)
Measured values Shifted Reference Curve
K4-2

OPEN/CLOSED WINDOW RESEARCH Defra Research Contract: NANR116
Airborne Sound Insulation. Laboratory measurements with non-diffuse source conditions
Standardised Level Difference. Simulated residential receiver environment
Date: 28/6/2005 Test Sample: Window A-3 Untensioned.
Air temperature: 20.6 ºC Area of window unit, S: 2.52 m2
Air humidity: 31.2 % Window mass per unit area: 30.00 kg/m2
Atmospheric pressure: 1.0091 Bar
Receiving room volume: 31.2 m3
Glass Specification: 4 -16 - 4 mm
Source room volume: 343.1 m3
Canopy: n/a
Vent: n/a
Test ID: 628066 Loudspeaker Configuration: L4
Frequency D0.01m,nT
Hz dB
50 29.4
63 35.7
80 28.2
100 33.7 13
125 30.5 16
160 25.0 19
200 29.2 22
250 28.8 25
315 30.3 28
400 37.0 31
500 35.4 32
630 33.5 33
800 34.6 34
1k 34.4 35
1.25k 36.8 36
1.6k 36.6 36
2k 38.3 36
2.5k 36.2 36
3.15k 34.5 36
4k 35.1
5k 39.4
D0.01m,nT,w(C;Ctr ) 36 (-1; -2) dB
Tested by Building Performance Centre, Napier University, Edinburgh.
Measured D0.01m,nT dB
10.0
20.0
30.0
40.0
50.0
60.0
70.0
63 125 250 500 1k 2k 4kFrequency (Hz)
Sta
nd
ard
ise
d L
eve
l D
iffe
ren
ce
, D
0.0
1m
,nT
(d
B)
Measured values Shifted Reference Curve
K4-3

OPEN/CLOSED WINDOW RESEARCH Defra Research Contract: NANR116
Airborne Sound Insulation. Laboratory measurements with non-diffuse source conditions
Standardised Level Difference. Simulated residential receiver environment
Date: 5/7/05 Test Sample: Window B Untensioned.
Air temperature: 19.5 ºC Area of window unit, S: 1.26 m2
Air humidity: 31.2 % Window mass per unit area: 27.94 kg/m2
Atmospheric pressure: 0.9981 Bar
Receiving room volume: 31.2 m3
Glass Specification: 4 -16 - 4 mm
Source room volume: 343.1 m3
Canopy: n/a
Vent: n/a
Test ID: 705017 Loudspeaker Configuration: L4
Frequency D0.01m,nT
Hz dB
50 29.6
63 35.4
80 25.8
100 30.1 3
125 28.6 6
160 26.1 9
200 25.8 12
250 26.9 15
315 30.4 18
400 32.0 21
500 27.6 22
630 20.2 23
800 30.9 24
1k 22.7 25
1.25k 26.5 26
1.6k 26.5 26
2k 26.5 26
2.5k 27.9 26
3.15k 30.2 26
4k 34.6
5k 39.9
D0.01m,nT,w(C;Ctr ) 26 ( 0; -1) dB
Tested by Building Performance Centre, Napier University, Edinburgh.
Measured D0.01m,nT dB
0.0
10.0
20.0
30.0
40.0
50.0
60.0
63 125 250 500 1k 2k 4kFrequency (Hz)
Sta
nd
ard
ise
d L
eve
l D
iffe
ren
ce
, D
0.0
1m
,nT
(d
B)
Measured values Shifted Reference Curve
K4-4

OPEN/CLOSED WINDOW RESEARCH Defra Research Contract: NANR116
Airborne Sound Insulation. Laboratory measurements with non-diffuse source conditions
Standardised Level Difference. Simulated residential receiver environment
Date: 11/7/05 Test Sample: Window C-2 Untensioned.
Air temperature: 20.6 ºC Area of window unit, S: 0.945 m2
Air humidity: 31.2 % Window mass per unit area: 36.83 kg/m2
Atmospheric pressure: 1.0273 Bar
Receiving room volume: 31.2 m3
Glass Specification: 4 -16 - 4 mm
Source room volume: 343.1 m3
Canopy: Original
Vent: Closed
Test ID: 711060 Loudspeaker Configuration: L4
Frequency D0.01m,nT
Hz dB
50 30.6 b
63 38.0
80 29.1
100 32.4 7
125 30.7 10
160 31.1 13
200 36.8 16
250 25.7 19
315 26.8 22
400 30.7 25
500 34.6 26
630 24.7 27
800 30.5 28
1k 25.1 29
1.25k 29.6 30
1.6k 31.5 30
2k 35.5 30
2.5k 32.8 30
3.15k 31.1 30
4k 32.3
5k 37.5
D0.01m,nT,w(C;Ctr ) 30 (-1; -2) dB
Tested by Building Performance Centre, Napier University, Edinburgh.
Measured D0.01m,nT dB
0.0
10.0
20.0
30.0
40.0
50.0
60.0
63 125 250 500 1k 2k 4kFrequency (Hz)
Sta
nd
ard
ise
d L
eve
l D
iffe
ren
ce
, D
0.0
1m
,nT
(d
B)
Measured values Shifted Reference Curve
K4-5

OPEN/CLOSED WINDOW RESEARCH Defra Research Contract: NANR116
Airborne Sound Insulation. Laboratory measurements with non-diffuse source conditions
Standardised Level Difference. Simulated residential receiver environment
Date: 12/7/05 Test Sample: Window C-3 Untensioned.
Air temperature: 21.1 ºC Area of window unit, S: 0.945 m2
Air humidity: 31.2 % Window mass per unit area: 36.83 kg/m2
Atmospheric pressure: 1.0246 Bar
Receiving room volume: 31.2 m3
Glass Specification: 4 -18 - 6.4(lam) mm
Source room volume: 343.1 m3
Canopy: n/a
Vent: Vent 1 closed
Test ID: 712057 Loudspeaker Configuration: L4
Frequency D0.01m,nT
Hz dB
50 29.4 b
63 36.7
80 27.8
100 32.3 4
125 30.6 7
160 31.6 10
200 35.5 13
250 25.5 16
315 25.8 19
400 27.5 22
500 33.0 23
630 23.0 24
800 28.4 25
1k 24.1 26
1.25k 25.7 27
1.6k 25.6 27
2k 32.0 27
2.5k 27.8 27
3.15k 26.4 27
4k 29.5
5k 33.9
D0.01m,nT,w(C;Ctr ) 27 (-1; -1) dB
Tested by Building Performance Centre, Napier University, Edinburgh.
Measured D0.01m,nT dB
0.0
10.0
20.0
30.0
40.0
50.0
60.0
63 125 250 500 1k 2k 4kFrequency (Hz)
Sta
nd
ard
ise
d L
eve
l D
iffe
ren
ce
, D
0.0
1m
,nT
(d
B)
Measured values Shifted Reference Curve
K4-6

OPEN/CLOSED WINDOW RESEARCH Defra Research Contract: NANR116
Airborne Sound Insulation. Laboratory measurements with non-diffuse source conditions
Standardised Level Difference. Simulated residential receiver environment
Date: 12/7/05 Test Sample: Window C-4 Untensioned.
Air temperature: 21.1 ºC Area of window unit, S: 0.945 m2
Air humidity: 31.2 % Window mass per unit area: 36.83 kg/m2
Atmospheric pressure: 1.0246 Bar
Receiving room volume: 31.2 m3
Glass Specification: 4 -18 - 6.4(lam) mm
Source room volume: 343.1 m3
Canopy: n/a
Vent: Vent 1 closed
Test ID: 712061 Loudspeaker Configuration: L4
Frequency D0.01m,nT
Hz dB
50 32.5 b
63 39.2
80 30.5
100 34.9 8
125 33.2 11
160 33.2 14
200 40.0 17
250 28.5 20
315 29.3 23
400 30.9 26
500 36.0 27
630 25.1 28
800 31.5 29
1k 26.6 30
1.25k 30.2 31
1.6k 31.8 31
2k 37.1 31
2.5k 32.5 31
3.15k 30.8 31
4k 33.4
5k 39.6
D0.01m,nT,w(C;Ctr ) 31 (-1; -1) dB
Tested by Building Performance Centre, Napier University, Edinburgh.
Measured D0.01m,nT dB
0.0
10.0
20.0
30.0
40.0
50.0
60.0
63 125 250 500 1k 2k 4kFrequency (Hz)
Sta
nd
ard
ise
d L
eve
l D
iffe
ren
ce
, D
0.0
1m
,nT
(d
B)
Measured values Shifted Reference Curve
K4-7

OPEN/CLOSED WINDOW RESEARCH Defra Research Contract: NANR116
Airborne Sound Insulation. Laboratory measurements with non-diffuse source conditions
Standardised Level Difference. Simulated residential receiver environment
Date: 18/7/2005 Test Sample: Window E Untensioned.
Air temperature: 20.3 ºC Area of window unit, S: 0.63 m2
Air humidity: 31.2 % Window mass per unit area: 26.83 kg/m2
Atmospheric pressure: 0.9956 Bar
Receiving room volume: 31.2 m3
Glass Specification: 4 -16 - 4 mm
Source room volume: 343.1 m3
Canopy: n/a
Vent: n/a
Test ID: 718012 Loudspeaker Configuration: L4
Frequency D0.01m,nT
Hz dB
50 43.1 B
63 44.0
80 37.0
100 39.2 23
125 38.0 26
160 38.8 29
200 31.4 32
250 37.5 35
315 43.3 38
400 43.8 41
500 43.4 42
630 44.7 43
800 44.3 44
1k 47.1 45
1.25k 47.7 46
1.6k 49.5 46
2k 48.9 46
2.5k 48.4 46
3.15k 48.6 46
4k 50.3
5k 54.9
D0.01m,nT,w(C;Ctr ) 46 (-1; -3) dB
Tested by Building Performance Centre, Napier University, Edinburgh.
Measured D0.01m,nT dB
20.0
30.0
40.0
50.0
60.0
70.0
80.0
63 125 250 500 1k 2k 4kFrequency (Hz)
Sta
nd
ard
ise
d L
eve
l D
iffe
ren
ce
, D
0.0
1m
,nT
(d
B)
Measured values Shifted Reference Curve
K4-8

OPEN/CLOSED WINDOW RESEARCH Defra Research Contract: NANR116
Airborne Sound Insulation. Laboratory measurements with non-diffuse source conditions
Standardised Level Difference. Simulated residential receiver environment
Date: 19/7/2005 Test Sample: Window F Untensioned.
Air temperature: 20.3 ºC Area of window unit, S: 0.63 m2
Air humidity: 31.2 % Window mass per unit area: 26.83 kg/m2
Atmospheric pressure: 1.0023 Bar
Receiving room volume: 31.2 m3
Glass Specification: 4 -16 - 4 mm
Source room volume: 343.1 m3
Canopy: n/a
Vent: n/a
Test ID: 719027 Loudspeaker Configuration: L4
Frequency D0.01m,nT
Hz dB
50 42.0 b
63 45.6
80 31.0
100 36.8 16
125 36.3 19
160 34.7 22
200 27.3 25
250 36.2 28
315 37.9 31
400 38.5 34
500 39.1 35
630 40.8 36
800 36.6 37
1k 38.8 38
1.25k 32.1 39
1.6k 37.7 39
2k 44.0 39
2.5k 45.9 39
3.15k 40.1 39
4k 36.0
5k 40.6
D0.01m,nT,w(C;Ctr ) 39 (-2; -3) dB
Tested by Building Performance Centre, Napier University, Edinburgh.
Measured D0.01m,nT dB
10.0
20.0
30.0
40.0
50.0
60.0
70.0
63 125 250 500 1k 2k 4kFrequency (Hz)
Sta
nd
ard
ise
d L
eve
l D
iffe
ren
ce
, D
0.0
1m
,nT
(d
B)
Measured values Shifted Reference Curve
K4-9

OPEN/CLOSED WINDOW RESEARCH Defra Research Contract: NANR116
Airborne Sound Insulation. Laboratory measurements with non-diffuse source conditions
Standardised Level Difference. Simulated residential receiver environment
Date: 20/7/2005 Test Sample: Window G Untensioned.
Air temperature: 20.3 ºC Area of window unit, S: 0.54 m2
Air humidity: 31.2 % Window mass per unit area: 33.33 kg/m2
Atmospheric pressure: 1.0032 Bar
Receiving room volume: 31.2 m3
Glass Specification: 4 -16 - 4 mm
Source room volume: 343.1 m3
Canopy: n/a
Vent: n/a
Test ID: 720029 Loudspeaker Configuration: L4
Frequency D0.01m,nT
Hz dB
50 40.2 b
63 42.9
80 37.8
100 43.4 18
125 40.0 21
160 37.8 24
200 37.1 27
250 33.1 30
315 41.4 33
400 43.4 36
500 45.1 37
630 36.5 38
800 34.7 39
1k 35.6 40
1.25k 45.2 41
1.6k 47.2 41
2k 49.1 41
2.5k 44.6 41
3.15k 39.1 41
4k 42.3
5k 46.6
D0.01m,nT,w(C;Ctr ) 41 (-1; -3) dB
Tested by Building Performance Centre, Napier University, Edinburgh.
Measured D0.01m,nT dB
10.0
20.0
30.0
40.0
50.0
60.0
70.0
63 125 250 500 1k 2k 4kFrequency (Hz)
Sta
nd
ard
ise
d L
eve
l D
iffe
ren
ce
, D
0.0
1m
,nT
(d
B)
Measured values Shifted Reference Curve
K4-10

OPEN/CLOSED WINDOW RESEARCH Defra Research Contract: NANR116
Airborne Sound Insulation. Laboratory measurements with non-diffuse source conditions
Standardised Level Difference. Simulated residential receiver environment
Date: 28/6/2005 Test Sample: Window A-1 Untensioned.
Air temperature: 20.7 ºC Area of window unit, S: 2.52 m2
Air humidity: 31.2 % Window mass per unit area: 30.00 kg/m2
Atmospheric pressure: 1.0091 Bar
Receiving room volume: 31.2 m3
Glass Specification: 4 -16 - 4 mm
Source room volume: 343.1 m3
Canopy: n/a
Vent: n/a
Test ID: 628092 Loudspeaker Configuration: L5
Frequency D0.01m,nT
Hz dB
50 29.5
63 35.5
80 28.8
100 34.7 12
125 31.9 15
160 25.1 18
200 28.3 21
250 30.3 24
315 32.6 27
400 37.3 30
500 35.1 31
630 32.5 32
800 34.3 33
1k 32.0 34
1.25k 37.2 35
1.6k 34.4 35
2k 38.4 35
2.5k 38.1 35
3.15k 34.8 35
4k 39.0
5k 39.6
D0.01m,nT,w(C;Ctr ) 35 ( 0; -2) dB
Tested by Building Performance Centre, Napier University, Edinburgh.
Measured D0.01m,nT dB
10.0
20.0
30.0
40.0
50.0
60.0
70.0
63 125 250 500 1k 2k 4kFrequency (Hz)
Sta
nd
ard
ise
d L
eve
l D
iffe
ren
ce
, D
0.0
1m
,nT
(d
B)
Measured values Shifted Reference Curve
K5-1

OPEN/CLOSED WINDOW RESEARCH Defra Research Contract: NANR116
Airborne Sound Insulation. Laboratory measurements with non-diffuse source conditions
Standardised Level Difference. Simulated residential receiver environment
Date: 28/6/2005 Test Sample: Window A-2 Untensioned.
Air temperature: 20.7 ºC Area of window unit, S: 2.52 m2
Air humidity: 31.2 % Window mass per unit area: 30.00 kg/m2
Atmospheric pressure: 1.0091 Bar
Receiving room volume: 31.2 m3
Glass Specification: 4 -16 - 4 mm
Source room volume: 343.1 m3
Canopy: n/a
Vent: n/a
Test ID: 628087 Loudspeaker Configuration: L5
Frequency D0.01m,nT
Hz dB
50 29.3
63 35.0
80 27.6
100 32.6 9
125 30.7 12
160 25.1 15
200 28.2 18
250 27.8 21
315 30.2 24
400 36.7 27
500 33.4 28
630 25.9 29
800 34.8 30
1k 27.2 31
1.25k 35.0 32
1.6k 33.5 32
2k 37.0 32
2.5k 34.4 32
3.15k 29.5 32
4k 36.1
5k 37.1
D0.01m,nT,w(C;Ctr ) 32 (-1; -2) dB
Tested by Building Performance Centre, Napier University, Edinburgh.
Measured D0.01m,nT dB
0.0
10.0
20.0
30.0
40.0
50.0
60.0
63 125 250 500 1k 2k 4kFrequency (Hz)
Sta
nd
ard
ise
d L
eve
l D
iffe
ren
ce
, D
0.0
1m
,nT
(d
B)
Measured values Shifted Reference Curve
K5-2

OPEN/CLOSED WINDOW RESEARCH Defra Research Contract: NANR116
Airborne Sound Insulation. Laboratory measurements with non-diffuse source conditions
Standardised Level Difference. Simulated residential receiver environment
Date: 28/6/2005 Test Sample: Window A-3 Untensioned.
Air temperature: 20.7 ºC Area of window unit, S: 2.52 m2
Air humidity: 31.2 % Window mass per unit area: 30.00 kg/m2
Atmospheric pressure: 1.0091 Bar
Receiving room volume: 31.2 m3
Glass Specification: 4 -16 - 4 mm
Source room volume: 343.1 m3
Canopy: n/a
Vent: n/a
Test ID: 628082 Loudspeaker Configuration: L5
Frequency D0.01m,nT
Hz dB
50 30.7
63 36.3
80 28.1
100 33.9 14
125 31.1 17
160 24.9 20
200 28.5 23
250 28.6 26
315 30.8 29
400 37.2 32
500 37.3 33
630 34.5 34
800 34.0 35
1k 36.6 36
1.25k 41.1 37
1.6k 37.5 37
2k 40.5 37
2.5k 41.5 37
3.15k 38.1 37
4k 39.6
5k 43.5
D0.01m,nT,w(C;Ctr ) 37 (-1; -2) dB
Tested by Building Performance Centre, Napier University, Edinburgh.
Measured D0.01m,nT dB
10.0
20.0
30.0
40.0
50.0
60.0
70.0
63 125 250 500 1k 2k 4kFrequency (Hz)
Sta
nd
ard
ise
d L
eve
l D
iffe
ren
ce
, D
0.0
1m
,nT
(d
B)
Measured values Shifted Reference Curve
K5-3

OPEN/CLOSED WINDOW RESEARCH Defra Research Contract: NANR116
Airborne Sound Insulation. Laboratory measurements with non-diffuse source conditions
Standardised Level Difference. Simulated residential receiver environment
Date: 5/7/05 Test Sample: Window B Untensioned.
Air temperature: 19.5 ºC Area of window unit, S: 1.26 m2
Air humidity: 31.2 % Window mass per unit area: 27.94 kg/m2
Atmospheric pressure: 0.9981 Bar
Receiving room volume: 31.2 m3
Glass Specification: 4 -16 - 4 mm
Source room volume: 343.1 m3
Canopy: n/a
Vent: n/a
Test ID: 705022 Loudspeaker Configuration: L5
Frequency D0.01m,nT
Hz dB
50 31.1
63 37.4
80 27.6
100 31.7 7
125 31.0 10
160 27.6 13
200 25.7 16
250 26.0 19
315 32.7 22
400 34.2 25
500 30.7 26
630 21.0 27
800 30.2 28
1k 24.3 29
1.25k 30.1 30
1.6k 31.5 30
2k 32.6 30
2.5k 33.6 30
3.15k 35.8 30
4k 40.7
5k 42.7
D0.01m,nT,w(C;Ctr ) 30 (-2; -3) dB
Tested by Building Performance Centre, Napier University, Edinburgh.
Measured D0.01m,nT dB
0.0
10.0
20.0
30.0
40.0
50.0
60.0
63 125 250 500 1k 2k 4kFrequency (Hz)
Sta
nd
ard
ise
d L
eve
l D
iffe
ren
ce
, D
0.0
1m
,nT
(d
B)
Measured values Shifted Reference Curve
K5-4

OPEN/CLOSED WINDOW RESEARCH Defra Research Contract: NANR116
Airborne Sound Insulation. Laboratory measurements with non-diffuse source conditions
Standardised Level Difference. Simulated residential receiver environment
Date: 11/7/05 Test Sample: Window C-1 Untensioned.
Air temperature: 20.6 ºC Area of window unit, S: 0.945 m2
Air humidity: 31.2 % Window mass per unit area: 36.83 kg/m2
Atmospheric pressure: 1.0274 Bar
Receiving room volume: 31.2 m3
Glass Specification: 4 -16 - 4 mm
Source room volume: 343.1 m3
Canopy: Original
Vent: Closed
Test ID: 711055 Loudspeaker Configuration: L5
Frequency D0.01m,nT
Hz dB
50 30.0 b
63 37.4
80 28.8
100 31.8 5
125 29.4 8
160 31.9 11
200 32.9 14
250 21.4 17
315 23.4 20
400 27.3 23
500 32.7 24
630 25.2 25
800 25.8 26
1k 25.7 27
1.25k 26.3 28
1.6k 28.4 28
2k 32.5 28
2.5k 32.9 28
3.15k 29.2 28
4k 25.6
5k 29.6
D0.01m,nT,w(C;Ctr ) 28 ( 0; -1) dB
Tested by Building Performance Centre, Napier University, Edinburgh.
Measured D0.01m,nT dB
0.0
10.0
20.0
30.0
40.0
50.0
60.0
63 125 250 500 1k 2k 4kFrequency (Hz)
Sta
nd
ard
ise
d L
eve
l D
iffe
ren
ce
, D
0.0
1m
,nT
(d
B)
Measured values Shifted Reference Curve
K5-5

OPEN/CLOSED WINDOW RESEARCH Defra Research Contract: NANR116
Airborne Sound Insulation. Laboratory measurements with non-diffuse source conditions
Standardised Level Difference. Simulated residential receiver environment
Date: 11/7/05 Test Sample: Window C-2 Untensioned.
Air temperature: 20.6 ºC Area of window unit, S: 0.945 m2
Air humidity: 31.2 % Window mass per unit area: 36.83 kg/m2
Atmospheric pressure: 1.0274 Bar
Receiving room volume: 31.2 m3
Glass Specification: 4 -16 - 4 mm
Source room volume: 343.1 m3
Canopy: Original
Vent: Closed
Test ID: 711048 Loudspeaker Configuration: L5
Frequency D0.01m,nT
Hz dB
50 31.6 b
63 38.7
80 30.0
100 32.9 6
125 30.0 9
160 32.2 12
200 33.1 15
250 22.5 18
315 24.6 21
400 28.9 24
500 32.3 25
630 24.6 26
800 26.8 27
1k 24.7 28
1.25k 27.6 29
1.6k 30.3 29
2k 35.3 29
2.5k 35.7 29
3.15k 31.5 29
4k 29.4
5k 32.6
D0.01m,nT,w(C;Ctr ) 29 (-1; -2) dB
Tested by Building Performance Centre, Napier University, Edinburgh.
Measured D0.01m,nT dB
0.0
10.0
20.0
30.0
40.0
50.0
60.0
63 125 250 500 1k 2k 4kFrequency (Hz)
Sta
nd
ard
ise
d L
eve
l D
iffe
ren
ce
, D
0.0
1m
,nT
(d
B)
Measured values Shifted Reference Curve
K5-6

OPEN/CLOSED WINDOW RESEARCH Defra Research Contract: NANR116
Airborne Sound Insulation. Laboratory measurements with non-diffuse source conditions
Standardised Level Difference. Simulated residential receiver environment
Date: 12/7/05 Test Sample: Window C-4 Untensioned.
Air temperature: 21.1 ºC Area of window unit, S: 0.945 m2
Air humidity: 31.2 % Window mass per unit area: 36.83 kg/m2
Atmospheric pressure: 1.0246 Bar
Receiving room volume: 31.2 m3
Glass Specification: 4 -18 - 6.4(lam) mm
Source room volume: 343.1 m3
Canopy: n/a
Vent: Vent 1 closed
Test ID: 712066 Loudspeaker Configuration: L5
Frequency D0.01m,nT
Hz dB
50 32.0 b
63 38.8
80 30.5
100 34.3 6
125 32.0 9
160 34.2 12
200 33.6 15
250 25.6 18
315 26.8 21
400 28.3 24
500 32.0 25
630 24.3 26
800 27.8 27
1k 24.3 28
1.25k 26.4 29
1.6k 28.4 29
2k 33.8 29
2.5k 33.8 29
3.15k 29.3 29
4k 28.4
5k 35.7
D0.01m,nT,w(C;Ctr ) 29 (-1; -2) dB
Tested by Building Performance Centre, Napier University, Edinburgh.
Measured D0.01m,nT dB
0.0
10.0
20.0
30.0
40.0
50.0
60.0
63 125 250 500 1k 2k 4kFrequency (Hz)
Sta
nd
ard
ise
d L
eve
l D
iffe
ren
ce
, D
0.0
1m
,nT
(d
B)
Measured values Shifted Reference Curve
K5-7

OPEN/CLOSED WINDOW RESEARCH Defra Research Contract: NANR116
Airborne Sound Insulation. Laboratory measurements with non-diffuse source conditions
Standardised Level Difference. Simulated residential receiver environment
Date: 13/7/2005 Test Sample: Window D-1 Untensioned.
Air temperature: 21.8 ºC Area of window unit, S: 1.26 m2
Air humidity: 31.2 % Window mass per unit area: 27.94 kg/m2
Atmospheric pressure: 1.018 Bar
Receiving room volume: 31.2 m3
Glass Specification: 4 -16 - 4 mm
Source room volume: 343.1 m3
Canopy: n/a
Vent: n/a
Test ID: 713030 Loudspeaker Configuration: L5
Frequency D0.01m,nT
Hz dB
50 31.2 B
63 43.6 b
80 34.7
100 39.4 17
125 38.4 20
160 32.6 23
200 37.6 26
250 29.3 29
315 41.9 32
400 43.6 35
500 44.3 36
630 40.2 37
800 42.5 38
1k 36.9 39
1.25k 42.2 40
1.6k 41.4 40
2k 38.3 40
2.5k 38.6 40
3.15k 41.7 40
4k 47.5
5k 46.4
D0.01m,nT,w(C;Ctr ) 40 (-1; -2) dB
Tested by Building Performance Centre, Napier University, Edinburgh.
Measured D0.01m,nT dB
10.0
20.0
30.0
40.0
50.0
60.0
70.0
63 125 250 500 1k 2k 4kFrequency (Hz)
Sta
nd
ard
ise
d L
eve
l D
iffe
ren
ce
, D
0.0
1m
,nT
(d
B)
Measured values Shifted Reference Curve
K5-8

OPEN/CLOSED WINDOW RESEARCH Defra Research Contract: NANR116
Airborne Sound Insulation. Laboratory measurements with non-diffuse source conditions
Standardised Level Difference. Simulated residential receiver environment
Date: 20/7/2005 Test Sample: Window G Untensioned.
Air temperature: 20.3 ºC Area of window unit, S: 0.54 m2
Air humidity: 31.2 % Window mass per unit area: 33.33 kg/m2
Atmospheric pressure: 1.0032 Bar
Receiving room volume: 31.2 m3
Glass Specification: 4 -16 - 4 mm
Source room volume: 343.1 m3
Canopy: n/a
Vent: n/a
Test ID: 720026 Loudspeaker Configuration: L5
Frequency D0.01m,nT
Hz dB
50 40.6 b
63 43.4
80 39.1
100 39.2 19
125 40.6 22
160 37.5 25
200 40.0 28
250 35.3 31
315 44.6 34
400 45.0 37
500 43.3 38
630 41.1 39
800 31.9 40
1k 36.5 41
1.25k 46.2 42
1.6k 45.9 42
2k 50.3 42
2.5k 47.5 42
3.15k 39.1 42
4k 43.4
5k 42.6
D0.01m,nT,w(C;Ctr ) 42 (-3; -4) dB
Tested by Building Performance Centre, Napier University, Edinburgh.
Measured D0.01m,nT dB
10.0
20.0
30.0
40.0
50.0
60.0
70.0
63 125 250 500 1k 2k 4kFrequency (Hz)
Sta
nd
ard
ise
d L
eve
l D
iffe
ren
ce
, D
0.0
1m
,nT
(d
B)
Measured values Shifted Reference Curve
K5-9

OPEN/CLOSED WINDOW RESEARCH Defra Research Contract: NANR116
Airborne Sound Insulation. Laboratory measurements with non-diffuse source conditions
Standardised Level Difference. Simulated residential receiver environment
Date: 28/6/2005 Test Sample: Window A-1 Untensioned.
Air temperature: 20.5 ºC Area of window unit, S: 2.52 m2
Air humidity: 31.2 % Window mass per unit area: 30.00 kg/m2
Atmospheric pressure: 1.0109 Bar
Receiving room volume: 31.2 m3
Glass Specification: 4 -16 - 4 mm
Source room volume: 343.1 m3
Canopy: n/a
Vent: n/a
Test ID: 628028 Loudspeaker Configuration: L6
Frequency D0.01m,nT
Hz dB
50 28.5
63 35.9
80 28.9
100 35.4 9
125 31.2 12
160 25.6 15
200 22.3 18
250 27.4 21
315 29.9 24
400 24.2 27
500 34.3 28
630 36.5 29
800 34.5 30
1k 25.6 31
1.25k 33.6 32
1.6k 33.0 32
2k 34.4 32
2.5k 38.0 32
3.15k 33.7 32
4k 35.5
5k 33.0 b
D0.01m,nT,w(C;Ctr ) 32 (-1; -3) dB
Tested by Building Performance Centre, Napier University, Edinburgh.
Measured D0.01m,nT dB
0.0
10.0
20.0
30.0
40.0
50.0
60.0
63 125 250 500 1k 2k 4kFrequency (Hz)
Sta
nd
ard
ise
d L
eve
l D
iffe
ren
ce
, D
0.0
1m
,nT
(d
B)
Measured values Shifted Reference Curve
K6-1

OPEN/CLOSED WINDOW RESEARCH Defra Research Contract: NANR116
Airborne Sound Insulation. Laboratory measurements with non-diffuse source conditions
Standardised Level Difference. Simulated residential receiver environment
Date: 28/6/2005 Test Sample: Window A-2 Untensioned.
Air temperature: 20.5 ºC Area of window unit, S: 2.52 m2
Air humidity: 31.2 % Window mass per unit area: 30.00 kg/m2
Atmospheric pressure: 1.0109 Bar
Receiving room volume: 31.2 m3
Glass Specification: 4 -16 - 4 mm
Source room volume: 343.1 m3
Canopy: n/a
Vent: n/a
Test ID: 628023 Loudspeaker Configuration: L6
Frequency D0.01m,nT
Hz dB
50 29.8
63 35.0
80 28.1
100 34.7 8
125 31.3 11
160 25.7 14
200 22.3 17
250 26.6 20
315 28.9 23
400 23.5 26
500 33.9 27
630 36.2 28
800 35.8 29
1k 25.2 30
1.25k 31.5 31
1.6k 31.8 31
2k 33.2 31
2.5k 36.8 31
3.15k 32.0 31
4k 34.9
5k 32.4 b
D0.01m,nT,w(C;Ctr ) 31 (-1; -2) dB
Tested by Building Performance Centre, Napier University, Edinburgh.
Measured D0.01m,nT dB
0.0
10.0
20.0
30.0
40.0
50.0
60.0
63 125 250 500 1k 2k 4kFrequency (Hz)
Sta
nd
ard
ise
d L
eve
l D
iffe
ren
ce
, D
0.0
1m
,nT
(d
B)
Measured values Shifted Reference Curve
K6-2

OPEN/CLOSED WINDOW RESEARCH Defra Research Contract: NANR116
Airborne Sound Insulation. Laboratory measurements with non-diffuse source conditions
Standardised Level Difference. Simulated residential receiver environment
Date: 28/6/2005 Test Sample: Window A-3 Untensioned.
Air temperature: 20.5 ºC Area of window unit, S: 2.52 m2
Air humidity: 31.2 % Window mass per unit area: 30.00 kg/m2
Atmospheric pressure: 1.0109 Bar
Receiving room volume: 31.2 m3
Glass Specification: 4 -16 - 4 mm
Source room volume: 343.1 m3
Canopy: n/a
Vent: n/a
Test ID: 628018 Loudspeaker Configuration: L6
Frequency D0.01m,nT
Hz dB
50 29.9
63 36.3
80 28.2
100 34.6 12
125 31.0 15
160 25.4 18
200 22.3 21
250 26.5 24
315 30.5 27
400 25.7 30
500 38.8 31
630 36.3 32
800 34.8 33
1k 36.1 34
1.25k 37.8 35
1.6k 36.4 35
2k 35.9 35
2.5k 41.6 35
3.15k 37.9 35
4k 38.5
5k 34.2 b
D0.01m,nT,w(C;Ctr ) 35 (-1; -3) dB
Tested by Building Performance Centre, Napier University, Edinburgh.
Measured D0.01m,nT dB
10.0
20.0
30.0
40.0
50.0
60.0
70.0
63 125 250 500 1k 2k 4kFrequency (Hz)
Sta
nd
ard
ise
d L
eve
l D
iffe
ren
ce
, D
0.0
1m
,nT
(d
B)
Measured values Shifted Reference Curve
K6-3

OPEN/CLOSED WINDOW RESEARCH Defra Research Contract: NANR116
Airborne Sound Insulation. Laboratory measurements with non-diffuse source conditions
Standardised Level Difference. Simulated residential receiver environment
Date: 5/7/05 Test Sample: Window B Untensioned.
Air temperature: 19.5 ºC Area of window unit, S: 1.26 m2
Air humidity: 31.2 % Window mass per unit area: 27.94 kg/m2
Atmospheric pressure: 0.998 Bar
Receiving room volume: 31.2 m3
Glass Specification: 4 -16 - 4 mm
Source room volume: 343.1 m3
Canopy: n/a
Vent: n/a
Test ID: 705027 Loudspeaker Configuration: L6
Frequency D0.01m,nT
Hz dB
50 30.5
63 37.2
80 27.9
100 31.6 7
125 31.2 10
160 28.5 13
200 27.1 16
250 29.6 19
315 29.1 22
400 27.4 25
500 36.1 26
630 29.7 27
800 30.0 28
1k 20.2 29
1.25k 30.7 30
1.6k 30.8 30
2k 34.0 30
2.5k 35.7 30
3.15k 30.5 30
4k 33.9
5k 31.4 b
D0.01m,nT,w(C;Ctr ) 30 (-2; -4) dB
Tested by Building Performance Centre, Napier University, Edinburgh.
Measured D0.01m,nT dB
0.0
10.0
20.0
30.0
40.0
50.0
60.0
63 125 250 500 1k 2k 4kFrequency (Hz)
Sta
nd
ard
ise
d L
eve
l D
iffe
ren
ce
, D
0.0
1m
,nT
(d
B)
Measured values Shifted Reference Curve
K6-4
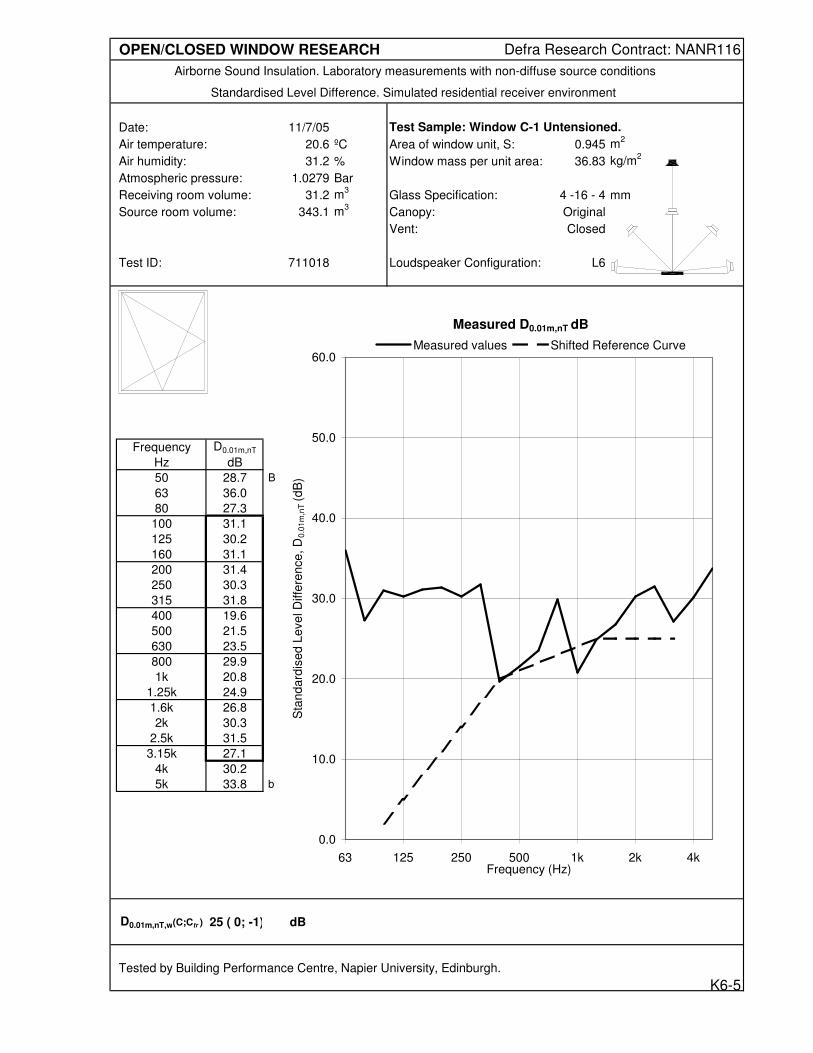
OPEN/CLOSED WINDOW RESEARCH Defra Research Contract: NANR116
Airborne Sound Insulation. Laboratory measurements with non-diffuse source conditions
Standardised Level Difference. Simulated residential receiver environment
Date: 11/7/05 Test Sample: Window C-1 Untensioned.
Air temperature: 20.6 ºC Area of window unit, S: 0.945 m2
Air humidity: 31.2 % Window mass per unit area: 36.83 kg/m2
Atmospheric pressure: 1.0279 Bar
Receiving room volume: 31.2 m3
Glass Specification: 4 -16 - 4 mm
Source room volume: 343.1 m3
Canopy: Original
Vent: Closed
Test ID: 711018 Loudspeaker Configuration: L6
Frequency D0.01m,nT
Hz dB
50 28.7 B
63 36.0
80 27.3
100 31.1 2
125 30.2 5
160 31.1 8
200 31.4 11
250 30.3 14
315 31.8 17
400 19.6 20
500 21.5 21
630 23.5 22
800 29.9 23
1k 20.8 24
1.25k 24.9 25
1.6k 26.8 25
2k 30.3 25
2.5k 31.5 25
3.15k 27.1 25
4k 30.2
5k 33.8 b
D0.01m,nT,w(C;Ctr ) 25 ( 0; -1) dB
Tested by Building Performance Centre, Napier University, Edinburgh.
Measured D0.01m,nT dB
0.0
10.0
20.0
30.0
40.0
50.0
60.0
63 125 250 500 1k 2k 4kFrequency (Hz)
Sta
nd
ard
ise
d L
eve
l D
iffe
ren
ce
, D
0.0
1m
,nT
(d
B)
Measured values Shifted Reference Curve
K6-5
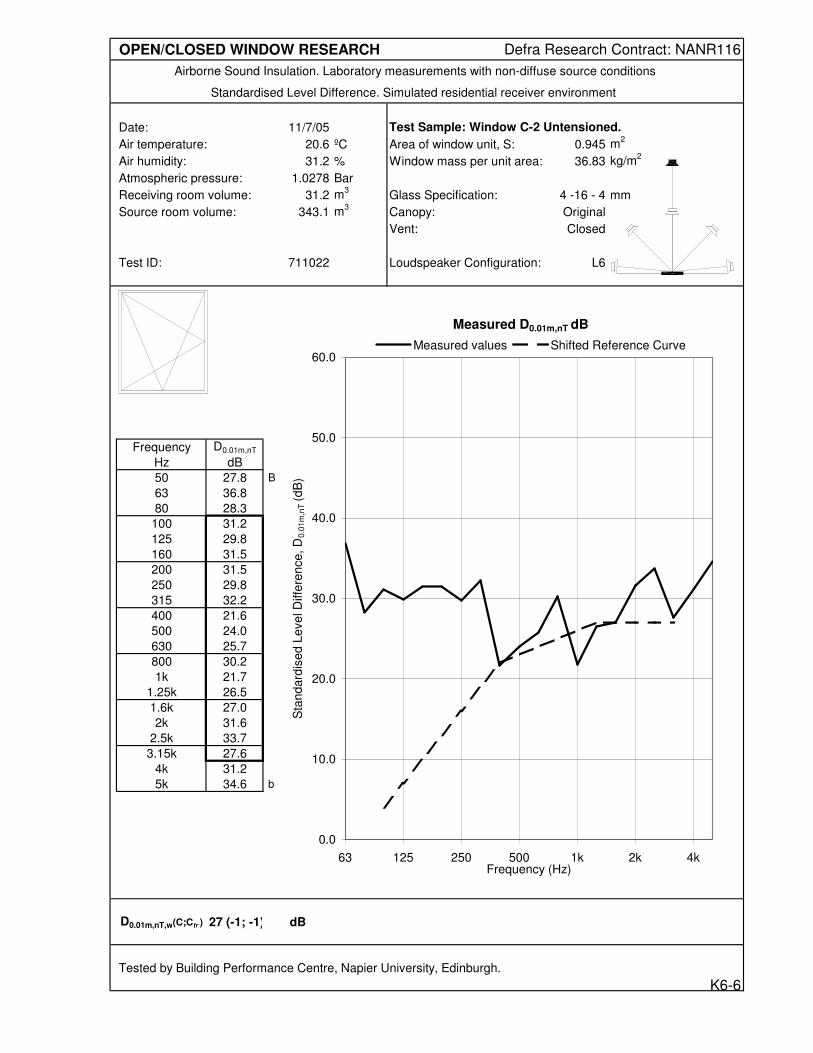
OPEN/CLOSED WINDOW RESEARCH Defra Research Contract: NANR116
Airborne Sound Insulation. Laboratory measurements with non-diffuse source conditions
Standardised Level Difference. Simulated residential receiver environment
Date: 11/7/05 Test Sample: Window C-2 Untensioned.
Air temperature: 20.6 ºC Area of window unit, S: 0.945 m2
Air humidity: 31.2 % Window mass per unit area: 36.83 kg/m2
Atmospheric pressure: 1.0278 Bar
Receiving room volume: 31.2 m3
Glass Specification: 4 -16 - 4 mm
Source room volume: 343.1 m3
Canopy: Original
Vent: Closed
Test ID: 711022 Loudspeaker Configuration: L6
Frequency D0.01m,nT
Hz dB
50 27.8 B
63 36.8
80 28.3
100 31.2 4
125 29.8 7
160 31.5 10
200 31.5 13
250 29.8 16
315 32.2 19
400 21.6 22
500 24.0 23
630 25.7 24
800 30.2 25
1k 21.7 26
1.25k 26.5 27
1.6k 27.0 27
2k 31.6 27
2.5k 33.7 27
3.15k 27.6 27
4k 31.2
5k 34.6 b
D0.01m,nT,w(C;Ctr ) 27 (-1; -1) dB
Tested by Building Performance Centre, Napier University, Edinburgh.
Measured D0.01m,nT dB
0.0
10.0
20.0
30.0
40.0
50.0
60.0
63 125 250 500 1k 2k 4kFrequency (Hz)
Sta
nd
ard
ise
d L
eve
l D
iffe
ren
ce
, D
0.0
1m
,nT
(d
B)
Measured values Shifted Reference Curve
K6-6

OPEN/CLOSED WINDOW RESEARCH Defra Research Contract: NANR116
Airborne Sound Insulation. Laboratory measurements with non-diffuse source conditions
Standardised Level Difference. Simulated residential receiver environment
Date: 17/7/2005 Test Sample: Window C-4 Untensioned.
Air temperature: 20.4 ºC Area of window unit, S: 0.995 m2
Air humidity: 31.2 % Window mass per unit area: 39.20 kg/m2
Atmospheric pressure: 1.0076 Bar
Receiving room volume: 31.2 m3
Glass Specification: 4 -18 - 6.4(lam) mm
Source room volume: 343.1 m3
Canopy: Original
Vent: n/a
Test ID: 717016 Loudspeaker Configuration: L6
Frequency D0.01m,nT
Hz dB
50 31.5 b
63 38.3
80 29.3
100 33.6 4
125 32.5 7
160 34.1 10
200 35.4 13
250 34.8 16
315 33.2 19
400 21.6 22
500 23.4 23
630 26.5 24
800 30.0 25
1k 25.7 26
1.25k 25.5 27
1.6k 27.6 27
2k 28.7 27
2.5k 28.3 27
3.15k 28.2 27
4k 35.3
5k 37.0
D0.01m,nT,w(C;Ctr ) 27 ( 0; 0) dB
Tested by Building Performance Centre, Napier University, Edinburgh.
Measured D0.01m,nT dB
0.0
10.0
20.0
30.0
40.0
50.0
60.0
63 125 250 500 1k 2k 4kFrequency (Hz)
Sta
nd
ard
ise
d L
eve
l D
iffe
ren
ce
, D
0.0
1m
,nT
(d
B)
Measured values Shifted Reference Curve
K6-7

OPEN/CLOSED WINDOW RESEARCH Defra Research Contract: NANR116
Airborne Sound Insulation. Laboratory measurements with non-diffuse source conditions
Standardised Level Difference. Simulated residential receiver environment
Date: 13/7/2005 Test Sample: Window D-1 Untensioned.
Air temperature: 21.8 ºC Area of window unit, S: 1.26 m2
Air humidity: 31.2 % Window mass per unit area: 27.94 kg/m2
Atmospheric pressure: 1.0185 Bar
Receiving room volume: 31.2 m3
Glass Specification: 4 -16 - 4 mm
Source room volume: 343.1 m3
Canopy: n/a
Vent: n/a
Test ID: 713016 Loudspeaker Configuration: L6
Frequency D0.01m,nT
Hz dB
50 29.9 B
63 43.4 b
80 35.3
100 39.8 18
125 38.6 21
160 34.0 24
200 37.9 27
250 36.4 30
315 37.8 33
400 32.9 36
500 37.2 37
630 38.7 38
800 46.0 39
1k 38.3 40
1.25k 40.1 41
1.6k 39.4 41
2k 46.5 41
2.5k 45.5 41
3.15k 46.6 41
4k 41.8
5k 36.6 b
D0.01m,nT,w(C;Ctr ) 41 (-1; -2) dB
Tested by Building Performance Centre, Napier University, Edinburgh.
Measured D0.01m,nT dB
10.0
20.0
30.0
40.0
50.0
60.0
70.0
63 125 250 500 1k 2k 4kFrequency (Hz)
Sta
nd
ard
ise
d L
eve
l D
iffe
ren
ce
, D
0.0
1m
,nT
(d
B)
Measured values Shifted Reference Curve
K6-8

OPEN/CLOSED WINDOW RESEARCH Defra Research Contract: NANR116
Airborne Sound Insulation. Laboratory measurements with non-diffuse source conditions
Standardised Level Difference. Simulated residential receiver environment
Date: 18/7/2005 Test Sample: Window E Untensioned.
Air temperature: 20.4 ºC Area of window unit, S: 0.63 m2
Air humidity: 31.2 % Window mass per unit area: 26.83 kg/m2
Atmospheric pressure: 0.9956 Bar
Receiving room volume: 31.2 m3
Glass Specification: 4 -16 - 4 mm
Source room volume: 343.1 m3
Canopy: n/a
Vent: n/a
Test ID: 718027 Loudspeaker Configuration: L6
Frequency D0.01m,nT
Hz dB
50 33.5
63 43.3
80 37.6
100 42.5 25
125 42.4 28
160 39.0 31
200 31.4 34
250 42.7 37
315 49.6 40
400 45.5 43
500 49.4 44
630 47.6 45
800 45.4 46
1k 50.9 47
1.25k 53.6 48
1.6k 57.1 48
2k 51.5 48
2.5k 45.6 48
3.15k 45.5 48
4k 55.3
5k 58.8
D0.01m,nT,w(C;Ctr ) 48 (-1; -3) dB
Tested by Building Performance Centre, Napier University, Edinburgh.
Measured D0.01m,nT dB
20.0
30.0
40.0
50.0
60.0
70.0
80.0
63 125 250 500 1k 2k 4kFrequency (Hz)
Sta
nd
ard
ise
d L
eve
l D
iffe
ren
ce
, D
0.0
1m
,nT
(d
B)
Measured values Shifted Reference Curve
K6-9

OPEN/CLOSED WINDOW RESEARCH Defra Research Contract: NANR116
Airborne Sound Insulation. Laboratory measurements with non-diffuse source conditions
Standardised Level Difference. Simulated residential receiver environment
Date: 19/7/2005 Test Sample: Window F Untensioned.
Air temperature: 19.9 ºC Area of window unit, S: 0.63 m2
Air humidity: 31.2 % Window mass per unit area: 26.83 kg/m2
Atmospheric pressure: 1.0019 Bar
Receiving room volume: 31.2 m3
Glass Specification: 4 -16 - 4 mm
Source room volume: 343.1 m3
Canopy: n/a
Vent: n/a
Test ID: 719002 Loudspeaker Configuration: L6
Frequency D0.01m,nT
Hz dB
50 35.2
63 46.4
80 32.5
100 36.7 16
125 37.6 19
160 34.9 22
200 27.8 25
250 43.3 28
315 42.0 31
400 35.4 34
500 41.5 35
630 35.6 36
800 36.2 37
1k 34.6 38
1.25k 40.6 39
1.6k 47.4 39
2k 46.5 39
2.5k 45.3 39
3.15k 40.7 39
4k 39.8
5k 45.6
D0.01m,nT,w(C;Ctr ) 39 ( 0; -2) dB
Tested by Building Performance Centre, Napier University, Edinburgh.
Measured D0.01m,nT dB
10.0
20.0
30.0
40.0
50.0
60.0
70.0
63 125 250 500 1k 2k 4kFrequency (Hz)
Sta
nd
ard
ise
d L
eve
l D
iffe
ren
ce
, D
0.0
1m
,nT
(d
B)
Measured values Shifted Reference Curve
K6-10

OPEN/CLOSED WINDOW RESEARCH Defra Research Contract: NANR116
Airborne Sound Insulation. Laboratory measurements with non-diffuse source conditions
Standardised Level Difference. Simulated residential receiver environment
Date: 20/7/2005 Test Sample: Window G Untensioned.
Air temperature: 20.3 ºC Area of window unit, S: 0.54 m2
Air humidity: 31.2 % Window mass per unit area: 33.33 kg/m2
Atmospheric pressure: 1.0032 Bar
Receiving room volume: 31.2 m3
Glass Specification: 4 -16 - 4 mm
Source room volume: 343.1 m3
Canopy: n/a
Vent: Blocked
Test ID: 720002 Loudspeaker Configuration: L6
Frequency D0.01m,nT
Hz dB
50 34.2
63 41.6
80 40.6
100 43.5 21
125 43.2 24
160 38.4 27
200 39.2 30
250 38.2 33
315 46.7 36
400 43.6 39
500 41.8 40
630 39.0 41
800 48.6 42
1k 44.2 43
1.25k 51.7 44
1.6k 50.0 44
2k 47.3 44
2.5k 41.4 44
3.15k 38.5 44
4k 49.2
5k 51.2
D0.01m,nT,w(C;Ctr ) 44 (-1; -1) dB
Tested by Building Performance Centre, Napier University, Edinburgh.
Measured D0.01m,nT dB
20.0
30.0
40.0
50.0
60.0
70.0
80.0
63 125 250 500 1k 2k 4kFrequency (Hz)
Sta
nd
ard
ise
d L
eve
l D
iffe
ren
ce
, D
0.0
1m
,nT
(d
B)
Measured values Shifted Reference Curve
K6-11

OPEN/CLOSED WINDOW RESEARCH Defra Research Contract: NANR116
Airborne Sound Insulation. Laboratory measurements with non-diffuse source conditions
Standardised Level Difference. Simulated residential receiver environment
Date: 28/6/2005 Test Sample: Window A-1 Untensioned.
Air temperature: 20.7 ºC Area of window unit, S: 2.52 m2
Air humidity: 31.2 % Window mass per unit area: 30.00 kg/m2
Atmospheric pressure: 1.009 Bar
Receiving room volume: 31.2 m3
Glass Specification: 4 -16 - 4 mm
Source room volume: 343.1 m3
Canopy: n/a
Vent: n/a
Test ID: 628108 Loudspeaker Configuration: Line
Frequency D0.01m,nT
Hz dB
50 29.7
63 36.2
80 28.8
100 36.4 11
125 30.9 14
160 24.1 17
200 27.0 20
250 31.9 23
315 33.3 26
400 35.8 29
500 39.2 30
630 33.0 31
800 35.9 32
1k 29.5 33
1.25k 30.8 34
1.6k 32.4 34
2k 34.8 34
2.5k 36.0 34
3.15k 36.5 34
4k 38.3
5k 37.7
D0.01m,nT,w(C;Ctr ) 34 (-1; -2) dB
Tested by Building Performance Centre, Napier University, Edinburgh.
Measured D0.01m,nT dB
10.0
20.0
30.0
40.0
50.0
60.0
70.0
63 125 250 500 1k 2k 4kFrequency (Hz)
Sta
nd
ard
ise
d L
eve
l D
iffe
ren
ce
, D
0.0
1m
,nT
(d
B)
Measured values Shifted Reference Curve
K7-1
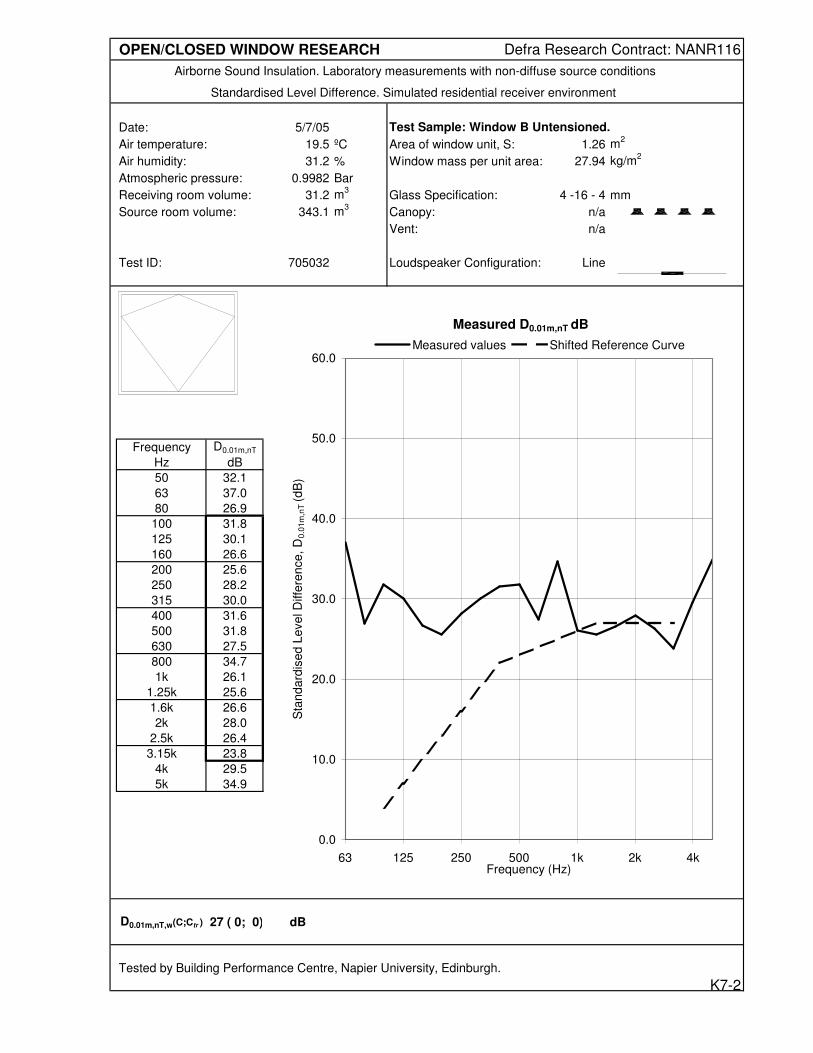
OPEN/CLOSED WINDOW RESEARCH Defra Research Contract: NANR116
Airborne Sound Insulation. Laboratory measurements with non-diffuse source conditions
Standardised Level Difference. Simulated residential receiver environment
Date: 5/7/05 Test Sample: Window B Untensioned.
Air temperature: 19.5 ºC Area of window unit, S: 1.26 m2
Air humidity: 31.2 % Window mass per unit area: 27.94 kg/m2
Atmospheric pressure: 0.9982 Bar
Receiving room volume: 31.2 m3
Glass Specification: 4 -16 - 4 mm
Source room volume: 343.1 m3
Canopy: n/a
Vent: n/a
Test ID: 705032 Loudspeaker Configuration: Line
Frequency D0.01m,nT
Hz dB
50 32.1
63 37.0
80 26.9
100 31.8 4
125 30.1 7
160 26.6 10
200 25.6 13
250 28.2 16
315 30.0 19
400 31.6 22
500 31.8 23
630 27.5 24
800 34.7 25
1k 26.1 26
1.25k 25.6 27
1.6k 26.6 27
2k 28.0 27
2.5k 26.4 27
3.15k 23.8 27
4k 29.5
5k 34.9
D0.01m,nT,w(C;Ctr ) 27 ( 0; 0) dB
Tested by Building Performance Centre, Napier University, Edinburgh.
Measured D0.01m,nT dB
0.0
10.0
20.0
30.0
40.0
50.0
60.0
63 125 250 500 1k 2k 4kFrequency (Hz)
Sta
nd
ard
ise
d L
eve
l D
iffe
ren
ce
, D
0.0
1m
,nT
(d
B)
Measured values Shifted Reference Curve
K7-2

OPEN/CLOSED WINDOW RESEARCH Defra Research Contract: NANR116
Airborne Sound Insulation. Laboratory measurements with non-diffuse source conditions
Standardised Level Difference. Simulated residential receiver environment
Date: 11/7/05 Test Sample: Window C-1 Untensioned.
Air temperature: 20.7 ºC Area of window unit, S: 0.945 m2
Air humidity: 31.2 % Window mass per unit area: 36.83 kg/m2
Atmospheric pressure: 1.0272 Bar
Receiving room volume: 31.2 m3
Glass Specification: 4 -16 - 4 mm
Source room volume: 343.1 m3
Canopy: Original
Vent: Closed
Test ID: 711069 Loudspeaker Configuration: Line
Frequency D0.01m,nT
Hz dB
50 29.4 b
63 36.3
80 27.4
100 31.2 4
125 29.5 7
160 30.3 10
200 34.3 13
250 20.1 16
315 23.1 19
400 26.1 22
500 33.3 23
630 26.8 24
800 25.3 25
1k 24.1 26
1.25k 26.7 27
1.6k 27.0 27
2k 34.0 27
2.5k 31.0 27
3.15k 26.6 27
4k 27.2
5k 31.0
D0.01m,nT,w(C;Ctr ) 27 ( 0; -1) dB
Tested by Building Performance Centre, Napier University, Edinburgh.
Measured D0.01m,nT dB
0.0
10.0
20.0
30.0
40.0
50.0
60.0
63 125 250 500 1k 2k 4kFrequency (Hz)
Sta
nd
ard
ise
d L
eve
l D
iffe
ren
ce
, D
0.0
1m
,nT
(d
B)
Measured values Shifted Reference Curve
K7-3

OPEN/CLOSED WINDOW RESEARCH Defra Research Contract: NANR116
Airborne Sound Insulation. Laboratory measurements with non-diffuse source conditions
Standardised Level Difference. Simulated residential receiver environment
Date: 11/7/05 Test Sample: Window C-2 Untensioned.
Air temperature: 20.7 ºC Area of window unit, S: 0.945 m2
Air humidity: 31.2 % Window mass per unit area: 36.83 kg/m2
Atmospheric pressure: 1.0272 Bar
Receiving room volume: 31.2 m3
Glass Specification: 4 -16 - 4 mm
Source room volume: 343.1 m3
Canopy: Original
Vent: Closed
Test ID: 711073 Loudspeaker Configuration: Line
Frequency D0.01m,nT
Hz dB
50 29.7 b
63 36.6
80 27.9
100 31.2 5
125 29.5 8
160 30.4 11
200 33.9 14
250 21.8 17
315 24.9 20
400 28.1 23
500 33.1 24
630 26.5 25
800 26.9 26
1k 25.3 27
1.25k 28.6 28
1.6k 27.5 28
2k 33.7 28
2.5k 31.3 28
3.15k 26.7 28
4k 26.9
5k 34.2
D0.01m,nT,w(C;Ctr ) 28 ( 0; -1) dB
Tested by Building Performance Centre, Napier University, Edinburgh.
Measured D0.01m,nT dB
0.0
10.0
20.0
30.0
40.0
50.0
60.0
63 125 250 500 1k 2k 4kFrequency (Hz)
Sta
nd
ard
ise
d L
eve
l D
iffe
ren
ce
, D
0.0
1m
,nT
(d
B)
Measured values Shifted Reference Curve
K7-4

OPEN/CLOSED WINDOW RESEARCH Defra Research Contract: NANR116
Airborne Sound Insulation. Laboratory measurements with non-diffuse source conditions
Standardised Level Difference. Simulated residential receiver environment
Date: 12/7/05 Test Sample: Window C-3 Untensioned.
Air temperature: 20.9 ºC Area of window unit, S: 0.945 m2
Air humidity: 31.2 % Window mass per unit area: 36.83 kg/m2
Atmospheric pressure: 1.0254 Bar
Receiving room volume: 31.2 m3
Glass Specification: 4 -18 - 6.4(lam) mm
Source room volume: 343.1 m3
Canopy: n/a
Vent: Vent 1 closed
Test ID: 712005 Loudspeaker Configuration: Line
Frequency D0.01m,nT
Hz dB
50 30.4
63 36.8
80 27.9
100 32.2 5
125 30.4 8
160 33.3 11
200 35.4 14
250 23.2 17
315 25.9 20
400 26.8 23
500 33.7 24
630 27.3 25
800 24.7 26
1k 24.3 27
1.25k 26.9 28
1.6k 29.2 28
2k 34.7 28
2.5k 29.6 28
3.15k 24.5 28
4k 27.2
5k 35.5
D0.01m,nT,w(C;Ctr ) 28 (-1; -1) dB
Tested by Building Performance Centre, Napier University, Edinburgh.
Measured D0.01m,nT dB
0.0
10.0
20.0
30.0
40.0
50.0
60.0
63 125 250 500 1k 2k 4kFrequency (Hz)
Sta
nd
ard
ise
d L
eve
l D
iffe
ren
ce
, D
0.0
1m
,nT
(d
B)
Measured values Shifted Reference Curve
K7-5

OPEN/CLOSED WINDOW RESEARCH Defra Research Contract: NANR116
Airborne Sound Insulation. Laboratory measurements with non-diffuse source conditions
Standardised Level Difference. Simulated residential receiver environment
Date: 12/7/05 Test Sample: Window C-4 Untensioned.
Air temperature: 20.9 ºC Area of window unit, S: 0.945 m2
Air humidity: 31.2 % Window mass per unit area: 36.83 kg/m2
Atmospheric pressure: 1.0254 Bar
Receiving room volume: 31.2 m3
Glass Specification: 4 -18 - 6.4(lam) mm
Source room volume: 343.1 m3
Canopy: n/a
Vent: Vent 1 closed
Test ID: 712009 Loudspeaker Configuration: Line
Frequency D0.01m,nT
Hz dB
50 33.7
63 39.9
80 31.0
100 35.3 8
125 33.4 11
160 35.7 14
200 38.7 17
250 26.7 20
315 29.3 23
400 30.5 26
500 35.7 27
630 28.5 28
800 26.3 29
1k 26.8 30
1.25k 31.8 31
1.6k 35.2 31
2k 39.5 31
2.5k 34.8 31
3.15k 26.4 31
4k 28.0
5k 39.0
D0.01m,nT,w(C;Ctr ) 31 (-1; -2) dB
Tested by Building Performance Centre, Napier University, Edinburgh.
Measured D0.01m,nT dB
0.0
10.0
20.0
30.0
40.0
50.0
60.0
63 125 250 500 1k 2k 4kFrequency (Hz)
Sta
nd
ard
ise
d L
eve
l D
iffe
ren
ce
, D
0.0
1m
,nT
(d
B)
Measured values Shifted Reference Curve
K7-6

OPEN/CLOSED WINDOW RESEARCH Defra Research Contract: NANR116
Airborne Sound Insulation. Laboratory measurements with non-diffuse source conditions
Standardised Level Difference. Simulated residential receiver environment
Date: 13/7/2005 Test Sample: Window D-1 Untensioned.
Air temperature: 21.8 ºC Area of window unit, S: 1.26 m2
Air humidity: 31.2 % Window mass per unit area: 27.94 kg/m2
Atmospheric pressure: 1.0175 Bar
Receiving room volume: 31.2 m3
Glass Specification: 4 -16 - 4 mm
Source room volume: 343.1 m3
Canopy: n/a
Vent: n/a
Test ID: 713058 Loudspeaker Configuration: Line
Frequency D0.01m,nT
Hz dB
50 34.9 b
63 43.8
80 34.5
100 40.2 16
125 38.2 19
160 32.8 22
200 37.2 25
250 29.6 28
315 42.3 31
400 42.7 34
500 36.4 35
630 37.2 36
800 38.2 37
1k 37.5 38
1.25k 42.7 39
1.6k 40.5 39
2k 43.2 39
2.5k 37.7 39
3.15k 42.1 39
4k 43.7
5k 46.7
D0.01m,nT,w(C;Ctr ) 39 ( 0; -1) dB
Tested by Building Performance Centre, Napier University, Edinburgh.
Measured D0.01m,nT dB
10.0
20.0
30.0
40.0
50.0
60.0
70.0
63 125 250 500 1k 2k 4kFrequency (Hz)
Sta
nd
ard
ise
d L
eve
l D
iffe
ren
ce
, D
0.0
1m
,nT
(d
B)
Measured values Shifted Reference Curve
K7-7

OPEN/CLOSED WINDOW RESEARCH Defra Research Contract: NANR116
Airborne Sound Insulation. Laboratory measurements with non-diffuse source conditions
Standardised Level Difference. Simulated residential receiver environment
Date: 18/7/2005 Test Sample: Window E Untensioned.
Air temperature: 20.5 ºC Area of window unit, S: 0.63 m2
Air humidity: 31.2 % Window mass per unit area: 26.83 kg/m2
Atmospheric pressure: 0.9959 Bar
Receiving room volume: 31.2 m3
Glass Specification: 4 -16 - 4 mm
Source room volume: 343.1 m3
Canopy: n/a
Vent: n/a
Test ID: 718030 Loudspeaker Configuration: Line
Frequency D0.01m,nT
Hz dB
50 43.9 b
63 43.7
80 35.7
100 42.9 27
125 42.8 30
160 39.4 33
200 30.8 36
250 35.9 39
315 51.7 42
400 52.9 45
500 50.8 46
630 51.9 47
800 53.8 48
1k 50.4 49
1.25k 55.1 50
1.6k 54.6 50
2k 51.1 50
2.5k 51.8 50
3.15k 48.4 50
4k 50.3
5k 58.7
D0.01m,nT,w(C;Ctr ) 50 (-2; -6) dB
Tested by Building Performance Centre, Napier University, Edinburgh.
Measured D0.01m,nT dB
20.0
30.0
40.0
50.0
60.0
70.0
80.0
63 125 250 500 1k 2k 4kFrequency (Hz)
Sta
nd
ard
ise
d L
eve
l D
iffe
ren
ce
, D
0.0
1m
,nT
(d
B)
Measured values Shifted Reference Curve
K7-8

OPEN/CLOSED WINDOW RESEARCH Defra Research Contract: NANR116
Airborne Sound Insulation. Laboratory measurements with non-diffuse source conditions
Standardised Level Difference. Simulated residential receiver environment
Date: 19/7/2005 Test Sample: Window F Untensioned.
Air temperature: 20.1 ºC Area of window unit, S: 0.63 m2
Air humidity: 31.2 % Window mass per unit area: 26.83 kg/m2
Atmospheric pressure: 1.0023 Bar
Receiving room volume: 31.2 m3
Glass Specification: 4 -16 - 4 mm
Source room volume: 343.1 m3
Canopy: n/a
Vent: n/a
Test ID: 719013 Loudspeaker Configuration: Line
Frequency D0.01m,nT
Hz dB
50 42.3 b
63 46.0
80 31.9
100 36.8 16
125 37.1 19
160 35.0 22
200 27.5 25
250 34.9 28
315 38.8 31
400 41.6 34
500 44.5 35
630 40.5 36
800 33.3 37
1k 36.2 38
1.25k 38.9 39
1.6k 42.4 39
2k 42.2 39
2.5k 40.8 39
3.15k 39.3 39
4k 35.0
5k 46.0
D0.01m,nT,w(C;Ctr ) 39 (-1; -2) dB
Tested by Building Performance Centre, Napier University, Edinburgh.
Measured D0.01m,nT dB
10.0
20.0
30.0
40.0
50.0
60.0
70.0
63 125 250 500 1k 2k 4kFrequency (Hz)
Sta
nd
ard
ise
d L
eve
l D
iffe
ren
ce
, D
0.0
1m
,nT
(d
B)
Measured values Shifted Reference Curve
K7-9

OPEN/CLOSED WINDOW RESEARCH Defra Research Contract: NANR116
Airborne Sound Insulation. Laboratory measurements with non-diffuse source conditions
Standardised Level Difference. Simulated residential receiver environment
Date: 20/7/2005 Test Sample: Window G Untensioned.
Air temperature: 20.3 ºC Area of window unit, S: 0.54 m2
Air humidity: 31.2 % Window mass per unit area: 33.33 kg/m2
Atmospheric pressure: 1.0032 Bar
Receiving room volume: 31.2 m3
Glass Specification: 4 -16 - 4 mm
Source room volume: 343.1 m3
Canopy: n/a
Vent: n/a
Test ID: 720013 Loudspeaker Configuration: Line
Frequency D0.01m,nT
Hz dB
50 42.7 b
63 46.6
80 34.9
100 41.4 16
125 41.5 19
160 37.5 22
200 39.4 25
250 33.2 28
315 40.4 31
400 42.1 34
500 44.4 35
630 36.7 36
800 33.9 37
1k 34.0 38
1.25k 39.0 39
1.6k 44.1 39
2k 45.3 39
2.5k 40.1 39
3.15k 37.5 39
4k 41.7
5k 45.4
D0.01m,nT,w(C;Ctr ) 39 (-1; -2) dB
Tested by Building Performance Centre, Napier University, Edinburgh.
Measured D0.01m,nT dB
10.0
20.0
30.0
40.0
50.0
60.0
70.0
63 125 250 500 1k 2k 4kFrequency (Hz)
Sta
nd
ard
ise
d L
eve
l D
iffe
ren
ce
, D
0.0
1m
,nT
(d
B)
Measured values Shifted Reference Curve
K7-10

OPEN/CLOSED WINDOW RESEARCH Defra Research Contract: NANR116
Airborne Sound Insulation. Laboratory measurements with non-diffuse source conditions
Standardised Level Difference. Simulated residential receiver environment
Date: 28/6/2005 Test Sample: Window A-1 Open 0.05 m2
Air temperature: 20.5 ºC Area of window unit, S: 2.52 m2
Air humidity: 31.2 % Window mass per unit area: 30.00 kg/m2
Atmospheric pressure: 1.0109 Bar
Receiving room volume: 31.2 m3
Glass Specification: 4 -16 - 4 mm
Source room volume: 343.1 m3
Canopy: n/a
Vent: n/a
Test ID: 628014 Loudspeaker Configuration: L1
Frequency D0.01m,nT
Hz dB
50 20.9
63 27.6
80 21.3
100 28.3 -2
125 23.9 1
160 19.0 4
200 19.6 7
250 22.4 10
315 23.6 13
400 21.3 16
500 21.7 17
630 18.2 18
800 24.4 19
1k 20.9 20
1.25k 20.9 21
1.6k 20.5 21
2k 19.4 21
2.5k 20.2 21
3.15k 24.5 21
4k 22.7
5k 22.3
D0.01m,nT,w(C;Ctr ) 21 ( 0; 0) dB
Tested by Building Performance Centre, Napier University, Edinburgh.
Measured D0.01m,nT dB
0.0
10.0
20.0
30.0
40.0
50.0
60.0
63 125 250 500 1k 2k 4kFrequency (Hz)
Sta
nd
ard
ise
d L
eve
l D
iffe
ren
ce
, D
0.0
1m
,nT
(d
B)
Measured values Shifted Reference Curve
L1-1

OPEN/CLOSED WINDOW RESEARCH Defra Research Contract: NANR116
Airborne Sound Insulation. Laboratory measurements with non-diffuse source conditions
Standardised Level Difference. Simulated residential receiver environment
Date: 28/6/2005 Test Sample: Window A-2 Open 0.05 m2
Air temperature: 20.5 ºC Area of window unit, S: 2.52 m2
Air humidity: 31.2 % Window mass per unit area: 30.00 kg/m2
Atmospheric pressure: 1.0112 Bar
Receiving room volume: 31.2 m3
Glass Specification: 4 -16 - 4 mm
Source room volume: 343.1 m3
Canopy: n/a
Vent: n/a
Test ID: 628009 Loudspeaker Configuration: L1
Frequency D0.01m,nT
Hz dB
50 21.0
63 28.0
80 21.1
100 27.0 -2
125 23.6 1
160 19.6 4
200 20.6 7
250 21.6 10
315 23.6 13
400 20.1 16
500 21.3 17
630 18.4 18
800 23.7 19
1k 20.3 20
1.25k 21.4 21
1.6k 20.8 21
2k 20.8 21
2.5k 20.2 21
3.15k 23.7 21
4k 21.8
5k 21.2
D0.01m,nT,w(C;Ctr ) 21 ( 0; 0) dB
Tested by Building Performance Centre, Napier University, Edinburgh.
Measured D0.01m,nT dB
0.0
10.0
20.0
30.0
40.0
50.0
60.0
63 125 250 500 1k 2k 4kFrequency (Hz)
Sta
nd
ard
ise
d L
eve
l D
iffe
ren
ce
, D
0.0
1m
,nT
(d
B)
Measured values Shifted Reference Curve
L1-2

OPEN/CLOSED WINDOW RESEARCH Defra Research Contract: NANR116
Airborne Sound Insulation. Laboratory measurements with non-diffuse source conditions
Standardised Level Difference. Simulated residential receiver environment
Date: 28/6/2005 Test Sample: Window A-3 Open 0.05 m2
Air temperature: 20.5 ºC Area of window unit, S: 2.52 m2
Air humidity: 31.2 % Window mass per unit area: 30.00 kg/m2
Atmospheric pressure: 1.0112 Bar
Receiving room volume: 31.2 m3
Glass Specification: 4 -16 - 4 mm
Source room volume: 343.1 m3
Canopy: n/a
Vent: n/a
Test ID: 628004 Loudspeaker Configuration: L1
Frequency D0.01m,nT
Hz dB
50 21.6
63 27.9
80 18.6
100 25.0 -3
125 20.5 0
160 19.1 3
200 20.1 6
250 18.4 9
315 20.2 12
400 21.0 15
500 23.7 16
630 22.3 17
800 18.7 18
1k 19.5 19
1.25k 20.8 20
1.6k 20.9 20
2k 16.1 20
2.5k 19.0 20
3.15k 22.7 20
4k 20.5
5k 20.6
D0.01m,nT,w(C;Ctr ) 20 ( 0; 0) dB
Tested by Building Performance Centre, Napier University, Edinburgh.
Measured D0.01m,nT dB
0.0
10.0
20.0
30.0
40.0
50.0
60.0
63 125 250 500 1k 2k 4kFrequency (Hz)
Sta
nd
ard
ise
d L
eve
l D
iffe
ren
ce
, D
0.0
1m
,nT
(d
B)
Measured values Shifted Reference Curve
L1-3

OPEN/CLOSED WINDOW RESEARCH Defra Research Contract: NANR116
Airborne Sound Insulation. Laboratory measurements with non-diffuse source conditions
Standardised Level Difference. Simulated residential receiver environment
Date: 5/7/05 Test Sample: Window B Open 0.05 m2
Air temperature: 18.8 ºC Area of window unit, S: 1.26 m2
Air humidity: 31.2 % Window mass per unit area: 27.94 kg/m2
Atmospheric pressure: 0.9984 Bar
Receiving room volume: 31.2 m3
Glass Specification: 4 -16 - 4 mm
Source room volume: 343.1 m3
Canopy: n/a
Vent: n/a
Test ID: 705003 Loudspeaker Configuration: L1
Frequency D0.01m,nT
Hz dB
50 24.4
63 29.7
80 19.8
100 24.4 -6
125 21.8 -3
160 19.5 0
200 20.4 3
250 21.8 6
315 21.9 9
400 22.1 12
500 20.3 13
630 13.7 14
800 20.5 15
1k 17.5 16
1.25k 18.5 17
1.6k 16.5 17
2k 18.0 17
2.5k 15.5 17
3.15k 17.1 17
4k 21.5
5k 26.7
D0.01m,nT,w(C;Ctr ) 17 ( 0; 1) dB
Tested by Building Performance Centre, Napier University, Edinburgh.
Measured D0.01m,nT dB
0.0
10.0
20.0
30.0
40.0
50.0
60.0
63 125 250 500 1k 2k 4kFrequency (Hz)
Sta
nd
ard
ise
d L
eve
l D
iffe
ren
ce
, D
0.0
1m
,nT
(d
B)
Measured values Shifted Reference Curve
L1-4

OPEN/CLOSED WINDOW RESEARCH Defra Research Contract: NANR116
Airborne Sound Insulation. Laboratory measurements with non-diffuse source conditions
Standardised Level Difference. Simulated residential receiver environment
Date: 11/7/05 Test Sample: Window C-1 Open 0.05 m2
Air temperature: 20.4 ºC Area of window unit, S: 0.945 m2
Air humidity: 31.2 % Window mass per unit area: 36.83 kg/m2
Atmospheric pressure: 1.0282 Bar
Receiving room volume: 31.2 m3
Glass Specification: 4 -16 - 4 mm
Source room volume: 343.1 m3
Canopy: Original
Vent: Closed
Test ID: 711006 Loudspeaker Configuration: L1
Frequency D0.01m,nT
Hz dB
50 25.3
63 31.8
80 22.6
100 27.1 -4
125 24.1 -1
160 27.4 2
200 25.8 5
250 21.2 8
315 20.0 11
400 20.9 14
500 18.1 15
630 10.2 16
800 15.1 17
1k 19.2 18
1.25k 22.0 19
1.6k 20.0 19
2k 20.7 19
2.5k 20.4 19
3.15k 26.2 19
4k 27.1
5k 26.7
D0.01m,nT,w(C;Ctr ) 19 (-1; -2) dB
Tested by Building Performance Centre, Napier University, Edinburgh.
Measured D0.01m,nT dB
0.0
10.0
20.0
30.0
40.0
50.0
60.0
63 125 250 500 1k 2k 4kFrequency (Hz)
Sta
nd
ard
ise
d L
eve
l D
iffe
ren
ce
, D
0.0
1m
,nT
(d
B)
Measured values Shifted Reference Curve
L1-5

OPEN/CLOSED WINDOW RESEARCH Defra Research Contract: NANR116
Airborne Sound Insulation. Laboratory measurements with non-diffuse source conditions
Standardised Level Difference. Simulated residential receiver environment
Date: 11/7/05 Test Sample: Window C-2 Open 0.05 m2
Air temperature: 20.5 ºC Area of window unit, S: 0.945 m2
Air humidity: 31.2 % Window mass per unit area: 36.83 kg/m2
Atmospheric pressure: 1.0281 Bar
Receiving room volume: 31.2 m3
Glass Specification: 4 -16 - 4 mm
Source room volume: 343.1 m3
Canopy: Original
Vent: Closed
Test ID: 711010 Loudspeaker Configuration: L1
Frequency D0.01m,nT
Hz dB
50 24.7
63 31.2
80 22.4
100 26.8 -4
125 23.9 -1
160 25.4 2
200 23.9 5
250 22.0 8
315 21.7 11
400 22.3 14
500 16.8 15
630 9.3 16
800 17.1 17
1k 17.6 18
1.25k 18.7 19
1.6k 22.8 19
2k 20.5 19
2.5k 22.6 19
3.15k 26.6 19
4k 24.5
5k 26.2
D0.01m,nT,w(C;Ctr ) 19 (-1; -2) dB
Tested by Building Performance Centre, Napier University, Edinburgh.
Measured D0.01m,nT dB
0.0
10.0
20.0
30.0
40.0
50.0
60.0
63 125 250 500 1k 2k 4kFrequency (Hz)
Sta
nd
ard
ise
d L
eve
l D
iffe
ren
ce
, D
0.0
1m
,nT
(d
B)
Measured values Shifted Reference Curve
L1-6

OPEN/CLOSED WINDOW RESEARCH Defra Research Contract: NANR116
Airborne Sound Insulation. Laboratory measurements with non-diffuse source conditions
Standardised Level Difference. Simulated residential receiver environment
Date: 12/7/05 Test Sample: Window C-3 Open 0.05 m2
Air temperature: 21 ºC Area of window unit, S: 0.945 m2
Air humidity: 31.2 % Window mass per unit area: 36.83 kg/m2
Atmospheric pressure: 1.0252 Bar
Receiving room volume: 31.2 m3
Glass Specification: 4 -18 - 6.4(lam) mm
Source room volume: 343.1 m3
Canopy: n/a
Vent: Vent 1 closed
Test ID: 712032 Loudspeaker Configuration: L1
Frequency D0.01m,nT
Hz dB
50 24.4
63 31.4
80 22.2
100 27.3 -4
125 24.7 -1
160 27.9 2
200 26.6 5
250 23.4 8
315 20.4 11
400 19.7 14
500 18.3 15
630 8.2 16
800 14.5 17
1k 17.7 18
1.25k 21.8 19
1.6k 22.6 19
2k 20.8 19
2.5k 19.6 19
3.15k 23.8 19
4k 25.5
5k 30.3
D0.01m,nT,w(C;Ctr ) 19 (-2; -3) dB
Tested by Building Performance Centre, Napier University, Edinburgh.
Measured D0.01m,nT dB
0.0
10.0
20.0
30.0
40.0
50.0
60.0
63 125 250 500 1k 2k 4kFrequency (Hz)
Sta
nd
ard
ise
d L
eve
l D
iffe
ren
ce
, D
0.0
1m
,nT
(d
B)
Measured values Shifted Reference Curve
L1-7

OPEN/CLOSED WINDOW RESEARCH Defra Research Contract: NANR116
Airborne Sound Insulation. Laboratory measurements with non-diffuse source conditions
Standardised Level Difference. Simulated residential receiver environment
Date: 12/7/05 Test Sample: Window C-4 Open 0.05 m2
Air temperature: 21.1 ºC Area of window unit, S: 0.945 m2
Air humidity: 31.2 % Window mass per unit area: 36.83 kg/m2
Atmospheric pressure: 1.025 Bar
Receiving room volume: 31.2 m3
Glass Specification: 4 -18 - 6.4(lam) mm
Source room volume: 343.1 m3
Canopy: n/a
Vent: Vent 1 closed
Test ID: 712036 Loudspeaker Configuration: L1
Frequency D0.01m,nT
Hz dB
50 24.3
63 31.2
80 22.6
100 27.4 -4
125 24.8 -1
160 26.7 2
200 25.0 5
250 24.2 8
315 22.8 11
400 21.6 14
500 17.3 15
630 8.7 16
800 18.0 17
1k 16.1 18
1.25k 19.4 19
1.6k 23.3 19
2k 20.1 19
2.5k 22.3 19
3.15k 25.7 19
4k 24.4
5k 28.5
D0.01m,nT,w(C;Ctr ) 19 (-2; -2) dB
Tested by Building Performance Centre, Napier University, Edinburgh.
Measured D0.01m,nT dB
0.0
10.0
20.0
30.0
40.0
50.0
60.0
63 125 250 500 1k 2k 4kFrequency (Hz)
Sta
nd
ard
ise
d L
eve
l D
iffe
ren
ce
, D
0.0
1m
,nT
(d
B)
Measured values Shifted Reference Curve
L1-8

OPEN/CLOSED WINDOW RESEARCH Defra Research Contract: NANR116
Airborne Sound Insulation. Laboratory measurements with non-diffuse source conditions
Standardised Level Difference. Simulated residential receiver environment
Date: 13/7/2005 Test Sample: Window D-1 Open 0.05 m2
Air temperature: 21.8 ºC Area of window unit, S: 1.26 m2
Air humidity: 31.2 % Window mass per unit area: 27.94 kg/m2
Atmospheric pressure: 1.0185 Bar
Receiving room volume: 31.2 m3
Glass Specification: 4 -16 - 4 mm
Source room volume: 343.1 m3
Canopy: n/a
Vent: n/a
Test ID: 713011 Loudspeaker Configuration: L1
Frequency D0.01m,nT
Hz dB
50 27.0 b
63 32.7
80 23.0
100 27.6 -4
125 25.0 -1
160 26.7 2
200 26.6 5
250 16.3 8
315 19.1 11
400 19.0 14
500 15.6 15
630 17.5 16
800 19.2 17
1k 16.1 18
1.25k 20.3 19
1.6k 21.1 19
2k 17.0 19
2.5k 20.5 19
3.15k 18.9 19
4k 18.3
5k 22.7
D0.01m,nT,w(C;Ctr ) 19 (-1; -1) dB
Tested by Building Performance Centre, Napier University, Edinburgh.
Measured D0.01m,nT dB
0.0
10.0
20.0
30.0
40.0
50.0
60.0
63 125 250 500 1k 2k 4kFrequency (Hz)
Sta
nd
ard
ise
d L
eve
l D
iffe
ren
ce
, D
0.0
1m
,nT
(d
B)
Measured values Shifted Reference Curve
L1-9

OPEN/CLOSED WINDOW RESEARCH Defra Research Contract: NANR116
Airborne Sound Insulation. Laboratory measurements with non-diffuse source conditions
Standardised Level Difference. Simulated residential receiver environment
Date: 13/7/2005 Test Sample: Window D-2 Open 0.05 m2
Air temperature: 21.8 ºC Area of window unit, S: 1.26 m2
Air humidity: 31.2 % Window mass per unit area: 27.94 kg/m2
Atmospheric pressure: 1.0185 Bar
Receiving room volume: 31.2 m3
Glass Specification: 4 -16 - 4 mm
Source room volume: 343.1 m3
Canopy: n/a
Vent: n/a
Test ID: 713003 Loudspeaker Configuration: L1
Frequency D0.01m,nT
Hz dB
50 26.7 b
63 32.1
80 22.7
100 26.4 -8
125 23.2 -5
160 22.7 -2
200 22.3 1
250 18.3 4
315 24.9 7
400 25.5 10
500 11.2 11
630 15.7 12
800 15.7 13
1k 16.1 14
1.25k 15.2 15
1.6k 11.5 15
2k 11.9 15
2.5k 13.6 15
3.15k 18.7 15
4k 19.3
5k 19.6
D0.01m,nT,w(C;Ctr ) 15 (-1; 0) dB
Tested by Building Performance Centre, Napier University, Edinburgh.
Measured D0.01m,nT dB
0.0
10.0
20.0
30.0
40.0
50.0
60.0
63 125 250 500 1k 2k 4kFrequency (Hz)
Sta
nd
ard
ise
d L
eve
l D
iffe
ren
ce
, D
0.0
1m
,nT
(d
B)
Measured values Shifted Reference Curve
L1-10

OPEN/CLOSED WINDOW RESEARCH Defra Research Contract: NANR116
Airborne Sound Insulation. Laboratory measurements with non-diffuse source conditions
Standardised Level Difference. Simulated residential receiver environment
Date: 13/7/2005 Test Sample: Window D-3 Open 0.05 m2
Air temperature: 21.8 ºC Area of window unit, S: 1.26 m2
Air humidity: 31.2 % Window mass per unit area: 27.94 kg/m2
Atmospheric pressure: 1.0185 Bar
Receiving room volume: 31.2 m3
Glass Specification: 4 -16 - 4 mm
Source room volume: 343.1 m3
Canopy: n/a
Vent: n/a
Test ID: 713007 Loudspeaker Configuration: L1
Frequency D0.01m,nT
Hz dB
50 29.1 b
63 33.0
80 23.2
100 27.4 -5
125 24.4 -2
160 24.1 1
200 23.1 4
250 19.0 7
315 26.0 10
400 14.7 13
500 13.3 14
630 18.0 15
800 17.9 16
1k 17.5 17
1.25k 17.3 18
1.6k 19.1 18
2k 15.0 18
2.5k 19.3 18
3.15k 24.1 18
4k 22.6
5k 24.9
D0.01m,nT,w(C;Ctr ) 18 ( 0; -1) dB
Tested by Building Performance Centre, Napier University, Edinburgh.
Measured D0.01m,nT dB
0.0
10.0
20.0
30.0
40.0
50.0
60.0
63 125 250 500 1k 2k 4kFrequency (Hz)
Sta
nd
ard
ise
d L
eve
l D
iffe
ren
ce
, D
0.0
1m
,nT
(d
B)
Measured values Shifted Reference Curve
L1-11

OPEN/CLOSED WINDOW RESEARCH Defra Research Contract: NANR116
Airborne Sound Insulation. Laboratory measurements with non-diffuse source conditions
Standardised Level Difference. Simulated residential receiver environment
Date: 18/7/2005 Test Sample: Window E Open 0.05 m2
Air temperature: 20.3 ºC Area of window unit, S: 0.63 m2
Air humidity: 31.2 % Window mass per unit area: 26.83 kg/m2
Atmospheric pressure: 0.9956 Bar
Receiving room volume: 31.2 m3
Glass Specification: 4 -16 - 4 mm
Source room volume: 343.1 m3
Canopy: n/a
Vent: n/a
Test ID: 718004 Loudspeaker Configuration: L1
Frequency D0.01m,nT
Hz dB
50 27.7
63 33.2
80 23.4
100 27.4 -1
125 26.1 2
160 27.7 5
200 24.5 8
250 18.0 11
315 21.6 14
400 24.0 17
500 26.1 18
630 25.8 19
800 19.0 20
1k 19.9 21
1.25k 25.0 22
1.6k 21.0 22
2k 22.7 22
2.5k 20.2 22
3.15k 23.1 22
4k 26.5
5k 26.2
D0.01m,nT,w(C;Ctr ) 22 ( 0; 0) dB
Tested by Building Performance Centre, Napier University, Edinburgh.
Measured D0.01m,nT dB
0.0
10.0
20.0
30.0
40.0
50.0
60.0
63 125 250 500 1k 2k 4kFrequency (Hz)
Sta
nd
ard
ise
d L
eve
l D
iffe
ren
ce
, D
0.0
1m
,nT
(d
B)
Measured values Shifted Reference Curve
L1-12

OPEN/CLOSED WINDOW RESEARCH Defra Research Contract: NANR116
Airborne Sound Insulation. Laboratory measurements with non-diffuse source conditions
Standardised Level Difference. Simulated residential receiver environment
Date: 19/7/2005 Test Sample: Window F Open 0.05 m2
Air temperature: 20.3 ºC Area of window unit, S: 0.63 m2
Air humidity: 31.2 % Window mass per unit area: 26.83 kg/m2
Atmospheric pressure: 1.0023 Bar
Receiving room volume: 31.2 m3
Glass Specification: 4 -16 - 4 mm
Source room volume: 343.1 m3
Canopy: n/a
Vent: n/a
Test ID: 719018 Loudspeaker Configuration: L1
Frequency D0.01m,nT
Hz dB
50 27.6
63 33.7
80 24.8
100 27.0 1
125 25.5 4
160 26.2 7
200 23.3 10
250 20.5 13
315 22.5 16
400 24.7 19
500 25.0 20
630 25.7 21
800 20.0 22
1k 24.0 23
1.25k 26.7 24
1.6k 24.5 24
2k 25.7 24
2.5k 23.6 24
3.15k 22.3 24
4k 22.4
5k 22.5
D0.01m,nT,w(C;Ctr ) 24 ( 0; 0) dB
Tested by Building Performance Centre, Napier University, Edinburgh.
Measured D0.01m,nT dB
0.0
10.0
20.0
30.0
40.0
50.0
60.0
63 125 250 500 1k 2k 4kFrequency (Hz)
Sta
nd
ard
ise
d L
eve
l D
iffe
ren
ce
, D
0.0
1m
,nT
(d
B)
Measured values Shifted Reference Curve
L1-13

OPEN/CLOSED WINDOW RESEARCH Defra Research Contract: NANR116
Airborne Sound Insulation. Laboratory measurements with non-diffuse source conditions
Standardised Level Difference. Simulated residential receiver environment
Date: 20/7/2005 Test Sample: Window G Open 0.05 m2
Air temperature: 20.3 ºC Area of window unit, S: 0.54 m2
Air humidity: 31.2 % Window mass per unit area: 33.33 kg/m2
Atmospheric pressure: 1.0032 Bar
Receiving room volume: 31.2 m3
Glass Specification: 4 -16 - 4 mm
Source room volume: 343.1 m3
Canopy: n/a
Vent: n/a
Test ID: 720017 Loudspeaker Configuration: L1
Frequency D0.01m,nT
Hz dB
50 23.2
63 32.5
80 23.3
100 26.4 -1
125 24.9 2
160 24.4 5
200 23.0 8
250 22.1 11
315 25.4 14
400 26.6 17
500 25.8 18
630 21.2 19
800 24.3 20
1k 21.4 21
1.25k 22.9 22
1.6k 21.4 22
2k 20.2 22
2.5k 21.0 22
3.15k 18.9 22
4k 19.6
5k 25.5
D0.01m,nT,w(C;Ctr ) 22 (-1; 0) dB
Tested by Building Performance Centre, Napier University, Edinburgh.
Measured D0.01m,nT dB
0.0
10.0
20.0
30.0
40.0
50.0
60.0
63 125 250 500 1k 2k 4kFrequency (Hz)
Sta
nd
ard
ise
d L
eve
l D
iffe
ren
ce
, D
0.0
1m
,nT
(d
B)
Measured values Shifted Reference Curve
L1-14
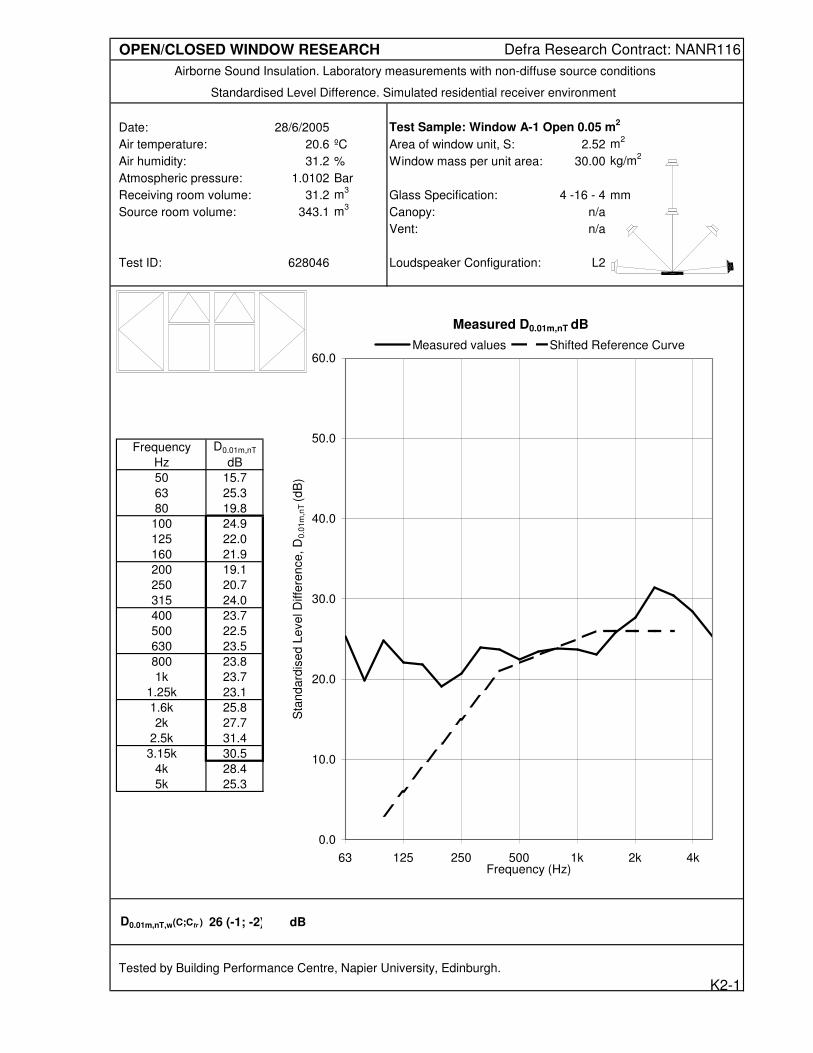
OPEN/CLOSED WINDOW RESEARCH Defra Research Contract: NANR116
Airborne Sound Insulation. Laboratory measurements with non-diffuse source conditions
Standardised Level Difference. Simulated residential receiver environment
Date: 28/6/2005 Test Sample: Window A-1 Open 0.05 m2
Air temperature: 20.6 ºC Area of window unit, S: 2.52 m2
Air humidity: 31.2 % Window mass per unit area: 30.00 kg/m2
Atmospheric pressure: 1.0102 Bar
Receiving room volume: 31.2 m3
Glass Specification: 4 -16 - 4 mm
Source room volume: 343.1 m3
Canopy: n/a
Vent: n/a
Test ID: 628046 Loudspeaker Configuration: L2
Frequency D0.01m,nT
Hz dB
50 15.7
63 25.3
80 19.8
100 24.9 3
125 22.0 6
160 21.9 9
200 19.1 12
250 20.7 15
315 24.0 18
400 23.7 21
500 22.5 22
630 23.5 23
800 23.8 24
1k 23.7 25
1.25k 23.1 26
1.6k 25.8 26
2k 27.7 26
2.5k 31.4 26
3.15k 30.5 26
4k 28.4
5k 25.3
D0.01m,nT,w(C;Ctr ) 26 (-1; -2) dB
Tested by Building Performance Centre, Napier University, Edinburgh.
Measured D0.01m,nT dB
0.0
10.0
20.0
30.0
40.0
50.0
60.0
63 125 250 500 1k 2k 4kFrequency (Hz)
Sta
nd
ard
ise
d L
eve
l D
iffe
ren
ce
, D
0.0
1m
,nT
(d
B)
Measured values Shifted Reference Curve
K2-1

OPEN/CLOSED WINDOW RESEARCH Defra Research Contract: NANR116
Airborne Sound Insulation. Laboratory measurements with non-diffuse source conditions
Standardised Level Difference. Simulated residential receiver environment
Date: 5/7/05 Test Sample: Window B Open 0.05 m2
Air temperature: 19.1 ºC Area of window unit, S: 1.26 m2
Air humidity: 31.2 % Window mass per unit area: 27.94 kg/m2
Atmospheric pressure: 0.998 Bar
Receiving room volume: 31.2 m3
Glass Specification: 4 -16 - 4 mm
Source room volume: 343.1 m3
Canopy: n/a
Vent: n/a
Test ID: 705008 Loudspeaker Configuration: L2
Frequency D0.01m,nT
Hz dB
50 19.1
63 30.1
80 21.8
100 25.1 -1
125 24.1 2
160 23.3 5
200 23.7 8
250 24.5 11
315 24.9 14
400 20.9 17
500 22.4 18
630 19.9 19
800 22.0 20
1k 17.5 21
1.25k 17.6 22
1.6k 21.6 22
2k 26.0 22
2.5k 27.9 22
3.15k 26.5 22
4k 24.9
5k 29.1
D0.01m,nT,w(C;Ctr ) 22 (-1; -2) dB
Tested by Building Performance Centre, Napier University, Edinburgh.
Measured D0.01m,nT dB
0.0
10.0
20.0
30.0
40.0
50.0
60.0
63 125 250 500 1k 2k 4kFrequency (Hz)
Sta
nd
ard
ise
d L
eve
l D
iffe
ren
ce
, D
0.0
1m
,nT
(d
B)
Measured values Shifted Reference Curve
K2-2

OPEN/CLOSED WINDOW RESEARCH Defra Research Contract: NANR116
Airborne Sound Insulation. Laboratory measurements with non-diffuse source conditions
Standardised Level Difference. Simulated residential receiver environment
Date: 11/7/05 Test Sample: Window C-1 Open 0.05 m2
Air temperature: 20.6 ºC Area of window unit, S: 0.945 m2
Air humidity: 31.2 % Window mass per unit area: 36.83 kg/m2
Atmospheric pressure: 1.0278 Bar
Receiving room volume: 31.2 m3
Glass Specification: 4 -16 - 4 mm
Source room volume: 343.1 m3
Canopy: Original
Vent: Closed
Test ID: 711032 Loudspeaker Configuration: L2
Frequency D0.01m,nT
Hz dB
50 22.1
63 33.6
80 25.2
100 28.8 0
125 27.3 3
160 27.4 6
200 27.6 9
250 25.2 12
315 23.6 15
400 25.4 18
500 25.0 19
630 21.2 20
800 25.5 21
1k 25.3 22
1.25k 25.3 23
1.6k 22.2 23
2k 20.4 23
2.5k 19.0 23
3.15k 20.9 23
4k 24.4
5k 24.7
D0.01m,nT,w(C;Ctr ) 23 (-1; 0) dB
Tested by Building Performance Centre, Napier University, Edinburgh.
Measured D0.01m,nT dB
0.0
10.0
20.0
30.0
40.0
50.0
60.0
63 125 250 500 1k 2k 4kFrequency (Hz)
Sta
nd
ard
ise
d L
eve
l D
iffe
ren
ce
, D
0.0
1m
,nT
(d
B)
Measured values Shifted Reference Curve
K2-3

OPEN/CLOSED WINDOW RESEARCH Defra Research Contract: NANR116
Airborne Sound Insulation. Laboratory measurements with non-diffuse source conditions
Standardised Level Difference. Simulated residential receiver environment
Date: 11/7/05 Test Sample: Window C-2 Open 0.05 m2
Air temperature: 20.6 ºC Area of window unit, S: 0.945 m2
Air humidity: 31.2 % Window mass per unit area: 36.83 kg/m2
Atmospheric pressure: 1.0276 Bar
Receiving room volume: 31.2 m3
Glass Specification: 4 -16 - 4 mm
Source room volume: 343.1 m3
Canopy: Original
Vent: Closed
Test ID: 711036 Loudspeaker Configuration: L2
Frequency D0.01m,nT
Hz dB
50 21.4
63 33.0
80 24.6
100 28.2 3
125 26.6 6
160 26.7 9
200 28.2 12
250 25.4 15
315 25.3 18
400 28.7 21
500 27.0 22
630 23.2 23
800 26.4 24
1k 27.2 25
1.25k 26.8 26
1.6k 22.8 26
2k 23.5 26
2.5k 26.6 26
3.15k 26.5 26
4k 28.5
5k 24.0
D0.01m,nT,w(C;Ctr ) 26 (-1; 0) dB
Tested by Building Performance Centre, Napier University, Edinburgh.
Measured D0.01m,nT dB
0.0
10.0
20.0
30.0
40.0
50.0
60.0
63 125 250 500 1k 2k 4kFrequency (Hz)
Sta
nd
ard
ise
d L
eve
l D
iffe
ren
ce
, D
0.0
1m
,nT
(d
B)
Measured values Shifted Reference Curve
K2-4

OPEN/CLOSED WINDOW RESEARCH Defra Research Contract: NANR116
Airborne Sound Insulation. Laboratory measurements with non-diffuse source conditions
Standardised Level Difference. Simulated residential receiver environment
Date: 12/7/05 Test Sample: Window C-3 Open 0.05 m2
Air temperature: 21.1 ºC Area of window unit, S: 0.945 m2
Air humidity: 31.2 % Window mass per unit area: 36.83 kg/m2
Atmospheric pressure: 1.0247 Bar
Receiving room volume: 31.2 m3
Glass Specification: 4 -18 - 6.4(lam) mm
Source room volume: 343.1 m3
Canopy: n/a
Vent: Vent 1 closed
Test ID: 712045 Loudspeaker Configuration: L2
Frequency D0.01m,nT
Hz dB
50 22.2
63 33.8
80 25.7
100 29.6 -1
125 28.7 2
160 29.2 5
200 28.9 8
250 28.0 11
315 25.3 14
400 24.5 17
500 25.2 18
630 22.5 19
800 24.7 20
1k 26.1 21
1.25k 24.7 22
1.6k 21.5 22
2k 20.3 22
2.5k 17.5 22
3.15k 20.2 22
4k 21.5
5k 31.6
D0.01m,nT,w(C;Ctr ) 22 (-1; 1) dB
Tested by Building Performance Centre, Napier University, Edinburgh.
Measured D0.01m,nT dB
0.0
10.0
20.0
30.0
40.0
50.0
60.0
63 125 250 500 1k 2k 4kFrequency (Hz)
Sta
nd
ard
ise
d L
eve
l D
iffe
ren
ce
, D
0.0
1m
,nT
(d
B)
Measured values Shifted Reference Curve
K2-5

OPEN/CLOSED WINDOW RESEARCH Defra Research Contract: NANR116
Airborne Sound Insulation. Laboratory measurements with non-diffuse source conditions
Standardised Level Difference. Simulated residential receiver environment
Date: 12/7/05 Test Sample: Window C-4 Open 0.05 m2
Air temperature: 21.1 ºC Area of window unit, S: 0.945 m2
Air humidity: 31.2 % Window mass per unit area: 36.83 kg/m2
Atmospheric pressure: 1.0247 Bar
Receiving room volume: 31.2 m3
Glass Specification: 4 -18 - 6.4(lam) mm
Source room volume: 343.1 m3
Canopy: n/a
Vent: Vent 1 closed
Test ID: 712049 Loudspeaker Configuration: L2
Frequency D0.01m,nT
Hz dB
50 21.3
63 33.0
80 24.9
100 28.7 2
125 27.5 5
160 28.2 8
200 29.3 11
250 27.6 14
315 26.3 17
400 27.4 20
500 26.9 21
630 23.5 22
800 25.5 23
1k 27.1 24
1.25k 25.5 25
1.6k 21.9 25
2k 23.9 25
2.5k 24.2 25
3.15k 26.1 25
4k 26.6
5k 30.9
D0.01m,nT,w(C;Ctr ) 25 ( 0; 0) dB
Tested by Building Performance Centre, Napier University, Edinburgh.
Measured D0.01m,nT dB
0.0
10.0
20.0
30.0
40.0
50.0
60.0
63 125 250 500 1k 2k 4kFrequency (Hz)
Sta
nd
ard
ise
d L
eve
l D
iffe
ren
ce
, D
0.0
1m
,nT
(d
B)
Measured values Shifted Reference Curve
K2-6

OPEN/CLOSED WINDOW RESEARCH Defra Research Contract: NANR116
Airborne Sound Insulation. Laboratory measurements with non-diffuse source conditions
Standardised Level Difference. Simulated residential receiver environment
Date: 18/7/2005 Test Sample: Window E Open 0.05 m2
Air temperature: 20.4 ºC Area of window unit, S: 0.63 m2
Air humidity: 31.2 % Window mass per unit area: 26.83 kg/m2
Atmospheric pressure: 0.9956 Bar
Receiving room volume: 31.2 m3
Glass Specification: 4 -16 - 4 mm
Source room volume: 343.1 m3
Canopy: n/a
Vent: n/a
Test ID: 718018 Loudspeaker Configuration: L2
Frequency D0.01m,nT
Hz dB
50 22.3
63 32.6
80 25.1
100 26.6 4
125 25.5 7
160 26.4 10
200 22.1 13
250 25.2 16
315 24.6 19
400 22.2 22
500 21.5 23
630 26.7 24
800 25.9 25
1k 24.1 26
1.25k 30.4 27
1.6k 29.0 27
2k 30.4 27
2.5k 29.6 27
3.15k 28.3 27
4k 30.1
5k 25.9
D0.01m,nT,w(C;Ctr ) 27 ( 0; -1) dB
Tested by Building Performance Centre, Napier University, Edinburgh.
Measured D0.01m,nT dB
0.0
10.0
20.0
30.0
40.0
50.0
60.0
63 125 250 500 1k 2k 4kFrequency (Hz)
Sta
nd
ard
ise
d L
eve
l D
iffe
ren
ce
, D
0.0
1m
,nT
(d
B)
Measured values Shifted Reference Curve
K2-7

OPEN/CLOSED WINDOW RESEARCH Defra Research Contract: NANR116
Airborne Sound Insulation. Laboratory measurements with non-diffuse source conditions
Standardised Level Difference. Simulated residential receiver environment
Date: 19/7/2005 Test Sample: Window F Open 0.05 m2
Air temperature: 20.4 ºC Area of window unit, S: 0.63 m2
Air humidity: 31.2 % Window mass per unit area: 26.83 kg/m2
Atmospheric pressure: 1.0024 Bar
Receiving room volume: 31.2 m3
Glass Specification: 4 -16 - 4 mm
Source room volume: 343.1 m3
Canopy: n/a
Vent: n/a
Test ID: 719032 Loudspeaker Configuration: L2
Frequency D0.01m,nT
Hz dB
50 21.8
63 32.7
80 24.8
100 26.1 2
125 24.7 5
160 24.9 8
200 22.2 11
250 24.7 14
315 24.0 17
400 20.8 20
500 20.9 21
630 26.1 22
800 25.4 23
1k 22.6 24
1.25k 26.7 25
1.6k 25.7 25
2k 28.0 25
2.5k 27.8 25
3.15k 27.1 25
4k 29.2
5k 29.1
D0.01m,nT,w(C;Ctr ) 25 ( 0; -1) dB
Tested by Building Performance Centre, Napier University, Edinburgh.
Measured D0.01m,nT dB
0.0
10.0
20.0
30.0
40.0
50.0
60.0
63 125 250 500 1k 2k 4kFrequency (Hz)
Sta
nd
ard
ise
d L
eve
l D
iffe
ren
ce
, D
0.0
1m
,nT
(d
B)
Measured values Shifted Reference Curve
K2-8

OPEN/CLOSED WINDOW RESEARCH Defra Research Contract: NANR116
Airborne Sound Insulation. Laboratory measurements with non-diffuse source conditions
Standardised Level Difference. Simulated residential receiver environment
Date: 20/7/2005 Test Sample: Window G Open 0.05 m2
Air temperature: 20.3 ºC Area of window unit, S: 0.54 m2
Air humidity: 31.2 % Window mass per unit area: 33.33 kg/m2
Atmospheric pressure: 1.0032 Bar
Receiving room volume: 31.2 m3
Glass Specification: 4 -16 - 4 mm
Source room volume: 343.1 m3
Canopy: n/a
Vent: n/a
Test ID: 720045 Loudspeaker Configuration: L2
Frequency D0.01m,nT
Hz dB
50 22.4
63 31.9
80 25.0
100 26.6 -1
125 24.8 2
160 24.2 5
200 23.3 8
250 24.3 11
315 24.1 14
400 21.4 17
500 20.9 18
630 21.9 19
800 19.1 20
1k 16.0 21
1.25k 20.9 22
1.6k 21.6 22
2k 24.9 22
2.5k 25.9 22
3.15k 21.2 22
4k 23.4
5k 19.9
D0.01m,nT,w(C;Ctr ) 22 (-1; -2) dB
Tested by Building Performance Centre, Napier University, Edinburgh.
Measured D0.01m,nT dB
0.0
10.0
20.0
30.0
40.0
50.0
60.0
63 125 250 500 1k 2k 4kFrequency (Hz)
Sta
nd
ard
ise
d L
eve
l D
iffe
ren
ce
, D
0.0
1m
,nT
(d
B)
Measured values Shifted Reference Curve
K2-9

OPEN/CLOSED WINDOW RESEARCH Defra Research Contract: NANR116
Airborne Sound Insulation. Laboratory measurements with non-diffuse source conditions
Standardised Level Difference. Simulated residential receiver environment
Date: 28/6/2005 Test Sample: Window A-1 Open 0.05 m2
Air temperature: 20.6 ºC Area of window unit, S: 2.52 m2
Air humidity: 31.2 % Window mass per unit area: 30.00 kg/m2
Atmospheric pressure: 1.0095 Bar
Receiving room volume: 31.2 m3
Glass Specification: 4 -16 - 4 mm
Source room volume: 343.1 m3
Canopy: n/a
Vent: n/a
Test ID: 628062 Loudspeaker Configuration: L3
Frequency D0.01m,nT
Hz dB
50 19.1
63 27.6
80 24.2
100 29.1 -2
125 27.1 1
160 22.8 4
200 23.6 7
250 23.9 10
315 25.7 13
400 25.4 16
500 20.3 17
630 19.0 18
800 18.8 19
1k 16.8 20
1.25k 16.9 21
1.6k 20.1 21
2k 22.9 21
2.5k 28.7 21
3.15k 24.8 21
4k 22.9
5k 18.0
D0.01m,nT,w(C;Ctr ) 21 (-1; -2) dB
Tested by Building Performance Centre, Napier University, Edinburgh.
Measured D0.01m,nT dB
0.0
10.0
20.0
30.0
40.0
50.0
60.0
63 125 250 500 1k 2k 4kFrequency (Hz)
Sta
nd
ard
ise
d L
eve
l D
iffe
ren
ce
, D
0.0
1m
,nT
(d
B)
Measured values Shifted Reference Curve
L3-1

OPEN/CLOSED WINDOW RESEARCH Defra Research Contract: NANR116
Airborne Sound Insulation. Laboratory measurements with non-diffuse source conditions
Standardised Level Difference. Simulated residential receiver environment
Date: 5/7/05 Test Sample: Window B Open 0.05 m2
Air temperature: 19.3 ºC Area of window unit, S: 1.26 m2
Air humidity: 31.2 % Window mass per unit area: 27.94 kg/m2
Atmospheric pressure: 0.9975 Bar
Receiving room volume: 31.2 m3
Glass Specification: 4 -16 - 4 mm
Source room volume: 343.1 m3
Canopy: n/a
Vent: n/a
Test ID: 705013 Loudspeaker Configuration: L3
Frequency D0.01m,nT
Hz dB
50 19.8
63 30.9
80 21.5
100 24.6 -1
125 23.9 2
160 23.8 5
200 24.1 8
250 23.7 11
315 24.7 14
400 21.3 17
500 21.9 18
630 19.7 19
800 21.1 20
1k 16.8 21
1.25k 16.8 22
1.6k 21.9 22
2k 25.4 22
2.5k 27.1 22
3.15k 27.1 22
4k 27.1
5k 31.0
D0.01m,nT,w(C;Ctr ) 22 (-1; -2) dB
Tested by Building Performance Centre, Napier University, Edinburgh.
Measured D0.01m,nT dB
0.0
10.0
20.0
30.0
40.0
50.0
60.0
63 125 250 500 1k 2k 4kFrequency (Hz)
Sta
nd
ard
ise
d L
eve
l D
iffe
ren
ce
, D
0.0
1m
,nT
(d
B)
Measured values Shifted Reference Curve
L3-2
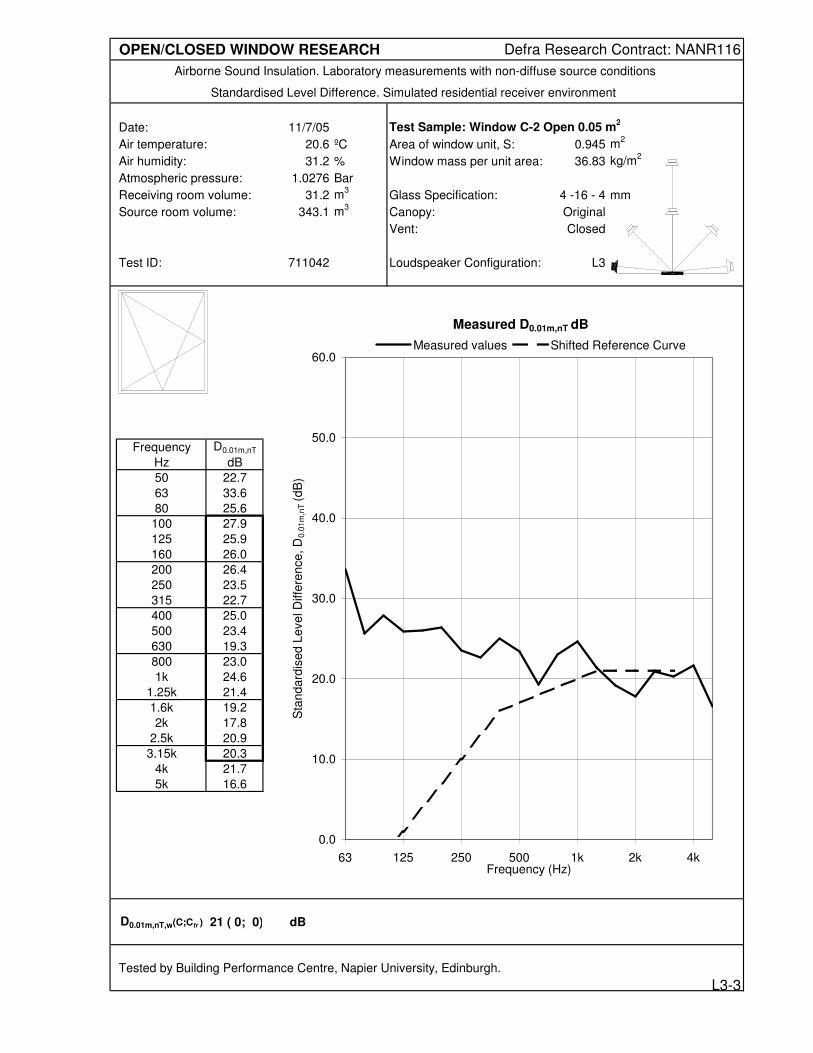
OPEN/CLOSED WINDOW RESEARCH Defra Research Contract: NANR116
Airborne Sound Insulation. Laboratory measurements with non-diffuse source conditions
Standardised Level Difference. Simulated residential receiver environment
Date: 11/7/05 Test Sample: Window C-2 Open 0.05 m2
Air temperature: 20.6 ºC Area of window unit, S: 0.945 m2
Air humidity: 31.2 % Window mass per unit area: 36.83 kg/m2
Atmospheric pressure: 1.0276 Bar
Receiving room volume: 31.2 m3
Glass Specification: 4 -16 - 4 mm
Source room volume: 343.1 m3
Canopy: Original
Vent: Closed
Test ID: 711042 Loudspeaker Configuration: L3
Frequency D0.01m,nT
Hz dB
50 22.7
63 33.6
80 25.6
100 27.9 -2
125 25.9 1
160 26.0 4
200 26.4 7
250 23.5 10
315 22.7 13
400 25.0 16
500 23.4 17
630 19.3 18
800 23.0 19
1k 24.6 20
1.25k 21.4 21
1.6k 19.2 21
2k 17.8 21
2.5k 20.9 21
3.15k 20.3 21
4k 21.7
5k 16.6
D0.01m,nT,w(C;Ctr ) 21 ( 0; 0) dB
Tested by Building Performance Centre, Napier University, Edinburgh.
Measured D0.01m,nT dB
0.0
10.0
20.0
30.0
40.0
50.0
60.0
63 125 250 500 1k 2k 4kFrequency (Hz)
Sta
nd
ard
ise
d L
eve
l D
iffe
ren
ce
, D
0.0
1m
,nT
(d
B)
Measured values Shifted Reference Curve
L3-3
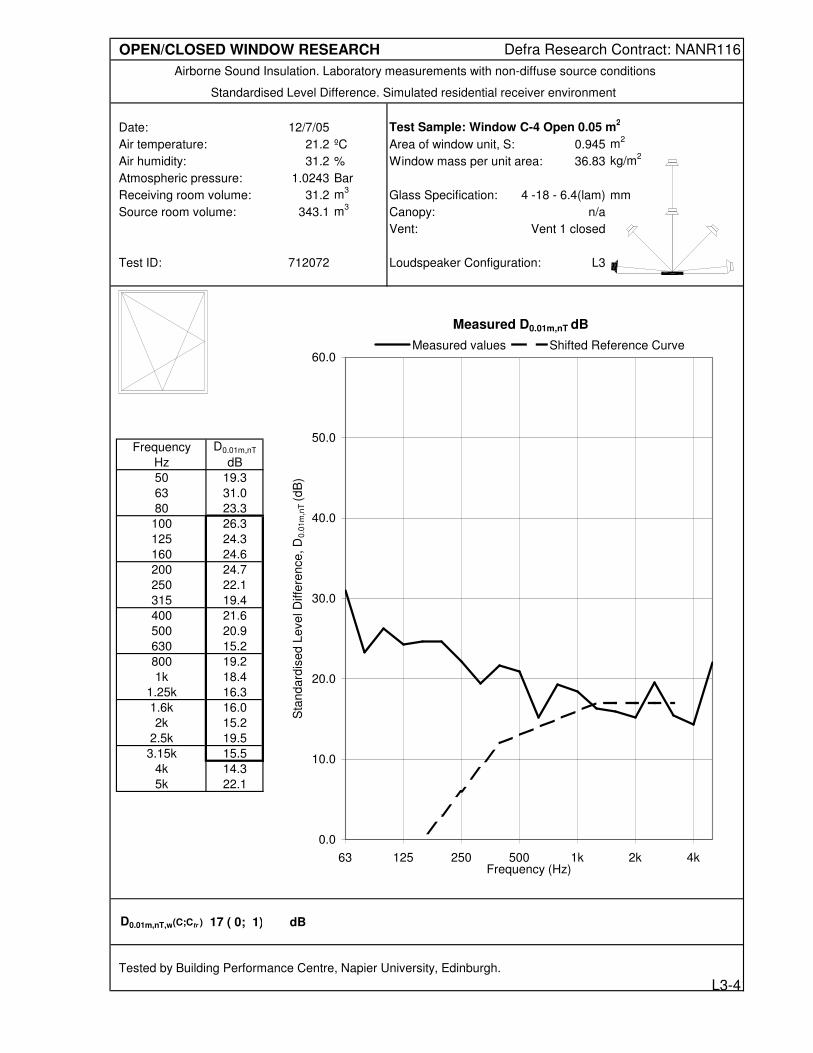
OPEN/CLOSED WINDOW RESEARCH Defra Research Contract: NANR116
Airborne Sound Insulation. Laboratory measurements with non-diffuse source conditions
Standardised Level Difference. Simulated residential receiver environment
Date: 12/7/05 Test Sample: Window C-4 Open 0.05 m2
Air temperature: 21.2 ºC Area of window unit, S: 0.945 m2
Air humidity: 31.2 % Window mass per unit area: 36.83 kg/m2
Atmospheric pressure: 1.0243 Bar
Receiving room volume: 31.2 m3
Glass Specification: 4 -18 - 6.4(lam) mm
Source room volume: 343.1 m3
Canopy: n/a
Vent: Vent 1 closed
Test ID: 712072 Loudspeaker Configuration: L3
Frequency D0.01m,nT
Hz dB
50 19.3
63 31.0
80 23.3
100 26.3 -6
125 24.3 -3
160 24.6 0
200 24.7 3
250 22.1 6
315 19.4 9
400 21.6 12
500 20.9 13
630 15.2 14
800 19.2 15
1k 18.4 16
1.25k 16.3 17
1.6k 16.0 17
2k 15.2 17
2.5k 19.5 17
3.15k 15.5 17
4k 14.3
5k 22.1
D0.01m,nT,w(C;Ctr ) 17 ( 0; 1) dB
Tested by Building Performance Centre, Napier University, Edinburgh.
Measured D0.01m,nT dB
0.0
10.0
20.0
30.0
40.0
50.0
60.0
63 125 250 500 1k 2k 4kFrequency (Hz)
Sta
nd
ard
ise
d L
eve
l D
iffe
ren
ce
, D
0.0
1m
,nT
(d
B)
Measured values Shifted Reference Curve
L3-4

OPEN/CLOSED WINDOW RESEARCH Defra Research Contract: NANR116
Airborne Sound Insulation. Laboratory measurements with non-diffuse source conditions
Standardised Level Difference. Simulated residential receiver environment
Date: 13/7/2005 Test Sample: Window D-1 Open 0.05 m2
Air temperature: 21.8 ºC Area of window unit, S: 1.26 m2
Air humidity: 31.2 % Window mass per unit area: 27.94 kg/m2
Atmospheric pressure: 1.0175 Bar
Receiving room volume: 31.2 m3
Glass Specification: 4 -16 - 4 mm
Source room volume: 343.1 m3
Canopy: n/a
Vent: n/a
Test ID: 713053 Loudspeaker Configuration: L3
Frequency D0.01m,nT
Hz dB
50 21.4
63 33.7
80 24.3
100 27.0 4
125 25.5 7
160 26.6 10
200 26.6 13
250 25.5 16
315 25.2 19
400 27.3 22
500 28.2 23
630 20.7 24
800 27.0 25
1k 24.6 26
1.25k 28.3 27
1.6k 30.4 27
2k 29.2 27
2.5k 27.6 27
3.15k 24.3 27
4k 21.9
5k 25.5
D0.01m,nT,w(C;Ctr ) 27 (-1; -1) dB
Tested by Building Performance Centre, Napier University, Edinburgh.
Measured D0.01m,nT dB
0.0
10.0
20.0
30.0
40.0
50.0
60.0
63 125 250 500 1k 2k 4kFrequency (Hz)
Sta
nd
ard
ise
d L
eve
l D
iffe
ren
ce
, D
0.0
1m
,nT
(d
B)
Measured values Shifted Reference Curve
L3-5

OPEN/CLOSED WINDOW RESEARCH Defra Research Contract: NANR116
Airborne Sound Insulation. Laboratory measurements with non-diffuse source conditions
Standardised Level Difference. Simulated residential receiver environment
Date: 13/7/2005 Test Sample: Window D-2 Open 0.05 m2
Air temperature: 21.8 ºC Area of window unit, S: 1.26 m2
Air humidity: 31.2 % Window mass per unit area: 27.94 kg/m2
Atmospheric pressure: 1.0176 Bar
Receiving room volume: 31.2 m3
Glass Specification: 4 -16 - 4 mm
Source room volume: 343.1 m3
Canopy: n/a
Vent: n/a
Test ID: 713045 Loudspeaker Configuration: L3
Frequency D0.01m,nT
Hz dB
50 21.4
63 32.7
80 24.2
100 25.8 0
125 23.2 3
160 24.5 6
200 28.6 9
250 24.2 12
315 27.6 15
400 29.1 18
500 28.4 19
630 20.4 20
800 24.2 21
1k 21.2 22
1.25k 21.2 23
1.6k 25.1 23
2k 26.8 23
2.5k 25.4 23
3.15k 20.3 23
4k 18.2
5k 19.8
D0.01m,nT,w(C;Ctr ) 23 ( 0; 0) dB
Tested by Building Performance Centre, Napier University, Edinburgh.
Measured D0.01m,nT dB
0.0
10.0
20.0
30.0
40.0
50.0
60.0
63 125 250 500 1k 2k 4kFrequency (Hz)
Sta
nd
ard
ise
d L
eve
l D
iffe
ren
ce
, D
0.0
1m
,nT
(d
B)
Measured values Shifted Reference Curve
L3-6

OPEN/CLOSED WINDOW RESEARCH Defra Research Contract: NANR116
Airborne Sound Insulation. Laboratory measurements with non-diffuse source conditions
Standardised Level Difference. Simulated residential receiver environment
Date: 13/7/2005 Test Sample: Window D-3 Open 0.05 m2
Air temperature: 21.8 ºC Area of window unit, S: 1.26 m2
Air humidity: 31.2 % Window mass per unit area: 27.94 kg/m2
Atmospheric pressure: 1.0176 Bar
Receiving room volume: 31.2 m3
Glass Specification: 4 -16 - 4 mm
Source room volume: 343.1 m3
Canopy: n/a
Vent: n/a
Test ID: 713049 Loudspeaker Configuration: L3
Frequency D0.01m,nT
Hz dB
50 23.7
63 34.0
80 24.6
100 27.0 2
125 24.5 5
160 25.5 8
200 28.3 11
250 24.2 14
315 26.1 17
400 28.2 20
500 24.6 21
630 17.8 22
800 26.3 23
1k 22.3 24
1.25k 22.9 25
1.6k 27.1 25
2k 29.2 25
2.5k 28.8 25
3.15k 28.0 25
4k 25.8
5k 25.9
D0.01m,nT,w(C;Ctr ) 25 (-1; -1) dB
Tested by Building Performance Centre, Napier University, Edinburgh.
Measured D0.01m,nT dB
0.0
10.0
20.0
30.0
40.0
50.0
60.0
63 125 250 500 1k 2k 4kFrequency (Hz)
Sta
nd
ard
ise
d L
eve
l D
iffe
ren
ce
, D
0.0
1m
,nT
(d
B)
Measured values Shifted Reference Curve
L3-7

OPEN/CLOSED WINDOW RESEARCH Defra Research Contract: NANR116
Airborne Sound Insulation. Laboratory measurements with non-diffuse source conditions
Standardised Level Difference. Simulated residential receiver environment
Date: 20/7/2005 Test Sample: Window G Open 0.05 m2
Air temperature: 20.3 ºC Area of window unit, S: 0.54 m2
Air humidity: 31.2 % Window mass per unit area: 33.33 kg/m2
Atmospheric pressure: 1.0032 Bar
Receiving room volume: 31.2 m3
Glass Specification: 4 -16 - 4 mm
Source room volume: 343.1 m3
Canopy: n/a
Vent: n/a
Test ID: 720038 Loudspeaker Configuration: L3
Frequency D0.01m,nT
Hz dB
50 20.9
63 31.1
80 22.6
100 24.5 -1
125 23.7 2
160 24.7 5
200 25.9 8
250 25.6 11
315 26.7 14
400 23.9 17
500 26.8 18
630 27.2 19
800 26.5 20
1k 23.1 21
1.25k 23.8 22
1.6k 23.2 22
2k 15.9 22
2.5k 18.7 22
3.15k 21.8 22
4k 29.8
5k 29.0
D0.01m,nT,w(C;Ctr ) 22 (-1; 0) dB
Tested by Building Performance Centre, Napier University, Edinburgh.
Measured D0.01m,nT dB
0.0
10.0
20.0
30.0
40.0
50.0
60.0
63 125 250 500 1k 2k 4kFrequency (Hz)
Sta
nd
ard
ise
d L
eve
l D
iffe
ren
ce
, D
0.0
1m
,nT
(d
B)
Measured values Shifted Reference Curve
L3-8

OPEN/CLOSED WINDOW RESEARCH Defra Research Contract: NANR116
Airborne Sound Insulation. Laboratory measurements with non-diffuse source conditions
Standardised Level Difference. Simulated residential receiver environment
Date: 28/6/2005 Test Sample: Window A-1 Open 0.05 m2
Air temperature: 20.6 ºC Area of window unit, S: 2.52 m2
Air humidity: 31.2 % Window mass per unit area: 30.00 kg/m2
Atmospheric pressure: 1.0091 Bar
Receiving room volume: 31.2 m3
Glass Specification: 4 -16 - 4 mm
Source room volume: 343.1 m3
Canopy: n/a
Vent: n/a
Test ID: 628078 Loudspeaker Configuration: L4
Frequency D0.01m,nT
Hz dB
50 19.3
63 27.3
80 21.4
100 26.0 -1
125 23.7 2
160 20.4 5
200 22.0 8
250 18.7 11
315 20.8 14
400 25.7 17
500 20.7 18
630 17.6 19
800 26.2 20
1k 22.5 21
1.25k 24.2 22
1.6k 21.7 22
2k 22.4 22
2.5k 19.2 22
3.15k 24.3 22
4k 24.5
5k 23.7
D0.01m,nT,w(C;Ctr ) 22 ( 0; 0) dB
Tested by Building Performance Centre, Napier University, Edinburgh.
Measured D0.01m,nT dB
0.0
10.0
20.0
30.0
40.0
50.0
60.0
63 125 250 500 1k 2k 4kFrequency (Hz)
Sta
nd
ard
ise
d L
eve
l D
iffe
ren
ce
, D
0.0
1m
,nT
(d
B)
Measured values Shifted Reference Curve
K4-1

OPEN/CLOSED WINDOW RESEARCH Defra Research Contract: NANR116
Airborne Sound Insulation. Laboratory measurements with non-diffuse source conditions
Standardised Level Difference. Simulated residential receiver environment
Date: 5/7/05 Test Sample: Window B Open 0.05 m2
Air temperature: 19.5 ºC Area of window unit, S: 1.26 m2
Air humidity: 31.2 % Window mass per unit area: 27.94 kg/m2
Atmospheric pressure: 0.9981 Bar
Receiving room volume: 31.2 m3
Glass Specification: 4 -16 - 4 mm
Source room volume: 343.1 m3
Canopy: n/a
Vent: n/a
Test ID: 705018 Loudspeaker Configuration: L4
Frequency D0.01m,nT
Hz dB
50 23.6
63 29.8
80 20.3
100 24.3 -3
125 22.8 0
160 20.9 3
200 22.2 6
250 21.6 9
315 24.0 12
400 25.0 15
500 20.7 16
630 15.2 17
800 22.9 18
1k 16.9 19
1.25k 20.3 20
1.6k 21.7 20
2k 18.4 20
2.5k 19.5 20
3.15k 20.3 20
4k 21.7
5k 27.2
D0.01m,nT,w(C;Ctr ) 20 (-1; -1) dB
Tested by Building Performance Centre, Napier University, Edinburgh.
Measured D0.01m,nT dB
0.0
10.0
20.0
30.0
40.0
50.0
60.0
63 125 250 500 1k 2k 4kFrequency (Hz)
Sta
nd
ard
ise
d L
eve
l D
iffe
ren
ce
, D
0.0
1m
,nT
(d
B)
Measured values Shifted Reference Curve
K4-2

OPEN/CLOSED WINDOW RESEARCH Defra Research Contract: NANR116
Airborne Sound Insulation. Laboratory measurements with non-diffuse source conditions
Standardised Level Difference. Simulated residential receiver environment
Date: 11/7/05 Test Sample: Window C-2 Open 0.05 m2
Air temperature: 20.6 ºC Area of window unit, S: 0.945 m2
Air humidity: 31.2 % Window mass per unit area: 36.83 kg/m2
Atmospheric pressure: 1.0273 Bar
Receiving room volume: 31.2 m3
Glass Specification: 4 -16 - 4 mm
Source room volume: 343.1 m3
Canopy: Original
Vent: Closed
Test ID: 711061 Loudspeaker Configuration: L4
Frequency D0.01m,nT
Hz dB
50 22.7
63 31.5
80 23.0
100 26.2 -1
125 24.8 2
160 25.5 5
200 27.6 8
250 21.9 11
315 21.8 14
400 24.1 17
500 26.9 18
630 17.4 19
800 23.0 20
1k 20.4 21
1.25k 22.4 22
1.6k 20.0 22
2k 20.0 22
2.5k 22.0 22
3.15k 27.3 22
4k 26.9
5k 28.2
D0.01m,nT,w(C;Ctr ) 22 (-1; -1) dB
Tested by Building Performance Centre, Napier University, Edinburgh.
Measured D0.01m,nT dB
0.0
10.0
20.0
30.0
40.0
50.0
60.0
63 125 250 500 1k 2k 4kFrequency (Hz)
Sta
nd
ard
ise
d L
eve
l D
iffe
ren
ce
, D
0.0
1m
,nT
(d
B)
Measured values Shifted Reference Curve
K4-3

OPEN/CLOSED WINDOW RESEARCH Defra Research Contract: NANR116
Airborne Sound Insulation. Laboratory measurements with non-diffuse source conditions
Standardised Level Difference. Simulated residential receiver environment
Date: 12/7/05 Test Sample: Window C-3 Open 0.05 m2
Air temperature: 21.1 ºC Area of window unit, S: 0.945 m2
Air humidity: 31.2 % Window mass per unit area: 36.83 kg/m2
Atmospheric pressure: 1.0246 Bar
Receiving room volume: 31.2 m3
Glass Specification: 4 -18 - 6.4(lam) mm
Source room volume: 343.1 m3
Canopy: n/a
Vent: Vent 1 closed
Test ID: 712058 Loudspeaker Configuration: L4
Frequency D0.01m,nT
Hz dB
50 23.6
63 31.5
80 22.6
100 27.1 -3
125 25.2 0
160 26.9 3
200 28.5 6
250 22.0 9
315 19.6 12
400 21.0 15
500 25.9 16
630 16.9 17
800 21.1 18
1k 19.8 19
1.25k 19.6 20
1.6k 19.3 20
2k 21.8 20
2.5k 18.5 20
3.15k 23.9 20
4k 26.4
5k 24.6
D0.01m,nT,w(C;Ctr ) 20 ( 0; 0) dB
Tested by Building Performance Centre, Napier University, Edinburgh.
Measured D0.01m,nT dB
0.0
10.0
20.0
30.0
40.0
50.0
60.0
63 125 250 500 1k 2k 4kFrequency (Hz)
Sta
nd
ard
ise
d L
eve
l D
iffe
ren
ce
, D
0.0
1m
,nT
(d
B)
Measured values Shifted Reference Curve
K4-4

OPEN/CLOSED WINDOW RESEARCH Defra Research Contract: NANR116
Airborne Sound Insulation. Laboratory measurements with non-diffuse source conditions
Standardised Level Difference. Simulated residential receiver environment
Date: 12/7/05 Test Sample: Window C-4 Open 0.05 m2
Air temperature: 21.1 ºC Area of window unit, S: 0.945 m2
Air humidity: 31.2 % Window mass per unit area: 36.83 kg/m2
Atmospheric pressure: 1.0246 Bar
Receiving room volume: 31.2 m3
Glass Specification: 4 -18 - 6.4(lam) mm
Source room volume: 343.1 m3
Canopy: n/a
Vent: Vent 1 closed
Test ID: 712062 Loudspeaker Configuration: L4
Frequency D0.01m,nT
Hz dB
50 22.5
63 30.4
80 22.0
100 26.2 -3
125 24.4 0
160 25.2 3
200 27.1 6
250 23.9 9
315 22.6 12
400 22.1 15
500 25.5 16
630 15.4 17
800 21.9 18
1k 20.0 19
1.25k 17.3 20
1.6k 17.8 20
2k 21.0 20
2.5k 18.9 20
3.15k 26.9 20
4k 25.1
5k 29.7
D0.01m,nT,w(C;Ctr ) 20 ( 0; 0) dB
Tested by Building Performance Centre, Napier University, Edinburgh.
Measured D0.01m,nT dB
0.0
10.0
20.0
30.0
40.0
50.0
60.0
63 125 250 500 1k 2k 4kFrequency (Hz)
Sta
nd
ard
ise
d L
eve
l D
iffe
ren
ce
, D
0.0
1m
,nT
(d
B)
Measured values Shifted Reference Curve
K4-5

OPEN/CLOSED WINDOW RESEARCH Defra Research Contract: NANR116
Airborne Sound Insulation. Laboratory measurements with non-diffuse source conditions
Standardised Level Difference. Simulated residential receiver environment
Date: 18/7/2005 Test Sample: Window E Open 0.05 m2
Air temperature: 20.3 ºC Area of window unit, S: 0.63 m2
Air humidity: 31.2 % Window mass per unit area: 26.83 kg/m2
Atmospheric pressure: 0.9956 Bar
Receiving room volume: 31.2 m3
Glass Specification: 4 -16 - 4 mm
Source room volume: 343.1 m3
Canopy: n/a
Vent: n/a
Test ID: 718011 Loudspeaker Configuration: L4
Frequency D0.01m,nT
Hz dB
50 26.1
63 32.8
80 24.1
100 26.5 2
125 25.3 5
160 26.9 8
200 23.9 11
250 19.8 14
315 20.8 17
400 23.8 20
500 22.9 21
630 21.6 22
800 21.6 23
1k 25.2 24
1.25k 23.9 25
1.6k 25.9 25
2k 26.9 25
2.5k 25.8 25
3.15k 26.9 25
4k 27.3
5k 27.7
D0.01m,nT,w(C;Ctr ) 25 (-1; -1) dB
Tested by Building Performance Centre, Napier University, Edinburgh.
Measured D0.01m,nT dB
0.0
10.0
20.0
30.0
40.0
50.0
60.0
63 125 250 500 1k 2k 4kFrequency (Hz)
Sta
nd
ard
ise
d L
eve
l D
iffe
ren
ce
, D
0.0
1m
,nT
(d
B)
Measured values Shifted Reference Curve
K4-6

OPEN/CLOSED WINDOW RESEARCH Defra Research Contract: NANR116
Airborne Sound Insulation. Laboratory measurements with non-diffuse source conditions
Standardised Level Difference. Simulated residential receiver environment
Date: 19/7/2005 Test Sample: Window F Open 0.05 m2
Air temperature: 20.3 ºC Area of window unit, S: 0.63 m2
Air humidity: 31.2 % Window mass per unit area: 26.83 kg/m2
Atmospheric pressure: 1.0023 Bar
Receiving room volume: 31.2 m3
Glass Specification: 4 -16 - 4 mm
Source room volume: 343.1 m3
Canopy: n/a
Vent: n/a
Test ID: 719025 Loudspeaker Configuration: L4
Frequency D0.01m,nT
Hz dB
50 26.3
63 32.8
80 24.1
100 26.4 1
125 24.9 4
160 25.8 7
200 23.0 10
250 16.5 13
315 21.0 16
400 23.1 19
500 22.9 20
630 22.5 21
800 19.5 22
1k 24.5 23
1.25k 21.3 24
1.6k 24.9 24
2k 27.1 24
2.5k 25.6 24
3.15k 25.5 24
4k 22.5
5k 22.1
D0.01m,nT,w(C;Ctr ) 24 (-1; -2) dB
Tested by Building Performance Centre, Napier University, Edinburgh.
Measured D0.01m,nT dB
0.0
10.0
20.0
30.0
40.0
50.0
60.0
63 125 250 500 1k 2k 4kFrequency (Hz)
Sta
nd
ard
ise
d L
eve
l D
iffe
ren
ce
, D
0.0
1m
,nT
(d
B)
Measured values Shifted Reference Curve
K4-7

OPEN/CLOSED WINDOW RESEARCH Defra Research Contract: NANR116
Airborne Sound Insulation. Laboratory measurements with non-diffuse source conditions
Standardised Level Difference. Simulated residential receiver environment
Date: 20/7/2005 Test Sample: Window G Open 0.05 m2
Air temperature: 20.3 ºC Area of window unit, S: 0.54 m2
Air humidity: 31.2 % Window mass per unit area: 33.33 kg/m2
Atmospheric pressure: 1.0032 Bar
Receiving room volume: 31.2 m3
Glass Specification: 4 -16 - 4 mm
Source room volume: 343.1 m3
Canopy: n/a
Vent: n/a
Test ID: 720031 Loudspeaker Configuration: L4
Frequency D0.01m,nT
Hz dB
50 26.4
63 32.5
80 23.1
100 26.4 -1
125 24.6 2
160 25.0 5
200 23.8 8
250 22.9 11
315 24.0 14
400 24.9 17
500 23.4 18
630 17.9 19
800 26.0 20
1k 21.4 21
1.25k 23.0 22
1.6k 23.9 22
2k 21.9 22
2.5k 21.4 22
3.15k 20.6 22
4k 17.7
5k 17.9
D0.01m,nT,w(C;Ctr ) 22 ( 0; 0) dB
Tested by Building Performance Centre, Napier University, Edinburgh.
Measured D0.01m,nT dB
0.0
10.0
20.0
30.0
40.0
50.0
60.0
63 125 250 500 1k 2k 4kFrequency (Hz)
Sta
nd
ard
ise
d L
eve
l D
iffe
ren
ce
, D
0.0
1m
,nT
(d
B)
Measured values Shifted Reference Curve
K4-8

OPEN/CLOSED WINDOW RESEARCH Defra Research Contract: NANR116
Airborne Sound Insulation. Laboratory measurements with non-diffuse source conditions
Standardised Level Difference. Simulated residential receiver environment
Date: 28/6/2005 Test Sample: Window A-1 Open 0.05 m2
Air temperature: 20.7 ºC Area of window unit, S: 2.52 m2
Air humidity: 31.2 % Window mass per unit area: 30.00 kg/m2
Atmospheric pressure: 1.0091 Bar
Receiving room volume: 31.2 m3
Glass Specification: 4 -16 - 4 mm
Source room volume: 343.1 m3
Canopy: n/a
Vent: n/a
Test ID: 628094 Loudspeaker Configuration: L5
Frequency D0.01m,nT
Hz dB
50 20.9
63 27.6
80 22.2
100 28.5 -2
125 25.9 1
160 21.5 4
200 22.8 7
250 21.6 10
315 23.1 13
400 26.5 16
500 21.0 17
630 17.4 18
800 23.1 19
1k 22.5 20
1.25k 23.5 21
1.6k 18.9 21
2k 20.8 21
2.5k 19.6 21
3.15k 23.3 21
4k 22.9
5k 21.3
D0.01m,nT,w(C;Ctr ) 21 ( 0; 0) dB
Tested by Building Performance Centre, Napier University, Edinburgh.
Measured D0.01m,nT dB
0.0
10.0
20.0
30.0
40.0
50.0
60.0
63 125 250 500 1k 2k 4kFrequency (Hz)
Sta
nd
ard
ise
d L
eve
l D
iffe
ren
ce
, D
0.0
1m
,nT
(d
B)
Measured values Shifted Reference Curve
L5-1

OPEN/CLOSED WINDOW RESEARCH Defra Research Contract: NANR116
Airborne Sound Insulation. Laboratory measurements with non-diffuse source conditions
Standardised Level Difference. Simulated residential receiver environment
Date: 5/7/05 Test Sample: Window B Open 0.05 m2
Air temperature: 19.5 ºC Area of window unit, S: 1.26 m2
Air humidity: 31.2 % Window mass per unit area: 27.94 kg/m2
Atmospheric pressure: 0.998 Bar
Receiving room volume: 31.2 m3
Glass Specification: 4 -16 - 4 mm
Source room volume: 343.1 m3
Canopy: n/a
Vent: n/a
Test ID: 705023 Loudspeaker Configuration: L5
Frequency D0.01m,nT
Hz dB
50 23.6
63 29.9
80 20.0
100 24.1 -7
125 23.1 -4
160 21.0 -1
200 22.0 2
250 18.5 5
315 25.1 8
400 25.1 11
500 20.9 12
630 13.7 13
800 21.2 14
1k 16.2 15
1.25k 17.9 16
1.6k 16.7 16
2k 12.1 16
2.5k 13.9 16
3.15k 20.2 16
4k 24.6
5k 31.9
D0.01m,nT,w(C;Ctr ) 16 ( 0; 1) dB
Tested by Building Performance Centre, Napier University, Edinburgh.
Measured D0.01m,nT dB
0.0
10.0
20.0
30.0
40.0
50.0
60.0
63 125 250 500 1k 2k 4kFrequency (Hz)
Sta
nd
ard
ise
d L
eve
l D
iffe
ren
ce
, D
0.0
1m
,nT
(d
B)
Measured values Shifted Reference Curve
L5-2

OPEN/CLOSED WINDOW RESEARCH Defra Research Contract: NANR116
Airborne Sound Insulation. Laboratory measurements with non-diffuse source conditions
Standardised Level Difference. Simulated residential receiver environment
Date: 11/7/05 Test Sample: Window C-1 Open 0.05 m2
Air temperature: 20.6 ºC Area of window unit, S: 0.945 m2
Air humidity: 31.2 % Window mass per unit area: 36.83 kg/m2
Atmospheric pressure: 1.0274 Bar
Receiving room volume: 31.2 m3
Glass Specification: 4 -16 - 4 mm
Source room volume: 343.1 m3
Canopy: Original
Vent: Closed
Test ID: 711056 Loudspeaker Configuration: L5
Frequency D0.01m,nT
Hz dB
50 25.8
63 33.7
80 24.7
100 28.2 0
125 26.4 3
160 28.7 6
200 29.1 9
250 19.6 12
315 20.4 15
400 23.9 18
500 29.1 19
630 21.7 20
800 21.9 21
1k 22.9 22
1.25k 24.3 23
1.6k 21.8 23
2k 23.2 23
2.5k 24.0 23
3.15k 22.1 23
4k 23.1
5k 30.7
D0.01m,nT,w(C;Ctr ) 23 ( 0; 0) dB
Tested by Building Performance Centre, Napier University, Edinburgh.
Measured D0.01m,nT dB
0.0
10.0
20.0
30.0
40.0
50.0
60.0
63 125 250 500 1k 2k 4kFrequency (Hz)
Sta
nd
ard
ise
d L
eve
l D
iffe
ren
ce
, D
0.0
1m
,nT
(d
B)
Measured values Shifted Reference Curve
L5-3

OPEN/CLOSED WINDOW RESEARCH Defra Research Contract: NANR116
Airborne Sound Insulation. Laboratory measurements with non-diffuse source conditions
Standardised Level Difference. Simulated residential receiver environment
Date: 11/7/05 Test Sample: Window C-2 Open 0.05 m2
Air temperature: 20.6 ºC Area of window unit, S: 0.945 m2
Air humidity: 31.2 % Window mass per unit area: 36.83 kg/m2
Atmospheric pressure: 1.0274 Bar
Receiving room volume: 31.2 m3
Glass Specification: 4 -16 - 4 mm
Source room volume: 343.1 m3
Canopy: Original
Vent: Closed
Test ID: 711051 Loudspeaker Configuration: L5
Frequency D0.01m,nT
Hz dB
50 23.7
63 31.6
80 23.1
100 26.6 -3
125 24.9 0
160 25.3 3
200 25.1 6
250 17.9 9
315 18.8 12
400 21.5 15
500 22.4 16
630 16.9 17
800 18.6 18
1k 20.8 19
1.25k 20.4 20
1.6k 21.4 20
2k 20.6 20
2.5k 20.5 20
3.15k 21.1 20
4k 25.7
5k 27.1
D0.01m,nT,w(C;Ctr ) 20 ( 0; 0) dB
Tested by Building Performance Centre, Napier University, Edinburgh.
Measured D0.01m,nT dB
0.0
10.0
20.0
30.0
40.0
50.0
60.0
63 125 250 500 1k 2k 4kFrequency (Hz)
Sta
nd
ard
ise
d L
eve
l D
iffe
ren
ce
, D
0.0
1m
,nT
(d
B)
Measured values Shifted Reference Curve
L5-4

OPEN/CLOSED WINDOW RESEARCH Defra Research Contract: NANR116
Airborne Sound Insulation. Laboratory measurements with non-diffuse source conditions
Standardised Level Difference. Simulated residential receiver environment
Date: 12/7/05 Test Sample: Window C-4 Open 0.05 m2
Air temperature: 21.1 ºC Area of window unit, S: 0.945 m2
Air humidity: 31.2 % Window mass per unit area: 36.83 kg/m2
Atmospheric pressure: 1.0246 Bar
Receiving room volume: 31.2 m3
Glass Specification: 4 -18 - 6.4(lam) mm
Source room volume: 343.1 m3
Canopy: n/a
Vent: Vent 1 closed
Test ID: 712067 Loudspeaker Configuration: L5
Frequency D0.01m,nT
Hz dB
50 26.2 b
63 33.5
80 25.2
100 28.9 -1
125 27.0 2
160 28.1 5
200 27.3 8
250 21.8 11
315 22.6 14
400 23.2 17
500 24.2 18
630 18.8 19
800 22.7 20
1k 21.5 21
1.25k 22.2 22
1.6k 22.3 22
2k 23.2 22
2.5k 22.4 22
3.15k 21.8 22
4k 26.3
5k 31.0
D0.01m,nT,w(C;Ctr ) 22 ( 0; 0) dB
Tested by Building Performance Centre, Napier University, Edinburgh.
Measured D0.01m,nT dB
0.0
10.0
20.0
30.0
40.0
50.0
60.0
63 125 250 500 1k 2k 4kFrequency (Hz)
Sta
nd
ard
ise
d L
eve
l D
iffe
ren
ce
, D
0.0
1m
,nT
(d
B)
Measured values Shifted Reference Curve
L5-5

OPEN/CLOSED WINDOW RESEARCH Defra Research Contract: NANR116
Airborne Sound Insulation. Laboratory measurements with non-diffuse source conditions
Standardised Level Difference. Simulated residential receiver environment
Date: 13/7/2005 Test Sample: Window D-1 Open 0.05 m2
Air temperature: 21.8 ºC Area of window unit, S: 1.26 m2
Air humidity: 31.2 % Window mass per unit area: 27.94 kg/m2
Atmospheric pressure: 1.0176 Bar
Receiving room volume: 31.2 m3
Glass Specification: 4 -16 - 4 mm
Source room volume: 343.1 m3
Canopy: n/a
Vent: n/a
Test ID: 713039 Loudspeaker Configuration: L5
Frequency D0.01m,nT
Hz dB
50 25.5 b
63 32.9
80 23.5
100 27.3 -2
125 25.6 1
160 26.9 4
200 30.2 7
250 18.6 10
315 19.7 13
400 22.6 16
500 26.2 17
630 18.5 18
800 22.3 19
1k 16.4 20
1.25k 21.8 21
1.6k 20.6 21
2k 21.7 21
2.5k 19.9 21
3.15k 25.5 21
4k 23.1
5k 22.0
D0.01m,nT,w(C;Ctr ) 21 ( 0; -1) dB
Tested by Building Performance Centre, Napier University, Edinburgh.
Measured D0.01m,nT dB
0.0
10.0
20.0
30.0
40.0
50.0
60.0
63 125 250 500 1k 2k 4kFrequency (Hz)
Sta
nd
ard
ise
d L
eve
l D
iffe
ren
ce
, D
0.0
1m
,nT
(d
B)
Measured values Shifted Reference Curve
L5-6

OPEN/CLOSED WINDOW RESEARCH Defra Research Contract: NANR116
Airborne Sound Insulation. Laboratory measurements with non-diffuse source conditions
Standardised Level Difference. Simulated residential receiver environment
Date: 13/7/2005 Test Sample: Window D-2 Open 0.05 m2
Air temperature: 21.8 ºC Area of window unit, S: 1.26 m2
Air humidity: 31.2 % Window mass per unit area: 27.94 kg/m2
Atmospheric pressure: 1.018 Bar
Receiving room volume: 31.2 m3
Glass Specification: 4 -16 - 4 mm
Source room volume: 343.1 m3
Canopy: n/a
Vent: n/a
Test ID: 713031 Loudspeaker Configuration: L5
Frequency D0.01m,nT
Hz dB
50 25.9 b
63 32.3
80 23.2
100 26.3 -7
125 24.1 -4
160 23.2 -1
200 24.7 2
250 16.0 5
315 26.6 8
400 29.5 11
500 23.5 12
630 15.2 13
800 17.7 14
1k 14.5 15
1.25k 18.6 16
1.6k 17.9 16
2k 13.8 16
2.5k 12.3 16
3.15k 18.3 16
4k 24.1
5k 21.7
D0.01m,nT,w(C;Ctr ) 16 ( 0; 1) dB
Tested by Building Performance Centre, Napier University, Edinburgh.
Measured D0.01m,nT dB
0.0
10.0
20.0
30.0
40.0
50.0
60.0
63 125 250 500 1k 2k 4kFrequency (Hz)
Sta
nd
ard
ise
d L
eve
l D
iffe
ren
ce
, D
0.0
1m
,nT
(d
B)
Measured values Shifted Reference Curve
L5-7
OPEN/CLOSED WINDOW RESEARCH Defra Research Contract: NANR116
Airborne Sound Insulation. Laboratory measurements with non-diffuse source conditions
Standardised Level Difference. Simulated residential receiver environment
Date: 13/7/2005 Test Sample: Window D-3 Open 0.05 m2
Air temperature: 21.8 ºC Area of window unit, S: 1.26 m2
Air humidity: 31.2 % Window mass per unit area: 27.94 kg/m2
Atmospheric pressure: 1.018 Bar
Receiving room volume: 31.2 m3
Glass Specification: 4 -16 - 4 mm
Source room volume: 343.1 m3
Canopy: n/a
Vent: n/a
Test ID: 713035 Loudspeaker Configuration: L5
Frequency D0.01m,nT
Hz dB
50 27.9 B
63 32.9
80 23.3
100 27.0 -4
125 24.9 -1
160 24.3 2
200 24.8 5
250 19.4 8
315 26.7 11
400 20.5 14
500 18.3 15
630 15.6 16
800 21.8 17
1k 16.0 18
1.25k 21.3 19
1.6k 15.6 19
2k 18.2 19
2.5k 17.3 19
3.15k 25.3 19
4k 27.2
5k 26.1
D0.01m,nT,w(C;Ctr ) 19 (-1; -1) dB
Tested by Building Performance Centre, Napier University, Edinburgh.
Measured D0.01m,nT dB
0.0
10.0
20.0
30.0
40.0
50.0
60.0
63 125 250 500 1k 2k 4kFrequency (Hz)
Sta
nd
ard
ise
d L
eve
l D
iffe
ren
ce
, D
0.0
1m
,nT
(d
B)
Measured values Shifted Reference Curve
L5-8

OPEN/CLOSED WINDOW RESEARCH Defra Research Contract: NANR116
Airborne Sound Insulation. Laboratory measurements with non-diffuse source conditions
Standardised Level Difference. Simulated residential receiver environment
Date: 20/7/2005 Test Sample: Window G Open 0.05 m2
Air temperature: 20.3 ºC Area of window unit, S: 0.54 m2
Air humidity: 31.2 % Window mass per unit area: 33.33 kg/m2
Atmospheric pressure: 1.0032 Bar
Receiving room volume: 31.2 m3
Glass Specification: 4 -16 - 4 mm
Source room volume: 343.1 m3
Canopy: n/a
Vent: n/a
Test ID: 720024 Loudspeaker Configuration: L5
Frequency D0.01m,nT
Hz dB
50 25.1
63 31.8
80 22.6
100 24.8 -1
125 24.5 2
160 24.6 5
200 25.3 8
250 20.6 11
315 24.6 14
400 25.6 17
500 24.8 18
630 23.0 19
800 24.0 20
1k 21.4 21
1.25k 22.2 22
1.6k 20.3 22
2k 22.2 22
2.5k 23.1 22
3.15k 19.7 22
4k 25.5
5k 22.2
D0.01m,nT,w(C;Ctr ) 22 ( 0; 0) dB
Tested by Building Performance Centre, Napier University, Edinburgh.
Measured D0.01m,nT dB
0.0
10.0
20.0
30.0
40.0
50.0
60.0
63 125 250 500 1k 2k 4kFrequency (Hz)
Sta
nd
ard
ise
d L
eve
l D
iffe
ren
ce
, D
0.0
1m
,nT
(d
B)
Measured values Shifted Reference Curve
L5-9

OPEN/CLOSED WINDOW RESEARCH Defra Research Contract: NANR116
Airborne Sound Insulation. Laboratory measurements with non-diffuse source conditions
Standardised Level Difference. Simulated residential receiver environment
Date: 28/6/2005 Test Sample: Window A-1 Open 0.05 m2
Air temperature: 20.5 ºC Area of window unit, S: 2.52 m2
Air humidity: 31.2 % Window mass per unit area: 30.00 kg/m2
Atmospheric pressure: 1.0106 Bar
Receiving room volume: 31.2 m3
Glass Specification: 4 -16 - 4 mm
Source room volume: 343.1 m3
Canopy: n/a
Vent: n/a
Test ID: 628030 Loudspeaker Configuration: L6
Frequency D0.01m,nT
Hz dB
50 21.3
63 27.8
80 21.9
100 28.1 -3
125 24.9 0
160 21.4 3
200 19.3 6
250 20.8 9
315 21.8 12
400 15.8 15
500 22.4 16
630 24.9 17
800 25.7 18
1k 17.3 19
1.25k 21.5 20
1.6k 17.8 20
2k 16.7 20
2.5k 22.7 20
3.15k 24.7 20
4k 24.2
5k 21.7
D0.01m,nT,w(C;Ctr ) 20 ( 0; 0) dB
Tested by Building Performance Centre, Napier University, Edinburgh.
Measured D0.01m,nT dB
0.0
10.0
20.0
30.0
40.0
50.0
60.0
63 125 250 500 1k 2k 4kFrequency (Hz)
Sta
nd
ard
ise
d L
eve
l D
iffe
ren
ce
, D
0.0
1m
,nT
(d
B)
Measured values Shifted Reference Curve
L6-1

OPEN/CLOSED WINDOW RESEARCH Defra Research Contract: NANR116
Airborne Sound Insulation. Laboratory measurements with non-diffuse source conditions
Standardised Level Difference. Simulated residential receiver environment
Date: 5/7/05 Test Sample: Window B Open 0.05 m2
Air temperature: 19.5 ºC Area of window unit, S: 1.26 m2
Air humidity: 31.2 % Window mass per unit area: 27.94 kg/m2
Atmospheric pressure: 0.998 Bar
Receiving room volume: 31.2 m3
Glass Specification: 4 -16 - 4 mm
Source room volume: 343.1 m3
Canopy: n/a
Vent: n/a
Test ID: 705028 Loudspeaker Configuration: L6
Frequency D0.01m,nT
Hz dB
50 25.3
63 29.9
80 20.6
100 24.0 -4
125 23.5 -1
160 21.8 2
200 23.2 5
250 19.7 8
315 19.3 11
400 15.7 14
500 24.7 15
630 21.9 16
800 21.9 17
1k 16.4 18
1.25k 20.6 19
1.6k 18.5 19
2k 19.9 19
2.5k 19.6 19
3.15k 12.5 19
4k 17.9
5k 25.7
D0.01m,nT,w(C;Ctr ) 19 (-1; 0) dB
Tested by Building Performance Centre, Napier University, Edinburgh.
Measured D0.01m,nT dB
0.0
10.0
20.0
30.0
40.0
50.0
60.0
63 125 250 500 1k 2k 4kFrequency (Hz)
Sta
nd
ard
ise
d L
eve
l D
iffe
ren
ce
, D
0.0
1m
,nT
(d
B)
Measured values Shifted Reference Curve
L6-2

OPEN/CLOSED WINDOW RESEARCH Defra Research Contract: NANR116
Airborne Sound Insulation. Laboratory measurements with non-diffuse source conditions
Standardised Level Difference. Simulated residential receiver environment
Date: 11/7/05 Test Sample: Window C-1 Open 0.05 m2
Air temperature: 20.6 ºC Area of window unit, S: 0.945 m2
Air humidity: 31.2 % Window mass per unit area: 36.83 kg/m2
Atmospheric pressure: 1.0279 Bar
Receiving room volume: 31.2 m3
Glass Specification: 4 -16 - 4 mm
Source room volume: 343.1 m3
Canopy: Original
Vent: Closed
Test ID: 711019 Loudspeaker Configuration: L6
Frequency D0.01m,nT
Hz dB
50 27.0 B
63 32.8
80 24.0
100 27.7 -3
125 26.5 0
160 28.2 3
200 27.9 6
250 28.8 9
315 29.7 12
400 17.2 15
500 17.5 16
630 18.3 17
800 24.3 18
1k 19.7 19
1.25k 21.7 20
1.6k 18.4 20
2k 17.6 20
2.5k 22.1 20
3.15k 25.8 20
4k 29.9
5k 29.2 b
D0.01m,nT,w(C;Ctr ) 20 ( 0; 0) dB
Tested by Building Performance Centre, Napier University, Edinburgh.
Measured D0.01m,nT dB
0.0
10.0
20.0
30.0
40.0
50.0
60.0
63 125 250 500 1k 2k 4kFrequency (Hz)
Sta
nd
ard
ise
d L
eve
l D
iffe
ren
ce
, D
0.0
1m
,nT
(d
B)
Measured values Shifted Reference Curve
L6-3

OPEN/CLOSED WINDOW RESEARCH Defra Research Contract: NANR116
Airborne Sound Insulation. Laboratory measurements with non-diffuse source conditions
Standardised Level Difference. Simulated residential receiver environment
Date: 11/7/05 Test Sample: Window C-2 Open 0.05 m2
Air temperature: 20.6 ºC Area of window unit, S: 0.945 m2
Air humidity: 31.2 % Window mass per unit area: 36.83 kg/m2
Atmospheric pressure: 1.0278 Bar
Receiving room volume: 31.2 m3
Glass Specification: 4 -16 - 4 mm
Source room volume: 343.1 m3
Canopy: Original
Vent: Closed
Test ID: 711023 Loudspeaker Configuration: L6
Frequency D0.01m,nT
Hz dB
50 27.0 B
63 33.3
80 24.8
100 28.0 -1
125 26.8 2
160 28.1 5
200 27.5 8
250 27.1 11
315 27.9 14
400 18.6 17
500 20.2 18
630 20.7 19
800 23.7 20
1k 19.8 21
1.25k 23.8 22
1.6k 19.4 22
2k 19.1 22
2.5k 24.3 22
3.15k 25.7 22
4k 30.5
5k 28.8 b
D0.01m,nT,w(C;Ctr ) 22 (-1; -1) dB
Tested by Building Performance Centre, Napier University, Edinburgh.
Measured D0.01m,nT dB
0.0
10.0
20.0
30.0
40.0
50.0
60.0
63 125 250 500 1k 2k 4kFrequency (Hz)
Sta
nd
ard
ise
d L
eve
l D
iffe
ren
ce
, D
0.0
1m
,nT
(d
B)
Measured values Shifted Reference Curve
L6-4

OPEN/CLOSED WINDOW RESEARCH Defra Research Contract: NANR116
Airborne Sound Insulation. Laboratory measurements with non-diffuse source conditions
Standardised Level Difference. Simulated residential receiver environment
Date: 12/7/05 Test Sample: Window C-3 Open 0.05 m2
Air temperature: 21 ºC Area of window unit, S: 0.945 m2
Air humidity: 31.2 % Window mass per unit area: 36.83 kg/m2
Atmospheric pressure: 1.0252 Bar
Receiving room volume: 31.2 m3
Glass Specification: 4 -18 - 6.4(lam) mm
Source room volume: 343.1 m3
Canopy: n/a
Vent: Vent 1 closed
Test ID: 712019 Loudspeaker Configuration: L6
Frequency D0.01m,nT
Hz dB
50 27.0 B
63 33.1
80 24.3
100 28.5 -4
125 27.7 -1
160 29.3 2
200 29.4 5
250 32.8 8
315 29.7 11
400 15.6 14
500 17.5 15
630 18.5 16
800 23.7 17
1k 20.3 18
1.25k 20.6 19
1.6k 17.1 19
2k 13.4 19
2.5k 22.5 19
3.15k 27.3 19
4k 30.2
5k 31.5 b
D0.01m,nT,w(C;Ctr ) 19 (-1; 0) dB
Tested by Building Performance Centre, Napier University, Edinburgh.
Measured D0.01m,nT dB
0.0
10.0
20.0
30.0
40.0
50.0
60.0
63 125 250 500 1k 2k 4kFrequency (Hz)
Sta
nd
ard
ise
d L
eve
l D
iffe
ren
ce
, D
0.0
1m
,nT
(d
B)
Measured values Shifted Reference Curve
L6-5

OPEN/CLOSED WINDOW RESEARCH Defra Research Contract: NANR116
Airborne Sound Insulation. Laboratory measurements with non-diffuse source conditions
Standardised Level Difference. Simulated residential receiver environment
Date: 17/7/2005 Test Sample: Window C-4 Open 0.05 m2
Air temperature: 21 ºC Area of window unit, S: 0.995 m2
Air humidity: 31.2 % Window mass per unit area: 39.20 kg/m2
Atmospheric pressure: 1.0044 Bar
Receiving room volume: 31.2 m3
Glass Specification: 4 -18 - 6.4(lam) mm
Source room volume: 343.1 m3
Canopy: n/a
Vent: Overframe A closed
Test ID: 717078 Loudspeaker Configuration: L6
Frequency D0.01m,nT
Hz dB
50 28.1
63 33.4
80 25.0
100 28.5 -1
125 27.4 2
160 28.3 5
200 28.2 8
250 28.8 11
315 30.4 14
400 21.4 17
500 18.3 18
630 21.0 19
800 22.0 20
1k 21.0 21
1.25k 21.2 22
1.6k 21.8 22
2k 20.1 22
2.5k 20.9 22
3.15k 26.3 22
4k 31.6
5k 32.6
D0.01m,nT,w(C;Ctr ) 22 (-1; 0) dB
Tested by Building Performance Centre, Napier University, Edinburgh.
Measured D0.01m,nT dB
0.0
10.0
20.0
30.0
40.0
50.0
60.0
63 125 250 500 1k 2k 4kFrequency (Hz)
Sta
nd
ard
ise
d L
eve
l D
iffe
ren
ce
, D
0.0
1m
,nT
(d
B)
Measured values Shifted Reference Curve
L6-6

OPEN/CLOSED WINDOW RESEARCH Defra Research Contract: NANR116
Airborne Sound Insulation. Laboratory measurements with non-diffuse source conditions
Standardised Level Difference. Simulated residential receiver environment
Date: 13/7/2005 Test Sample: Window D-1 Open 0.05 m2
Air temperature: 21.8 ºC Area of window unit, S: 1.26 m2
Air humidity: 31.2 % Window mass per unit area: 27.94 kg/m2
Atmospheric pressure: 1.0183 Bar
Receiving room volume: 31.2 m3
Glass Specification: 4 -16 - 4 mm
Source room volume: 343.1 m3
Canopy: n/a
Vent: n/a
Test ID: 713025 Loudspeaker Configuration: L6
Frequency D0.01m,nT
Hz dB
50 26.2 B
63 32.1
80 22.9
100 26.6 -3
125 25.4 0
160 26.7 3
200 28.4 6
250 27.6 9
315 18.5 12
400 12.0 15
500 13.7 16
630 18.3 17
800 24.8 18
1k 16.3 19
1.25k 22.0 20
1.6k 23.5 20
2k 22.4 20
2.5k 22.7 20
3.15k 20.9 20
4k 18.4
5k 21.8
D0.01m,nT,w(C;Ctr ) 20 (-1; -1) dB
Tested by Building Performance Centre, Napier University, Edinburgh.
Measured D0.01m,nT dB
0.0
10.0
20.0
30.0
40.0
50.0
60.0
63 125 250 500 1k 2k 4kFrequency (Hz)
Sta
nd
ard
ise
d L
eve
l D
iffe
ren
ce
, D
0.0
1m
,nT
(d
B)
Measured values Shifted Reference Curve
L6-7

OPEN/CLOSED WINDOW RESEARCH Defra Research Contract: NANR116
Airborne Sound Insulation. Laboratory measurements with non-diffuse source conditions
Standardised Level Difference. Simulated residential receiver environment
Date: 13/7/2005 Test Sample: Window D-2 Open 0.05 m2
Air temperature: 21.8 ºC Area of window unit, S: 1.26 m2
Air humidity: 31.2 % Window mass per unit area: 27.94 kg/m2
Atmospheric pressure: 1.0185 Bar
Receiving room volume: 31.2 m3
Glass Specification: 4 -16 - 4 mm
Source room volume: 343.1 m3
Canopy: n/a
Vent: n/a
Test ID: 713017 Loudspeaker Configuration: L6
Frequency D0.01m,nT
Hz dB
50 26.5 B
63 32.6
80 24.1
100 26.2 -6
125 25.0 -3
160 24.7 0
200 25.1 3
250 21.5 6
315 17.2 9
400 12.4 12
500 22.2 13
630 22.2 14
800 21.5 15
1k 17.9 16
1.25k 15.7 17
1.6k 13.5 17
2k 17.3 17
2.5k 17.7 17
3.15k 20.1 17
4k 18.7
5k 20.7
D0.01m,nT,w(C;Ctr ) 17 ( 0; 0) dB
Tested by Building Performance Centre, Napier University, Edinburgh.
Measured D0.01m,nT dB
0.0
10.0
20.0
30.0
40.0
50.0
60.0
63 125 250 500 1k 2k 4kFrequency (Hz)
Sta
nd
ard
ise
d L
eve
l D
iffe
ren
ce
, D
0.0
1m
,nT
(d
B)
Measured values Shifted Reference Curve
L6-8

OPEN/CLOSED WINDOW RESEARCH Defra Research Contract: NANR116
Airborne Sound Insulation. Laboratory measurements with non-diffuse source conditions
Standardised Level Difference. Simulated residential receiver environment
Date: 13/7/2005 Test Sample: Window D-3 Open 0.05 m2
Air temperature: 21.8 ºC Area of window unit, S: 1.26 m2
Air humidity: 31.2 % Window mass per unit area: 27.94 kg/m2
Atmospheric pressure: 1.0183 Bar
Receiving room volume: 31.2 m3
Glass Specification: 4 -16 - 4 mm
Source room volume: 343.1 m3
Canopy: n/a
Vent: n/a
Test ID: 713021 Loudspeaker Configuration: L6
Frequency D0.01m,nT
Hz dB
50 27.3 B
63 33.3
80 24.3
100 27.0 -1
125 25.7 2
160 25.6 5
200 24.9 8
250 21.3 11
315 18.8 14
400 14.2 17
500 20.4 18
630 21.1 19
800 23.0 20
1k 19.0 21
1.25k 24.6 22
1.6k 20.5 22
2k 22.2 22
2.5k 25.8 22
3.15k 24.7 22
4k 23.2
5k 25.9
D0.01m,nT,w(C;Ctr ) 22 (-1; -1) dB
Tested by Building Performance Centre, Napier University, Edinburgh.
Measured D0.01m,nT dB
0.0
10.0
20.0
30.0
40.0
50.0
60.0
63 125 250 500 1k 2k 4kFrequency (Hz)
Sta
nd
ard
ise
d L
eve
l D
iffe
ren
ce
, D
0.0
1m
,nT
(d
B)
Measured values Shifted Reference Curve
L6-9

OPEN/CLOSED WINDOW RESEARCH Defra Research Contract: NANR116
Airborne Sound Insulation. Laboratory measurements with non-diffuse source conditions
Standardised Level Difference. Simulated residential receiver environment
Date: 18/7/2005 Test Sample: Window E Open 0.05 m2
Air temperature: 20.4 ºC Area of window unit, S: 0.63 m2
Air humidity: 31.2 % Window mass per unit area: 26.83 kg/m2
Atmospheric pressure: 0.9956 Bar
Receiving room volume: 31.2 m3
Glass Specification: 4 -16 - 4 mm
Source room volume: 343.1 m3
Canopy: n/a
Vent: n/a
Test ID: 718025 Loudspeaker Configuration: L6
Frequency D0.01m,nT
Hz dB
50 25.3
63 32.9
80 23.2
100 26.6 -1
125 25.5 2
160 26.6 5
200 24.6 8
250 24.5 11
315 23.5 14
400 17.8 17
500 23.2 18
630 21.3 19
800 17.5 20
1k 20.3 21
1.25k 24.9 22
1.6k 28.4 22
2k 24.1 22
2.5k 20.0 22
3.15k 20.7 22
4k 23.0
5k 26.1
D0.01m,nT,w(C;Ctr ) 22 (-1; -1) dB
Tested by Building Performance Centre, Napier University, Edinburgh.
Measured D0.01m,nT dB
0.0
10.0
20.0
30.0
40.0
50.0
60.0
63 125 250 500 1k 2k 4kFrequency (Hz)
Sta
nd
ard
ise
d L
eve
l D
iffe
ren
ce
, D
0.0
1m
,nT
(d
B)
Measured values Shifted Reference Curve
L6-10

OPEN/CLOSED WINDOW RESEARCH Defra Research Contract: NANR116
Airborne Sound Insulation. Laboratory measurements with non-diffuse source conditions
Standardised Level Difference. Simulated residential receiver environment
Date: 19/7/2005 Test Sample: Window F Open 0.05 m2
Air temperature: 19.9 ºC Area of window unit, S: 0.63 m2
Air humidity: 31.2 % Window mass per unit area: 26.83 kg/m2
Atmospheric pressure: 1.0019 Bar
Receiving room volume: 31.2 m3
Glass Specification: 4 -16 - 4 mm
Source room volume: 343.1 m3
Canopy: n/a
Vent: n/a
Test ID: 719004 Loudspeaker Configuration: L6
Frequency D0.01m,nT
Hz dB
50 25.6
63 33.5
80 24.7
100 26.4 1
125 25.5 4
160 25.5 7
200 23.1 10
250 25.2 13
315 25.2 16
400 20.1 19
500 22.6 20
630 20.3 21
800 20.5 22
1k 21.2 23
1.25k 28.0 24
1.6k 27.7 24
2k 23.6 24
2.5k 23.9 24
3.15k 26.8 24
4k 23.9
5k 21.4
D0.01m,nT,w(C;Ctr ) 24 (-1; -1) dB
Tested by Building Performance Centre, Napier University, Edinburgh.
Measured D0.01m,nT dB
0.0
10.0
20.0
30.0
40.0
50.0
60.0
63 125 250 500 1k 2k 4kFrequency (Hz)
Sta
nd
ard
ise
d L
eve
l D
iffe
ren
ce
, D
0.0
1m
,nT
(d
B)
Measured values Shifted Reference Curve
L6-11

OPEN/CLOSED WINDOW RESEARCH Defra Research Contract: NANR116
Airborne Sound Insulation. Laboratory measurements with non-diffuse source conditions
Standardised Level Difference. Simulated residential receiver environment
Date: 28/6/2005 Test Sample: Window A-1 Open 0.05 m2
Air temperature: 20.7 ºC Area of window unit, S: 2.52 m2
Air humidity: 31.2 % Window mass per unit area: 30.00 kg/m2
Atmospheric pressure: 1.009 Bar
Receiving room volume: 31.2 m3
Glass Specification: 4 -16 - 4 mm
Source room volume: 343.1 m3
Canopy: n/a
Vent: n/a
Test ID: 628110 Loudspeaker Configuration: Line
Frequency D0.01m,nT
Hz dB
50 20.8
63 27.8
80 21.5
100 28.6 -2
125 24.6 1
160 20.3 4
200 22.1 7
250 23.0 10
315 25.5 13
400 27.4 16
500 26.7 17
630 21.4 18
800 26.6 19
1k 21.8 20
1.25k 17.4 21
1.6k 17.4 21
2k 18.2 21
2.5k 20.9 21
3.15k 25.7 21
4k 23.8
5k 19.8
D0.01m,nT,w(C;Ctr ) 21 (-1; 0) dB
Tested by Building Performance Centre, Napier University, Edinburgh.
Measured D0.01m,nT dB
0.0
10.0
20.0
30.0
40.0
50.0
60.0
63 125 250 500 1k 2k 4kFrequency (Hz)
Sta
nd
ard
ise
d L
eve
l D
iffe
ren
ce
, D
0.0
1m
,nT
(d
B)
Measured values Shifted Reference Curve
L7-1

OPEN/CLOSED WINDOW RESEARCH Defra Research Contract: NANR116
Airborne Sound Insulation. Laboratory measurements with non-diffuse source conditions
Standardised Level Difference. Simulated residential receiver environment
Date: 5/7/05 Test Sample: Window B Open 0.05 m2
Air temperature: 19.5 ºC Area of window unit, S: 1.26 m2
Air humidity: 31.2 % Window mass per unit area: 27.94 kg/m2
Atmospheric pressure: 0.9982 Bar
Receiving room volume: 31.2 m3
Glass Specification: 4 -16 - 4 mm
Source room volume: 343.1 m3
Canopy: n/a
Vent: n/a
Test ID: 705033 Loudspeaker Configuration: Line
Frequency D0.01m,nT
Hz dB
50 24.5
63 29.9
80 20.1
100 24.3 -6
125 22.2 -3
160 19.7 0
200 21.2 3
250 21.2 6
315 24.0 9
400 26.1 12
500 23.1 13
630 18.0 14
800 24.4 15
1k 20.6 16
1.25k 19.8 17
1.6k 14.1 17
2k 11.6 17
2.5k 14.1 17
3.15k 16.6 17
4k 21.0
5k 26.0
D0.01m,nT,w(C;Ctr ) 17 (-1; 1) dB
Tested by Building Performance Centre, Napier University, Edinburgh.
Measured D0.01m,nT dB
0.0
10.0
20.0
30.0
40.0
50.0
60.0
63 125 250 500 1k 2k 4kFrequency (Hz)
Sta
nd
ard
ise
d L
eve
l D
iffe
ren
ce
, D
0.0
1m
,nT
(d
B)
Measured values Shifted Reference Curve
L7-2

OPEN/CLOSED WINDOW RESEARCH Defra Research Contract: NANR116
Airborne Sound Insulation. Laboratory measurements with non-diffuse source conditions
Standardised Level Difference. Simulated residential receiver environment
Date: 11/7/05 Test Sample: Window C-1 Open 0.05 m2
Air temperature: 20.7 ºC Area of window unit, S: 0.945 m2
Air humidity: 31.2 % Window mass per unit area: 36.83 kg/m2
Atmospheric pressure: 1.0272 Bar
Receiving room volume: 31.2 m3
Glass Specification: 4 -16 - 4 mm
Source room volume: 343.1 m3
Canopy: Original
Vent: Closed
Test ID: 711070 Loudspeaker Configuration: Line
Frequency D0.01m,nT
Hz dB
50 23.9
63 31.6
80 22.6
100 26.5 -1
125 24.7 2
160 26.3 5
200 28.4 8
250 17.3 11
315 18.2 14
400 20.4 17
500 26.9 18
630 21.1 19
800 18.0 20
1k 21.1 21
1.25k 23.4 22
1.6k 22.5 22
2k 21.2 22
2.5k 21.6 22
3.15k 24.9 22
4k 27.3
5k 26.9
D0.01m,nT,w(C;Ctr ) 22 ( 0; -1) dB
Tested by Building Performance Centre, Napier University, Edinburgh.
Measured D0.01m,nT dB
0.0
10.0
20.0
30.0
40.0
50.0
60.0
63 125 250 500 1k 2k 4kFrequency (Hz)
Sta
nd
ard
ise
d L
eve
l D
iffe
ren
ce
, D
0.0
1m
,nT
(d
B)
Measured values Shifted Reference Curve
L7-3

OPEN/CLOSED WINDOW RESEARCH Defra Research Contract: NANR116
Airborne Sound Insulation. Laboratory measurements with non-diffuse source conditions
Standardised Level Difference. Simulated residential receiver environment
Date: 11/7/05 Test Sample: Window C-2 Open 0.05 m2
Air temperature: 20.7 ºC Area of window unit, S: 0.945 m2
Air humidity: 31.2 % Window mass per unit area: 36.83 kg/m2
Atmospheric pressure: 1.0272 Bar
Receiving room volume: 31.2 m3
Glass Specification: 4 -16 - 4 mm
Source room volume: 343.1 m3
Canopy: Original
Vent: Closed
Test ID: 711074 Loudspeaker Configuration: Line
Frequency D0.01m,nT
Hz dB
50 20.7
63 28.5
80 20.0
100 24.0 -3
125 22.2 0
160 22.8 3
200 23.7 6
250 17.6 9
315 19.5 12
400 19.2 15
500 21.4 16
630 17.0 17
800 17.2 18
1k 18.3 19
1.25k 14.4 20
1.6k 22.1 20
2k 23.1 20
2.5k 23.0 20
3.15k 22.5 20
4k 26.0
5k 24.4
D0.01m,nT,w(C;Ctr ) 20 (-1; -2) dB
Tested by Building Performance Centre, Napier University, Edinburgh.
Measured D0.01m,nT dB
0.0
10.0
20.0
30.0
40.0
50.0
60.0
63 125 250 500 1k 2k 4kFrequency (Hz)
Sta
nd
ard
ise
d L
eve
l D
iffe
ren
ce
, D
0.0
1m
,nT
(d
B)
Measured values Shifted Reference Curve
L7-4

OPEN/CLOSED WINDOW RESEARCH Defra Research Contract: NANR116
Airborne Sound Insulation. Laboratory measurements with non-diffuse source conditions
Standardised Level Difference. Simulated residential receiver environment
Date: 12/7/05 Test Sample: Window C-3 Open 0.05 m2
Air temperature: 20.9 ºC Area of window unit, S: 0.945 m2
Air humidity: 31.2 % Window mass per unit area: 36.83 kg/m2
Atmospheric pressure: 1.0254 Bar
Receiving room volume: 31.2 m3
Glass Specification: 4 -18 - 6.4(lam) mm
Source room volume: 343.1 m3
Canopy: n/a
Vent: Vent 1 closed
Test ID: 712006 Loudspeaker Configuration: Line
Frequency D0.01m,nT
Hz dB
50 25.7
63 32.4
80 23.5
100 27.8 0
125 26.2 3
160 28.8 6
200 29.5 9
250 21.0 12
315 21.8 15
400 22.5 18
500 29.1 19
630 22.6 20
800 19.4 21
1k 21.4 22
1.25k 22.7 23
1.6k 23.6 23
2k 23.1 23
2.5k 23.5 23
3.15k 25.8 23
4k 26.4
5k 28.9
D0.01m,nT,w(C;Ctr ) 23 ( 0; -1) dB
Tested by Building Performance Centre, Napier University, Edinburgh.
Measured D0.01m,nT dB
0.0
10.0
20.0
30.0
40.0
50.0
60.0
63 125 250 500 1k 2k 4kFrequency (Hz)
Sta
nd
ard
ise
d L
eve
l D
iffe
ren
ce
, D
0.0
1m
,nT
(d
B)
Measured values Shifted Reference Curve
L7-5

OPEN/CLOSED WINDOW RESEARCH Defra Research Contract: NANR116
Airborne Sound Insulation. Laboratory measurements with non-diffuse source conditions
Standardised Level Difference. Simulated residential receiver environment
Date: 12/7/05 Test Sample: Window C-4 Open 0.05 m2
Air temperature: 20.9 ºC Area of window unit, S: 0.945 m2
Air humidity: 31.2 % Window mass per unit area: 36.83 kg/m2
Atmospheric pressure: 1.0254 Bar
Receiving room volume: 31.2 m3
Glass Specification: 4 -18 - 6.4(lam) mm
Source room volume: 343.1 m3
Canopy: n/a
Vent: Vent 1 closed
Test ID: 712010 Loudspeaker Configuration: Line
Frequency D0.01m,nT
Hz dB
50 24.9
63 31.6
80 23.1
100 27.2 -2
125 25.5 1
160 26.5 4
200 26.8 7
250 21.9 10
315 23.6 13
400 24.5 16
500 26.8 17
630 19.5 18
800 16.8 19
1k 20.7 20
1.25k 20.3 21
1.6k 23.3 21
2k 20.2 21
2.5k 22.9 21
3.15k 23.4 21
4k 25.0
5k 26.7
D0.01m,nT,w(C;Ctr ) 21 ( 0; 0) dB
Tested by Building Performance Centre, Napier University, Edinburgh.
Measured D0.01m,nT dB
0.0
10.0
20.0
30.0
40.0
50.0
60.0
63 125 250 500 1k 2k 4kFrequency (Hz)
Sta
nd
ard
ise
d L
eve
l D
iffe
ren
ce
, D
0.0
1m
,nT
(d
B)
Measured values Shifted Reference Curve
L7-6

OPEN/CLOSED WINDOW RESEARCH Defra Research Contract: NANR116
Airborne Sound Insulation. Laboratory measurements with non-diffuse source conditions
Standardised Level Difference. Simulated residential receiver environment
Date: 13/7/2005 Test Sample: Window D-1 Open 0.05 m2
Air temperature: 21.8 ºC Area of window unit, S: 1.26 m2
Air humidity: 31.2 % Window mass per unit area: 27.94 kg/m2
Atmospheric pressure: 1.0174 Bar
Receiving room volume: 31.2 m3
Glass Specification: 4 -16 - 4 mm
Source room volume: 343.1 m3
Canopy: n/a
Vent: n/a
Test ID: 713067 Loudspeaker Configuration: Line
Frequency D0.01m,nT
Hz dB
50 26.4
63 33.0
80 23.5
100 27.7 -5
125 25.5 -2
160 27.0 1
200 31.0 4
250 17.9 7
315 19.8 10
400 21.4 13
500 20.1 14
630 12.1 15
800 17.0 16
1k 15.5 17
1.25k 18.9 18
1.6k 22.8 18
2k 22.3 18
2.5k 16.1 18
3.15k 19.4 18
4k 20.0
5k 25.0
D0.01m,nT,w(C;Ctr ) 18 ( 0; -1) dB
Tested by Building Performance Centre, Napier University, Edinburgh.
Measured D0.01m,nT dB
0.0
10.0
20.0
30.0
40.0
50.0
60.0
63 125 250 500 1k 2k 4kFrequency (Hz)
Sta
nd
ard
ise
d L
eve
l D
iffe
ren
ce
, D
0.0
1m
,nT
(d
B)
Measured values Shifted Reference Curve
L7-7

OPEN/CLOSED WINDOW RESEARCH Defra Research Contract: NANR116
Airborne Sound Insulation. Laboratory measurements with non-diffuse source conditions
Standardised Level Difference. Simulated residential receiver environment
Date: 13/7/2005 Test Sample: Window D-2 Open 0.05 m2
Air temperature: 21.8 ºC Area of window unit, S: 1.26 m2
Air humidity: 31.2 % Window mass per unit area: 27.94 kg/m2
Atmospheric pressure: 1.0175 Bar
Receiving room volume: 31.2 m3
Glass Specification: 4 -16 - 4 mm
Source room volume: 343.1 m3
Canopy: n/a
Vent: n/a
Test ID: 713059 Loudspeaker Configuration: Line
Frequency D0.01m,nT
Hz dB
50 26.6
63 32.2
80 23.1
100 26.3 -7
125 23.7 -4
160 23.0 -1
200 24.0 2
250 17.1 5
315 26.9 8
400 28.5 11
500 17.4 12
630 15.8 13
800 13.4 14
1k 16.2 15
1.25k 18.3 16
1.6k 16.3 16
2k 14.2 16
2.5k 12.0 16
3.15k 16.8 16
4k 17.9
5k 21.2
D0.01m,nT,w(C;Ctr ) 16 (-1; 0) dB
Tested by Building Performance Centre, Napier University, Edinburgh.
Measured D0.01m,nT dB
0.0
10.0
20.0
30.0
40.0
50.0
60.0
63 125 250 500 1k 2k 4kFrequency (Hz)
Sta
nd
ard
ise
d L
eve
l D
iffe
ren
ce
, D
0.0
1m
,nT
(d
B)
Measured values Shifted Reference Curve
L7-8

OPEN/CLOSED WINDOW RESEARCH Defra Research Contract: NANR116
Airborne Sound Insulation. Laboratory measurements with non-diffuse source conditions
Standardised Level Difference. Simulated residential receiver environment
Date: 13/7/2005 Test Sample: Window D-3 Open 0.05 m2
Air temperature: 21.8 ºC Area of window unit, S: 1.26 m2
Air humidity: 31.2 % Window mass per unit area: 27.94 kg/m2
Atmospheric pressure: 1.0174 Bar
Receiving room volume: 31.2 m3
Glass Specification: 4 -16 - 4 mm
Source room volume: 343.1 m3
Canopy: n/a
Vent: n/a
Test ID: 713063 Loudspeaker Configuration: Line
Frequency D0.01m,nT
Hz dB
50 28.5
63 33.1
80 23.4
100 27.2 -6
125 24.7 -3
160 24.2 0
200 24.4 3
250 21.5 6
315 27.5 9
400 17.6 12
500 8.0 13
630 14.0 14
800 16.2 15
1k 14.2 16
1.25k 19.4 17
1.6k 20.5 17
2k 17.0 17
2.5k 18.2 17
3.15k 21.2 17
4k 22.0
5k 25.4
D0.01m,nT,w(C;Ctr ) 17 (-1; -2) dB
Tested by Building Performance Centre, Napier University, Edinburgh.
Measured D0.01m,nT dB
0.0
10.0
20.0
30.0
40.0
50.0
60.0
63 125 250 500 1k 2k 4kFrequency (Hz)
Sta
nd
ard
ise
d L
eve
l D
iffe
ren
ce
, D
0.0
1m
,nT
(d
B)
Measured values Shifted Reference Curve
L7-9

OPEN/CLOSED WINDOW RESEARCH Defra Research Contract: NANR116
Airborne Sound Insulation. Laboratory measurements with non-diffuse source conditions
Standardised Level Difference. Simulated residential receiver environment
Date: 18/7/2005 Test Sample: Window E Open 0.05 m2
Air temperature: 20.5 ºC Area of window unit, S: 0.63 m2
Air humidity: 31.2 % Window mass per unit area: 26.83 kg/m2
Atmospheric pressure: 0.9959 Bar
Receiving room volume: 31.2 m3
Glass Specification: 4 -16 - 4 mm
Source room volume: 343.1 m3
Canopy: n/a
Vent: n/a
Test ID: 718032 Loudspeaker Configuration: Line
Frequency D0.01m,nT
Hz dB
50 27.4
63 32.9
80 23.0
100 27.1 0
125 25.5 3
160 27.2 6
200 25.2 9
250 16.8 12
315 20.7 15
400 23.3 18
500 25.1 19
630 26.0 20
800 17.5 21
1k 16.7 22
1.25k 24.7 23
1.6k 25.8 23
2k 25.5 23
2.5k 24.5 23
3.15k 20.7 23
4k 20.7
5k 26.1
D0.01m,nT,w(C;Ctr ) 23 (-2; -2) dB
Tested by Building Performance Centre, Napier University, Edinburgh.
Measured D0.01m,nT dB
0.0
10.0
20.0
30.0
40.0
50.0
60.0
63 125 250 500 1k 2k 4kFrequency (Hz)
Sta
nd
ard
ise
d L
eve
l D
iffe
ren
ce
, D
0.0
1m
,nT
(d
B)
Measured values Shifted Reference Curve
L7-10

OPEN/CLOSED WINDOW RESEARCH Defra Research Contract: NANR116
Airborne Sound Insulation. Laboratory measurements with non-diffuse source conditions
Standardised Level Difference. Simulated residential receiver environment
Date: 19/7/2005 Test Sample: Window F Open 0.05 m2
Air temperature: 20.1 ºC Area of window unit, S: 0.63 m2
Air humidity: 31.2 % Window mass per unit area: 26.83 kg/m2
Atmospheric pressure: 1.0023 Bar
Receiving room volume: 31.2 m3
Glass Specification: 4 -16 - 4 mm
Source room volume: 343.1 m3
Canopy: n/a
Vent: n/a
Test ID: 719011 Loudspeaker Configuration: Line
Frequency D0.01m,nT
Hz dB
50 26.8
63 33.1
80 24.3
100 26.6 0
125 25.1 3
160 26.1 6
200 23.5 9
250 17.3 12
315 21.2 15
400 24.3 18
500 26.0 19
630 26.8 20
800 18.9 21
1k 22.6 22
1.25k 24.5 23
1.6k 23.3 23
2k 20.5 23
2.5k 20.9 23
3.15k 23.7 23
4k 20.5
5k 22.4
D0.01m,nT,w(C;Ctr ) 23 (-1; -1) dB
Tested by Building Performance Centre, Napier University, Edinburgh.
Measured D0.01m,nT dB
0.0
10.0
20.0
30.0
40.0
50.0
60.0
63 125 250 500 1k 2k 4kFrequency (Hz)
Sta
nd
ard
ise
d L
eve
l D
iffe
ren
ce
, D
0.0
1m
,nT
(d
B)
Measured values Shifted Reference Curve
L7-11

OPEN/CLOSED WINDOW RESEARCH Defra Research Contract: NANR116
Airborne Sound Insulation. Laboratory measurements with non-diffuse source conditions
Standardised Level Difference. Simulated residential receiver environment
Date: 20/7/2005 Test Sample: Window G Open 0.05 m2
Air temperature: 20.3 ºC Area of window unit, S: 0.54 m2
Air humidity: 31.2 % Window mass per unit area: 33.33 kg/m2
Atmospheric pressure: 1.0032 Bar
Receiving room volume: 31.2 m3
Glass Specification: 4 -16 - 4 mm
Source room volume: 343.1 m3
Canopy: n/a
Vent: n/a
Test ID: 720011 Loudspeaker Configuration: Line
Frequency D0.01m,nT
Hz dB
50 26.2
63 32.3
80 22.9
100 25.9 -3
125 24.6 0
160 24.3 3
200 23.8 6
250 21.6 9
315 24.2 12
400 25.5 15
500 25.1 16
630 19.1 17
800 25.4 18
1k 20.0 19
1.25k 19.9 20
1.6k 16.7 20
2k 19.5 20
2.5k 19.2 20
3.15k 17.8 20
4k 21.2
5k 23.7
D0.01m,nT,w(C;Ctr ) 20 (-1; 0) dB
Tested by Building Performance Centre, Napier University, Edinburgh.
Measured D0.01m,nT dB
0.0
10.0
20.0
30.0
40.0
50.0
60.0
63 125 250 500 1k 2k 4kFrequency (Hz)
Sta
nd
ard
ise
d L
eve
l D
iffe
ren
ce
, D
0.0
1m
,nT
(d
B)
Measured values Shifted Reference Curve
L7-12
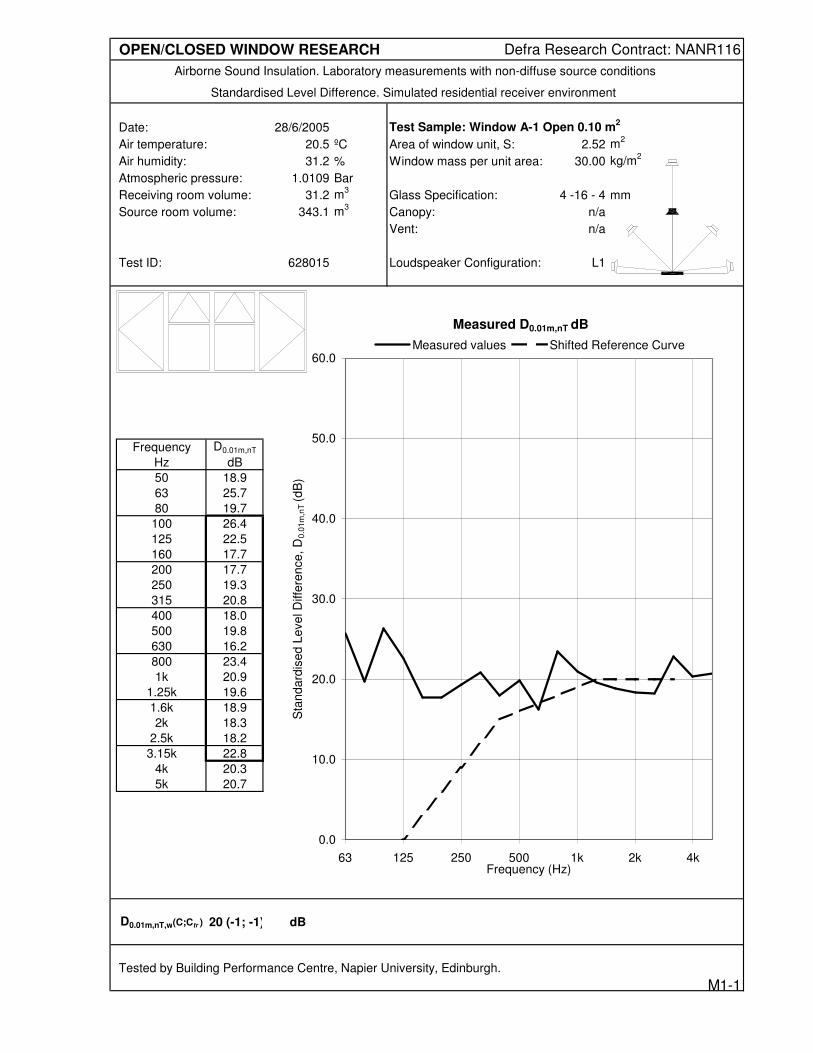
OPEN/CLOSED WINDOW RESEARCH Defra Research Contract: NANR116
Airborne Sound Insulation. Laboratory measurements with non-diffuse source conditions
Standardised Level Difference. Simulated residential receiver environment
Date: 28/6/2005 Test Sample: Window A-1 Open 0.10 m2
Air temperature: 20.5 ºC Area of window unit, S: 2.52 m2
Air humidity: 31.2 % Window mass per unit area: 30.00 kg/m2
Atmospheric pressure: 1.0109 Bar
Receiving room volume: 31.2 m3
Glass Specification: 4 -16 - 4 mm
Source room volume: 343.1 m3
Canopy: n/a
Vent: n/a
Test ID: 628015 Loudspeaker Configuration: L1
Frequency D0.01m,nT
Hz dB
50 18.9
63 25.7
80 19.7
100 26.4 -3
125 22.5 0
160 17.7 3
200 17.7 6
250 19.3 9
315 20.8 12
400 18.0 15
500 19.8 16
630 16.2 17
800 23.4 18
1k 20.9 19
1.25k 19.6 20
1.6k 18.9 20
2k 18.3 20
2.5k 18.2 20
3.15k 22.8 20
4k 20.3
5k 20.7
D0.01m,nT,w(C;Ctr ) 20 (-1; -1) dB
Tested by Building Performance Centre, Napier University, Edinburgh.
Measured D0.01m,nT dB
0.0
10.0
20.0
30.0
40.0
50.0
60.0
63 125 250 500 1k 2k 4kFrequency (Hz)
Sta
nd
ard
ise
d L
eve
l D
iffe
ren
ce
, D
0.0
1m
,nT
(d
B)
Measured values Shifted Reference Curve
M1-1

OPEN/CLOSED WINDOW RESEARCH Defra Research Contract: NANR116
Airborne Sound Insulation. Laboratory measurements with non-diffuse source conditions
Standardised Level Difference. Simulated residential receiver environment
Date: 28/6/2005 Test Sample: Window A-2 Open 0.10 m2
Air temperature: 20.5 ºC Area of window unit, S: 2.52 m2
Air humidity: 31.2 % Window mass per unit area: 30.00 kg/m2
Atmospheric pressure: 1.0109 Bar
Receiving room volume: 31.2 m3
Glass Specification: 4 -16 - 4 mm
Source room volume: 343.1 m3
Canopy: n/a
Vent: n/a
Test ID: 628010 Loudspeaker Configuration: L1
Frequency D0.01m,nT
Hz dB
50 19.7
63 26.8
80 19.9
100 25.8 -3
125 22.7 0
160 18.8 3
200 19.6 6
250 20.0 9
315 21.9 12
400 17.8 15
500 19.9 16
630 17.0 17
800 23.2 18
1k 20.7 19
1.25k 21.4 20
1.6k 19.5 20
2k 19.3 20
2.5k 18.8 20
3.15k 23.5 20
4k 20.3
5k 20.1
D0.01m,nT,w(C;Ctr ) 20 ( 0; 0) dB
Tested by Building Performance Centre, Napier University, Edinburgh.
Measured D0.01m,nT dB
0.0
10.0
20.0
30.0
40.0
50.0
60.0
63 125 250 500 1k 2k 4kFrequency (Hz)
Sta
nd
ard
ise
d L
eve
l D
iffe
ren
ce
, D
0.0
1m
,nT
(d
B)
Measured values Shifted Reference Curve
M1-2
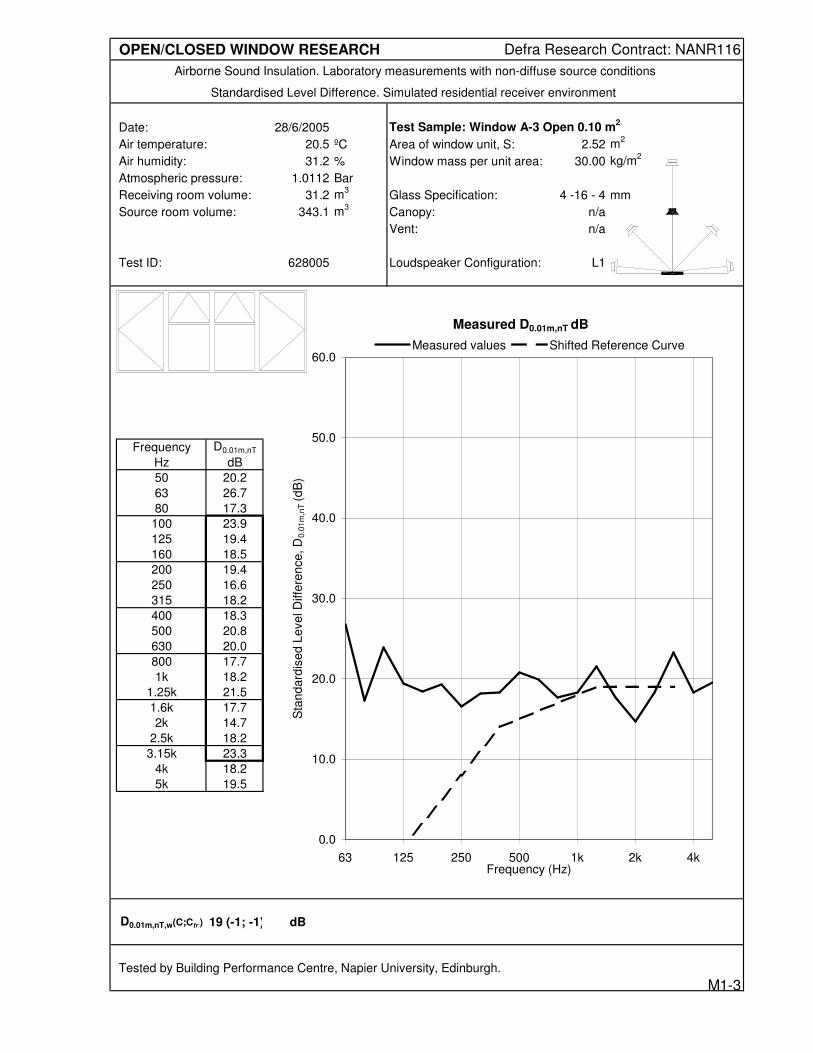
OPEN/CLOSED WINDOW RESEARCH Defra Research Contract: NANR116
Airborne Sound Insulation. Laboratory measurements with non-diffuse source conditions
Standardised Level Difference. Simulated residential receiver environment
Date: 28/6/2005 Test Sample: Window A-3 Open 0.10 m2
Air temperature: 20.5 ºC Area of window unit, S: 2.52 m2
Air humidity: 31.2 % Window mass per unit area: 30.00 kg/m2
Atmospheric pressure: 1.0112 Bar
Receiving room volume: 31.2 m3
Glass Specification: 4 -16 - 4 mm
Source room volume: 343.1 m3
Canopy: n/a
Vent: n/a
Test ID: 628005 Loudspeaker Configuration: L1
Frequency D0.01m,nT
Hz dB
50 20.2
63 26.7
80 17.3
100 23.9 -4
125 19.4 -1
160 18.5 2
200 19.4 5
250 16.6 8
315 18.2 11
400 18.3 14
500 20.8 15
630 20.0 16
800 17.7 17
1k 18.2 18
1.25k 21.5 19
1.6k 17.7 19
2k 14.7 19
2.5k 18.2 19
3.15k 23.3 19
4k 18.2
5k 19.5
D0.01m,nT,w(C;Ctr ) 19 (-1; -1) dB
Tested by Building Performance Centre, Napier University, Edinburgh.
Measured D0.01m,nT dB
0.0
10.0
20.0
30.0
40.0
50.0
60.0
63 125 250 500 1k 2k 4kFrequency (Hz)
Sta
nd
ard
ise
d L
eve
l D
iffe
ren
ce
, D
0.0
1m
,nT
(d
B)
Measured values Shifted Reference Curve
M1-3

OPEN/CLOSED WINDOW RESEARCH Defra Research Contract: NANR116
Airborne Sound Insulation. Laboratory measurements with non-diffuse source conditions
Standardised Level Difference. Simulated residential receiver environment
Date: 5/7/05 Test Sample: Window B Open 0.10 m2
Air temperature: 18.9 ºC Area of window unit, S: 1.26 m2
Air humidity: 31.2 % Window mass per unit area: 27.94 kg/m2
Atmospheric pressure: 0.9982 Bar
Receiving room volume: 31.2 m3
Glass Specification: 4 -16 - 4 mm
Source room volume: 343.1 m3
Canopy: n/a
Vent: n/a
Test ID: 705004 Loudspeaker Configuration: L1
Frequency D0.01m,nT
Hz dB
50 22.9
63 28.6
80 18.6
100 22.9 -7
125 20.2 -4
160 17.9 -1
200 18.4 2
250 19.8 5
315 21.2 8
400 21.8 11
500 19.9 12
630 12.9 13
800 18.7 14
1k 16.0 15
1.25k 16.8 16
1.6k 15.8 16
2k 14.1 16
2.5k 13.6 16
3.15k 15.9 16
4k 20.1
5k 25.7
D0.01m,nT,w(C;Ctr ) 16 ( 0; 0) dB
Tested by Building Performance Centre, Napier University, Edinburgh.
Measured D0.01m,nT dB
0.0
10.0
20.0
30.0
40.0
50.0
60.0
63 125 250 500 1k 2k 4kFrequency (Hz)
Sta
nd
ard
ise
d L
eve
l D
iffe
ren
ce
, D
0.0
1m
,nT
(d
B)
Measured values Shifted Reference Curve
M1-4

OPEN/CLOSED WINDOW RESEARCH Defra Research Contract: NANR116
Airborne Sound Insulation. Laboratory measurements with non-diffuse source conditions
Standardised Level Difference. Simulated residential receiver environment
Date: 11/7/05 Test Sample: Window C-1 Open 0.10 m2
Air temperature: 20.5 ºC Area of window unit, S: 0.945 m2
Air humidity: 31.2 % Window mass per unit area: 36.83 kg/m2
Atmospheric pressure: 1.0281 Bar
Receiving room volume: 31.2 m3
Glass Specification: 4 -16 - 4 mm
Source room volume: 343.1 m3
Canopy: Original
Vent: Closed
Test ID: 711007 Loudspeaker Configuration: L1
Frequency D0.01m,nT
Hz dB
50 24.1
63 30.8
80 21.6
100 26.3 -5
125 23.3 -2
160 26.4 1
200 25.1 4
250 20.8 7
315 18.3 10
400 19.8 13
500 17.6 14
630 9.6 15
800 12.4 16
1k 16.4 17
1.25k 20.1 18
1.6k 22.7 18
2k 20.9 18
2.5k 21.8 18
3.15k 22.9 18
4k 24.4
5k 26.1
D0.01m,nT,w(C;Ctr ) 18 (-1; -2) dB
Tested by Building Performance Centre, Napier University, Edinburgh.
Measured D0.01m,nT dB
0.0
10.0
20.0
30.0
40.0
50.0
60.0
63 125 250 500 1k 2k 4kFrequency (Hz)
Sta
nd
ard
ise
d L
eve
l D
iffe
ren
ce
, D
0.0
1m
,nT
(d
B)
Measured values Shifted Reference Curve
M1-5

OPEN/CLOSED WINDOW RESEARCH Defra Research Contract: NANR116
Airborne Sound Insulation. Laboratory measurements with non-diffuse source conditions
Standardised Level Difference. Simulated residential receiver environment
Date: 11/7/05 Test Sample: Window C-2 Open 0.10 m2
Air temperature: 20.5 ºC Area of window unit, S: 0.945 m2
Air humidity: 31.2 % Window mass per unit area: 36.83 kg/m2
Atmospheric pressure: 1.0281 Bar
Receiving room volume: 31.2 m3
Glass Specification: 4 -16 - 4 mm
Source room volume: 343.1 m3
Canopy: Original
Vent: Closed
Test ID: 711011 Loudspeaker Configuration: L1
Frequency D0.01m,nT
Hz dB
50 23.1
63 29.8
80 21.1
100 25.5 -5
125 22.7 -2
160 24.0 1
200 22.7 4
250 20.9 7
315 20.2 10
400 20.6 13
500 16.0 14
630 6.7 15
800 15.4 16
1k 15.3 17
1.25k 15.9 18
1.6k 24.0 18
2k 21.5 18
2.5k 23.1 18
3.15k 21.8 18
4k 24.3
5k 25.5
D0.01m,nT,w(C;Ctr ) 18 (-2; -3) dB
Tested by Building Performance Centre, Napier University, Edinburgh.
Measured D0.01m,nT dB
0.0
10.0
20.0
30.0
40.0
50.0
60.0
63 125 250 500 1k 2k 4kFrequency (Hz)
Sta
nd
ard
ise
d L
eve
l D
iffe
ren
ce
, D
0.0
1m
,nT
(d
B)
Measured values Shifted Reference Curve
M1-6

OPEN/CLOSED WINDOW RESEARCH Defra Research Contract: NANR116
Airborne Sound Insulation. Laboratory measurements with non-diffuse source conditions
Standardised Level Difference. Simulated residential receiver environment
Date: 12/7/05 Test Sample: Window C-3 Open 0.10 m2
Air temperature: 21.1 ºC Area of window unit, S: 0.945 m2
Air humidity: 31.2 % Window mass per unit area: 36.83 kg/m2
Atmospheric pressure: 1.025 Bar
Receiving room volume: 31.2 m3
Glass Specification: 4 -18 - 6.4(lam) mm
Source room volume: 343.1 m3
Canopy: n/a
Vent: Vent 1 closed
Test ID: 712033 Loudspeaker Configuration: L1
Frequency D0.01m,nT
Hz dB
50 23.8
63 30.8
80 21.6
100 26.8 -5
125 24.1 -2
160 27.4 1
200 26.1 4
250 23.2 7
315 19.4 10
400 19.0 13
500 18.1 14
630 7.1 15
800 13.1 16
1k 16.2 17
1.25k 20.2 18
1.6k 23.8 18
2k 21.3 18
2.5k 21.0 18
3.15k 24.2 18
4k 26.2
5k 27.2
D0.01m,nT,w(C;Ctr ) 18 (-2; -3) dB
Tested by Building Performance Centre, Napier University, Edinburgh.
Measured D0.01m,nT dB
0.0
10.0
20.0
30.0
40.0
50.0
60.0
63 125 250 500 1k 2k 4kFrequency (Hz)
Sta
nd
ard
ise
d L
eve
l D
iffe
ren
ce
, D
0.0
1m
,nT
(d
B)
Measured values Shifted Reference Curve
M1-7

OPEN/CLOSED WINDOW RESEARCH Defra Research Contract: NANR116
Airborne Sound Insulation. Laboratory measurements with non-diffuse source conditions
Standardised Level Difference. Simulated residential receiver environment
Date: 12/7/05 Test Sample: Window C-4 Open 0.10 m2
Air temperature: 21.1 ºC Area of window unit, S: 0.945 m2
Air humidity: 31.2 % Window mass per unit area: 36.83 kg/m2
Atmospheric pressure: 1.025 Bar
Receiving room volume: 31.2 m3
Glass Specification: 4 -18 - 6.4(lam) mm
Source room volume: 343.1 m3
Canopy: n/a
Vent: Vent 1 closed
Test ID: 712037 Loudspeaker Configuration: L1
Frequency D0.01m,nT
Hz dB
50 23.0
63 29.9
80 21.3
100 26.1 -6
125 23.5 -3
160 25.2 0
200 23.7 3
250 23.0 6
315 21.3 9
400 19.9 12
500 16.5 13
630 5.5 14
800 16.1 15
1k 13.6 16
1.25k 17.0 17
1.6k 23.8 17
2k 21.2 17
2.5k 23.0 17
3.15k 20.2 17
4k 25.1
5k 27.5
D0.01m,nT,w(C;Ctr ) 17 (-2; -3) dB
Tested by Building Performance Centre, Napier University, Edinburgh.
Measured D0.01m,nT dB
0.0
10.0
20.0
30.0
40.0
50.0
60.0
63 125 250 500 1k 2k 4kFrequency (Hz)
Sta
nd
ard
ise
d L
eve
l D
iffe
ren
ce
, D
0.0
1m
,nT
(d
B)
Measured values Shifted Reference Curve
M1-8

OPEN/CLOSED WINDOW RESEARCH Defra Research Contract: NANR116
Airborne Sound Insulation. Laboratory measurements with non-diffuse source conditions
Standardised Level Difference. Simulated residential receiver environment
Date: 13/7/2005 Test Sample: Window D-1 Open 0.10 m2
Air temperature: 21.8 ºC Area of window unit, S: 1.26 m2
Air humidity: 31.2 % Window mass per unit area: 27.94 kg/m2
Atmospheric pressure: 1.0185 Bar
Receiving room volume: 31.2 m3
Glass Specification: 4 -16 - 4 mm
Source room volume: 343.1 m3
Canopy: n/a
Vent: n/a
Test ID: 713012 Loudspeaker Configuration: L1
Frequency D0.01m,nT
Hz dB
50 25.1 b
63 31.2
80 21.6
100 26.1 -5
125 23.3 -2
160 25.8 1
200 24.9 4
250 14.2 7
315 17.3 10
400 16.9 13
500 13.8 14
630 15.1 15
800 17.4 16
1k 18.2 17
1.25k 20.6 18
1.6k 18.0 18
2k 16.8 18
2.5k 19.0 18
3.15k 20.0 18
4k 17.6
5k 19.9
D0.01m,nT,w(C;Ctr ) 18 ( 0; -1) dB
Tested by Building Performance Centre, Napier University, Edinburgh.
Measured D0.01m,nT dB
0.0
10.0
20.0
30.0
40.0
50.0
60.0
63 125 250 500 1k 2k 4kFrequency (Hz)
Sta
nd
ard
ise
d L
eve
l D
iffe
ren
ce
, D
0.0
1m
,nT
(d
B)
Measured values Shifted Reference Curve
M1-9

OPEN/CLOSED WINDOW RESEARCH Defra Research Contract: NANR116
Airborne Sound Insulation. Laboratory measurements with non-diffuse source conditions
Standardised Level Difference. Simulated residential receiver environment
Date: 13/7/2005 Test Sample: Window D-2 Open 0.10 m2
Air temperature: 21.8 ºC Area of window unit, S: 1.26 m2
Air humidity: 31.2 % Window mass per unit area: 27.94 kg/m2
Atmospheric pressure: 1.0185 Bar
Receiving room volume: 31.2 m3
Glass Specification: 4 -16 - 4 mm
Source room volume: 343.1 m3
Canopy: n/a
Vent: n/a
Test ID: 713004 Loudspeaker Configuration: L1
Frequency D0.01m,nT
Hz dB
50 25.0 b
63 30.5
80 21.2
100 24.7 -10
125 21.4 -7
160 21.2 -4
200 20.0 -1
250 16.5 2
315 23.0 5
400 22.0 8
500 8.9 9
630 13.1 10
800 16.0 11
1k 17.1 12
1.25k 12.7 13
1.6k 10.2 13
2k 12.2 13
2.5k 11.6 13
3.15k 18.1 13
4k 17.0
5k 16.1
D0.01m,nT,w(C;Ctr ) 13 ( 0; 0) dB
Tested by Building Performance Centre, Napier University, Edinburgh.
Measured D0.01m,nT dB
-10.0
0.0
10.0
20.0
30.0
40.0
50.0
63 125 250 500 1k 2k 4kFrequency (Hz)
Sta
nd
ard
ise
d L
eve
l D
iffe
ren
ce
, D
0.0
1m
,nT
(d
B)
Measured values Shifted Reference Curve
M1-10

OPEN/CLOSED WINDOW RESEARCH Defra Research Contract: NANR116
Airborne Sound Insulation. Laboratory measurements with non-diffuse source conditions
Standardised Level Difference. Simulated residential receiver environment
Date: 13/7/2005 Test Sample: Window D-3 Open 0.10 m2
Air temperature: 21.8 ºC Area of window unit, S: 1.26 m2
Air humidity: 31.2 % Window mass per unit area: 27.94 kg/m2
Atmospheric pressure: 1.0185 Bar
Receiving room volume: 31.2 m3
Glass Specification: 4 -16 - 4 mm
Source room volume: 343.1 m3
Canopy: n/a
Vent: n/a
Test ID: 713008 Loudspeaker Configuration: L1
Frequency D0.01m,nT
Hz dB
50 26.4 b
63 30.9
80 21.1
100 25.2 -7
125 22.0 -4
160 21.9 -1
200 20.0 2
250 16.0 5
315 23.2 8
400 11.2 11
500 13.0 12
630 16.8 13
800 17.7 14
1k 18.4 15
1.25k 13.2 16
1.6k 15.1 16
2k 17.4 16
2.5k 15.3 16
3.15k 21.8 16
4k 19.5
5k 20.5
D0.01m,nT,w(C;Ctr ) 16 ( 0; 0) dB
Tested by Building Performance Centre, Napier University, Edinburgh.
Measured D0.01m,nT dB
0.0
10.0
20.0
30.0
40.0
50.0
60.0
63 125 250 500 1k 2k 4kFrequency (Hz)
Sta
nd
ard
ise
d L
eve
l D
iffe
ren
ce
, D
0.0
1m
,nT
(d
B)
Measured values Shifted Reference Curve
M1-11

OPEN/CLOSED WINDOW RESEARCH Defra Research Contract: NANR116
Airborne Sound Insulation. Laboratory measurements with non-diffuse source conditions
Standardised Level Difference. Simulated residential receiver environment
Date: 18/7/2005 Test Sample: Window E Open 0.10 m2
Air temperature: 20.3 ºC Area of window unit, S: 0.63 m2
Air humidity: 31.2 % Window mass per unit area: 26.83 kg/m2
Atmospheric pressure: 0.9956 Bar
Receiving room volume: 31.2 m3
Glass Specification: 4 -16 - 4 mm
Source room volume: 343.1 m3
Canopy: n/a
Vent: n/a
Test ID: 718005 Loudspeaker Configuration: L1
Frequency D0.01m,nT
Hz dB
50 25.7
63 31.8
80 22.1
100 26.1 -2
125 24.7 1
160 26.7 4
200 23.6 7
250 15.6 10
315 18.8 13
400 20.9 16
500 23.3 17
630 23.2 18
800 18.8 19
1k 20.8 20
1.25k 23.5 21
1.6k 18.9 21
2k 20.4 21
2.5k 17.6 21
3.15k 21.0 21
4k 26.1
5k 24.5
D0.01m,nT,w(C;Ctr ) 21 (-1; -1) dB
Tested by Building Performance Centre, Napier University, Edinburgh.
Measured D0.01m,nT dB
0.0
10.0
20.0
30.0
40.0
50.0
60.0
63 125 250 500 1k 2k 4kFrequency (Hz)
Sta
nd
ard
ise
d L
eve
l D
iffe
ren
ce
, D
0.0
1m
,nT
(d
B)
Measured values Shifted Reference Curve
M1-12

OPEN/CLOSED WINDOW RESEARCH Defra Research Contract: NANR116
Airborne Sound Insulation. Laboratory measurements with non-diffuse source conditions
Standardised Level Difference. Simulated residential receiver environment
Date: 19/7/2005 Test Sample: Window F Open 0.10 m2
Air temperature: 20.3 ºC Area of window unit, S: 0.63 m2
Air humidity: 31.2 % Window mass per unit area: 26.83 kg/m2
Atmospheric pressure: 1.0023 Bar
Receiving room volume: 31.2 m3
Glass Specification: 4 -16 - 4 mm
Source room volume: 343.1 m3
Canopy: n/a
Vent: n/a
Test ID: 719019 Loudspeaker Configuration: L1
Frequency D0.01m,nT
Hz dB
50 25.1
63 31.5
80 22.8
100 25.5 -1
125 23.8 2
160 25.2 5
200 22.2 8
250 16.8 11
315 18.3 14
400 21.1 17
500 23.0 18
630 23.7 19
800 19.8 20
1k 24.1 21
1.25k 24.4 22
1.6k 22.3 22
2k 24.2 22
2.5k 18.0 22
3.15k 15.9 22
4k 20.2
5k 19.2
D0.01m,nT,w(C;Ctr ) 22 (-2; -1) dB
Tested by Building Performance Centre, Napier University, Edinburgh.
Measured D0.01m,nT dB
0.0
10.0
20.0
30.0
40.0
50.0
60.0
63 125 250 500 1k 2k 4kFrequency (Hz)
Sta
nd
ard
ise
d L
eve
l D
iffe
ren
ce
, D
0.0
1m
,nT
(d
B)
Measured values Shifted Reference Curve
M1-13

OPEN/CLOSED WINDOW RESEARCH Defra Research Contract: NANR116
Airborne Sound Insulation. Laboratory measurements with non-diffuse source conditions
Standardised Level Difference. Simulated residential receiver environment
Date: 20/7/2005 Test Sample: Window G Open 0.10 m2
Air temperature: 20.3 ºC Area of window unit, S: 0.54 m2
Air humidity: 31.2 % Window mass per unit area: 33.33 kg/m2
Atmospheric pressure: 1.0032 Bar
Receiving room volume: 31.2 m3
Glass Specification: 4 -16 - 4 mm
Source room volume: 343.1 m3
Canopy: n/a
Vent: n/a
Test ID: 720018 Loudspeaker Configuration: L1
Frequency D0.01m,nT
Hz dB
50 24.7
63 30.8
80 21.7
100 24.6 -2
125 22.8 1
160 22.4 4
200 20.2 7
250 20.0 10
315 23.6 13
400 24.2 16
500 24.2 17
630 21.1 18
800 24.3 19
1k 22.1 20
1.25k 22.4 21
1.6k 19.8 21
2k 19.6 21
2.5k 20.4 21
3.15k 18.6 21
4k 17.1
5k 21.9
D0.01m,nT,w(C;Ctr ) 21 ( 0; 1) dB
Tested by Building Performance Centre, Napier University, Edinburgh.
Measured D0.01m,nT dB
0.0
10.0
20.0
30.0
40.0
50.0
60.0
63 125 250 500 1k 2k 4kFrequency (Hz)
Sta
nd
ard
ise
d L
eve
l D
iffe
ren
ce
, D
0.0
1m
,nT
(d
B)
Measured values Shifted Reference Curve
M1-14

OPEN/CLOSED WINDOW RESEARCH Defra Research Contract: NANR116
Airborne Sound Insulation. Laboratory measurements with non-diffuse source conditions
Standardised Level Difference. Simulated residential receiver environment
Date: 28/6/2005 Test Sample: Window A-1 Open 0.10 m2
Air temperature: 20.6 ºC Area of window unit, S: 2.52 m2
Air humidity: 31.2 % Window mass per unit area: 30.00 kg/m2
Atmospheric pressure: 1.0102 Bar
Receiving room volume: 31.2 m3
Glass Specification: 4 -16 - 4 mm
Source room volume: 343.1 m3
Canopy: n/a
Vent: n/a
Test ID: 628047 Loudspeaker Configuration: L2
Frequency D0.01m,nT
Hz dB
50 14.5
63 24.3
80 18.7
100 23.8 1
125 20.9 4
160 21.2 7
200 18.5 10
250 19.4 13
315 23.0 16
400 22.8 19
500 21.9 20
630 22.3 21
800 23.1 22
1k 22.3 23
1.25k 21.5 24
1.6k 24.7 24
2k 25.4 24
2.5k 28.0 24
3.15k 27.9 24
4k 24.9
5k 21.9
D0.01m,nT,w(C;Ctr ) 24 ( 0; -1) dB
Tested by Building Performance Centre, Napier University, Edinburgh.
Measured D0.01m,nT dB
0.0
10.0
20.0
30.0
40.0
50.0
60.0
63 125 250 500 1k 2k 4kFrequency (Hz)
Sta
nd
ard
ise
d L
eve
l D
iffe
ren
ce
, D
0.0
1m
,nT
(d
B)
Measured values Shifted Reference Curve
M2-1

OPEN/CLOSED WINDOW RESEARCH Defra Research Contract: NANR116
Airborne Sound Insulation. Laboratory measurements with non-diffuse source conditions
Standardised Level Difference. Simulated residential receiver environment
Date: 5/7/05 Test Sample: Window B Open 0.10 m2
Air temperature: 19.1 ºC Area of window unit, S: 1.26 m2
Air humidity: 31.2 % Window mass per unit area: 27.94 kg/m2
Atmospheric pressure: 0.998 Bar
Receiving room volume: 31.2 m3
Glass Specification: 4 -16 - 4 mm
Source room volume: 343.1 m3
Canopy: n/a
Vent: n/a
Test ID: 705009 Loudspeaker Configuration: L2
Frequency D0.01m,nT
Hz dB
50 17.6
63 28.9
80 20.7
100 23.9 -2
125 22.9 1
160 22.4 4
200 23.0 7
250 23.4 10
315 23.5 13
400 19.6 16
500 21.8 17
630 18.5 18
800 21.5 19
1k 16.6 20
1.25k 16.7 21
1.6k 20.6 21
2k 25.0 21
2.5k 26.7 21
3.15k 25.6 21
4k 23.3
5k 27.0
D0.01m,nT,w(C;Ctr ) 21 (-1; -1) dB
Tested by Building Performance Centre, Napier University, Edinburgh.
Measured D0.01m,nT dB
0.0
10.0
20.0
30.0
40.0
50.0
60.0
63 125 250 500 1k 2k 4kFrequency (Hz)
Sta
nd
ard
ise
d L
eve
l D
iffe
ren
ce
, D
0.0
1m
,nT
(d
B)
Measured values Shifted Reference Curve
M2-2

OPEN/CLOSED WINDOW RESEARCH Defra Research Contract: NANR116
Airborne Sound Insulation. Laboratory measurements with non-diffuse source conditions
Standardised Level Difference. Simulated residential receiver environment
Date: 11/7/05 Test Sample: Window C-1 Open 0.10 m2
Air temperature: 20.6 ºC Area of window unit, S: 0.945 m2
Air humidity: 31.2 % Window mass per unit area: 36.83 kg/m2
Atmospheric pressure: 1.0278 Bar
Receiving room volume: 31.2 m3
Glass Specification: 4 -16 - 4 mm
Source room volume: 343.1 m3
Canopy: Original
Vent: Closed
Test ID: 711033 Loudspeaker Configuration: L2
Frequency D0.01m,nT
Hz dB
50 20.5
63 32.3
80 23.9
100 27.7 -2
125 26.1 1
160 26.3 4
200 26.5 7
250 23.7 10
315 21.9 13
400 23.7 16
500 23.4 17
630 19.2 18
800 23.2 19
1k 23.5 20
1.25k 23.4 21
1.6k 20.0 21
2k 16.7 21
2.5k 17.1 21
3.15k 19.6 21
4k 19.9
5k 21.9
D0.01m,nT,w(C;Ctr ) 21 (-1; 0) dB
Tested by Building Performance Centre, Napier University, Edinburgh.
Measured D0.01m,nT dB
0.0
10.0
20.0
30.0
40.0
50.0
60.0
63 125 250 500 1k 2k 4kFrequency (Hz)
Sta
nd
ard
ise
d L
eve
l D
iffe
ren
ce
, D
0.0
1m
,nT
(d
B)
Measured values Shifted Reference Curve
M2-3

OPEN/CLOSED WINDOW RESEARCH Defra Research Contract: NANR116
Airborne Sound Insulation. Laboratory measurements with non-diffuse source conditions
Standardised Level Difference. Simulated residential receiver environment
Date: 11/7/05 Test Sample: Window C-2 Open 0.10 m2
Air temperature: 20.6 ºC Area of window unit, S: 0.945 m2
Air humidity: 31.2 % Window mass per unit area: 36.83 kg/m2
Atmospheric pressure: 1.0276 Bar
Receiving room volume: 31.2 m3
Glass Specification: 4 -16 - 4 mm
Source room volume: 343.1 m3
Canopy: Original
Vent: Closed
Test ID: 711037 Loudspeaker Configuration: L2
Frequency D0.01m,nT
Hz dB
50 19.5
63 31.2
80 23.0
100 26.7 0
125 25.1 3
160 25.2 6
200 26.6 9
250 23.9 12
315 23.3 15
400 26.3 18
500 25.0 19
630 20.0 20
800 24.4 21
1k 24.0 22
1.25k 24.0 23
1.6k 20.1 23
2k 21.9 23
2.5k 23.3 23
3.15k 24.0 23
4k 21.3
5k 28.5
D0.01m,nT,w(C;Ctr ) 23 ( 0; 0) dB
Tested by Building Performance Centre, Napier University, Edinburgh.
Measured D0.01m,nT dB
0.0
10.0
20.0
30.0
40.0
50.0
60.0
63 125 250 500 1k 2k 4kFrequency (Hz)
Sta
nd
ard
ise
d L
eve
l D
iffe
ren
ce
, D
0.0
1m
,nT
(d
B)
Measured values Shifted Reference Curve
M2-4

OPEN/CLOSED WINDOW RESEARCH Defra Research Contract: NANR116
Airborne Sound Insulation. Laboratory measurements with non-diffuse source conditions
Standardised Level Difference. Simulated residential receiver environment
Date: 12/7/05 Test Sample: Window C-3 Open 0.10 m2
Air temperature: 21.1 ºC Area of window unit, S: 0.945 m2
Air humidity: 31.2 % Window mass per unit area: 36.83 kg/m2
Atmospheric pressure: 1.0247 Bar
Receiving room volume: 31.2 m3
Glass Specification: 4 -18 - 6.4(lam) mm
Source room volume: 343.1 m3
Canopy: n/a
Vent: Vent 1 closed
Test ID: 712046 Loudspeaker Configuration: L2
Frequency D0.01m,nT
Hz dB
50 19.6
63 31.8
80 23.6
100 27.7 -4
125 26.4 -1
160 27.2 2
200 26.8 5
250 25.7 8
315 22.6 11
400 21.6 14
500 22.6 15
630 19.4 16
800 20.6 17
1k 22.2 18
1.25k 21.3 19
1.6k 18.1 19
2k 13.8 19
2.5k 18.0 19
3.15k 18.7 19
4k 22.2
5k 27.3
D0.01m,nT,w(C;Ctr ) 19 (-1; 1) dB
Tested by Building Performance Centre, Napier University, Edinburgh.
Measured D0.01m,nT dB
0.0
10.0
20.0
30.0
40.0
50.0
60.0
63 125 250 500 1k 2k 4kFrequency (Hz)
Sta
nd
ard
ise
d L
eve
l D
iffe
ren
ce
, D
0.0
1m
,nT
(d
B)
Measured values Shifted Reference Curve
M2-5

OPEN/CLOSED WINDOW RESEARCH Defra Research Contract: NANR116
Airborne Sound Insulation. Laboratory measurements with non-diffuse source conditions
Standardised Level Difference. Simulated residential receiver environment
Date: 12/7/05 Test Sample: Window C-4 Open 0.10 m2
Air temperature: 21.1 ºC Area of window unit, S: 0.945 m2
Air humidity: 31.2 % Window mass per unit area: 36.83 kg/m2
Atmospheric pressure: 1.0247 Bar
Receiving room volume: 31.2 m3
Glass Specification: 4 -18 - 6.4(lam) mm
Source room volume: 343.1 m3
Canopy: n/a
Vent: Vent 1 closed
Test ID: 712050 Loudspeaker Configuration: L2
Frequency D0.01m,nT
Hz dB
50 19.7
63 31.6
80 23.6
100 27.6 0
125 26.2 3
160 26.9 6
200 28.0 9
250 26.4 12
315 24.9 15
400 25.6 18
500 25.3 19
630 21.8 20
800 24.0 21
1k 24.8 22
1.25k 23.2 23
1.6k 20.3 23
2k 22.9 23
2.5k 21.3 23
3.15k 25.1 23
4k 22.8
5k 32.0
D0.01m,nT,w(C;Ctr ) 23 ( 0; 0) dB
Tested by Building Performance Centre, Napier University, Edinburgh.
Measured D0.01m,nT dB
0.0
10.0
20.0
30.0
40.0
50.0
60.0
63 125 250 500 1k 2k 4kFrequency (Hz)
Sta
nd
ard
ise
d L
eve
l D
iffe
ren
ce
, D
0.0
1m
,nT
(d
B)
Measured values Shifted Reference Curve
M2-6

OPEN/CLOSED WINDOW RESEARCH Defra Research Contract: NANR116
Airborne Sound Insulation. Laboratory measurements with non-diffuse source conditions
Standardised Level Difference. Simulated residential receiver environment
Date: 18/7/2005 Test Sample: Window E Open 0.10 m2
Air temperature: 20.4 ºC Area of window unit, S: 0.63 m2
Air humidity: 31.2 % Window mass per unit area: 26.83 kg/m2
Atmospheric pressure: 0.9956 Bar
Receiving room volume: 31.2 m3
Glass Specification: 4 -16 - 4 mm
Source room volume: 343.1 m3
Canopy: n/a
Vent: n/a
Test ID: 718019 Loudspeaker Configuration: L2
Frequency D0.01m,nT
Hz dB
50 20.6
63 31.3
80 23.8
100 25.4 3
125 24.2 6
160 25.3 9
200 21.0 12
250 23.4 15
315 22.7 18
400 20.8 21
500 20.1 22
630 25.6 23
800 23.8 24
1k 23.3 25
1.25k 29.9 26
1.6k 27.2 26
2k 27.8 26
2.5k 27.8 26
3.15k 27.1 26
4k 25.9
5k 23.2
D0.01m,nT,w(C;Ctr ) 26 (-1; -2) dB
Tested by Building Performance Centre, Napier University, Edinburgh.
Measured D0.01m,nT dB
0.0
10.0
20.0
30.0
40.0
50.0
60.0
63 125 250 500 1k 2k 4kFrequency (Hz)
Sta
nd
ard
ise
d L
eve
l D
iffe
ren
ce
, D
0.0
1m
,nT
(d
B)
Measured values Shifted Reference Curve
M2-7

OPEN/CLOSED WINDOW RESEARCH Defra Research Contract: NANR116
Airborne Sound Insulation. Laboratory measurements with non-diffuse source conditions
Standardised Level Difference. Simulated residential receiver environment
Date: 19/7/2005 Test Sample: Window F Open 0.10 m2
Air temperature: 20.4 ºC Area of window unit, S: 0.63 m2
Air humidity: 31.2 % Window mass per unit area: 26.83 kg/m2
Atmospheric pressure: 1.0024 Bar
Receiving room volume: 31.2 m3
Glass Specification: 4 -16 - 4 mm
Source room volume: 343.1 m3
Canopy: n/a
Vent: n/a
Test ID: 719033 Loudspeaker Configuration: L2
Frequency D0.01m,nT
Hz dB
50 20.1
63 31.2
80 23.5
100 25.0 1
125 23.5 4
160 23.9 7
200 21.0 10
250 22.9 13
315 22.1 16
400 19.5 19
500 19.6 20
630 25.2 21
800 23.9 22
1k 22.3 23
1.25k 26.8 24
1.6k 25.9 24
2k 25.3 24
2.5k 25.6 24
3.15k 26.5 24
4k 25.7
5k 25.9
D0.01m,nT,w(C;Ctr ) 24 ( 0; -1) dB
Tested by Building Performance Centre, Napier University, Edinburgh.
Measured D0.01m,nT dB
0.0
10.0
20.0
30.0
40.0
50.0
60.0
63 125 250 500 1k 2k 4kFrequency (Hz)
Sta
nd
ard
ise
d L
eve
l D
iffe
ren
ce
, D
0.0
1m
,nT
(d
B)
Measured values Shifted Reference Curve
M2-8

OPEN/CLOSED WINDOW RESEARCH Defra Research Contract: NANR116
Airborne Sound Insulation. Laboratory measurements with non-diffuse source conditions
Standardised Level Difference. Simulated residential receiver environment
Date: 20/7/2005 Test Sample: Window G Open 0.10 m2
Air temperature: 20.3 ºC Area of window unit, S: 0.54 m2
Air humidity: 31.2 % Window mass per unit area: 33.33 kg/m2
Atmospheric pressure: 1.0032 Bar
Receiving room volume: 31.2 m3
Glass Specification: 4 -16 - 4 mm
Source room volume: 343.1 m3
Canopy: n/a
Vent: n/a
Test ID: 720046 Loudspeaker Configuration: L2
Frequency D0.01m,nT
Hz dB
50 20.6
63 30.2
80 23.7
100 25.2 -1
125 23.3 2
160 22.9 5
200 21.7 8
250 23.2 11
315 23.1 14
400 19.3 17
500 20.1 18
630 23.6 19
800 19.7 20
1k 18.6 21
1.25k 21.2 22
1.6k 22.0 22
2k 25.1 22
2.5k 24.8 22
3.15k 21.6 22
4k 17.2
5k 14.7
D0.01m,nT,w(C;Ctr ) 22 ( 0; -1) dB
Tested by Building Performance Centre, Napier University, Edinburgh.
Measured D0.01m,nT dB
0.0
10.0
20.0
30.0
40.0
50.0
60.0
63 125 250 500 1k 2k 4kFrequency (Hz)
Sta
nd
ard
ise
d L
eve
l D
iffe
ren
ce
, D
0.0
1m
,nT
(d
B)
Measured values Shifted Reference Curve
M2-9
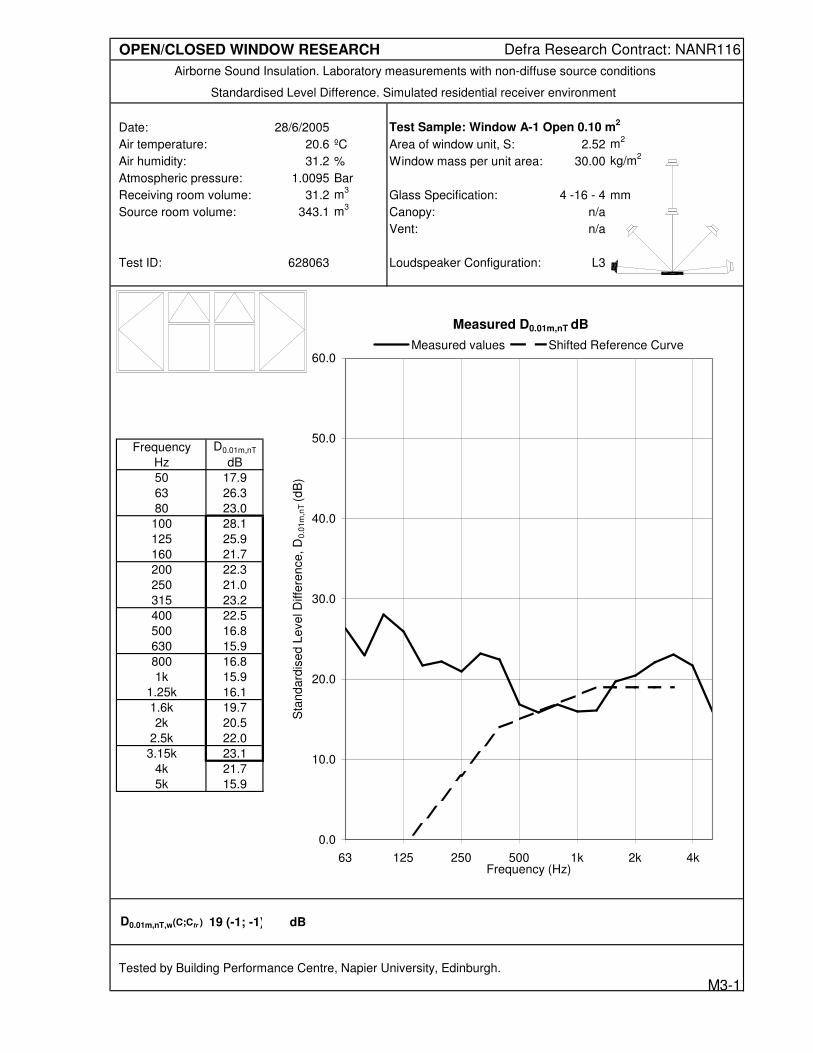
OPEN/CLOSED WINDOW RESEARCH Defra Research Contract: NANR116
Airborne Sound Insulation. Laboratory measurements with non-diffuse source conditions
Standardised Level Difference. Simulated residential receiver environment
Date: 28/6/2005 Test Sample: Window A-1 Open 0.10 m2
Air temperature: 20.6 ºC Area of window unit, S: 2.52 m2
Air humidity: 31.2 % Window mass per unit area: 30.00 kg/m2
Atmospheric pressure: 1.0095 Bar
Receiving room volume: 31.2 m3
Glass Specification: 4 -16 - 4 mm
Source room volume: 343.1 m3
Canopy: n/a
Vent: n/a
Test ID: 628063 Loudspeaker Configuration: L3
Frequency D0.01m,nT
Hz dB
50 17.9
63 26.3
80 23.0
100 28.1 -4
125 25.9 -1
160 21.7 2
200 22.3 5
250 21.0 8
315 23.2 11
400 22.5 14
500 16.8 15
630 15.9 16
800 16.8 17
1k 15.9 18
1.25k 16.1 19
1.6k 19.7 19
2k 20.5 19
2.5k 22.0 19
3.15k 23.1 19
4k 21.7
5k 15.9
D0.01m,nT,w(C;Ctr ) 19 (-1; -1) dB
Tested by Building Performance Centre, Napier University, Edinburgh.
Measured D0.01m,nT dB
0.0
10.0
20.0
30.0
40.0
50.0
60.0
63 125 250 500 1k 2k 4kFrequency (Hz)
Sta
nd
ard
ise
d L
eve
l D
iffe
ren
ce
, D
0.0
1m
,nT
(d
B)
Measured values Shifted Reference Curve
M3-1

OPEN/CLOSED WINDOW RESEARCH Defra Research Contract: NANR116
Airborne Sound Insulation. Laboratory measurements with non-diffuse source conditions
Standardised Level Difference. Simulated residential receiver environment
Date: 5/7/05 Test Sample: Window B Open 0.10 m2
Air temperature: 19.3 ºC Area of window unit, S: 1.26 m2
Air humidity: 31.2 % Window mass per unit area: 27.94 kg/m2
Atmospheric pressure: 0.9975 Bar
Receiving room volume: 31.2 m3
Glass Specification: 4 -16 - 4 mm
Source room volume: 343.1 m3
Canopy: n/a
Vent: n/a
Test ID: 705014 Loudspeaker Configuration: L3
Frequency D0.01m,nT
Hz dB
50 18.0
63 29.5
80 20.3
100 23.3 -2
125 22.6 1
160 23.0 4
200 23.4 7
250 22.5 10
315 23.1 13
400 19.8 16
500 20.8 17
630 18.2 18
800 20.2 19
1k 15.8 20
1.25k 16.0 21
1.6k 20.9 21
2k 24.3 21
2.5k 26.2 21
3.15k 25.3 21
4k 25.7
5k 28.9
D0.01m,nT,w(C;Ctr ) 21 (-1; -2) dB
Tested by Building Performance Centre, Napier University, Edinburgh.
Measured D0.01m,nT dB
0.0
10.0
20.0
30.0
40.0
50.0
60.0
63 125 250 500 1k 2k 4kFrequency (Hz)
Sta
nd
ard
ise
d L
eve
l D
iffe
ren
ce
, D
0.0
1m
,nT
(d
B)
Measured values Shifted Reference Curve
M3-2

OPEN/CLOSED WINDOW RESEARCH Defra Research Contract: NANR116
Airborne Sound Insulation. Laboratory measurements with non-diffuse source conditions
Standardised Level Difference. Simulated residential receiver environment
Date: 11/7/05 Test Sample: Window C-2 Open 0.10 m2
Air temperature: 20.6 ºC Area of window unit, S: 0.945 m2
Air humidity: 31.2 % Window mass per unit area: 36.83 kg/m2
Atmospheric pressure: 1.0276 Bar
Receiving room volume: 31.2 m3
Glass Specification: 4 -16 - 4 mm
Source room volume: 343.1 m3
Canopy: Original
Vent: Closed
Test ID: 711043 Loudspeaker Configuration: L3
Frequency D0.01m,nT
Hz dB
50 21.0
63 32.1
80 24.1
100 26.7 -4
125 24.7 -1
160 24.7 2
200 25.0 5
250 21.6 8
315 20.2 11
400 23.2 14
500 21.6 15
630 17.2 16
800 20.1 17
1k 21.2 18
1.25k 18.7 19
1.6k 17.9 19
2k 17.2 19
2.5k 20.9 19
3.15k 20.0 19
4k 13.9
5k 19.0
D0.01m,nT,w(C;Ctr ) 19 ( 0; 1) dB
Tested by Building Performance Centre, Napier University, Edinburgh.
Measured D0.01m,nT dB
0.0
10.0
20.0
30.0
40.0
50.0
60.0
63 125 250 500 1k 2k 4kFrequency (Hz)
Sta
nd
ard
ise
d L
eve
l D
iffe
ren
ce
, D
0.0
1m
,nT
(d
B)
Measured values Shifted Reference Curve
M3-3

OPEN/CLOSED WINDOW RESEARCH Defra Research Contract: NANR116
Airborne Sound Insulation. Laboratory measurements with non-diffuse source conditions
Standardised Level Difference. Simulated residential receiver environment
Date: 12/7/05 Test Sample: Window C-4 Open 0.10 m2
Air temperature: 21.2 ºC Area of window unit, S: 0.945 m2
Air humidity: 31.2 % Window mass per unit area: 36.83 kg/m2
Atmospheric pressure: 1.0243 Bar
Receiving room volume: 31.2 m3
Glass Specification: 4 -18 - 6.4(lam) mm
Source room volume: 343.1 m3
Canopy: n/a
Vent: Vent 1 closed
Test ID: 712073 Loudspeaker Configuration: L3
Frequency D0.01m,nT
Hz dB
50 18.5
63 30.2
80 22.5
100 25.7 -6
125 23.7 -3
160 24.0 0
200 24.2 3
250 21.0 6
315 17.8 9
400 21.0 12
500 20.2 13
630 14.1 14
800 19.3 15
1k 18.1 16
1.25k 15.0 17
1.6k 14.9 17
2k 14.5 17
2.5k 18.5 17
3.15k 17.0 17
4k 17.0
5k 27.7
D0.01m,nT,w(C;Ctr ) 17 (-1; 0) dB
Tested by Building Performance Centre, Napier University, Edinburgh.
Measured D0.01m,nT dB
0.0
10.0
20.0
30.0
40.0
50.0
60.0
63 125 250 500 1k 2k 4kFrequency (Hz)
Sta
nd
ard
ise
d L
eve
l D
iffe
ren
ce
, D
0.0
1m
,nT
(d
B)
Measured values Shifted Reference Curve
M3-4

OPEN/CLOSED WINDOW RESEARCH Defra Research Contract: NANR116
Airborne Sound Insulation. Laboratory measurements with non-diffuse source conditions
Standardised Level Difference. Simulated residential receiver environment
Date: 13/7/2005 Test Sample: Window D-1 Open 0.10 m2
Air temperature: 21.8 ºC Area of window unit, S: 1.26 m2
Air humidity: 31.2 % Window mass per unit area: 27.94 kg/m2
Atmospheric pressure: 1.0175 Bar
Receiving room volume: 31.2 m3
Glass Specification: 4 -16 - 4 mm
Source room volume: 343.1 m3
Canopy: n/a
Vent: n/a
Test ID: 713054 Loudspeaker Configuration: L3
Frequency D0.01m,nT
Hz dB
50 19.4
63 31.9
80 22.4
100 25.3 2
125 23.7 5
160 25.1 8
200 24.0 11
250 23.2 14
315 22.3 17
400 24.4 20
500 24.8 21
630 19.4 22
800 26.7 23
1k 25.4 24
1.25k 28.1 25
1.6k 28.3 25
2k 26.6 25
2.5k 23.9 25
3.15k 19.6 25
4k 17.9
5k 20.3
D0.01m,nT,w(C;Ctr ) 25 (-1; -1) dB
Tested by Building Performance Centre, Napier University, Edinburgh.
Measured D0.01m,nT dB
0.0
10.0
20.0
30.0
40.0
50.0
60.0
63 125 250 500 1k 2k 4kFrequency (Hz)
Sta
nd
ard
ise
d L
eve
l D
iffe
ren
ce
, D
0.0
1m
,nT
(d
B)
Measured values Shifted Reference Curve
M3-5

OPEN/CLOSED WINDOW RESEARCH Defra Research Contract: NANR116
Airborne Sound Insulation. Laboratory measurements with non-diffuse source conditions
Standardised Level Difference. Simulated residential receiver environment
Date: 13/7/2005 Test Sample: Window D-2 Open 0.10 m2
Air temperature: 21.8 ºC Area of window unit, S: 1.26 m2
Air humidity: 31.2 % Window mass per unit area: 27.94 kg/m2
Atmospheric pressure: 1.0176 Bar
Receiving room volume: 31.2 m3
Glass Specification: 4 -16 - 4 mm
Source room volume: 343.1 m3
Canopy: n/a
Vent: n/a
Test ID: 713046 Loudspeaker Configuration: L3
Frequency D0.01m,nT
Hz dB
50 19.8
63 31.1
80 22.6
100 24.2 -2
125 21.5 1
160 23.2 4
200 26.5 7
250 22.1 10
315 25.4 13
400 26.5 16
500 25.1 17
630 17.8 18
800 22.5 19
1k 19.7 20
1.25k 19.3 21
1.6k 23.0 21
2k 24.4 21
2.5k 23.2 21
3.15k 18.6 21
4k 16.7
5k 18.0
D0.01m,nT,w(C;Ctr ) 21 ( 0; 0) dB
Tested by Building Performance Centre, Napier University, Edinburgh.
Measured D0.01m,nT dB
0.0
10.0
20.0
30.0
40.0
50.0
60.0
63 125 250 500 1k 2k 4kFrequency (Hz)
Sta
nd
ard
ise
d L
eve
l D
iffe
ren
ce
, D
0.0
1m
,nT
(d
B)
Measured values Shifted Reference Curve
M3-6

OPEN/CLOSED WINDOW RESEARCH Defra Research Contract: NANR116
Airborne Sound Insulation. Laboratory measurements with non-diffuse source conditions
Standardised Level Difference. Simulated residential receiver environment
Date: 13/7/2005 Test Sample: Window D-3 Open 0.10 m2
Air temperature: 21.8 ºC Area of window unit, S: 1.26 m2
Air humidity: 31.2 % Window mass per unit area: 27.94 kg/m2
Atmospheric pressure: 1.0176 Bar
Receiving room volume: 31.2 m3
Glass Specification: 4 -16 - 4 mm
Source room volume: 343.1 m3
Canopy: n/a
Vent: n/a
Test ID: 713050 Loudspeaker Configuration: L3
Frequency D0.01m,nT
Hz dB
50 21.0
63 31.7
80 22.3
100 24.8 -1
125 22.0 2
160 23.4 5
200 25.3 8
250 20.8 11
315 22.8 14
400 24.6 17
500 21.1 18
630 15.6 19
800 24.4 20
1k 20.1 21
1.25k 21.5 22
1.6k 25.0 22
2k 25.6 22
2.5k 25.4 22
3.15k 21.7 22
4k 21.6
5k 22.9
D0.01m,nT,w(C;Ctr ) 22 ( 0; -1) dB
Tested by Building Performance Centre, Napier University, Edinburgh.
Measured D0.01m,nT dB
0.0
10.0
20.0
30.0
40.0
50.0
60.0
63 125 250 500 1k 2k 4kFrequency (Hz)
Sta
nd
ard
ise
d L
eve
l D
iffe
ren
ce
, D
0.0
1m
,nT
(d
B)
Measured values Shifted Reference Curve
M3-7

OPEN/CLOSED WINDOW RESEARCH Defra Research Contract: NANR116
Airborne Sound Insulation. Laboratory measurements with non-diffuse source conditions
Standardised Level Difference. Simulated residential receiver environment
Date: 20/7/2005 Test Sample: Window G Open 0.10 m2
Air temperature: 20.3 ºC Area of window unit, S: 0.54 m2
Air humidity: 31.2 % Window mass per unit area: 33.33 kg/m2
Atmospheric pressure: 1.0032 Bar
Receiving room volume: 31.2 m3
Glass Specification: 4 -16 - 4 mm
Source room volume: 343.1 m3
Canopy: n/a
Vent: n/a
Test ID: 720037 Loudspeaker Configuration: L3
Frequency D0.01m,nT
Hz dB
50 18.9
63 29.4
80 20.9
100 22.9 -4
125 22.1 -1
160 23.2 2
200 23.7 5
250 22.2 8
315 22.4 11
400 20.7 14
500 24.2 15
630 23.2 16
800 24.2 17
1k 22.1 18
1.25k 19.3 19
1.6k 19.5 19
2k 15.1 19
2.5k 15.8 19
3.15k 14.8 19
4k 21.2
5k 24.7
D0.01m,nT,w(C;Ctr ) 19 (-1; 1) dB
Tested by Building Performance Centre, Napier University, Edinburgh.
Measured D0.01m,nT dB
0.0
10.0
20.0
30.0
40.0
50.0
60.0
63 125 250 500 1k 2k 4kFrequency (Hz)
Sta
nd
ard
ise
d L
eve
l D
iffe
ren
ce
, D
0.0
1m
,nT
(d
B)
Measured values Shifted Reference Curve
M3-8

OPEN/CLOSED WINDOW RESEARCH Defra Research Contract: NANR116
Airborne Sound Insulation. Laboratory measurements with non-diffuse source conditions
Standardised Level Difference. Simulated residential receiver environment
Date: 28/6/2005 Test Sample: Window A-1 Open 0.10 m2
Air temperature: 20.6 ºC Area of window unit, S: 2.52 m2
Air humidity: 31.2 % Window mass per unit area: 30.00 kg/m2
Atmospheric pressure: 1.0091 Bar
Receiving room volume: 31.2 m3
Glass Specification: 4 -16 - 4 mm
Source room volume: 343.1 m3
Canopy: n/a
Vent: n/a
Test ID: 628079 Loudspeaker Configuration: L4
Frequency D0.01m,nT
Hz dB
50 18.0
63 26.0
80 20.2
100 24.6 -2
125 22.5 1
160 19.3 4
200 20.6 7
250 16.9 10
315 19.0 13
400 24.0 16
500 19.3 17
630 16.8 18
800 25.8 19
1k 22.3 20
1.25k 24.2 21
1.6k 21.7 21
2k 22.4 21
2.5k 17.3 21
3.15k 22.2 21
4k 23.0
5k 22.4
D0.01m,nT,w(C;Ctr ) 21 ( 0; 0) dB
Tested by Building Performance Centre, Napier University, Edinburgh.
Measured D0.01m,nT dB
0.0
10.0
20.0
30.0
40.0
50.0
60.0
63 125 250 500 1k 2k 4kFrequency (Hz)
Sta
nd
ard
ise
d L
eve
l D
iffe
ren
ce
, D
0.0
1m
,nT
(d
B)
Measured values Shifted Reference Curve
M4-1

OPEN/CLOSED WINDOW RESEARCH Defra Research Contract: NANR116
Airborne Sound Insulation. Laboratory measurements with non-diffuse source conditions
Standardised Level Difference. Simulated residential receiver environment
Date: 5/7/05 Test Sample: Window B Open 0.10 m2
Air temperature: 19.5 ºC Area of window unit, S: 1.26 m2
Air humidity: 31.2 % Window mass per unit area: 27.94 kg/m2
Atmospheric pressure: 0.9981 Bar
Receiving room volume: 31.2 m3
Glass Specification: 4 -16 - 4 mm
Source room volume: 343.1 m3
Canopy: n/a
Vent: n/a
Test ID: 705019 Loudspeaker Configuration: L4
Frequency D0.01m,nT
Hz dB
50 22.2
63 28.6
80 19.0
100 22.9 -6
125 21.3 -3
160 19.3 0
200 20.5 3
250 21.0 6
315 22.9 9
400 23.0 12
500 18.8 13
630 14.8 14
800 21.4 15
1k 13.1 16
1.25k 17.4 17
1.6k 17.2 17
2k 13.0 17
2.5k 15.3 17
3.15k 20.6 17
4k 24.5
5k 30.0
D0.01m,nT,w(C;Ctr ) 17 (-1; -1) dB
Tested by Building Performance Centre, Napier University, Edinburgh.
Measured D0.01m,nT dB
0.0
10.0
20.0
30.0
40.0
50.0
60.0
63 125 250 500 1k 2k 4kFrequency (Hz)
Sta
nd
ard
ise
d L
eve
l D
iffe
ren
ce
, D
0.0
1m
,nT
(d
B)
Measured values Shifted Reference Curve
M4-2

OPEN/CLOSED WINDOW RESEARCH Defra Research Contract: NANR116
Airborne Sound Insulation. Laboratory measurements with non-diffuse source conditions
Standardised Level Difference. Simulated residential receiver environment
Date: 11/7/05 Test Sample: Window C-2 Open 0.10 m2
Air temperature: 20.6 ºC Area of window unit, S: 0.945 m2
Air humidity: 31.2 % Window mass per unit area: 36.83 kg/m2
Atmospheric pressure: 1.0273 Bar
Receiving room volume: 31.2 m3
Glass Specification: 4 -16 - 4 mm
Source room volume: 343.1 m3
Canopy: Original
Vent: Closed
Test ID: 711062 Loudspeaker Configuration: L4
Frequency D0.01m,nT
Hz dB
50 23.0
63 31.3
80 22.7
100 26.1 -2
125 24.7 1
160 25.3 4
200 27.4 7
250 21.8 10
315 21.6 13
400 23.9 16
500 26.7 17
630 17.2 18
800 22.6 19
1k 20.2 20
1.25k 21.9 21
1.6k 19.7 21
2k 19.9 21
2.5k 22.3 21
3.15k 27.6 21
4k 26.8
5k 28.2
D0.01m,nT,w(C;Ctr ) 21 ( 0; 0) dB
Tested by Building Performance Centre, Napier University, Edinburgh.
Measured D0.01m,nT dB
0.0
10.0
20.0
30.0
40.0
50.0
60.0
63 125 250 500 1k 2k 4kFrequency (Hz)
Sta
nd
ard
ise
d L
eve
l D
iffe
ren
ce
, D
0.0
1m
,nT
(d
B)
Measured values Shifted Reference Curve
M4-3
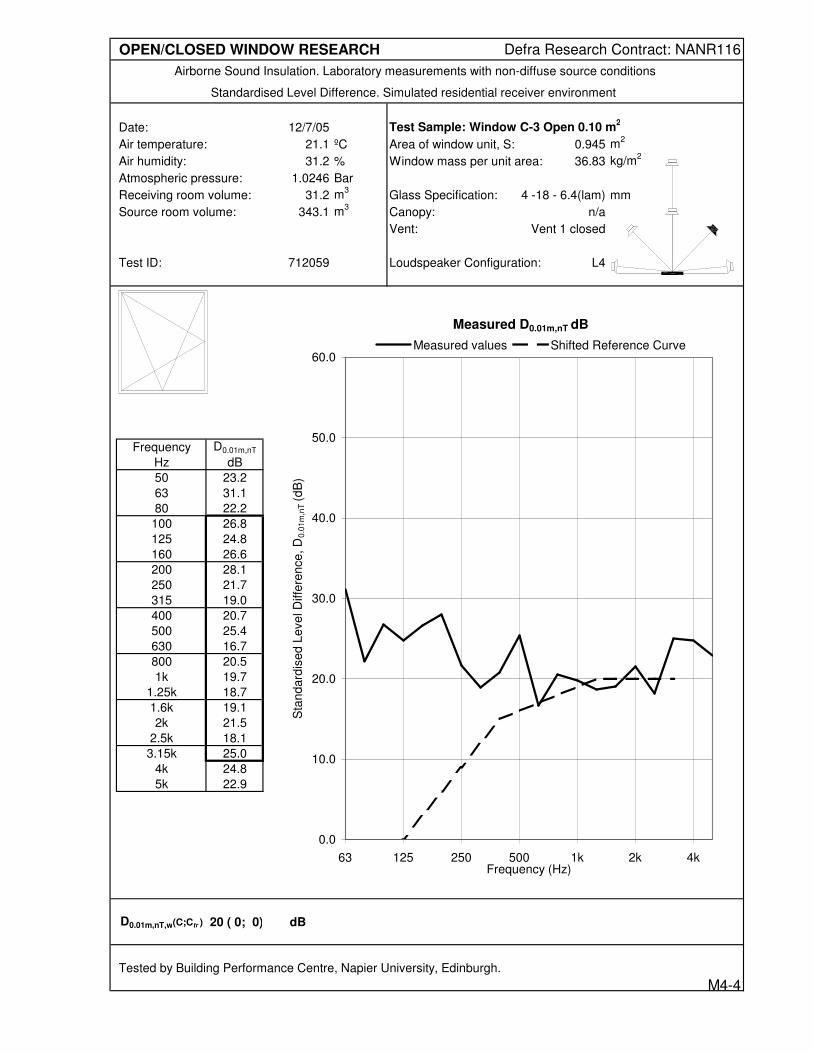
OPEN/CLOSED WINDOW RESEARCH Defra Research Contract: NANR116
Airborne Sound Insulation. Laboratory measurements with non-diffuse source conditions
Standardised Level Difference. Simulated residential receiver environment
Date: 12/7/05 Test Sample: Window C-3 Open 0.10 m2
Air temperature: 21.1 ºC Area of window unit, S: 0.945 m2
Air humidity: 31.2 % Window mass per unit area: 36.83 kg/m2
Atmospheric pressure: 1.0246 Bar
Receiving room volume: 31.2 m3
Glass Specification: 4 -18 - 6.4(lam) mm
Source room volume: 343.1 m3
Canopy: n/a
Vent: Vent 1 closed
Test ID: 712059 Loudspeaker Configuration: L4
Frequency D0.01m,nT
Hz dB
50 23.2
63 31.1
80 22.2
100 26.8 -3
125 24.8 0
160 26.6 3
200 28.1 6
250 21.7 9
315 19.0 12
400 20.7 15
500 25.4 16
630 16.7 17
800 20.5 18
1k 19.7 19
1.25k 18.7 20
1.6k 19.1 20
2k 21.5 20
2.5k 18.1 20
3.15k 25.0 20
4k 24.8
5k 22.9
D0.01m,nT,w(C;Ctr ) 20 ( 0; 0) dB
Tested by Building Performance Centre, Napier University, Edinburgh.
Measured D0.01m,nT dB
0.0
10.0
20.0
30.0
40.0
50.0
60.0
63 125 250 500 1k 2k 4kFrequency (Hz)
Sta
nd
ard
ise
d L
eve
l D
iffe
ren
ce
, D
0.0
1m
,nT
(d
B)
Measured values Shifted Reference Curve
M4-4

OPEN/CLOSED WINDOW RESEARCH Defra Research Contract: NANR116
Airborne Sound Insulation. Laboratory measurements with non-diffuse source conditions
Standardised Level Difference. Simulated residential receiver environment
Date: 12/7/05 Test Sample: Window C-4 Open 0.10 m2
Air temperature: 21.1 ºC Area of window unit, S: 0.945 m2
Air humidity: 31.2 % Window mass per unit area: 36.83 kg/m2
Atmospheric pressure: 1.0246 Bar
Receiving room volume: 31.2 m3
Glass Specification: 4 -18 - 6.4(lam) mm
Source room volume: 343.1 m3
Canopy: n/a
Vent: Vent 1 closed
Test ID: 712063 Loudspeaker Configuration: L4
Frequency D0.01m,nT
Hz dB
50 21.7
63 29.6
80 21.2
100 25.4 -4
125 23.5 -1
160 24.2 2
200 25.7 5
250 23.3 8
315 22.1 11
400 21.1 14
500 24.3 15
630 14.0 16
800 21.6 17
1k 17.6 18
1.25k 11.9 19
1.6k 17.8 19
2k 21.9 19
2.5k 19.4 19
3.15k 25.4 19
4k 22.4
5k 28.2
D0.01m,nT,w(C;Ctr ) 19 (-2; -2) dB
Tested by Building Performance Centre, Napier University, Edinburgh.
Measured D0.01m,nT dB
0.0
10.0
20.0
30.0
40.0
50.0
60.0
63 125 250 500 1k 2k 4kFrequency (Hz)
Sta
nd
ard
ise
d L
eve
l D
iffe
ren
ce
, D
0.0
1m
,nT
(d
B)
Measured values Shifted Reference Curve
M4-5

OPEN/CLOSED WINDOW RESEARCH Defra Research Contract: NANR116
Airborne Sound Insulation. Laboratory measurements with non-diffuse source conditions
Standardised Level Difference. Simulated residential receiver environment
Date: 18/7/2005 Test Sample: Window E Open 0.10 m2
Air temperature: 20.3 ºC Area of window unit, S: 0.63 m2
Air humidity: 31.2 % Window mass per unit area: 26.83 kg/m2
Atmospheric pressure: 0.9956 Bar
Receiving room volume: 31.2 m3
Glass Specification: 4 -16 - 4 mm
Source room volume: 343.1 m3
Canopy: n/a
Vent: n/a
Test ID: 718010 Loudspeaker Configuration: L4
Frequency D0.01m,nT
Hz dB
50 24.3
63 31.4
80 22.8
100 25.3 0
125 24.0 3
160 25.8 6
200 23.1 9
250 17.9 12
315 18.6 15
400 21.5 18
500 20.7 19
630 20.0 20
800 19.8 21
1k 24.3 22
1.25k 24.5 23
1.6k 24.1 23
2k 24.2 23
2.5k 23.5 23
3.15k 23.8 23
4k 26.0
5k 26.0
D0.01m,nT,w(C;Ctr ) 23 ( 0; -1) dB
Tested by Building Performance Centre, Napier University, Edinburgh.
Measured D0.01m,nT dB
0.0
10.0
20.0
30.0
40.0
50.0
60.0
63 125 250 500 1k 2k 4kFrequency (Hz)
Sta
nd
ard
ise
d L
eve
l D
iffe
ren
ce
, D
0.0
1m
,nT
(d
B)
Measured values Shifted Reference Curve
M4-6
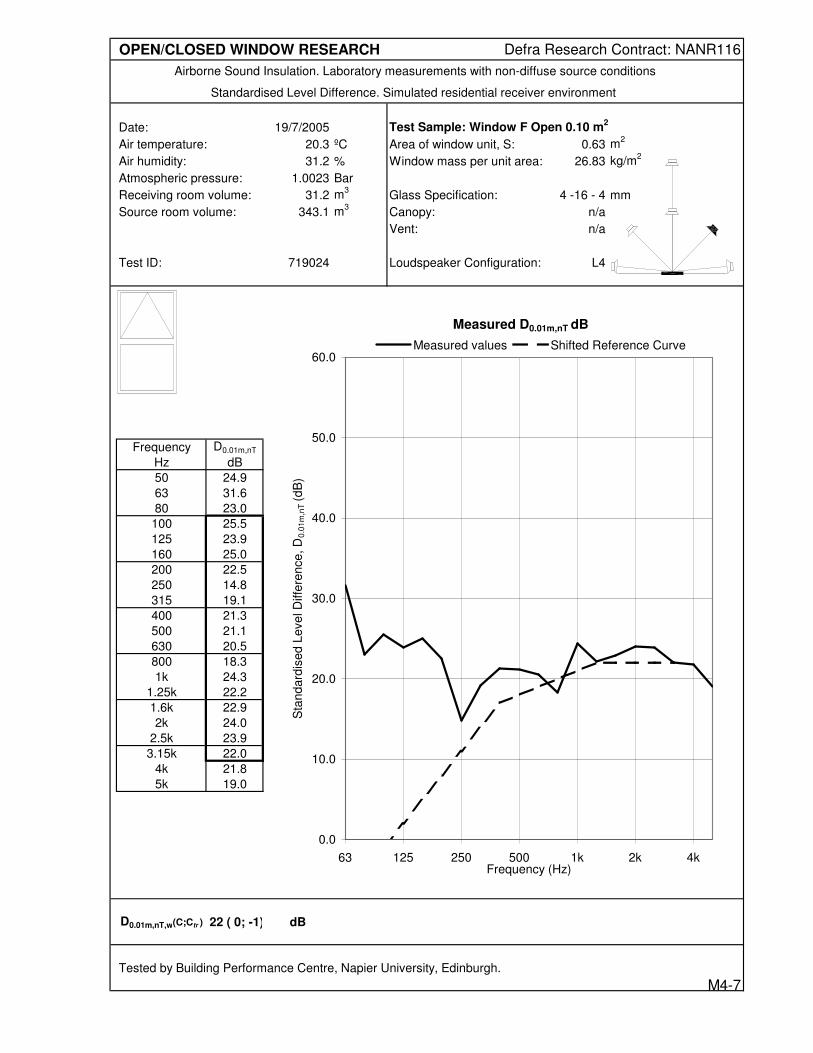
OPEN/CLOSED WINDOW RESEARCH Defra Research Contract: NANR116
Airborne Sound Insulation. Laboratory measurements with non-diffuse source conditions
Standardised Level Difference. Simulated residential receiver environment
Date: 19/7/2005 Test Sample: Window F Open 0.10 m2
Air temperature: 20.3 ºC Area of window unit, S: 0.63 m2
Air humidity: 31.2 % Window mass per unit area: 26.83 kg/m2
Atmospheric pressure: 1.0023 Bar
Receiving room volume: 31.2 m3
Glass Specification: 4 -16 - 4 mm
Source room volume: 343.1 m3
Canopy: n/a
Vent: n/a
Test ID: 719024 Loudspeaker Configuration: L4
Frequency D0.01m,nT
Hz dB
50 24.9
63 31.6
80 23.0
100 25.5 -1
125 23.9 2
160 25.0 5
200 22.5 8
250 14.8 11
315 19.1 14
400 21.3 17
500 21.1 18
630 20.5 19
800 18.3 20
1k 24.3 21
1.25k 22.2 22
1.6k 22.9 22
2k 24.0 22
2.5k 23.9 22
3.15k 22.0 22
4k 21.8
5k 19.0
D0.01m,nT,w(C;Ctr ) 22 ( 0; -1) dB
Tested by Building Performance Centre, Napier University, Edinburgh.
Measured D0.01m,nT dB
0.0
10.0
20.0
30.0
40.0
50.0
60.0
63 125 250 500 1k 2k 4kFrequency (Hz)
Sta
nd
ard
ise
d L
eve
l D
iffe
ren
ce
, D
0.0
1m
,nT
(d
B)
Measured values Shifted Reference Curve
M4-7

OPEN/CLOSED WINDOW RESEARCH Defra Research Contract: NANR116
Airborne Sound Insulation. Laboratory measurements with non-diffuse source conditions
Standardised Level Difference. Simulated residential receiver environment
Date: 20/7/2005 Test Sample: Window G Open 0.10 m2
Air temperature: 20.3 ºC Area of window unit, S: 0.54 m2
Air humidity: 31.2 % Window mass per unit area: 33.33 kg/m2
Atmospheric pressure: 1.0032 Bar
Receiving room volume: 31.2 m3
Glass Specification: 4 -16 - 4 mm
Source room volume: 343.1 m3
Canopy: n/a
Vent: n/a
Test ID: 720032 Loudspeaker Configuration: L4
Frequency D0.01m,nT
Hz dB
50 24.1
63 30.3
80 21.3
100 24.5 -1
125 22.6 2
160 23.0 5
200 20.7 8
250 21.5 11
315 23.2 14
400 24.0 17
500 22.7 18
630 16.1 19
800 26.3 20
1k 23.1 21
1.25k 23.0 22
1.6k 22.8 22
2k 20.6 22
2.5k 20.3 22
3.15k 20.5 22
4k 21.6
5k 19.6
D0.01m,nT,w(C;Ctr ) 22 (-1; 0) dB
Tested by Building Performance Centre, Napier University, Edinburgh.
Measured D0.01m,nT dB
0.0
10.0
20.0
30.0
40.0
50.0
60.0
63 125 250 500 1k 2k 4kFrequency (Hz)
Sta
nd
ard
ise
d L
eve
l D
iffe
ren
ce
, D
0.0
1m
,nT
(d
B)
Measured values Shifted Reference Curve
M4-8

OPEN/CLOSED WINDOW RESEARCH Defra Research Contract: NANR116
Airborne Sound Insulation. Laboratory measurements with non-diffuse source conditions
Standardised Level Difference. Simulated residential receiver environment
Date: 28/6/2005 Test Sample: Window A-1 Open 0.10 m2
Air temperature: 20.7 ºC Area of window unit, S: 2.52 m2
Air humidity: 31.2 % Window mass per unit area: 30.00 kg/m2
Atmospheric pressure: 1.0091 Bar
Receiving room volume: 31.2 m3
Glass Specification: 4 -16 - 4 mm
Source room volume: 343.1 m3
Canopy: n/a
Vent: n/a
Test ID: 628095 Loudspeaker Configuration: L5
Frequency D0.01m,nT
Hz dB
50 20.0
63 26.3
80 21.0
100 27.5 -3
125 24.9 0
160 20.6 3
200 21.2 6
250 19.8 9
315 21.0 12
400 24.0 15
500 18.6 16
630 14.9 17
800 21.6 18
1k 21.7 19
1.25k 23.8 20
1.6k 19.5 20
2k 18.3 20
2.5k 17.7 20
3.15k 20.2 20
4k 20.3
5k 18.1
D0.01m,nT,w(C;Ctr ) 20 (-1; 0) dB
Tested by Building Performance Centre, Napier University, Edinburgh.
Measured D0.01m,nT dB
0.0
10.0
20.0
30.0
40.0
50.0
60.0
63 125 250 500 1k 2k 4kFrequency (Hz)
Sta
nd
ard
ise
d L
eve
l D
iffe
ren
ce
, D
0.0
1m
,nT
(d
B)
Measured values Shifted Reference Curve
M5-1
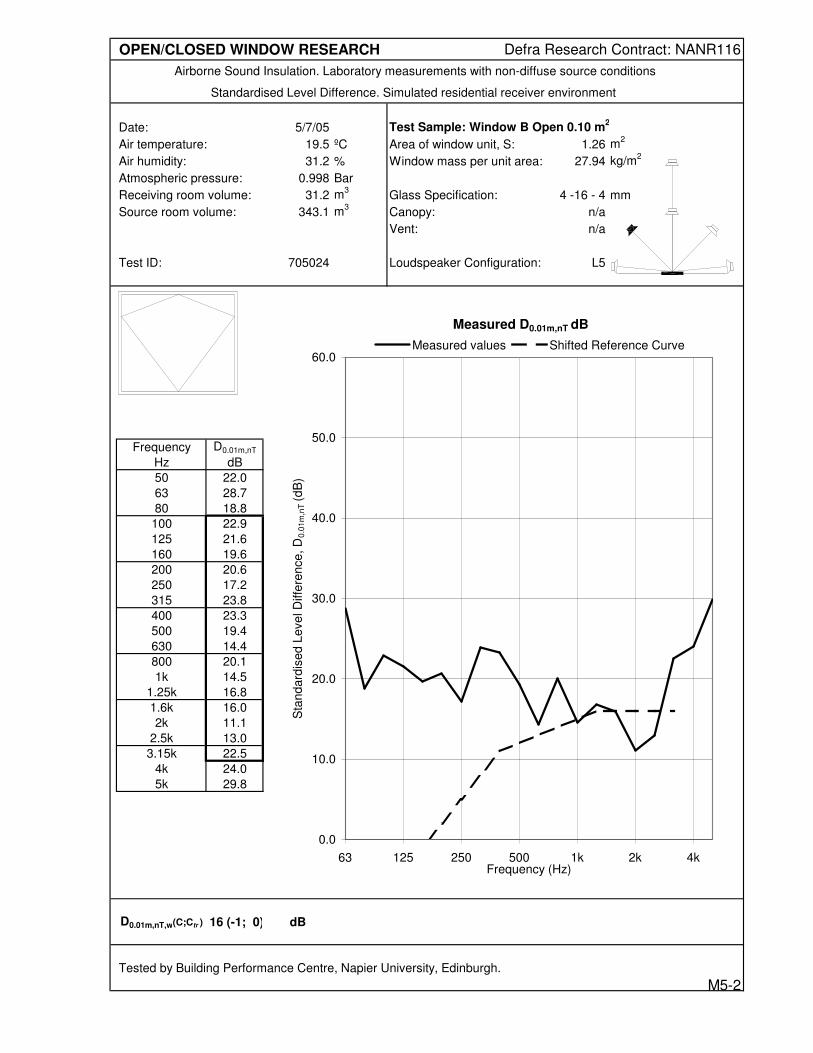
OPEN/CLOSED WINDOW RESEARCH Defra Research Contract: NANR116
Airborne Sound Insulation. Laboratory measurements with non-diffuse source conditions
Standardised Level Difference. Simulated residential receiver environment
Date: 5/7/05 Test Sample: Window B Open 0.10 m2
Air temperature: 19.5 ºC Area of window unit, S: 1.26 m2
Air humidity: 31.2 % Window mass per unit area: 27.94 kg/m2
Atmospheric pressure: 0.998 Bar
Receiving room volume: 31.2 m3
Glass Specification: 4 -16 - 4 mm
Source room volume: 343.1 m3
Canopy: n/a
Vent: n/a
Test ID: 705024 Loudspeaker Configuration: L5
Frequency D0.01m,nT
Hz dB
50 22.0
63 28.7
80 18.8
100 22.9 -7
125 21.6 -4
160 19.6 -1
200 20.6 2
250 17.2 5
315 23.8 8
400 23.3 11
500 19.4 12
630 14.4 13
800 20.1 14
1k 14.5 15
1.25k 16.8 16
1.6k 16.0 16
2k 11.1 16
2.5k 13.0 16
3.15k 22.5 16
4k 24.0
5k 29.8
D0.01m,nT,w(C;Ctr ) 16 (-1; 0) dB
Tested by Building Performance Centre, Napier University, Edinburgh.
Measured D0.01m,nT dB
0.0
10.0
20.0
30.0
40.0
50.0
60.0
63 125 250 500 1k 2k 4kFrequency (Hz)
Sta
nd
ard
ise
d L
eve
l D
iffe
ren
ce
, D
0.0
1m
,nT
(d
B)
Measured values Shifted Reference Curve
M5-2

OPEN/CLOSED WINDOW RESEARCH Defra Research Contract: NANR116
Airborne Sound Insulation. Laboratory measurements with non-diffuse source conditions
Standardised Level Difference. Simulated residential receiver environment
Date: 11/7/05 Test Sample: Window C-1 Open 0.10 m2
Air temperature: 20.6 ºC Area of window unit, S: 0.945 m2
Air humidity: 31.2 % Window mass per unit area: 36.83 kg/m2
Atmospheric pressure: 1.0274 Bar
Receiving room volume: 31.2 m3
Glass Specification: 4 -16 - 4 mm
Source room volume: 343.1 m3
Canopy: Original
Vent: Closed
Test ID: 711057 Loudspeaker Configuration: L5
Frequency D0.01m,nT
Hz dB
50 23.8
63 31.8
80 22.9
100 26.6 -2
125 24.7 1
160 27.1 4
200 27.5 7
250 18.6 10
315 17.9 13
400 21.4 16
500 26.3 17
630 19.4 18
800 18.1 19
1k 21.1 20
1.25k 22.5 21
1.6k 20.7 21
2k 21.6 21
2.5k 21.1 21
3.15k 23.2 21
4k 26.0
5k 29.0
D0.01m,nT,w(C;Ctr ) 21 ( 0; 0) dB
Tested by Building Performance Centre, Napier University, Edinburgh.
Measured D0.01m,nT dB
0.0
10.0
20.0
30.0
40.0
50.0
60.0
63 125 250 500 1k 2k 4kFrequency (Hz)
Sta
nd
ard
ise
d L
eve
l D
iffe
ren
ce
, D
0.0
1m
,nT
(d
B)
Measured values Shifted Reference Curve
M5-3

OPEN/CLOSED WINDOW RESEARCH Defra Research Contract: NANR116
Airborne Sound Insulation. Laboratory measurements with non-diffuse source conditions
Standardised Level Difference. Simulated residential receiver environment
Date: 11/7/05 Test Sample: Window C-2 Open 0.10 m2
Air temperature: 20.6 ºC Area of window unit, S: 0.945 m2
Air humidity: 31.2 % Window mass per unit area: 36.83 kg/m2
Atmospheric pressure: 1.0274 Bar
Receiving room volume: 31.2 m3
Glass Specification: 4 -16 - 4 mm
Source room volume: 343.1 m3
Canopy: Original
Vent: Closed
Test ID: 711052 Loudspeaker Configuration: L5
Frequency D0.01m,nT
Hz dB
50 22.8
63 30.9
80 22.4
100 25.9 -3
125 24.0 0
160 24.7 3
200 24.4 6
250 17.3 9
315 17.8 12
400 20.6 15
500 21.7 16
630 16.4 17
800 16.9 18
1k 19.9 19
1.25k 19.2 20
1.6k 20.1 20
2k 19.9 20
2.5k 20.1 20
3.15k 24.3 20
4k 26.2
5k 23.7
D0.01m,nT,w(C;Ctr ) 20 ( 0; -1) dB
Tested by Building Performance Centre, Napier University, Edinburgh.
Measured D0.01m,nT dB
0.0
10.0
20.0
30.0
40.0
50.0
60.0
63 125 250 500 1k 2k 4kFrequency (Hz)
Sta
nd
ard
ise
d L
eve
l D
iffe
ren
ce
, D
0.0
1m
,nT
(d
B)
Measured values Shifted Reference Curve
M5-4
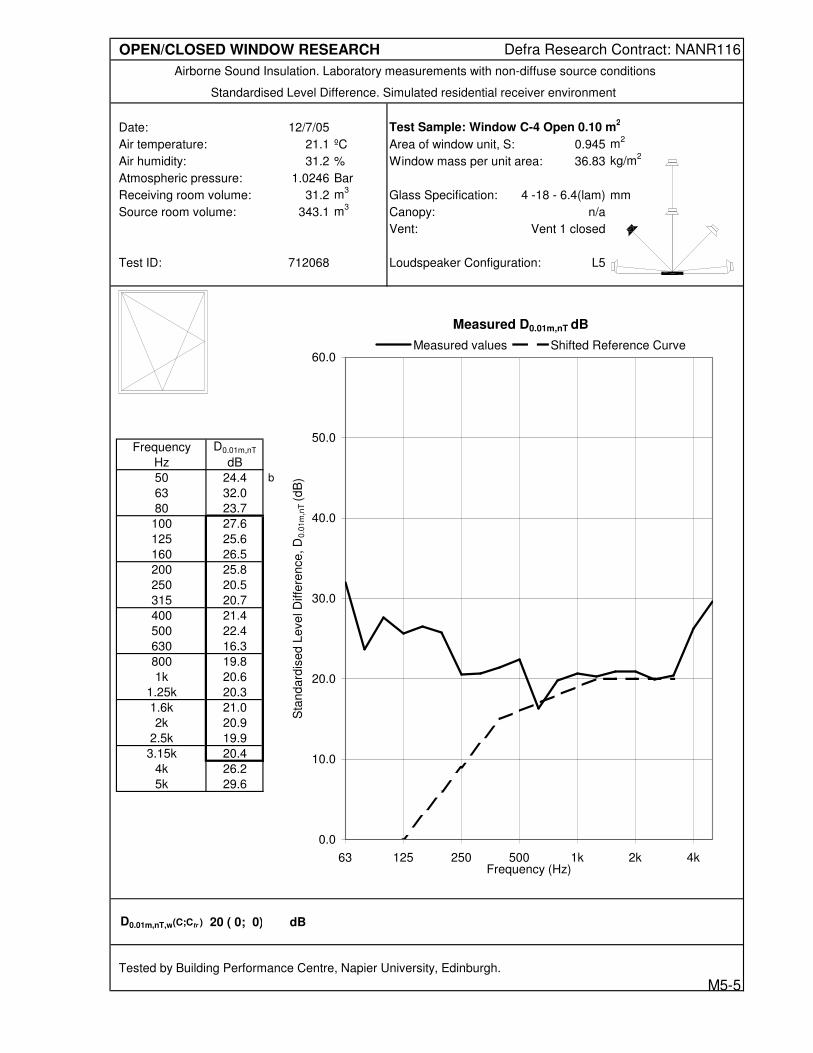
OPEN/CLOSED WINDOW RESEARCH Defra Research Contract: NANR116
Airborne Sound Insulation. Laboratory measurements with non-diffuse source conditions
Standardised Level Difference. Simulated residential receiver environment
Date: 12/7/05 Test Sample: Window C-4 Open 0.10 m2
Air temperature: 21.1 ºC Area of window unit, S: 0.945 m2
Air humidity: 31.2 % Window mass per unit area: 36.83 kg/m2
Atmospheric pressure: 1.0246 Bar
Receiving room volume: 31.2 m3
Glass Specification: 4 -18 - 6.4(lam) mm
Source room volume: 343.1 m3
Canopy: n/a
Vent: Vent 1 closed
Test ID: 712068 Loudspeaker Configuration: L5
Frequency D0.01m,nT
Hz dB
50 24.4 b
63 32.0
80 23.7
100 27.6 -3
125 25.6 0
160 26.5 3
200 25.8 6
250 20.5 9
315 20.7 12
400 21.4 15
500 22.4 16
630 16.3 17
800 19.8 18
1k 20.6 19
1.25k 20.3 20
1.6k 21.0 20
2k 20.9 20
2.5k 19.9 20
3.15k 20.4 20
4k 26.2
5k 29.6
D0.01m,nT,w(C;Ctr ) 20 ( 0; 0) dB
Tested by Building Performance Centre, Napier University, Edinburgh.
Measured D0.01m,nT dB
0.0
10.0
20.0
30.0
40.0
50.0
60.0
63 125 250 500 1k 2k 4kFrequency (Hz)
Sta
nd
ard
ise
d L
eve
l D
iffe
ren
ce
, D
0.0
1m
,nT
(d
B)
Measured values Shifted Reference Curve
M5-5
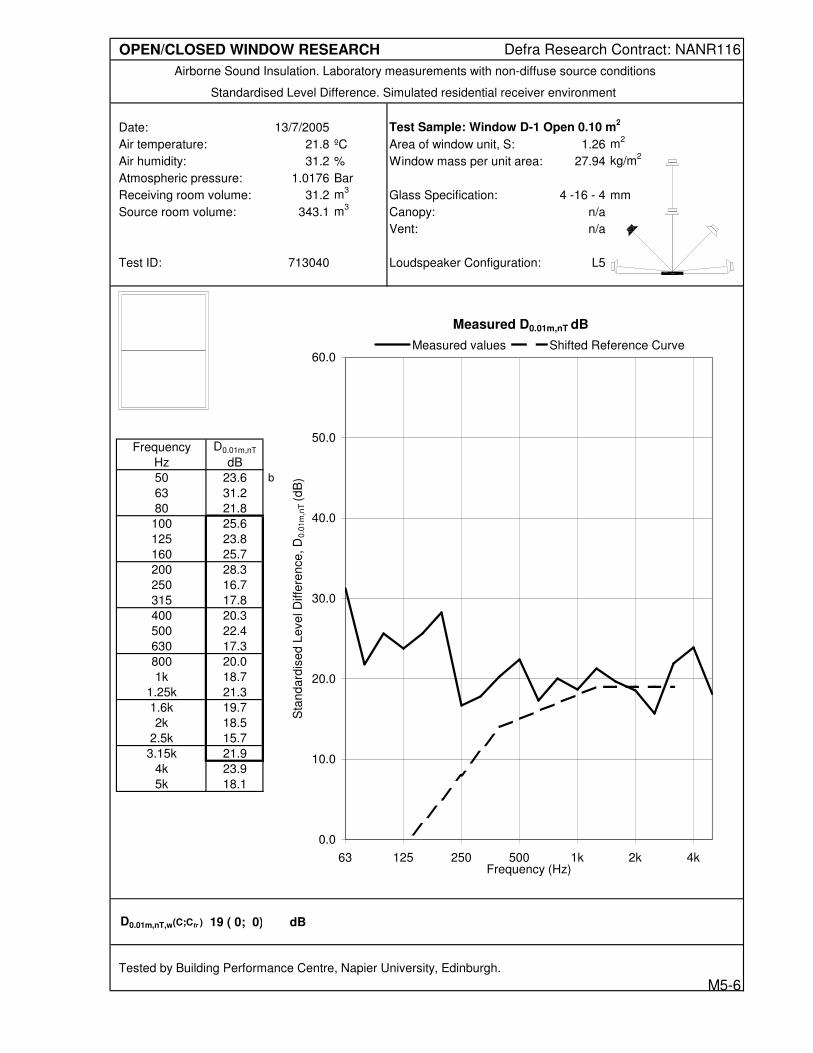
OPEN/CLOSED WINDOW RESEARCH Defra Research Contract: NANR116
Airborne Sound Insulation. Laboratory measurements with non-diffuse source conditions
Standardised Level Difference. Simulated residential receiver environment
Date: 13/7/2005 Test Sample: Window D-1 Open 0.10 m2
Air temperature: 21.8 ºC Area of window unit, S: 1.26 m2
Air humidity: 31.2 % Window mass per unit area: 27.94 kg/m2
Atmospheric pressure: 1.0176 Bar
Receiving room volume: 31.2 m3
Glass Specification: 4 -16 - 4 mm
Source room volume: 343.1 m3
Canopy: n/a
Vent: n/a
Test ID: 713040 Loudspeaker Configuration: L5
Frequency D0.01m,nT
Hz dB
50 23.6 b
63 31.2
80 21.8
100 25.6 -4
125 23.8 -1
160 25.7 2
200 28.3 5
250 16.7 8
315 17.8 11
400 20.3 14
500 22.4 15
630 17.3 16
800 20.0 17
1k 18.7 18
1.25k 21.3 19
1.6k 19.7 19
2k 18.5 19
2.5k 15.7 19
3.15k 21.9 19
4k 23.9
5k 18.1
D0.01m,nT,w(C;Ctr ) 19 ( 0; 0) dB
Tested by Building Performance Centre, Napier University, Edinburgh.
Measured D0.01m,nT dB
0.0
10.0
20.0
30.0
40.0
50.0
60.0
63 125 250 500 1k 2k 4kFrequency (Hz)
Sta
nd
ard
ise
d L
eve
l D
iffe
ren
ce
, D
0.0
1m
,nT
(d
B)
Measured values Shifted Reference Curve
M5-6

OPEN/CLOSED WINDOW RESEARCH Defra Research Contract: NANR116
Airborne Sound Insulation. Laboratory measurements with non-diffuse source conditions
Standardised Level Difference. Simulated residential receiver environment
Date: 13/7/2005 Test Sample: Window D-2 Open 0.10 m2
Air temperature: 21.8 ºC Area of window unit, S: 1.26 m2
Air humidity: 31.2 % Window mass per unit area: 27.94 kg/m2
Atmospheric pressure: 1.018 Bar
Receiving room volume: 31.2 m3
Glass Specification: 4 -16 - 4 mm
Source room volume: 343.1 m3
Canopy: n/a
Vent: n/a
Test ID: 713032 Loudspeaker Configuration: L5
Frequency D0.01m,nT
Hz dB
50 24.3 b
63 30.5
80 21.4
100 24.4 -8
125 22.1 -5
160 21.5 -2
200 22.0 1
250 13.4 4
315 24.5 7
400 25.2 10
500 19.1 11
630 13.8 12
800 16.3 13
1k 15.9 14
1.25k 16.2 15
1.6k 14.7 15
2k 11.7 15
2.5k 11.1 15
3.15k 15.8 15
4k 21.6
5k 18.9
D0.01m,nT,w(C;Ctr ) 15 (-1; 0) dB
Tested by Building Performance Centre, Napier University, Edinburgh.
Measured D0.01m,nT dB
0.0
10.0
20.0
30.0
40.0
50.0
60.0
63 125 250 500 1k 2k 4kFrequency (Hz)
Sta
nd
ard
ise
d L
eve
l D
iffe
ren
ce
, D
0.0
1m
,nT
(d
B)
Measured values Shifted Reference Curve
M5-7

OPEN/CLOSED WINDOW RESEARCH Defra Research Contract: NANR116
Airborne Sound Insulation. Laboratory measurements with non-diffuse source conditions
Standardised Level Difference. Simulated residential receiver environment
Date: 13/7/2005 Test Sample: Window D-3 Open 0.10 m2
Air temperature: 21.8 ºC Area of window unit, S: 1.26 m2
Air humidity: 31.2 % Window mass per unit area: 27.94 kg/m2
Atmospheric pressure: 1.018 Bar
Receiving room volume: 31.2 m3
Glass Specification: 4 -16 - 4 mm
Source room volume: 343.1 m3
Canopy: n/a
Vent: n/a
Test ID: 713036 Loudspeaker Configuration: L5
Frequency D0.01m,nT
Hz dB
50 25.7 b
63 30.9
80 21.2
100 24.9 -6
125 22.5 -3
160 22.2 0
200 21.8 3
250 16.2 6
315 24.3 9
400 17.4 12
500 16.2 13
630 14.5 14
800 21.4 15
1k 16.8 16
1.25k 18.5 17
1.6k 16.6 17
2k 13.9 17
2.5k 15.9 17
3.15k 21.8 17
4k 24.0
5k 22.6
D0.01m,nT,w(C;Ctr ) 17 ( 0; 0) dB
Tested by Building Performance Centre, Napier University, Edinburgh.
Measured D0.01m,nT dB
0.0
10.0
20.0
30.0
40.0
50.0
60.0
63 125 250 500 1k 2k 4kFrequency (Hz)
Sta
nd
ard
ise
d L
eve
l D
iffe
ren
ce
, D
0.0
1m
,nT
(d
B)
Measured values Shifted Reference Curve
M5-8

OPEN/CLOSED WINDOW RESEARCH Defra Research Contract: NANR116
Airborne Sound Insulation. Laboratory measurements with non-diffuse source conditions
Standardised Level Difference. Simulated residential receiver environment
Date: 20/7/2005 Test Sample: Window G Open 0.10 m2
Air temperature: 20.3 ºC Area of window unit, S: 0.54 m2
Air humidity: 31.2 % Window mass per unit area: 33.33 kg/m2
Atmospheric pressure: 1.0032 Bar
Receiving room volume: 31.2 m3
Glass Specification: 4 -16 - 4 mm
Source room volume: 343.1 m3
Canopy: n/a
Vent: n/a
Test ID: 720023 Loudspeaker Configuration: L5
Frequency D0.01m,nT
Hz dB
50 23.3
63 30.4
80 21.4
100 23.4 -1
125 23.0 2
160 23.1 5
200 23.3 8
250 18.2 11
315 22.2 14
400 22.9 17
500 22.4 18
630 21.3 19
800 23.6 20
1k 22.2 21
1.25k 21.8 22
1.6k 18.7 22
2k 21.6 22
2.5k 23.9 22
3.15k 17.6 22
4k 17.6
5k 20.3
D0.01m,nT,w(C;Ctr ) 22 (-1; -1) dB
Tested by Building Performance Centre, Napier University, Edinburgh.
Measured D0.01m,nT dB
0.0
10.0
20.0
30.0
40.0
50.0
60.0
63 125 250 500 1k 2k 4kFrequency (Hz)
Sta
nd
ard
ise
d L
eve
l D
iffe
ren
ce
, D
0.0
1m
,nT
(d
B)
Measured values Shifted Reference Curve
M5-9

OPEN/CLOSED WINDOW RESEARCH Defra Research Contract: NANR116
Airborne Sound Insulation. Laboratory measurements with non-diffuse source conditions
Standardised Level Difference. Simulated residential receiver environment
Date: 28/6/2005 Test Sample: Window A-1 Open 0.10 m2
Air temperature: 20.5 ºC Area of window unit, S: 2.52 m2
Air humidity: 31.2 % Window mass per unit area: 30.00 kg/m2
Atmospheric pressure: 1.0106 Bar
Receiving room volume: 31.2 m3
Glass Specification: 4 -16 - 4 mm
Source room volume: 343.1 m3
Canopy: n/a
Vent: n/a
Test ID: 628031 Loudspeaker Configuration: L6
Frequency D0.01m,nT
Hz dB
50 20.0
63 26.6
80 20.9
100 26.9 -3
125 24.0 0
160 20.6 3
200 18.4 6
250 19.0 9
315 19.9 12
400 14.2 15
500 21.1 16
630 23.7 17
800 25.4 18
1k 17.5 19
1.25k 21.2 20
1.6k 17.7 20
2k 15.7 20
2.5k 21.3 20
3.15k 23.0 20
4k 21.0
5k 19.5
D0.01m,nT,w(C;Ctr ) 20 (-1; -1) dB
Tested by Building Performance Centre, Napier University, Edinburgh.
Measured D0.01m,nT dB
0.0
10.0
20.0
30.0
40.0
50.0
60.0
63 125 250 500 1k 2k 4kFrequency (Hz)
Sta
nd
ard
ise
d L
eve
l D
iffe
ren
ce
, D
0.0
1m
,nT
(d
B)
Measured values Shifted Reference Curve
M6-1
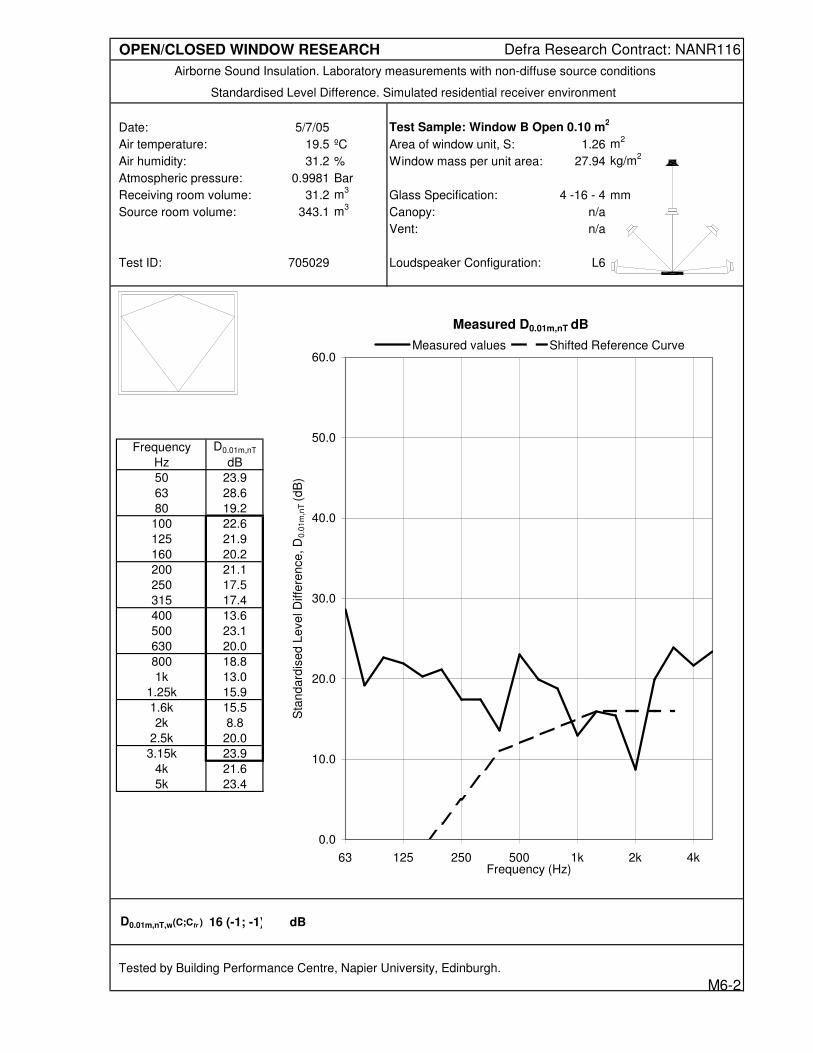
OPEN/CLOSED WINDOW RESEARCH Defra Research Contract: NANR116
Airborne Sound Insulation. Laboratory measurements with non-diffuse source conditions
Standardised Level Difference. Simulated residential receiver environment
Date: 5/7/05 Test Sample: Window B Open 0.10 m2
Air temperature: 19.5 ºC Area of window unit, S: 1.26 m2
Air humidity: 31.2 % Window mass per unit area: 27.94 kg/m2
Atmospheric pressure: 0.9981 Bar
Receiving room volume: 31.2 m3
Glass Specification: 4 -16 - 4 mm
Source room volume: 343.1 m3
Canopy: n/a
Vent: n/a
Test ID: 705029 Loudspeaker Configuration: L6
Frequency D0.01m,nT
Hz dB
50 23.9
63 28.6
80 19.2
100 22.6 -7
125 21.9 -4
160 20.2 -1
200 21.1 2
250 17.5 5
315 17.4 8
400 13.6 11
500 23.1 12
630 20.0 13
800 18.8 14
1k 13.0 15
1.25k 15.9 16
1.6k 15.5 16
2k 8.8 16
2.5k 20.0 16
3.15k 23.9 16
4k 21.6
5k 23.4
D0.01m,nT,w(C;Ctr ) 16 (-1; -1) dB
Tested by Building Performance Centre, Napier University, Edinburgh.
Measured D0.01m,nT dB
0.0
10.0
20.0
30.0
40.0
50.0
60.0
63 125 250 500 1k 2k 4kFrequency (Hz)
Sta
nd
ard
ise
d L
eve
l D
iffe
ren
ce
, D
0.0
1m
,nT
(d
B)
Measured values Shifted Reference Curve
M6-2

OPEN/CLOSED WINDOW RESEARCH Defra Research Contract: NANR116
Airborne Sound Insulation. Laboratory measurements with non-diffuse source conditions
Standardised Level Difference. Simulated residential receiver environment
Date: 11/7/05 Test Sample: Window C-1 Open 0.10 m2
Air temperature: 20.6 ºC Area of window unit, S: 0.945 m2
Air humidity: 31.2 % Window mass per unit area: 36.83 kg/m2
Atmospheric pressure: 1.0279 Bar
Receiving room volume: 31.2 m3
Glass Specification: 4 -16 - 4 mm
Source room volume: 343.1 m3
Canopy: Original
Vent: Closed
Test ID: 711020 Loudspeaker Configuration: L6
Frequency D0.01m,nT
Hz dB
50 25.4 b
63 31.3
80 22.4
100 26.3 -4
125 25.0 -1
160 26.8 2
200 26.7 5
250 27.8 8
315 28.6 11
400 15.9 14
500 15.2 15
630 14.8 16
800 19.3 17
1k 18.0 18
1.25k 20.7 19
1.6k 19.0 19
2k 17.5 19
2.5k 23.0 19
3.15k 26.0 19
4k 29.8
5k 25.5
D0.01m,nT,w(C;Ctr ) 19 ( 0; -1) dB
Tested by Building Performance Centre, Napier University, Edinburgh.
Measured D0.01m,nT dB
0.0
10.0
20.0
30.0
40.0
50.0
60.0
63 125 250 500 1k 2k 4kFrequency (Hz)
Sta
nd
ard
ise
d L
eve
l D
iffe
ren
ce
, D
0.0
1m
,nT
(d
B)
Measured values Shifted Reference Curve
M6-3

OPEN/CLOSED WINDOW RESEARCH Defra Research Contract: NANR116
Airborne Sound Insulation. Laboratory measurements with non-diffuse source conditions
Standardised Level Difference. Simulated residential receiver environment
Date: 11/7/05 Test Sample: Window C-2 Open 0.10 m2
Air temperature: 20.6 ºC Area of window unit, S: 0.945 m2
Air humidity: 31.2 % Window mass per unit area: 36.83 kg/m2
Atmospheric pressure: 1.0278 Bar
Receiving room volume: 31.2 m3
Glass Specification: 4 -16 - 4 mm
Source room volume: 343.1 m3
Canopy: Original
Vent: Closed
Test ID: 711024 Loudspeaker Configuration: L6
Frequency D0.01m,nT
Hz dB
50 25.7 B
63 31.4
80 23.0
100 26.3 -4
125 25.2 -1
160 26.2 2
200 25.8 5
250 25.5 8
315 25.7 11
400 17.1 14
500 16.5 15
630 17.1 16
800 19.0 17
1k 17.0 18
1.25k 20.8 19
1.6k 21.0 19
2k 14.0 19
2.5k 25.7 19
3.15k 28.3 19
4k 26.8
5k 25.3
D0.01m,nT,w(C;Ctr ) 19 ( 0; -1) dB
Tested by Building Performance Centre, Napier University, Edinburgh.
Measured D0.01m,nT dB
0.0
10.0
20.0
30.0
40.0
50.0
60.0
63 125 250 500 1k 2k 4kFrequency (Hz)
Sta
nd
ard
ise
d L
eve
l D
iffe
ren
ce
, D
0.0
1m
,nT
(d
B)
Measured values Shifted Reference Curve
M6-4
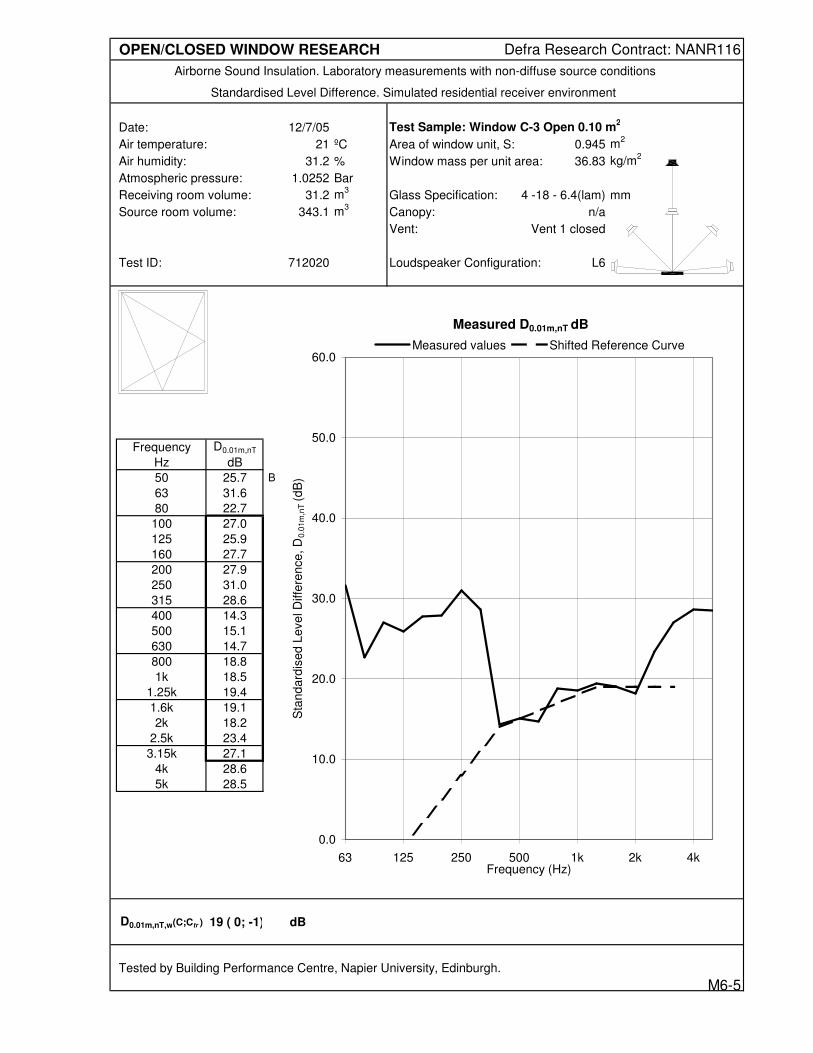
OPEN/CLOSED WINDOW RESEARCH Defra Research Contract: NANR116
Airborne Sound Insulation. Laboratory measurements with non-diffuse source conditions
Standardised Level Difference. Simulated residential receiver environment
Date: 12/7/05 Test Sample: Window C-3 Open 0.10 m2
Air temperature: 21 ºC Area of window unit, S: 0.945 m2
Air humidity: 31.2 % Window mass per unit area: 36.83 kg/m2
Atmospheric pressure: 1.0252 Bar
Receiving room volume: 31.2 m3
Glass Specification: 4 -18 - 6.4(lam) mm
Source room volume: 343.1 m3
Canopy: n/a
Vent: Vent 1 closed
Test ID: 712020 Loudspeaker Configuration: L6
Frequency D0.01m,nT
Hz dB
50 25.7 B
63 31.6
80 22.7
100 27.0 -4
125 25.9 -1
160 27.7 2
200 27.9 5
250 31.0 8
315 28.6 11
400 14.3 14
500 15.1 15
630 14.7 16
800 18.8 17
1k 18.5 18
1.25k 19.4 19
1.6k 19.1 19
2k 18.2 19
2.5k 23.4 19
3.15k 27.1 19
4k 28.6
5k 28.5
D0.01m,nT,w(C;Ctr ) 19 ( 0; -1) dB
Tested by Building Performance Centre, Napier University, Edinburgh.
Measured D0.01m,nT dB
0.0
10.0
20.0
30.0
40.0
50.0
60.0
63 125 250 500 1k 2k 4kFrequency (Hz)
Sta
nd
ard
ise
d L
eve
l D
iffe
ren
ce
, D
0.0
1m
,nT
(d
B)
Measured values Shifted Reference Curve
M6-5

OPEN/CLOSED WINDOW RESEARCH Defra Research Contract: NANR116
Airborne Sound Insulation. Laboratory measurements with non-diffuse source conditions
Standardised Level Difference. Simulated residential receiver environment
Date: 12/7/05 Test Sample: Window C-4 Open 0.10 m2
Air temperature: 21 ºC Area of window unit, S: 0.945 m2
Air humidity: 31.2 % Window mass per unit area: 36.83 kg/m2
Atmospheric pressure: 1.0252 Bar
Receiving room volume: 31.2 m3
Glass Specification: 4 -18 - 6.4(lam) mm
Source room volume: 343.1 m3
Canopy: n/a
Vent: Vent 1 closed
Test ID: 712024 Loudspeaker Configuration: L6
Frequency D0.01m,nT
Hz dB
50 25.5 b
63 31.7
80 23.3
100 27.0 -4
125 26.1 -1
160 27.2 2
200 26.8 5
250 28.0 8
315 26.7 11
400 15.8 14
500 16.4 15
630 16.9 16
800 18.0 17
1k 17.1 18
1.25k 18.5 19
1.6k 20.2 19
2k 17.0 19
2.5k 25.4 19
3.15k 27.5 19
4k 25.8
5k 28.8
D0.01m,nT,w(C;Ctr ) 19 ( 0; -1) dB
Tested by Building Performance Centre, Napier University, Edinburgh.
Measured D0.01m,nT dB
0.0
10.0
20.0
30.0
40.0
50.0
60.0
63 125 250 500 1k 2k 4kFrequency (Hz)
Sta
nd
ard
ise
d L
eve
l D
iffe
ren
ce
, D
0.0
1m
,nT
(d
B)
Measured values Shifted Reference Curve
M6-6
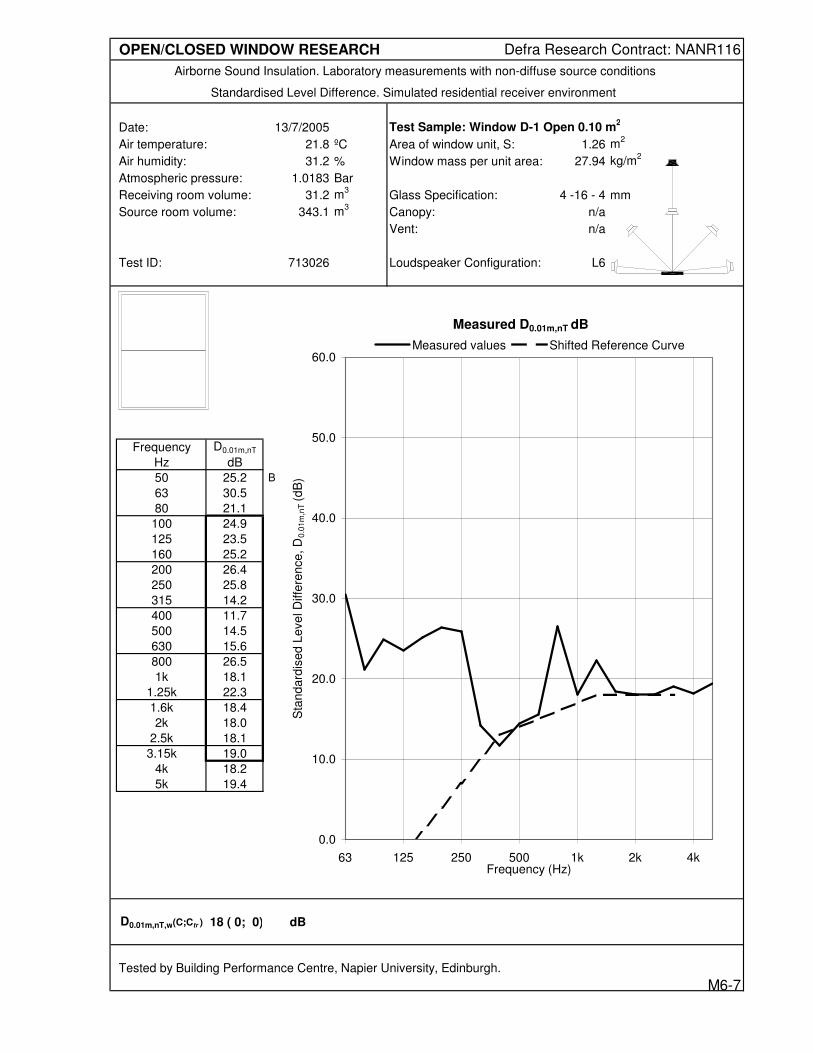
OPEN/CLOSED WINDOW RESEARCH Defra Research Contract: NANR116
Airborne Sound Insulation. Laboratory measurements with non-diffuse source conditions
Standardised Level Difference. Simulated residential receiver environment
Date: 13/7/2005 Test Sample: Window D-1 Open 0.10 m2
Air temperature: 21.8 ºC Area of window unit, S: 1.26 m2
Air humidity: 31.2 % Window mass per unit area: 27.94 kg/m2
Atmospheric pressure: 1.0183 Bar
Receiving room volume: 31.2 m3
Glass Specification: 4 -16 - 4 mm
Source room volume: 343.1 m3
Canopy: n/a
Vent: n/a
Test ID: 713026 Loudspeaker Configuration: L6
Frequency D0.01m,nT
Hz dB
50 25.2 B
63 30.5
80 21.1
100 24.9 -5
125 23.5 -2
160 25.2 1
200 26.4 4
250 25.8 7
315 14.2 10
400 11.7 13
500 14.5 14
630 15.6 15
800 26.5 16
1k 18.1 17
1.25k 22.3 18
1.6k 18.4 18
2k 18.0 18
2.5k 18.1 18
3.15k 19.0 18
4k 18.2
5k 19.4
D0.01m,nT,w(C;Ctr ) 18 ( 0; 0) dB
Tested by Building Performance Centre, Napier University, Edinburgh.
Measured D0.01m,nT dB
0.0
10.0
20.0
30.0
40.0
50.0
60.0
63 125 250 500 1k 2k 4kFrequency (Hz)
Sta
nd
ard
ise
d L
eve
l D
iffe
ren
ce
, D
0.0
1m
,nT
(d
B)
Measured values Shifted Reference Curve
M6-7

OPEN/CLOSED WINDOW RESEARCH Defra Research Contract: NANR116
Airborne Sound Insulation. Laboratory measurements with non-diffuse source conditions
Standardised Level Difference. Simulated residential receiver environment
Date: 13/7/2005 Test Sample: Window D-2 Open 0.10 m2
Air temperature: 21.8 ºC Area of window unit, S: 1.26 m2
Air humidity: 31.2 % Window mass per unit area: 27.94 kg/m2
Atmospheric pressure: 1.0183 Bar
Receiving room volume: 31.2 m3
Glass Specification: 4 -16 - 4 mm
Source room volume: 343.1 m3
Canopy: n/a
Vent: n/a
Test ID: 713018 Loudspeaker Configuration: L6
Frequency D0.01m,nT
Hz dB
50 25.7 B
63 31.1
80 22.5
100 24.5 -9
125 23.2 -6
160 23.3 -3
200 22.7 0
250 18.9 3
315 14.8 6
400 9.3 9
500 19.0 10
630 21.6 11
800 19.3 12
1k 15.2 13
1.25k 13.1 14
1.6k 10.2 14
2k 13.6 14
2.5k 16.1 14
3.15k 17.4 14
4k 16.6
5k 17.7
D0.01m,nT,w(C;Ctr ) 14 ( 0; 0) dB
Tested by Building Performance Centre, Napier University, Edinburgh.
Measured D0.01m,nT dB
0.0
10.0
20.0
30.0
40.0
50.0
60.0
63 125 250 500 1k 2k 4kFrequency (Hz)
Sta
nd
ard
ise
d L
eve
l D
iffe
ren
ce
, D
0.0
1m
,nT
(d
B)
Measured values Shifted Reference Curve
M6-8

OPEN/CLOSED WINDOW RESEARCH Defra Research Contract: NANR116
Airborne Sound Insulation. Laboratory measurements with non-diffuse source conditions
Standardised Level Difference. Simulated residential receiver environment
Date: 13/7/2005 Test Sample: Window D-3 Open 0.10 m2
Air temperature: 21.8 ºC Area of window unit, S: 1.26 m2
Air humidity: 31.2 % Window mass per unit area: 27.94 kg/m2
Atmospheric pressure: 1.0183 Bar
Receiving room volume: 31.2 m3
Glass Specification: 4 -16 - 4 mm
Source room volume: 343.1 m3
Canopy: n/a
Vent: n/a
Test ID: 713022 Loudspeaker Configuration: L6
Frequency D0.01m,nT
Hz dB
50 26.3 B
63 31.1
80 21.9
100 24.6 -4
125 23.1 -1
160 23.4 2
200 21.6 5
250 17.9 8
315 14.5 11
400 11.8 14
500 20.5 15
630 20.6 16
800 25.3 17
1k 19.7 18
1.25k 19.8 19
1.6k 13.2 19
2k 19.7 19
2.5k 19.1 19
3.15k 22.8 19
4k 20.5
5k 23.0
D0.01m,nT,w(C;Ctr ) 19 (-1; -1) dB
Tested by Building Performance Centre, Napier University, Edinburgh.
Measured D0.01m,nT dB
0.0
10.0
20.0
30.0
40.0
50.0
60.0
63 125 250 500 1k 2k 4kFrequency (Hz)
Sta
nd
ard
ise
d L
eve
l D
iffe
ren
ce
, D
0.0
1m
,nT
(d
B)
Measured values Shifted Reference Curve
M6-9

OPEN/CLOSED WINDOW RESEARCH Defra Research Contract: NANR116
Airborne Sound Insulation. Laboratory measurements with non-diffuse source conditions
Standardised Level Difference. Simulated residential receiver environment
Date: 18/7/2005 Test Sample: Window E Open 0.10 m2
Air temperature: 20.4 ºC Area of window unit, S: 0.63 m2
Air humidity: 31.2 % Window mass per unit area: 26.83 kg/m2
Atmospheric pressure: 0.9956 Bar
Receiving room volume: 31.2 m3
Glass Specification: 4 -16 - 4 mm
Source room volume: 343.1 m3
Canopy: n/a
Vent: n/a
Test ID: 718024 Loudspeaker Configuration: L6
Frequency D0.01m,nT
Hz dB
50 23.7
63 31.4
80 21.8
100 25.2 -2
125 23.9 1
160 25.4 4
200 23.6 7
250 22.7 10
315 21.2 13
400 14.6 16
500 19.6 17
630 19.1 18
800 18.9 19
1k 21.1 20
1.25k 22.7 21
1.6k 26.5 21
2k 24.4 21
2.5k 17.7 21
3.15k 20.4 21
4k 21.9
5k 23.9
D0.01m,nT,w(C;Ctr ) 21 (-1; -1) dB
Tested by Building Performance Centre, Napier University, Edinburgh.
Measured D0.01m,nT dB
0.0
10.0
20.0
30.0
40.0
50.0
60.0
63 125 250 500 1k 2k 4kFrequency (Hz)
Sta
nd
ard
ise
d L
eve
l D
iffe
ren
ce
, D
0.0
1m
,nT
(d
B)
Measured values Shifted Reference Curve
M6-10

OPEN/CLOSED WINDOW RESEARCH Defra Research Contract: NANR116
Airborne Sound Insulation. Laboratory measurements with non-diffuse source conditions
Standardised Level Difference. Simulated residential receiver environment
Date: 19/7/2005 Test Sample: Window F Open 0.10 m2
Air temperature: 19.9 ºC Area of window unit, S: 0.63 m2
Air humidity: 31.2 % Window mass per unit area: 26.83 kg/m2
Atmospheric pressure: 1.0019 Bar
Receiving room volume: 31.2 m3
Glass Specification: 4 -16 - 4 mm
Source room volume: 343.1 m3
Canopy: n/a
Vent: n/a
Test ID: 719005 Loudspeaker Configuration: L6
Frequency D0.01m,nT
Hz dB
50 23.1
63 31.0
80 22.4
100 24.8 -1
125 23.5 2
160 24.1 5
200 22.2 8
250 22.1 11
315 20.8 14
400 14.4 17
500 19.4 18
630 17.8 19
800 21.9 20
1k 22.2 21
1.25k 24.4 22
1.6k 24.3 22
2k 23.8 22
2.5k 22.1 22
3.15k 24.8 22
4k 20.5
5k 17.5
D0.01m,nT,w(C;Ctr ) 22 ( 0; -1) dB
Tested by Building Performance Centre, Napier University, Edinburgh.
Measured D0.01m,nT dB
0.0
10.0
20.0
30.0
40.0
50.0
60.0
63 125 250 500 1k 2k 4kFrequency (Hz)
Sta
nd
ard
ise
d L
eve
l D
iffe
ren
ce
, D
0.0
1m
,nT
(d
B)
Measured values Shifted Reference Curve
M6-11

OPEN/CLOSED WINDOW RESEARCH Defra Research Contract: NANR116
Airborne Sound Insulation. Laboratory measurements with non-diffuse source conditions
Standardised Level Difference. Simulated residential receiver environment
Date: 28/6/2005 Test Sample: Window A-1 Open 0.10 m2
Air temperature: 20.7 ºC Area of window unit, S: 2.52 m2
Air humidity: 31.2 % Window mass per unit area: 30.00 kg/m2
Atmospheric pressure: 1.009 Bar
Receiving room volume: 31.2 m3
Glass Specification: 4 -16 - 4 mm
Source room volume: 343.1 m3
Canopy: n/a
Vent: n/a
Test ID: 628111 Loudspeaker Configuration: Line
Frequency D0.01m,nT
Hz dB
50 19.5
63 26.5
80 20.4
100 27.3 -3
125 23.6 0
160 19.5 3
200 20.7 6
250 21.5 9
315 23.8 12
400 25.4 15
500 25.8 16
630 20.1 17
800 25.9 18
1k 21.7 19
1.25k 16.6 20
1.6k 17.7 20
2k 18.8 20
2.5k 18.8 20
3.15k 24.5 20
4k 22.3
5k 18.5
D0.01m,nT,w(C;Ctr ) 20 ( 0; 0) dB
Tested by Building Performance Centre, Napier University, Edinburgh.
Measured D0.01m,nT dB
0.0
10.0
20.0
30.0
40.0
50.0
60.0
63 125 250 500 1k 2k 4kFrequency (Hz)
Sta
nd
ard
ise
d L
eve
l D
iffe
ren
ce
, D
0.0
1m
,nT
(d
B)
Measured values Shifted Reference Curve
M7-1
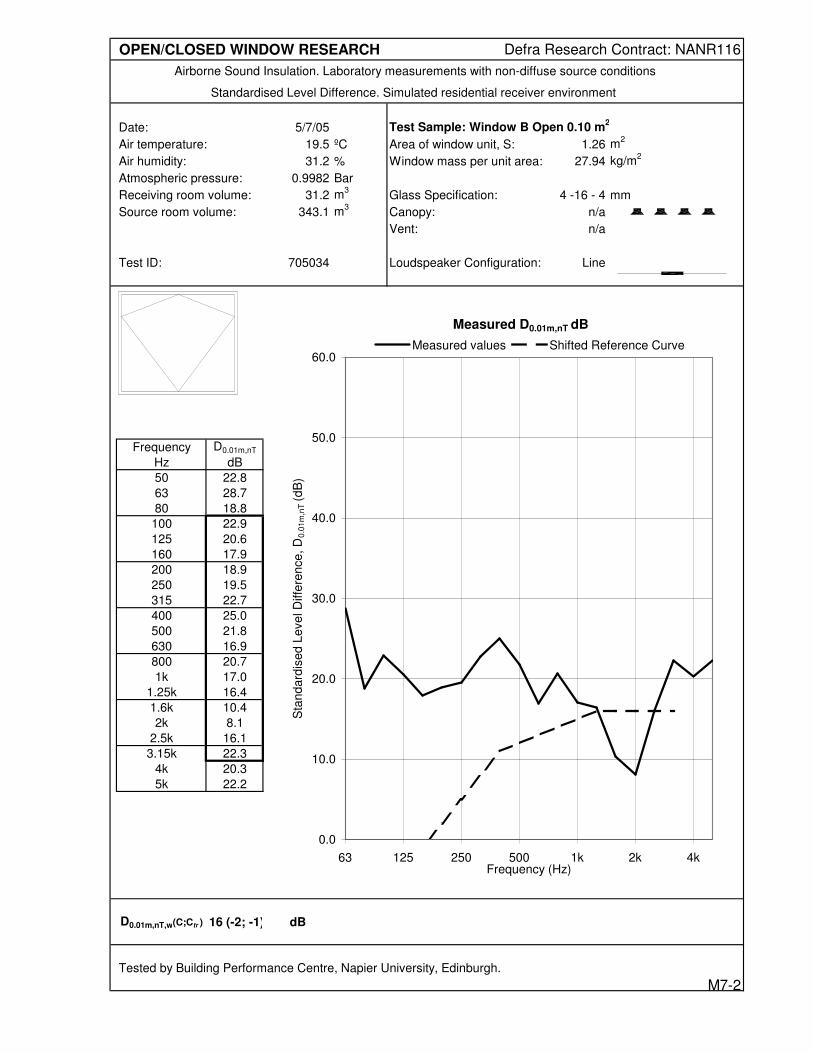
OPEN/CLOSED WINDOW RESEARCH Defra Research Contract: NANR116
Airborne Sound Insulation. Laboratory measurements with non-diffuse source conditions
Standardised Level Difference. Simulated residential receiver environment
Date: 5/7/05 Test Sample: Window B Open 0.10 m2
Air temperature: 19.5 ºC Area of window unit, S: 1.26 m2
Air humidity: 31.2 % Window mass per unit area: 27.94 kg/m2
Atmospheric pressure: 0.9982 Bar
Receiving room volume: 31.2 m3
Glass Specification: 4 -16 - 4 mm
Source room volume: 343.1 m3
Canopy: n/a
Vent: n/a
Test ID: 705034 Loudspeaker Configuration: Line
Frequency D0.01m,nT
Hz dB
50 22.8
63 28.7
80 18.8
100 22.9 -7
125 20.6 -4
160 17.9 -1
200 18.9 2
250 19.5 5
315 22.7 8
400 25.0 11
500 21.8 12
630 16.9 13
800 20.7 14
1k 17.0 15
1.25k 16.4 16
1.6k 10.4 16
2k 8.1 16
2.5k 16.1 16
3.15k 22.3 16
4k 20.3
5k 22.2
D0.01m,nT,w(C;Ctr ) 16 (-2; -1) dB
Tested by Building Performance Centre, Napier University, Edinburgh.
Measured D0.01m,nT dB
0.0
10.0
20.0
30.0
40.0
50.0
60.0
63 125 250 500 1k 2k 4kFrequency (Hz)
Sta
nd
ard
ise
d L
eve
l D
iffe
ren
ce
, D
0.0
1m
,nT
(d
B)
Measured values Shifted Reference Curve
M7-2

OPEN/CLOSED WINDOW RESEARCH Defra Research Contract: NANR116
Airborne Sound Insulation. Laboratory measurements with non-diffuse source conditions
Standardised Level Difference. Simulated residential receiver environment
Date: 11/7/05 Test Sample: Window C-1 Open 0.10 m2
Air temperature: 20.7 ºC Area of window unit, S: 0.945 m2
Air humidity: 31.2 % Window mass per unit area: 36.83 kg/m2
Atmospheric pressure: 1.0272 Bar
Receiving room volume: 31.2 m3
Glass Specification: 4 -16 - 4 mm
Source room volume: 343.1 m3
Canopy: Original
Vent: Closed
Test ID: 711071 Loudspeaker Configuration: Line
Frequency D0.01m,nT
Hz dB
50 23.3
63 30.9
80 21.9
100 26.1 -2
125 24.3 1
160 25.8 4
200 27.8 7
250 16.9 10
315 17.3 13
400 19.6 16
500 26.1 17
630 20.8 18
800 17.0 19
1k 20.5 20
1.25k 22.6 21
1.6k 22.2 21
2k 20.4 21
2.5k 21.3 21
3.15k 26.9 21
4k 27.2
5k 24.1
D0.01m,nT,w(C;Ctr ) 21 ( 0; -1) dB
Tested by Building Performance Centre, Napier University, Edinburgh.
Measured D0.01m,nT dB
0.0
10.0
20.0
30.0
40.0
50.0
60.0
63 125 250 500 1k 2k 4kFrequency (Hz)
Sta
nd
ard
ise
d L
eve
l D
iffe
ren
ce
, D
0.0
1m
,nT
(d
B)
Measured values Shifted Reference Curve
M7-3

OPEN/CLOSED WINDOW RESEARCH Defra Research Contract: NANR116
Airborne Sound Insulation. Laboratory measurements with non-diffuse source conditions
Standardised Level Difference. Simulated residential receiver environment
Date: 11/7/05 Test Sample: Window C-2 Open 0.10 m2
Air temperature: 20.7 ºC Area of window unit, S: 0.945 m2
Air humidity: 31.2 % Window mass per unit area: 36.83 kg/m2
Atmospheric pressure: 1.0272 Bar
Receiving room volume: 31.2 m3
Glass Specification: 4 -16 - 4 mm
Source room volume: 343.1 m3
Canopy: Original
Vent: Closed
Test ID: 711075 Loudspeaker Configuration: Line
Frequency D0.01m,nT
Hz dB
50 21.5
63 29.3
80 20.8
100 24.6 -3
125 22.9 0
160 23.6 3
200 24.5 6
250 18.0 9
315 20.0 12
400 20.3 15
500 22.9 16
630 17.8 17
800 18.5 18
1k 18.4 19
1.25k 16.0 20
1.6k 21.4 20
2k 21.1 20
2.5k 23.7 20
3.15k 25.7 20
4k 23.0
5k 26.9
D0.01m,nT,w(C;Ctr ) 20 ( 0; -1) dB
Tested by Building Performance Centre, Napier University, Edinburgh.
Measured D0.01m,nT dB
0.0
10.0
20.0
30.0
40.0
50.0
60.0
63 125 250 500 1k 2k 4kFrequency (Hz)
Sta
nd
ard
ise
d L
eve
l D
iffe
ren
ce
, D
0.0
1m
,nT
(d
B)
Measured values Shifted Reference Curve
M7-4

OPEN/CLOSED WINDOW RESEARCH Defra Research Contract: NANR116
Airborne Sound Insulation. Laboratory measurements with non-diffuse source conditions
Standardised Level Difference. Simulated residential receiver environment
Date: 12/7/05 Test Sample: Window C-3 Open 0.10 m2
Air temperature: 20.9 ºC Area of window unit, S: 0.945 m2
Air humidity: 31.2 % Window mass per unit area: 36.83 kg/m2
Atmospheric pressure: 1.0254 Bar
Receiving room volume: 31.2 m3
Glass Specification: 4 -18 - 6.4(lam) mm
Source room volume: 343.1 m3
Canopy: n/a
Vent: Vent 1 closed
Test ID: 712007 Loudspeaker Configuration: Line
Frequency D0.01m,nT
Hz dB
50 24.0
63 31.0
80 21.9
100 26.6 -1
125 24.7 2
160 27.1 5
200 28.0 8
250 20.5 11
315 19.4 14
400 20.7 17
500 27.3 18
630 21.4 19
800 16.0 20
1k 20.0 21
1.25k 20.0 22
1.6k 24.3 22
2k 24.8 22
2.5k 25.1 22
3.15k 24.7 22
4k 25.3
5k 25.0
D0.01m,nT,w(C;Ctr ) 22 (-1; -1) dB
Tested by Building Performance Centre, Napier University, Edinburgh.
Measured D0.01m,nT dB
0.0
10.0
20.0
30.0
40.0
50.0
60.0
63 125 250 500 1k 2k 4kFrequency (Hz)
Sta
nd
ard
ise
d L
eve
l D
iffe
ren
ce
, D
0.0
1m
,nT
(d
B)
Measured values Shifted Reference Curve
M7-5

OPEN/CLOSED WINDOW RESEARCH Defra Research Contract: NANR116
Airborne Sound Insulation. Laboratory measurements with non-diffuse source conditions
Standardised Level Difference. Simulated residential receiver environment
Date: 12/7/05 Test Sample: Window C-4 Open 0.10 m2
Air temperature: 20.9 ºC Area of window unit, S: 0.945 m2
Air humidity: 31.2 % Window mass per unit area: 36.83 kg/m2
Atmospheric pressure: 1.0254 Bar
Receiving room volume: 31.2 m3
Glass Specification: 4 -18 - 6.4(lam) mm
Source room volume: 343.1 m3
Canopy: n/a
Vent: Vent 1 closed
Test ID: 712011 Loudspeaker Configuration: Line
Frequency D0.01m,nT
Hz dB
50 22.7
63 29.6
80 21.1
100 25.4 -3
125 23.5 0
160 24.5 3
200 24.7 6
250 20.6 9
315 21.5 12
400 22.4 15
500 25.2 16
630 18.2 17
800 15.9 18
1k 17.6 19
1.25k 15.1 20
1.6k 24.2 20
2k 23.0 20
2.5k 24.0 20
3.15k 22.1 20
4k 23.0
5k 23.7
D0.01m,nT,w(C;Ctr ) 20 (-1; -1) dB
Tested by Building Performance Centre, Napier University, Edinburgh.
Measured D0.01m,nT dB
0.0
10.0
20.0
30.0
40.0
50.0
60.0
63 125 250 500 1k 2k 4kFrequency (Hz)
Sta
nd
ard
ise
d L
eve
l D
iffe
ren
ce
, D
0.0
1m
,nT
(d
B)
Measured values Shifted Reference Curve
M7-6

OPEN/CLOSED WINDOW RESEARCH Defra Research Contract: NANR116
Airborne Sound Insulation. Laboratory measurements with non-diffuse source conditions
Standardised Level Difference. Simulated residential receiver environment
Date: 13/7/2005 Test Sample: Window D-1 Open 0.10 m2
Air temperature: 21.8 ºC Area of window unit, S: 1.26 m2
Air humidity: 31.2 % Window mass per unit area: 27.94 kg/m2
Atmospheric pressure: 1.0174 Bar
Receiving room volume: 31.2 m3
Glass Specification: 4 -16 - 4 mm
Source room volume: 343.1 m3
Canopy: n/a
Vent: n/a
Test ID: 713068 Loudspeaker Configuration: Line
Frequency D0.01m,nT
Hz dB
50 24.5
63 31.2
80 21.8
100 26.0 -7
125 23.6 -4
160 25.7 -1
200 29.4 2
250 15.9 5
315 17.7 8
400 18.9 11
500 15.8 12
630 6.2 13
800 15.5 14
1k 17.3 15
1.25k 18.7 16
1.6k 19.4 16
2k 18.9 16
2.5k 15.3 16
3.15k 18.1 16
4k 18.8
5k 22.1
D0.01m,nT,w(C;Ctr ) 16 (-1; -1) dB
Tested by Building Performance Centre, Napier University, Edinburgh.
Measured D0.01m,nT dB
0.0
10.0
20.0
30.0
40.0
50.0
60.0
63 125 250 500 1k 2k 4kFrequency (Hz)
Sta
nd
ard
ise
d L
eve
l D
iffe
ren
ce
, D
0.0
1m
,nT
(d
B)
Measured values Shifted Reference Curve
M7-7

OPEN/CLOSED WINDOW RESEARCH Defra Research Contract: NANR116
Airborne Sound Insulation. Laboratory measurements with non-diffuse source conditions
Standardised Level Difference. Simulated residential receiver environment
Date: 13/7/2005 Test Sample: Window D-2 Open 0.10 m2
Air temperature: 21.8 ºC Area of window unit, S: 1.26 m2
Air humidity: 31.2 % Window mass per unit area: 27.94 kg/m2
Atmospheric pressure: 1.0175 Bar
Receiving room volume: 31.2 m3
Glass Specification: 4 -16 - 4 mm
Source room volume: 343.1 m3
Canopy: n/a
Vent: n/a
Test ID: 713060 Loudspeaker Configuration: Line
Frequency D0.01m,nT
Hz dB
50 24.9
63 30.6
80 21.4
100 24.5 -9
125 21.8 -6
160 21.3 -3
200 21.4 0
250 14.9 3
315 24.9 6
400 24.6 9
500 12.6 10
630 10.9 11
800 13.2 12
1k 17.6 13
1.25k 15.7 14
1.6k 11.4 14
2k 13.7 14
2.5k 9.5 14
3.15k 16.7 14
4k 15.4
5k 17.9
D0.01m,nT,w(C;Ctr ) 14 (-1; 0) dB
Tested by Building Performance Centre, Napier University, Edinburgh.
Measured D0.01m,nT dB
0.0
10.0
20.0
30.0
40.0
50.0
60.0
63 125 250 500 1k 2k 4kFrequency (Hz)
Sta
nd
ard
ise
d L
eve
l D
iffe
ren
ce
, D
0.0
1m
,nT
(d
B)
Measured values Shifted Reference Curve
M7-8

OPEN/CLOSED WINDOW RESEARCH Defra Research Contract: NANR116
Airborne Sound Insulation. Laboratory measurements with non-diffuse source conditions
Standardised Level Difference. Simulated residential receiver environment
Date: 13/7/2005 Test Sample: Window D-3 Open 0.10 m2
Air temperature: 21.8 ºC Area of window unit, S: 1.26 m2
Air humidity: 31.2 % Window mass per unit area: 27.94 kg/m2
Atmospheric pressure: 1.0174 Bar
Receiving room volume: 31.2 m3
Glass Specification: 4 -16 - 4 mm
Source room volume: 343.1 m3
Canopy: n/a
Vent: n/a
Test ID: 713064 Loudspeaker Configuration: Line
Frequency D0.01m,nT
Hz dB
50 26.2
63 31.2
80 21.4
100 25.2 -8
125 22.4 -5
160 22.2 -2
200 21.5 1
250 18.5 4
315 25.3 7
400 14.0 10
500 6.4 11
630 12.6 12
800 16.4 13
1k 14.9 14
1.25k 15.4 15
1.6k 13.3 15
2k 19.7 15
2.5k 14.7 15
3.15k 20.3 15
4k 19.5
5k 23.1
D0.01m,nT,w(C;Ctr ) 15 (-1; -1) dB
Tested by Building Performance Centre, Napier University, Edinburgh.
Measured D0.01m,nT dB
0.0
10.0
20.0
30.0
40.0
50.0
60.0
63 125 250 500 1k 2k 4kFrequency (Hz)
Sta
nd
ard
ise
d L
eve
l D
iffe
ren
ce
, D
0.0
1m
,nT
(d
B)
Measured values Shifted Reference Curve
M7-9

OPEN/CLOSED WINDOW RESEARCH Defra Research Contract: NANR116
Airborne Sound Insulation. Laboratory measurements with non-diffuse source conditions
Standardised Level Difference. Simulated residential receiver environment
Date: 18/7/2005 Test Sample: Window E Open 0.10 m2
Air temperature: 20.5 ºC Area of window unit, S: 0.63 m2
Air humidity: 31.2 % Window mass per unit area: 26.83 kg/m2
Atmospheric pressure: 0.9959 Bar
Receiving room volume: 31.2 m3
Glass Specification: 4 -16 - 4 mm
Source room volume: 343.1 m3
Canopy: n/a
Vent: n/a
Test ID: 718033 Loudspeaker Configuration: Line
Frequency D0.01m,nT
Hz dB
50 25.7
63 31.6
80 21.8
100 25.9 -2
125 24.3 1
160 26.2 4
200 24.4 7
250 15.2 10
315 18.3 13
400 20.5 16
500 22.5 17
630 23.6 18
800 17.0 19
1k 18.0 20
1.25k 23.4 21
1.6k 23.8 21
2k 23.7 21
2.5k 23.1 21
3.15k 18.1 21
4k 18.2
5k 24.9
D0.01m,nT,w(C;Ctr ) 21 (-1; -1) dB
Tested by Building Performance Centre, Napier University, Edinburgh.
Measured D0.01m,nT dB
0.0
10.0
20.0
30.0
40.0
50.0
60.0
63 125 250 500 1k 2k 4kFrequency (Hz)
Sta
nd
ard
ise
d L
eve
l D
iffe
ren
ce
, D
0.0
1m
,nT
(d
B)
Measured values Shifted Reference Curve
M7-10

OPEN/CLOSED WINDOW RESEARCH Defra Research Contract: NANR116
Airborne Sound Insulation. Laboratory measurements with non-diffuse source conditions
Standardised Level Difference. Simulated residential receiver environment
Date: 19/7/2005 Test Sample: Window F Open 0.10 m2
Air temperature: 20.1 ºC Area of window unit, S: 0.63 m2
Air humidity: 31.2 % Window mass per unit area: 26.83 kg/m2
Atmospheric pressure: 1.0023 Bar
Receiving room volume: 31.2 m3
Glass Specification: 4 -16 - 4 mm
Source room volume: 343.1 m3
Canopy: n/a
Vent: n/a
Test ID: 719010 Loudspeaker Configuration: Line
Frequency D0.01m,nT
Hz dB
50 24.9
63 31.3
80 22.8
100 25.4 -2
125 23.7 1
160 25.1 4
200 22.8 7
250 15.6 10
315 18.6 13
400 21.2 16
500 23.3 17
630 23.9 18
800 19.1 19
1k 22.8 20
1.25k 23.8 21
1.6k 19.4 21
2k 18.7 21
2.5k 16.8 21
3.15k 21.6 21
4k 18.1
5k 19.9
D0.01m,nT,w(C;Ctr ) 21 (-1; -1) dB
Tested by Building Performance Centre, Napier University, Edinburgh.
Measured D0.01m,nT dB
0.0
10.0
20.0
30.0
40.0
50.0
60.0
63 125 250 500 1k 2k 4kFrequency (Hz)
Sta
nd
ard
ise
d L
eve
l D
iffe
ren
ce
, D
0.0
1m
,nT
(d
B)
Measured values Shifted Reference Curve
M7-11

OPEN/CLOSED WINDOW RESEARCH Defra Research Contract: NANR116
Airborne Sound Insulation. Laboratory measurements with non-diffuse source conditions
Standardised Level Difference. Simulated residential receiver environment
Date: 20/7/2005 Test Sample: Window G Open 0.10 m2
Air temperature: 20.3 ºC Area of window unit, S: 0.54 m2
Air humidity: 31.2 % Window mass per unit area: 33.33 kg/m2
Atmospheric pressure: 1.0032 Bar
Receiving room volume: 31.2 m3
Glass Specification: 4 -16 - 4 mm
Source room volume: 343.1 m3
Canopy: n/a
Vent: n/a
Test ID: 720010 Loudspeaker Configuration: Line
Frequency D0.01m,nT
Hz dB
50 24.5
63 30.6
80 21.5
100 24.3 -5
125 22.8 -2
160 22.6 1
200 21.3 4
250 20.3 7
315 22.9 10
400 23.4 13
500 23.4 14
630 19.0 15
800 25.2 16
1k 20.9 17
1.25k 16.7 18
1.6k 14.8 18
2k 19.4 18
2.5k 18.5 18
3.15k 12.8 18
4k 19.8
5k 21.5
D0.01m,nT,w(C;Ctr ) 18 (-1; 1) dB
Tested by Building Performance Centre, Napier University, Edinburgh.
Measured D0.01m,nT dB
0.0
10.0
20.0
30.0
40.0
50.0
60.0
63 125 250 500 1k 2k 4kFrequency (Hz)
Sta
nd
ard
ise
d L
eve
l D
iffe
ren
ce
, D
0.0
1m
,nT
(d
B)
Measured values Shifted Reference Curve
M7-12
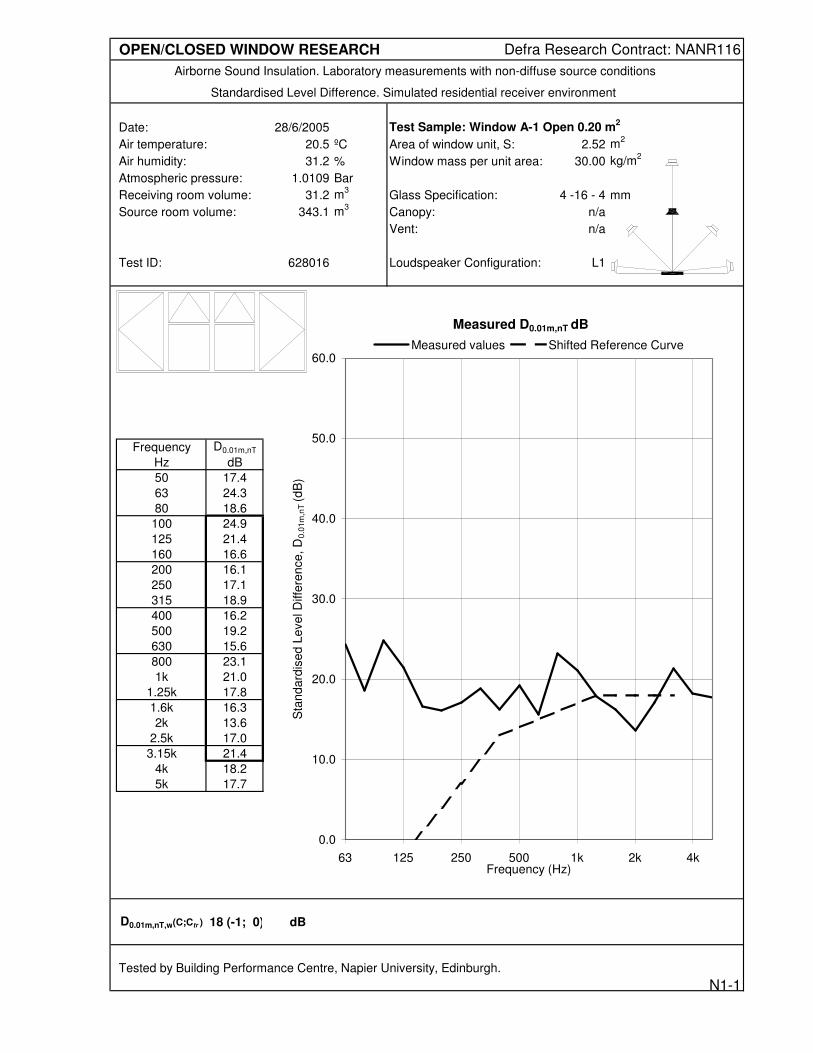
OPEN/CLOSED WINDOW RESEARCH Defra Research Contract: NANR116
Airborne Sound Insulation. Laboratory measurements with non-diffuse source conditions
Standardised Level Difference. Simulated residential receiver environment
Date: 28/6/2005 Test Sample: Window A-1 Open 0.20 m2
Air temperature: 20.5 ºC Area of window unit, S: 2.52 m2
Air humidity: 31.2 % Window mass per unit area: 30.00 kg/m2
Atmospheric pressure: 1.0109 Bar
Receiving room volume: 31.2 m3
Glass Specification: 4 -16 - 4 mm
Source room volume: 343.1 m3
Canopy: n/a
Vent: n/a
Test ID: 628016 Loudspeaker Configuration: L1
Frequency D0.01m,nT
Hz dB
50 17.4
63 24.3
80 18.6
100 24.9 -5
125 21.4 -2
160 16.6 1
200 16.1 4
250 17.1 7
315 18.9 10
400 16.2 13
500 19.2 14
630 15.6 15
800 23.1 16
1k 21.0 17
1.25k 17.8 18
1.6k 16.3 18
2k 13.6 18
2.5k 17.0 18
3.15k 21.4 18
4k 18.2
5k 17.7
D0.01m,nT,w(C;Ctr ) 18 (-1; 0) dB
Tested by Building Performance Centre, Napier University, Edinburgh.
Measured D0.01m,nT dB
0.0
10.0
20.0
30.0
40.0
50.0
60.0
63 125 250 500 1k 2k 4kFrequency (Hz)
Sta
nd
ard
ise
d L
eve
l D
iffe
ren
ce
, D
0.0
1m
,nT
(d
B)
Measured values Shifted Reference Curve
N1-1

OPEN/CLOSED WINDOW RESEARCH Defra Research Contract: NANR116
Airborne Sound Insulation. Laboratory measurements with non-diffuse source conditions
Standardised Level Difference. Simulated residential receiver environment
Date: 28/6/2005 Test Sample: Window A-2 Open 0.20 m2
Air temperature: 20.5 ºC Area of window unit, S: 2.52 m2
Air humidity: 31.2 % Window mass per unit area: 30.00 kg/m2
Atmospheric pressure: 1.0109 Bar
Receiving room volume: 31.2 m3
Glass Specification: 4 -16 - 4 mm
Source room volume: 343.1 m3
Canopy: n/a
Vent: n/a
Test ID: 628011 Loudspeaker Configuration: L1
Frequency D0.01m,nT
Hz dB
50 17.6
63 24.8
80 18.1
100 23.7 -5
125 20.9 -2
160 17.4 1
200 17.5 4
250 17.1 7
315 18.6 10
400 15.4 13
500 18.4 14
630 15.5 15
800 22.9 16
1k 20.2 17
1.25k 18.6 18
1.6k 15.6 18
2k 14.5 18
2.5k 16.5 18
3.15k 20.9 18
4k 17.1
5k 17.0
D0.01m,nT,w(C;Ctr ) 18 (-1; 0) dB
Tested by Building Performance Centre, Napier University, Edinburgh.
Measured D0.01m,nT dB
0.0
10.0
20.0
30.0
40.0
50.0
60.0
63 125 250 500 1k 2k 4kFrequency (Hz)
Sta
nd
ard
ise
d L
eve
l D
iffe
ren
ce
, D
0.0
1m
,nT
(d
B)
Measured values Shifted Reference Curve
N1-2

OPEN/CLOSED WINDOW RESEARCH Defra Research Contract: NANR116
Airborne Sound Insulation. Laboratory measurements with non-diffuse source conditions
Standardised Level Difference. Simulated residential receiver environment
Date: 28/6/2005 Test Sample: Window A-3 Open 0.20 m2
Air temperature: 20.5 ºC Area of window unit, S: 2.52 m2
Air humidity: 31.2 % Window mass per unit area: 30.00 kg/m2
Atmospheric pressure: 1.0112 Bar
Receiving room volume: 31.2 m3
Glass Specification: 4 -16 - 4 mm
Source room volume: 343.1 m3
Canopy: n/a
Vent: n/a
Test ID: 628006 Loudspeaker Configuration: L1
Frequency D0.01m,nT
Hz dB
50 18.3
63 25.2
80 16.0
100 22.6 -6
125 17.9 -3
160 18.0 0
200 18.6 3
250 14.4 6
315 15.5 9
400 14.4 12
500 17.5 13
630 16.5 14
800 17.3 15
1k 16.9 16
1.25k 17.7 17
1.6k 15.4 17
2k 15.7 17
2.5k 14.7 17
3.15k 20.7 17
4k 15.6
5k 17.2
D0.01m,nT,w(C;Ctr ) 17 (-1; -1) dB
Tested by Building Performance Centre, Napier University, Edinburgh.
Measured D0.01m,nT dB
0.0
10.0
20.0
30.0
40.0
50.0
60.0
63 125 250 500 1k 2k 4kFrequency (Hz)
Sta
nd
ard
ise
d L
eve
l D
iffe
ren
ce
, D
0.0
1m
,nT
(d
B)
Measured values Shifted Reference Curve
N1-3

OPEN/CLOSED WINDOW RESEARCH Defra Research Contract: NANR116
Airborne Sound Insulation. Laboratory measurements with non-diffuse source conditions
Standardised Level Difference. Simulated residential receiver environment
Date: 5/7/05 Test Sample: Window B Open 0.20 m2
Air temperature: 18.9 ºC Area of window unit, S: 1.26 m2
Air humidity: 31.2 % Window mass per unit area: 27.94 kg/m2
Atmospheric pressure: 0.9982 Bar
Receiving room volume: 31.2 m3
Glass Specification: 4 -16 - 4 mm
Source room volume: 343.1 m3
Canopy: n/a
Vent: n/a
Test ID: 705005 Loudspeaker Configuration: L1
Frequency D0.01m,nT
Hz dB
50 21.3
63 27.1
80 17.0
100 21.1 -8
125 18.0 -5
160 15.5 -2
200 15.2 1
250 18.1 4
315 20.8 7
400 21.0 10
500 19.5 11
630 11.8 12
800 17.7 13
1k 14.9 14
1.25k 13.1 15
1.6k 16.2 15
2k 15.1 15
2.5k 12.0 15
3.15k 16.3 15
4k 19.5
5k 23.4
D0.01m,nT,w(C;Ctr ) 15 ( 0; 0) dB
Tested by Building Performance Centre, Napier University, Edinburgh.
Measured D0.01m,nT dB
0.0
10.0
20.0
30.0
40.0
50.0
60.0
63 125 250 500 1k 2k 4kFrequency (Hz)
Sta
nd
ard
ise
d L
eve
l D
iffe
ren
ce
, D
0.0
1m
,nT
(d
B)
Measured values Shifted Reference Curve
N1-4

OPEN/CLOSED WINDOW RESEARCH Defra Research Contract: NANR116
Airborne Sound Insulation. Laboratory measurements with non-diffuse source conditions
Standardised Level Difference. Simulated residential receiver environment
Date: 11/7/05 Test Sample: Window C-1 Open 0.20 m2
Air temperature: 20.5 ºC Area of window unit, S: 0.945 m2
Air humidity: 31.2 % Window mass per unit area: 36.83 kg/m2
Atmospheric pressure: 1.0281 Bar
Receiving room volume: 31.2 m3
Glass Specification: 4 -16 - 4 mm
Source room volume: 343.1 m3
Canopy: Original
Vent: Closed
Test ID: 711008 Loudspeaker Configuration: L1
Frequency D0.01m,nT
Hz dB
50 22.5
63 29.5
80 20.2
100 25.1 -7
125 22.0 -4
160 25.1 -1
200 24.2 2
250 20.0 5
315 16.0 8
400 18.4 11
500 16.5 12
630 7.9 13
800 9.7 14
1k 13.3 15
1.25k 15.8 16
1.6k 21.2 16
2k 21.8 16
2.5k 20.0 16
3.15k 24.7 16
4k 24.2
5k 22.9
D0.01m,nT,w(C;Ctr ) 16 (-1; -2) dB
Tested by Building Performance Centre, Napier University, Edinburgh.
Measured D0.01m,nT dB
0.0
10.0
20.0
30.0
40.0
50.0
60.0
63 125 250 500 1k 2k 4kFrequency (Hz)
Sta
nd
ard
ise
d L
eve
l D
iffe
ren
ce
, D
0.0
1m
,nT
(d
B)
Measured values Shifted Reference Curve
N1-5

OPEN/CLOSED WINDOW RESEARCH Defra Research Contract: NANR116
Airborne Sound Insulation. Laboratory measurements with non-diffuse source conditions
Standardised Level Difference. Simulated residential receiver environment
Date: 11/7/05 Test Sample: Window C-2 Open 0.20 m2
Air temperature: 20.5 ºC Area of window unit, S: 0.945 m2
Air humidity: 31.2 % Window mass per unit area: 36.83 kg/m2
Atmospheric pressure: 1.0281 Bar
Receiving room volume: 31.2 m3
Glass Specification: 4 -16 - 4 mm
Source room volume: 343.1 m3
Canopy: Original
Vent: Closed
Test ID: 711012 Loudspeaker Configuration: L1
Frequency D0.01m,nT
Hz dB
50 20.9
63 28.0
80 19.3
100 24.0 -7
125 21.1 -4
160 22.2 -1
200 21.5 2
250 19.3 5
315 17.5 8
400 18.0 11
500 14.9 12
630 4.9 13
800 12.4 14
1k 11.3 15
1.25k 14.9 16
1.6k 21.0 16
2k 22.1 16
2.5k 21.6 16
3.15k 22.1 16
4k 23.3
5k 24.5
D0.01m,nT,w(C;Ctr ) 16 (-2; -3) dB
Tested by Building Performance Centre, Napier University, Edinburgh.
Measured D0.01m,nT dB
0.0
10.0
20.0
30.0
40.0
50.0
60.0
63 125 250 500 1k 2k 4kFrequency (Hz)
Sta
nd
ard
ise
d L
eve
l D
iffe
ren
ce
, D
0.0
1m
,nT
(d
B)
Measured values Shifted Reference Curve
N1-6

OPEN/CLOSED WINDOW RESEARCH Defra Research Contract: NANR116
Airborne Sound Insulation. Laboratory measurements with non-diffuse source conditions
Standardised Level Difference. Simulated residential receiver environment
Date: 12/7/05 Test Sample: Window C-3 Open 0.20 m2
Air temperature: 21.1 ºC Area of window unit, S: 0.945 m2
Air humidity: 31.2 % Window mass per unit area: 36.83 kg/m2
Atmospheric pressure: 1.025 Bar
Receiving room volume: 31.2 m3
Glass Specification: 4 -18 - 6.4(lam) mm
Source room volume: 343.1 m3
Canopy: n/a
Vent: Vent 1 closed
Test ID: 712034 Loudspeaker Configuration: L1
Frequency D0.01m,nT
Hz dB
50 22.5
63 29.7
80 20.5
100 25.8 -7
125 23.1 -4
160 26.3 -1
200 25.3 2
250 22.5 5
315 17.6 8
400 17.8 11
500 17.2 12
630 4.9 13
800 11.9 14
1k 13.3 15
1.25k 16.1 16
1.6k 22.0 16
2k 20.3 16
2.5k 19.1 16
3.15k 24.7 16
4k 23.9
5k 26.5
D0.01m,nT,w(C;Ctr ) 16 (-2; -3) dB
Tested by Building Performance Centre, Napier University, Edinburgh.
Measured D0.01m,nT dB
0.0
10.0
20.0
30.0
40.0
50.0
60.0
63 125 250 500 1k 2k 4kFrequency (Hz)
Sta
nd
ard
ise
d L
eve
l D
iffe
ren
ce
, D
0.0
1m
,nT
(d
B)
Measured values Shifted Reference Curve
N1-7

OPEN/CLOSED WINDOW RESEARCH Defra Research Contract: NANR116
Airborne Sound Insulation. Laboratory measurements with non-diffuse source conditions
Standardised Level Difference. Simulated residential receiver environment
Date: 12/7/05 Test Sample: Window C-4 Open 0.20 m2
Air temperature: 21.1 ºC Area of window unit, S: 0.945 m2
Air humidity: 31.2 % Window mass per unit area: 36.83 kg/m2
Atmospheric pressure: 1.025 Bar
Receiving room volume: 31.2 m3
Glass Specification: 4 -18 - 6.4(lam) mm
Source room volume: 343.1 m3
Canopy: n/a
Vent: Vent 1 closed
Test ID: 712038 Loudspeaker Configuration: L1
Frequency D0.01m,nT
Hz dB
50 20.8
63 28.0
80 19.5
100 24.5 -7
125 21.8 -4
160 23.1 -1
200 22.2 2
250 21.4 5
315 18.5 8
400 17.5 11
500 15.5 12
630 3.7 13
800 13.1 14
1k 11.4 15
1.25k 15.4 16
1.6k 21.3 16
2k 20.3 16
2.5k 20.9 16
3.15k 22.2 16
4k 22.4
5k 26.5
D0.01m,nT,w(C;Ctr ) 16 (-3; -4) dB
Tested by Building Performance Centre, Napier University, Edinburgh.
Measured D0.01m,nT dB
0.0
10.0
20.0
30.0
40.0
50.0
60.0
63 125 250 500 1k 2k 4kFrequency (Hz)
Sta
nd
ard
ise
d L
eve
l D
iffe
ren
ce
, D
0.0
1m
,nT
(d
B)
Measured values Shifted Reference Curve
N1-8
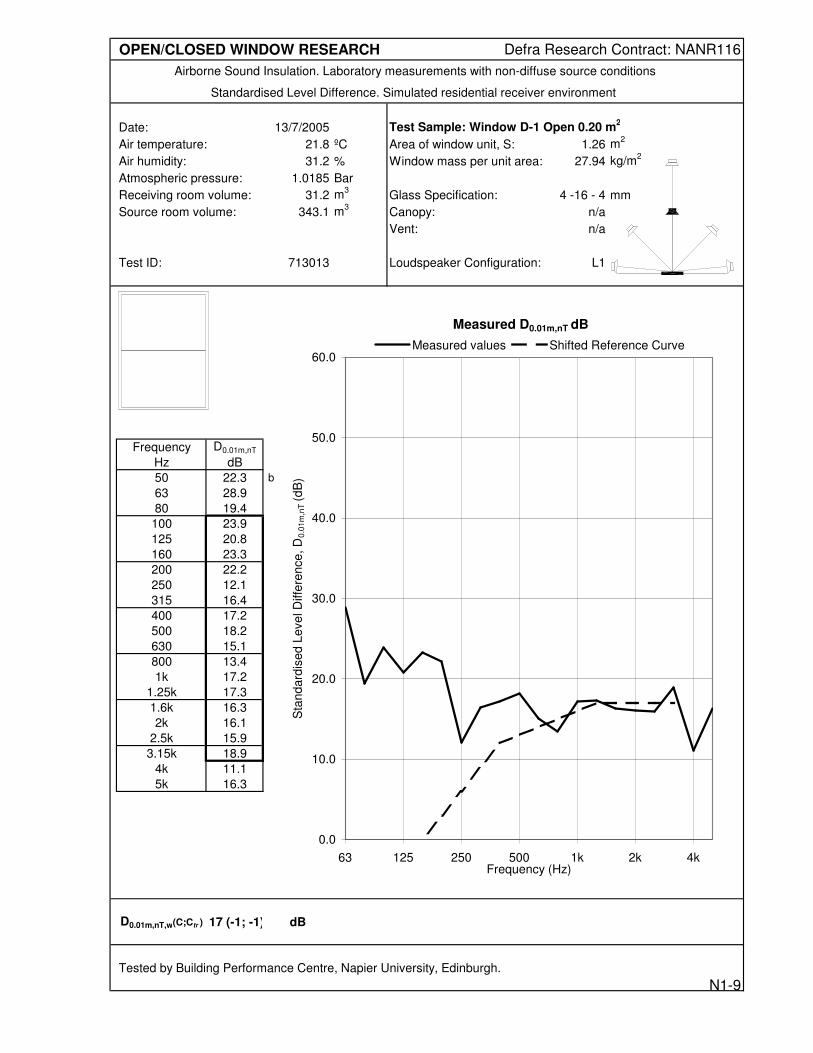
OPEN/CLOSED WINDOW RESEARCH Defra Research Contract: NANR116
Airborne Sound Insulation. Laboratory measurements with non-diffuse source conditions
Standardised Level Difference. Simulated residential receiver environment
Date: 13/7/2005 Test Sample: Window D-1 Open 0.20 m2
Air temperature: 21.8 ºC Area of window unit, S: 1.26 m2
Air humidity: 31.2 % Window mass per unit area: 27.94 kg/m2
Atmospheric pressure: 1.0185 Bar
Receiving room volume: 31.2 m3
Glass Specification: 4 -16 - 4 mm
Source room volume: 343.1 m3
Canopy: n/a
Vent: n/a
Test ID: 713013 Loudspeaker Configuration: L1
Frequency D0.01m,nT
Hz dB
50 22.3 b
63 28.9
80 19.4
100 23.9 -6
125 20.8 -3
160 23.3 0
200 22.2 3
250 12.1 6
315 16.4 9
400 17.2 12
500 18.2 13
630 15.1 14
800 13.4 15
1k 17.2 16
1.25k 17.3 17
1.6k 16.3 17
2k 16.1 17
2.5k 15.9 17
3.15k 18.9 17
4k 11.1
5k 16.3
D0.01m,nT,w(C;Ctr ) 17 (-1; -1) dB
Tested by Building Performance Centre, Napier University, Edinburgh.
Measured D0.01m,nT dB
0.0
10.0
20.0
30.0
40.0
50.0
60.0
63 125 250 500 1k 2k 4kFrequency (Hz)
Sta
nd
ard
ise
d L
eve
l D
iffe
ren
ce
, D
0.0
1m
,nT
(d
B)
Measured values Shifted Reference Curve
N1-9

OPEN/CLOSED WINDOW RESEARCH Defra Research Contract: NANR116
Airborne Sound Insulation. Laboratory measurements with non-diffuse source conditions
Standardised Level Difference. Simulated residential receiver environment
Date: 13/7/2005 Test Sample: Window D-2 Open 0.20 m2
Air temperature: 21.8 ºC Area of window unit, S: 1.26 m2
Air humidity: 31.2 % Window mass per unit area: 27.94 kg/m2
Atmospheric pressure: 1.0185 Bar
Receiving room volume: 31.2 m3
Glass Specification: 4 -16 - 4 mm
Source room volume: 343.1 m3
Canopy: n/a
Vent: n/a
Test ID: 713005 Loudspeaker Configuration: L1
Frequency D0.01m,nT
Hz dB
50 22.5 b
63 28.3
80 19.0
100 22.4 -12
125 18.8 -9
160 18.8 -6
200 16.7 -3
250 14.4 0
315 19.8 3
400 17.5 6
500 11.2 7
630 7.7 8
800 13.8 9
1k 15.0 10
1.25k 12.4 11
1.6k 7.6 11
2k 8.8 11
2.5k 9.3 11
3.15k 15.5 11
4k 13.7
5k 13.4
D0.01m,nT,w(C;Ctr ) 11 ( 0; 0) dB
Tested by Building Performance Centre, Napier University, Edinburgh.
Measured D0.01m,nT dB
-10.0
0.0
10.0
20.0
30.0
40.0
50.0
63 125 250 500 1k 2k 4kFrequency (Hz)
Sta
nd
ard
ise
d L
eve
l D
iffe
ren
ce
, D
0.0
1m
,nT
(d
B)
Measured values Shifted Reference Curve
N1-10

OPEN/CLOSED WINDOW RESEARCH Defra Research Contract: NANR116
Airborne Sound Insulation. Laboratory measurements with non-diffuse source conditions
Standardised Level Difference. Simulated residential receiver environment
Date: 13/7/2005 Test Sample: Window D-3 Open 0.20 m2
Air temperature: 21.8 ºC Area of window unit, S: 1.26 m2
Air humidity: 31.2 % Window mass per unit area: 27.94 kg/m2
Atmospheric pressure: 1.0185 Bar
Receiving room volume: 31.2 m3
Glass Specification: 4 -16 - 4 mm
Source room volume: 343.1 m3
Canopy: n/a
Vent: n/a
Test ID: 713009 Loudspeaker Configuration: L1
Frequency D0.01m,nT
Hz dB
50 24.1 b
63 29.0
80 19.1
100 23.2 -9
125 19.7 -6
160 19.7 -3
200 17.2 0
250 12.9 3
315 20.2 6
400 11.0 9
500 13.7 10
630 17.4 11
800 16.4 12
1k 13.7 13
1.25k 13.4 14
1.6k 10.1 14
2k 14.8 14
2.5k 14.8 14
3.15k 17.5 14
4k 16.2
5k 16.9
D0.01m,nT,w(C;Ctr ) 14 ( 0; 0) dB
Tested by Building Performance Centre, Napier University, Edinburgh.
Measured D0.01m,nT dB
0.0
10.0
20.0
30.0
40.0
50.0
60.0
63 125 250 500 1k 2k 4kFrequency (Hz)
Sta
nd
ard
ise
d L
eve
l D
iffe
ren
ce
, D
0.0
1m
,nT
(d
B)
Measured values Shifted Reference Curve
N1-11

OPEN/CLOSED WINDOW RESEARCH Defra Research Contract: NANR116
Airborne Sound Insulation. Laboratory measurements with non-diffuse source conditions
Standardised Level Difference. Simulated residential receiver environment
Date: 18/7/2005 Test Sample: Window E Open 0.20 m2
Air temperature: 20.3 ºC Area of window unit, S: 0.63 m2
Air humidity: 31.2 % Window mass per unit area: 26.83 kg/m2
Atmospheric pressure: 0.9956 Bar
Receiving room volume: 31.2 m3
Glass Specification: 4 -16 - 4 mm
Source room volume: 343.1 m3
Canopy: n/a
Vent: n/a
Test ID: 718006 Loudspeaker Configuration: L1
Frequency D0.01m,nT
Hz dB
50 24.0
63 30.4
80 20.9
100 25.0 -5
125 23.4 -2
160 25.9 1
200 23.1 4
250 13.7 7
315 15.6 10
400 17.2 13
500 22.0 14
630 20.5 15
800 19.6 16
1k 15.4 17
1.25k 21.8 18
1.6k 18.2 18
2k 18.4 18
2.5k 14.7 18
3.15k 18.4 18
4k 22.2
5k 21.7
D0.01m,nT,w(C;Ctr ) 18 ( 0; 0) dB
Tested by Building Performance Centre, Napier University, Edinburgh.
Measured D0.01m,nT dB
0.0
10.0
20.0
30.0
40.0
50.0
60.0
63 125 250 500 1k 2k 4kFrequency (Hz)
Sta
nd
ard
ise
d L
eve
l D
iffe
ren
ce
, D
0.0
1m
,nT
(d
B)
Measured values Shifted Reference Curve
N1-12

OPEN/CLOSED WINDOW RESEARCH Defra Research Contract: NANR116
Airborne Sound Insulation. Laboratory measurements with non-diffuse source conditions
Standardised Level Difference. Simulated residential receiver environment
Date: 19/7/2005 Test Sample: Window F Open 0.20 m2
Air temperature: 20.3 ºC Area of window unit, S: 0.63 m2
Air humidity: 31.2 % Window mass per unit area: 26.83 kg/m2
Atmospheric pressure: 1.0023 Bar
Receiving room volume: 31.2 m3
Glass Specification: 4 -16 - 4 mm
Source room volume: 343.1 m3
Canopy: n/a
Vent: n/a
Test ID: 719020 Loudspeaker Configuration: L1
Frequency D0.01m,nT
Hz dB
50 23.3
63 30.1
80 21.8
100 24.5 -3
125 22.7 0
160 24.5 3
200 21.7 6
250 15.0 9
315 15.2 12
400 17.8 15
500 21.6 16
630 21.3 17
800 20.5 18
1k 18.0 19
1.25k 23.4 20
1.6k 20.8 20
2k 22.6 20
2.5k 17.2 20
3.15k 15.8 20
4k 19.8
5k 17.5
D0.01m,nT,w(C;Ctr ) 20 (-1; -1) dB
Tested by Building Performance Centre, Napier University, Edinburgh.
Measured D0.01m,nT dB
0.0
10.0
20.0
30.0
40.0
50.0
60.0
63 125 250 500 1k 2k 4kFrequency (Hz)
Sta
nd
ard
ise
d L
eve
l D
iffe
ren
ce
, D
0.0
1m
,nT
(d
B)
Measured values Shifted Reference Curve
N1-13

OPEN/CLOSED WINDOW RESEARCH Defra Research Contract: NANR116
Airborne Sound Insulation. Laboratory measurements with non-diffuse source conditions
Standardised Level Difference. Simulated residential receiver environment
Date: 20/7/2005 Test Sample: Window G Open 0.20 m2
Air temperature: 20.3 ºC Area of window unit, S: 0.54 m2
Air humidity: 31.2 % Window mass per unit area: 33.33 kg/m2
Atmospheric pressure: 1.0032 Bar
Receiving room volume: 31.2 m3
Glass Specification: 4 -16 - 4 mm
Source room volume: 343.1 m3
Canopy: n/a
Vent: n/a
Test ID: 720019 Loudspeaker Configuration: L1
Frequency D0.01m,nT
Hz dB
50 22.9
63 29.4
80 20.5
100 23.1 -2
125 21.1 1
160 20.7 4
200 17.8 7
250 18.4 10
315 22.3 13
400 22.3 16
500 23.7 17
630 22.1 18
800 25.6 19
1k 23.1 20
1.25k 19.1 21
1.6k 20.6 21
2k 19.7 21
2.5k 20.4 21
3.15k 16.6 21
4k 14.8
5k 17.5
D0.01m,nT,w(C;Ctr ) 21 (-1; 0) dB
Tested by Building Performance Centre, Napier University, Edinburgh.
Measured D0.01m,nT dB
0.0
10.0
20.0
30.0
40.0
50.0
60.0
63 125 250 500 1k 2k 4kFrequency (Hz)
Sta
nd
ard
ise
d L
eve
l D
iffe
ren
ce
, D
0.0
1m
,nT
(d
B)
Measured values Shifted Reference Curve
N1-14

OPEN/CLOSED WINDOW RESEARCH Defra Research Contract: NANR116
Airborne Sound Insulation. Laboratory measurements with non-diffuse source conditions
Standardised Level Difference. Simulated residential receiver environment
Date: 28/6/2005 Test Sample: Window A-1 Open 0.20 m2
Air temperature: 20.6 ºC Area of window unit, S: 2.52 m2
Air humidity: 31.2 % Window mass per unit area: 30.00 kg/m2
Atmospheric pressure: 1.0102 Bar
Receiving room volume: 31.2 m3
Glass Specification: 4 -16 - 4 mm
Source room volume: 343.1 m3
Canopy: n/a
Vent: n/a
Test ID: 628048 Loudspeaker Configuration: L2
Frequency D0.01m,nT
Hz dB
50 12.2
63 21.7
80 16.3
100 21.3 -2
125 18.7 1
160 19.8 4
200 17.7 7
250 17.5 10
315 21.7 13
400 21.4 16
500 21.2 17
630 19.5 18
800 20.6 19
1k 18.4 20
1.25k 15.6 21
1.6k 21.9 21
2k 21.7 21
2.5k 24.2 21
3.15k 23.6 21
4k 19.5
5k 18.2
D0.01m,nT,w(C;Ctr ) 21 (-1; -2) dB
Tested by Building Performance Centre, Napier University, Edinburgh.
Measured D0.01m,nT dB
0.0
10.0
20.0
30.0
40.0
50.0
60.0
63 125 250 500 1k 2k 4kFrequency (Hz)
Sta
nd
ard
ise
d L
eve
l D
iffe
ren
ce
, D
0.0
1m
,nT
(d
B)
Measured values Shifted Reference Curve
N2-1

OPEN/CLOSED WINDOW RESEARCH Defra Research Contract: NANR116
Airborne Sound Insulation. Laboratory measurements with non-diffuse source conditions
Standardised Level Difference. Simulated residential receiver environment
Date: 5/7/05 Test Sample: Window B Open 0.20 m2
Air temperature: 19.1 ºC Area of window unit, S: 1.26 m2
Air humidity: 31.2 % Window mass per unit area: 27.94 kg/m2
Atmospheric pressure: 0.998 Bar
Receiving room volume: 31.2 m3
Glass Specification: 4 -16 - 4 mm
Source room volume: 343.1 m3
Canopy: n/a
Vent: n/a
Test ID: 705010 Loudspeaker Configuration: L2
Frequency D0.01m,nT
Hz dB
50 15.8
63 27.4
80 19.4
100 22.5 -3
125 21.4 0
160 21.3 3
200 21.9 6
250 21.8 9
315 21.4 12
400 17.7 15
500 20.6 16
630 16.6 17
800 20.5 18
1k 15.3 19
1.25k 15.6 20
1.6k 19.2 20
2k 23.9 20
2.5k 25.4 20
3.15k 23.6 20
4k 21.6
5k 24.1
D0.01m,nT,w(C;Ctr ) 20 (-1; -2) dB
Tested by Building Performance Centre, Napier University, Edinburgh.
Measured D0.01m,nT dB
0.0
10.0
20.0
30.0
40.0
50.0
60.0
63 125 250 500 1k 2k 4kFrequency (Hz)
Sta
nd
ard
ise
d L
eve
l D
iffe
ren
ce
, D
0.0
1m
,nT
(d
B)
Measured values Shifted Reference Curve
N2-2

OPEN/CLOSED WINDOW RESEARCH Defra Research Contract: NANR116
Airborne Sound Insulation. Laboratory measurements with non-diffuse source conditions
Standardised Level Difference. Simulated residential receiver environment
Date: 11/7/05 Test Sample: Window C-1 Open 0.20 m2
Air temperature: 20.6 ºC Area of window unit, S: 0.945 m2
Air humidity: 31.2 % Window mass per unit area: 36.83 kg/m2
Atmospheric pressure: 1.0278 Bar
Receiving room volume: 31.2 m3
Glass Specification: 4 -16 - 4 mm
Source room volume: 343.1 m3
Canopy: Original
Vent: Closed
Test ID: 711034 Loudspeaker Configuration: L2
Frequency D0.01m,nT
Hz dB
50 16.7
63 29.0
80 20.7
100 24.9 -5
125 22.9 -2
160 23.4 1
200 23.2 4
250 19.7 7
315 16.7 10
400 20.1 13
500 20.2 14
630 15.8 15
800 18.0 16
1k 17.7 17
1.25k 16.1 18
1.6k 15.0 18
2k 15.5 18
2.5k 20.2 18
3.15k 25.0 18
4k 21.5
5k 19.1
D0.01m,nT,w(C;Ctr ) 18 (-1; -1) dB
Tested by Building Performance Centre, Napier University, Edinburgh.
Measured D0.01m,nT dB
0.0
10.0
20.0
30.0
40.0
50.0
60.0
63 125 250 500 1k 2k 4kFrequency (Hz)
Sta
nd
ard
ise
d L
eve
l D
iffe
ren
ce
, D
0.0
1m
,nT
(d
B)
Measured values Shifted Reference Curve
N2-3
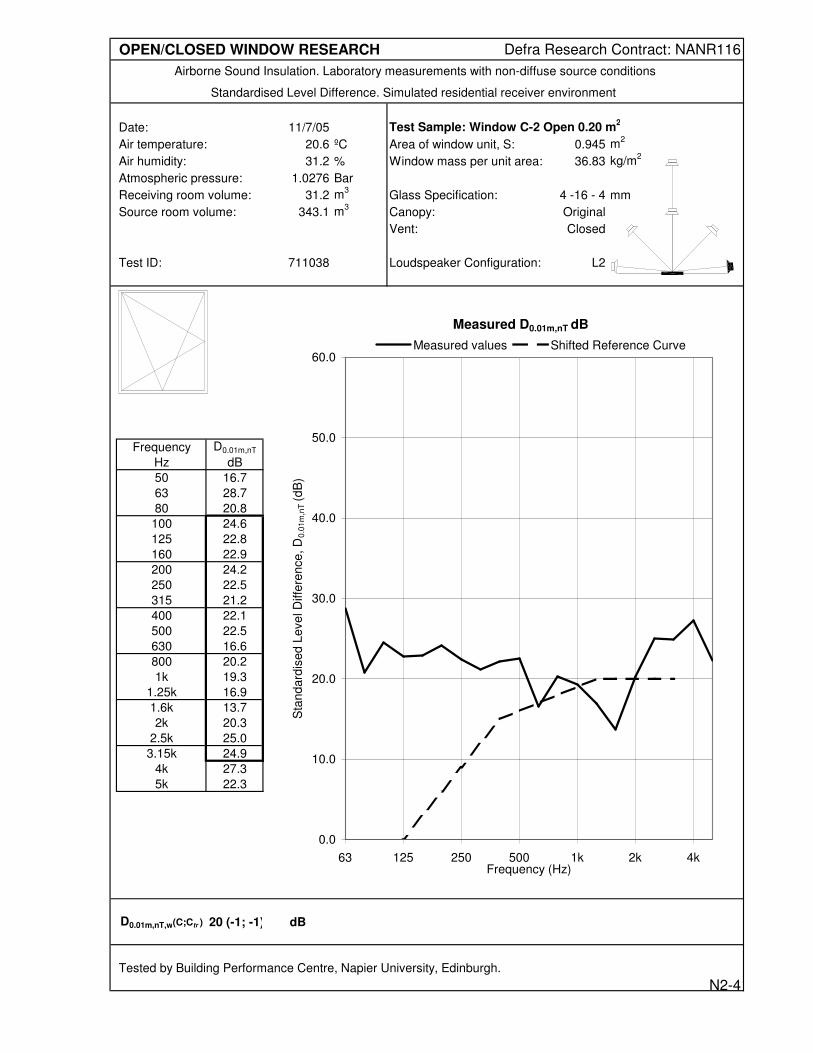
OPEN/CLOSED WINDOW RESEARCH Defra Research Contract: NANR116
Airborne Sound Insulation. Laboratory measurements with non-diffuse source conditions
Standardised Level Difference. Simulated residential receiver environment
Date: 11/7/05 Test Sample: Window C-2 Open 0.20 m2
Air temperature: 20.6 ºC Area of window unit, S: 0.945 m2
Air humidity: 31.2 % Window mass per unit area: 36.83 kg/m2
Atmospheric pressure: 1.0276 Bar
Receiving room volume: 31.2 m3
Glass Specification: 4 -16 - 4 mm
Source room volume: 343.1 m3
Canopy: Original
Vent: Closed
Test ID: 711038 Loudspeaker Configuration: L2
Frequency D0.01m,nT
Hz dB
50 16.7
63 28.7
80 20.8
100 24.6 -3
125 22.8 0
160 22.9 3
200 24.2 6
250 22.5 9
315 21.2 12
400 22.1 15
500 22.5 16
630 16.6 17
800 20.2 18
1k 19.3 19
1.25k 16.9 20
1.6k 13.7 20
2k 20.3 20
2.5k 25.0 20
3.15k 24.9 20
4k 27.3
5k 22.3
D0.01m,nT,w(C;Ctr ) 20 (-1; -1) dB
Tested by Building Performance Centre, Napier University, Edinburgh.
Measured D0.01m,nT dB
0.0
10.0
20.0
30.0
40.0
50.0
60.0
63 125 250 500 1k 2k 4kFrequency (Hz)
Sta
nd
ard
ise
d L
eve
l D
iffe
ren
ce
, D
0.0
1m
,nT
(d
B)
Measured values Shifted Reference Curve
N2-4

OPEN/CLOSED WINDOW RESEARCH Defra Research Contract: NANR116
Airborne Sound Insulation. Laboratory measurements with non-diffuse source conditions
Standardised Level Difference. Simulated residential receiver environment
Date: 12/7/05 Test Sample: Window C-3 Open 0.20 m2
Air temperature: 21.1 ºC Area of window unit, S: 0.945 m2
Air humidity: 31.2 % Window mass per unit area: 36.83 kg/m2
Atmospheric pressure: 1.0247 Bar
Receiving room volume: 31.2 m3
Glass Specification: 4 -18 - 6.4(lam) mm
Source room volume: 343.1 m3
Canopy: n/a
Vent: Vent 1 closed
Test ID: 712047 Loudspeaker Configuration: L2
Frequency D0.01m,nT
Hz dB
50 17.8
63 30.1
80 22.0
100 26.3 -5
125 24.7 -2
160 25.5 1
200 25.2 4
250 23.7 7
315 20.1 10
400 19.7 13
500 21.0 14
630 17.7 15
800 17.7 16
1k 19.1 17
1.25k 16.9 18
1.6k 15.6 18
2k 13.6 18
2.5k 21.0 18
3.15k 25.7 18
4k 22.2
5k 23.4
D0.01m,nT,w(C;Ctr ) 18 ( 0; 0) dB
Tested by Building Performance Centre, Napier University, Edinburgh.
Measured D0.01m,nT dB
0.0
10.0
20.0
30.0
40.0
50.0
60.0
63 125 250 500 1k 2k 4kFrequency (Hz)
Sta
nd
ard
ise
d L
eve
l D
iffe
ren
ce
, D
0.0
1m
,nT
(d
B)
Measured values Shifted Reference Curve
N2-5

OPEN/CLOSED WINDOW RESEARCH Defra Research Contract: NANR116
Airborne Sound Insulation. Laboratory measurements with non-diffuse source conditions
Standardised Level Difference. Simulated residential receiver environment
Date: 12/7/05 Test Sample: Window C-4 Open 0.20 m2
Air temperature: 21.1 ºC Area of window unit, S: 0.945 m2
Air humidity: 31.2 % Window mass per unit area: 36.83 kg/m2
Atmospheric pressure: 1.0247 Bar
Receiving room volume: 31.2 m3
Glass Specification: 4 -18 - 6.4(lam) mm
Source room volume: 343.1 m3
Canopy: n/a
Vent: Vent 1 closed
Test ID: 712051 Loudspeaker Configuration: L2
Frequency D0.01m,nT
Hz dB
50 16.8
63 29.0
80 21.2
100 25.2 -3
125 23.6 0
160 24.1 3
200 25.3 6
250 25.0 9
315 22.9 12
400 21.1 15
500 22.6 16
630 18.2 17
800 19.0 18
1k 19.6 19
1.25k 15.1 20
1.6k 17.8 20
2k 21.3 20
2.5k 25.1 20
3.15k 25.6 20
4k 27.0
5k 26.0
D0.01m,nT,w(C;Ctr ) 20 (-1; -1) dB
Tested by Building Performance Centre, Napier University, Edinburgh.
Measured D0.01m,nT dB
0.0
10.0
20.0
30.0
40.0
50.0
60.0
63 125 250 500 1k 2k 4kFrequency (Hz)
Sta
nd
ard
ise
d L
eve
l D
iffe
ren
ce
, D
0.0
1m
,nT
(d
B)
Measured values Shifted Reference Curve
N2-6

OPEN/CLOSED WINDOW RESEARCH Defra Research Contract: NANR116
Airborne Sound Insulation. Laboratory measurements with non-diffuse source conditions
Standardised Level Difference. Simulated residential receiver environment
Date: 18/7/2005 Test Sample: Window E Open 0.20 m2
Air temperature: 20.4 ºC Area of window unit, S: 0.63 m2
Air humidity: 31.2 % Window mass per unit area: 26.83 kg/m2
Atmospheric pressure: 0.9956 Bar
Receiving room volume: 31.2 m3
Glass Specification: 4 -16 - 4 mm
Source room volume: 343.1 m3
Canopy: n/a
Vent: n/a
Test ID: 718020 Loudspeaker Configuration: L2
Frequency D0.01m,nT
Hz dB
50 18.8
63 30.0
80 22.6
100 24.3 1
125 23.1 4
160 24.4 7
200 20.1 10
250 22.1 13
315 21.1 16
400 20.0 19
500 19.6 20
630 23.9 21
800 22.9 22
1k 23.9 23
1.25k 27.6 24
1.6k 26.3 24
2k 27.5 24
2.5k 25.4 24
3.15k 24.8 24
4k 24.2
5k 18.8
D0.01m,nT,w(C;Ctr ) 24 ( 0; -1) dB
Tested by Building Performance Centre, Napier University, Edinburgh.
Measured D0.01m,nT dB
0.0
10.0
20.0
30.0
40.0
50.0
60.0
63 125 250 500 1k 2k 4kFrequency (Hz)
Sta
nd
ard
ise
d L
eve
l D
iffe
ren
ce
, D
0.0
1m
,nT
(d
B)
Measured values Shifted Reference Curve
N2-7

OPEN/CLOSED WINDOW RESEARCH Defra Research Contract: NANR116
Airborne Sound Insulation. Laboratory measurements with non-diffuse source conditions
Standardised Level Difference. Simulated residential receiver environment
Date: 19/7/2005 Test Sample: Window F Open 0.20 m2
Air temperature: 20.4 ºC Area of window unit, S: 0.63 m2
Air humidity: 31.2 % Window mass per unit area: 26.83 kg/m2
Atmospheric pressure: 1.0024 Bar
Receiving room volume: 31.2 m3
Glass Specification: 4 -16 - 4 mm
Source room volume: 343.1 m3
Canopy: n/a
Vent: n/a
Test ID: 719034 Loudspeaker Configuration: L2
Frequency D0.01m,nT
Hz dB
50 18.3
63 29.6
80 22.3
100 24.0 0
125 22.4 3
160 23.0 6
200 20.0 9
250 21.6 12
315 20.7 15
400 18.8 18
500 19.4 19
630 22.8 20
800 23.0 21
1k 23.7 22
1.25k 25.5 23
1.6k 24.6 23
2k 24.6 23
2.5k 25.4 23
3.15k 23.6 23
4k 24.8
5k 22.9
D0.01m,nT,w(C;Ctr ) 23 ( 0; 0) dB
Tested by Building Performance Centre, Napier University, Edinburgh.
Measured D0.01m,nT dB
0.0
10.0
20.0
30.0
40.0
50.0
60.0
63 125 250 500 1k 2k 4kFrequency (Hz)
Sta
nd
ard
ise
d L
eve
l D
iffe
ren
ce
, D
0.0
1m
,nT
(d
B)
Measured values Shifted Reference Curve
N2-8

OPEN/CLOSED WINDOW RESEARCH Defra Research Contract: NANR116
Airborne Sound Insulation. Laboratory measurements with non-diffuse source conditions
Standardised Level Difference. Simulated residential receiver environment
Date: 20/7/2005 Test Sample: Window G Open 0.20 m2
Air temperature: 20.3 ºC Area of window unit, S: 0.54 m2
Air humidity: 31.2 % Window mass per unit area: 33.33 kg/m2
Atmospheric pressure: 1.0032 Bar
Receiving room volume: 31.2 m3
Glass Specification: 4 -16 - 4 mm
Source room volume: 343.1 m3
Canopy: n/a
Vent: n/a
Test ID: 720047 Loudspeaker Configuration: L2
Frequency D0.01m,nT
Hz dB
50 18.9
63 28.8
80 22.7
100 24.1 -1
125 22.1 2
160 21.7 5
200 20.6 8
250 23.0 11
315 23.4 14
400 19.2 17
500 20.4 18
630 25.2 19
800 21.2 20
1k 18.3 21
1.25k 21.0 22
1.6k 22.6 22
2k 23.9 22
2.5k 25.1 22
3.15k 20.9 22
4k 17.1
5k 15.2
D0.01m,nT,w(C;Ctr ) 22 ( 0; -1) dB
Tested by Building Performance Centre, Napier University, Edinburgh.
Measured D0.01m,nT dB
0.0
10.0
20.0
30.0
40.0
50.0
60.0
63 125 250 500 1k 2k 4kFrequency (Hz)
Sta
nd
ard
ise
d L
eve
l D
iffe
ren
ce
, D
0.0
1m
,nT
(d
B)
Measured values Shifted Reference Curve
N2-9

OPEN/CLOSED WINDOW RESEARCH Defra Research Contract: NANR116
Airborne Sound Insulation. Laboratory measurements with non-diffuse source conditions
Standardised Level Difference. Simulated residential receiver environment
Date: 28/6/2005 Test Sample: Window A-1 Open 0.20 m2
Air temperature: 20.6 ºC Area of window unit, S: 2.52 m2
Air humidity: 31.2 % Window mass per unit area: 30.00 kg/m2
Atmospheric pressure: 1.0095 Bar
Receiving room volume: 31.2 m3
Glass Specification: 4 -16 - 4 mm
Source room volume: 343.1 m3
Canopy: n/a
Vent: n/a
Test ID: 628064 Loudspeaker Configuration: L3
Frequency D0.01m,nT
Hz dB
50 16.2
63 24.5
80 21.6
100 27.0 -6
125 24.8 -3
160 20.6 0
200 20.9 3
250 18.6 6
315 21.0 9
400 19.7 12
500 15.0 13
630 14.0 14
800 16.1 15
1k 15.0 16
1.25k 15.7 17
1.6k 18.5 17
2k 17.7 17
2.5k 21.8 17
3.15k 21.9 17
4k 18.5
5k 12.2
D0.01m,nT,w(C;Ctr ) 17 ( 0; 0) dB
Tested by Building Performance Centre, Napier University, Edinburgh.
Measured D0.01m,nT dB
0.0
10.0
20.0
30.0
40.0
50.0
60.0
63 125 250 500 1k 2k 4kFrequency (Hz)
Sta
nd
ard
ise
d L
eve
l D
iffe
ren
ce
, D
0.0
1m
,nT
(d
B)
Measured values Shifted Reference Curve
N3-1

OPEN/CLOSED WINDOW RESEARCH Defra Research Contract: NANR116
Airborne Sound Insulation. Laboratory measurements with non-diffuse source conditions
Standardised Level Difference. Simulated residential receiver environment
Date: 5/7/05 Test Sample: Window B Open 0.20 m2
Air temperature: 19.3 ºC Area of window unit, S: 1.26 m2
Air humidity: 31.2 % Window mass per unit area: 27.94 kg/m2
Atmospheric pressure: 0.9975 Bar
Receiving room volume: 31.2 m3
Glass Specification: 4 -16 - 4 mm
Source room volume: 343.1 m3
Canopy: n/a
Vent: n/a
Test ID: 705015 Loudspeaker Configuration: L3
Frequency D0.01m,nT
Hz dB
50 16.1
63 28.1
80 18.8
100 21.9 -3
125 21.0 0
160 22.1 3
200 22.4 6
250 20.9 9
315 21.2 12
400 17.9 15
500 19.5 16
630 16.5 17
800 19.4 18
1k 15.3 19
1.25k 15.8 20
1.6k 20.4 20
2k 23.8 20
2.5k 25.2 20
3.15k 24.1 20
4k 25.0
5k 28.3
D0.01m,nT,w(C;Ctr ) 20 (-1; -2) dB
Tested by Building Performance Centre, Napier University, Edinburgh.
Measured D0.01m,nT dB
0.0
10.0
20.0
30.0
40.0
50.0
60.0
63 125 250 500 1k 2k 4kFrequency (Hz)
Sta
nd
ard
ise
d L
eve
l D
iffe
ren
ce
, D
0.0
1m
,nT
(d
B)
Measured values Shifted Reference Curve
N3-2

OPEN/CLOSED WINDOW RESEARCH Defra Research Contract: NANR116
Airborne Sound Insulation. Laboratory measurements with non-diffuse source conditions
Standardised Level Difference. Simulated residential receiver environment
Date: 11/7/05 Test Sample: Window C-2 Open 0.20 m2
Air temperature: 20.6 ºC Area of window unit, S: 0.945 m2
Air humidity: 31.2 % Window mass per unit area: 36.83 kg/m2
Atmospheric pressure: 1.0276 Bar
Receiving room volume: 31.2 m3
Glass Specification: 4 -16 - 4 mm
Source room volume: 343.1 m3
Canopy: Original
Vent: Closed
Test ID: 711044 Loudspeaker Configuration: L3
Frequency D0.01m,nT
Hz dB
50 17.8
63 29.4
80 21.4
100 24.5 -6
125 22.5 -3
160 22.6 0
200 23.2 3
250 18.1 6
315 15.5 9
400 21.0 12
500 19.6 13
630 13.9 14
800 19.0 15
1k 17.9 16
1.25k 14.4 17
1.6k 14.3 17
2k 14.7 17
2.5k 19.2 17
3.15k 17.9 17
4k 17.5
5k 26.3
D0.01m,nT,w(C;Ctr ) 17 (-1; -1) dB
Tested by Building Performance Centre, Napier University, Edinburgh.
Measured D0.01m,nT dB
0.0
10.0
20.0
30.0
40.0
50.0
60.0
63 125 250 500 1k 2k 4kFrequency (Hz)
Sta
nd
ard
ise
d L
eve
l D
iffe
ren
ce
, D
0.0
1m
,nT
(d
B)
Measured values Shifted Reference Curve
N3-3

OPEN/CLOSED WINDOW RESEARCH Defra Research Contract: NANR116
Airborne Sound Insulation. Laboratory measurements with non-diffuse source conditions
Standardised Level Difference. Simulated residential receiver environment
Date: 12/7/05 Test Sample: Window C-4 Open 0.20 m2
Air temperature: 21.2 ºC Area of window unit, S: 0.945 m2
Air humidity: 31.2 % Window mass per unit area: 36.83 kg/m2
Atmospheric pressure: 1.0243 Bar
Receiving room volume: 31.2 m3
Glass Specification: 4 -18 - 6.4(lam) mm
Source room volume: 343.1 m3
Canopy: n/a
Vent: Vent 1 closed
Test ID: 712074 Loudspeaker Configuration: L3
Frequency D0.01m,nT
Hz dB
50 15.8
63 28.0
80 20.4
100 24.0 -6
125 21.9 -3
160 22.1 0
200 22.5 3
250 17.8 6
315 14.2 9
400 19.1 12
500 18.7 13
630 11.8 14
800 18.2 15
1k 16.7 16
1.25k 13.4 17
1.6k 16.6 17
2k 19.1 17
2.5k 16.9 17
3.15k 18.8 17
4k 21.8
5k 23.5
D0.01m,nT,w(C;Ctr ) 17 (-1; -1) dB
Tested by Building Performance Centre, Napier University, Edinburgh.
Measured D0.01m,nT dB
0.0
10.0
20.0
30.0
40.0
50.0
60.0
63 125 250 500 1k 2k 4kFrequency (Hz)
Sta
nd
ard
ise
d L
eve
l D
iffe
ren
ce
, D
0.0
1m
,nT
(d
B)
Measured values Shifted Reference Curve
N3-4

OPEN/CLOSED WINDOW RESEARCH Defra Research Contract: NANR116
Airborne Sound Insulation. Laboratory measurements with non-diffuse source conditions
Standardised Level Difference. Simulated residential receiver environment
Date: 13/7/2005 Test Sample: Window D-1 Open 0.20 m2
Air temperature: 21.8 ºC Area of window unit, S: 1.26 m2
Air humidity: 31.2 % Window mass per unit area: 27.94 kg/m2
Atmospheric pressure: 1.0175 Bar
Receiving room volume: 31.2 m3
Glass Specification: 4 -16 - 4 mm
Source room volume: 343.1 m3
Canopy: n/a
Vent: n/a
Test ID: 713055 Loudspeaker Configuration: L3
Frequency D0.01m,nT
Hz dB
50 16.8
63 29.5
80 20.1
100 23.1 0
125 21.2 3
160 22.4 6
200 21.1 9
250 20.8 12
315 19.4 15
400 22.9 18
500 22.7 19
630 20.5 20
800 24.9 21
1k 25.1 22
1.25k 26.2 23
1.6k 26.1 23
2k 23.9 23
2.5k 20.8 23
3.15k 15.5 23
4k 15.8
5k 16.5
D0.01m,nT,w(C;Ctr ) 23 (-2; 0) dB
Tested by Building Performance Centre, Napier University, Edinburgh.
Measured D0.01m,nT dB
0.0
10.0
20.0
30.0
40.0
50.0
60.0
63 125 250 500 1k 2k 4kFrequency (Hz)
Sta
nd
ard
ise
d L
eve
l D
iffe
ren
ce
, D
0.0
1m
,nT
(d
B)
Measured values Shifted Reference Curve
N3-5

OPEN/CLOSED WINDOW RESEARCH Defra Research Contract: NANR116
Airborne Sound Insulation. Laboratory measurements with non-diffuse source conditions
Standardised Level Difference. Simulated residential receiver environment
Date: 13/7/2005 Test Sample: Window D-2 Open 0.20 m2
Air temperature: 21.8 ºC Area of window unit, S: 1.26 m2
Air humidity: 31.2 % Window mass per unit area: 27.94 kg/m2
Atmospheric pressure: 1.0176 Bar
Receiving room volume: 31.2 m3
Glass Specification: 4 -16 - 4 mm
Source room volume: 343.1 m3
Canopy: n/a
Vent: n/a
Test ID: 713047 Loudspeaker Configuration: L3
Frequency D0.01m,nT
Hz dB
50 17.4
63 28.9
80 20.5
100 22.1 -4
125 19.2 -1
160 21.2 2
200 23.5 5
250 19.5 8
315 22.4 11
400 23.3 14
500 22.3 15
630 16.4 16
800 19.7 17
1k 17.0 18
1.25k 16.9 19
1.6k 21.3 19
2k 23.1 19
2.5k 21.6 19
3.15k 17.6 19
4k 14.2
5k 14.9
D0.01m,nT,w(C;Ctr ) 19 ( 0; 0) dB
Tested by Building Performance Centre, Napier University, Edinburgh.
Measured D0.01m,nT dB
0.0
10.0
20.0
30.0
40.0
50.0
60.0
63 125 250 500 1k 2k 4kFrequency (Hz)
Sta
nd
ard
ise
d L
eve
l D
iffe
ren
ce
, D
0.0
1m
,nT
(d
B)
Measured values Shifted Reference Curve
N3-6

OPEN/CLOSED WINDOW RESEARCH Defra Research Contract: NANR116
Airborne Sound Insulation. Laboratory measurements with non-diffuse source conditions
Standardised Level Difference. Simulated residential receiver environment
Date: 13/7/2005 Test Sample: Window D-3 Open 0.20 m2
Air temperature: 21.8 ºC Area of window unit, S: 1.26 m2
Air humidity: 31.2 % Window mass per unit area: 27.94 kg/m2
Atmospheric pressure: 1.0176 Bar
Receiving room volume: 31.2 m3
Glass Specification: 4 -16 - 4 mm
Source room volume: 343.1 m3
Canopy: n/a
Vent: n/a
Test ID: 713051 Loudspeaker Configuration: L3
Frequency D0.01m,nT
Hz dB
50 18.8
63 29.9
80 20.5
100 23.1 -2
125 20.0 1
160 21.5 4
200 22.8 7
250 18.0 10
315 20.1 13
400 22.5 16
500 18.5 17
630 15.8 18
800 23.6 19
1k 19.2 20
1.25k 18.4 21
1.6k 23.0 21
2k 24.6 21
2.5k 23.2 21
3.15k 20.5 21
4k 19.3
5k 18.2
D0.01m,nT,w(C;Ctr ) 21 (-1; -1) dB
Tested by Building Performance Centre, Napier University, Edinburgh.
Measured D0.01m,nT dB
0.0
10.0
20.0
30.0
40.0
50.0
60.0
63 125 250 500 1k 2k 4kFrequency (Hz)
Sta
nd
ard
ise
d L
eve
l D
iffe
ren
ce
, D
0.0
1m
,nT
(d
B)
Measured values Shifted Reference Curve
N3-7

OPEN/CLOSED WINDOW RESEARCH Defra Research Contract: NANR116
Airborne Sound Insulation. Laboratory measurements with non-diffuse source conditions
Standardised Level Difference. Simulated residential receiver environment
Date: 20/7/2005 Test Sample: Window G Open 0.20 m2
Air temperature: 20.3 ºC Area of window unit, S: 0.54 m2
Air humidity: 31.2 % Window mass per unit area: 33.33 kg/m2
Atmospheric pressure: 1.0032 Bar
Receiving room volume: 31.2 m3
Glass Specification: 4 -16 - 4 mm
Source room volume: 343.1 m3
Canopy: n/a
Vent: n/a
Test ID: 720036 Loudspeaker Configuration: L3
Frequency D0.01m,nT
Hz dB
50 16.8
63 27.7
80 19.2
100 21.3 -10
125 20.4 -7
160 21.7 -4
200 21.1 -1
250 17.7 2
315 17.8 5
400 17.1 8
500 20.3 9
630 19.5 10
800 21.5 11
1k 21.4 12
1.25k 13.3 13
1.6k 14.6 13
2k 8.7 13
2.5k 9.8 13
3.15k 11.4 13
4k 15.4
5k 15.0
D0.01m,nT,w(C;Ctr ) 13 ( 0; 2) dB
Tested by Building Performance Centre, Napier University, Edinburgh.
Measured D0.01m,nT dB
-10.0
0.0
10.0
20.0
30.0
40.0
50.0
63 125 250 500 1k 2k 4kFrequency (Hz)
Sta
nd
ard
ise
d L
eve
l D
iffe
ren
ce
, D
0.0
1m
,nT
(d
B)
Measured values Shifted Reference Curve
N3-8

OPEN/CLOSED WINDOW RESEARCH Defra Research Contract: NANR116
Airborne Sound Insulation. Laboratory measurements with non-diffuse source conditions
Standardised Level Difference. Simulated residential receiver environment
Date: 28/6/2005 Test Sample: Window A-1 Open 0.20 m2
Air temperature: 20.6 ºC Area of window unit, S: 2.52 m2
Air humidity: 31.2 % Window mass per unit area: 30.00 kg/m2
Atmospheric pressure: 1.0091 Bar
Receiving room volume: 31.2 m3
Glass Specification: 4 -16 - 4 mm
Source room volume: 343.1 m3
Canopy: n/a
Vent: n/a
Test ID: 628080 Loudspeaker Configuration: L4
Frequency D0.01m,nT
Hz dB
50 15.6
63 23.8
80 18.2
100 22.1 -3
125 20.4 0
160 17.6 3
200 18.5 6
250 13.2 9
315 15.6 12
400 21.3 15
500 18.8 16
630 16.8 17
800 25.5 18
1k 21.7 19
1.25k 21.9 20
1.6k 18.0 20
2k 21.4 20
2.5k 15.6 20
3.15k 20.5 20
4k 22.1
5k 20.8
D0.01m,nT,w(C;Ctr ) 20 (-1; -1) dB
Tested by Building Performance Centre, Napier University, Edinburgh.
Measured D0.01m,nT dB
0.0
10.0
20.0
30.0
40.0
50.0
60.0
63 125 250 500 1k 2k 4kFrequency (Hz)
Sta
nd
ard
ise
d L
eve
l D
iffe
ren
ce
, D
0.0
1m
,nT
(d
B)
Measured values Shifted Reference Curve
N4-1

OPEN/CLOSED WINDOW RESEARCH Defra Research Contract: NANR116
Airborne Sound Insulation. Laboratory measurements with non-diffuse source conditions
Standardised Level Difference. Simulated residential receiver environment
Date: 5/7/05 Test Sample: Window B Open 0.20 m2
Air temperature: 19.5 ºC Area of window unit, S: 1.26 m2
Air humidity: 31.2 % Window mass per unit area: 27.94 kg/m2
Atmospheric pressure: 0.9981 Bar
Receiving room volume: 31.2 m3
Glass Specification: 4 -16 - 4 mm
Source room volume: 343.1 m3
Canopy: n/a
Vent: n/a
Test ID: 705020 Loudspeaker Configuration: L4
Frequency D0.01m,nT
Hz dB
50 20.5
63 27.1
80 17.5
100 21.2 -7
125 19.4 -4
160 17.3 -1
200 18.0 2
250 19.6 5
315 21.5 8
400 20.7 11
500 17.4 12
630 16.2 13
800 20.6 14
1k 12.6 15
1.25k 16.0 16
1.6k 15.6 16
2k 13.5 16
2.5k 14.1 16
3.15k 16.5 16
4k 20.1
5k 26.5
D0.01m,nT,w(C;Ctr ) 16 (-1; 0) dB
Tested by Building Performance Centre, Napier University, Edinburgh.
Measured D0.01m,nT dB
0.0
10.0
20.0
30.0
40.0
50.0
60.0
63 125 250 500 1k 2k 4kFrequency (Hz)
Sta
nd
ard
ise
d L
eve
l D
iffe
ren
ce
, D
0.0
1m
,nT
(d
B)
Measured values Shifted Reference Curve
N4-2

OPEN/CLOSED WINDOW RESEARCH Defra Research Contract: NANR116
Airborne Sound Insulation. Laboratory measurements with non-diffuse source conditions
Standardised Level Difference. Simulated residential receiver environment
Date: 11/7/05 Test Sample: Window C-2 Open 0.20 m2
Air temperature: 20.6 ºC Area of window unit, S: 0.945 m2
Air humidity: 31.2 % Window mass per unit area: 36.83 kg/m2
Atmospheric pressure: 1.0273 Bar
Receiving room volume: 31.2 m3
Glass Specification: 4 -16 - 4 mm
Source room volume: 343.1 m3
Canopy: Original
Vent: Closed
Test ID: 711063 Loudspeaker Configuration: L4
Frequency D0.01m,nT
Hz dB
50 20.3
63 28.7
80 20.2
100 24.1 -4
125 22.4 -1
160 22.9 2
200 24.3 5
250 20.4 8
315 20.0 11
400 20.6 14
500 23.3 15
630 13.9 16
800 19.6 17
1k 15.6 18
1.25k 10.7 19
1.6k 19.6 19
2k 22.5 19
2.5k 23.3 19
3.15k 23.6 19
4k 24.7
5k 25.4
D0.01m,nT,w(C;Ctr ) 19 (-2; -3) dB
Tested by Building Performance Centre, Napier University, Edinburgh.
Measured D0.01m,nT dB
0.0
10.0
20.0
30.0
40.0
50.0
60.0
63 125 250 500 1k 2k 4kFrequency (Hz)
Sta
nd
ard
ise
d L
eve
l D
iffe
ren
ce
, D
0.0
1m
,nT
(d
B)
Measured values Shifted Reference Curve
N4-3

OPEN/CLOSED WINDOW RESEARCH Defra Research Contract: NANR116
Airborne Sound Insulation. Laboratory measurements with non-diffuse source conditions
Standardised Level Difference. Simulated residential receiver environment
Date: 12/7/05 Test Sample: Window C-3 Open 0.20 m2
Air temperature: 21.1 ºC Area of window unit, S: 0.945 m2
Air humidity: 31.2 % Window mass per unit area: 36.83 kg/m2
Atmospheric pressure: 1.0246 Bar
Receiving room volume: 31.2 m3
Glass Specification: 4 -18 - 6.4(lam) mm
Source room volume: 343.1 m3
Canopy: n/a
Vent: Vent 1 closed
Test ID: 712060 Loudspeaker Configuration: L4
Frequency D0.01m,nT
Hz dB
50 21.7
63 29.9
80 20.9
100 25.8 -5
125 23.6 -2
160 25.5 1
200 26.9 4
250 20.7 7
315 16.7 10
400 19.3 13
500 23.7 14
630 15.9 15
800 18.4 16
1k 18.5 17
1.25k 13.4 18
1.6k 18.4 18
2k 20.2 18
2.5k 17.7 18
3.15k 22.7 18
4k 21.0
5k 26.4
D0.01m,nT,w(C;Ctr ) 18 ( 0; 0) dB
Tested by Building Performance Centre, Napier University, Edinburgh.
Measured D0.01m,nT dB
0.0
10.0
20.0
30.0
40.0
50.0
60.0
63 125 250 500 1k 2k 4kFrequency (Hz)
Sta
nd
ard
ise
d L
eve
l D
iffe
ren
ce
, D
0.0
1m
,nT
(d
B)
Measured values Shifted Reference Curve
N4-4

OPEN/CLOSED WINDOW RESEARCH Defra Research Contract: NANR116
Airborne Sound Insulation. Laboratory measurements with non-diffuse source conditions
Standardised Level Difference. Simulated residential receiver environment
Date: 12/7/05 Test Sample: Window C-4 Open 0.20 m2
Air temperature: 21.1 ºC Area of window unit, S: 0.945 m2
Air humidity: 31.2 % Window mass per unit area: 36.83 kg/m2
Atmospheric pressure: 1.0246 Bar
Receiving room volume: 31.2 m3
Glass Specification: 4 -18 - 6.4(lam) mm
Source room volume: 343.1 m3
Canopy: n/a
Vent: Vent 1 closed
Test ID: 712064 Loudspeaker Configuration: L4
Frequency D0.01m,nT
Hz dB
50 19.6
63 27.8
80 19.5
100 23.9 -4
125 21.9 -1
160 22.6 2
200 24.0 5
250 22.1 8
315 20.8 11
400 18.3 14
500 21.0 15
630 10.7 16
800 17.6 17
1k 16.9 18
1.25k 15.2 19
1.6k 22.7 19
2k 23.9 19
2.5k 20.9 19
3.15k 23.6 19
4k 24.4
5k 26.4
D0.01m,nT,w(C;Ctr ) 19 (-1; -2) dB
Tested by Building Performance Centre, Napier University, Edinburgh.
Measured D0.01m,nT dB
0.0
10.0
20.0
30.0
40.0
50.0
60.0
63 125 250 500 1k 2k 4kFrequency (Hz)
Sta
nd
ard
ise
d L
eve
l D
iffe
ren
ce
, D
0.0
1m
,nT
(d
B)
Measured values Shifted Reference Curve
N4-5

OPEN/CLOSED WINDOW RESEARCH Defra Research Contract: NANR116
Airborne Sound Insulation. Laboratory measurements with non-diffuse source conditions
Standardised Level Difference. Simulated residential receiver environment
Date: 18/7/2005 Test Sample: Window E Open 0.20 m2
Air temperature: 20.3 ºC Area of window unit, S: 0.63 m2
Air humidity: 31.2 % Window mass per unit area: 26.83 kg/m2
Atmospheric pressure: 0.9956 Bar
Receiving room volume: 31.2 m3
Glass Specification: 4 -16 - 4 mm
Source room volume: 343.1 m3
Canopy: n/a
Vent: n/a
Test ID: 718009 Loudspeaker Configuration: L4
Frequency D0.01m,nT
Hz dB
50 22.3
63 30.2
80 21.8
100 24.3 -1
125 22.9 2
160 25.0 5
200 22.5 8
250 16.3 11
315 16.8 14
400 19.1 17
500 19.9 18
630 19.1 19
800 19.3 20
1k 24.4 21
1.25k 21.9 22
1.6k 22.9 22
2k 23.1 22
2.5k 21.2 22
3.15k 23.7 22
4k 22.8
5k 23.7
D0.01m,nT,w(C;Ctr ) 22 (-1; -1) dB
Tested by Building Performance Centre, Napier University, Edinburgh.
Measured D0.01m,nT dB
0.0
10.0
20.0
30.0
40.0
50.0
60.0
63 125 250 500 1k 2k 4kFrequency (Hz)
Sta
nd
ard
ise
d L
eve
l D
iffe
ren
ce
, D
0.0
1m
,nT
(d
B)
Measured values Shifted Reference Curve
N4-6

OPEN/CLOSED WINDOW RESEARCH Defra Research Contract: NANR116
Airborne Sound Insulation. Laboratory measurements with non-diffuse source conditions
Standardised Level Difference. Simulated residential receiver environment
Date: 19/7/2005 Test Sample: Window F Open 0.20 m2
Air temperature: 20.3 ºC Area of window unit, S: 0.63 m2
Air humidity: 31.2 % Window mass per unit area: 26.83 kg/m2
Atmospheric pressure: 1.0023 Bar
Receiving room volume: 31.2 m3
Glass Specification: 4 -16 - 4 mm
Source room volume: 343.1 m3
Canopy: n/a
Vent: n/a
Test ID: 719023 Loudspeaker Configuration: L4
Frequency D0.01m,nT
Hz dB
50 23.1
63 30.0
80 21.7
100 24.4 -3
125 22.6 0
160 24.2 3
200 22.1 6
250 12.7 9
315 16.5 12
400 18.6 15
500 19.5 16
630 19.3 17
800 18.7 18
1k 22.8 19
1.25k 19.7 20
1.6k 21.0 20
2k 21.7 20
2.5k 21.6 20
3.15k 19.9 20
4k 17.5
5k 17.4
D0.01m,nT,w(C;Ctr ) 20 ( 0; 0) dB
Tested by Building Performance Centre, Napier University, Edinburgh.
Measured D0.01m,nT dB
0.0
10.0
20.0
30.0
40.0
50.0
60.0
63 125 250 500 1k 2k 4kFrequency (Hz)
Sta
nd
ard
ise
d L
eve
l D
iffe
ren
ce
, D
0.0
1m
,nT
(d
B)
Measured values Shifted Reference Curve
N4-7

OPEN/CLOSED WINDOW RESEARCH Defra Research Contract: NANR116
Airborne Sound Insulation. Laboratory measurements with non-diffuse source conditions
Standardised Level Difference. Simulated residential receiver environment
Date: 20/7/2005 Test Sample: Window G Open 0.20 m2
Air temperature: 20.3 ºC Area of window unit, S: 0.54 m2
Air humidity: 31.2 % Window mass per unit area: 33.33 kg/m2
Atmospheric pressure: 1.0032 Bar
Receiving room volume: 31.2 m3
Glass Specification: 4 -16 - 4 mm
Source room volume: 343.1 m3
Canopy: n/a
Vent: n/a
Test ID: 720033 Loudspeaker Configuration: L4
Frequency D0.01m,nT
Hz dB
50 22.6
63 29.1
80 20.3
100 23.3 -2
125 21.3 1
160 21.9 4
200 18.8 7
250 21.2 10
315 23.5 13
400 24.7 16
500 24.0 17
630 15.8 18
800 26.7 19
1k 23.5 20
1.25k 21.3 21
1.6k 22.1 21
2k 19.4 21
2.5k 20.6 21
3.15k 20.3 21
4k 22.3
5k 22.6
D0.01m,nT,w(C;Ctr ) 21 ( 0; 0) dB
Tested by Building Performance Centre, Napier University, Edinburgh.
Measured D0.01m,nT dB
0.0
10.0
20.0
30.0
40.0
50.0
60.0
63 125 250 500 1k 2k 4kFrequency (Hz)
Sta
nd
ard
ise
d L
eve
l D
iffe
ren
ce
, D
0.0
1m
,nT
(d
B)
Measured values Shifted Reference Curve
N4-8
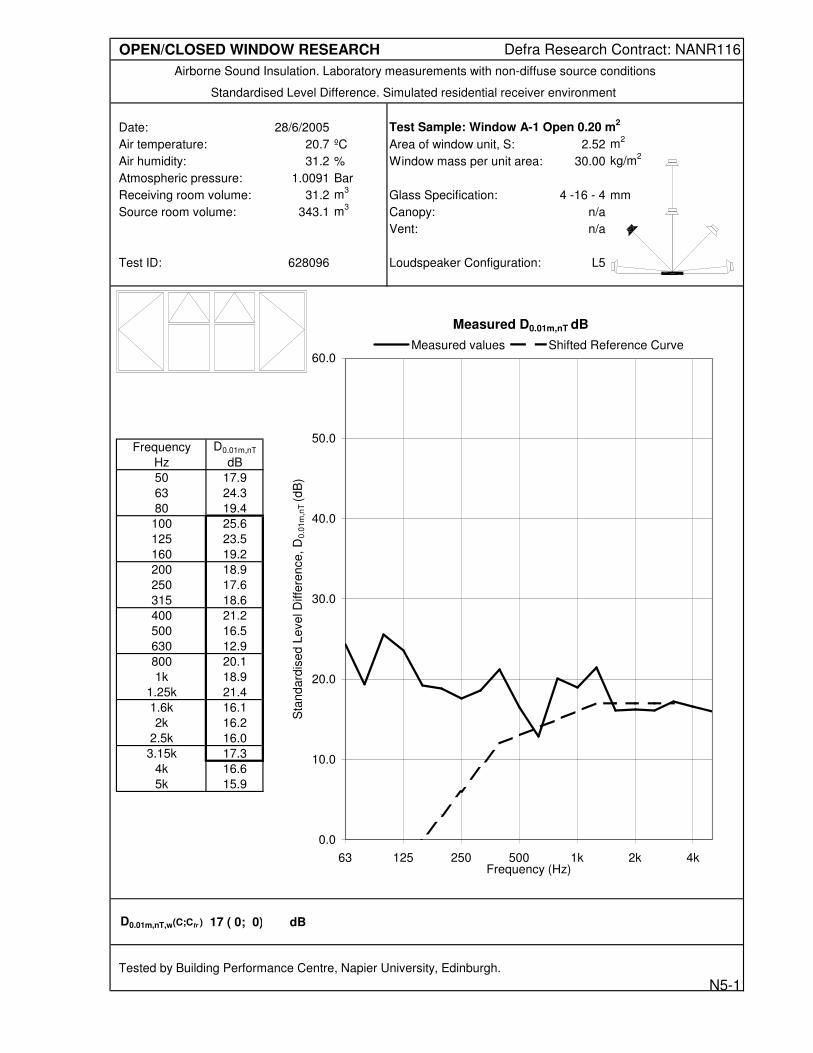
OPEN/CLOSED WINDOW RESEARCH Defra Research Contract: NANR116
Airborne Sound Insulation. Laboratory measurements with non-diffuse source conditions
Standardised Level Difference. Simulated residential receiver environment
Date: 28/6/2005 Test Sample: Window A-1 Open 0.20 m2
Air temperature: 20.7 ºC Area of window unit, S: 2.52 m2
Air humidity: 31.2 % Window mass per unit area: 30.00 kg/m2
Atmospheric pressure: 1.0091 Bar
Receiving room volume: 31.2 m3
Glass Specification: 4 -16 - 4 mm
Source room volume: 343.1 m3
Canopy: n/a
Vent: n/a
Test ID: 628096 Loudspeaker Configuration: L5
Frequency D0.01m,nT
Hz dB
50 17.9
63 24.3
80 19.4
100 25.6 -6
125 23.5 -3
160 19.2 0
200 18.9 3
250 17.6 6
315 18.6 9
400 21.2 12
500 16.5 13
630 12.9 14
800 20.1 15
1k 18.9 16
1.25k 21.4 17
1.6k 16.1 17
2k 16.2 17
2.5k 16.0 17
3.15k 17.3 17
4k 16.6
5k 15.9
D0.01m,nT,w(C;Ctr ) 17 ( 0; 0) dB
Tested by Building Performance Centre, Napier University, Edinburgh.
Measured D0.01m,nT dB
0.0
10.0
20.0
30.0
40.0
50.0
60.0
63 125 250 500 1k 2k 4kFrequency (Hz)
Sta
nd
ard
ise
d L
eve
l D
iffe
ren
ce
, D
0.0
1m
,nT
(d
B)
Measured values Shifted Reference Curve
N5-1

OPEN/CLOSED WINDOW RESEARCH Defra Research Contract: NANR116
Airborne Sound Insulation. Laboratory measurements with non-diffuse source conditions
Standardised Level Difference. Simulated residential receiver environment
Date: 5/7/05 Test Sample: Window B Open 0.20 m2
Air temperature: 19.5 ºC Area of window unit, S: 1.26 m2
Air humidity: 31.2 % Window mass per unit area: 27.94 kg/m2
Atmospheric pressure: 0.998 Bar
Receiving room volume: 31.2 m3
Glass Specification: 4 -16 - 4 mm
Source room volume: 343.1 m3
Canopy: n/a
Vent: n/a
Test ID: 705025 Loudspeaker Configuration: L5
Frequency D0.01m,nT
Hz dB
50 20.4
63 27.2
80 17.3
100 21.2 -6
125 19.6 -3
160 17.6 0
200 18.1 3
250 15.9 6
315 22.6 9
400 21.1 12
500 18.0 13
630 16.2 14
800 20.0 15
1k 15.0 16
1.25k 16.2 17
1.6k 17.0 17
2k 17.1 17
2.5k 15.8 17
3.15k 15.0 17
4k 18.8
5k 25.3
D0.01m,nT,w(C;Ctr ) 17 (-1; 0) dB
Tested by Building Performance Centre, Napier University, Edinburgh.
Measured D0.01m,nT dB
0.0
10.0
20.0
30.0
40.0
50.0
60.0
63 125 250 500 1k 2k 4kFrequency (Hz)
Sta
nd
ard
ise
d L
eve
l D
iffe
ren
ce
, D
0.0
1m
,nT
(d
B)
Measured values Shifted Reference Curve
N5-2
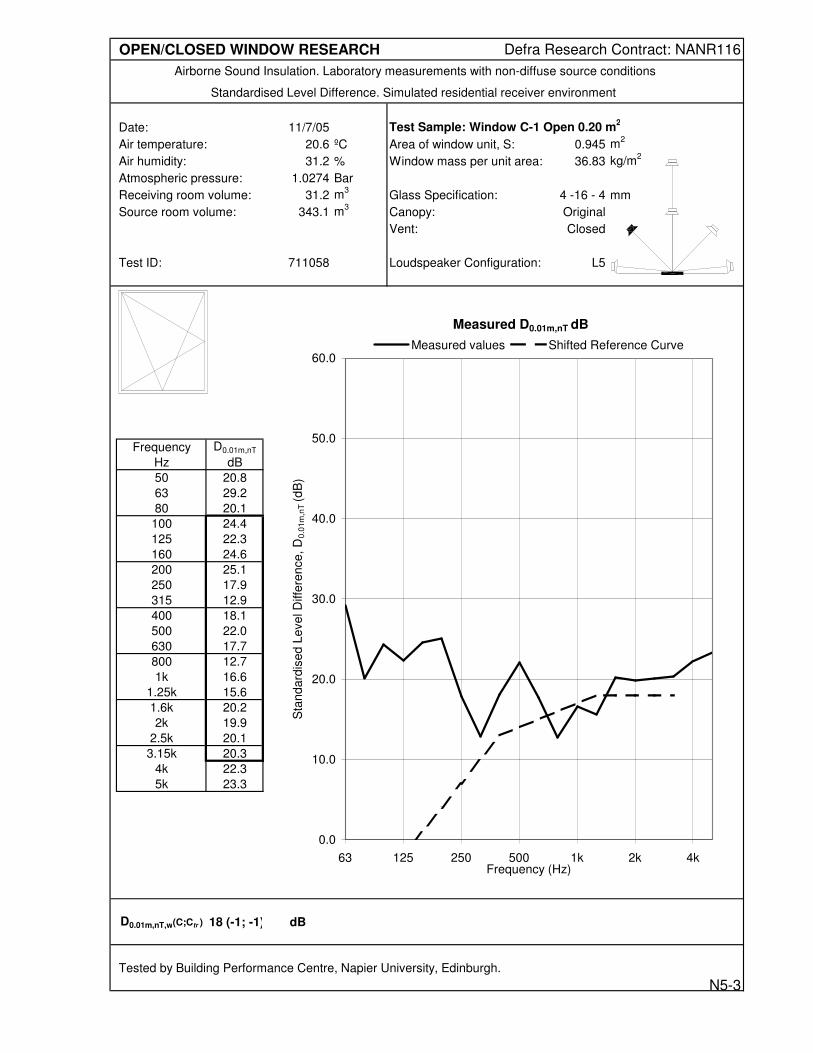
OPEN/CLOSED WINDOW RESEARCH Defra Research Contract: NANR116
Airborne Sound Insulation. Laboratory measurements with non-diffuse source conditions
Standardised Level Difference. Simulated residential receiver environment
Date: 11/7/05 Test Sample: Window C-1 Open 0.20 m2
Air temperature: 20.6 ºC Area of window unit, S: 0.945 m2
Air humidity: 31.2 % Window mass per unit area: 36.83 kg/m2
Atmospheric pressure: 1.0274 Bar
Receiving room volume: 31.2 m3
Glass Specification: 4 -16 - 4 mm
Source room volume: 343.1 m3
Canopy: Original
Vent: Closed
Test ID: 711058 Loudspeaker Configuration: L5
Frequency D0.01m,nT
Hz dB
50 20.8
63 29.2
80 20.1
100 24.4 -5
125 22.3 -2
160 24.6 1
200 25.1 4
250 17.9 7
315 12.9 10
400 18.1 13
500 22.0 14
630 17.7 15
800 12.7 16
1k 16.6 17
1.25k 15.6 18
1.6k 20.2 18
2k 19.9 18
2.5k 20.1 18
3.15k 20.3 18
4k 22.3
5k 23.3
D0.01m,nT,w(C;Ctr ) 18 (-1; -1) dB
Tested by Building Performance Centre, Napier University, Edinburgh.
Measured D0.01m,nT dB
0.0
10.0
20.0
30.0
40.0
50.0
60.0
63 125 250 500 1k 2k 4kFrequency (Hz)
Sta
nd
ard
ise
d L
eve
l D
iffe
ren
ce
, D
0.0
1m
,nT
(d
B)
Measured values Shifted Reference Curve
N5-3

OPEN/CLOSED WINDOW RESEARCH Defra Research Contract: NANR116
Airborne Sound Insulation. Laboratory measurements with non-diffuse source conditions
Standardised Level Difference. Simulated residential receiver environment
Date: 11/7/05 Test Sample: Window C-2 Open 0.20 m2
Air temperature: 20.6 ºC Area of window unit, S: 0.945 m2
Air humidity: 31.2 % Window mass per unit area: 36.83 kg/m2
Atmospheric pressure: 1.0274 Bar
Receiving room volume: 31.2 m3
Glass Specification: 4 -16 - 4 mm
Source room volume: 343.1 m3
Canopy: Original
Vent: Closed
Test ID: 711053 Loudspeaker Configuration: L5
Frequency D0.01m,nT
Hz dB
50 20.7
63 29.0
80 20.5
100 24.3 -5
125 22.4 -2
160 22.9 1
200 22.9 4
250 15.8 7
315 14.5 10
400 18.8 13
500 20.1 14
630 15.7 15
800 14.8 16
1k 16.9 17
1.25k 14.9 18
1.6k 19.3 18
2k 20.2 18
2.5k 20.8 18
3.15k 20.5 18
4k 20.3
5k 24.1
D0.01m,nT,w(C;Ctr ) 18 ( 0; -1) dB
Tested by Building Performance Centre, Napier University, Edinburgh.
Measured D0.01m,nT dB
0.0
10.0
20.0
30.0
40.0
50.0
60.0
63 125 250 500 1k 2k 4kFrequency (Hz)
Sta
nd
ard
ise
d L
eve
l D
iffe
ren
ce
, D
0.0
1m
,nT
(d
B)
Measured values Shifted Reference Curve
N5-4

OPEN/CLOSED WINDOW RESEARCH Defra Research Contract: NANR116
Airborne Sound Insulation. Laboratory measurements with non-diffuse source conditions
Standardised Level Difference. Simulated residential receiver environment
Date: 12/7/05 Test Sample: Window C-4 Open 0.20 m2
Air temperature: 21.1 ºC Area of window unit, S: 0.945 m2
Air humidity: 31.2 % Window mass per unit area: 36.83 kg/m2
Atmospheric pressure: 1.0246 Bar
Receiving room volume: 31.2 m3
Glass Specification: 4 -18 - 6.4(lam) mm
Source room volume: 343.1 m3
Canopy: n/a
Vent: Vent 1 closed
Test ID: 712069 Loudspeaker Configuration: L5
Frequency D0.01m,nT
Hz dB
50 21.6
63 29.5
80 21.1
100 25.3 -5
125 23.3 -2
160 24.0 1
200 23.7 4
250 18.0 7
315 16.4 10
400 18.8 13
500 20.3 14
630 14.8 15
800 16.1 16
1k 16.5 17
1.25k 15.0 18
1.6k 18.6 18
2k 21.9 18
2.5k 19.5 18
3.15k 20.2 18
4k 19.7
5k 25.3
D0.01m,nT,w(C;Ctr ) 18 ( 0; -1) dB
Tested by Building Performance Centre, Napier University, Edinburgh.
Measured D0.01m,nT dB
0.0
10.0
20.0
30.0
40.0
50.0
60.0
63 125 250 500 1k 2k 4kFrequency (Hz)
Sta
nd
ard
ise
d L
eve
l D
iffe
ren
ce
, D
0.0
1m
,nT
(d
B)
Measured values Shifted Reference Curve
N5-5

OPEN/CLOSED WINDOW RESEARCH Defra Research Contract: NANR116
Airborne Sound Insulation. Laboratory measurements with non-diffuse source conditions
Standardised Level Difference. Simulated residential receiver environment
Date: 13/7/2005 Test Sample: Window D-1 Open 0.20 m2
Air temperature: 21.8 ºC Area of window unit, S: 1.26 m2
Air humidity: 31.2 % Window mass per unit area: 27.94 kg/m2
Atmospheric pressure: 1.0176 Bar
Receiving room volume: 31.2 m3
Glass Specification: 4 -16 - 4 mm
Source room volume: 343.1 m3
Canopy: n/a
Vent: n/a
Test ID: 713041 Loudspeaker Configuration: L5
Frequency D0.01m,nT
Hz dB
50 21.4 b
63 28.9
80 19.5
100 23.4 -6
125 21.2 -3
160 23.1 0
200 25.1 3
250 14.3 6
315 16.4 9
400 19.6 12
500 24.0 13
630 18.9 14
800 17.5 15
1k 17.4 16
1.25k 16.2 17
1.6k 19.8 17
2k 10.2 17
2.5k 16.0 17
3.15k 20.8 17
4k 20.3
5k 15.6
D0.01m,nT,w(C;Ctr ) 17 (-1; -1) dB
Tested by Building Performance Centre, Napier University, Edinburgh.
Measured D0.01m,nT dB
0.0
10.0
20.0
30.0
40.0
50.0
60.0
63 125 250 500 1k 2k 4kFrequency (Hz)
Sta
nd
ard
ise
d L
eve
l D
iffe
ren
ce
, D
0.0
1m
,nT
(d
B)
Measured values Shifted Reference Curve
N5-6

OPEN/CLOSED WINDOW RESEARCH Defra Research Contract: NANR116
Airborne Sound Insulation. Laboratory measurements with non-diffuse source conditions
Standardised Level Difference. Simulated residential receiver environment
Date: 13/7/2005 Test Sample: Window D-2 Open 0.20 m2
Air temperature: 21.8 ºC Area of window unit, S: 1.26 m2
Air humidity: 31.2 % Window mass per unit area: 27.94 kg/m2
Atmospheric pressure: 1.018 Bar
Receiving room volume: 31.2 m3
Glass Specification: 4 -16 - 4 mm
Source room volume: 343.1 m3
Canopy: n/a
Vent: n/a
Test ID: 713033 Loudspeaker Configuration: L5
Frequency D0.01m,nT
Hz dB
50 22.0 b
63 28.4
80 19.3
100 22.2 -11
125 19.6 -8
160 19.3 -5
200 18.8 -2
250 11.0 1
315 22.1 4
400 22.7 7
500 19.8 8
630 12.5 9
800 11.7 10
1k 11.2 11
1.25k 14.2 12
1.6k 12.7 12
2k 9.9 12
2.5k 8.8 12
3.15k 12.9 12
4k 18.9
5k 16.1
D0.01m,nT,w(C;Ctr ) 12 ( 0; 1) dB
Tested by Building Performance Centre, Napier University, Edinburgh.
Measured D0.01m,nT dB
-10.0
0.0
10.0
20.0
30.0
40.0
50.0
63 125 250 500 1k 2k 4kFrequency (Hz)
Sta
nd
ard
ise
d L
eve
l D
iffe
ren
ce
, D
0.0
1m
,nT
(d
B)
Measured values Shifted Reference Curve
N5-7
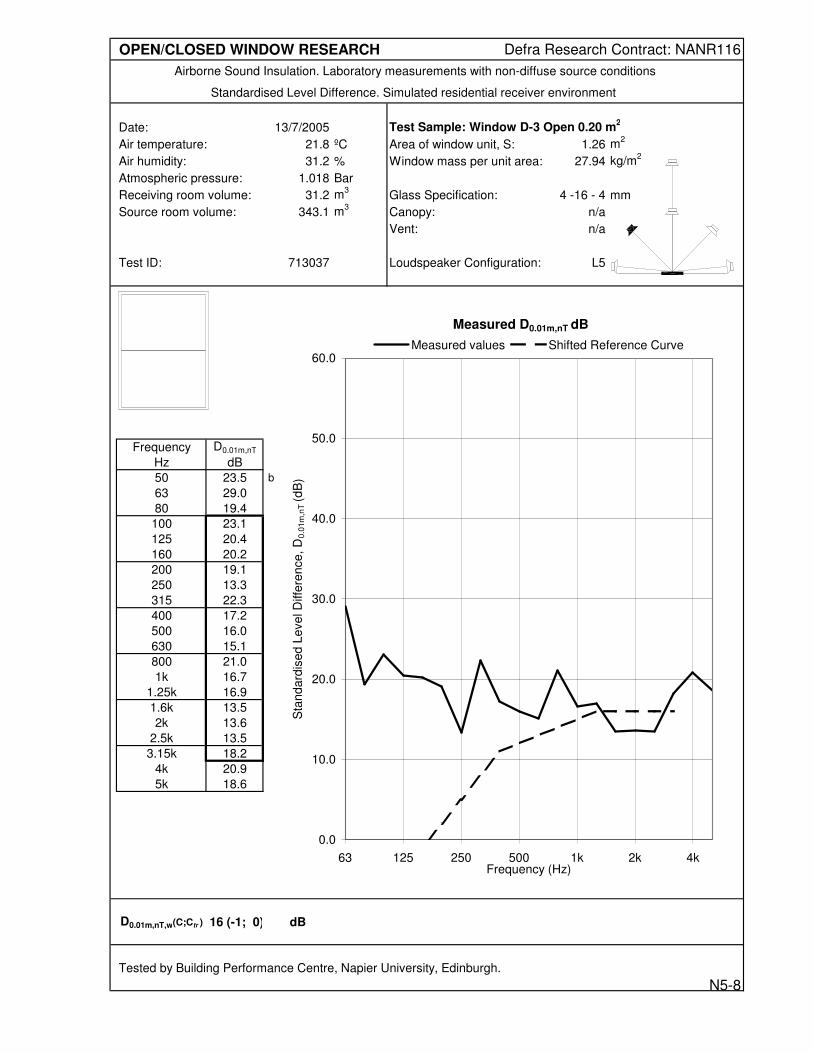
OPEN/CLOSED WINDOW RESEARCH Defra Research Contract: NANR116
Airborne Sound Insulation. Laboratory measurements with non-diffuse source conditions
Standardised Level Difference. Simulated residential receiver environment
Date: 13/7/2005 Test Sample: Window D-3 Open 0.20 m2
Air temperature: 21.8 ºC Area of window unit, S: 1.26 m2
Air humidity: 31.2 % Window mass per unit area: 27.94 kg/m2
Atmospheric pressure: 1.018 Bar
Receiving room volume: 31.2 m3
Glass Specification: 4 -16 - 4 mm
Source room volume: 343.1 m3
Canopy: n/a
Vent: n/a
Test ID: 713037 Loudspeaker Configuration: L5
Frequency D0.01m,nT
Hz dB
50 23.5 b
63 29.0
80 19.4
100 23.1 -7
125 20.4 -4
160 20.2 -1
200 19.1 2
250 13.3 5
315 22.3 8
400 17.2 11
500 16.0 12
630 15.1 13
800 21.0 14
1k 16.7 15
1.25k 16.9 16
1.6k 13.5 16
2k 13.6 16
2.5k 13.5 16
3.15k 18.2 16
4k 20.9
5k 18.6
D0.01m,nT,w(C;Ctr ) 16 (-1; 0) dB
Tested by Building Performance Centre, Napier University, Edinburgh.
Measured D0.01m,nT dB
0.0
10.0
20.0
30.0
40.0
50.0
60.0
63 125 250 500 1k 2k 4kFrequency (Hz)
Sta
nd
ard
ise
d L
eve
l D
iffe
ren
ce
, D
0.0
1m
,nT
(d
B)
Measured values Shifted Reference Curve
N5-8

OPEN/CLOSED WINDOW RESEARCH Defra Research Contract: NANR116
Airborne Sound Insulation. Laboratory measurements with non-diffuse source conditions
Standardised Level Difference. Simulated residential receiver environment
Date: 20/7/2005 Test Sample: Window G Open 0.20 m2
Air temperature: 20.3 ºC Area of window unit, S: 0.54 m2
Air humidity: 31.2 % Window mass per unit area: 33.33 kg/m2
Atmospheric pressure: 1.0032 Bar
Receiving room volume: 31.2 m3
Glass Specification: 4 -16 - 4 mm
Source room volume: 343.1 m3
Canopy: n/a
Vent: n/a
Test ID: 720022 Loudspeaker Configuration: L5
Frequency D0.01m,nT
Hz dB
50 21.6
63 29.0
80 20.1
100 22.0 -3
125 21.4 0
160 21.6 3
200 21.2 6
250 15.3 9
315 19.2 12
400 19.8 15
500 20.0 16
630 19.6 17
800 23.0 18
1k 22.4 19
1.25k 21.0 20
1.6k 18.8 20
2k 18.6 20
2.5k 23.1 20
3.15k 15.6 20
4k 15.3
5k 16.7
D0.01m,nT,w(C;Ctr ) 20 (-1; 0) dB
Tested by Building Performance Centre, Napier University, Edinburgh.
Measured D0.01m,nT dB
0.0
10.0
20.0
30.0
40.0
50.0
60.0
63 125 250 500 1k 2k 4kFrequency (Hz)
Sta
nd
ard
ise
d L
eve
l D
iffe
ren
ce
, D
0.0
1m
,nT
(d
B)
Measured values Shifted Reference Curve
N5-9

OPEN/CLOSED WINDOW RESEARCH Defra Research Contract: NANR116
Airborne Sound Insulation. Laboratory measurements with non-diffuse source conditions
Standardised Level Difference. Simulated residential receiver environment
Date: 28/6/2005 Test Sample: Window A-1 Open 0.20 m2
Air temperature: 20.5 ºC Area of window unit, S: 2.52 m2
Air humidity: 31.2 % Window mass per unit area: 30.00 kg/m2
Atmospheric pressure: 1.0106 Bar
Receiving room volume: 31.2 m3
Glass Specification: 4 -16 - 4 mm
Source room volume: 343.1 m3
Canopy: n/a
Vent: n/a
Test ID: 628032 Loudspeaker Configuration: L6
Frequency D0.01m,nT
Hz dB
50 17.8
63 24.5
80 19.2
100 24.8 -6
125 22.2 -3
160 19.0 0
200 16.2 3
250 14.9 6
315 16.3 9
400 11.5 12
500 19.4 13
630 22.7 14
800 25.5 15
1k 17.8 16
1.25k 17.7 17
1.6k 13.3 17
2k 13.1 17
2.5k 18.8 17
3.15k 22.3 17
4k 20.3
5k 17.7
D0.01m,nT,w(C;Ctr ) 17 (-1; 0) dB
Tested by Building Performance Centre, Napier University, Edinburgh.
Measured D0.01m,nT dB
0.0
10.0
20.0
30.0
40.0
50.0
60.0
63 125 250 500 1k 2k 4kFrequency (Hz)
Sta
nd
ard
ise
d L
eve
l D
iffe
ren
ce
, D
0.0
1m
,nT
(d
B)
Measured values Shifted Reference Curve
N6-1
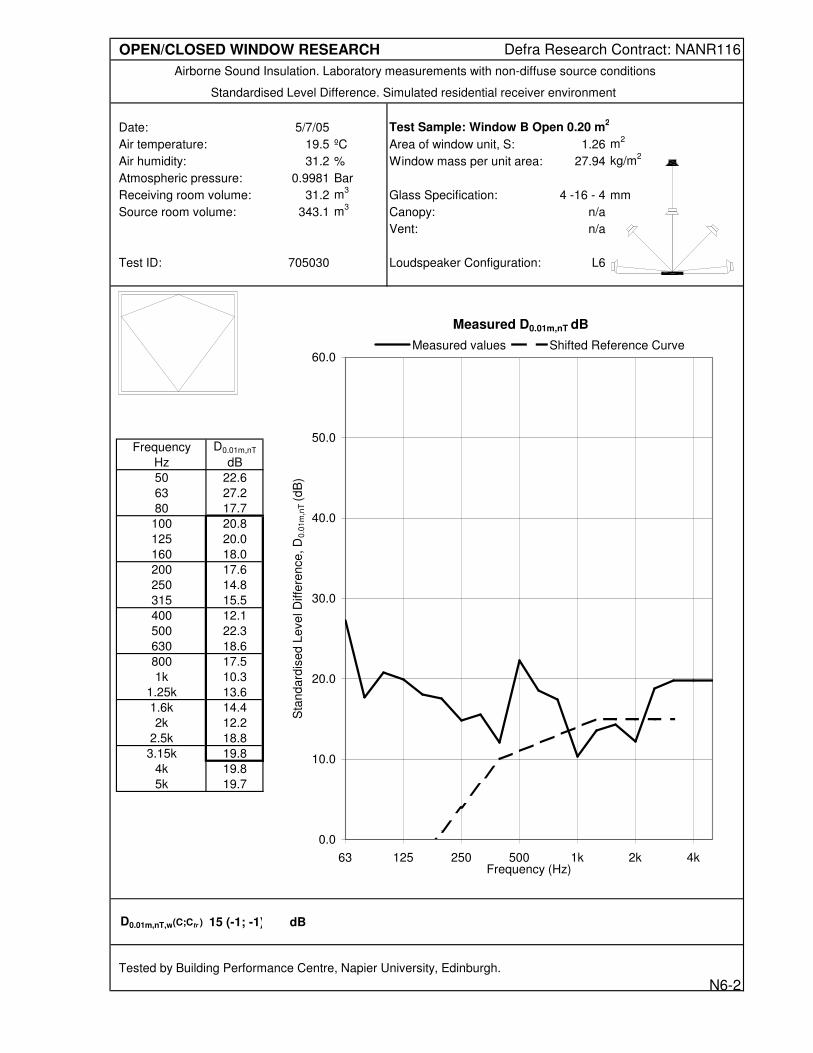
OPEN/CLOSED WINDOW RESEARCH Defra Research Contract: NANR116
Airborne Sound Insulation. Laboratory measurements with non-diffuse source conditions
Standardised Level Difference. Simulated residential receiver environment
Date: 5/7/05 Test Sample: Window B Open 0.20 m2
Air temperature: 19.5 ºC Area of window unit, S: 1.26 m2
Air humidity: 31.2 % Window mass per unit area: 27.94 kg/m2
Atmospheric pressure: 0.9981 Bar
Receiving room volume: 31.2 m3
Glass Specification: 4 -16 - 4 mm
Source room volume: 343.1 m3
Canopy: n/a
Vent: n/a
Test ID: 705030 Loudspeaker Configuration: L6
Frequency D0.01m,nT
Hz dB
50 22.6
63 27.2
80 17.7
100 20.8 -8
125 20.0 -5
160 18.0 -2
200 17.6 1
250 14.8 4
315 15.5 7
400 12.1 10
500 22.3 11
630 18.6 12
800 17.5 13
1k 10.3 14
1.25k 13.6 15
1.6k 14.4 15
2k 12.2 15
2.5k 18.8 15
3.15k 19.8 15
4k 19.8
5k 19.7
D0.01m,nT,w(C;Ctr ) 15 (-1; -1) dB
Tested by Building Performance Centre, Napier University, Edinburgh.
Measured D0.01m,nT dB
0.0
10.0
20.0
30.0
40.0
50.0
60.0
63 125 250 500 1k 2k 4kFrequency (Hz)
Sta
nd
ard
ise
d L
eve
l D
iffe
ren
ce
, D
0.0
1m
,nT
(d
B)
Measured values Shifted Reference Curve
N6-2

OPEN/CLOSED WINDOW RESEARCH Defra Research Contract: NANR116
Airborne Sound Insulation. Laboratory measurements with non-diffuse source conditions
Standardised Level Difference. Simulated residential receiver environment
Date: 11/7/05 Test Sample: Window C-1 Open 0.20 m2
Air temperature: 20.6 ºC Area of window unit, S: 0.945 m2
Air humidity: 31.2 % Window mass per unit area: 36.83 kg/m2
Atmospheric pressure: 1.0278 Bar
Receiving room volume: 31.2 m3
Glass Specification: 4 -16 - 4 mm
Source room volume: 343.1 m3
Canopy: Original
Vent: Closed
Test ID: 711021 Loudspeaker Configuration: L6
Frequency D0.01m,nT
Hz dB
50 24.3 b
63 29.8
80 20.8
100 24.9 -5
125 23.5 -2
160 25.3 1
200 25.4 4
250 26.6 7
315 28.0 10
400 15.8 13
500 14.0 14
630 12.4 15
800 13.8 16
1k 14.2 17
1.25k 16.5 18
1.6k 22.1 18
2k 21.2 18
2.5k 23.8 18
3.15k 24.9 18
4k 23.9
5k 24.6
D0.01m,nT,w(C;Ctr ) 18 (-1; -2) dB
Tested by Building Performance Centre, Napier University, Edinburgh.
Measured D0.01m,nT dB
0.0
10.0
20.0
30.0
40.0
50.0
60.0
63 125 250 500 1k 2k 4kFrequency (Hz)
Sta
nd
ard
ise
d L
eve
l D
iffe
ren
ce
, D
0.0
1m
,nT
(d
B)
Measured values Shifted Reference Curve
N6-3

OPEN/CLOSED WINDOW RESEARCH Defra Research Contract: NANR116
Airborne Sound Insulation. Laboratory measurements with non-diffuse source conditions
Standardised Level Difference. Simulated residential receiver environment
Date: 11/7/05 Test Sample: Window C-2 Open 0.20 m2
Air temperature: 20.6 ºC Area of window unit, S: 0.945 m2
Air humidity: 31.2 % Window mass per unit area: 36.83 kg/m2
Atmospheric pressure: 1.0278 Bar
Receiving room volume: 31.2 m3
Glass Specification: 4 -16 - 4 mm
Source room volume: 343.1 m3
Canopy: Original
Vent: Closed
Test ID: 711025 Loudspeaker Configuration: L6
Frequency D0.01m,nT
Hz dB
50 22.7 b
63 28.8
80 20.4
100 24.1 -6
125 22.9 -3
160 23.7 0
200 23.3 3
250 23.2 6
315 22.7 9
400 15.7 12
500 13.4 13
630 12.5 14
800 13.3 15
1k 14.7 16
1.25k 13.7 17
1.6k 20.1 17
2k 22.3 17
2.5k 22.8 17
3.15k 20.5 17
4k 24.9
5k 24.7
D0.01m,nT,w(C;Ctr ) 17 (-1; -1) dB
Tested by Building Performance Centre, Napier University, Edinburgh.
Measured D0.01m,nT dB
0.0
10.0
20.0
30.0
40.0
50.0
60.0
63 125 250 500 1k 2k 4kFrequency (Hz)
Sta
nd
ard
ise
d L
eve
l D
iffe
ren
ce
, D
0.0
1m
,nT
(d
B)
Measured values Shifted Reference Curve
N6-4

OPEN/CLOSED WINDOW RESEARCH Defra Research Contract: NANR116
Airborne Sound Insulation. Laboratory measurements with non-diffuse source conditions
Standardised Level Difference. Simulated residential receiver environment
Date: 12/7/05 Test Sample: Window C-3 Open 0.20 m2
Air temperature: 21 ºC Area of window unit, S: 0.945 m2
Air humidity: 31.2 % Window mass per unit area: 36.83 kg/m2
Atmospheric pressure: 1.0252 Bar
Receiving room volume: 31.2 m3
Glass Specification: 4 -18 - 6.4(lam) mm
Source room volume: 343.1 m3
Canopy: n/a
Vent: Vent 1 closed
Test ID: 712021 Loudspeaker Configuration: L6
Frequency D0.01m,nT
Hz dB
50 24.5 b
63 30.0
80 21.1
100 25.6 -6
125 24.3 -3
160 26.1 0
200 26.4 3
250 29.4 6
315 28.2 9
400 13.8 12
500 13.8 13
630 12.3 14
800 13.0 15
1k 15.3 16
1.25k 15.7 17
1.6k 22.4 17
2k 22.1 17
2.5k 23.7 17
3.15k 24.3 17
4k 26.3
5k 27.0
D0.01m,nT,w(C;Ctr ) 17 ( 0; -1) dB
Tested by Building Performance Centre, Napier University, Edinburgh.
Measured D0.01m,nT dB
0.0
10.0
20.0
30.0
40.0
50.0
60.0
63 125 250 500 1k 2k 4kFrequency (Hz)
Sta
nd
ard
ise
d L
eve
l D
iffe
ren
ce
, D
0.0
1m
,nT
(d
B)
Measured values Shifted Reference Curve
N6-5

OPEN/CLOSED WINDOW RESEARCH Defra Research Contract: NANR116
Airborne Sound Insulation. Laboratory measurements with non-diffuse source conditions
Standardised Level Difference. Simulated residential receiver environment
Date: 12/7/05 Test Sample: Window C-4 Open 0.20 m2
Air temperature: 21 ºC Area of window unit, S: 0.945 m2
Air humidity: 31.2 % Window mass per unit area: 36.83 kg/m2
Atmospheric pressure: 1.0252 Bar
Receiving room volume: 31.2 m3
Glass Specification: 4 -18 - 6.4(lam) mm
Source room volume: 343.1 m3
Canopy: n/a
Vent: Vent 1 closed
Test ID: 712025 Loudspeaker Configuration: L6
Frequency D0.01m,nT
Hz dB
50 23.0 b
63 29.2
80 20.9
100 24.8 -6
125 23.7 -3
160 24.7 0
200 24.4 3
250 25.5 6
315 24.0 9
400 14.4 12
500 13.5 13
630 12.3 14
800 13.7 15
1k 15.0 16
1.25k 15.9 17
1.6k 20.5 17
2k 22.8 17
2.5k 22.7 17
3.15k 20.4 17
4k 25.4
5k 27.2
D0.01m,nT,w(C;Ctr ) 17 ( 0; -1) dB
Tested by Building Performance Centre, Napier University, Edinburgh.
Measured D0.01m,nT dB
0.0
10.0
20.0
30.0
40.0
50.0
60.0
63 125 250 500 1k 2k 4kFrequency (Hz)
Sta
nd
ard
ise
d L
eve
l D
iffe
ren
ce
, D
0.0
1m
,nT
(d
B)
Measured values Shifted Reference Curve
N6-6

OPEN/CLOSED WINDOW RESEARCH Defra Research Contract: NANR116
Airborne Sound Insulation. Laboratory measurements with non-diffuse source conditions
Standardised Level Difference. Simulated residential receiver environment
Date: 13/7/2005 Test Sample: Window D-1 Open 0.20 m2
Air temperature: 21.8 ºC Area of window unit, S: 1.26 m2
Air humidity: 31.2 % Window mass per unit area: 27.94 kg/m2
Atmospheric pressure: 1.0183 Bar
Receiving room volume: 31.2 m3
Glass Specification: 4 -16 - 4 mm
Source room volume: 343.1 m3
Canopy: n/a
Vent: n/a
Test ID: 713027 Loudspeaker Configuration: L6
Frequency D0.01m,nT
Hz dB
50 23.0 B
63 28.1
80 18.8
100 22.6 -8
125 20.8 -5
160 22.5 -2
200 23.0 1
250 22.2 4
315 11.4 7
400 10.5 10
500 15.2 11
630 15.2 12
800 20.6 13
1k 14.1 14
1.25k 14.2 15
1.6k 14.5 15
2k 14.0 15
2.5k 17.7 15
3.15k 18.3 15
4k 14.1
5k 16.0
D0.01m,nT,w(C;Ctr ) 15 ( 0; 0) dB
Tested by Building Performance Centre, Napier University, Edinburgh.
Measured D0.01m,nT dB
0.0
10.0
20.0
30.0
40.0
50.0
60.0
63 125 250 500 1k 2k 4kFrequency (Hz)
Sta
nd
ard
ise
d L
eve
l D
iffe
ren
ce
, D
0.0
1m
,nT
(d
B)
Measured values Shifted Reference Curve
N6-7

OPEN/CLOSED WINDOW RESEARCH Defra Research Contract: NANR116
Airborne Sound Insulation. Laboratory measurements with non-diffuse source conditions
Standardised Level Difference. Simulated residential receiver environment
Date: 13/7/2005 Test Sample: Window D-2 Open 0.20 m2
Air temperature: 21.8 ºC Area of window unit, S: 1.26 m2
Air humidity: 31.2 % Window mass per unit area: 27.94 kg/m2
Atmospheric pressure: 1.0183 Bar
Receiving room volume: 31.2 m3
Glass Specification: 4 -16 - 4 mm
Source room volume: 343.1 m3
Canopy: n/a
Vent: n/a
Test ID: 713019 Loudspeaker Configuration: L6
Frequency D0.01m,nT
Hz dB
50 24.1 B
63 29.0
80 20.3
100 22.2 -11
125 20.7 -8
160 21.1 -5
200 19.3 -2
250 15.6 1
315 11.8 4
400 8.1 7
500 20.5 8
630 19.3 9
800 15.1 10
1k 9.9 11
1.25k 11.6 12
1.6k 10.3 12
2k 10.6 12
2.5k 14.6 12
3.15k 13.5 12
4k 13.2
5k 14.7
D0.01m,nT,w(C;Ctr ) 12 ( 0; 0) dB
Tested by Building Performance Centre, Napier University, Edinburgh.
Measured D0.01m,nT dB
-10.0
0.0
10.0
20.0
30.0
40.0
50.0
63 125 250 500 1k 2k 4kFrequency (Hz)
Sta
nd
ard
ise
d L
eve
l D
iffe
ren
ce
, D
0.0
1m
,nT
(d
B)
Measured values Shifted Reference Curve
N6-8
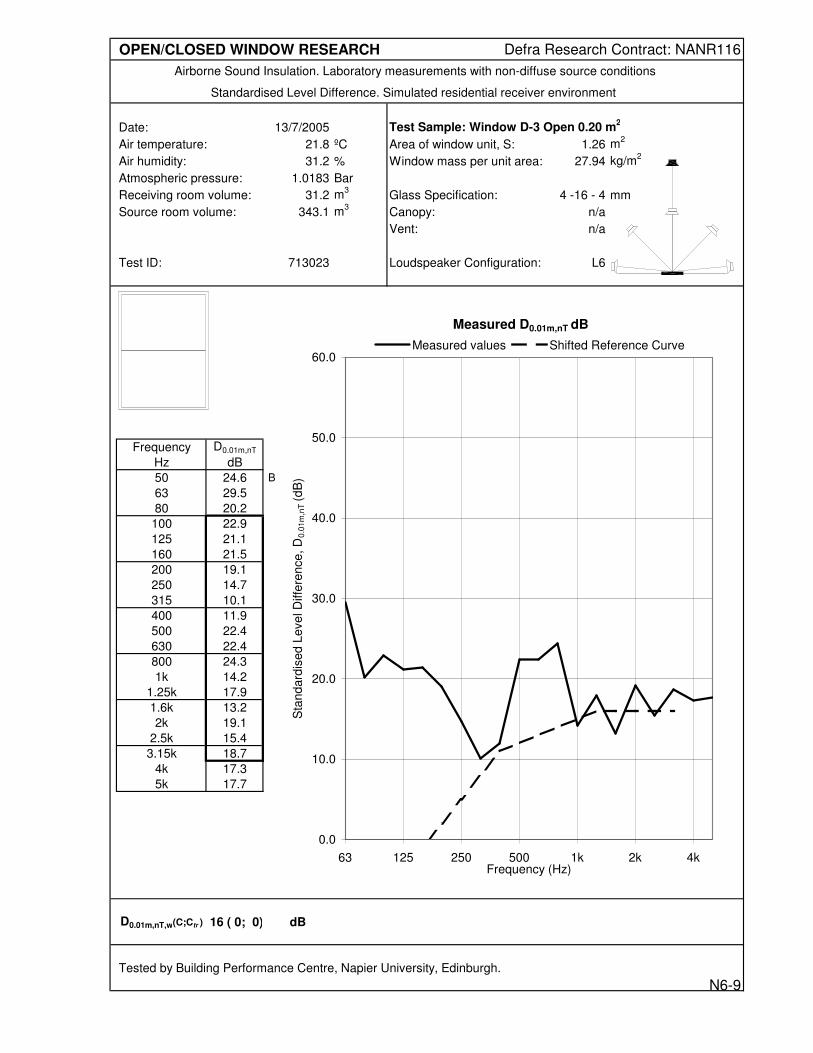
OPEN/CLOSED WINDOW RESEARCH Defra Research Contract: NANR116
Airborne Sound Insulation. Laboratory measurements with non-diffuse source conditions
Standardised Level Difference. Simulated residential receiver environment
Date: 13/7/2005 Test Sample: Window D-3 Open 0.20 m2
Air temperature: 21.8 ºC Area of window unit, S: 1.26 m2
Air humidity: 31.2 % Window mass per unit area: 27.94 kg/m2
Atmospheric pressure: 1.0183 Bar
Receiving room volume: 31.2 m3
Glass Specification: 4 -16 - 4 mm
Source room volume: 343.1 m3
Canopy: n/a
Vent: n/a
Test ID: 713023 Loudspeaker Configuration: L6
Frequency D0.01m,nT
Hz dB
50 24.6 B
63 29.5
80 20.2
100 22.9 -7
125 21.1 -4
160 21.5 -1
200 19.1 2
250 14.7 5
315 10.1 8
400 11.9 11
500 22.4 12
630 22.4 13
800 24.3 14
1k 14.2 15
1.25k 17.9 16
1.6k 13.2 16
2k 19.1 16
2.5k 15.4 16
3.15k 18.7 16
4k 17.3
5k 17.7
D0.01m,nT,w(C;Ctr ) 16 ( 0; 0) dB
Tested by Building Performance Centre, Napier University, Edinburgh.
Measured D0.01m,nT dB
0.0
10.0
20.0
30.0
40.0
50.0
60.0
63 125 250 500 1k 2k 4kFrequency (Hz)
Sta
nd
ard
ise
d L
eve
l D
iffe
ren
ce
, D
0.0
1m
,nT
(d
B)
Measured values Shifted Reference Curve
N6-9

OPEN/CLOSED WINDOW RESEARCH Defra Research Contract: NANR116
Airborne Sound Insulation. Laboratory measurements with non-diffuse source conditions
Standardised Level Difference. Simulated residential receiver environment
Date: 18/7/2005 Test Sample: Window E Open 0.20 m2
Air temperature: 20.4 ºC Area of window unit, S: 0.63 m2
Air humidity: 31.2 % Window mass per unit area: 26.83 kg/m2
Atmospheric pressure: 0.9956 Bar
Receiving room volume: 31.2 m3
Glass Specification: 4 -16 - 4 mm
Source room volume: 343.1 m3
Canopy: n/a
Vent: n/a
Test ID: 718023 Loudspeaker Configuration: L6
Frequency D0.01m,nT
Hz dB
50 22.2
63 30.1
80 20.7
100 24.1 -5
125 22.8 -2
160 24.7 1
200 23.0 4
250 21.7 7
315 19.6 10
400 11.3 13
500 15.5 14
630 19.6 15
800 20.1 16
1k 17.2 17
1.25k 22.4 18
1.6k 25.1 18
2k 22.7 18
2.5k 16.1 18
3.15k 13.2 18
4k 20.1
5k 21.8
D0.01m,nT,w(C;Ctr ) 18 (-1; 0) dB
Tested by Building Performance Centre, Napier University, Edinburgh.
Measured D0.01m,nT dB
0.0
10.0
20.0
30.0
40.0
50.0
60.0
63 125 250 500 1k 2k 4kFrequency (Hz)
Sta
nd
ard
ise
d L
eve
l D
iffe
ren
ce
, D
0.0
1m
,nT
(d
B)
Measured values Shifted Reference Curve
N6-10

OPEN/CLOSED WINDOW RESEARCH Defra Research Contract: NANR116
Airborne Sound Insulation. Laboratory measurements with non-diffuse source conditions
Standardised Level Difference. Simulated residential receiver environment
Date: 19/7/2005 Test Sample: Window F Open 0.20 m2
Air temperature: 19.9 ºC Area of window unit, S: 0.63 m2
Air humidity: 31.2 % Window mass per unit area: 26.83 kg/m2
Atmospheric pressure: 1.0019 Bar
Receiving room volume: 31.2 m3
Glass Specification: 4 -16 - 4 mm
Source room volume: 343.1 m3
Canopy: n/a
Vent: n/a
Test ID: 719006 Loudspeaker Configuration: L6
Frequency D0.01m,nT
Hz dB
50 21.4
63 29.5
80 21.1
100 23.7 -4
125 22.3 -1
160 23.3 2
200 21.7 5
250 20.8 8
315 18.8 11
400 10.5 14
500 15.5 15
630 17.7 16
800 21.7 17
1k 17.4 18
1.25k 24.8 19
1.6k 23.3 19
2k 21.5 19
2.5k 19.5 19
3.15k 21.0 19
4k 19.8
5k 18.2
D0.01m,nT,w(C;Ctr ) 19 ( 0; -1) dB
Tested by Building Performance Centre, Napier University, Edinburgh.
Measured D0.01m,nT dB
0.0
10.0
20.0
30.0
40.0
50.0
60.0
63 125 250 500 1k 2k 4kFrequency (Hz)
Sta
nd
ard
ise
d L
eve
l D
iffe
ren
ce
, D
0.0
1m
,nT
(d
B)
Measured values Shifted Reference Curve
N6-11

OPEN/CLOSED WINDOW RESEARCH Defra Research Contract: NANR116
Airborne Sound Insulation. Laboratory measurements with non-diffuse source conditions
Standardised Level Difference. Simulated residential receiver environment
Date: 28/6/2005 Test Sample: Window A-1 Open 0.20 m2
Air temperature: 20.7 ºC Area of window unit, S: 2.52 m2
Air humidity: 31.2 % Window mass per unit area: 30.00 kg/m2
Atmospheric pressure: 1.009 Bar
Receiving room volume: 31.2 m3
Glass Specification: 4 -16 - 4 mm
Source room volume: 343.1 m3
Canopy: n/a
Vent: n/a
Test ID: 628112 Loudspeaker Configuration: Line
Frequency D0.01m,nT
Hz dB
50 17.4
63 24.5
80 18.7
100 25.2 -5
125 22.1 -2
160 18.1 1
200 18.6 4
250 18.8 7
315 21.3 10
400 23.3 13
500 24.9 14
630 19.0 15
800 24.8 16
1k 19.0 17
1.25k 14.7 18
1.6k 13.5 18
2k 15.5 18
2.5k 17.7 18
3.15k 22.9 18
4k 19.7
5k 15.3
D0.01m,nT,w(C;Ctr ) 18 (-1; 0) dB
Tested by Building Performance Centre, Napier University, Edinburgh.
Measured D0.01m,nT dB
0.0
10.0
20.0
30.0
40.0
50.0
60.0
63 125 250 500 1k 2k 4kFrequency (Hz)
Sta
nd
ard
ise
d L
eve
l D
iffe
ren
ce
, D
0.0
1m
,nT
(d
B)
Measured values Shifted Reference Curve
N7-1

OPEN/CLOSED WINDOW RESEARCH Defra Research Contract: NANR116
Airborne Sound Insulation. Laboratory measurements with non-diffuse source conditions
Standardised Level Difference. Simulated residential receiver environment
Date: 5/7/05 Test Sample: Window B Open 0.20 m2
Air temperature: 19.5 ºC Area of window unit, S: 1.26 m2
Air humidity: 31.2 % Window mass per unit area: 27.94 kg/m2
Atmospheric pressure: 0.9982 Bar
Receiving room volume: 31.2 m3
Glass Specification: 4 -16 - 4 mm
Source room volume: 343.1 m3
Canopy: n/a
Vent: n/a
Test ID: 705035 Loudspeaker Configuration: Line
Frequency D0.01m,nT
Hz dB
50 20.7
63 27.3
80 17.4
100 21.1 -8
125 18.5 -5
160 15.6 -2
200 15.7 1
250 17.9 4
315 22.3 7
400 24.4 10
500 21.8 11
630 17.5 12
800 20.6 13
1k 17.2 14
1.25k 16.2 15
1.6k 14.8 15
2k 10.7 15
2.5k 10.0 15
3.15k 15.6 15
4k 19.3
5k 18.5
D0.01m,nT,w(C;Ctr ) 15 (-1; 1) dB
Tested by Building Performance Centre, Napier University, Edinburgh.
Measured D0.01m,nT dB
0.0
10.0
20.0
30.0
40.0
50.0
60.0
63 125 250 500 1k 2k 4kFrequency (Hz)
Sta
nd
ard
ise
d L
eve
l D
iffe
ren
ce
, D
0.0
1m
,nT
(d
B)
Measured values Shifted Reference Curve
N7-2

OPEN/CLOSED WINDOW RESEARCH Defra Research Contract: NANR116
Airborne Sound Insulation. Laboratory measurements with non-diffuse source conditions
Standardised Level Difference. Simulated residential receiver environment
Date: 11/7/05 Test Sample: Window C-1 Open 0.20 m2
Air temperature: 20.7 ºC Area of window unit, S: 0.945 m2
Air humidity: 31.2 % Window mass per unit area: 36.83 kg/m2
Atmospheric pressure: 1.0272 Bar
Receiving room volume: 31.2 m3
Glass Specification: 4 -16 - 4 mm
Source room volume: 343.1 m3
Canopy: Original
Vent: Closed
Test ID: 711072 Loudspeaker Configuration: Line
Frequency D0.01m,nT
Hz dB
50 21.2
63 29.1
80 20.1
100 24.4 -4
125 22.4 -1
160 24.2 2
200 25.9 5
250 15.6 8
315 14.3 11
400 17.6 14
500 23.2 15
630 19.7 16
800 12.2 17
1k 17.7 18
1.25k 18.9 19
1.6k 17.9 19
2k 20.7 19
2.5k 20.8 19
3.15k 23.5 19
4k 23.3
5k 21.5
D0.01m,nT,w(C;Ctr ) 19 (-1; -2) dB
Tested by Building Performance Centre, Napier University, Edinburgh.
Measured D0.01m,nT dB
0.0
10.0
20.0
30.0
40.0
50.0
60.0
63 125 250 500 1k 2k 4kFrequency (Hz)
Sta
nd
ard
ise
d L
eve
l D
iffe
ren
ce
, D
0.0
1m
,nT
(d
B)
Measured values Shifted Reference Curve
N7-3

OPEN/CLOSED WINDOW RESEARCH Defra Research Contract: NANR116
Airborne Sound Insulation. Laboratory measurements with non-diffuse source conditions
Standardised Level Difference. Simulated residential receiver environment
Date: 11/7/05 Test Sample: Window C-2 Open 0.20 m2
Air temperature: 20.7 ºC Area of window unit, S: 0.945 m2
Air humidity: 31.2 % Window mass per unit area: 36.83 kg/m2
Atmospheric pressure: 1.0272 Bar
Receiving room volume: 31.2 m3
Glass Specification: 4 -16 - 4 mm
Source room volume: 343.1 m3
Canopy: Original
Vent: Closed
Test ID: 711076 Loudspeaker Configuration: Line
Frequency D0.01m,nT
Hz dB
50 19.4
63 27.4
80 19.1
100 23.1 -4
125 21.3 -1
160 21.9 2
200 22.8 5
250 17.0 8
315 18.6 11
400 17.5 14
500 19.0 15
630 14.8 16
800 13.4 17
1k 16.9 18
1.25k 15.5 19
1.6k 22.1 19
2k 22.7 19
2.5k 20.2 19
3.15k 24.7 19
4k 25.5
5k 24.6
D0.01m,nT,w(C;Ctr ) 19 (-1; -2) dB
Tested by Building Performance Centre, Napier University, Edinburgh.
Measured D0.01m,nT dB
0.0
10.0
20.0
30.0
40.0
50.0
60.0
63 125 250 500 1k 2k 4kFrequency (Hz)
Sta
nd
ard
ise
d L
eve
l D
iffe
ren
ce
, D
0.0
1m
,nT
(d
B)
Measured values Shifted Reference Curve
N7-4

OPEN/CLOSED WINDOW RESEARCH Defra Research Contract: NANR116
Airborne Sound Insulation. Laboratory measurements with non-diffuse source conditions
Standardised Level Difference. Simulated residential receiver environment
Date: 12/7/05 Test Sample: Window C-3 Open 0.20 m2
Air temperature: 20.9 ºC Area of window unit, S: 0.945 m2
Air humidity: 31.2 % Window mass per unit area: 36.83 kg/m2
Atmospheric pressure: 1.0254 Bar
Receiving room volume: 31.2 m3
Glass Specification: 4 -18 - 6.4(lam) mm
Source room volume: 343.1 m3
Canopy: n/a
Vent: Vent 1 closed
Test ID: 712008 Loudspeaker Configuration: Line
Frequency D0.01m,nT
Hz dB
50 22.1
63 29.5
80 20.5
100 25.2 -3
125 23.1 0
160 25.7 3
200 26.5 6
250 19.3 9
315 16.9 12
400 18.8 15
500 25.0 16
630 20.3 17
800 12.1 18
1k 17.8 19
1.25k 20.3 20
1.6k 18.9 20
2k 25.1 20
2.5k 21.4 20
3.15k 24.3 20
4k 20.7
5k 22.8
D0.01m,nT,w(C;Ctr ) 20 (-1; -2) dB
Tested by Building Performance Centre, Napier University, Edinburgh.
Measured D0.01m,nT dB
0.0
10.0
20.0
30.0
40.0
50.0
60.0
63 125 250 500 1k 2k 4kFrequency (Hz)
Sta
nd
ard
ise
d L
eve
l D
iffe
ren
ce
, D
0.0
1m
,nT
(d
B)
Measured values Shifted Reference Curve
N7-5

OPEN/CLOSED WINDOW RESEARCH Defra Research Contract: NANR116
Airborne Sound Insulation. Laboratory measurements with non-diffuse source conditions
Standardised Level Difference. Simulated residential receiver environment
Date: 12/7/05 Test Sample: Window C-4 Open 0.20 m2
Air temperature: 20.9 ºC Area of window unit, S: 0.945 m2
Air humidity: 31.2 % Window mass per unit area: 36.83 kg/m2
Atmospheric pressure: 1.0254 Bar
Receiving room volume: 31.2 m3
Glass Specification: 4 -18 - 6.4(lam) mm
Source room volume: 343.1 m3
Canopy: n/a
Vent: Vent 1 closed
Test ID: 712012 Loudspeaker Configuration: Line
Frequency D0.01m,nT
Hz dB
50 20.4
63 27.8
80 19.5
100 23.9 -4
125 22.0 -1
160 22.8 2
200 23.1 5
250 19.2 8
315 18.9 11
400 20.2 14
500 23.8 15
630 16.7 16
800 13.1 17
1k 17.2 18
1.25k 17.9 19
1.6k 21.8 19
2k 24.7 19
2.5k 20.4 19
3.15k 19.1 19
4k 23.8
5k 25.2
D0.01m,nT,w(C;Ctr ) 19 (-1; -1) dB
Tested by Building Performance Centre, Napier University, Edinburgh.
Measured D0.01m,nT dB
0.0
10.0
20.0
30.0
40.0
50.0
60.0
63 125 250 500 1k 2k 4kFrequency (Hz)
Sta
nd
ard
ise
d L
eve
l D
iffe
ren
ce
, D
0.0
1m
,nT
(d
B)
Measured values Shifted Reference Curve
N7-6

OPEN/CLOSED WINDOW RESEARCH Defra Research Contract: NANR116
Airborne Sound Insulation. Laboratory measurements with non-diffuse source conditions
Standardised Level Difference. Simulated residential receiver environment
Date: 13/7/2005 Test Sample: Window D-1 Open 0.20 m2
Air temperature: 21.8 ºC Area of window unit, S: 1.26 m2
Air humidity: 31.2 % Window mass per unit area: 27.94 kg/m2
Atmospheric pressure: 1.0174 Bar
Receiving room volume: 31.2 m3
Glass Specification: 4 -16 - 4 mm
Source room volume: 343.1 m3
Canopy: n/a
Vent: n/a
Test ID: 713069 Loudspeaker Configuration: Line
Frequency D0.01m,nT
Hz dB
50 21.9
63 28.9
80 19.5
100 23.6 -8
125 20.9 -5
160 23.0 -2
200 26.1 1
250 13.7 4
315 16.3 7
400 18.5 10
500 20.7 11
630 11.5 12
800 13.4 13
1k 17.4 14
1.25k 13.9 15
1.6k 13.6 15
2k 15.9 15
2.5k 14.2 15
3.15k 16.6 15
4k 13.2
5k 17.2
D0.01m,nT,w(C;Ctr ) 15 ( 0; 0) dB
Tested by Building Performance Centre, Napier University, Edinburgh.
Measured D0.01m,nT dB
0.0
10.0
20.0
30.0
40.0
50.0
60.0
63 125 250 500 1k 2k 4kFrequency (Hz)
Sta
nd
ard
ise
d L
eve
l D
iffe
ren
ce
, D
0.0
1m
,nT
(d
B)
Measured values Shifted Reference Curve
N7-7

OPEN/CLOSED WINDOW RESEARCH Defra Research Contract: NANR116
Airborne Sound Insulation. Laboratory measurements with non-diffuse source conditions
Standardised Level Difference. Simulated residential receiver environment
Date: 13/7/2005 Test Sample: Window D-2 Open 0.20 m2
Air temperature: 21.8 ºC Area of window unit, S: 1.26 m2
Air humidity: 31.2 % Window mass per unit area: 27.94 kg/m2
Atmospheric pressure: 1.0175 Bar
Receiving room volume: 31.2 m3
Glass Specification: 4 -16 - 4 mm
Source room volume: 343.1 m3
Canopy: n/a
Vent: n/a
Test ID: 713061 Loudspeaker Configuration: Line
Frequency D0.01m,nT
Hz dB
50 22.4
63 28.3
80 19.2
100 22.2 -11
125 19.2 -8
160 19.0 -5
200 17.9 -2
250 12.8 1
315 22.0 4
400 20.5 7
500 15.2 8
630 7.0 9
800 12.0 10
1k 15.2 11
1.25k 14.5 12
1.6k 12.0 12
2k 11.0 12
2.5k 8.1 12
3.15k 12.7 12
4k 13.4
5k 15.4
D0.01m,nT,w(C;Ctr ) 12 (-1; 0) dB
Tested by Building Performance Centre, Napier University, Edinburgh.
Measured D0.01m,nT dB
-10.0
0.0
10.0
20.0
30.0
40.0
50.0
63 125 250 500 1k 2k 4kFrequency (Hz)
Sta
nd
ard
ise
d L
eve
l D
iffe
ren
ce
, D
0.0
1m
,nT
(d
B)
Measured values Shifted Reference Curve
N7-8
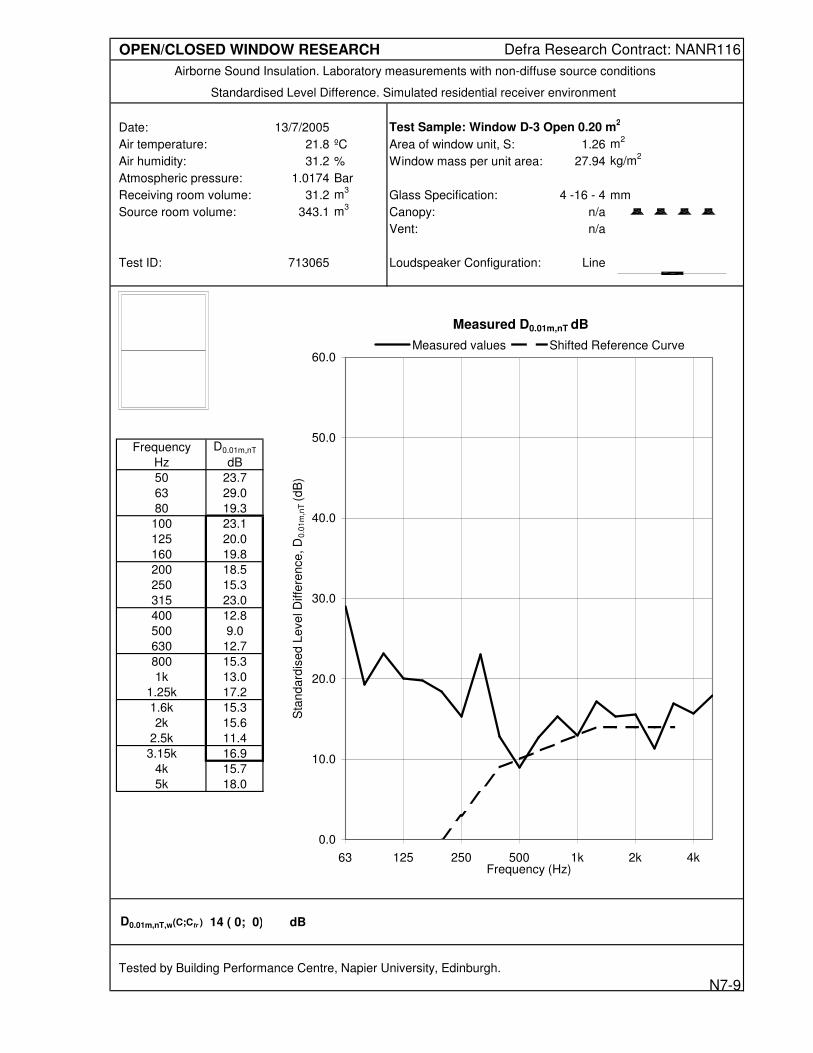
OPEN/CLOSED WINDOW RESEARCH Defra Research Contract: NANR116
Airborne Sound Insulation. Laboratory measurements with non-diffuse source conditions
Standardised Level Difference. Simulated residential receiver environment
Date: 13/7/2005 Test Sample: Window D-3 Open 0.20 m2
Air temperature: 21.8 ºC Area of window unit, S: 1.26 m2
Air humidity: 31.2 % Window mass per unit area: 27.94 kg/m2
Atmospheric pressure: 1.0174 Bar
Receiving room volume: 31.2 m3
Glass Specification: 4 -16 - 4 mm
Source room volume: 343.1 m3
Canopy: n/a
Vent: n/a
Test ID: 713065 Loudspeaker Configuration: Line
Frequency D0.01m,nT
Hz dB
50 23.7
63 29.0
80 19.3
100 23.1 -9
125 20.0 -6
160 19.8 -3
200 18.5 0
250 15.3 3
315 23.0 6
400 12.8 9
500 9.0 10
630 12.7 11
800 15.3 12
1k 13.0 13
1.25k 17.2 14
1.6k 15.3 14
2k 15.6 14
2.5k 11.4 14
3.15k 16.9 14
4k 15.7
5k 18.0
D0.01m,nT,w(C;Ctr ) 14 ( 0; 0) dB
Tested by Building Performance Centre, Napier University, Edinburgh.
Measured D0.01m,nT dB
0.0
10.0
20.0
30.0
40.0
50.0
60.0
63 125 250 500 1k 2k 4kFrequency (Hz)
Sta
nd
ard
ise
d L
eve
l D
iffe
ren
ce
, D
0.0
1m
,nT
(d
B)
Measured values Shifted Reference Curve
N7-9

OPEN/CLOSED WINDOW RESEARCH Defra Research Contract: NANR116
Airborne Sound Insulation. Laboratory measurements with non-diffuse source conditions
Standardised Level Difference. Simulated residential receiver environment
Date: 18/7/2005 Test Sample: Window E Open 0.20 m2
Air temperature: 20.5 ºC Area of window unit, S: 0.63 m2
Air humidity: 31.2 % Window mass per unit area: 26.83 kg/m2
Atmospheric pressure: 0.9959 Bar
Receiving room volume: 31.2 m3
Glass Specification: 4 -16 - 4 mm
Source room volume: 343.1 m3
Canopy: n/a
Vent: n/a
Test ID: 718034 Loudspeaker Configuration: Line
Frequency D0.01m,nT
Hz dB
50 24.2
63 30.4
80 20.9
100 24.9 -3
125 23.2 0
160 25.5 3
200 24.0 6
250 13.4 9
315 15.5 12
400 17.1 15
500 21.5 16
630 21.6 17
800 19.4 18
1k 14.2 19
1.25k 23.0 20
1.6k 22.1 20
2k 22.4 20
2.5k 21.0 20
3.15k 14.7 20
4k 16.8
5k 22.0
D0.01m,nT,w(C;Ctr ) 20 (-2; -2) dB
Tested by Building Performance Centre, Napier University, Edinburgh.
Measured D0.01m,nT dB
0.0
10.0
20.0
30.0
40.0
50.0
60.0
63 125 250 500 1k 2k 4kFrequency (Hz)
Sta
nd
ard
ise
d L
eve
l D
iffe
ren
ce
, D
0.0
1m
,nT
(d
B)
Measured values Shifted Reference Curve
N7-10

OPEN/CLOSED WINDOW RESEARCH Defra Research Contract: NANR116
Airborne Sound Insulation. Laboratory measurements with non-diffuse source conditions
Standardised Level Difference. Simulated residential receiver environment
Date: 19/7/2005 Test Sample: Window F Open 0.20 m2
Air temperature: 20.1 ºC Area of window unit, S: 0.63 m2
Air humidity: 31.2 % Window mass per unit area: 26.83 kg/m2
Atmospheric pressure: 1.0023 Bar
Receiving room volume: 31.2 m3
Glass Specification: 4 -16 - 4 mm
Source room volume: 343.1 m3
Canopy: n/a
Vent: n/a
Test ID: 719009 Loudspeaker Configuration: Line
Frequency D0.01m,nT
Hz dB
50 23.2
63 29.9
80 21.6
100 24.4 -4
125 22.6 -1
160 24.4 2
200 22.5 5
250 13.7 8
315 15.6 11
400 17.8 14
500 22.0 15
630 21.9 16
800 19.3 17
1k 18.9 18
1.25k 21.6 19
1.6k 18.0 19
2k 17.2 19
2.5k 14.8 19
3.15k 19.5 19
4k 18.6
5k 17.1
D0.01m,nT,w(C;Ctr ) 19 (-1; 0) dB
Tested by Building Performance Centre, Napier University, Edinburgh.
Measured D0.01m,nT dB
0.0
10.0
20.0
30.0
40.0
50.0
60.0
63 125 250 500 1k 2k 4kFrequency (Hz)
Sta
nd
ard
ise
d L
eve
l D
iffe
ren
ce
, D
0.0
1m
,nT
(d
B)
Measured values Shifted Reference Curve
N7-11

OPEN/CLOSED WINDOW RESEARCH Defra Research Contract: NANR116
Airborne Sound Insulation. Laboratory measurements with non-diffuse source conditions
Standardised Level Difference. Simulated residential receiver environment
Date: 20/7/2005 Test Sample: Window G Open 0.20 m2
Air temperature: 20.3 ºC Area of window unit, S: 0.54 m2
Air humidity: 31.2 % Window mass per unit area: 33.33 kg/m2
Atmospheric pressure: 1.0032 Bar
Receiving room volume: 31.2 m3
Glass Specification: 4 -16 - 4 mm
Source room volume: 343.1 m3
Canopy: n/a
Vent: n/a
Test ID: 720009 Loudspeaker Configuration: Line
Frequency D0.01m,nT
Hz dB
50 22.6
63 29.1
80 20.2
100 22.8 -4
125 21.2 -1
160 20.9 2
200 18.7 5
250 19.2 8
315 21.7 11
400 21.4 14
500 22.6 15
630 20.3 16
800 26.4 17
1k 22.8 18
1.25k 16.9 19
1.6k 14.6 19
2k 18.0 19
2.5k 21.9 19
3.15k 14.9 19
4k 13.3
5k 20.1
D0.01m,nT,w(C;Ctr ) 19 (-1; 0) dB
Tested by Building Performance Centre, Napier University, Edinburgh.
Measured D0.01m,nT dB
0.0
10.0
20.0
30.0
40.0
50.0
60.0
63 125 250 500 1k 2k 4kFrequency (Hz)
Sta
nd
ard
ise
d L
eve
l D
iffe
ren
ce
, D
0.0
1m
,nT
(d
B)
Measured values Shifted Reference Curve
N7-12