a guide to standardised tests - gl-assessment.co.uk · learned in school, ... choose to use...
TRANSCRIPT
A guide to standardised
tests
gl-assessment.co.uk
Introduction
GL Assessment is the leading provider of assessments to UK schools.
Through building close relationships and forging lasting partnerships, we specialise in developing and providing a comprehensive range of assessments and services to schools around the world. Today, we lead literacy, numeracy and ability testing in UK schools and operate in over 100 countries worldwide. We have pioneered e-assessment and delivered over 7 million online tests, giving teachers accurate and speedy insights to help them maximise every student’s achievement.
We’ve developed this guide to give you an overview of standardised tests, how they’re developed, how to interpret results, and how your school can benefit from the data produced from using standardised assessments.
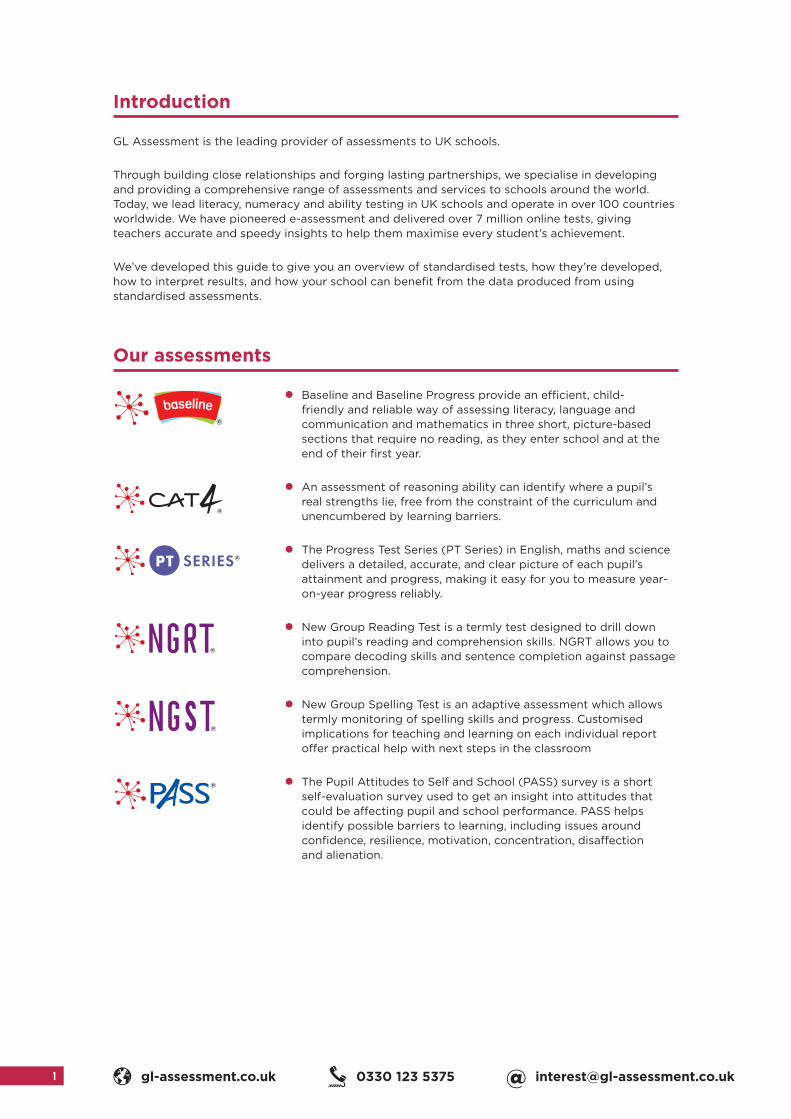
Our assessments
• Baseline and Baseline Progress provide an efficient, child-friendly and reliable way of assessing literacy, language and communication and mathematics in three short, picture-based sections that require no reading, as they enter school and at the end of their first year.
• An assessment of reasoning ability can identify where a pupil’s real strengths lie, free from the constraint of the curriculum and unencumbered by learning barriers.
• The Progress Test Series (PT Series) in English, maths and science delivers a detailed, accurate, and clear picture of each pupil’s attainment and progress, making it easy for you to measure year-on-year progress reliably.
• New Group Reading Test is a termly test designed to drill down into pupil’s reading and comprehension skills. NGRT allows you to compare decoding skills and sentence completion against passage comprehension.
• New Group Spelling Test is an adaptive assessment which allows termly monitoring of spelling skills and progress. Customised implications for teaching and learning on each individual report offer practical help with next steps in the classroom
• The Pupil Attitudes to Self and School (PASS) survey is a short self-evaluation survey used to get an insight into attitudes that could be affecting pupil and school performance. PASS helps identify possible barriers to learning, including issues around confidence, resilience, motivation, concentration, disaffection and alienation.
gl-assessment.co.uk 0330 123 5375 [email protected] 1

Standardised tests require all test takers to answer the same questions in the same way, and are scored in a consistent manner, which makes it possible to compare the relative performance of pupils or groups of pupils.
Many assessment experts consider standardised tests to be a fair and objective method of assessing pupils, because the standardised format reduces the potential for favouritism, bias, or subjective evaluations.
Standardised tests are used for a number of educational purposes, for example, they may be used to determine what a child knows and can do on entry into school or to identify pupils who need special education support. At GL Assessment, we offer two kinds of standardised test:
• Abilities test, such as the Cognitive Abilities Test (CAT4) www.gl-assessment.co.uk/CAT4, are designed to predict a pupil’s ability to succeed in an academic endeavour by evaluating verbal, non-verbal, quantitative and spatial ability. Abilities tests are ‘forward looking’ in that they predict how well pupils will do in the future based on their abilities which support academic progress, such as types of reasoning. General cognitive ability is the single strongest predictor of how well a child will do in their GCSEs.
• Attainment test such as the Progress Test Series www.gl-assessment.co.uk/PTSeries, are designed to measure the knowledge and skills from key areas of the curriculum pupils have learned in school, or to determine the progress they have made over a period of time. The tests may also be used to evaluate the effectiveness of a school and teachers, which is the case with Key Stage 2 national tests and GCSEs. Attainment tests are ‘backward looking’ in that they measure how well pupils have learned what they were expected to learn.
Why use standardised tests?
Schools and Multi-Academy Trusts (MATs) or school groups choose to use standardised tests to ensure consistency of assessment across the school or schools and to gain important insight into how pupils and schools are performing in relation to other schools nationally. School leaders are able to benchmark a school’s performance nationally against other schools by using standardised tests. Standardised tests are used as part of an assessment regime alongside tests of curriculum knowledge, understanding and in-class teacher assessment as well as the outcomes from national tests, such as those at the end of Key Stage 2.
What are standardised tests?
Abilities tests are designed to indicate a pupil’s propensity to succeed at school, while attainment tests measure the curriculum knowledge and skills acquired.
Standardised tests measure performance relative to all other pupils taking the same test.
gl-assessment.co.uk 0330 123 5375 [email protected] 2

What are the benefits of standardised tests?
There are a number of benefits to using standardised tests within schools or groups of schools:
• Identify areas where a pupil or group of pupils is strong or requires additional support; can be applied to improve teaching and learning.
• Provide a more reliable comparison of the test outcomes than non-standardised tests
• Provide quantifiable measures, such as Standard Age Scores (SAS) and indicative prediction of Key Stage 2 national test or GCSE performance
• Indicate how a pupil or groups of pupils have performed in relation to others nationally
• Use at regular intervals over time, allowing progress to be tracked in an effective and objective way
• Used to measure the impact of interventions. For example, NGRT can be used to measure reading age before and after an intervention and thereby provide evidence of the impact of the intervention
What are the limitations of standardised tests?
Standardised tests form part of an effective assessment system, but they cannot measure everything. For this reason standardised tests are best used alongside regular in-class formative feedback about what a pupil knows or can do.
• Any test will reflect a pupil’s performance at a point in time, and this may be affected by factors such as tiredness or illness
• Some pupils with Special Educational Needs (SEN) may be unable to access particular tests
• Some pupils with very high attainment will reach the “ceiling” of a static test so the information from the test is not that helpful to the teacher
NGRT can be used to objectively measure reading age before and after an intervention and thereby provide evidence of the impact of the intervention.
gl-assessment.co.uk 0330 123 5375 [email protected] 3
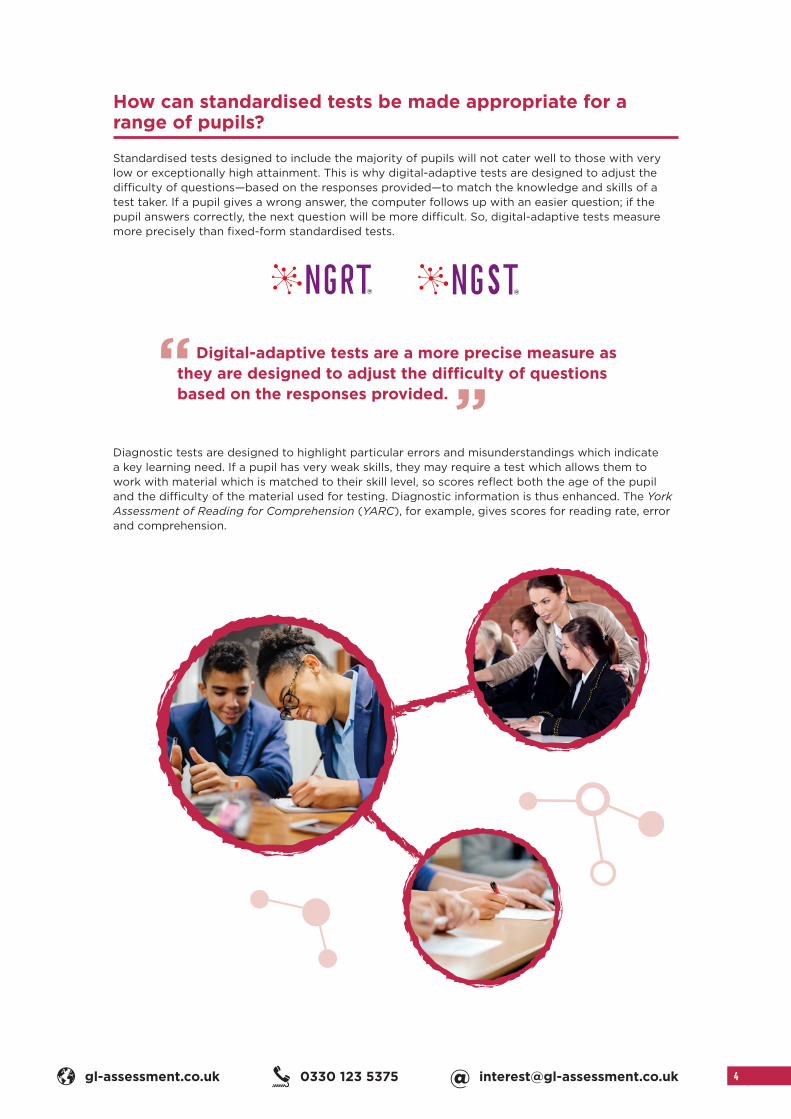
Digital-adaptive tests are a more precise measure as they are designed to adjust the difficulty of questions based on the responses provided.
How can standardised tests be made appropriate for a range of pupils?
Standardised tests designed to include the majority of pupils will not cater well to those with very low or exceptionally high attainment. This is why digital-adaptive tests are designed to adjust the difficulty of questions—based on the responses provided—to match the knowledge and skills of a test taker. If a pupil gives a wrong answer, the computer follows up with an easier question; if the pupil answers correctly, the next question will be more difficult. So, digital-adaptive tests measure more precisely than fixed-form standardised tests.
Diagnostic tests are designed to highlight particular errors and misunderstandings which indicate a key learning need. If a pupil has very weak skills, they may require a test which allows them to work with material which is matched to their skill level, so scores reflect both the age of the pupil and the difficulty of the material used for testing. Diagnostic information is thus enhanced. The York Assessment of Reading for Comprehension (YARC), for example, gives scores for reading rate, error and comprehension.
gl-assessment.co.uk 0330 123 5375 [email protected] 4

The Standard Age Score (SAS) is a recognised benchmark to measure against a national sample of pupils of the same age.
How are standardised tests developed?
Standardised tests are developed in a very structured way to ensure that they have validity (they test what they claim to test or the results predict future behaviour) and reliability (the test gives the same or similar results repeatedly over time). The rigorous development process can take between two and four years to complete and involves a number of stages and experts.
1 Design a test framework (for curriculum tests, this samples the knowledge and skills to be assessed)
2 Write a large number of content questions
3 Trial questions with pupils in schools
4 Reject questions that perform badly in trialling
5 Develop tests for a standardisation trial
6 Conduct the standardisation trial with a statistically significant and nationally representative sample of pupils
7 Develop the norm-referenced measures (such as age-standardised scores and percentiles) to enable comparison of pupil or school performance to performance nationally.
How are standardised test results described?
Raw score: The raw score is the total number or points or marks the pupil has scored on the test. Standardised tests convert raw scores, for example 33 out of 50, to scores on a readily understandable scale, a normal distribution curve.
Standard Age Score: A Standard Age Score converts a pupil’s raw score to a standardised score which takes into account the pupil’s age in years and months and gives an indication of how the pupil is performing relative to a national sample of pupils of the same age. The average score is 100. A higher score is above average and a lower score is below average. The SAS is key to benchmarking and tracking progress and is the fairest way to compare performance of different pupils within a year group or across a year group.
Stanine: The stanine places the pupil’s score on a scale of 1 (low) to 9 (high) and offers a broad overview of performance.
Confidence bands: The confidence band is an indication of the range within which a pupil’s score lies. The narrower the band the more reliable the score. Reliability values range from 0 to 1, with 0.9 being very high and 90% confidence bands showing strong reliability. This means that on 9 out of 10 occasions, the true value of the score is within the score band. Reliability can be determined by testing and re-testing a group of pupils and seeing how well the scores correlate between the two testing occasions.
Group Rank (GR): Group Rank shows how each pupil has performed in comparison to those in the group.
gl-assessment.co.uk 0330 123 5375 [email protected] 5
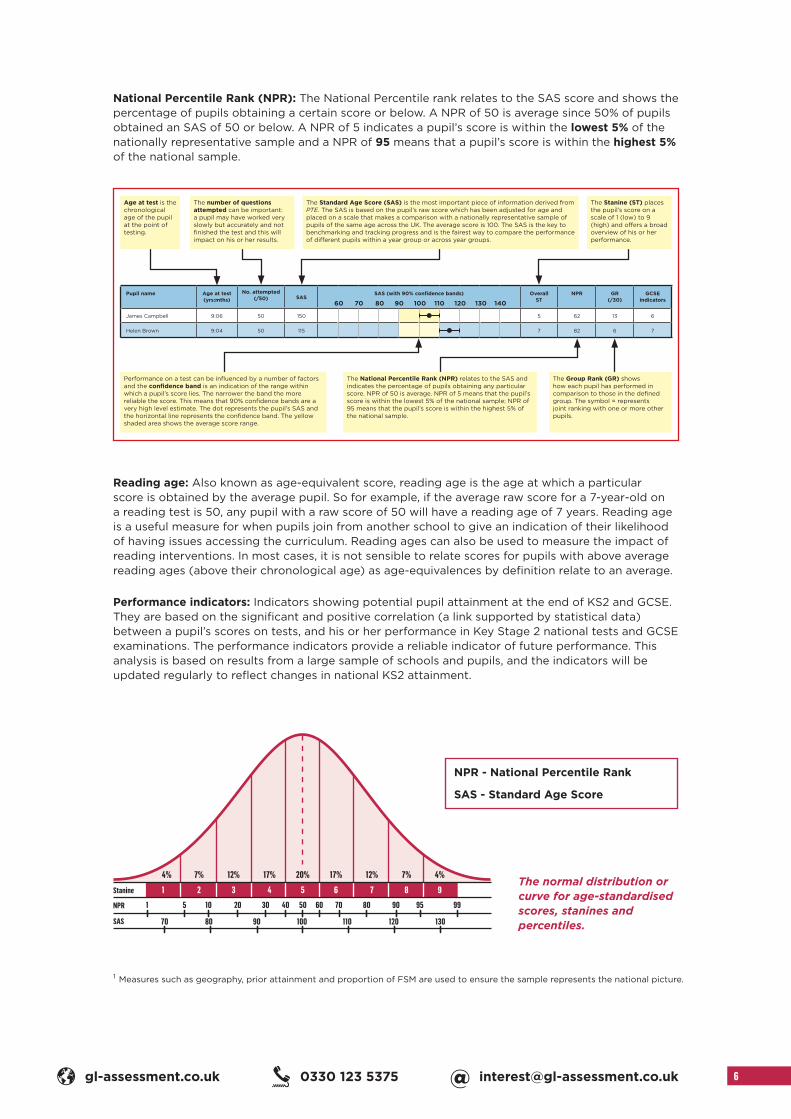
National Percentile Rank (NPR): The National Percentile rank relates to the SAS score and shows the percentage of pupils obtaining a certain score or below. A NPR of 50 is average since 50% of pupils obtained an SAS of 50 or below. A NPR of 5 indicates a pupil’s score is within the lowest 5% of the nationally representative sample and a NPR of 95 means that a pupil’s score is within the highest 5% of the national sample.
Reading age: Also known as age-equivalent score, reading age is the age at which a particular score is obtained by the average pupil. So for example, if the average raw score for a 7-year-old on a reading test is 50, any pupil with a raw score of 50 will have a reading age of 7 years. Reading age is a useful measure for when pupils join from another school to give an indication of their likelihood of having issues accessing the curriculum. Reading ages can also be used to measure the impact of reading interventions. In most cases, it is not sensible to relate scores for pupils with above average reading ages (above their chronological age) as age-equivalences by definition relate to an average.
Performance indicators: Indicators showing potential pupil attainment at the end of KS2 and GCSE. They are based on the significant and positive correlation (a link supported by statistical data) between a pupil’s scores on tests, and his or her performance in Key Stage 2 national tests and GCSE examinations. The performance indicators provide a reliable indicator of future performance. This analysis is based on results from a large sample of schools and pupils, and the indicators will be updated regularly to reflect changes in national KS2 attainment.
Performance on a test can be influenced by a number of factors and the confidence band is an indication of the range within which a pupil’s score lies. The narrower the band the more reliable the score. This means that 90% confidence bands are a very high level estimate. The dot represents the pupil’s SAS and the horizontal line represents the confidence band. The yellow shaded area shows the average score range.
The National Percentile Rank (NPR) relates to the SAS and indicates the percentage of pupils obtaining any particular score. NPR of 50 is average. NPR of 5 means that the pupil’s score is within the lowest 5% of the national sample; NPR of 95 means that the pupil’s score is within the highest 5% of the national sample.
Pupil name Age at test (yrs:mths)
No. attempted (/50) SAS
SAS (with 90% confidence bands) Overall ST
NPR GR (/30)
GCSE indicators
James Campbell 9:06 50 150 5 62 13 6
Helen Brown 9:04 50 115 7 82 6 7
Age at test is the chronological age of the pupil at the point of testing.
The number of questions attempted can be important: a pupil may have worked very slowly but accurately and not finished the test and this will impact on his or her results.
The Stanine (ST) places the pupil’s score on a scale of 1 (low) to 9 (high) and offers a broad overview of his or her performance.
The Standard Age Score (SAS) is the most important piece of information derived from PTE. The SAS is based on the pupil’s raw score which has been adjusted for age and placed on a scale that makes a comparison with a nationally representative sample of pupils of the same age across the UK. The average score is 100. The SAS is the key to benchmarking and tracking progress and is the fairest way to compare the performance of different pupils within a year group or across year groups.
60 70 80 90 100 110 120 130 140
The Group Rank (GR) shows how each pupil has performed in comparison to those in the defined group. The symbol = represents joint ranking with one or more other pupils.
The normal distribution or curve for age-standardised scores, stanines and percentiles.
4% 7% 12% 17% 20% 17% 12% 7% 4%
1 2 3 4 5 6 7 8 9
1 5 10 20 30 40 50 60 70 80 90 95 99
70 80 90 100 110 120 130
Stanine
NPR
SAS
NPR - National Percentile Rank
SAS - Standard Age Score
1 Measures such as geography, prior attainment and proportion of FSM are used to ensure the sample represents the national picture.
gl-assessment.co.uk 0330 123 5375 [email protected] 6

GL Assessment,
1st Floor Vantage London,
Great West Road,
Brentford,
TW8 9AG
GL
20
87
Baseline®, Cognitive Abilities Test: Fourth Edition® (CAT4), Progress Test Series® (PT Series), New Group Reading Test® (NGRT), New Group Spelling Test® (NGST) and Pupil Attitudes to Self and School® survey (PASS) are registered trademarks of the GL Education Group.
0330 123 5375
gl-assessment.co.uk