ssangyong motor company and subsidiaries
TRANSCRIPT

SSANGYONG MOTOR COMPANY AND SUBSIDIARIES Consolidated Financial Statements
December 31, 2018 and 2017 (With Independent Auditors’ Report Thereon)

Contents Page Independent Auditors’ Report 1 Consolidated Statements of Financial Position 5 Consolidated Statements of Comprehensive Loss 7 Consolidated Statements of Changes in Equity 8 Consolidated Statements of Cash Flows 10 Notes to the Consolidated Financial Statements 11

Independent Auditors’ Report
Based on a report originally issued in Korean
The Board of Directors and Shareholders Ssangyong Motor Company Opinion We have audited the accompanying consolidated financial statements of Ssangyong Motor Company and its subsidiaries (“the Group”), which comprise the consolidated statements of financial position as of December 31, 2018 and 2017, the consolidated statements of comprehensive loss, changes in equity and cash flows for the years then ended, and notes, comprising significant accounting policies and other explanatory information. In our opinion, the accompanying consolidated financial statements present fairly, in all material respects, the consolidated financial position of the Group as of December 31, 2018 and 2017, and its consolidated financial performance and its consolidated cash flows for the years then ended in accordance with Korean International Financial Reporting Standards (“K-IFRS”). Basis for Opinion We conducted our audits in accordance with Korean Standards on Auditing (KSAs). Our responsibilities under those standards are further described in the Auditors’ Responsibilities for the Audit of the Consolidated Financial Statements section of our report. We are independent of the Group in accordance with the ethical requirements that are relevant to our audit of the consolidated financial statements in Republic of Korea, and we have fulfilled our other ethical responsibilities in accordance with these requirements. We believe that the audit evidence we have obtained is sufficient and appropriate to provide a basis for our opinion. Key Audit Matters Key audit matters are those matters that, in our professional judgment, were of most significance in our audit of the consolidated financial statements as of and for the year ended December 31, 2018. These matters were addressed in the context of our audit of the consolidated financial statements as a whole, and in forming our opinion thereon, and we do not provide a separate opinion on these matters. Going concern assumption As described in note 35, the Group incurred operating losses during the years ended December 31, 2018 and 2017, with operating losses of W 64,176 million (Rs 4,032 million) and net losses of W 61,838 million (Rs 3,885 million) for the year ended December 31, 2018. As of December 31, 2018, the Group’s current liabilities exceeded current assets by W 424,050 million (Rs 26,639 million) and the debt ratio was 218 percent. Considering the financial conditions of the Group, we determined that events or conditions exist that may cast significant doubt on the Group’s ability to continue as going concern. As determining whether a material uncertainty exists related to the identified events or conditions that may cast significant doubt on the Group’s ability to continue as a going concern requires significant auditor attention, we identified the going concern as a key audit matter. The primary procedures we performed to address the key audit matter included: • We evaluated the overall feasibility of the Group’s plan for new capital increases, additional borrowings and the extension of the maturity of short-term borrowings for the next twelve months from the end of the reporting period. • We evaluated whether the plan was realized after the management’s assessment and also considered whether additional facts or information have become available up to the date of the auditor’s report. • We assessed whether the disclosure of the Group is adequate.

Revenue recognition As described in note 2.(4) and 31, the Group generates profits by selling finished vehicles and then selling parts and providing maintenance activities. For sales of finished vehicles and sales of parts, revenue is recognized when control is transferred to the customer. Revenue from maintenance activities is recognized at the time the maintenance activity is completed to the customer. We identified revenue recognition as a key audit matter, because there is a significant inherent risk that sales may be recognized before the revenue recognition conditions are met and that there is a risk that the revenue is overstated due to external pressure on financial performance as the revenue is one of the key performance indicators for the Group's executive directors. The primary procedures we performed to address the key audit matter included: • We evaluated the effectiveness of the design and operation of the Group's IT system general control and IT application controls related to revenue recognition. • On a sampling basis, we vouched the sales transactions to supporting documents, to evaluate whether the Group has recognized the relevant revenue in accordance with the requirements of the relevant accounting standards and the Group’s accounting policies. • Selected sales transactions recorded immediately before and after the reporting date and vouched to the supporting documents to assess whether revenue is recognized in an appropriate accounting period. Possibility of impairment of tangible and intangible assets As described in note 3.(11) and 3.(12), the Group reviews for indication of asset impairment at each reporting date, and estimates the recoverable amount of the asset to determine the amount of the impairment loss if there is any indication of asset impairment. When the recoverable amount of an individual asset cannot be estimated, the Group estimates the recoverable amount of the cash-generating unit to which the asset belongs. Impairment indicator existed as the PBR, stock price divided by net asset value per share, is less than 1 and the Group has incurred continuous operating losses. Considering the significant degree of the judgment in estimating the value in use of the Group used in the impairment testing for non-financial assets which requires significant auditor attention, we identified the impairment of non-financial assets as a key audit matter. The primary procedures we performed to address the key audit matter included: • We evaluated whether the Group’s personnel who performed the impairment testing had sufficient understanding of the underlying assets. • We assessed whether the input data for estimation of the projected future cash flows have been appropriately approved and compared the key financial information used in the discounted cash flow projections with the approved financial information. • We evaluated the reasonableness of the Group’s methodology to estimate the value in use for impairment testing. • We have assessed whether there are significant errors in the key assumptions applied to discounted cash flow projections such as projected sales and discount rates. Other matters The procedures and practices utilized in the Republic of Korea to audits such consolidated financial statements may differ from those generally accepted and applied in other countries. The accompanying consolidated financial statements as of and for the years ended December 31, 2018 and 2017 have been translated into Indian rupees solely for the convenience of the reader. We have audited the translation and, in our opinion, the consolidated financial statements expressed in Korean won have been translated into rupees on the basis set forth in note 2.(1) to the consolidated financial statements.

Responsibilities of Management and Those Charged with Governance for the Consolidated Financial Statements Management is responsible for the preparation and fair presentation of the consolidated financial statements in accordance with K-IFRS, and for such internal control as management determines is necessary to enable the preparation of consolidated financial statements that are free from material misstatement, whether due to fraud or error. In preparing the consolidated financial statements, management is responsible for assessing the Group’s ability to continue as a going concern, disclosing, as applicable, matters related to going concern and using the going concern basis of accounting unless management either intends to liquidate the Group or to cease operations, or has no realistic alternative but to do so. Those charged with governance are responsible for overseeing the Group’s financial reporting process. Auditors’ Responsibilities for the Audit of the Consolidated Financial Statements Our objectives are to obtain reasonable assurance about whether the consolidated financial statements as a whole are free from material misstatement, whether due to fraud or error, and to issue an auditors’ report that includes our opinion. Reasonable assurance is a high level of assurance, but is not a guarantee that an audit conducted in accordance with KSAs will always detect a material misstatement when it exists. Misstatements can arise from fraud or error and are considered material if, individually or in the aggregate, they could reasonably be expected to influence the economic decisions of users taken on the basis of these consolidated financial statements. As part of an audit in accordance with KSAs, we exercise professional judgment and maintain professional skepticism throughout the audit. We also: • Identify and assess the risks of material misstatement of the consolidated financial statements, whether due to fraud or error, design and perform audit procedures responsive to those risks, and obtain audit evidence that is sufficient and appropriate to provide a basis for our opinion. The risk of not detecting a material misstatement resulting from fraud is higher than for one resulting from error, as fraud may involve collusion, forgery, intentional omissions, misrepresentations, or the override of internal control. • Obtain an understanding of internal control relevant to the audit in order to design audit procedures that are appropriate in the circumstances, but not for the purpose of expressing an opinion on the effectiveness of the Group’s internal control. • Evaluate the appropriateness of accounting policies used in the preparation of the consolidated financial statements and the reasonableness of accounting estimates and related disclosures made by management. • Conclude on the appropriateness of management’s use of the going concern basis of accounting and, based on the audit evidence obtained, whether a material uncertainty exists related to events or conditions that may cast significant doubt on the Group’s ability to continue as a going concern. If we conclude that a material uncertainty exists, we are required to draw attention in our auditors’ report to the related disclosures in the consolidated financial statements or, if such disclosures are inadequate, to modify our opinion. Our conclusions are based on the audit evidence obtained up to the date of our auditors’ report. However, future events or conditions may cause the Group to cease to continue as a going concern. • Evaluate the overall presentation, structure and content of the consolidated financial statements, including the disclosures, and whether the consolidated financial statements represent the underlying transactions and events in a manner that achieves fair presentation.

• Obtain sufficient appropriate audit evidence regarding the financial information of the entities or business activities within the Group to express an opinion on the consolidated financial statements. We are responsible for the direction, supervision and performance of the group audit. We remain solely responsible for our audit opinion. We communicate with those charged with governance regarding, among other matters, the planned scope and timing of the audit and significant audit findings, including any significant deficiencies in internal control that we identify during our audit. We also provide those charged with governance with a statement that we have complied with relevant ethical requirements regarding independence, and communicate with them all relationships and other matters that may reasonably be thought to bear on our independence, and where applicable, related safeguards. From the matters communicated with those charged with governance, we determine those matters that were of most significance in the audit of the consolidated financial statements of the current period and are therefore the key audit matters. We describe these matters in our auditors’ report unless law or regulation precludes public disclosure about the matter or when, in extremely rare circumstances, we determine that a matter should not be communicated in our report because the adverse consequences of doing so would reasonably be expected to outweigh the public interest benefits of such communication. The engagement partner on the audit resulting in this independent auditors’ report is Sang-Min, Nam.
Seoul, Korea March 12, 2019
This report is effective as of March 12, 2019, the audits report date. Certain subsequent events or circumstances, which may occur between the audits report date and the time of reading this report, could have a material impact on the consolidated financial statements and notes thereto. Accordingly, the readers of the audit report should understand that the above audit report has not been updated to reflect the impact of such subsequent events or circumstances, if any.

SSANGYONG MOTOR COMPANY AND SUBSIDIARIES Consolidated Statements of Financial Position As of December 31, 2018 and 2017
5
(In thousands of won and in thousands of rupee) Korean won Indian rupee Note 2018 2017 2018 2017 Assets Cash and cash equivalents 4,5,33 W 156,062,657 215,443,730 Rs 9,803,856 13,534,175 Trade and other receivables, net 7,32,33 174,203,955 203,824,819 10,943,492 12,804,274 Derivative assets 25,33 891,319 - 55,993 - Inventories, net 8,24 228,612,470 228,374,429 14,361,435 14,346,482 Other current assets 10 11,299,802 7,548,242 709,854 474,181 Total current assets 571,070,203 655,191,220 35,874,630 41,159,112 Non-current financial instruments 5,33 4,000 4,000 251 251 Non-current other receivables, net 7,32,33 35,124,579 33,953,847 2,206,526 2,132,981 Non-current financial assets 6,33 560,000 560,000 35,179 35,179 Property, plant and equipment,net 11,13 1,228,125,718 1,239,703,951 77,150,858 77,878,202 Intangible assets, net 11,12 353,759,963 303,268,722 22,223,201 19,051,341 Investments in joint venture 9 16,706,345 15,063,851 1,049,493 946,312 Other non-current assets 10 291,258 273,283 18,297 17,168 Total non-current assets 1,634,571,863 1,592,827,654 102,683,805 100,061,434 Total assets W 2,205,642,066 2,248,018,874 Rs 138,558,435 141,220,546 See accompanying notes to the consolidated financial statements.

SSANGYONG MOTOR COMPANY AND SUBSIDIARIES Consolidated Statements of Financial Position, Continued As of December 31, 2018 and 2017
6
(In thousands of won and in thousands of rupee) Korean won Indian rupee Note 2018 2017 2018 2017 Liabilities Trade and other payables 14,18,
32,33 W 731,995,228 752,931,607 Rs 45,983,941 47,299,164 Short-term borrowings
13,18, 30,33 178,227,545 163,840,987 11,196,254 10,292,491
Derivative liabilities 25,33 - 409,259 - 25,710 Provision of warranty for sale
- current 15 49,209,826 53,046,748 3,091,361 3,332,397 Other long-term employee
benefits liabilities- current 2,726,290 1,190,438 171,266 74,783 Other current liabilities 16 32,961,084 35,176,481 2,070,616 2,209,786 Total current liabilities 995,119,973 1,006,595,520 62,513,438 63,234,331
Long-term borrowings 13,18, 30,33 75,000,000 70,000,000 4,711,500 4,397,400
Non-current other payables 33 1,593,271 3,374,008 100,089 211,955 Other non-current liabilities 16 11,317,482 - 710,964 - Defined benefit liabilities 17 329,181,466 284,563,123 20,679,180 17,876,256 Other long-term employee
benefits liabilities 14,313,194 15,138,490 899,155 951,000 Non-current provision of
warranty for sale 15 85,828,260 93,192,809 5,391,731 5,854,372 Total non-current liabilities 517,233,673 466,268,430 32,492,619 29,290,983 Total liabilities W 1,512,353,646 1,472,863,950 Rs 95,006,057 92,525,314 Equity Capital stock 19 689,746,980 689,746,980 43,329,905 43,329,905 Other capital surplus 20 87,909,479 133,141,920 5,522,474 8,363,976 Other equity 21 1,242,617 1,153,581 78,061 72,468 Accumulated deficit 22 (85,610,656) (48,887,557) (5,378,062) (3,071,117) Equity attributable to
owners of the Company 693,288,420 775,154,924 43,552,378 48,695,232 Non-controlling interests - - - - Total equity W 693,288,420 775,154,924 Rs 43,552,378 48,695,232 Total liabilities and equity W 2,205,642,066 2,248,018,874 Rs 138,558,435 141,220,546 See accompanying notes to the consolidated financial statements.

SSANGYONG MOTOR COMPANY AND SUBSIDIARIES Consolidated Statements of Comprehensive loss For the years ended December 31, 2018 and 2017
7
(In thousands of won and in thousands of rupee, except earnings per share information) Korean won Indian rupee
Note 2018 2017 2018 2017 Sales 31,32 W 3,704,793,546 3,494,637,644 Rs 232,735,131 219,533,137 Cost of sales 24,32 3,242,522,474 2,978,559,796 203,695,262 187,113,127 Gross profit 462,271,072 516,077,848 29,039,869 32,420,010 Selling, general and administrative
expenses 24,26 526,447,069 581,353,654 33,071,405 36,520,636 Operating loss (64,175,997) (65,275,806) (4,031,536) (4,100,626)
Other income 27,32 11,201,136 29,156,178 703,654 1,831,591 Other expenses 27,32 10,530,861 35,014,445 661,549 2,199,607 Finance income 25,28 13,002,067 25,979,517 816,791 1,632,033 Finance costs 25,28 13,013,168 22,025,222 817,487 1,383,624 Share of profits of joint venture 9 1,719,303 1,395,754 108,007 87,681 Loss before income taxes (61,797,520) (65,784,024) (3,882,120) (4,132,552)
Income tax expenses 23 40,707 37,174 2,557 2,336 Loss for the year (61,838,227) (65,821,198) (3,884,677) (4,134,888)
Loss attributable to:
Owners of the Company (61,838,227) (65,821,198) (3,884,677) (4,134,888) Non-controlling interests - - - -
Other comprehensive income(loss) for the year 21,22 (20,028,277) 23,172,136 (1,258,177) 1,455,674
Items that will never be reclassified to profit or loss: Defined benefit plan re-measurements 17 (20,040,505) 20,746,539 (1,258,945) 1,303,298
Defined benefit plan re-measurements of joint ventures 9 (76,809) (13,797) (4,825) (868)
Items that are or may be reclassified subsequently to profit or loss: Changes in fair value of cash flow hedge 21,25 103,000 2,574,700 6,470 161,743
Foreign currency translation difference for foreign operation (13,964) (135,306) (877) (8,499)
Total comprehensive loss for the year W (81,866,505) (42,649,062) Rs (5,142,854) (2,679,214)
Total comprehensive loss attributable to: Owners of the Company (81,866,505) (42,649,062) (5,142,854) (2,679,214) Non-controlling interests - - - -
Losses per share
Basic and diluted losses per share 29 W (448)
(478) Rs (28)
(30) See accompanying notes to the consolidated financial statements.

SSANGYONG MOTOR COMPANY AND SUBSIDIARIES Consolidated Statements of Changes in Equity For the years ended December 31, 2018 and 2017
8
(In thousands of won) Other capital surplus
Capital stock
Paid-in capital
in excess of par value
Gain on capital
reduction
Debt to be swapped for equity
Gain on disposal of
treasury stock Other equity
Accumulated deficit
Non-controlling
interest Total Balance at January 1, 2017 W 686,100,480 11,452,713 118,189,001 931,508 1,105,138 (1,285,813) (3,799,101) - 812,693,926 Total comprehensive income(loss) for the year: Loss for the year - - - - - - (65,821,198) - (65,821,198) Defined benefit plan re-measurements - - - - - - 20,746,539 - 20,746,539 Changes in fair value of cash flow hedge - - - - - 2,574,700 - - 2,574,700 Foreign currency translation difference for
foreign operation - - - - - (135,306) - - (135,306) Defined benefit plan re-measurements of
joint ventures - - - - - - (13,797) - (13,797) Transactions with owners of the Parent Company, recognized directly in equity: Issue of ordinary shares 3,646,500 1,463,560 - - - - - - 5,110,060 Balance at December 31, 2017 W 689,746,980 12,916,273 118,189,001 931,508 1,105,138 1,153,581 (48,887,557) - 775,154,924 Balance at January 1, 2018 W 689,746,980 12,916,273 118,189,001 931,508 1,105,138 1,153,581 (48,887,557) - 775,154,924 Total comprehensive income(loss) for the year: Loss for the year - - - - - - (61,838,227) - (61,838,227) Defined benefit plan re-measurements - - - - - - (20,040,505) - (20,040,505) Changes in fair value of cash flow hedge - - - - - 103,000 - - 103,000 Foreign currency translation difference for
foreign operation - - - - - (13,964) - - (13,964) Defined benefit plan re-measurements of
joint ventures - - - - - - (76,809) - (76,809) Transactions with owners of the Parent Company, recognized directly in equity: Disposal of Accumulated Deficit - - (44,127,304) - (1,105,138) - 45,232,441 - - Balance at December 31, 2018 W 689,746,980 12,916,273 74,061,697 931,508 - 1,242,617 (85,610,656) - 693,288,420 See accompanying notes to the consolidated financial statements.

SSANGYONG MOTOR COMPANY AND SUBSIDIARIES Consolidated Statements of Changes in Equity, Continued For the years ended December 31, 2018 and 2017
9
(In thousands of rupee) Other capital surplus
Capital stock
Paid-in capital
in excess of par value
Gain on capital
reduction
Debt to be swapped for equity
Gain on disposal of
treasury stock Other equity
Accumulated deficit
Non-controlling
interest Total Balance at January 1, 2017 Rs 43,100,832 719,461 7,424,633 58,516 69,425 (80,776) (238,659) - 51,053,432 Total comprehensive income(loss) for the year: Loss for the year - - - - - - (4,134,888) - (4,134,888) Defined benefit plan re-measurements - - - - - - 1,303,298 - 1,303,298 Changes in fair value of cash flow hedge - - - - - 161,743 - - 161,743 Foreign currency translation difference for
foreign operation - - - - - (8,499) - - (8,499) Defined benefit plan re-measurements of
joint ventures - - - - - - (868) - (868) Transactions with owners of the Parent Company, recognized directly in equity: Issue of ordinary shares 229,073 91,941 - - - - - - 321,014 Balance at December 31, 2017 Rs 43,329,905 811,402 7,424,633 58,516 69,425 72,468 (3,071,117) - 48,695,232 Balance at January 1, 2018 Rs 43,329,905 811,402 7,424,633 58,516 69,425 72,468 (3,071,117) - 48,695,232 Total comprehensive income(loss) for the year: Loss for the year - - - - - - (3,884,677) - (3,884,677) Defined benefit plan re-measurements - - - - - - (1,258,945) - (1,258,945) Changes in fair value of cash flow hedge - - - - - 6,470 - - 6,470 Foreign currency translation difference for
foreign operation - - - - - (877) - - (877) Defined benefit plan re-measurements of
joint ventures - - - - - - (4,825) - (4,825) Transactions with owners of the Parent Company, recognized directly in equity: Disposal of Accumulated Deficit - - (2,772,077) - (69,425) - 2,841,502 - - Balance at December 31, 2018 Rs 43,329,905 811,402 4,652,556 58,516 - 78,061 (5,378,062) - 43,552,378 See accompanying notes to the consolidated financial statements.

SSANGYONG MOTOR COMPANY AND SUBSIDIARIES Consolidated Statements of Cash Flows For the years ended December 31, 2018 and 2017
10
(In thousands of won and in thousands of rupee) Korean won Indian rupee
2018 2017 2018 2017 Cash flows from operating activities Loss for the year W (61,838,227) (65,821,198) Rs (3,884,677) (4,134,888) Adjustment 290,877,430 280,201,951 18,272,919 17,602,286 Changes in assets and liabilities (49,981,589) (8,904,655) (3,139,843) (559,390) Cash generated from operations (note 30) 179,057,614 205,476,098 11,248,399 12,908,008 Interest received 2,604,644 2,682,053 163,624 168,487 Interest paid (4,550,165) (3,793,590) (285,841) (238,313) Dividends received 11,000 11,000 691 691 Net cash provided by operating activities 177,123,093 204,375,561 11,126,873 12,838,873
Cash flows from investing activities Proceed from disposal of property, plant and
equipment 447,785 294,784 28,131 18,518 Proceed from disposal of intangible assets - 763,636 - 47,972 Acquisition of property, plant and equipment (136,929,799) (157,501,790) (8,601,930) (9,894,262) Acquisition of intangible assets (119,497,975) (118,257,642) (7,506,862) (7,428,945) Cash flow used in other investing activities (1,713,945) (2,753,543) (107,672) (172,978) Net cash used in investing activities (257,693,934) (277,454,555) (16,188,333) (17,429,695)
Cash flows from financing activities Proceeds from borrowings 31,769,058 70,000,000 1,995,733 4,397,400 Receipts of government grants 2,012,470 133,034 126,423 8,357 Proceeds from issuing capital stock - 5,110,060 - 321,014 Repayment of borrowings (12,500,000) (25,014,060) (785,250) (1,571,383) Net cash provided by financing activities 21,281,528 50,229,034 1,336,906 3,155,388 Effect of exchange rate fluctuations on
cash and cash equivalents (91,760) (108,017) (5,765) (6,786) Net decrease in cash and cash equivalents (59,381,073) (22,957,977) (3,730,319) (1,442,220) Cash and cash equivalents at January 1 215,443,730 238,401,707 13,534,175 14,976,395 Cash and cash equivalents at December 31 W 156,062,657 215,443,730 Rs 9,803,856 13,534,175 See accompanying notes to the consolidated financial statements.

SSANGYONG MOTOR COMPANY AND SUBSIDIARIES Notes to the Consolidated Financial Statements For the years ended December 31, 2018 and 2017
11
1. General Description of the Company (1) Organization and description of business of the Company
Ssangyong Motor Company (the “Company”) was incorporated on December 6, 1962, in the Republic of Korea and listed its stocks on the Korea Stock Exchange in May 1975. The Company is headquartered in Dongsak-ro, Pyeongtaek, and its factories are located in Pyeongtaek, Gyeonggi-do, and Changwon, Gyeongsangnam-do, Republic of Korea to manufacture, sell and fix multiple types of vehicle, heavy machinery and those parts.
(2) Major shareholders
As of December 31, 2018, the Company’s shareholders are as follows:
Name of shareholder Number of shares Percentage of ownership Mahindra & Mahindra Ltd. 99,964,502 72.46% Others 37,984,894 27.54% 137,949,396 100.00%
The consolidated financial statements comprise the Company and its subsidiaries (the “Company”) and the Company’s interest in associates and joint ventures.
2. Basis of Preparation and Accounting Policies (1) Basis of translating consolidated financial statements
The consolidated financial statements are expressed in Korean won and have been translated into Indian rupees at the rate of INR 0.06282 to W 1 on December 31, 2018, solely for the convenience of the reader. These translations should not be construed as a representation that any or all of the amounts shown could be converted into Indian rupees at this or any other rate.
(2) Statement of compliance
The Group has prepared its consolidated financial statements in accordance with the K-IFRS. Major accounting policies used for the preparation of the consolidated financial statements are stated below. Unless stated otherwise, these accounting policies have been applied consistently to the consolidated financial statements for the current period and accompanying comparative period. The accompanying consolidated financial statements have been prepared on the historical cost basis, except as described below. Historical cost is generally based on the fair value of the consideration given. ① Derivatives measured at fair value ② FVTPL measured at fair value ③ Defined benefit liabilities that present value of defined benefit obligation deducted by plan assets The consolidated financial statements as of and for the year ended December 31, 2018, to be submitted at the ordinary shareholders’ meeting on March 29, 2018, were authorized for issuance at the board of directors’ meeting on January 30, 2018.

SSANGYONG MOTOR COMPANY AND SUBSIDIARIES Notes to the Consolidated Financial Statements For the years ended December 31, 2018 and 2017
12
2. Basis of Preparation and Accounting Policies, Continued
(2) Statement of compliance, continued
The Group has initially applied K-IFRS 1109 ‘Financial Instruments’ and K-IFRS 1115 ‘Revenue from Contracts with Customers’ for preparation of the separate interim financial statements as of and for the twelve-month periods ended December 31, 2018. The significant changes in accounting policies are described in note 2.(4).
(3) Use of estimates and judgments
The preparation of the consolidated financial statements in conformity with K-IFRS requires management to make judgments, estimates and assumptions that affect the application of accounting policies and the reported amounts of assets, liabilities, income and expenses. Actual results may differ from these estimates. Estimates and underlying assumptions are reviewed on an ongoing basis. Revisions to estimates are recognised prospectively. The significant estimates and assumptions and those which have a significant risk of causing a material adjustment to the carrying amounts of assets and liabilities after the end of the reporting period are addressed below. - Property, plant and equipment and Intangible assets: Assumptions for estimating recoverable amount
for impairment test of development expenditures. - Provision for warranty for sale: Assumptions of expected expenditures based on warranty periods. - Employee benefits: Actuarial assumptions. - Trade and other receivables: Estimation of the possibility of impairment of receivables. - Inventories: Estimation of the possibility of losses of inventories. - Going concern assumption: Judgment on whether there is any significant uncertainty of going concern
assumption.
(4) Changes in accounting policies
New standard, interpretations, and changes in accounting policies resulting from the adoption of them are as follows. The changes in accounting policies described below is reflected in the annual consolidated financial statements for the year ended December 31, 2018.
① K-IFRS 1115, Revenue from Contracts with Customers K-IFRS 1115 establishes a comprehensive framework for determining whether, how much and when revenue is recognized. It replaces existing revenue recognition guidance, including K-IFRS 1018 Revenue, K-IFRS 1011 Construction Contracts, K-IFRS 2113 Customer Loyalty Programs, K-IFRS 2115 Agreements for the Construction of Real Estate and K-IFRS 2118 Transfers of assets from customers. The Group adopted K-IFRS 1115 using the cumulative effect method, with the effect of initially applying this standard recognized and applied to the contracts that are not completed at the date of initial application (January 1, 2018).
There is no effect on retained earnings as of January 1, 2018 because the Group concluded that the contracts before adopting K-IFRS 1115 were completed before the date.

SSANGYONG MOTOR COMPANY AND SUBSIDIARIES Notes to the Consolidated Financial Statements For the years ended December 31, 2018 and 2017
13
2. Basis of Preparation and Accounting Policies, Continued
(4) Changes in accounting policies, continued The effect of adoption of the K-IFRS 1115 on the consolidated statement of financial position as of December 31, 2018 and the consolidated of statement comprehensive loss for the years ended December 31, 2018 are as follows. The effect on the consolidated statement of cash flow for the years ended December 31, 2018 is not significant.
1) Impact on the consolidated statements of financial position as of December 31, 2018
(In thousands of won)
Amount in accordance with
K-IFRS No. 1018(A)
Amount in accordance with
K-IFRS No. 1115(B) Difference(B-A) Current assets(*1) W 566,460,978 571,070,203 4,609,225 Non-current assets 1,634,571,863 1,634,571,863 - Total assets 2,201,032,841 2,205,642,066 4,609,225 Current liabilities(*1) 989,565,661 995,119,973 5,554,312 Non-current liabilities(*2) 515,886,115 517,233,673 1,347,558 Total liabilities 1,505,451,776 1,512,353,646 6,901,870 Total equity W 695,581,065 693,288,420 (2,292,645) (In thousands of rupee)
Amount in accordance with
K-IFRS No. 1018(A)
Amount in accordance with
K-IFRS No. 1115(B) Difference(B-A) Current assets(*1) Rs 35,585,079 35,874,630 289,551 Non-current assets 102,683,805 102,683,805 - Total assets 138,268,884 138,558,435 289,551 Current liabilities(*1) 62,164,516 62,513,438 348,922 Non-current liabilities(*2) 32,407,965 32,492,619 84,654 Total liabilities 94,572,481 95,006,057 433,576 Total equity Rs 43,696,403 43,552,378 (144,025)
(*1) The Group analyzed deferring effects of revenue and associated costs due to non-fulfillment of performance obligations in relation to the additional services. (*2) The Group analyzed the effect of the deferred revenue due to non-performance of obligations related to the additional guarantees.

SSANGYONG MOTOR COMPANY AND SUBSIDIARIES Notes to the Consolidated Financial Statements For the years ended December 31, 2018 and 2017
14
2. Basis of Preparation and Accounting Policies, Continued
(4) Changes in accounting policies, continued
2) Impact on the consolidated statements of comprehensive loss for the years ended December 31, 2018 (In thousands of won)
Amount in accordance with
K-IFRS No. 1018(A)
Amount in accordance with
K-IFRS No. 1115(B) Difference(B-A) Gross sales(*) W 3,735,791,107 3,704,793,546 (30,997,561) Cost of sales(*) 3,215,416,598 3,242,522,474 27,105,876 Selling, general and
administrative expenses(*) 571,759,662 526,447,069 (45,312,593)
Loss for the period W (59,545,582) (61,838,227) (2,292,645) (In thousands of rupee )
Amount in accordance with
K-IFRS No. 1018(A)
Amount in accordance with
K-IFRS No. 1115(B) Difference(B-A) Gross sales(*) Rs 234,682,398 232,735,131 (1,947,267) Cost of sales(*) 201,992,441 203,695,262 1,702,791 Selling, general and
administrative expenses(*) 35,917,942 33,071,405 (2,846,537)
Loss for the period Rs (3,740,653) (3,884,677) (144,024) (*) The Group analyzed the effect of the deferred revenue due to non-performance of obligations related to the additional guarantees and the effect of reclassification of accounts from Selling, general and administrative expenses related to other service to cost of sales.
The Group have identified distinct performance obligations for our products and merchandise contract with our customers, such as (1) sales of vehicles and merchandise, (2) transportation of vehicles, and (3) warranties. Revenues was recognized at the time of the transfer of the risks and rewards of the goods under K-IFRS 1018, and under K-IFRS 1115, revenue is recognized at the time when the obligation to perform the transportation and warranty is identified and implemented in the contract of transfer of the goods during contract period. Our sales contract with customers has the option of customers purchasing additional warranties. Also, depending on the sales policy, customers may be offered service warranty beyond the assurance warranty when selling a vehicle. When a customer purchases a warranty or provides a service warranty to a customer under a sales policy, sales recognition related to the performance obligations is deferred to the time the performance obligation is fulfilled, and is not recognized in provision of warranties. Transaction price of a service warranty to a customer under a sales policy is allocated by relative individual sales price that is estimated by “expected cost plus a margin approach”. The consideration paid to other customers defined in K-IFRS 1115 are recognized by deducting from related sales.
② K-IFRS 1109 : Financial Instruments Key features of the new standard, K-IFRS 1109, are 1) classification and measurement of financial assets that reflects the business model in which the assets are managed and their cash flow characteristics, 2) impairment methodology that reflects ‘expected credit loss’ (ECL) model for financial assets, and 3) expanded scope of hedged items and hedging instruments which qualify for hedge accounting and changes in assessment method for effectiveness of hedging relationships.

SSANGYONG MOTOR COMPANY AND SUBSIDIARIES Notes to the Consolidated Financial Statements For the years ended December 31, 2018 and 2017
15
2. Basis of Preparation and Accounting Policies, Continued
(4) Changes in accounting policies, continued
Classification and measurement of financial assets K-IFRS 1109, Financial Instruments sets out requirements for recognizing and measuring financial assets, financial liabilities and some contracts to buy or sell non-financial items. This standard replaces K-IFRS 1039 Financial Instruments: Recognition and Measurement.
Most of the requirements of K-IFRS 1039 for classification and measurement of financial liabilities are existed, but categories of held to maturity, loans and receivables and available for sales are deleted under K-IFRS 1109.
There is no effect of adoption of the K-IFRS 1109 on the consolidated statement of financial position as of January 1, 2018. The results of the classification and measurement of financial assets held by the Group as of January 1, 2018 are as follows:
(In thousands of won) Under K-IFRS 1039 Under K-IFRS 1109
Classification Book value Classification Book value Cash and cash equivalents Loan and receivables W 215,443,730 Amortised cost W 215,443,730 Trade receivables Loan and receivables 187,064,713 Amortised cost 187,064,713 Other receivables Loan and receivables 3,092,349 Amortised cost 3,092,349 Loans and others Loan and receivables 11,921,800 Amortised cost 11,921,800 Long-term financial
instruments Loan and receivables 4,000 Amortised cost 4,000 Long-term loans and
others Loan and receivables 33,953,846 Amortised cost 33,953,846 Non-current financial
assets(*) AFS financial assets 560,000 FVTPL 560,000
(In thousands of rupee) Under K-IFRS 1039 Under K-IFRS 1109
Classification Book value Classification Book value Cash and cash equivalents Loan and receivables Rs 13,534,175 Amortised cost Rs 13,534,175 Trade receivables Loan and receivables 11,751,405 Amortised cost 11,751,405 Other receivables Loan and receivables 194,261 Amortised cost 194,261 Loans and others Loan and receivables 748,927 Amortised cost 748,927 Long-term financial
instruments Loan and receivables 251 Amortised cost 251 Long-term loans and
others Loan and receivables 2,132,981 Amortised cost 2,132,981 Non-current financial
assets(*) AFS financial assets 35,179 FVTPL 35,179
(*) The Group judged that acquisition cost is the best estimate of fair values of non-current financial assets since these do not have a quoted market price in an active market and fair values of them cannot be reliably measured due to the excessively vast range of possible outcomes of the fair value measurement.

SSANGYONG MOTOR COMPANY AND SUBSIDIARIES Notes to the Consolidated Financial Statements For the years ended December 31, 2018 and 2017
16
2. Basis of Preparation and Accounting Policies, Continued (4) Changes in accounting policies, continued
Impairment: Financial assets and contract assets K-IFRS 1109 replaces the ‘incurred loss’ model in K-IFRS 1039 with a forward-looking ‘expected credit loss’ (ECL) model. The new impairment model will apply to financial assets measured at amortised cost or FVOCI, except for investments in equity instruments, and to contract assets. Under K-IFRS 1109, impairment losses are likely to be recognized earlier than using the incurred loss model under the existing guidance in K-IFRS 1039.
Under K-IFRS 1109, loss allowances will be measured on either of the following bases: – 12-month ECLs: ECLs that result from possible default events within the 12 months after the
reporting date – lifetime ECLs: ECLs that result from all possible default events over the expected life of a financial
instrument. As of December 31, 2018, the Group has recognized loss allowances amounting to W 4,088 million (Rs 257 million) for loans and receivables. The Group has chosen its accounting policy to measure the loss allowance at an amount equal to lifetime expected assets if the trade receivables or contract assets contain a significant financing component, and plan to use practical simplification method that the credit risk on a financial instrument has not increased significantly at the reporting date. Hedge accounting K-IFRS 1109 retains the mechanics of hedge accounting (fair value hedge, cash flow hedge, hedging on net investment in a foreign operation) which was defined in the existing guidance in K-IFRS 1039, but provides principle-based and less complex guidance in hedging which focuses on the risk management activities. More hedged items and hedging instruments would qualify for hedge accounting, more qualitative and forward-looking approach will be taken to assessing hedge effectiveness, and qualitative threshold (80~125%) is removed under K-IFRS 1109.
3. Significant Accounting Policies
(1) New standards and interpretations not yet adopted
A number of new standards and amendments are required to be effective starting from annual period starting on January 1, 2019, and early adoption is allowed. The followings are newly required standards and amendments that the Group decided not to early adopt in preparation of the financial statements.
Amendments to K-IFRS No.1116: Leases K-IFRS 1116 replaces existing leases guidance, including K-IFRS 1017 Leases, K-IFRS 2104 Determining whether an Arrangement contains a Lease.
The standard is effective for annual periods beginning on or after January 1, 2019. Early adoption is permitted for entities that apply K-IFRS 1115 at or before the date of initial application of K-IFRS 1116.
K-IFRS 1116 introduces a single, on-balance sheet lease accounting model for lessees. A lessee recognizes a right-of-use asset representing its right to use the underlying asset and a lease liability representing its obligation to make lease payments. There are recognition exemption for short-term leases and leases of low-value items. Lessor accounting is similar to the current standard, that classifies leases as finance or operating leases.

SSANGYONG MOTOR COMPANY AND SUBSIDIARIES Notes to the Consolidated Financial Statements For the years ended December 31, 2018 and 2017
17
3. Significant Accounting Policies, Continued
(1) New standards and interpretations not yet adopted, continued
Other revision standards
The following amendment standards will not have a material impact on the Group. - K-IFRS 2123 ‘Uncertainty of tax treatment’ - K-IFRS 1109 ‘Financial instruments’ revision - K-IFRS 1028 'Investing in affiliated and joint ventures' - K-IFRS 1019 'employee salary' - Revised Conceptual Framework for Financial Reporting - K-IFRS 1117 'Insurance contract'
(2) Basis of consolidation
The consolidated financial statements incorporate the financial statements of the Group and the entities (including structured entities) controlled by the Company and its subsidiaries. Control is achieved when the Group 1) has the power over the investee; 2) is exposed, or has rights, to variable returns from its involvement with the investee; and 3) has the ability to use its power to affect its returns. The Company reassesses whether or not it controls an investee if facts and circumstances indicate that there are changes to one or more of the three elements of control listed above.
When the Group has less than a majority of the voting rights of an investee, it has power over the investee when the voting rights are sufficient to give it the practical ability to direct the relevant activities of the investee unilaterally. The Group considers all relevant facts and circumstances in assessing whether or not the Group's voting rights in an investee are sufficient to give it power, including:
a. the size of the Group's holding of voting rights relative to the size and dispersion of holdings of the
other vote holders; b. potential voting rights held by the Group, other vote holders or other parties; c. rights arising from other contractual arrangements; and d. any additional facts and circumstances that indicate that the Group has, or does not have, the current
ability to direct the relevant activities at the time that decisions need to be made, including voting patterns at previous shareholders' meetings.
Income and expenses of subsidiaries acquired or disposed of during the year are included in the consolidated statements of comprehensive income from the date the Company gains control to the date when the Company ceases to control the subsidiary. Profit or loss and each component of other comprehensive income are attributed to the owners of the Group and to the non-controlling interests. Total comprehensive income of subsidiaries is attributed to the owners of the Group and to the non-controlling interests even if this results in the non-controlling interests having a deficit balance.
When necessary, adjustments are made to the financial statements of subsidiaries to bring their accounting policies in-line with the Group’s accounting policies.

SSANGYONG MOTOR COMPANY AND SUBSIDIARIES Notes to the Consolidated Financial Statements For the years ended December 31, 2018 and 2017
18
3. Significant Accounting Policies, Continued (2) Basis of consolidation, continued
All inter-company transactions and related assets and liabilities, income and expenses are eliminated in full on consolidation. Changes in the Group’s ownership interests in subsidiaries that do not result in the Group losing control over the subsidiaries are accounted for as equity transactions. The carrying amounts of the Group’s interests and the non-controlling interests are adjusted to reflect the changes in their relative interests in the subsidiaries. Any difference between the amount by which the non-controlling interests are adjusted and the fair value of the consideration paid or received is recognized directly in equity and attributed to the owners of the Group. When the Group loses control of a subsidiary, a gain or loss on disposal is calculated as the difference between (i) the aggregate of the fair value of the consideration received and the fair value of any retained interest and (ii) the previous carrying amount of the assets (including goodwill) and liabilities of the subsidiary and any non-controlling interests. When assets of the subsidiary are carried at revalued amounts or fair values and the related cumulative gain or loss has been recognized in other comprehensive income and accumulated in equity, the amounts previously recognized in other comprehensive income and accumulated in equity are accounted for as if the Group had directly disposed of the relevant assets (i.e., reclassified to profit or loss or transferred directly to retained earnings). The fair value of any investment retained in the former subsidiary at the date when control is lost is recognized as the fair value on initial recognition for subsequent accounting under K-IFRS 1039, Financial Instruments: Recognition and Measurement, or, when applicable, the cost on initial recognition of an investment in an associate or a joint venture.
(3) Investments in joint ventures
An associate is an entity over which the Group has significant influence. Significant influence is the power to participate in the financial and operating policy decisions of the investee, but is not control or joint control over those policies. A joint venture is a joint arrangement, whereby the parties that have joint control of the arrangement have rights to the net assets of the joint arrangement. Joint control is the contractually agreed sharing of control of an arrangement, which exists only when decisions about the relevant activities require unanimous consent of the parties sharing control. The results and assets and liabilities of associates or joint ventures are incorporated in these consolidated financial statements using the equity method of accounting, except when the investment is classified as held for sale; in which case, it is accounted for in accordance with K-IFRS 1105, Non-Current Assets Held for Sale and Discontinued Operations. Under the equity method, an investment in an associate or a joint venture is initially recognized in the consolidated statements of financial position at cost and adjusted thereafter to recognize the Group's share of the profit or loss and other comprehensive income of the associate or joint venture. When the Group's share of losses of an associate or a joint venture exceeds the Group's interest in that associate or joint venture (which includes any long-term interests that, in substance, form part of the Group's net investment in the associate or joint venture), the Group discontinues recognizing its share of further losses. Additional losses are recognized only to the extent that the Group has incurred legal or constructive obligations or made payments on behalf of the associate or joint venture.

SSANGYONG MOTOR COMPANY AND SUBSIDIARIES Notes to the Consolidated Financial Statements For the years ended December 31, 2018 and 2017
19
3. Significant Accounting Policies, Continued
(3) Investments in joint ventures, continued Any excess of the cost of acquisition over the Group's share of the net fair value of the identifiable assets, liabilities and contingent liabilities of an associate or a joint venture recognized at the date of acquisition is recognized as goodwill, which is included within the carrying amount of the investment. Any excess of the Group’s share of the net fair value of the identifiable assets, liabilities and contingent liabilities over the cost of acquisition, after reassessment, is recognized immediately in profit or loss. Upon disposal of an associate or a joint venture that results in the Group losing significant influence over that associate or joint venture, any retained investment is measured at fair value at that date and the fair value is regarded as its fair value on initial recognition as a financial asset in accordance with K-IFRS 1039. The difference between the previous carrying amount of the associate or joint venture attributable to the retained interest and its fair value is included in the determination of the gain or loss on disposal of the associate or joint venture. In addition, the Group accounts for all amounts previously recognized in other comprehensive income in relation to that associate or joint venture on the same basis it would be required if that associate or joint venture had directly disposed of the related assets or liabilities. Therefore, if a gain or loss previously recognized in other comprehensive income by that associate or joint venture would be reclassified to profit or loss on the disposal of the related assets or liabilities, the Group reclassifies the gain or loss from equity to profit or loss (as reclassification adjustment) when it loses significant influence over that associate or joint venture. When the Group reduces its ownership interest in an associate or a joint venture, but continues to use the equity method, it reclassifies to profit or loss the proportion of the gain or loss that had previously been recognized in other comprehensive income relating to that reduction in ownership interest if that gain or loss would be reclassified to profit or loss on the disposal of the related assets or liabilities. In addition, the Group applies K-IFRS 5, Non-Current Assets Held for Sale and Discontinued Operations, to a portion of investment in an associate or a joint venture that meets the criteria to be classified as held for sale. The requirements of K-IFRS 1039 are applied to determine whether it is necessary to recognize any impairment loss with respect to the Group’s investment in an associate or a joint venture. When necessary, the entire carrying amount of the investment (including goodwill) is tested for impairment in accordance with K-IFRS 1036, Impairment of Assets, by comparing its recoverable amount (higher of value in use or fair value, less costs to sell) with its carrying amount, and any impairment loss recognized forms part of the carrying amount of the investment. Any reversal of that impairment loss is recognized in accordance with K-IFRS 1036 to the extent that the recoverable amount of the investment subsequently increases. The Group continues to use the equity method when an investment in an associate becomes an investment in a joint venture or an investment in a joint venture becomes an investment in an associate. There is no re-measurement to fair value upon such changes in ownership interests. When a Group entity transacts with an associate or a joint venture of the Group, profits and losses resulting from the transactions with the associate or joint venture are recognized in the Group's consolidated financial statements only to the extent of interests in the associate or joint venture that are not related to the Group.
(4) Revenue recognition
The Group's financial statements have been prepared by first applying K-IFRS 1115 from January 1, 2018, 'Revenue from contracts with customers'. This change is explained in Note 2 (4).

SSANGYONG MOTOR COMPANY AND SUBSIDIARIES Notes to the Consolidated Financial Statements For the years ended December 31, 2018 and 2017
20
3. Significant Accounting Policies, Continued (5) Foreign currencies
The individual financial statements of each Group entity are presented in the currency of the primary economic environment in which the entity operates (its functional currency). For the purpose of the consolidated financial statements, the results and financial position of each Group entity are expressed in Korean won, which is the functional currency of the entity and the presentation currency for the consolidated financial statements.
In preparing the financial statements of the individual entities, transactions in currencies other than the entity’s functional currency (foreign currencies) are recognized at the rates of exchange prevailing at the dates of the transactions. At the end of each reporting period, monetary items denominated in foreign currencies are retranslated at the rates prevailing at that date. Non-monetary items carried at fair value that are denominated in foreign currencies are retranslated at the rates prevailing at the date when the fair value was determined. Non-monetary items that are measured in terms of historical cost in a foreign currency are not retranslated.
(6) Non-derivative financial assets ① Recognition and initial measurement
Trade receivables and debt securities are recognized for the first time at the time of issue. Other financial instruments and financial liabilities are recognized only when the Group becomes a party to the financial instrument.
Except for trade receivables that do not include significant financial assets, are measured at fair value at the time of initial recognition and except for, financial assets at fair value through profit or loss or financial liabilities s at fair value through profit or loss, transaction costs directly related to the acquisition of the financial asset or the issuance of the financial liability are added to or subtracted from the fair value. Trade receivables that do not include significant financial elements are initially measured at transaction prices.
② Classification and subsequent measurements
At initial recognition, financial assets are amortized cost, other comprehensive income - fair value debt instruments, other comprehensive income - fair value equity instruments or profit or loss - classified as measured at fair value.
Financial assets are not reclassified after initial recognition, unless the entity modifies the financial asset management model, in which case all of the financial assets impacted are reclassified on the first day of the first reporting period after the change in the business model.
A financial asset is measured at amortized cost if it meets both of the following conditions and is not designated as at FVTPL: - It is held within a business model whose objective is to hold assets to collect contractual cash flows. - Its contractual terms give rise on specified dates to cash flows that are solely payments of principal and interest on the principal amount outstanding.

SSANGYONG MOTOR COMPANY AND SUBSIDIARIES Notes to the Consolidated Financial Statements For the years ended December 31, 2018 and 2017
21
3. Significant Accounting Policies, Continued (6) Non-derivative financial assets, continued
A debt investment is measured at FVOCI if it meets both of the following conditions and is not designated as at FVTPL: - It is held within a business model whose objective is achieved by both collecting contractual cash flows and selling financial assets. - Its contractual terms give rise on specified dates to cash flows that are solely payments of principal and interest on the principal amount outstanding.
On initial recognition of an equity investment that is not held for trading, the Group may irrevocably elect to present subsequent changes in the investment’s fair value in OCI. This election is made on an investment-by-investment basis.
All financial assets not classified as measured at amortised cost or FVOCI as described above are measured at FVTPL. This includes all derivative financial assets. On initial recognition, the Group may irrevocably designate a financial asset that otherwise meets the requirements to be measured at amortised cost or at FVOCI as at FVTPL if doing so eliminates or significantly reduces an accounting mismatch that would otherwise arise. An assessment of whether contractual cash flows consist solely of principal and interest The principal is defined as the fair value at the initial recognition of the financial asset. Interest consists of consideration for the time value of money, consideration for credit risk associated with the principal balance in a particular time period, as well as consideration for basic loan risk and costs (e.g., liquidity risk and operating costs) as well as profit.
When evaluating whether the contractual cash flows consist solely of payments for principal and interest, we take into account the terms and conditions of the applicable product. If a financial asset includes a contractual term that changes the timing or amount of a contractual cash flow, then the contractual terms must determine whether the contractual cash flows that may occur over the life of the financial instrument consist solely of principal payments.
When evaluating this, we consider the following: - Conditional conditions that change the amount or timing of cash flow - Provision to adjust contractual nominal interest rate, including variable interest rate characteristics - Moderate repayment characteristics and maturity extension characteristics - The terms of the contract that limit our claims for cash flows arising from a particular asset (e.g. non-property features) If the reimbursement amounts represent interest on principal and remnant principal that have not yet been outstanding and include reasonable additional compensation for the early liquidation of the contract, the early repayment characteristics are consistent with the conditions under which principal and interest are paid on a particular day. In addition, for financial assets acquired at significant discounts or premiums on the contractual face value, the amortized amount represents the actual face value of the contract and the accrued interest on the contract (but not outstanding) (in this case, If the fair value of the characteristic is mild at the time of initial recognition of the financial asset.

SSANGYONG MOTOR COMPANY AND SUBSIDIARIES Notes to the Consolidated Financial Statements For the years ended December 31, 2018 and 2017
22
3. Significant Accounting Policies, Continued (6) Non-derivative financial assets, continued
Subsequent measurement and profit and loss
Financial assets at FVTPL These assets are subsequently measured at fair value.
Net gains and losses, including any interest or dividend income, are recognized in profit or loss. See note 3 below for derivatives designated as hedging instruments.
Financial assets at amortised cost These assets are subsequently measured at amortised cost using the effective interest method. The amortised cost is reduced by impairment losses. Interest income, foreign exchange gains and losses and impairment are recognized in profit or loss. Any gain or loss on derecognition is recognized in profit or loss.
Debt investments at FVOCI These assets are subsequently measured at fair value. Interest income calculated using the effective interest method, foreign exchange gains and losses and impairment are recognized in profit or loss. Other net gains and losses are recognized in OCI. On derecognition, gains and losses accumulated in OCI are reclassified to profit or loss.
Equity investments at FVOCI These assets are subsequently measured at fair value. Dividends are recognized as income in profit or loss unless the dividend clearly represents a recovery of part of the cost of the investment. Other net gains and losses are recognized in OCI and are never reclassified to profit or loss.
③ Elimination In the event that the contractual rights to cash flows of financial assets have ceased, the Group transfers the contractual rights to receive the cash flows of the financial assets and substantially transfers the risks and rewards of ownership of the transferred financial assets. Or if the Group does not control or control the financial assets without retaining or transferring substantially all the risks and rewards of ownership.
If the Group transacts a recognized asset in its statement of financial position but holds most of the risks and rewards of ownership of the transferred asset, the transferred asset is not removed.

SSANGYONG MOTOR COMPANY AND SUBSIDIARIES Notes to the Consolidated Financial Statements For the years ended December 31, 2018 and 2017
23
3. Significant Accounting Policies, Continued (7) Impairment of financial assets ① Financial instruments and contract assets
The Group recognize a loss reserve for expected credit losses on the following assets: - Financial assets measured at amortized cost- Other comprehensive income - Debt instruments measured at fair value - Contractual assets as defined in K-IFRS 1115
The Group measures loss allowances at an amount equal to lifetime ECLs, except for the following, which are measured as 12-month ECLs: - Debt securities that are determined to have low credit risk at the reporting date; and - Other debt securities and bank balances for which credit risk (i.e. the risk of default occurring over the expected life of the financial instrument) has not increased significantly since initial recognition. The Group has elected to measure loss allowances for trade receivables and contract assets at an amount equal to lifetime ECLs.
When determining whether the credit risk of a financial asset has increased significantly since initial recognition and when estimating ECLs, the Group considers reasonable and supportable information that is relevant and available without undue cost or effort. This includes both quantitative and qualitative information and analysis, based on the Group’s historical experience and informed credit assessment and including forward-looking information.
The Group considers a financial asset to be in default when: - The borrower is unlikely to pay its credit obligations to the Group in full, without recourse by the Group to actions such as realizing security (if any is held)
Total expected credit losses are the expected credit losses due to any default event that may occur during the expected life of the instrument. The expected 12-month credit loss is the total expected period that represents the expected credit loss due to a default event of a financial instrument that can occur within 12 months after the end of the reporting period (or a shorter period if the expected life of the instrument is less than 12 months) Part of credit loss.
The maximum period considered when estimating ECLs is the maximum contractual period over which the Group is exposed to credit risk. ② Measurement of ECLs
ECLs are a probability-weighted estimate of credit losses. Credit losses are measured as the present value of all cash shortfalls (i.e. the difference between the cash flows due to the entity in accordance with the contract and the cash flows that the Group expects to receive). ECLs are discounted at the effective interest rate of the financial asset.

SSANGYONG MOTOR COMPANY AND SUBSIDIARIES Notes to the Consolidated Financial Statements For the years ended December 31, 2018 and 2017
24
3. Significant Accounting Policies, Continued (7) Impairment of financial assets, continued ③ Credit-impaired financial assets
At each reporting date, the Group assesses whether financial assets carried at amortized cost and debt securities at FVOCI are credit-impaired. A financial asset is ‘credit-impaired’ when one or more events that have a detrimental impact on the estimated future cash flows of the financial asset have occurred. The evidence that the credit of a financial asset is impaired includes the following observable information. - Significant financial difficulties of issuer or borrower - Default - Inevitable mitigation of initial borrowing conditions for economic or contractual reasons related to the borrower's financial difficulties - Borrowers are likely to go bankrupt or other financial restructuring becomes more likely- Termination of active market for financial assets due to financial difficulties ④ Presentation of allowance for credit loss on statement of financial position
The allowance for losses on financial assets at amortized cost is deducted from the carrying amount of the asset. For debt instruments measured at FVOCI, changes in credit risk are included in profit or loss and changes in non-credit risk are recognized in other comprehensive income.
⑤ Amounts written off
If there is no reasonable expectation of recovery of all or part of the contractual cash flows of a financial asset, the asset is removed. For individual customers, the Group assesses the timing and amount of each individual by assessing whether there is a reasonable expectation of recovery for the enterprise customer, based on historical experience with the recovery of similar assets. The Group has no expectation that the proceeds will be recovered significantly. However, deferred financial assets can be subject to collection activities in accordance with the collection procedure of the amount due.
(8) Financial liabilities and Paid-in capital 1) Paid-in capital
Common stock is classified as equity. Incremental costs directly related to capital transactions are deducted from equity as a net amount reflecting the tax effect. Repurchase of the Group’s own equity instruments is recognized and deducted directly in equity. No gain or loss is recognized in profit or loss on the purchase, sale, issue or cancellation of the Group’s own equity instruments.

SSANGYONG MOTOR COMPANY AND SUBSIDIARIES Notes to the Consolidated Financial Statements For the years ended December 31, 2018 and 2017
25
3. Significant Accounting Policies, Continued (8) Financial liabilities and Paid-in capital, continued 2) Financial liabilities
The Group classifies financial liabilities as financial liabilities at fair value through profit or loss and other financial liabilities in accordance with the definition of the substance of contractual contracts and financial liabilities and recognizes them in the consolidated statement of financial position when becoming a party to the contract.
① Financial liabilities at fair value through profit or loss
Financial liabilities are classified as held for trading if they are classified as held for trading, are derivatives, or are initially recognized at fair value through profit or loss. Financial liabilities at fair value through profit or loss are measured at fair value after initial recognition and changes in fair value are recognized in profit or loss. Transaction costs incurred in connection with the initial recognition are recognized in profit or loss as incurred.
② Other financial liabilities
Non-derivative financial liabilities that are not classified as financial liabilities at fair value through profit or loss are classified as other financial liabilities. Other financial liabilities are measured initially at fair value, net of transaction costs directly attributable to the issue. Subsequently, other financial liabilities are measured at amortized cost using the effective interest method. Interest expense is recognized using the effective interest method.
③ Elimination of financial liabilities
Group only eliminates financial liabilities when the contractual obligation of the financial liability is fulfilled, cancelled or expired. The Group recognizes new financial liabilities as fair value based on new contracts and removes existing liabilities when the contractual terms of the financial liabilities change and the cash flows change substantially. When a financial liability is derecognized, the difference between the carrying amount and the consideration paid (including any transferred non-cash assets or liabilities assumed) is recognized in profit or loss.
(9) Derivative financial instruments
The Group enters into derivative financial instruments to manage its exposure to foreign exchange rate risk by foreign exchange forward contracts. Derivatives are initially recognized at fair value at the date the derivative contract is entered into and are subsequently re-measured to their fair value at the end of each reporting period. The resulting gain or loss is recognized in profit or loss immediately, unless the derivative is designated and effective as a hedging instrument; in which case the timing of the recognition in profit or loss depends on the nature of the hedge relationship. A derivative with a positive fair value is recognized as a financial asset; a derivative with a negative fair value is recognized as a financial liability. A derivative is presented as a non-current asset or a non-current liability if the remaining maturity of the instrument is more than 12 months and it is not expected to be realized or settled within 12 months. Other derivatives are presented as current assets or current liabilities.

SSANGYONG MOTOR COMPANY AND SUBSIDIARIES Notes to the Consolidated Financial Statements For the years ended December 31, 2018 and 2017
26
3. Significant Accounting Policies, Continued
(9) Derivative financial instruments, continued
The effective portion of changes in the fair value of derivatives that are designated and qualify as cash flow hedges is recognized in other comprehensive income. The gain or loss relating to the ineffective portion is recognized immediately in other gains and losses line item.
Amounts previously recognized in other comprehensive income and accumulated in equity are reclassified to profit or loss in the periods when the hedged item is recognized in profit or loss, in the same line of the separate statement of comprehensive income as the recognized hedged item. However, when the forecast transaction that is hedged results in the recognition of a non-financial asset or a non-financial liability, the gains and losses previously accumulated in equity are transferred from equity and included in the initial measurement of the cost of the non-financial asset or non-financial liability.
Hedge accounting is discontinued when the Group revokes the hedging relationship; when the hedging instrument expires or is sold, terminated, or exercised; or when it no longer qualifies for hedge accounting. Any gain or loss accumulated in equity at that time remains in equity and is recognized when the forecast transaction is ultimately recognized in profit or loss. When a forecast transaction is no longer expected to occur, the gain or loss accumulated in equity is recognized immediately in profit or loss.
(10) Inventories
Inventories are stated at the lower of cost or net realizable value. Cost of inventories, except for those in transit, are measured under the weighted-average method and consists of the purchase price, cost of conversion and other costs incurred in bringing the inventories to their present location and condition. Net realizable value represents the estimated selling price for inventories, less all estimated costs of completion and costs necessary to make the sale.
When inventories are sold, the carrying amount of those inventories is recognized as an expense (cost of sales) in the period in which the related revenue is recognized. The amount of any write-down of inventories to net realizable value and all losses of inventories is recognized as an expense in the period the write-down or loss occurs. The amount of any reversal of any write-down of inventories, arising from an increase in net realizable value, is recognized as a reduction in the amount of inventories recognized as an expense in the period in which the reversal occurs.
(11) Property, plant and equipment
Property, plant and equipment are stated at cost, less subsequent accumulated depreciation and accumulated impairment losses. The cost of an item of property, plant and equipment is directly attributable to their purchase or construction, which includes any costs directly attributable to bringing the asset to the location and condition necessary for it to be capable of operating in the manner intended by management. It also includes the initial estimate of the costs of dismantling and removing the item and restoring the site on which it is located. Subsequent costs are recognized in the carrying amount of an asset or as a separate asset if it is probable that future economic benefits associated with the assets will flow into the Group and the cost of an asset can be measured reliably. Routine maintenance and repairs are expensed as incurred.
The Group does not depreciate land. Depreciation expense is computed using the straight-line method based on the estimated useful lives of the assets as follows:

SSANGYONG MOTOR COMPANY AND SUBSIDIARIES Notes to the Consolidated Financial Statements For the years ended December 31, 2018 and 2017
27
3. Significant Accounting Policies, Continued (11) Property, plant and equipment, continued
Useful lives (Years) Buildings 24–50 Structures 13–30 Machinery and equipment 10 Vehicles 6–10 Others 6–10
If each part of an item of property, plant and equipment has a cost that is significant in relation to the total cost of the item, it is depreciated separately. The Group reviews the depreciation method, the estimated useful lives and residual values of property, plant and equipment at the end of each annual reporting period. If expectations differ from previous estimates, the changes are accounted for as a change in an accounting estimate. An item of property, plant and equipment is derecognized upon disposal or when no future economic benefits are expected to arise from the continued use of the asset. Any gain or loss arising on de-recognition of the property (calculated as the difference between the net disposal proceeds and the carrying amount of the asset) is included in profit or loss in the period in which the property is derecognized.
(12) Intangible assets ① Intangible assets acquired separately
Intangible assets with finite useful lives that are acquired separately are carried at cost, less accumulated amortization and accumulated impairment losses. Amortization is recognized on a straight-line basis over their estimated useful lives. The estimated useful life and amortization method are reviewed at the end of each reporting period, with the effect of any changes in estimate being accounted for on a prospective basis. Intangible assets with indefinite useful lives that are acquired separately are carried at cost, less accumulated impairment losses. ② Internally generated intangible assets - research and development expenditure
Expenditure on research activities is recognized as an expense in the period in which it is incurred. Expenditure arising from development (or from the development phase of an internal project) is recognized as an intangible asset if, and only if, the development project is designed to produce new or substantially improved products, and the Group can demonstrate the technical and economic feasibility and measure reliably the resources attributable to the intangible asset during its development. The amount initially recognized for internally generated intangible assets is the sum of the expenditure incurred from the date when the intangible asset first meets the recognition criteria. Where no internally generated intangible asset can be recognized, development expenditure is recognized in profit or loss in the period in which it is incurred. Subsequent to initial recognition, internally generated intangible assets are reported at cost, less accumulated amortization and accumulated impairment losses, on the same basis as intangible assets that are acquired separately.

SSANGYONG MOTOR COMPANY AND SUBSIDIARIES Notes to the Consolidated Financial Statements For the years ended December 31, 2018 and 2017
28
3. Significant Accounting Policies, Continued
(12) Intangible assets, continued ③ Derecognition of intangible assets
An intangible asset is derecognized on disposal or when no future economic benefits are expected from its use or disposal. Gains or losses arising from derecognition of an intangible asset, measured as the difference between the net disposal proceeds and the carrying amount of the asset, are recognized in profit or loss when the asset is derecognized.
(13) Impairment of property, plant and equipment and intangible assets except for goodwill
At the end of each reporting period, the Group reviews the carrying amounts of its tangible and intangible assets to determine whether there is any indication that those assets have suffered an impairment loss. If any such indication exists, the recoverable amount of the asset is estimated in order to determine the extent of the impairment loss (if any). Where it is not possible to estimate the recoverable amount of an individual asset, the Group estimates the recoverable amount of the cash-generating unit to which the asset belongs. Where a reasonable and consistent basis of allocation can be identified, corporate assets are also allocated to individual cash-generating units, or otherwise, they are allocated to the smallest group of cash-generating units for which a reasonable and consistent allocation basis can be identified.
Intangible assets with indefinite useful lives and intangible assets not yet available for use are tested for impairment at least annually, and whenever there is an indication that the asset may be impaired. Recoverable amount is the higher of fair value, less costs to sell, or value in use. In assessing value in use, the estimated future cash flows are discounted to their present value using a pretax discount rate that reflects current market assessments of the time value of money and the risks specific to the asset for which the estimates of future cash flows have not been adjusted. If the recoverable amount of an asset (or a cash-generating unit) is estimated to be less than its carrying amount, the carrying amount of the asset (or the cash-generating unit) is reduced to its recoverable amount. An impairment loss is recognized immediately in profit or loss, unless the relevant asset is carried at a revalued amount, in which case the impairment loss is treated as a revaluation decrease.
(14) Retirement benefit costs and termination benefits
For defined benefit retirement benefit plans, the cost of providing benefits is determined using the projected unit credit method, with actuarial valuations being carried out at the end of each reporting period. Remeasurement, comprising actuarial gains and losses, the effect of the changes to the asset ceiling (if applicable) and the return on plan assets (excluding interest), is reflected immediately in the separate statement of financial position with a charge or credit recognized in other comprehensive income in the period in which they occur. Remeasurement recognized in other comprehensive income is reflected immediately in retained earnings and will not be reclassified to profit or loss. Past service cost is recognized in profit or loss in the period of a plan amendment. Net interest is calculated by applying the discount rate at the beginning of the period to the net defined benefit liability or asset. Defined benefit costs are composed of service cost (including current service cost and past service cost, as well as gains and losses on curtailments and settlements), net interest expense (income) and remeasurement. The Group presents the service cost and net interest expense (income) components in profit or loss and the remeasurement component in other comprehensive income. Curtailment gains and losses are accounted for as past service costs.

SSANGYONG MOTOR COMPANY AND SUBSIDIARIES Notes to the Consolidated Financial Statements For the years ended December 31, 2018 and 2017
29
3. Significant Accounting Policies, Continued
(14) Retirement benefit costs and termination benefits, continued The retirement benefit obligation recognized in the separate statement of financial position represents the actual deficit or surplus in the Group’s defined benefit plans. Any surplus resulting from this calculation is limited to the present value of any economic benefits available in the form of refunds from the plans or reductions in future contributions to the plans. A liability for a termination benefit is recognized at the earlier of when the entity can no longer withdraw the offer of the termination benefit or when the entity recognizes any related restructuring costs. Discretionary contributions made by employees or third parties reduce service cost upon payment of these contributions to the plan. When the formal terms of the plans specify that there will be contributions from employees or third parties, the accounting depends on whether the contributions are linked to service, as follows: If the contributions are not linked to services (e.g., contributions are required to reduce a deficit arising from losses on plan assets or from actuarial losses), they are reflected in the remeasurement of the net defined benefit liability (asset). If contributions are linked to services, they reduce service costs. For the amount of contribution that is dependent on the number of years of service, the entity reduces service cost by attributing the contributions to periods of service using the attribution method required by K-IFRS 1019 paragraph 70 for the gross benefits. For the amount of contribution that is independent of the number of years of service, the entity reduces service cost in the period in which the related service is rendered.
(15) Provisions
Provisions are recognized when the Group has a present obligation (legal or constructive) as a result of a past event, if it is probable that the Group will be required to settle the obligation and a reliable estimate can be made of the amount of the obligation. The amount recognized as a provision is the best estimate of the consideration required to settle the present obligation at the end of the reporting period, taking into account the risks and uncertainties surrounding the obligation. When a provision is measured using the cash flows estimated to settle the present obligation, its carrying amount is the present value of those cash flows (where the effect of the time value of money is material). The discount rate used is a pretax rate that reflects current market assessments of the time value of money and the risks specific to the liability. Where discounting is used, the increase in the provision due to the passage is recognized in profit or loss as borrowing cost. When some or all of the economic benefits required to settle a provision are expected to be recovered from a third party, a receivable is recognized as an asset if it is virtually certain that reimbursement will be received and the amount of the receivable can be measured reliably. At the end of each reporting period, the remaining provision balance is reviewed and assessed to determine if the current best estimate is being recognized. If the existence of an obligation to transfer economic benefit is no longer probable, the related provision is reversed during the period.

SSANGYONG MOTOR COMPANY AND SUBSIDIARIES Notes to the Consolidated Financial Statements For the years ended December 31, 2018 and 2017
30
3. Significant Accounting Policies, Continued (16) Lease
Leases are classified as finance leases whenever the terms of the lease transfer substantially all the risks and rewards of ownership to the lessee. All other leases are classified as operating leases.
① As a lessor Amounts due from lessees under finance leases are recognized as receivables at the amount of the Group’s net investment in the leases. Finance lease income is allocated to accounting periods so as to reflect a constant periodic rate of return on the Group’s net investment outstanding in respect of the leases. Rental income from operating leases is recognized on a straight-line basis over the term of the relevant lease. Initial direct costs incurred in negotiating and arranging an operating lease are added to the carrying amount of the leased asset and recognized on a straight-line basis over the lease term.
② As a lessee Assets held under finance leases are initially recognized as assets of the Group at their fair value at the inception of the lease or, if lower, at the present value of the minimum lease payments. The corresponding liability to the lessor is included in the separate statement of financial position as a finance lease obligation. Lease payments are apportioned between finance expenses and reduction of the lease obligation so as to achieve a constant rate of interest on the remaining balance of the liability. Finance expenses are recognized immediately in profit or loss, unless they are directly attributable to qualifying assets, in which case they are capitalized in accordance with the Group’s general policy on borrowing costs (see Note 3. (17)). Contingent rentals are recognized as expenses in the periods in which they are incurred. Operating lease payments are recognized as an expense on a straight-line basis over the lease term, except where another systematic basis is more representative of the time pattern in which economic benefits from the leased asset are consumed. Contingent rentals arising from operating leases are recognized as an expense in the period in which they are incurred.
In the event that lease incentives are received to enter into operating leases, such incentives are recognized as a liability. The aggregate benefit of incentives is recognized as a reduction of rental expense on a straight-line basis, except where another systematic basis is more representative of the time pattern in which economic benefits from the leased asset are consumed
(17) Borrowing costs
Borrowing costs directly attributable to the acquisition, construction or production of qualifying assets, which are assets that necessarily take a substantial period of time to get ready for their intended use or sale, are added to the cost of those assets, until such time as the assets are substantially ready for their intended use or sale. Investment income earned on the temporary investment of specific borrowings, pending their expenditure on qualifying assets, is deducted from the borrowing costs eligible for capitalization. All other borrowing costs are recognized in profit or loss in the period in which they are incurred.

SSANGYONG MOTOR COMPANY AND SUBSIDIARIES Notes to the Consolidated Financial Statements For the years ended December 31, 2018 and 2017
31
3. Significant Accounting Policies, Continued (18) Government grants
Government grants are not recognized until there is reasonable assurance that the Group will comply with the conditions attached to them and that the grants will be received. The benefit of a government loan at a below-market rate of interest is treated as a government grant, measured as the difference between proceeds received and the fair value of the loan based on prevailing market interest rates. Government grants related to assets are presented in the separate statement of financial position by deducting the grant from the carrying amount of the asset. The related grant is recognized in profit or loss over the life of a depreciable asset as a reduced depreciation expense. Government grants related to income are recognized in profit or loss on a systematic basis over the periods in which the Group recognizes as expenses the related costs for which the grants are intended to compensate. Government grants that are receivable as compensation for expenses or losses already incurred or for the purpose of giving immediate financial support to the Group with no future related costs are recognized in profit or loss in the period in which they become receivable.
(19) Taxation
Income tax expense represents the sum of the tax currently payable and deferred tax. ① Current tax The tax currently payable is based on taxable profit for the year. Taxable profit differs from profit as reported in the separate statement of comprehensive income because of items of income or expense that are taxable or deductible in other years and items that are never taxable or deductible. The Group’s liability for current tax is calculated using tax rates that have been enacted or substantively enacted by the end of the reporting period. ② Deferred tax Deferred tax is recognized on temporary differences between the carrying amounts of assets and liabilities in the financial statements and the corresponding tax bases used in the computation of taxable profit. Deferred tax liabilities are generally recognized for all taxable temporary differences.
Deferred tax assets are generally recognized for all deductible temporary differences to the extent it is probable that taxable profits will be available against which those deductible temporary differences can be utilized. Such deferred tax assets and liabilities are not recognized if the temporary difference arises from goodwill or from the initial recognition (other than in a business combination) of other assets and liabilities in a transaction that affects neither the taxable profit nor the accounting profit. Deferred tax liabilities are recognized for taxable temporary differences associated with investments in subsidiaries and associates and interests in joint ventures, except where the Group is able to control the reversal of the temporary difference and it is probable that the temporary difference will not reverse in the foreseeable future. Deferred tax assets arising from deductible temporary differences associated with such investments and interests are only recognized to the extent it is probable that there will be sufficient taxable profits against which the benefits of the temporary differences can be utilized and they are expected to reverse in the foreseeable future.

SSANGYONG MOTOR COMPANY AND SUBSIDIARIES Notes to the Consolidated Financial Statements For the years ended December 31, 2018 and 2017
32
3. Significant Accounting Policies, Continued
(19) Taxation, continued The carrying amount of deferred tax assets is reviewed at the end of each reporting period and reduced to the extent it is no longer probable that sufficient taxable profits will be available to allow all or part of the asset to be recovered. Deferred tax assets and liabilities are measured at the tax rates that are expected to apply in the period in which the liability is settled or the asset realized, based on tax rates (and tax laws) that have been enacted or substantively enacted by the end of the reporting period. The measurement of deferred tax liabilities and assets reflects the tax consequences that would follow from the manner in which the Group expects, at the end of the reporting period, to recover or settle the carrying amount of its assets and liabilities. Deferred tax assets and liabilities are offset if, and only if, the Group has a legally enforceable right to set off current tax assets against current tax liabilities and the deferred tax assets and liabilities relate to income taxes levied by the same taxation authority on either the same taxable entity or different taxable entities that intend either to settle current tax liabilities and assets on a net basis or to realize the assets and settle the liabilities simultaneously in each future period in which significant amounts of deferred tax liabilities or assets are expected to be settled or recovered. For the purpose of measuring deferred tax liabilities and deferred tax assets for investment properties that are measured using the fair value model, the carrying amounts of such properties are presumed to be recovered entirely through sale, unless the presumption is rebutted. The presumption is rebutted when the investment property is depreciable and is held within a business model whose objective is to consume substantially all of the economic benefits embodied in the investment properties over time, rather than through sale.
③ Current and deferred taxes for the year Current and deferred tax are recognized in profit or loss, except when they relate to items that are recognized in other comprehensive income or directly in equity, in which case the current and deferred taxes are also recognized in other comprehensive income or directly in equity, respectively. Where current tax or deferred tax arises from the initial accounting for a business combination, the tax effect is included in the accounting for the business combination.

SSANGYONG MOTOR COMPANY AND SUBSIDIARIES Notes to the Consolidated Financial Statements For the years ended December 31, 2018 and 2017
33
3. Significant Accounting Policies, Continued
(20) Fair value
Fair value is the price that would be received to sell an asset or paid to transfer a liability in an orderly transaction between market participants at the measurement date, regardless of whether that price is directly observable or estimated using another valuation technique. In estimating the fair value of an asset or a liability, the Group takes into account the characteristics of the asset or liability if market participants would take those characteristics into account when pricing the asset or liability at the measurement date. Fair value for measurement and/or disclosure purposes in these separate financial statements is determined on such a basis, except for share-based payment transactions that are within the scope of K-IFRS 1102 Share-based payment; leasing transactions that are within the scope of K-IFRS No. 1017 Leases; and measurements that have some similarities to fair value, but are not fair value, such as net realizable value in K-IFRS 1002 Inventories or value in use in K-IFRS 1036 Impairment of Assets. In addition, for financial reporting purposes, fair value measurements are categorized into Level 1, 2 or 3 based on the degree to which the inputs to the fair value measurements are observable and the significance of the inputs to the fair value measurement in its entirety, which are described as follows:
a. Level 1 inputs are quoted prices (unadjusted) in active markets for identical assets or liabilities that the
entity can access at the measurement date; b. Level 2 inputs, other than quoted prices included within Level 1, that are observable for the asset or
liability, either directly or indirectly; and c. Level 3 inputs are unobservable inputs for the asset or liability.
(21) Segment information
Segment information is presented in the same format as the reporting material presented to the Group’s management. The Group’s management is liable for the assessment of the resources to be allocated to the business segments and the performance results of the business segments.
(22) Accounting Treatment related to the Emission Rights Cap and Trade Scheme
The Group classifies the emission rights as intangible assets. Emission right allowances the government allocated free of charge are measured at W 0, and emission right allowances purchased are measured at cost that the Group paid to purchase the allowances. If emission rights that the government allocated free of charge are sufficient to settle the emission rights allowances allotted for vintage year, the emissions liabilities are measured at W 0. However, for the emission liabilities that exceed the allowances allocated free of charge, the shortfall is measured at best estimate at the end of the reporting period.
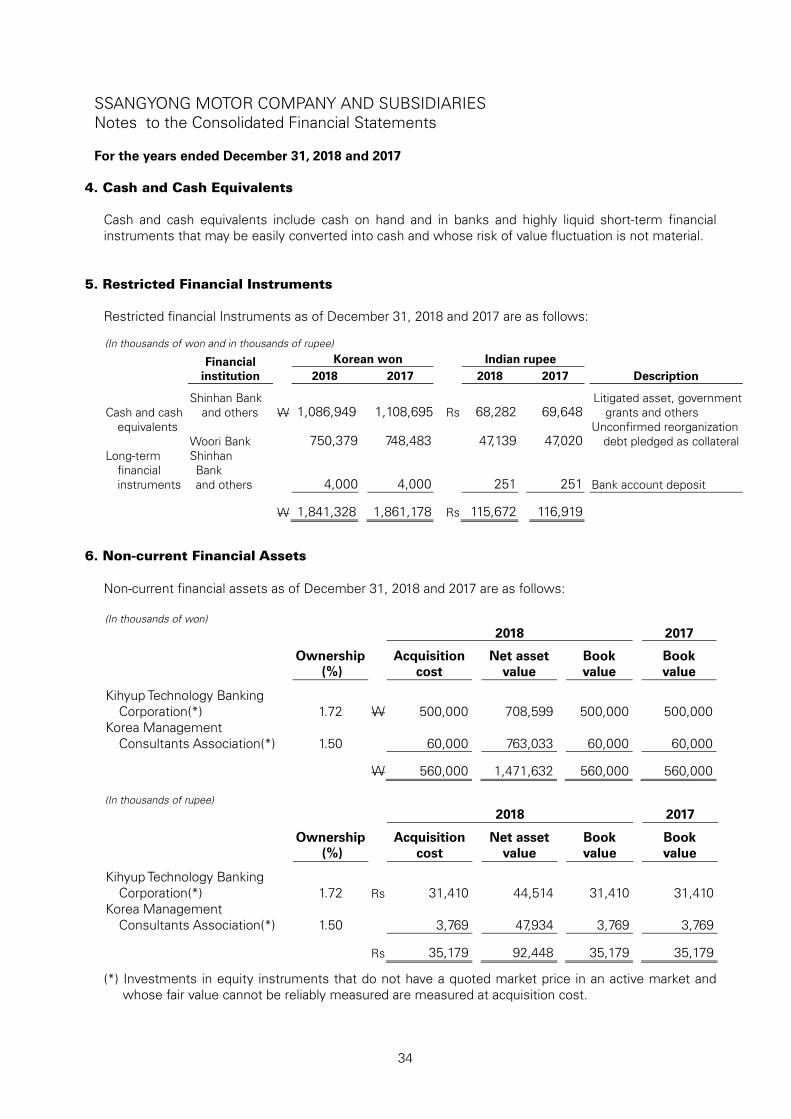
SSANGYONG MOTOR COMPANY AND SUBSIDIARIES Notes to the Consolidated Financial Statements For the years ended December 31, 2018 and 2017
34
4. Cash and Cash Equivalents
Cash and cash equivalents include cash on hand and in banks and highly liquid short-term financial instruments that may be easily converted into cash and whose risk of value fluctuation is not material.
5. Restricted Financial Instruments
Restricted financial Instruments as of December 31, 2018 and 2017 are as follows: (In thousands of won and in thousands of rupee) Financial
institution Korean won Indian rupee
2018 2017 2018 2017 Description
Cash and cash equivalents
Shinhan Bank and others W 1,086,949 1,108,695 Rs 68,282 69,648
Litigated asset, government grants and others
Woori Bank 750,379 748,483 47,139 47,020 Unconfirmed reorganization
debt pledged as collateral Long-term
financial instruments
Shinhan Bank and others 4,000 4,000 251 251 Bank account deposit
W 1,841,328 1,861,178 Rs 115,672 116,919
6. Non-current Financial Assets
Non-current financial assets as of December 31, 2018 and 2017 are as follows: (In thousands of won) 2018 2017
Ownership (%)
Acquisition cost
Net asset value
Book value
Book value
Kihyup Technology Banking Corporation(*) 1.72 W 500,000 708,599 500,000 500,000
Korea Management Consultants Association(*) 1.50 60,000 763,033 60,000 60,000
W 560,000 1,471,632 560,000 560,000
(In thousands of rupee)
2018 2017
Ownership (%)
Acquisition cost
Net asset value
Book value
Book value
Kihyup Technology Banking Corporation(*) 1.72 Rs 31,410 44,514 31,410 31,410
Korea Management Consultants Association(*) 1.50 3,769 47,934 3,769 3,769
Rs 35,179 92,448 35,179 35,179
(*) Investments in equity instruments that do not have a quoted market price in an active market and whose fair value cannot be reliably measured are measured at acquisition cost.

SSANGYONG MOTOR COMPANY AND SUBSIDIARIES Notes to the Consolidated Financial Statements For the years ended December 31, 2018 and 2017
35
7. Trade and Other Receivables
(1) Details of trade and other receivables as of December 31, 2018 and 2017 are as follows: (In thousands of won) 2018 2017
Current Non-current Current Non-current Trade receivables W 157,304,034 1,332,414 187,191,428 539,605 Less: Allowance for doubtful accounts (122,904) (1,395) (126,715) - Other receivables 8,760,688 147,500 8,562,086 147,594 Less: Allowance for doubtful accounts (3,918,799) (44,250) (3,723,780) (44,250) Loans and others 12,180,936 33,690,667 11,925,878 33,322,232 Less: Allowance for doubtful accounts - (357) (4,078) (11,334) W 174,203,955 35,124,579 203,824,819 33,953,847
(In thousands of rupee) 2018 2017
Current Non-current Current Non-current Trade receivables Rs 9,881,839 83,702 11,759,366 33,898 Less: Allowance for doubtful accounts
(7,720) (88) (7,960) -
Other receivables 550,346 9,266 537,870 9,272 Less: Allowance for doubtful accounts (246,179) (2,780) (233,928) (2,780) Loans and others 765,206 2,116,448 749,182 2,093,303 Less: Allowance for doubtful accounts - (22) (256) (712)
Rs 10,943,492 2,206,526 12,804,274 2,132,981
(2) Details of aging analysis of the trade and other receivables as of December 31, 2018 and 2017 are as
follows: (In thousands of won) 2018 2017
Trade receivables Others(*)
Trade receivables Others(*)
Not past due W 158,545,766 50,741,857 187,731,033 50,086,202 Less than 30 days - - - - More than 60 days - - - - More than 90 days 90,682 4,037,934 - 3,871,588 W 158,636,448 54,779,791 187,731,033 53,957,790
(In thousands of rupee) 2018 2017
Trade receivables Others(*)
Trade receivables Others(*)
Not past due Rs 9,959,845 3,187,603 11,793,264 3,146,415 Less than 30 days - - - - More than 60 days - - - - More than 90 days 5,696 253,663 - 243,212 Rs 9,965,541 3,441,266 11,793,264 3,389,627 (*) Others consist of other receivables, loans and others.

SSANGYONG MOTOR COMPANY AND SUBSIDIARIES Notes to the Consolidated Financial Statements For the years ended December 31, 2018 and 2017
36
7. Trade and Other Receivables, Continued
(3) Changes in allowance for trade and other receivables for the years ended December 31, 2018 and 2017 are as follows:
(In thousands of won)
2018 2017
Trade
receivables Others Trade
receivables Others Beginning balance W 126,715 3,783,442 93,208 123,730
Bad debt expense - 195,019 33,507 3,723,115 Reversal of allowance for bad debts (2,416) (15,055) - (63,403)
Ending balance W 124,299 3,963,406
126,715
3,783,442
(In thousands of rupee) 2018 2017
Trade
receivables Others Trade
receivables Others Beginning balance Rs 7,960 237,676 5,855 7,773
Bad debt expense - 12,251 2,105 233,886 Reversal of allowance for bad debts (152) (946) - (3,983)
Ending balance Rs 7,808 248,981 7,960 237,676
8. Inventories
Details of inventories as of December 31, 2018 and 2017 are as follows: (In thousands of won and in thousands of rupee)
Korean won Indian rupee 2018 2017 2018 2017 Merchandises W 44,349,645 38,056,984 Rs 2,786,045 2,390,740 Finished goods 83,787,753 66,624,320 5,263,547 4,185,340 Work-in-process 27,069,755 29,867,552 1,700,522 1,876,280 Raw materials 31,654,571 33,097,439 1,988,540 2,079,181 Sub-materials 413,615 414,413 25,983 26,033 Supplies 3,611,193 3,632,719 226,855 228,207 Goods in transit 37,725,938 56,681,002 2,369,943 3,560,701 W 228,612,470 228,374,429 Rs 14,361,435 14,346,482
The Group has measured inventories at the lower of cost or net realizable value. The allowance for valuation of inventories amounted to W 44,193,010 thousand (Rs 2,776,205 thousand) for the year ended December 31, 2018. The loss on valuation of inventories amounted to W 8,278,944 thousand (Rs 520,083 thousand) and W 3,103,515 thousand (Rs 194,963 thousand) for the years ended December 31, 2018 and 2017 is included in cost of sales.

SSANGYONG MOTOR COMPANY AND SUBSIDIARIES Notes to the Consolidated Financial Statements For the years ended December 31, 2018 and 2017
37
9. Investments in Subsidiaries and a Joint venture
(1) Details of investment in subsidiaries and a joint venture as of December 31, 2018 and 2017 are as follows:
(In thousands of won)
Company Location Owner
ship Closing month Industry
Subsidiaries Ssangyong Motor (Shanghai) Co., Ltd. China 100% December Sales of
automobile Ssangyong European Parts Center B.V. Netherlands 100% December A/S and sales
Ssangyong Australia Pty Ltd.(*1) Australia 100% December Sales of
automobile Joint venture SY Auto Capital Co., Ltd.(*2) Korea 51% December Finance
(*1) Ssangyong Australia Pty Ltd. was established in the current period and invested W2,950,833 thousand equivalent of 100.00% in equity. (*2) SY Auto Capital Co., Ltd. were established under joint venture agreement as a joint venture since the Group has rights only to the net assets, and their legal structures of arrangements are separated. (2) Changes in the carrying amounts of investments in a joint venture for the year ended December 31,
2018 is as follows: (In thousands of won)
Beginning
balance
Share of profit of a
joint venture
Changes in defined benefit plan
re-measurements Ending balance
Ssangyong Motor (Shanghai) Co., Ltd. W 15,063,851 1,719,303 (76,809) 16,706,345
(In thousands of rupee)
Beginning
balance
Share of profit of a
joint venture
Changes in defined benefit plan
re-measurements Ending balance
Ssangyong Motor (Shanghai) Co., Ltd. Rs 946,312 108,007 (4,825) 1,049,493
(3) Summarized financial information of subsidiaries and a joint venture
1) The summarized financial information of the Group’s subsidiaries and joint venture as of and for the year ended December 31, 2018 is as follows:
(In thousands of won) 2018
Assets Liabilities Equity
Sales Net income
(loss) Ssangyong Motor (Shanghai)
Co., Ltd. W 857,388 559,977 297,411 117,767 (770,177) Ssangyong European Parts
Center B.V. 10,573,792 13,824,773 (3,250,981) 19,240,893 157,039 Ssangyong Australia Pty Ltd. 11,298,929 10,826,727 472,202 3,311,392 (2,455,680) SY Auto Capital Co., Ltd.(*) 89,948,057 58,812,195 31,135,862 13,564,131 2,728,552

SSANGYONG MOTOR COMPANY AND SUBSIDIARIES Notes to the Consolidated Financial Statements For the years ended December 31, 2018 and 2017
38
9. Investments in Subsidiaries and a Joint venture, Continued
(3) Summarized financial information of subsidiaries and a joint venture, continued
(In thousands of rupee) 2018
Assets Liabilities Equity
Sales Net income
(loss) Ssangyong Motor (Shanghai)
Co., Ltd. Rs 53,861 35,178 18,683 7,398 (48,383) Ssangyong European Parts
Center B.V. 664,246 868,473 (204,227) 1,208,713 9,865 Ssangyong Australia Pty Ltd. 709,799 680,135 29,664 208,022 (154,266) SY Auto Capital Co., Ltd.(*) 5,650,537 3,694,582 1,955,955 852,099 171,408
(*) Additional financial information for the joint venture for the year ended December 31, 2018 is as follows: (In thousands of won)
Cash and cash
equivalents Financial liabilities Depreciation
Interest income
Interest expense
Income tax expense
SY Auto Capital Co., Ltd. W 2,032,075 57,730,337 821,860 2,356,269 1,298,471 914,140
(In thousands of rupee)
Cash and cash
equivalents Financial liabilities Depreciation
Interest income
Interest expense
Income tax expense
SY Auto Capital Co., Ltd. Rs 127,655 3,626,620 51,629 148,021 81,570 57,426 2) The summarized financial information of the Group’s subsidiaries and a joint venture as of and for the year ended 2017 is as follows:
(In thousands of won) 2017
Assets Liabilities Equity
Sales Net income
(loss) Ssangyong Motor
(Shanghai) Co., Ltd. W 1,580,643 524,158 1,056,485 18,892 (1,190,972) Ssangyong European
Parts Center B.V. 12,283,604 15,689,509 (3,405,905) 17,735,781 145,124 SY Auto Capital Co.,
Ltd.(*) 79,844,693 51,070,952 28,773,741 10,767,932 2,489,859
(In thousands of rupee) 2017
Assets Liabilities Equity
Sales Net income
(loss) Ssangyong Motor
(Shanghai) Co., Ltd. Rs 99,296 32,928 66,368 1,187 (74,817) Ssangyong European
Parts Center B.V. 771,656 985,615 (213,959) 1,114,162 9,117 SY Auto Capital Co.,
Ltd.(*) 5,015,844 3,208,277 1,807,567 676,441 156,413

SSANGYONG MOTOR COMPANY AND SUBSIDIARIES Notes to the Consolidated Financial Statements For the years ended December 31, 2018 and 2017
39
9. Investments in Subsidiaries and a Joint venture, Continued
(3) Summarized financial information of subsidiaries and a joint venture, continued
(*) Additional financial information for the joint venture for the year ended 2017 is as follows: (In thousands of won)
Cash and cash
equivalents Financial liabilities Depreciation
Interest income
Interest expense
Income tax expense
SY Auto Capital Co., Ltd. W 10,192,682 50,642,190 798,151 1,375,672 842,319 645,729
(In thousands of rupee)
Cash and cash
equivalents Financial liabilities Depreciation
Interest income
Interest expense
Income tax expense
SY Auto Capital Co., Ltd. Rs 640,304 3,181,342 50,140 86,420 52,914 40,565
(4) Reconciliation from the net assets of the Group’s joint venture to the carrying amount of investments
in joint venture as of December 31, 2018 is as follows:
(In thousands of won) Net assets
Percentage of ownership
Share of the net assets of the Group Reconciliation
Carrying amount
SY Auto Capital Co., Ltd. W 31,135,862 51.00% 15,879,290 827,055 16,706,345
(In thousands of rupee)
Net assets Percentage of
ownership Share of the net
assets of the Group Reconciliation Carrying amount
SY Auto Capital Co., Ltd. Rs 1,955,955 51.00% 997,537 51,956 1,049,493
10. Other Assets
Details of other assets as of December 31, 2018 and 2017 are as follows: (In thousands of won and in thousands of rupee)
Korean won Indian rupee 2018 2017 2018 2017 Other current assets Advance payments W 1,028,309 1,750,943 Rs 64,598 109,994 Prepaid expenses 9,947,199 5,464,706 624,884 343,294 Current tax assets 324,294 332,593 20,372 20,893
11,299,802 7,548,242 709,854 474,181 Other non-current assets Other non-current assets W 291,258 273,283 Rs 18,297 17,168

SSANGYONG MOTOR COMPANY AND SUBSIDIARIES Notes to the Consolidated Financial Statements For the years ended December 31, 2018 and 2017
40
11. Property, Plant and Equipment
(1) Details of property, plant and equipment as of December 31, 2018 and 2017 are as follows: (In thousands of won) 2018
Acquisition
cost Government
grants Accumulated depreciation
Accumulated impairment
losses Book value Land W 475,116,992 (7,354) - - 475,109,638 Buildings 550,322,646 (3,734,723) (228,576,444) (148,366,786) 169,644,693 Structures 112,176,542 (90,063) (65,850,786) (28,862,964) 17,372,729 Machinery 1,276,272,698 (166,908) (1,023,019,261) (92,390,513) 160,696,016 Vehicles 8,195,311 (5,878) (5,821,277) (516,742) 1,851,414 Tools and molds 1,261,396,400 (24,038) (826,949,338) (157,469,741) 276,953,283 Equipment 69,709,884 (74,248) (52,108,182) (3,203,583) 14,323,871 Construction in progress 110,855,937 - - - 110,855,937 Machinery in transit 1,318,137 - - - - 1,318,137
W 3,865,364,547 (4,103,212) (2,202,325,288) (430,810,329) 1,228,125,718
(In thousands of won) 2017
Acquisition cost
Government grants
Accumulated depreciation
Accumulated impairment
losses Book value Land W 475,062,920 - - - 475,062,920 Buildings 543,207,391 (1,845,609) (217,544,488) (148,366,786) 175,450,508 Structures 109,871,927 (111,068) (64,129,824) (28,913,882) 16,717,153 Machinery 1,298,011,168 (261,084) (1,033,241,296) (95,508,817) 168,999,971 Vehicles 7,730,749 (7,411) (5,939,980) (583,550) 1,199,808 Tools and molds 1,200,844,395 (31,214) (743,644,745) (158,770,322) 298,398,114 Equipment 67,614,131 (42,425) (47,783,836) (3,354,079) 16,433,791 Construction in progress 87,441,686 - - - 87,441,686 W 3,789,784,367 (2,298,811) (2,112,284,169) (435,497,436) 1,239,703,951

SSANGYONG MOTOR COMPANY AND SUBSIDIARIES Notes to the Consolidated Financial Statements For the years ended December 31, 2018 and 2017
41
11. Property, Plant and Equipment, Continued
(1) Details of property, plant and equipment as of December 31, 2018 and 2017 are as follows, continued:
(In thousands of rupee) 2018
Acquisition
cost Government
grants Accumulated depreciation
Accumulated impairment
losses Book value Land Rs 29,846,849 (462) - - 29,846,387 Buildings 34,571,269 (234,616) (14,359,172) (9,320,401) 10,657,080 Structures 7,046,930 (5,658) (4,136,747) (1,813,171) 1,091,354 Machinery 80,175,451 (10,485) (64,266,070) (5,803,972) 10,094,924 Vehicles 514,829 (369) (365,693) (32,462) 116,305 Tools and molds 79,240,922 (1,510) (51,948,957) (9,892,249) 17,398,206 Equipment 4,379,175 (4,664) (3,273,436) (201,250) 899,825 Construction in progress 6,963,971 - - - 6,963,972 Machinery in transit 82,805 - - - 82,805 Rs 242,822,201 (257,764) (138,350,075) (27,063,505) 77,150,858
(In thousands of rupee) 2017
Acquisition cost
Government grants
Accumulated depreciation
Accumulated impairment
losses Book value Land Rs 29,843,453 - - - 29,843,453 Buildings 34,124,288 (115,941) (13,666,145) (9,320,401) 11,021,801 Structures 6,902,154 (6,977) (4,028,636) (1,816,370) 1,050,171 Machinery 81,541,062 (16,401) (64,908,218) (5,999,864) 10,616,579 Vehicles 485,646 (466) (373,150) (36,659) 75,371 Tools and molds 75,437,045 (1,961) (46,715,762) (9,973,952) 18,745,370 Equipment 4,247,519 (2,665) (3,001,780) (210,703) 1,032,370 Construction in progress 5,493,087 - - - 5,493,087 Rs 238,074,254 (144,411) (132,693,691) (27,357,949) 77,878,202

SSANGYONG MOTOR COMPANY AND SUBSIDIARIES Notes to the Consolidated Financial Statements For the years ended December 31, 2018 and 2017
42
11. Property, Plant and Equipment, Continued (2) Changes in property, plant and equipment for the years ended December 31, 2018 and 2017 are as follows:
(In thousands of won) 2018 Beginning
balance Acquisition Disposal Depreciation Others(*) Ending balance
Land W 475,062,920 54,072 - - (7,354) 475,109,638 Buildings 175,450,508 245,602 (352) (10,958,093) 4,907,028 169,644,693 Structures 16,717,153 509,016 (3) (1,719,493) 1,866,056 17,372,729 Machinery 168,999,971 33,906 (96,855) (32,913,358) 24,672,352 160,696,016 Vehicles 1,199,808 114,689 (257,180) (415,684) 1,209,781 1,851,414 Tools and molds 298,398,114 897,900 (224,932) (89,610,504) 67,492,705 276,953,283 Equipment 16,433,791 3,901,949 (147,314) (6,156,278) 291,723 14,323,871 Construction in progress 87,441,686 123,665,274 - - (100,251,023) 110,855,937 Machinery in transit - 1,318,137 - - - 1,318,137 W 1,239,703,951 130,740,545 (726,636) (141,773,410) 181,268 1,228,125,718
(In thousands of won) 2017
Beginning
balance Acquisition Disposal Depreciation Others(*) Ending balance
Land W 475,072,283 73,126 (82,489) - - 475,062,920 Buildings 181,592,388 208,020 (1,039) (10,618,327) 4,269,466 175,450,508 Structures 16,779,735 786,249 (7,845) (1,681,746) 840,760 16,717,153 Machinery 173,322,039 44,987 (105,279) (31,100,022) 26,838,246 168,999,971 Vehicles 1,034,519 244,577 (5,264) (431,444) 357,420 1,199,808 Tools and molds 227,760,362 4,905,915 (610,423) (77,389,074) 143,731,334 298,398,114 Equipment 19,249,890 3,325,503 (51,121) (6,905,811) 815,330 16,433,791 Construction in progress 103,179,053 158,642,593 - - (174,379,960) 87,441,686 Machinery in transit 1,016,181 389,149 - - (1,405,330) - W 1,199,006,450 168,620,119 (863,460) (128,126,424) 1,067,266 1,239,703,951
(*) Capitalized borrowing costs in respect of construction in progress is W 1,073,366 thousand (2017: W 950,290 thousand) and W 1,171,678 thousand (2017: W 251,882 thousand) was transferred from inventory to vehicles during the year ended December 31, 2018. The government grants amounting to W 2,012,470 thousand (2017: W 133,034 thousand) used for asset acquisition and the effect of exchange rate fluctuation was included in others during the year ended December 31, 2018.

SSANGYONG MOTOR COMPANY AND SUBSIDIARIES Notes to the Consolidated Financial Statements For the years ended December 31, 2018 and 2017
43
11. Property, Plant and Equipment, Continued (2) Changes in property, plant and equipment for the years ended December 31, 2018 and 2017 are as follows,
continued:
(In thousands of rupee) 2018 Beginning
balance Acquisition Disposal Depreciation Others (*) Ending balance
Land Rs 29,843,453 3,396 - - (462) 29,846,387 Buildings 11,021,801 15,430 (23) (688,387) 308,259 10,657,080 Structures 1,050,171 31,976 - (108,019) 117,226 1,091,354 Machinery 10,616,579 2,129 (6,084) (2,067,617) 1,549,917 10,094,924 Vehicles 75,371 7,205 (16,156) (26,113) 75,998 116,305 Tools and molds 18,745,370 56,406 (14,130) (5,629,332) 4,239,892 17,398,206 Equipment 1,032,370 245,120 (9,254) (386,738) 18,327 899,825 Construction in progress 5,493,087 7,768,654 - - (6,297,769) 6,963,972 Machinery in transit - 82,805 - - - 82,805 Rs 77,878,202 8,213,121 (45,647) (8,906,206) 11,388 77,150,858
(In thousands of rupee) 2017
Beginning balance Acquisition Disposal Depreciation Others(*)
Ending balance
Land Rs 29,844,041 4,594 (5,182) - - 29,843,453 Buildings 11,407,633 13,068 (65) (667,043) 268,208 11,021,801 Structures 1,054,101 49,392 (492) (105,647) 52,817 1,050,171 Machinery 10,888,090 2,827 (6,614) (1,953,703) 1,685,979 10,616,579 Vehicles 64,988 15,364 (331) (27,103) 22,453 75,371 Tools and molds 14,307,906 308,191 (38,347) (4,861,582) 9,029,202 18,745,370 Equipment 1,209,278 208,908 (3,211) (433,824) 51,219 1,032,370 Construction in progress 6,481,709 9,965,927 - - (10,954,549) 5,493,087 Machinery in transit 63,837 24,446 - - (88,283) - Rs 75,321,583 10,592,717 (54,242) (8,048,902) 67,046 77,878,202
(*) Capitalized borrowing costs in respect of construction in progress is Rs 67,429 thousand (2017: Rs
59,697 thousand) and Rs 73,605 thousand (2017: Rs 15,823 thousand) was transferred from inventory to vehicles for the year ended December 31, 2018. The government grants amounting to Rs 126,423 thousand (2017: Rs 8,357 thousand) used for asset acquisition and the effect of exchange rate fluctuation was included in others for the year ended December 31, 2018.

SSANGYONG MOTOR COMPANY AND SUBSIDIARIES Notes to the Consolidated Financial Statements For the years ended December 31, 2018 and 2017
44
11. Property, Plant and Equipment, Continued (3) Details of pledged assets provided as collateral for the borrowings as of December 31, 2018 are as follows:
(In thousands of won and in thousands of rupee)
Korean won Indian rupee
Book value Collateralized
amount Book value Collateralized
amount Land W 340,125,850
207,000,000 Rs 21,366,706
13,003,740 Buildings and structures 53,980,814 3,391,075
Machinery and others 39,574 2,486 W 394,146,238 207,000,000 Rs 24,760,267 13,003,740
(4) Capitalized borrowing costs and capitalization interest rate for the years ended December 31, 2018 and
2017 are as follows:
(In thousands of won and in thousands of rupee)
Korean won Indian rupee 2018 2017 2018 2017 Capitalized interest expenses(*) W 3,724,107 3,023,949 Rs 233,949 189,964 Capitalization interest rate 3.35% 3.22% 3.35% 3.22%
(*) Capitalized borrowing costs for intangible assets are W 2,650,741 thousand (Rs 166,520 thousand) and W 2,073,659 thousand (Rs 130,267 thousand) for the years ended December 31, 2018 and 2017, respectively.

SSANGYONG MOTOR COMPANY AND SUBSIDIARIES Notes to the Consolidated Financial Statements For the years ended December 31, 2018 and 2017
45
12. Intangible Assets
(1) Details of intangible assets as of December 31, 2018 and 2017 are as follows:
(In thousands of won) 2018
Acquisition
cost Government
grants Accumulated amortization
Accumulated impairment
losses Book value Development cost W 345,185,015 - (182,160,013) - 163,025,002 Patents 4,360,730 (11,559) (2,907,159) (107,788) 1,334,224 Other intangible assets 221,383,685 (6,186) (30,567,312) (1,409,450) 189,400,737 W 570,929,430 (17,745) (215,634,484) (1,517,238) 353,759,963
(In thousands of won) 2017
Acquisition
cost Government
grants Accumulated amortization
Accumulated impairment
losses Book value Development cost W 304,955,420 - (115,794,054) - 189,161,366 Patents 3,984,136 (18,286) (2,294,527) (78,338) 1,592,985 Other intangible assets
139,841,157 (20,628) (26,943,689) (362,469) 112,514,371
W 448,780,713 (38,914) (145,032,270) (440,807) 303,268,722
(In thousands of rupee) 2018
Acquisition
cost Government
grants Accumulated amortization
Accumulated impairment
losses Book value Development cost Rs 21,684,523 - (11,443,293) - 10,241,230 Patents 273,941 (726) (182,628) (6,771) 83,816 Other intangible assets 13,907,323 (389) (1,920,237) (88,542) 11,898,155 Rs 35,865,787 (1,115) (13,546,158) (95,313) 22,223,201
(In thousands of rupee) 2017
Acquisition
cost Government
grants Accumulated amortization
Accumulated impairment
losses Book value Development cost Rs 19,157,299 - (7,274,182) - 11,883,117 Patents 250,284 (1,149) (144,142) (4,921) 100,072 Other intangible assets
8,784,821 (1,296) (1,692,603) (22,770) 7,068,152
Rs 28,192,404 (2,445) (9,110,927) (27,691) 19,051,341

SSANGYONG MOTOR COMPANY AND SUBSIDIARIES Notes to the Consolidated Financial Statements For the years ended December 31, 2018 and 2017
46
12. Intangible Assets, Continued (2) Changes in intangible assets for the years ended December 31, 2018 and 2017 are as follows:
(In thousands of won) 2018
Beginning
balance Acquisition Disposal Amortization Impairment Transfer
Others (*)
Ending balance
Internally created intangible assets: Development
cost W 189,161,366 - - (66,365,959) - 40,229,595 - 163,025,002 Other
intangible assets 104,765,438 115,704,215 - - (1,046,981) (40,229,595) 2,650,742 181,843,819
W 293,926,804 115,704,215 - (66,365,959) (1,046,981) - 2,650,742 344,868,821 Individually acquired intangible assets: Patents 1,592,985 376,594 - (605,905) (29,450) - - 1,334,224 Other
intangible assets 7,748,933 3,417,166 - (3,609,181) - - - 7,556,918
9,341,918 3,793,760 - (4,215,086) (29,450) - - 8,891,142
W 303,268,722 119,497,975 - (70,581,045) (1,076,431) - 2,650,742 353,759,963
(In thousands of won) 2017
Beginning
balance Acquisition
Disposal Amortization Impairment Transfer Others
(*) Ending balance
Internally created intangible assets: Development
cost W 101,512,605 - - (46,513,168) - 134,161,929 - 189,161,366 Other
intangible assets 123,384,189 113,469,519 - - - (134,161,929) 2,073,659 104,765,438
W 224,896,794 - 113,469,519 - (46,513,168) - - 2,073,659 293,926,804 Individually acquired intangible assets: Patents 1,709,533 495,075 - (587,912) (23,711) - - 1,592,985 Other
intangible assets 7,738,171 4,293,048 (763,636) (3,732,285) 213,635 - - 7,748,933
9,447,704 4,788,123 (763,636) (4,320,197) 189,924 - - 9,341,918 W 234,344,498 118,257,642 (763,636) (50,833,365) 189,924 - 2,073,659 303,268,722
(*) Capitalized borrowing costs in respect of other intangible assets is W 2,650,741 thousand and W 2,073,659 thousand for the years ended December 31, 2018 and 2017, respectively.

SSANGYONG MOTOR COMPANY AND SUBSIDIARIES Notes to the Consolidated Financial Statements For the years ended December 31, 2018 and 2017
47
12. Intangible Assets, Continued (2) Changes in intangible assets for the years ended December 31, 2018 and 2017 are as follows, continued:
(In thousands of rupee) 2018
Beginning
balance Acquisition
Disposal Amortization Impairment Transfer Others(*) Ending balance
Internally created intangible assets: Development
cost Rs 11,883,117 - - (4,169,110) - 2,527,223 - 10,241,230 Other
intangible assets 6,581,365 7,268,539 - - (65,770) (2,527,223) 166,520 11,423,431
Rs 18,464,482 7,268,539 - (4,169,110) (65,770) - 166,520 21,664,661 Individually acquired intangible assets: Patents 100,072 23,658 - (38,063) (1,851) - - 83,816 Other intangible assets 486,787 214,665 - (226,728) - - - 474,724
586,859 238,323 - (264,791) (1,851) - - 558,540 Rs 19,051,340 7,506,862 - (4,433,901) (67,620) - 166,520 22,223,201
(In thousands of rupee) 2017
Beginning
balance Acquisition
Disposal Amortization Impairment Transfer Others(*) Ending balance
Internally created intangible assets: Development
cost Rs 6,377,022 - - (2,921,957) - 8,428,052 - 11,883,117 Other
intangible assets 7,750,994 7,128,155 - - - (8,428,052) 130,268 6,581,365
Rs 14,128,016 7,128,155 - (2,921,957) - - 130,268 18,464,482 Individually acquired intangible assets: Patents 107,393 31,101 - (36,933) (1,490) - - 100,071 Other intangible assets 486,112 269,689 (47,972) (234,462) 13,421 - - 486,788
593,505 300,790 (47,972) (271,395) 11,931 - - 586,859 Rs 14,721,521 7,428,945 (47,972) (3,193,352) 11,931 - 130,268 19,051,341
(*) Capitalized borrowing costs in respect of other intangible assets is Rs 166,520 thousand and Rs 130,268 thousand for the years ended December 31, 2018 and 2017, respectively.

SSANGYONG MOTOR COMPANY AND SUBSIDIARIES Notes to the Consolidated Financial Statements For the years ended December 31, 2018 and 2017
48
12. Intangible Assets, Continued (3) Details of capitalized development costs as of December 31, 2018 are as follows:
(In thousands of won and in thousands of rupee)
Project name
Korean won
Indian rupee
Remaining amortization
period(*1) Development cost RV(*1) W 139,065,824 Rs 8,736,115 1~4 years Power train and others 23,959,178 1,505,116 1~4 years Other intangible assets RV(*2) 164,494,424 10,333,540 -
Power train and others 17,349,394 1,089,890 - W 344,868,820 Rs 21,664,661 (*1) If the amortization is initiated, the remaining amortization period is recorded. If the amortization is
not started, it is marked with "-" only. (*2) It is a development project for vehicles under sale as of December 31, 2018. (*3) On-going development project for vehicles as of December 31, 2018 to respond to consumer needs and market conditions.
(4) Details of expenditures for research and developments for the years ended December 31, 2018 and
2017 are as follows:
(In thousands of won and in thousands of rupee)
Korean won Indian rupee 2018 2017 2018 2017 Capitalization of intangible assets W 118,354,956 115,543,178 Rs 7,435,059 7,258,422 Manufacturing costs 69,401,524 56,080,698 4,359,804 3,522,989 Selling and administrative expenses 13,882,448 19,616,836 872,095 1,232,331 W 201,638,928 191,240,712 Rs 12,666,958 12,013,742
13. Borrowings (1) Details of short-term borrowings as of December 31, 2018 and 2017 are as follows:
(In thousands of won and in thousands of rupee)
Korean won Indian rupee
Creditor Type Interest rate (%) 2018 2017 2018 2017
Korea Development
Bank Operating
fund CD+1.98 W 30,000,000 30,000,000 Rs 1,884,600 1,884,600
Woori Bank Operating
fund - - 12,500,000 - 785,250
Kookmin Bank Facility fund(*) CD+2.00 5,000,000 - 314,100 -
Citibank Korea and others
Banker's usance 0.30 ~3.53 143,227,545 121,340,987 8,997,554 7,622,641
W 178,227,545 163,840,987 Rs 11,196,254 10,292,491
(*) Current portion of long-term borrowing

SSANGYONG MOTOR COMPANY AND SUBSIDIARIES Notes to the Consolidated Financial Statements For the years ended December 31, 2018 and 2017
49
13. Borrowings, Continued (2) Details of long-term borrowing as of December 31, 2018 and 2017 are as follows: (In thousands of won and in thousands of rupee)
Korean won Indian rupee
Creditor Type Interest rate(%) 2018 2017 2018 2017
Korea Development
Bank Facility
fund CD+1.57 W 70,000,000 70,000,000 Rs 4,397,400 4,397,400
Woori Bank Operating
fund - - 12,500,000 - 785,250
Kookmin Bank Facility
fund CD+2.00 10,000,000 - 628,200 - Less: Current portion (5,000,000) (12,500,000) (314,100) (785,250) W 75,000,000 70,000,000 Rs 4,711,500 4,397,400
(3) Details of pledged assets as collateral for borrowings as of December 31, 2018 are as follows: (In thousands of won)
Creditor Pledged assets Borrowings
amount Maximum credit
amount Korea Development Bank
Land, buildings, structures and
machinery W 100,000,000 195,000,000 Woori Bank Land, buildings and machinery 10,000,000 12,000,000 W 110,000,000 207,000,000
(In thousands of rupee)
Creditor Pledged assets Borrowings
amount Maximum credit
amount Korea Development Bank
Land, buildings, structures and
machinery Rs 6,282,000 12,249,900 Woori Bank Land, buildings and machinery 628,200 753,840 Rs 6,910,200 13,003,740
14. Other Financial Liabilities Details of other financial liabilities as of December 31, 2018 and 2017 are as follows:
(In thousands of won and in thousands of rupee)
Korean won Indian rupee 2018 2017 2018 2017 Accrued expenses W 38,053,382 37,164,320 Rs 2,390,513 2,334,663

SSANGYONG MOTOR COMPANY AND SUBSIDIARIES Notes to the Consolidated Financial Statements For the years ended December 31, 2018 and 2017
50
15. Provision of Warranty for sale The Group generally provides warranty for each product sold and accrues warranty expense at the time of sale based on the history of actual claims. Changes in provision of warranty for sale for the years ended December 31, 2018 and 2017 are as follows:
(In thousands of won and in thousands of rupee)
Korean won Indian rupee 2018 2017 2018 2017 Beginning balance W 146,239,557 145,848,984 Rs 9,186,769 9,162,233 Increase 27,317,842 41,427,330 1,716,106 2,602,465 Decrease (38,519,313) (41,036,757) (2,419,783) (2,577,929) Ending balance W 135,038,086 146,239,557 Rs 8,483,092 9,186,769 Current W 49,209,826 53,046,748 Rs 3,091,361 3,332,397 Non-current 85,828,260 93,192,809 5,391,731 5,854,372
16. Other Liabilities
Details of other liabilities as of December 31, 2018 and 2017 are as follows:
(In thousands of won)
2018 2017 Current Non-current Current Non-current Advances from customers W 3,817,676 - W 3,943,130 - Deposits received 525,166 - 531,789 - Withholdings 22,650,209 - 30,701,562 - Unearned revenue 5,968,033 11,317,482 - - W 32,961,084 11,317,482 W 35,176,481 - (In thousands of rupee)
2018 2017 Current Non-current Current Non-current Advances from customers Rs 239,826 - Rs 247,707 - Deposits received 32,991 - 33,407 - Withholdings 1,422,887 - 1,928,672 - Unearned revenue 374,912 710,964 - - Rs 2,070,616 710,964 Rs 2,209,786 -

SSANGYONG MOTOR COMPANY AND SUBSIDIARIES Notes to the Consolidated Financial Statements For the years ended December 31, 2018 and 2017
51
17. Employee Benefits (1) Details of defined benefit liabilities as of December 31, 2018 and 2017 are as follows:
(In thousands of won and in thousands of rupee)
Korean won Indian rupee
2018 2017 2018 2017 Present value of defined benefit
obligations W 330,195,117 285,658,090 Rs 20,742,858 17,945,042 Fair value of plan assets (1,013,651) (1,094,967) (63,678) (68,786) W 329,181,466 284,563,123 Rs 20,679,180 17,876,256
(2) Changes in defined benefit liabilities for the years ended December 31, 2018 and 2017 are as follows:
(In thousands of won) 2018
Details PV of defined
benefit obligation Plan assets Total Beginning balance W 285,658,090 (1,094,967) 284,563,123
Current service cost 36,320,832 - 36,320,832 Interest expense (income) 8,892,349 (34,034) 8,858,315
Sub-total W 330,871,271 (1,129,001) 329,742,270 Re-measurement factors: Re-measurements of plan assets - 20,618 20,618 Loss (gain) from experience adjustments 1,253,039 - 1,253,039
Loss (gain) from changes in financial assumptions 18,608,552 - 18,608,552
Loss (gain) from changes in demographic assumptions 158,296 - 158,296
Sub-total W 20,019,887 20,618 - 20,040,505
Benefit paid by plan (94,732) 94,732 - Benefit paid directly (20,601,309) - (20,601,309) Ending balance W 330,195,117 (1,013,651) 329,181,466

SSANGYONG MOTOR COMPANY AND SUBSIDIARIES Notes to the Consolidated Financial Statements For the years ended December 31, 2018 and 2017
52
17. Employee Benefits, Continued (2) Changes in defined benefit liabilities for the years ended December 31, 2018 and 2017 are as follows,
continued:
(In thousands of won) 2017
Details PV of defined
benefit obligation Plan assets Total Beginning balance W 280,792,667 (1,183,467) 279,609,200
Current service cost 37,549,102 - 37,549,102 Interest expense (income) 8,063,849 (33,950) 8,029,899
Sub-total W 326,405,618 (1,217,417) 325,188,201 Re-measurement factors: Re-measurements of plan assets - 19,501 19,501 Loss (gain) from experience adjustments (12,356,496) - (12,356,496)
Loss (gain) from changes in financial assumptions (8,594,588) - (8,594,588)
Loss (gain) from changes in demographic assumptions 185,044 - 185,044
Sub-total W (20,766,040) 19,501 (20,746,539)
Benefit paid by plan (102,949) 102,949 - Benefit paid directly (19,878,539) - (19,878,539) Ending balance W 285,658,090 (1,094,967) 284,563,123
(In thousands of rupee) 2018
Details PV of defined
benefit obligation Plan assets Total Beginning balance Rs 17,945,041 (68,786) 17,876,255
Current service cost 2,281,675 - 2,281,675 Interest expense (income) 558,617 (2,138) 556,479
Sub-total Rs 20,785,333 (70,924) 20,714,409 Re-measurement factors: Re-measurements of plan assets - 1,295 1,295 Loss (gain) from experience adjustments 78,717 - 78,717
Loss (gain) from changes in financial assumptions 1,168,989 - 1,168,989
Loss (gain) from changes in demographic assumptions 9,944 - 9,944
Sub-total Rs 1,257,650 1,295 1,258,945 Benefit paid by plan (5,951) 5,951 - Benefit paid directly (1,294,174) - (1,294,174) Ending balance Rs 20,742,858 (63,678) 20,679,180

SSANGYONG MOTOR COMPANY AND SUBSIDIARIES Notes to the Consolidated Financial Statements For the years ended December 31, 2018 and 2017
53
17. Employee Benefits, Continued (2) Changes in defined benefit liabilities for the years ended December 31, 2018 and 2017 are as follows,
continued:
(In thousands of rupee) 2017
Details PV of defined
benefit obligation Plan assets Total Beginning balance Rs 17,639,395 (74,345) 17,565,050
Current service cost 2,358,835 - 2,358,835 Interest expense (income) 506,571 (2,133) 504,438
Sub-total Rs 20,504,801 (76,478) 20,428,323 Re-measurement factors: Re-measurements of plan assets - 1,225 1,225 Loss (gain) from experience adjustments (776,235) - (776,235)
Loss (gain) from changes in financial assumptions (539,912) - (539,912)
Loss (gain) from changes in demographic assumptions 11,624 - 11,624
Sub-total Rs (1,304,523) 1,225 (1,303,298) Benefit paid by plan (6,467) 6,467 - Benefit paid directly (1,248,770) - (1,248,770) Ending balance Rs 17,945,041 (68,786) 17,876,255
(3) The components of plan assets as of December 31, 2018 and 2017 are as follows:
(In thousands of won and in thousands of rupee)
Korean won Indian rupee
2018 2017 2018 2017 Insurance contracts W 1,013,651 1,094,967 Rs 63,678 68,786
(4) Actuarial assumptions used related to plans as of December 31, 2018 and 2017 are as follows:
2018 2017 Discount rate (%) 2.63 3.15 Rate of future salary growth (%) 3.95 3.94
The discount rate is the market yield at the end of the reporting year on high quality corporate bonds (AA+) that have maturity which approximates the terms of the Company’s obligations and that are denominated in the same currency in which the benefits are expected to be paid. The discount rate for the calculation of the present value of defined benefit obligations is also used as expected return on plan assets.
Weighted average duration of defined benefit obligation as of December 31, 2018 and 2017 are 11.6 years and 12.0 years, respectively.

SSANGYONG MOTOR COMPANY AND SUBSIDIARIES Notes to the Consolidated Financial Statements For the years ended December 31, 2018 and 2017
54
17. Employee Benefits, Continued (5) The sensitivity of the defined benefit obligations to key assumptions as of December 31, 2018 is as
follows:
(In thousands of won and in thousands of rupee)
Korean won Indian rupee
1% increase 1% decrease 1% increase 1% decrease Discount rate W (33,690,779) 39,170,533 Rs (2,116,455) 2,460,693 Future salary growth 37,026,125 (32,517,154) 2,325,981 (2,042,728)
Sensitivity analysis does not take into account the variance of all expected cash flows, but it provides an approximation of the sensitivity to the assumptions used.
18. Commitments and Contingencies Details of commitments and contingencies as of December 31, 2018 are as follows:
(1) The Group carries product liability insurance for all products that it sells.
(2) As of December 31, 2018, the Group has agreements with Korea Development Bank and others for various borrowings, trading finance and others with limit of W 257,000 million (Rs 16,165 million)and USD 260 million.
(3) As of December 31, 2018, the Group has been provided with guarantees amounting to USD 896,649
by Standard Chartered Bank Korea Limited in connection with refunds for advance received and performing transactions.
(4) As of December 31, 2018, 3 claims as a plaintiff were filled with the claim amount of W 4,592 million
(Rs 288 million) and 12 claims as a defendant were filled with the claims of W 3,879 million (Rs 244 million). The provision amounting to W 6,584 million (Rs 414 million) is recognized as other payable for the foregoing lawsuits and claims, since the amounts for potential loss can be estimated and management expect that it is probable that the Group will be required to incur an outflow.
(5) Operation lease agreements - Lessee
1) The Group has entered into operating lease agreements such as office supply lease and vehicle lease,
and plans for future lease payment related to non-cancellable operation lease agreements as of December 31, 2018 and 2017 are as follows:
(In thousands of won) 2018
Details Less than 1 year 1~5 year Total Buildings etc W 1,533,972 4,310,848 5,844,820
Vehicles 409,123 442,359 851,482 Equipment 1,468,006 2,104,231 3,572,237
W 3,411,101 6,857,438 10,268,539

SSANGYONG MOTOR COMPANY AND SUBSIDIARIES Notes to the Consolidated Financial Statements For the years ended December 31, 2018 and 2017
55
18. Commitments and Contingencies, Continued
(5) Operation lease agreements – Lessee, continued
(In thousands of won) 2017
Details Less than 1 year 1~5 year Total Buildings, etc. W 860,361 2,493,782 3,354,143
Vehicles 405,207 226,431 631,638 Equipment 2,200,110 5,331,313 7,531,423
W 3,465,678 8,051,526 11,517,204
(In thousands of rupee) 2018
Details Less than 1 year 1~5 year Total Buildings, etc. Rs 96,364 270,807 367,172
Vehicles 25,701 27,789 53,490 Equipment 92,220 132,188 224,408
Rs 214,285 430,784 645,070
(In thousands of won) 2017
Details Less than 1 year 1~5 year Total Buildings, etc. Rs 54,048 156,659 210,707
Vehicles 25,455 14,224 39,679 Equipment 138,211 334,913 473,124
Rs 217,714 505,797 723,511
2) The lease payments recognized by us are W 5,666 million (Rs 356 million) and W 5,649 million (Rs 355 million), respectively, in respect of operating lease agreements, including terminable contracts during 2018 and 2017.
(6) Operation lease agreements -Lessor
Details of income from sublease and income from lease for the years ended December 31, 2018 and 2017 are as follows:
(In thousands of won and in thousands of rupee)
Korean won Indian rupee 2018 2017 2018 2017 Income from sublease W 663,325 688,145 Rs 41,670 43,229 Income from lease 178,956 658,188 11,242 41,347 W 842,281 1,346,333 Rs 52,912 84,577

SSANGYONG MOTOR COMPANY AND SUBSIDIARIES Notes to the Consolidated Financial Statements For the years ended December 31, 2018 and 2017
56
19. Capital Stock The Group’s capital stock as of December 31, 2018 and 2017 are as follows:
(In thousands of won and in thousands of rupee, except for par value and share information)
Korean won Indian rupee 2018 2017 2018 2017 Number of shares authorized 3,000,000,000 3,000,000,000 3,000,000,000 3,000,000,000 Shares outstanding 137,949,396 137,949,396 137,949,396 137,949,396 Par value 5,000 5,000 314 314 Capital stock W 689,746,980 689,746,980 Rs 43,329,905 43,329,905
20. Other Capital Surplus and Retained Earnings Details of other capital surplus and retained earnings as of December 31, 2018 and 2017 are as follows:
(In thousands of won and in thousands of rupee)
Korean won Indian rupee 2018 2017 2018 2017 Paid-up capital in excess of par W 12,916,273 12,916,273 Rs 811,402 811,402
Gain on capital reduction 74,061,697 118,189,001 4,652,556 7,424,633 Debt to be swapped for equity 931,509 931,508 58,516 58,516 Gain on disposal of treasury
- 1,105,138 - 69,425
W 87,909,479 133,141,920 Rs 5,522,474 8,363,976

SSANGYONG MOTOR COMPANY AND SUBSIDIARIES Notes to the Consolidated Financial Statements For the years ended December 31, 2018 and 2017
57
21. Other Equity (1) Details of the Group’s other equity as of December 31, 2018 and 2017 are as follows:
(In thousands of won and in thousands of rupee)
Korean won Indian rupee 2018 2017 2018 2017
Gains (losses) on valuation of derivatives W 103,000 - Rs 6,470 -
Accumulated foreign currency translation difference for foreign operations 1,139,617 1,153,581 71,591 72,468
1,242,617 1,153,581 78,061 72,468 (2) Changes in the Group’s gains (losses) on valuation of derivatives for the years ended December 31,
2018 and 2017 are as follows:
(In thousands of won and in thousands of rupee)
Korean won Indian rupee 2018 2017 2018 2017
Beginning balance W - (2,574,700) Rs - (161,743) Gains on valuation of derivatives 103,000 - 6,470 - Reclassified to net income (losses) - 2,574,700 - 161,743 Ending balance W 103,000 - Rs 6,470 -
(3) Changes in the foreign currency translation difference for foreign operation for the years ended
December 31, 2018 and 2017 are as follows:
(In thousands of won and in thousands of rupee)
Korean won Indian rupee 2018 2017 2018 2017
Beginning balance W 1,153,581 1,288,887 Rs 72,468 80,967
Foreign currency translation difference for foreign operation (13,964) (135,306) (877) (8,499)
Ending balance W 1,139,617 1,153,581 Rs 71,591 72,468

SSANGYONG MOTOR COMPANY AND SUBSIDIARIES Notes to the Consolidated Financial Statements For the years ended December 31, 2018 and 2017
58
22. Deficit (1) Details of deficit as of December 31, 2018 and 2017 are as follows:
(In thousands of won and in thousands of rupee) Korean won Indian rupee 2018 2017 2018 2017
Deficit W (85,610,656) (48,887,557) Rs (5,378,062) (3,071,117) (2) Changes in deficit for the years ended December 31, 2018 and 2017 are as follows:
(In thousands of won and in thousands of rupee)
Korean won Indian rupee 2018 2017 2018 2017
Beginning balance W (48,887,556) (3,799,101) Rs (3,071,117) (238,659) Disposition of deficit 45,232,442 - 2,841,502 - Loss for the year (61,838,227) (65,821,198) (3,884,677) (4,134,888) Defined benefit plan re-measurement (20,040,506) 20,746,539 (1,258,945) 1,303,298 Defined benefit plan re-measurement from joint venture (76,809) (13,797) (4,825) (868)
Ending balance W (85,610,656) (48,887,557) Rs (5,378,062) (3,071,117)
23. Income Tax Expense (1) Composition of income tax expense for the years ended December 31, 2018 and 2017 are as follows:
(In thousands of won and in thousands of rupee)
Korean won Indian rupee 2018 2017 2018 2017 Income tax expense of parent(*) W - - Rs - -
Income tax expense of subsidiary 40,708 37,174 2,557 2,223 Total W 40,708 37,174 Rs 2,557 2,223
(*) Income tax expense and deferred income tax assets related to the temporary differences, deficit carried forward and tax credit carried forward are not recognized as of December 31, 2018.

SSANGYONG MOTOR COMPANY AND SUBSIDIARIES Notes to the Consolidated Financial Statements For the years ended December 31, 2018 and 2017
59
23. Income Tax Expense, Continued (2) Changes in temporary differences and deferred income tax assets for the years ended December 31,
2018 and 2017, are as follows:
(In thousands of won) 2018
Beginning
balance Decrease Increase Ending balance
Allowance for doubtful accounts W 1,597,027 1,614,687 2,432,766 2,415,106 Government grants 3,025,471 2,297,962 4,312,115 5,039,624 Provision for warranties 146,239,557 146,239,557 135,038,086 135,038,086 Defined benefit liabilities 287,112,258 20,550,333 64,848,500 331,410,425 Impairment loss of property, plant
and equipment 91,298,992 6,653,531 23,829 84,669,290 Intangible assets 23,602,904 6,590,801 2,145,022 19,157,125 Depreciation 13,534,126 1,031,848 4,259,448 16,761,726 Other payables 26,556,965 28,265,201 23,788,110 22,079,874 Accrued expenses 36,769,573 36,769,573 37,502,860 37,502,860 Investment in subsidiaries (2,480,564) - (1,642,493) (4,123,057) Derivatives 409,259 409,259 (891,319) (891,319) Other long-term employee benefit 16,328,928 16,328,928 17,039,484 17,039,484 Trade receivable 2,458,305 - 446,041 2,904,346 Other receivable 2,007,258 37,313 1,059,860 3,029,805 Land (260,713,528) - - (260,713,528) Others 838,816 (100,987) 3,953,187 4,892,990 Deficit carried over on tax 1,108,462,181 - 47,224,696 1,155,686,877
Sub-total W 1,497,047,528 266,688,006 341,540,192 1,571,899,714 Not recognized as deferred tax assets 1,497,047,528 266,688,006 341,540,192 1,571,899,714 Recognized as deferred tax assets - - - -
Statutory tax rate (%) 22% 22% Deferred tax assets resulting from temporary differences or deficits
carried over on tax - - Tax credit carry-forwards: 3,223,052 - 19,233,613 22,456,665 Not recognized as deferred tax assets 3,223,052 - 19,233,613 22,456,665 Recognized as deferred tax assets - - - - Deferred tax assets resulting from tax credit carry-forwards - - - -
Total deferred income tax W - - - -
The Group does not recognize deferred tax assets since it could not estimate income tax decease effect by deducting temporary differences, deficits carried over on tax and tax credit carry-forwards from expected future taxable income.

SSANGYONG MOTOR COMPANY AND SUBSIDIARIES Notes to the Consolidated Financial Statements For the years ended December 31, 2018 and 2017
60
23. Income Tax Expense, Continued (2) Changes in temporary differences and deferred income tax assets for the years ended December 31,
2018 and 2017, are as follows, continued:
(In thousands of won) 2017
Beginning
balance Decrease Increase Ending balance
Allowance for doubtful accounts W - - 1,597,027 1,597,027 Government grants 3,025,504 1,163,320 1,163,287 3,025,471 Provision for warranties 145,848,984 145,848,984 146,239,557 146,239,557 Defined benefit liabilities 282,337,426 19,766,561 24,541,393 287,112,258 Impairment loss of property, plant
and equipment
99,336,813
8,037,821 -
91,298,992
Intangible assets 231,282 8,221,828 31,593,450 23,602,904 Depreciation 11,528,277 1,125,035 3,130,884 13,534,126 Other payables 26,297,688 26,773,724 27,033,001 26,556,965 Accrued expenses 34,274,171 34,274,171 36,769,573 36,769,573 Investment in subsidiaries - - (2,480,564) (2,480,564) Derivatives 5,042,771 5,042,771 409,259 409,259 Other long-term employee benefit 16,688,601 16,688,601 16,328,928 16,328,928 Trade receivable - - 2,458,305 2,458,305 Other receivable - 4,320,982 6,328,240 2,007,258 Land (260,713,528) - - (260,713,528) Others 887,397 96,382 47,801 838,816 Deficit carried over on tax 1,113,990,602 5,528,421 - 1,108,462,181
Sub-total W 1,478,775,988 276,888,601 295,160,141 1,497,047,528 Not recognized as deferred tax assets 1,478,775,988 276,888,601 295,160,141 1,497,047,528 Recognized as deferred tax assets - - - -
Statutory tax rate (%) 22% 22% Deferred tax assets resulting from temporary differences or deficits
carried over on tax - - Tax credit carry-forwards: 3,223,052 - - 3,223,052 Not recognized as deferred tax assets 3,223,052 - - 3,223,052 Recognized as deferred tax assets - - - - Deferred tax assets resulting from tax credit carry-forwards - - - -
Total deferred income tax W - - - -

SSANGYONG MOTOR COMPANY AND SUBSIDIARIES Notes to the Consolidated Financial Statements For the years ended December 31, 2018 and 2017
61
23. Income Tax Expense, Continued (2) Changes in temporary differences and deferred income tax assets for the years ended December 31,
2018 and 2017, are as follows, continued:
(In thousands of rupee) 2018
Beginning
balance Decrease Increase Ending balance
Allowance for doubtful accounts Rs 100,325 101,435 152,826 151,717 Government grants 190,060 144,358 270,887 316,589 Provision for warranties 9,186,769 9,186,769 8,483,093 8,483,093 Defined benefit liabilities 18,036,392 1,290,972 4,073,783 20,819,203 Loss on revaluation of property,
plant and equipment 5,735,403 417,975 1,497 5,318,925 Intangible assets 1,482,734 414,034 134,750 1,203,451 Depreciation 850,214 64,821 267,579 1,052,972 Other payables 1,668,309 1,775,620 1,494,369 1,387,058 Accrued expenses 2,309,865 2,309,865 2,355,930 2,355,930 Investment in subsidiaries (155,829) - (103,181) (259,010) Derivatives 25,710 25,710 (55,993) (55,993) Other long-term employee benefit 1,025,783 1,025,783 1,070,420 1,070,420 Trade receivable 154,431 - 28,020 182,451 Other receivable 126,096 2,344 66,580 190,332 Land (16,378,024) - - (16,378,024) Others 52,694 (6,344) 248,339 307,378 Deficit carried over on tax 69,633,594 - 2,966,655 72,600,250
Sub-total Rs 94,044,526 16,753,341 21,455,555 98,746,740 Not recognized as deferred tax assets 94,044,526 16,753,341 21,455,555 98,746,740 Recognized as deferred tax assets - - - -
Statutory tax rate (%) 22% 22% Deferred tax assets resulting from temporary differences - - Tax credit carry-forwards: 202,472 - 1,208,256 1,410,728 Not recognized as deferred tax assets 202,472 - 1,208,256 1,410,728 Recognized as deferred tax assets - - - - Deferred tax assets resulting from tax credit carry-forwards - - - -
Total deferred income tax Rs - - - -
The Group does not recognize deferred tax assets since it could not estimate income tax decease effect by deducting temporary differences, deficits carried over on tax and tax credit carry-forwards from expected future taxable income.

SSANGYONG MOTOR COMPANY AND SUBSIDIARIES Notes to the Consolidated Financial Statements For the years ended December 31, 2018 and 2017
62
23. Income Tax Expense, Continued (2) Changes in temporary differences and deferred income tax assets for the years ended December 31,
2018 and 2017, are as follows, continued:
(In thousands of rupee) 2017
Beginning
balance Decrease Increase Ending balance
Allowance for doubtful accounts Rs - - 100,325 100,325 Government grants 190,062 73,080 73,078 190,060 Provision for warranties 9,162,233 9,162,233 9,186,769 9,186,769 Defined benefit liabilities 17,736,437 1,241,735 1,541,690 18,036,392 Loss on revaluation of property,
plant and equipment 6,240,339 504,936 - 5,735,403 Intangible assets 14,529 516,495 1,984,701 1,482,734 Depreciation 724,206 70,675 196,682 850,214 Other payables 1,652,021 1,681,925 1,698,213 1,668,309 Accrued expenses 2,153,103 2,153,103 2,309,865 2,309,865 Investment in subsidiaries - - (155,829) (155,829) Derivatives 316,787 316,787 25,710 25,710 Other long-term employee benefit 1,048,378 1,048,378 1,025,783 1,025,783 Trade receivable - - 154,431 154,431 Other receivable - 271,444 397,540 126,096 Land (16,378,024) - - (16,378,024) Others 55,746 6,055 3,003 52,694 Deficit carried over on tax 69,980,890 347,295 - 69,633,594
Sub-total Rs 92,896,708 17,394,142 18,541,960 94,044,526 Not recognized as deferred tax assets 92,896,708 17,394,142 18,541,960 94,044,526 Recognized as deferred tax assets - - - -
Statutory tax rate (%) 22% 22% Deferred tax assets resulting from temporary differences - - Tax credit carry-forwards: 202,472 - - 202,472 Not recognized as deferred tax assets 202,472 - - 202,472 Recognized as deferred tax assets - - - - Deferred tax assets resulting from tax credit carry-forwards - - - -
Total deferred income tax Rs - - - - (3) Details of information that the expected expiration of tax losses and deferred tax credits which are not
recognized as deferred tax assets.
(In thousands of won and in thousands of rupee)
Korean won Indian rupee
Deficit carried
over on tax Tax credit
carry-forwards Deficit carried
over on tax Tax credit
carry-forwards
0 ~ 1 Year W 569,599,726 2,023,360 Rs 35,782,255 127,107
1 ~ 5 Years 431,643,646 20,433,305 27,115,854 1,283,620
5 ~ 10 Years 154,443,505 - 9,702,141 -
W 1,155,686,877 22,456,665 Rs 72,600,250 1,410,727

SSANGYONG MOTOR COMPANY AND SUBSIDIARIES Notes to the Consolidated Financial Statements For the years ended December 31, 2018 and 2017
63
24. Nature of Expenses
Details of nature of expenses for the years ended December 31, 2018 and 2017 are as follows: (In thousands of won and in thousands of rupee)
Korean won Indian rupee
2018 2017 2018 2017
Changes in inventories W (20,658,297) (19,936,950) Rs (1,297,754) (1,252,439) Raw materials consumed and
purchase of merchandise 2,560,539,435 2,369,824,804 160,853,087 148,872,394 Employee benefits 543,376,706 525,957,045 34,134,926 33,040,622 Depreciation 141,773,410 128,126,424 8,906,206 8,048,902 Amortization 70,581,045 50,833,365 4,433,900 3,193,352 Others 473,357,244 505,108,763 29,736,302 31,730,932 W 3,768,969,543 3,559,913,451 Rs 236,766,667 223,633,763
Total expenses are equal to the sum of cost of sales and selling, general and administrative expenses.
25. Derivatives
The Group holds derivative contracts to minimize foreign exchange risk. As of December 31, 2018, there is derivative for cash flow hedge W 103,000 thousand (Rs 6,470 thousand) recognized in Other equity, and changes in fair value of derivative not designated as hedging instrument for the year ended December 31, 2018 is net amounting to W 788,319 thousand (Rs 49,522 thousand) recognized in current profit.
26. Selling, General and Administrative Expenses
(1) Details of selling expenses for the years ended December 31, 2018 and 2017 are as follows:
(In thousands of won and in thousands of rupee)
Korean won Indian rupee 2018 2017 2018 2017
Warranty expenses W 49,391,583 64,029,487 Rs 3,102,779 4,022,333 Commissions 235,656,996 236,689,627 14,803,973 14,868,841 Advertising 17,977,724 18,803,819 1,129,361 1,181,256 Export expenses 9,247,333 33,078,418 580,917 2,077,986 Others 23,476,537 38,096,189 1,474,796 2,393,203 W 335,750,173 390,697,540 Rs 21,091,826 24,543,619

SSANGYONG MOTOR COMPANY AND SUBSIDIARIES Notes to the Consolidated Financial Statements For the years ended December 31, 2018 and 2017
64
26. Selling, General and Administrative Expenses, Continued (2) Details of general and administrative expenses for the years ended December 31, 2018 and 2017 are as
follows:
(In thousands of won and in thousands of rupee) Korean won Indian rupee 2018 2017 2018 2017 Salaries W 53,615,276 52,725,428 Rs 3,368,112 3,312,211
Retirement benefit costs 5,912,583 5,732,951 371,430 360,144 Employee welfare 13,249,465 12,329,403 832,331 774,533 Rent expense 12,226,314 11,537,739 768,057 724,801 Service fees 37,222,934 35,326,474 2,338,345 2,219,209 Depreciation 15,538,974 14,089,709 976,158 885,116 R&D expenses 13,882,448 19,616,836 872,095 1,232,330 Amortization 4,129,695 4,320,197 259,427 271,395 Bad debt expense (2,416) 33,507 (152) 2,105 Others 34,921,623 34,943,870 2,193,776 2,195,173 W 190,696,896 190,656,114 Rs 11,979,579 11,977,017
27. Other Income and Expenses (1) Details of other income for the years ended December 31, 2018 and 2017 are as follows:
(In thousands of won and in thousands of rupee) Korean won Indian rupee 2018 2017 2018 2017 Foreign exchange transaction gain W 5,772,244 11,049,978 Rs 362,612 694,159
Foreign exchange translation gain 269,394 501,746 16,923 31,520 Gain on disposal of property, plant and
equipment 243,229 179,970 15,280 11,306 Others 4,916,269 17,424,484 308,839 1,094,606 W 11,201,136 29,156,178 Rs 703,654 1,831,591
(2) Details of other expenses for the years ended December 31, 2018 and 2017 are as follows:
(In thousands of won and in thousands of rupee) Korean won Indian rupee 2018 2017 2018 2017 Foreign exchange transaction loss W 5,878,888 9,171,400 Rs 369,312 576,147
Foreign exchange translation loss 601,157 659,308 37,765 41,418 Loss on disposal of property, plant
and equipment 522,078 748,646 32,797 47,030 Loss on disposal of trade receivables 73,131 14,775,609 4,594 928,204 Other bad debt expenses 195,019 3,723,115 12,251 233,886 Others 3,260,588 5,936,365 204,830 372,922 W 10,530,861 35,014,443 Rs 661,549 2,199,607

SSANGYONG MOTOR COMPANY AND SUBSIDIARIES Notes to the Consolidated Financial Statements For the years ended December 31, 2018 and 2017
65
28. Finance Income and Costs
(1) Details of finance income for the years ended December 31, 2018 and 2017 are as follows:
(In thousands of won and in thousands of rupee) Korean won Indian rupee 2018 2017 2018 2017 Interest income W 2,485,558 2,756,319 Rs 156,143 173,152
Dividend income 11,000 11,000 691 691 Foreign exchange transaction gain 3,959,690 8,772,393 248,748 551,082 Foreign exchange translation gain 903,198 5,615,197 56,740 352,746 Realized gain of financial derivatives 4,835,727 8,824,608 303,780 554,362 Unrealized gain of financial derivatives 806,894 - 50,689 - W 13,002,067 25,979,517 Rs 816,791 1,632,033
(2) Details of finance costs for the years ended December 31, 2018 and 2017 are as follows:
(In thousands of won and in thousands of rupee) Korean won Indian rupee 2018 2017 2018 2017 Interest expense W 963,968 918,941 Rs 60,556 57,728
Foreign exchange transaction loss 9,322,029 11,945,458 585,610 750,413 Foreign exchange translation loss 1,017,763 5,737 63,936 360 Realized loss of financial derivatives 1,690,833 8,745,827 106,218 549,413 Unrealized loss of financial derivatives 18,575 409,259 1,167 25,710 W 13,013,168 22,025,222 Rs 817,487 1,383,624
(3) Details of the Group’s financial net profit or loss for the years ended December 31, 2018 and 2017 are
as follows:
(In thousands of won and in thousands of rupee) Korean won Indian rupee 2018 2017 2018 2017 Financial assets/ liabilities
at amortized cost W (3,955,314) 4,273,773 Rs (248,471) 268,479 Non-current financial assets 11,000 11,000 691 691 Derivatives financial assets (liabilities) 3,933,213 (330,478) 247,084 (20,761) W (11,101) 3,954,295 Rs (696) 248,409

SSANGYONG MOTOR COMPANY AND SUBSIDIARIES Notes to the Consolidated Financial Statements For the years ended December 31, 2018 and 2017
66
29. Losses per Share
(1) Basic losses per share for the years ended December 31, 2018 and 2017 are calculated as follows:
(In thousands of won and in thousands of rupee, except per share information) Korean won Indian rupee 2018 2017 2018 2017 Loss for the year W (61,838,227) (65,821,198) Rs (3,884,677) (4,134,888)
Loss contributed to common stocks (61,838,227) (65,821,198) (3,884,677) (4,134,888)
Weighted average number of common shares 137,949,396 137,801,538 137,949,396 137,801,538
Basic losses per share(*) W (448) (478) Rs (28) (30)
(*) Diluted losses per share are not calculated for the years ended December 31, 2018 and 2017, because there are no dilutive shares as of December 31, 2018 and 2017.
(2) Weighted average number of common shares outstanding for the years ended December 31, 2018 and 2017 are calculated as follows:
(In shares) 2018
Outstanding period Common shares
issued Weighted-average Common shares
outstanding Beginning 2018-01-01~2018-12-31 137,949,396 365/365 137,949,396
(In shares) 2017
Outstanding period Common shares
issued Weighted-average Common shares
outstanding Beginning 2017-01-01~2017-03-15 137,220,096 74/365 27,819,965 Issuing 2017-03-16~2017-12-31 137,949,396 291/365 109,981,573 137,801,538

SSANGYONG MOTOR COMPANY AND SUBSIDIARIES Notes to the Consolidated Financial Statements For the years ended December 31, 2018 and 2017
67
30. Cash Flows (1) Details of cash flows from operating activities for the years ended December 31, 2018 and 2017 are as
follows:
(In thousands of won and in thousands of rupee) Korean won Indian rupee 2018 2017 2018 2017 Loss for the year W (61,838,227) (65,821,198) Rs (3,884,677) (4,134,888)
Adjustments for: Retirement benefit costs 45,179,147 45,579,001 2,838,154 2,863,273 Depreciation 141,773,410 128,126,424 8,906,206 8,048,902 Amortization 70,581,045 50,833,365 4,433,901 3,193,352 Losses on disposal of trade receivables 73,131 14,775,609 4,594 928,204 Foreign exchange translation gain and
loss, net 446,328 (5,451,898)
28,038 (342,488)
Loss (Gain) on disposal of property, plant and equipment 278,849 568,676
17,516 35,724
Interest expense and income, net (1,521,590) (1,837,378) (95,587) (115,424) Dividends income (11,000) (11,000) (691) (691) Unrealized gain and loss of financial
derivatives, net (788,319) 409,259
(49,522) 25,710
Losses on valuation of inventories 7,981,632 3,542,010 501,406 222,509 Increase in provision of warranty for
sale 27,285,585 41,427,330
1,714,080 2,602,465
Equity profit on investments (1,719,302) (1,395,753) (108,007) (87,681) Others 1,318,514 3,636,306 82,831 228,431
290,877,430 280,201,951 18,272,919 17,602,286 Changes in assets and liabilities
Trade receivables 28,582,182 10,530,730 1,795,533 661,540 Other receivables 66,885 (1,095,178) 4,202 (68,799) Inventories (9,587,462) (27,109,085) (602,284) (1,702,993) Trade payables 8,633,150 43,628,066 542,334 2,740,715 Other payables (25,900,071) 22,988,506 (1,627,042) 1,444,138 Accrued expenses 751,693 2,495,403 47,221 156,761 Usage of provision of warranty for sale (38,519,313) (41,036,756) (2,419,783) (2,577,929) Payment of retirement benefits (20,601,309) (19,878,539) (1,294,174) (1,248,770) Others 6,592,656 572,198 414,150 35,947
(49,981,589) (8,904,655) (3,139,843) (559,390) Net cash provided by operating activities W 179,057,614 205,476,098 Rs 11,248,399 12,908,008
(2) Significant non-cash activities for the years ended December 31, 2018 and 2017 are as follows:
(In thousands of won and in thousands of rupee) Korean won Indian rupee 2018 2017 2018 2017 Changes in other payables related to the
acquisition of property, plant and equipment W (6,189,254) 11,118,331 Rs (388,809) 698,455

SSANGYONG MOTOR COMPANY AND SUBSIDIARIES Notes to the Consolidated Financial Statements For the years ended December 31, 2018 and 2017
68
30. Cash Flows, Continued (3) Adjustment of liabilities from financing activities Changes in liabilities from financial activities for the year ended December 31, 2018 is as follows:
(In thousands of won)
Beginning
balance Increase
Decrease Liquidity Exchange rate
effect Ending balance
Banker's usance(*) W 121,340,987 21,769,058 - - 117,500 143,227,545 Short-term
borrowings 42,500,000 - (12,500,000) 5,000,000 - 35,000,000 Long-term
borrowings 70,000,000 10,000,000 - (5,000,000) - 75,000,000 W 233,840,987 31,769,058 (12,500,000) - 117,500 253,227,545
(In thousands of rupee)
Beginning
balance Increase Decrease Liquidity Exchange rate
effect Ending balance
Banker's usance(*) Rs 7,622,641 1,367,532 - - 7,381 8,997,554 Short-term
borrowings 2,669,850 - (785,250) 314,100 - 2,198,700 Long-term
borrowings 4,397,400 628,200 - (314,100) - 4,711,500 Rs 14,689,891 1,995,732 (785,250) - 7,381 15,907,754
(*) The changes in usance borrowings are presented by net amounts.
31. Segment Information
(1) The Group determined itself as a single reportable segment by considering the nature of goods and service as well as the characteristic of assets used in providing service. The Group has not disclosed operating income or loss, profit or loss before income taxes and total assets and liabilities by reportable segment.
(2) Geographic sales information of the Group for the years ended December 31, 2018 and 2017 are as
follows:
(In thousands of won and in thousands of rupee) Korean won Indian rupee
Sales region 2018 2017 2018 2017 Republic of Korea W 3,005,311,067 2,732,196,915 Rs 188,793,641 171,636,610
Europe 317,650,218 380,203,457 19,954,787 23,884,381 Asia Pacific 119,458,721 172,847,893 7,504,397 10,858,305 Others 286,152,937 222,388,490 17,976,128 13,970,445 Consolidated adjustment (23,779,397) (12,999,111) (1,493,822) (816,604) W 3,704,793,546 3,494,637,644 Rs 232,735,131 219,533,137
Non-current assets are not separately disclosed since those are located in Korea. Main customer over 10% of sales is not disclosed since most sales are occurred through contract with individual customer and authorized foreign agencies.

SSANGYONG MOTOR COMPANY AND SUBSIDIARIES Notes to the Consolidated Financial Statements For the years ended December 31, 2018 and 2017
69
31. Segment Information, Continued
(3) Information of sales of goods and service for the years ended December 31, 2018 and 2017 are as follows:
(In thousands of won and in thousands of rupee)
Korean won Indian rupee 2018 2017 2018 2017
Automobile W 3,240,404,523 3,117,252,232 Rs 203,562,212 195,825,785 Merchandise and parts 362,319,256 337,069,352 22,760,896 21,174,697 Others 102,069,767 40,316,060 6,412,023 2,532,655 W 3,704,793,546 3,494,637,644 Rs 232,735,131 219,533,137
(4) Balance of Contracts as of December 31, 2018 and December 2017 are as follows:
(In thousands of won and in thousands of rupee) Korean won Indian rupee
2018 2017 2018 2017 Receivables from contracts
with customers W 158,512,150 183,645,818 Rs 9,957,733 11,536,630 Contract assets - 3,958,500 - 248,673 Contract liabilities 17,311,822 1,776,567 1,087,529 111,604
The contract assets are related to technical service contracts which are executed over periods. The contract liabilities are related to service warranties and transportation contracts that are executed over period, that are recognized in deferred income and advances from customers.
32. Transactions and Balances with Related Parties (1) Details of related parties as of December 31, 2018 are as follows:
Relationship Company Parent Mahindra & Mahindra Ltd. Joint venture SY Auto Capital Co., Ltd.
Others Mahindra Vehicle Manufacturing Ltd.,
Mahindra Electric Mobility Ltd., Mahindra & Mahindra South Africa Ltd., PININFARINA S.p.A.

SSANGYONG MOTOR COMPANY AND SUBSIDIARIES Notes to the Consolidated Financial Statements For the years ended December 31, 2018 and 2017
70
32. Transactions and Balances with Related Parties, Continued
(2) Transactions with related parties for the years ended December 31, 2018 and 2017 are as follows: (In thousands of won)
Relationship Company Description 2018 2017
Parent
Mahindra & Mahindra Ltd.
Sales W 12,961,510 8,898,635 Other income - 95,019 Purchases 110,907 1,529,987 Other expenses 4,830,477 640,963
Joint venture SY Auto Capital Co., Ltd. Other expenses 21,734,022 14,089,290
Others Mahindra Vehicle Manufacturing Ltd. and others
Sales 29,196,388 735,257
Other income
-
5,179
Other expenses 3,132,055 963,843
(In thousands of rupee)
Relationship Company Description 2018 2017
Parent
Mahindra & Mahindra Ltd.
Sales Rs 814,242 559,012 Other income - 5,969 Purchases 6,967 96,114 Other expenses 303,451 40,265
Joint venture SY Auto Capital Co., Ltd. Other expenses 1,365,331 885,089
Others Mahindra Vehicle Manufacturing Ltd. and others
Sales 1,834,117 46,189
Other income
-
325
Other expenses 196,756 60,549 (3) Account balances with related parties as of December 31, 2018 and 2017 are as follows: (In thousands of won)
Relationship Company Description 2018 2017
Parent Mahindra & Mahindra Ltd.
Trade receivables W 4,171,953 4,120,559 Other receivables 30,314 77,342 Other payables 669,683 2,308,472
Joint venture SY Auto Capital Co., Ltd. Other payables 242,805 450,795
Others Mahindra Vehicle
Manufacturing Ltd. and others Trade receivables 5,450,701 37,279
Other payables 2,556,284 18,250 (In thousands of rupee)
Relationship Company Description 2018 2017
Parent Mahindra & Mahindra Ltd.
Trade receivables Rs 262,082 258,854 Other receivables 1,904 4,859 Other payables 42,069 145,018
Joint venture SY Auto Capital Co., Ltd. Other payables 15,253 28,319
Others Mahindra Vehicle
Manufacturing Ltd. and others Trade receivables 342,413 2,342
Other payables 160,586 1,146
Allowance for receivables from related parties are not recognized as of December 31, 2018 and 2017.

SSANGYONG MOTOR COMPANY AND SUBSIDIARIES Notes to the Consolidated Financial Statements For the years ended December 31, 2018 and 2017
71
32. Transactions and Balances with Related Parties, Continued (4) There is no transactions with related parties during the years ended December 31, 2018 and 2017. (5) Executive compensation of the Group for the years ended December 31, 2018 and 2017, are as follows:
(In thousands of won and in thousands of rupee)
Korean won Indian rupee
2018 2017 2018 2017
Short-term employee benefits W 6,939,709 7,467,468 Rs 435,953 469,106 Retirement benefits 131,900 135,329 8,286 8,501
33. Financial Instruments (1) Capital risk management
The Group manages capital risk in order to maximize shareholders' profit by maintaining sound or optimal capital structure through monitoring of financial ratios, such as debt-to-equity ratio on a monthly basis and implements capital structure improvement plan when necessary. The Group uses debt ratio as a capital management index and calculates the ratio as total liabilities divided by total equity on financial statements. The Group is not subject to externally enforced capital regulation.
Debt-to-equity ratio as of December 31, 2018 and 2017 are as follows: (In thousands of won and in thousands of rupee)
Korean won Indian rupee 2018 2017 2018 2017
Debt (A) W 1,512,353,646 1,472,863,950 Rs 95,006,057 92,525,314 Equity (B) 693,288,420 775,154,924 43,552,378 48,695,232 Debt-to-equity ratio (A/B) 218.14% 190.01% 218.14% 190.01%

SSANGYONG MOTOR COMPANY AND SUBSIDIARIES Notes to the Consolidated Financial Statements For the years ended December 31, 2018 and 2017
72
33. Financial Instruments, Continued (2) Details of financial assets and liabilities by category as of December 31, 2018 and 2017 are as follows: 1) Financial assets
(In thousands of won) 2018
Amoritsed
cost Measured at
FVTPL
Derivatives cash flow
hedge Total Fair value Cash and cash
equivalents W 156,062,657 - - 156,062,657 156,062,657 Long-term financial
instruments 4,000 - - 4,000 4,000 Trade and other
receivables 207,545,265 - - 207,545,265 207,545,265 Non-current
financial assets - 560,000 - 560,000 560,000 Derivative assets - 806,894 84,425 891,319 891,319 W 363,611,922 1,366,894 84,425 365,063,241 365,063,241
(In thousands of won)
2017
Amoritsed
cost Measured at
FVTPL Total Fair value Cash and cash equivalents W 215,443,730 - 215,443,730 215,443,730 Long-term financial
instruments 4,000 - 4,000 4,000 Trade and other receivables 236,032,708 - 236,032,708 236,032,708 AFS financial assets - 560,000 560,000 560,000
W 451,480,438 560,000 452,040,438 452,040,438
(In thousands of rupee) 2018
Amoritsed
cost Measured at
FVTPL
Derivatives cash flow
hedge Total Fair value Cash and cash
equivalents Rs 9,803,856 - - 9,803,856 9,803,856
Long-term financial instruments 251 - - 251 251
Trade and other receivables 13,037,994 - - 13,037,994 13,037,994
Non-current financial assets - 35,179 - 35,179 35,179
Derivative assets - 50,689 5,304 55,993 55,993 Rs 22,842,101 85,868 5,304 22,933,273 22,933,273

SSANGYONG MOTOR COMPANY AND SUBSIDIARIES Notes to the Consolidated Financial Statements For the years ended December 31, 2018 and 2017
73
33. Financial Instruments, Continued (2) Details of financial assets and liabilities by category as of December 31, 2018 and 2017 are as follows,
continued: 1) Financial assets, continued
(In thousands of rupee) 2017
Amoritsed
cost Measured at
FVTPL Total Fair value Cash and cash equivalents Rs 13,534,175 - 13,534,175 13,534,175 Long-term financial
instruments 251 - 251 251 Trade and other receivables 14,827,575 - 14,827,575 14,827,575 AFS financial assets - 35,179 35,179 35,179
Rs 28,362,001 35,179 28,397,180 28,397,180
2) Financial liabilities (In thousands of won) 2018
Financial liability measured at
amortised cost Financial liabilities
at FVTPL Total Fair value Trade and other payables W 693,223,692 - 693,223,692 693,223,692
Borrowings 253,227,545 - 253,227,545 253,227,545 W 946,451,237 - 946,451,237 946,451,237
(In thousands of won) 2017
Financial liability measured at
amortised cost Financial liabilities
at FVTPL Total Fair value Trade and other payables W 718,008,735 - 718,008,735 718,008,735
Borrowings 233,840,987 - 233,840,987 233,840,987 Derivative liabilities - 409,259 409,259 409,259 W 951,849,722 409,259 952,258,981 952,258,981

SSANGYONG MOTOR COMPANY AND SUBSIDIARIES Notes to the Consolidated Financial Statements For the years ended December 31, 2018 and 2017
74
33. Financial Instruments, Continued
(2) Details of financial assets and liabilities by category as of December 31, 2018 and 2017 are as follows, continued:
2) Financial liabilities, continued
(In thousands of rupee) 2018
Financial liability measured at
amortised cost Financial liabilities
at FVTPL Total Fair value Trade and other payables Rs 43,548,313 - 43,548,313 43,548,313
Borrowings 15,907,754 - 15,907,754 15,907,754 Rs 59,456,067 - 59,456,067 59,456,067
(In thousands of rupee) 2017
Financial liability measured at
amortised cost Financial liabilities
at FVTPL Total Fair value Trade and other payables Rs 45,105,308 - 45,105,308 45,105,308
Borrowings 14,689,891 - 14,689,891 14,689,891 Derivative liabilities - 25,710 25,710 25,710 Rs 59,795,199 25,710 59,820,909 59,820,909
(3) Financial risk management
The Group is exposed to credit risk, liquidity risk and market risk. In order to manage the aforementioned risks, the Group operates a risk management policy and a program that performs close monitoring and responds to each risk factors. Financial assets that are subject to the financial risk management consist of cash and cash equivalents, non-current financial assets, trade receivables, other receivables and others; financial liabilities subject to the financial risk management consist of trade payables, other payables, borrowings, and others.
1) Market risk
a. Foreign exchange risk
The Group undertakes transactions denominated in foreign currencies; consequently, exposures to exchange rate fluctuations arise. The Group assesses, manages and reports, on a regular basis, the foreign exchange risk for its receivables and payables denominated in foreign currency. The table below shows the sensitivity for each foreign currency when exchange rates change 10%. Sensitivity analysis only includes foreign currency monetary items that are not paid, and it adjusts the translation assuming exchange rate changes 10% as of December 31, 2018.

SSANGYONG MOTOR COMPANY AND SUBSIDIARIES Notes to the Consolidated Financial Statements For the years ended December 31, 2018 and 2017
75
33. Financial Instruments, Continued (3) Financial risk management, continued 1) Market risk, continued
a. Foreign exchange risk, continued
(In thousands of won and in thousands of rupee)
Korean won Indian rupee Currency 10% increase 10% decrease 10% increase 10% decrease
USD W 3,508,288 (3,508,288) Rs 220,391 (220,391) EUR (3,569,199) 3,569,199 (224,217) 224,217 JPY (9,878,289) 9,878,289 (620,554) 620,554 Others 679,253 (679,253) 42,670 (42,670) W (9,259,947) 9,259,947 Rs (581,710) 581,710
Details of forward contracts which are not settled as of the year ended December 31, 2018, are as follows: (In thousands of won and in thousands USD, JPY)
Maturity
Contracted exchange
rate Short-position
amount long-position
amount Fair value
Cashflow hedge
Within 3 Months
1,125.98 USD 10,000 KRW11,259,800 W 84,425
Held for trading Within 3 Months 9.91 KRW 24,477,440 JPY 2,470,000 592,470 3 ~ 6 Months 9.87 KRW 6,909,200 JPY 700,000 214,424
(In thousands of rupee and in thousands USD, JPY)
Maturity
Contracted exchange
rate Short-position
amount long-position
amount Fair value
Cashflow hedge
Within 3 Months
1,125.98 USD 10,000 RS 707,341 Rs 5,304
Held for trading Within 3 Months 9.91 RS 1,537,673 JPY 2,470,000 37,219 3 ~ 6 Months 9.87 RS 434,036 JPY 700,000 13,470
b. Interest rate risk Sensitivity analysis was conducted assuming floating rate debt current balance is the same during the whole reporting year. When reporting interest rate risk to management internally, 0.5% variation is used, representing management's assessment about reasonably possible fluctuations of interest rates. If other variables are constant and the interest rate is lower or higher by 0.5% than the current rate, the Group's current income will decrease or increase in W 364,110 thousand (Rs 22,873 thousand) for the year ended December 31, 2018, due to floating rate debt’s interest rate risk.

SSANGYONG MOTOR COMPANY AND SUBSIDIARIES Notes to the Consolidated Financial Statements For the years ended December 31, 2018 and 2017
76
33. Financial Instruments, Continued (3) Financial risk management, continued 2) Credit risk Credit risk arises from transactions in the ordinary course of business and investment activities and when a customer or a transacting party fails to perform obligations defined by respective contract terms. In order to manage the aforementioned credit risk, the Group regularly assesses credit ratings of its customers and transacting parties based on their financial status and past experiences, and establishes credit limit for each customer or transacting party.
If a credit risk occurs with respect to a dealership sale, which is a major type of the Group’s sales, the respective dealership bears all of the risk; the Group manages credit risk on product sales using two management index, agreed liability rate and agreed excess rate, and when the management index exceeds the agreed rate, it imposes a release restriction on the respective dealership and transfers a credit risk arising from product sales. The Group’s trade receivables are usually collected within 30 days but some of the notes receivable are collected within 75 days. The Group estimates an allowance for the receivables that are over more than 90 days, but less than one year through an individual analysis based on each transacting party; for receivables that are not subject to individual analysis, the Group estimates an allowance based on the historical loss rates.
For the receivables that are not subject to individual analysis, the allowance is estimated by applying the average loss rate for the past three years to the remaining balance of the receivables at the end of a reporting year; the average loss rate for the past three-years is calculated by dividing the amount of actual loss occurred in the past three years by the average balance of the receivables. The Group estimates an allowance for the receivables that are over more than 90 days, but less than one year through an individual analysis based on each transacting party; for receivables that are not subject to individual analysis, the Group estimates an allowance based on the historical loss rates.
Maximum exposure in respect of credit risk as of December 31, 2018 and 2017 are as follows:
(In thousands of won and in thousands of rupee)
Korean won Indian rupee 2018 2017 2018 2017
Trade and other receivables W 207,545,265 236,032,708 Rs 13,037,994 14,827,575

SSANGYONG MOTOR COMPANY AND SUBSIDIARIES Notes to the Consolidated Financial Statements For the years ended December 31, 2018 and 2017
77
33. Financial Instruments, Continued (3) Financial risk management, continued
3) Liquidity risk
The Group has managed liquidity risk to maintain adequate level of liquidity by periodic projecting cash outflow. To manage the risks, the Group has entered into a factoring agreement with capital financial institutions. The contractual maturities of financial liabilities as of December 31, 2018 and 2017 are as follows: (In thousands of won) 2018
Within a year Over 1 year Total Trade payables W 534,943,259 - 534,943,259
Other payables 155,611,475 - 155,611,475 Short-term borrowings(*) 179,518,770 - 179,518,770 Other payables 1,057,821 - 1,057,821 Long-term borrowings(*) - 78,760,222 78,760,222 Long-term other payables - 1,593,271 1,593,271 W 871,131,325 80,353,493 951,484,818
(In thousands of won) 2017
Within a year Over 1 year Total Trade payables W 526,482,552 - 526,482,552
Other payables 187,225,641 - 187,225,641 Short-term borrowings(*) 165,030,362 - 165,030,362 Derivatives liabilities 409,259 - 409,259 Other payables 926,535 - 926,535 Long-term borrowings(*) - 75,719,767 75,719,767 Long-term other payables - 3,374,008 3,374,008 W 880,074,349 79,093,775 959,168,124 (*) Including expected interest expenses.
(In thousands of rupee) 2018
Within a year Over 1 year Total Trade payables Rs 33,605,136 - 33,605,136
Other payables 9,775,513 - 9,775,513 Short-term borrowings(*) 11,277,369 - 11,277,369 Other payables 66,452 - 66,452 Long-term borrowings(*) - 4,947,717 4,947,717 Long-term other payables - 100,089 100,089 Rs 54,724,470 5,047,806 59,772,276

SSANGYONG MOTOR COMPANY AND SUBSIDIARIES Notes to the Consolidated Financial Statements For the years ended December 31, 2018 and 2017
78
33. Financial Instruments, Continued (3) Financial risk management, continued 3) Liquidity risk, continued (In thousands of rupee) 2017
Within a year Over 1 year Total
Trade payables Rs 33,073,634 - 33,073,634 Other payables 11,761,515 - 11,761,515 Short-term borrowings(*) 10,367,207 - 10,367,207 Derivatives liabilities 25,710 - 25,710 Other payables 58,205 - 58,205 Long-term borrowings(*) - 4,756,716 4,756,716 Long-term other payables - 211,955 211,955 Rs 55,286,271 4,968,671 60,254,942 (*) Including expected interest expenses.
Details of commitments for borrowings as of December 31, 2018 and 2017 are as follows:
(In thousands of won and in thousands of rupee)
Korean won Indian rupee 2018 2017 2018 2017
Limitation of commitments for Borrowings
Used W 110,000,000 125,000,000 Rs 6,910,200 7,852,500
Unused 147,000,000 142,500,000 9,234,540 8,951,850 W 257,000,000 267,500,000 Rs 16,144,740 16,804,350
(4) Fair value of financial instruments
1) The Group’s management deems that the differences between carrying value and fair value of financial assets and financial liabilities recognized as amortized cost on financial statements is not significant.

SSANGYONG MOTOR COMPANY AND SUBSIDIARIES Notes to the Consolidated Financial Statements For the years ended December 31, 2018 and 2017
79
33. Financial Instruments, Continued (4) Fair value of financial instruments, continued
2) Valuation methods and assumptions applied in fair value measurement
The fair values of financial instruments (i.e., government bonds and unsecured corporate bonds) traded on active markets are determined with reference to quoted market prices. The Group uses the closing price as the quoted market price for its financial assets.
The fair values of derivatives where no active market exists or where quoted prices are not otherwise available are determined by using valuation techniques. Non-option derivatives are evaluated by discounted cash flow method using the yield curve available. Options are evaluated by option-pricing models. Foreign exchange forward contracts are determined using the yield curve derived from market interest rates with the same maturity of forward contracts. To measure interest rate swaps, the cash flows are estimated by the yield curve derived from market interest rate and discounted to calculate the present value of swaps.
Fair values of other financial assets and liabilities (except those stated above) are calculated by generally accepted valuation models based on discounted cash flow analysis. In case of borrowings, its fair value are disclosed, but estimated in amortized costs. The Group deem that its book value are similar to its fair values calculated by generally accepted valuation models based on discounts cash flow analysis.
3) The following table provides an analysis of financial instruments that are measured subsequent to initial recognition at fair value, classified as Level 1, 2 or 3, based on the degree to which the fair value is observable.
Level 1 quoted prices (unadjusted) in active markets for identical assets or liabilities Level 2 inputs other than quoted prices included within Level 1 that are observable for the asset or
liability, either directly or in indirectly (i.e. derived from prices) Level 3 input for the asset or liability that are not based on observable market data (unobservable
inputs)
Fair values of financial instruments by hierarchy level as of December 31, 2018 and 2017 are as follows:
(In thousands of won) Level 1 Level 2 Level 3 Fair value As of December 31, 2018 Derivatives assets W - 891,319 - 891,319
As of December 31, 2017 Derivatives liabilities - 409,259 - 409,259
(In thousands of rupee) Level 1 Level 2 Level 3 Fair value As of December 31, 2018 Derivatives assets Rs - 55,993 - 55,993
As of December 31, 2017 Derivatives liabilities Rs - 25,710 - 25,710

SSANGYONG MOTOR COMPANY AND SUBSIDIARIES Notes to the Consolidated Financial Statements For the years ended December 31, 2018 and 2017
80
33. Financial Instruments, Continued (4) Fair value of financial instruments, continued
4) The Group measures the foreign exchange forward contract derivative liabilities: W 891,319 thousand (Rs 55,993 thousand) based on the forward rate announced officially in the market as of December 31, 2018. In the event that no corresponding forward rate with residual year of the foreign exchange forward contract in the market exists, the Group measured the market value through interpolation method.
As input factors used in measuring market value of foreign exchange forward are from observable exchange forward rate, the Group classified the fair value of foreign exchange forward as level 2.
34. Subsequent events
Mahindra & Mahindra Ltd., the largest shareholder of the rights offering W 4,200 (Rs 264) per share under the face value of the registered common stock determined at the shareholders' meeting on October 25, 2018, participated in 11,890,606 shares, 100% of the capital increase shares in January 2019, to hold 74.66% of the total shares.
35. Going concern assumption
The Group’s financial statements are prepared on the assumption that it will continue as going concern, and therefore our assets and liabilities are accounted for on the assumption that they can be recovered or repaid at their carrying amount through the normal course of business activities. However, as of the end of the reporting period due to deteriorating financial structure, the Group has incurred operating losses of W 64,176 million (Rs 4,032 million) and net losses of W 61,838 million (Rs 3,885 million) as of the end of the reporting period. In addition, the Group’s current liabilities exceed its current assets by W 424,050 million (Rs 26,639 million). The deterioration in the Group’s financial structure was determined to be an event or situation that would significantly doubt on going concern assumption, and we plan the new capital increase and additional borrowing and the plan to extend the maturity of short-term borrowings. Under these plans, we have determined that there is no significant uncertainty about the going concern assumption.