hyundai motor company and subsidiaries …€¦ · hyundai motor company and subsidiaries...
TRANSCRIPT
HYUNDAI MOTOR COMPANY AND SUBSIDIARIES CONSOLIDATED FINANCIAL STATEMENTS FOR THE THREE MONTHS ENDED MARCH 31, 2011 AND 2010 AND INDEPENDENT ACCOUNTANTS’ REVIEW REPORT


HYUNDAI MOTOR COMPANY AND SUBSIDIARIES
CONSOLIDATED STATEMENTS OF FINANCIAL POSITION
AS OF MARCH 31, 2011 AND DECEMBER 31, 2010
ASSETS NOTES March 31, 2011
December 31, 2010
(In millions of Korean Won) Current assets: Cash and cash equivalents 17 ₩ 8,356,560 ₩ 6,215,815 Short-term financial instruments 17 7,285,005 7,421,776 Trade notes and accounts receivable 3,17 3,083,111 3,192,003 Other receivables 4,17 2,294,174 2,117,900 Other financial assets 5,17 773,005 125,746 Inventories 6 5,473,700 5,491,437 Other assets 7,17 1,114,595 1,188,813 Current tax assets 34,001 35,109 Financial services assets 16,17 19,100,065 17,731,555 Total current assets 47,514,216 43,520,154 Non-current assets: Long-term financial instruments 17 1,621 1,121,612 Long-term trade notes and accounts receivable 3,17 89,249 98,384 Other receivables 4,17 1,274,447 1,060,151 Other financial assets 5,17 1,810,262 2,145,803 Other assets 7,17 20,651 1,497 Property, plant and equipment 8 18,525,667 18,514,209 Investment property 9 279,395 267,116 Intangibles 10 2,588,029 2,651,568 Investments in joint ventures and associates 11 7,450,676 6,909,451 Deferred tax assets 527,946 588,674 Financial services assets 16,17 17,725,893 17,835,512 Total non-current assets 50,293,836 51,193,977 Total assets ₩ 97,808,052 ₩ 94,714,131 (Continued)
HYUNDAI MOTOR COMPANY AND SUBSIDIARIES
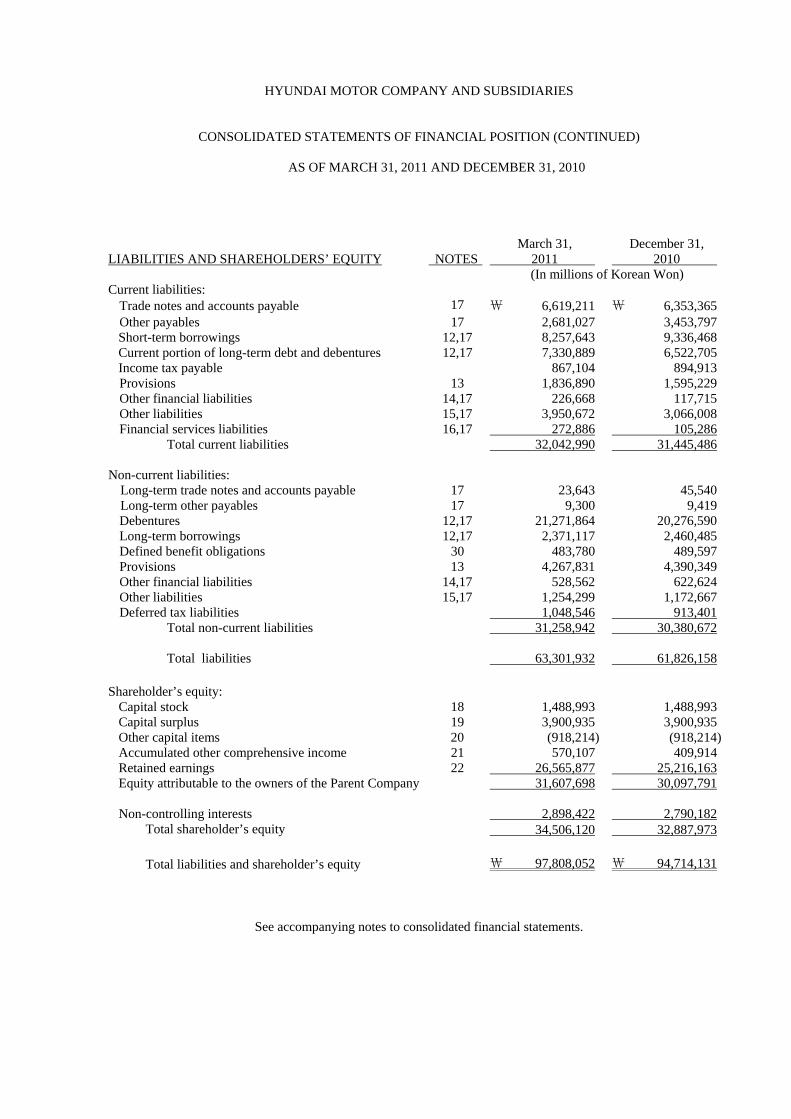
CONSOLIDATED STATEMENTS OF FINANCIAL POSITION (CONTINUED)
AS OF MARCH 31, 2011 AND DECEMBER 31, 2010
LIABILITIES AND SHAREHOLDERS’ EQUITY NOTES March 31, 2011
December 31, 2010
(In millions of Korean Won) Current liabilities: Trade notes and accounts payable 17 ₩ 6,619,211 ₩ 6,353,365 Other payables 17 2,681,027 3,453,797 Short-term borrowings 12,17 8,257,643 9,336,468 Current portion of long-term debt and debentures 12,17 7,330,889 6,522,705 Income tax payable 867,104 894,913 Provisions 13 1,836,890 1,595,229 Other financial liabilities 14,17 226,668 117,715 Other liabilities 15,17 3,950,672 3,066,008 Financial services liabilities 16,17 272,886 105,286 Total current liabilities 32,042,990 31,445,486 Non-current liabilities: Long-term trade notes and accounts payable 17 23,643 45,540 Long-term other payables 17 9,300 9,419 Debentures 12,17 21,271,864 20,276,590 Long-term borrowings 12,17 2,371,117 2,460,485 Defined benefit obligations 30 483,780 489,597 Provisions 13 4,267,831 4,390,349 Other financial liabilities 14,17 528,562 622,624 Other liabilities 15,17 1,254,299 1,172,667 Deferred tax liabilities 1,048,546 913,401 Total non-current liabilities 31,258,942 30,380,672 Total liabilities 63,301,932 61,826,158 Shareholder’s equity: Capital stock 18 1,488,993 1,488,993 Capital surplus 19 3,900,935 3,900,935 Other capital items 20 (918,214) (918,214) Accumulated other comprehensive income 21 570,107 409,914 Retained earnings 22 26,565,877 25,216,163 Equity attributable to the owners of the Parent Company 31,607,698 30,097,791 Non-controlling interests 2,898,422 2,790,182 Total shareholder’s equity 34,506,120 32,887,973
Total liabilities and shareholder’s equity ₩ 97,808,052 ₩ 94,714,131
See accompanying notes to consolidated financial statements.
HYUNDAI MOTOR COMPANY AND SUBSIDIARIES
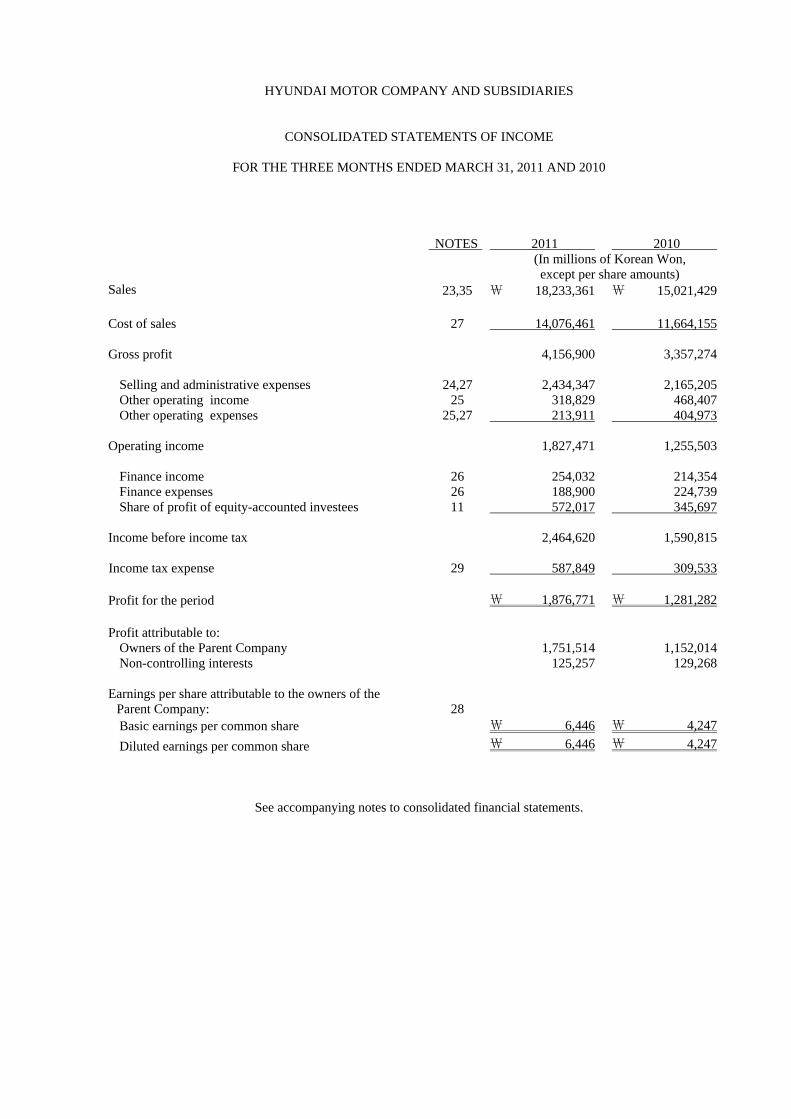
CONSOLIDATED STATEMENTS OF INCOME
FOR THE THREE MONTHS ENDED MARCH 31, 2011 AND 2010
NOTES 2011 2010
(In millions of Korean Won, except per share amounts)
Sales 23,35 ₩ 18,233,361 ₩ 15,021,429 Cost of sales 27 14,076,461 11,664,155 Gross profit 4,156,900 3,357,274 Selling and administrative expenses 24,27 2,434,347 2,165,205 Other operating income 25 318,829 468,407 Other operating expenses 25,27 213,911 404,973 Operating income 1,827,471 1,255,503 Finance income 26 254,032 214,354 Finance expenses 26 188,900 224,739 Share of profit of equity-accounted investees 11 572,017 345,697 Income before income tax 2,464,620 1,590,815 Income tax expense 29 587,849 309,533 Profit for the period ₩ 1,876,771 ₩ 1,281,282 Profit attributable to: Owners of the Parent Company 1,751,514 1,152,014 Non-controlling interests 125,257 129,268 Earnings per share attributable to the owners of the Parent Company: 28
Basic earnings per common share ₩ 6,446 ₩ 4,247
Diluted earnings per common share ₩ 6,446 ₩ 4,247
See accompanying notes to consolidated financial statements.

HYUNDAI MOTOR COMPANY AND SUBSIDIARIES
CONSOLIDATED STATEMENTS OF COMPREHENSIVE INCOME
FOR THE THREE MONTHS ENDED MARCH 31, 2011 AND 2010
2011 2010 (In millions of Korean Won) Profit for the period ₩ 1,876,771 ₩ 1,281,282 Other comprehensive income Gain on valuation of available-for-sale financial assets 143,113 118,044 Gain on valuation of cash flow hedge derivatives 78,478 29,930 Shares of changes of equity-accounted investees 41,523 (58,125) Actuarial gain on defined benefit obligations 6,637 2,953 Loss on foreign operations translation (70,911) (161,770) Total other comprehensive income 198,840 (68,968) Total comprehensive income ₩ 2,075,611 ₩ 1,212,314 Comprehensive income attributable to: Owners of the Parent Company 1,921,402 1,082,946 Non-controlling interests 154,209 129,368 Total comprehensive income ₩ 2,075,611 ₩ 1,212,314
See accompanying notes to consolidated financial statements.

HYUNDAI MOTOR COMPANY AND SUBSIDIARIES
CONSOLIDATED STATEMENTS OF CHANGES IN SHAREHOLDERS’ EQUITY
FOR THE THREE MONTHS ENDED MARCH 31, 2011 AND 2010
Capital stock
Capital surplus
Other Capital Items
Accumulated other
comprehensive income
Retained earnings
Total
Non- controlling interests
Total equity
(In millions of Korean Won) Balance at January 1, 2010 ₩ 1,488,993 ₩ 3,731,315 ₩ (743,909) ₩ (71,649) ₩ 20,165,746 ₩ 24,570,496 ₩ 2,575,017 ₩ 27,145,513Comprehensive income: Profit for the period 1,152,014 1,152,014 129,268 1,281,282Gain on valuation of available-for-sale financial assets, net 114,544 114,544 3,500 118,044Gain on valuation of cash flow hedge derivatives, net 29,792 29,792
138
29,930
Change in valuation of equity-accounted investees (58,131) (58,131) 6 (58,125)Actuarial gain on defined benefit obligations 3,033 3,033
(80)
2,953
Loss on foreign operations translation (158,306) (158,306) (3,464) (161,770)Total comprehensive income - - - (72,101) 1,155,047 1,082,946 129,368 1,212,314Transactions with owners, recorded directly in equity Payment of cash dividends (317,199) (317,199) (160,077) (477,276)Purchase of treasury stock (218,619) (218,619) (218,619)Disposal of treasury stock 75,962 148,983 224,945 224,945Other (1,560) (1,560) (88) (1,648)Total transactions with owners, recorded directly in equity - 75,962 (69,636) - (318,759) (312,433) (160,165) (472,598)Balance at March 31, 2010 ₩ 1,488,993 ₩ 3,807,277 ₩ (813,545) ₩ (143,750) ₩ 21,002,034 ₩ 25,341,009 ₩ 2,544,220 ₩ 27,885,229
(Continued)

HYUNDAI MOTOR COMPANY AND SUBSIDIARIES
CONSOLIDATED STATEMENTS OF CHANGES IN SHAREHOLDERS’ EQUITY (CONTINUED)
FOR THE THREE MONTHS ENDED MARCH 31, 2011 AND 2010
Capital stock
Capital surplus
Other Capital Items
Accumulated other
comprehensive income
Retained earnings
Total
Non- controlling interests
Total equity
(In millions of Korean Won) Balance at January 1, 2011 ₩ 1,488,993 ₩ 3,900,935 ₩ (918,214) ₩ 409,914 ₩ 25,216,163 ₩30,097,791 ₩ 2,790,182 ₩ 32,887,973Comprehensive income: Profit for the period 1,751,514 1,751,514 125,257 1,876,771Gain on valuation of available-for-sale financial assets, net 143,017 143,017 96 143,113Gain on valuation of cash flow hedge derivatives, net 50,910 50,910 27,568 78,478Change in valuation of equity-accounted investees 38,182 3,296 41,478 45 41,523Actuarial gain on defined benefit obligations 6,399 6,399 238 6,637Loss on foreign operations translation (71,916) (71,916) 1,005 (70,911)Total comprehensive income - - - 160,193 1,761,209 1,921,402 154,209 2,075,611Transactions with owners, recorded directly in equity Payment of cash dividends (412,227) (412,227) (45,423) (457,650)Other 732 732 (546) 186Total transactions with owners, recorded directly in equity - - - - (411,495) (411,495) (45,969) (457,464)Balance at March 31, 2011 ₩ 1,488,993 ₩ 3,900,935 ₩ (918,214) ₩ 570,107 ₩ 26,565,877 ₩31,607,698 ₩ 2,898,422 ₩ 34,506,120
See accompanying notes to consolidated financial statements.

HYUNDAI MOTOR COMPANY AND SUBSIDIARIES
CONSOLIDATED STATEMENTS OF CASH FLOWS
FOR THE THREE MONTHS ENDED MARCH 31, 2011 AND 2010
NOTES 2011 2010 (In millions of Korean Won) Cash flows from operating activities: Cash generated from operations 31 Profit for the period ₩ 1,876,771 ₩ 1,281,282 Adjustments 988,921 1,091,567 Changes in operating assets and liabilities (1,568,940) (741,429) 1,296,752 1,631,420 Interest received 111,185 74,514 Interest paid (102,865) (104,992) Dividend received 106,577 47,510 Income tax paid (447,140) (361,521) 964,509 1,286,931 Cash flows from investing activities: Cash inflows from investing activities: Proceeds from withdrawal of short-term financial instruments
1,670,991
1,271,535 Proceeds from disposal of other financial assets
2,163
67,938 Proceeds from disposal of other receivables 54,052 39,450 Proceeds from disposal of property, plant and equipment
48,268
79,885 Proceeds from disposal of intangible assets 199 21 Other cash receipts from investing activities 36,623 18,584 1,812,296 1,477,413 Cash outflows from investing activities: Purchase of short-term financial instruments 430,802 1,553,724 Acquisition of other financial assets 143,046 347,877 Acquisition of other receivables 335,217 51,672 Purchase of long-term financial instruments - 40,000 Acquisition of investments in joint ventures and associates
10,809
37,576
Acquisition of property, plant and equipment 462,273 481,786 Acquisition of intangible assets 152,703 191,854 Other cash payments from investing activities 44,078 41,675 (1,578,928) (2,746,164) 233,368 (1,268,751) (Continued)
HYUNDAI MOTOR COMPANY AND SUBSIDIARIES
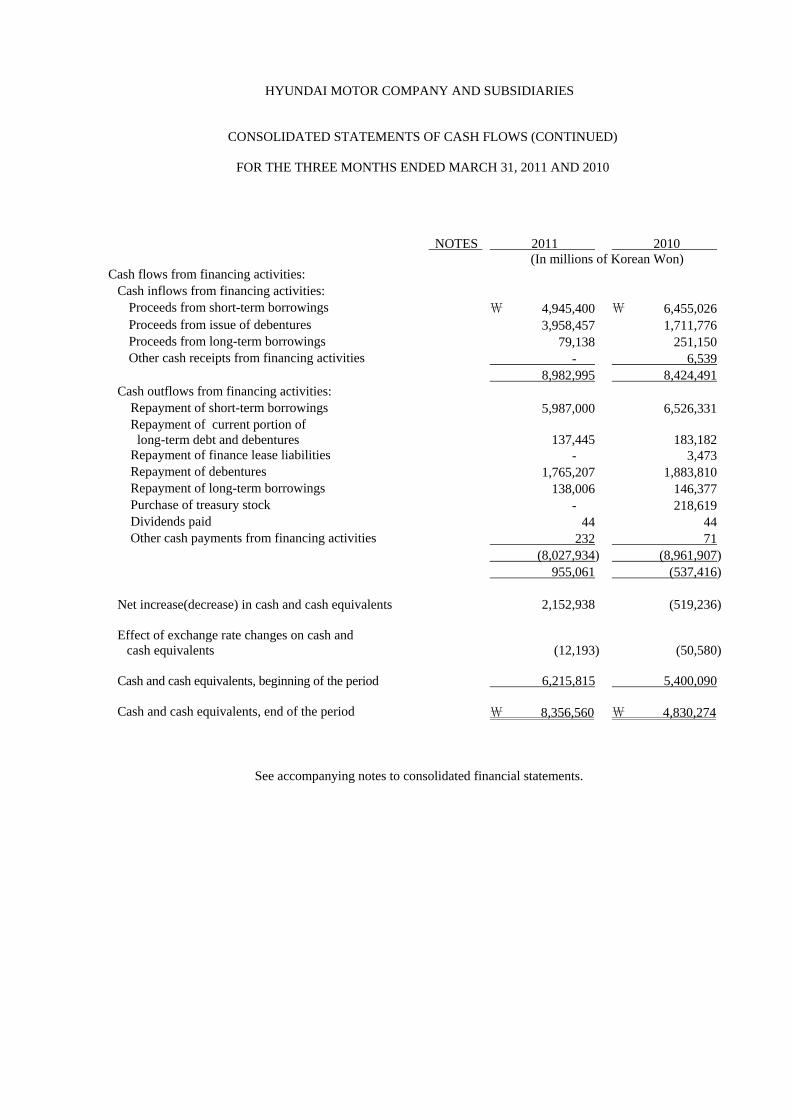
CONSOLIDATED STATEMENTS OF CASH FLOWS (CONTINUED)
FOR THE THREE MONTHS ENDED MARCH 31, 2011 AND 2010
NOTES 2011 2010 (In millions of Korean Won) Cash flows from financing activities: Cash inflows from financing activities: Proceeds from short-term borrowings ₩ 4,945,400 ₩ 6,455,026 Proceeds from issue of debentures 3,958,457 1,711,776 Proceeds from long-term borrowings 79,138 251,150 Other cash receipts from financing activities - 6,539 8,982,995 8,424,491 Cash outflows from financing activities: Repayment of short-term borrowings 5,987,000 6,526,331 Repayment of current portion of long-term debt and debentures
137,445
183,182
Repayment of finance lease liabilities - 3,473 Repayment of debentures 1,765,207 1,883,810 Repayment of long-term borrowings 138,006 146,377 Purchase of treasury stock - 218,619 Dividends paid 44 44 Other cash payments from financing activities 232 71 (8,027,934) (8,961,907) 955,061 (537,416) Net increase(decrease) in cash and cash equivalents 2,152,938 (519,236) Effect of exchange rate changes on cash and cash equivalents
(12,193)
(50,580)
Cash and cash equivalents, beginning of the period 6,215,815 5,400,090 Cash and cash equivalents, end of the period ₩ 8,356,560 ₩ 4,830,274
See accompanying notes to consolidated financial statements.

HYUNDAI MOTOR COMPANY AND SUBSIDIARIES
NOTES TO CONSOLIDATED FINANCIAL STATEMENTS
FOR THE THREE MONTHS ENDED MARCH 31, 2011 AND 2010
1. GENERAL: Hyundai Motor Company (“the Company”) was incorporated in 1967, under the laws of the Republic of Korea, to manufacture and distribute motor vehicles and parts. The shares of the Company have been listed on the Korea Exchange since 1974 and the Global Depositary Receipts issued by the Company have been listed on the London Stock Exchange and Luxemburg Stock Exchange. As of March 31, 2011, the major shareholders of the Company are Hyundai MOBIS (20.78%) and Chung, Mong Koo (5.17%). The Company’s consolidated subsidiaries as of March 31, 2011 are as follows: Subsidiaries
Nature of business
Location
Ownership percentage
Indirect ownership
Hyundai Capital Services, Inc. Financing Korea 56.47% Hyundai Card Co., Ltd.(*) ˝ ˝ 31.52% Hyundai Rotem Company Manufacturing ˝ 57.64% Green Air Co., Ltd. ˝ ˝ 51.00% Hyundai Rotem 51.00% Maintrans Co., Ltd. Services ˝ 80.00% Hyundai Rotem 80.00% Hyundai Partecs Company Ltd. Manufacturing ˝ 56.00% Jeonbuk Hyundai Motors FC Co., Ltd. Football Club ˝ 100.00% Hyundai NGV Tech Co., Ltd. Engineering ˝ 97.76% Hyundai Carnes Co., Ltd. R&D ˝ 100.00% Hyundai Motor America (HMA) Manufacturing USA 100.00% Hyundai Capital America (HCA) Financing ˝ 93.96% HMA 93.96% Hyundai Motor Manufacturing Alabama, LLC (HMMA) Manufacturing ˝ 100.00%
HMA 100.00%
Hyundai Auto Canada Corp. (HAC) ˝ Canada 100.00% HMA 100.00% Hyundai Auto Canada Captive Insurance Incorporation (HACCI) Insurance ˝ 100.00% HAC 100.00% Stamped Metal American Research Technology, Inc. (SMARTI)
Holding Company USA 72.45% HMA 72.45%
Stamped Metal American Research Technology LLC Manufacturing ˝ 100.00% SMARTI 100.00% Hyundai America Technical Center Inc. (HATCI) R&D ˝ 100.00% Hyundai Translead, Inc. (HT) Manufacturing ˝ 100.00% Rotem USA Corporation ˝ ˝ 100.00% Hyundai Rotem 100.00% Hyundai Motor India (HMI) ˝ India 100.00% Hyundai Motor India Engineering (HMIE) R&D ˝ 100.00% HMI 100.00% Hyundai Motor Japan Co. (HMJ) Sales Japan 100.00% Hyundai Motor Japan R&D Center Inc. (HMJ R&D) R&D ˝ 100.00% China Millennium Corporations (CMEs)
Real estate development China 59.60%
Beijing Hines Millennium Real Estate Development ˝ ˝ 99.00% CMEs 99.00% Beijing Jinxian Motor Safeguard Service Co., Ltd. (BJMSS) Sales ˝ 100.00% Beijing Jungxianronghua Motor Sale Co., Ltd. ˝ ˝ 100.00% BJMSS 100.00%

- 2 -
Subsidiaries
Nature of business
Location
Percentage ownership
Indirect ownership
Beijing Xinhuaxiaquyuetong Motor Chain Co., Ltd. ˝ ˝ 100.00% BJMSS 100.00% Rotem Equipments (Beijing) Co., Ltd. Manufacturing ˝ 100.00% Hyundai Rotem 100.00% Hyundai Motor Company Australia Pty Limited (HMCA) Sales Australia 100.00% Hyundai Motor Manufacturing Czech, Ltd. (HMMC) Manufacturing Czech 100.00% Hyundai Assan Otomotiv Sanayi Ve Ticaret A.S. (HAOSVT) ˝ Turkey 85.03% Hyundai Motor Manufacturing Rus LLC (HMMR) ˝ Russia 70.00% Hyundai Motor Commonwealth of Independent States B.V (HMCIS B.V) Holding Company Netherlands 100.00% HMMR 1.4% Hyundai Motor Commonwealth of Independent States (HMCIS) Sales Russia 100.00% HMCIS B.V 100.00% Hyundai Motor UK Ltd. (HMUK) ˝ UK 100.00% Hyundai Motor Europe GmbH (HME) ˝ Germany 100.00% Hyundai Motor Czech s.r.o (HMCZ) ˝ Czech 100.00% Hyundai Motor Poland Sp. Zo.O (HMP) ˝ Poland 100.00% Hyundai Motor Espana. S.L (HMES) ˝ Spain 100.00% Hyundai Motor Company Italy S.r.l (HMCI) ˝ Italy 100.00% Hyundai Motor Norway AS (HMN) ˝ Norway 100.00% Hyundai Motor Europe Technical Center GmbH (HMETC) R&D Germany 100.00% Hyundai Motor Hungary (HMH) Sales Hungary 100.00% Hyundai Motor Brasil Montadora de Automoveis LTDA (HMB) Manufacturing Brazil 100.00% Hyundai de Mexico, SA DE C.V., (HYMEX) ˝ Mexico 99.99% HT 99.99% Hyundai Capital Europe GmbH Financing Germany 100.00% Hyundai Capital Services 100.00%Eurotem DEMIRYOLU ARACLARI SAN. VE TIC A.S Manufacturing Turkey 50.50% Hyundai Rotem 50.50% Autopia Thirty-Third ~ Forty-Fifth Asset Securitization Specialty Company Financing Korea 91.00% Hyundai Capital Services 100.00%Work & Joy 2007-1 Securitization Specialty Co.(*) ˝ ˝ 0.90% Hyundai Card 0.90% Privia the First and Second Securitization Specialty Co., Ltd.(*) ˝ ˝ 0.90% Hyundai Card 0.90% Hyundai BC Funding Corporation ˝ USA 100.00% HCA 100% Hyundai CHA Funding Corporation ˝ ˝ 100.00% HCA 100% Hyundai Lease Titling Trust ˝ ˝ 100.00% HCA 100% Hyundai HK Funding, LLC ˝ ˝ 100.00% HCA 100% Hyundai HK Funding One, LLC ˝ ˝ 100.00% HCA 100% Hyundai HK Funding Two, LLC ˝ ˝ 100.00% HCA 100% Hyundai Auto Lease Funding, LLC ˝ ˝ 100.00% HCA 100% Hyundai ABS Funding Corporation ˝ ˝ 100.00% HCA 100% Hyundai Capital Insurance Services, LLC ˝ ˝ 100.00% HCA 100% HK Real Properties, LLC ˝ ˝ 100.00% HCA 100% (*) As the Company is considered to have substantial control over the entity, it is included in the consolidated financial statement.

- 3 -
2. SUMMARY OF SIGNIFICANT ACCOUNTING POLICIES: The Company maintains its official accounting records in Republic of Korean won (“Won”) and prepares consolidated financial statements in conformity with Korean statutory requirements and Korean International Reporting Standards (“K-IFRS”), in the Korean language (Hangul). Accordingly, these consolidated financial statements are intended for use by those who are informed about K-IFRS and Korean practices. The accompanying consolidated financial statements have been condensed, restructured and translated into English with certain expanded descriptions from the Korean language financial statements. Certain information included in the Korean language financial statements, but not required for a fair presentation of the Company’s financial position, comprehensive income, changes in stockholders’ equity or cash flows, is not presented in the accompanying consolidated financial statements. (1) Basis of consolidated financial statements presentation The Company and its subsidiaries (the “Group”) adopted the Korean International Financial Reporting Standards (“K-IFRS”) for the annual period beginning on January 1, 2011. In accordance with K-IFRS 1101 First-time Adoption of K-IFRS, the date of transition to K-IFRS is January 1, 2010. Reconciliations of the effect of the transition to K-IFRS are described in Note 36. The Group’s interim consolidated financial statements for the three months ended March 31, 2011 are prepared in accordance with K-IFRS 1034 Interim Financial Reporting. The interim consolidated financial statements are prepared in accordance with the K-IFRS that are effective as of March 31, 2011. There may be newly or amended K-IFRS and interpretations that are effective subsequent to the current period-end. Accordingly, accounting policies that are used for the preparation of the interim consolidated financial statements may be different from the policies that are used for the preparation of the first annual consolidated financial statements in accordance with K-IFRS as of and for the period ending December 31, 2011. Currently, enactments and amendments of the K-IFRSs are in progress, and the financial information presented in the interim financial statements may change accordingly in the future. The significant accounting policies used for the preparation of the interim consolidated financial statements are summarized below. These accounting policies are consistently applied to the Group’s consolidated financial statements for the current period and accompanying comparative prior period. (2) Basis of measurement The interim consolidated financial statements are prepared on the historical cost basis except otherwise stated in the accounting policies below. (3) Basis of consolidation The consolidated financial statements incorporate the financial statements of the Company and entities(including special purpose entities) controlled by the Company (or its subsidiaries). Control is the power to govern the financial and operating policies of an entity so as to obtain benefits from its activities. Income and expenses of subsidiaries acquired or disposed of during the period are included in the consolidated statement of comprehensive income from the effective date of acquisition and up to the effective date of disposal, as appropriate. When necessary, adjustments are made to the financial statements of subsidiaries to bring their accounting policies into line with those used by the Group. All intra-group transactions, balances, income and expenses are eliminated in full on consolidation. Non-controlling interests are presented in the consolidated statement of financial position within equity, separately from the equity of the owners of the Group. The carrying amount of non-controlling interests consists of the amount of those non-controlling interests at the initial recognition and the non-controlling interests’ share of changes in equity since the date of the acquisition. Total comprehensive income is attributed to the owners of the Group and to the non-controlling interests even if this results in the non-controlling interests having a deficit balance.

- 4 -
Changes in the Group's ownership interests in subsidiaries that do not result in the Group losing control over the subsidiaries are accounted for as equity transactions. The carrying amounts of the Group's interests and the non-controlling interests are adjusted to reflect the changes in their relative interests in the subsidiaries. Any difference between the amount by which the non-controlling interests are adjusted and the fair value of the consideration paid or received is recognized directly in equity and attributed to owners of the Group. When the Group loses control of a subsidiary, the profit or loss on disposal is calculated as the difference between (i) the aggregate of the fair value of the consideration received and the fair value of any retained interest and (ii) the previous carrying amount of the assets (including goodwill), and liabilities of the subsidiary and any non-controlling interests. When assets of the subsidiary are carried at revalued amounts or fair values and the related cumulative gain or loss has been recognized in other comprehensive income and accumulated in equity, the amounts previously recognized in other comprehensive income and accumulated in equity are accounted for as if the Company had directly disposed of the relevant assets (i.e. reclassified to profit or loss or transferred directly to retained earnings as specified by applicable K-IFRSs). The fair value of any investment retained in the former subsidiary at the date when control is lost is regarded as the fair value on initial recognition for subsequent accounting under K-IFRS 1039 Financial Instruments: Recognition and Measurement or, when applicable, the cost on initial recognition of an investment in an associate or a jointly controlled entity. (4) Business combination Acquisitions of businesses are accounted for using the acquisition method. The consideration transferred in a business combination is measured at fair value, which is calculated as the sum of the acquisition-date fair values of the assets transferred by the Group, liabilities incurred by the Group to the former owners of the acquiree and the equity interests issued by the Group in exchange for control of the acquiree. The consideration includes any asset or liability resulting from a contingent consideration arrangement and is measured at fair value. Acquisition-related costs are generally recognized in profit or loss as incurred. When a business combination is achieved in stages, the Group's previously held equity interest in the acquiree is remeasured at its fair value at the acquisition date (i.e. the date when the Group obtains control) and the resulting gain or loss, if any, is recognized in profit or loss. Prior to the acquisition date, the amount resulting from changes in the value of its equity interest in the acquiree that have previously been recognized in other comprehensive income are reclassified to profit or loss where such treatment would be appropriate if that interest were directly disposed of. (5) Revenue recognition 1) Sale of goods The Group recognizes revenue from sale of goods when all of the following conditions are satisfied: the Group has transferred to the buyer the significant risks and rewards of ownership of the goods; the
amount of revenue can be measured reliably; it is probable that the economic benefits associated with the transaction will flow to the Group
The Group grants award credits which the customers can redeem for awards such as free or discounted goods or services. The fair value of the award credits is estimated by considering the fair value of the goods granted, the expected rate and period of collection. The fair value of the consideration received or receivable from the customers is allocated to award credits and sales transaction. The consideration allocated to the award credits is deferred and recognized as revenue when the award credits are redeemed and the Group's obligations have been fulfilled. 2) Rendering of services The Group recognizes revenue from rendering of services when the amount of revenue can be measured reliably and it is probable that the economic benefits associated with the transaction will flow to the Group. 3) Royalties The Group recognizes revenue from royalties on an accrual basis in accordance with the substance of the relevant agreement.

- 5 -
4) Dividend and interest income Revenues arising from dividends are recognized when the right to receive payment is established. Interest income is recognized using the effective interest method as time passes. (6) Foreign currency translation The individual financial statements of each Group entity are presented in the currency of the primary economic environment in which the entity operates (its functional currency). In preparing the financial statements of the individual entities, transactions occurred in currencies other than their functional currency (foreign currencies) are recorded in translated amount using the exchange rate on the dates of the transactions. At the end of each reporting period, monetary items denominated in foreign currencies are translated using the exchange rate at the reporting period. Non-monetary items that are measured in terms of historical cost in a foreign currency are translated using the exchange rate at the date of the transaction. Non-monetary items that are measured at fair value in a foreign currency are translated using the exchange rates at the date when the fair value was determined. Exchange differences resulting from settlement of assets or liabilities and translation of monetary items denominated in foreign currencies are recognized in profit or loss in the period in which they arise except for some exceptions. For the purpose of presenting the consolidated financial statements, assets and liabilities in the Group’s foreign operations are translated into Korean Won, using the exchange rates at the end of reporting period. Income and expense items are translated at the average exchange rate for the period, unless the exchange rate during the period has significantly fluctuated, in which case the exchange rates at the dates of the transactions are used. The exchange differences arising, if any, are recognized in equity as other comprehensive income. On the disposal of a foreign operation, the cumulative amount of the exchange differences relating to that foreign operation is reclassified from equity to profit or loss when the gain or loss on disposal is recognized. Any goodwill arising on the acquisition of a foreign operation and any fair value adjustments to the carrying amounts of assets and liabilities arising on the acquisition of that foreign operation are treated as assets and liabilities of the foreign operation and translated at the exchange rate at the end of reporting period. In addition, the foreign exchange gain or loss is classified in other operating income(expense) or finance income(expense) by the nature of the transaction or event. (7) Financial assets The Group classifies the financial assets into the following specified categories: financial assets at fair value through profit or loss (“FVTPL”), held-to-maturity investments, loans and receivables and available-for-sale (“AFS”) financial assets. The classification depends on the nature and purpose of the financial assets and is determined at the time of initial recognition. 1) Financial assets at FVTPL FVTPL includes financial assets classified as held for trading and financial assets designated at FVTPL upon initial recognition. A financial asset is classified as FVTPL, if it has been acquired principally for the purpose of selling or repurchasing in near term. All derivative assets, except for derivatives that are designated and effective hedging instruments, are classified as held for trading financial assets which are measured at fair value through profit or loss. Financial assets at FVTPL are measured at fair value, with any gains or losses arising on remeasurement recognized in profit or loss. 2) Held-to-maturity investments Held-to-maturity investments are non-derivative financial instruments with fixed or determinable payments and fixed maturity that the Group has the positive intention and ability to hold to maturity. Held-to-maturity investments are presented at amortized cost using the effective interest rate less accumulated impairment loss, and interest income is recognized using the effective interest rate method.

- 6 -
3) Loans and receivables Loans and receivables are non-derivative financial assets with fixed or determinable payments that are not quoted in an active market, and measured at amortized cost. Interest income is recognized using the effective interest rate method except for the short-term receivable of which the interest income is not material. 4) AFS financial assets Available-for-sale financial assets are those non-derivative financial assets that are designated as available for sale or are not classified as loans and receivables, held-to-maturity investments or financial assets at fair value through profit or loss. Available-for-sale financial assets are measured at fair value. However, investments in equity instruments that do not have a quoted market price in an active market and whose fair value cannot be reliably measured are measured at cost. A gain or loss on changes in fair value of AFS financial assets are recognized in other comprehensive income, except for impairment loss, interest calculated using the effective interest method and foreign exchange gains and losses on monetary assets. Accumulated other comprehensive income is reclassified to current gain or loss from equity at the time of impairment recognition or elimination of related financial assets. Dividends on an AFS equity instrument are recognized in profit or loss when the Group’s right to receive payment is established. (8) Impairment of financial assets 1) Financial assets carried at amortized cost The Group assesses at the end of each reporting period whether there is any objective evidence that a financial asset or group of financial assets is impaired. If any such evidence exists, the Group determines the amount of any impairment loss. The amount of the loss is measured as the difference between the asset’s carrying amount and the present value of estimated future cash flows, excluding future credit losses that have not been incurred, discounted at the financial asset’s original effective interest rate computed at initial recognition. The carrying amount of the asset is reduced directly and the amount of the loss is recognized in profit or loss. If, in a subsequent period, the amount of the impairment loss decreases and the decrease can be related objectively to an event occurring after the impairment was recognized, the previously recognized impairment loss is reversed and recognized in profit or loss. The reversal shall not result in a carrying amount of the financial asset that exceeds what the amortized cost would have been had the impairment not been recognized at the date the impairment is reversed 2) Financial assets carried at cost The amount of the impairment loss on financial assets that is carried at cost because its fair value cannot be reliably measured is measured as the difference between the carrying amount of the financial asset and the present value of estimated future cash flows discounted at the current market rate of return for a similar financial asset. Such impairment losses shall not be reversed. 3) Available-for-sale financial assets If there is objective evidence of impairment on available-for-sale financial assets, the cumulative loss that has been recognized in other comprehensive income less any impairment loss previously recognized in profit or loss is reclassified from equity to profit or loss. Impairment losses recognized in profit or loss for an investment in an equity instrument classified as AFS aren’t reversed through profit or loss. Meanwhile, if, in a subsequent period, the fair value of a debt instrument classified as AFS increases and the increase can be objectively related to an event occurring after the impairment loss was recognized in profit or loss, the impairment loss is reversed through profit or loss. A certain financial assets such as trade receivables that are assessed not to be impaired individually are, in addition, assessed for impairment on a collective basis. The objective evidence of impairment for a portfolio of receivables could include the Group’s past experience of collecting payments, an increase in the number of delayed payments in the portfolio past the average credit period, as well as observable changes in national or local economic conditions that correlate with default on receivables.

- 7 -
(9) Derecognition of financial assets The Group derecognizes a financial asset when the contractual rights to the cash flows from the asset expire, or when it transfers the financial asset and substantially all the risks and rewards of ownership of the asset to another entity. If the Group neither retains substantially all the risks and rewards of ownership nor transfers and continues to control the transferred asset, the Group recognizes its retained interest in the asset and associated liability for amounts it may have to pay. If the Group retains substantially all the risks and rewards of ownership of a transferred financial asset, the Group continues to recognize the financial asset and also recognizes a collateralized borrowing for the proceeds received. (10) Inventory Inventory is measured at the lower of cost and net realizable value. Inventory cost including the fixed and variable manufacturing overhead cost, is calculated, using the moving average method except for the cost for inventory in transit which are determined by identified cost method. Net realizable value is the estimated selling price in the ordinary course of business less the estimated costs of completion and the estimated costs necessary to make the sale. (11) Investments in associates An associate is an entity over which the Group has significant influence and that is neither a subsidiary nor an interest in a joint venture. Significant influence is the power to participate in the financial and operating policy decisions of the investee but is not control or joint control over its policies. The investment is initially recognized at cost and accounted for using the equity method. Under the equity method, an investment in an associate is initially recognized in the consolidated statement of financial position at cost and adjusted thereafter to recognize the Group's share of the profit or loss and other comprehensive income of the associate. When the Group's share of losses of an associate exceeds the Group's interest in that associate (which includes any long-term interests that, in substance, form part of the Group's net investment in the associate), the Group discontinues recognizing its share of further losses. Additional losses are recognized only to the extent that the Group has incurred legal or constructive obligations or made payments on behalf of the associate. Any excess of the cost of acquisition over the Group's share of the net fair value of the identifiable assets, liabilities and contingent liabilities of an associate recognized at the date of acquisition is recognized as goodwill, which is included within the carrying amount of the investment. The entire carrying amount of the investment including goodwill is tested for impairment and presented at the amount less accumulated impairment losses. Any excess of the Group's share of the net fair value of the identifiable assets, liabilities and contingent liabilities over the cost of acquisition, after reassessment, is recognized immediately in profit or loss. Unrealized gains from transactions between the Group and its associates are eliminated limited up to the shares in associate stocks. Unrealized losses are also eliminated unless evidence of impairment in assets transferred is produced. If the accounting policy of associates differs from the Group, financial statements are adjusted accordingly before applying equity method of accounting. If the Group’s ownership interest in an associate is reduced, but the significant influence is continued, the Group reclassifies to profit or loss only a proportionate amount of the gain or loss previously recognized in other comprehensive income. (12) Interests in joint ventures A joint venture is a contractual arrangement whereby the Group and other parties undertake an economic activity that is subject to joint control(i.e. when the strategic financial and operating policy decisions relating to the activities of the joint venture require the unanimous consent of the parties sharing control). Investments in joint ventures are initially recognized at acquisition cost and accounted for using the equity method. The carrying amount of the investments contains goodwill arising on the acquisition of the Group's interest in a jointly controlled entity and presented at the amount less accumulated impairment losses.
- 8 -
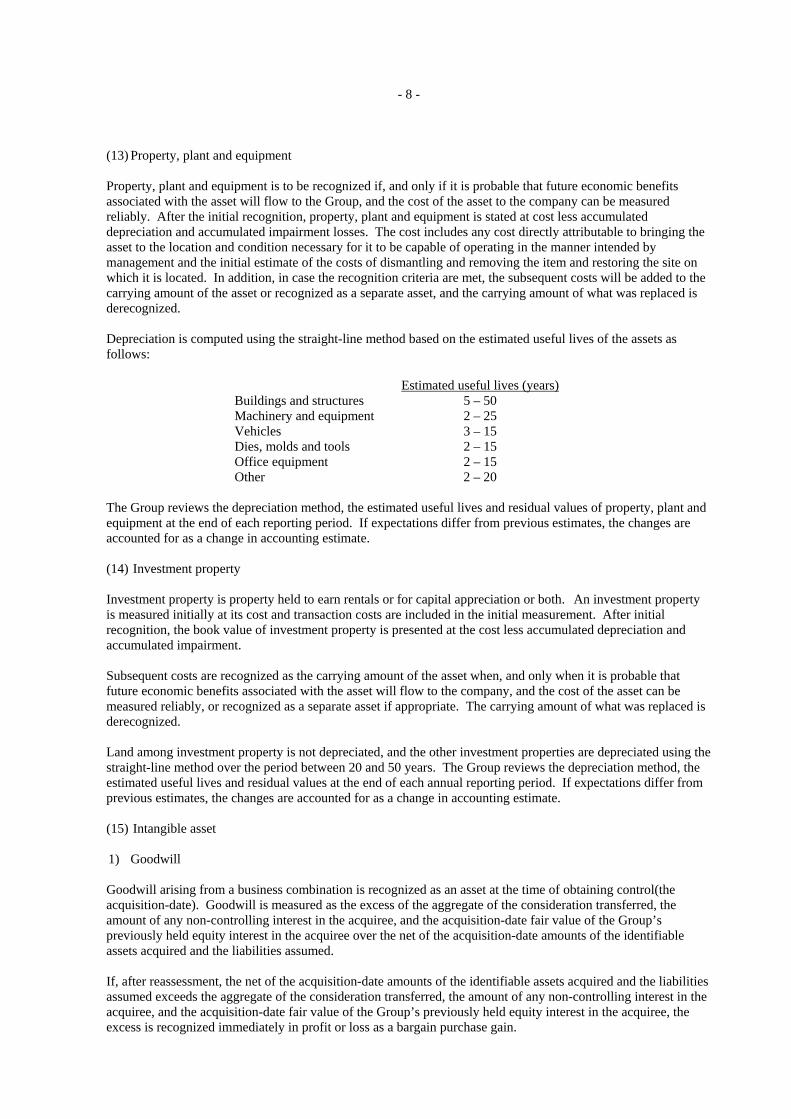
(13) Property, plant and equipment Property, plant and equipment is to be recognized if, and only if it is probable that future economic benefits associated with the asset will flow to the Group, and the cost of the asset to the company can be measured reliably. After the initial recognition, property, plant and equipment is stated at cost less accumulated depreciation and accumulated impairment losses. The cost includes any cost directly attributable to bringing the asset to the location and condition necessary for it to be capable of operating in the manner intended by management and the initial estimate of the costs of dismantling and removing the item and restoring the site on which it is located. In addition, in case the recognition criteria are met, the subsequent costs will be added to the carrying amount of the asset or recognized as a separate asset, and the carrying amount of what was replaced is derecognized. Depreciation is computed using the straight-line method based on the estimated useful lives of the assets as follows:
Estimated useful lives (years)Buildings and structures 5 – 50 Machinery and equipment 2 – 25 Vehicles 3 – 15 Dies, molds and tools 2 – 15 Office equipment 2 – 15 Other 2 – 20
The Group reviews the depreciation method, the estimated useful lives and residual values of property, plant and equipment at the end of each reporting period. If expectations differ from previous estimates, the changes are accounted for as a change in accounting estimate. (14) Investment property Investment property is property held to earn rentals or for capital appreciation or both. An investment property is measured initially at its cost and transaction costs are included in the initial measurement. After initial recognition, the book value of investment property is presented at the cost less accumulated depreciation and accumulated impairment. Subsequent costs are recognized as the carrying amount of the asset when, and only when it is probable that future economic benefits associated with the asset will flow to the company, and the cost of the asset can be measured reliably, or recognized as a separate asset if appropriate. The carrying amount of what was replaced is derecognized. Land among investment property is not depreciated, and the other investment properties are depreciated using the straight-line method over the period between 20 and 50 years. The Group reviews the depreciation method, the estimated useful lives and residual values at the end of each annual reporting period. If expectations differ from previous estimates, the changes are accounted for as a change in accounting estimate. (15) Intangible asset 1) Goodwill Goodwill arising from a business combination is recognized as an asset at the time of obtaining control(the acquisition-date). Goodwill is measured as the excess of the aggregate of the consideration transferred, the amount of any non-controlling interest in the acquiree, and the acquisition-date fair value of the Group’s previously held equity interest in the acquiree over the net of the acquisition-date amounts of the identifiable assets acquired and the liabilities assumed. If, after reassessment, the net of the acquisition-date amounts of the identifiable assets acquired and the liabilities assumed exceeds the aggregate of the consideration transferred, the amount of any non-controlling interest in the acquiree, and the acquisition-date fair value of the Group’s previously held equity interest in the acquiree, the excess is recognized immediately in profit or loss as a bargain purchase gain.

- 9 -
Goodwill isn’t amortized but tested for impairment at least annually. For purposes of impairment tests, goodwill is distributed to cash generating unit(“CGU”) of the Group where it is thought to have synergy effect from business combination. CGU that has goodwill is tested for impairment every year or when an event occurs that indicates impairment. If recoverable amount of CGU is less than carrying amount, the impairment will first decrease the goodwill distributed to that CGU and the remaining impairment will be distributed among other assets relative to its carrying value. Impairment recognized to goodwill may not be reversed. When disposing a subsidiary, related goodwill will be included in gain or loss from disposal. 2) Development costs The expenditure on research is recognized as an expense when it is incurred. The expenditure on development is recognized if, and only if, all of the following can be demonstrated: - the technical feasibility of completing the intangible asset so that it will be available for use or sale; - the intention to complete the intangible asset and use or sell it; - the ability to use or sell the intangible asset; - how the intangible asset will generate probable future economic benefits; - the availability of adequate technical, financial and other resources to complete the development and to use or
sell the intangible asset; and - the ability to measure reliably the expenditure attributable to the intangible asset during its development.
The cost of an internally generated intangible asset is the sum of the expenditure incurred from the date when the intangible asset first meets the recognition criteria above and the carrying amount of intangible assets is presented the acquisition cost less accumulated amortization and accumulated impairment losses. 3) Intangible assets acquired separately
Intangible assets that are acquired separately are carried at cost less accumulated amortization and accumulated impairment losses. Amortization is recognized using the straight-line method based on the estimated useful lives. The Group reviews the estimated useful life and amortization method at the end of each reporting period. If expectations differ from previous estimates, the changes are accounted for as a change in accounting estimate. Amortization is computed using the straight line method based on the estimated useful lives of the assets as follows:
Estimated useful lives (years) Development costs 3 – 5 Industrial property rights 5 – 10 Software 2 – 6 Other 2 – 40
(16) Impairment of tangible and intangible assets The Group assesses at the end of each reporting period whether there is any indication that an asset may be impaired. If any such indication exists, the Group estimates the recoverable amount of the asset to determine the extent of the impairment loss. Recoverable amount is the higher of fair value less costs to sell and value in use. If the cash inflow of individual asset occurs separately from other assets or group of assets, the recoverable amount is measured for that individual asset; otherwise, it is measured for each CGU to which the asset belongs. Except for goodwill, all non-financial assets that have incurred impairment are tested for reversal of impairment at the end of each reporting period. Intangible assets with indefinite useful lives or intangible assets not yet available for use aren’t amortized and tested for impairment at least annually.

- 10 -
(17) Lease Leases are classified as finance leases when the terms of the lease transfer substantially all the risks and rewards of ownership to the lessee. All other leases are classified as operating leases. 1) The Group as lessor Amounts due from lessees under finance leases are recognized as receivables at the amount of the Group’s net investment in the leases. Finance lease interest income is allocated to accounting periods so as to reflect an effective interest rate on the Group’s net investment outstanding in respect of the leases. Rental income from operating leases is recognized on a straight-line basis over the term of the relevant lease. Initial direct costs incurred in negotiating and arranging an operating lease are added to the carrying amount of the leased asset and recognized as expense on a straight-line basis over the lease term. 2) The Group as lessee Assets held under finance leases are initially recognized as assets and liability of the Group at their fair value at the inception of the lease or, if lower, at the present value of the minimum lease payments. Minimum lease payments are apportioned between the finance expenses and the reduction of the outstanding liability. The finance expenses are allocated to each period during the lease term so as to produce a constant periodic rate of interest on the remaining balance of the liability. Contingent rents are recognized as expenses in the periods in which they are incurred. Operating lease payments are recognized as expense on a straight-line basis over the lease term, except where another systematic basis is more representative of the time pattern in which economic benefits from the leased asset are consumed. And contingent rents for operating lease are recognized as expenses in the periods in which they are incurred. (18) Borrowing costs Borrowing costs directly attributable to the acquisition, construction or production of qualifying assets are capitalized to the cost of those assets, until they are ready for their intended use or sale. A qualifying asset is an asset that necessarily takes a substantial period of time to get ready for its intended use or sale. Investment income earned on the temporary investment of specific borrowings pending their expenditure on qualifying assets is deducted from the borrowing costs eligible for capitalization. All other borrowing costs are recognized in profit or loss in the period in which they are incurred. (19) Retirement benefit costs Contributions to defined contribution retirement benefit plans are recognized as an expense when employees have rendered service entitling them to the contributions. The retirement benefit obligation recognized in the statements of financial position represents the present value of the defined benefit obligation, less fair value of plan assets and adjustment for unrecognized past service cost. Defined benefit obligations are calculated by an actuary using the Projected Unit Credit Method. The present value of the defined benefit obligation are measured by discounting estimated future cash outflows by the interest rate of high-quality corporate bonds with similar maturity as the expected post-employment benefit payment date. Actuarial gain or loss from changes in actuarial assumptions or differences between actuarial assumptions and actual results is recognized in other comprehensive income of the statement of comprehensive income, which is immediately recognized as retained earnings. Those recognized in retained earnings will not be reclassified in profit and loss of current period. Past service costs are recognized in profit and loss of the period, but if the changes in pension plans require a vesting period, the past service costs are expensed over the vesting period using a straight-line method.

- 11 -
(20) Provisions A provision is recognized when the Group has a present obligation (legal or constructive) as a result of a past event and it is probable that an outflow of resources embodying economic benefits will be required to settle the obligation, and a reliable estimate can be made of the amount of the obligation. The amount recognized as a provision is the best estimate of the consideration required to settle the present obligation at the end of the reporting period, taking into account the risks and uncertainties surrounding the obligation. A provision is measured using the present value of the cash flows estimated to settle the present obligation. The increase in provision due to passage of time is recognized as interest expense. The Group generally provides a warranty to the ultimate consumer for each product sold and accrues warranty expense at the time of sale based on actual claims history. Also, the Group accrues potential expenses, which may occur due to product liability suit, voluntary recall campaign and other obligations as of the date of the end of the reporting period. In addition, certain subsidiaries recognize provision for the potential loss from the unused agreed credit limits, construction contracts, pre-contract sale or service contract. When some or all of the economic benefits required to settle a provision are expected to be recovered from a third party, a receivable is recognized as an asset if it is certain that reimbursement will be received and the amount of the receivable can be measured reliably. (21) Taxation Income tax expense is composed of current and deferred tax. 1) Current tax
The current tax is computed based on the taxable profit for the year. The taxable profit differs from the profit for the period as reported in the consolidated statements of comprehensive income because it excludes items of income or expense that are taxable or deductible in other years and it further excludes items that are never taxable or deductible. The Group’s liability for current tax expense is calculated using tax rates that have been enacted or substantively enacted by the end of the reporting period. 2) Deferred tax Deferred tax is recognized on temporary differences between the carrying amounts of assets and liabilities in the financial statements and the corresponding tax bases used in the computation of taxable profit. Deferred tax liabilities are generally recognized for all taxable temporary differences. Deferred tax assets are generally recognized for all deductible temporary differences to the extent that it is probable that taxable profits will be available against which those deductible temporary differences can be utilized. Such deferred tax assets and liabilities are not recognized if the temporary difference arises from goodwill or from the initial recognition (other than in a business combination) of other assets and liabilities in a transaction that affects neither the taxable profit nor the accounting profit. Deferred tax liabilities are recognized for taxable temporary differences associated with investments in subsidiaries and associates, and interests in joint ventures, except when the Group is able to control the timing of the reversal of the temporary difference and it is probable that the temporary difference will not be reversed in the foreseeable future. Deferred tax assets arising from deductible temporary differences associated with such investments and interests are only recognized to the extent that taxable profit will be available against which the temporary difference can be utilized and they are expected to be reversed in the foreseeable future. The carrying amount of deferred tax assets is reviewed at the end of each reporting period and reduced to the extent that it is no longer probable that sufficient taxable profits will be available to allow all or part of the asset to be recovered. Deferred tax assets and liabilities are measured at the tax rates that are expected to be applied in the period in which the liability is settled or the asset is realized, based on tax rates and tax laws that have been enacted or substantively enacted by the end of the reporting period. The measurement of deferred tax assets and liabilities reflects the tax consequences that would follow from the manner in which the Group expects to recover or settle the carrying amount of its assets and liabilities at the end of the reporting period.

- 12 -
Deferred tax assets and liabilities are offset when there is a legally enforceable right to offset current tax assets against current tax liabilities and when they relate to income tax levied by the same taxation authority. Also, they are offset when different taxable entities which intend either to settle current tax liabilities and assets on a net basis, or to realize the assets and settle the liabilities simultaneously, in each future period in which significant amounts of deferred tax liabilities or assets are expected to be settled or recovered. 3) Current and deferred tax for the year Current and deferred tax are recognized in profit or loss, except when they relate to items that are recognized in other comprehensive income or directly in equity, or items arising from initial accounting treatments of a business combination. The tax effect arising from a business combination is included in the accounting for the business combination. (22) Treasury stock When the Group repurchases its equity instruments(treasury stock), the incremental costs, net of tax effect, are deducted from the shareholders’ equity and recognized as other capital item deducted from the total equity in the statements of financial position. In addition, profits or losses from purchase, sale or retirement of treasury stocks are directly recognized in shareholders’ equity and not in current profit or loss. (23) Financial liabilities and equity instruments Debt instruments and equity instruments issued by the Group are recognized as financial liabilities or equity depending on the contract. 1) Equity instruments
An equity instrument is any contract that evidences a residual interest in the assets of an entity after deducting all of its liabilities. Equity instrument issued by the Group is recognized at issuance amount net of direct issuance costs. 2) Financial guarantee liabilities Financial guarantee liabilities are initially measured at fair value and are subsequently measured at higher amount between obligated amount of the contract and the initial cost less accumulated amortization according to profit recognition principles. 3) Financial liabilities at FVTPL (Fair Value Through Profit or Loss) Financial liabilities at FVTPL include a financial liability held for trading and a financial liability designated at FVTPL. FVTPL is stated at fair value and the gains and losses arising on remeasurement and the interest expenses paid in financial liabilities are recognized in profit and loss. 4) Other financial liabilities Other financial liabilities are initially measured at fair value, net of transaction costs. Other financial liabilities are subsequently measured at amortized cost using the effective interest method, with interest expense recognized on an effective-yield basis. 5) Derecognition of financial liabilities The Group derecognizes financial liabilities only when the Group’s obligations are discharged, cancelled or expired.

- 13 -
(24) Derivative financial instruments
Derivatives are initially recognized at fair value at the date the derivative contracts are entered into and are subsequently remeasured to their fair value at the end of each reporting period. If derivative designated as a hedged item is not effective, it shall be recognized immediately in profit or loss, in such case the timing of the recognition in profit or loss depends on the nature of the hedge relationship. The Group designates certain derivatives as hedging instruments to hedge the risk of changes in fair value of a recognized asset or liability or an unrecognized firm commitment (fair value hedges) and the risk of changes in cash flow of a highly probable forecast transaction and the risk of changes in foreign currency exchange rates of firm commitment (cash flow hedge).
1) Fair value hedges The Group recognizes the changes in the fair value of derivatives that are designated and qualify as fair value hedges are recognized in profit or loss immediately, together with any changes in the fair value of the hedged asset or liability that are attributable to the hedged risk. Hedge accounting is discontinued when the Group revokes the hedging relationship, when the hedging instrument expires or is sold, terminated, or exercised, or when it no longer qualifies for hedge accounting. The fair value adjustment to the carrying amount of the hedged item arising from the hedged risk is amortized to profit or loss from that date. 2) Cash flow hedges The effective portion of changes in the fair value of derivatives that are designated and qualify as cash flow hedges is recognized in other comprehensive income. The gain or loss relating to the ineffective portion is recognized immediately in profit or loss. Amounts previously recognized in other comprehensive income and accumulated in equity are reclassified to profit or loss in the periods when the hedged item is recognized in profit or loss. If non-financial asset or liability is recognized due to forecast transaction of hedged item, the related gain and loss recognized in other comprehensive income and accumulated in equity is transferred from equity and included in the initial cost of related non-financial asset or liability. Cash flow hedge is discontinued when the Group revokes the hedging relationship, when the hedge instrument is extinguished, disposed, redeemed, exercised, or when it no longer qualifies for the criteria of hedging. Any gain or loss accumulated in equity at that time remains in equity and is recognized when the forecast transaction occurs. When the forecast transaction is no longer expected to occur, the gain or loss accumulated in equity is recognized immediately in profit or loss. (25) Significant accounting judgements and key sources of estimation uncertainties In the application of the Group accounting policies, management is required to make judgments, estimates and assumptions about the carrying amounts of assets and liabilities that cannot be identified from other sources.. The estimation and assumptions are based on historical experience and other factors that are considered to be relevant. Actual results may be different from those estimations. The estimates and underlying assumptions are reviewed on an ongoing basis. Revisions to accounting estimates are recognized in the period in which the estimate is revised if the revision affects only that period or in the period of the revision and future periods if the revision affects both current and future periods. 3. TRADE NOTES AND ACCOUNTS RECEIVABLE: (1) Trade receivables as of March 31, 2011 and December 31, 2010 consist of the following: March 31, 2011 December 31, 2010 Description Current Non-current Current Non-current (In millions of Korean Won) Trade notes and accounts receivable ₩ 3,116,201 ₩ 98,339 ₩ 3,222,358 ₩ 109,244Allowance for doubtful accounts (33,090) - (30,355) - Present value discount accounts - (9,090) - (10,860) ₩ 3,083,111 ₩ 89,249 ₩ 3,192,003 ₩ 98,384

- 14 -
The balances of trade receivables that are past due, but not impaired as of March 31, 2011 and December 31, 2010 are ₩220,186 million and ₩360,014 million, respectively, and the balances that are past due under 90 days are ₩133,594 million and ₩162,965 million, respectively. The impaired amounts as of March 31, 2011 and December 31, 2010 are ₩33,313 million and ₩31,229 million, respectively. (2) The changes in allowance for doubtful accounts for the three months ended March 31, 2011 and 2010 are as follows: Three months ended March 31, Description 2011 2010 (In millions of Korean Won) Beginning of the period ₩ 30,355 ₩ 29,993 Impairment loss 3,234 4,324 Effect of foreign exchange differences (499) (652) End of the period ₩ 33,090 ₩ 33,665 4. OTHER RECEIVABLES: Other receivables as of March 31, 2011 and December 31, 2010 consist of the following: March 31, 2011 December 31, 2010 Current Non-current Current Non-current (In millions of Korean Won) Accounts receivables-other ₩ 1,342,689 ₩ 686,565 ₩ 1,276,609 ₩ 774,737Due from customers for contract work 883,114 - 751,016 - Lease and rental deposits 57,738 537,304 82,216 234,521Deposits 5,553 39,072 2,323 39,430Other 7,832 20,348 9,754 21,810Allowance for doubtful accounts (2,752) - (4,018) - Present value discount accounts - (8,842) - (10,347) ₩ 2,294,174 ₩ 1,274,447 ₩ 2,117,900 ₩ 1,060,151 5. OTHER FINANCIAL ASSETS: (1) Other financial assets as of March 31, 2011 and December 31, 2010 consist of the following: March 31, 2011 December 31, 2010 Description Current Non-current Current Non-current (In millions of Korean Won) Financial assets at FVTPL ₩ 260,640 ₩ 48,093 ₩ 10,684 ₩ 198,617 Derivative assets that are effective hedging instruments 478,862
- 109,545
461,773
AFS financial assets 24,805 1,753,893 3,372 1,476,613 Loans and receivables 8,698 8,276 2,145 8,800 ₩ 773,005 ₩ 1,810,262 ₩ 125,746 ₩ 2,145,803 (2) AFS financial assets which are measured at fair value as of March 31, 2011 and December 31, 2010 consist of the following:
March 31,
2011 December 31, 2010
Description
Acquisition cost
Fair value
Difference
Book value Book value
(In millions of Korean Won) Debt instruments ₩ 23,594 ₩ 26,038 ₩ 2,444 ₩ 26,038 ₩ 24,783Equity instruments 508,683 1,752,660 1,243,977 1,752,660 1,455,202 ₩ 532,277 ₩ 1,778,698 ₩ 1,246,421 ₩ 1,778,698 ₩ 1,479,985

- 15 -
(3) Equity securities classified into AFS financial assets as of March 31, 2011 and December 31, 2010, consist of the following:
March 31,
2011 December 31, 2010
Name of company
Ownership percentage
Acquisition cost
Book value
Difference Book value
(%) (In millions of Korean Won) Hyundai Heavy Industries Co., Ltd. 2.88 ₩ 56,924 ₩ 1,134,420 ₩ 1,077,496 ₩ 970,170Hyundai Glovis Co., Ltd. 4.88 210,688 285,626 74,938 150,743Hyundai Oil Refinery Co., Ltd. 4.35 53,734 120,211 66,477 120,211Seoul Metro Line Nine Corporation(*) 25.00 41,779 41,779 - 41,779Hyundai Green Food Co., Ltd. 2.56 15,005 28,154 13,149 25,962Hyundai Merchant Marine Co., Ltd. 0.45 9,161 23,839 14,678 26,715Doosan Capital Co., Ltd. 9.99 10,000 22,866 12,866 22,866Hyundai Development Company 0.60 9,025 14,333 5,308 15,300Hyundai Finance Corporation 9.29 9,888 10,084 196 9,887KT Corporation 0.09 8,655 9,340 685 11,104Ubivelox Co., Ltd. 5.65 1,710 7,111 5,401 5,444Hyundai Venture Investment Corp. 14.97 4,490 4,490 - 4,490Industry Otomotif Komersial 15.00 4,439 4,439 - 4,439Hyundai Asan Corporation 2.85 22,500 4,239 (18,261) 4,239NICE Information Service Co., Ltd. 2.25 3,312 4,016 704 4,221NICE Holdings Co., Ltd. 1.42 3,491 3,023 (468) 3,097Kihyup Finance 10.34 3,000 3,000 - 3,000EUKOR Shipowning Singapore Pte Ltd. 12.00 2,099 2,099 - 2,099NESSCAP Inc. 7.30 1,997 1,997 - 1,997Muan environment Co., Ltd.(*) 29.90 1,848 1,848 - 1,848Hyundai Research Institute 14.90 1,359 1,271 (88) 1,271Heesung PM Tech Corporation 19.90 1,194 1,194 - 1,194Dongbu NTS Co., Ltd. 19.90 1,134 1,134 - 1,134Micro Infinity 9.02 607 607 - 607UI Trans Corporation 4.00 501 501 - 501Clean Air Technology Inc. 16.13 500 500 - 500ENOVA System 0.59 2,204 308 (1,896) 271Green village Co., Ltd. 5.43 4,800 284 (4,516) 284Jinil MVC Co., Ltd. 18.00 180 180 - 180ROTIS Inc. 0.19 1,000 8 (992) 8Equity investment and other 21,459 19,759 (1,700) 19,641 ₩ 508,683 ₩ 1,752,660 ₩ 1,243,977 ₩ 1,455,202 (*) The investment securities are not accounted for using the equity method, as the Group is considered not to have
significant influence over the investee, despite the fact that its’ their ownership percentage exceeding twenty percentages. As of March 31, 2011 the difference between the book value and the acquisition cost of equity securities includes the impairment loss of ₩25,557 million.

- 16 -
6. INVENTORIES: Inventories as of March 31, 2011 and December 31, 2010 consist of the following: March 31, 2011 December 31, 2010 Acquisition
cost Valuation allowance
Book value
Acquisition cost
Valuation allowance
Book value
(In millions of Korean Won)
Finished goods ₩ 2,653,218 ₩ (9,055) ₩ 2,644,163 ₩ 2,821,526 ₩ (11,697) ₩ 2,809,829
Merchandise 174,628 (16,492) 158,136 168,882 (15,322) 153,560Semi-finished goods 292,100 (11) 292,089 282,519 (18) 282,501Work in progress 293,900 (14) 293,886 274,025 (1,158) 272,867Raw materials 1,015,040 (1,607) 1,013,433 1,070,210 (627) 1,069,583Supplies 163,779 - 163,779 155,091 - 155,091Materials in transit 392,829 - 392,829 211,779 - 211,779Other 517,360 (1,975) 515,385 538,359 (2,132) 536,227
₩ 5,502,854 ₩ (29,154) ₩ 5,473,700 ₩ 5,522,391 ₩ (30,954) ₩ 5,491,437 7. OTHER ASSETS: Other assets as of March 31, 2011 and December 31, 2010 consist of the following: March 31, 2011 December 31, 2010 Description Current Non-current Current Non-current (In millions of Korean Won) Accrued income ₩ 308,294 ₩ - ₩ 295,254 ₩ - Advanced payments 381,548 19,217 480,168 - Prepaid expenses 173,875 1,434 170,117 1,497Prepaid VAT and other 250,878 - 243,274 -
₩ 1,114,595 ₩ 20,651 ₩ 1,188,813 ₩ 1,497 8. PROPERTY, PLANT AND EQUIPMENT: (1) Property, plant and equipment as of March 31, 2011 and December 31, 2010 consist of the following: March 31, 2011 December 31, 2010
Description Acquisition cost Accumulated depreciation Book value Acquisition cost
Accumulated depreciation Book value
(In millions of Korean Won) Land ₩ 5,623,113 ₩ - ₩ 5,623,113 ₩ 5,667,851 ₩ - ₩ 5,667,851Buildings 5,887,261 (1,564,608) 4,322,653 5,869,056 (1,533,238) 4,335,818Structures 871,123 (313,142) 557,981 849,730 (302,794) 546,936Machinery and equipment 10,189,720 (5,033,795) 5,155,925 10,020,479 (4,912,738) 5,107,741Vehicles 277,753 (103,270) 174,483 258,988 (98,558) 160,430Dies, molds and tools 4,878,097 (3,531,762) 1,346,335 4,794,467 (3,429,965) 1,364,502Office equipment 1,282,321 (958,267) 324,054 1,271,737 (951,749) 319,988Other 72,113 (48,480) 23,633 69,771 (62,786) 6,985Construction in progress 997,490 - 997,490 1,003,958 - 1,003,958 ₩ 30,078,991 ₩ (11,553,324) ₩ 18,525,667 ₩ 29,806,037 ₩ (11,291,828) ₩ 18,514,209

- 17 -
(2) The changes in property, plant and equipment for the three months ended March 31, 2011 are as follows:
Description Beginning of period
Acquisition
Transfer
Disposal
Depreciation
Other (*)
End of period
(In millions of Korean Won) Land ₩ 5,667,851 ₩ 3,706 ₩ 7,477 ₩ (40,079) ₩ - ₩ (15,842) ₩ 5,623,113Buildings 4,335,818 12,680 28,528 (2,233) (45,370) (6,770) 4,322,653Structures 546,936 935 16,102 (933) (11,260) 6,201 557,981Machinery and equipment 5,107,741 44,141 181,010 (1,613) (162,474) (12,880) 5,155,925Vehicles 160,430 11,069 1,308 (5,729) (8,537) 15,942 174,483Dies, molds and tools 1,364,502 14,960 88,237 (222) (121,119) (23) 1,346,335Office equipment 319,988 12,710 23,886 (272) (31,964) (294) 324,054Other 6,985 4,523 13,963 (482) (1,905) 549 23,633Construction in progress 1,003,958 357,549 (360,511) (858) - (2,648) 997,490 ₩ 18,514,209 ₩ 462,273 ₩ - ₩ (52,421) ₩ (382,629) ₩ (15,765) ₩ 18,525,667
(*) Other includes the effect of foreign exchange differences and transfer to other accounts. The changes in property, plant and equipment for the three months ended March 31, 2010 are as follows:
Description Beginning of period
Acquisition
Transfer
Disposal
Depreciation
Other (*)
End of period
(In millions of Korean Won) Land ₩ 5,667,985 ₩ 5,476 ₩ 40,633 ₩ (13,696) ₩ - ₩ (14,789) ₩ 5,685,609Buildings 4,296,820 6,347 31,370 (9,877) (44,884) (62,862) 4,216,914Structures 486,670 9,288 5,345 (2,402) (8,936) (20,131) 469,834Machinery and equipment 5,066,628 58,192 46,858 (34,725) (177,246) (32,444) 4,927,263Vehicles 152,917 13,206 1,370 (17,211) (6,888) 9,066 152,460Dies, molds and tools 1,405,635 23,819 35,562 (173) (119,577) (32,212) 1,313,054Office equipment 340,013 8,054 22,201 (385) (32,476) (5,849) 331,558Other 52,148 5,142 125 (75) (1,823) (5,099) 50,418Construction in progress 936,582 352,262 (183,464) (15,384) - (60,969) 1,029,027 ₩ 18,405,398 ₩ 481,786 ₩ - ₩ (93,928) ₩ (391,830) ₩ (225,289) ₩ 18,176,137
(*) Other includes the effect of foreign exchange differences and transfer to other accounts. 9. INVESTMENT PROPERTY: (1) Investment property as of March 31, 2011 and December 31, 2010 consists of the following: March 31, 2011 December 31, 2010
Description Acquisition cost
Accumulated depreciation Book value
Acquisition cost
Accumulated depreciation Book value
(In millions of Korean Won) Land ₩ 46,757 ₩ - ₩ 46,757 ₩ 32,159 ₩ - ₩ 32,159Buildings 328,535 (110,533) 218,002 322,169 (101,398) 220,771Structures 18,303 (3,667) 14,636 17,620 (3,434) 14,186
₩ 393,595 ₩ (114,200) ₩ 279,395 ₩ 371,948 ₩ (104,832) ₩ 267,116

- 18 -
(2) The changes in investment property for the three months ended March 31, 2011 are as follows: Description
Beginning of period
Depreciation
Transfer
Effect of exchange differences
End of period
(In millions of Korean Won) Land ₩ 32,159 ₩ - ₩ 14,598 ₩ - ₩ 46,757 Buildings 220,771 (2,710) 1,436 (1,495) 218,002 Structures 14,186 (98) 548 - 14,636 ₩ 267,116 ₩ (2,808) ₩ 16,582 ₩ (1,495) ₩ 279,395 The changes in investment property for the three months ended March 31, 2010 are as follows: Description
Beginning of period
Depreciation
Transfer
Effect of exchange differences
End of period
(In millions of Korean Won) Land ₩ 32,159 ₩ - ₩ - ₩ - ₩ 32,159 Buildings 230,911 (2,768) 30 (2,423) 225,750 Structures 14,572 (96) - - 14,476 ₩ 277,642 ₩ (2,864) ₩ 30 ₩ (2,423) ₩ 272,385 (3) The fair value of investment property as of March 31, 2011 and December 31, 2010 consist of the following:
Description March 31, 2011 December 31, 2010 (In millions of Korean Won) Land ₩ 46,757 ₩ 32,159Buildings 363,866 361,782Structures 15,223 14,656 ₩ 425,846 ₩ 408,597
On January 1, 2010, K-IFRS transition date, the Group assessed the fair value of its’ investment property through an independent third party. As of March 31, 2011, no fair value assessment was performed , as the change of fair value is considered not to be material. (4) Income and expenses related to investment property for the three months ended March 31, 2011 and 2010 are as
follows: Description 2011 2010 (In millions of Korean Won) Rental income ₩ 6,404 ₩ 5,174Operating and maintenance expenses 1,923 1,851

- 19 -
10. INTANGIBLES: (1) Intangibles as of March 31, 2011 and December 31, 2010 consist of the following:
March 31, 2011 December 31, 2010
Description Acquisition cost
Accumulated amortization
Accumulated impairment Book value
Acquisition cost
Accumulated amortization
Accumulated impairment Book value
(In millions of Korean Won) Goodwill ₩ 181,392 ₩ - ₩ (2,500) ₩ 178,892 ₩ 180,077 ₩ - ₩ (2,470) ₩ 177,607Development costs 4,544,032 (2,346,173) (342,331) 1,855,528 4,436,620 (2,230,027) (263,127) 1,943,466
Industrial property rights
87,764
(62,323)
-
25,441
82,182
(61,155)
-
21,027
Software 242,990 (91,776) - 151,214 219,153 (81,620) - 137,533Other 369,648 (85,458) (6,795) 277,395 362,866 (82,376) 273,778Construction in progress 99,559 - - 99,559 98,157 - - 98,157
₩ 5,525,385 ₩(2,585,730) ₩ (351,626) ₩ 2,588,029 ₩5,379,055 ₩ (2,455,178) ₩ (272,309) ₩2,651,568 (2) The changes in intangibles for the three months ended March 31, 2011 are as follows:
Description
Beginning of period
Acquisition
Transfer
Disposal Amortization Impairment
Other changes(*)
End of period
(In millions of Korean Won)
Goodwill ₩ 177,607 ₩ - ₩ - ₩ - ₩ - ₩ - ₩ 1,285 ₩ 178,892Development costs 1,943,466 119,251 7,196 - (138,382) (79,204) 3,201 1,855,528Industrial property rights 21,027 3,997 1,721 - (1,346) - 42 25,441Software 137,533 7,969 664 - (10,576) - 15,624 151,214Other 273,778 9,262 - (37) (3,644) - (1,964) 277,395Construction in progress 98,157 12,224 (9,581) - - - (1,241) 99,559
₩ 2,651,568 ₩ 152,703 ₩ - ₩ (37) ₩ (153,948) ₩ (79,204) ₩ 16,947 ₩ 2,588,029 (*) Other changes include the effect of foreign exchange differences and transfer from/to other accounts. The changes in intangibles for the three months ended March 31, 2010 are as follows:
Description
Beginning of period
Acquisition
Transfer
Disposal Amortization Impairment
Other changes(*)
End of period
(In millions of Korean Won) Goodwill ₩ 181,833 ₩ - ₩ - ₩ - ₩ - ₩ - ₩ (4,202) ₩ 177,631Development costs 1,840,072 187,190 47,708 - (142,613) (101,306) (2,439) 1,828,612Industrial property rights 19,477 9 1,071 (1) (1,231) - (35) 19,290Software 97,976 699 949 (20) (6,176) - 3,030 96,458Other 256,890 3,156 419 - (4,856) (178) (3,777) 251,654Construction in progress 96,051 800 (50,147) - - - (24,717) 21,987
₩ 2,492,299 ₩ 191,854 ₩ - ₩ (21) ₩ (154,876) ₩ (101,484) ₩ (32,140) ₩ 2,395,632 (*) Other changes include the effect of foreign exchange differences and transfer from/to other accounts.
- 20 -
(3) Research and development expenditure for the three months ended March 31, 2011 and 2010 are as follows: Three months ended March 31, Description 2011 2010 (In millions of Korean Won) Development costs ₩ 119,251 ₩ 187,190Ordinary development (manufacturing cost) 22,681 29,717Research costs (administrative expenses) 109,171 55,959
₩ 251,103 ₩ 272,866 (4) Impairment test of goodwill Goodwill allocated amongst the Group’s cash-generating units as of March 31, 2011 and December 31, 2010 is as follows:
Description March 31, 2011
December 31, 2010
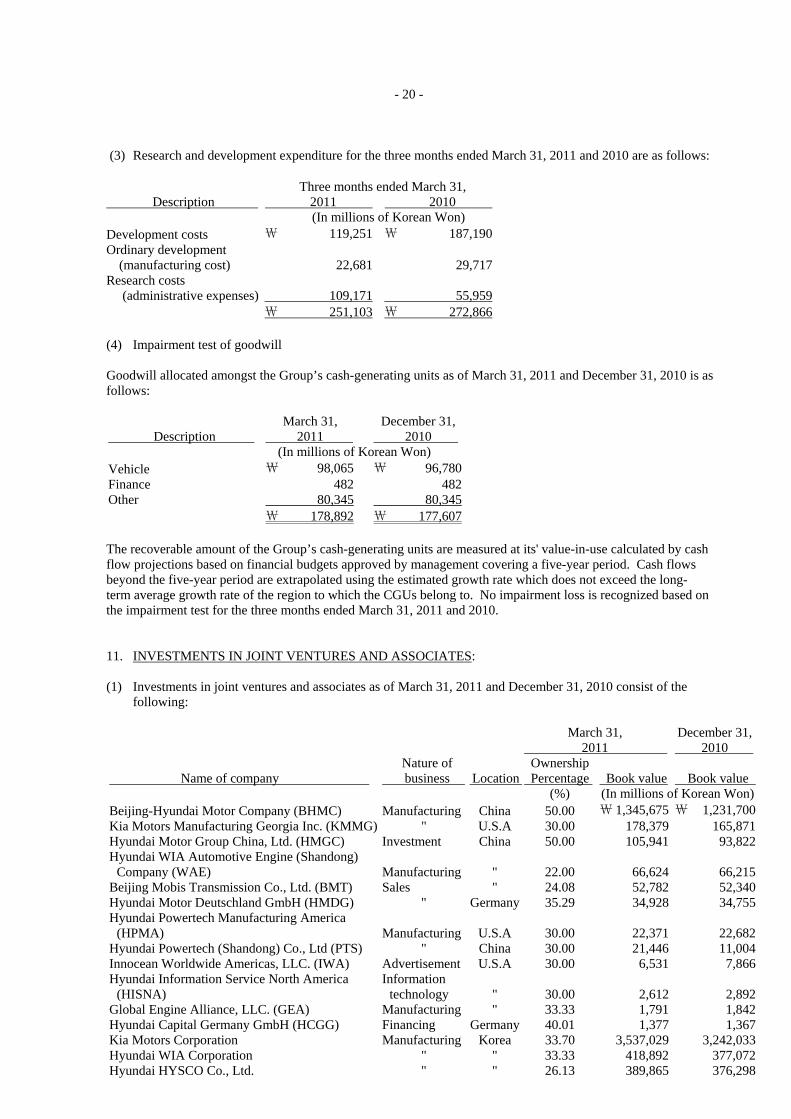
(In millions of Korean Won) Vehicle ₩ 98,065 ₩ 96,780 Finance 482 482 Other 80,345 80,345 ₩ 178,892 ₩ 177,607 The recoverable amount of the Group’s cash-generating units are measured at its' value-in-use calculated by cash flow projections based on financial budgets approved by management covering a five-year period. Cash flows beyond the five-year period are extrapolated using the estimated growth rate which does not exceed the long-term average growth rate of the region to which the CGUs belong to. No impairment loss is recognized based on the impairment test for the three months ended March 31, 2011 and 2010. 11. INVESTMENTS IN JOINT VENTURES AND ASSOCIATES: (1) Investments in joint ventures and associates as of March 31, 2011 and December 31, 2010 consist of the
following: March 31,
2011 December 31, 2010
Name of company
Nature of business
Location
Ownership Percentage
Book value
Book value
(%) (In millions of Korean Won)Beijing-Hyundai Motor Company (BHMC) Manufacturing China 50.00 ₩ 1,345,675 ₩ 1,231,700Kia Motors Manufacturing Georgia Inc. (KMMG) " U.S.A 30.00 178,379 165,871Hyundai Motor Group China, Ltd. (HMGC) Investment China 50.00 105,941 93,822Hyundai WIA Automotive Engine (Shandong) Company (WAE) Manufacturing " 22.00 66,624 66,215Beijing Mobis Transmission Co., Ltd. (BMT) Sales " 24.08 52,782 52,340Hyundai Motor Deutschland GmbH (HMDG) " Germany 35.29 34,928 34,755Hyundai Powertech Manufacturing America (HPMA) Manufacturing U.S.A 30.00 22,371 22,682Hyundai Powertech (Shandong) Co., Ltd (PTS) " China 30.00 21,446 11,004Innocean Worldwide Americas, LLC. (IWA) Advertisement U.S.A 30.00 6,531 7,866Hyundai Information Service North America (HISNA)
Information technology " 30.00 2,612 2,892
Global Engine Alliance, LLC. (GEA) Manufacturing " 33.33 1,791 1,842Hyundai Capital Germany GmbH (HCGG) Financing Germany 40.01 1,377 1,367Kia Motors Corporation Manufacturing Korea 33.70 3,537,029 3,242,033Hyundai WIA Corporation " " 33.33 418,892 377,072Hyundai HYSCO Co., Ltd. " " 26.13 389,865 376,298
- 21 -
March 31, 2011
December 31, 2010
Name of company
Nature of business
Location
Ownership Percentage
Book value
Book value
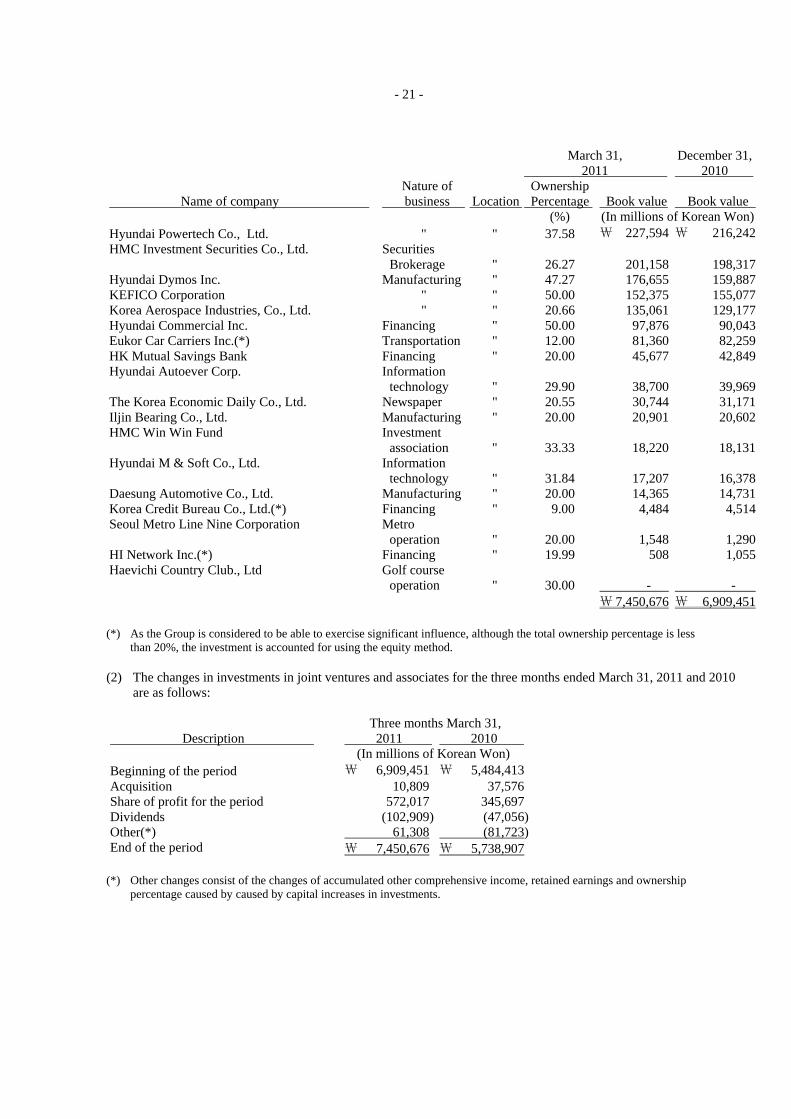
(%) (In millions of Korean Won)Hyundai Powertech Co., Ltd. " " 37.58 ₩ 227,594 ₩ 216,242HMC Investment Securities Co., Ltd. Securities
Brokerage " 26.27 201,158 198,317Hyundai Dymos Inc. Manufacturing " 47.27 176,655 159,887KEFICO Corporation " " 50.00 152,375 155,077Korea Aerospace Industries, Co., Ltd. " " 20.66 135,061 129,177Hyundai Commercial Inc. Financing " 50.00 97,876 90,043Eukor Car Carriers Inc.(*) Transportation " 12.00 81,360 82,259HK Mutual Savings Bank Financing " 20.00 45,677 42,849Hyundai Autoever Corp.
Information technology " 29.90 38,700 39,969
The Korea Economic Daily Co., Ltd. Newspaper " 20.55 30,744 31,171Iljin Bearing Co., Ltd. Manufacturing " 20.00 20,901 20,602HMC Win Win Fund
Investment association " 33.33 18,220 18,131
Hyundai M & Soft Co., Ltd.
Information technology " 31.84 17,207 16,378
Daesung Automotive Co., Ltd. Manufacturing " 20.00 14,365 14,731Korea Credit Bureau Co., Ltd.(*) Financing " 9.00 4,484 4,514Seoul Metro Line Nine Corporation Metro
operation " 20.00 1,548 1,290HI Network Inc.(*) Financing " 19.99 508 1,055Haevichi Country Club., Ltd
Golf course operation " 30.00 - -
₩ 7,450,676 ₩ 6,909,451 (*) As the Group is considered to be able to exercise significant influence, although the total ownership percentage is less
than 20%, the investment is accounted for using the equity method. (2) The changes in investments in joint ventures and associates for the three months ended March 31, 2011 and 2010 are as follows: Three months March 31, Description 2011 2010 (In millions of Korean Won) Beginning of the period ₩ 6,909,451 ₩ 5,484,413 Acquisition 10,809 37,576 Share of profit for the period 572,017 345,697 Dividends (102,909) (47,056)Other(*) 61,308 (81,723)End of the period ₩ 7,450,676 ₩ 5,738,907
(*) Other changes consist of the changes of accumulated other comprehensive income, retained earnings and ownership
percentage caused by caused by capital increases in investments.

- 22 -
(3) Condensed financial information of the joint ventures and associates as of and for the three months ended March 31, 2011 is as follows:
Name of company Assets
Liabilities
Sales
Net income (loss)
(In millions of Korean Won) BHMC ₩ 5,326,449 ₩ 2,621,668 ₩ 2,933,363 ₩ 277,217KMMG 2,019,488 1,399,976 1,305,341 85,267HMGC 471,422 231,775 542,125 34,960WAE 763,986 461,153 219,240 8,240BMT 304,452 85,258 85,901 6,449HMDG 379,116 280,154 376,833 1,383HPMA 312,884 236,387 182,342 1,081PTS 91,928 20,443 - - IWA 193,603 178,546 43,130 3,269HISNA 18,761 10,993 20,074 433GEA 20,119 13,561 7,333 54HCGG 3,287 108 130 12Kia Motors Corporation 28,312,737 17,133,835 10,657,827 953,221Hyundai WIA Corporation 3,844,659 2,547,951 1,496,872 54,681Hyundai HYSCO Co., Ltd. 4,160,862 2,756,066 1,856,461 73,332Hyundai Powertech Co., Ltd. 1,875,668 1,233,425 683,689 30,542HMC Investment Securities Co., Ltd. 2,821,822 2,208,480 102,406 15,903Hyundai Dymos Inc. 1,069,499 692,700 449,304 14,003KEFICO Corporation 699,637 392,764 281,012 13,809Korea Aerospace Industries, Co., Ltd. 1,752,278 1,114,260 323,884 33,438Hyundai Commercial Inc. 3,021,666 2,826,956 80,258 18,121Eukor Car Carriers Inc. 2,484,073 1,806,075 541,791 51,230HK Mutual Savings Bank 2,487,736 2,320,593 88,477 13,626Hyundai Autoever Corp. 301,844 172,251 138,422 5,831The Korea Economic Daily Co., Ltd. 191,413 56,673 26,947 (2,079)Iljin Bearing Co., Ltd. 142,059 37,560 52,756 2,618HMC Win Win Fund 54,660 - 424 266Hyundai M & Soft Co., Ltd. 73,773 19,968 18,188 3,051Daesung Automotive Co., Ltd. 89,547 17,724 14,458 1,157Korea Credit Bureau Co., Ltd. 42,029 7,066 6,876 (423)Seoul Metro Line Nine Corporation 18,422 10,735 13,645 1,285HI Network Inc. 8,641 2,567 5,075 798Haevichi Country Club., Ltd 215,697 262,078 952 (3,560)
(4) The market price of listed equity securities as of March 31, 2011 is as follows: Name of company Price per share Number of shares Market value (In millions of Korean Won, except price per share) Kia Motors Corporation ₩ 69,000 134,285,491 ₩ 9,265,699 Hyundai WIA Corporation 77,300 8,575,239 662,866 Hyundai HYSCO Co., Ltd. 31,850 20,954,188 667,391HMC Investment Securities Co., Ltd. 20,550 7,705,980 158,358 (5) The losses for the three months ended March 31, 2011 and cumulative losses as of March 31, 2011, which are
not recognized due to the discontinuation of the equity method, are ₩1,068 million and ₩9,287 million, respectively, related to Haevichi Country Club., Ltd.
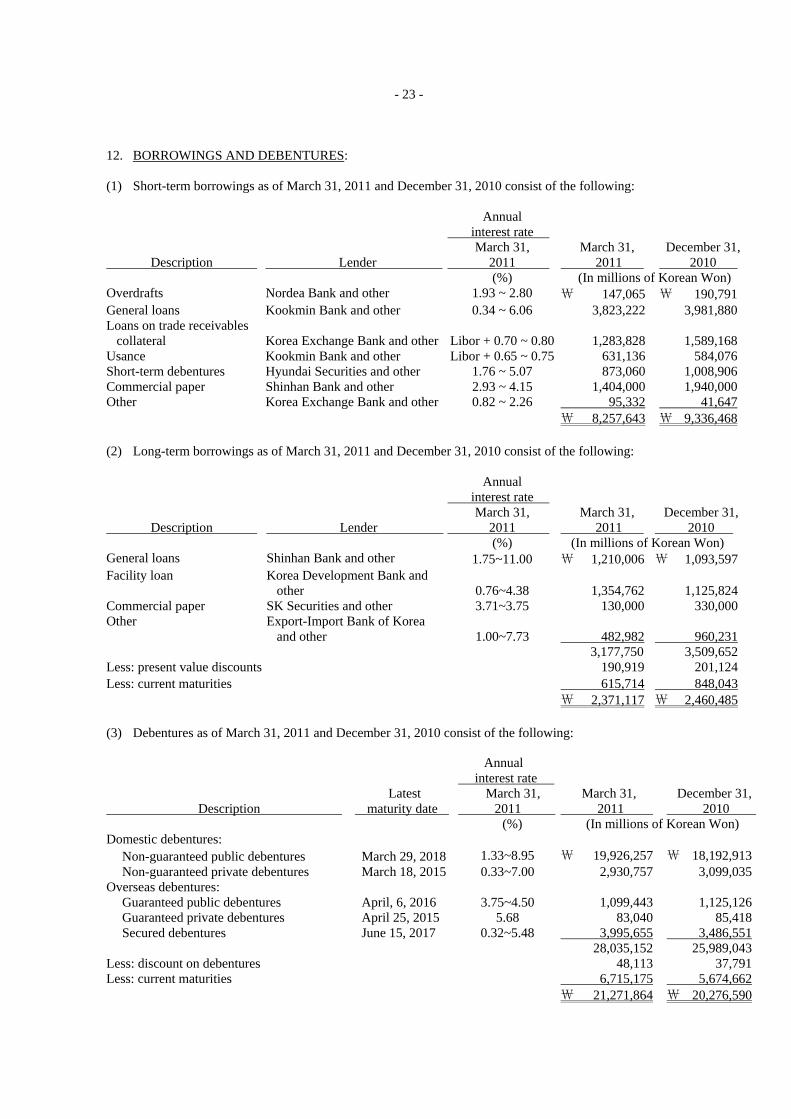
- 23 -
12. BORROWINGS AND DEBENTURES: (1) Short-term borrowings as of March 31, 2011 and December 31, 2010 consist of the following:
Annual
interest rate
Description Lender March 31, 2011
March 31, 2011
December 31, 2010
(%) (In millions of Korean Won) Overdrafts Nordea Bank and other 1.93 ~ 2.80 ₩ 147,065 ₩ 190,791 General loans Kookmin Bank and other 0.34 ~ 6.06 3,823,222 3,981,880 Loans on trade receivables collateral Korea Exchange Bank and other
Libor + 0.70 ~ 0.80 1,283,828 1,589,168
Usance Kookmin Bank and other Libor + 0.65 ~ 0.75 631,136 584,076 Short-term debentures Hyundai Securities and other 1.76 ~ 5.07 873,060 1,008,906 Commercial paper Shinhan Bank and other 2.93 ~ 4.15 1,404,000 1,940,000Other Korea Exchange Bank and other 0.82 ~ 2.26 95,332 41,647 ₩ 8,257,643 ₩ 9,336,468 (2) Long-term borrowings as of March 31, 2011 and December 31, 2010 consist of the following:
Annual
interest rate
Description
Lender
March 31, 2011
March 31, 2011
December 31, 2010
(%) (In millions of Korean Won) General loans Shinhan Bank and other 1.75~11.00 ₩ 1,210,006 ₩ 1,093,597Facility loan Korea Development Bank and
other
0.76~4.38 1,354,762 1,125,824Commercial paper SK Securities and other 3.71~3.75 130,000 330,000Other Export-Import Bank of Korea
and other 1.00~7.73 482,982 960,231 3,177,750 3,509,652Less: present value discounts 190,919 201,124Less: current maturities 615,714 848,043 ₩ 2,371,117 ₩ 2,460,485 (3) Debentures as of March 31, 2011 and December 31, 2010 consist of the following:
Annual interest rate
Description
Latest maturity date
March 31, 2011
March 31, 2011
December 31, 2010
(%) (In millions of Korean Won) Domestic debentures: Non-guaranteed public debentures March 29, 2018 1.33~8.95 ₩ 19,926,257 ₩ 18,192,913 Non-guaranteed private debentures March 18, 2015 0.33~7.00 2,930,757 3,099,035Overseas debentures: Guaranteed public debentures April, 6, 2016 3.75~4.50 1,099,443 1,125,126 Guaranteed private debentures April 25, 2015 5.68 83,040 85,418 Secured debentures June 15, 2017 0.32~5.48 3,995,655 3,486,551 28,035,152 25,989,043Less: discount on debentures 48,113 37,791Less: current maturities 6,715,175 5,674,662
₩ 21,271,864 ₩ 20,276,590

- 24 -
13. PROVISIONS: (1) The provisions as of March 31, 2011 and December 31, 2010 consist of the followings:
Description March 31, 2011
December 31, 2010
(In millions of Korean Won)Warranty ₩ 5,354,110 ₩ 5,252,340 Employee benefit 429,694 431,518 Other 320,917 301,720 ₩ 6,104,721 ₩ 5,985,578 (2) The changes of provisions for the three months ended March 31, 2011 are as follows: Description Warranty Employee benefit Other (In millions of Korean Won) Beginning of the period ₩ 5,252,340 ₩ 431,518 ₩ 301,720Accrual 294,664 12,975 11,273Use (128,816) (14,651) (9,137)Changes in the discount rate 35,796 - - Changes in expected reimbursements by third parties (86,918) - - Effect of foreign exchange differences (12,956) (148) (100)Other - - 17,161End of the period ₩ 5,354,110 ₩ 429,694 ₩ 320,917
14. OTHER FINANCIAL LIABILITIES: Other financial liabilities as of March 31, 2011 and December 31, 2010 consist of the following:
March 31, 2011
December 31, 2010
Description Current Non-current Current Non-current (In millions of Korean Won) Financial liabilities at FVTPL ₩ 54,086 ₩ 424,043 ₩ 46,196 ₩ 432,306Derivative liabilities that are effective hedging instruments 172,582 -
71,519
85,799
Other - 104,519 - 104,519 ₩ 226,668 ₩ 528,562 ₩ 117,715 ₩ 622,624 15. OTHER LIABILITIES: Other liabilities as of March 31, 2011 and December 31, 2010 consist of the following: March 31, 2011 December 31, 2010 Description Current Non-current Current Non-current (In millions of Korean Won) Advance received ₩ 393,070 ₩ 33,152 ₩ 426,934 ₩ 29,846Withholdings 929,497 603,930 969,355 562,181Accrued expenses 1,430,822 - 1,007,750 - Unearned income 329,551 315,060 321,863 330,881Accrued dividends 412,332 - 69 - Other 455,400 302,157 340,037 249,759 ₩ 3,950,672 ₩ 1,254,299 ₩ 3,066,008 ₩ 1,172,667

- 25 -
16. FINANCIAL SERVICES ASSETS AND LIABILLITIES: (1) Financial services assets as of March 31, 2011 and December 31, 2010 consist of the following:
Description March 31, 2011
December 31, 2010
(In millions of Korean Won) I. Financial services receivables: Loans ₩ 23,943,816 ₩ 23,155,855 Card receivables 8,965,436 9,028,064 Financial lease receivables 1,899,037 1,771,393 Other lease receivables 59,318 31,932 34,867,607 33,987,244 Allowance of doubtful accounts (659,659) (615,599) Loan origination fee (385,171) (398,300) Present value discount accounts (8,144) (8,346)
33,814,633 32,964,999II. Lease assets: Operating lease assets 3,389,994 2,998,691 Accumulated depreciation (351,119) (378,654) Accumulated impairment loss (27,550) (17,969) 3,011,325 2,602,068
Total ₩ 36,825,958 ₩ 35,567,067 The balances of financial services receivables that are past due, but not impaired as of March 31, 2011 and December 31, 2010 are ₩1,127,814 million and ₩1,059,980 million, respectively, and the balances that are past due under 90 days are ₩1,105,164 million and ₩1,059,977 million, respectively. The impaired amounts as of March 31, 2011 and December 31, 2010 are ₩239,270 million and ₩479,660 million, respectively. (2) The changes in allowance for doubtful accounts of financial services receivables for the three months ended
March 31, 2011 and 2010 are as follows: Three months ended March 31, Description 2011 2010 (In millions of Korean Won) Beginning of the period ₩ 615,599 ₩ 431,817 Impairment loss 157,579 81,038 Write-off (74,859) (74,854) Effect of foreign exchange differences (5,190) (3,789) Transfer and other (33,470) (5,555) End of the period ₩ 659,659 ₩ 428,657 (3) Financial services liabilities as of March 31, 2011 and December 31, 2010 mainly consist of business operating
accounts payables.

- 26 -
17. CATEGORIES OF FINANCIAL INSTRUMENTS: (1) Categories of financial assets as of March 31, 2011, consist of the following:
Description Financial assets at FVTPL
Loans and receivables
AFS financial assets
Derivatives designated as hedging instruments Book value Fair value
(In millions of Korean Won) Cash and cash equivalents ₩ - ₩ 8,356,560 ₩ - ₩ - ₩ 8,356,560 ₩ 8,356,560Short-term and long- term financial instruments - 7,286,626 - -
7,286,626 7,286,626
Trade notes and accounts receivable - 3,172,360 - -
3,172,360
3,172,360
Other receivables - 3,568,621 - - 3,568,621 3,568,621Other financial assets 308,733 16,974 1,778,698 478,862 2,583,267 2,583,267Other assets - 308,294 - - 308,294 308,294Financial services receivables - 33,814,633 - - 33,814,633 33,814,633
₩ 308,733 ₩ 56,524,068 ₩ 1,778,698 ₩ 478,862 ₩ 59,090,361 ₩59,090,361 (2) Categories of financial liabilities as of March 31, 2011, consist of the following:
Description Financial liabilities at FVTPL
Financial liabilities carried at
amortized cost
Derivatives designated as
hedging instruments Book value Fair value (In millions of Korean Won) Trade notes and accounts payable ₩ - ₩ 6,642,854 ₩ - ₩ 6,642,854 ₩ 6,642,854Other payables - 2,690,327 - 2,690,327 2,690,327Borrowings and Debentures - 39,231,513 -
39,231,513
39,571,735
Other financial liabilities 478,129 104,519 172,582 755,230 755,230Other liabilities - 1,430,822 - 1,430,822 1,430,822Financial services Liabilities - 272,886 - 272,886 272,886
₩ 478,129 ₩ 50,372,921 ₩ 172,582 ₩ 51,023,632 ₩ 51,363,854
(3) Fair value estimation Financial instruments that are measured subsequent to initial recognition at fair value are grouped into Level 1 to Level 3, based on the degree to which the fair value is observable, as described below: Level 1 : Fair value measurements are those derived from quoted prices (unadjusted) in active markets for
identical assets or liabilities.
Level 2 : Fair value measurements are those derived from inputs other than quoted prices included within Level 1 that are observable for the asset or liability, either directly (i.e. as prices) or indirectly (i.e. derived from prices).
Level 3 : Fair value measurements are those derived from valuation techniques that include inputs for the asset or liability that are not based on observable market data (unobservable inputs).

- 27 -
Fair value measurements of financial instruments by fair-value hierarchy levels as of March 31, 2011 are as follows: March 31, 2011 Description Level 1 Level 2 Level 3 Total (In millions of Korean Won) Financial Assets: Financial assets at FVTPL ₩ 187,425 ₩ 121,308 ₩ - ₩ 308,733 Derivatives designated as hedging instruments - 478,862 - 478,862 AFS financial assets 1,510,170 158,948 109,580 1,778,698
₩ 1,697,595 ₩ 759,118 ₩ 109,580 ₩ 2,566,293 Financial Liabilities: Financial liabilities at FVTPL 412,225 65,904 - 478,129 Derivatives designated as hedging instruments - 172,582 - 172,582 ₩ 412,225 ₩ 238,486 ₩ - ₩ 650,711 The changes in financial instruments classified as level 3 for the three months ended March 31, 2011 are as follows: Description
Beginning of period
Purchases
Sales Valuation Transfer
End of period
(In millions of Korean Won) AFS financial assets ₩ 109,401 ₩ 1,104 ₩ (309) ₩ (616) ₩ - ₩ 109,580 18. CAPITAL STOCK: Common stock as of March 31, 2011 and December 31, 2010 consists of the following:
Description March 31, 2011
December 31, 2010
(In millions of Korean Won, except par value) Authorized 600,000,000 shares 600,000,000 sharesIssued 220,276,479 shares 220,276,479 sharesPar value ₩ 5,000 ₩ 5,000Capital stock ₩ 1,157,982 ₩ 1,157,982 The Company completed stock retirement of 10,000,000 common shares and 1,320,000 common shares on March 5, 2001 and on May 4, 2004, respectively. Due to these stock retirements, the total face value of outstanding stock differs from the capital stock amount. Preferred stock as of March 31, 2011 and December 31, 2010 consists of the following: Par value Issued Korean Won Dividend rate (In millions of
Korean Won)
1 preferred stock
₩ 5,000 25,109,982 shares
₩ 125,550
Dividend rate of common stock + 1%
2 preferred stock 5,000 37,613,865 shares 193,069 Dividend rate of common stock + 2%3 preferred stock 5,000 2,478,299 shares 12,392 Dividend rate of common stock + 1%
Total 65,202,146 shares ₩ 331,011 On March 5, 2001, the Company retired 1,000,000 second preferred shares. Due to the stock retirement, the total face value of outstanding stock differs from the capital stock amount.
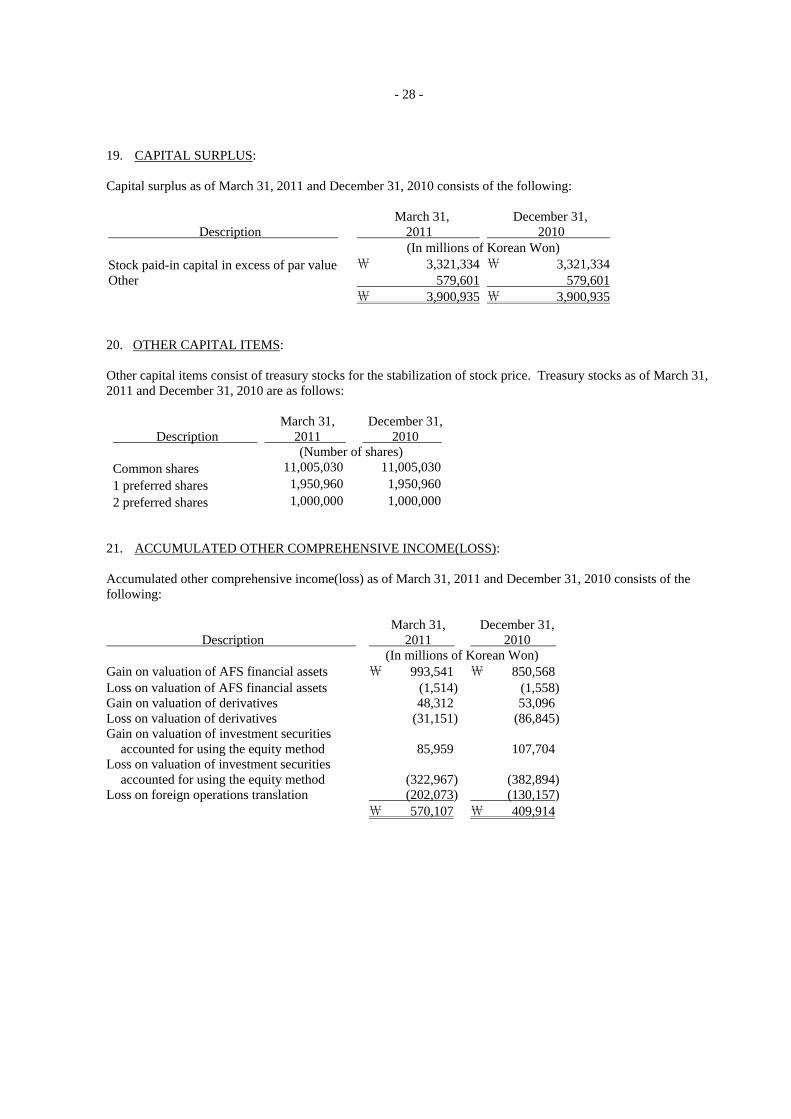
- 28 -
19. CAPITAL SURPLUS: Capital surplus as of March 31, 2011 and December 31, 2010 consists of the following:
Description March 31, 2011
December 31, 2010
(In millions of Korean Won) Stock paid-in capital in excess of par value ₩ 3,321,334 ₩ 3,321,334 Other 579,601 579,601 ₩ 3,900,935 ₩ 3,900,935 20. OTHER CAPITAL ITEMS: Other capital items consist of treasury stocks for the stabilization of stock price. Treasury stocks as of March 31, 2011 and December 31, 2010 are as follows:
Description March 31, 2011
December 31, 2010
(Number of shares) Common shares 11,005,030 11,005,0301 preferred shares 1,950,960 1,950,960
2 preferred shares 1,000,000 1,000,000 21. ACCUMULATED OTHER COMPREHENSIVE INCOME(LOSS): Accumulated other comprehensive income(loss) as of March 31, 2011 and December 31, 2010 consists of the following:
Description March 31, 2011
December 31, 2010
(In millions of Korean Won) Gain on valuation of AFS financial assets ₩ 993,541 ₩ 850,568 Loss on valuation of AFS financial assets (1,514) (1,558) Gain on valuation of derivatives 48,312 53,096 Loss on valuation of derivatives (31,151) (86,845) Gain on valuation of investment securities accounted for using the equity method 85,959 107,704 Loss on valuation of investment securities accounted for using the equity method (322,967) (382,894) Loss on foreign operations translation (202,073) (130,157) ₩ 570,107 ₩ 409,914

- 29 -
22. RETAINED EARNINGS: Retained earnings as of March 31, 2011 and December 31, 2010 consist of the following:
Description March 31, 2011
December 31, 2010
(In millions of Korean Won) Legal reserve ₩ 375,113 ₩ 333,890Discretionary reserve 19,046,647 14,336,647Unappropriated 7,144,117 10,545,626 ₩ 26,565,877 ₩ 25,216,163 23. SALES: Sales for the three months ended March 31, 2011 and 2010 consist of the following: Three months ended March 31, Description 2011 2010 (In millions of Korean Won) Sales of goods ₩ 16,078,183 ₩ 13,080,202Rendering of services 225,464 201,280Royalties 34,006 35,861Other 61,717 63,511Financial services revenue 1,833,991 1,640,575 ₩ 18,233,361 ₩ 15,021,429 24. SELLING AND ADMINISTRATIVE EXPENSES: Selling and administrative expenses for the three months ended March 31, 2011 and 2010 consist of the following: Three months ended March 31, Description 2011 2010 (In millions of Korean Won) Selling expenses :
Export expenses ₩ 117,615 ₩ 174,846Overseas market expenses 122,822 177,506Advertisements 329,611 288,501Sales commissions 184,892 177,867Warranty expenses 54,393 62,993Campaign and recall expenses 11,498 9,647Transportation expenses 41,710 54,671Sales promotion 238,953 164,371Provision for warranties 294,664 185,865
1,396,158 1,296,267Administrative expenses :
Salaries 413,694 369,974Post-employment benefits 29,780 24,728Welfare expenses 65,586 62,217Service charges 192,655 147,838Research 109,171 55,959Other 227,303 208,222
1,038,189 868,938
₩ 2,434,347 ₩ 2,165,205
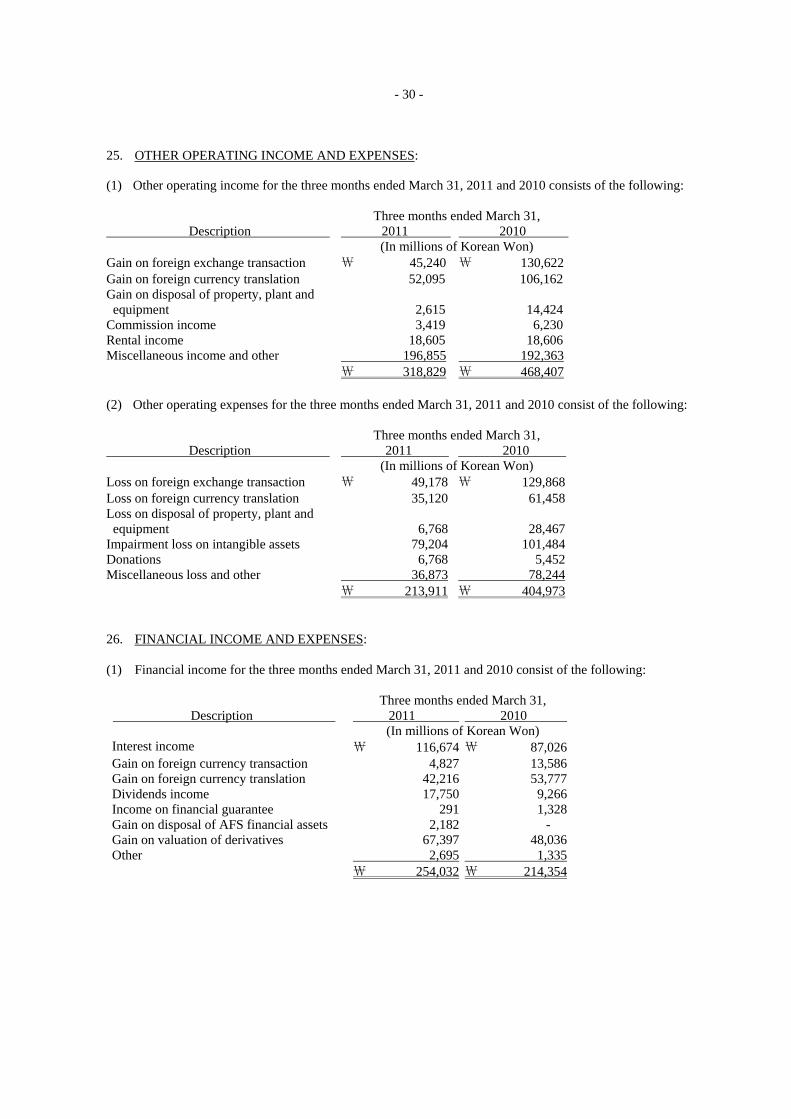
- 30 -
25. OTHER OPERATING INCOME AND EXPENSES: (1) Other operating income for the three months ended March 31, 2011 and 2010 consists of the following: Three months ended March 31, Description 2011 2010 (In millions of Korean Won) Gain on foreign exchange transaction ₩ 45,240 ₩ 130,622 Gain on foreign currency translation 52,095 106,162 Gain on disposal of property, plant and equipment 2,615
14,424
Commission income 3,419 6,230 Rental income 18,605 18,606 Miscellaneous income and other 196,855 192,363 ₩ 318,829 ₩ 468,407 (2) Other operating expenses for the three months ended March 31, 2011 and 2010 consist of the following: Three months ended March 31, Description 2011 2010 (In millions of Korean Won) Loss on foreign exchange transaction ₩ 49,178 ₩ 129,868 Loss on foreign currency translation 35,120 61,458 Loss on disposal of property, plant and equipment 6,768
28,467
Impairment loss on intangible assets 79,204 101,484 Donations 6,768 5,452 Miscellaneous loss and other 36,873 78,244 ₩ 213,911 ₩ 404,973 26. FINANCIAL INCOME AND EXPENSES: (1) Financial income for the three months ended March 31, 2011 and 2010 consist of the following: Three months ended March 31, Description 2011 2010 (In millions of Korean Won) Interest income ₩ 116,674 ₩ 87,026 Gain on foreign currency transaction 4,827 13,586 Gain on foreign currency translation 42,216 53,777 Dividends income 17,750 9,266 Income on financial guarantee 291 1,328 Gain on disposal of AFS financial assets 2,182 - Gain on valuation of derivatives 67,397 48,036 Other 2,695 1,335 ₩ 254,032 ₩ 214,354
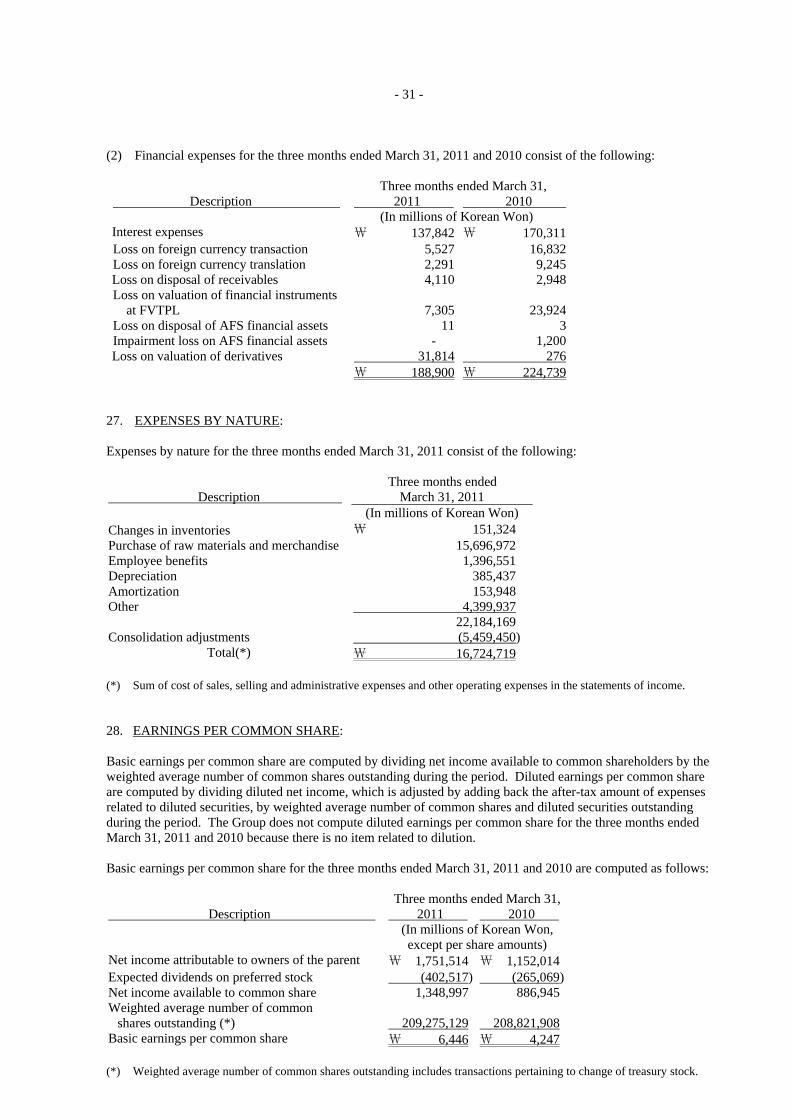
- 31 -
(2) Financial expenses for the three months ended March 31, 2011 and 2010 consist of the following: Three months ended March 31, Description 2011 2010 (In millions of Korean Won) Interest expenses ₩ 137,842 ₩ 170,311 Loss on foreign currency transaction 5,527 16,832 Loss on foreign currency translation 2,291 9,245 Loss on disposal of receivables 4,110 2,948 Loss on valuation of financial instruments at FVTPL 7,305 23,924 Loss on disposal of AFS financial assets 11 3 Impairment loss on AFS financial assets - 1,200 Loss on valuation of derivatives 31,814 276 ₩ 188,900 ₩ 224,739
27. EXPENSES BY NATURE: Expenses by nature for the three months ended March 31, 2011 consist of the following: Description
Three months ended March 31, 2011
(In millions of Korean Won) Changes in inventories ₩ 151,324 Purchase of raw materials and merchandise 15,696,972 Employee benefits 1,396,551 Depreciation 385,437 Amortization 153,948 Other 4,399,937 22,184,169 Consolidation adjustments (5,459,450)
Total(*) ₩ 16,724,719 (*) Sum of cost of sales, selling and administrative expenses and other operating expenses in the statements of income. 28. EARNINGS PER COMMON SHARE: Basic earnings per common share are computed by dividing net income available to common shareholders by the weighted average number of common shares outstanding during the period. Diluted earnings per common share are computed by dividing diluted net income, which is adjusted by adding back the after-tax amount of expenses related to diluted securities, by weighted average number of common shares and diluted securities outstanding during the period. The Group does not compute diluted earnings per common share for the three months ended March 31, 2011 and 2010 because there is no item related to dilution. Basic earnings per common share for the three months ended March 31, 2011 and 2010 are computed as follows: Three months ended March 31, Description 2011 2010 (In millions of Korean Won,
except per share amounts) Net income attributable to owners of the parent ₩ 1,751,514 ₩ 1,152,014 Expected dividends on preferred stock (402,517) (265,069) Net income available to common share 1,348,997 886,945 Weighted average number of common shares outstanding (*) 209,275,129 208,821,908 Basic earnings per common share ₩ 6,446 ₩ 4,247 (*) Weighted average number of common shares outstanding includes transactions pertaining to change of treasury stock.

- 32 -
29. INCOME TAX EXPENSE: Income tax expense for the three months ended March 31, 2011 and 2010 consists of the following: Three months ended March 31, Description 2011 2010 (In millions of Korean Won) Income tax currently payable ₩ 461,055 ₩ 328,286 Adjustments recognized in the current year in relation to the prior years (6,608) (33,795) Changes in deferred taxes due to: Temporary differences 361,826 97,216 Tax credits and deficits (165,953) (1,301) Items directly charged to equity (67,103) (44,433) Current tax directly charged to equity - (28,524) Effect of foreign exchange differences 4,632 (7,916) Income tax expense ₩ 587,849 ₩ 309,533
30. RETIREMENT BENEFIT PLAN: (1) Expenses recognized in relation to defined contribution plans for the three months ended March 31, 2011 and 2010 are as follows: Three months ended March 31, Description 2011 2010 (In millions of Korean Won) Paid in cash ₩ 1,561 ₩ 686 Recognized liability 516 3,469 ₩ 2,077 ₩ 4,155 (2) Actuarial assumptions used as of March 31, 2011 and December 31, 2010 are as follows: Description March 31, 2011 December 31, 2010 Discount rate 4.90~5.90% 4.90~5.90% Expected return on plan assets 4.20~8.25% 4.20~8.25% Expected rate of salary increase 1.50~5.50% 1.50~5.50% (3) Income and loss in relation to defined benefit plans for the three months ended March 31, 2011 and 2010 are as follows: Three months ended March 31, Description 2011 2010 (In millions of Korean Won) Current service cost ₩ 80,745 ₩ 69,026 Interest cost 23,899 25,541 Expected return on plan assets (14,921) (18,054) ₩ 89,723 ₩ 76,513 Cost of sales (Manufacturing cost) 48,918 44,917 Selling and administrative expenses 28,863 21,734 Other 11,942 9,862 ₩ 89,723 ₩ 76,513
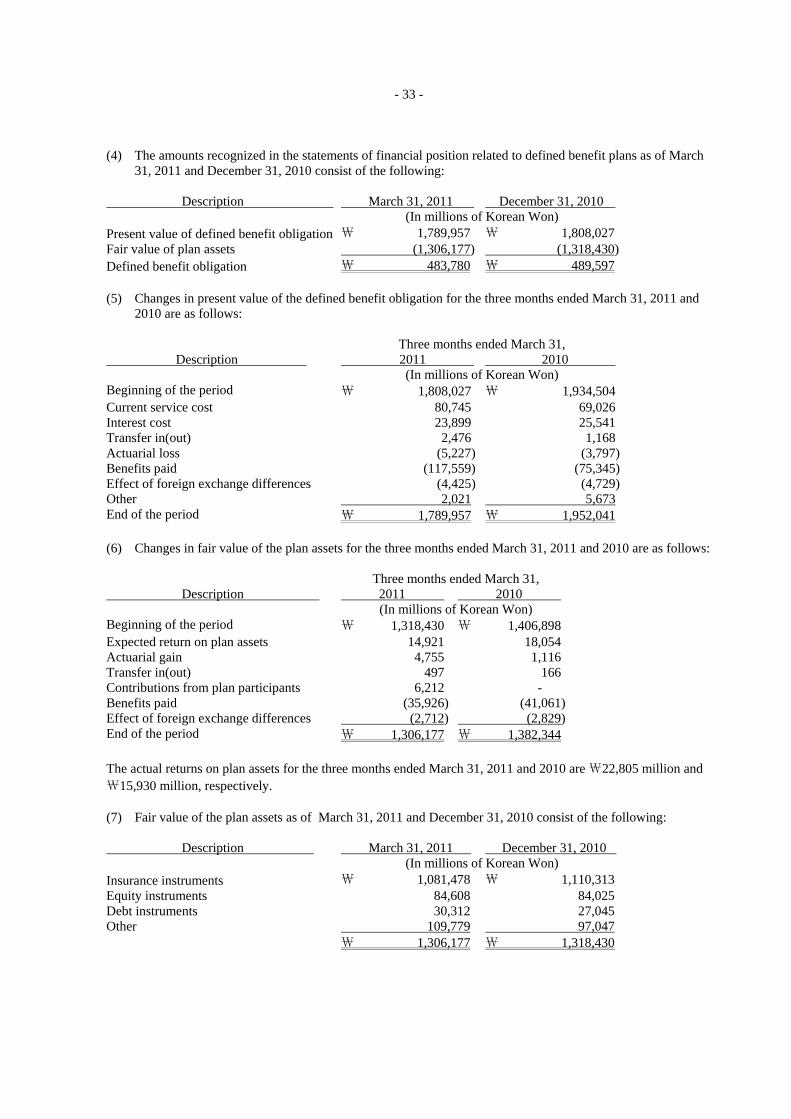
- 33 -
(4) The amounts recognized in the statements of financial position related to defined benefit plans as of March 31, 2011 and December 31, 2010 consist of the following: Description March 31, 2011 December 31, 2010 (In millions of Korean Won) Present value of defined benefit obligation ₩ 1,789,957 ₩ 1,808,027 Fair value of plan assets (1,306,177) (1,318,430) Defined benefit obligation ₩ 483,780 ₩ 489,597 (5) Changes in present value of the defined benefit obligation for the three months ended March 31, 2011 and 2010 are as follows: Three months ended March 31, Description 2011 2010 (In millions of Korean Won) Beginning of the period ₩ 1,808,027 ₩ 1,934,504 Current service cost 80,745 69,026 Interest cost 23,899 25,541 Transfer in(out) 2,476 1,168 Actuarial loss (5,227) (3,797) Benefits paid (117,559) (75,345) Effect of foreign exchange differences (4,425) (4,729) Other 2,021 5,673 End of the period ₩ 1,789,957 ₩ 1,952,041 (6) Changes in fair value of the plan assets for the three months ended March 31, 2011 and 2010 are as follows: Three months ended March 31, Description 2011 2010 (In millions of Korean Won) Beginning of the period ₩ 1,318,430 ₩ 1,406,898 Expected return on plan assets 14,921 18,054 Actuarial gain 4,755 1,116 Transfer in(out) 497 166 Contributions from plan participants 6,212 - Benefits paid (35,926) (41,061) Effect of foreign exchange differences (2,712) (2,829) End of the period ₩ 1,306,177 ₩ 1,382,344 The actual returns on plan assets for the three months ended March 31, 2011 and 2010 are ₩22,805 million and ₩15,930 million, respectively. (7) Fair value of the plan assets as of March 31, 2011 and December 31, 2010 consist of the following: Description March 31, 2011 December 31, 2010 (In millions of Korean Won) Insurance instruments ₩ 1,081,478 ₩ 1,110,313 Equity instruments 84,608 84,025 Debt instruments 30,312 27,045 Other 109,779 97,047 ₩ 1,306,177 ₩ 1,318,430

- 34 -
31. CASH GENERATED FROM OPERATIONS: Cash generated from operations for the three months ended March 31, 2011 and 2010 is as follows: Three months ended March 31, Description 2011 2010 (In millions of Korean Won) Profit for the period ₩ 1,876,771 ₩ 1,281,282 Addition of items not involving cash outflows:
Payroll 12,975 12,280Retirement benefits 89,723 76,513Depreciation 385,437 394,694Income tax expense 587,849 309,533Interest expense 137,842 170,311Provision for warranties 294,664 185,865Amortization of intangible assets 153,948 154,876Loss on foreign currency translation 37,411 70,703Impairment loss on AFS financial assets - 1,200Loss on disposal of property, plant and equipment 6,768 28,467Loss on valuation of derivatives 31,814 276Loss on valuation of equity method investee 1,410 30,172Loss on valuation of financial instruments at FVTPL 7,305 23,924Impairment loss on intangible assets 79,204 101,484Cost of sales from financial services 542,569 362,871Other 39,707 38,088 2,408,626 1,961,257
Deduction of items not involving cash inflows: Interest income 116,674 87,026Dividend income 17,750 9,266Gain on foreign currency translation 94,311 159,939Gain on disposal of property, plant and equipment 2,615 14,424Gain on valuation of derivatives 67,397 50,537Gain on valuation of equity method investee 573,427 375,869Revenue from financial services 493,919 65,447Other 53,612 107,182 (1,419,705) (869,690)
Changes in operating assets and liabilities Decrease(increase) in trade notes and accounts receivable
163,525 (743,279)
Decrease(increase) in other receivables (87,886) 86,667Decrease in other financial assets 41,371 251,956Decrease(increase) in inventories (16,861) 64,856Decrease(increase) in other assets 92,537 (50,145)Increase in trade notes and accounts payable 269,890 280,146Decrease in other payables (808,308) (368,953)Increase in other liabilities 692,941 102,463Decrease in other financial liabilities (33,661) (27,279)Changes in retirement benefit obligation (13,907) (138)Payment of severance benefits (81,633) (34,284)Decrease in provisions (152,434) (146,480)Changes in financial services assets and liabilities (1,606,429) (114,730)Other (28,085) (42,229) (1,568,940) (741,429)
Cash generated from operations ₩ 1,296,752 ₩ 1,631,420
- 35 -
32. RISK MANAGEMENT: (1) Capital risk management The Group manages its capital to maintain an optimal capital structure for maximizing its’ shareholder’s profit and reducing the cost of capital. Debt to equity ratio calculated as total liabilities divided by equity is used as an index to manage the Group’s capital. The overall capital risk management policy is consistent with that of the prior period. Debt to equity ratios as of March 31, 2011 and December 31, 2010 are as follows: Description
March 31, 2011
December 31, 2010
(In millions of Korean Won) Total liabilities ₩ 63,301,932 ₩ 61,826,158 Total equity 34,506,120 32,887,973 Debt to equity ratio 183.5% 188.0% (2) Financial risk management
The Group is exposed to various financial risks such as market risk(foreign exchange risk, interest rate risk and price risk), credit risk and liquidity risk related to financial instruments. The purpose of risk management of the Group is to identify potential risks related to financial performance and reduce, eliminate and evade those risks to a degree acceptable to the Group. Overall, the Group’s financial risk management policy is consistent as the prior period. 1) Market risk
The Group is mainly exposed to the financial risks arising from the changes of the foreign exchange rates and the interest rates. Accordingly, the Group uses financial derivative contracts for risk hedge and to manage its interest rate risk and foreign currency risk. a) Foreign exchange risk management The Group is exposed to various foreign currencies risk since it makes transactions in foreign currencies. The Group is mainly exposed to the risk on USD, EUR and JPY. The Group manages foreign exchange risk by matching the inflow and the outflow of foreign currencies according to each currency and maturity, and by adjusting the foreign currency settlement day according to the exchange rate forecast. The Group uses foreign currency derivatives, such as currency forward, currency swap, and currency option, as hedging instruments, but speculative foreign exchange trade on derivative financial instruments is basically prohibited. The effect of 5% change of the exchange rate of the functional currency against each foreign currency on income before income tax as of March 31, 2011, is as follows: Description Increase by 5% Decrease by 5% (In millions of Korean Won)
USD ₩ (51,665) ₩ 51,665EUR (63,494) 63,494JPY (20,640) 20,640
(*) Sensitivity analysis above is performed with the Group’s monetary assets and liabilities and derivative assets and liabilities. b) Interest rate risk management The Group borrows funds with fixed and variable interest rates, and the Group is exposed to interest rate risk arising from financial instruments with variable interest rates. To manage the interest rate risk, the Group maintains the appropriate balance between the borrowings with fixed and variable interest rate for short-term borrowings, and, has a policy to borrow funds with fixed interest rates to avoid the future cash flow fluctuation risk for the long-term borrowings. The Group manages its interest rate risk through regular assessment and adjustments to the changing markets conditions and nature of its interest rates.

- 36 -
The effect of changes in interest rates by 1% to income before income tax as of March 31, 2011 is as follows; Description Increase by 1% Decrease by 1% (In millions of Korean Won) Cash and cash equivalents ₩ 2,890 ₩ (2,890)AFS financial assets (Debt investments) 219 (219)Borrowing (32,763) 32,763Debentures (1,745) 1,745 c) Equity price risk The Group is exposed to price fluctuation risk arising from available-for-sale equity investments. As of March 31, 2011, the amount of available-for-sale equity investments measured at fair value is ₩1,752,660 million. 2) Credit risk
The credit risk refers to risk of financial losses to the Group when the counterpart defaults on the obligations of the contract. The Group operates a policy to transact only with counterparties that are more than a certain level of credit rating, based on the counterparty’s financial conditions, default history, and other factors. The credit risk on liquid funds and derivative financial instruments is limited as the Group transacts only with financial institutions with high credit-ratings assigned by international credit-rating agencies. Except for guarantee of indebtedness discussed in Note 34, the book value of financial assets on the financial statements represents the maximum amount of exposure to credit risk. 3) Liquidity risk
The Group manages liquidity risk by establishing short-term and long-term fund management plans and analyzing and reviewing actual cash outflow and its budget to correspond the maturity of financial liabilities to that of financial assets. Due to the inherent nature of the Group’s industry of continuous R&D investment and sensitivity to economic fluctuations, the Group minimizes the credit risk of its cash equivalents by investing in risk-free assets. In addition, the Group has agreements in place with financial institutions with respect to trade financing and overdraft to mitigate any significant unexpected market deterioration, and has secured stable financing ability through the strengthening of its credit ratings. The maturity analysis of non-derivative liabilities according to their remaining contract expiration as of March 31, 2011 is as follows: Nominal cash flows Description
Less than 1 years
1-5 years
More than 5 years
Total
Book value
(In millions of Korean Won) Non interest-bearing liabilities ₩ 11,003,946 ₩ 137,326 ₩ 136 ₩ 11,141,408 ₩ 11,141,408Interest-bearing liabilities 15,594,584 20,617,675 3,670,511 39,882,770 39,643,738 ₩ 26,598,530 ₩ 20,755,001 ₩ 3,670,647 ₩ 51,024,178 ₩ 50,785,146 (*) Maturity analysis above is based on the book value and the earliest maturity date by which the payments should be made.

- 37 -
(3) Derivative 1) The Company entered into derivative instrument contracts including forwards, options and swaps to hedge
the exposure to changes in foreign exchange rate. As of March 31, 2011 and December 31, 2010, the Company deferred net gain of ₩26,143 million and ₩6,169 million, respectively, as accumulated other comprehensive income (loss), resulting from the effective portion of its cash flow hedging instruments. The longest period in which the forecasted transactions are expected to occur is within 12 months from March 31, 2011. Accordingly, the aforementioned total amount of deferred net gain recorded as accumulated other comprehensive income as of March 31, 2011, is expected to be realized and charged to current operations within 12 months from March 31, 2011.
For the three months ended March 31, 2011 and 2010, the Company recognized gain of ₩67,397million and ₩48,036 million, respectively, and loss of ₩8,835 million and ₩275 million, respectively, as finance income (expense), which resulted from the ineffective portion of its cash flow hedging instruments and change in the valuation of its’ other non-hedging derivative instruments.
2) The derivatives transactions held by subsidiaries as of March 31, 2011 consist of the following: Description
Gain(Loss)
Accumulate Other comprehensive income
(In millions of Korean Won) Currency forward ₩ - ₩ 144Currency swap (134,408) (10,119)Interest rate swap (3,440) (361) Total ₩ (137,848) ₩ (10,336)
As of March 31, 2011, certain subsidiaries entered into derivative instrument contracts including currency forwards, currency swaps and interest swaps, to hedge the risk of changes in cash flow of foreign exchange rate and interest rate. The longest period in which the forecasted transactions are expected to occur is within 12 months from March 31, 2011. 33. RELATED PARTY TRANSACTIONS: The transactions and outstanding balances of receivables and payables within the Group are wholly eliminated in the preparation of consolidated financial statements of the Group. The Group’s significant joint ventures and associates are Kia Motors Corporation, Hyundai WIA Corp, Hyundai HYSCO and Beijing-Hyundai Motor Company. Hyundai MOBIS and Hyundai Steel Company and others are included in other related parties. (1) Significant transactions parties for the three months ended March 31, 2011 and 2010 between the Group and
related parties are as follows:
Three months ended March 31, 2011 2010 Description Sales/proceeds Purchases/expense Sales/proceeds Purchases/expense (In millions of Korean Won) Joint ventures and associates ₩ 972,220 ₩ 2,089,509 ₩ 736,988 ₩ 1,342,365Others 272,237 2,594,196 361,601 2,152,019 ₩ 1,244,457 ₩ 4,683,705 ₩ 1,098,589 ₩ 3,494,384

- 38 -
(2) As of March 31, 2011 and December 31 2010, significant balances related to the transactions between the Group and related parties are as follows:
March 31, 2011 December 31, 2010 Description Receivables Payables Receivables Payables (In millions of Korean Won) Joint ventures and associates ₩ 893,317 ₩ 1,332,455 ₩ 992,629 ₩ 1,310,784Others 375,858 1,895,145 350,691 1,653,601 ₩ 1,269,175 ₩ 3,227,600 ₩ 1,343,320 ₩ 2,964,385
(3) Compensations for registered and unregistered directors for the three months ended March 31, 2011 and 2010 are as follows: Three months ended March 31, Description 2011 2010 (In millions of Korean Won) Short-term salaries ₩ 16,500 ₩ 16,523Long-term salaries 50 41Severance benefits 5,217 3,188 ₩ 21,767 ₩ 19,752 34. COMMITMENTS AND CONTINGENCIES: (1) As of March 31, 2011, the debt guarantees provided by the Group to related parties, excluding the Group’s
subsidiaries, are as follows: Domestic Overseas (*) (In millions of Korean Won) Associates and joint ventures ₩ - ₩ 149,472Others 170,150 287,134Customer financing and lease financing 89,389 - ₩ 259,539 ₩ 436,606 (*) The guarantee amounts in foreign currency are translated into Korean Won using the Base Rate announced by Seoul
Money Brokerage Services, Ltd. as of March 31, 2011. (2) As of March 31, 2011, though the Group is involved in the lawsuits as defendants, the Group is currently
unable to estimate the outcome or the potential financial impact of it. However, it expects that it will likely not have a material effect on its financial statements.
The Group estimates and accrues product liability and completed operations liability insurance for potential losses which may result from foreign operations lawsuits.
(3) As of March 31, 2011, the Group's property, plant and equipment are pledged as collateral for various loans
with a limit of ₩1,343,260 million. In addition, the Group pledged certain bank deposits, checks, promissory notes and investment securities, including 213,466 shares of Kia Motors Corporation, as collateral to financial institutions and others. Certain foreign subsidiaries’ receivables and financial services receivables are pledged as collateral for their borrowings.
(4) Hyundai Rotem Company, a subsidiary, provided two promissory notes and two checks as collateral for
contract performance and payment guarantees.
- 39 -
(5) As of March 31, 2011, the Group’s consolidated subsidiaries have been provided with payment guarantee from other companies as follows:
Subsidiaries
Provider
Amounts of guarantee
(KRW in millions) Hyundai Rotem Company Machinery Financial Cooperative KRW 846,092 Korea Defense Industry Association KRW 327,715 Seoul Guarantee Insurance Company KRW 646,856 Woori Bank USD 19,822,222 Export-Import Bank of Korea USD 385,902,383 ˝ EUR 453,139,686 ˝ CAD 8,032,593 ˝ GBP 489,190 ˝ TWD 31,870,312 ˝ HKD - ˝ SGD 6,409,023 ˝ CNY 69,820,205 ˝ OMR 6,580,290 ˝ EGP 15,000,000 ˝ BRL 6,000,000 ˝ TND 2,000,000 ˝ KRW 1,155 Korea Exchange Bank USD 1,292,085 ˝ EUR 4,063,636 ˝ SGD 2,662,000 ˝ INR 6,287,457 ˝ VND 9,633,724,973 ˝ KRW 3,463 BNP Paribas USD 7,620,000 ANZ Bank NZD 46,015,237 Standard Chartered, Seoul Branch THB 686,000,000 MARSH USD 5,000,000 Hyundai Capital Services, Inc. Hyundai WIA Corporation KRW 8,732 Hyundai Card Co., Ltd. Seoul Guarantee Insurance Company KRW 5,134 Hyundai Carnes Co., Ltd. Korea Exchange Bank KRW 1,000 ˝ USD 300,000 HAOS Other USD 111,958,072 HMCI Dealers' network EUR 33,979,536 (6) In 2006, the Group sold 10,658,367 shares of Hyundai Rotem Company, a subsidiary, to MSPE Metro
Investment AB and entered into a shareholders’ agreement. MSPE Metro Investment AB is entitled to a put option to sell those shares back to the Group in certain events (as defined) in accordance with the agreement. In relation to the agreement, the present value of exercise price of the put option is recognized as a liability(other financial liability) by the Group.
(7) Hyundai Capital Services, Inc., a subsidiary, has Revolving Credit Facility Agreement with the following
financial institutions for credit line: Financial institution Credit line GE Capital Corporation Euro worth of USD 1,000 million Mizuho Corporate Bank, Seoul Branch KRW 65,000 million JP Morgan Seoul Branch KRW 34,000 million Citibank, Seoul KRW 50,000 million Standard Chartered, Seoul Branch KRW 50,000 million

- 40 -
(8) Hyundai Card Co., Ltd, a subsidiary, has Revolving Credit Facility Agreement with the following financial institutions for credit line: Financial institution Credit line GE Capital Corporation Euro worth of USD 200 million Kookmin Bank KRW 100,000 million Nonghyup KRW 100,000 million Citibank, Seoul KRW 50,000 million
Woori Bank KRW 200,000 million
Shinhan Bank KRW 50,000 million (9) Hyundai Card Co., Ltd., a subsidiary, has an asset backed securitization agreement, under which exists early
redemption clauses when certain triggering events occur. Such clauses has been put in place to limit the risk that investors may incur due to changes in asset quality of the subsidiary in the future. In the event the asset-backed securitization of the Hyundai Card Co., Ltd. triggers such clauses, Hyundai Card Co., Ltd. is obligated to make early redemption of its asset-backed securities.
35. SEGMENT INFORMATION: (1) The Group has a Vehicle segment, Finance segment and other. The Vehicle segment is engaged in the
manufacturing and sales of motor vehicles. The Finance segment operates vehicle financing, credit card processing and other financing activities. Other includes the R&D, manufacturing the trains and other products..
(2) Sales and income by operating segments for three months ended March 31, 2011 is as follows:
Vehicle Finance Other
Consolidation adjustments(*) Total
(In millions of Korean Won) Total sales ₩ 20,850,212 ₩ 1,904,558 ₩ 934,764 ₩ (5,456,173) ₩ 18,233,361Inter-company sales (5,308,859) (31,269) (116,045) 5,456,173 - Net sales 15,541,353 1,873,289 818,719 - 18,233,361 Operating income 1,506,388 325,449 27,053 (31,419) 1,827,471Profit for the period 1,423,305 244,801 16,423 192,242 1,876,771 (*) Consolidation adjustments consist of elimination of inter-company transactions, unrealized profits and losses, and other
adjustments. Sales and income by operating segments for three months ended March 31, 2010 is as follows:
Vehicle Finance Other
Consolidation adjustments(*) Total
(In millions of Korean Won) Total sales ₩ 16,850,186 ₩ 1,704,581 ₩ 928,666 ₩ (4,462,004) ₩ 15,021,429Inter-company sales (4,339,640) (39,223) (83,141) 4,462,004 - Net sales 12,510,546 1,665,358 845,525 - 15,021,429 Operating income 898,874 309,134 43,530 3,965 1,255,503Profit for the period 916,351 219,161 33,864 111,906 1,281,282 (*) Consolidation adjustments consist of elimination of inter-company transactions, unrealized profits and losses, and other
adjustments.
- 41 -
(3) Assets and liabilities by operating segments as of March 31, 2011 is as follows:
Vehicle
Finance Other
Consolidation adjustments(*) Total
ASSETS (In millions of Korean Won) Current assets ₩ 27,944,728 ₩ 23,483,857 ₩ 2,204,539 ₩ (6,118,908) ₩ 47,514,216Non-current assets 36,020,747 19,111,381 2,126,198 (6,964,490) 50,293,836
Total assets ₩ 63,965,475 ₩ 42,595,238 ₩ 4,330,737 ₩ (13,083,398) ₩ 97,808,052
LIABILITIES Current liabilities ₩ 20,644,268 ₩ 15,215,520 ₩ 1,979,641 ₩ (5,796,439) ₩ 32,042,990 Borrowings and debentures 3,325,417 12,092,602 903,590 (733,077) 15,588,532 Other 17,318,851 3,122,918 1,076,051 (5,063,362) 16,454,458Non-current liabilities 7,702,690 22,093,114 1,021,785 441,353 31,258,942 Borrowings and debentures 2,481,386 20,421,993 739,602 - 23,642,981 Other 5,221,304 1,671,121 282,183 441,353 7,615,961
Total liabilities ₩ 28,346,958 ₩ 37,308,634 ₩ 3,001,426 ₩ (5,355,086) ₩ 63,301,932 (*) Consolidation adjustments consist of elimination of inter-company transactions, unrealized profits and losses, and other
adjustments. Assets and liabilities by operating segments as of December 31, 2010 is as follows:
Vehicle
Finance Other
Consolidation adjustments(*) Total
ASSETS (In millions of Korean Won) Current assets: ₩ 25,761,342 ₩ 21,227,745 ₩ 2,049,880 ₩ (5,518,813) ₩ 43,520,154Non-current assets: 36,798,877 19,611,520 2,181,870 (7,398,290) 51,193,977
Total assets ₩ 62,560,219 ₩ 40,839,265 ₩ 4,231,750 ₩ (12,917,103) ₩ 94,714,131
LIABILITIES Current liabilities ₩ 20,172,503 ₩ 14,540,732 ₩ 1,945,354 ₩ (5,213,103) ₩ 31,445,486 Borrowings and debentures 3,657,242 11,732,707 875,356 (406,132) 15,859,173 Other 16,515,261 2,808,025 1,069,998 (4,806,971) 15,586,313Non-current liabilities 7,823,253 21,206,728 968,913 381,778 30,380,672 Borrowings and debentures 2,487,002 19,558,651 691,422 - 22,737,075 Other 5,336,251 1,648,077 277,491 381,778 7,643,597
Total liabilities ₩ 27,995,756 ₩ 35,747,460 ₩ 2,914,267 ₩ (4,831,325) ₩ 61,826,158 (*) Consolidation adjustments consist of elimination of inter-company transactions, unrealized profits and losses, and other
adjustments.

- 42 -
(4) Sales by region where by the Group’s entities are located in for the three months ended March 31, 2011 are as follows:
Domestic North America Asia Europe
Consolidation adjustments
Consolidated amounts
(In millions of Korean Won) Total sales ₩ 11,666,230 ₩ 6,115,711 ₩ 1,832,294 ₩ 4,075,299 ₩ (5,456,173) ₩ 18,233,361Inter-company sales (2,368,420) (1,519,301) (137,415) (1,431,037) 5,456,173 - Net sales 9,297,810 4,596,410 1,694,879 2,644,262 - 18,233,361 Sales by region where by the Group’s entities are located in for the three months ended March 31, 2010 are as
follows:
Domestic North America Asia Europe
Consolidation adjustments
Consolidated amounts
(In millions of Korean Won) Total sales ₩ 10,755,210 ₩ 4,633,677 ₩ 1,781,915 ₩ 2,312,631 ₩ (4,462,004) ₩ 15,021,429Inter-company sales (2,172,748) (1,624,954) (285,643) (378,659) 4,462,004 - Net sales 8,582,462 3,008,723 1,496,272 1,933,972 - 15,021,429 (5) Non-current assets by region where by the Group’s entities are located in is located as of March 31, 2011 and December 31, 2010 are as follows: March 31,
2011 December 31, 2010
(In millions of Korean Won) Korea ₩ 16,455,133 ₩ 16,535,745 North America 1,527,762 1,601,862 Asia 1,201,439 1,228,577 Europe 2,148,282 2,041,919 Other 53,621 16,806 21,386,237 21,424,909 Consolidation adjustments 6,854 7,984
Total (*) ₩ 21,393,091 ₩ 21,432,893 (*) Sum of property, plant and equipment intangible assets and investment property. (6) There is no single external customer who has 10% or more of the Group’s revenues for the three months
ended March 31, 2011. 36. TRANSITION TO K-IFRS: (1) Optional exemptions for K-IFRS 1101 First-time adoption 1) Business combinations that occurred before the date of transition to K-IFRS, have not been retrospectively restated. 2) Cumulative translation differences for all foreign operations are deemed to be zero at the date of transition to K-IFRS. 3) The Group capitalizes borrowing costs relating to qualifying assets for which the commencement date for capitalization occurred after the date of transition to K-IFRS. 4) The Group measures the land at fair value as of the date of transition as deemed cost. The fair value amounting to ₩4,411,286 million (carrying amount of ₩1,954,751 million under previous GAAP) at the date of transition is used as deemed cost; the related deferred tax effect recognized amounts to ₩540,438 million. In addition, for property, plant and equipment and investment property other than land, the Group uses the revaluation previously performed, before the date of transition to K-IFRS, under previous GAAP as deemed cost.

- 43 -
(2) Significant differences in accounting policies
1) Derecognition of financial assets Under previous GAAP, when the Group transferred a financial asset to financial institutions and it was considered that control over the financial asset was transferred, and accordingly the Group derecognized the financial asset. Under K-IFRS, if the transfer doesn’t satisfy the criteria of derecognition, the financial asset is not derecognized and the related cash proceeds are recognized as financial liabilities. 2) Employee benefits Under previous GAAP, the Group measured the accrued severance benefits with the assumption that all employees and directors with more than one year of service were to retire as of the end of reporting period and recognized long-term employee benefits as an expense when the obligation of the payment was determined. Under K-IFRS, the company recognizes the defined benefit obligation and long-term employee benefits by using actuarial assumptions. 3) Provision Under previous GAAP, the discount rate at the initial recognition was applied to measure the present value of provisions in the subsequent periods. Under K-IFRS, the current market discount rate is applied to remeasure the present value of provisions. Under K-IFRS, where some or all of the expenditure required to settle a provision is expected to be reimbursed by another party and when it is virtually certain that reimbursement will be received if the Group settles the obligation, the Group recognizes the reimbursement by another party as a separate asset. 4) Financial guarantee contracts
Under K-IFRS, the Group has recognized the fair value of financial guarantee contracts which require the issuer to make specified payments to reimburse the holder for a loss it incurs because a specified debtor fails to make payment when due in accordance with the original or modified terms of a debt instrument as a financial liability. 5) Customer loyalty programmes Under previous GAAP, the Group recognized expenditure expected to be paid in the future as selling expenses and the provision that indicates the transaction granted the award credits under customer loyalty programmes. Under K-IFRS, since the Group is required to allocate the fair value of the consideration received or receivable between the award credits and the other components of the sale and defer the recognition of revenue, the Group has recognized the amount as deferred revenue. 6) Investment property
The Group classifies the property held to earn rentals as investment property under K-IFRS, which was classified as tangible asset under previous GAAP. 7) Borrowing cost Under K-IFRS, borrowing costs that are directly attributable to the acquisition, construction or production of a qualifying assets after the date of transition are recognized as the cost of the asset, which was recognized as expense under previous GAAP. 8) Deferred income tax Under previous GAAP, the Group recognized deferred tax assets or liabilities for investments in subsidiaries, jointly controlled entities and associates without separating the temporary difference by the origin of its occurrence. However, under K-IFRS, the Group recognizes deferred tax assets or liabilities for those in accordance with the way the related temporary difference reverses by the origin of its occurrence. In addition, under previous GAAP, deferred tax assets and liabilities are presented in current or non-current assets or liabilities in accordance with the classification of the related assets or liabilities. Under K-IFRS, deferred tax assets and liabilities are presented in non-current assets and liabilities.

- 44 -
9) Category of operating income Under K-IFRS, the gain or loss on disposal of property, plant and equipment, the impairment loss on intangible assets and etc., which they are categorized in non-operating income(expense) under previous GAAP, are recognized in operating income(expense). In addition, under previous GAAP, the foreign exchange gain or loss is recognized in non-operating income (expense). However, under K-IFRS, the foreign exchange gain or loss is classified in operating income (expense) or non-operating income (expense) by the nature of the transaction or event. (3) Changes in scope of consolidation
Changes Description Name of entity
Increase
Under Korean GAAP, these companies are excluded in the consolidation since individual beginning balance of total assets is less than 10,000 million won, but they are included in the scope of consolidation under K-IFRS.
Hyundai NGV Tech Co., Ltd., Jeonbuk Hyundai Motors FC Co., Ltd., Hyundai Carnes Co., Ltd., Rotem Equipments (Beijing) Co., Ltd., Maintrance Co., Ltd., Hyundai Motor Japan R&D Center Inc., Hyundai Capital Europe GmbH, Hyundai Motor Brasil Montadora de Automoveis, Beijing Jingxianronghua Motor sale Co., Ltd., Beijing xinhuaxiaqiyuetong Motor Chain Co., Ltd.
Under Korean GAAP, the company is excluded in the consolidation due to the plan to go into liquidation, but it is included in the scope of consolidation under K-IFRS.
Hyundai Motor Hungary
Under Korean GAAP, these companies are excluded in the consolidation since it is deemed not to have control over the company due to the passively designated scope of operation by the related law or the article of association. However, they are included in the scope of consolidation under K-IFRS.
Autopia Thirty-Third Asset Securitization Specialty Company, etc.
Decrease
These companies are excluded in the consolidation under K-IFRS since the voting power rights is less than 50% and as the Company does not have control of these companies.
Kia Motors Corporation and its subsidiaries, Hyundai HYSCO Co., Ltd. and its subsidiaries, Hyundai Dymos Inc. and its subsidiaries, Hyundai WIA Corporation and its subsidiaries, KEFICO Corporation and its subsidiaries, Hyundai Powertech Co., Ltd. and its subsidiaries, Hyundai Autoever Corp., Hyundai Commercial Inc., Hyundai M & Soft Co., Ltd., Haevichi Country Club Co., Ltd., HMC Win Win Fund, Innocean Worldwide Americas, LLC, Hyundai Information Service North America, LLC, Beijing Mobis Transmission Co., Ltd, Hyundai Motor Group China. Ltd, Hyundai-Wia Automotive Engine (Shandong) Company
- 45 -
(4) Adjustments in financial position and financial performance due to transition to K-IFRS 1) Adjustments in financial position as of January 1, 2010, transition date to K-IFRS
Description Assets Liabilities Equity
(In millions of Korean Won) K-GAAP ₩ 102,324,934 ₩ 73,363,274 ₩ 28,961,660 Adjustments:
Change in scope of consolidation (24,767,776) (20,210,061) (4,557,715) Deemed cost of land 2,456,535 - 2,456,535 Employee benefits - 321,935 (321,935) Provisions 734,022 668,115 65,907 Effect of the adoption of K-IFRS for joint ventures and associates 478,709 - 478,709 Allowance for bad debt 268,500 - 268,500 Deferred tax (166,571) 44,659 (211,230) Other 51,703 46,621 5,082
Total (20,944,878) (19,128,731) (1,816,147) K-IFRS ₩ 81,380,056 ₩ 54,234,543 ₩ 27,145,513
2) Adjustments in financial position and financial performance for the year ended December 31, 2010
Description Assets Liabilities Equity Net income
Comprehensive income
(In millions of Korean Won) K-GAAP ₩ 118,077,818 ₩ 81,342,217 ₩ 36,735,601 ₩ 7,982,924 ₩ 8,482,806Adjustments:
Change in scope of consolidation (27,185,274) (20,680,341) (6,504,933) (2,221,013) (2,221,013)Deemed cost of land 2,456,535 - 2,456,535 - - Employee benefits (14,371) 453,707 (468,078) 45,892 (118,812)Provisions 809,831 818,263 (8,432) (52,638) (52,638)Effect of the adoption of K-IFRS for joint ventures and associates 642,353 - 642,353 138,355 138,355Allowance for bad debts 230,787 - 230,787 (25,500) (25,500)Deferred tax (256,162) (248,166) (7,996) 157,292 157,292Other (47,386) 140,478 (187,864) (24,130) (42,449)
Total (23,363,687) (19,516,059) (3,847,628) (1,981,742) (2,164,765)K-IFRS ₩ 94,714,131 ₩ 61,826,158 ₩ 32,887,973 ₩ 6,001,182 ₩ 6,318,041
(5) Adjustments in statements of cash flows due to the transition to K-IFRS Interest receipts, interest payments, dividend received and tax payments are represented in separate accounts in accordance with K-IFRS which were not separately stated under previous GAAP. (6) Adjustments to the comparative financial statements of the interim period of the previous fiscal year As the Group did not prepare consolidated financial statements for the comparative interim periods of previous fiscal year under previous GAAP, reconciliations of equity as of March 31, 2010 and total comprehensive income for the three months ended March 31, 2010 are not represented in adjustments due to the transition to K-IFRS of interim consolidated financial statements. 37. SIGNIFICANT EVENTS AFTER THE REPORTING PERIOD:
On March 8, 2011, Hyundai Motor Company Group consortium including the Company signed a share purchase agreement with the creditors of Hyundai Engineering & Construction Co., Ltd. and acquired 20.95% of common share of Hyundai Engineering & Construction Co., Ltd. on April 1, 2011.