sr eport - cuesta
TRANSCRIPT
s R lege -
Sat
eport Composite
is faction
Cuesta College - Composite - 1/99 Student Satisfaction Inventory
Institutional Summary Scales: In Alphabetical Order With Items That Make Up the Scale
National Group Means are based on 142897 students records
ScaleIItem
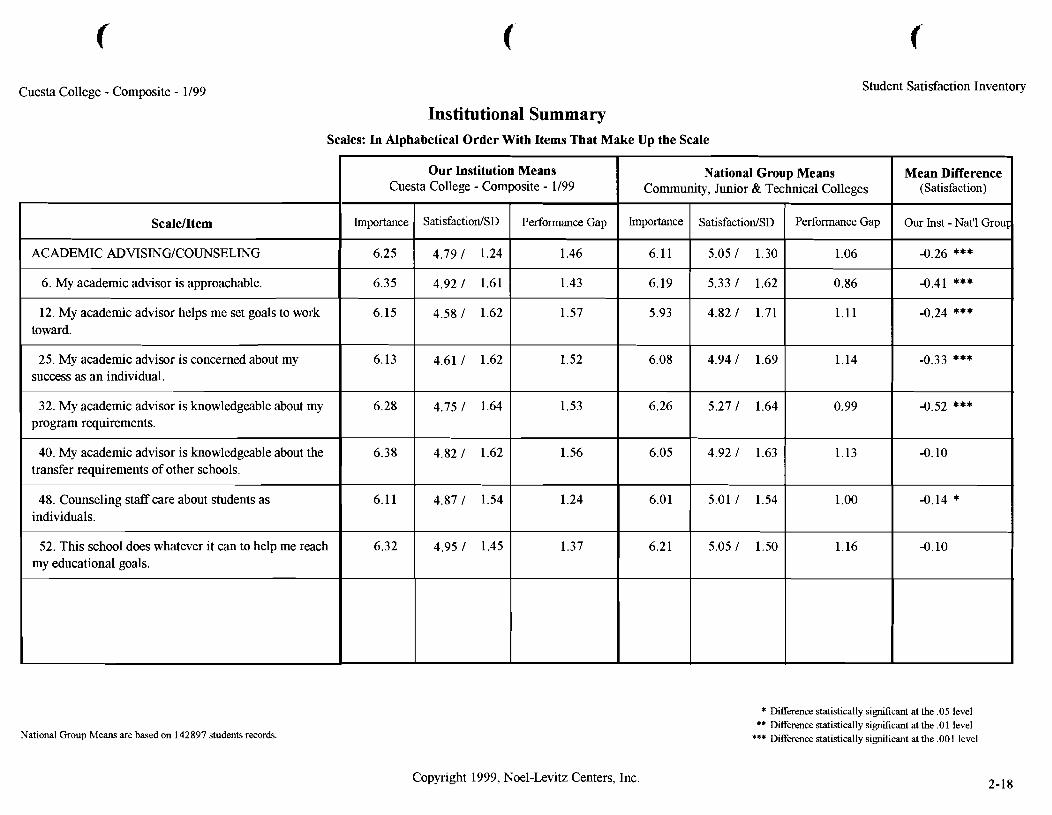
ACADEMIC ADVISING/COUNSELING
6. My academic advisor is approachable.
12. My academic advisor helps me set goals to work toward.
25. My academic advisor is concerned about my success as an individual.
32. My academic advisor is knowledgeable about my program requirements.
40. My academic advisor is knowledgeable about the transfer requirements of other schools.
48. Counseling staff care about students as individuals.
52. This school does whatever it can to help me reach my educational goals.
Copyright 1999, Noel-Levitz Centers, Inc.
* Difference statistically significant at the .05 level ** Difference statistically significant at the .O1 level
*** Difference statistically si@~cant at the .OO 1 level
Our Institution Means Cuesta College - Composite - 1/99
Importance
6.25
6.35
6.15
6.13
6.28
6.38
6.11
6.32
Mean Difference (Satisfaction)
Our Inst - Nat'l Grou~
-0.26 ***
-0.41 ***
-0.24 ***
-0.33 ***
-0.52 ***
-0.10
-0.14 *
-0.10
National Group Means
SatisfactiodSD
4.79 / 1.24
4.92 / 1.61
4.58 / 1.62
4.61 / 1.62
4.75 / 1.64
4.82 / 1.62
4.87 / 1.54
4.95 / 1.45
Community,
Importance
6.11
6.19
5.93
6.08
6.26
6.05
6.01
6.21
Performance Gap
1.46
1.43
1.57
1.52
1.53
1.56
1.24
1.37
Junior &
SatisfactiodSD
5.05 / 1.30
5.33 / 1.62
4.82 / 1.71
4.94 / 1.69
5.27 / 1.64
4.92 / 1.63
5.01 / 1.54
5.05 / 1.50
Technical Colleges
Performance Gap
1.06
0.86
1.11
1.14
0.99
1.13
1.00
1.16
Cuesta College - Composite - 1/99 Student Satisfaction Inventory
Institutional Summary Scales: In Alphabetical Order With Items That Make Up the Scale
National Group Means are based on 142897 students records.
ScaleIItem
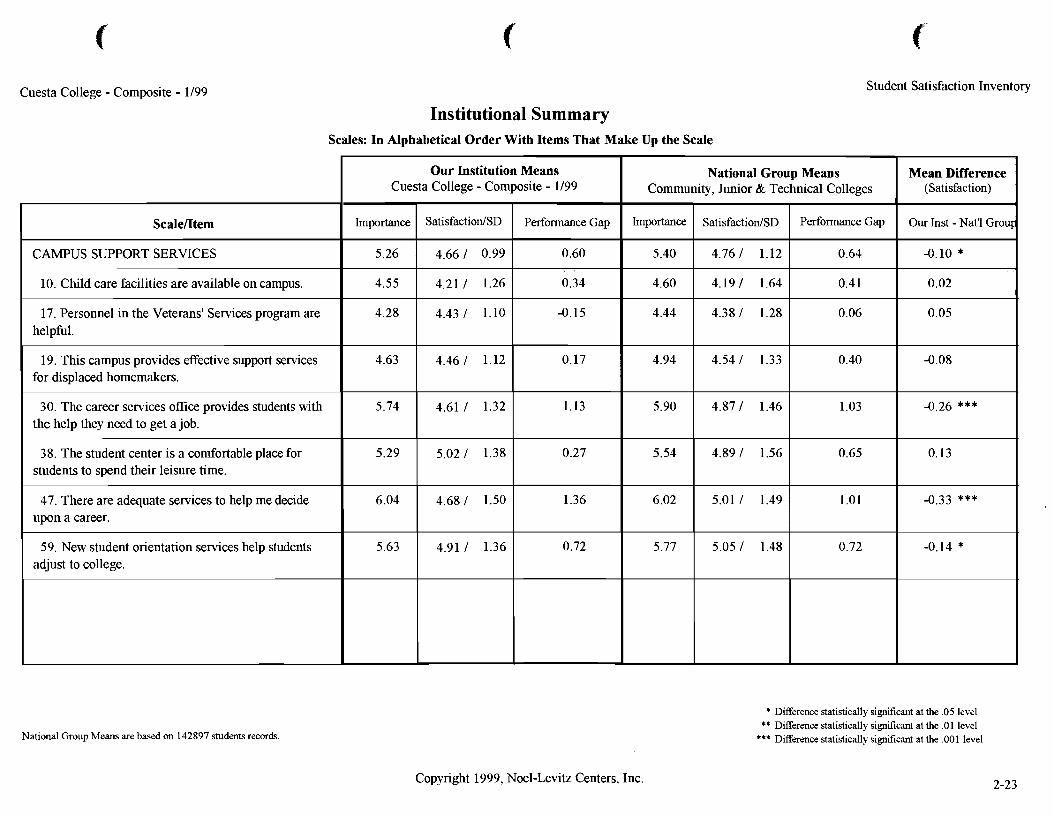
CAMPUS SUPPORT SERVICES
10. Child care facilities are available on campus.
17. Personnel in the Veterans' Services program are helpful.
19. This campus provides effective support services for displaced homemakers.
30. The career services office provides students with the help they need to get a job.
38. The student center is a comfortable place for students to spend their leisure time.
47. There are adequate services to help me decide upon a career.
59. New student orientation services help students adjust to college.
Copyright 1999, Noel-Levitz Centers, Inc.
* Difference statistically significant at the .05 level ** Difference statistically significant at the .O1 level
*** Difference statistically significant at the .001 level
Our Institution Means Cuesta College - Composite - 1199
Importance
5.26
4.55
4.28
4.63
5.74
5.29
6.04
5.63
Mean Difference (Satisfaction)
Our Inst - Nat'l Group
-0.10 *
0.02
0.05
-0.08
-0.26 ***
0.13
-0.33 ***
-0.14 *
National Group Means
SatisfactiodSD
4.66 1 0.99
4.21 1 1.26
4.43 1 1.10
4.46 1 1.12
4.61 1 1.32
5.02 1 1.38
4.68 1 1.50
4.91 1 1.36
Community,
Importance
5.40
4.60
4.44
4.94
5.90
5.54
6.02
5.77
Performance Gap
0.60
0.34
-0.15
0.17
1.13
0.27
1.36
0.72
Junior &
SatisfactiodSD
4.76 1 1.12
4.19 1 1.64
4.38 1 1.28
4.54 1 1.33
4.87 1 1.46
4.89 1 1.56
5.01 1 1.49
5.05 1 1.48
Technical Colleges
Performance Gap
0.64
0.41
0.06
0.40
1.03
0.65
1.01
0.72
Cuesta College - Composite - 1/99 Student Satisfaction Inventory
Institutional Summary Scales: In Alphabetical Order With Items That Make Up the Scale
National Group Means are based on 142897 students records.
ScaletItem
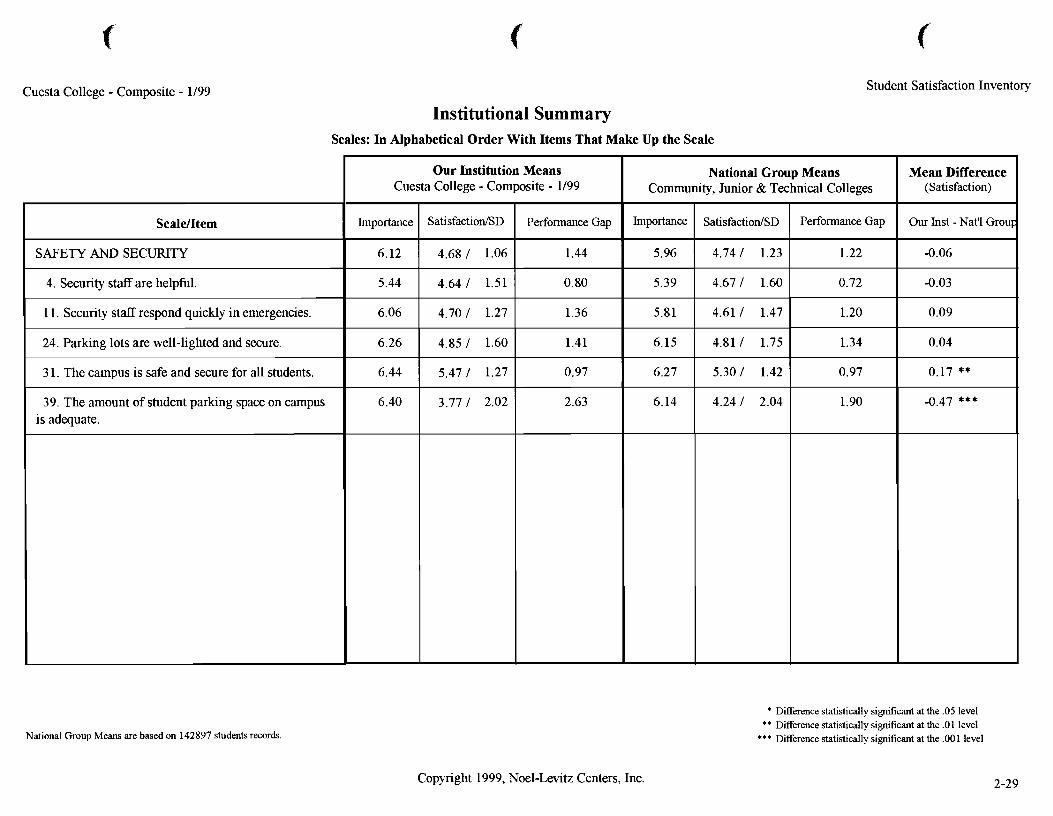
SAFETY AND SECURITY
4. Security staff are helpful.
1 1. Security staff respond quickly in emergencies.
24. Parking lots are well-lighted and secure.
3 1. The campus is safe and secure for all students.
39. The amount of student parking space on campus is adequate.
Copyright 1999, Noel-Levitz Centers, Inc.
* Difference statistically sigruficant at the .05 level ** Difference statistically significant at the .O1 level
*** Difference statistically significant at the .001 level
Our Institution Means Cuesta College - Composite - 1/99
Importance
6.12
5.44
6.06
6.26
6.44
6.40
Mean Difference (Satisfaction)
Our Inst - Nat'l Grou~
-0.06
-0.03
0.09
0.04
0.17 **
-0.47 ***
National Group Means Community,
Importance
5.96
5.39
5.81
6.15
6.27
6.14
SatisfactiodSD
4.68 / 1.06
4.64 / 1.51
4.70 / 1.27
4.85 / 1.60
5.47 / 1.27
3.77 / 2.02
Performance Gap
1.44
0.80
1.36
1.41
0.97
2.63
Junior &
SatisfactiodSD
4.74 / 1.23
4.67 / 1.60
4.61 / 1.47
4.81 / 1.75
5.30 / 1.42
4.24 / 2.04
Technical Colleges
Performance Gap
1.22
0.72
1.20
1.34
0.97
1.90
Cuesta College - Composite - 1/99 Student Satisfaction Inventow
Institutional Summary Scales: In Alphabetical Order With Items That Make Up the Scale
National Group Means are based on 142897 students records.
ScaleIItem
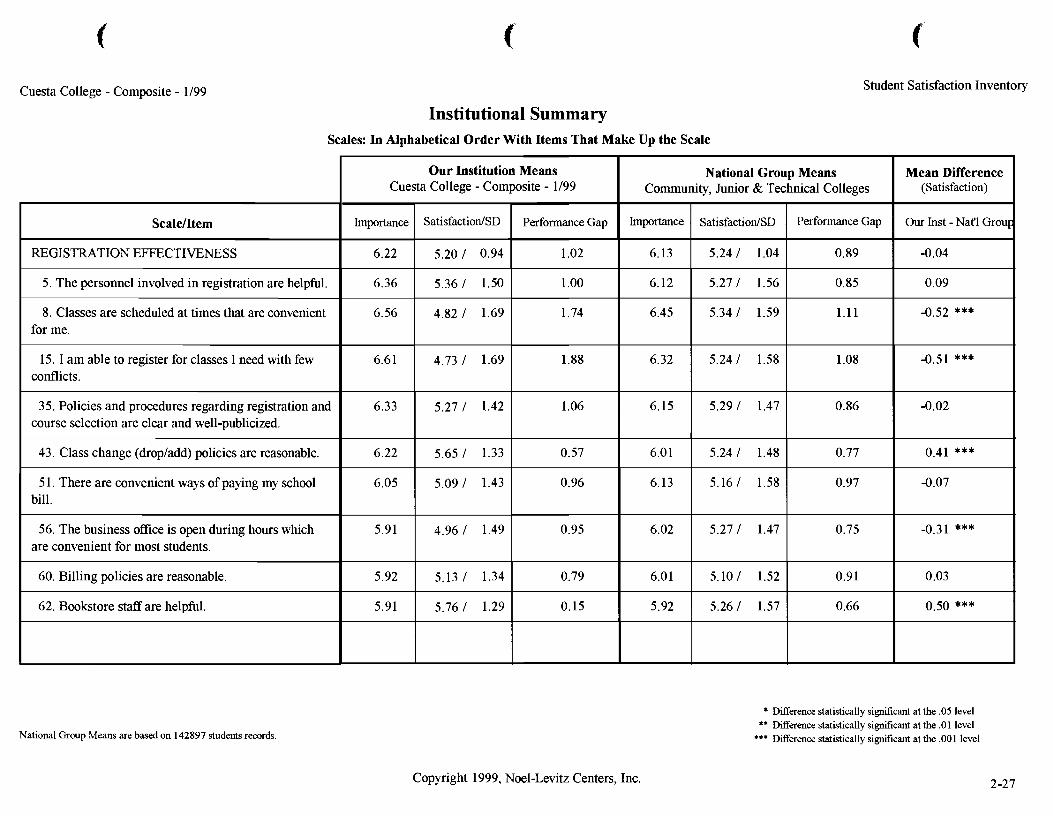
REGISTRATION EFFECTIVENESS
5. The personnel involved in registration are helpful.
8. Classes are scheduled at times that are convenient for me.
15. I am able to register for classes I need with few conflicts.
35. Policies and procedures regarding registration and course selection are clear and well-publicized.
43. Class change (dropladd) policies are reasonable.
5 1. There are convenient ways of paying my school bill.
56. The business office is open during hours which are convenient for most students.
60. Billing policies are reasonable.
62. Bookstore staff are helpful.
Copyright 1999, Noel-Levitz Centers, Inc.
* Difference statistically significant at the .05 level ** Difference statistically significant at the .O1 level
*** Dfierence statistically significant at the ,001 level
Our Institution Means Cuesta College - Composite - 1/99
Importance
6.22
6.36
6.56
6.6 1
6.33
6.22
6.05
5.91
5.92
5.91
Mean Difference (Satisfaction)
Our Inst - Nat'l Grou~
-0.04
0.09
-0.52 ***
-0.51 ***
-0.02
0.41 ***
-0.07
-0.31 ***
0.03
0.50 ***
National Group Means
SatisfactiodSD
5.20 / 0.94
5.36 / 1.50
4.82 / 1.69
4.73 / 1.69
5.27 / 1.42
5.65 / 1.33
5.09 / 1.43
4.96 / 1.49
5.13 / 1.34
5.76 / 1.29
Community,
Importance
6.13
6.12
6.45
6.32
6.15
6.0 1
6.13
6.02
6.0 1
5.92
Performance Gap
1.02
1 .OO
1.74
1.88
1.06
0.57
0.96
0.95
0.79
0.15
Junior &
SatisfactiodSD
5.24 / 1.04
5.27 / 1.56
5.34 / 1.59
5.24 / 1.58
5.29 / 1.47
5.24 / 1.48
5.16 / 1.58
5.27 / 1.47
5.10 / 1.52
5.26 / 1.57
Technical Colleges
Performance Gap
0.89
0.85
1.11
1.08
0.86
0.77
0.97
0.75
0.91
0.66
Cuesta College - Composite - 1/99 Student Satisfaction Inventoq
Institutional Summary Scales: In Alphabetical Order With Items That Make Up the Scale
National Group Means are based on 142897 students records.
Scale/Item
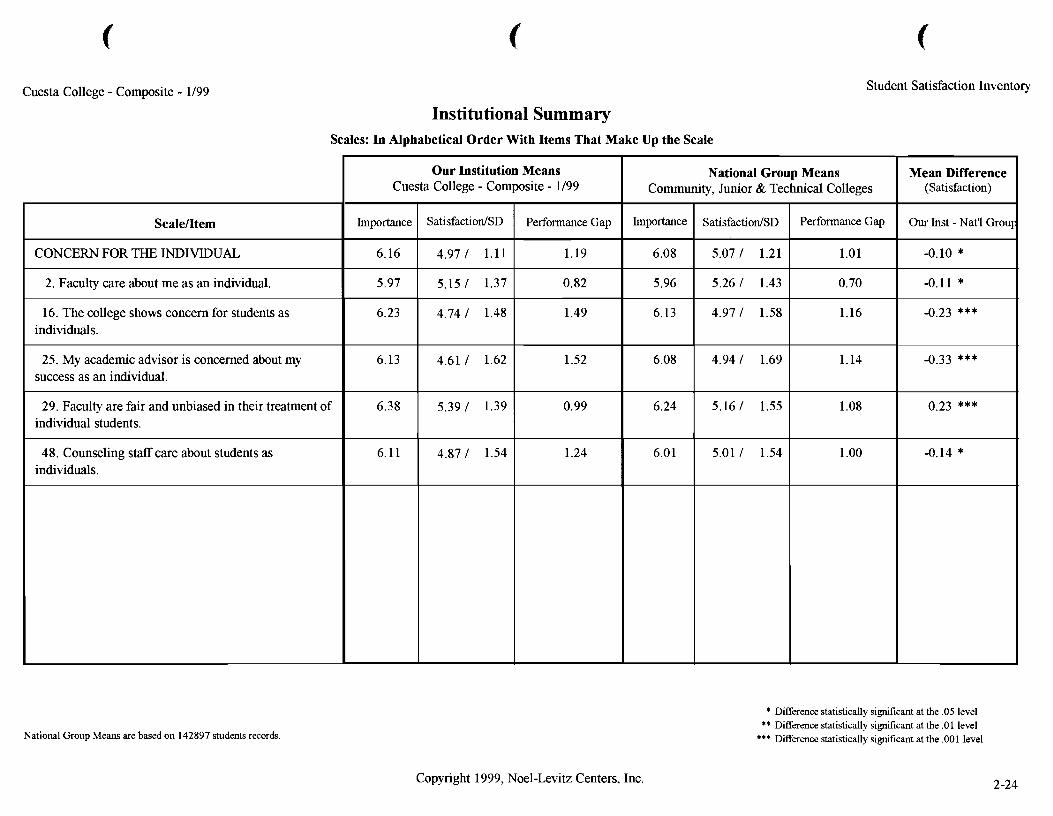
CONCERN FOR THE INDIVIDUAL
2. Faculty care about me as an individual.
16. The college shows concern for students as individuals.
25. My academic advisor is concerned about my success as an individual.
29. Faculty are fair and unbiased in their treatment of individual students.
48. Counseling staff care about students as individuals.
Copyright 1999, Noel-Levitz Centers, Inc.
* Difference statistically significant at the .05 level ** Difference statistically significant at the .0 1 level
*** Difference statistically significant at the .001 level
Our Institution Means Cuesta College - Composite - 1/99
Importance
6.16
5.97
6.23
6.13
6.38
6.11
Mean Difference (Satisfaction)
Our Inst - Nat'l Grou~
-0.10 *
-0.11 *
-0.23 ***
-0.33 ***
0.23 ***
-0.14 *
National Group Means
SatisfactiodSD
4.97 / 1.11
5.15 / 1.37
4.74 / 1.48
4.61 / 1.62
5.39 / 1.39
4.87 / 1.54
Community,
Importance
6.08
5.96
6.13
6.08
6.24
6.01
Performance Gap
1.19
0.82
1.49
1.52
0.99
1.24
Junior &
SatisfactiodSD
5.07 / 1.21
5.26 / 1.43
4.97 / 1.58
4.94 / 1.69
5.16 / 1.55
5.01 / 1.54
Technical Colleges
Performance Gap
1.01
0.70
1.16
1.14
1.08
1.00
Cuesta College - Composite - 1/99 Student Satisfaction Inventory
Institutional Summary Scales: In Alphabetical Order With Items That Make Up the Scale
National Group Means are based on 142897 students records.
ScaleIItem
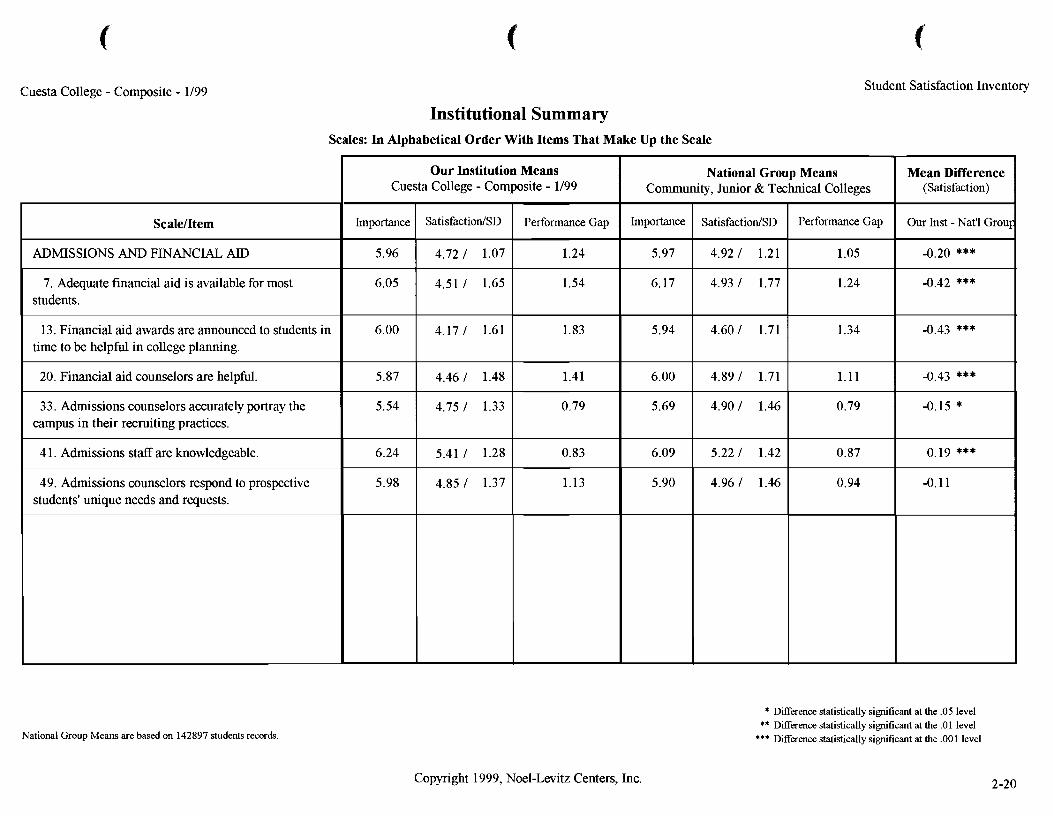
ADMSSIONS AND FINANCIAL AID
7. Adequate financial aid is available for most students.
13. Financial aid awards are announced to students in time to be helpful in college planning.
20. Financial aid counselors are helpful.
33. Admissions counselors accurately portray the campus in their recruiting practices.
4 1. Admissions staff are knowledgeable.
49. Admissions counselors respond to prospective students' unique needs and requests.
Copyright 1999, Noel-Levitz Centers, Inc.
* DiEerence statistically significant at the .05 level ** DiEerence statistically significant at the .O1 level
*** Difference statistically significant at the .001 level
Our Institution Means Cuesta College - Composite - 1/99
Importance
5.96
6.05
6.00
5.87
5.54
6.24
5.98
Mean Difference (Satisfaction)
Our Inst - Nat'l Group
-0.20 ***
-0.42 ***
-0.43 ***
-0.43 ***
-0.15 *
0.19 ***
-0.11
National Group Means
SatisfactiodSD
4.72 / 1.07
4.51 / 1.65
4.17 / 1.61
4.46 / 1.48
4.75 / 1.33
5.41 / 1.28
4.85 / 1.37
Community,
Importance
5.97
6.17
5.94
6.00
5.69
6.09
5.90
Performance Gap
1.24
1.54
1.83
1.41
0.79
0.83
1.13
Junior &
SatisfactiodSD
4.92 / 1.21
4.93 / 1.77
4.60 / 1.71
4.89 / 1.71
4.90 / 1.46
5.22 / 1.42
4.96 / 1.46
Technical Colleges
Performance Gap
1.05
1.24
1.34
1.11
0.79
0.87
0.94
Student Satisfaction Inventory Cuesta College - San Luis Obispo - 12198
Institutional Summary Scales: In Alphabetical Order With Items That Make Up the Scale
National Group Means are based on 142897 students records.
ScalelItem
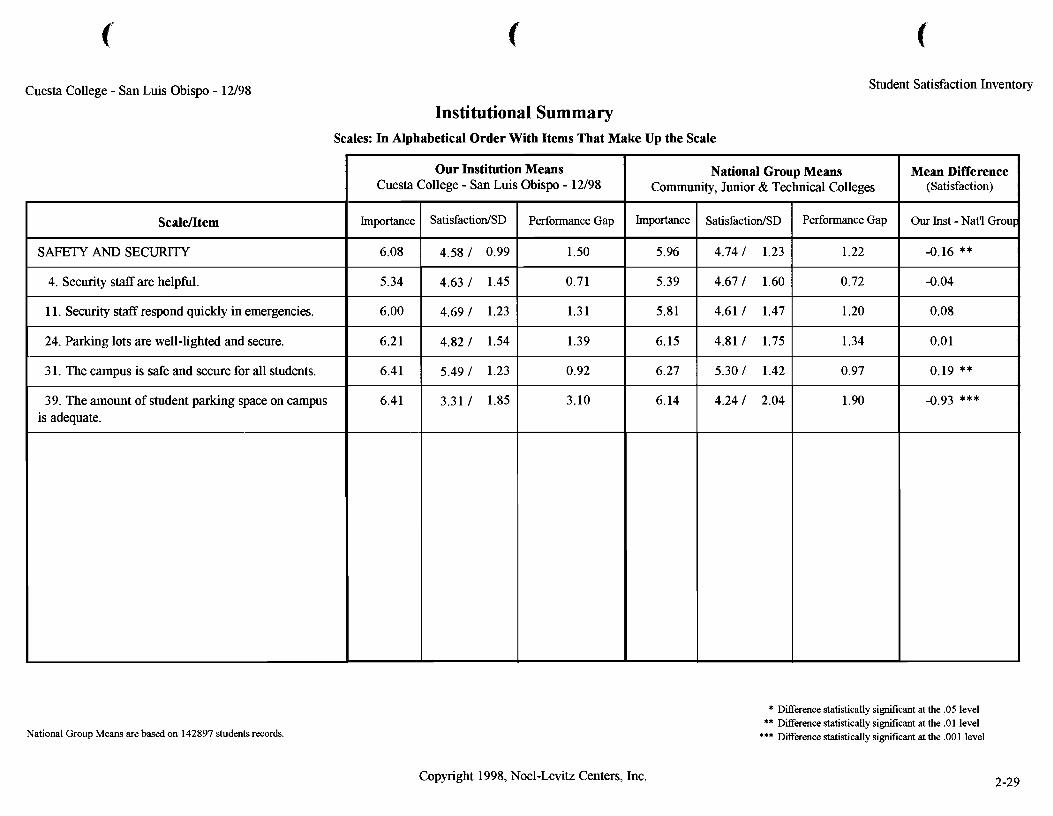
SAFETY AND SECURITY
4. Security staff are helpful.
1 1. Security staff respond quickly in emergencies.
24. Parking lots are well-lighted and secure.
3 1. The campus is safe and secure for all students.
39. The amount of student parking space on campus is adequate.
Copyright 1998, Noel-Levitz Centers, Inc.
* Difference statistically sigruf~cant at the .05 level ** Difference statistically significant at the .O1 level
*** Difference statistically significant at the ,001 level
Our Institution Means Cuesta College - San Luis Obispo - 12/98
Importance
6.08
5.34
6.00
6.2 1
6.41
6.41
Mean Difference (Satisfaction)
Our Inst - Nat'l Group
-0.16 **
-0.04
0.08
0.01
0.19 **
-0.93 ***
National Group Means
SatisfactiodSD
4.58 1 0.99
4.63 1 1.45
4.69 I 1.23
4.82 1 1.54
5.49 1 1.23
3.31 1 1.85
Community,
Importance
5.96
5.39
5.81
6.15
6.27
6.14
Performance Gap
1.50
0.71
1.31
1.39
0.92
3.10
Junior &
SatisfactiodSD
4.74 1 1.23
4.67 1 1.60
4.61 I 1.47
4.81 1 1.75
5.30 1 1.42
4.24 1 2.04
Technical Colleges
Performance Gap
1.22
0.72
1.20
1.34
0.97
1.90
Student Satisfaction Inventory Cuesta College - San Luis Obispo - 12/98
Institutional Summary Scales: In Alphabetical Order With Items That Make Up the Scale
National Group Means are based on 142897 students records.
Scaldtem
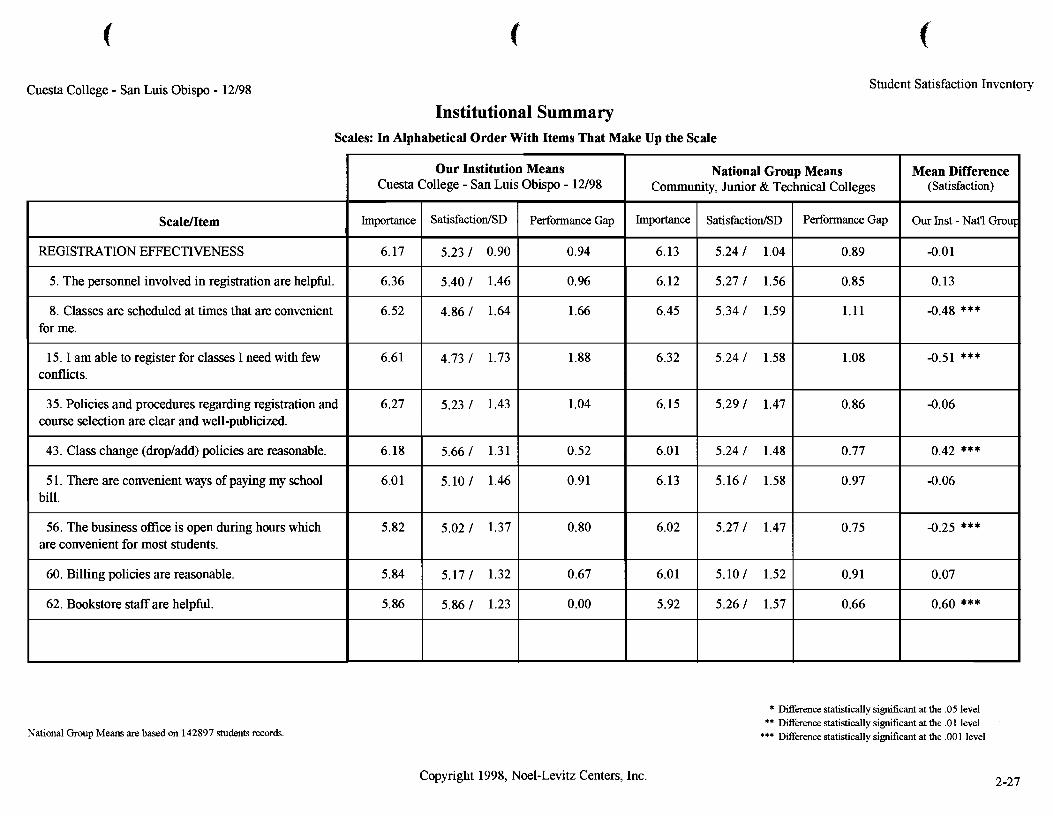
REGISTRATION EFFECTIVENESS
5. The personnel involved in registration are helpful.
8. Classes are scheduled at times that are convenient for me.
15. I am able to register for classes I need with few conflicts.
35. Policies and procedures regarding registration and course selection are clear and well-publicized.
43. Class change (dropladd) policies are reasonable.
5 1. There are convenient ways of paying my school bill.
56. The business office is open during hours which are convenient for most students.
60. Billing policies are reasonable.
62. Bookstore staff are helpful.
Copyright 1998, Noel-Levitz Centers, Inc.
* DBerence statistically sigdicant at the .05 level ** DBerence statistically si&cant at the .O1 level
*** DSrence statistically si&cant at the ,001 level
Our Institution Means Cuesta College - San Luis Obispo - 12/98
Importance
6.17
6.36
6.52
6.61
6.27
6.18
6.0 1
5.82
5.84
5.86
Mean Difference (Satisfaction)
Our Inst - Nat'l Grou~
-0.01
0.13
-0.48 ***
-0.51 ***
-0.06
0.42 ***
-0.06
-0.25 ***
0.07
0.60 ***
National Group Means
SatisfactiodSD
5.23 I 0.90
5.40 1 1.46
4.86 1 1.64
4.731 1.73
5.23 1 1.43
5.66 I 1.31
5.10 I 1.46
5.02 I 1.37
5.17 I 1.32
5.86 I 1.23
Community,
hnp0rtance
6.13
6.12
6.45
6.32
6.15
6.01
6.13
6.02
6.01
5.92
Performance Gap
0.94
0.96
1.66
1.88
1.04
0.52
0.91
0.80
0.67
0.00
Junior &
SatisfactiodSD
5.24 I 1.04
5.27 1 1.56
5.34 1 1.59
5.24 1 1.58
5.29 1 1.47
5.24 I 1.48
5.16 I 1.58
5.27 I 1.47
5.10 I 1.52
5.26 I 1.57
Technical Colleges
Performance Gap
0.89
0.85
1.11
1.08
0.86
0.77
0.97
0.75
0.91
0.66

Student Satisfaction Inventory Cuesta College - San Luis Obispo - 12/98
Institutional Summary Scales: In Alphabetical Order With Items That Make Up the Scale
National Group Means are based on 142897 students records.
ScaleIItem
CONCERN FOR THE INDIVIDUAL
2. Faculty care about me as an individual.
16. The college shows concern for students as individuals.
25. My academic advisor is concerned about my success as an individual.
29. Faculty are fair and unbiased in their treatment of individual students.
48. Counseling staff care about students as individuals.
-
Copyright 1998, Noel-Levitz Centers, Inc.
* Difference statistically si&~cant at the .05 level ** Difference statistically si&lcant at the .O1 level
*** Difference statistically si&~cant at the .OO 1 level
Our Institution Means Cuesta College - San Luis Obispo - 12/98
Importance
6.14
5.96
6.20
6.13
6.34
6.06
Mean Difference (Satisfaction)
Our Inst - Nat'l Group
-0.14 **
-0.16 *
-0.25 ***
-0.35 ***
0.18 **
-0.18 *
National Group Means
SatisfactiodSD
4.93 / 1.13
5.10 / 1.37
4.72 / 1.49
4.59 / 1.66
5.34 / 1.39
4.83 / 1.58
Community,
Importance
6.08
5.96
6.13
6.08
6.24
6.0 1
Performance Gap
1.21
0.86
1.48
1.54
1.00
1.23
Junior &
SatisfactiodSD
5.07 / 1.21
5.26 / 1.43
4.97 / 1.58
4.94 / 1.69
5.16 / 1.55
5.01 / 1.54
Technical Colleges
Performance Gap
1.01
0.70
1.16
1.14
1.08
1.00
Cuesta College - San Luis Obispo - 12/98 Student Satisfaction Inventory
Institutional Summary Scales: In Alphabetical Order Witb Items That MaLe Up the Scale
National Group Means are based on 142897 students records.
Scaldtern
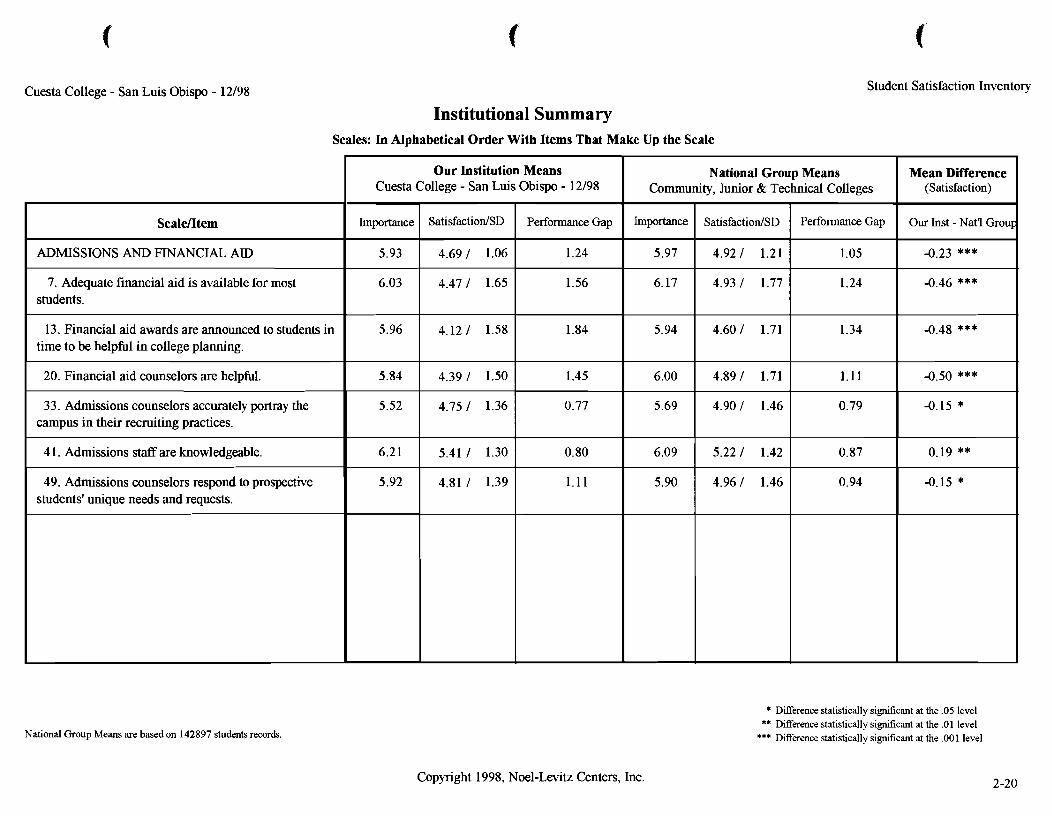
ADMISSIONS AND FINANCIAL AID
7. Adequate financial aid is available for most students.
13. Financial aid awards are announced to students in time to be helpful in college planning.
20. Financial aid counselors are helpful.
33. Admissions counselors accurately portray the campus in their recruiting practices.
4 1. Admissions staff are knowledgeable.
49. Admissions counselors respond to prospective students' unique needs and requests.
Copyright 1998, Noel-Levitz Centers, Inc.
* Difference statistically significant at the .05 level ** Difference statistically sigmficant at the .O1 level
*** Difference statistically si&icant at the .001 level
Our Institution Means Cuesta College - San Luis Obispo - 12/98
Mean Difference (Satisfaction)
Our Inst - Nat'l Grou~
-0.23 ***
-0.46 ***
-0.48 ***
-0.50 ***
-0.15 *
0.19 **
-0.15 *
Performance Gap
1.24
1.56
1.84
1.45
0.77
0.80
1.11
Importance
5.93
6.03
5.96
5.84
5.52
6.2 1
5.92
National Group Means
SatisfactiodSD
4.69 1 1.06
4.47 1 1.65
4.12 1 1.58
4.39 1 1.50
4.75 I 1.36
5.41 I 1.30
4.81 I 1.39
Community,
hportance
5.97
6.17
5.94
6.00
5.69
6.09
5.90
Junior &
SatisfactiodSD
4.92 1 1.21
4.93 1 1.77
4.60 1 1.71
4.89 1 1.71
4.90 I 1.46
5.22 I 1.42
4.96 I 1.46
Technical Colleges
Performance Gap
1.05
1.24
1.34
1.11
0.79
0.87
0.94
Cuesta College - San Luis Obispo - 12/98 Student Satisfaction Inventory
Institutional Summary Scales: In Alphabetical Order With Items That Make Up the Scale
National Group Means are based on 142897 students records.
ScaleIItem
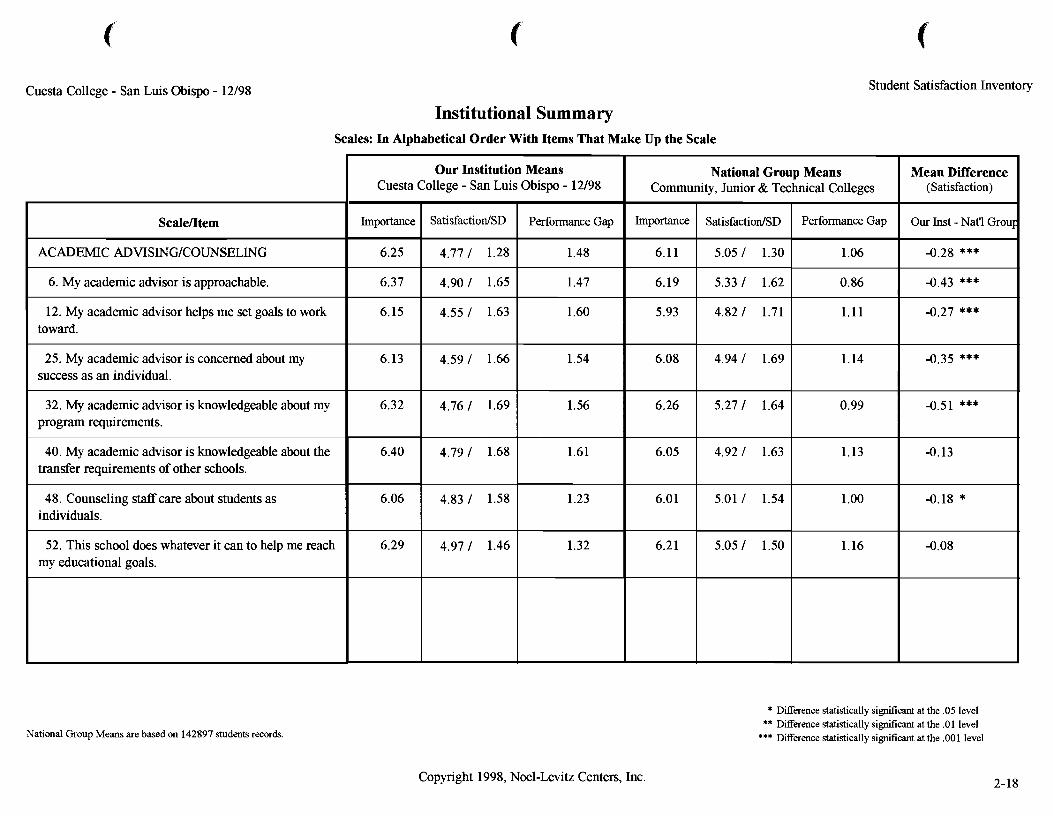
ACADEMIC ADVISINGICOUNSELING
6. My academic advisor is approachable.
12. My academic advisor helps me set goals to work toward.
25. My academic advisor is concerned about my success as an individual.
32. My academic advisor is knowledgeable about my program requirements.
40. My academic advisor is knowledgeable about the transfer requirements of other schools.
48. Counseling staff care about students as individuals.
52. This school does whatever it can to help me reach my educational goals.
Copyright 1998, Noel-Levitz Centers, Inc.
* Difference statistically sisruflcant at the .05 level ** Difference statistically signticant at the .O1 level
*** Difference statistically sisruflcant at the ,001 level
Our Institution Means Cuesta College - San Luis Obispo - 12/98
Importance
6.25
6.37
6.15
6.13
6.32
6.40
6.06
6.29
Mean Difference (Satisfaction)
Our Inst - Nat'l Grou~
-0.28 ***
-0.43 ***
-0.27 ***
-0.35 ***
-0.51 ***
-0.13
-0.18 *
-0.08
National Group Means
SatisfactiodSD
4.77 1 1.28
4.90 I 1.65
4.55 I 1.63
4.59 I 1.66
4.76 I 1.69
4.79 I 1.68
4.83 I 1.58
4.97 I 1.46
Community,
Importance
6.11
6.19
5.93
6.08
6.26
6.05
6.01
6.2 1
Performance Gap
1.48
1.47
1.60
1.54
1.56
1.61
1.23
1.32
Junior &
SatisfactiodSD
5.05 1 1.30
5.33 I 1.62
4.82 I 1.71
4.94 I 1.69
5.27 I 1.64
4.92 I 1.63
5.01 I 1.54
5.05 I 1.50
Technical Colleges
Performance Gap
1.06
0.86
1.11
1.14
0.99
1.13
1.00
1.16

k Cuesta Coll Fall 1998
s Report ege - Composite
Satisfaction vTM
A Key Message to Campus Leaders
This report offers a unique and comprehensive view of your students' perceptions regarding your institution.
In it, you'll learn how satisfied your students are and what's most important to them - a combination that pinpoints your institution's strengths and areas in need of improvement.
Specifically, you'll learn the answers to questions such as:
which aspects of campus do your students care about most?
which aspects of your campus do students find most and least satisfj.ing?
how can you best meet student expectations?
how do your students' responses compare with students' responses at institutions similar to your own?
1 how do your students' responses compare with the strengths and priorities for action identified by faculty, staff, and administrators? (This applies if your insti- tution used both the Student Satisfaction Inventory and the Institutional Priori- ties Survey.)
In essence, you have in your hands a blueprintfor improving your institution; effective- ness. You can use this information to identifj. institutional strengths that should be highlighted in student recruitment; to accelerate your student retention initiatives; to advance your efforts in strategic planning, self-studies for accreditation, and total quality management; and to align your budget decisions with your students' priori- ties. You'll also find it is well worth your while to share the report's findings as encouragement and feedback to your faculty, staff and students.
To get the most value from student satisfaction studies, we recommend that you compare your students' perceptions over time. Annual surveying allows you to provide systematic feedback to your internal and external constituents on the effec- tiveness of all campus programs and services. You will have the information needed to assess the effectiveness of your special initiatives and to determine priorities for current student populations.
Now on to the report!
Copyright 1997, USA Group Noel-Levitz, Inc.
'L Contents
I. Introduction
About the Student Satisfaction Inventory ........................................ p. 1-1
........................................................ How to Interpret Your Results p. 1-7
II. The Findi~igs
Demographic Summary .................................................................. p. 2- 1 A projLe of the students who participated in this study
Scale Summary Graphs ................................................................... p. 2-3 A quick overview of thejndings, clustered by I 2 major scales
Institutional Summary .................................................................. p. 2-6 An item-by-item review of student responses
Summary Items .............................................................................. p. 2-40 Another Look at student satisfaction
Ill. Setting Priorities and Direction ....................................................... p. 3-1
IV. Target Group Reports
If requested, this section includes special Target Group Reports focusing on specific student populations.
Copyright 1997, USA Group Noel-Levitz, Inc.
ident Satisfaction ventoryTM
About the Student Satisfaction InventoryTM
The Student Satisfaction Inventory measures students' satisfaction with a wide range of college experiences. Principles of consumer theory serve as the basis for the inventory's construction. Therefore, students are viewed as consumers who have a choice about whether to invest in education and where to enroll. In addition, stu- dents are seen as individuals who have definite expectations about what they want from their campus experience. From this perspective, satisfaction with college occurs when an expectation is met or exceeded by an institution.
Students rate each item in the inventory by the importance of the specific expectation as well as their satisfaction with how well that expectation is being met. A perfor- mance gap is then determined by the difference in the importance rating and the satisfaction rating. Items with large performance gaps indicate areas on campus where students perceive their expectations are not being met adequately.
Because the Student Satisfaction Inventory results in three different scores for each item, a significant amount of information is generated for institutional decision makers. Importance score ratings reflect how strongly students feel about the expecta- tion (the higher the score, the more important it is to a student, hence the stronger the expectation). Satisfaction ratings show how satisfied students are that your institution has met the expectation (the higher the score, the more satisfied the student). Performance gap scores (importance rating minus satisfaction rating) show how well you are meeting the expectation overall. A large performance gap score for an item (e.g., 1.5) indicates that the institution is not meeting students' expectations, whereas a small or zero gap score (e.g., .50) indicates that an institution is meeting students' expectations, and a negative gap score (e.g., -.25) indicates that an institu- tion is exceeding students' expectations.
In addition to the information provided by the three measurements for each item, inventory composite scales offer a global perspective of your students' responses. The scales provide a good overview of your institution's strengths and areas in need of improvement.
Three versions of the inventory are available: the Community, Junior and Technical College version, the 4-Year College and University version, and the 2-year Career and Private School version. Each version captures the unique features of the type of institution for which it was developed. At the end of this report, you'll find the version of the instrument your campus used.
Student responses are compared to corresponding national groups as follows: 4-year private institutions are compared with other 4-year private institutions, 4-year public institutions are compared with other 4-year public institutions, community, junior
Copyright 1997, USA Group Noel-Levitz, Inc.
and technical colleges are compared with other community, junior and technical d institutions, and 2-year career and private schools are compared with other career and private schools.
The ltenis
The Student Satisfaction Inventory collects student feedback on over 100 items. Included are:
70 items of expectation for community, junior and technical colleges and career and private schools
OR
73 items of expectation for 4-year colleges and universities
10 optional items that may be defined by the institution
6 items that assess the institution's commitment to specific student populations
W 9 items that assess pre-enrollment factors
3 summary items that assess overall satisfaction with the institution
13 demographic items that identify demographic characteristics of respondents
2 optional items that further identify the demographic characteristics of respon- dents (you can have students record their major or program, plus one other demographic characteristic of your choosing).
The Scales Community, Junior and Technical College Version and Career and Private School Wrsion
For the community, junior and technical college and career and private school versions of the inventory, 70 items of expectation and 6 items that assess the institution's commitment to specific student populations are analyzed statistically and conceptually to provide the following 12 composite scales:
Academic Advising and Counseling Efectiveness assesses the comprehensiveness of your academic advising program. Academic advisors and counselors are evaluated on the basis of their knowledge, competence, and personal concern for student success, as well as on their approachability.
Academic Services assesses services students utilize to achieve their academic goals. These services include the library, computer labs, tutoring, and study areas.
Admissions and Financial Aid Efectiveness assesses your institution's ability to enroll students in an effective manner. This scale covers issues such as competence and knowledge of admissions counselors, as well as the effectiveness and availability of financial aid programs.
Copyright 1997, USA Group Noel-Levitz, Inc.
Campus Climate assesses the extent to which your institution provides experiences that promote a sense of campus pride and feelings of belonging. This scale also assesses the effectiveness of your institution's channels of communication for students.
Campus Support Services assesses the quality of your support programs and services that students utilize to make their educational experiences more meaningful and productive. This scale covers career services, orientation, child care, and special programs such as Veterans' Services and support services for displaced homemakers.
Concern for the Individual assesses your institution's commitment to treating each student as an individual. Those groups who frequently deal with students on a personal level (e.g., faculty, advisors, counselors) are included in this assessment.
Instructional Efectiveness assesses your students' academic experience, the curriculum, and the campus's overriding commitment to academic excellence. This comprehensive scale covers areas such as the variety of courses offered, the effectiveness of your faculty in and out of the classroom, and the effectiveness of your adjunct faculty and graduate teaching assistants.
Reg;Ftration Efectiveness assesses issues associated with registration and billing. This scale also measures your institution's commitment to making this process as smooth and effective as possible.
Responsiveness to Diverse Populations assesses your institution's commitment to specific groups of students enrolled at your institution, e.g., under-represented populations, students with disabilities, commuters, part-time students, and older, returning learners.
Safety and Security assesses your institution's responsiveness to students' personal safety and security on your campus. This scale measures the effectiveness of both security personnel and campus facilities.
Service Excellence assesses the attitude of staff toward students, especially front-line st&. This scale pinpoints the areas of your campus where quality service and personal concern for students are rated most and least favorably.
Student Centeredness assesses your campus's efforts to convey to students that they are important to the institution. This scale measures your institution's attitude toward students and the extent to which they feel welcome and valued.
Some items on the inventory contribute to more than one scale. In addition, four items (numbers 3, 9, 53, and 68) are not included in any of the two-year scales.
Copyright 1997, USA Group Noel-Levitz, Inc.
The Scales C E u r College and University Version
For the 4-year college and university version of the inventory, 73 items of expectation and 6 items that assess the institution's commitment to specific student populations are analyzed statistically and conceptually to provide the following 12 composite scales:
Academic Advising Efectiveness assesses the comprehensiveness of your academic advising program. Academic advisors are evaluated on the basis of their knowledge, competence and personal concern for student success, as well as on their approachability.
Campus Climate assesses the extent to which your institution provides experiences that promote a sense of campus pride and feelings of belonging. This scale also assesses the effectiveness of your institution's channels of communication for students.
Campus Life assesses the effectiveness of student life programs offered by your institution, covering issues ranging from athletics to residence life. This scale also assesses campus policies and procedures to determine students' perceptions of their rights and responsibilities.
Campus Support Services assesses the quality of your support programs and services which students utilize in order to make their educational experiences more meaningful and productive. This scale covers areas such as tutoring, the adequacy of the library and computer labs, and the availability of academic and career services.
Concern for the Individual assesses your institution's commitment to treating each student as an individual. Those groups who frequently deal with students on a personal level (e.g., faculty, advisors, counselors, residence hall staff) are included in this assessment.
Instructional Efectivmess assesses your students' academic experience, your curriculum, and your campus's overriding commitment to academic excellence. This comprehensive scale covers areas such as the variety of courses offered, the effectiveness of your faculty in and out of the classroom, and the effectiveness of your adjunct faculty and gaduate teaching assistants.
Recruitment and Financial Aid Efectiveness assesses your institution's ability to enroll students in an effective manner. This scale covers issues such as competence and knowledge of admissions counselors, as well as the effectiveness and availability of financial aid programs.
Copyright 1997, USA Group Noel-Levitz, Inc.
Registration Effectiveness assesses issues associated with registration and billing. This scale also measures your institution's commitment to making this process as smooth and effective as possible.
Responsiveness to Diverse Populations assesses your institution's commitment to specific groups of students enrolled at your institution, e.g., under-represented populations, students with disabilities, commuters, part-time students, and older, returning learners.
Safety and Security assesses your institution's responsiveness to students' personal safety and security on your campus. This scale measures the effectiveness of both security personnel and campus facilities.
Service EjcceZhce assesses the perceived attitude of your st& toward students, especially front-line staff. This scale pinpoints the areas of your campus where quality service and personal concern for students are rated most and least favorably.
StEldent Centeredness assesses your campus's efforts to convey to students that they are important to your institution. This scale measures the extent to which students feel welcome and valued.
Some items on the inventory contribute to more than one scale. In addition, there are two items (numbers 35 and 72) that are not included in any of the fouryear scales.
- - -
Reliability and Validity
The Student Satisfaction Inventory is a very reliable instrument. Both the two-year and four-year versions of the SSI show exceptionally high internal reliability. Cronbach's coefficient alpha is .97 for the set of importance scores and is .98 for the set of satisfaction scores. It also demonstrates good score reliability over time; the three-week, test-retest reliability coefficient is .85 for importance scores and .84 for satisfaction scores.
There is also evidence to support the validity of the Student Satisfaction Inventory. Convergent validity was assessed by correlating satisfaction scores from the SSI with satisfaction scores from the College Student Satisfaction Questionnaire (CSSQ), another statistically reliable satisfaction instrument. The Pearson correlation between these two instruments (r=.71; p<.00001) is high enough to indicate that the SSI's satisfaction scores measure the same satisfaction construct as the CSSQ's scores, and yet the correlation is low enough to indicate that there are distinct differences be- tween the two instruments.
Copyright 1997, USA Group Noel-Levitz, Inc.
Tlie Inventory Authors
The Student Satisfaction Inventory was developed by Laurie A. Schreiner, Ph.D., and Stephanie L. Juillerat, Ph.D., with assistance from USA Group Noel-Levitz. Dr. Schreiner is professor of psychology at Eastern College in St. Davids, Pennsylvania, and Dr. Juillerat is assistant professor of psychology at Wesley College in Dover, Delaware.
A Word About USA Group Noel-Levitz
USA Group Noel-Levitz is the preeminent consulting firm in the nation that pro- vides comprehensive programs and services to colleges, universities, and postsecond- ary systems throughout the United States and Canada. Since its founding in 1984, the higher education professionals at Noel-Levitz have consulted directly with over 1,400 colleges and universities nationwide in the areas of:
student retention
staff and organizational development
student success
marketing and recruiting
enrollment management
strategic planning and resource development
institutional effectiveness.
Noel-Levitz has developed an array of proven tools including software programs, diagnostic tools and instruments, videotape-based training programs, and customized consultations, workshops, and national conferences. With the Student Satisfaction Inventory and the Institutional Priorities Survey, the firm brings together its many years of research and campus-based experience to enable you to get to the heart of your campus agenda.
Our alliance with the USA Group family of companies has linked our content expertise to new technologies and services that together ensure top results for our clients.
For more information, contact:
USA Group Noel-Levitz Phone: 3 19-337-4700 or 800-876- 1 1 17 2 10 1 ACT Circle FAX: 3 19-337-5274 Iowa City, Iowa 52245-9581 E-Mail: [email protected]
Copyright 1997, USA Group Noel-Levitz, Inc.
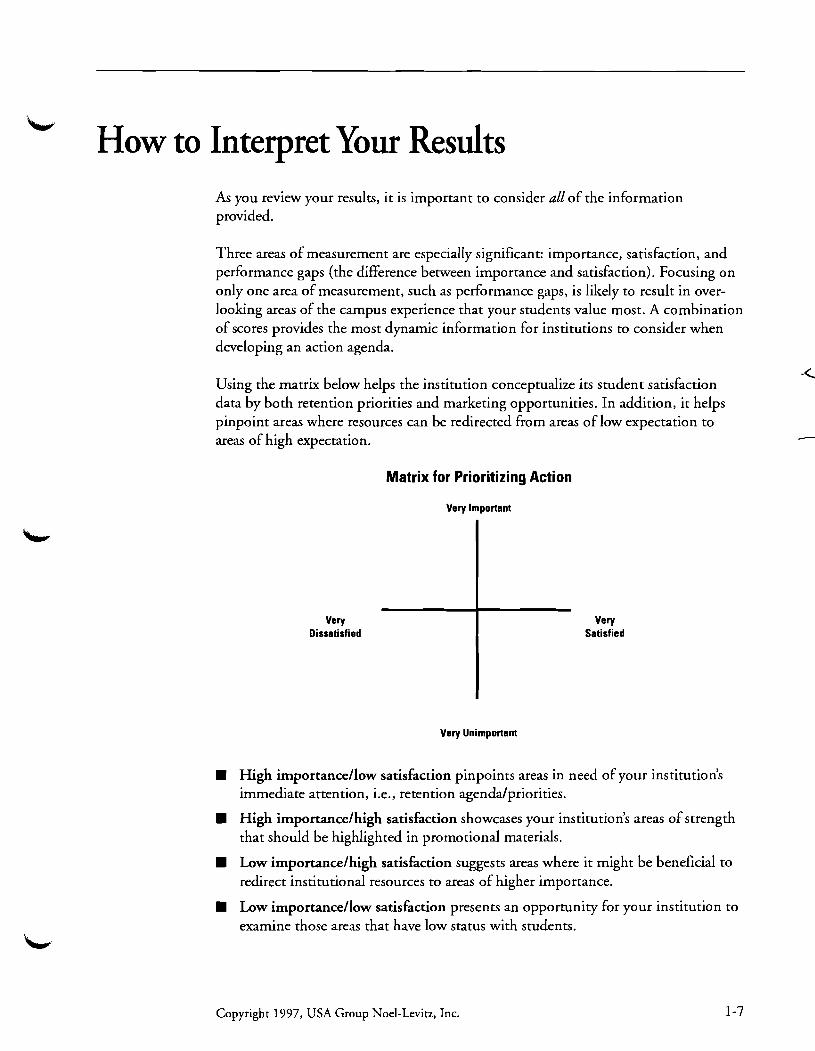
How to Interpret Your Results As you review your results, it is important to consider all of the information provided.
Three areas of measurement are especially significant: importance, satisfaction, and performance gaps (the difference between importance and satisfaction). Focusing on only one area of measurement, such as performance gaps, is likely to result in over- looking areas of the campus experience that your students value most. A combination of scores provides the most dynamic information for institutions to consider when developing an action agenda.
Using the matrix below helps the institution conceptualize its student satisfaction data by both retention priorities and marketing opportunities. In addition, it helps pinpoint areas where resources can be redirected from areas of low expectation to areas of high expectation.
Very Dissatisfied
Very Unimportant
High importancetlow satisfaction pinpoints areas in need of your institution's immediate attention, i.e., retention agendatpriorities.
High importancethigh satisfaction showcases your institution's areas of strength that should be highlighted in promotional materials.
Low importancethigh satisfiction suggests areas where it might be beneficial to redirect institutional resources to areas of higher importance.
Matrix for Prioritizing Action
Very Important
Very Satisfied
Low importance/low satisfaction presents an opportunity for your institution to examine those areas that have low status with students.
Copyright 1997, USA Group Noel-Levitz, Inc.
The national comparison scores indicated throughout the report are for institutions d similar to your own. For example, if you are a 4-year private institution, your scores are compared to 4-year private institutions. The national comparison scores are specific to 4-year private institutions, 4-year public institutions, community, junior and technical colleges, or to 2-year career and private schools.
Each section of the Campus Report has a distinct purpose, as described below.
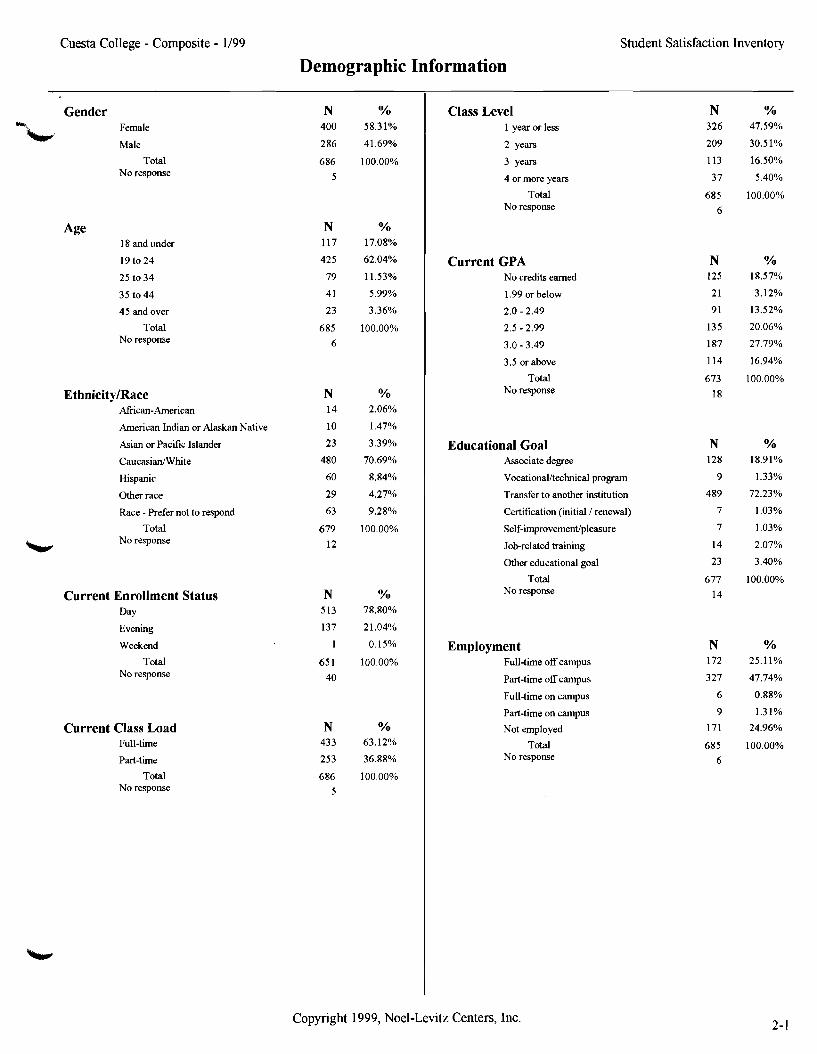
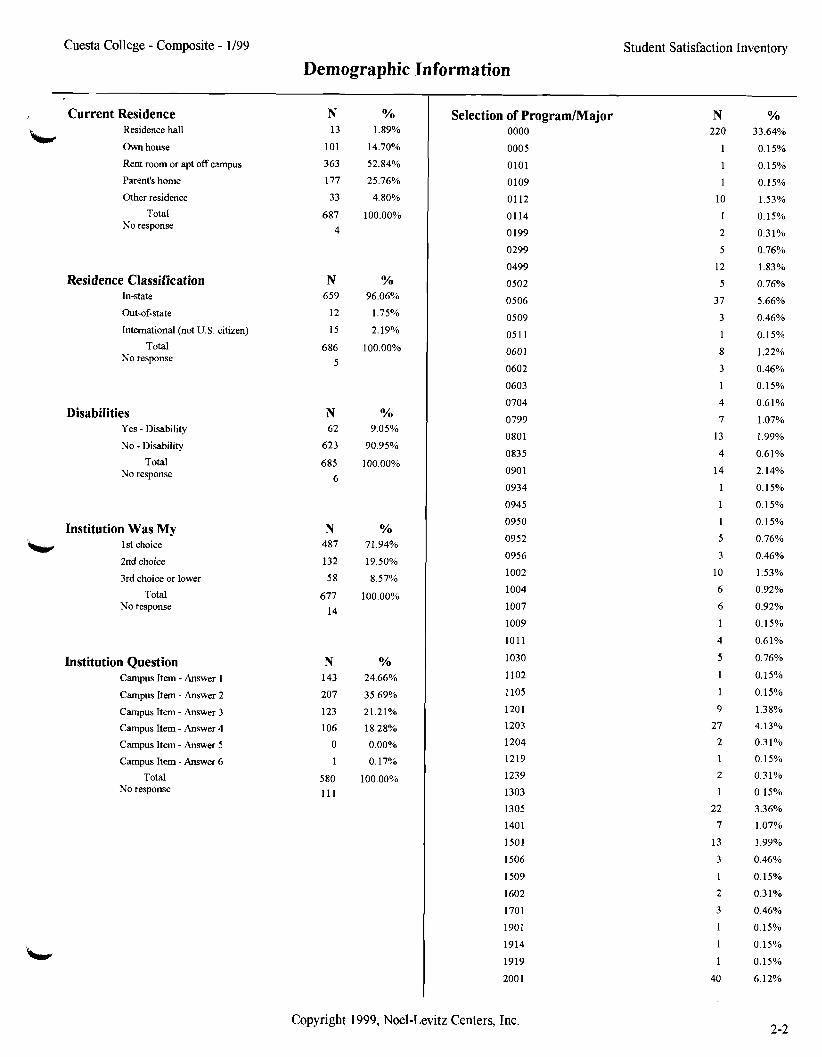
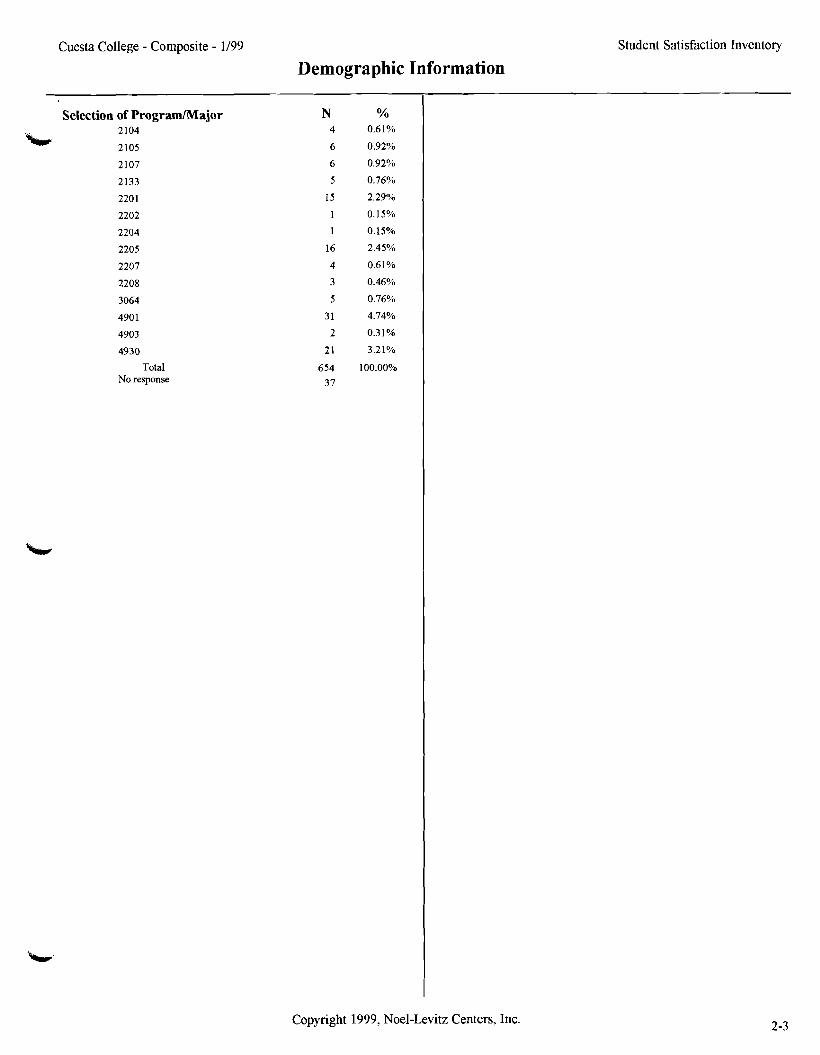
Demographic Summary
The two-page Demographic Summary reveals your students' responses to 13 standard demographic items and to two optional items your institution may have defined. Frequency and percentage scores are reported for each item. To learn how the op- tional items were defined, please consult your institution's inventory administrator.
Scale Summary Graphs
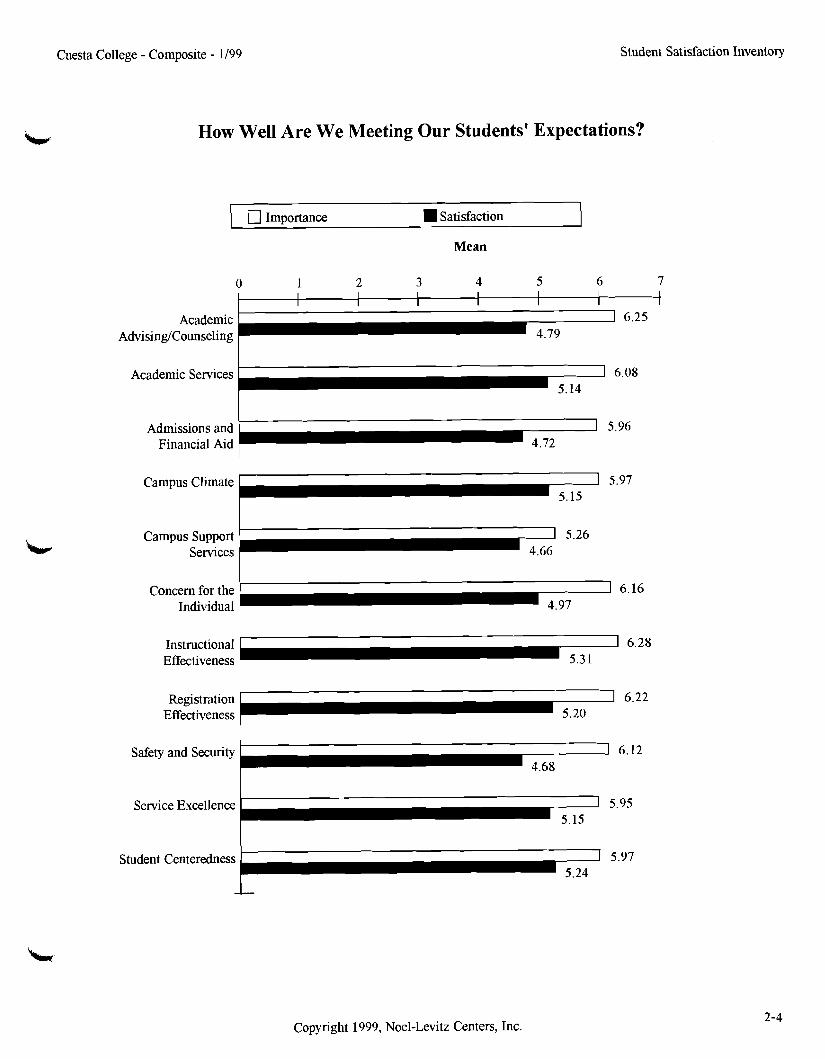
The three Scale Summary Graphs provide a visual display of the importance and satisfaction means for the inventory scales. Each scale mean is calculated by summing each respondent's item ratings to get a scale score, adding all respondents' scale scores, and dividing the sum of the scale scores by the number of respondents.
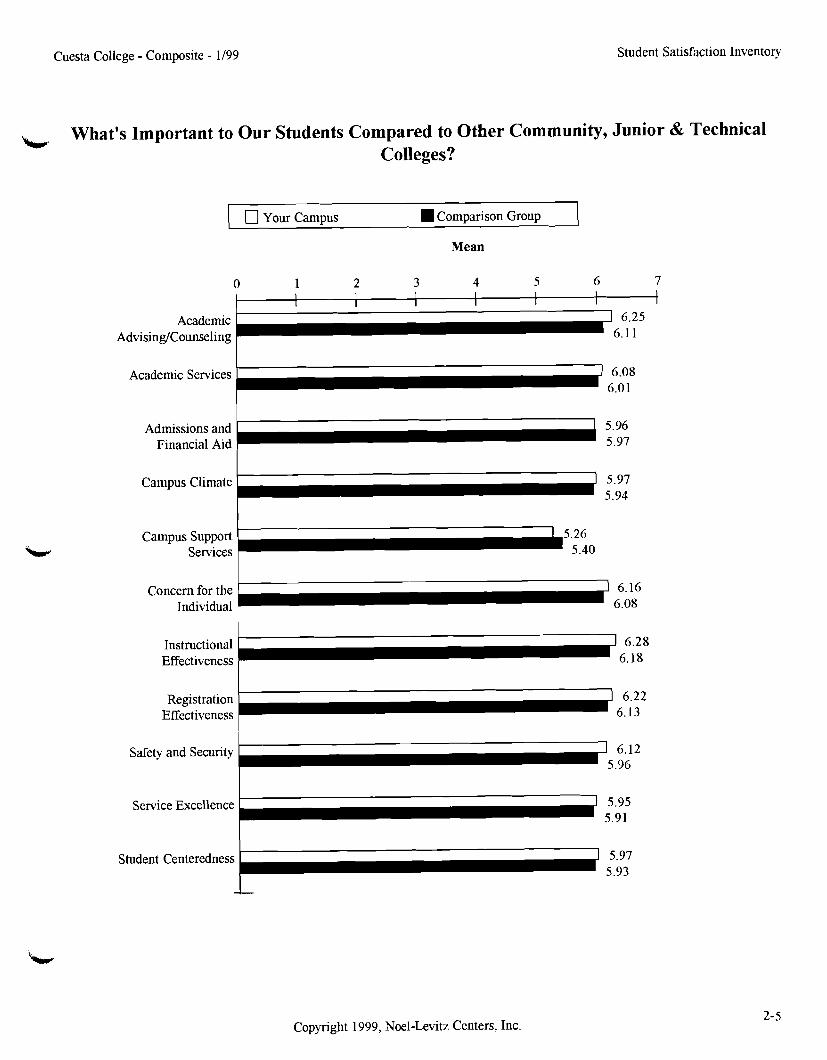
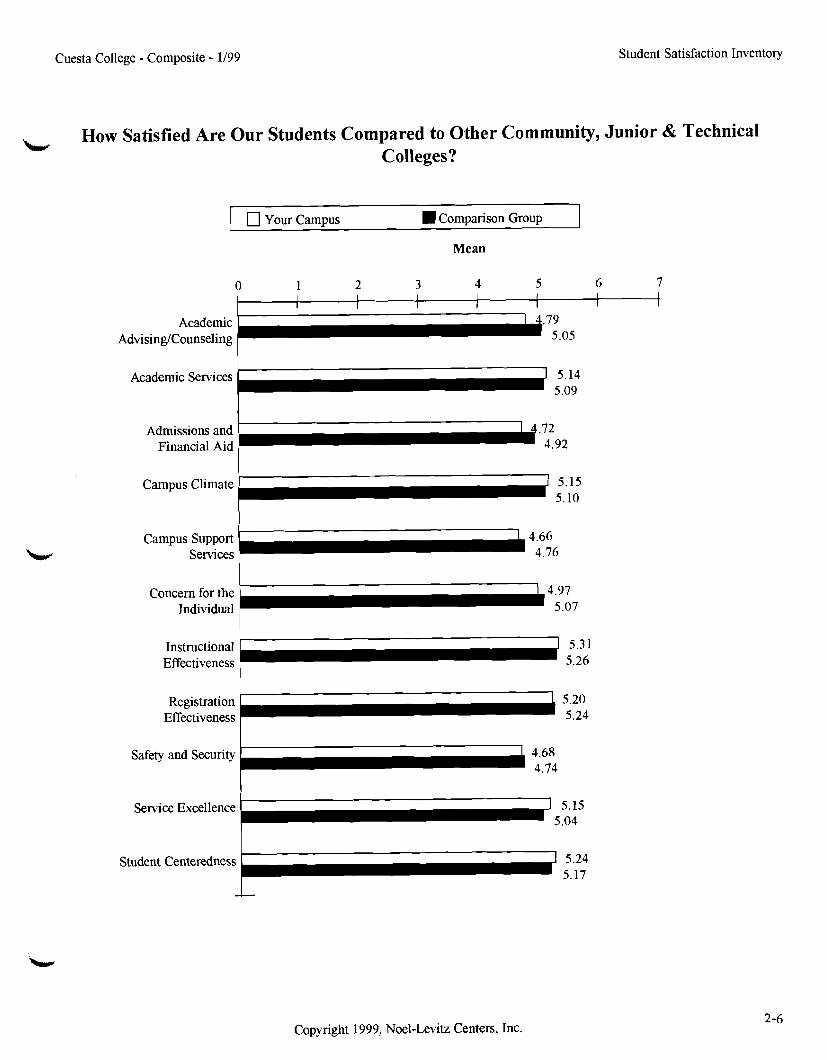
The graphs show levels of importance and satisfaction for the scales. Graph 1 allows you to compare the importance and satisfaction ratings for each scale for your institu- tion. Using Graphs 2 and 3, you can compare your campus's scores to the national comparison group.
Institutional S~~mmary
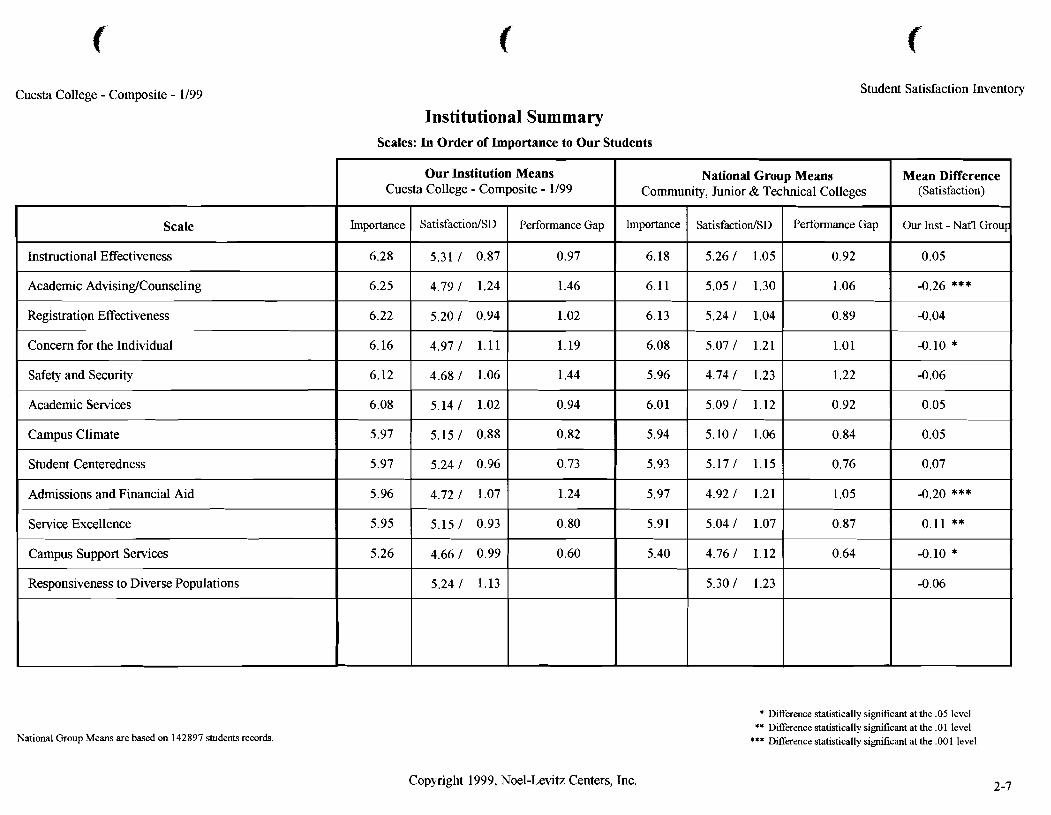
This section of the report presents all inventory data in a traditional chart format. The three areas of measurement for each scale and item - importance, satisfaction, and performance gap - for your institution's data are presented alongside those of the national comparison group. In addition, standard deviations (variability of responses) are presented for the satisfaction means for both your institution and the national group.
Copyright 1997, USA Group Noel-Levitz, Inc.
The last column shows the difference between your institution's satisfaction means and the national group satisfaction means. If the mean difference in these scores is a positive number, then your students are more satisfied than the students in the national comparison group. If the mean difference is a negative number, your stu- dents are less satisfied than the students in the national comparison group.
The statistical significance in the difference of these means has also been calculated. The key for the levels of significance appears at the bottom of each page. The greater the number of asterisks, the greater the confidence in the significance of this differ- ence, and the greater the likelihood that this did not occur by chance. For example, statistical significance at the .05 level indicates that there are five chances in 100 that the difference between your institution's satisfaction score and the national compari- son group satisfaction score would occur due to chance alone. The .0 1 level indicates a one in 100 chance and the .00l level indicates a one in 1000 chance.
Means for importance and satisfaction are calculated by summing respondents' ratings and dividing by the number of respondents. The performance gap means are calculated by taking the difference between the importance rating and the satisfaction rating.
Four charts are included in this section:
Chart 1 shows the scales in order of importance, beginning with the scale your students deemed most important.
Chart 2 shows the items in order of importance, beginning with the item your students deemed most important, including your campus-defined items, if utilized by your institution.
Chart 3 shows the scales in alphabetical order, accompanied by a list of the items included in each scale.
Chart 4 shows all of the inventory items in sequence, including your campus- defined items, if utilized by your institution.
Please note:
Importance data are not collected for the six Responsiveness to Diverse Population items.
Satisfaction data are not collected for the six pre-enrollment items.
National comparison data are not available for campus-defined items.
Copyright 1997, USA Group Noel-Levitz, Inc.
Summary Items
This brief section measures overall student satisfaction with your campus by revealing the extent to which students perceive their expectations have been met, their overall level of satisfaction, and the likelihood that they would enroll again at your institu- tion if they had it to do all over again. The means and standard deviations for both your campus and the national group are reported along with the differences between the two means.
Target Group Reports
Optional Target Group Reports, if requested by your institution, appear in one of two formats described below. These reports focus on specific groups of students on your campus. The target groups are defined by the items in the Demographic Sum- mary section of this report.
The first Target Group Report format, the Comparative Summary Analysis, offers a quick synopsis of the scores for your chosen target goup(s). At a glance, you can compare your overall campus scores with such groups as males, females, full-time, part-time, day, evening, first-year, second-year, and any other group for whom you have demographic data. Scale results are presented in alphabetical order, followed by item results in order of importance to students at your institution. For easy reference, you'll also see your overall campus scores alongside the composite national compari- son group. The national comparisons are specific to institutions like yours, but not specific to the target group.
The second Target Group Report format, the Single Group Analysis, is similar to the Campus Report but focuses on only one target group (e.g., female students, full-time students, evening students, or any other group for whom you have demographic data). Like the Campus Report, this analysis includes a demographic summary, a complete review of scale and items scores, and the summary items. The national comparison group data provided is for the selected target group at similar institu- tions. Example: if you selected part-time students and your national comparison group is community, junior and technical colleges, the Single Group Analysis will provide national comparison data for part-time students at other community, junior and technical colleges.
Copyright 1997, USA Group Noel-Levitz, Inc.
ndings
lent Satisfaction
Cuesta College - Composite - 1/99 Student Satisfaction Inventory
Demographic Information
Gender N % I Female
Male
Total No response
Age 18 and under
19 to24
25 to 34
35 to 44
45 and over
Total No response
EthnicityIRace African-American
American Indian or Alaskan Native
Asian or Pacific Islander
CaucasianIWhite
Hispanic
Other race
Race - Prefer not to respond
Total
h v No response
Current Enrollment Status Day Evening
Weekend
Total No response
Current Class Load Full-time
Part-time
Total No response 5
Class Level 1 year or less
2 years
3 years
4 or more years
Total No response
Current GPA No credits earned
1.99 or below
2.0 - 2.49
2.5 - 2.99
3.0 - 3.49
3.5 or above
Total No response
Educational Goal Associate degree
VocationaVtechnical program
Transfer to another institution
Certification (initial 1 renewal)
Self-improvement/pleasure
Job-related training
Other educational goal
Total No response
Employment Full-time off campus
Part-time off campus
Full-time on campus
Part-time on campus
Not employed
Total No response
Copyright 1999, Noel-Levitz Centers, Inc.
Cuesta College - Composite - 1/99 Student Satisfaction Inventory
Demographic Information
Current Residence
'1Cv Residence hall
Own house
Rent room or apt off campus
Parent's home
Other residence
Total No response
Residence Classification ln-state
Out-of-state
International (not U.S. citizen)
Total No response
Disabilities Yes - Disability
No - Disability
Total No response
Institution Was My 'crv 1st choice
2nd choice
3rd choice or lower
Total No response
Institution Question Campus Item - Answer 1
Campus Item - Answer 2
Campus Item - Answer 3
Campus Item - Answer 4
Campus Item - Answer 5
Campus Item - Answer 6
Total No response
N 'Yo
659 96.06%
12 1.75%
15 2.19%
686 100.00%
5
N 'Yo
487 71.94%
132 19.50%
5 8 8.57%
677 100.00%
Selection of Program/Major 0000
0005
0101
0109
01 12
0114
0199
0299
0499
0502
0506
0509
0511
0601
0602
0603
0704
0799
0801
0835
090 1
0934
0945
Copyright 1999, Noel-Levitz Centers, Inc.
Cuesta College - Composite - 1/99
Demographic Information Student Satisfaction Inventory
Selection of Program/Major 2104
2105
2107
2133
220 1
2202
2204
2205
2207
2208
3064
4901
4903
4930
Total No response
Copyright 1999, Noel-Levitz Centers, Inc.
Cuesta College - Composite - 1/99 Student Satisfaction Inventory
How Well Are We Meeting Our Students' Expectations?
I Importance Satisfaction I Mean
Academic Services 0.08
Academic AdvisinglCounseling
Admissions and 5.96 Financial Aid
1 6.25 4.79
Campus Climate 5 . Y l
Campus Support 5.26 Services
Concern for the 6.16 Individual
Instructional 6.28 Effectiveness
Safety and Security 6.12
Service Excellence 5.95
Student Centeredness 5.97
-
Copyright 1999, Noel-Levitz Centers, Inc.
Cuesta College - Composite - 1/99 Student Satisfaction Inventory
b What's Important to Our Students Compared to Other Community, Junior & Technical Colleges?
Your Campus Comparison Group
Mean
Academic Ad\rising/Counseling
Academic Senrices 6.08 6.01
Admissions and Financial Aid
Campus Climate 1-I :..;: Campus Support
Services
Concern for the 6.16
Individual 6.08
Instructional Effectiveness
Registration Eflect iveness -' 6y,iL
Safety and Security s 5 . Y
Scnice Excellence - ;;l' Student Centeredness 1-I ;A'
Copyright 1999, Noel-Levitz Centers, Inc.
Cuesta College - Composite - 1/99 Student Satisfaction Inventory
How Satisfied Are Our Students Compared to Other Community, Junior & Technical Colleges?
Your Campus Comparison Group
Mean
0 1 2 3 4 5 6 7 I I I I I I I I I I t
Academic Advising/Counseling
Academic Services - ::l Admissions and
Financial Aid -.?92
Campus Climate 5.10
Campus Support 1 1 4.66 Services 4.76
Concern for the Individual C 4.97 5.07
Instructional 1 -
1 5.31 Effectiveness 5.26
Registration ~..L[J
Effectiveness 5.24
Safety and Security 4.74
Service Excellence 1' 5;:)
Student Centeredness 1; :f;
Copyright 1999, Noel-Levitz Centers, Inc.
Cuesta College - Composite - 1199 Student Satisfaction Inventory
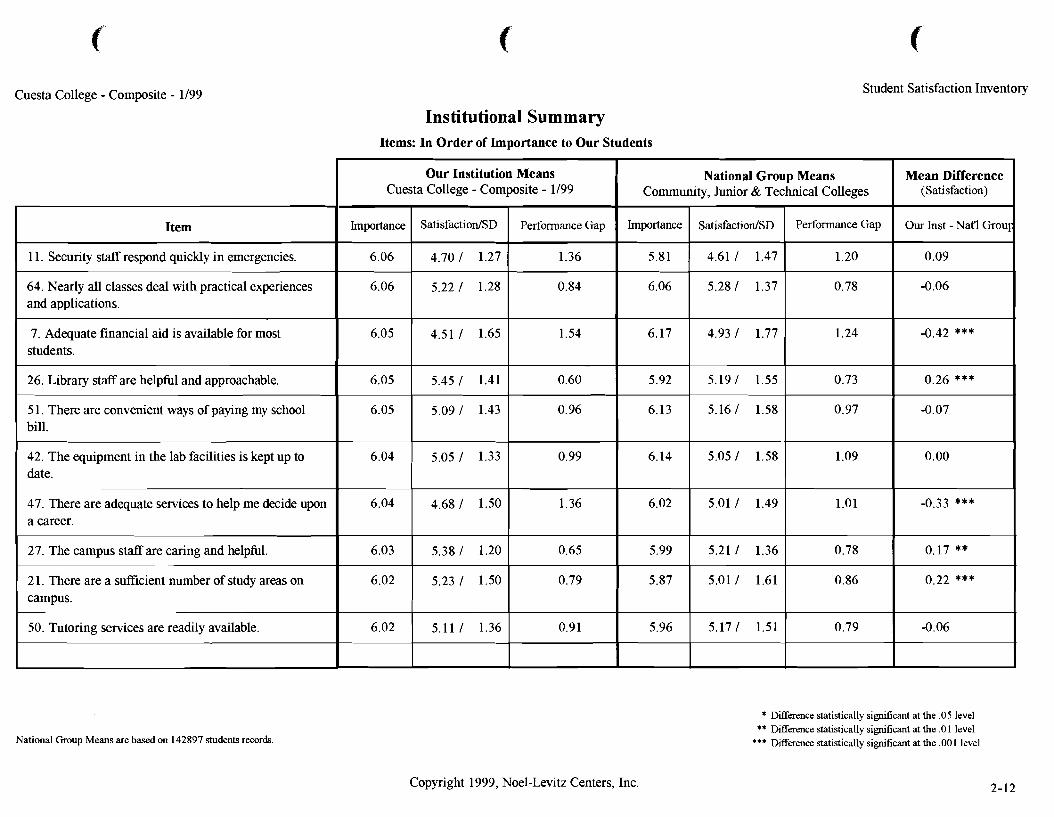
Institutional Summary Scales: In Order of Importance to Our Students
National Group Means are based on 142897 students records.
Scale
Instructional Effectiveness
Academic AdvisingICounseling
Registration Effectiveness
Concern for the Individual
Safety and Security
Academic Senices
Campus Climate
Student Centeredness
Admissions and Financial Aid
Service Excellence
Campus Support Senices
Responsiveness to Diverse Populations
Copyright 1999, Noel-Levitz Centers, Inc.
* Difference statistically significant at the .05 level ** Daerence statistically significant at the .O1 level
*** Difference statistically significant at the .OO 1 level
Our Institution Means Cuesta College - Composite - 1/99
Importance
6.28
6.25
6.22
6.16
6.12
6.08
5.97
5.97
5.96
5.95
5.26
Mean Difference (Satisfaction)
Our Inst - Nat'l Group
0.05
-0.26 ***
-0.04
-0.10 *
-0.06
0.05
0.05
0.07
-0.20 ***
0.11 **
-0.10 *
-0.06
National Group Means
SatisfactiodSD
5.31 1 0.87
4.79 I 1.24
5.20 1 0.94
4.971 1.11
4.68 1 1.06
5.14 1 1.02
5.15 1 0.88
5.24 1 0.96
4.72 1 1.07
5.15 I 0.93
4.66 I 0.99
5.24 1 1.13
Community,
Importance
6.18
6.11
6.13
6.08
5.96
6.01
5.94
5.93
5.97
5.91
5.40
Performance Gap
0.97
1.46
1.02
1.19
1.44
0.94
0.82
0.73
1.24
0.80
0.60
Junior &
SatisfactiodSD
5.26 1 1.05
5.05 1 1.30
5.24 1 1.04
5.07 1 1.21
4.74 / 1.23
5.09 / 1.12
5.10 I 1.06
5.17 1 1.15
4.92 1 1.21
5.04 1 1.07
4.76 I 1.12
5.30 / 1.23
Technical Colleges
Performance Gap
0.92
1.06
0.89
1.01
1.22
0.92
0.84
0.76
1.05
0.87
0.64
Student Satisfaction Inventory Cuesta College - Composite - 1/99
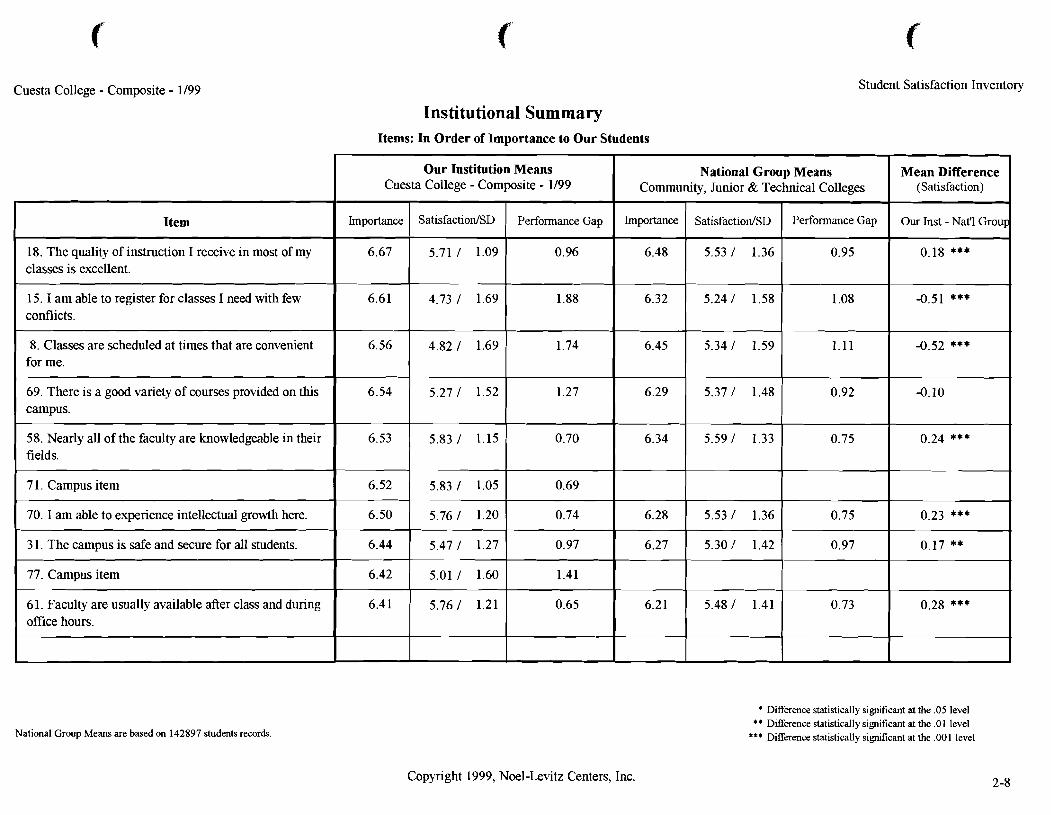
Institutional Summary Items: In Order of Importance to Our Students
National Group Means are based on 142897 students records.
Cuesta College - Composite - 1/99
Item
18. The quality of instruction I receive in most of my 6.67 5.71 / 1.09 0.96 6.48 5.53 / 1.36 classes is excellent.
15. I am able to register for classes I need with few 6.61 4.73 1 1.69 1.88 6.32 5.24 / 1.58 conflicts.
Copyright 1999, Noel-Levitz Centers, Inc.
8. Classes are scheduled at times that are convenient for me.
69. There is a good variety of courses provided on t h s campus.
58. Nearly all of the faculty are knowledgeable in their fields.
7 1. Campus item
70. I am able to experience intellectual growth here.
3 1. The campus is safe and secure for all students.
77. Campus item
6 1. Faculty are usually available after class and during office hours.
* Difference statistically significant at the .05 level ** DifFerence statistically significant at the .01 level
*** Difference statistically significant at the .001 level
6.56
6.54
6.53
6.52
6.50
6.44
6.42
6.41
4.82 / 1.69
5.27 / 1.52
5.83 / 1.15
5.83 / 1.05
5.76 / 1.20
5.47 / 1.27
5.01 / 1.60
5.76 / 1.21
1.74
1.27
0.70
0.69
0.74
0.97
1.41
0.65
6.45
6.29
6.34
6.28
6.27
6.2 1
5.34 / 1.59
5.37 1 1.48
5.59 / 1.33
5.531 1.36
5.30 / 1.42
5.48 / 1.41
1.11
0.92
0.75
0.75
0.97
0.73
-0.52 ***
-0.10
0.24 ***
0.23 ***
0.17 **
0.28 ***
Cuesta College - Composite - 1/99 Student Satisfaction Inventory
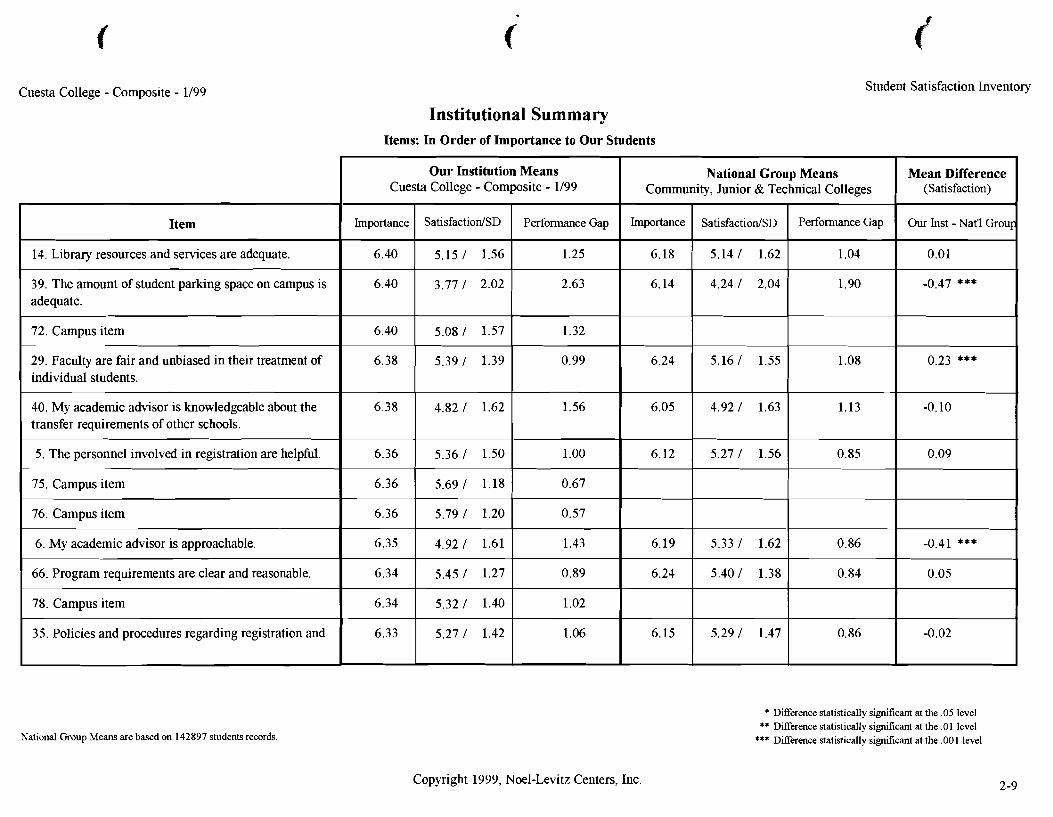
Institutional Summary Items: In Order of Importance to Our Students
National Group Means are based on 142897 students records.
Item
14. Library resources and senices are adequate.
39. The amount of student parking space on campus is adequate.
72. Campus item
29. Faculty are fair and unbiased in their treatment of individual students.
40. My academic advisor is knowledgeable about the transfer requirements of other schools.
5. The personnel involved in registration are helpful.
75. Campus item
76. Campus item
6. My academic advisor is approachable.
66. Program requirements are clear and reasonable.
78. Campus item
35. Policies and procedures regarding registration and
Copyright 1999, Noel-Levitz Centers, Inc.
* Difference statistically significant at the .05 level ** Difference statistically significant at the .O1 level
*** Difference statistically significant at the .OO 1 level
Our Institution Means Cuesta College - Composite - 1/99
Importance
6.40
6.40
6.40
6.38
6.38
6.36
6.36
6.36
6.35
6.34
6.34
6.33
Mean Difference (Satisfaction)
Our Inst - Nat'l Grou~
0.01
-0.47 ***
0.23 ***
-0.10
0.09
-0.41 ***
0.05
-0.02
National Group Means
SatisfactiodSD
5.15 / 1.56
3.77 / 2.02
5.08 / 1.57
5.39 / 1.39
4.82 / 1.62
5.36 / 1.50
5.691 1.18
5.79 / 1.20
4.921 1.61
5.45 / 1.27
5.32 / 1.40
5.27 / 1.42
Community,
Importance
6.18
6.14
6.24
6.05
6.12
6.19
6.24
6.15
Performance Gap
1.25
2.63
1.32
0.99
1.56
1.00
0.67
0.57
1.43
0.89
1.02
1.06
Junior &
SatisfactiodSD
5.14 / 1.62
4.24 / 2.04
5.16 / 1.55
4.92 / 1.63
5.27 / 1.56
5.33 / 1.62
5.40 / 1.38
5.29 / 1.47
Technical Colleges
Performance Gap
1.04
1.90
1.08
1.13
0.85
0.86
0.84
0.86
Student Satisfaction Inventory Cuesta College - Composite - 1/99
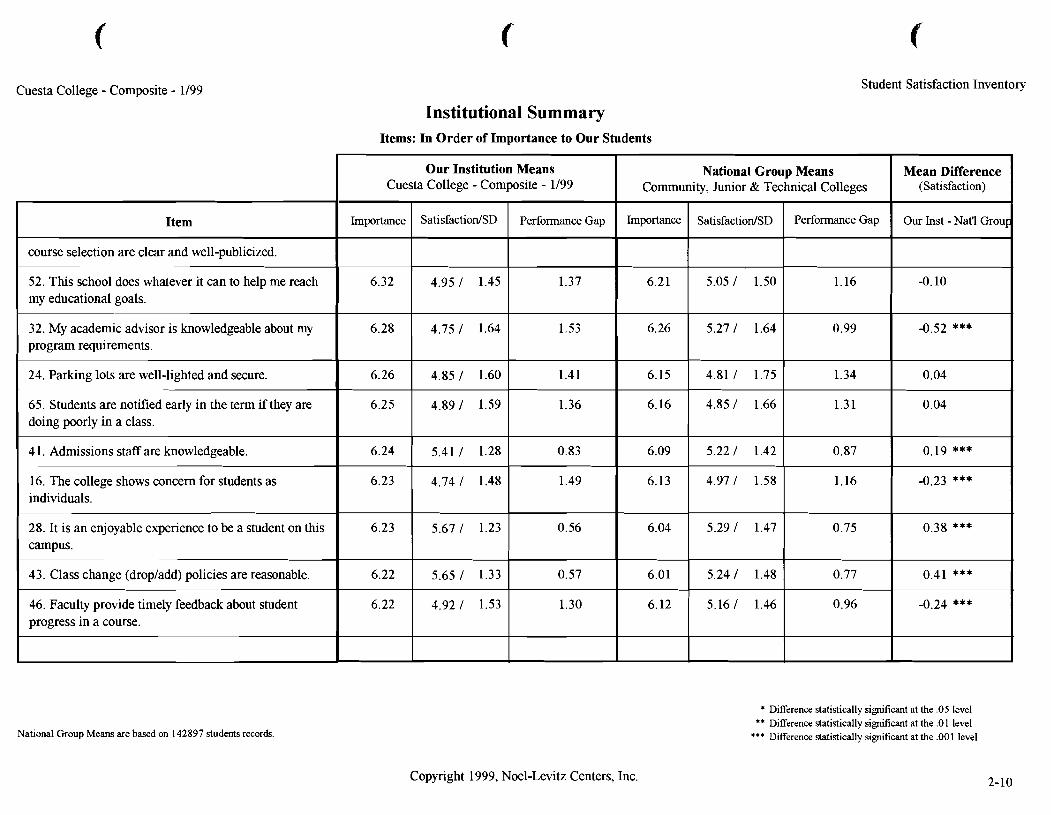
Institutional Summary Items: In Order of Importance to Our Students
National Group Means are based on 142897 students records.
Item
course selection are clear and well-publicized.
52. This school does whatever it can to help me reach my educational goals.
32. My academic advisor is knowledgeable about my program requirements.
24. Parking lots are well-lighted and secure.
65. Students are notified early in the term if they are doing poorly in a class.
4 1. Admissions staff are knowledgeable.
16. The college shows concern for students as individuals.
28. It is an enjoyable experience to be a student on t h s campus.
43. Class change (dropladd) policies are reasonable.
46. Faculty provide timely feedback about student progress in a course.
Copyright 1999, Noel-Levitz Centers, Inc.
* Difference statistically significant at the .05 level ** Difference statistically significant at the .O 1 level
*** Difference statistically significant at the ,001 level
Our Institution Means Cuesta College - Composite - 1/99
Importance
6.32
6.28
6.26
6.25
6.24
6.23
6.23
6.22
6.22
Mean Difference (Satisfaction)
Our Inst - Natl Grou~:
-0.10
-0.52 ***
0.04
0.04
0.19 ***
-0.23 ***
0.38 ***
0.41 ***
-0.24 ***
National Group Means
SatisfactionJSD
4.95 1 1.45
4.75 / 1.64
4.85 / 1.60
4.89 / 1.59
5.41 / 1.28
4.74 / 1.48
5.67 1 1.23
5.65 1 1.33
4.92 / 1.53
Community,
Importance
6.2 1
6.26
6.15
6.16
6.09
6.13
6.04
6.01
6.12
Performance Gap
1.37
1.53
1.41
1.36
0.83
1.49
0.56
0.57
1.30
Junior &
SatisfactionISD
5.05 1 1.50
5.27 / 1.64
4.81 / 1.75
4.85 1 1.66
5.22 / 1.42
4.97 / 1.58
5.29 1 1.47
5.24 / 1.48
5.161 1.46
Technical Colleges
Performance Gap
1.16
0.99
1.34
1.31
0.87
1.16
0.75
0.77
0.96
Cuesta College - Composite - 1/99 Student Satisfaction Inventory
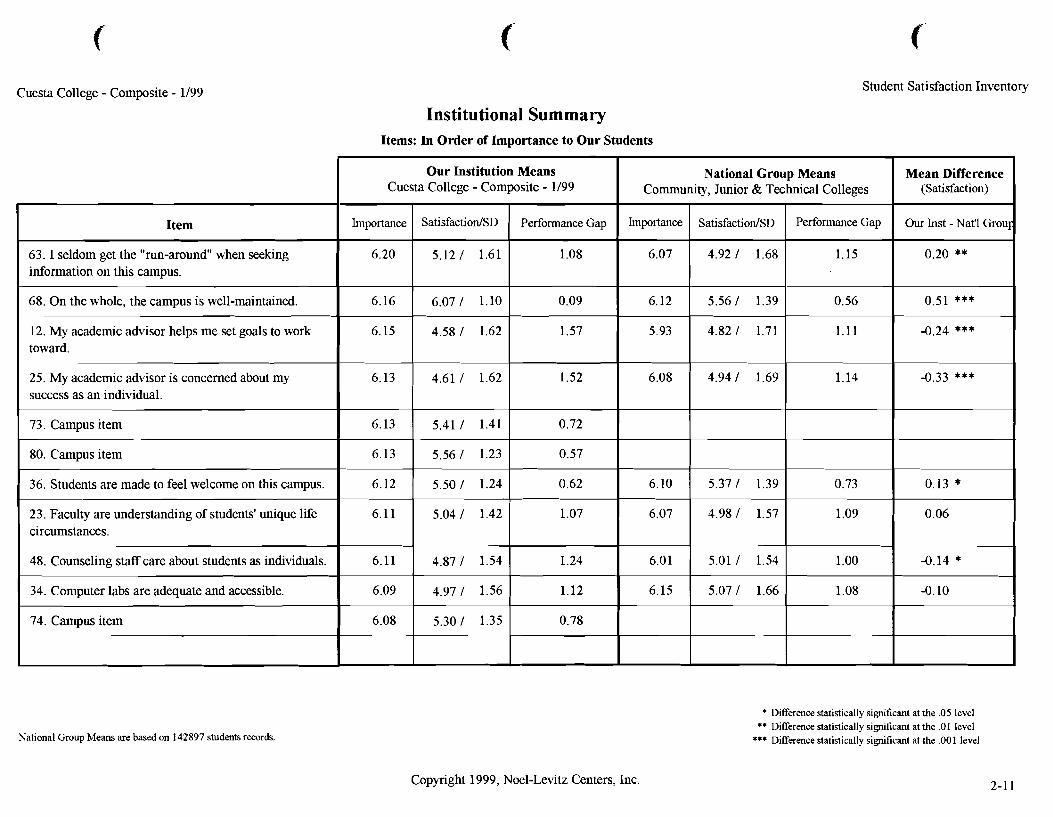
Institutional Summary Items: In Order of Importance to Our Students
National Group Means are based on 142897 students records.
Item
63. I seldom get the "run-around" when seelung information on this campus.
Copyright 1999, Noel-Levitz Centers, Inc.
* Difference statistically significant at the .05 level ** Difference statistically simcant at the .O1 level
*** Difference statistically significant at the ,001 level
Our Institution Means Cuesta College - Composite - 1/99
Importance
6.20
Mean Difference (Satisfaction)
Our Inst - Nat'l Group
0.20 **
National Group Means
68. On the whole, the campus is well-maintained.
12. My academic advisor helps me set goals to work toward.
25. My academic advisor is concerned about my success as an individual.
73. Campus item
80. Campus item
36. Students are made to feel welcome on this campus.
23. Faculty are understanding of students' unique life circumstances.
48. Counseling staff care about students as individuals.
34. Computer labs are adequate and accessible.
74. Campus item
0.51 ***
-0.24 ***
-0.33 ***
0.13 * 0.06
-0.14 *
-0.10
Community,
Importance
6.07
6.12
5.93
6.08
6.10
6.07
6.01
6.15
SatisfactionlSD
5.12 / 1.61
--- 6.07 / 1.10
4.58 / 1.62
4.61 / 1.62
5.411 1.41
5.56 / 1.23
5.50 / 1.24
5.04 / 1.42
4.87 / 1.54
4.97 / 1.56
5.30 / 1.35
6.16
6.15
6.13
6.13
6.13
6.12
6.11
6.11
6.09
6.08
Performance Gap
1.08
0.09
1.57
1.52
0.72
0.57
0.62
1.07
1.24
1.12
0.78
Junior &
SatisfactionJSD
4.92 / 1.68
5.56 / 1.39
4.82 / 1.71
4.94 / 1.69
5.37 / 1.39
4.98 / 1.57
5.01 / 1.54
5.07 / 1.66
Technical Colleges
Performance Gap
1.15
0.56
1.11
1.14
0.73
1.09
1.00
1.08
Cuesta College - Composite - 1/99 Student Satisfaction Inventory
Institutional Summary Items: In Order of Importance to Our Students
National Group Means are based on 142897 students records.
Item
1 1. Security staff respond quickly in emergencies.
64. Nearly all classes deal with practical experiences and applications.
7. Adequate financial aid is available for most students.
26. Library staff are helpful and approachable.
5 1. There are convenient ways of paying my school bill.
42. The equipment in the lab facilities is kept up to date.
47. There are adequate services to help me decide upon a career.
27. The campus staff are caring and helpful.
2 1. There are a sufficient number of study areas on campus.
50. Tutoring services are readily available.
Copyright 1999, Noel-Levitz Centers, Inc.
* Difference statistically sigdcant at the .05 level ** Difference statistically significant at the .O1 level
*** Difference statistically significant at the .001 level
Our Institution Means Cuesta College - Composite - 1/99
Importance
6.06
6.06
6.05
6.05
6.05
6.04
6.04
6.03
6.02
6.02
Mean Difference (Satisfaction)
Our Inst - Nat'l Grou~
0.09
-0.06
-0.42 ***
0.26 ***
-0.07
0.00
-0.33 ***
0.17 **
0.22 ***
-0.06
National Group Means Community,
Importance
5.81
6.06
6.17
5.92
6.13
6.14
6.02
5.99
5.87
5.96
SatisfactiodSD
4.70 / 1.27
5.22 1 1.28
4.51 / 1.65
5.45 / 1.41
5.09 / 1.43
5.05 / 1.33
4.68 / 1.50
5.38 / 1.20
5.23 / 1.50
5.11 / 1.36
Performance Gap
1.36
0.84
1.54
0.60
0.96
0.99
1.36
0.65
0.79
0.91
Junior &
SatisfactiodSD
4.61 / 1.47
5.28 / 1.37
4.93 / 1.77
5.19 / 1.55
5.16 / 1.58
5.05 / 1.58
5.011 1.49
5.21 / 1.36
5.01 / 1.61
5.17 / 1.51
Techrucal Colleges
Performance Gap
1.20
0.78
1.24
0.73
0.97
1.09
1.01
0.78
0.86
0.79
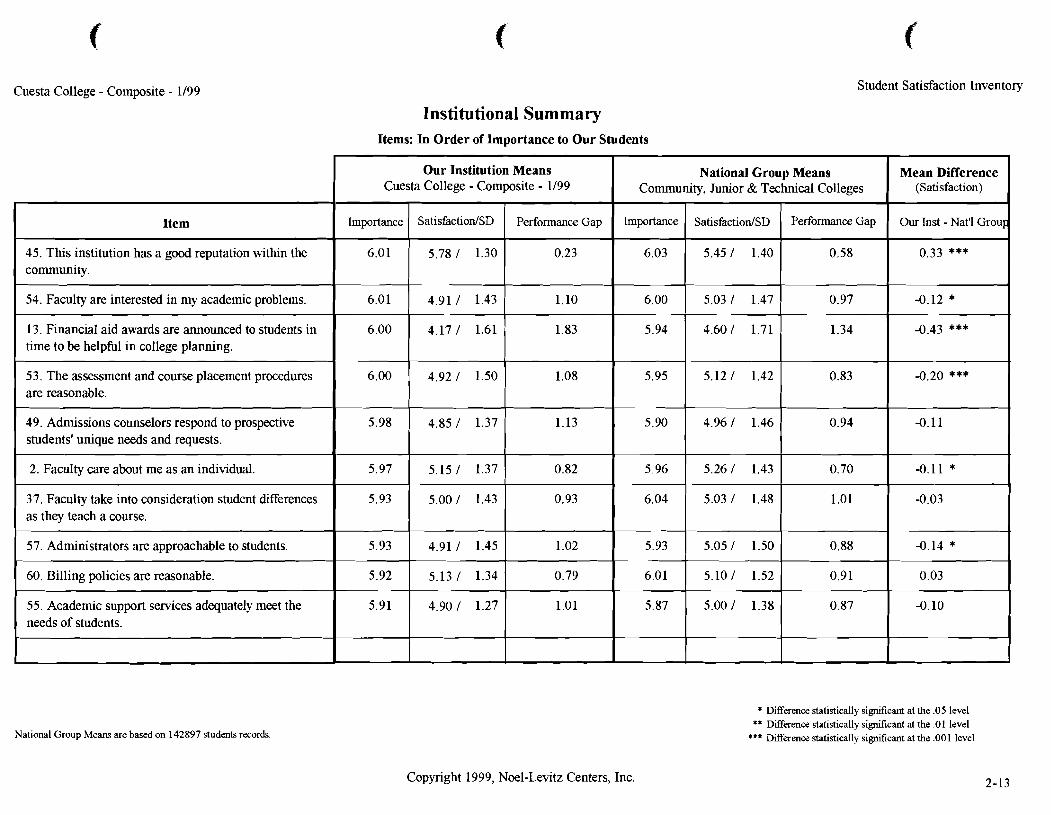
Student Satisfaction Inventory Cuesta College - Composite - 1/99
Institutional Summary Items: In Order of Importance to Our Students
National Group Means are based on 142897 students records.
Copyright 1999, Noel-Levitz Centers, Inc.
Our Institution Means Cuesta College - Composite - 1/99
* Difference statistically s i d ~ c a n t at the .05 level ** Difference statistically sigmf~cant at the .01 level
*** Difference statistically significant at the ,001 level
Mean Difference (Satisfaction)
Our Inst - Nat'l Group
0.33 ***
-0.12 *
-0.43 ***
-0.20 ***
-0.11
-0.11 *
-0.03
-0.14 *
0.03
-0.10
National Group Means
Item Importance
Community,
Importance -Pp-ppP
6.03
6.00
5.94
5.95
5.90
5.96
6.04
5.93
6.01
5.87
SatisfactlonJSD
5.78 / 1.30
4.91 / 1.43
4.17 / 1.61
4.92 / 1.50
4.85 / 1.37
5.15 / 1.37
5.00 / 1.43
4.91 / 1.45
5.13 / 1.34
4.90 1 1.27
45. This institution has a good reputation within the community.
54. Faculty are interested in my academic problems.
13. Financial aid awards are announced to students in time to be helpful in college planning.
5 3. The assessment and course placement procedures are reasonable.
49. Admissions counselors respond to prospective students' unique needs and requests.
2. Faculty care about me as an individual.
37. Faculty take into consideration student Werences as they teach a course.
57. Administrators are approachable to students.
60. Billing policies are reasonable.
55. Academic support services adequately meet the needs of students.
Performance Gap
0.23
1.10
1.83
1.08
1.13
0.82
0.93
1.02
0.79
1.01
6.01
6.01
6.00
6.00
5.98
5.97
5.93
5.93
5.92
5.91
Junior &
SatisfactionISD
5.45 / 1.40
5.03 / 1.47
4.60 1 1.71
5.12 / 1.42
4.96 / 1.46
5.26 / 1.43
5.03 / 1.48
5.05 / 1.50
5.10 / 1.52
5.00 / 1.38
Technical Colleges
Performance Gap
0.58
0.97
1.34
0.83
0.94
0.70
1.01
0.88
0.91
0.87
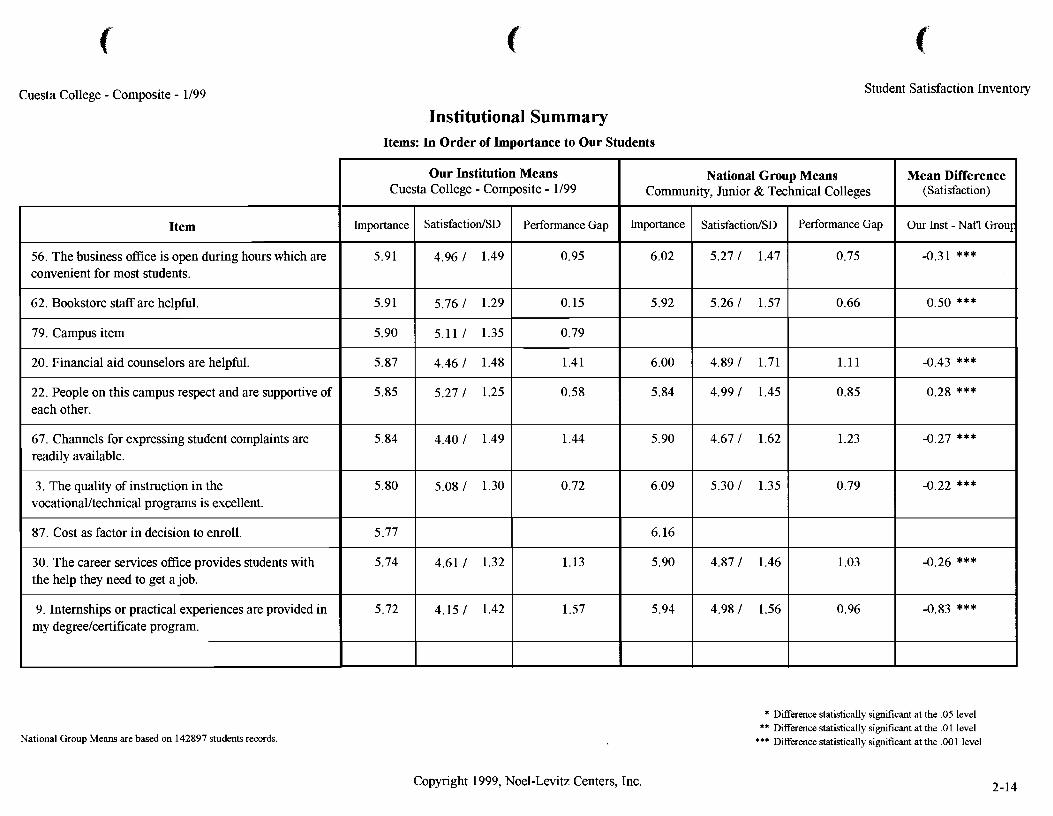
Cuesta College - Composite - 1/99 Student Satisfaction Inventory
Institutional Summary Items: In Order of Importance to Our Students
National Group Means are based on 142897 students records.
Item
56. The business office is open during hours which are convenient for most students.
62. Bookstore staff are helpful.
79. Campus item
20. Financial aid counselors are helpful.
22. People on t h s campus respect and are supportive of each other.
67. Channels for expressing student complaints are readily available.
3. The quality of instruction in the vocational/technical programs is excellent.
87. Cost as factor in decision to enroll.
30. The career services office provides students with the help they need to get a job.
9. Internships or practical experiences are provided in my degreelcertificate program.
Copyright 1999, Noel-Levitz Centers, Inc.
* Difference statistically significant at the .05 level ** Difference statistically simcant at the .O1 level
*** Ditference statistically significant at the .001 level
Our Institution Means Cuesta College - Composite - 1/99
Importance
5.91
5.91
5.90
5.87
5.85
5.84
5.80
5.77
5.74
5.72
Mean Difference (Satisfaction)
Our Inst - Nat'l G r o u ~
-0.31 ***
0.50 ***
-0.43 ***
0.28 ***
-0.27 ***
-0.22 ***
-0.26 ***
-0.83 ***
National Group Means
SatisfactiodSD
4.96 / 1.49
5.76 / 1.29
5.111 1.35
4.46 / 1.48
5.27 / 1.25
4.40 / 1.49
5.081 1.30
4.61 / 1.32
4.15 1 1.42
Community,
Importance
6.02
5.92
6.00
5.84
5.90
6.09
6.16
5.90
5.94
Performance Gap
0.95
0.15
0.79
1.41
0.58
1.44
0.72
1.13
1.57
Junior &
SatisfactiodSD
5.27 / 1.47
5.26 / 1.57
4.89 / 1.71
4.99 / 1.45
4.67 / 1.62
5.30 / 1.35
4.87 / 1.46
4.98 1 1.56
Technical Colleges
Performance Gap
0.75
0.66
1.11
0.85
1.23
0.79
1.03
0.96
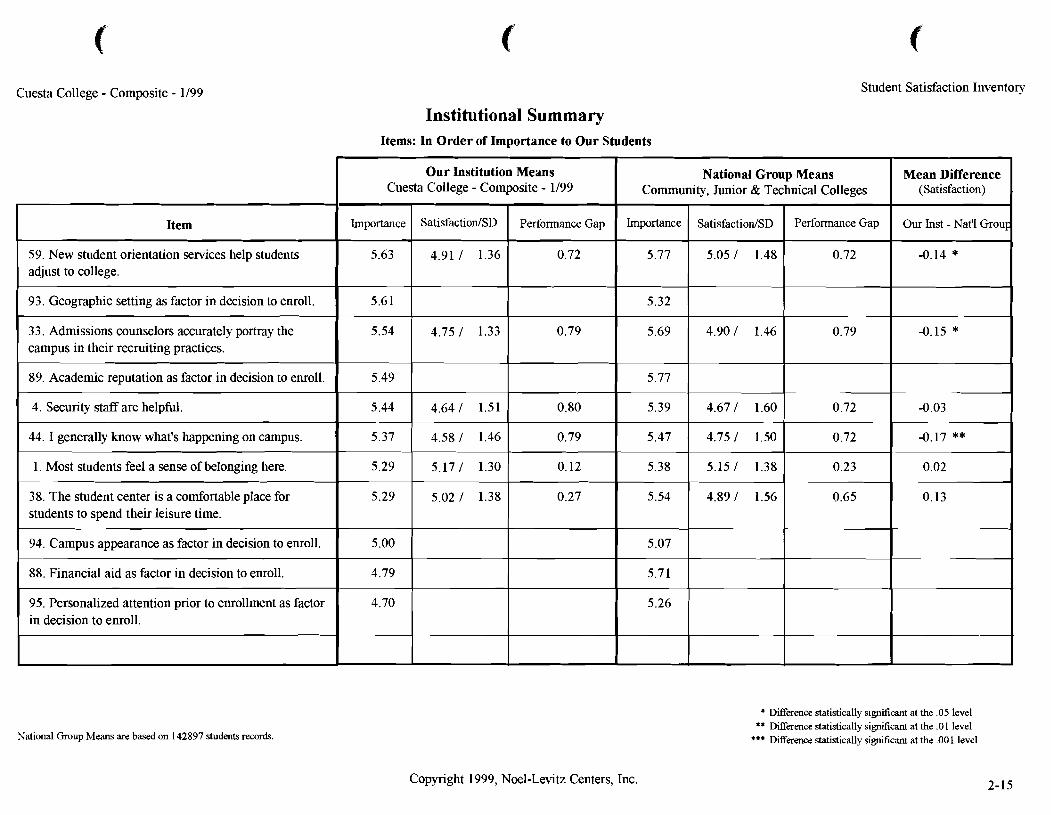
Cuesta College - Composite - 1/99 Student Satisfaction Inventory
Institutional Summary Items: In Order of Importance to Our Students
National Group Means are based on 142897 students records.
Copyright 1999, Noel-Levitz Centers, Inc.
Our Institution Means Cuesta College - Composite - 1/99
* Difference statistically si&cant at the .05 level ** Difference statistically significant at the .O I level
*** Difference statistically significant at the ,001 level
Mean Difference (Satisfaction)
Our Inst - Nat'l Grou~
-0.14 *
-0.15 *
-0.03
-0.17 **
0.02
0.13
National Group Means
Item Importance
Community,
Importance ------- 5.77
5.32
5.69
5.77
5.39
5.47
5.38
5.54
5.07
5.71
5.26
SatisfactionJSD
4.91 / 1.36
4.75 / 1.33
4.64 / 1.51
4.58 / 1.46
5.17 / 1.30
5.02 1 1.38
59. New student orientation services help students adjust to college.
93. Geographic setting as factor in decision to enroll.
3 3. Admissions counselors accurately portray the campus in their recruiting practices.
89. Academic reputation as factor in decision to enroll.
4. Security staff are helpful.
44. I generally know what's happening on campus.
1. Most students feel a sense of belonging here.
38. The student center is a comfortable place for students to spend their leisure time.
94. Campus appearance as factor in decision to enroll.
88. Financial aid as factor in decision to enroll.
95. Personalized attention prior to enrollment as factor in decision to enroll.
Performance Gap
0.72
0.79
0.80
0.79
0.12
0.27
5.63
5.6 1
5.54
5.49
5.44
5.37
5.29
5.29
5.00
4.79
4.70
Junior &
SatisfactioniSD
5.05 1 1.48
4.90 / 1.46
4.67 / 1.60
4.75 / 1.50
5.15 / 1.38
4.89 / 1.56
Technical Colleges
Performance Gap
0.72
0.79
0.72
0.72
0.23
0.65
Cuesta College - Composite - 1/99 Student Satisfaction Inventory
Institutional Summary Items: In Order of Importance to Our Students
National Group Means are based on 142897 students records.
Item
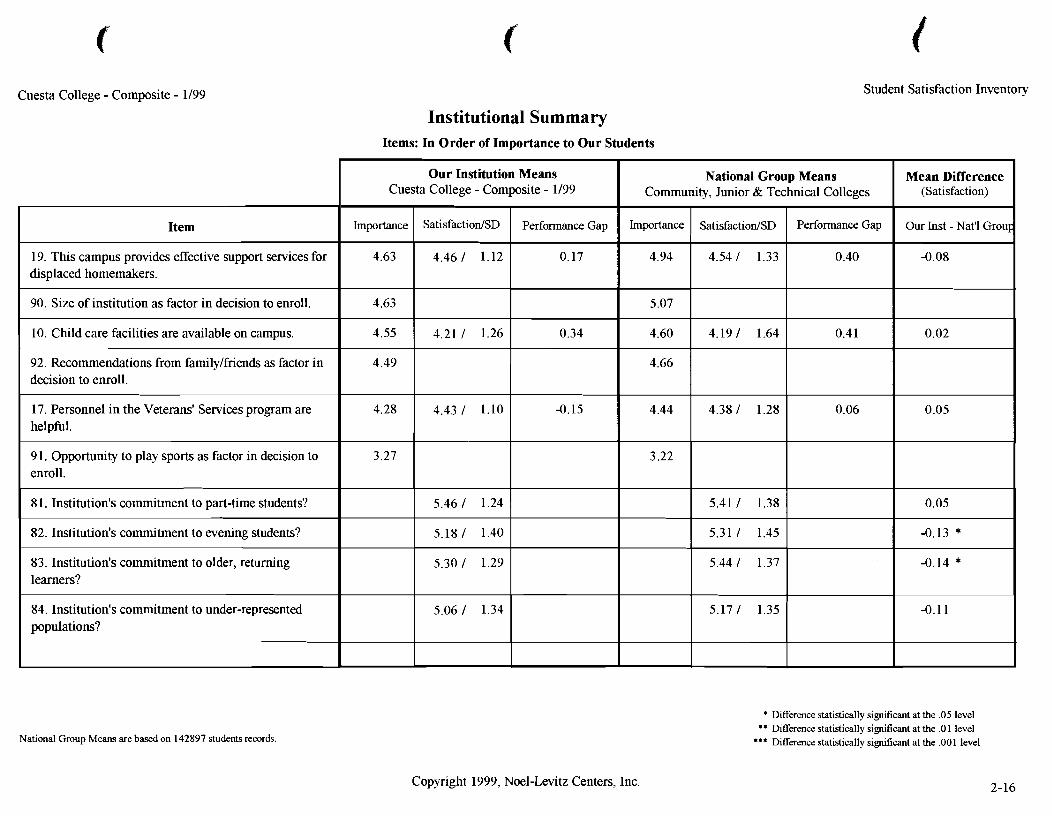
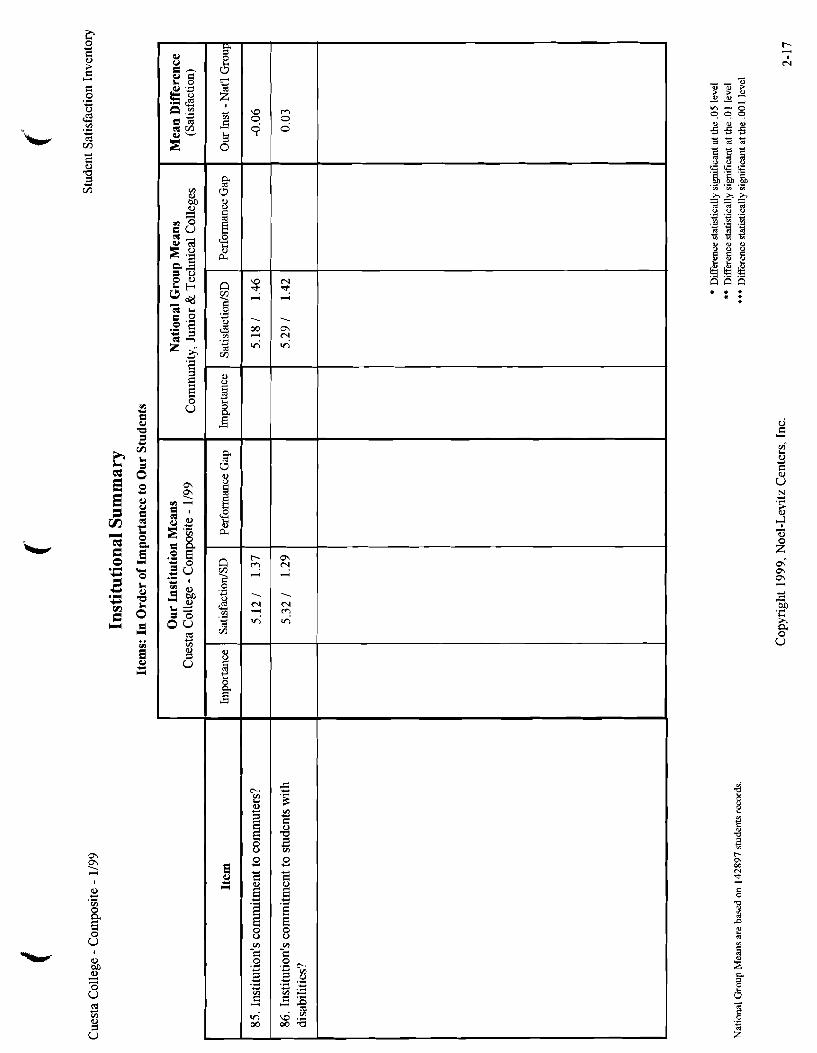
19. This campus provides effective support services for displaced homemakers.
90. Size of institution as factor in decision to enroll.
10. Child care facilities are available on campus.
92. Recommendations from familylfriends as factor in decision to enroll.
17. Personnel in the Veterans' Services program are helpful.
9 1. Opportunity to play sports as factor in decision to enroll.
8 1. Institution's commitment to part-time students?
82. Institution's commitment to evening students?
83. Institution's commitment to older, returning learners?
84. Institution's commitment to under-represented populations?
Difference statistically significant at the .05 level ** Difference statistically significant at the .O 1 level
*** Difference statistically significant at the .001 level
Copyright 1999, Noel-Levitz Centers, Inc.
Our Institution Means Cuesta College - Composite - 1/99
Importance
4.63
4.63
4.55
4.49
4.28
3.27
Mean Difference (Satisfaction)
Our Inst - Nat'l Grou~
-0.08
0.02
0.05
0.05
-0.13 *
-0.14 *
-0.11
National Group Means
SatisfactiodSD
4.46 1 1.12
4.21 1 1.26
4.43 1 1.10
5.46 I 1.24
5.181 1.40
5.30 I 1.29
5.06 I 1.34
Community,
Importance
4.94
5.07
4.60
4.66
4.44
3.22
Performance Gap
0.17
0.34
-0.15
Junior &
SatisfactiodSD
4.54 1 1.33
4.19 1 1.64
4.38 I 1.28
5.41 I 1.38
5.31 I 1.45
5.44 I 1.37
5.17 I 1.35
Technical Colleges
Performance Gap
0.40
0.41
0.06

Student Satisfaction Inventory Cuesta College - Composite - 1/99
Institutional Summary Scales: In Alphabetical Order With Items That Make Up the Scale
National Group Means are based on 142897 students records.
Scale/Item
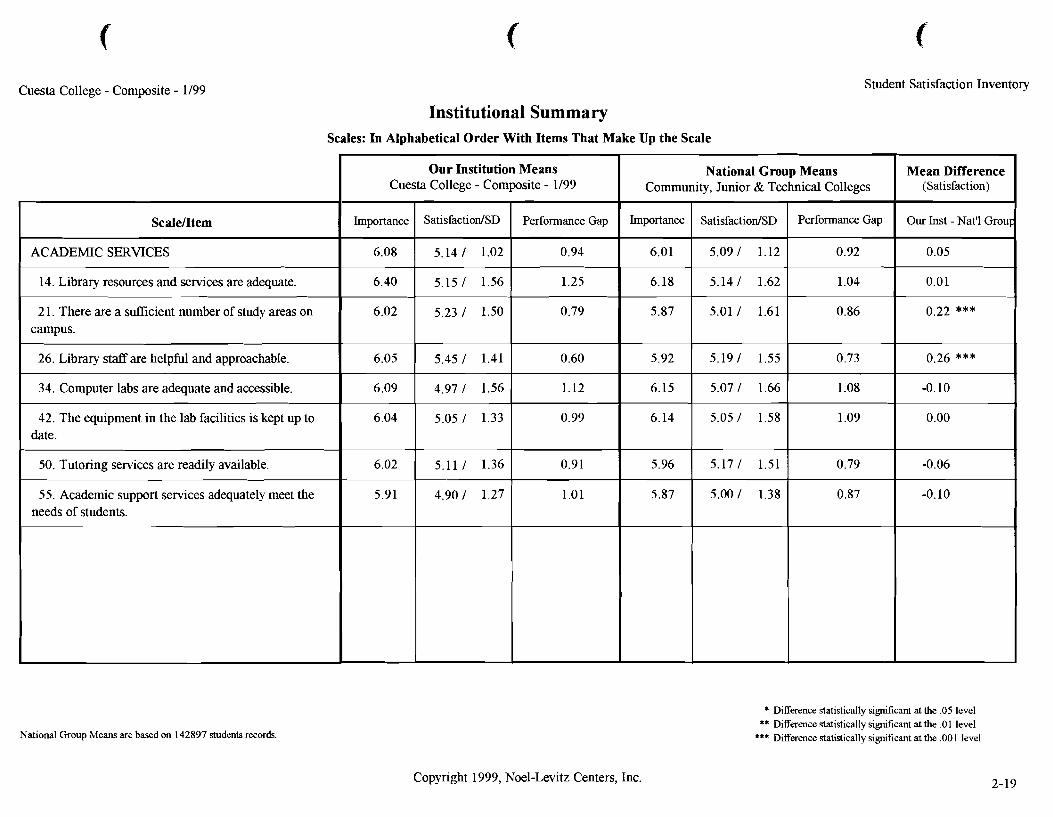
ACADEMIC SERVICES
14. Library resources and sewices are adequate.
2 1. There are a sufficient number of study areas on campus.
26. Library staff are helpful and approachable.
34. Computer labs are adequate and accessible.
42. The equipment in the lab facilities is kept up to date.
50. Tutoring services are readily available.
55. Academic support services adequately meet the needs of students.
Copyright 1999, Noel-Levitz Centers, Inc.
* Difference statistically si&~cant at the .05 level ** Difference statistically significant at the .O1 level
*** Difference statistically significant at the .OO 1 level
Our Institution Means Cuesta College - Composite - 1/99
Importance
6.08
6.40
6.02
6.05
6.09
6.04
6.02
5.91
Mean Difference (Satisfaction)
Our Inst - Nat'l Grou~
0.05
0.01
0.22 ***
0.26 ***
-0.10
0.00
-0.06
-0.10
National Group Means Community,
Importance
6.01
6.18
5.87
5.92
6.15
6.14
5.96
5.87
SatisfactiodSD
5.14 / 1.02
5.15 / 1.56
5.23 / 1.50
5.45 / 1.41
4.97 / 1.56
5.05 / 1.33
5.111 1.36
4.90 / 1.27
Performance Gap
0.94
1.25
0.79
0.60
1.12
0.99
0.91
1.01
Junior &
SatisfactiodSD
5.09 / 1.12
5.14 / 1.62
5.01 / 1.61
5.19 / 1.55
5.07 / 1.66
5.05 / 1.58
5.17 / 1.51
5.00 / 1.38
Technical Colleges
Performance Gap
0.92
1.04
0.86
0.73
1.08
1.09
0.79
0.87

Cuesta College - Composite - 1199 Student Satisfaction Inventory
Institutional Summary Scales: In Alphabetical Order With Items That Make Up the Scale
National Group Means are based on 142897 students records.
ScaleIItem
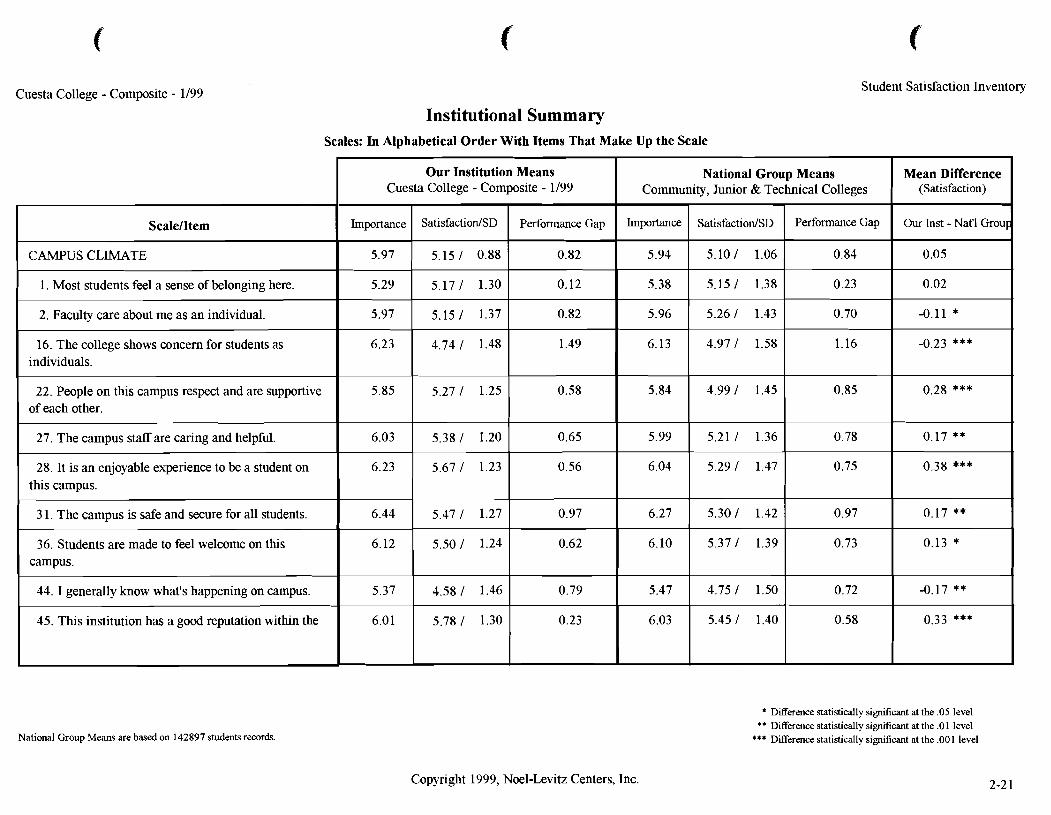
CAMPUS CLIMATE
1. Most students feel a sense of belonging here.
2. Faculty care about me as an individual.
16. The college shows concern for students as individuals.
22. People on this campus respect and are supportive of each other.
27. The campus staff are caring and helpful.
28. It is an enjoyable experience to be a student on this campus.
3 1. The campus is safe and secure for all students.
36. Students are made to feel welcome on t h s campus.
44. I generally know what's happening on campus.
45. This institution has a good reputation within the
Copyright 1999, Noel-Levitz Centers, Inc.
* Difference statistically sisruf~cant at the .05 level ** Difference statistically sisruf~cant at the .O1 level
*** Difference statistically significant at the .001 level
Our Institution Means Cuesta College - Composite - 1199
Importance
5.97
5.29
5.97
6.23
5.85
6.03
6.23
6.44
6.12
5.37
6.01
Mean Difference (Satisfaction)
Our Inst - Nat'l Group
0.05
0.02
-0.11 *
-0.23 ***
0.28 ***
0.17 **
0.38 ***
0.17 **
0.13 *
-0.17 **
0.33 ***
National Group Means Community,
Importance
5.94
5.38
5.96
6.13
5.84
5.99
6.04
6.27
6.10
5.47
6.03
SatisfactiodSD
5.15 1 0.88
5.17 1 1.30
5.15 1 1.37
4.74 1 1.48
5.27 1 1.25
5.38 1 1.20
5.67 1 1.23
5.47 1 1.27
5.50 1 1.24
4.58 1 1.46
5.78 1 1.30
Performance Gap
0.82
0.12
0.82
1.49
0.58
0.65
0.56
0.97
0.62
0.79
0.23
Junior &
SatisfactiodSD
5.10 1 1.06
5.15 1 1.38
5.26 1 1.43
4.97 1 1.58
4.99 1 1.45
5.21 1 1.36
5.29 1 1.47
5.30 / 1.42
5.37 1 1.39
4.75 1 1.50
5.45 1 1.40
Technical Colleges
Performance Gap
0.84
0.23
0.70
1.16
0.85
0.78
0.75
0.97
0.73
0.72
0.58
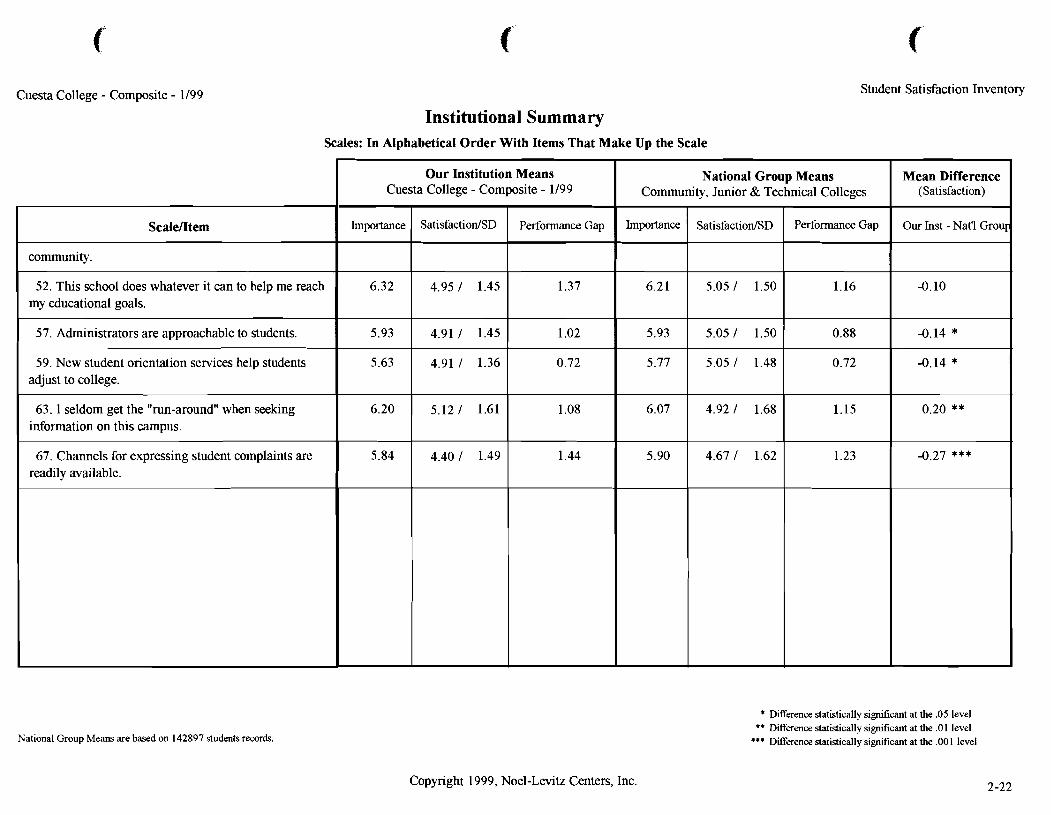
Cuesta College - Composite - 1/99 Student Satisfaction Inventory
Institutional Summary Scales: In Alphabetical Order With Items That Make Up the Scale
National Group Means are based on 142897 students records.
Scalt?/Item
community.
52. This school does whatever it can to help me reach my educational goals.
57. Administrators are approachable to students.
59. New student orientation services help students adjust to college.
63. 1 seldom get the "run-around" when seeking information on this campus.
67. Channels for expressing student complaints are readily available.
Copyright 1999, Noel-Levitz Centers, Inc.
* Difference statistically sisruf~cant at the .05 level ** D8erence statistically sisruflcant at the .0 1 level
*** Dserence statistically sisruf~cant at the .OO 1 level
Our Institution Means Cuesta College - Composite - 1/99
Importance
6.32
5.93
5.63
6.20
5.84
Mean Difference (Satisfaction)
Our Inst - Nat'l G~OUF
-0.10
-0.14 *
-0.14 *
0.20 **
-0.27 ***
National Group Means
SatisfactiodSD
4.95 1 1.45
4.91 1 1.45
4.91 1 1.36
5.12 1 1.61
4.40 1 1.49
Community,
Importance
6.2 1
5.93
5.77
6.07
5.90
Performance Gap
1.37
1.02
0.72
1.08
1.44
Junior &
SatisfactiodSD
5.05 1 1.50
5.05 I 1.50
5.05 I 1.48
4.92 1 1.68
4.67 1 1.62
Technical Colleges
Performance Gap
1.16
0.88
0.72
1.15
1.23

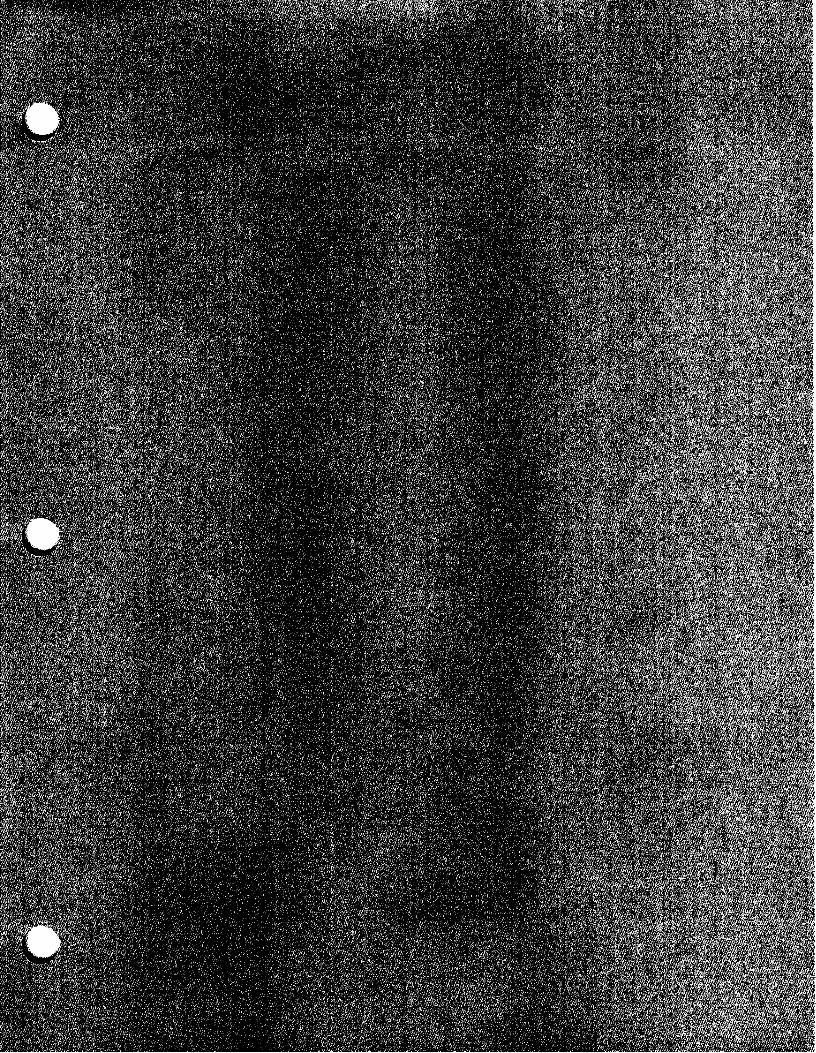
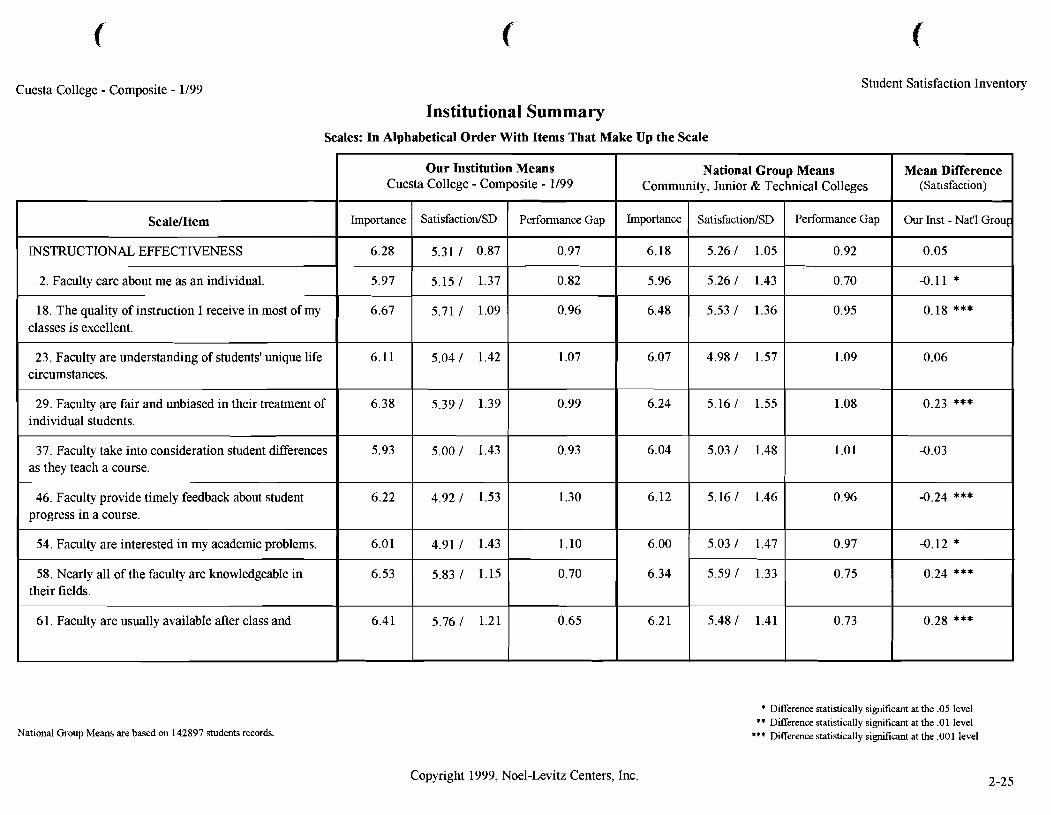
Student Satisfaction Inventory Cuesta College - Composite - 1/99
Institutional Summary Scales: In Alphabetical Order With Items That Make Up the Scale
National Group Means are based on 142897 students records.
Scale/Item
INSTRUCTIONAL EFFECTIVENESS
2. Faculty care about me as an individual.
18. The quality of instruction I receive in most of my classes is excellent.
23. Faculty are understanding of students' unique life circumstances.
29. Faculty are fair and unbiased in their treatment of individual students.
37. Faculty take into consideration student differences as they teach a course.
46. Faculty provide timely feedback about student progress in a course.
54. Faculty are interested in my academic problems.
58. Nearly all of the faculty are knowledgeable in their fields.
6 1. Faculty are usually available after class and
Copyright 1999, Noel-Levitz Centers, Inc.
* Difference statistically significant at the .05 level ** Difference statistically siNcant at the .0 1 level
*** Difference statistically sigruf~cant at the .OO 1 level
Our Institution Means Cuesta College - Composite - 1/99
Importance
6.28
5.97
6.67
6.11
6.38
5.93
6.22
6.0 1
6.53
6.41
Mean Difference (Satisfaction)
Our Inst - Nat'l Grou~
0.05
-0.11 *
0.18 ***
0.06
0.23 ***
-0.03
-0.24 ***
-0.12 *
0.24 ***
0.28 ***
National Group Means Community,
Importance
6.18
5.96
6.48
6.07
6.24
6.04
6.12
6.00
6.34
6.2 1
SatisfactiodSD
5.31 / 0.87
5.15 / 1.37
5.71 / 1.09
5.04 / 1.42
5.39 / 1.39
5.00 / 1.43
4.92 / 1.53
4.91 / 1.43
5.83 / 1.15
5.76 / 1.21
Performance Gap
0.97
0.82
0.96
1.07
0.99
0.93
1.30
1.10
0.70
0.65
Junior &
SatisfactiodSD
5.26 / 1.05
5.26 / 1.43
5.53 / 1.36
4.98 / 1.57
5.16 / 1.55
5.03 / 1.48
5.16 / 1.46
5.03 / 1.47
5.59 / 1.33
5.48 / 1.41
Technical Colleges
Performance Gap
0.92
0.70
0.95
1.09
1.08
1.01
0.96
0.97
0.75
0.73
Student Satisfaction Inventory Cuesta College - Composite - 1/99
Institutional Summary Scales: In Alphabetical Order With Items That Make Up the Scale
National Group Means are based on 142897 students records.
Scale/Item
during office hours.
64. Nearly all classes deal with practical experiences and applications.
65. Students are notified early in the term if they are doing poorly in a class.
66. Program requirements are clear and reasonable.
69. There is a good variety of courses provided on this campus.
70. I am able to experience intellectual growth here.
Copyright 1999, Noel-Levitz Centers, Inc.
* Difference statistically significant at the .05 level ** Difference statistically sisruf~cant at the .O1 level
*** Difference statistically significant at the ,001 level
Our Institution Means Cuesta College - Composite - 1/99
Importance
6.06
6.25
6.34
6.54
6.50
Mean Difference (Satisfaction)
Our Inst - Nat'l Group
-0.06
0.04
0.05
-0.10
0.23 ***
National Group Means
SatisfactiodSD
5.22 / 1.28
4.89 / 1.59
5.45 / 1.27
5.27 / 1.52
5.76 / 1.20
Community,
hp r t ance
6.06
6.16
6.24
6.29
6.28
Performance Gap
0.84
1.36
0.89
1.27
0.74
Junior &
SatisfactiodSD
5.28 / 1.37
4.85 / 1.66
5.40 / 1.38
5.37 / 1.48
5.53 / 1.36
Technical Colleges
Performance Gap
0.78
1.31
0.84
0.92
0.75


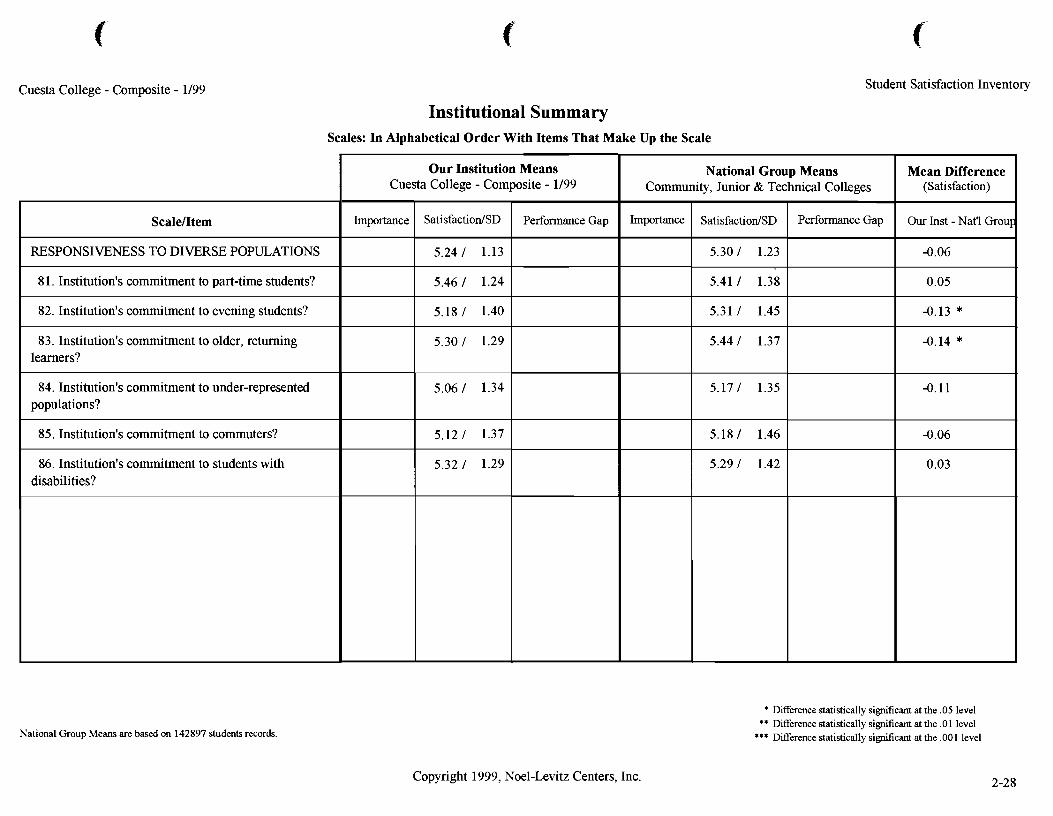
Student Satisfaction Inventory Cuesta College - Composite - 1199
Institutional Summary Scales: In Alphabetical Order With Items That Make Up the Scale
National Group Means are based on 142897 students records.
Scale/Item
RESPONSIVENESS TO DIVERSE POPULATIONS
8 1. Institution's commitment to part-time students?
82. Institution's commitment to evening students?
83. Institution's commitment to older, returning learners?
84. Institution's commitment to under-represented populations?
85. Institution's commitment to commuters?
86. Institution's commitment to students with disabilities?
Copyright 1999, Noel-Levitz Centers, Inc.
* Difference statistically significant at the .05 level ** Difference statistically significant at the .O1 level
*** Difference statistically significant at the .001 level
Our Institution Means Cuesta College - Composite - 1/99
Importance
Mean Difference (Satisfaction)
Our Inst - Nat'l
-0.06
0.05
-0.13 *
-0.14 *
-0.11
-0.06
0.03
National Group Means
SatisfactiodSD
5.24 1 1.13
5.46 1 1.24
5.18 1 1.40
5.30 1 1.29
5.06 1 1.34
5.12 I 1.37
5.321 1.29
Community,
Importance Performance Gap
Junior &
SatisfactiodSD
5.30 1 1.23
5.41 1 1.38
5.31 1 1.45
5.44 1 1.37
5.17 1 1.35
5.18 1 1.46
5.29 1 1.42
Technical Colleges
Performance Gap

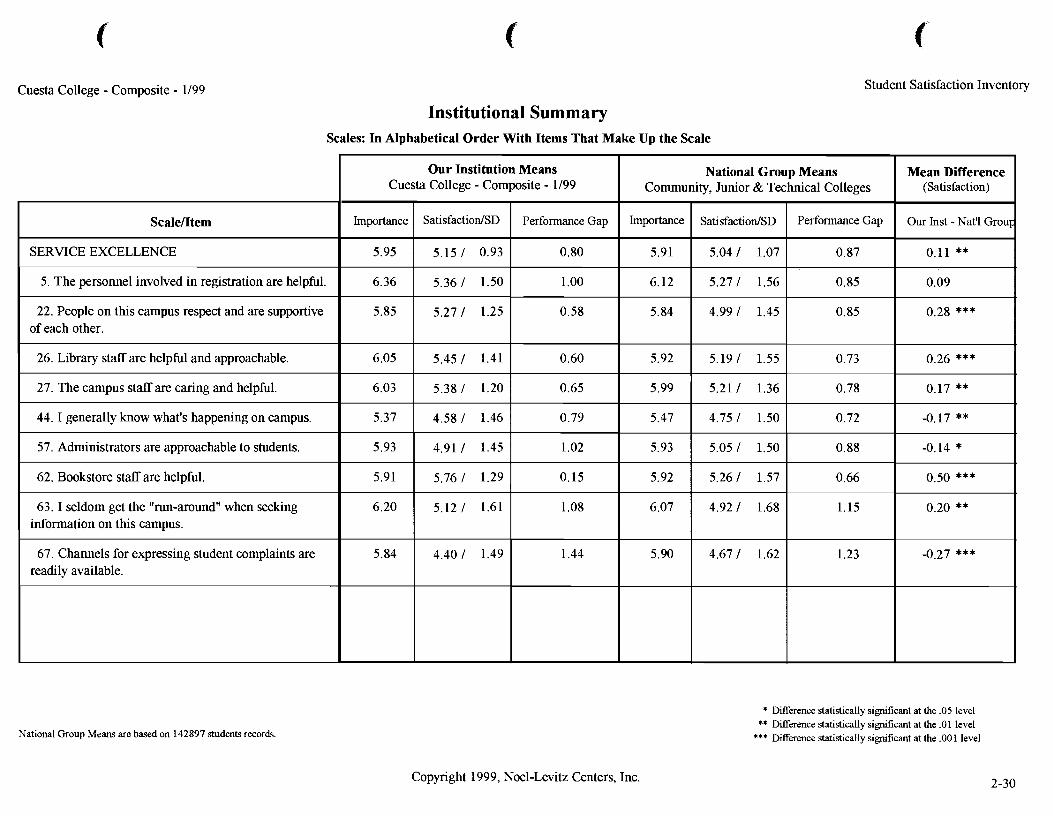
Student Satisfaction Inventory Cuesta College - Composite - 1/99
Institutional Summary Scales: In Alphabetical Order With Items That Make Up the Scale
National Group Means are based on 142897 students records.
Scalemem
SERVICE EXCELLENCE
5. The personnel involved in registration are helpful.
22. People on this campus respect and are supportive of each other.
26. Library staff are helpful and approachable.
27. The campus staff are caring and helpful.
44. I generally know what's happening on campus.
57. Administrators are approachable to students.
62. Bookstore staff are helpful.
63. I seldom get the "run-around" when seeking information on this campus.
67. Channels for expressing student complaints are readily available.
Copyright 1999, Noel-Levitz Centers, Inc.
* Difference statistically sigd~cant at the .05 level ** Difference statistically sigd~cant at the .O1 level
*** Difference statistically significant at the ,001 level
Our Institution Means Cuesta College - Composite - 1/99
Importance
5.95
6.36
5.85
6.05
6.03
5.37
5.93
5.91
6.20
5.84
Mean Difference (Satisfaction)
Our Inst - Nat'l Group
0.11 **
0.09
0.28 ***
0.26 ***
0.17 **
-0.17 **
-0.14 *
0.50 ***
0.20 **
-0.27 ***
National Group Means
SatisfactiodSD
5.15 1 0.93
5.36 1 1.50
5.27 1 1.25
5.45 I 1.41
5.38 I 1.20
4.58 I 1.46
4.91 I 1.45
5.76 I 1.29
5.12 I 1.61
4.40 I 1.49
Community,
Importance
5.91
6.12
5.84
5.92
5.99
5.47
5.93
5.92
6.07
5.90
Performance Gap
0.80
1.00
0.58
0.60
0.65
0.79
1.02
0.15
1.08
1.44
Junior &
SatisfactiodSD
5.04 1 1.07
5.271 1.56
4.99 1 1.45
5.19 I 1.55
5.21 I 1.36
4.75 I 1.50
5.05 I 1.50
5.26 I 1.57
4.92 I 1.68
4.67 I 1.62
Technical Colleges
Performance Gap
0.87
0.85
0.85
0.73
0.78
0.72
0.88
0.66
1.15
1.23
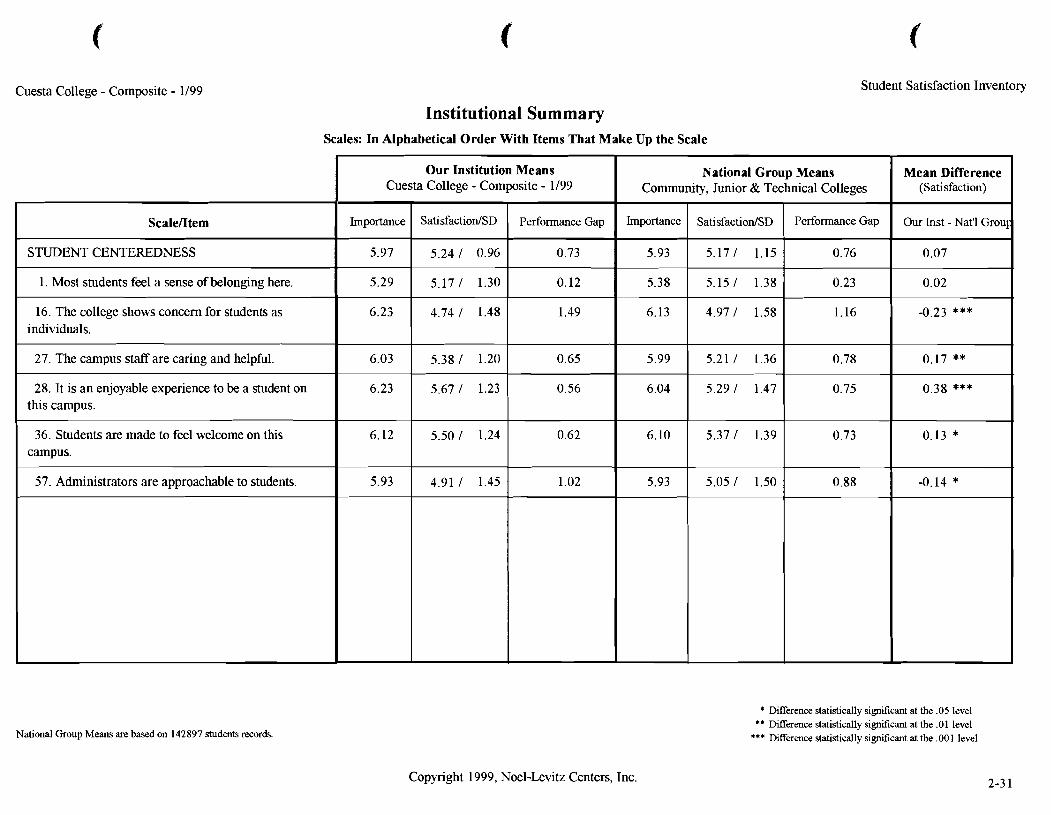
Student Satisfaction Inventory Cuesta College - Composite - 1199
Institutional Summary Scales: In Alphabetical Order With Items That Make Up the Scale
National Group Means are based on 142897 students records.
Copyright 1999, Noel-Levitz Centers, Inc.
Our Institution Means Cuesta College - Composite - 1/99
* Difference statistically significant at the .05 level ** Difference statistically significant at the .0 1 level
*** Difference statistically significant at the ,001 level
Mean Difference (Satisfaction)
Our Inst - Nat'l Grou~
0.07
0.02
-0.23 ***
0.17 **
0.38 ***
0.13 *
-0.14 *
National Group Means
Scale/Item
STUDENT CENTEREDNESS
1. Most students feel a sense of belongng here.
16. The college shows concern for students as individuals.
27. The campus staff are caring and helpful.
28. It is an enjoyable experience to be a student on this campus.
36. Students are made to feel welcome on this campus.
57. Administrators are approachable to students.
Importance
5.97
5.29
6.23
6.03
6.23
6.12
5.93
SatlsfactiodSD
5.24 1 0.96
5.17 1 1.30
4.74 1 1.48
5.38 1 1.20
5.67 1 1.23
5.50 1 1.24
4.91 1 1.45
Technical Colleges
Performance Gap
0.76
0.23
1.16
0.78
0.75
0.73
0.88
Performance Gap
0.73
0.12
1.49
0.65
0.56
0.62
1.02
Community,
Importance
5.93
5.38
6.13
5.99
6.04
6.10
5.93
Junior &
SatisfactiodSD
5.171 1.15
5.15 1 1.38
4.97 1 1.58
5.21 1 1.36
5.29 I 1.47
5.37 1 1.39
5.05 1 1.50
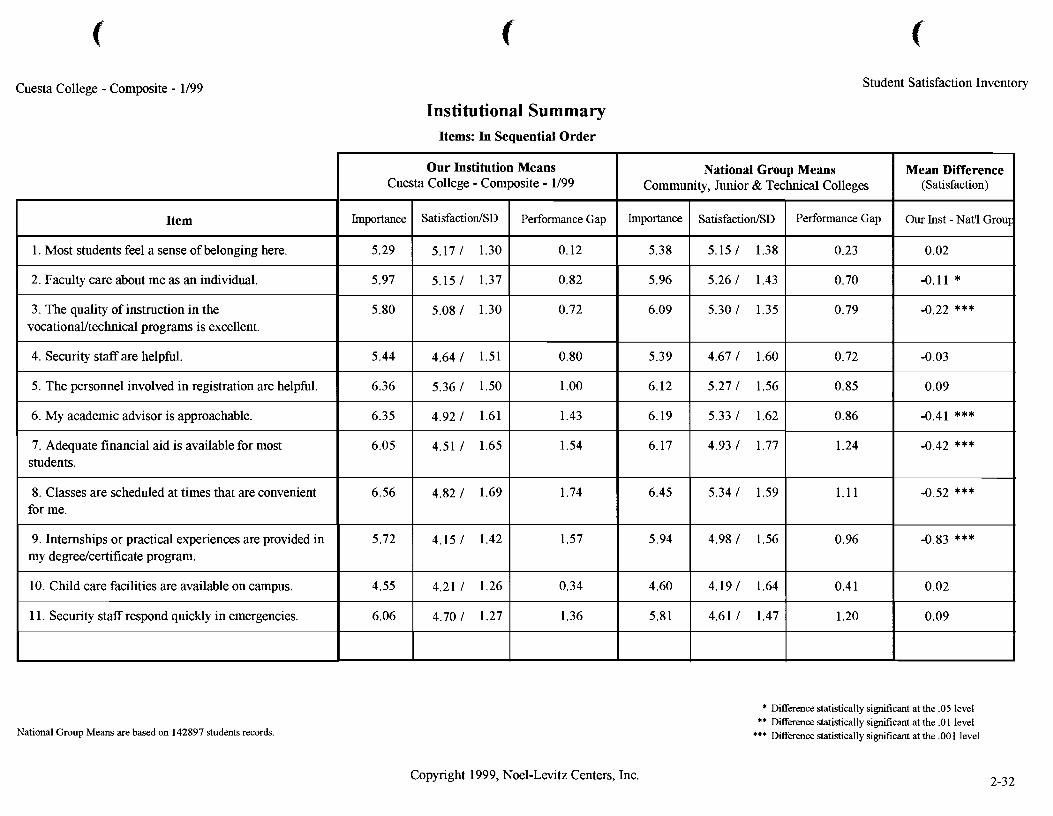
Cuesta College - Composite - 1199 Student Satisfaction Inventory
Institutional Summary Items: In Sequential Order
National Group Means are based on 142897 students records.
Item
1. Most students feel a sense of belonging here.
2. Faculty care about me as an individual.
3. The quality of instruction in the vocational/techcal programs is excellent.
4. Security staff are helpful.
5. The personnel involved in registration are helpful.
6. My academic advisor is approachable.
7. Adequate financial aid is available for most students.
8. Classes are scheduled at times that are convenient for me.
9. Internships or practical experiences are provided in my degreelcertificate program.
10. Child care facilities are available on campus.
1 1. Security staff respond quickly in emergencies.
Copyright 1999, Noel-Levitz Centers, Inc.
* Difference statistically significant at the .05 level ** Difference statistically significant at the .O 1 level
*** Difference statistically si&icant at the .OO 1 level
Our Institution Means Cuesta College - Composite - 1/99
Importance
5.29
5.97
5.80
5.44
6.36
6.35
6.05
6.56
5.72
4.55
6.06
Mean Difference (Satisfaction)
Our Inst - Nat'l G~OUF
0.02
-0.11 *
-0.22 ***
-0.03
0.09
-0.41 ***
-0.42 ***
-0.52 ***
-0.83 ***
0.02
0.09
National Group Means
SatisfactiodSD
5.17 1 1.30
5.15 1 1.37
5.08 1 1.30
4.64 1 1.51
5.36 I 1.50
4.92 I 1.61
4.51 I 1.65
4.82 I 1.69
4.15 I 1.42
4.21 I 1.26
4.70 I 1.27
Community,
Importance
5.38
5.96
6.09
5.39
6.12
6.19
6.17
6.45
5.94
4.60
5.81
Performance Gap
0.12
0.82
0.72
0.80
1 .OO
1.43
1.54
1.74
1.57
0.34
1.36
Junior &
SatisfactiodSD
5.15 1 1.38
5.26 1 1.43
5.30 1 1.35
4.67 1 1.60
5.27 I 1.56
5.33 I 1.62
4.93 I 1.77
5.34 I 1.59
4.98 I 1.56
4.19 I 1.64
4.611 1.47
Technical Colleges
Performance Gap
0.23
0.70
0.79
0.72
0.85
0.86
1.24
1.11
0.96
0.4 1
1.20
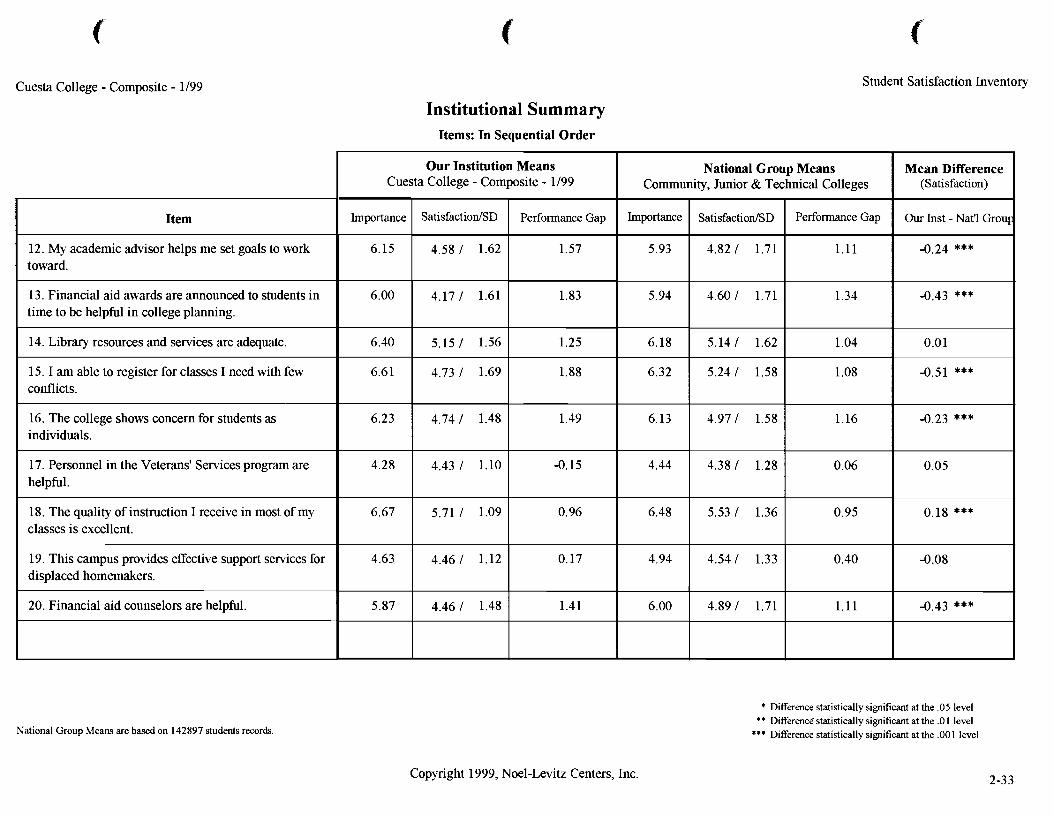
Cuesta College - Composite - 1/99 Student Satisfaction Inventory
Institutional Summary Items: In Sequential Order
National Group Means are based on 142897 students records.
Item
12. My academic advisor helps me set goals to work toward.
13. Financial aid awards are announced to students in time to be helpful in college planning.
14. Library resources and services are adequate.
15. I am able to register for classes I need with few conflicts.
16. The college shows concern for students as individuals.
17. Personnel in the Veterans' Services program are helpful.
18. The quality of instruction I receive in most of my classes is excellent.
19. This campus provides effective support services for displaced homemakers.
20. Financial aid counselors are helpful.
Copyright 1999, Noel-Levitz Centers, Inc.
* Difference statistically significant at the .05 level ** Difference statistically significant at the .O 1 level
*** Difference statistically significant at the .001 level
Our Institution Means Cuesta College - Composite - 1/99
Importance
6.15
6.00
6.40
6.61
6.23
4.28
6.67
4.63
5.87
Mean Difference (Satisfaction)
Our Inst - Nat'l Grou~:
-0.24 ***
-0.43 ***
0.01
-0.51 ***
-0.23 ***
0.05
0.18 ***
-0.08
-0.43 ***
National Group Means
SatisfactiodSD
4.58 / 1.62
4.17 / 1.61
5.15 / 1.56
4.73 / 1.69
4.74 / 1.48
4.43 / 1.10
5.71 / 1.09
4.46 / 1.12
4.46 / 1.48
Community,
Importance
5.93
5.94
6.18
6.32
6.13
4.44
6.48
4.94
6.00
Performance Gap
1.57
1.83
1.25
1.88
1.49
-0.15
0.96
0.17
1.41
Junior &
SatisfactiodSD
4.82 / 1.71
4.60 / 1.71
5.14 / 1.62
5.24 / 1.58
4.97 / 1.58
4.38 / 1.28
5.53 / 1.36
4.54 / 1.33
4.89 / 1.71
Technical Colleges
Performance Gap
1.11
1.34
1.04
1.08
1.16
0.06
0.95
0.40
1.11
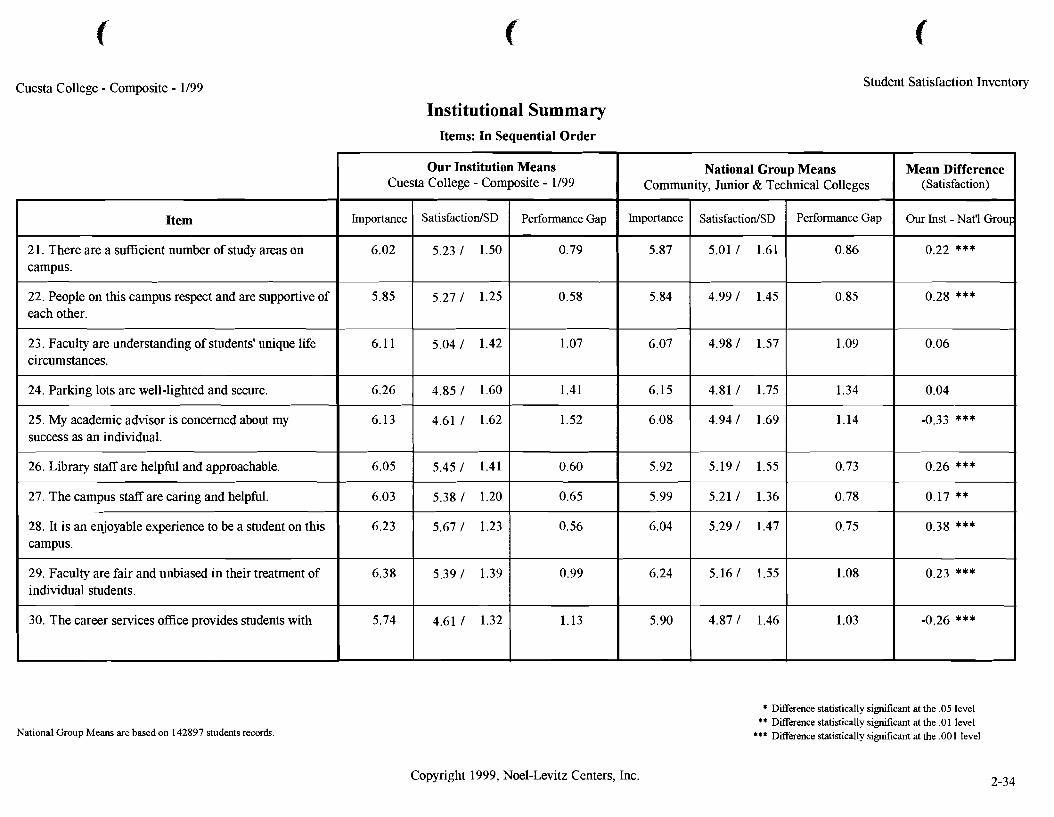
Cuesta College - Composite - 1/99 Student Satisfaction Inventory
Institutional Summary Items: In Sequential Order
National Group Means are based on 142897 students records.
Item
2 1. There are a ~ ~ c i e n t number of study areas on campus.
22. People on this campus respect and are supportive of each other.
23. Faculty are understanding of students' unique life circumstances.
24. Parking lots are well-lighted and secure.
25. My academic advisor is concerned about my success as an individual.
26. Library staff are helpful and approachable.
27. The campus staff are caring and helpful.
28. It is an enjoyable experience to be a student on this campus.
29. Faculty are fair and unbiased in their treatment of individual students.
30. The career services office provides students with
Copyright 1999, Noel-Levitz Centers, Inc.
Difference statistically sigruficant at the .O5 level ** Difference statistically significant at the .0l level
*** Difference statistically significant at the ,001 level
Our Institution Means Cuesta College - Composite - 1/99
Importance
6.02
5.85
6.11
6.26
6.13
6.05
6.03
6.23
6.38
5.74
Mean Difference (Satisfaction)
Our Inst - Nat'l Grou~
0.22 ***
0.28 ***
0.06
0.04
-0.33 ***
0.26 ***
0.17 **
0.38 ***
0.23 ***
-0.26 ***
National Group Means
SatisfactiodSD
5.23 / 1.50
5.27 / 1.25
5.04 / 1.42
4.85 / 1.60
4.61 / 1.62
5.45 / 1.41
5.38 / 1.20
5.67 / 1.23
5.39 / 1.39
4.61 / 1.32
Technical Colleges
Performance Gap
0.86
0.85
1.09
1.34
1.14
0.73
0.78
0.75
1.08
1.03
Community,
Importance
5.87
5.84
6.07
6.15
6.08
5.92
5.99
6.04
6.24
5.90
Performance Gap
0.79
0.58
1.07
1.41
1.52
0.60
0.65
0.56
0.99
1.13
Junior &
SatisfactiodSD
5.01 / 1.61
4.99 / 1.45
4.98 / 1.57
4.81 / 1.75
4.94 / 1.69
5.19 / 1.55
5.21 / 1.36
5.29 / 1.47
5.16 / 1.55
4.87 / 1.46
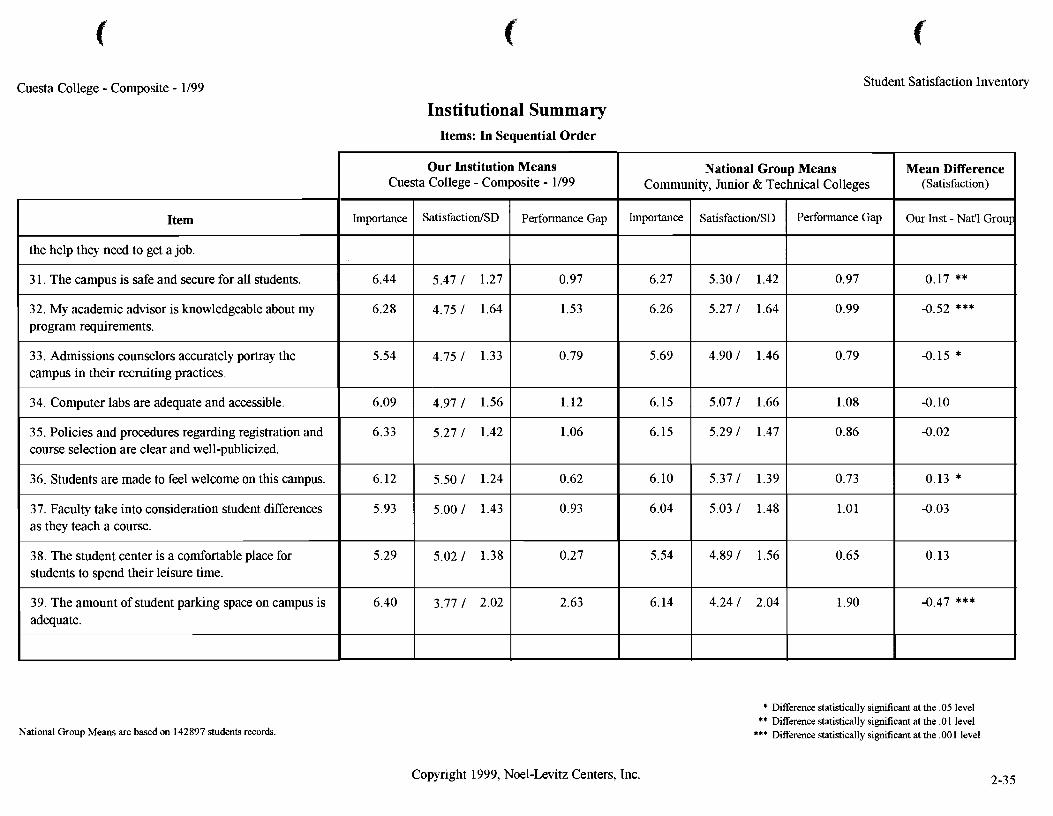
Cuesta College - Composite - 1/99 Student Satisfaction Inventory
Institutional Summary Items: In Sequential Order
National Group Means are based on 142897 students records.
Item
the help they need to get a job.
3 1. The campus is safe and secure for all students.
32. My academic advisor is knowledgeable about my program requirements.
33. Admissions counselors accurately portray the campus in their recruiting practices.
34. Computer labs are adequate and accessible.
3 5. Policies and procedures regarding registration and course selection are clear and well-publicized.
36. Students are made to feel welcome on tlus campus.
37. Faculty take into consideration student differences as they teach a course.
38. The student center is a comfortable place for students to spend their leisure time.
39. The amount of student parking space on campus is adequate.
Copyright 1999, Noel-Levitz Centers, Inc.
* Difference statistically significant at the .05 level ** Difference statistically significant at the .O I level
*** Difference statistically significant at the ,001 level
Our Institution Means Cuesta College - Composite - 1/99
Importance
6.44
6.28
5.54
6.09
6.33
6.12
5.93
5.29
6.40
Mean Difference (Satisfaction)
Our Inst - Nat'l Grou~
0.17 **
-0.52 ***
-0.15 *
-0.10
-0.02
0.13 *
-0.03
0.13
-0.47 ***
National Group Means Community,
Importance
6.27
6.26
5.69
6.15
6.15
6.10
6.04
5.54
6.14
SatisfactiodSD
5.47 / 1.27
4.75 / 1.64
4.75 / 1.33
4.97 / 1.56
5.27 / 1.42
5.50 / 1.24
5.00 / 1.43
5.02 / 1.38
3.77 / 2.02
Performance Gap
0.97
1.53
0.79
1.12
1.06
0.62
0.93
0.27
2.63
Junior &
SatisfactiodSD
5.30 / 1.42
5.27 / 1.64
4.90 / 1.46
5.07 / 1.66
5.29 / 1.47
5.37 / 1.39
5.03 / 1.48
4.89 / 1.56
4.24 / 2.04
Technical Colleges
Performance Gap
0.97
0.99
0.79
1.08
0.86
0.73
1.01
0.65
1.90
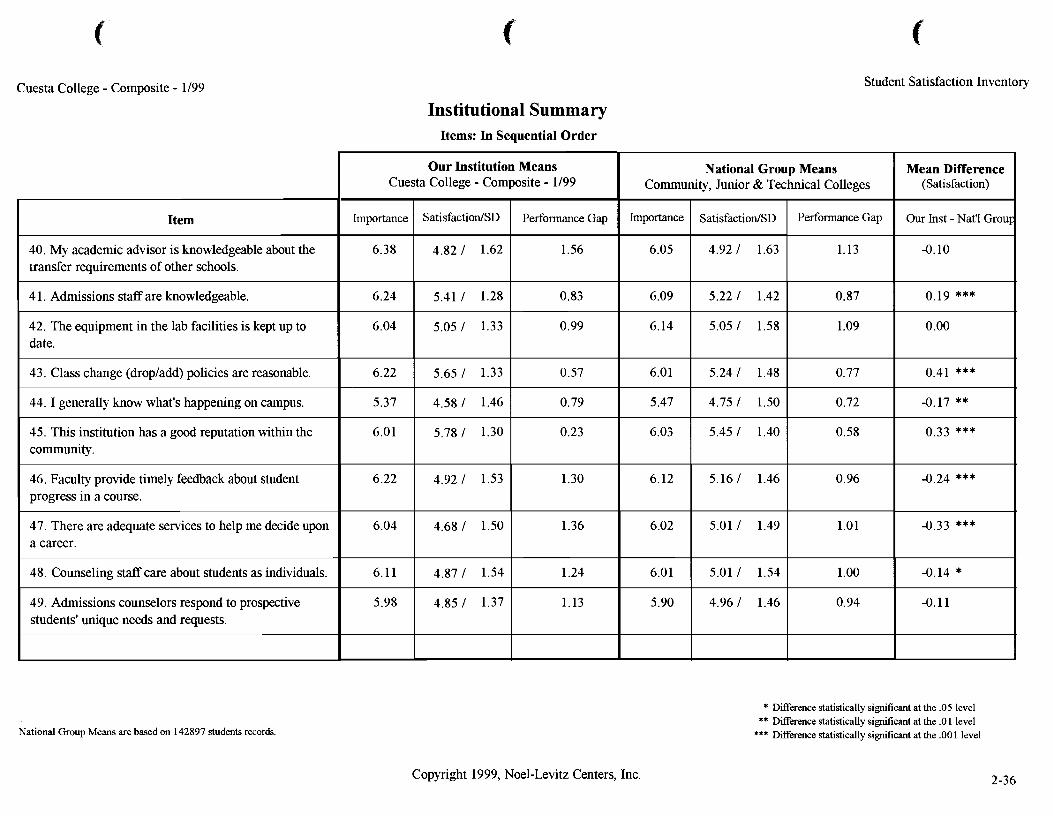
Cuesta College - Composite - 1/99 Student Satisfaction Inventory
Institutional Summary Items: In Sequential Order
National Group Means are based on 142897 students records.
Item
40. My academic advisor is knowledgeable about the transfer requirements of other schools.
4 1. Admissions staff are knowledgeable.
42. The equipment in the lab facilities is kept up to date.
43. Class change (dropladd) policies are reasonable.
44. I generally know what's happening on campus.
45. This institution has a good reputation within the community.
46. Faculty provide timely feedback about student progress in a course.
47. There are adequate services to help me decide upon a career.
48. Counseling staff care about students as incllviduals.
49. Admissions counselors respond to prospective students' unique needs and requests.
Copyright 1999, Noel-Levitz Centers, Inc.
* Difference statistically significant at the .05 level ** Difference statistically sigruficant at the .O 1 level
*** Difference statistically sigruficant at the .001 level
Our Institution Means Cuesta College - Composite - 1/99
Importance
6.38
6.24
6.04
6.22
5.37
6.01
6.22
6.04
6.11
5.98
Mean Difference (Satisfaction)
Our Inst - Nat'l Grou~
-0.10
0.19 ***
0.00
0.41 ***
-0.17 **
0.33 ***
-0.24 ***
-0.33 ***
-0.14 *
-0.11
National Group Means
SatisfactiodSD
4.82 / 1.62
5.41 / 1.28
5.05 / 1.33
5.65 / 1.33
4.58 / 1.46
5.78 / 1.30
4.92 / 1.53
4.68 / 1.50
4.87 / 1.54
4.85 / 1.37
Community,
Importance
6.05
6.09
6.14
6.01
5.47
6.03
6.12
6.02
6.01
5.90
Performance Gap
1.56
0.83
0.99
0.57
0.79
0.23
1.30
1.36
1.24
1.13
Junior &
SatisfactiodSD
4.92 / 1.63
5.22 / 1.42
5.05 / 1.58
5.24 / 1.48
4.75 / 1.50
5.45 / 1.40
5.16 / 1.46
5.01 / 1.49
5.01 / 1.54
4.96 / 1.46
Technical Colleges
Performance Gap
1.13
0.87
1.09
0.77
0.72
0.58
0.96
1.01
1.00
0.94
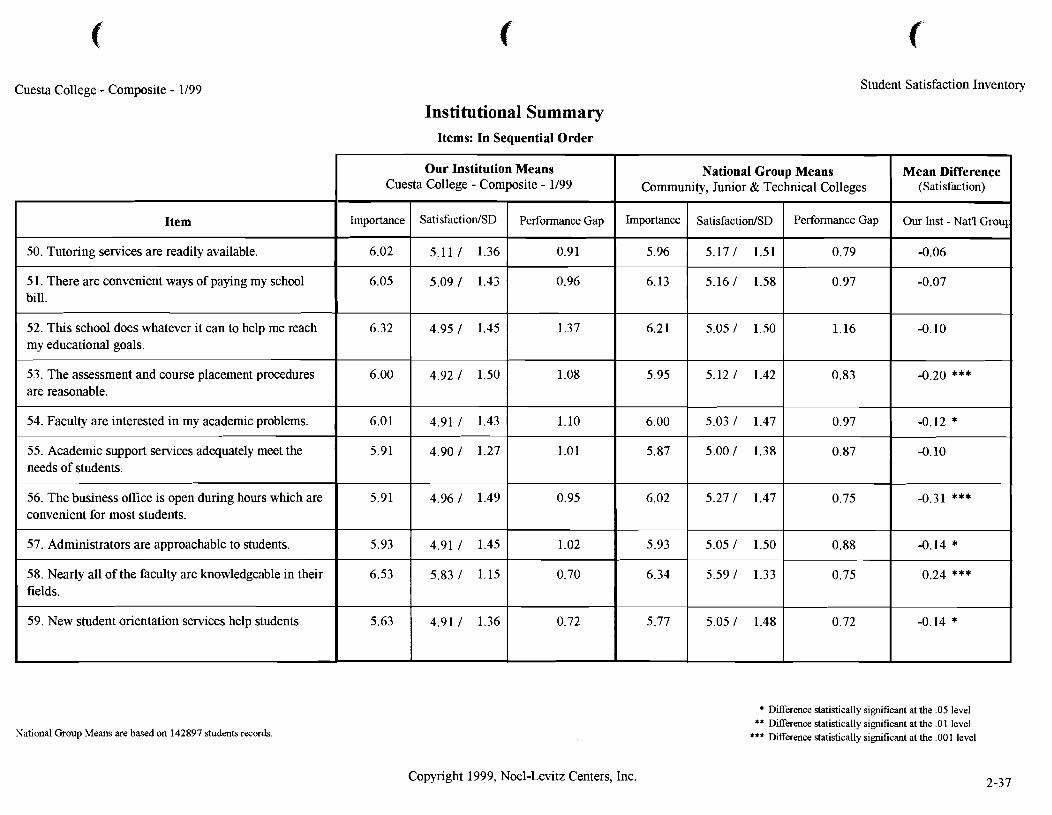
Cuesta College - Composite - 1/99 Student Satisfaction Inventory
Institutional Summary Items: In Sequential Order
National Group Means are based on 142897 students records.
Item
50. Tutoring services are readily available.
51. There are convenient ways of paying my school bill.
52. This school does whatever it can to help me reach my educational goals.
5 3. The assessment and course placement procedures are reasonable.
54. Faculty are interested in my academic problems.
55. Academic support services adequately meet the needs of students.
56. The business office is open during hours which are convenient for most students.
57. Administrators are approachable to students.
58. Nearly all of the faculty are knowledgeable in their fields.
59. New student orientation services help students
Copyright 1999, Noel-Levitz Centers, Inc.
* Difference statistically significant at the .05 level ** Difference statistically significant at the .01 level
*** Difference statistically significant at the .OO 1 level
Our Institution Means Cuesta College - Composite - 1/99
Importance
6.02
6.05
6.32
6.00
6.01
5.91
5.91
5.93
6.53
5.63
Mean Difference (Satisfaction)
Our Inst - Nat'l Grou~
-0.06
-0.07
-0.10
-0.20 ***
-0.12 *
-0.10
-0.31 ***
-0.14 *
0.24 ***
-0.14 *
National Group Means
SatisfactiodSD
5.1 1 1 1.36
5.09 1 1.43
4.95 / 1.45
4.92 / 1.50
4.91 / 1.43
4.90 / 1.27
4.96 / 1.49
4.91 / 1.45
5.83 / 1.15
4.91 / 1.36
Community,
Importance
5.96
6.13
6.21
5.95
6.00
5.87
6.02
5.93
6.34
5.77
Performance Gap
0.91
0.96
1.37
1.08
1.10
1.01
0.95
1.02
0.70
0.72
Junior &
SatisfactiodSD
5.17 1 1.51
5.16 1 1.58
5.05 / 1.50
5.12 / 1.42
5.03 / 1.47
5.00 / 1.38
5.27 / 1.47
5.05 / 1.50
5.59 1 1.33
5.05 / 1.48
Technical Colleges
Performance Gap
0.79
0.97
1.16
0.83
0.97
0.87
0.75
0.88
0.75
0.72
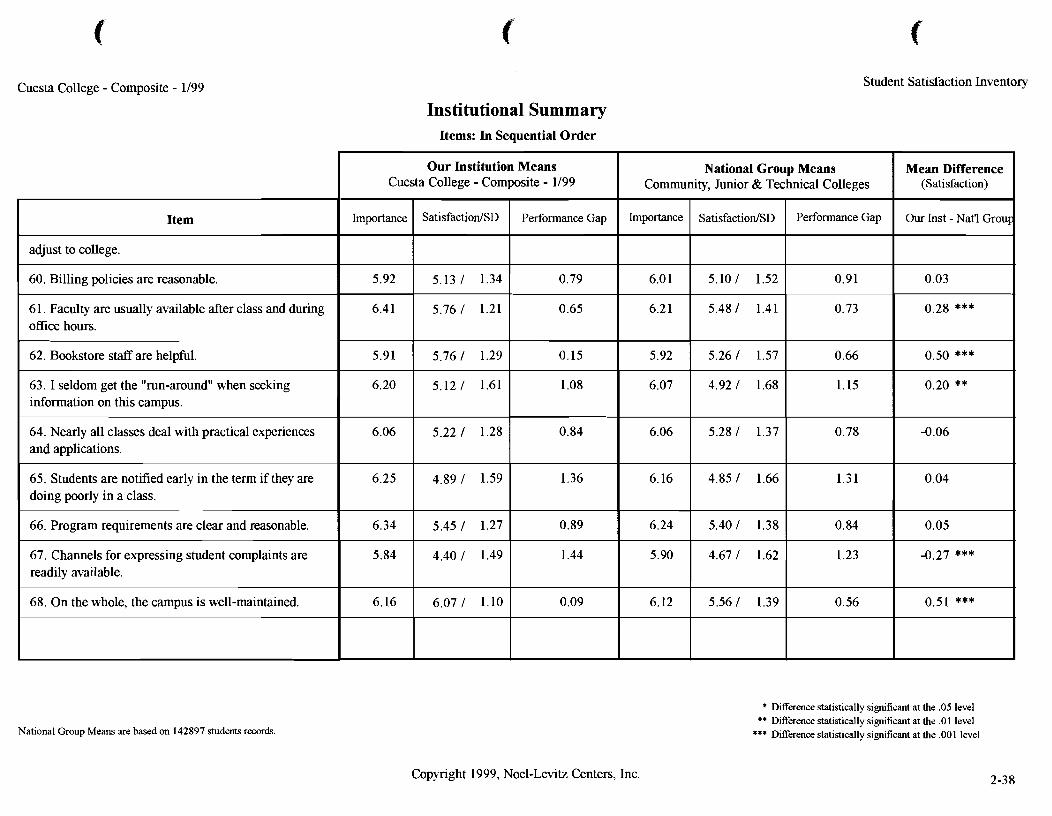
Cuesta College - Composite - 1/99
Institutional Summary Items: In Sequential Order
Student Satisfaction Inventory
National Group Means are based on 142897 students records.
Item
adjust to college.
60. Billing policies are reasonable.
6 1. Faculty are usually available after class and during office hours.
62. Bookstore staff are helpful.
63. I seldom get the "run-around" when seeking information on this campus.
64. Nearly all classes deal with practical experiences and applications.
65. Students are notified early in the term if they are doing poorly in a class.
66. Program requirements are clear and reasonable.
67. Channels for expressing student complaints are readily available.
68. On the whole, the campus is well-maintained.
Copyright 1999, Noel-Levitz Centers, Inc.
* D8erence statistically significant at the .05 level ** DXerence statistically si@cant at the .O1 level
*** DItference statistically significant at the ,001 level
Our Institution Means Cuesta College - Composite - 1/99
Importance
5.92
6.41
5.91
6.20
6.06
6.25
6.34
5.84
6.16
Mean Difference (Satisfaction)
Our Inst - Nat'l Grou~
0.03
0.28 ***
0.50 ***
0.20 **
-0.06
0.04
0.05
-0.27 ***
0.51 ***
National Group Means Community,
Importance
6.0 1
6.2 1
5.92
6.07
6.06
6.16
6.24
5.90
6.12
SatisfactiodSD
5.13 1 1.34
5.76 I 1.21
5.76 I 1.29
5.12 I 1.61
5.22 I 1.28
4.89 I 1.59
5.45 I 1.27
4.40 I 1.49
6.07 I 1.10
Performance Gap
0.79
0.65
0.15
1.08
0.84
1.36
0.89
1.44
0.09
Junior &
SatisfactiodSD
5.10 1 1.52
5.48 I 1.41
5.26 I 1.57
4.92 I 1.68
5.28 I 1.37
4.85 I 1.66
5.40 I 1.38
4.67 I 1.62
5.56 I 1.39
Technical Colleges
Performance Gap
0.91
0.73
0.66
1.15
0.78
1.31
0.84
1.23
0.56
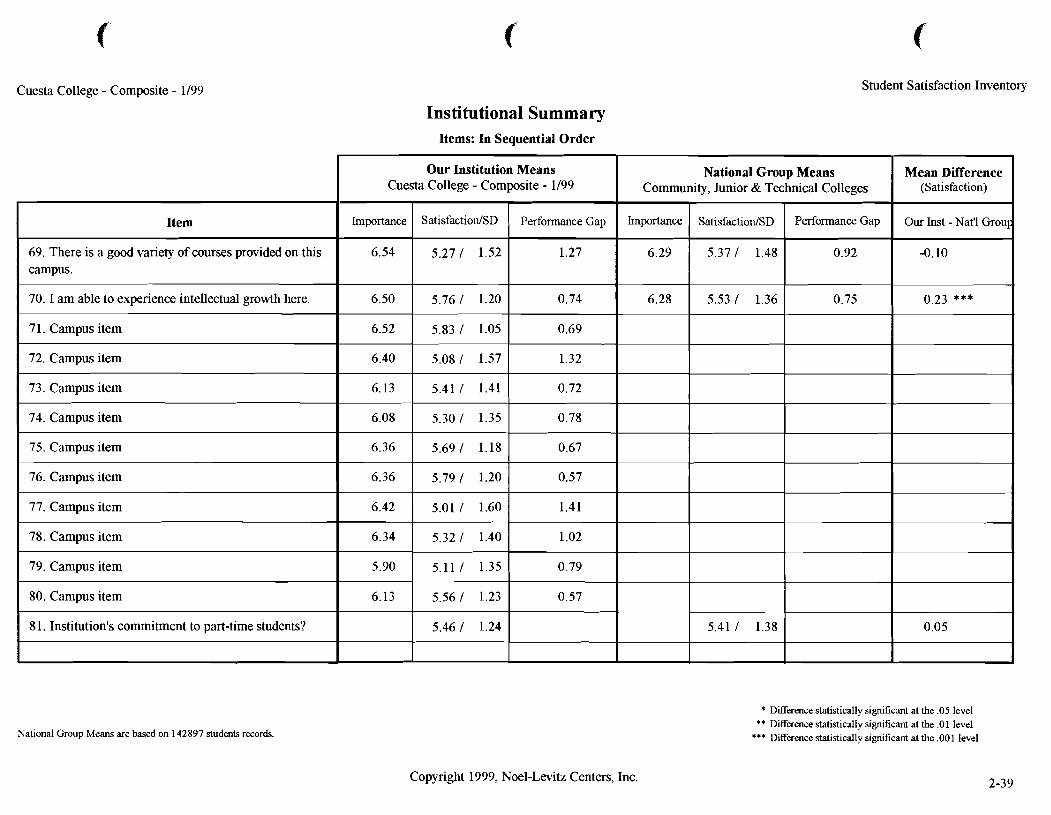
Cuesta College - Composite - 1199 Student Satisfaction Inventory
Institutional Summary Items: In Sequential Order
National Group Means are based on 142897 students records.
Item
69. There is a good variety of courses provided on this campus.
70. I am able to experience intellectual growth here.
7 1. Campus item
72. Campus item
73. Campus item
74. Campus item
75. Campus item
76. Campus item
77. Campus item
78. Campus item
79. Campus item
80. Campus item
8 1. Institution's commitment to part-time students?
Copyright 1999, Noel-Levitz Centers, Inc.
* Difference statistically significant at the .05 level ** Difference statistically significant at the .O1 level
*** Difference statistically significant at the ,001 level
Our Institution Means Cuesta College - Composite - 1/99
Importance
6.54
6.50
6.52
6.40
6.13
6.08
6.36
6.36
6.42
6.34
5.90
6.13
Mean Difference (Satisfaction)
Our Inst - Nat'l G~OUF
-0.10
0.23 ***
0.05
-
National Group Means
SatisfactiodSD
5.27 1 1.52
5.76 1 1.20
5.83 1 1.05
5.08 I 1.57
5.41 1 1.41
5.30 1 1.35
5.69 1 1.18
5.79 1 1.20
5.01 1 1.60
5.32 1 1.40
5.11 I 1.35
5.56 1 1.23
5.46 1 1.24
Community,
Importance
6.29
6.28
Performance Gap
1.27
0.74
0.69
1.32
0.72
0.78
0.67
0.57
1.41
1.02
0.79
0.57
Junior &
SatisfactiodSD
5.37 1 1.48
5.53 1 1.36
5.41 1 1.38
Technical Colleges
Performance Gap
0.92
0.75
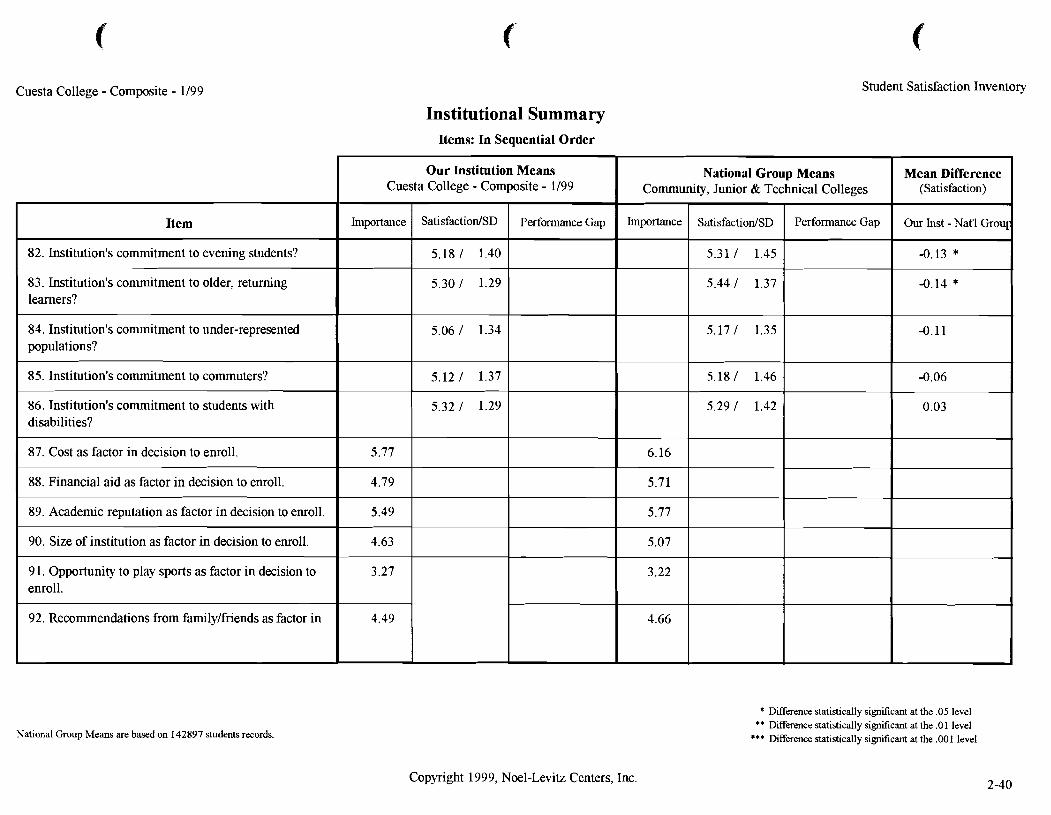
Cuesta College - Composite - 1/99 Student Satisfaction Inventory
Institutional Summary Items: In Sequential Order
National Group Means are based on 142897 students records.
Item
82. Institution's commitment to evening students?
83. Institution's commitment to older, returning learners?
84. Institution's commitment to under-represented populations?
85. Institution's commitment to commuters?
86. Institution's commitment to students with disabilities?
87. Cost as factor in decision to enroll.
88. Financial aid as factor in decision to enroll.
89. Academic reputation as factor in decision to enroll.
90. Size of institution as factor in decision to enroll.
9 1. Opportunity to play sports as factor in decision to enroll.
92. Recommendations from familylfriends as factor in
Copyright 1999, Noel-Levitz Centers, Inc.
* Dflerence statistically significant at the .05 level ** Difference statistically significant at the .O1 level
*** Difference statistically significant at the ,001 level
Our Institution Means Cuesta College - Composite - 1/99
Importance
5.77
4.79
5.49
4.63
3.27
4.49
Mean Difference (Satisfaction)
Our Inst - Nat'l Grou~
-0.13 *
-0.14 *
-0.11
-0.06
0.03
National Group Means
SatisfactiodSD
5.18 / 1.40
5.30 / 1.29
5.06 / 1.34
5.12 / 1.37
5.32 / 1.29
Community,
Importance
6.16
5.71
5.77
5.07
3.22
4.66
Performance Gap
Junior 62
SatisfactiodSD
5.31 / 1.45
5.44 / 1.37
5.17 / 1.35
5.18 / 1.46
5.29 / 1.42
Technical Colleges
Performance Gap
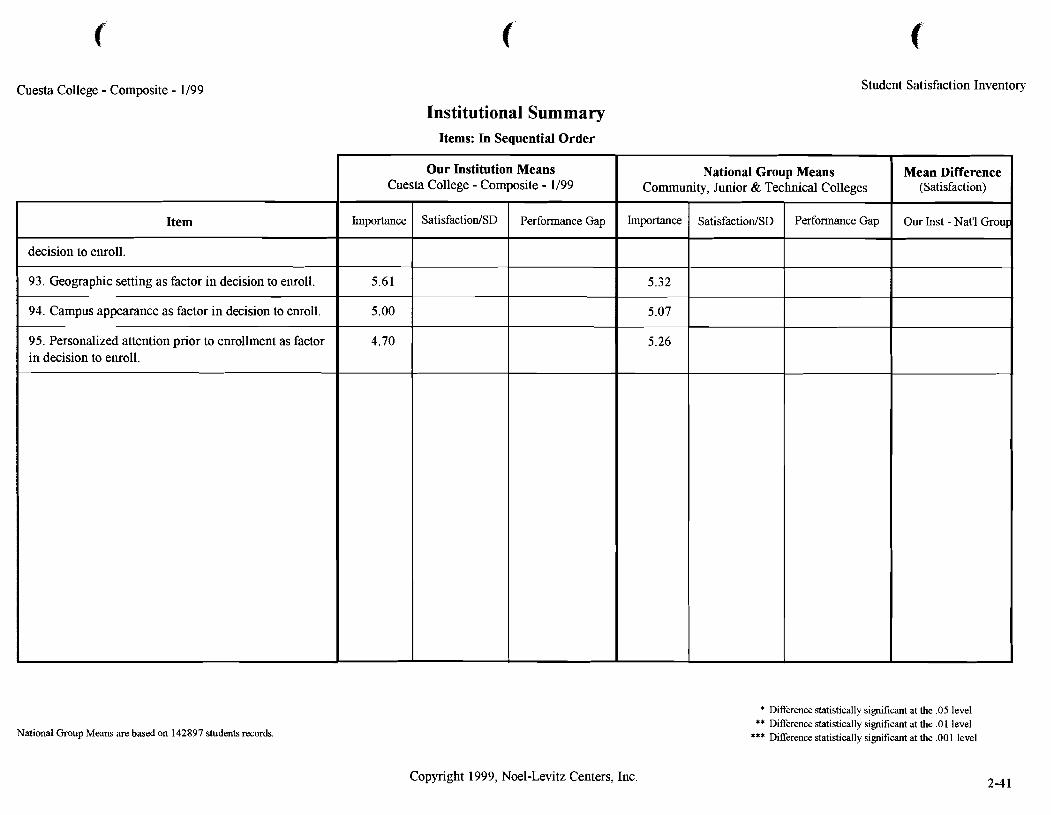
Cuesta College - Composite - 1/99 Student Satisfaction Inventory
Institutional Summary Items: In Sequential Order
National Group Means are based on 142897 students records.
Item
decision to enroll.
93. Geographic setting as factor in decision to enroll.
94. Campus appearance as factor in decision to enroll.
95. Personalized attention prior to enrollment as factor in decision to enroll.
Copyright 1999, Noel-Levitz Centers, Inc.
* Difference statistically sigruf~cant at the .05 level ** Difference statistically signficant at the .O1 level
*** Difference statistically significant at the ,001 level
Our Institution Means Cuesta College - Composite - 1/99
Importance
5.61
5.00
4.70
Mean Difference (Satisfaction)
Our Inst - Nat'l Grou~:
National Group Means
SatisfactiodSD Performance Gap
Technical Colleges
Performance Gap
Community,
Importance
5.32
5.07
5.26
Junior &
SatisfactiodSD
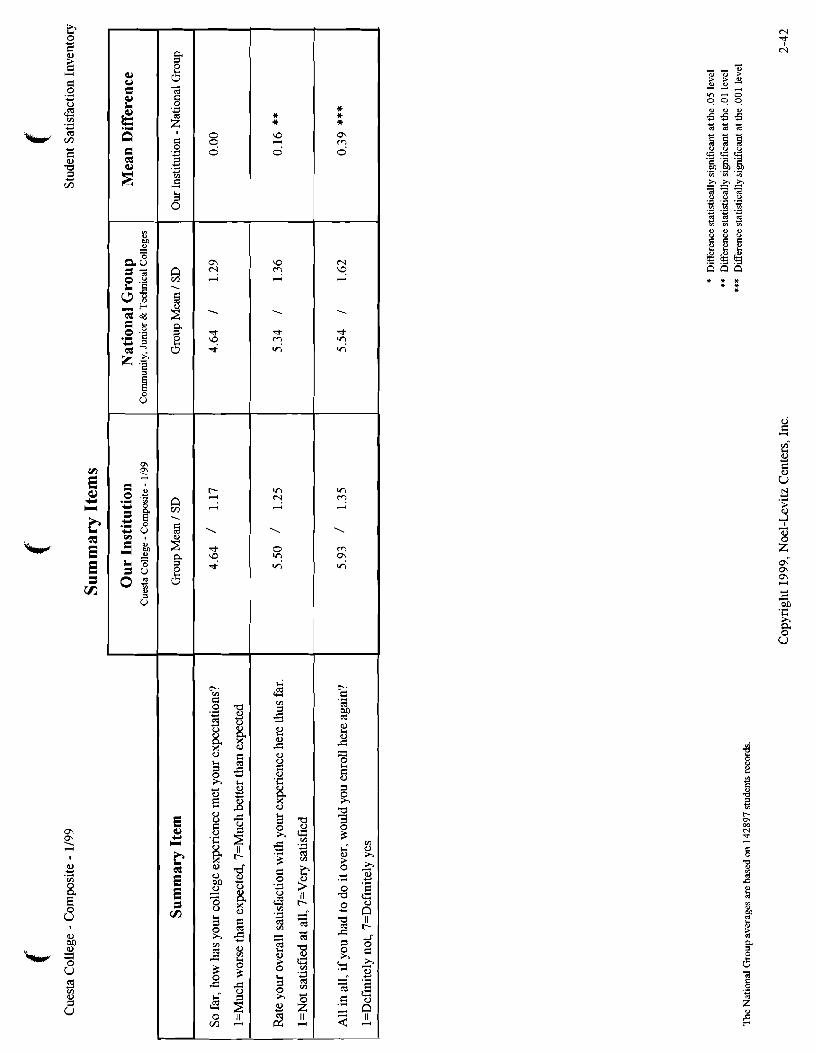
a Col 1998
b =nt nta
Year Report lege - Composite and Fall 1995
Satisfaction
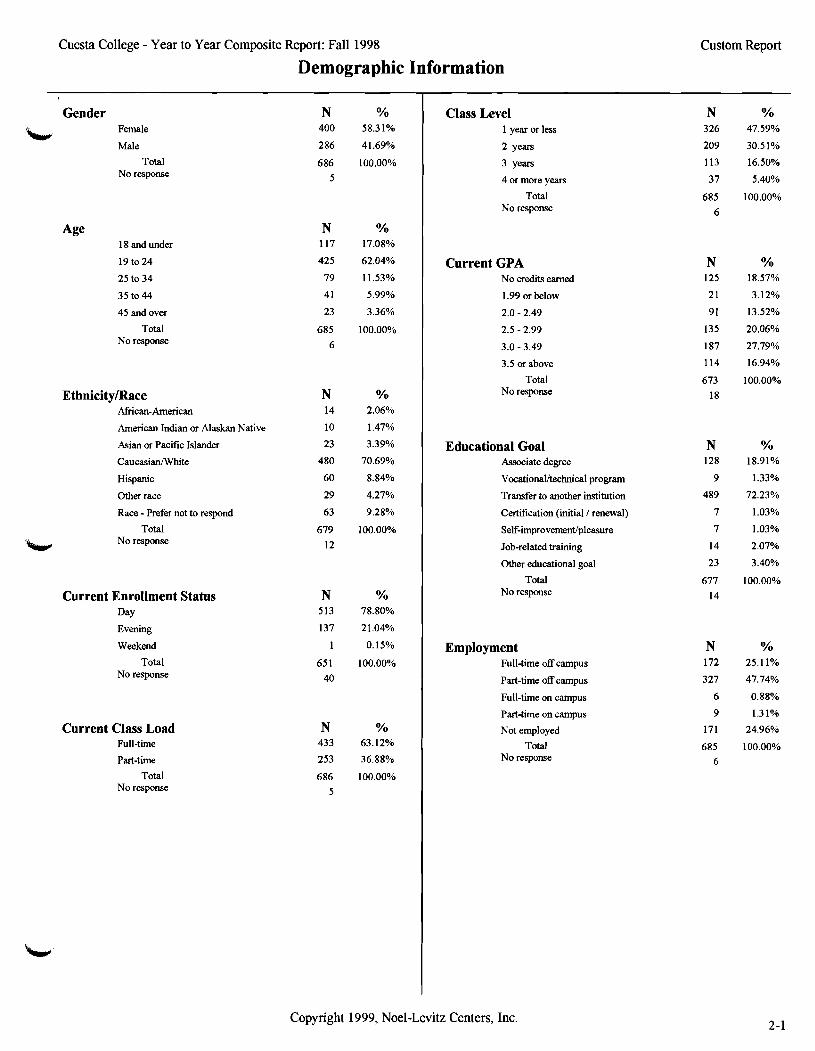
Cuesta College - Year to Year Composite Report: Fall 1998 Custom Report
Demographic Information
Gender Female
Male
Total No response
Age 18 and under
19 to24
25 to 34
35 to44
45 and over
Total No response
EthnicityIRace African-American
American Indian or Alaskan Native
Asian or Pacific Islander
CaucasianIWhite
Hispanic
Other race
Race - Prefer not to respond
Total No response
Current Enrollment Status Day Evening
Weekend
Total No response
Current Class Load Full-time
Part-time
Total No response
Class Level 1 year or less
2 years
3 years
4 or more years
Total No response
Current GPA No credits earned
1.99 or below
2.0 - 2.49
2.5 - 2.99
3.0 - 3.49
3.5 or above
Total No response
Educational Goal Associate degree
VocationaVtechnical program
Transfer to another institution
Certification (initial 1 renewal)
Self-improvement/pleasure
Job-related training
Other educational goal
Total No response
Employment Full-time off campus
Part-time off campus
Full-time on campus
Part-time on campus
Not employed
Total No response
Copyr~ght 1999, Noel-Levitz Centers, Inc.

Cuesta College - Year to Year Composite Report: Fall 1998 Custom Report
Demographic Information
Current Residence Residence hall
Own house
Rent room or apt off campus
Parent's home
Other residence
Total No respom
Residence Classification In-state
Out-of-state
International (not U.S. citizen)
Total No response
Disabilities Yes - Disability
No - Disability
Total No response
Institution Was My
"siv 1 st choice
2nd choice
3rd choice or lower
Total No response
Institution Question Campus Item - Answer 1
Campus ltem - Answer 2
Campus Item - Answer 3
Campus Item - Answer 4
Campus Item - Answer 5
Campus Item - Answer 6
Total No response
Selection of ProgramIMajor 0000
0005
0101
0109
01 12
0114
0199
0299
0499
0502
0506
0509
0511
0601
0602
0603
Copyright 1999, Noel-Levitz Centers, Inc.
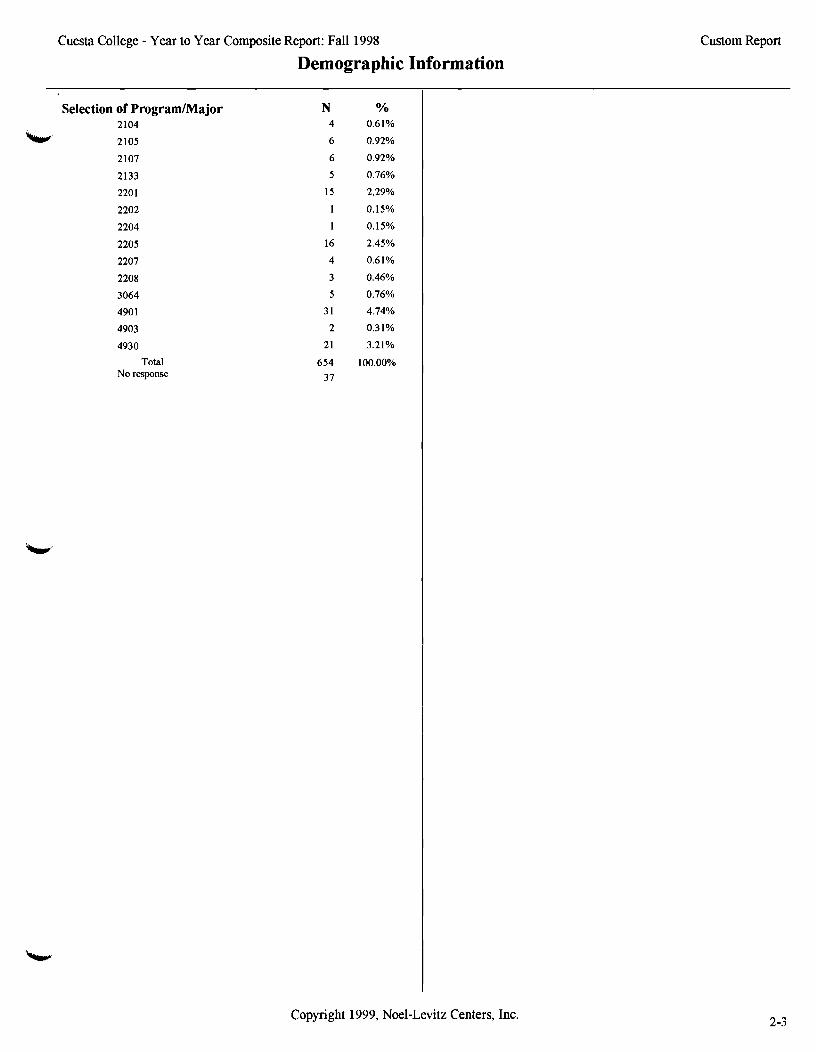
Cuesta College - Year to Year Composite Report: Fall 1998 Custom Report
Demographic Information
Selection of Program/Major N YO 2104 4 0.61%
'cu 2105 6 0.92%
2107 6 0.92%
2133 5 0.76%
220 1 15 2.29%
2202 1 0.15%
2204 1 0.15%
2205 16 2.45%
2207 4 0.61%
2208 3 0.46%
3064 5 0.76%
490 1 3 1 4.74%
4903 2 0.31%
4930 21 3.21%
Total 654 100.00% No response 37
Copyright 1999, Noel-Levitz Centers, Inc.

Cuesta College - Year to Year Composite Report: Fall 1995 Custom Report
Demographic Information
Gender Female
Male
Total No response
Age 18 and under
45 and over
Total No response
American Indian or Alaskan Native
Asian or Pacific Islander
CaucasianJWhite
Hispanic
Other race
Race - Prefer not to respond
Total No response
Current Enrollment Status Day Evening
Weekend
Total No response
Current Class Load Full-time
Part-time
Total No response 20
Class Level 1 year or less
2 years
3 years
4 or more years
Total No response
Current GPA No credits earned
1.99 or below
2.0 - 2.49
2.5 - 2.99
3.0 - 3.49
3.5 or above
Total No response
, Educational Goal Associate degree
Vocationa~chnical program
Transfer to another institution
Certification (initial 1 renewal)
Job-related training
Other educational goal
Total No response
Employment Full-time off campus
Part-time off campus
Full-time on campus
Part-time on campus
Not employed
Total No response
Copyright 1999, Noel-Levitz Centers, Inc.
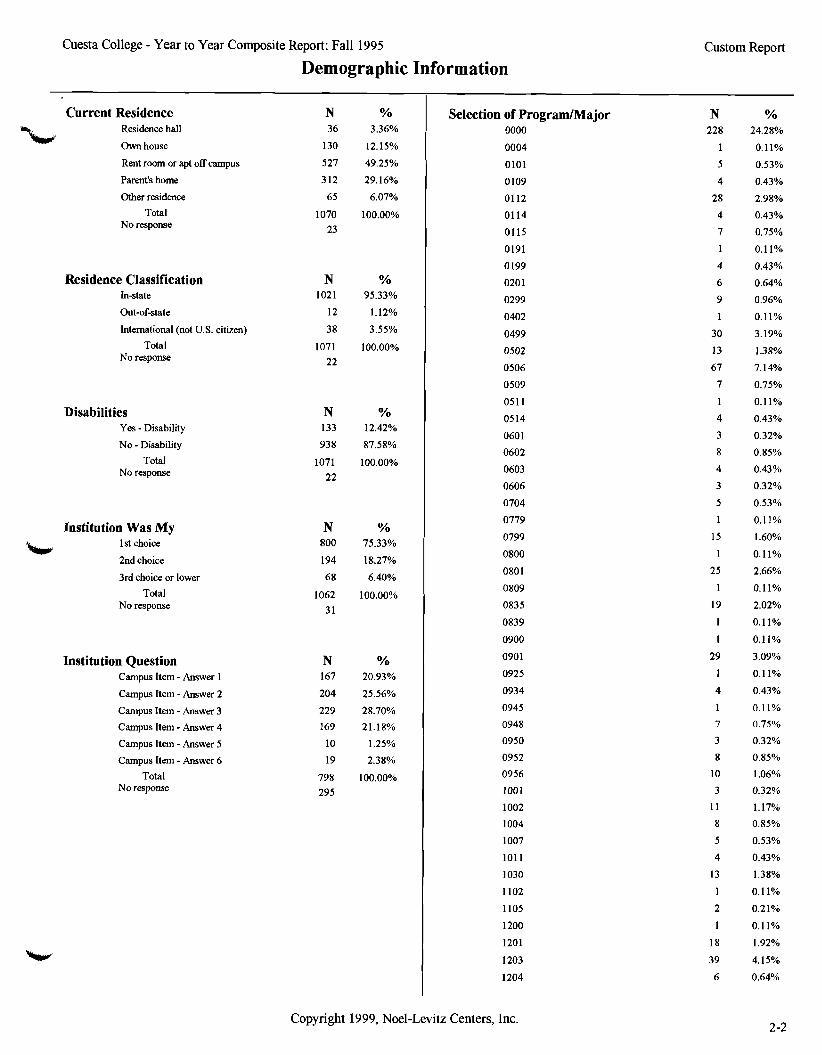
Cuesta College - Year to Year Composite Report: Fall 1995 Custom Report
Demographic Information
Current Residence Residence hall
Own house
Rent room or apt off campus
Parent's home
Other residence
Total No response
Residence Classification In-state
Out-of-state
International (not U.S. citizen)
Total No response
Disabilities Yes - Disability
No - Disability
Total No response
Institution Was My 1 st choice
2nd choice
3rd choice or lower
Total No response
Institution Question Campus Item - Answer 1
Campus Item - Answer 2
Campus Item - Answer 3
Campus Item - Answer 4
Campus ltem - Answer 5
Campus Item - Answer 6
Total No response
Selection of ProgramIMajor 0000
0004
0101
0109
01 12
0114
0115
0191
0199
020 1
0299
0402
0499
0502
0506
0509
0511
0514
0601
0602
0603
0606
0704
Copyright 1999, Noel-Levitz Centers, Inc.
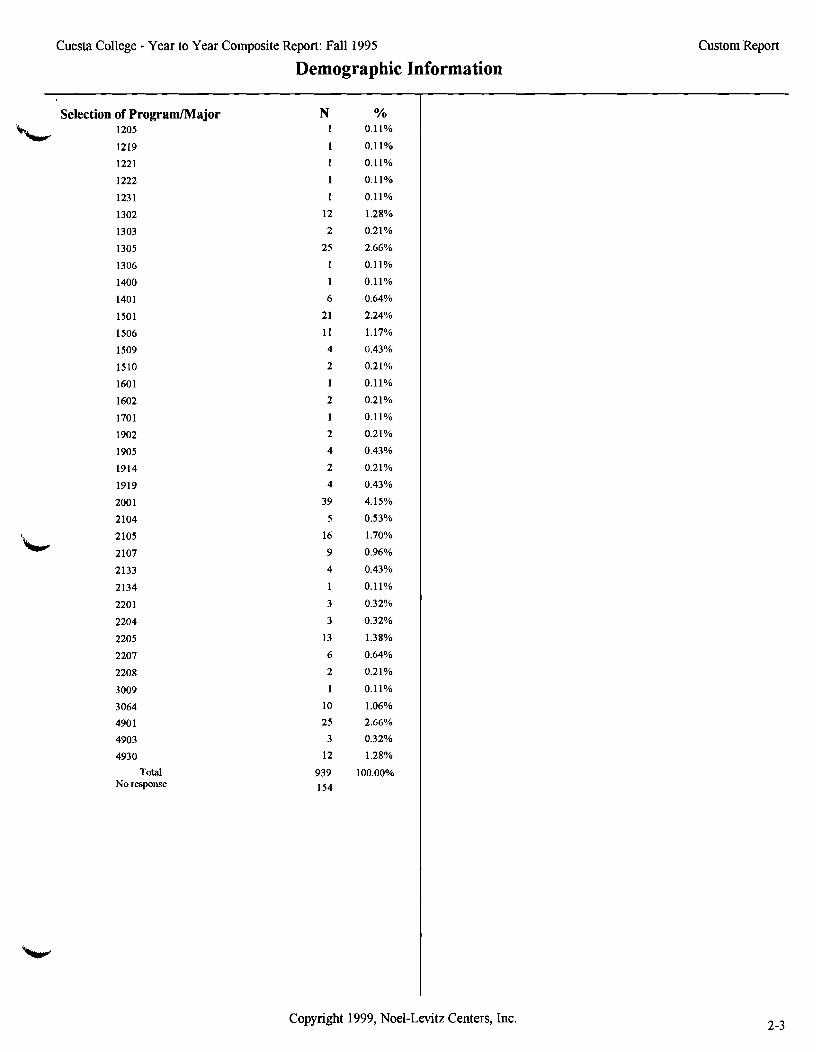
Cuesta College - Year to Year Composite Report: Fall 1995 Custom Report
Demographic Information
Selection of ProgramIMajor 1205
1219
1221
1222
123 1
1302
1303
1305
1306
1400
1401
1501
1506
1509
1510
1601
1602
1701
1902
1905
1914
1919
200 1
2104
2133
2134
220 1
2204
2205
2207
2208
3009
3064
490 1
4903
4930
Total No response
Copyright 1999, Noel-Levitz Centers, Inc.
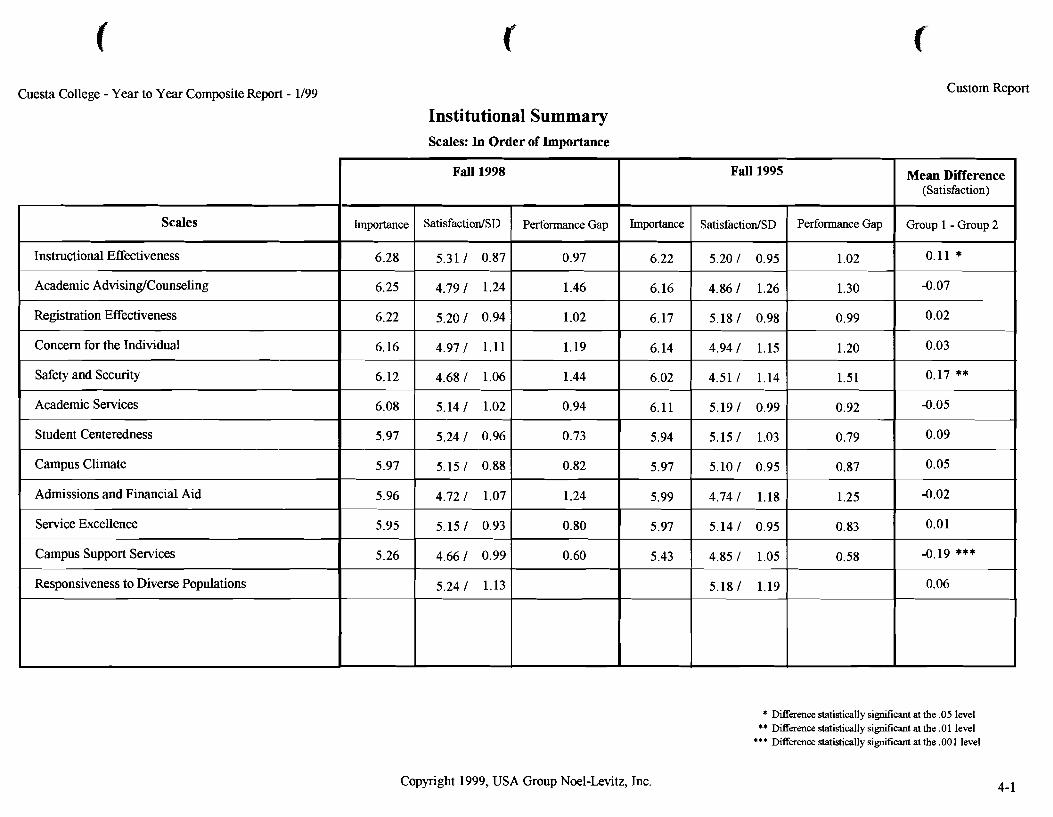
Cuesta College - Year to Year Composite Report - 1199 Custom Report
Institutional Summary Scales: In Order of Importance
* Dierence statistically sisruflcant at the .05 level ** DBerence statistically si&lcant at the .Ol level
*** DifFerence statistically si&~cant at the ,001 level
Scales
Instructional Effectiveness
Academic AdvisinglCounseling
Registration Effectiveness
Concern for the Individual
Safety and Security
Academic Services
Student Centeredness
Campus Climate
Admissions and Financial Aid
Service Excellence
Campus Support Services
Responsiveness to Diverse Populations
Copyright 1999, USA Group Noel-Levitz, Inc.
Mean Difference (Satisfaction)
Group 1 - Group 2
0.11 *
-0.07
0.02
0.03
0.17 **
-0.05
0.09
0.05
-0.02
0.01
-0.19 ***
0.06
Fall 1998
Importance
6.28
6.25
6.22
6.16
6.12
6.08
5.97
5.97
5.96
5.95
5.26
Fall 1995
Importance
6.22
6.16
6.17
6.14
6.02
6.11
5.94
5.97
5.99
5.97
5.43
SatisfactiodSD
5.31 1 0.87
4.79 1 1.24
5.20 1 0.94
4.97 1 1.11
4.68 1 1.06
5.14 I 1.02
5.24 1 0.96
5.15 1 0.88
4.72 1 1.07
5.15 1 0.93
4.66 1 0.99
5.24 1 1.13
Performance Gap
0.97
1.46
1.02
1.19
1.44
0.94
0.73
0.82
1.24
0.80
0.60
SatisfactiodSD
5.20 1 0.95
4.86 1 1.26
5.18 1 0.98
4.94 1 1.15
4.51 1 1.14
5.19 1 0.99
5.15 1 1.03
5.10 1 0.95
4.74 1 1.18
5.14 1 0.95
4.85 1 1.05
5.18 1 1.19
Performance Gap
1.02
1.30
0.99
1.20
1.51
0.92
0.79
0.87
1.25
0.83
0.58
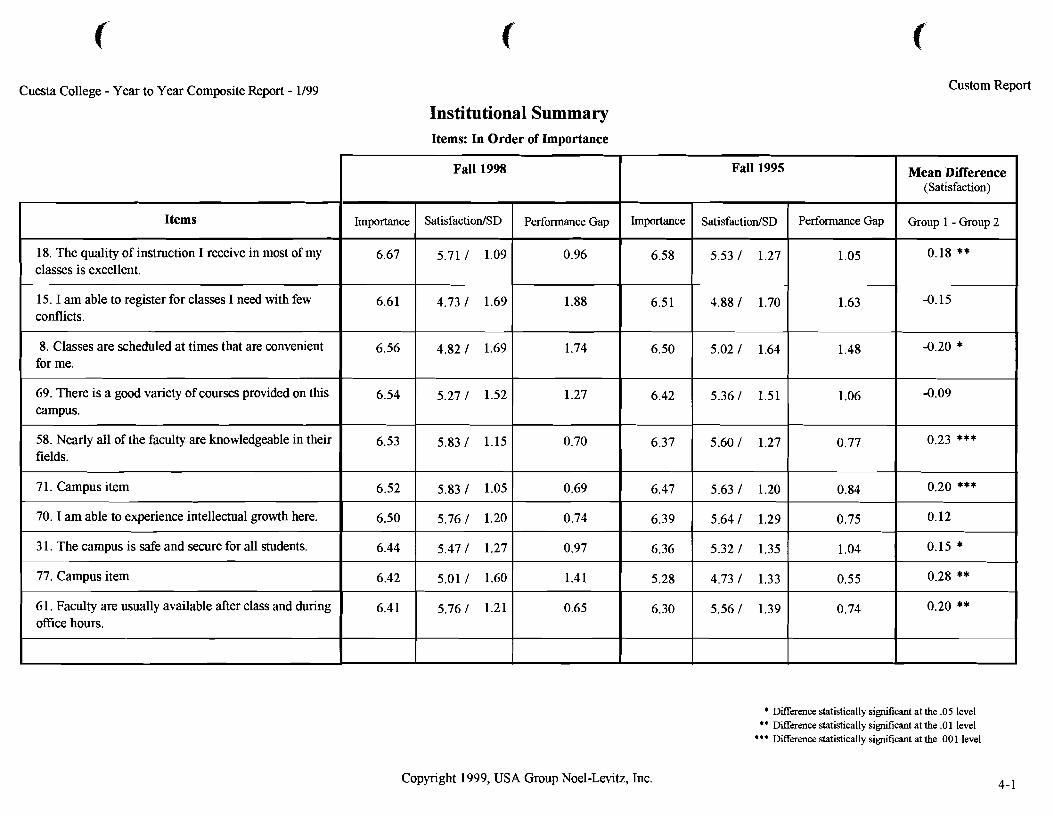
Cuesta College - Year to Year Composite Report - 1/99 Custom Report
Institutional Summary Items: In Order of Importance
* Difference statistically sigruficant at the .05 level " Difference statistically si&cant at the .0 1 level
"* Difference statistically s i d ~ c a n t at the .001 level
Items
18. The quality of instruction I receive in most of my classes is excellent.
15. I am able to register for classes I need with few conflicts.
8. Classes are scheduled at times that are convenient for me.
69. There is a good variety of courses provided on this campus.
58. Nearly all of the faculty are knowledgeable in their fields.
7 1. Campus item
70. I am able to experience intellectual growth here.
3 1. The campus is safe and secure for all students.
77. Campus item
6 1. Faculty are usually available after class and during office hours.
Copyright 1999, USA Group Noel-Levitz, Inc.
Pall 1998
Importance
6.67
6.61
6.56
6.54
6.53
6.52
6.50
6.44
6.42
6.41
Mean Difference (Satisfaction)
Group 1 - Group 2
0.18 **
-0.15
-0.20 *
-0.09
0.23 ***
0.20 ***
0.12
0.15 *
0.28 **
0.20 **
Pall 1995
Importance
6.58
6.5 1
6.50
6.42
6.37
6.47
6.39
6.36
5.28
6.30
SatisfactiodSD
5.71 1 1.09
4.73 1 1.69
4.82 1 1.69
5.27 1 1.52
5.83 1 1.15
5.83 I 1.05
5.76 I 1.20
5.47 1 1.27
5.01 I 1.60
5.76 I 1.21
Performance Gap
0.96
1.88
1.74
1.27
0.70
0.69
0.74
0.97
1.41
0.65
SatisfactiodSD
5.53 1 1.27
4.88 1 1.70
5.02 1 1.64
5.36 1 1.51
5.60 I 1.27
5.63 I 1.20
5.64 I 1.29
5.32 I 1.35
4.73 1 1.33
5.56 I 1.39
Performance Gap
1.05
1.63
1.48
1.06
0.77
0.84
0.75
1.04
0.55
0.74
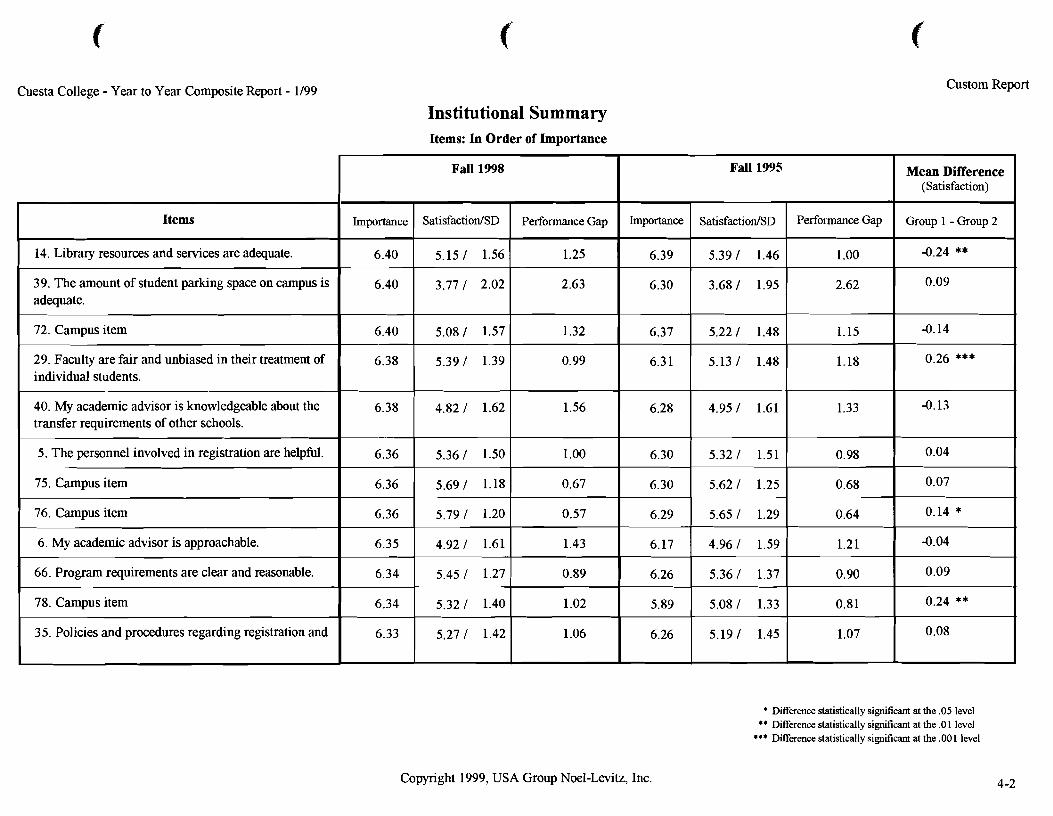
Cuesta College - Year to Year Composite Report - 1/99 Custom Report
Institutional Summary Items: In Order of Importance
* Difference statistically sigruficant at the .05 level ** Difference statistically sigruficant at the .O 1 level
*** Difference statistically sigruf~cant at the .OO 1 level
Items
14. Library resources and services are adequate.
39. The amount of student parking space on campus is adequate.
72. Campus item
29. Faculty are fair and unbiased in their treatment of individual students.
40. My academic advisor is knowledgeable about the transfer requirements of other schools.
5. The personnel involved in registration are helpful.
75. Campus item
76. Campus item
6. My academic advisor is approachable.
66. Program requirements are clear and reasonable.
78. Campus item
35. Policies and procedures regarding registration and
Copyright 1999, USA Group Noel-Levitz, Inc.
Mean Difference (Satisfaction)
Group 1 - Group 2
-0.24 **
0.09
-0.14
0.26 ***
-0.13
0.04
0.07
0.14 *
-0.04
0.09
0.24 **
0.08
Pall 1998 Pall 1995
Importance
6.40
6.40
6.40
6.38
6.38
6.36
6.36
6.36
6.35
6.34
6.34
6.33
Importance
6.39
6.30
6.37
6.3 1
6.28
6.30
6.30
6.29
6.17
6.26
5.89
6.26
SatisfactiodSD
5.15 1 1.56
3.77 1 2.02
5.08 1 1.57
5.39 1 1.39
4.82 I 1.62
5.36 I 1.50
5.69 I 1.18
5.79 I 1.20
4.92 I 1.61
5.45 I 1.27
5.32 I 1.40
5.27 I 1.42
SatisfactiodSD
5.39 1 1.46
3.68 1 1.95
5.22 1 1.48
5.13 1 1.48
4.95 I 1.61
5.32 I 1.51
5.62 I 1.25
5.65 I 1.29
4.96 I 1.59
5.36 I 1.37
5.08 I 1.33
5.19 I 1.45
Performance Gap
1.25
2.63
1.32
0.99
1.56
1.00
0.67
0.57
1.43
0.89
1.02
1.06
Performance Gap
1 .OO
2.62
1.15
1.18
1.33
0.98
0.68
0.64
1.21
0.90
0.81
1.07
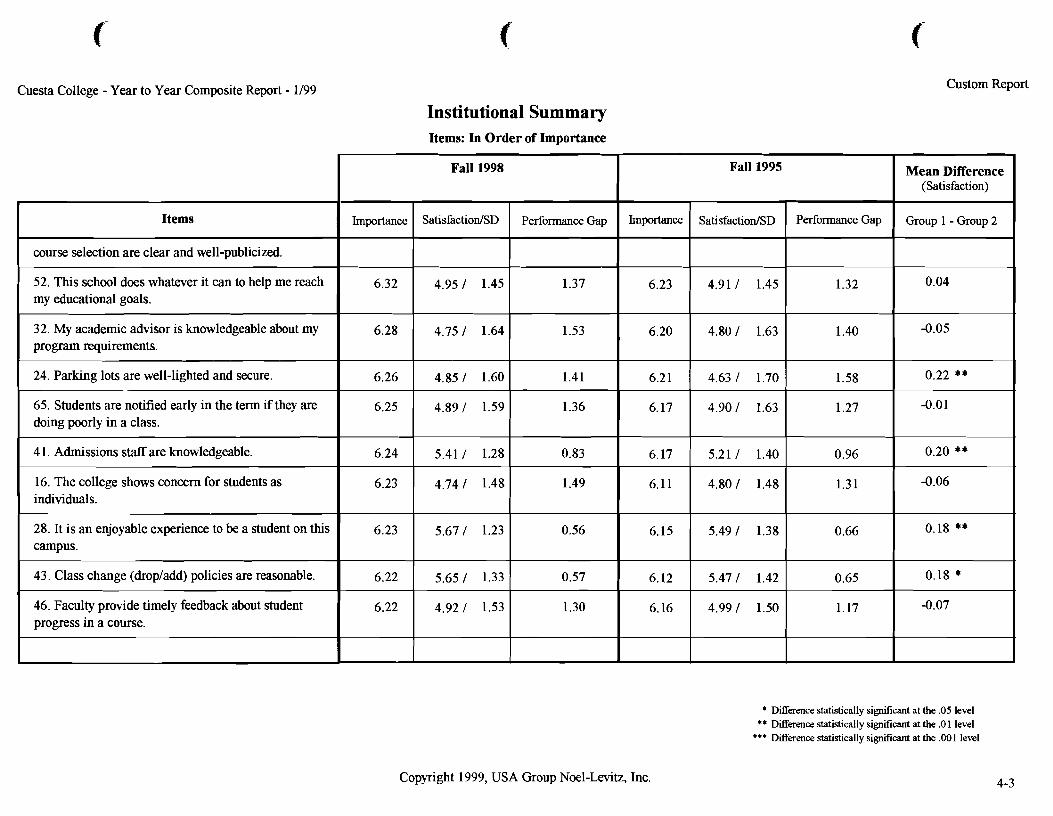
Cuesta College - Year to Year Composite Report - 1/99 Custom Report
Institutional Summary Items: In Order of Importance
Dflerence statistically sigl.f~cant at the .05 level ** Difference statistically sigl.f~cant at the .O1 level
*** Difference statistically significant at the ,001 level
Items
course selection are clear and well-publicized.
52. This school does whatever it can to help me reach my educational goals.
32. My academic advisor is knowledgeable about my program requirements.
24. Parking lots are well-lighted and secure.
65. Students are notified early in the term if they are doing poorly in a class.
4 1. Admissions staff are knowledgeable.
16. The college shows concern for students as individuals.
28. It is an enjoyable experience to be a student on tlus campus.
43. Class change (dropladd) policies are reasonable.
46. Faculty provide timely feedback about student progress in a course.
Copyright 1999, USA Group Noel-Levitz, Inc.
Fall 1998
Importance
6.32
6.28
6.26
6.25
6.24
6.23
6.23
6.22
6.22
Mean Difference (Satisfaction)
Group 1 - Group 2
0.04
-0.05
0.22 **
-0.01
0.20 **
-0.06
0.18 **
0.18 *
-0.07
Fall 1995
Importance
6.23
6.20
6.2 1
6.17
6.17
6.11
6.15
6.12
6.16
SatisfactiodSD
4.951 1.45
4.75 / 1.64
4.85 / 1.60
4.89 / 1.59
5.41 / 1.28
4.74 / 1.48
5.67 1 1.23
5.65 / 1.33
4.92 / 1.53
Performance Gap
1.37
1.53
1.41
1.36
0.83
1.49
0.56
0.57
1.30
SatisfactiodSD
4.91 / 1.45
4.80 / 1.63
4.63 / 1.70
4.90 / 1.63
5.21 / 1.40
4.80 / 1.48
5.49 1 1.38
5.47 / 1.42
4.99 / 1.50
Performance Gap
1.32
1.40
1.58
1.27
0.96
1.31
0.66
0.65
1.17
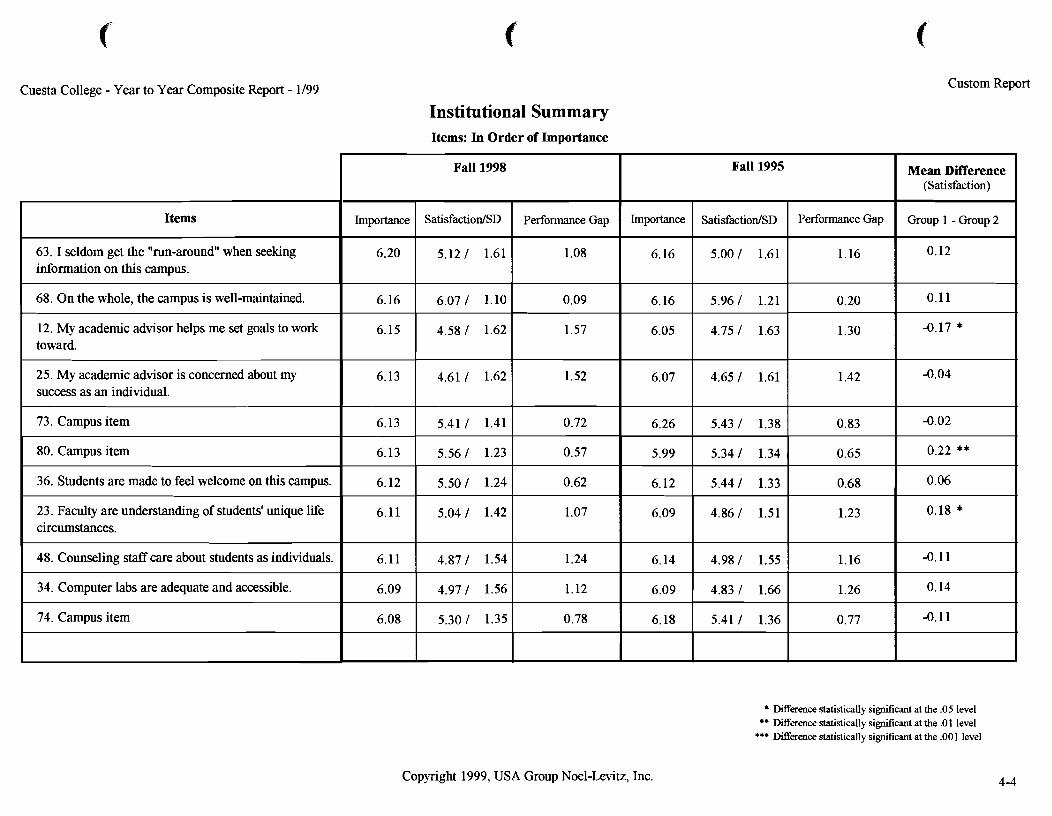
Cuesta College - Year to Year Composite Report - 1/99 Custom Report
Institutional Summary Items: In Order of Importance
Difference statistically simcant at the .05 level ** Difference statistically simcant at the .0 1 level
*** Difference statistically significant at the .00 1 level
Items
63. I seldom get the "run-around" when seeking information on this campus.
68. On the whole, the campus is well-maintained.
12. My academic advisor helps me set goals to work toward.
25. My academic advisor is concerned about my success as an individual.
73. Campus item
80. Campus item
36. Students are made to feel welcome on this campus.
23. Faculty are understanding of students' unique life circumstances.
48. Counseling staff care about students as individuals.
34. Computer labs are adequate and accessible.
74. Campus item
Copyright 1999, USA Group Noel-Levitz, Inc.
Fall 1998
Importance
6.20
6.16
6.15
6.13
6.13
6.13
6.12
6.11
6.11
6.09
6.08
Mean Difference (Satisfaction)
Group 1 - Group 2
0.12
0.11
-0.17 *
-0.04
-0.02
0.22 **
0.06
0.18 *
-0.11
0.14
-0.11
Fall 1995
SatisfactiodSD
5.12 1 1.61
6.07 1 1.10
4.58 / 1.62
4.61 / 1.62
5.41 I 1.41
5.56 I 1.23
5.50 I 1.24
5.04 I 1.42
4.87 I 1.54
4.97 I 1.56
5.30 I 1.35
Performance Gap
1.16
0.20
1.30
1.42
0.83
0.65
0.68
1.23
1.16
1.26
0.77
Importance
6.16
6.16
6.05
6.07
6.26
5.99
6.12
6.09
6.14
6.09
6.18
Performance Gap
1.08
0.09
1.57
1.52
0.72
0.57
0.62
1.07
1.24
1.12
0.78
SatisfactiodSD
5.00 1 1.61
5.96 1 1.21
4.75 I 1.63
4.65 I 1.61
5.43 I 1.38
5.34 I 1.34
5.44 I 1.33
4.86 I 1.51
4.98 I 1.55
4.83 I 1.66
5.41 / 1.36
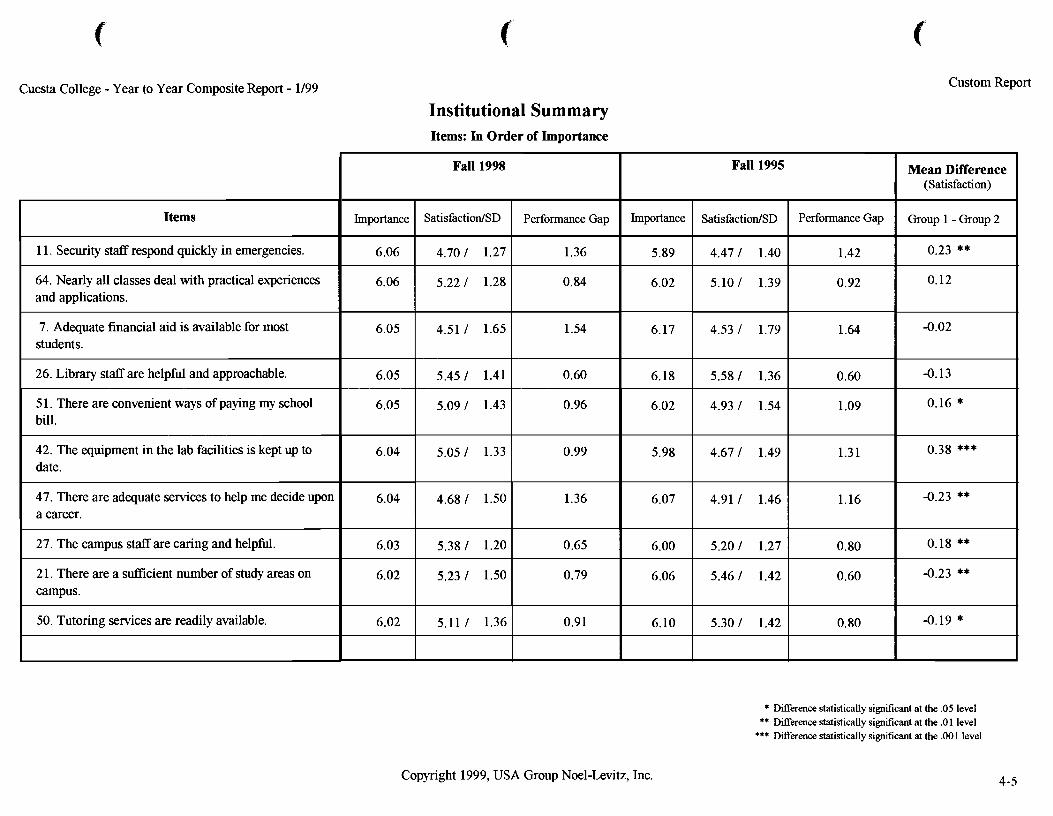
Cuesta College - Year to Year Composite Report - 1/99 Custom Report
Institutional Summary Items: In Order of Importance
Difference statistically significant at the .05 level ** Difference statistically significant at the .Ol level
*** Difference statistically significant at the ,001 level
Items
1 1. Security staff respond quickly in emergencies.
64. Nearly all classes deal with practical experiences and applications.
7. Adequate financial aid is available for most students.
26. Library staff are helpful and approachable.
5 1. There are convenient ways of paying my school bill.
42. The equipment in the lab facilities is kept up to date.
47. There are adequate services to help me decide upon a career.
27. The campus staff are caring and helpful.
2 1. There are a sufficient number of study areas on campus.
50. Tutoring services are readily available.
Copyright 1999, USA Group Noel-Levitz, Inc.
Fall 1998
Importance
6.06
6.06
6.05
6.05
6.05
6.04
6.04
6.03
6.02
6.02
Mean Difference (Satisfaction)
Group 1 - Group 2
0.23 **
0.12
-0.02
-0.13
0.16 *
0.38 ***
-0.23 **
0.18 **
-0.23 **
-0.19 *
Fall 1995
SatisfactiodSD
4.70 / 1.27
5.22 / 1.28
4.51 / 1.65
5.45 / 1.41
5.09 / 1.43
5.05 / 1.33
4.68 / 1.50
5.38 / 1.20
5.23 / 1.50
5.11 / 1.36
Importance
5.89
6.02
6.17
6.18
6.02
5.98
6.07
6.00
6.06
6.10
Performance Gap
1.36
0.84
1.54
0.60
0.96
0.99
1.36
0.65
0.79
0.91
SatisfactiodSD
4.47 / 1.40
5.10 / 1.39
4.53 / 1.79
5.58 / 1.36
4.93 / 1.54
4.67 / 1.49
4.91 / 1.46
5.20 / 1.27
5.46 / 1.42
5.30 / 1.42
Performance Gap
1.42
0.92
1.64
0.60
1.09
1.3 1
1.16
0.80
0.60
0.80
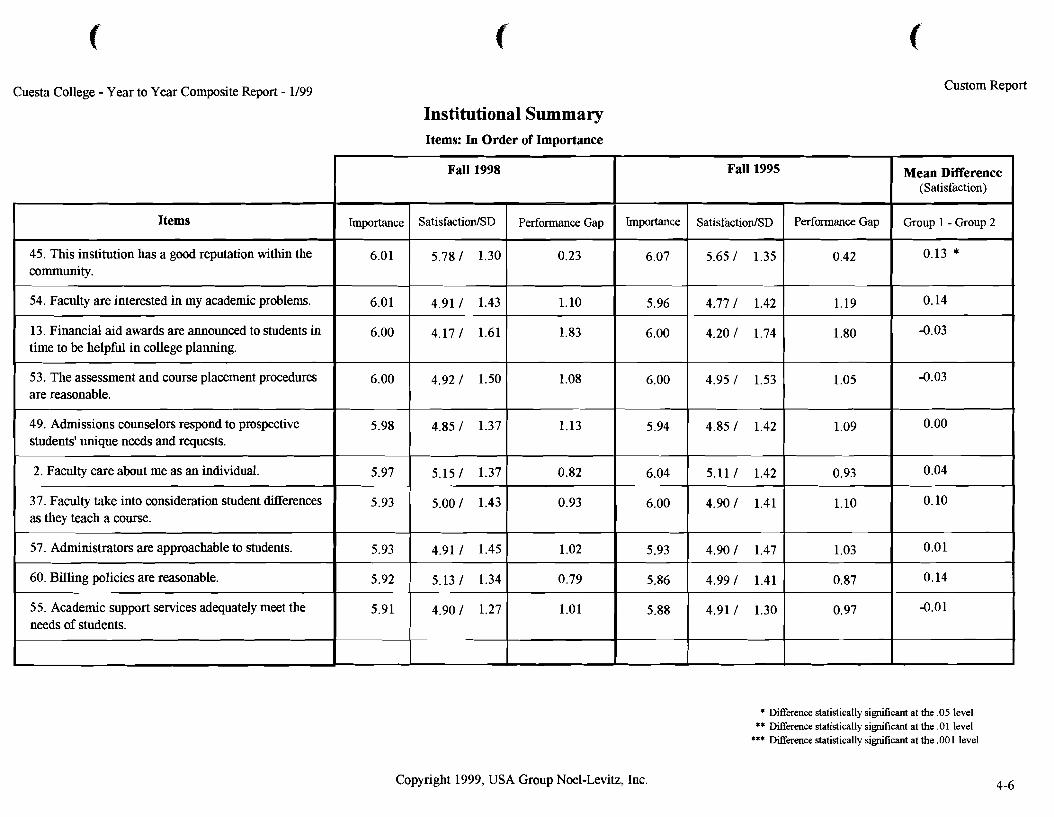
Cuesta College - Year to Year Composite Report - 1/99 Custom Report
Institutional Summary Items: In Order of Importance
* Difference statistically sigruf~cant at the .05 level ** Difference statistically significant at the .O1 level
*** Difference statistically significant at the .OO 1 level
Copyright 1999, USA Group Noel-Levitz, Inc.
Mean Difference (Satisfaction)
Group 1 - Group 2
0.13 *
0.14
-0.03
-0.03
0.00
0.04 P
Fall 1998 Fall 1995
SatisfactiodSD
5.65 1 1.35
4.77 I 1.42
4.20 I 1.74
4.95 I 1.53
4.85 I 1.42
5.11 I 1.42
Items Importance
37. Faculty take into consideration student differences as they teach a course.
57. Administrators are approachable to students.
60. Billing policies are reasonable.
Performance Gap
0.42
1.19
1.80
1.05
1.09
0.93
5.00 I 1.43
4.91 I 1.45
5.13 I 1.34
4.90 I 1.27
SatisfactiodSD --- 5.78 1 1.30
4.91 I 1.43
4.17 I 1.61
4.92 I 1.50
--- 4.85 I 1.37
5.15 I 1.37
45. This institution has a good reputation within the community.
54. Faculty are interested in my academic problems.
13. Financial aid awards are announced to students in time to be helpful in college planning.
53. The assessment and course placement procedures are reasonable.
5.93
5.93
5.92
6.01
6.01
6.00
6.00
55. Academic support services adequately meet the 5.91 needs of students.
0.93
1.02
0.79
1.01
Performance Gap
0.23
1.10
1.83
1.08
1.13
0.82 ----
Importance
6.07
5.96
6.00
6.00
5.94
6.04
49. Admissions counselors respond to prospective students' unique needs and requests.
2. Faculty care about me as an individual.
5.98
5.97
6.00 0.10
5.93
5.86 ~~~~~~~
5.88
4.90 I 1.47
4.99 1 1.41
4.91 I 1.30
1.03
0.87
0.97
0.01
0.14
-0.01
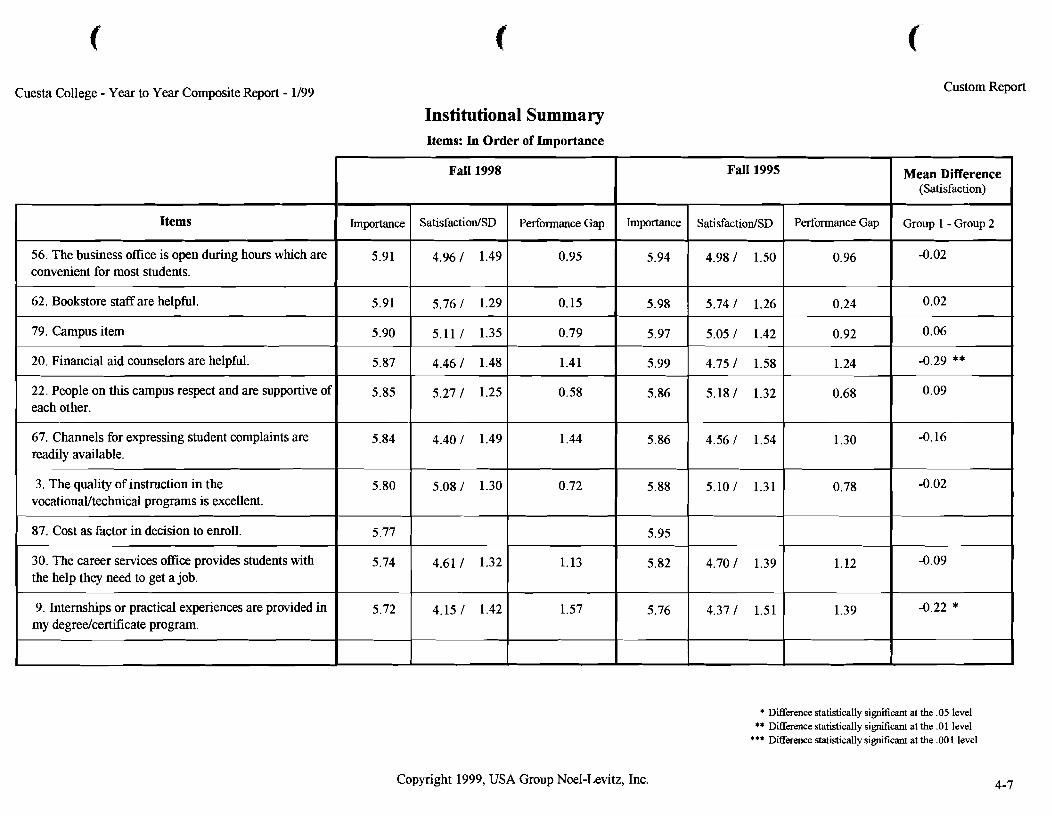
Cuesta College - Year to Year Composite Report - 1199 Custom Report
Institutional Summary Items: In Order of Importance
* Difference statistically si@cant at the .05 level ** Difference statistically sigmfkant at the .O1 level
*** Difference statistically sigruf~cant at the .001 level
Items
56. The business office is open during hours which are convenient for most students.
62. Bookstore staff are helpful.
79. Campus item
20. Financial aid counselors are helpll.
22. People on this campus respect and are supportive of each other.
67. C h a ~ e l S for expressing student complaints are readily available.
3. The quality of instruction in the vocationaYtechnical programs is excellent.
87. Cost as factor in decision to enroll.
30. The career services office provides students with the help they need to get a job.
9. Internships or practical experiences are provided in my degreelcertificate program.
Copyright 1999, USA Group Noel-Levitz, Inc.
Fall 1998
Importance
5.91
5.91
5.90
5.87
5.85
5.84
5.80
5.77
5.74
5.72
Mean Difference (Satisfaction)
Group 1 - Group 2
-0.02
0.02
0.06
-0.29 **
0.09
-0.16
-0.02
-0.09
-0.22 *
Fall 1995
Importance
5.94
5.98
5.97
5.99
5.86
5.86
5.88
5.95
5.82
5.76
SatisfactiodSD
4.96 1 1.49
5.76 1 1.29
5.11 1 1.35
4.46 1 1.48
5.27 1 1.25
4.40 I 1.49
5.08 I 1.30
4.61 I 1.32
4.15 1 1.42
Performance Gap
0.95
0.15
0.79
1.41
0.58
1.44
0.72
1.13
1.57
SatisfactiodSD
4.981 1.50
5.74 1 1.26
5.05 1 1.42
4.75 1 1.58
5.18 1 1.32
4.56 1 1.54
5.10 I 1.31
4.70 I 1.39
4.37 1 1.51
Performance Gap
0.96
0.24
0.92
1.24
0.68
1.30
0.78
1.12
1.39
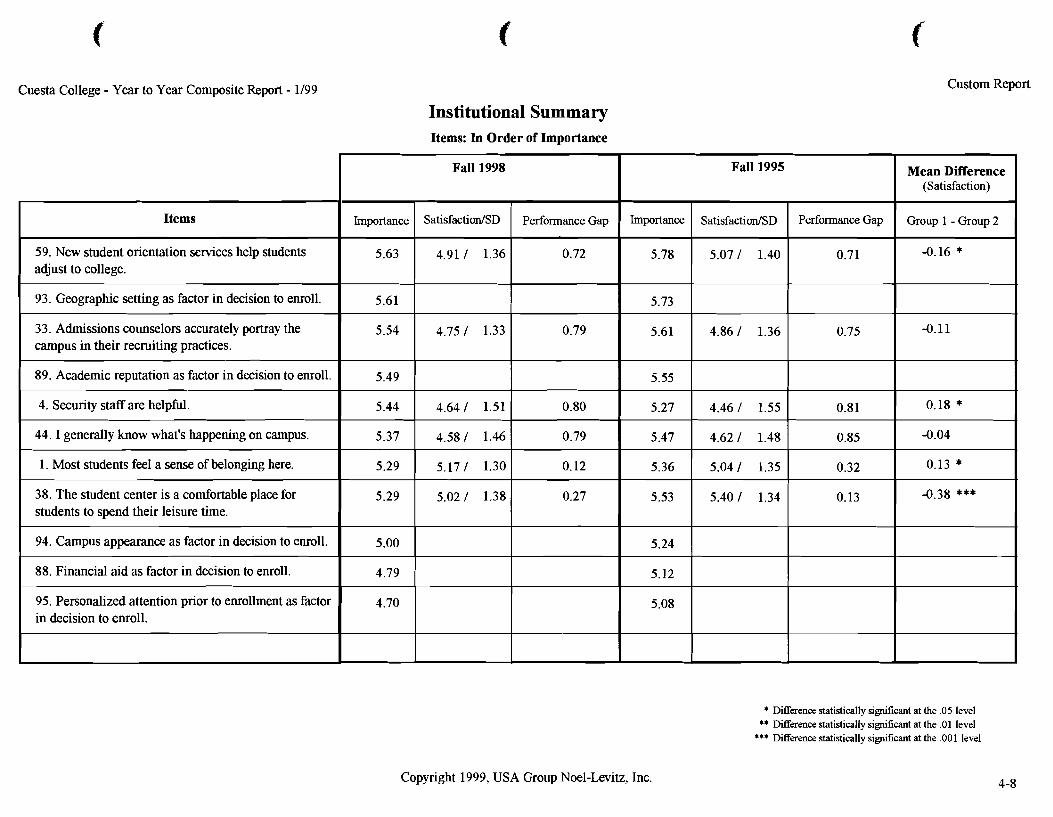
Cuesta College - Year to Year Composite Report - 1199 Custom Report
Institutional Summary Items: In Order of Importance
* Difference statistically sigtuf~cant at the .05 level ** Difference statistically significant at the . O 1 level
*** Difference statistically sigd~cant at the ,001 level
Items
59. New student orientation services help students adjust to college.
93. Geographic setting as factor in decision to enroll.
33. Admissions counselors accurately portray the campus in their recruiting practices.
89. Academic reputation as factor in decision to enroll.
Copyright 1999, USA Group Noel-Levitz, Inc.
Fall 1998
Importance
5.63
5.61
5.54
5.49
Mean Difference (Satisfaction)
Group 1 - Group 2
-0.16 *
-0.11
Fall 1995
4. Security staff are helpful.
44. I generally know what's happening on campus.
1. Most students feel a sense of belonging here.
38. The student center is a comfortable place for students to spend their leisure time.
94. Campus appearance as factor in decision to enroll.
88. Financial aid as factor in decision to enroll.
95. Personalized attention prior to enrollment as factor in decision to enroll.
0.18 *
-0.04
0.13 *
-0.38 ***
SatisfactiodSD
4.91 1 1.36
4.75 I 1.33
4.641 1.51
4.58 / 1.46
5.17 1 1.30
5.02 I 1.38
Importance
5.78
5.73
5.61
5.55
5.27
5.47
5.36
5.53
5.24
5.12
5.08
5.44
5.37
5.29
5.29
5.00
4.79
4.70
Performance Gap
0.72
0.79
-
0.80
0.79
0.12
0.27
SatisfactiodSD
5.07 1 1.40
4.86 1 1.36
4.46 1 1.55
4.62 I 1.48
5.04 1 1.35
5.40 1 1.34
Performance Gap
0.71
0.75
0.81
0.85
0.32
0.13
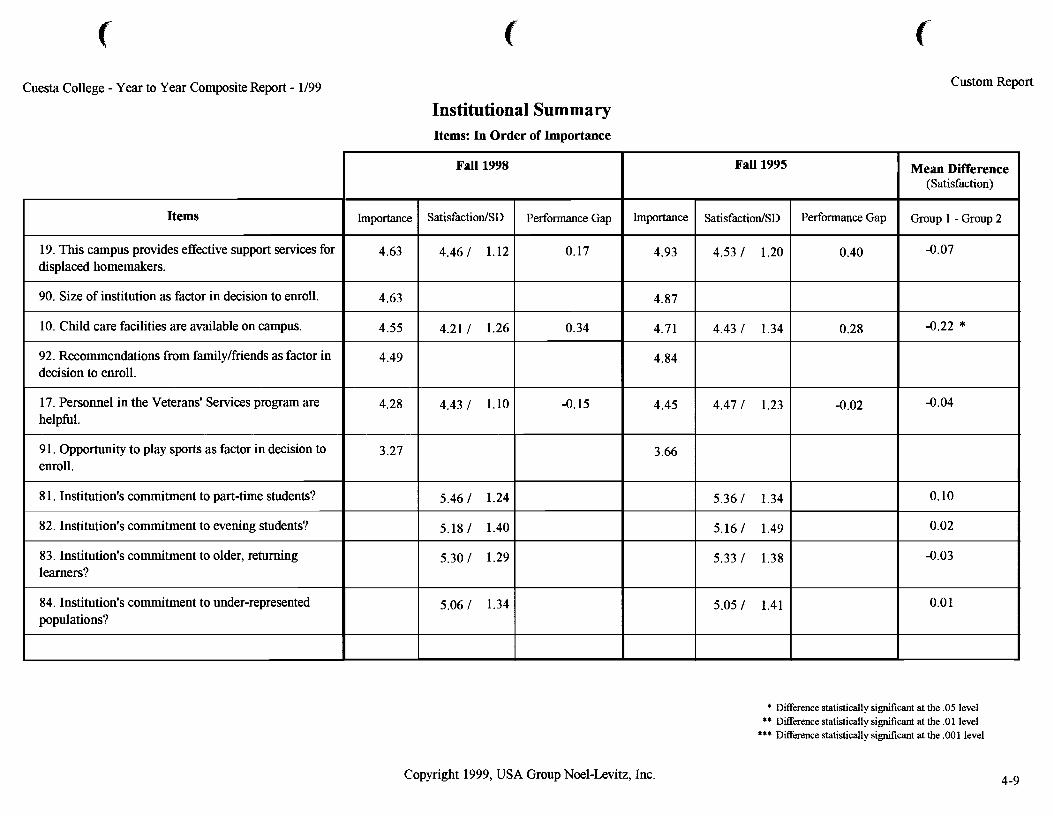
Cuesta College - Year to Year Composite Report - 1/99 Custom Report
Institutional Summary Items: In Order of Importance
Copyright 1999, USA Group Noel-Levitz, Inc.
Items
19. This campus provides effective support services for displaced homemakers.
90. Size of institution as factor in decision to enroll.
10. Child care facilities are available on campus.
92. Recommendations from familylfriends as factor in decision to enroll.
17. Personnel in the Veterans' Services program are helpful.
9 1. Opportunity to play sports as factor in decision to enroll.
8 1. Institution's commitment to part-time students?
82. Institution's commitment to evening students?
83. Institution's commitment to older, returning learners?
84. Institution's commitment to under-represented populations?
* DBerence statistically si&~cant at the .05 level ** DBerence statistically s imcant at the .O1 level
*** DBerence statistically si&~cant at the ,001 level
Fall 1998
Importance
4.63
4.63
4.55
4.49
4.28
3.27
Mean Difference (Satisfaction)
Group 1 - Group 2
-0.07
-0.22 *
-0.04
0.10
0.02
-0.03
0.01
Fall 1995
Importance
4.93
4.87
4.71
4.84
4.45
3.66
SatisfactiodSD
4.46 1 1.12
4.21 1 1.26
4.43 I 1.10
5.46 I 1.24
5.18 I 1.40
5.30 I 1.29
5.06 I 1.34
Performance Gap
0.17
0.34
-0.15
SatisfactiodSD
4.53 1 1.20
4.431 1.34
4.47 I 1.23
5.36 I 1.34
5.16 I 1.49
5.33 I 1.38
5.05 I 1.41
Performance Gap
0.40
0.28
-0.02
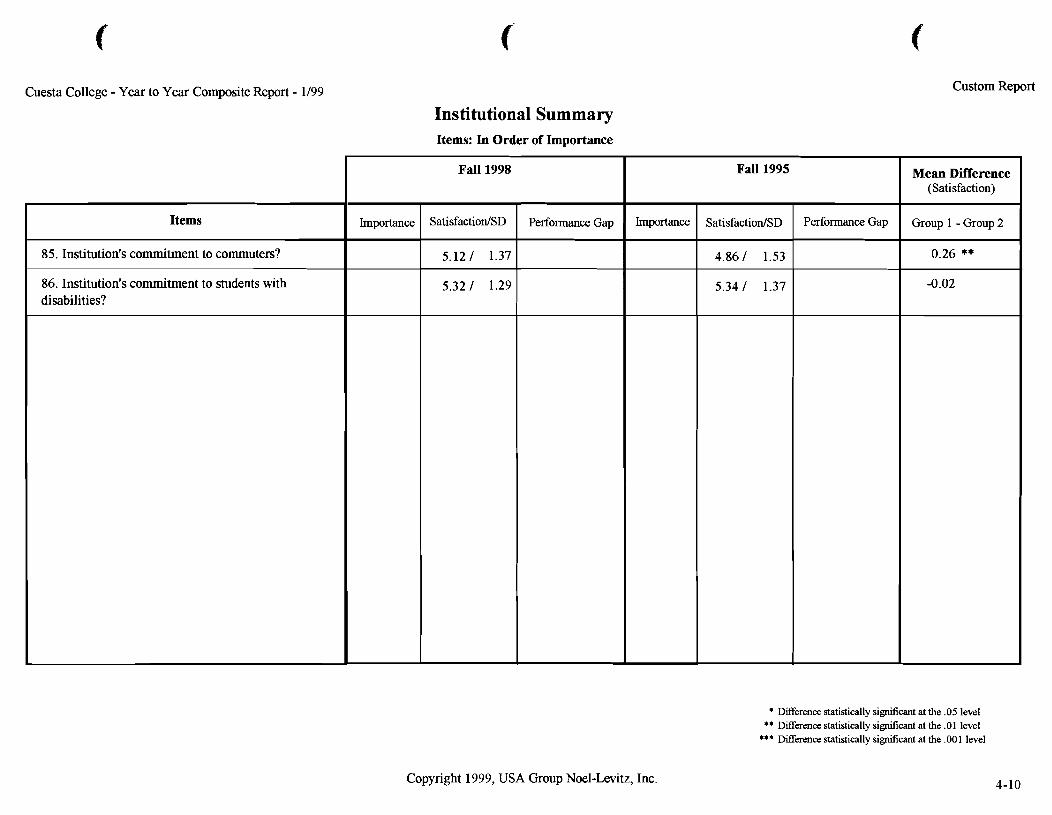
Cuesta College - Year to Year Composite Report - 1199 Custom Report
Institutional Summary Items: In Order of Importance
* Difference statistically sigruf~cant at the .05 level ** Difference statistically sigruflcant at the .01 level
*** Difference statistically sigruf~cant at the .001 level
Items
85. Institution's commitment to commuters?
86. Institution's commitment to students with disabilities?
-
Copyright 1999, USA Group Noel-Levitz, Inc.
Fall 1998
Importance
Mean Difference (Satisfaction)
Group 1 - Group 2
0.26 **
-0.02
Fall 1995
SatisfactiodSD
5.12 1 1.37
5.32 1 1.29
Importance Performance Gap SatisfactiodSD
4.86 1 1.53
5.34 1 1.37
Performance Gap
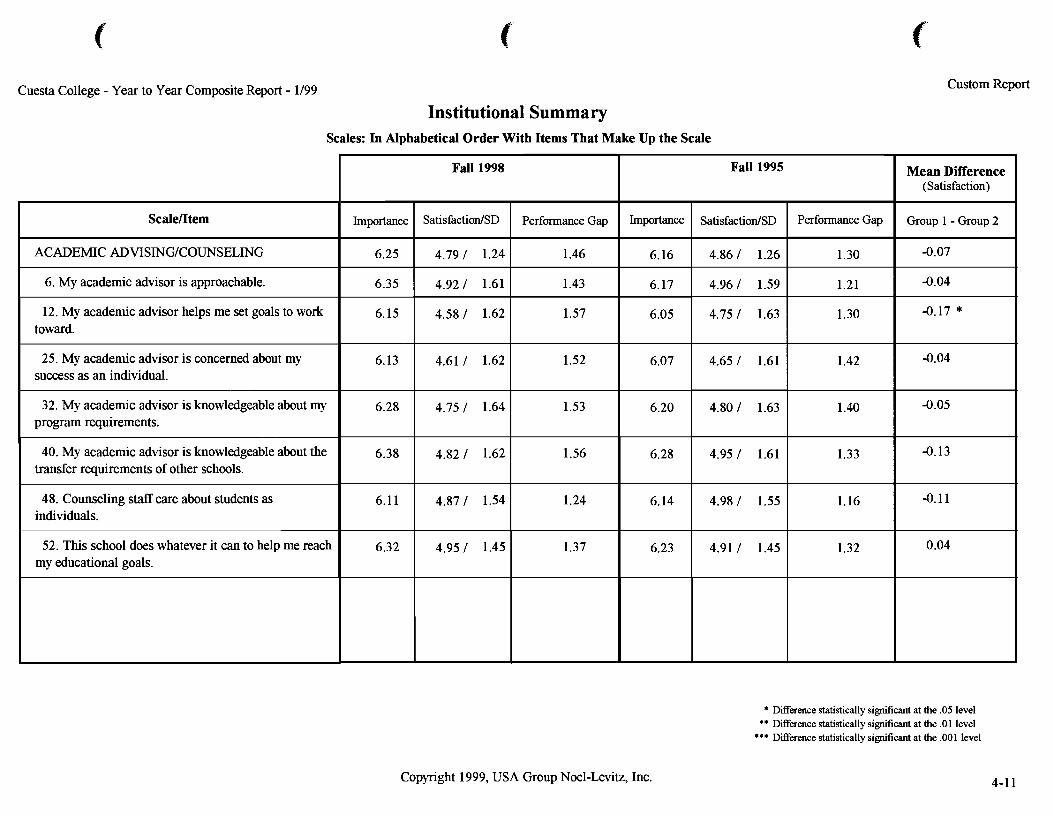
Cuesta College - Year to Year Composite Report - 1/99
Institutional Summary Scales: In Alphabetical Order With Items That Make Up the Scale
Custom Report
Copyright 1999, USA Group Noel-Levitz, Inc.
ScaleJItem
ACADEMIC ADVISINGICOUNSELING
6. My academic advisor is approachable.
12. My academic advisor helps me set goals to work toward.
25. My academic advisor is concerned about my success as an individual.
32. My academic advisor is knowledgeable about my program requirements.
40. My academic advisor is knowledgeable about the transfer requirements of other schools.
48. Counseling staff care about students as individuals.
52. This school does whatever it can to help me reach my educational goals.
* Difference statistically simcant at the .05 level ** Dierence statistically simcant at the .O1 level
*** Dierence statistically simcant at the ,001 level
Fall 1998
Importance
6.25
6.35
6.15
6.13
6.28
6.38
6.11
6.32
Mean Difference (Satisfaction)
Group 1 - Group 2
-0.07
-0.04
-0.17 *
-0.04
-0.05
-0.13
-0.11
0.04
Fall 1995
Importance
6.16
6.17
6.05
6.07
6.20
6.28
6.14
6.23
SatisfactiodSD
4.79 1 1.24
4.92 I 1.61
4.58 I 1.62
4.61 I 1.62
4.75 I 1.64
4.82 I 1.62
4.87 I 1.54
4.95 I 1.45
Performance Gap
1.46
1.43
1.57
1.52
1.53
1.56
1.24
1.37
SatisfactiodSD
4.86 1 1.26
4.96 I 1.59
4.75 I 1.63
4.65 I 1.61
4.80 I 1.63
4.95 I 1.61
4.98 I 1.55
4.91 I 1.45
Performance Gap
1.30
1.21
1.30
1.42
1.40
1.33
1.16
1.32
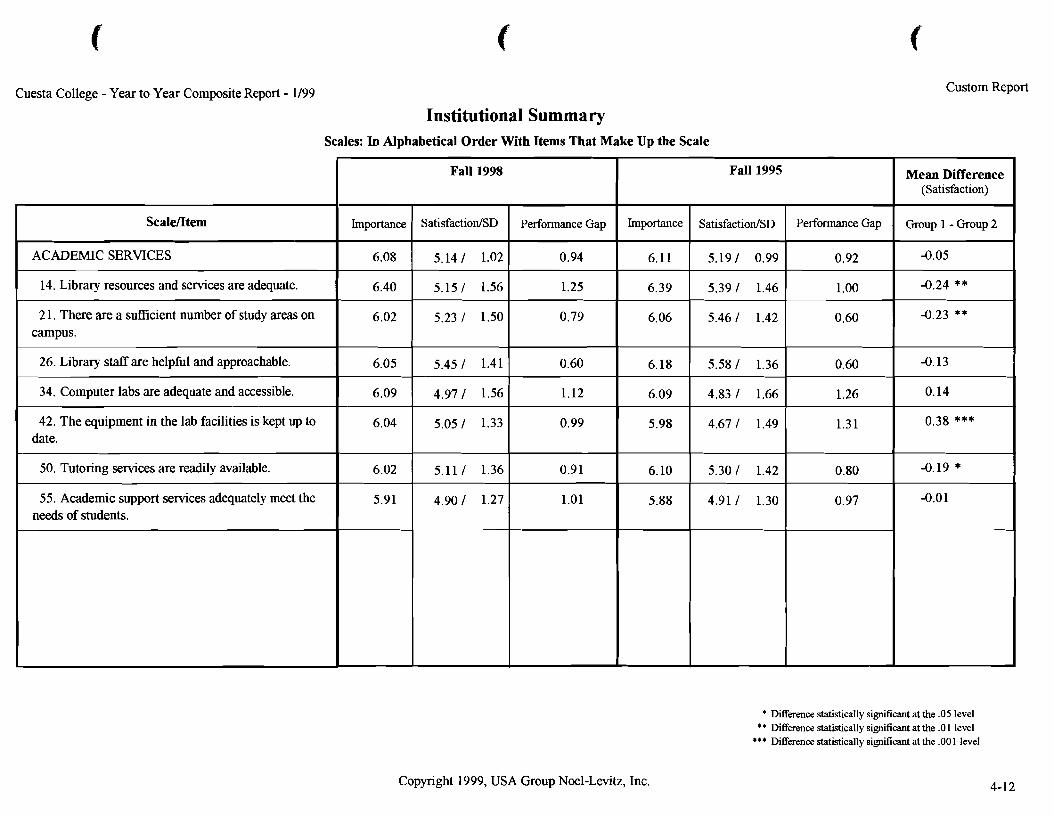
Cuesta College - Year to Year Composite Report - 1/99
Institutional Summary Scales: In Alphabetical Order With Items That Make Up the Scale
Custom Report
* Difference statistically sigruficant at the .05 level ** Difference statistically significant at the .O 1 level
*** Difference statistically sigmficant at the ,001 level
ScalelItem
ACADEMIC SERVICES
14. Library resources and services are adequate.
2 1. There are a sufficient number of study areas on campus.
26. Library staff are helpful and approachable.
34. Computer labs are adequate and accessible.
42. The equipment in the lab facilities is kept up to date.
50. Tutoring services are readily available.
55. Academic support services adequately meet the needs of students.
-
Copyright 1999, USA Group Noel-Levitz, Inc.
Fall 1998
Importance
6.08
6.40
6.02
6.05
6.09
6.04
6.02
5.91
Mean Difference (Satisfaction)
Group 1 - Group 2
-0.05
-0.24 **
-0.23 **
-0.13
0.14
0.38 ***
-0.19 *
-0.01
Fall 1995
SatisfactiodSD
5.14 1 1.02
5.15 1 1.56
5.23 / 1.50
5.45 I 1.41
4.97 I 1.56
5.05 / 1.33
5.11 1 1.36
4.90 I 1.27
Importance
6.11
6.39
6.06
6.18
6.09
5.98
6.10
5.88
Performance Gap
0.94
1.25
0.79
0.60
1.12
0.99
0.9 1
1.01
SatisfactiodSD
5.19 1 0.99
5.39 1 1.46
5.46 I 1.42
5.58 1 1.36
4.83 I 1.66
4.67 I 1.49
5.30 / 1.42
4.91 I 1.30
Performance Gap
0.92
1.00
0.60
0.60
1.26
1.31
0.80
0.97
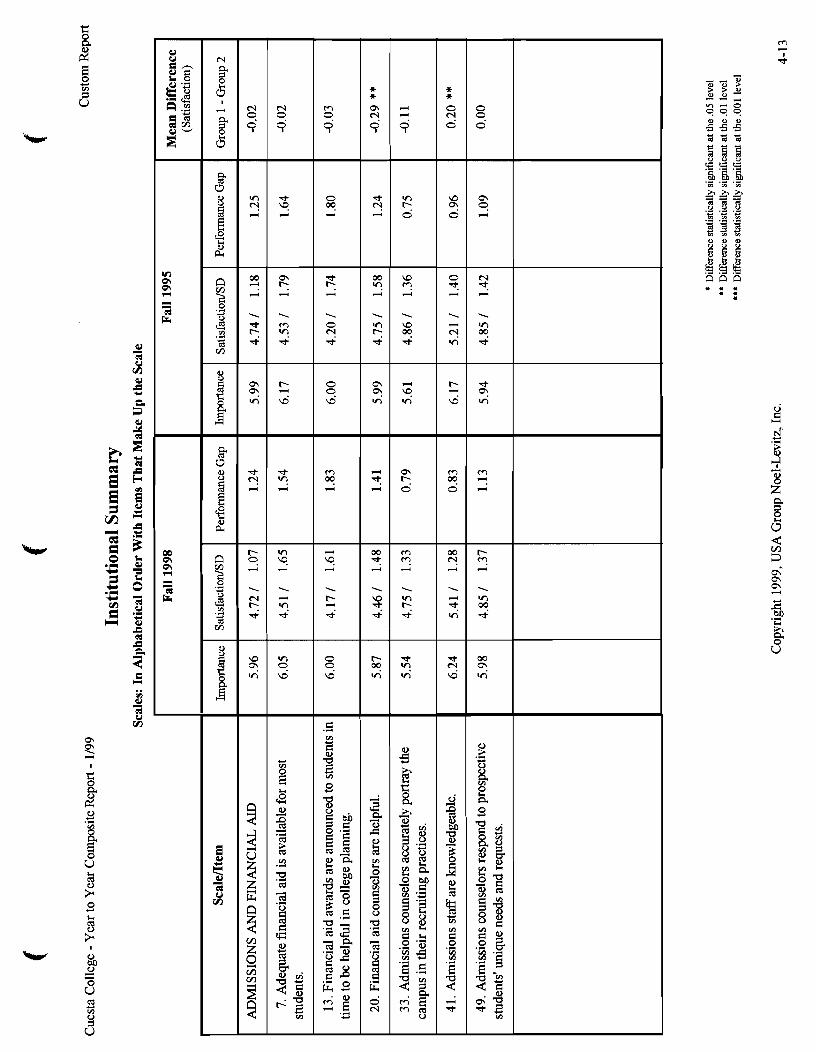
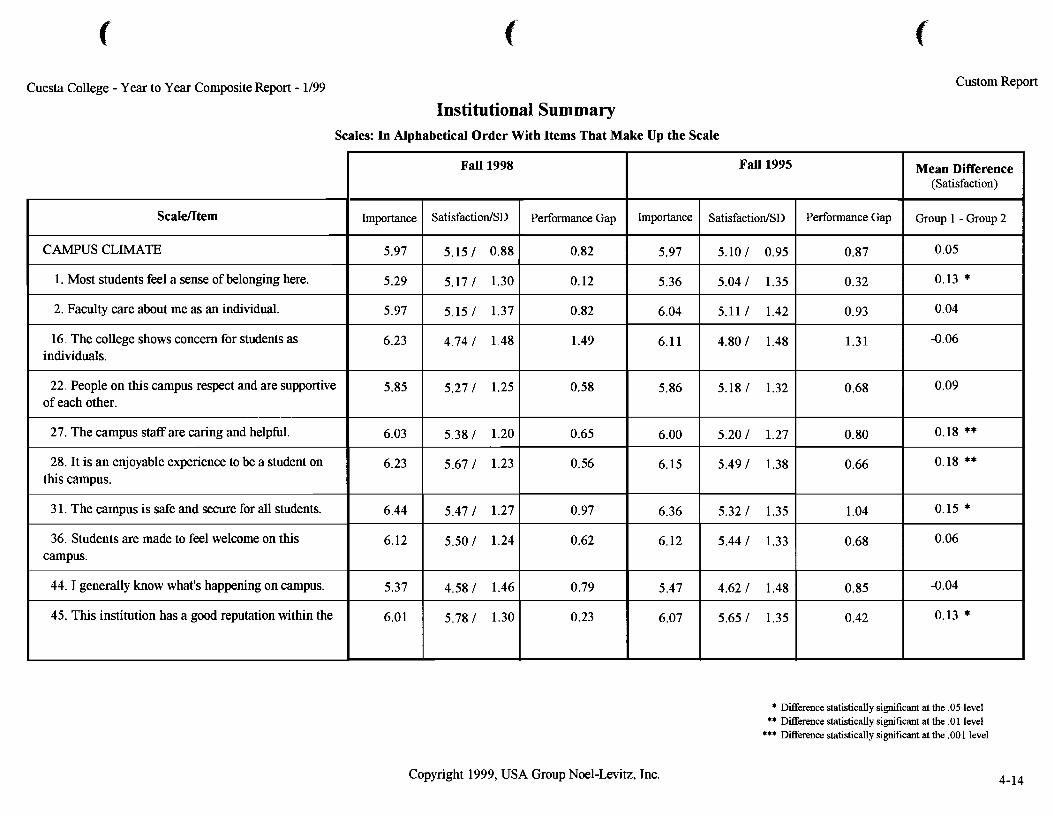
Cuesta College - Year to Year Composite Report - 1199
Institutional Summary Scales: In Alphabetical Order With Items That Make Up the Scale
Custom Report
Copyright 1999, USA Group Noel-Levitz, Inc.
Scale/Item
CAMPUS CLIMATE
1. Most students feel a sense of belonging here.
2. Faculty care about me as an individual.
16. The college shows concern for students as individuals.
22. People on this campus respect and are supportive of each other.
27. The campus staff are caring and helpful.
28. It is an enjoyable experience to be a student on this campus.
3 1. The campus is safe and secure for all students.
36. Students are made to feel welcome on this campus.
44. I generally know what's happening on campus.
45. This institution has a good reputation within the
Difference statistically sigruf~cant at the .05 level ** Difference statistically ~ i ~ c a n t at the .O1 level
*** Difference statistically sigruf~cant at the ,001 level
Fall 1998
Importance
5.97
5.29
5.97
6.23
5.85
6.03
6.23
6.44
6.12
5.37
6.01
Mean Difference (Satisfaction)
Group 1 - Group 2
0.05
0.13 *
0.04
-0.06
0.09
0.18 **
0.18 **
0.15 *
0.06
-0.04
0.13 *
Fall 1995
Importance
5.97
5.36
6.04
6.11
5.86
6.00
6.15
6.36
6.12
5.47
6.07
SatisfactionlSD
5.15 1 0.88
5.17 1 1.30
5.15 1 1.37
4.74 1 1.48
5.27 1 1.25
5.38 I 1.20
5.67 1 1.23
5.47 1 1.27
5.50 1 1.24
4.58 I 1.46
5.781 1.30
Performance Gap
0.82
0.12
0.82
1.49
0.58
0.65
0.56
0.97
0.62
0.79
0.23
SatisfactionISD
5.10 1 0.95
5.04 1 1.35
5.11 1 1.42
4.80 1 1.48
5.18 1 1.32
5.20 I 1.27
5.49 1 1.38
5.321 1.35
5.44 1 1.33
4.62 I 1.48
5.65 I 1.35
Performance Gap
0.87
0.32
0.93
1.31
0.68
0.80
0.66
1.04
0.68
0.85
0.42
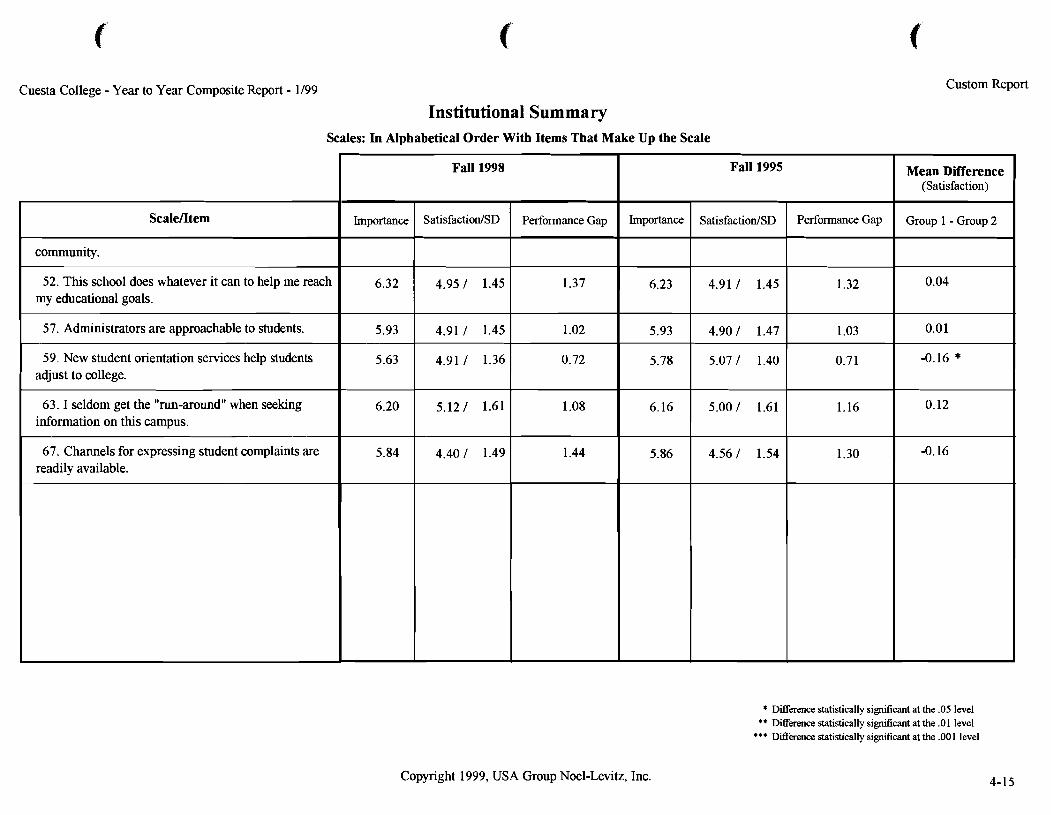
Cuesta College - Year to Year Composite Report - 1/99
Institutional Summary Scales: In Alphabetical Order With Items That Make Up the Scale
Custom Report
Difference statistically sigruf~cant at the .05 level ** Difference statistically significant at the .01 level
*** Difference statistically significant at the ,001 level
ScaleIItem
community.
52. This school does whatever it can to help me reach my educational goals.
57. Administrators are approachable to students.
59. New student orientation services help students adjust to college.
63. I seldom get the "run-around" when seeking information on this campus.
67. Channels for expressing student complaints are readily available.
Copyright 1999, USA Group Noel-Levitz, Inc.
Fall 1998
Importance
6.32
5.93
5.63
6.20
5.84
Mean Difference (Satisfaction)
Group 1 - Group 2
0.04
0.01
-0.16 *
0.12
-0.16
Fall 1995
Importance
6.23
5.93
5.78
6.16
5.86
SatisfactiodSD
4.95 1 1.45
4.91 I 1.45
4.91 I 1.36
5.121 1.61
4.40 1 1.49
Performance Gap
1.37
1.02
0.72
1.08
1.44
SatisfactiodSD
4.91 I 1.45
4.90 I 1.47
5.07 I 1.40
5.00 1 1.61
4.56 1 1.54
Performance Gap
1.32
1.03
0.7 1
1.16
1.30
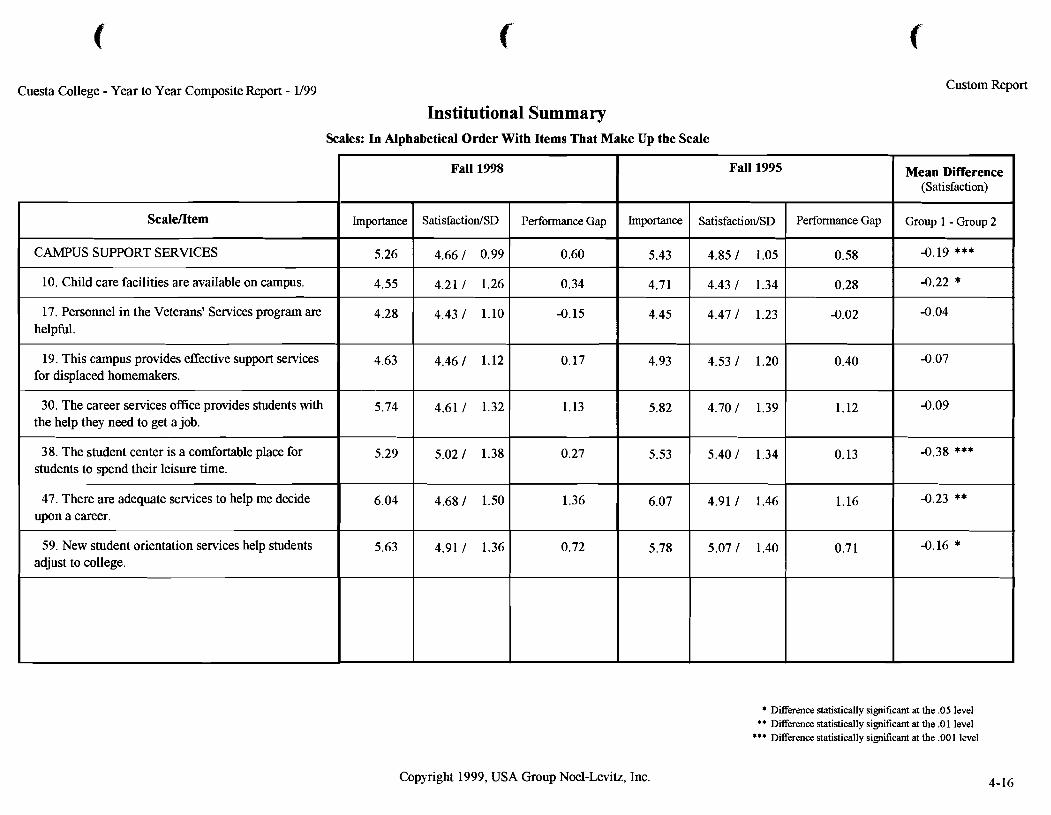
Cuesta College - Year to Year Composite Report - 1/99
Institutional Summary Scales: In Alphabetical Order With Items That Make Up the Scale
Custom Report
* Difference statistically sigruf~cant at the .05 level ** Difference statistically significant at the .0 1 level
*** Difference statistically significant at the ,001 level
Scale/Item
CAMPUS SUPPORT SERVICES
10. Child care facilities are available on campus.
17. Personnel in the Veterans' Services program are helpful.
19. This campus provides effective support services for displaced homemakers.
30. The career services office provides students with the help they need to get a job.
38. The student center is a comfortable place for students to spend their leisure time.
47. There are adequate services to help me decide upon a career.
59. New student orientation services help students adjust to college.
Copyright 1999, USA Group Noel-Levitz, Inc.
Fall 1998
Importance
5.26
4.55
4.28
4.63
5.74
5.29
6.04
5.63
Mean Difference (Satisfaction)
Group 1 - Group 2
-0.19 ***
-0.22 *
-0.04
-0.07
-0.09
-0.38 ***
-0.23 **
-0.16 *
Fall 1995
Importance
5.43
4.71
4.45
4.93
5.82
5.53
6.07
5.78
SatisfactiodSD
4.66 / 0.99
4.21 / 1.26
4.43 1 1.10
4.46 / 1.12
4.61 / 1.32
5.02 / 1.38
4.68 / 1.50
4.91 / 1.36
Performance Gap
0.60
0.34
-0.15
0.17
1.13
0.27
1.36
0.72
SatisfactiodSD
4.85 / 1.05
4.43 / 1.34
4.47 / 1.23
4.53 / 1.20
4.70 / 1.39
5.40 / 1.34
4.91 / 1.46
5.07 / 1.40
Performance Gap
0.58
0.28
-0.02
0.40
1.12
0.13
1.16
0.7 1
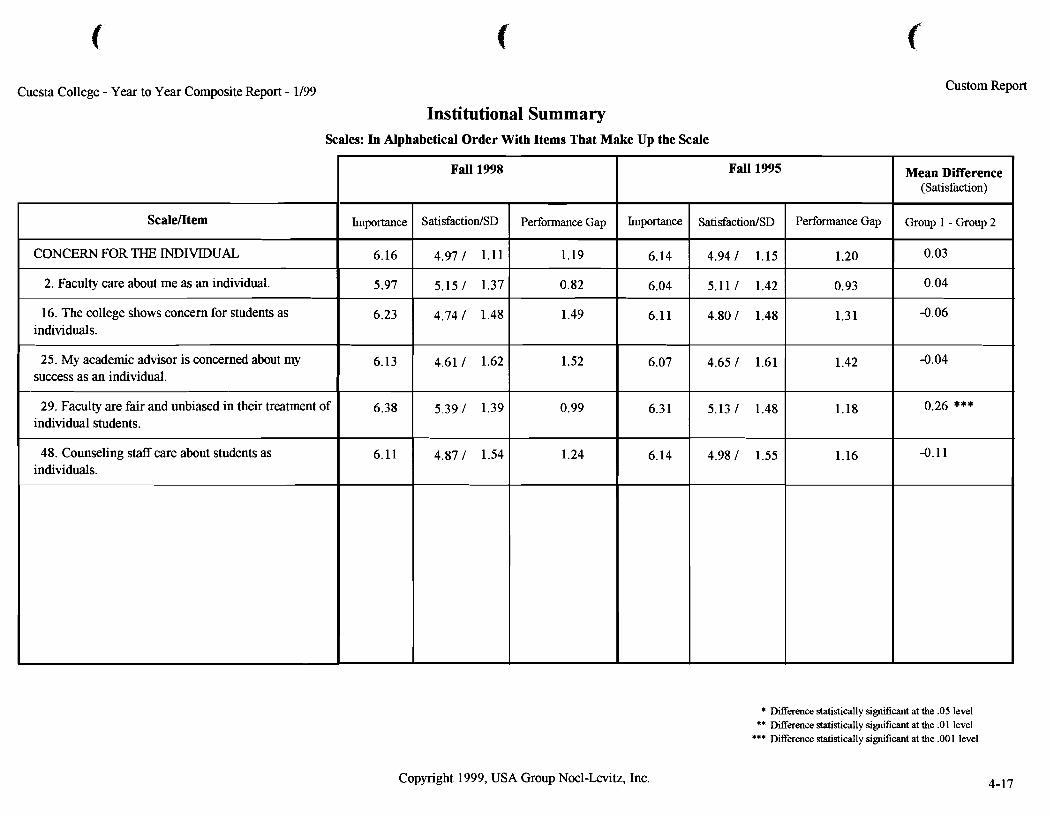
Cuesta College - Year to Year Composite Report - 1/99
Institutional Summary Scales: In Alphabetical Order With Items That Make Up the Scale
Custom Report
* Difference statistically significant at the .05 level ** Difference statistically significant at the .O1 level
*** Difference statistically si&~cant at the .OO 1 level
ScaleIItem
CONCERN FOR THE INDIVIDUAL
2. Faculty care about me as an individual.
16. The college shows concern for students as individuals.
25. My academic advisor is concerned about my success as an individual.
29. Faculty are fair and unbiased in their treatment of individual students.
48. Counseling staff care about students as individuals.
Copyright 1999, USA Group Noel-Levitz, Inc.
Fall 1998
Importance
6.16
5.97
6.23
6.13
6.38
6.11
Mean Difference (Satisfaction)
Group 1 - Group 2
0.03
0.04
-0.06
-0.04
0.26 ***
-0.11
Fall 1995
SatisfactiodSD
4.97 1 1.11
5.151 1.37
4.74 1 1.48
4.61 I 1.62
5.39 I 1.39
4.87 I 1.54
Performance Gap
1.20
0.93
1.3 1
1.42
1.18
1.16
Performance Gap
1.19
0.82
1.49
1.52
0.99
1.24
Importance
6.14
6.04
6.11
6.07
6.3 1
6.14
SatisfactiodSD
4.94 1 1.15
5.111 1.42
4.80 1 1.48
4.65 I 1.61
5.13 I 1.48
4.98 1 1.55
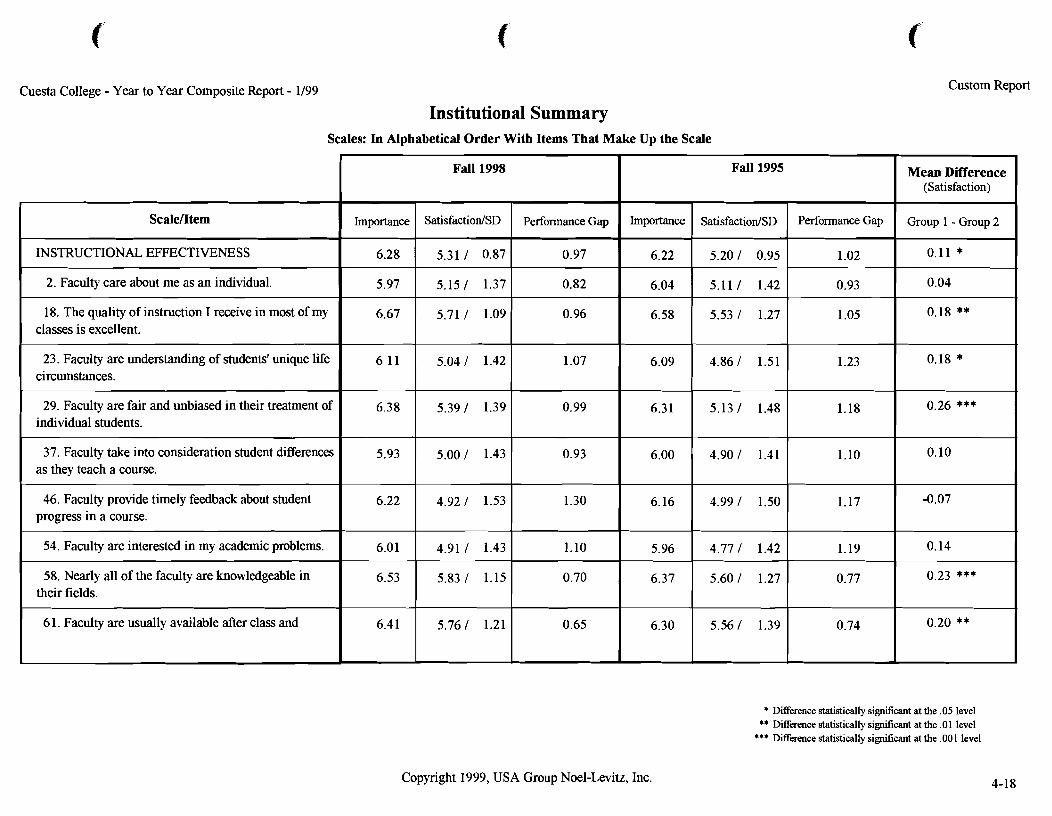
Cuesta College - Year to Year Composite Report - 1199
Institutional Summary Scales: In Alphabetical Order With Items That Make Up the Scale
Custom Report
Difference statistically si@~cant at the .05 level ** Difference statistically si@~cant at the .O1 level
*** Difference statistically significant at the .OO I level
Scalentem
INSTRUCTIONAL EFFECTIVENESS
2. Faculty care about me as an individual.
18. The quality of instruction I receive in most of my classes is excellent.
23. Faculty are understanding of students' unique life circumstances.
Copyright 1999, USA Group Noel-Levitz, Inc.
Fall 1998
Importance
6.28
5.97
6.67
6.11
Mean Difference (Satisfaction)
Group 1 - Group 2
0.11 *
0.04
0.18 **
0.18 *
Fall 1995
29. Faculty are fair and unbiased in their treatment of individual students.
37. Faculty take into consideration student differences as they teach a course.
0.26 ***
0.10
-0.07
0.14
0.23 ***
0.20 **
SatisfactiodSD
5.31 1 0.87
5.15 1 1.37
5.71 1 1.09
5.04 1 1.42
--- 5.39 1 1.39
5.00 1 1.43
--- 4.92 1 1.53
4.91 1 1.43
5.83 1 1.15
5.76 1 1.21
Importance
6.22
6.04
6.58
6.09
6.31
6.00
6.16
5.96
6.37
6.30
6.38
5.93
Performance Gap
0.97
0.82
0.96
1.07
0.99
0.93
1.30
1.10
0.70
0.65
SatisfactiodSD
5.20 1 0.95
5.11 1 1.42
5.531 1.27
4.86 1 1.51
5.13 1 1.48
4.90 1 1.41
4.99 1 1.50
4.77 1 1.42
5.60 1 1.27
5.56 1 1.39
46. Faculty provide timely feedback about student progress in a course.
54. Faculty are interested in my academic problems.
58. Nearly all of the faculty are knowledgeable in their fields.
6 1. Faculty are usually available after class and
Performance Gap
1.02
0.93
1.05
1.23
1.18
1.10
1.17
1.19
0.77
0.74
6.22
6.01
6.53
6.41
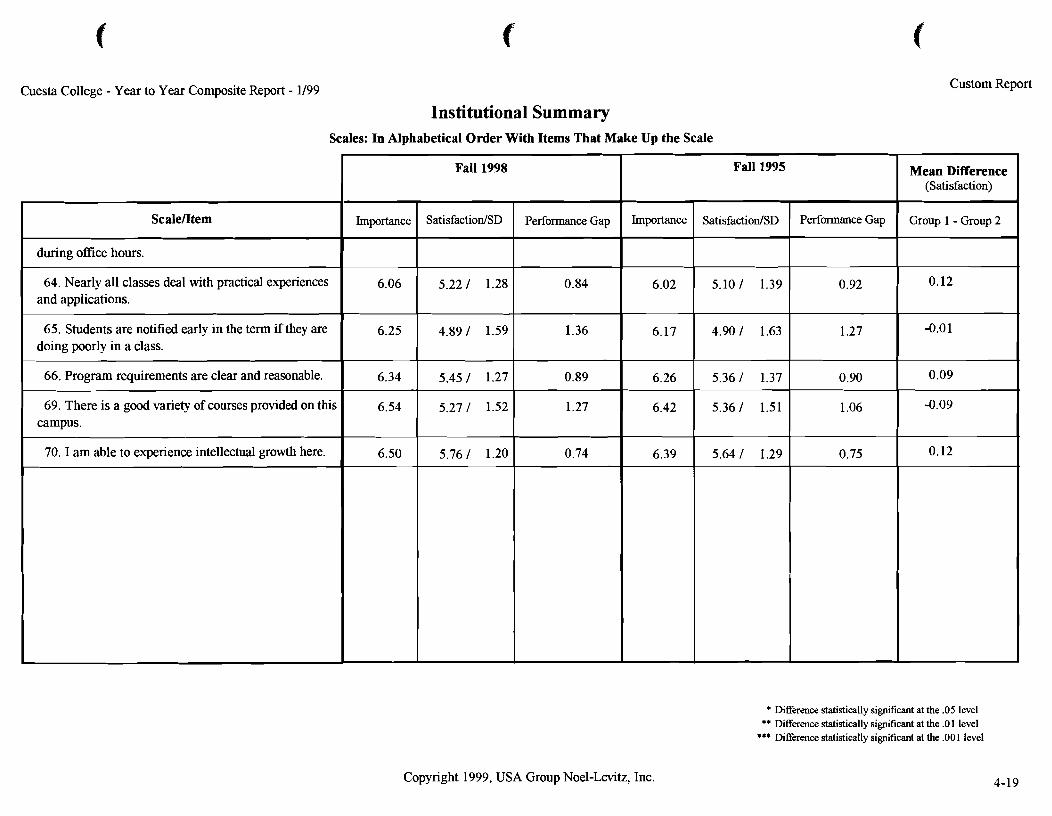
Cuesta College - Year to Year Composite Report - 1199
Institutional Summary Scales: In Alphabetical Order With Items That Make Up the Scale
Custom Report
* Difference statistically sigdcant at the .05 level ** Difference statistically si&~cant at the .Ol level
*** Diffmence statistically si&~cant at the ,001 level
Scalentem
during office hours.
64. Nearly all classes deal with practical experiences and applications.
65. Students are notified early in the term if they are doing poorly in a class.
66. Program requirements are clear and reasonable.
69. There is a good variety of courses provided on this campus.
70. I am able to experience intellectual growth here.
Copyright 1999, USA Group Noel-Laitz, Inc.
Mean Difference (Satisfaction)
Group 1 - Group 2
0.12
-0.0 1
0.09
-0.09
0.12
Fall 1998 Fall 1995
Importance
6.06
6.25
6.34
6.54
6.50
Importance
6.02
6.17
6.26
6.42
6.39
SatisfactiodSD
5.22 1 1.28
4.89 1 1.59
5.45 1 1.27
5.271 1.52
5.76 1 1.20
SatisfactiodSD
5.10 1 1.39
4.90 1 1.63
5.36 1 1.37
5.36 1 1.51
5.64 I 1.29
Performance Gap
0.84
1.36
0.89
1.27
0.74
Performance Gap
0.92
1.27
0.90
1.06
0.75
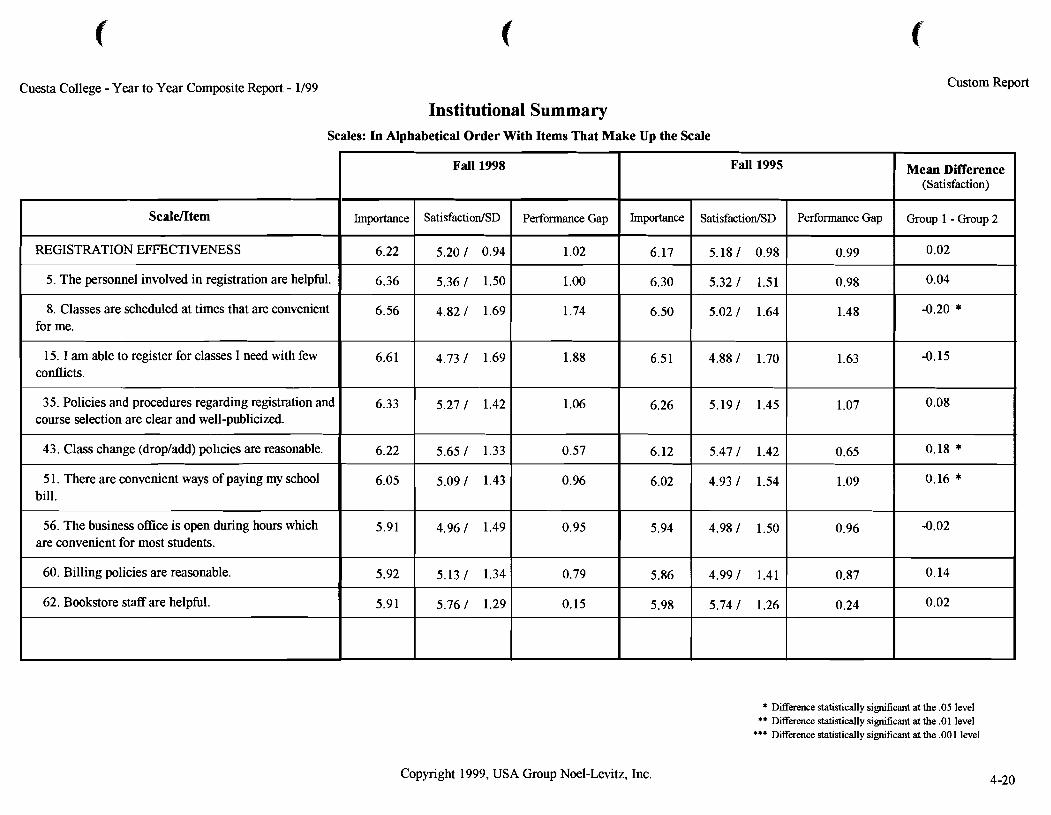
Cuesta College - Year to Year Composite Report - 1/99
Institutional Summary Scales: In Alphabetical Order With Items That Make Up the Scale
Custom Report
* Difference statistically significant at the .05 level ** Difference statistically sigruflcant at the .O1 level
*** Difference statistically sigruflcant at the ,001 level
Scaldtern
REGISTRATION EFFECTIVENESS
5. The personnel involved in registration are helpful.
8. Classes are scheduled at times that are convenient for me.
15. I am able to register for classes I need with few conflicts.
35. Policies and procedures regarding registration and course selection are clear and well-publicized.
43. Class change (dropladd) policies are reasonable.
5 1. There are convenient ways of paying my school bill.
56. The business office is open during hours which are convenient for most students.
60. Billing policies are reasonable.
62. Bookstore staff are helpful.
Copyright 1999, USA Group Noel-Levitz, Inc.
Fall 1998
Importance
6.22
6.36
6.56
6.61
6.33
6.22
6.05
5.91
5.92
5.91
Mean Difference (Satisfaction)
Group 1 - Group 2
0.02
0.04
-0.20 *
-0.15
0.08
0.18 *
0.16 *
-0.02
0.14
0.02
Fall 1995
Importance
6.17
6.30
6.50
6.51
6.26
6.12
6.02
5.94
5.86
5.98
SatisfactiodSD
5.20 1 0.94
5.36 1 1.50
4.82 1 1.69
4.73 1 1.69
5.27 1 1.42
5.65 I 1.33
5.09 I 1.43
4.96 I 1.49
5.13 I 1.34
5.76 I 1.29
Performance Gap
1.02
1 .OO
1.74
1.88
1.06
0.57
0.96
0.95
0.79
0.15
SatisfactiodSD
5.18 1 0.98
5.32 I 1.51
5.02 1 1.64
4.88 1 1.70
5.19 1 1.45
5.47 I 1.42
4.93 I 1.54
4.98 I 1.50
4.99 I 1.41
5.74 I 1.26
Performance Gap
0.99
0.98
1.48
1.63
1.07
0.65
1.09
0.96
0.87
0.24
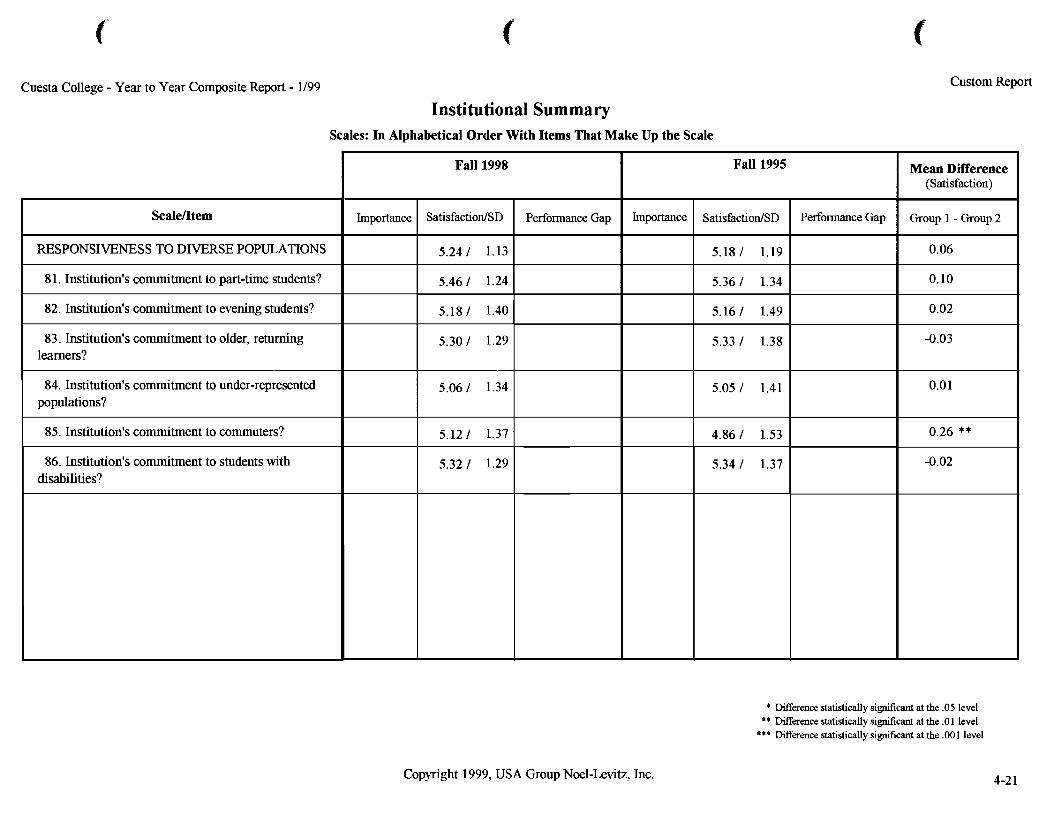
Cuesta College - Year to Year Composite Report - 1/99
Institutional Summary Scales: In Alphabetical Order With Items That Make Up the Scale
Custom Report
Copyright 1999, USA Group Noel-Levitz, Inc.
Scaldtern
RESPONSIVENESS TO DIVERSE POPULATIONS
8 1. Institution's commitment to part-time students?
82. Institution's commitment to evening students?
83. Institution's commitment to older, returning learners?
84. Institution's commitment to under-represented populations?
85. Institution's commitment to commuters?
86. Institution's commitment to students with disabilities?
* Difference statistically significant at the .05 level ** Difference statistically simcant at the .01 level
*** Difference statistically significant at the .001 level
Fall 1998
Importance
Mean Difference (Satisfaction)
Group 1 - Group 2
0.06
0.10
0.02
-0.03
0.0 1
0.26 **
-0.02
Fall 1995
SatisfactiodSD
5.24 / 1.13
5.46 / 1.24
5.18 / 1.40
5.30 / 1.29
5.06 / 1.34
5.12 / 1.37
5.32 / 1.29
Importance Performance Gap SatisfactiodSD
5.18 / 1.19
5.36 / 1.34
5.16 / 1.49
5.33 / 1.38
5.05 / 1.41
4.86 / 1.53
5.34 / 1.37
Performance Gap
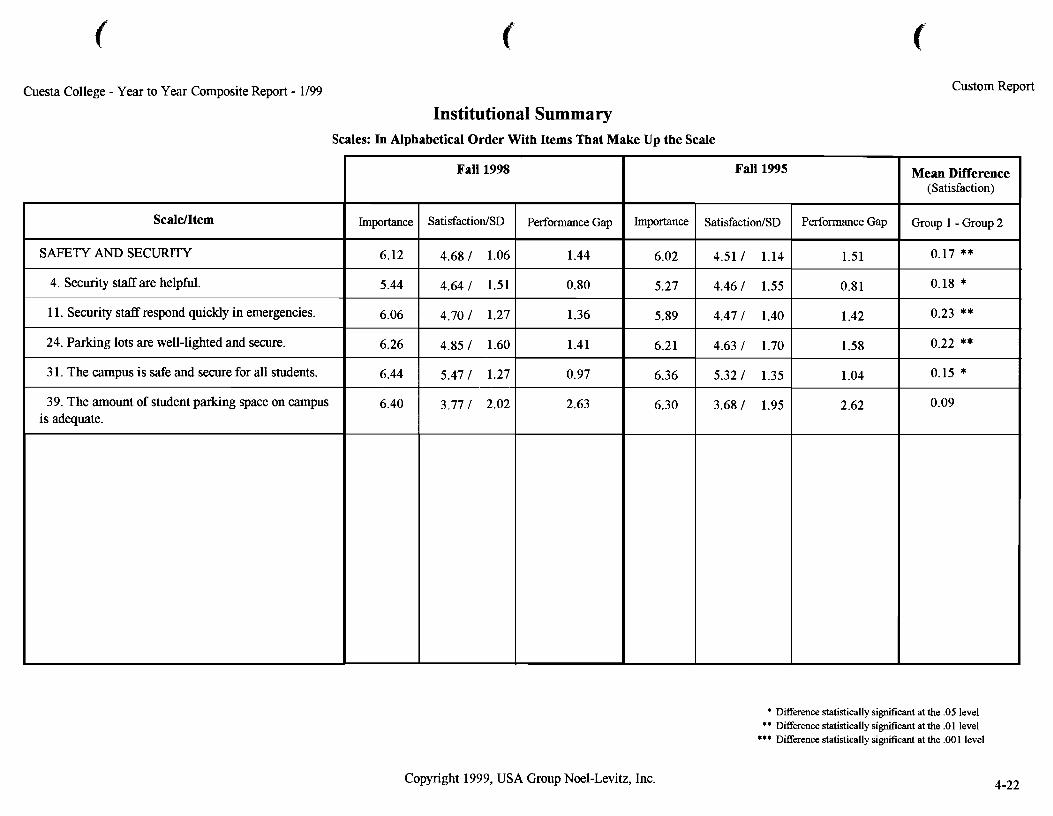
Cuesta College - Year to Year Composite Report - 1/99
Institutional Summary Scales: In Alphabetical Order With Items That Make Up the Scale
Custom Report
* Difference statistically sigtuf~cant at the .05 level ** Difference statistically sigtuflcant at the .O1 level
*** Difference statistically sigtuflcant at the ,001 level
Scaldtern
SAFETY AND SECURITY
4. Security staff are helpful.
1 1. Security staff respond quickly in emergencies.
24. Parking lots are well-lighted and secure.
3 1. The campus is safe and secure for all students.
39. The amount of student parking space on campus is adequate.
Copyright 1999, USA Group Noel-Levitz, Inc.
Fall 1998
Importance
6.12
5.44
6.06
6.26
6.44
6.40
Mean Difference (Satisfaction)
Group 1 - Group 2
0.17 **
0.18 *
0.23 **
0.22 **
0.15 *
0.09
Fall 1995
SatisfactiodSD
4.68 1 1.06
4.64 I 1.51
4.70 I 1.27
4.85 1 1.60
5.47 1 1.27
3.77 1 2.02
Importance
6.02
5.27
5.89
6.21
6.36
6.30
Performance Gap
1.44
0.80
1.36
1.4 1
0.97
2.63
SatisfactiodSD
4.51 1 1.14
4.46 I 1.55
4.47 I 1.40
4.63 1 1.70
5.32 1 1.35
3.68 1 1.95
Performance Gap
1.51
0.8 1
1.42
1.58
1.04
2.62
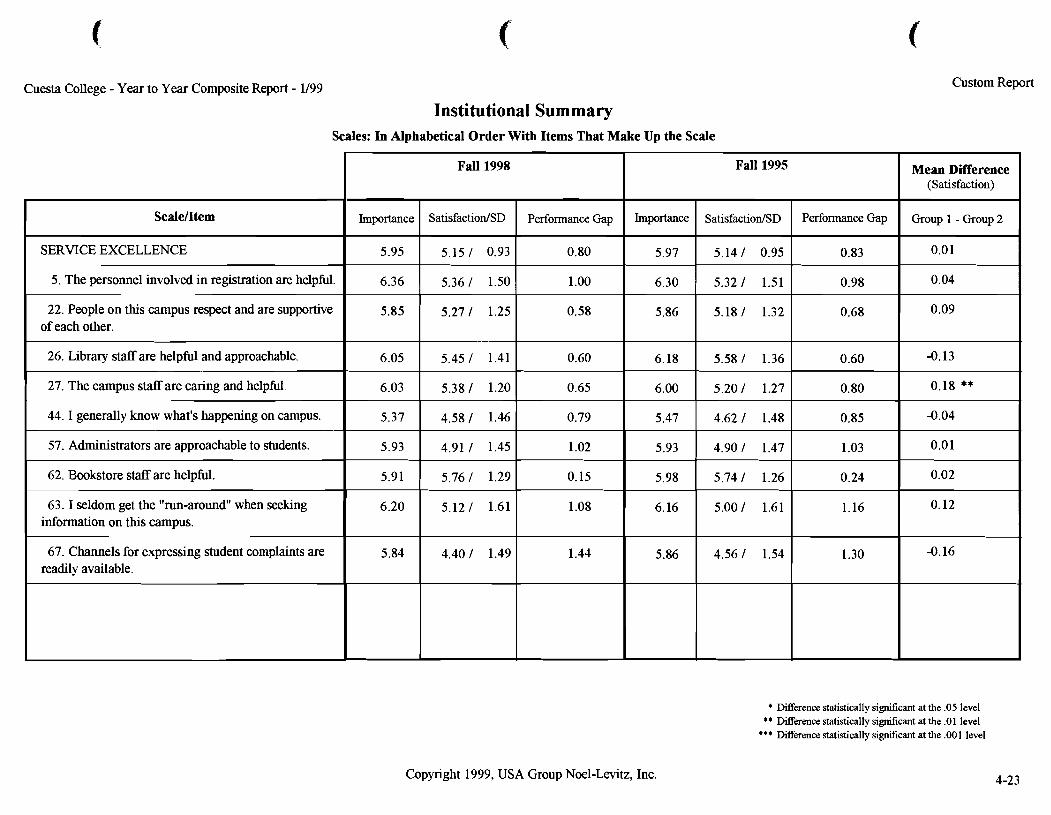
Cuesta College - Year to Year Composite Report - 1/99
Institutional Summary Scales: In Alphabetical Order With Items That Make Up the Scale
Custom Report
Difference statistically sigruf~cant at the .05 level ** Difference statistically sigruficant at the .O1 level
*** Difference statistically sigruf~cant at the ,001 level
Copyright 1999, USA Group Noel-Levitz, Inc.
Fall 1998 Mean Difference (Satisfaction)
Group 1 - Group 2
0.0 1
0.04
0.09
-0.13
0.18 **
-0.04
0.0 1
0.02
0.12
-0.16
Fall 1995
Scalefltem
SERVICE EXCELLENCE
5. The personnel involved in registration are helpful.
22. People on this campus respect and are supportive of each other.
26. Library staff are helpful and approachable.
27. The campus staff are caring and helpful.
44. I generally know what's happening on campus.
57. Administrators are approachable to students.
62. Bookstore staff are helpful.
63.1 seldom get the "run-around when seeking information on this campus.
67. Channels for expressing student complaints are readily available.
SatisfactiodSD
5.15 I 0.93
5.36 / 1.50
5.27 / 1.25
5.45 I 1.41
5.38 I 1.20
4.58 I 1.46
4.91 / 1.45
5.76 I 1.29
5.121 1.61
4.40 I 1.49
Importance
5.97
6.30
5.86
6.18
6.00
5.47
5.93
5.98
6.16
5.86
Importance
5.95
6.36
5.85
6.05
6.03
5.37
5.93
5.91
6.20
5.84
Performance Gap
0.80
1.00
0.58
0.60
0.65
0.79
1.02
0.15
1.08
1.44
SatisfactiodSD
5.14 1 0.95
5.32 I 1.51
5.18 I 1.32
5.58 I 1.36
5.20 I 1.27
4.62 I 1.48
4.90 / 1.47
5.74 I 1.26
5.00 I 1.61
4.56 I 1.54
Performance Gap
0.83
0.98
0.68
0.60
0.80
0.85
1.03
0.24
1.16
1.30
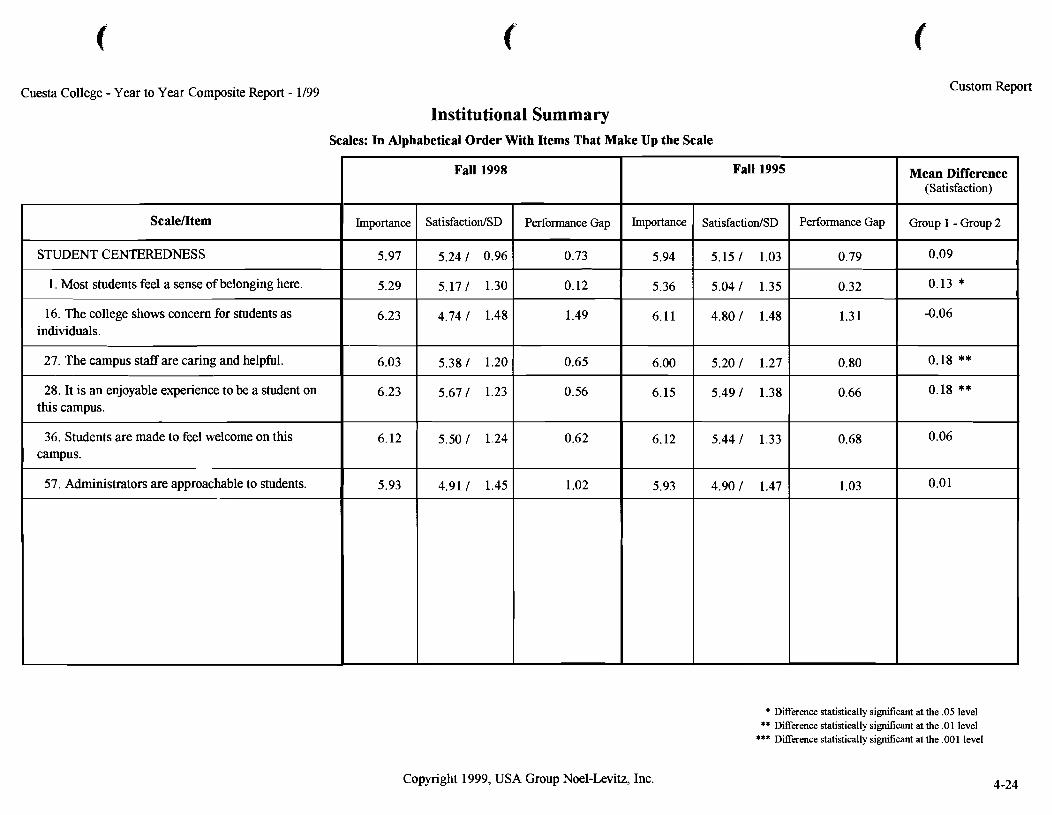
Cuesta College -Year to Year Composite Report - 1/99
Institutional Summary Scales: In Alphabetical Order With Items That Make Up the Scale
Custom Report
* Difference statistically simcant at the .05 level ** Difference statistically sigruf~cant at the .O1 level
*** Difference statistically sigruflcant at the .001 level
ScaleIItem
STUDENT CENTEREDNES S
1. Most students feel a sense of belonging here.
16. The college shows concern for students as individuals.
27. The campus staff are caring and helpful.
28. It is an enjoyable experience to be a student on this campus.
36. Students are made to feel welcome on this campus.
57. Administrators are approachable to students.
-
Copyright 1999, USA Group Noel-Levitz, Inc.
Fall 1998
Importance
5.97
5.29
6.23
6.03
6.23
6.12
5.93
Mean Difference (Satisfaction)
Group 1 - Group 2
0.09
0.13 *
-0.06
0.18 **
0.18 **
0.06
0.01
Fall 1995
SatisfactiodSD
5.24 / 0.96
5.17 / 1.30
4.74 / 1.48
5.38 1 1.20
5.67 / 1.23
5.50 / 1.24
4.91 / 1.45
Importance
5.94
5.36
6.11
6.00
6.15
6.12
5.93
Performance Gap
0.73
0.12
1.49
0.65
0.56
0.62
1.02
SatisfactiodSD
5.15 / 1.03
5.04 / 1.35
4.80 / 1.48
5.20 / 1.27
5.49 / 1.38
5.44 1 1.33
4.90 / 1.47
Performance Gap
0.79
0.32
1.31
0.80
0.66
0.68
1.03
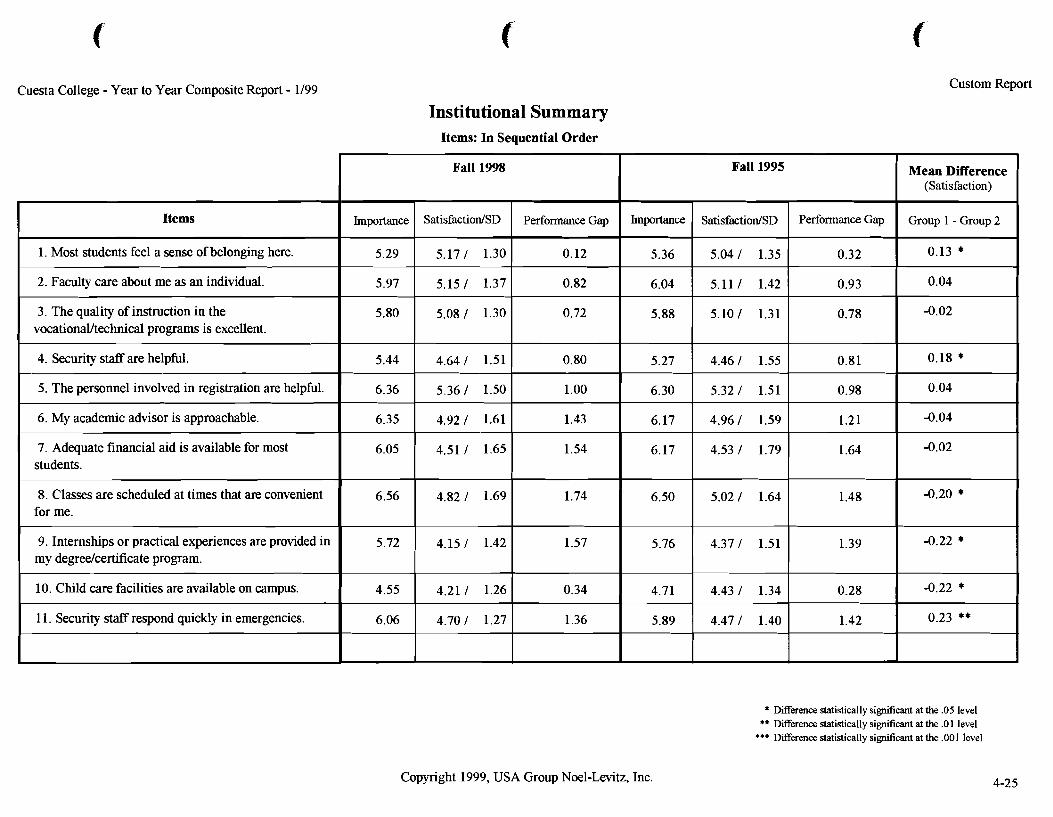
Cuesta College - Year to Year Composite Report - 1/99 Custom Report
Institutional Summary Items: In Sequential Order
* Difference statistically signf~cant at the .05 level ** Difference statistically sigdicant at the .O1 level
*** Difference statistically signf~cant at the ,001 level
Items
1. Most students feel a sense of belonging here.
2. Faculty care about me as an individual.
3. The quality of instruction in the vocationaVtechnical programs is excellent.
4. Security staff are helpful.
5. The personnel involved in registration are helpful.
6. My academic advisor is approachable.
7. Adequate financial aid is available for most students.
8. Classes are scheduled at times that are convenient for me.
9. Internships or practical experiences are provided in my degreelcertiticate program.
10. Child care facilities are available on campus.
1 1. Security staff respond quickly in emergencies.
Copyright 1999, USA Group Noel-Levitz, Inc.
Fall 1998
Importance
5.29
5.97
5.80
5.44
6.36
6.35
6.05
6.56
5.72
4.55
6.06
Mean Difference (Satisfaction)
Group 1 - Group 2
0.13 *
0.04
-0.02
0.18 *
0.04
-0.04
-0.02
-0.20 *
-0.22 *
-0.22 *
0.23 **
Fall 1995
SatisfactiodSD
5.17 I 1.30
5.15 1 1.37
5.08 I 1.30
4.641 1.51
5.36 I 1.50
4.921 1.61
4.51 I 1.65
4.82 I 1.69
4.15 I 1.42
4.21 I 1.26
4.701 1.27
Importance
5.36
6.04
5.88
5.27
6.30
6.17
6.17
6.50
5.76
4.71
5.89
Performance Gap
0.12
0.82
0.72
0.80
1.00
1.43
1.54
1.74
1.57
0.34
1.36
SatisfactiodSD
5.04 1 1.35
5.111 1.42
5.10 I 1.31
4.46 I 1.55
5.32 I 1.51
4.96 I 1.59
4.53 I 1.79
5.02 1 1.64
4.37 I 1.51
4.43 I 1.34
4.47 1 1.40
Performance Gap
0.32
0.93
0.78
0.81
0.98
1.21
1.64
1.48
1.39
0.28
1.42
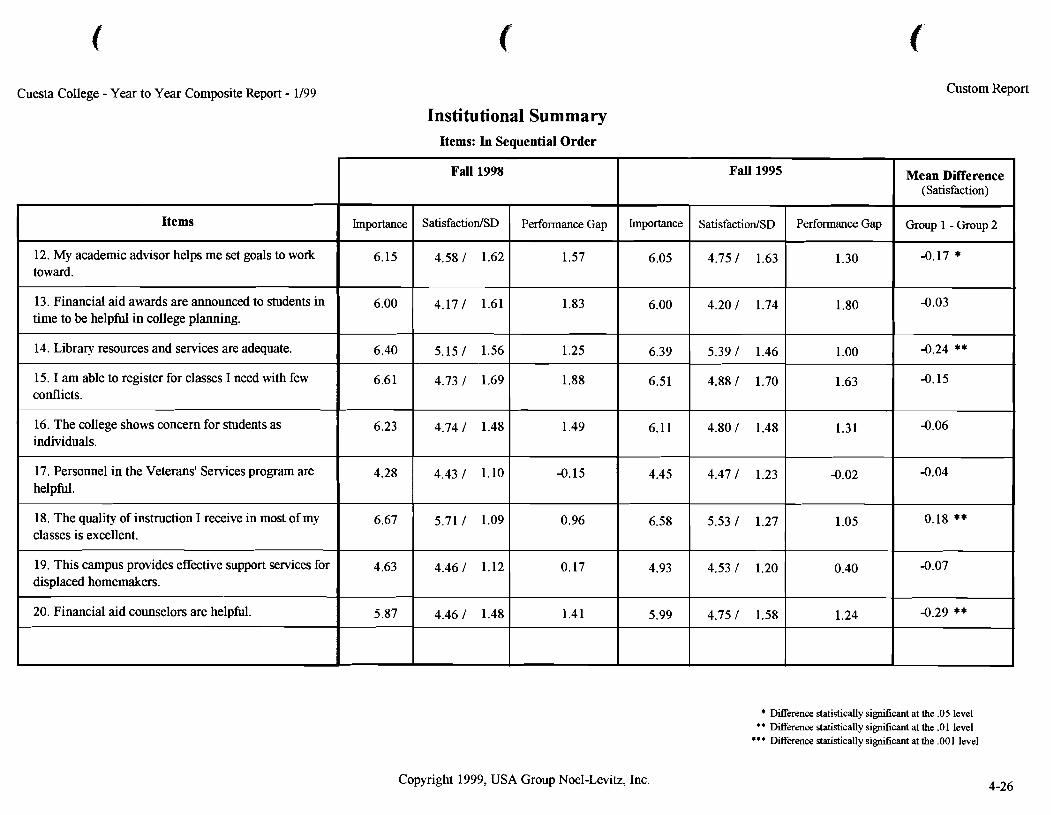
Cuesta College - Year to Year Composite Report - 1/99 Custom Report
Institutional Summary Items: In Sequential Order
* Difference statistically si&lcant at the .05 level ** Difference statistically sigdicant at the .01 level
*** Difference statistically si&lcant at the ,001 level
Items
12. My academic advisor helps me set goals to work toward.
13. Financial aid awards are announced to students in time to be helpful in college planning.
14. Library resources and services are adequate.
15. I am able to register for classes I need with few conflicts.
16. The college shows concern for students as individuals.
17. Personnel in the Veterans' Services program are helpful.
18. The quality of instruction I receive in most of my classes is excellent.
19. This campus provides effective support services for displaced homemakers.
20. Financial aid counselors are helpful.
Copyright 1999, USA Group Noel-Levitz, Inc.
Fall 1998
Importance
6.15
6.00
6.40
6.61
6.23
4.28
6.67
4.63
5.87
Mean Difference (Satisfaction)
Group 1 - Group 2
-0.17 *
-0.03
-0.24 **
-0.15
-0.06
-0.04
0.18 **
-0.07
-0.29 **
Fall 1995
SatisfactiodSD
4.58 / 1.62
4.17 / 1.61
5.15 / 1.56
4.73 / 1,69
4.74 / 1.48
4.43 / 1.10
5.71 / 1.09
4.46 / 1.12
4.46 / 1.48
Importance
6.05
6.00
6.39
6.51
6.11
4.45
6.58
4.93
5.99
Performance Gap
1.57
1.83
1.25
1.88
1.49
-0.15
0.96
0.17
1.41
SatisfactiodSD
4.75 / 1.63
4.20 / 1.74
5.39 / 1.46
4.88 / 1.70
4.80 / 1.48
4.47 / 1.23
5.53 / 1.27
4.53 / 1.20
4.75 / 1.58
Performance Gap
1.30
1.80
1.00
1.63
1.31
-0.02
1.05
0.40
1.24
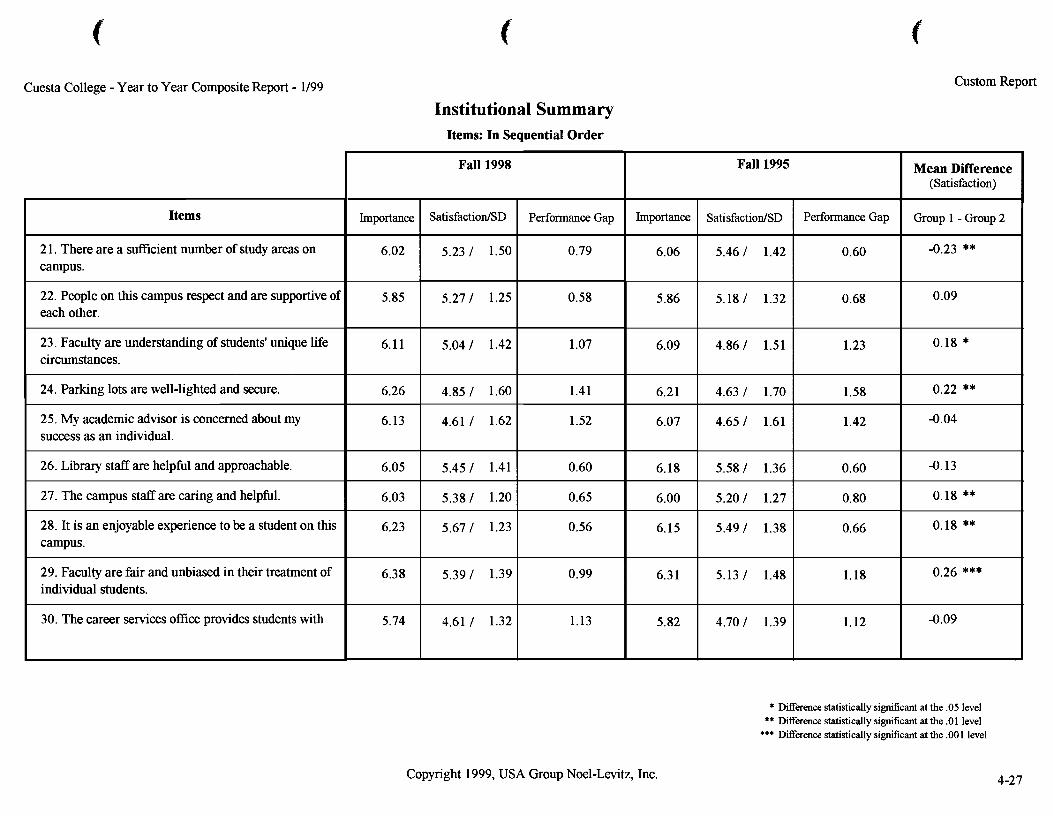
Cuesta College - Year to Year Composite Report - 1/99 Custom Report
Institutional Summary Items: In Sequential Order
* Difference statistically significant at the .05 level ** Difference statistically s i m c a n t at the .O1 level
*** Difference statistically si&~cant at the ,001 level
Items
2 1. There are a ~ ~ c i e n t number of study areas on campus.
22. People on this campus respect and are supportive of each other.
23. Faculty are understanding of students' unique life circumstances.
24. Parking lots are well-lighted and secure.
25. My academic advisor is concerned about my success as an individual.
26. Library staff are helpful and approachable.
27. The campus staff are caring and helpful.
28. It is an enjoyable experience to be a student on this campus.
29. Faculty are fair and unbiased in their treatment of individual students.
30. The career services office provides students with
Copyright 1999, USA Group Noel-Levitz, Inc.
Fall 1998
Importance
6.02
5.85
6.11
6.26
6.13
6.05
6.03
6.23
6.38
5.74
Mean Difference (Satisfaction)
Group 1 - Group 2
-0.23 **
0.09
0.18 *
0.22 **
-0.04
-0.13
0.18 **
0.18 **
0.26 ***
-0.09
-
Fall 1995
SatisfactiodSD
5.23 / 1.50
5.27 / 1.25
5.04 / 1.42
4.85 / 1.60
4.61 / 1.62
5.45 / 1.41
5.38 / 1.20
5.67 / 1.23
5.39 / 1.39
4.61 / 1.32
Importance
6.06
5.86
6.09
6.21
6.07
6.18
6.00
6.15
6.3 1
5.82
Performance Gap
0.79
0.58
1.07
1.41
1.52
0.60
0.65
0.56
0.99
1.13
SatisfactiodSD
5.46 / 1.42
5.18 / 1.32
4.86 / 1.51
4.63 / 1.70
4.65 / 1.61
5.58 / 1.36
5.20 / 1.27
5.49 / 1.38
5.13 / 1.48
4.70 / 1.39
Performance Gap
0.60
0.68
1.23
1.58
1.42
0.60
0.80
0.66
1.18
1.12
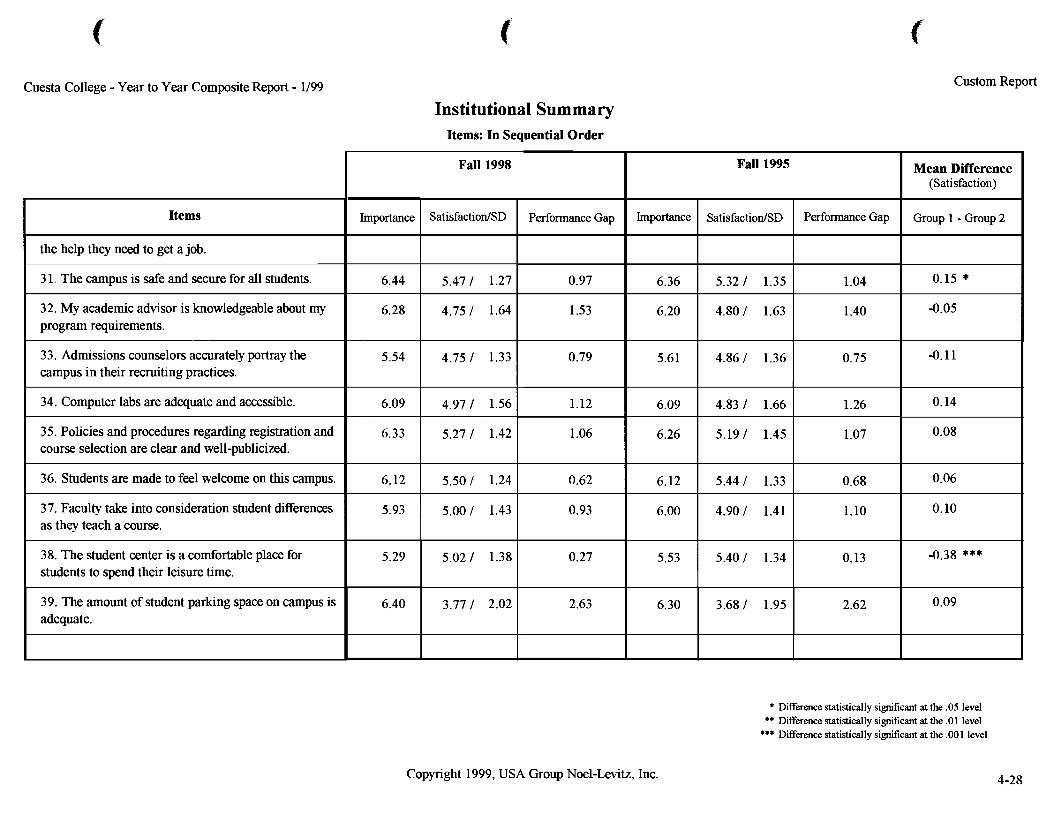
Cuesta College - Year to Year Composite Report - 1/99 Custom Report
Institutional Summary Items: In Sequential Order
Dierence statistically sigruf~cant at the .05 level ** Difference statistically sigruflcant at the .Ol level
*** Difference statistically sigruflcant at the ,001 level
Items
the help they need to get a job.
3 1. The campus is safe and secure for all students.
32. My academic advisor is knowledgeable about my program requirements.
33. Admissions counselors accurately portray the campus in their recruiting practices.
34. Computer labs are adequate and accessible.
35. Policies and procedures regarding registration and course selection are clear and well-publicized.
36. Students are made to feel welcome on this campus.
37. Faculty take into consideration student differences as they teach a course.
38. The student center is a comfortable place for students to spend their leisure time.
39. The amount of student parking space on campus is adequate.
Copyright 1999, USA Group Noel-Levitz, Inc.
Fall 1998
Importance
6.44
6.28
5.54
6.09
6.33
6.12
5.93
5.29
6.40
Mean Difference (Satisfaction)
Group 1 - Group 2
0.15 *
-0.05
-0.11
0.14
0.08
0.06
0.10
-0.38 ***
0.09
Fall 1995
SatisfactiodSD
5.47 1 1.27
4.75 / 1.64
4.75 / 1.33
4.97 / 1.56
5.27 / 1.42
5.50 / 1.24
5.00 / 1.43
5.02 / 1.38
3.77 / 2.02
Importance
6.36
6.20
5.61
6.09
6.26
6.12
6.00
5.53
6.30
Performance Gap
0.97
1.53
0.79
1.12
1.06
0.62
0.93
0.27
2.63
SatisfactiodSD
5.32 1 1.35
4.80 / 1.63
4.86 / 1.36
4.83 / 1.66
5.19 / 1.45
5.44 / 1.33
4.90 / 1.41
5.40 / 1.34
3.68 / 1.95
Performance Gap
1.04
1.40
0.75
1.26
1.07
0.68
1.10
0.13
2.62
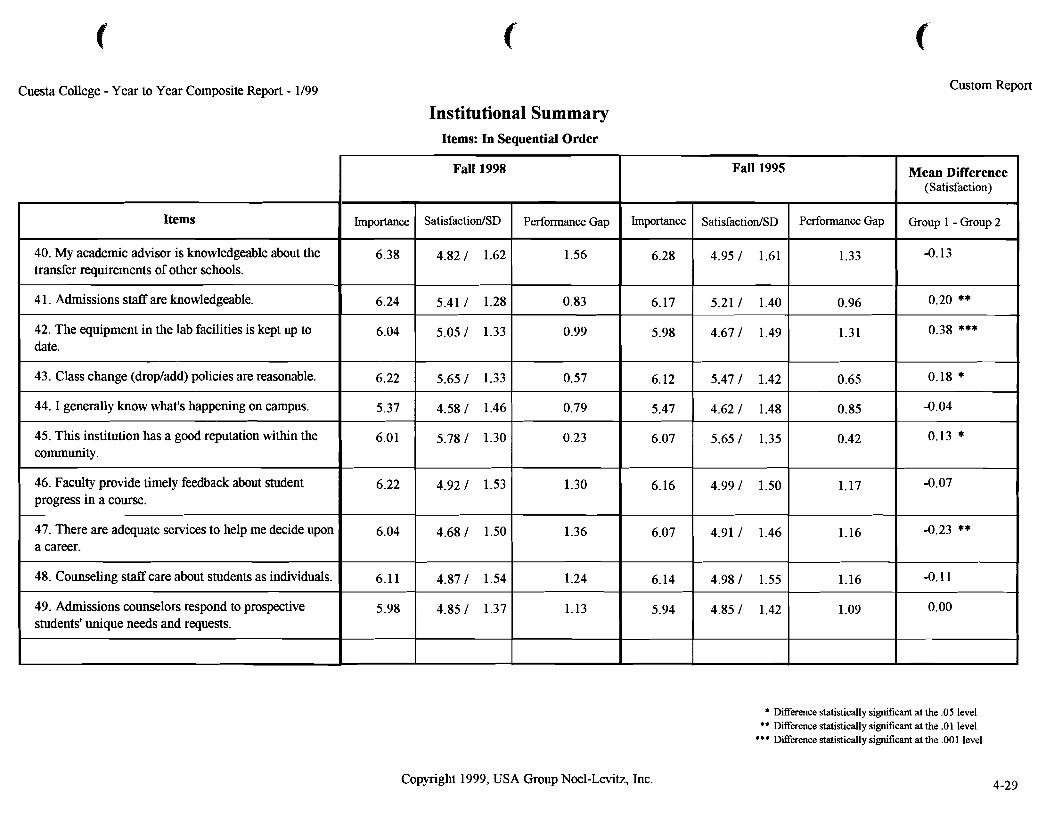
Cuesta College - Year to Year Composite Report - 1/99 Custom Report
Institutional Summary Items: In Sequential Order
* Difference statistically sigtuticant at the .05 level ** Difference statistically simcant at the .O1 level
*** Dierence statistically simcant at the ,001 level
Items
40. My academic advisor is knowledgeable about the transfer requirements of other schools.
4 1. Admissions staff are knowledgeable.
42. The equipment in the lab facilities is kept up to date.
43. Class change (dropladd) policies are reasonable.
44. I generally know what's happening on campus.
45. This institution has a good reputation within the community.
46. Faculty provide timely feedback about student progress in a course.
47. There are adequate services to help me decide upon a career.
48. Counseling staff care about students as individuals.
49. Admissions counselors respond to prospective students' unique needs and requests.
Copyright 1999, USA Group Noel-Levitz, Inc.
Fall 1998
Importance
6.38
6.24
6.04
6.22
5.37
6.01
6.22
6.04
6.11
5.98
Mean Difference (Satisfaction)
Group 1 - Group 2
-0.13
0.20 **
0.38 ***
0.18 *
-0.04
0.13 *
-0.07
-0.23 **
-0.11
0.00
Fall 1995
SatisfactiodSD
4.82 I 1.62
5.41 I 1.28
5.05 1 1.33
5.65 I 1.33
4.58 I 1.46
5.78 I 1.30
4.92 I 1.53
4.68 I 1.50
4.871 1.54
4.85 I 1.37
Importance
6.28
6.17
5.98
6.12
5.47
6.07
6.16
6.07
6.14
5.94
Perfo~mance Gap
1.56
0.83
0.99
0.57
0.79
0.23
1.30
1.36
1.24
1.13
SatisfactiodSD
4.95 I 1.61
5.21 1 1.40
4.67 1 1.49
5.47 I 1.42
4.62 I 1.48
5.65 I 1.35
4.99 I 1.50
4.91 1 1.46
4.98 I 1.55
4.85 I 1.42
Performance Gap
1.33
0.96
1.31
0.65
0.85
0.42
1.17
1.16
1.16
1.09
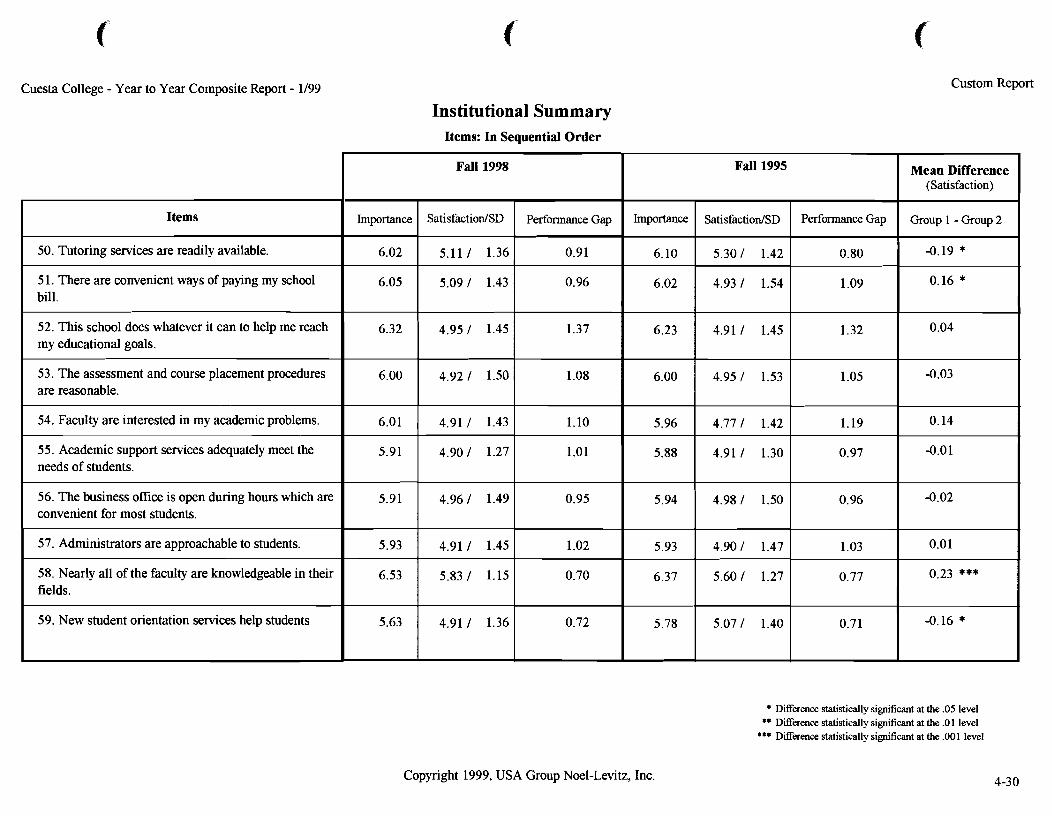
Cuesta College - Year to Year Composite Report - 1199 Custom Report
Institutional Summary Items: In Sequential Order
Difference statistically si@~cant at the .05 level ** Difference statistically sigmficant at the .O1 level
*** Difference statistically significant at the ,001 level
Items
50. Tutoring services are readily available.
5 1. There are convenient ways of paying my school bill.
52. This school does whatever it can to help me reach my educational goals.
53. The assessment and course placement procedures are reasonable.
54. Faculty are interested in my academic problems.
55. Academic support services adequately meet the needs of students.
56. The business office is open during hours which are convenient for most students.
57. Administrators are approachable to students.
58. Nearly all of the faculty are knowledgeable in their fields.
59. New student orientation services help students
Copyright 1999, USA Group Noel-Levitz, Inc.
Fall 1998
Importance
6.02
6.05
6.32
6.00
6.01
5.91
5.91
5.93
6.53
5.63
Mean Difference (Satisfaction)
Group 1 - Group 2
-0.19 *
0.16 *
0.04
-0.03
0.14
-0.01
-0.02
0.01
0.23 ***
-0.16 *
Fall 1995
SatisfactiodSD
5.11 1 1.36
5.09 1 1.43
4.95 1 1.45
4.92 1 1.50
4.91 1 1.43
4.90 1 1.27
4.96 1 1.49
4.91 1 1.45
5.83 I 1.15
4.91 I 1.36
Importance
6.10
6.02
6.23
6.00
5.96
5.88
5.94
5.93
6.37
5.78
Performance Gap
0.91
0.96
1.37
1.08
1.10
1.01
0.95
1.02
0.70
0.72
SatisfactiodSD
5.30 1 1.42
4.93 1 1.54
4.91 1 1.45
4.95 1 1.53
4.77 1 1.42
4.91 1 1.30
4.98 1 1.50
4.90 1 1.47
5.60 I 1.27
5.07 I 1.40
Performance Gap
0.80
1.09
1.32
1.05
1.19
0.97
0.96
1.03
0.77
0.71
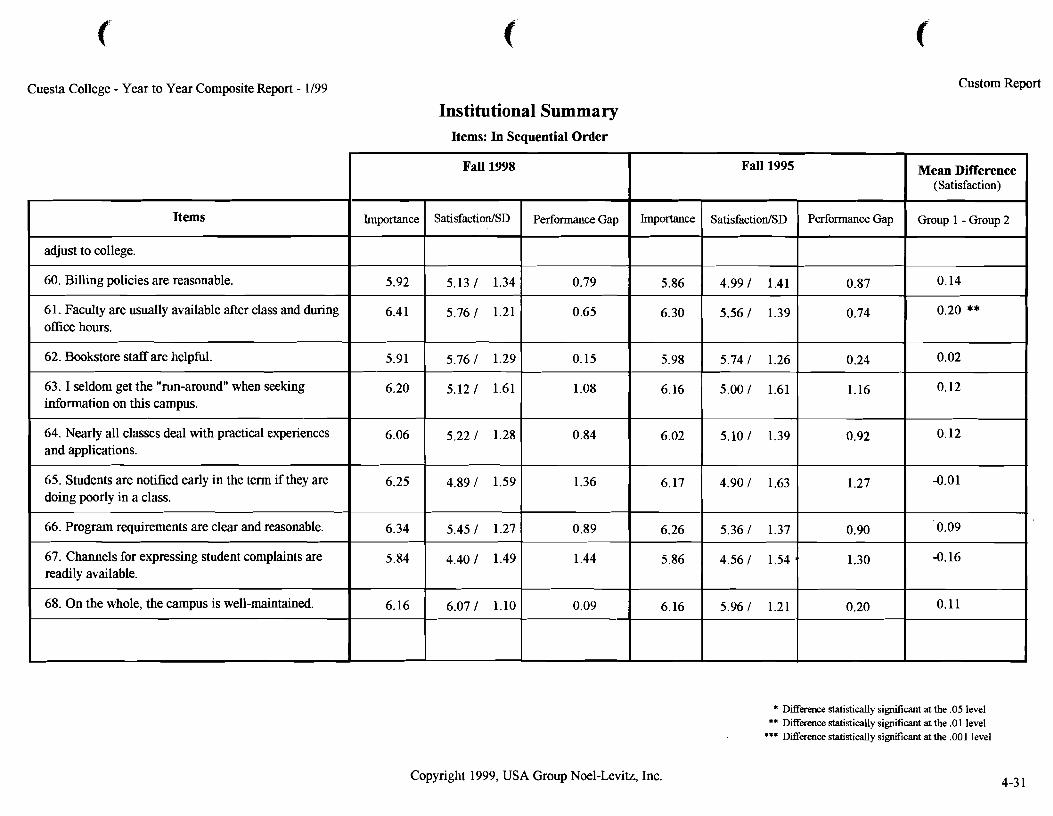
Cuesta College - Year to Year Composite Report - 1/99 Custom Report
Institutional Summary Items: In Sequential Order
* Difference statistically sigruf~cant at the .OS level ** Difference statistically significant at the .0 1 level
*** Daerence statistically significant at the ,001 level
Items
adjust to college.
60. Billing policies are reasonable.
6 1. Faculty are usually available after class and during office hours.
62. Bookstore staff are helpful.
63. I seldom get the "run-around" when seeking information on this campus.
64. Nearly all classes deal with practical experiences and applications.
65. Students are notified early in the term if they are doing poorly in a class.
66. Program requirements are clear and reasonable.
67. Channels for expressing student complaints are readily available.
68. On the whole, the campus is well-maintained.
Copyright 1999, USA Group Noel-Levitz, Inc.
Fall 1998 Mean Difference (Satisfaction)
Group 1 - Group 2
0.14
0.20 **
0.02
0.12
0.12
-0.01
0.09
-0.16
0.11
Performance Gap
0.79
0.65
0.15
1.08
0.84
1.36
0.89
1.44
0.09
Importance
5.92
6.41
5.91
6.20
6.06
6.25
6.34
5.84
6.16
Fall 1995
SatisfactiodSD
5.13 1 1.34
5.76 / 1.21
5.76 / 1.29
5.12 / 1.61
5.22 / 1.28
4.89 / 1.59
5.45 / 1.27
4.40 / 1.49
6.07 / 1.10
Importance
5.86
6.30
5.98
6.16
6.02
6.17
6.26
5.86
6.16
SatisfactiodSD
4.991 1.41
5.56 / 1.39
5.74 / 1.26
5.00 / 1.61
5.10 / 1.39
4.90 / 1.63
5.36 / 1.37
4.56 / 1.54
5.96 / 1.21
Performance Gap
0.87
0.74
0.24
1.16
0.92
1.27
0.90
1.30
0.20
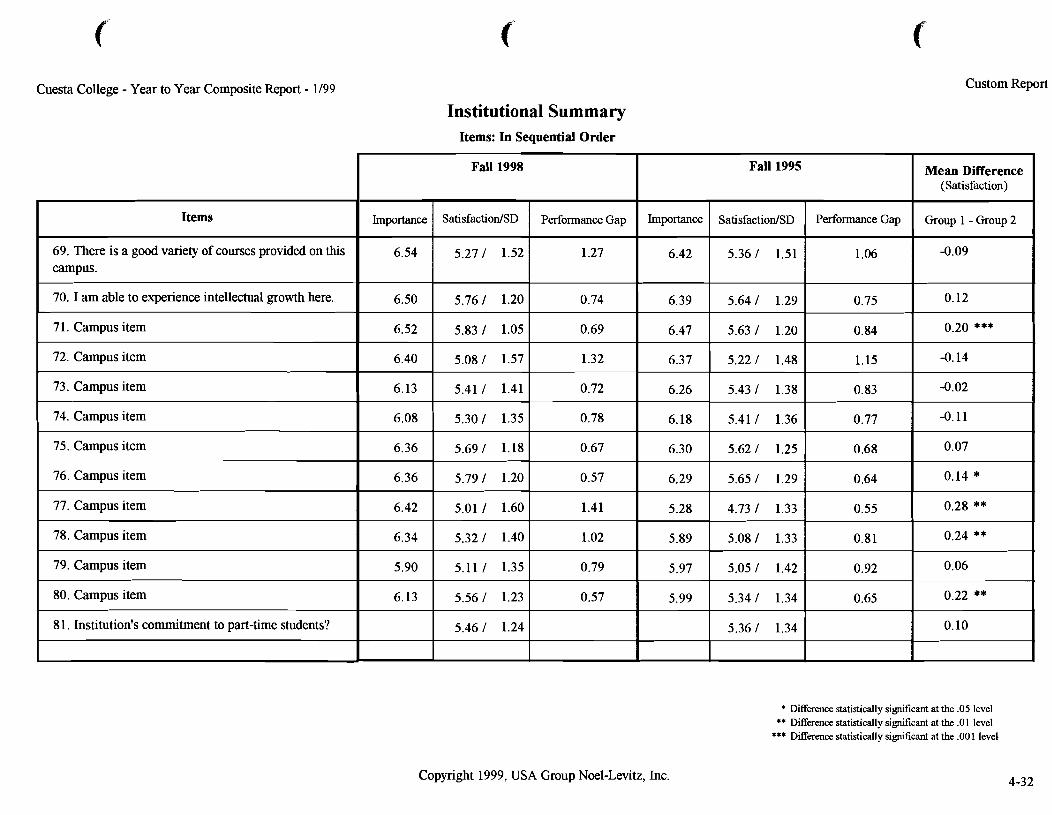
Cuesta College - Year to Year Composite Report - 1199 Custom Report
Institutional Summary Items: In Sequential Order
Difference statistically si@~cant at the .05 level ** Difference statistically sigruticant at the .O I level
*** Difference statistically sigruticant at the ,001 level
Items
69. There is a good variety of courses provided on this campus.
70. I am able to experience intellectual growth here.
7 1. Campus item
72. Campus item
73. Campus item
74. Campus item
75. Campus item
76. Campus item
77. Campus item
78. Campus item
79. Campus item
80. Campus item
8 1. Institution's commitment to part-time students?
Copyright 1999, USA Group Noel-Levitz, Inc.
Fall 1998
Importance
6.54
6.50
6.52
6.40
6.13
6.08
6.36
6.36
6.42
6.34
5.90
6.13
Mean Difference (Satisfaction)
Group 1 - Group 2
-0.09
0.12
0.20 ***
-0.14
-0.02
-0.11
0.07
0.14 *
0.28 **
0.24 **
0.06
0.22 **
0.10
Fall 1995
SatisfactiodSD
5.27 1 1.52
5.76 1 1.20
5.83 1 1.05
5.08 1 1.57
5.41 1 1.41
5.30 1 1.35
5.69 1 1.18
5.79 I 1.20
5.01 1 1.60
5.32 1 1.40
5.11 1 1.35
5.56 1 1.23
5.46 1 1.24
Importance
6.42
6.39
6.47
6.37
6.26
6.18
6.30
6.29
5.28
5.89
5.97
5.99
Performance Gap
1.27
0.74
0.69
1.32
0.72
0.78
0.67
0.57
1.41
1.02
0.79
0.57
SatisfactiodSD
5.36 1 1.51
5.64 1 1.29
5.63 1 1.20
5.22 1 1.48
5.43 I 1.38
5.41 I 1.36
5.62 I 1.25
5.65 I 1.29
4.73 I 1.33
5.08 1 1.33
5.05 1 1.42
5.34 1 1.34
5.36 1 1.34
Performance Gap
1.06
0.75
0.84
1.15
0.83
0.77
0.68
0.64
0.55
0.81
0.92
0.65
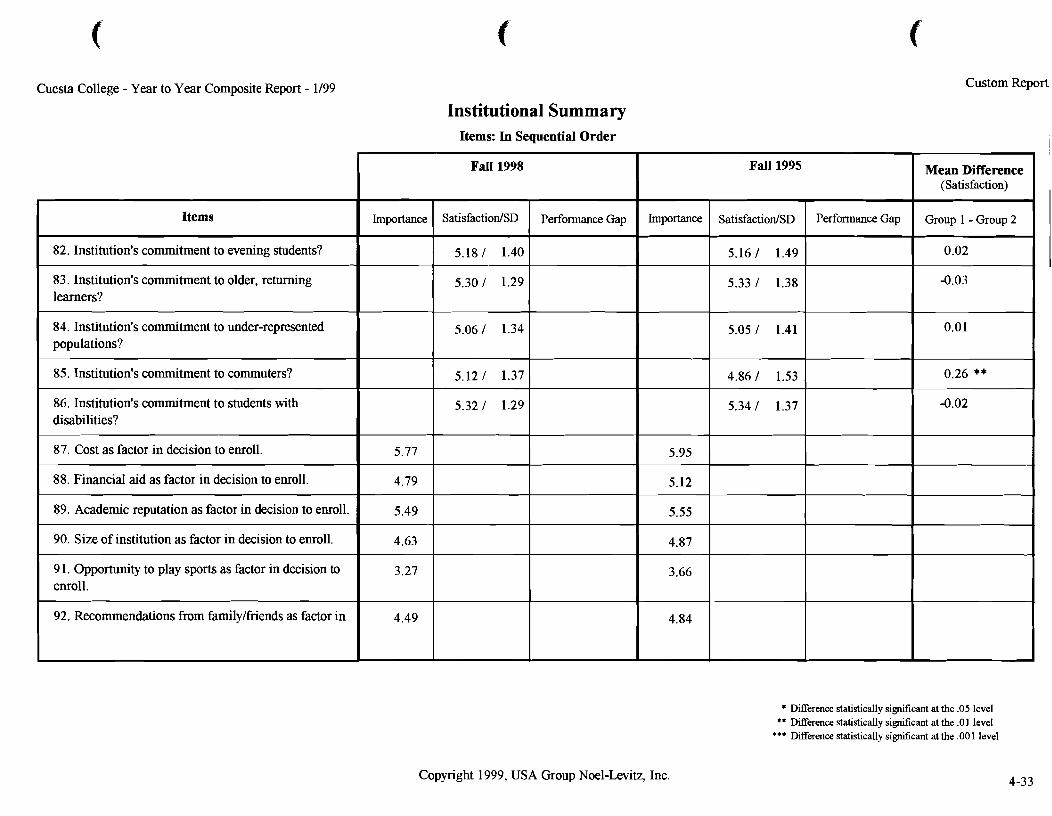
Cuesta College - Year to Year Composite Report - 1/99 Custom Report
Institutional Summary Items: In Sequential Order
Difference statistically sigtuf~cant at the .05 level ** Difference statistically s i d ~ c a n t at the .O1 level
*** Difference statistically sigruf~cant at the .001 level
Items
82. Institution's commitment to evening students?
83. Institution's commitment to older, returning learners?
84. Institution's commitment to under-represented populations?
85. Institution's commitment to commuters?
86. Institution's commitment to students with disabilities?
87. Cost as factor in decision to enroll.
88. Financial aid as factor in decision to enroll.
89. Academic reputation as factor in decision to enroll.
90. Size of institution as factor in decision to enroll.
9 1. Opportunity to play sports as factor in decision to enroll.
92. Recommendations from familylfriends as factor in
Copyright 1999, USA Group Noel-Levitz, Inc.
Fall 1998
Importance
5.77
4.79
5.49
4.63
3.27
4.49
Mean Difference (Satisfaction)
Group 1 - Group 2
0.02
-0.03
0.01
0.26 **
-0.02
Fall 1995
Importance
5.95
5.12
5.55
4.87
3.66
4.84
SatisfactiodSD
5.18 / 1.40
5.30 / 1.29
5.06 / 1.34
5.12 / 1.37
5.32 / 1.29
Performance Gap SatisfactiodSD
5.16 / 1.49
5.33 / 1.38
5.05 / 1.41
4.86 / 1.53
5.34 / 1.37
Performance Gap
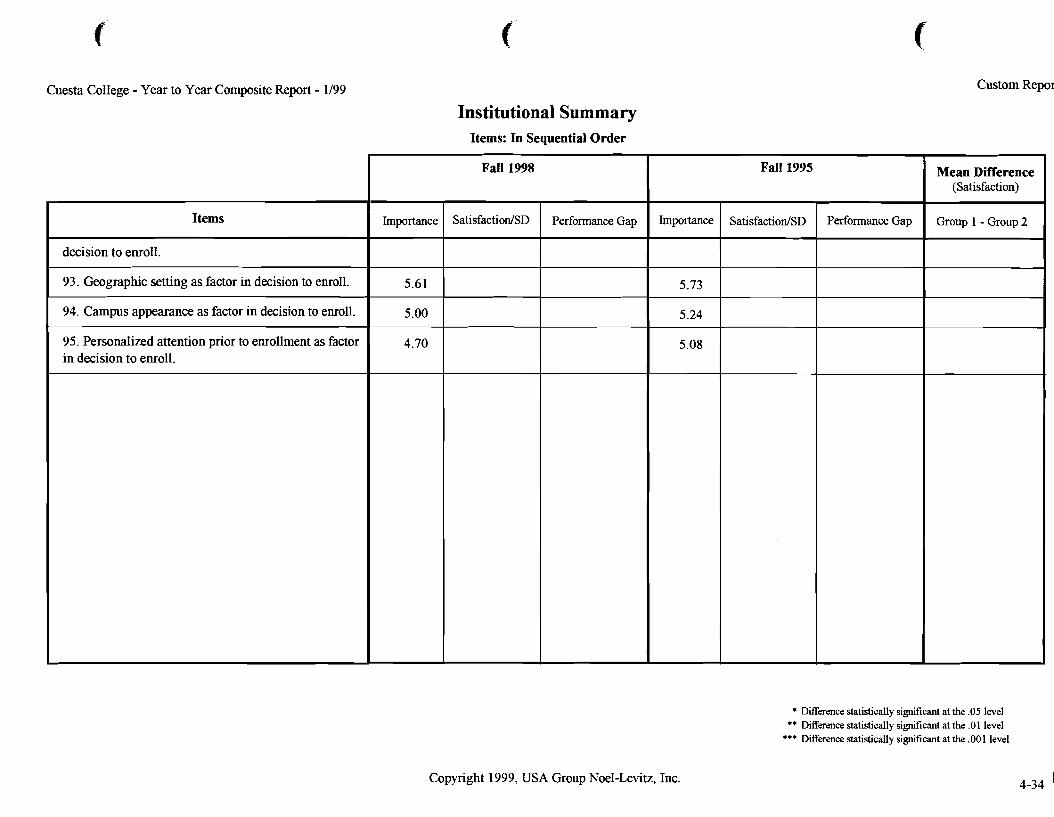
Cuesta College - Year to Year Composite Report - 1/99 Custom Repol
Institutional Summary Items: In Sequential Order
Difference statistically significant at the .05 level ** Difference statistically sistuflcant at the . O l level
*** Difference statistically sisruf~cant at the .OO 1 level
Items
decision to enroll.
93. Geographic setting as factor in decision to enroll.
94. Campus appearance as factor in decision to enroll.
95. Personalized attention prior to enrollment as factor in decision to enroll.
Copyright 1999, USA Group Noel-Levitz, Inc.
Fall 1998
Importance
5.61
5.00
4.70
Mean Difference (Satisfaction)
Group 1 - Group 2
Fall 1995
Importance
5.73
5.24
5.08
SatisfactiodSD Performance Gap SatisfactiodSD Performance Gap
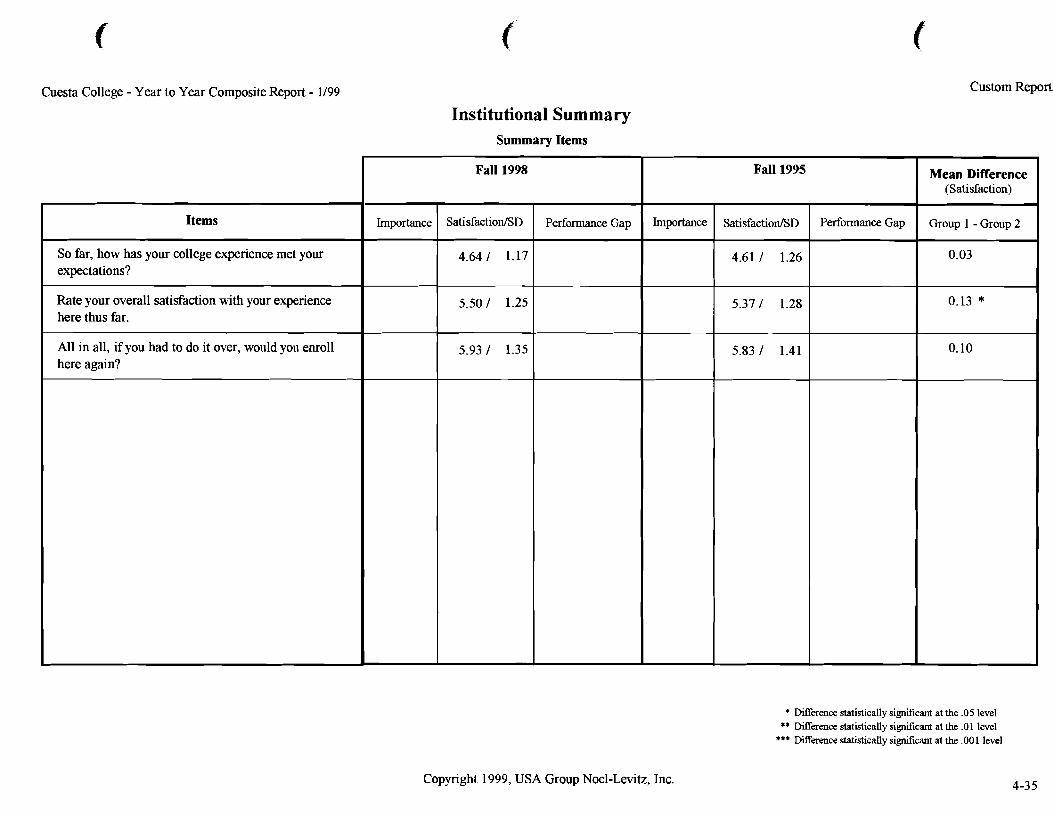
Cuesta College - Year to Year Composite Report - 1/99 Custom Repon
Institutional Summary Summary Items
Difference statistically si&~cant at the .05 level ** Difference statistically simcant at the .O1 level
*** DBerence statistically si&~cant at the ,001 level
Items
So far, how has your college experience met your expectations?
Rate your overall satisfaction with your experience here thus far.
All in all, if you had to do it over, would you enroll here again?
Copyright 1999, USA Group Noel-Levitz, Inc.
Fall 1998
Importance
Mean Difference (Satisfaction)
Group 1 - Group 2
0.03
0.13 *
0.10
Fall 1995
SatisfactiodSD
4.64 / 1.17
5.50 / 1.25
5.93 / 1.35
Importance Performance Gap SatisfactiodSD
4.61 1 1.26
5.37 / 1.28
5.83 1 1.41
Performance Gap
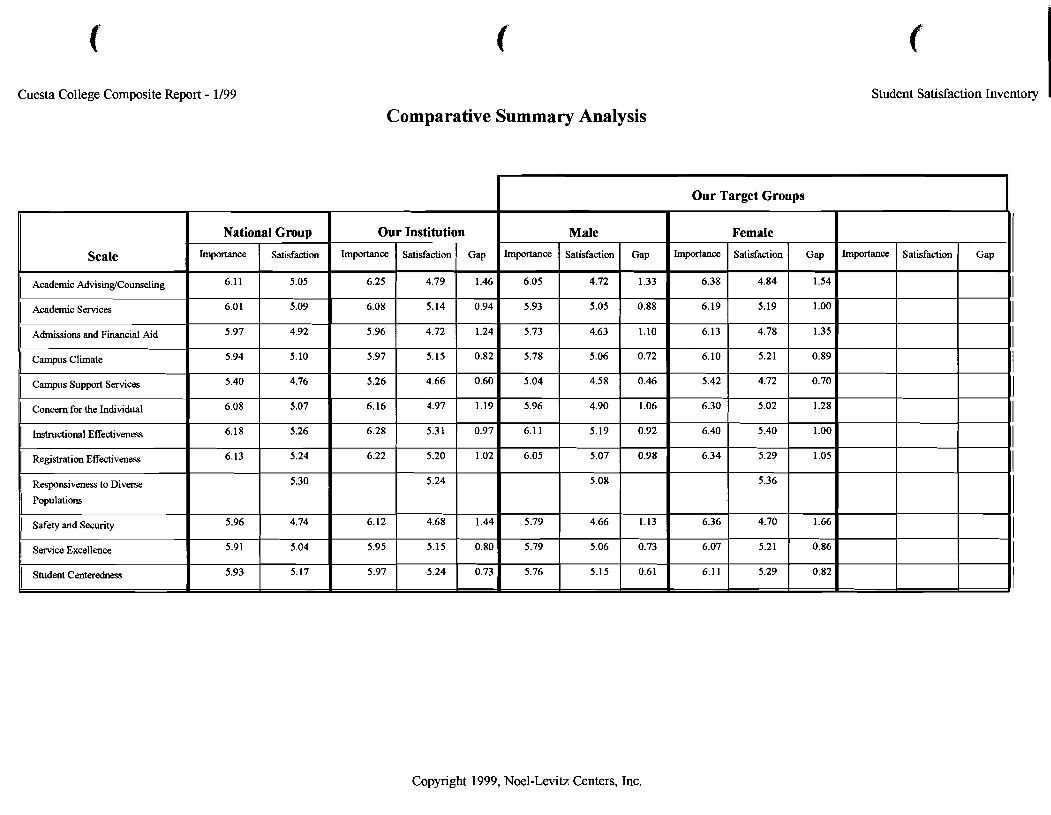
Cuesta College Composite Report - 1/99 Student Satisfaction Invento~y I Comparative Summary Analysis
I Our Target Groups I
Copyright 1999, Noel-Levitz Centers, Inc.
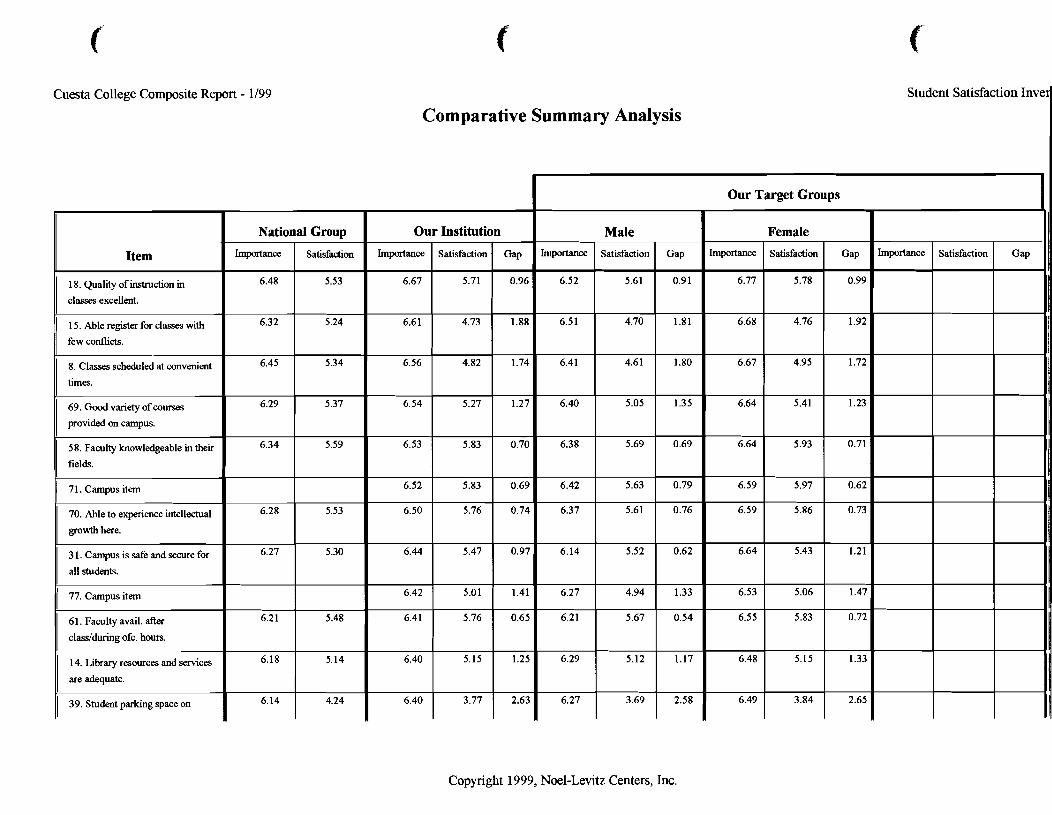
Cuesta College Composite Report - 1/99
Copyright 1999, Noel-Levitz Centers, Inc.
Student Satisfaction Inve
Comparative Summary Analysis
Item
18. Quality of instruction in
classes excellent.
15. Able register for classes with
few conflicts.
8. Classes scheduled at convenient
times.
69. Good variety of courses
provided on campus.
58. Faculty knowledgeable in their
fields.
I 71. Campus item
70. Able to experience intellectual
growth here.
3 1. Campus is safe and secure for
all students.
1 77. campus item
61. Faculty avail. after
clasdduring ofc. hours.
14. Library resources and services
are adequate.
1 39. student paicing space on
Importance
6.52
6.51
6.41
6.40
6.38
6.42
6.37
6.14
6.27
6.21
6.29
6.27
Our
Importance
6.67
6.61
6.56
6.54
6.53
6.52
6.50
6.44
6.42
6.41
6.40
6.40
National
hportance
6.48
6.32
6.45
6.29
6.34
6.28
6.27
6.21
6.18
6.14
Our Target Groups
Male
Satisfaction
5.61
4.70
4.61
5.05
5.69
5.63
5.61
5.52
4.94
5.67
5.12
3.69
Institution
Satisfaction
5.71
4.73
4.82
5.27
5.83
5.83
5.76
5.47
5.01
5.76
5.15
3.77
Group
Satisfaction
5.53
5.24
5.34
5.37
5.59
5.53
5.30
5.48
5.14
4.24
Importance
6.77
6.68
6.67
6.64
6.64
6.59
6.59
6.64
6.53
6.55
6.48
6.49
ImPtmce Gap
0.91
1.81
1.80
1.35
0.69
0.79
0.76
0.62
1.33
0.54
1.17
2.58
Gap
0.96
1.88
1.74
1.27
0.70
0.69
0.74
0.97
1.41
0.65
1.25
2.63
Satisfaction Gap
Female
Satisfaction
5.78
4.76
4.95
5.41
5.93
5.97
5.86
5.43
5.06
5.83
5.15
3.84
Gap
0.99
1.92
1.72
1.23
0.71
0.62
0.73
1.21
1.47
0.72
1.33
2.65
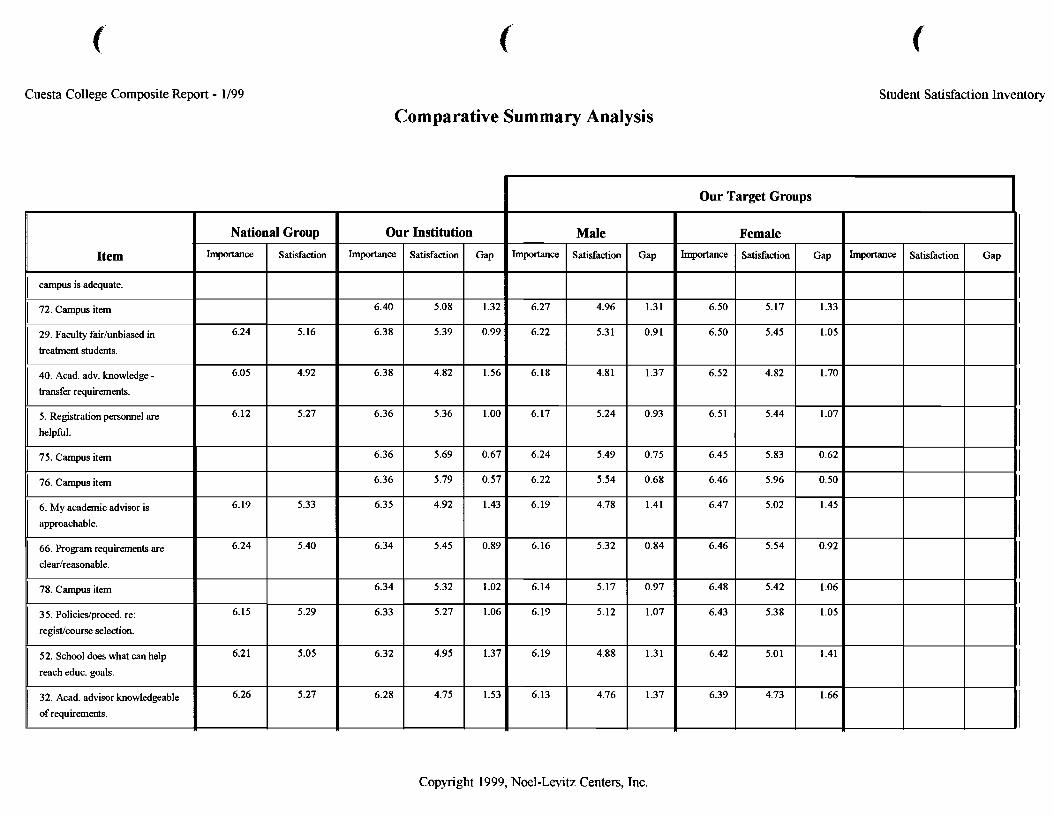
Cuesta College Composite Report - 1/99 Student Satisfaction Inventory
Comparative Summary Analysis
Our Target Groups
Copyright 1999, Noel-Levitz Centers, Inc.
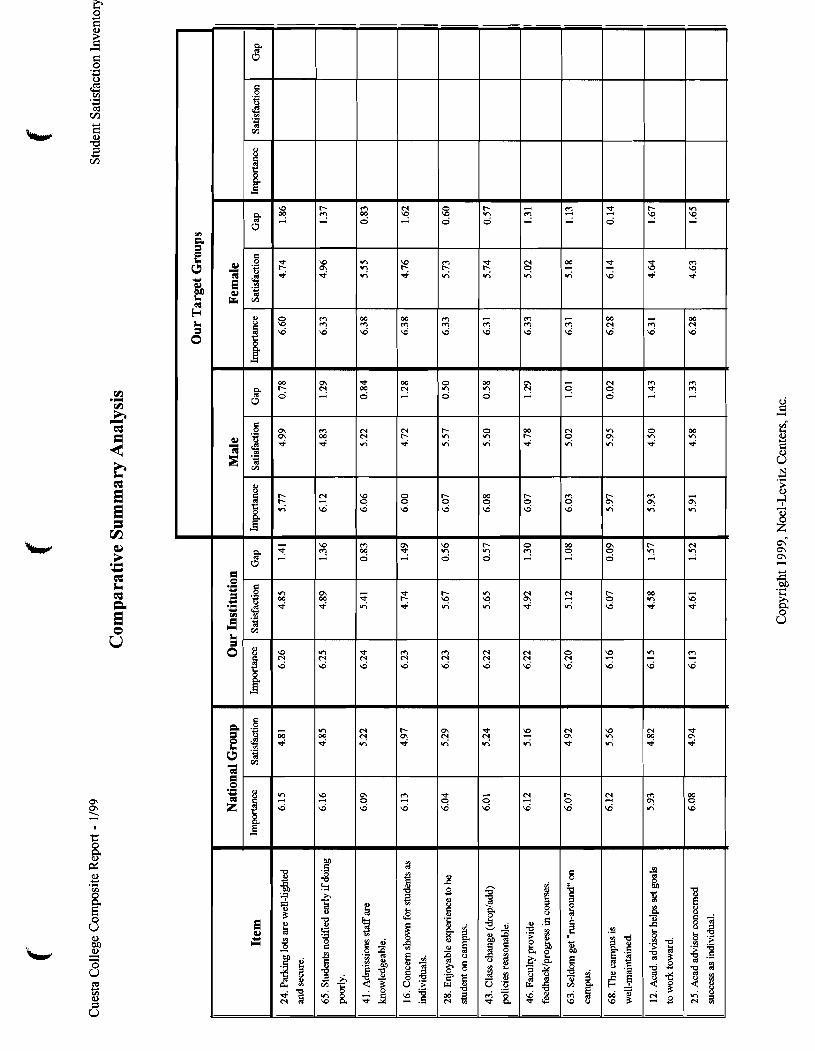
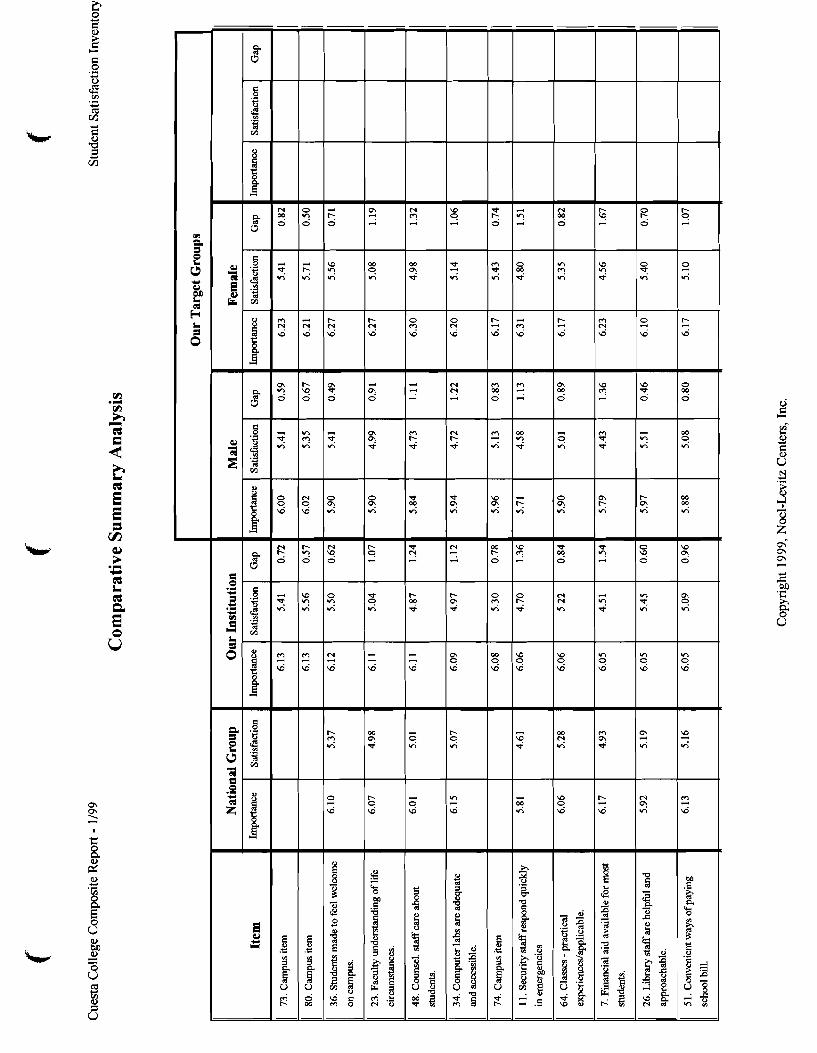
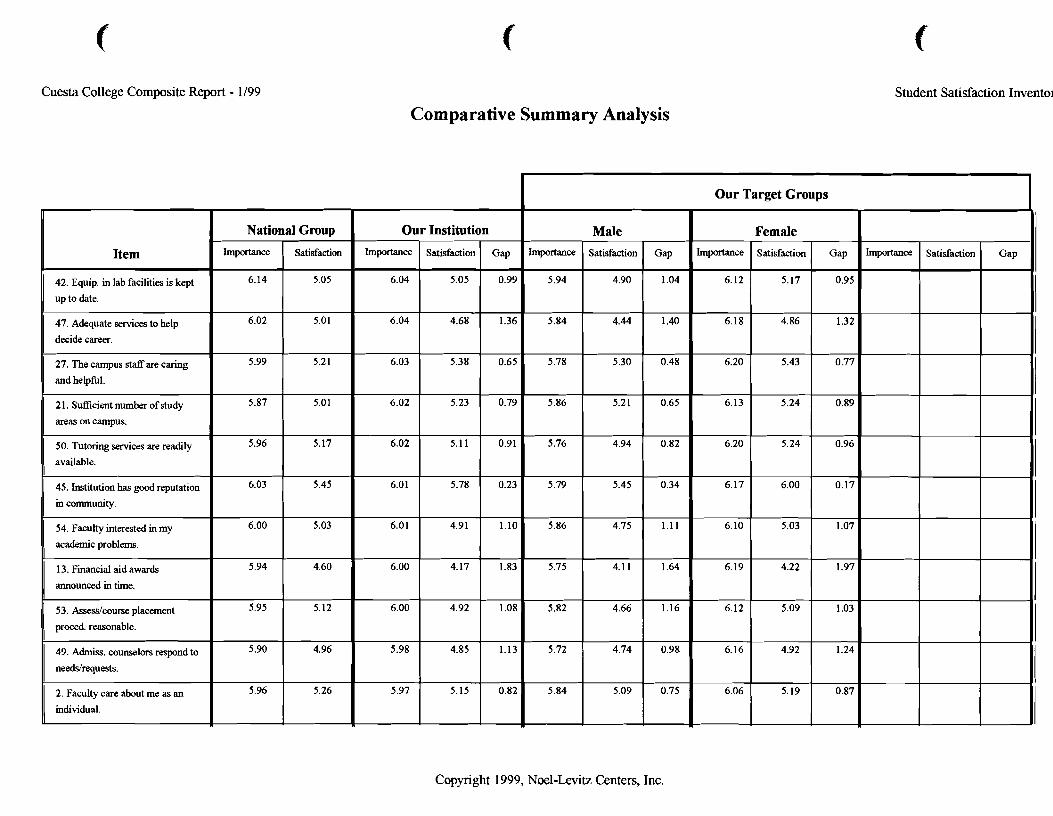
Cuesta College Composite Report - 1/99 Student Satisfaction Invent01
Comparative Summary Analysis
Copyright 1999, Noel-Levitz Centers, Inc.
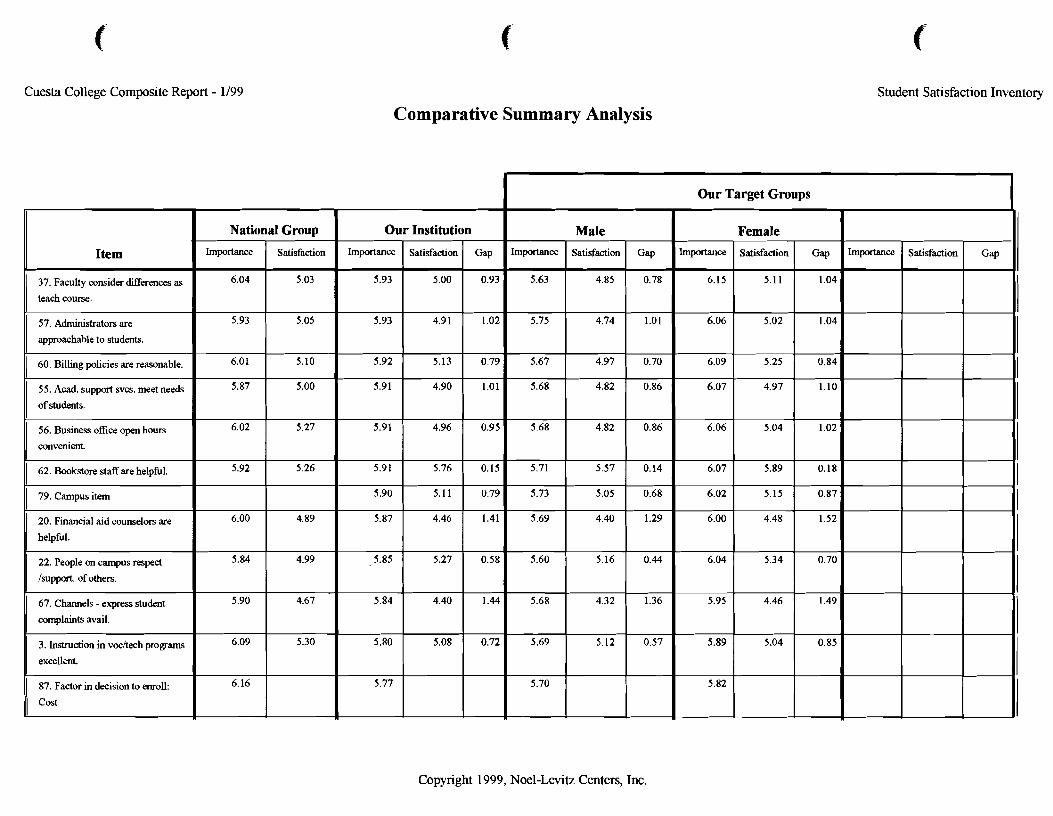
Cuesta College Composite Report - 1/99 Student Satisfaction Inventory
Comparative Summary Analysis
Copyright 1999, Noel-Levitz Centers, Inc.
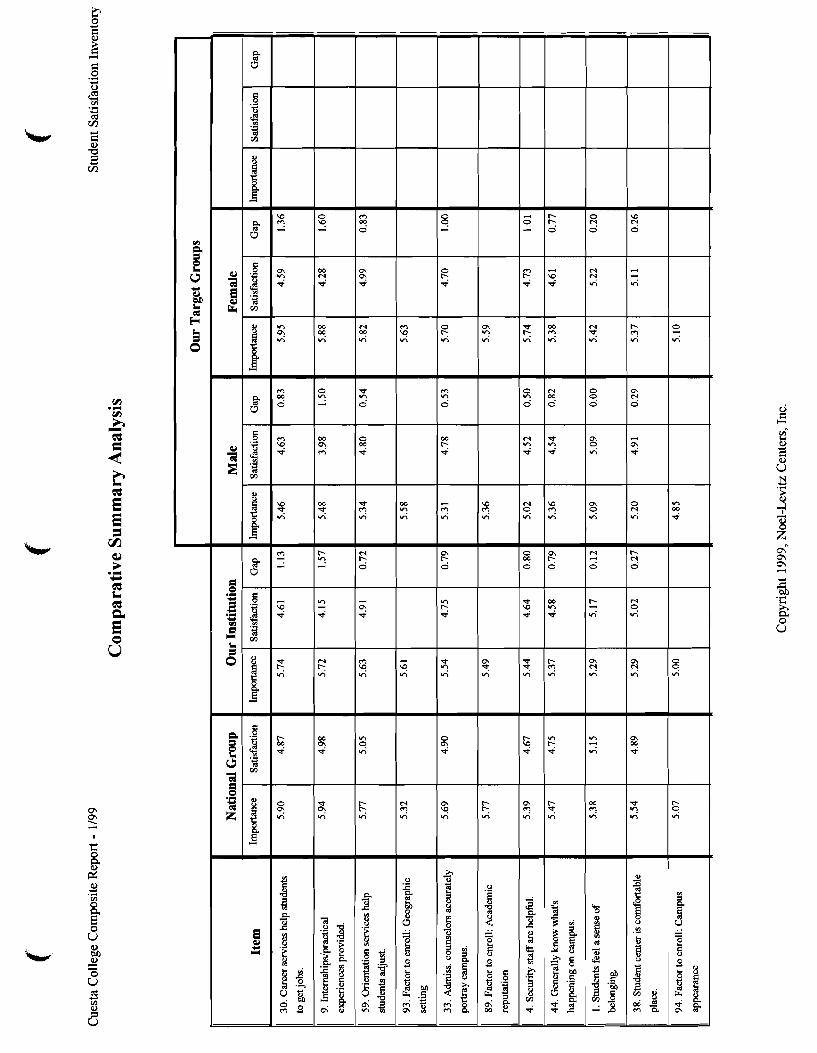
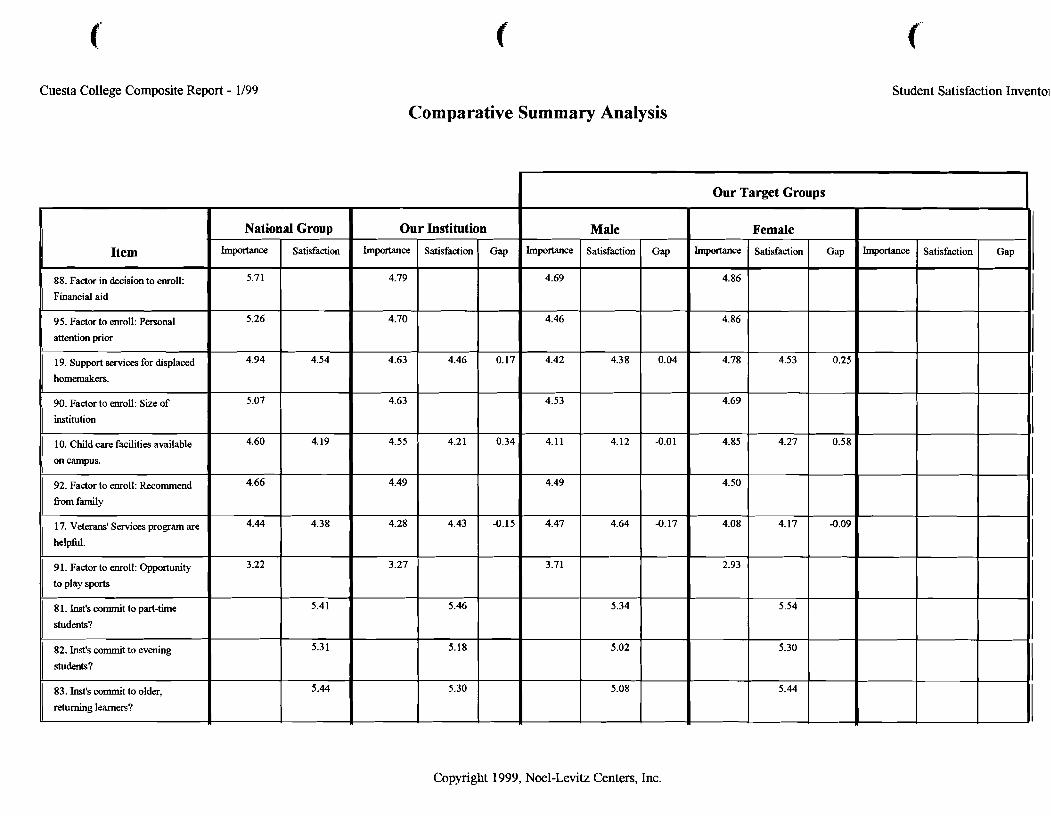
Cuesta College Composite Report - 1/99
Comparative Summary Analysis Student Satisfaction Inventoi
Our Target Groups
Copyright 1999, Noel-Levitz Centers, Inc.
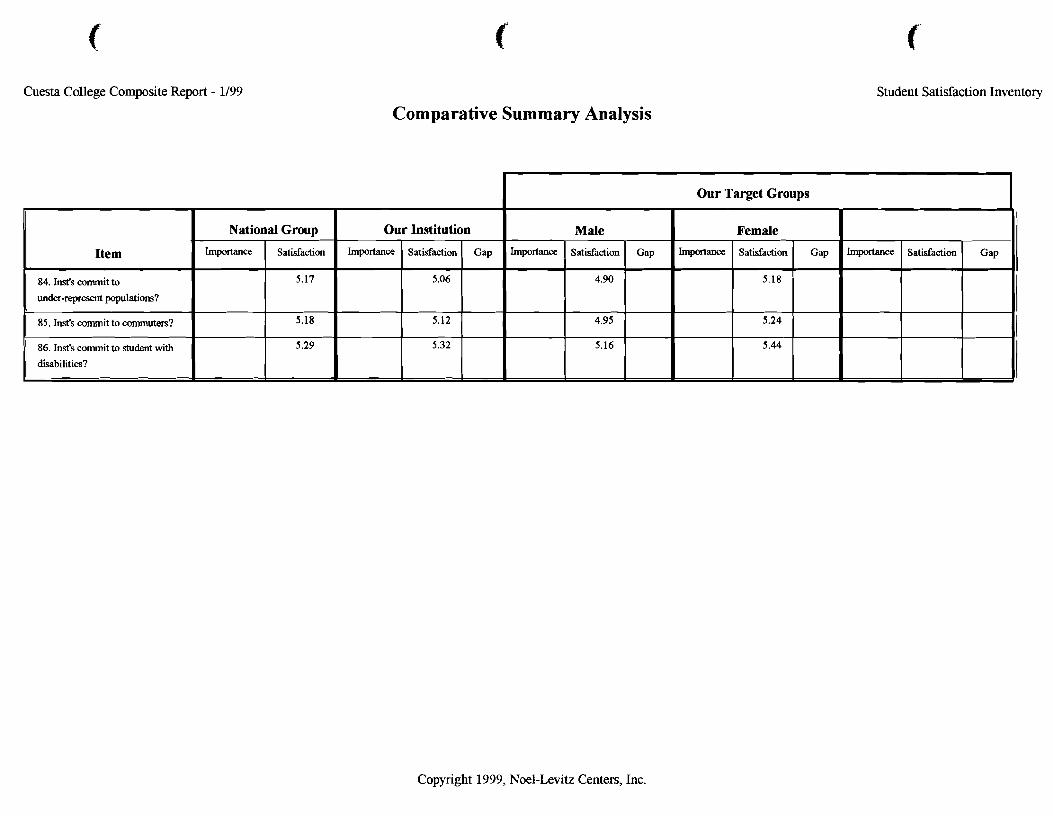
Cuesta College Composite Report - 1/99
Comparative Summary Analysis Student Satisfaction Inventory
Copyright 1999, Noel-Levitz Centers, Inc.
Item
84. Inst's commit to
under-represent populations?
1 85. Inst's commit to commuters?
86. Inst's commit to student with disabilities?
Our Target Groups I
I
National Group Male Our Institution
Importance Importance Satisfaction
5.17
5.18
5.29
Gap Importance
Female
Satisfaction
5.06
5.12
5.32
Satisfaction
4.90
4.95
5.16
Importance Importance Gap Satisfaction
5.18
5.24
5.44
Satisfaction Gap Gap

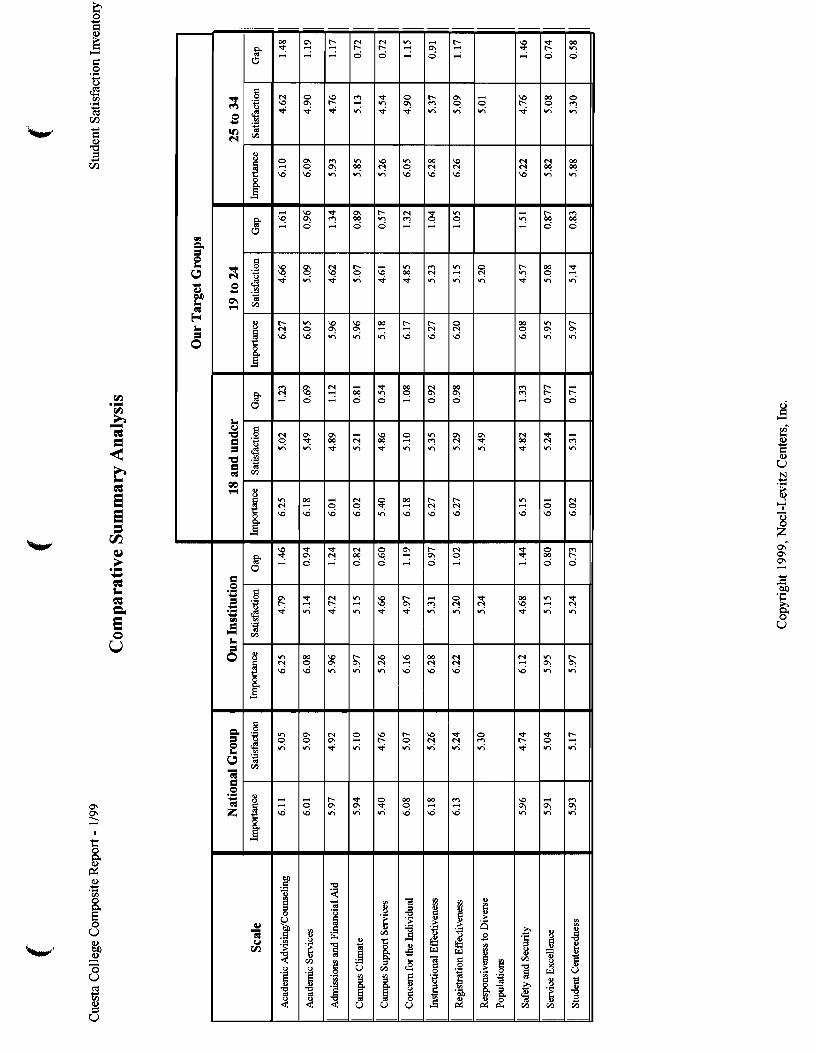
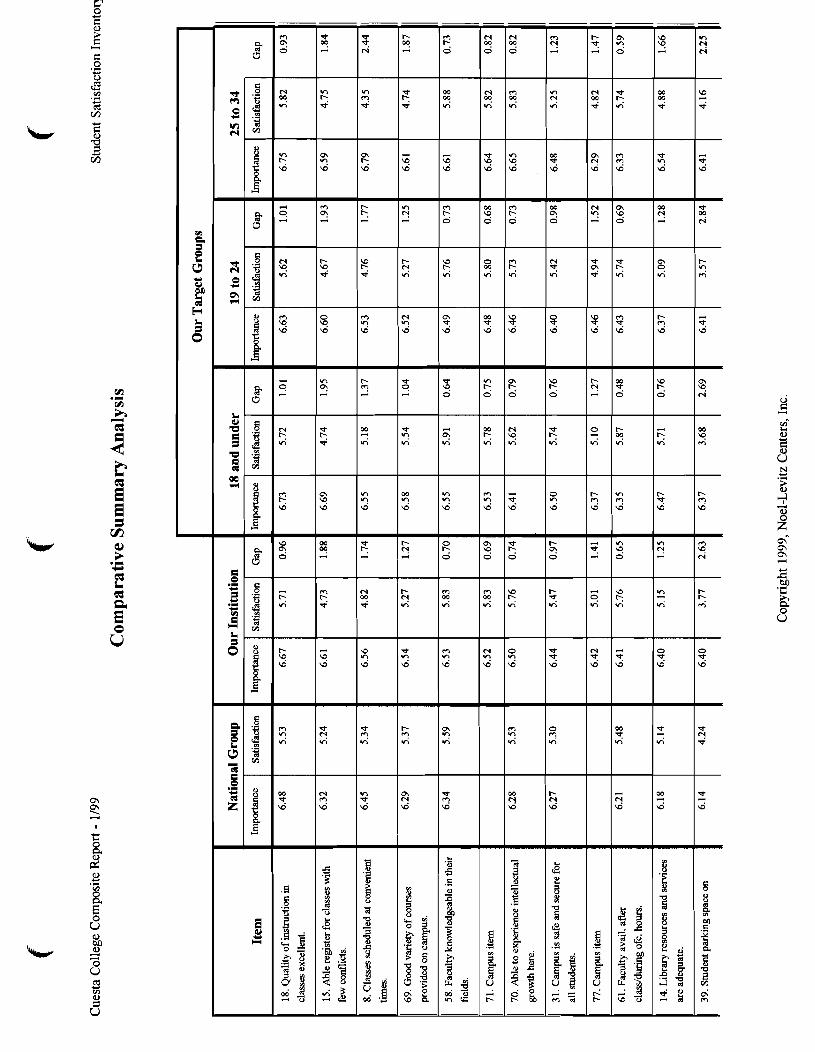
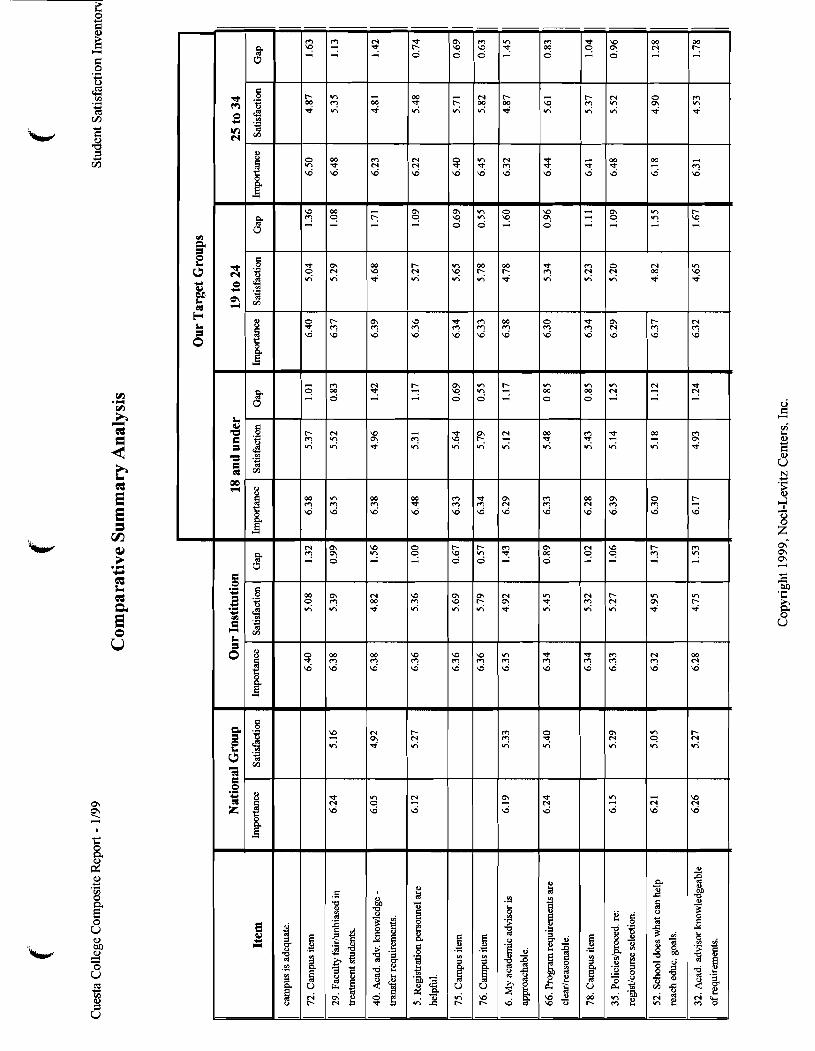
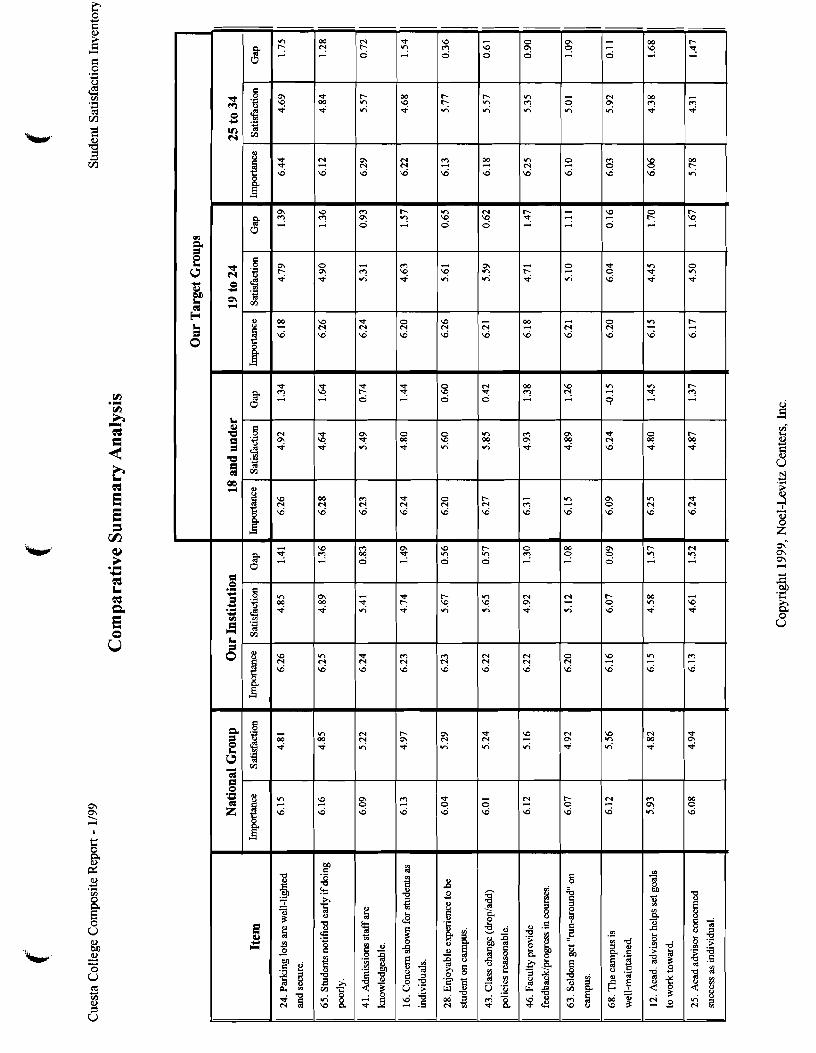
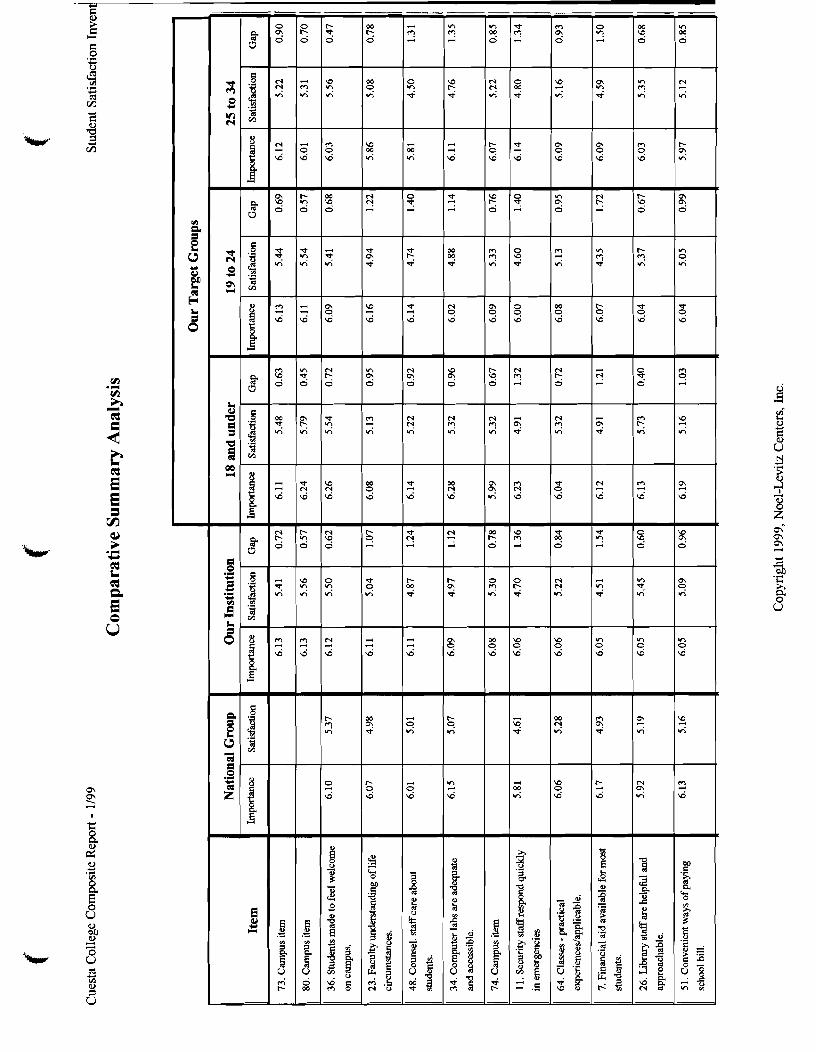
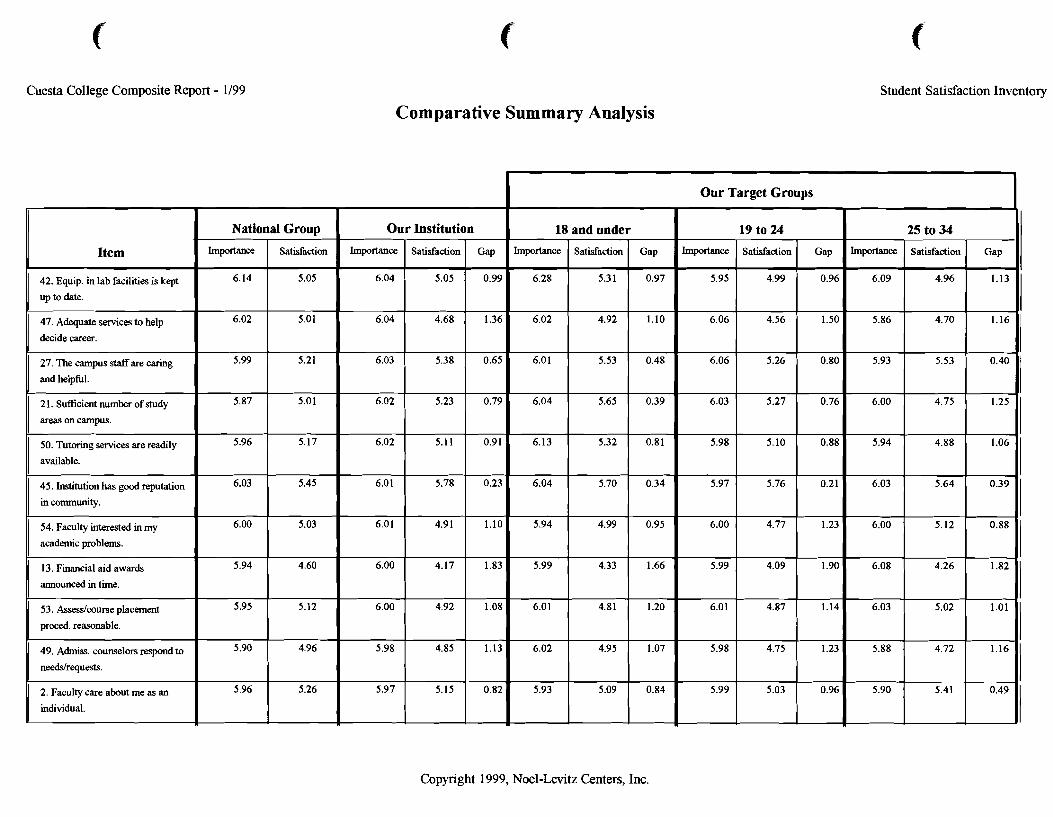
Cuesta College Composite Report - 1/99
Comparative Summary Analysis Student Satisfaction Inventory
I Our Target Groups
Copyright 1999, Noel-Levitz Centers, Inc.
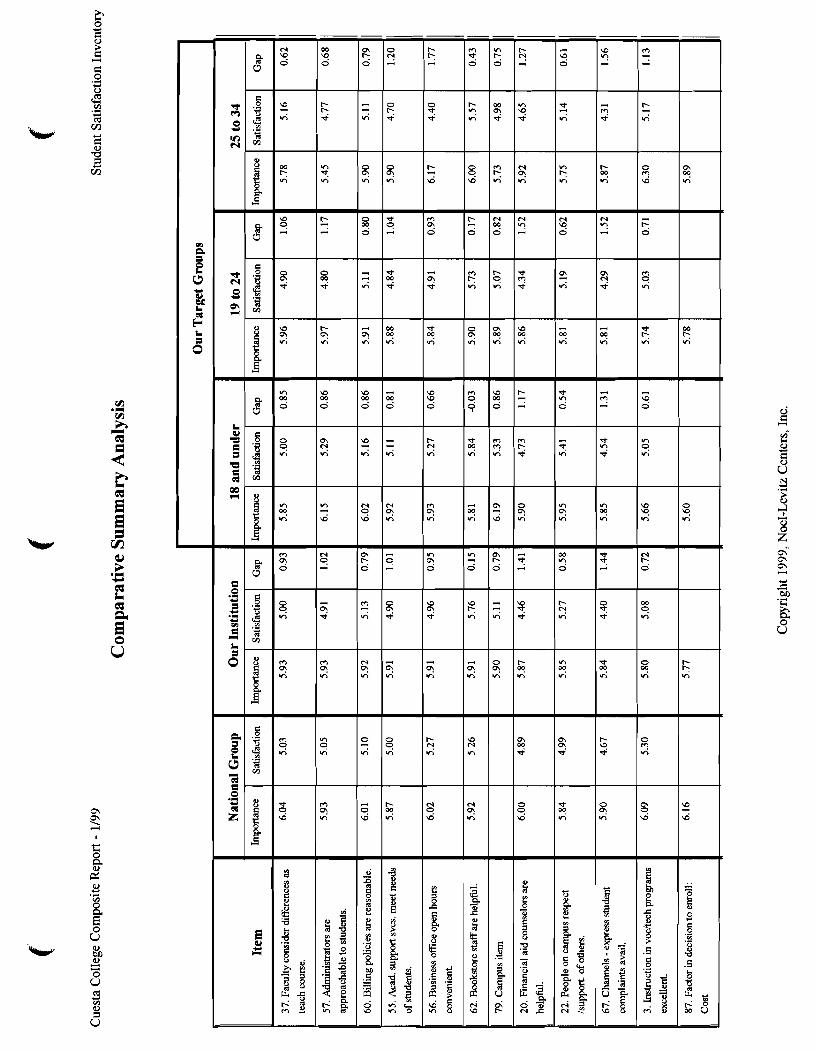
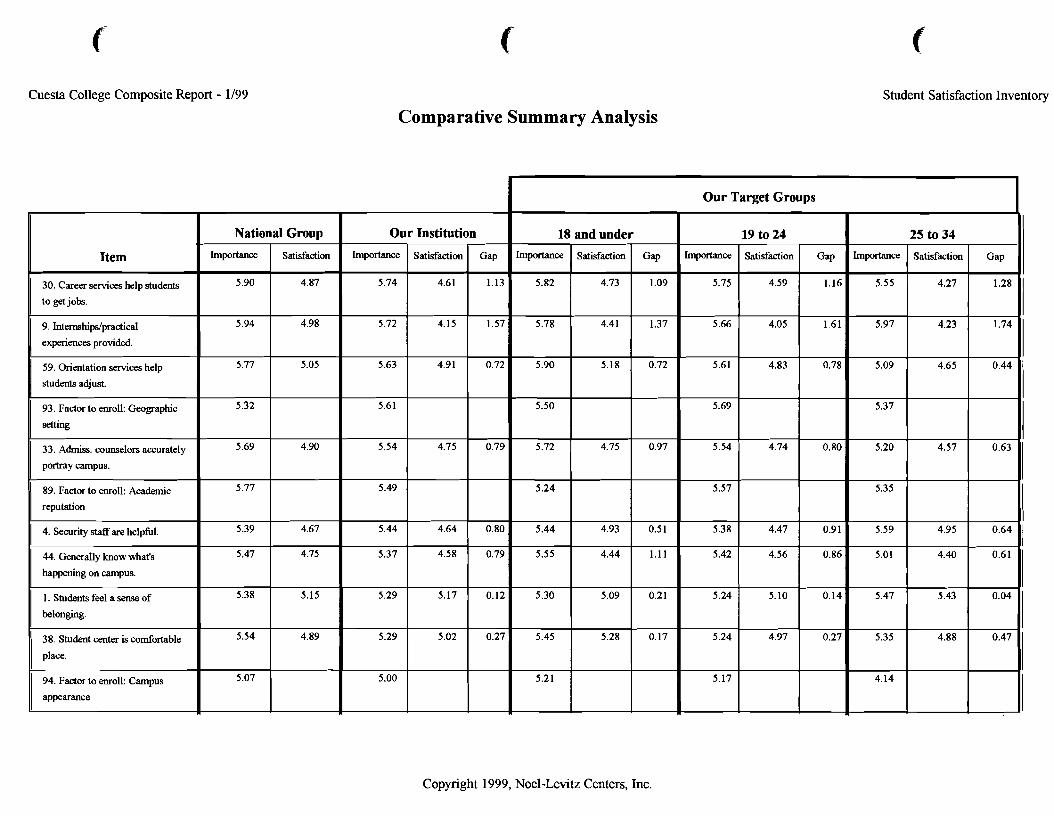
Cuesta College Composite Report - 1/99 Student Satisfaction Inventory
Comparative Summary Analysis
I Our Target Groups I
Copyright 1999, Noel-Levitz Centers, Inc.
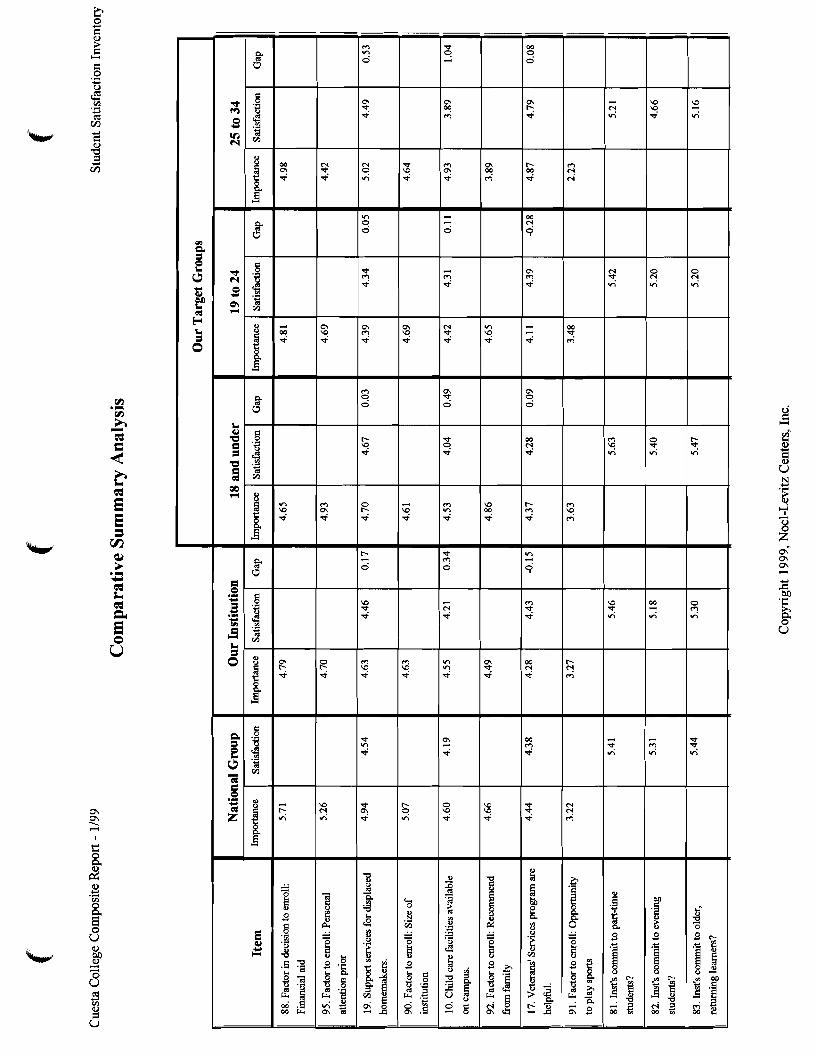
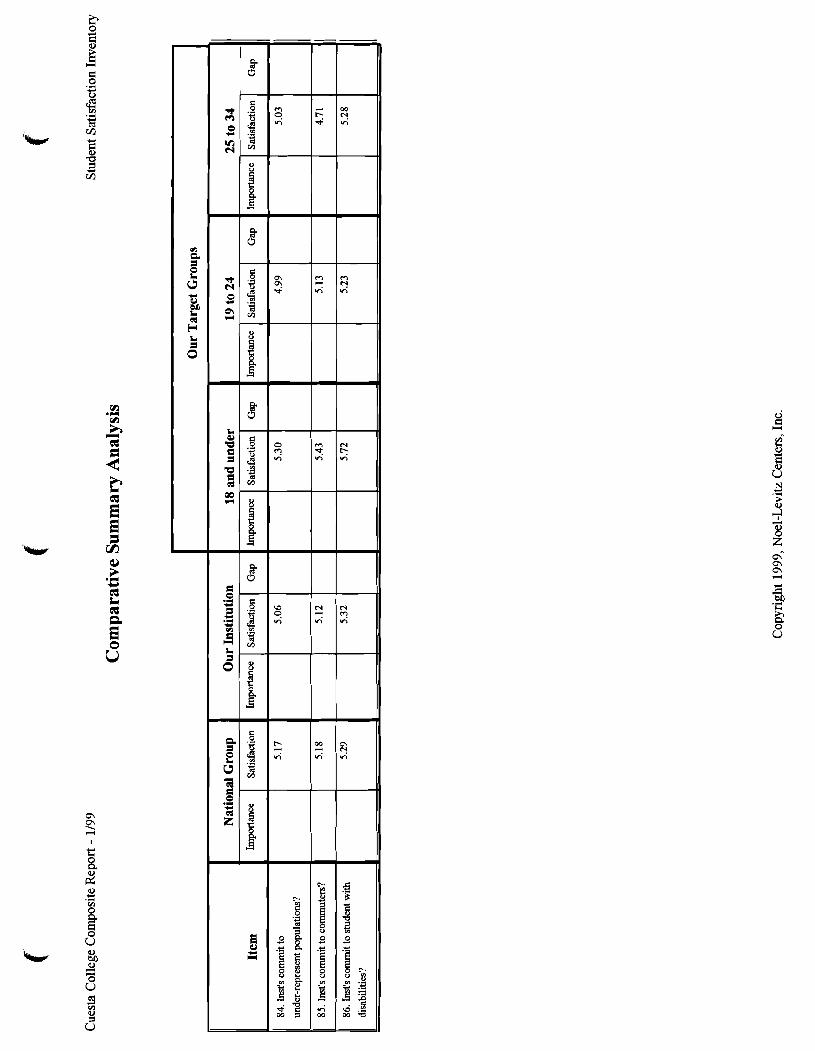

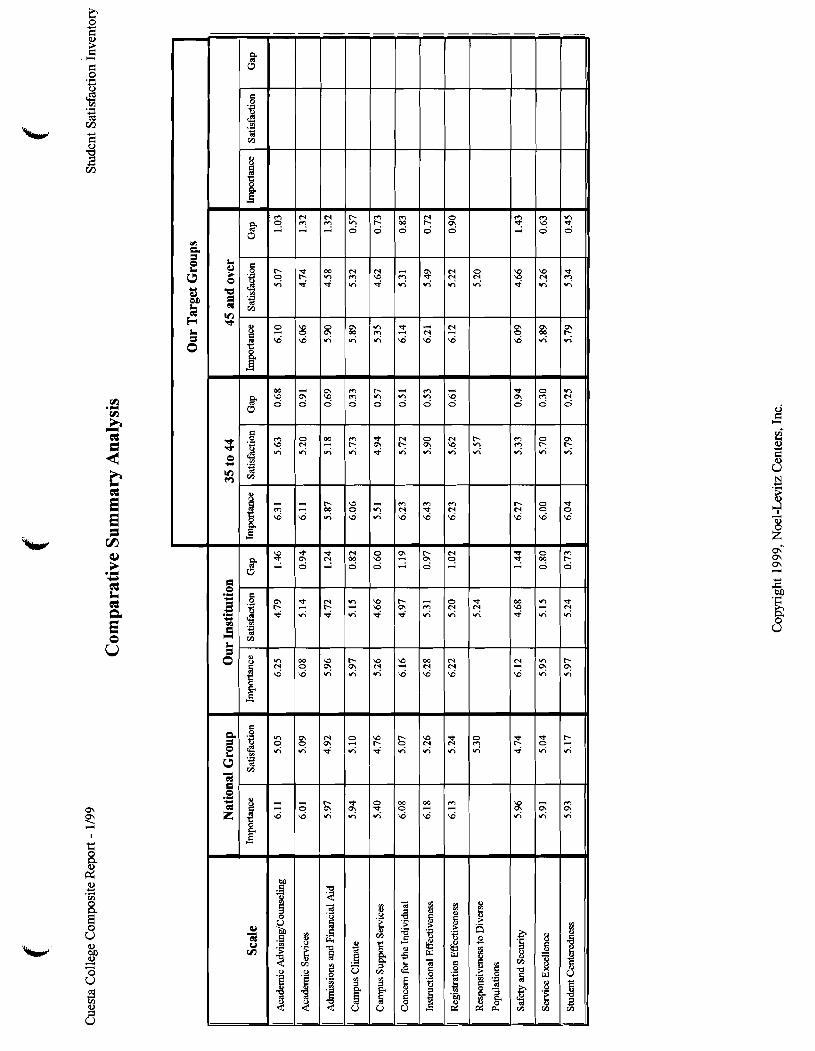
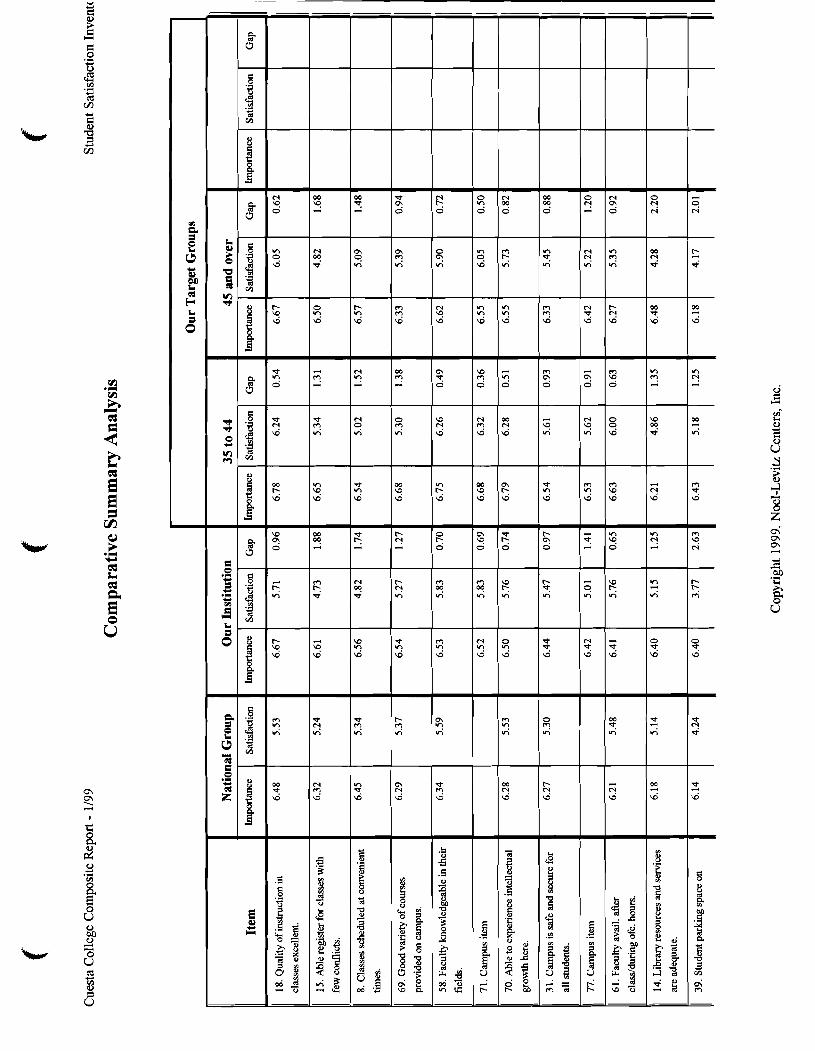
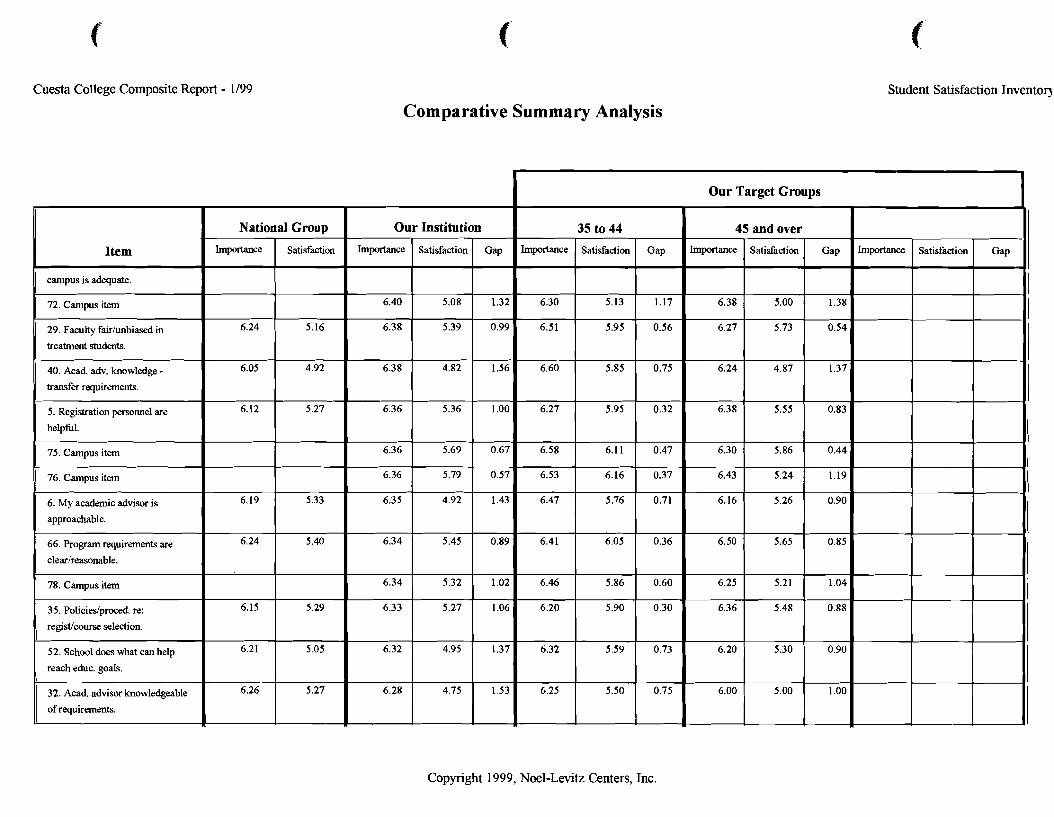
Cuesta College Composite Report - 1/99
Comparative Summary Analysis Student Satisfaction Inventoq
Copyright 1999, Noel-Levitz Centers, Inc.
Item
I campus is adequate.
1 72. Campus item
29. Faculty faidunbiased in
treatment students.
40. Acad. adv. knowledge - transfer requirements.
5. Registration personnel are
helpful.
I 75. Campus item
1 76. Campus item
6. My academic advisor is
approachable.
66. Program requirements are
clearireasonable.
1 78. Campus item
35. Policiedproced. re:
regist/course selection.
52. School does what can help
reach educ. goals.
32. Acad. advisor knowledgeable
of requirements.
I
Our
Im@ance
6.40
6.38
6.38
6.36
6.36
6.36
6.35
6.34
6.34
6.33
6.32
6.28
National
Importance
6.24
6.05
6.12
6.19
6.24
6.15
6.21
6.26
hnporhnce
6.30
Group
Satisfaction
5.16
4.92
5.27
5.33
5.40
5.29
5.05
5.27
Institution
Satisfaction
5.08
5.39
4.82
5.36
5.69
5.79
4.92
5.45
5.32
5.27
4.95
4.75
Gap
1.32
0.99
1.56
1.00
0.67
0.57
1.43
0.89
1.02
1.06
1.37
1.53
6.51
6.60
6.27
6.58
6.53
6.47
6.41
6.46
6.20
6.32
6.25
35 to 44
Satisfaction
5.13
Our Target Groups
Gap
1.17
45 Impa'h~ce
6.38
Importance
I
I
5.95
5.85
5.95
6.1 1
6.16
5.76
6.05
5.86
5.90
5.59
5.50
6.27
6.24
6.38
6.30
6.43
6.16
6.50
6.25
6.36
6.20
6.00
0.56
0.75
0.32
0.47
0.37
0.71
0.36
0.60
0.30
0.73
0.75
and over
Satisfaction
5.00
Satisfaction Gap
1.38
5.73
4.87
5.55
5.86
5.24
5.26
5.65
5.21
5.48
5.30
5.00
Gap
0.54
1.37
0.83
0.44
1.19
0.90
0.85
1.04
0.88
0.90
1 .OO
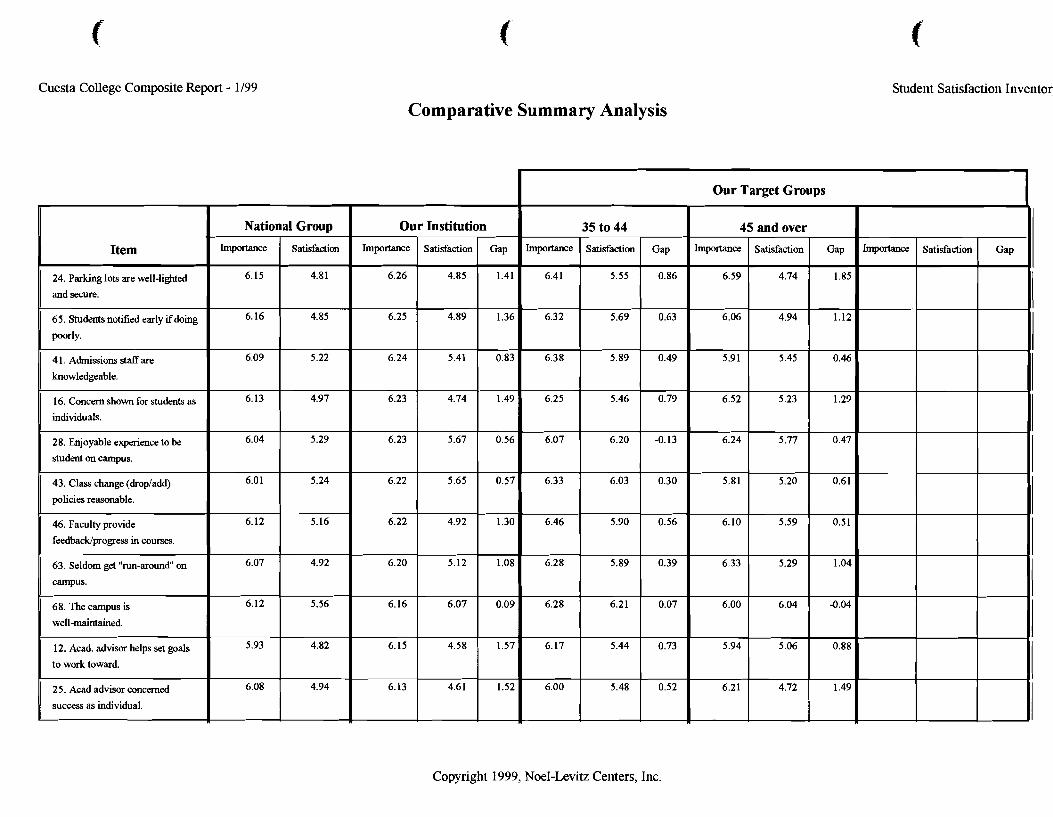
Cuesta College Composite Report - 1/99
Item
24. Parking lots are well-lighted
and secure.
65. Students notified early if doing
1 poorly.
4 1. Admissions staff are
knowledgeable.
16. Concern shown for students as
individuals. I
1 28. Enjoyable experience to be
Natio Impontance
al Group
Satisfaction
Student Satisfaction Inventor
Comparative Summary Analysis
Our hstitution 7
I success as individual. I I I I I
Copyright 1999, Noel-Levitz Centers, Inc.
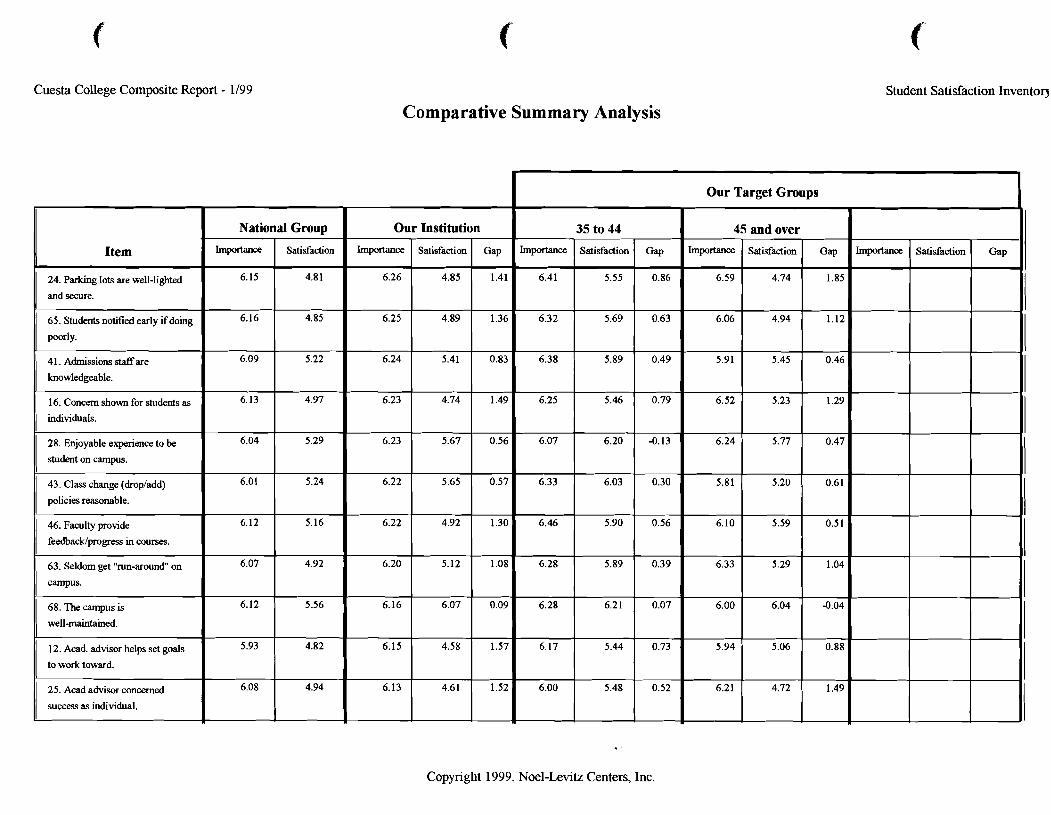
Cuesta College Composite Report - 1/99 Student Satisfaction Inventoq
Comparative Summary Analysis
Our Institution 35 to 44
Our 7 arget Groups
5 and over Importance Satisfaction I Gap Item
25. Acad advisor concerned
success as individual.
24. Parking lots are well-lighted
and secure.
65. Students notified early if doing
poorly.
41. Admissions staff are
knowledgeable.
16. Concern shown for students as
individuals.
28. Enjoyable experience to be
student on campus.
43. Class change (dropladd)
policies reasonable.
46. Faculty provide
feedbacWprogres in courses.
63. Seldom get "run-around" on
campus.
68. The campus is
well-maintained.
12. Acad. advisor helps set goals
to work toward.
Copyright 1999, Noel-Levitz Centers, Inc.
6.15
6.16
6.09
6.13
6.04
6.01
6.12
6.07
6.12
5.93
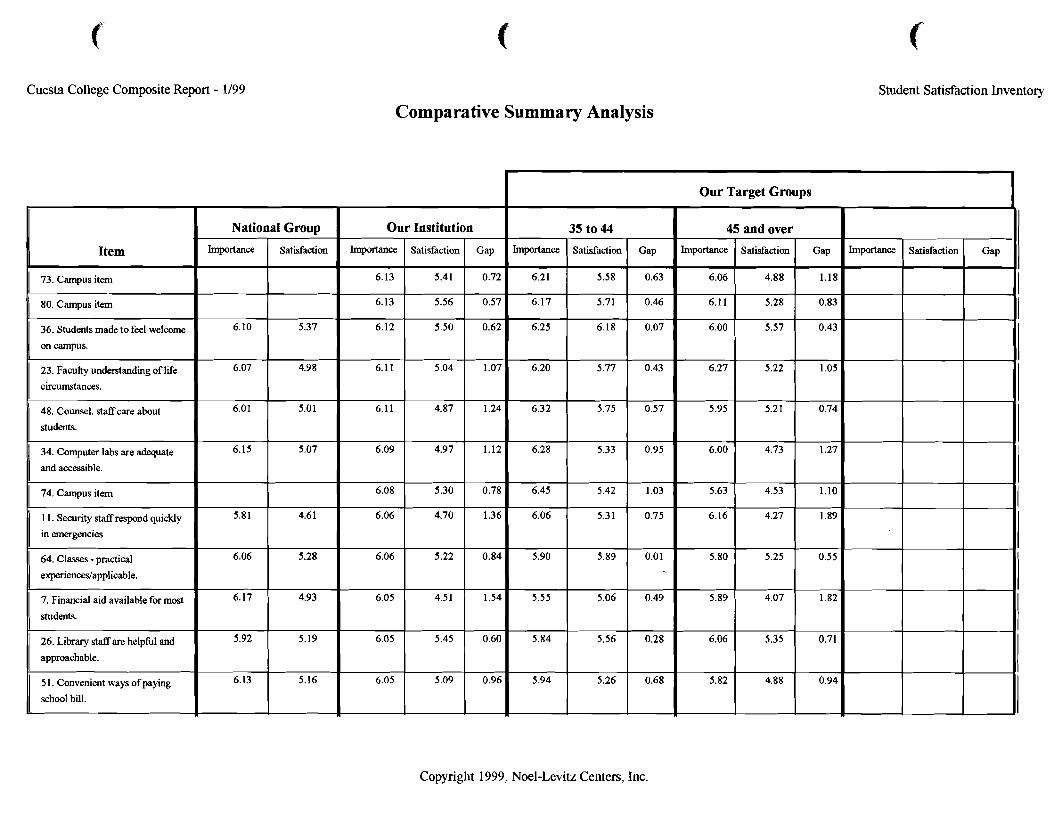
Cuesta College Composite Report - 1/99
Comparative Summary Analysis Student Satisfaction Inventory
Copyright 1999, Noel-Levitz Centers, Inc.
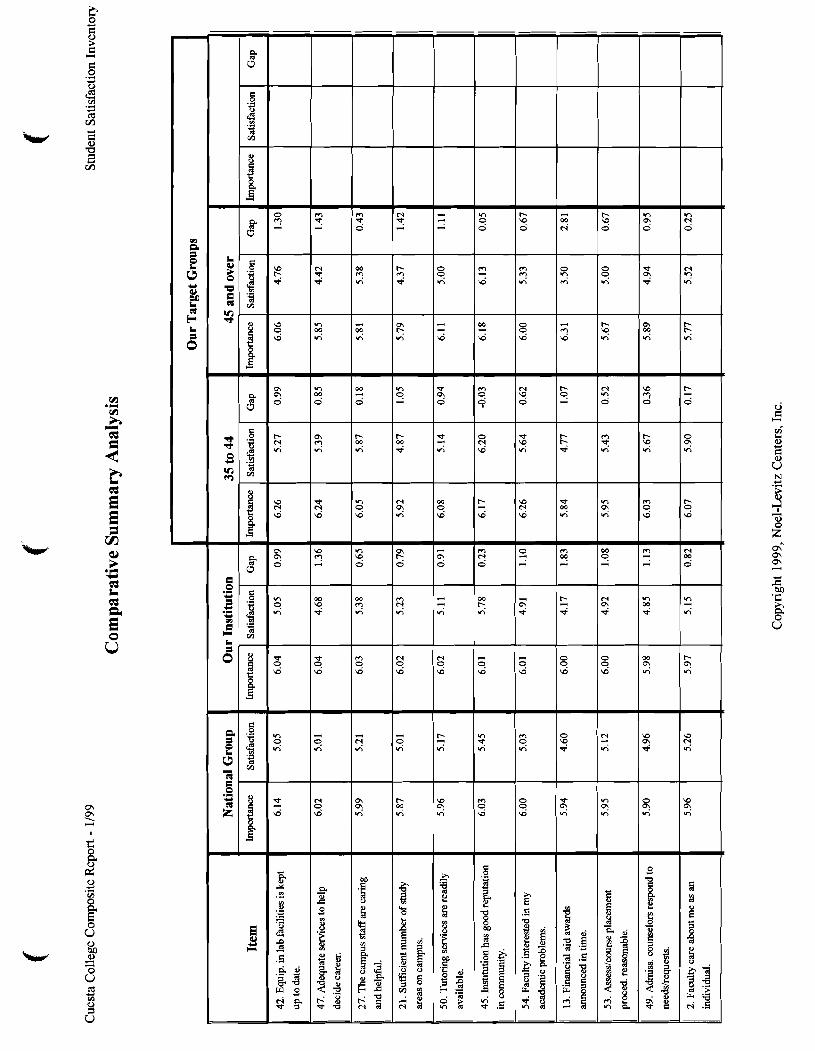
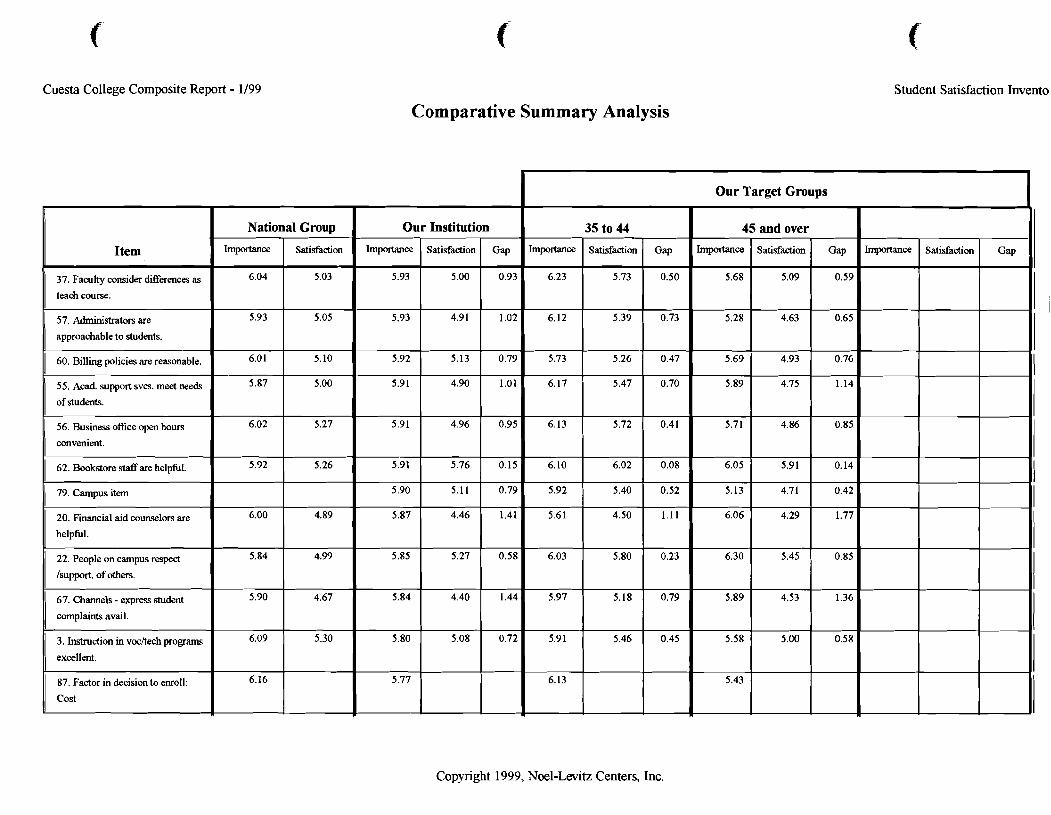
Cuesta College Composite Report - 1/99
Comparative Summary Analysis Student Satisfaction Invento
Copyright 1999, Noel-Levitz Centers, Inc.
Item
37. Faculty consider differences as
teach course.
57. Administrators are
approachable to students.
1 60. Billing policies are reasonable.
55. Acad. support svcs. meet needs
of students.
56. Business ofice open hours
convenient.
1 62. Bmkstore &are helpful.
/ 79. campus item
20. Financial aid counselors are
helpftl.
22. People on campus respect
/support. of others.
67. Channels - express student
complaints avail.
3. Instruction in vocttech programs
excellent.
87. Factor in decision to enroll:
Our Imptance
5.93
5.93
5.92
5.91
5.91
5.91
5.90
5.87
5.85
5.84
5.80
5.77
Importance
6.23
6.12
5.73
6.17
6.13
6.10
5.92
5.61
6.03
5.97
5.91
6.13
National
Importance
6.04
5.93
6.0 1
5.87
6.02
5.92
6.00
5.84
5.90
6.09
6.16
Institution
Satisfaction
5.00
4.9 1
5.13
4.90
4.96
5.76
5.11
4.46
5.27
4.40
5.08
Group
Satisfaction
5.03
5.05
5.10
5.00
5.27
5.26
4.89
4.99
4.67
5.30
35 to 44
Satisfaction
5.73
5.39
5.26
5.47
5.72
6.02
5.40
4.50
5.80
5.18
5.46
Our Target Groups
Gap
0.93
1.02
0.79
1.01
0.95
0.15
0.79
1.41
0.58
1.44
0.72
Gap
0.50
0.73
0.47
0.70
0.41
0.08
0.52
1.1 1
0.23
0.79
0.45
45
m c e
5.68
5.28
5.69
5.89
5.71
6.05
5.13
6.06
6.30
5.89
5.58
5.43
Gap
I
I
hportance
and over
Satisfaction
5.09
4.63
4.93
4.75
4.86
5.91
4.71
4.29
5.45
4.53
5.00
Satisfaction Gap
0.59
-
0.65
0.76
1.14
0.85
0.14
0.42
1.77
0.85
1.36
0.58
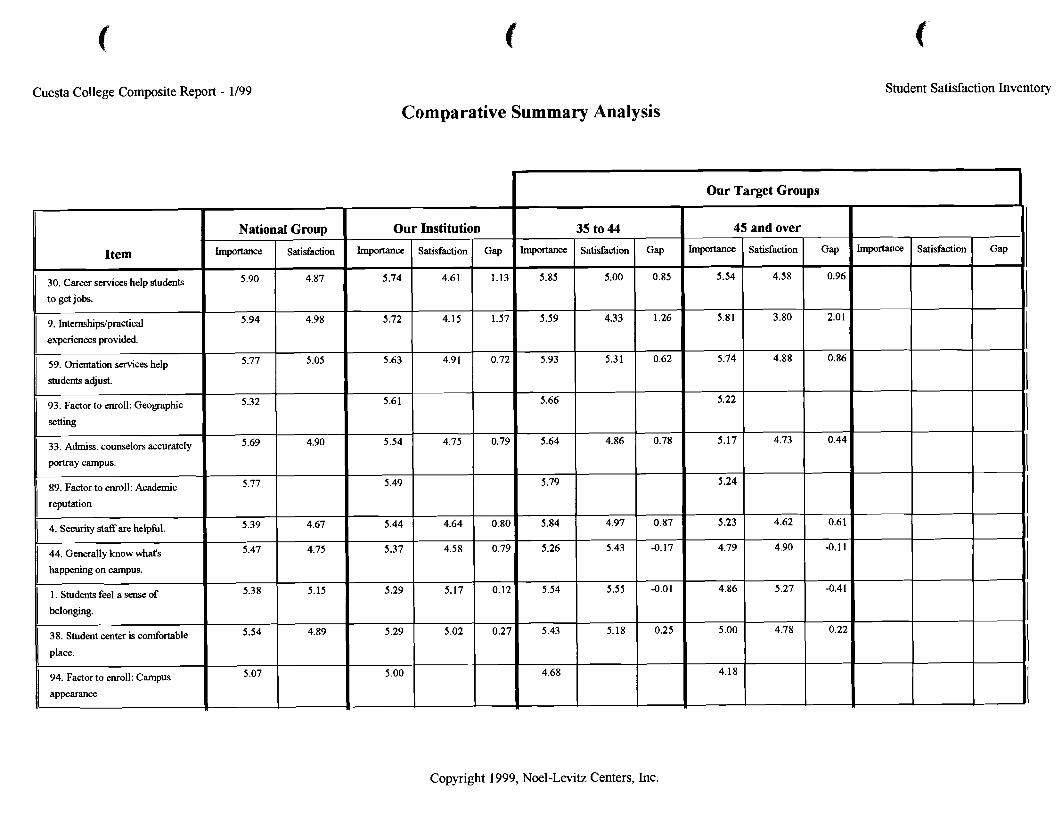
Cuesta College Composite Report - 1/99
Comparative Summary Analysis Student Satisfaction Inventory
Copyright 1999, Noel-Levitz Centers, Inc.
Item
30. Career services help students
to get jobs.
9. Intemshipdpractical
experiences provided.
59. Orientation services help
students adjust.
93. Factor to enroll: Geographic
setting
33. Admiss. counselors accurately
portray campus.
i 89. Factor to enroll: Academic
reputation
I 4. Security staff are helpful.
44. Generally know what's
happening on campus.
1. Students feel a sense of
belonging.
38. Student center is comfortable
place.
94. Factor to enroll: Campus
appearance
Gap
1.13
1.57
0.72
0.79
0.80
0.79
0.12
0.27
Our
Importance
5.74
5.72
5.63
5.61
5.54
5.49
5.44
5.37
5.29
5.29
5.00
National
Importance
5.90
5.94
5.77
5.32
5.69
5.77
5.39
5.47
5.38
5.54
5.07
Gap
I
Our Target Groups
Importance
-
Gap
0.85
1.26
0.62
0.78
0.87
-0.17
-0.01
0.25
I m m c e
5.85
5.59
5.93
5.66
5.64
5.79
5.84
5.26
5.54
5.43
4.68
Institution
Satisfaction
4.61
4.15
4.91
4.75
4.64
4.58
5.17
5.02
Group
Satisfaction
4.87
4.98
5.05
4.90
4.67
4.75
5.15
4.89
Satisfaction
35 to 44
Satisfaction
5.00
4.33
5.31
4.86
4.97
5.43
5.55
5.18
Gap
0.96
2.01
0.86
0.44
0.6 1
-0.11
-0.41
0.22
45 ImpOrtance
5.54
5.81
5.74
5.22
5.17
5.24
5.23
4.79
4.86
5.00
4.18
and over
Satisfaction
4.58
3.80
4.88
4.73
4.62
4.90
5.27
4.78
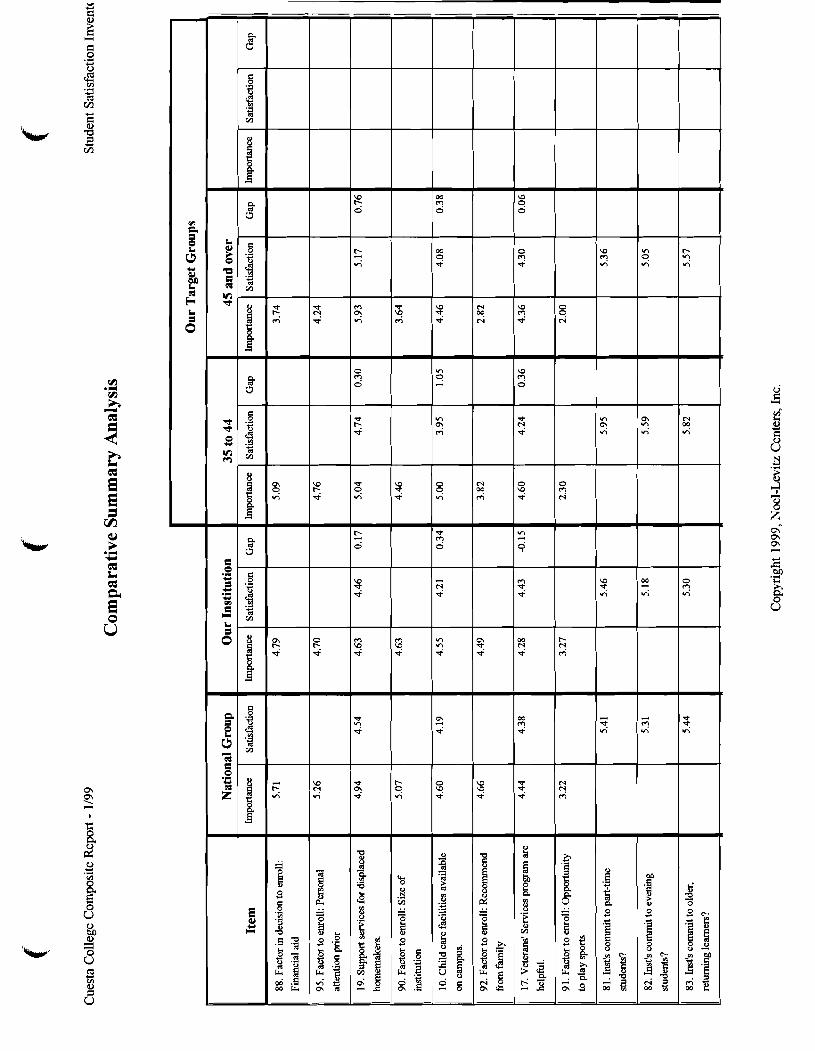
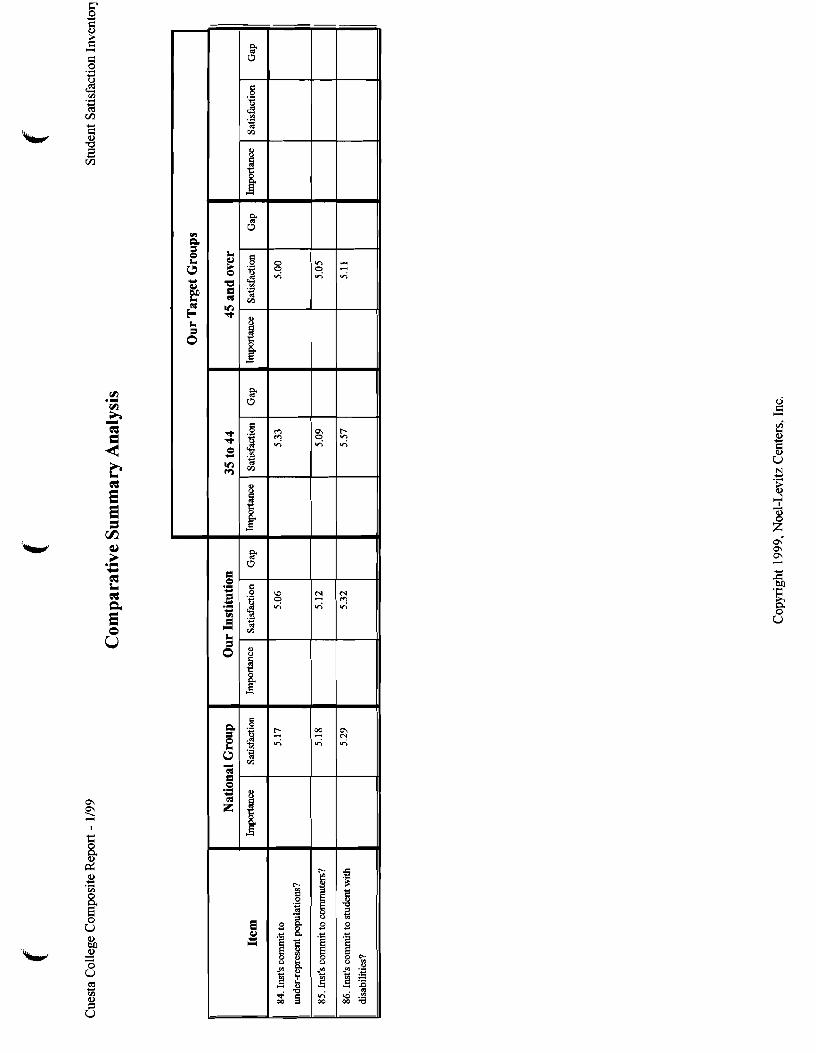

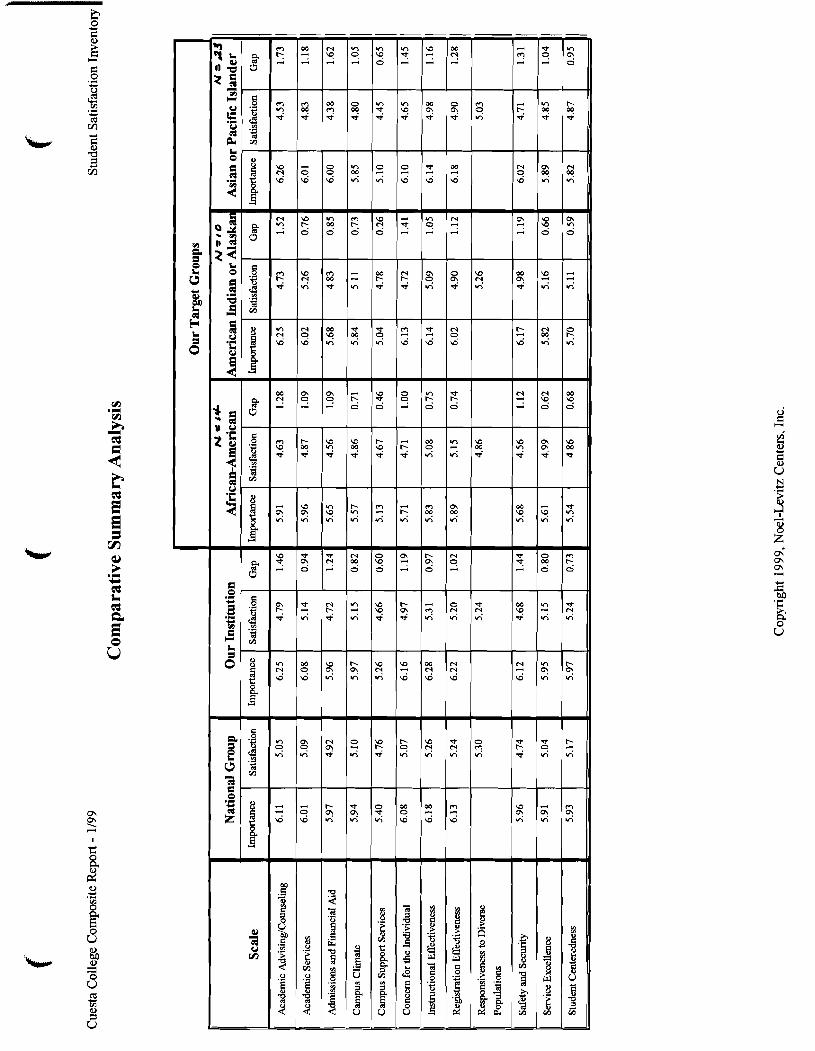
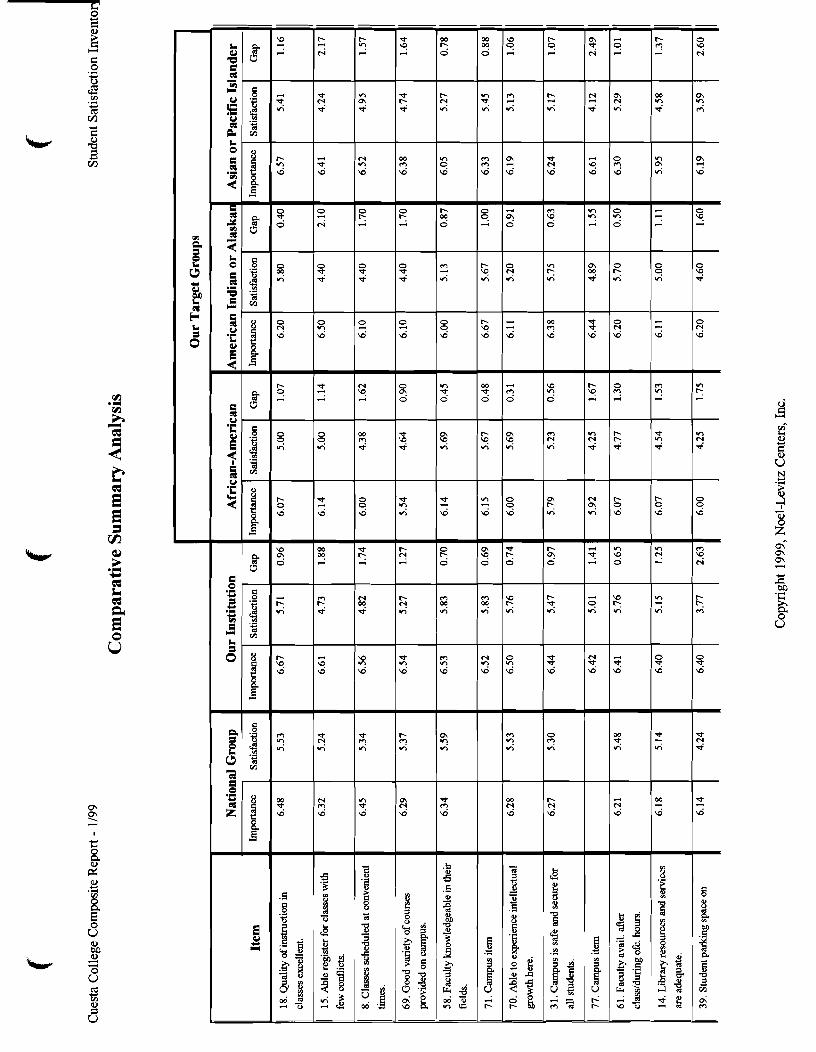
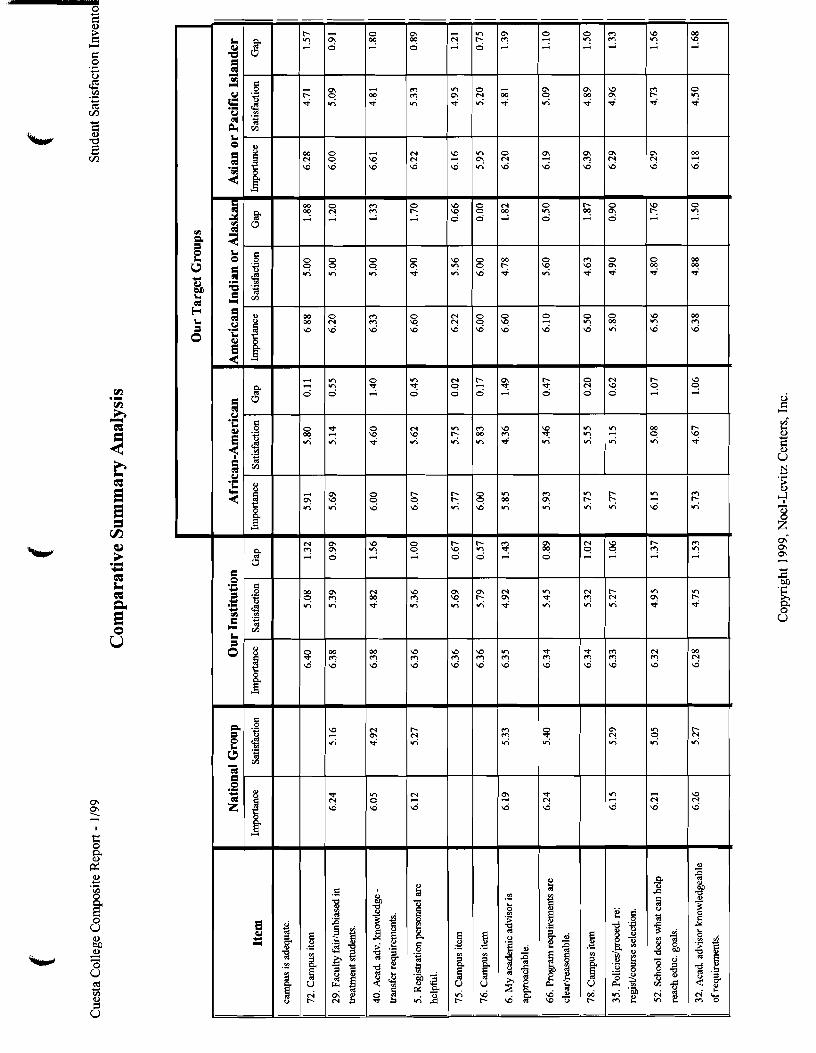
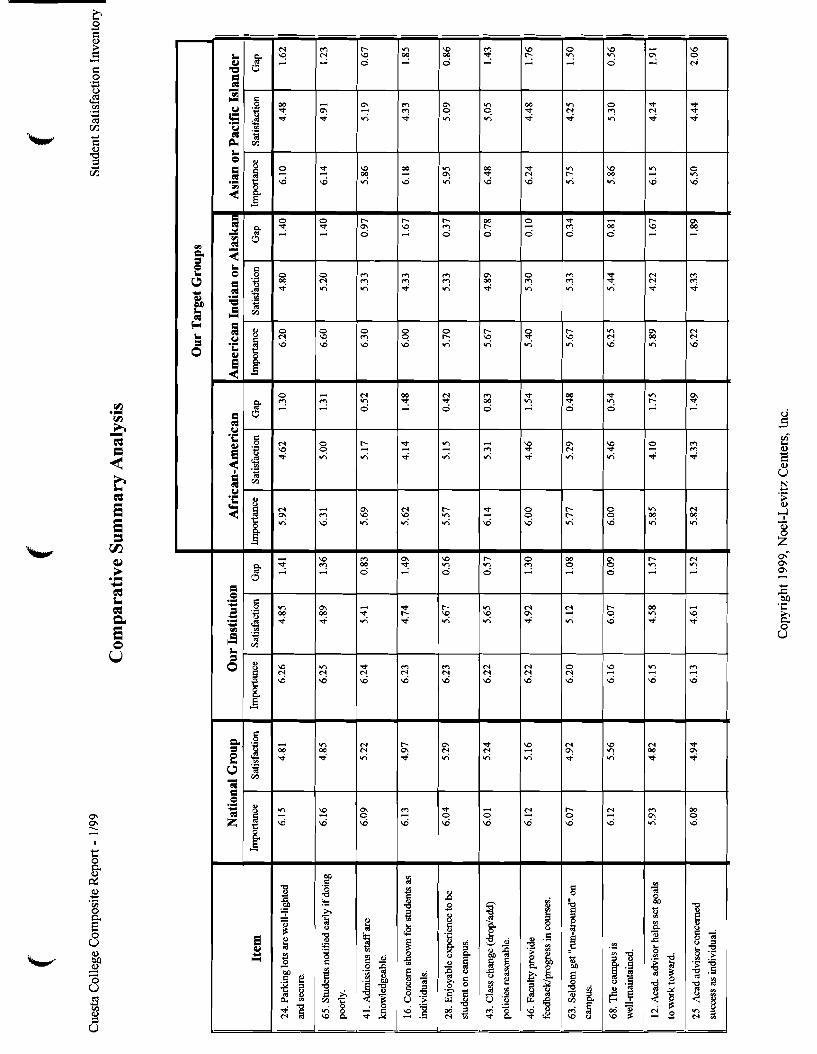
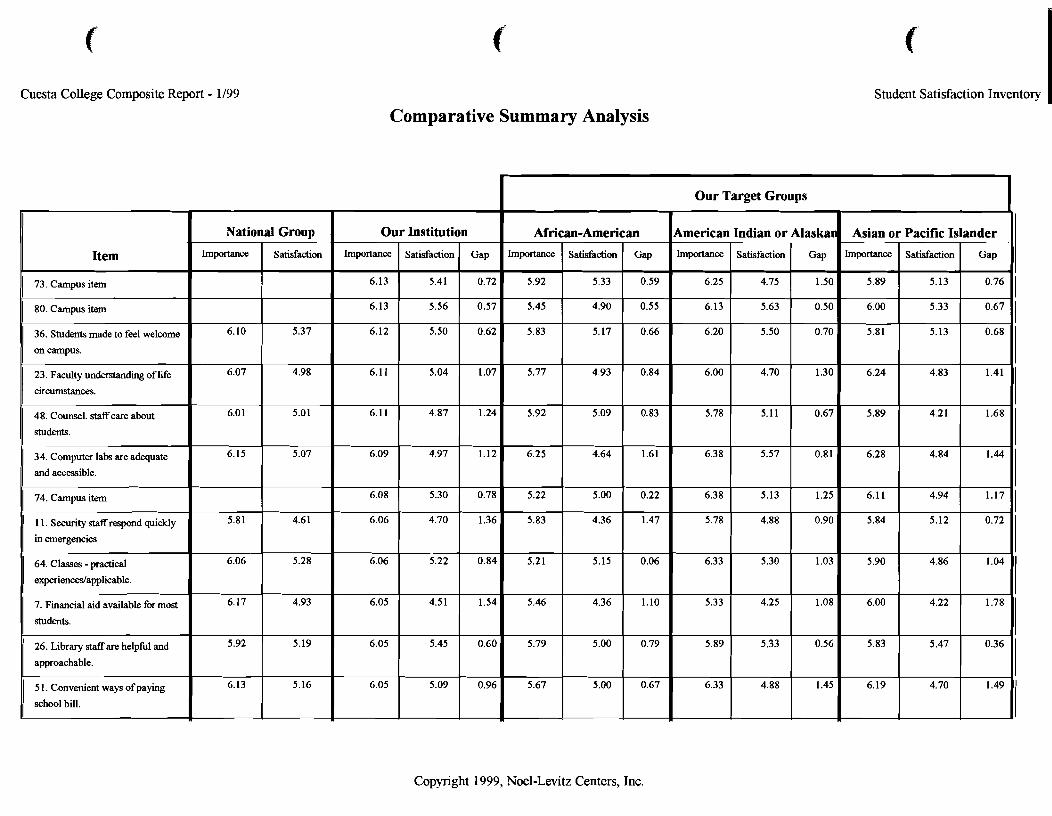
Cuesta College Composite Report - 1/99
Comparative Summary Analysis
C Student Satisfaction Inventory
Copyright 1999, Noel-Levitz Centers, Inc.
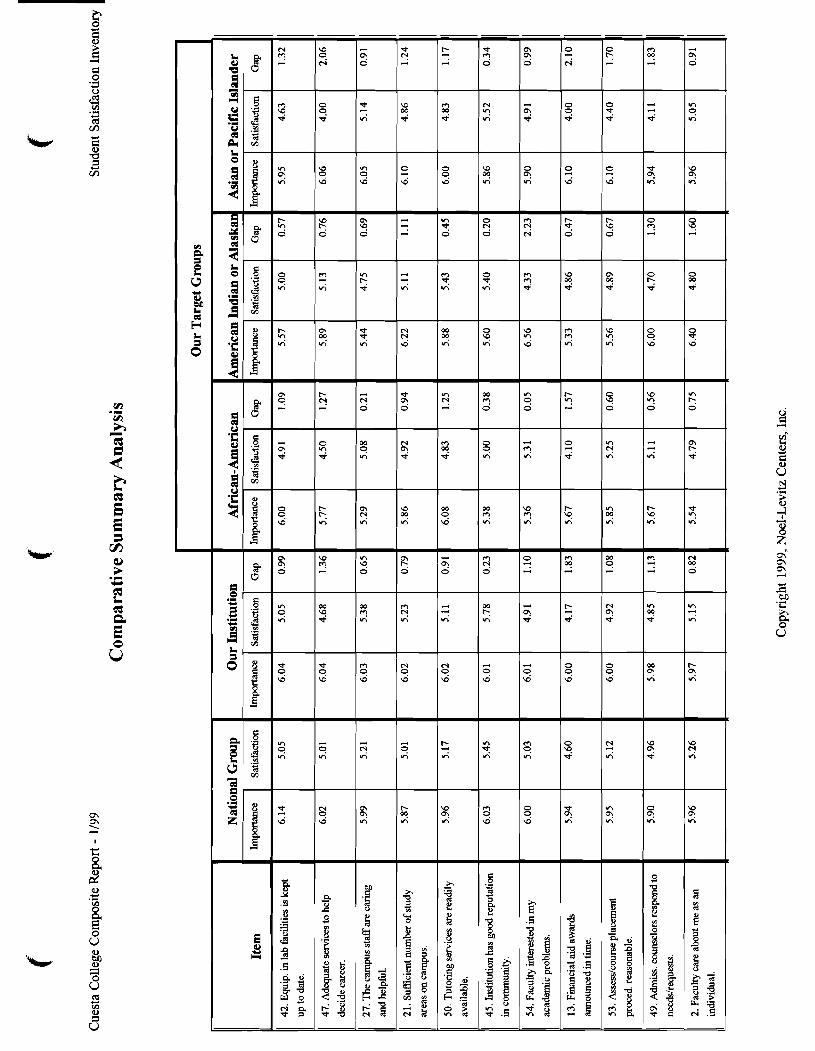
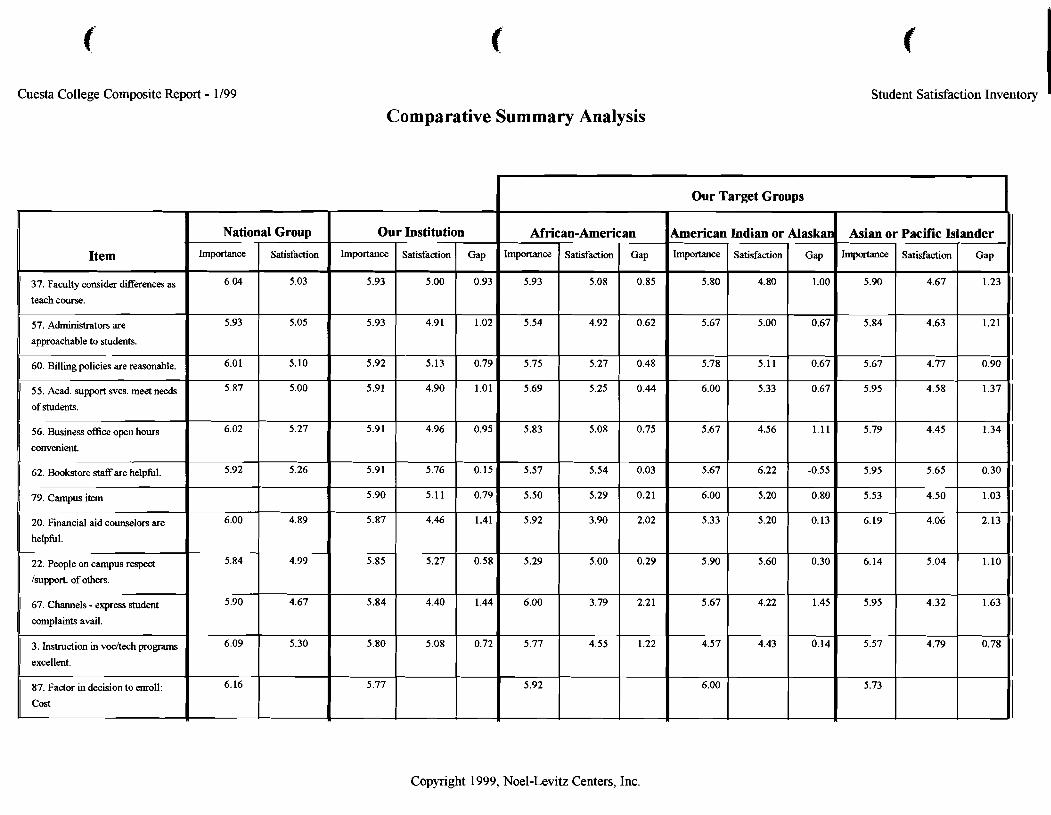
Cuesta College Composite Report - 1/99
Comparative Summary Analysis
i= Student Satisfaction Inventory
I Our Target Groups I
Copyright 1999, Noel-Levitz Centers, Inc.
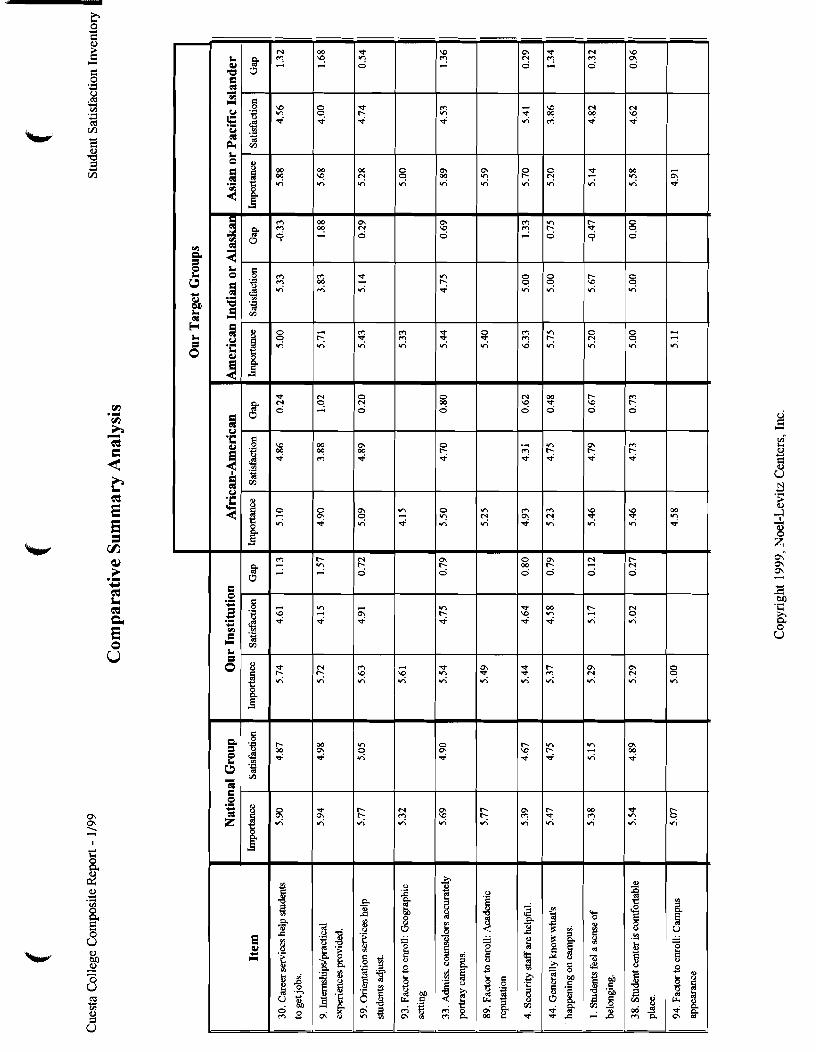
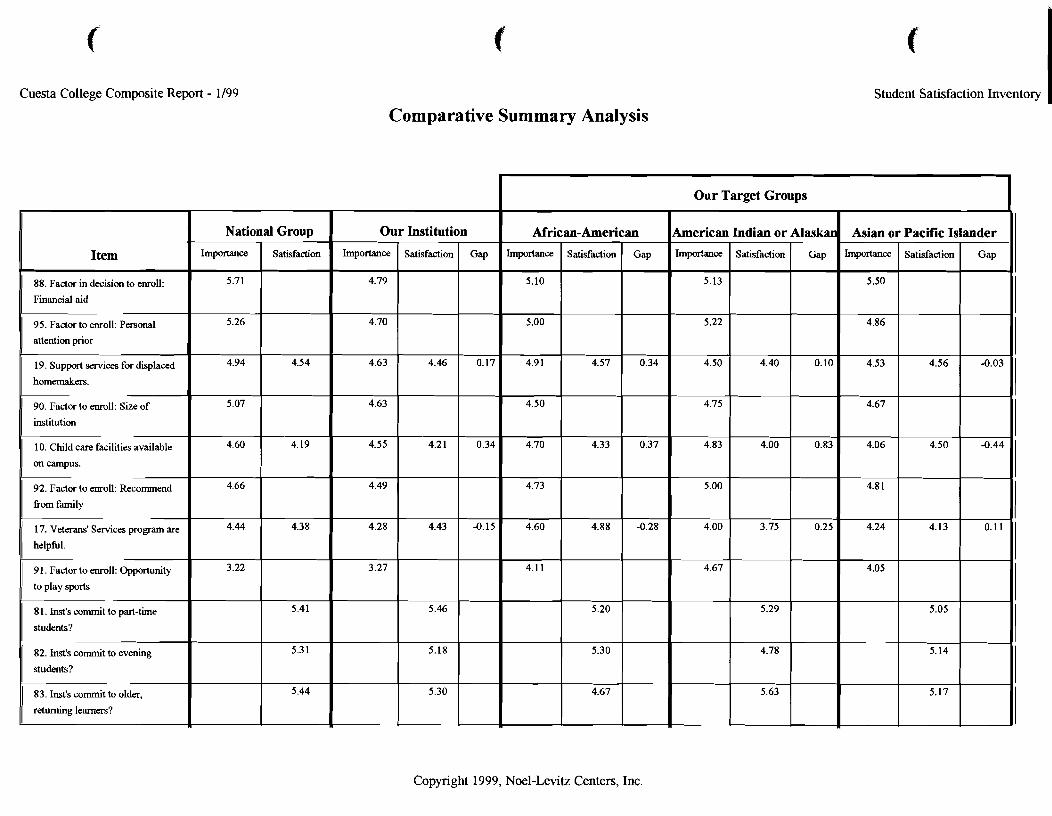
f Student Satisfaction Inventory Cuesta College Composite Report - 1/99
Comparative Summary Analysis
I Our Target Groups I National Group
L
lander
Gap
'
,
American Indian or
GzLqZiz
I
I
Alaska
I
Asian o - Pacific 11 Satisfaction Importance 1 satisfad: Importance Item
88. Factor in decision to enroll:
Financial aid -
95. Factor to enroll: Personal
attention prior
19. Support services for displaced
homemakers.
90. Factor to enroll: Size of
institution
10. Child care facilities available
on campus.
92. Factor to enroll: Recommend
fiom family -
17. Veterans' Services program are
helpful.
91. Factor to enroll: Oppo&ty
to play sports -
8 1. Inst's commit to part-time
students?
82. Inst's commit to evening
students?
83. Inst's commit to older,
returning learners?
Copyright 1999, Noel-Levitz Centers, Inc.
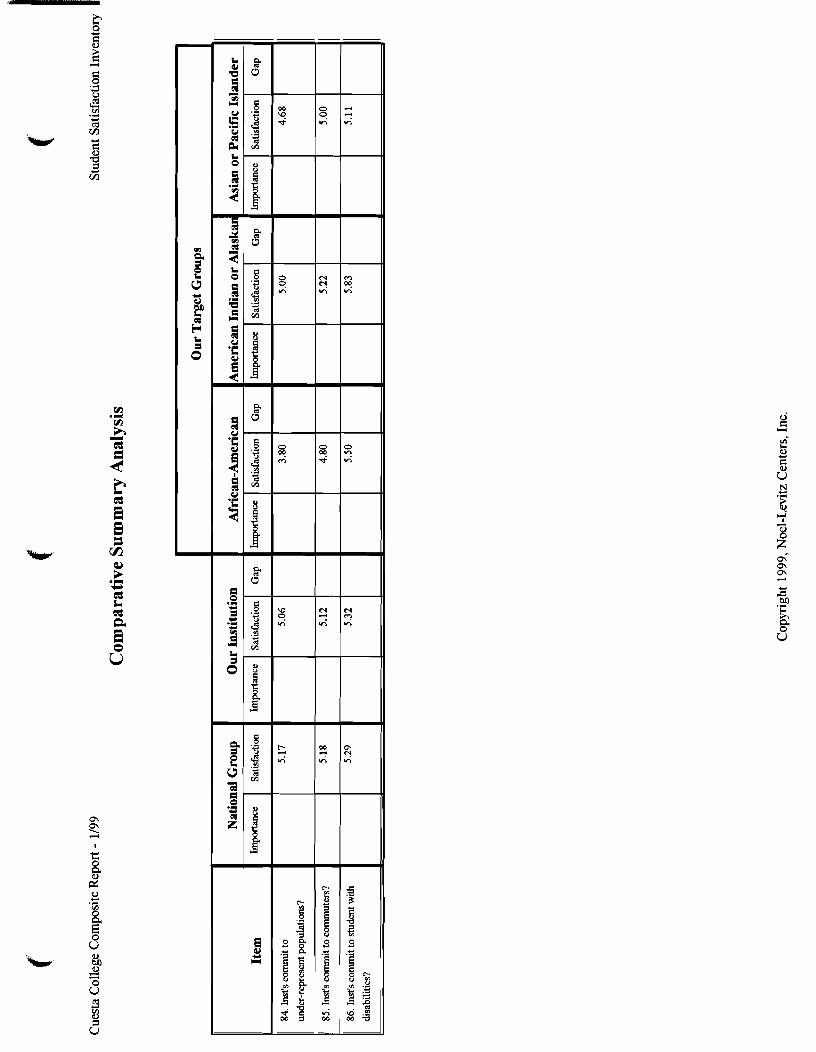

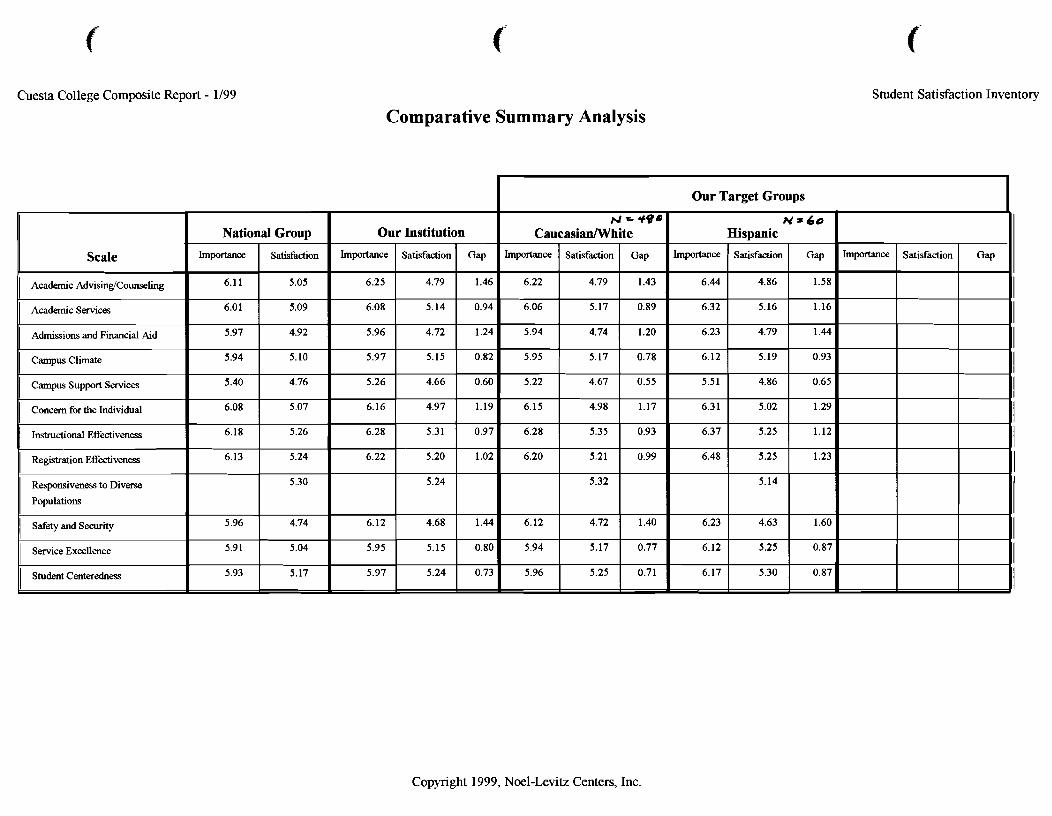
Cuesta College Composite Report - 1/99 Student Satisfaction Inventory
Comparative Summary Analysis
I Our Target Groups I
Copyright 1999, Noel-Levitz Centers, Inc.
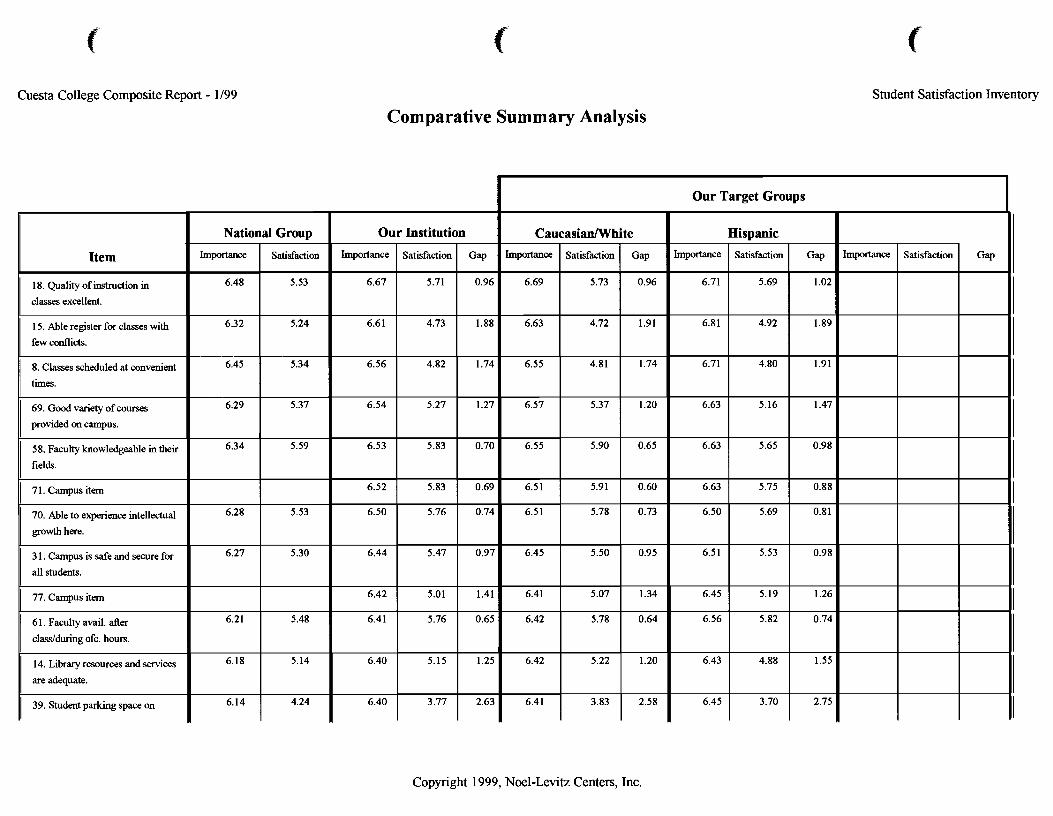
Cuesta College Composite Report - 1/99 Student Satisfaction Inventory
Comparative Summary Analysis
Copyright 1999, Noel-Levitz Centers, Inc.
Item
18. Quality of instruction in
classes excellent.
15. Able register for classes with
few conflicts.
8. Classes scheduled at convenient
times.
69. Good variety of courses
provided on campus.
58. Faculty knowledgeable in their
fields.
I 71.~ampusitem
70. Able to experience intellectual
growth here.
3 1. Campus is safe and secure for
all students.
I 77. ~ u n p l s i t a n
6 1. Faculty avail. after
cldduring ofc. hours.
14. Library resources and services
are adequate.
( 39. Student parking space on
Gap
0.96
1.91
1.74
1.20
0.65
0.60
0.73
0.95
1.34
0.64
1.20
National
Imptmce
6.48
6.32
6.45
6.29
6.34
6.28
6.27
6.21
6.18
6.14
I
Imptmce
6.69
6.63
6.55
6.57
6.55
6.51
6.51
6.45
6.41
6.42
6.42
Our Target Groups
Group
Satisfaction
5.53
5.24
5.34
5.37
5.59
5.53
5.30
5.48
5.14
1 4.24
Our
Importance
6.67
6.6 1
6.56
6.54
6.53
6.52
6.50
6.44
6.42
6.41
6.40
CaucasianIWhite
Satisfaction
5.73
4.72
4.81
5.37
5.90
5.91
5.78
5.50
5.07
5.78
5.22
I
Importance
6.71
6.81
6.71
6.63
6.63
6.63
6.50
6.5 1
6.45
6.56
6.43
Gap
I
Importance
Institution
Satisfaction
5.71
4.73
4.82
5.27
5.83
5.83
5.76
5.47
5.01
5.76
5.15
I 6.41
Hispanic
Satisfaction
5.69
4.92
4.80
5.16
5.65
5.75
5.69
5.53
5.19
5.82
4.88
3.70
I
Satisfaction Gap
0.96
1.88
1.74
1.27
0.70
0.69
0.74
0.97
1.41
0.65
1.25
1 3.77
Gap
1.02
1.89
1.91
1.47
0.98
0.88
0.81
0.98
1.26
0.74
1.55
I I I 2.63
I 6.45
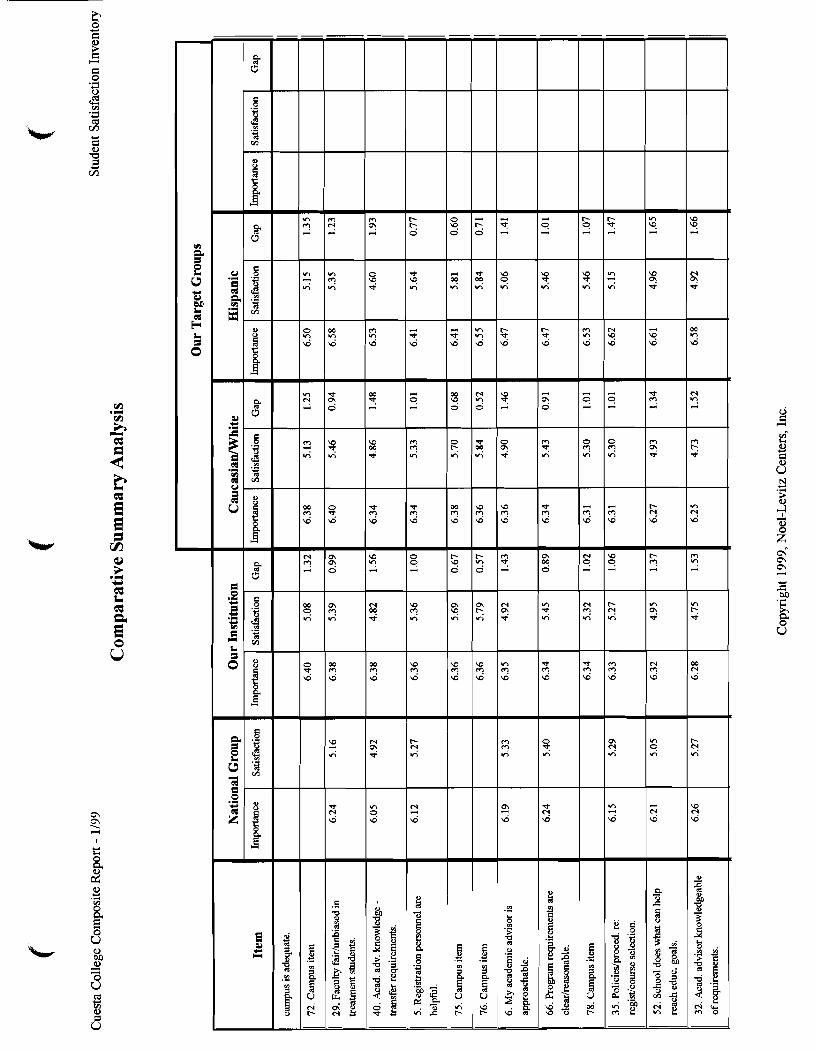
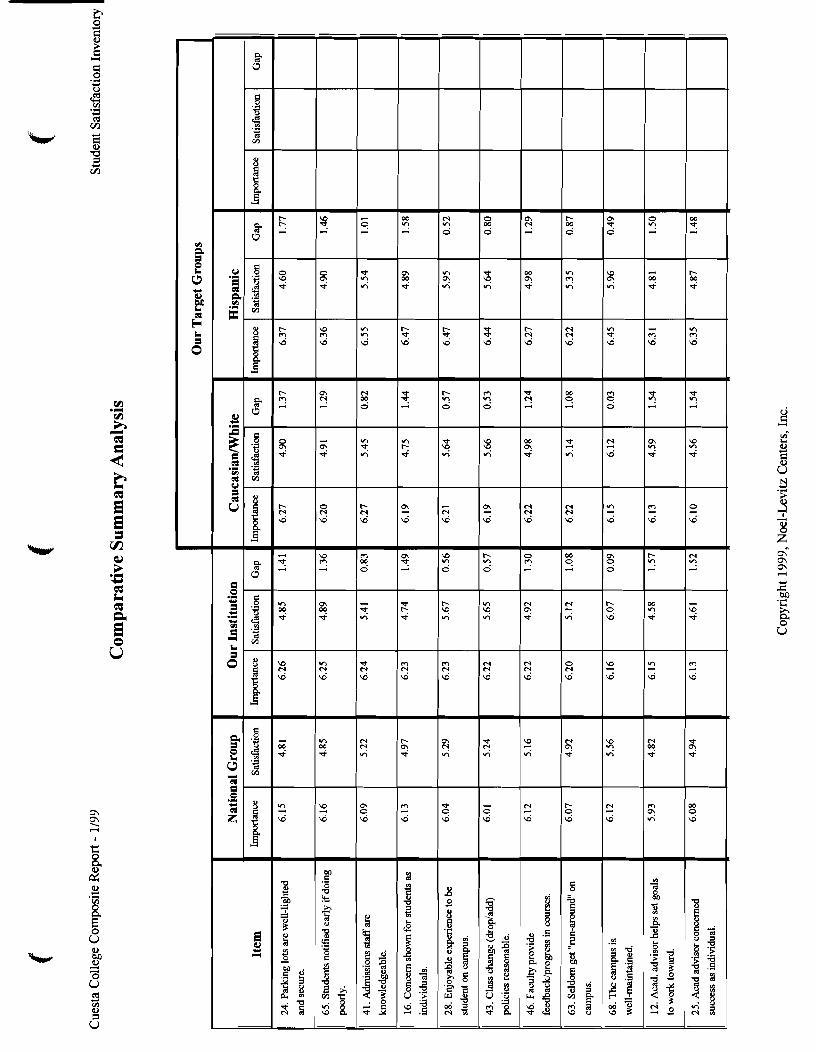
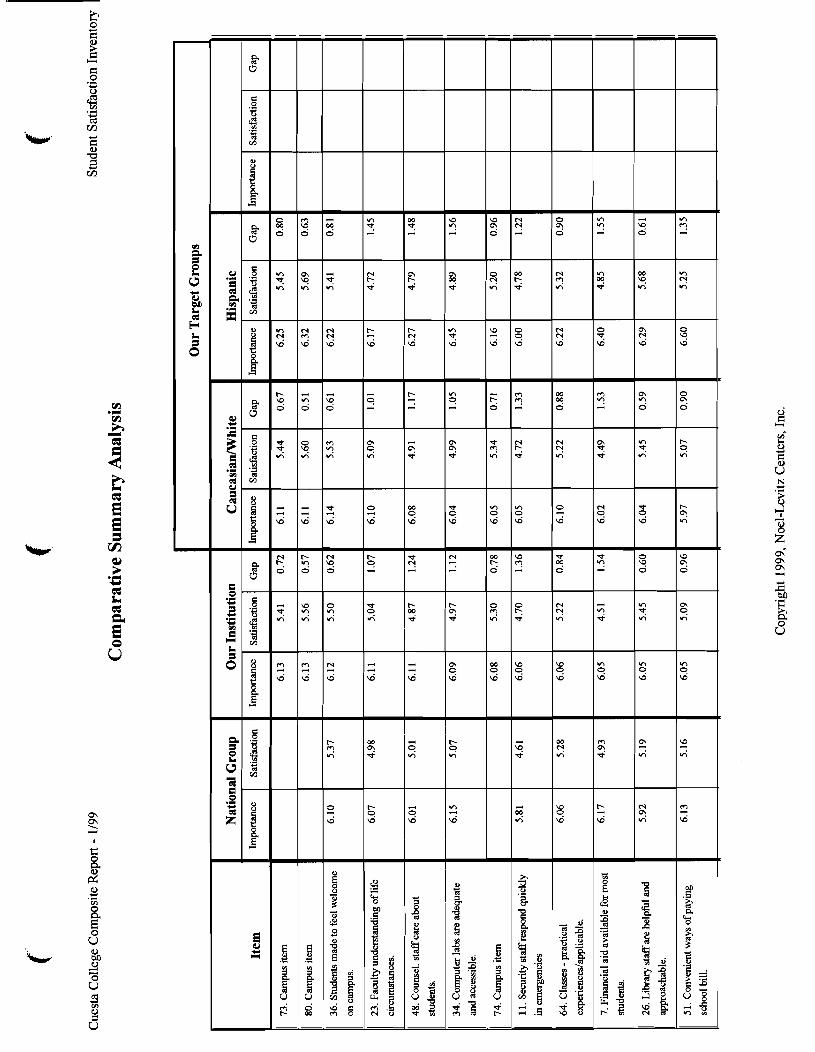
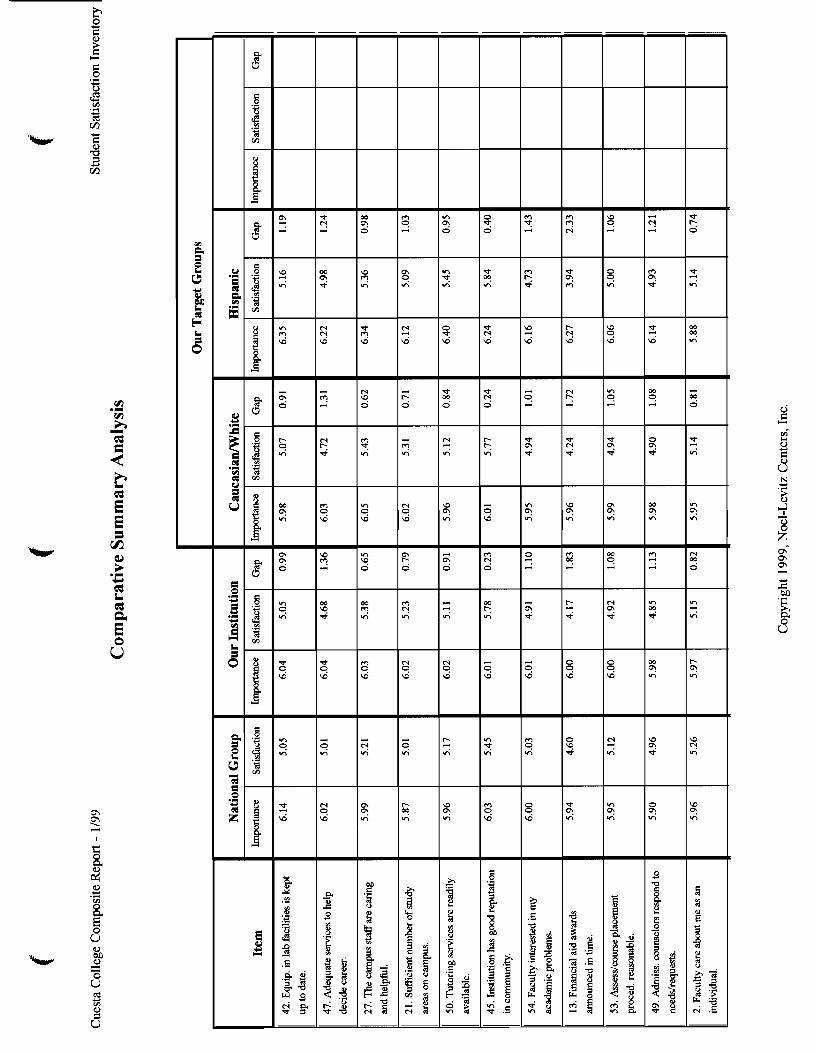
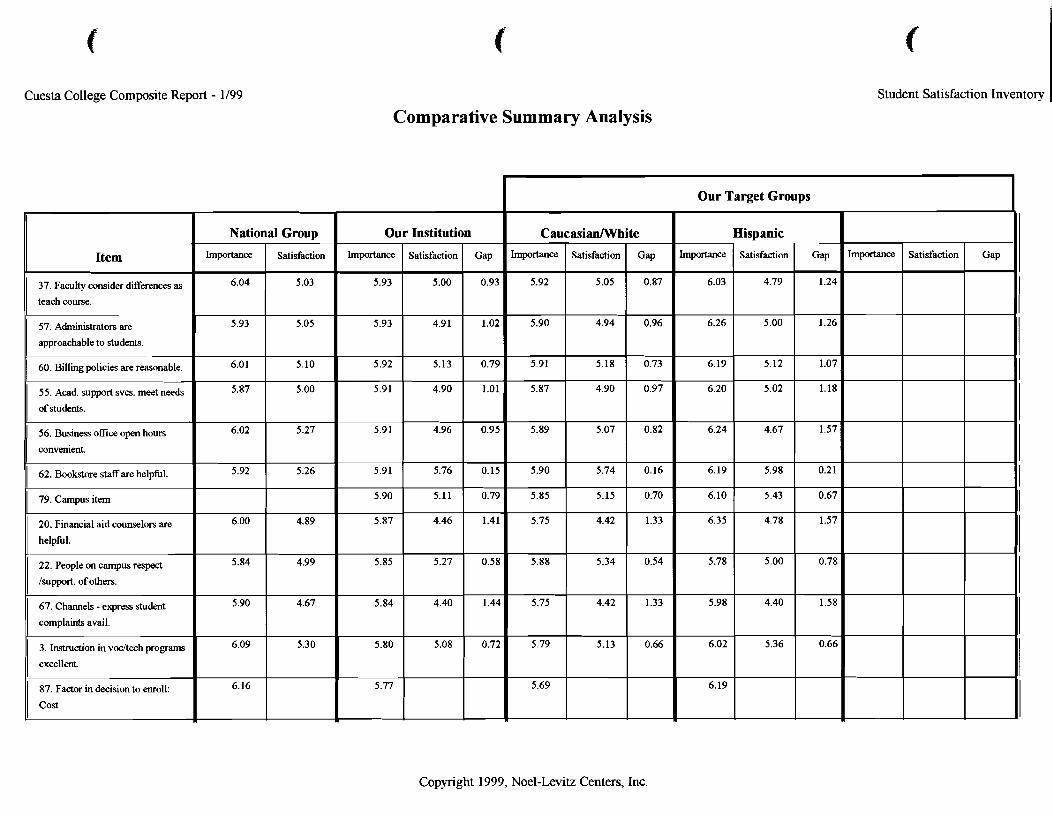
Cuesta College Composite Report - 1/99 Student Satisfaction Inventory I Comparative Summary Analysis
I Our Target Groups
Copyright 1999, Noel-Levitz Centers, Inc.
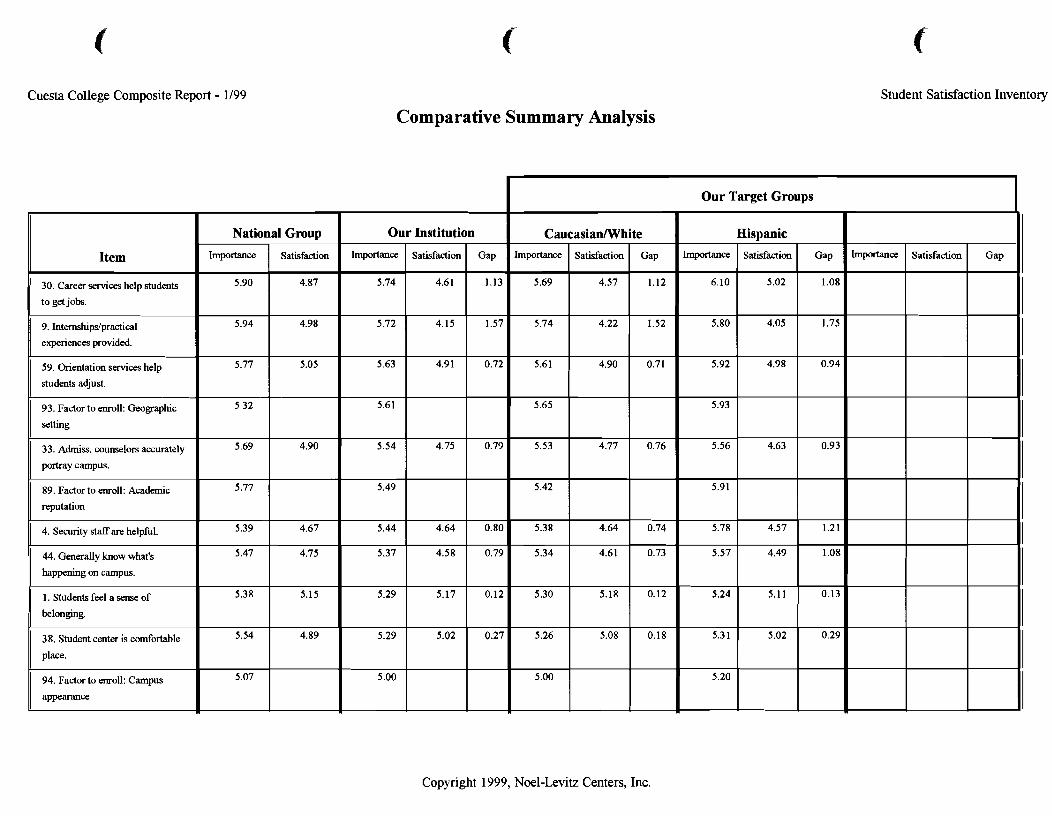
Cuesta College Composite Report - 1/99 Student Satisfaction Inventory
Comparative Summary Analysis
Our Target Groups
Copyright 1999, Noel-Levitz Centers, Inc.
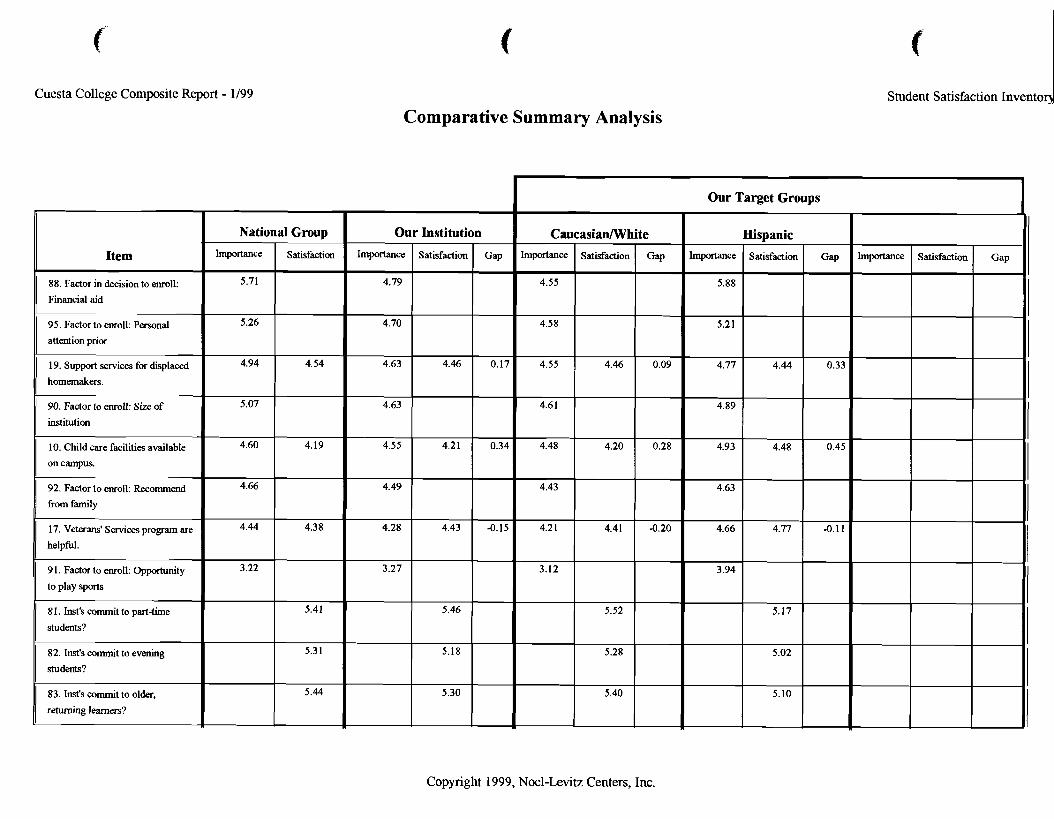
Cuesta College Composite Report - 1/99 Student Satisfaction Invento I Comparative Summary Analysis
Copyright 1999, Noel-Levitz Centers, Inc.
Item
88. Factor in decision to enroll:
Financial aid
95. Factor to enroll: Personal
attention prior
19. Support services for displaced
homemakers.
90. Factor to enroll: Size of
institution
10. Child care facilities available
on campus.
92. Factor to enroll: Recommend
&om family
17. Veterans' Senices program are
helpful.
9 1. Factor to enroll: Opportunity
to play sports
8 1. Inst's commit to part-time
students?
82. Inst's commit to evening
students?
83. Inst's commit to older,
returning learners?
hportance
4.55
4.58
4.55
4.61
4.48
4.43
4.21
3.12
National hportance
5.71
5.26
4.94
5.07
4.60
4.66
4.44
3.22
Group
Satisfaction
4.54
4.19
4.38
5.41
5.3 1
5.44
Our
Importance
4.79
4.70
4.63
4.63
4.55
4.49
4.28
3.27
Caucasiawhite
Satisfaction
4.46
4.20
4.41
5.52
5.28
5.40
Our Target Groups
Gap
0.09
0.28
-0.20
hpofhce
5.88
5.2 1
4.77
4.89
4.93
4.63
4.66
3.94
hpf tance
Institution
Satisfaction
4.46
4.21
4.43
5.46
5.18
5.30
Gap
0.17
0.34
-0.15
Hispanic
Satisfaction
4.44
4.48
4.77
5.17
5.02
5.10
Satisfaction Gap
0.33
0.45
-0.11
Gap
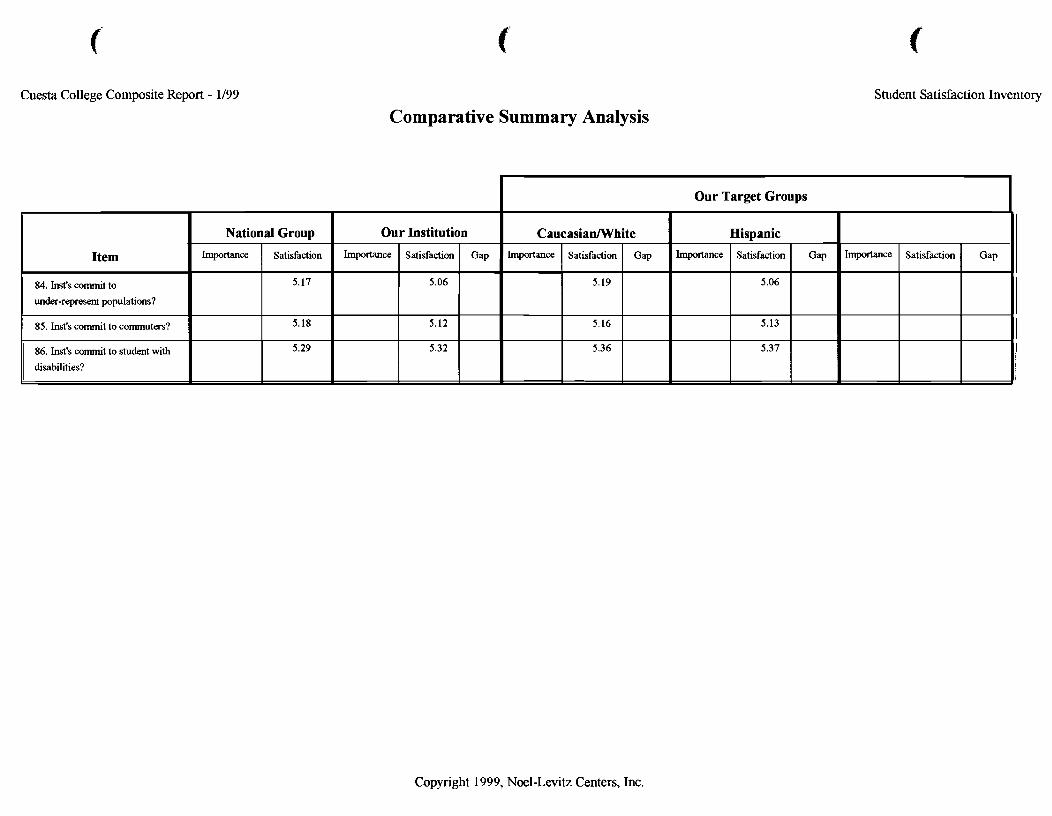
Cuesta College Composite Report - 1/99 Student Satisfaction Inventory
Comparative Summary Analysis
I Our Target Groups I
Copyright 1999, Noel-Levitz Centers, Inc.

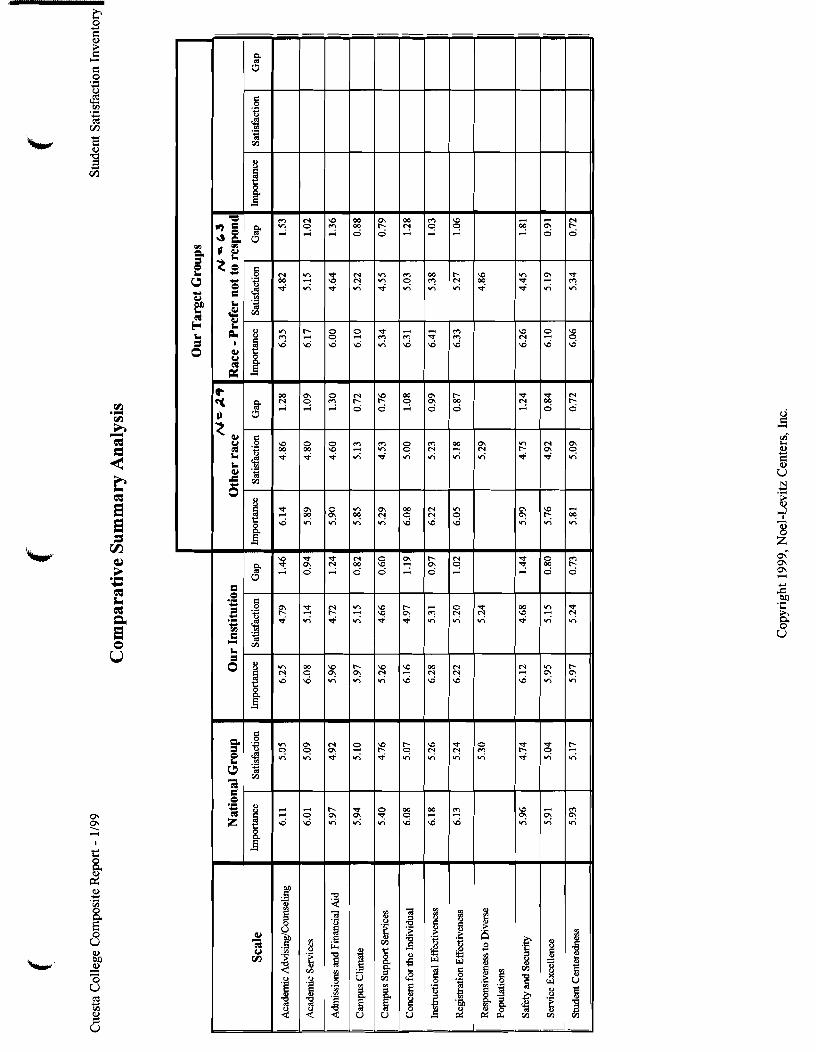
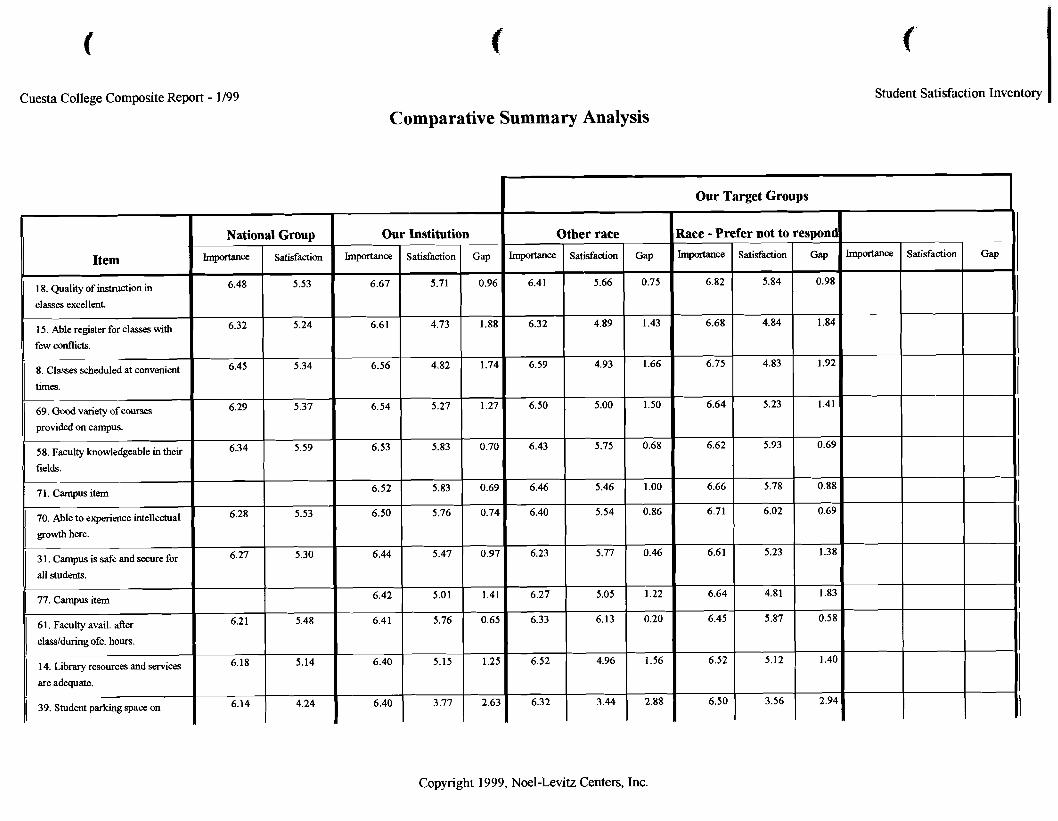
Cuesta College Composite Report - 1/99
f Student Satisfaction Inventory
Comparative Summary Analysis
Copyright 1999, Noel-Levitz Centers, Inc.
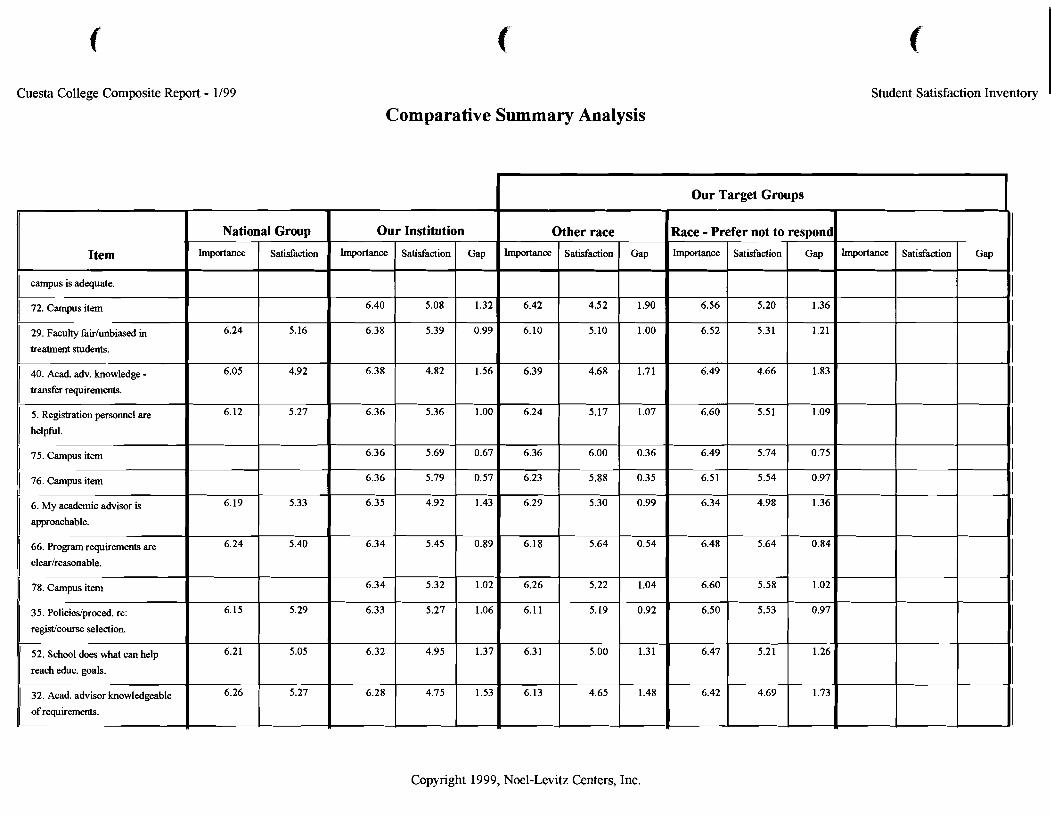
Cuesta College Composite Report - 1/99 Student Satisfaction Inventory I
Comparative Summary Analysis
I Our Target Groups I
Copyright 1999, Noel-Levitz Centers, Inc.
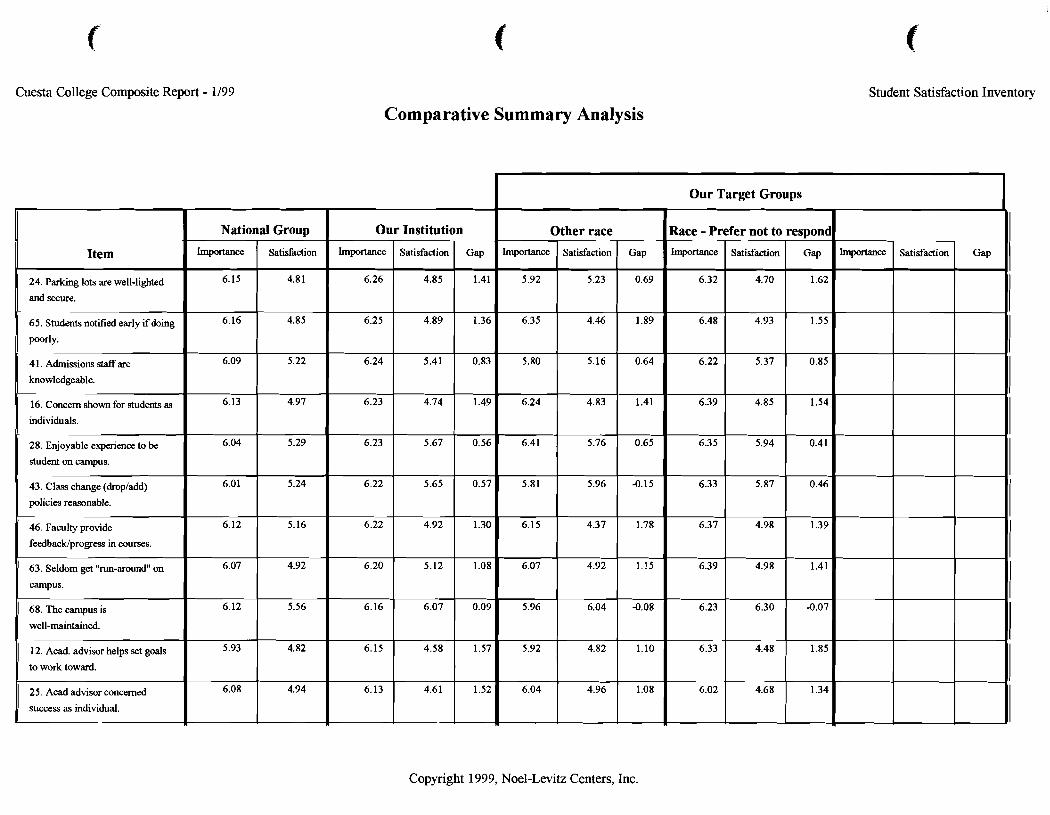
Cuesta College Composite Report - 1/99 Student Satisfaction Inventory
Comparative Summary Analysis
Our Target Groups
Copyright 1999, Noel-Levitz Centers, Inc.
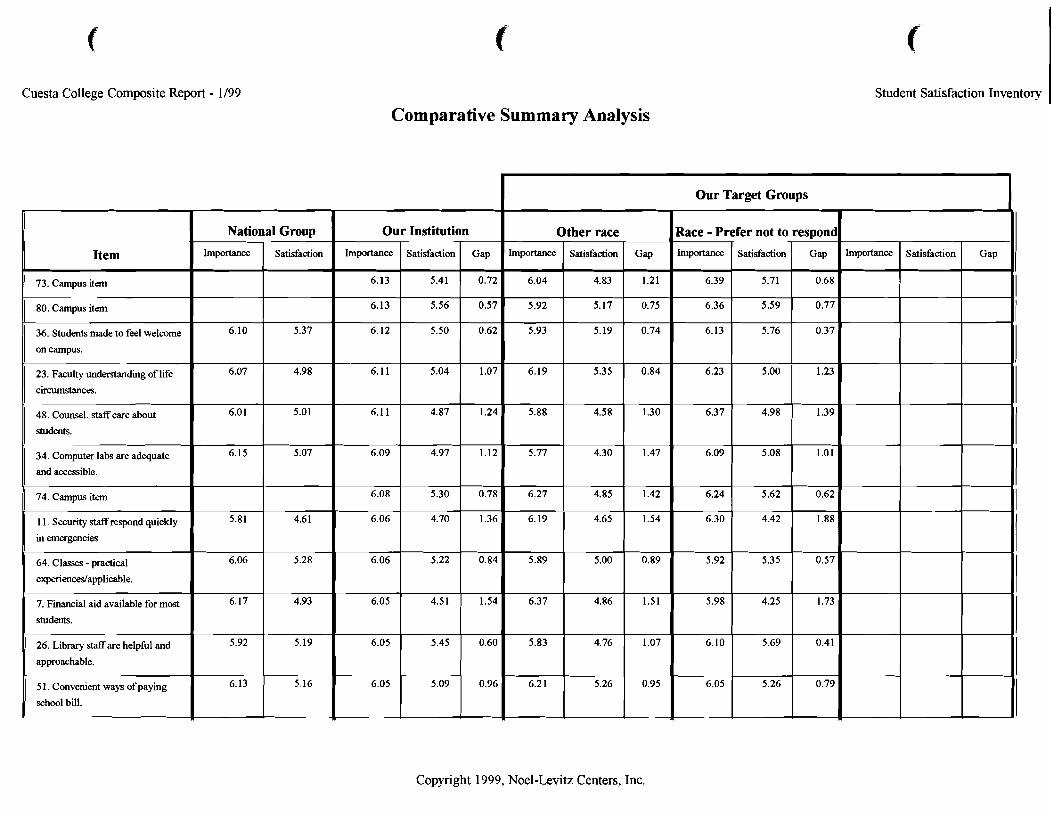
Cuesta College Composite Report - 1/99 Student Satisfaction Inventory
Comparative Summary Analysis
I Our Target Groups I
Copyright 1999, Noel-Levitz Centers, Inc.
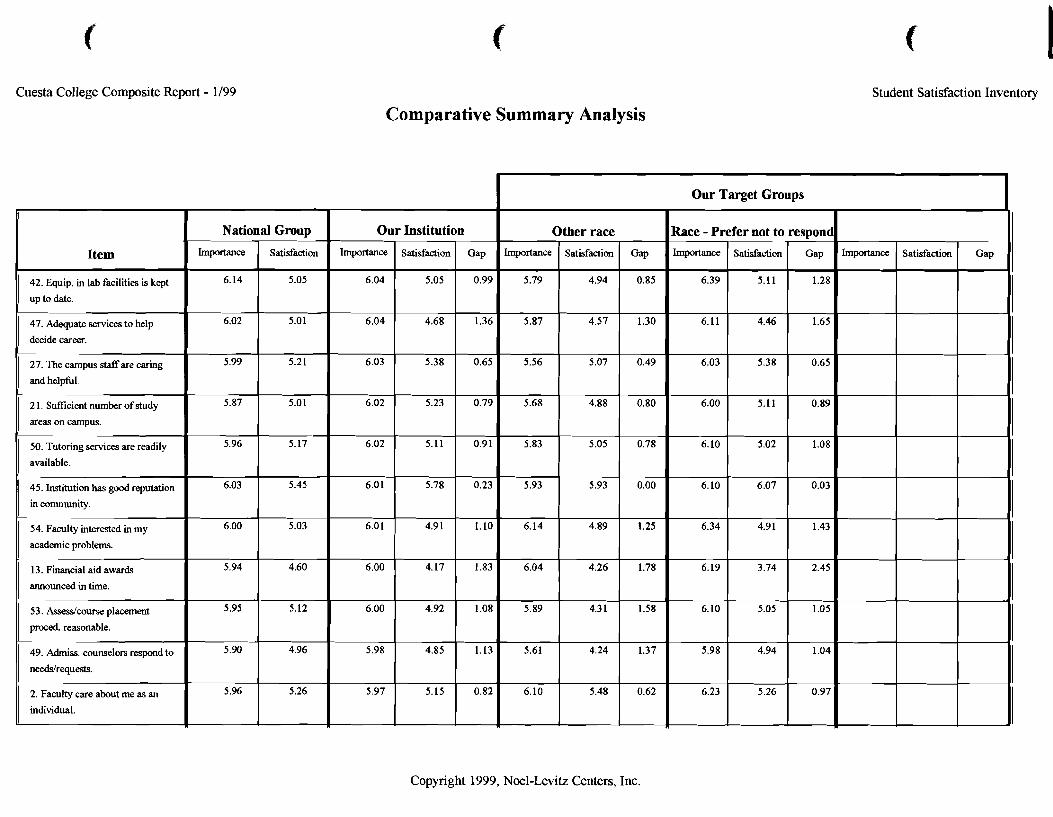
Cuesta College Composite Report - 1/99 Student Satisfaction Inventory
Comparative Summary Analysis
Copyright 1999, Noel-Levitz Centers, Inc.
Item
42. Equip. in lab facilities is kept
up to date.
47. Adequate services to help
decide career.
27. The campus &are caring
and helpful.
2 1. Sufficient number of study
areas on campus. 1- 50. Tutoring services are readily
available.
45. Institution has good reputation
in community.
54. Faculty interested in my
academic problems.
13. Financial aid awards
announced in time.
53. Assesdcourse placement
proced. reasonable.
49. Admiss. counselors respond to
needdrequests.
2. Faculty care about me as an
individual.
Importance
5.79
5.87
5.56
5.68
5.83
5.93
6.14
6.04
5.89
5.61
6.10
National
Importance
6.14
6.02
5.99
5.87
5.96
6.03
6.00
5.94
5.95
5.90
5.96
Group
Satisfaction
5.05
5.01
5.21
5.01
5.17
5.45
5.03
4.60
5.12
4.96
5.26
Our
Importance
6.04
6.04
6.03
6.02
6.02
6.01
6.01
6.00
6.00
5.98
5.97
Our Target Groups
Other race
Satisfaction
4.94
4.57
5.07
4.88
5.05
5.93
4.89
4.26
4.3 1
4.24
5.48
Race - Importance
6.39
6.11
6.03
6.00
6.10
6.10
6.34
6.19
6.10
5.98
6.23
Importance Gap
0.85
1.30
0.49
0.80
0.78
0.00
1.25
1.78
1.58
1.37
0.62
Institution
Satisfaction
5.05
4.68
5.38
5.23
5.11
5.78
4.9 1
4.17
4.92
4.85
5.15
Gap
0.99
1.36
0.65
0.79
0.91
0.23
1.10
1.83
1.08
1.13
0.82
Prefer not to
Satisfaction
5.1 1
4.46
5.38
5.11
5.02
6.07
4.9 1
3.74
5.05
4.94
5.26
Satisfaction
respond
Gap
1.28
1.65
0.65
0.89
1.08
0.03
1.43
2.45
1.05
1.04
0.97
Gap
I
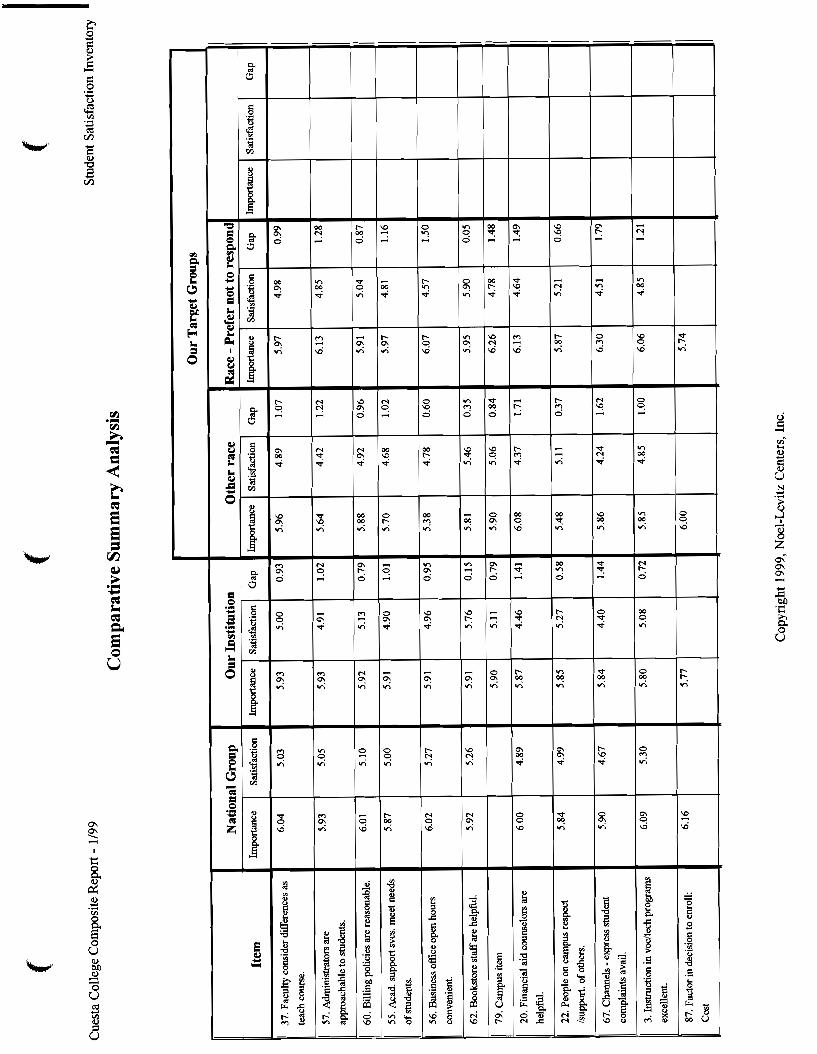
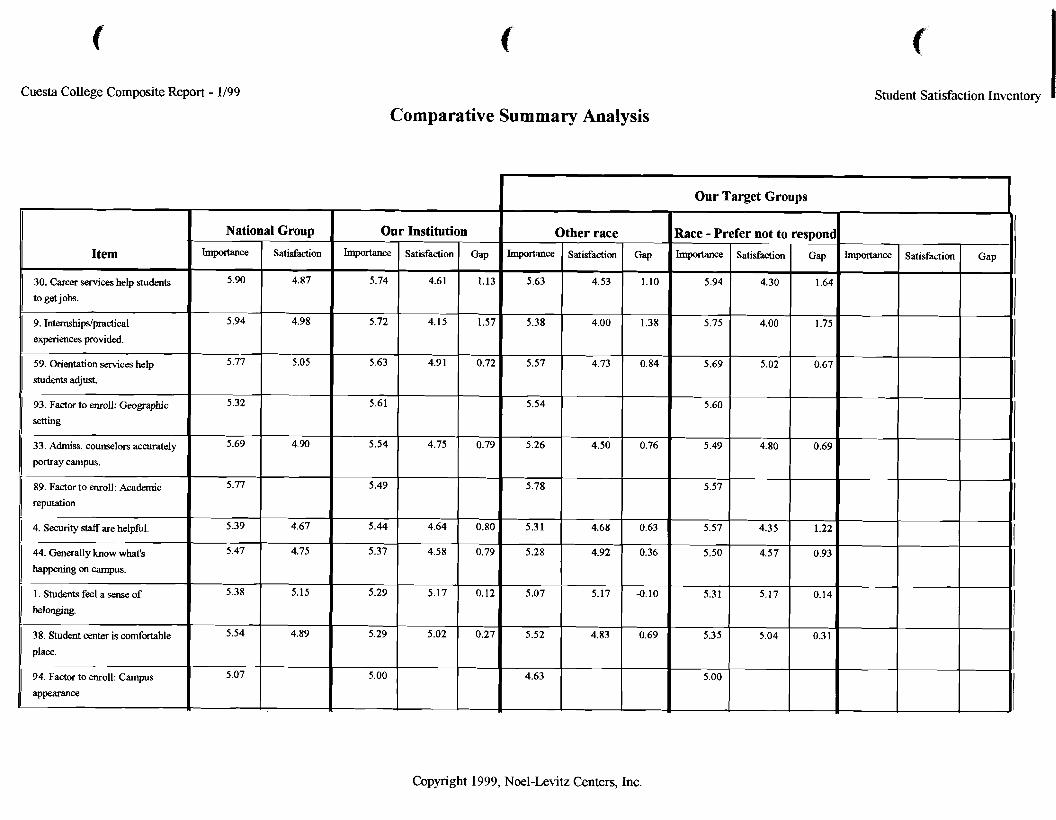
Cuesta College Composite Report - 1/99
Item
30. Career services help students
to get jobs.
9. Internshipsfpractical
experiences provided.
59. Orientation services help
students adjust. --
93. Factor to enroll: Geographic
setting
33. Admiss. counselors accurately
portray campus.
89. Factor to enroll: Academic
reputation
4. Security staffare helpful.
44. Generally know what's
happening on campus.
1. Students feel a sense of
belonging.
38. Student center is comfortable
I place. - 1 94. Factor to enroll: Campus
I appearance
Comparative Summary Analysis
Our Institution
c Student Satisfaction Inventory
Our Target Groups I
Copyright 1999, Noel-Levitz Centers, Inc.
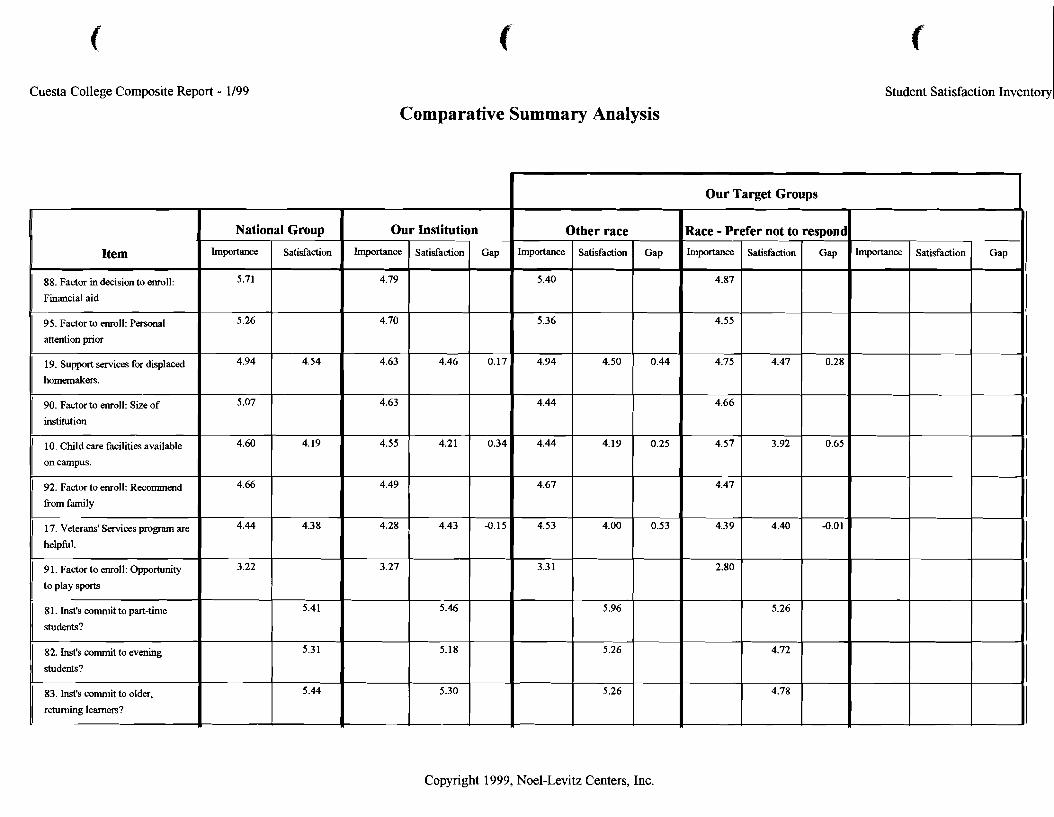
Cuesta College Composite Report - 1/99 Student Satisfaction Inventory
Comparative Summary Analysis
I Our Target Groups I
Copyright 1999, Noel-Levitz Centers, Inc.
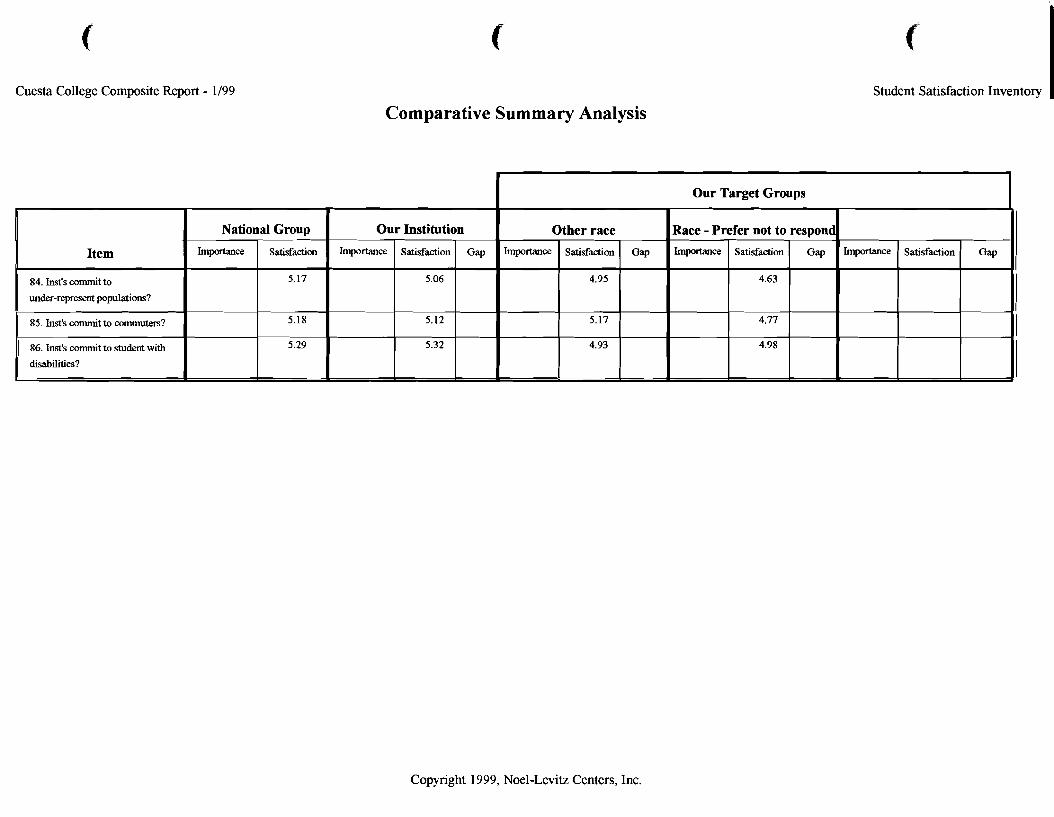
Cuesta College Composite Report - 1/99
84. Inst's commit to
under-represent populations?
85. Inst's commit to commuters?
86. Inst's commit to student with
disabilities?
Comparative Summary Analysis
National Group Our Institution
Importance Satisfaction Importance Satisfaction Gap
i- Student Satisfaction Inventory
Other race
Importans Satisfaction I
Our Target Groups
Race - Prefer not to respon Importance Satisfaction Gap
Copyright 1999, Noel-Levitz Centers, Inc.
I Importance Satisfaction Gap
.I

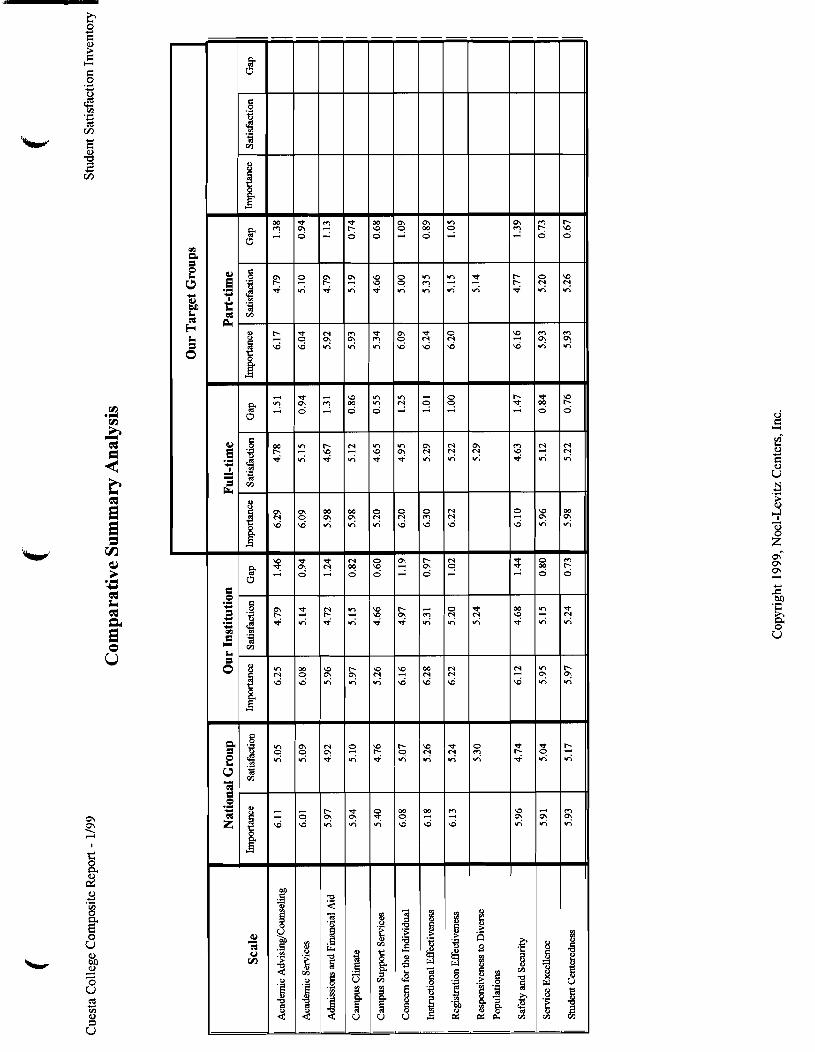
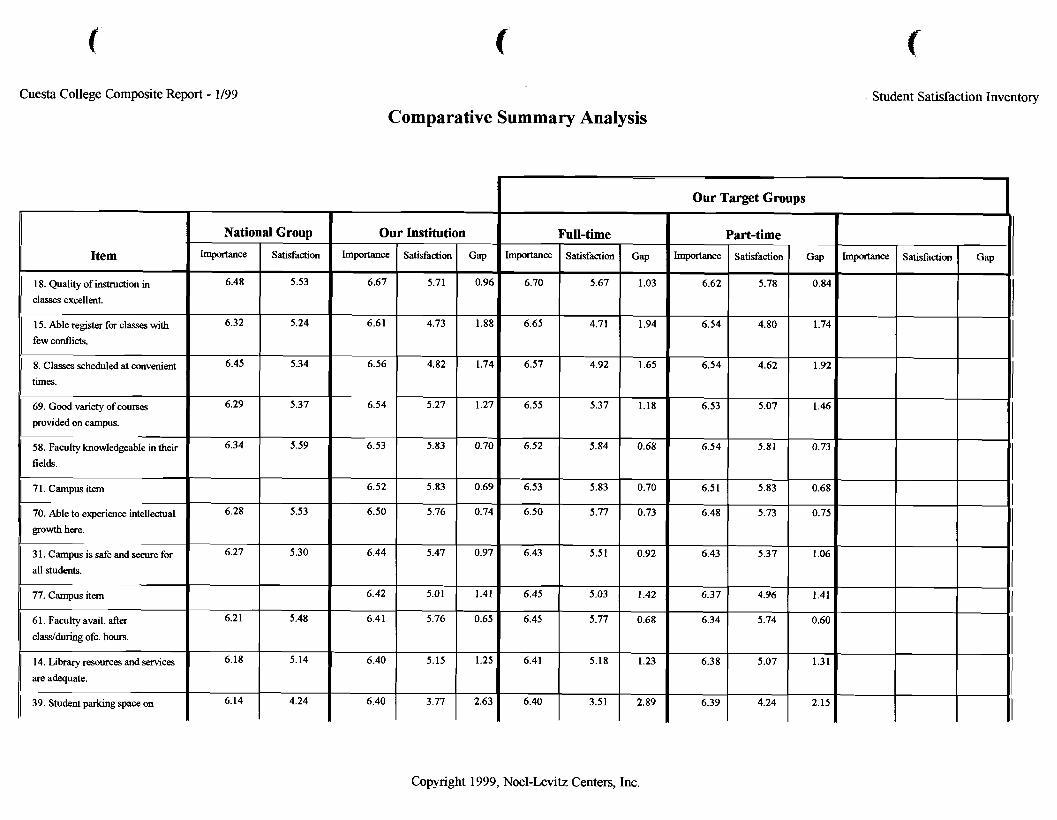
Cuesta College Composite Report - 1/99 Student Satisfaction Inventory
Comparative Summary Analysis
Copyright 1999, Noel-Levitz Centers, Inc.
Item
18. Quality of instruction in
classes excellent.
15. Able register for classes with
few conflicts.
8. Classes scheduled at convenient
times.
69. Good variety of courses
provided on campus.
58. Faculty knowledgeable in their
fields.
I 71. Campus item
70. Able to experience intellectual
growth here.
3 1. Campus is safe and secure for
all students.
1 77. campus item
6 1. Faculty avail. after
class/during ofc. hours.
14. Library resources and senices
are adequate.
I 39. student parking space on
Our Target Groups I National
Importance
6.48
6.32
6.45
6.29
6.34
6.28
6.27
6.2 1
6.18
6.14
Importance
6.70
6.65
6.57
6.55
6.52
6.53
6.50
6.43
6.45
6.45
6.41
6.40
Group
Satisfaction
5.53
5.24
5.34
5.37
5.59
5.53
5.30
5.48
5.14
4.24
Our
h-ce
6.67
6.61
6.56
6.54
6.53
6.52
6.50
6.44
6.42
6.41
6.40
6.40
Full-time
Satisfaction
5.67
4.71
4.92
5.37
5.84
5.83
5.77
5.51
5.03
5.77
5.18
3.51
Importance
6.62
6.54
6.54
6.53
6.54
6.5 1
6.48
6.43
6.37
6.34
6.38
6.39
Institution
Satisfaction
5.71
4.73
4.82
5.27
5.83
5.83
5.76
5.47
5.01
5.76
5.15
3.77
Gap
1.03
1.94
1.65
1.18
0.68
0.70
0.73
0.92
1.42
0.68
1.23
2.89
I
I
Gap
0.96
1.88
1.74
1.27
0.70
0.69
0.74
0.97
1.41
0.65
1.25
2.63
I
Part-time
Satisfaction
5.78
4.80
4.62
5.07
5.81
5.83
5.73
5.37
4.96
5.74
5.07
4.24
Importance Gap
0.84
1.74
1.92
1.46
0.73
0.68
0.75
1.06
1.41
0.60
1.31
2.15
II
Satisfaction Gap
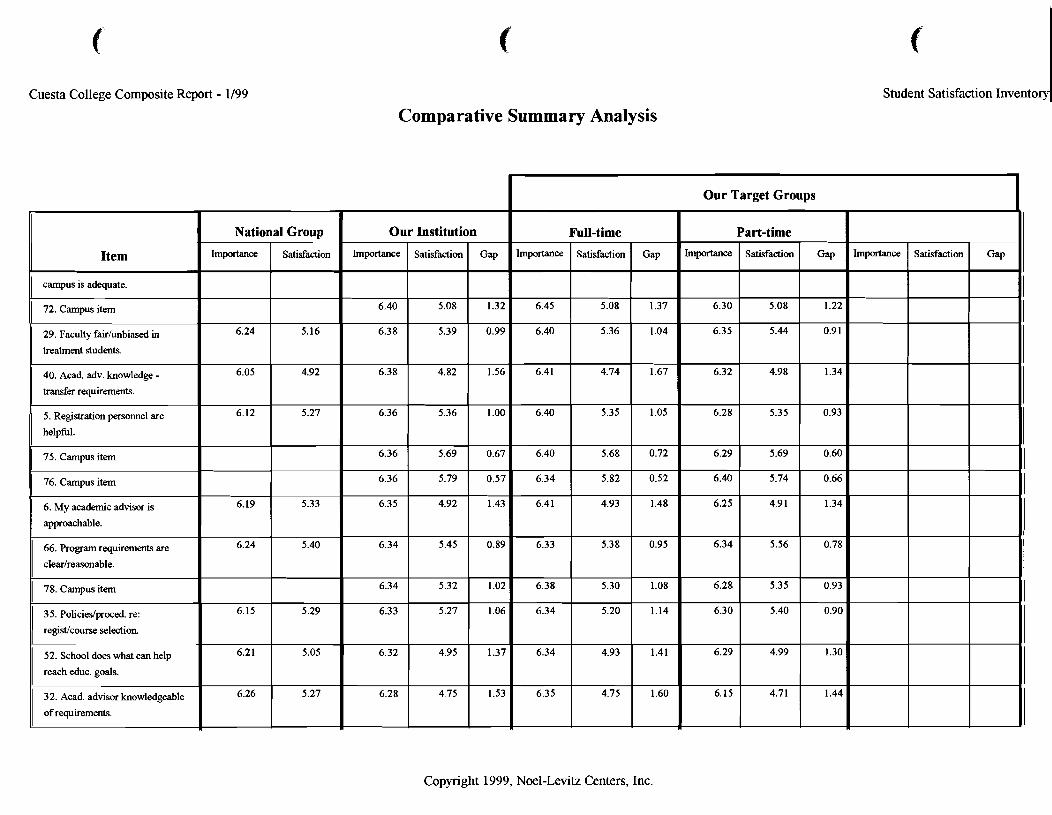
Cuesta College Composite Report - 1/99
Comparative Summary Analysis Student f- Satisfaction Invento 1
I Our Target Groups
Copyright 1999, Noel-Levitz Centers, Inc.
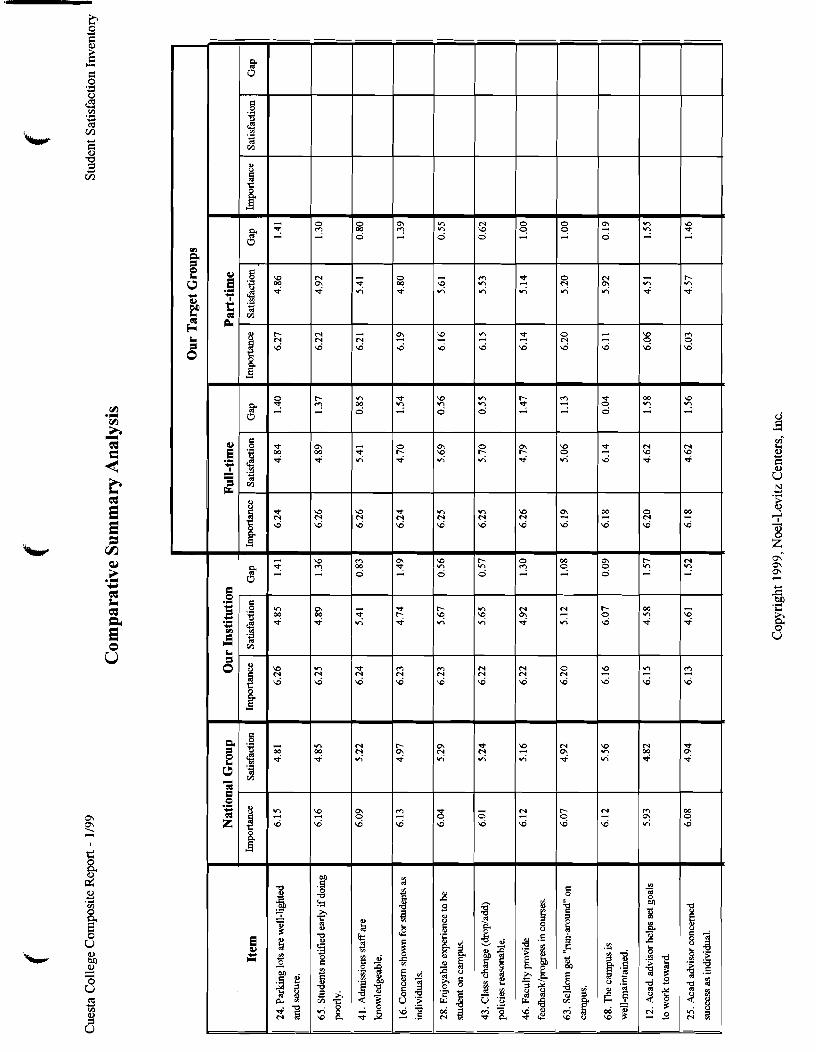
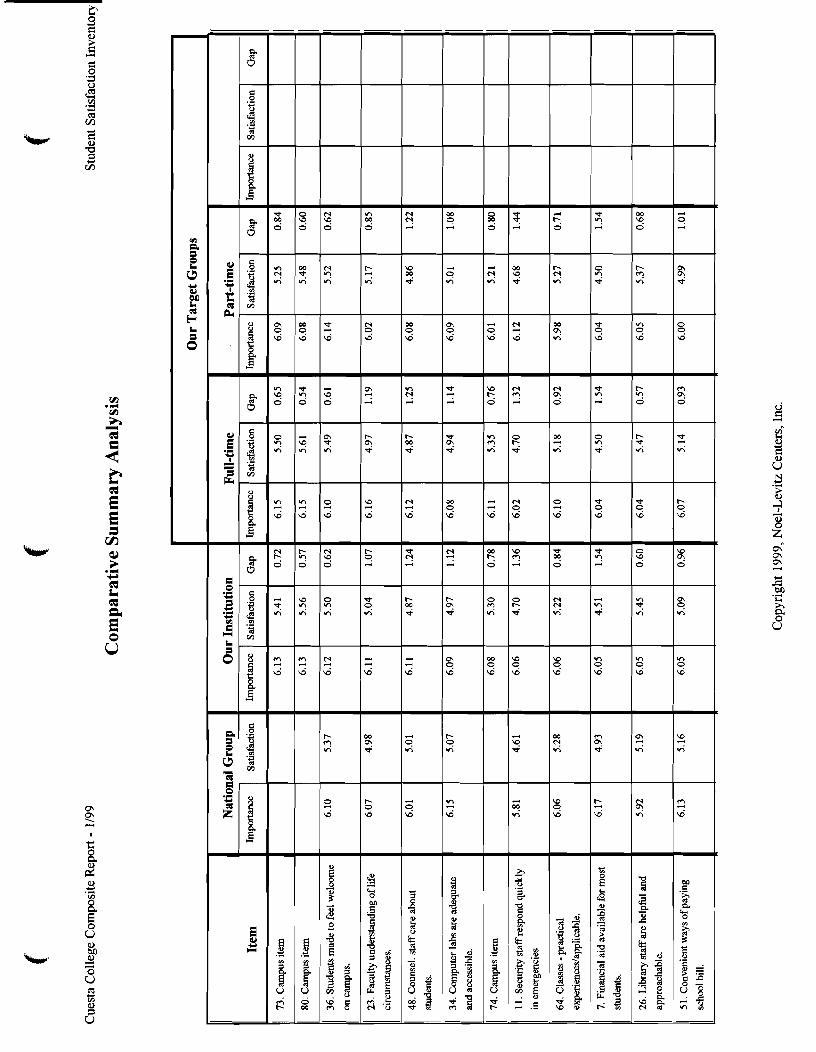
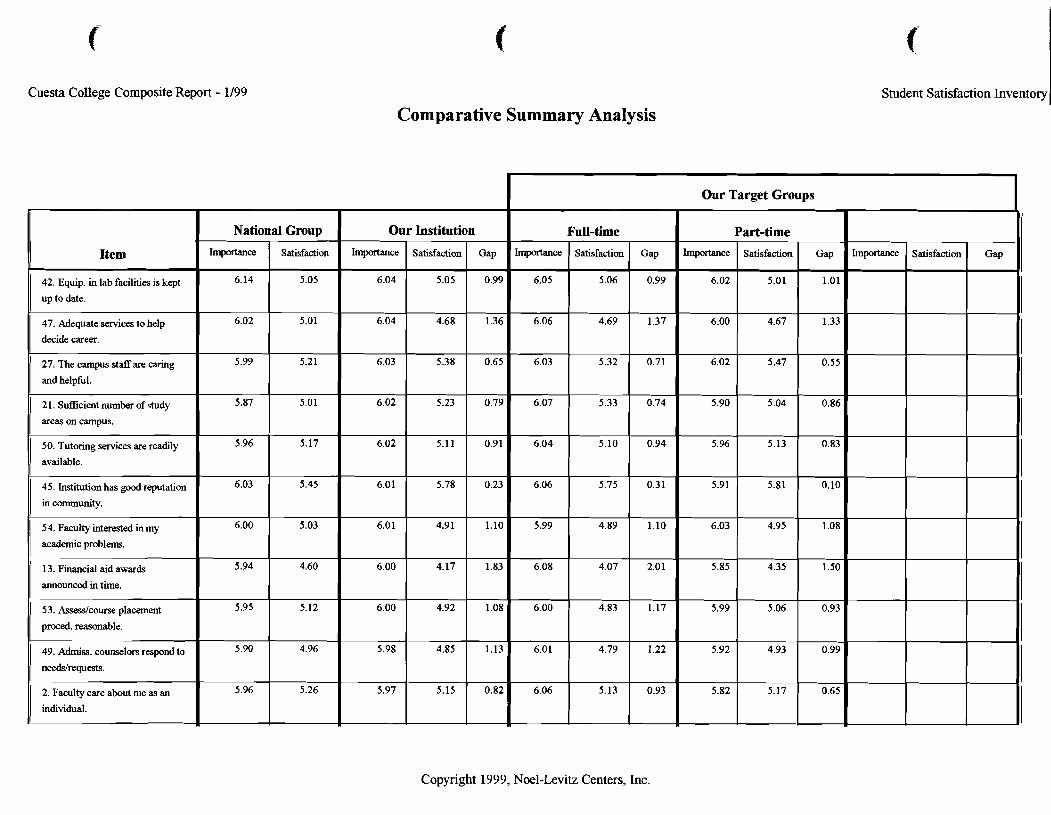
Cuesta College Composite Report - 1/99 Student Satisfaction inventory 1 Comparative Summary Analysis
Copyright 1999, Noel-Levitz Centers, Inc.
Item
42. Equip. in lab facilities is kept
up to date.
47. Adequate services to help
decide career.
27. The campus staffare caring
and helphl.
2 1. Sufficient number of study
areas on campus.
50. Tutoring services are readily
available.
45. Institution has good reputation
in community.
54. Faculty interested in my
academic problems.
13. Financial aid awards
announced in time.
53. A d c o u r s e placement
proced. reasonable.
49. Admiss. counselors respond to
needdrequests.
2. Faculty care about me as an
individual. I
hpXLmce
6.05
6.06
6.03
6.07
6.04
6.06
5.99
6.08
6.00
6.01
6.06
National
Importance
6.14
6.02
5.99
5.87
5.96
6.03
6.00
5.94
5.95
5.90
5.96
Our
Importance
6.04
6.04
6.03
6.02
6.02
6.01
6.01
6.00
6.00
5.98
5.97
Group
Satisfaction
5.05
5.01
5.2 1
5.01
5.17
5.45
5.03
4.60
5.12
4.96
5.26
Full-time
Satisfaction
5.06
4.69
5.32
5.33
5.10
5.75
4.89
4.07
4.83
4.79
5.13
Our Target Groups
Gap
0.99
1.37
0.71
0.74
0.94
0.31
1.10
2.01
1.17
1.22
0.93
Importance
6.02
6.00
6.02
5.90
5.96
5.91
6.03
5.85
5.99
5.92
5.82
Importance
Institution
Satisfaction
5.05
4.68
5.38
5.23
5.11
5.78
4.91
4.17
4.92
4.85
5.15
Gap
0.99
1.36
0.65
0.79
0.91
0.23
1.10
1.83
1.08
1.13
0.82
Part-time
Satisfaction
5.01
4.67
5.47
5.04
5.13
5.81
4.95
4.35
5.06
4.93
5.17
Satisfaction Gap
1.01
1.33
0.55
0.86
0.83
0.10
1.08
1.50
0.93
0.99
0.65
Gap
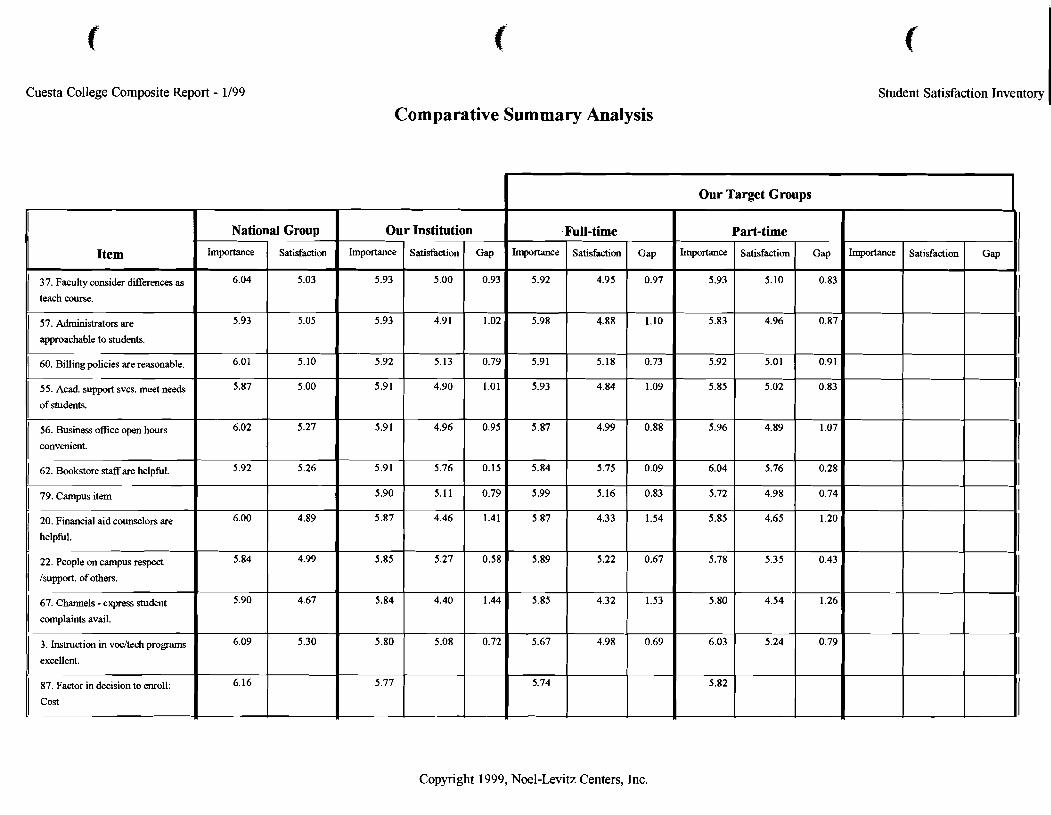
Cuesta College Composite Report - 1/99 Student Satisfaction Inventory
Comparative Summary Analysis
Copyright 1999, Noel-Levitz Centers, Inc.
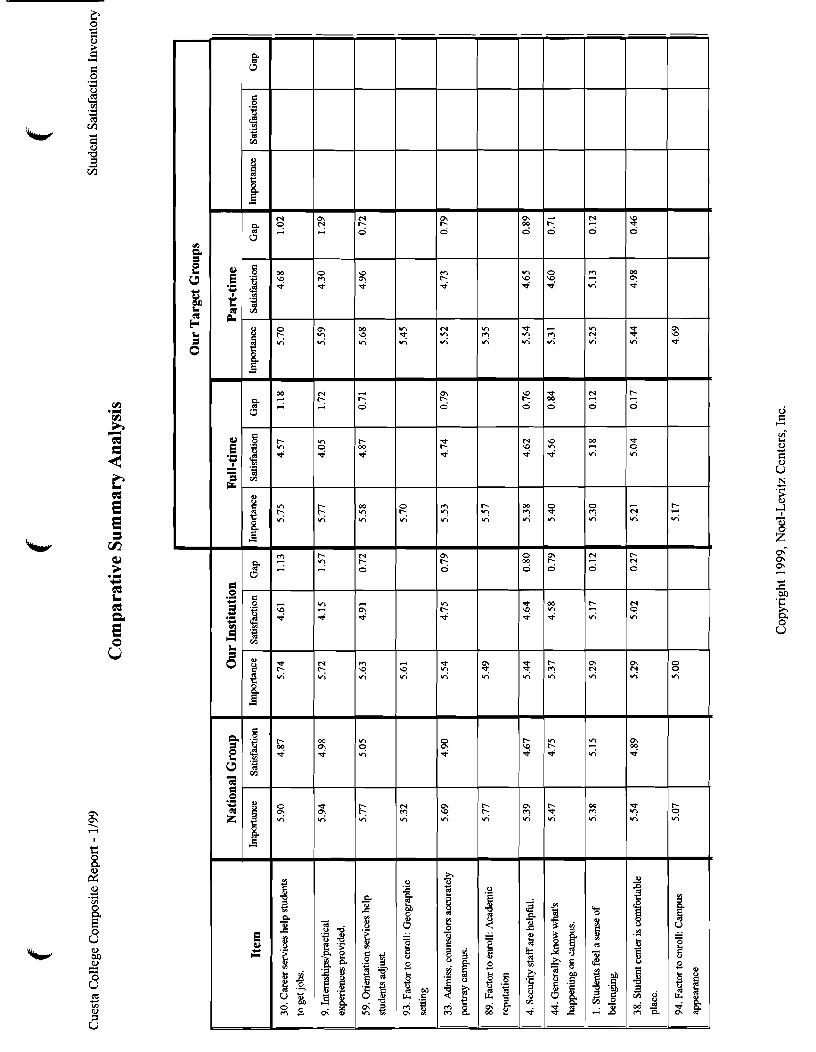
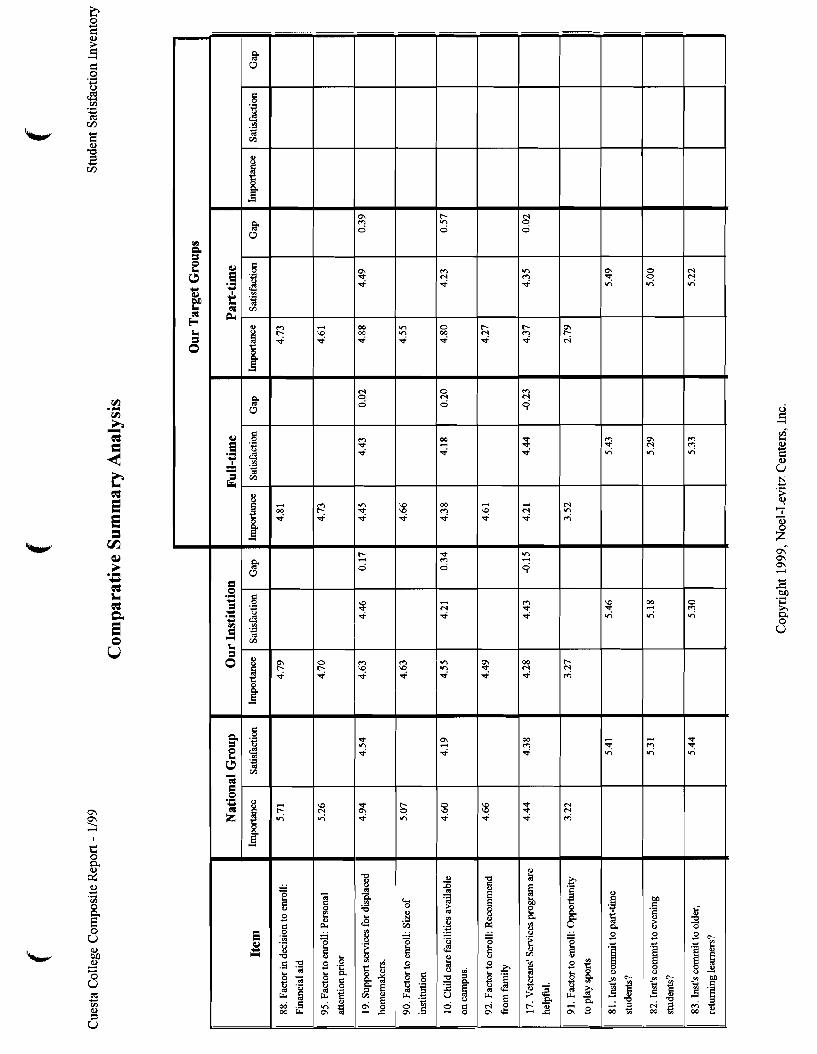
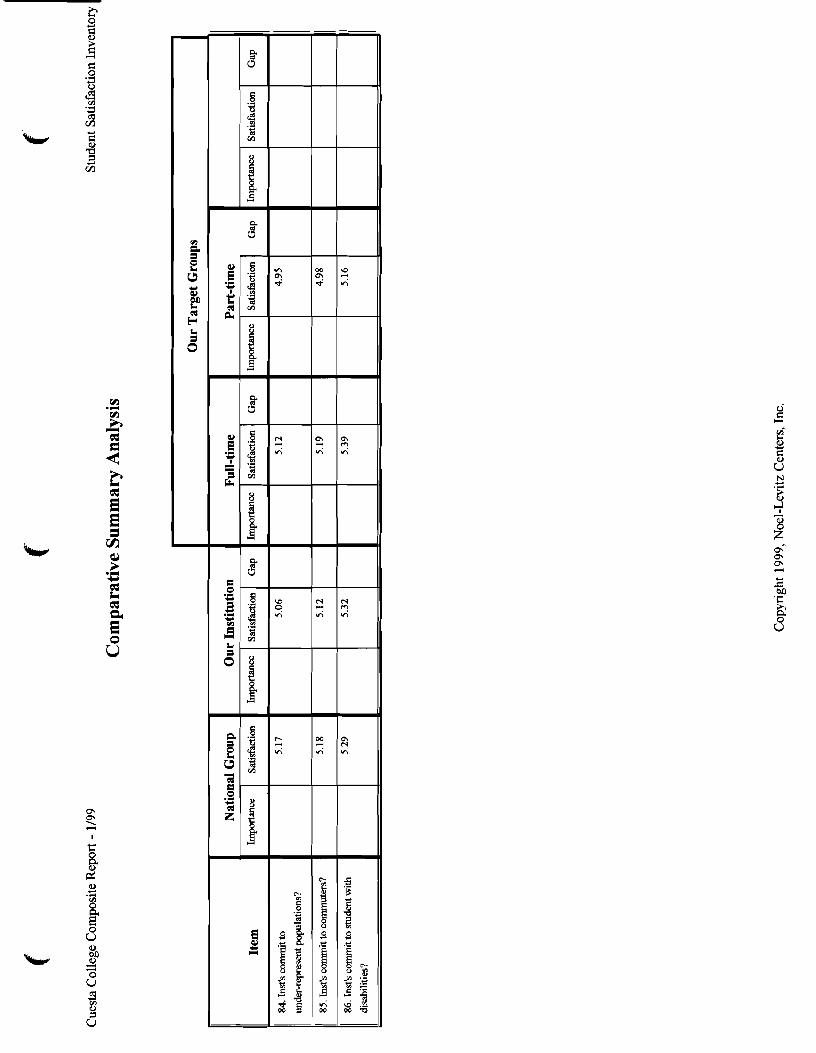

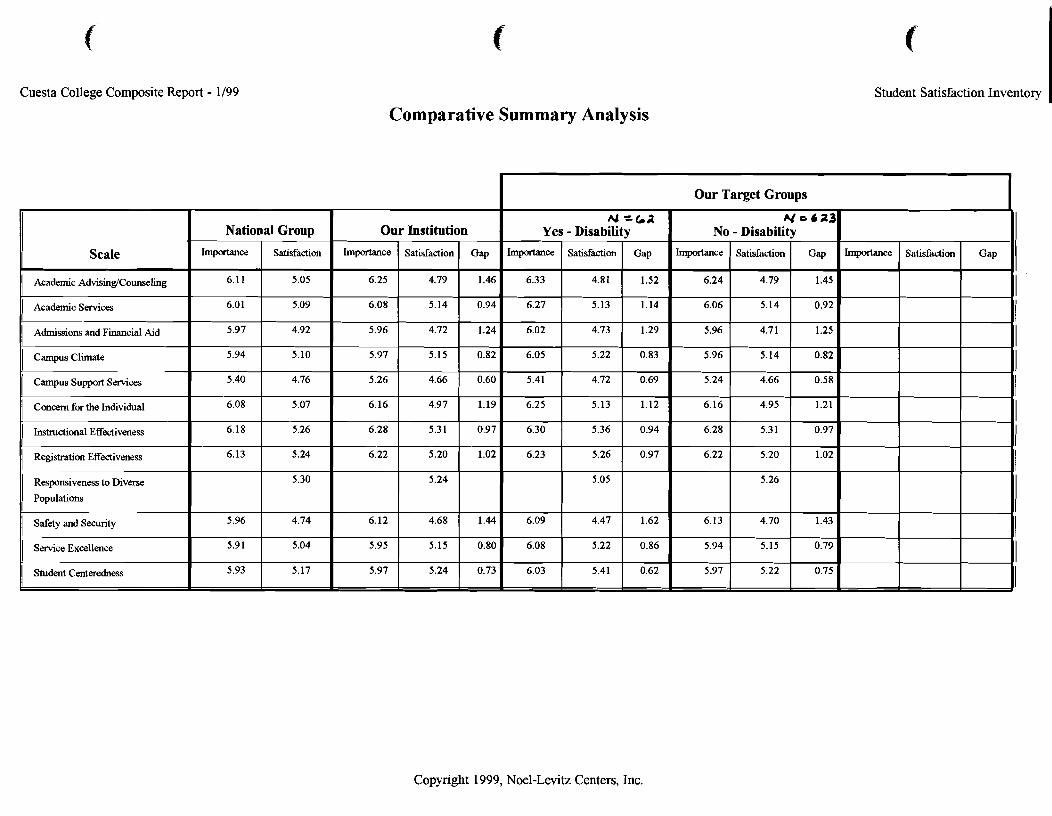
Cuesta College Composite Report - 1/99 Student Satisfaction Inventory I Comparative Summary Analysis
I Our Target Groups I
Copyright 1999, Noel-Levitz Centers, Inc.
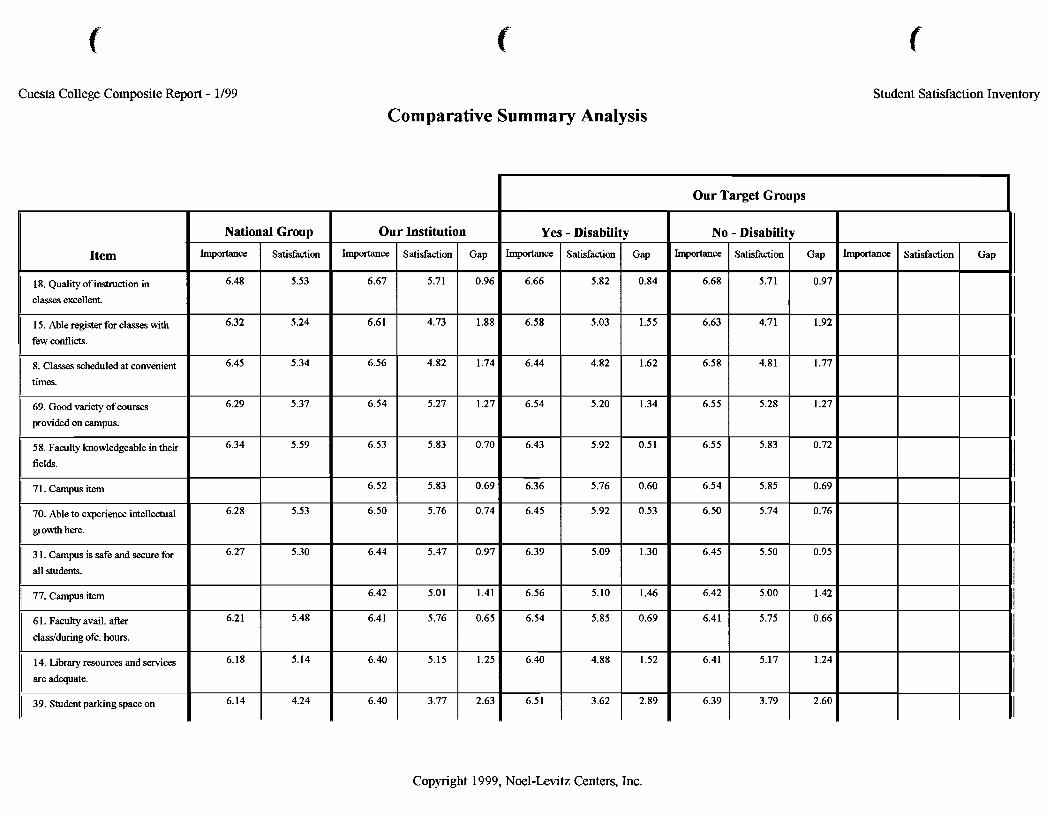
Cuesta College Composite Report - 1/99 Student Satisfaction Inventory
Comparative Summary Analysis
I Our Target Groups
Copyright 1999, Noel-Levitz Centers, Inc.

Cuesta College Composite Report - 1/99 Student Satisfaction Inventory
Comparative Summary Analysis
I Our Target Groups I
Copyright 1999, Noel-Levitz Centers, Inc.
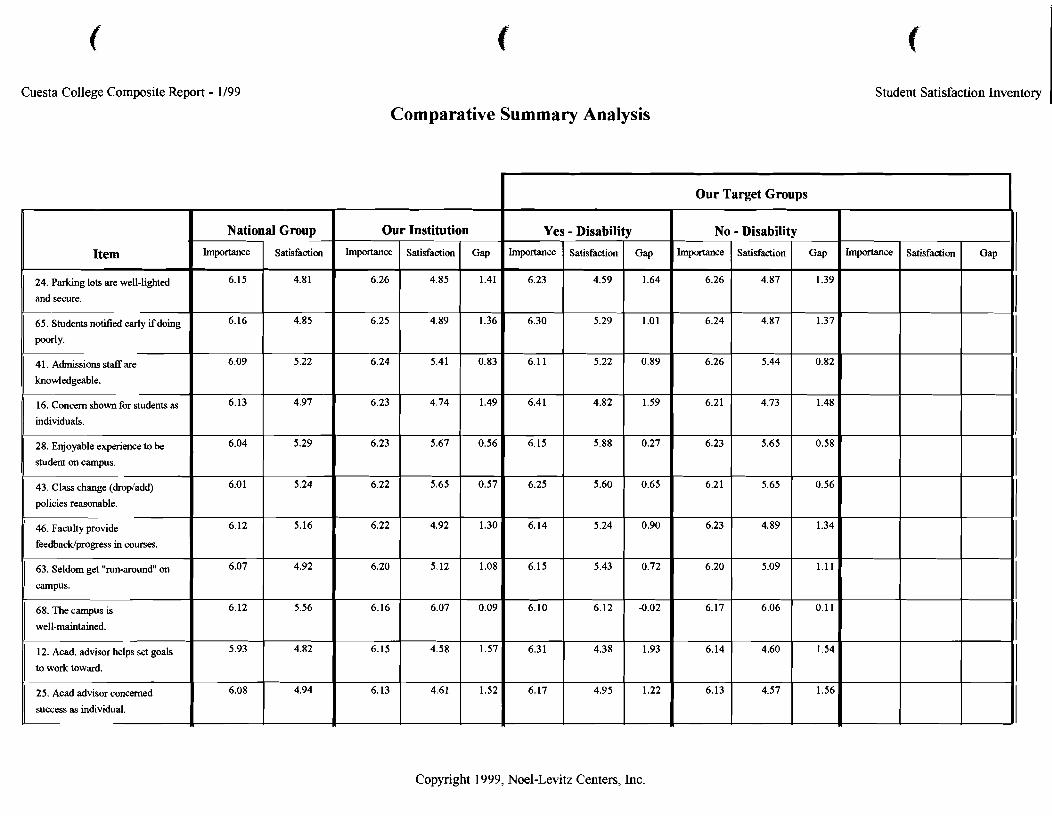
Cuesta College Composite Report - 1/99 Student Satisfaction Inventory 1
Comparative Summary Analysis
Copyright 1999, Noel-Levitz Centers, Inc.
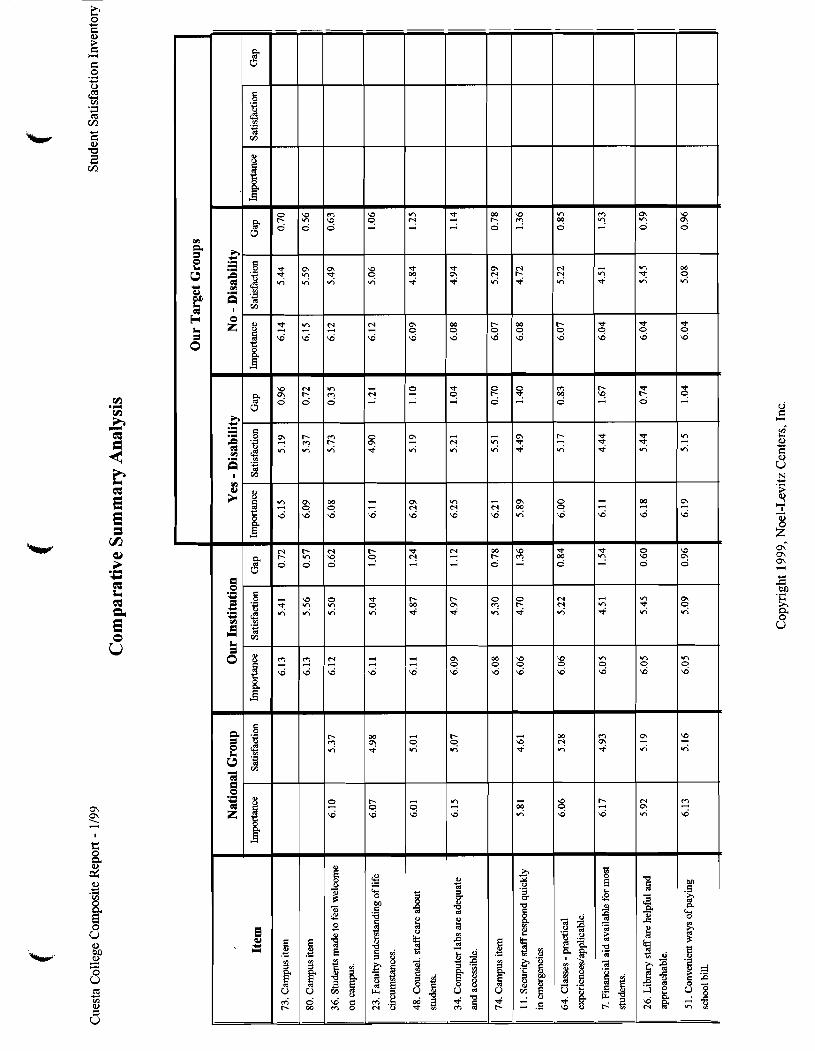
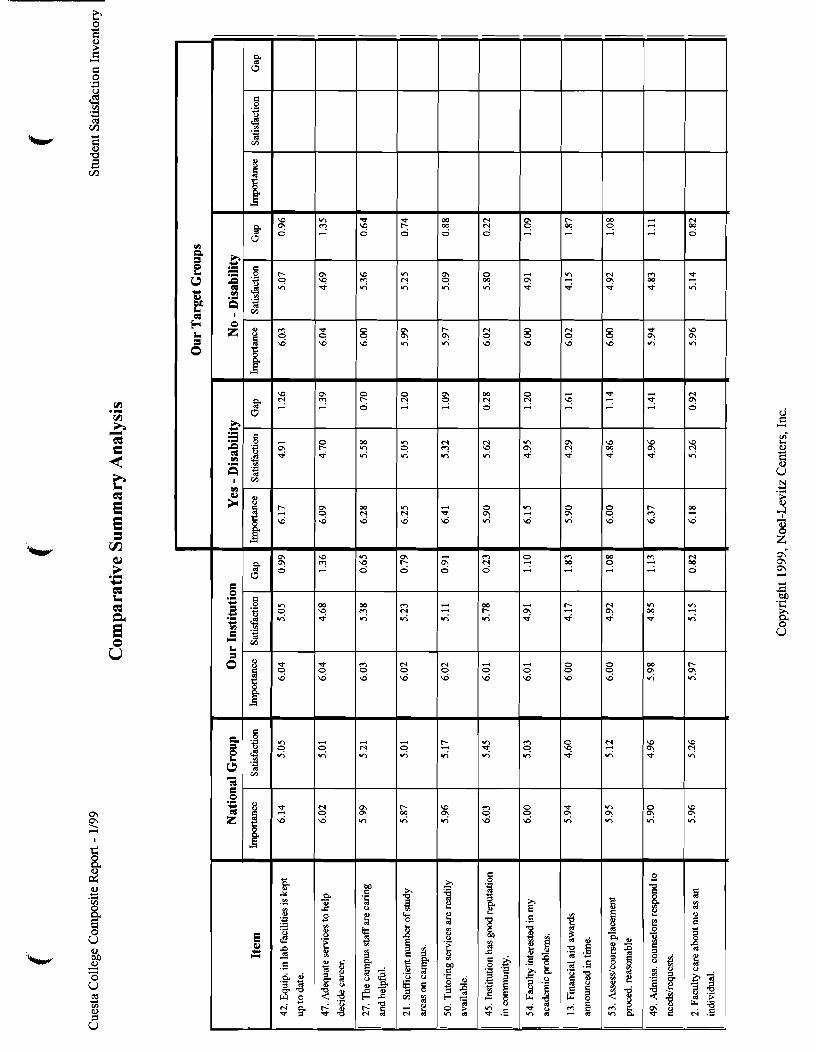
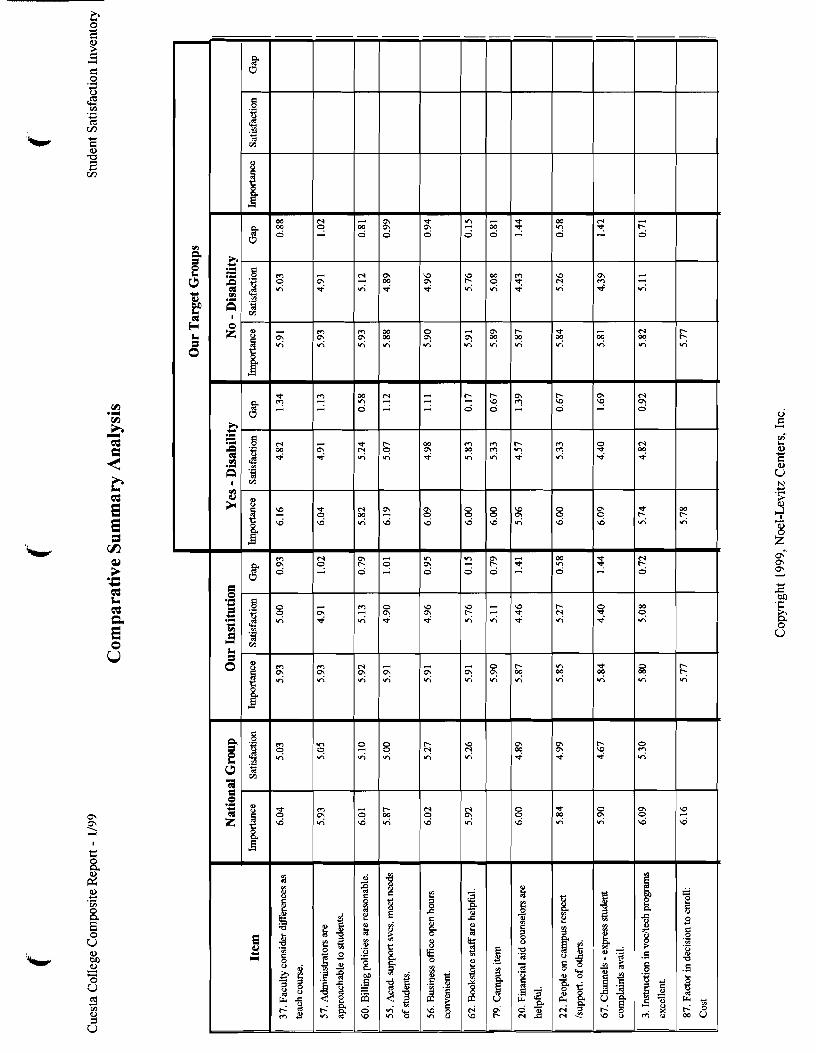
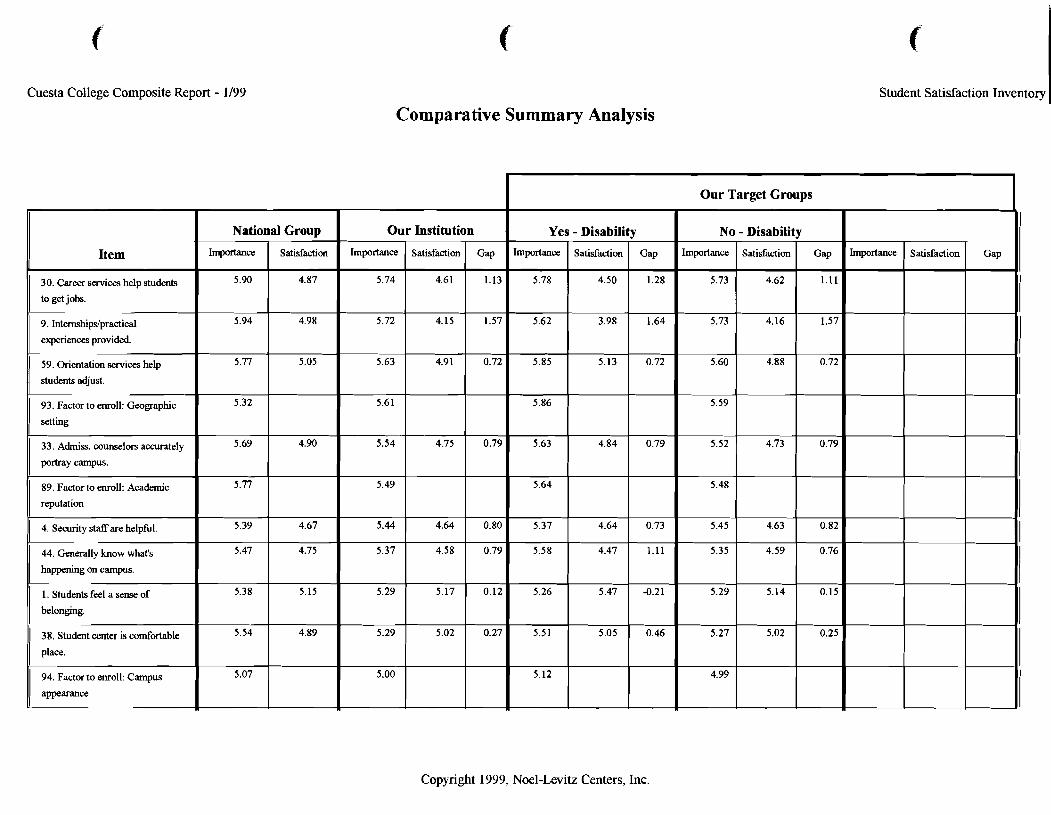
Cuesta College Composite Report - 1/99 Student Satisfaction Inventory ( Comparative Summary Analysis
I Our Target Groups I
Copyright 1999, Noel-Levitz Centers, Inc.
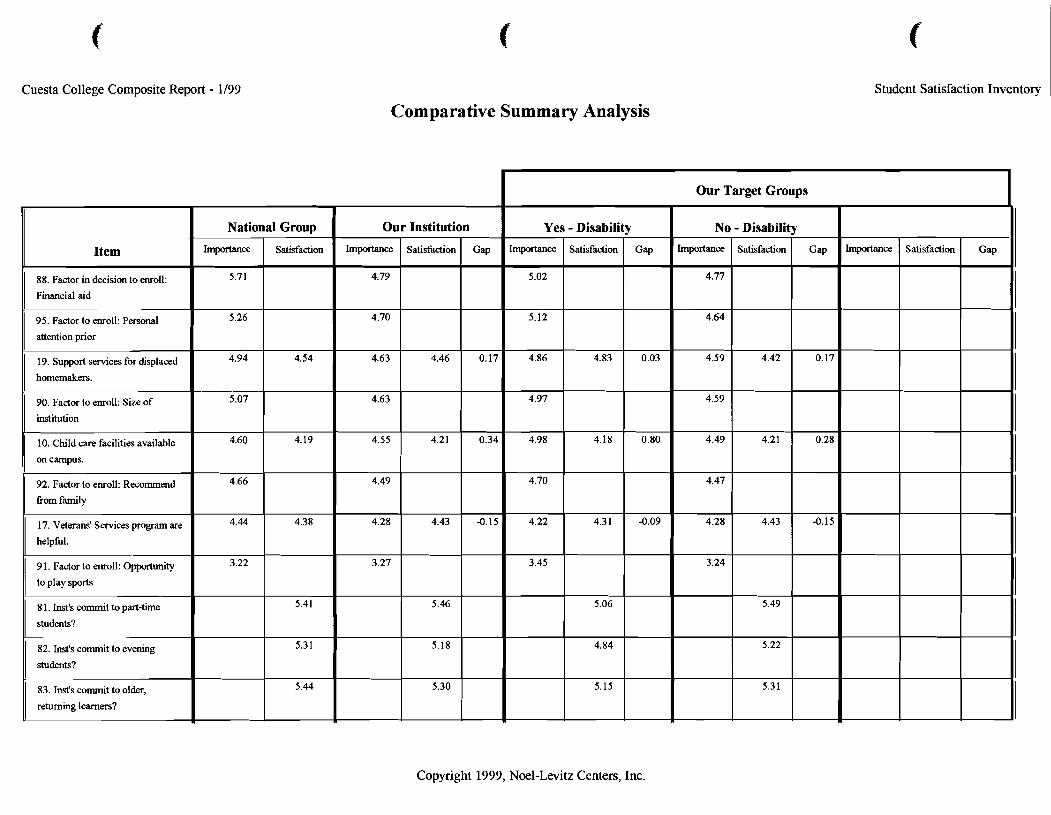
Cuesta College Composite Report - 1/99 Student Satisfaction Inventow
Comparative Summary Analysis
Copyright 1999, Noel-Levitz Centers, Inc.
83. Inst's commit to older, 5.44 5.30 5.15 5.31
returning learners?
Item
88. Factor in decision to enroll:
Financial aid
95. Factor to enroll: Personal
attention prior
19. Support services for displaced
homemakers.
90. Factor to enroll: Size of
institution
10. Child care facilities available
on campus.
92. Factor to enroll: Recommend
fiom family
17. Veterans' Services program are
helpful.
9 1. Factor to enroll: Opportunity
to play sports
8 1. Inst's commit to part-time
students?
Our Target Groups
Our
Importance
4.79
4.70
4.63
4.63
4.55
4.49
4.28
3.27
National
Importance
5.71
5.26
4.94
5.07
4.60
4.66
4.44
3.22
hpr tance
Group
Satisfaction
4.54
4.19
4.38
5.41
5.31
Institution
Satisfaction
4.46
4.21
4.43
5.46
5.18
Satisfaction Gap Gap
0.03
0.80
-0.09
No Importance
4.77
4.64
4.59
4.59
4.49
4.47
4.28
3.24
Gap
0.17
0.34
-0.15
Yes Importance
5.02
5.12
4.86
4.97
4.98
4.70
4.22
3.45
- Disability
Satisfaction
~ ~ p ~ ~ p p ~ ~ p ~ ~
4.83
4.18
4.31
5.06
4.84
- Disability
Satisfaction
4.42
4.21
4.43
5.49
5.22
Gap
0.17
0.28
-0.15
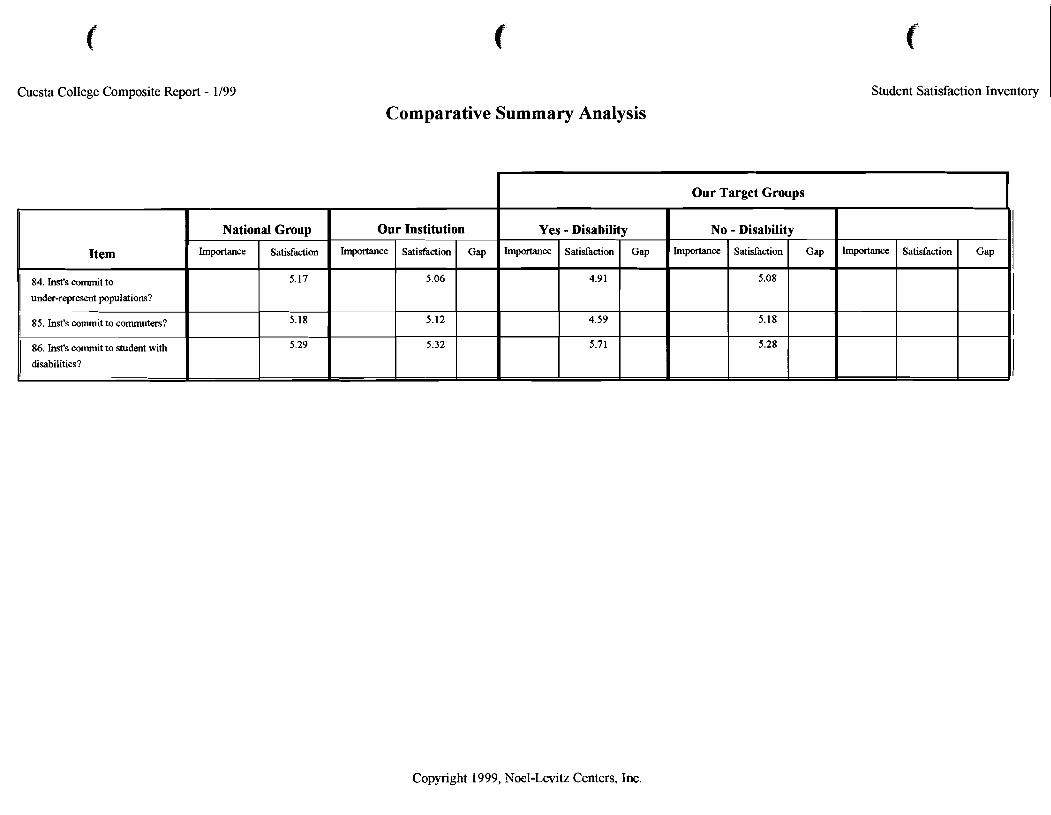
Cuesta College Composite Report - 1/99
Comparative Summary Analysis Student Satisfaction Inventory
Copyright 1999, Noel-Levitz Centers, Inc.
Item
84. Inst's commit to
under-represent populations?
I 85. Inst's commit to commutm?
86. Inst's commit to student with
disabilities?
Our Target Groups
National Group Our Institution Yes - Disability Importance Importance
No - Disability
Importance Importance Satisfaction
5.17
5.18
5.29
Satisfaction Gap Importance Gap Satisfaction
5.06
5.12
5.32
Satisfaction
4.91
4.59
5.71
Satisfaction
5.08
5.18
5.28
Gap Gap

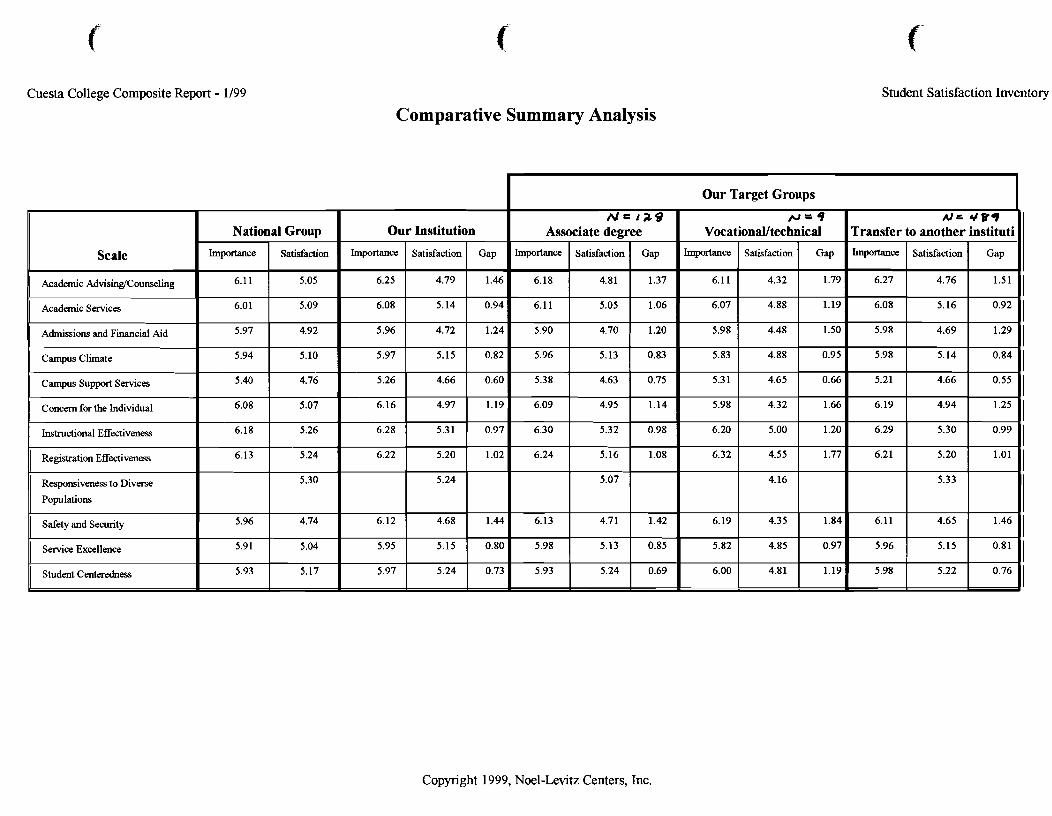
Cuesta College Composite Report - 1/99 Student Satisfaction Inventory
Comparative Summary Analysis
I Our Target Groups I
Copyright 1999, Noel-Levitz Centers, Inc.
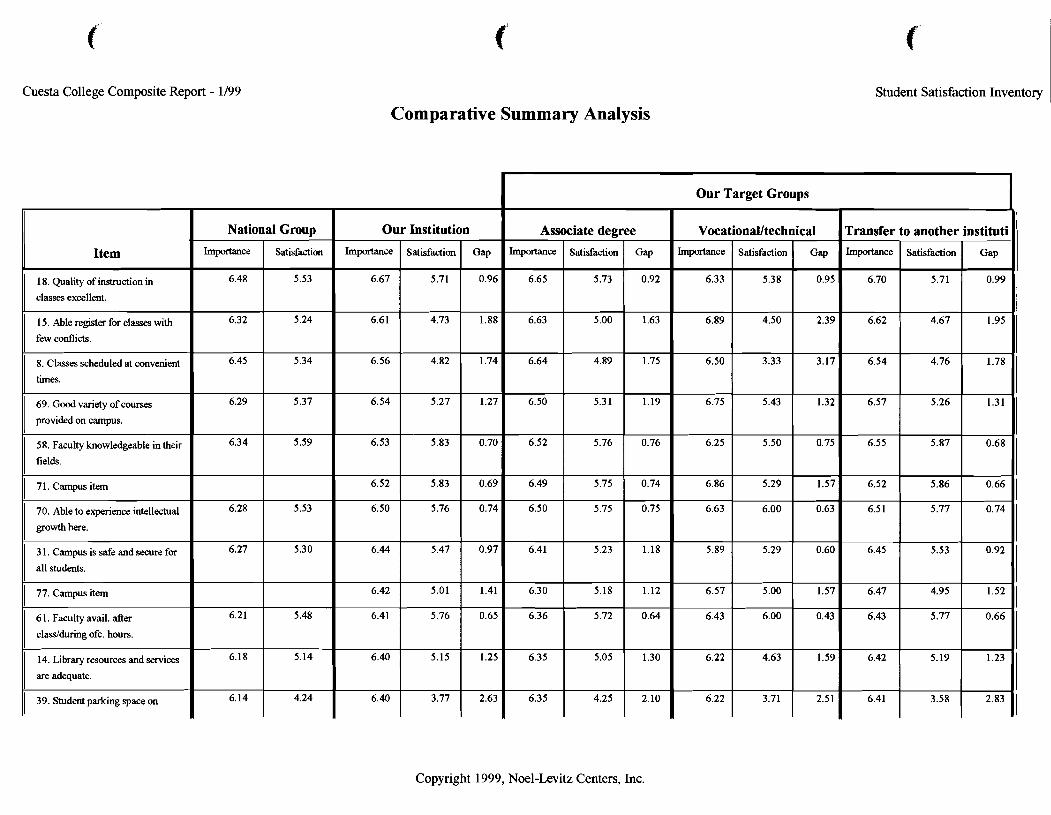
Cuesta College Composite Report - 1/99 Student Satisfaction Inventory
Comparative Summary Analysis
Copyright 1999, Noel-Levitz Centers, Inc.
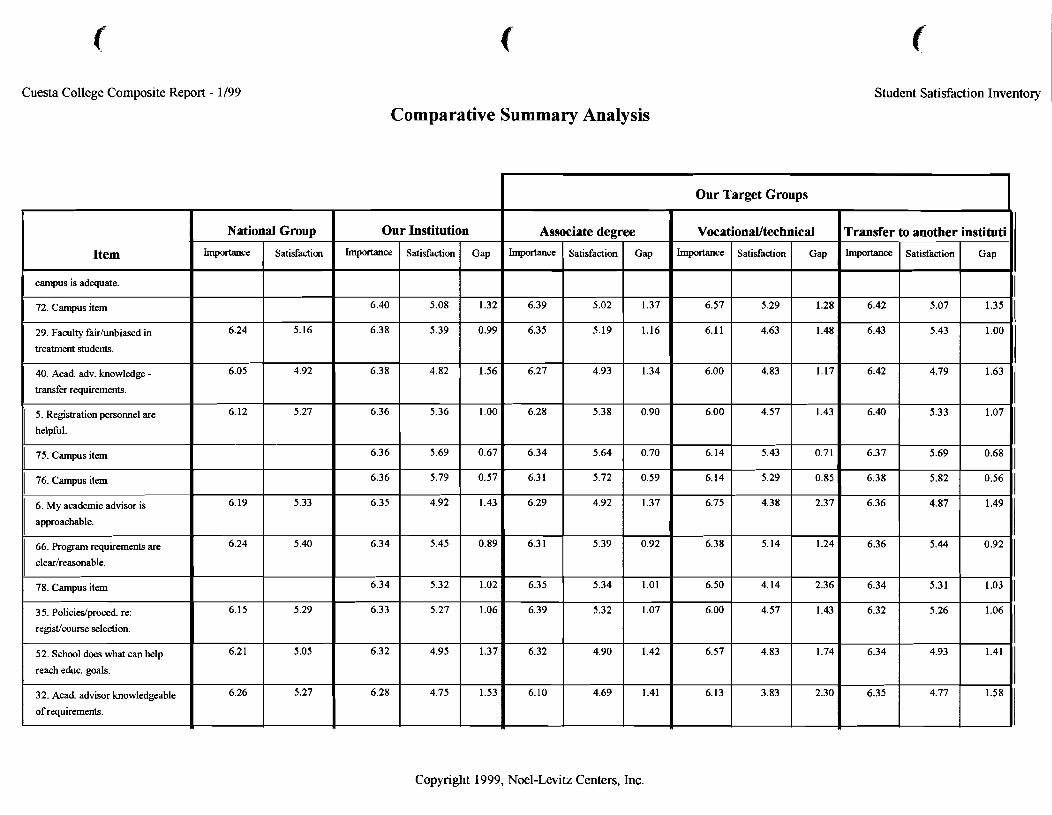
Cuesta College Composite Report - 1/99 Student Satisfaction Inventory 1 Comparative Summary Analysis
Our Target Groups
Copyright 1999, Noel-Levitz Centers, Inc.
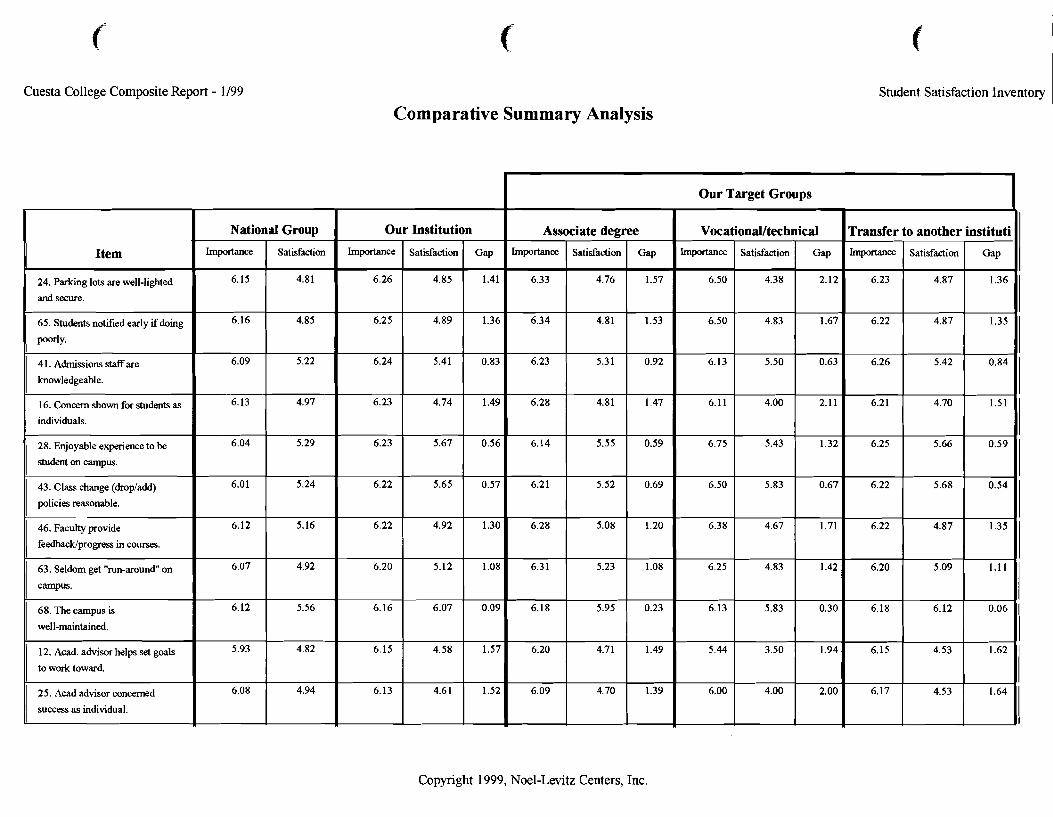
Cuesta College Composite Report - 1/99 Student Satisfaction Inventory 1 Comparative Summary Analysis
Copyright 1999, Noel-Levitz Centers, Inc.
Item
24. Parking lots are well-iighted
and secure.
65. Students notified early if doing
poorly.
41. Admissions statfare
knowledgeable.
16. Concern shown for students as
individuals.
28. Enjoyable experience to be
student on campus.
43. Class change (dropladd)
policies reasonable.
46. Faculty provide
feedbacklprogress in courses.
63. Seldom get "run-around" on
campus.
68. The campus is
well-maintained.
12. Acad. advisor helps set goals
to work toward.
25. Acad advisor concerned
success as individual.
Our
Importance
6.26
6.25
6.24
6.23
6.23
6.22
6.22
6.20
6.16
6.15
6.13
Our Target Groups
National
hportance
6.15
6.16
6.09
6.13
6.04
6.01
6.12
6.07
6.12
5.93
6.08
Gap
1.57
1.53
0.92
1.47
0.59
0.69
1.20
1.08
0.23
-
1.49
1.39
~mportance
6.33
6.34
6.23
6.28
6.14
6.21
6.28
6.31
6.18
- 6.20
6.09
Institution
Satisfaction
4.85
4.89
5.41
4.74
5.67
5.65
4.92
5.12
6.07
4.58
4.6 1
Group
Satisfaction
4.81
4.85
5.22
4.97
5.29
5.24
5.16
4.92
5.56
4.82
4.94
Associate degree Satisfaction
4.76
4.81
5.31
4.81
5.55
5.52
5.08
5.23
5.95
4.71
4.70
Gap
1.41
1.36
0.83
1.49
0.56
0.57
1.30
1.08
0.09
1.57
1.52
Importance
6.50
6.50
6.13
6.11
6.75
6.50
6.38
6.25
Transfer Importance
6.23
6.22
6.26
6.2 1
6.25
6.22
6.22
6.13
- 5.44
6.00
VocationaVtechnical
Satisfaction
4.38
4.83
5.50
4.00
5.43
5.83
4.67
4.83
Gap
2.12
1.67
0.63
2.11
1.32
0.67
1.71
1.42
to another
Satisfaction
4.87
4.87
5.42
4.70
5.66
5.68
4.87
5.83
3.50
4.00
0.30
- 1.94
2.00
instituti
Gap
1 0'84
1 I
O ' l l
I I
0'54 I I
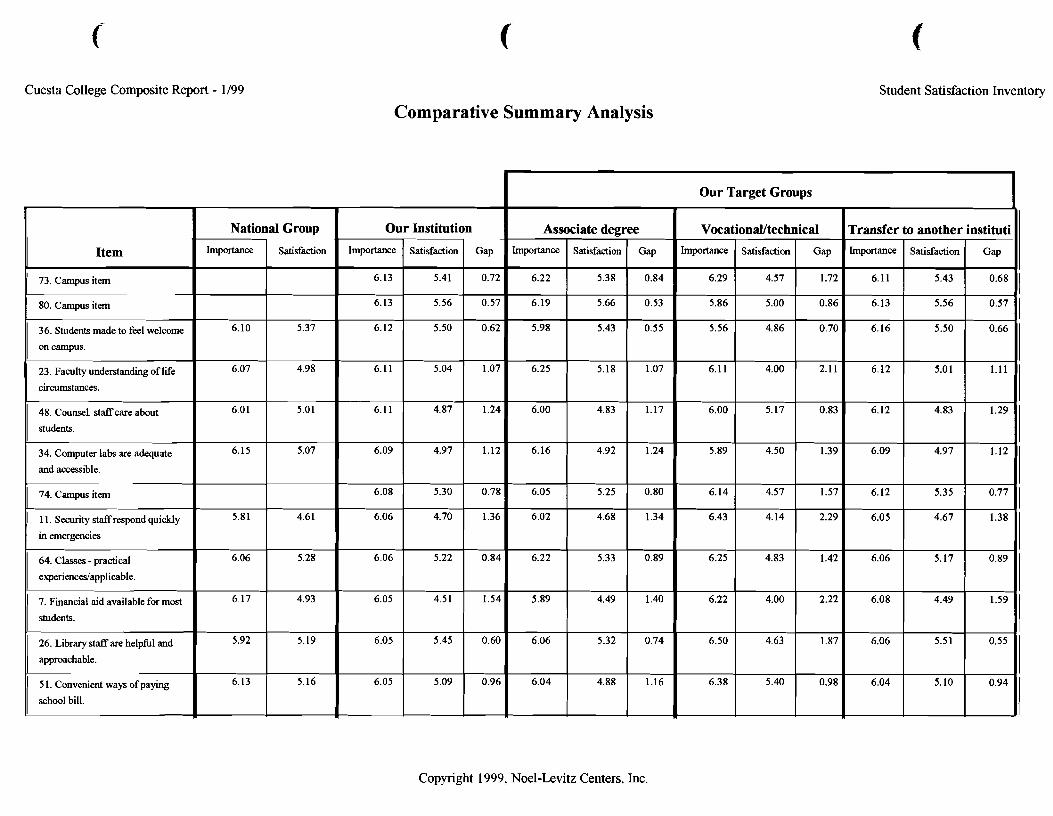
Cuesta College Composite Report - 1/99 Student Satisfaction Inventory
Comparative Summary Analysis
Copyright 1999, Noel-Levitz Centers, Inc.
Item
I 73. campusitem
1 80. Campus item
36. Students made to feel welcome
on campus.
23. Faculty understanding of l i e
circumstances.
48. Counsel. staffcare about
students.
34. Computer labs are adequate
and accessible.
74. Campus item
11. Security staffrespond quickly
in emergencies
64. Classes - practical
experiences/applicable.
7. Financial aid available for most
students.
26. Library staff are helpful and
approachable.
5 1. Convenient ways of paying
school bill.
I
National
Importance
6.10
6.07
6.01
6.15
5.81
6.06
6.17
5.92
6.13
Group
Satisfaction
5.37
4.98
5.01
5.07
4.61
5.28
4.93
5.19
5.16
Our
hportance
6.13
6.13
6.12
6.11
6.11
6.09
6.08
6.06
6.06
6.05
6.05
6.05
Importance
6.22
6.19
Transfer Importance
6.11
6.13
Our Target Groups
Institution
Satisfaction
5.41
5.56
5.50
5.04
4.87
4.97
5.30
4.70
5.22
4.51
5.45
5.09
5.98
6.25
6.00
6.16
6.05
6.02
6.22
5.89
6.06
6.04
Associate degree
Satisfaction
5.38
5.66
Importance
6.29
5.86
6.16
6.12
6.12
6.09
6.12
6.05
6.06
6.08
6.06
6.04
to another
Satisfaction
5.43
5.56
Gap
0.72
0.57
0.62
1.07
1.24
1.12
0.78
1.36
0.84
1.54
0.60
0.96
Gap
0.84
0.53
5.56
6.11
6.00
5.89
6.14
6.43
6.25
6.22
6.50
6.38
instituti
Gap
0.68
5.43
5.18
4.83
4.92
5.25
4.68
5.33
4.49
5.32
4.88
VocationaVtechnical
Satisfaction
4.57
5.00
5.50
5.0 1
4.83
4.97
5.35
4.67
5.17
4.49
5.51
5.10
0.55
1.07
1.17
1.24
0.80
1.34
0.89
1.40
0.74
1.16
Gap
1.72
0.86
4.86
4.00
5.17
4.50
4.57
4.14
4.83
4.00
4.63
5.40
0.70
2.11
0.83
1.39
1.57
2.29
1.42
2.22
1.87
0.98
0,57 I 0'66 I 1'11 I
I 1'12 I 0.77 1
1 0'89 I
I 0'15
0'94 I 1
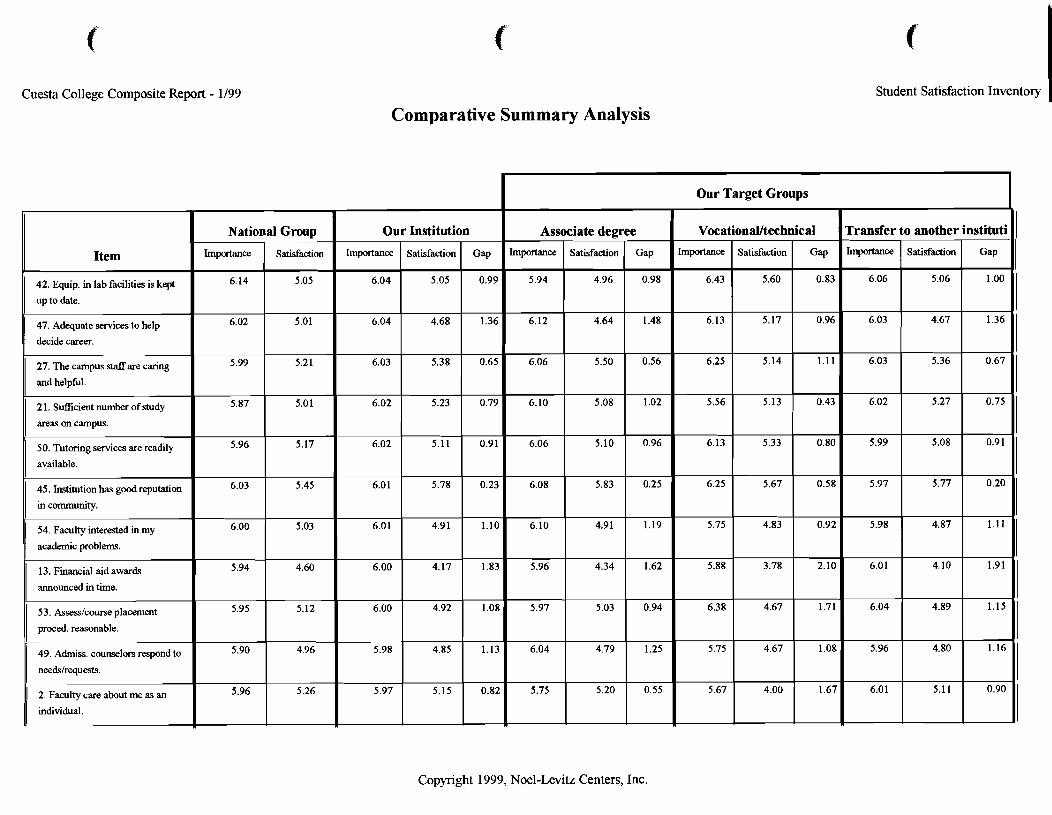
Cuesta College Composite Report - 1/99
Comparative Summary Analysis
f Student Satisfaction Inventoq
Copyright 1999, Noel-Levitz Centers, Inc.
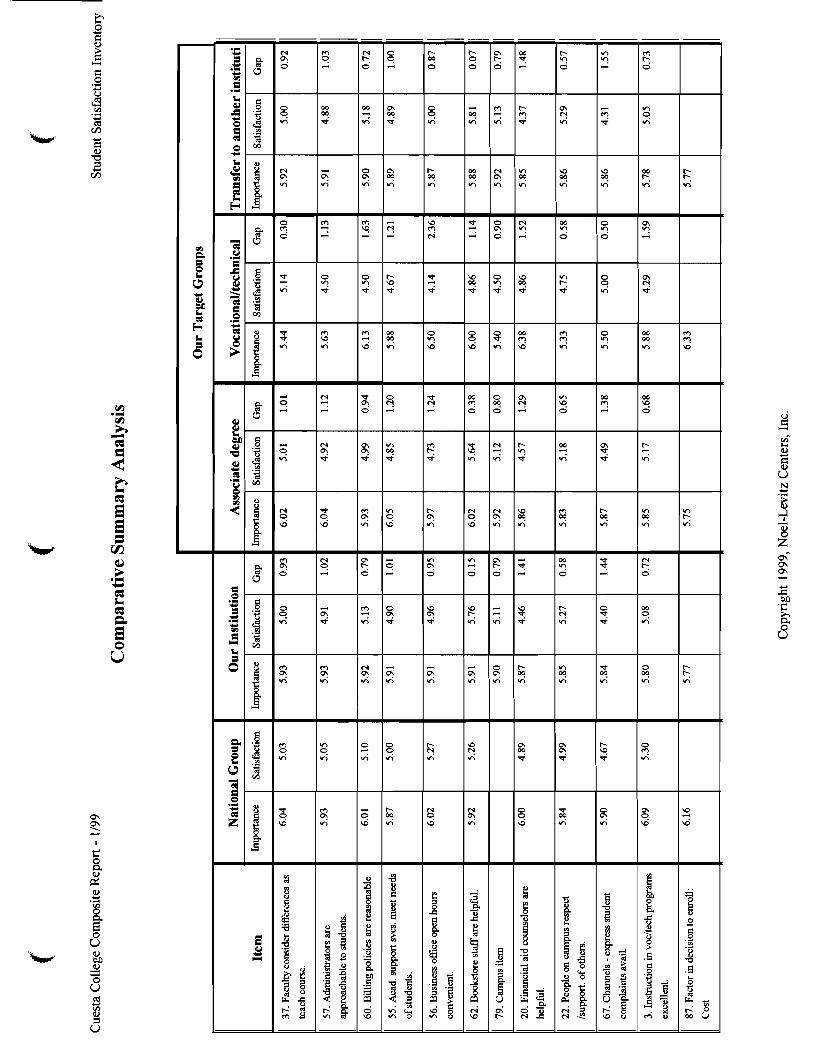
haw- 8k S 4
3
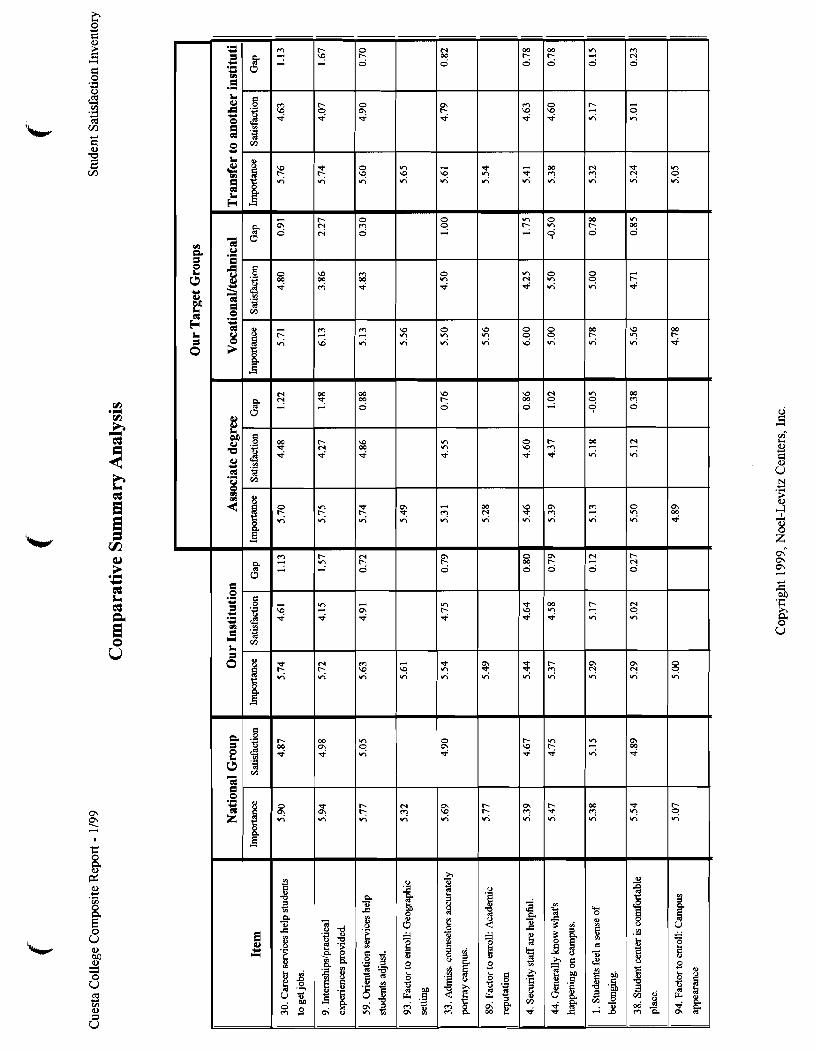
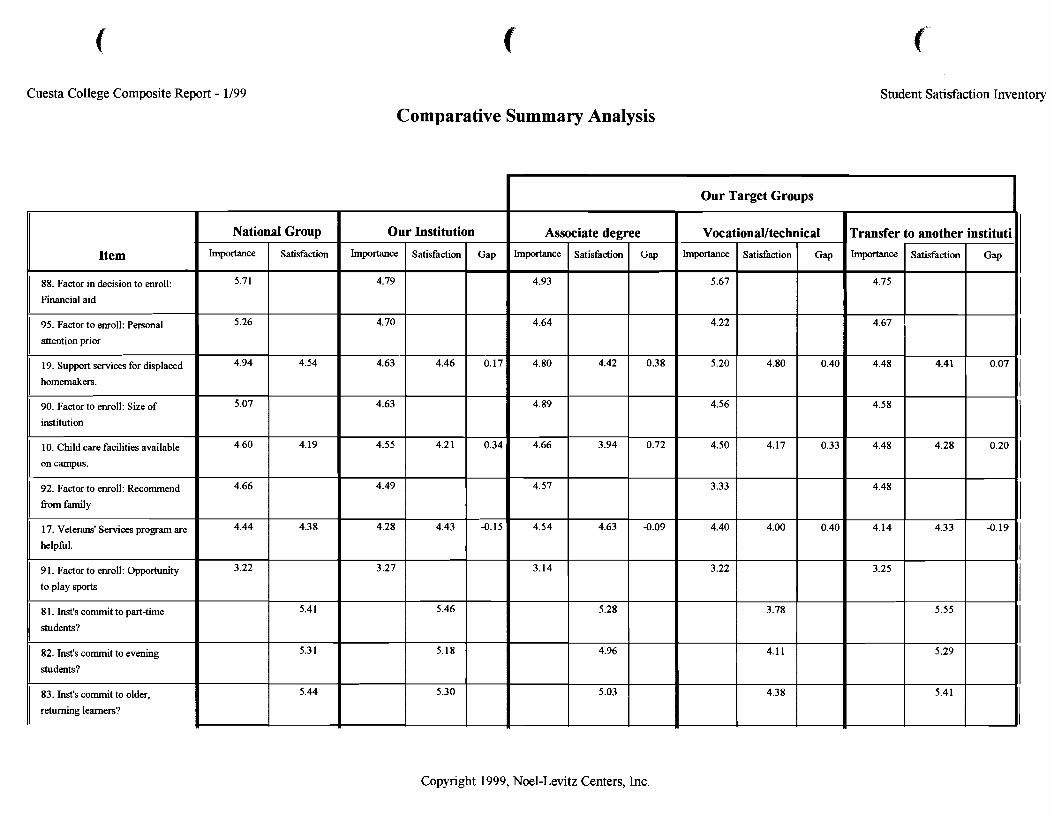
Cuesta College Composite Report - 1/99 Student Satisfaction Inventory
Comparative Summary Analysis
Copyright 1999, Noel-Levitz Centers, Inc.
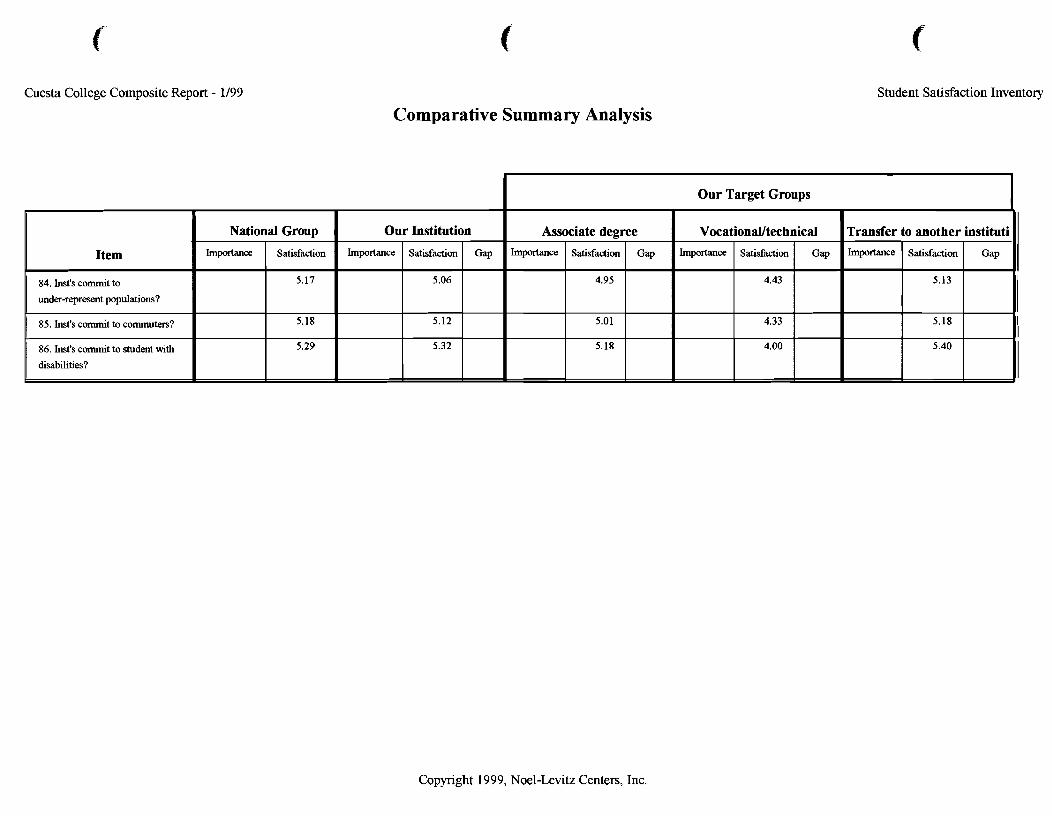
Cuesta College Composite Report - 1/99 Student Satisfaction Inventory
Comparative Summary Analysis
Copyright 1999, Noel-Levitz Centers, Inc.
Our Target Groups I Item
84. Inst's commit to
under-represent populations?
I 85. Inst's commit to commutm?
86. Inst's commit to student with
disabilities?
Our Institution Associate degree National Group
Importance ImpOrtmce Importance
Vocational/technical
Satisfaction
5.17
5.18
5.29
Satisfaction
5.06
5.12
5.32
Satisfaction
4.95
5.01
5.18
Importance Gap
I
Gap
Transfer to another instituti Importance Satisfaction
4.43
4.33
4.00
Gap Satisfaction
5.13
5.18
5.40
Gap

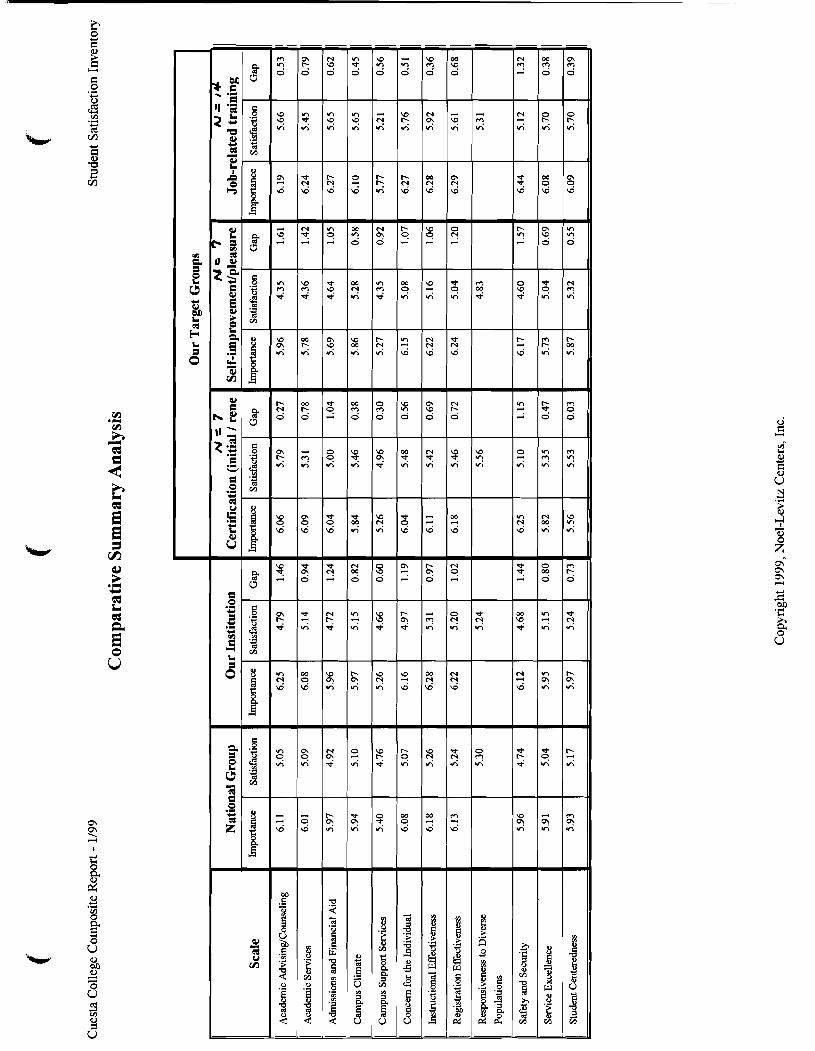
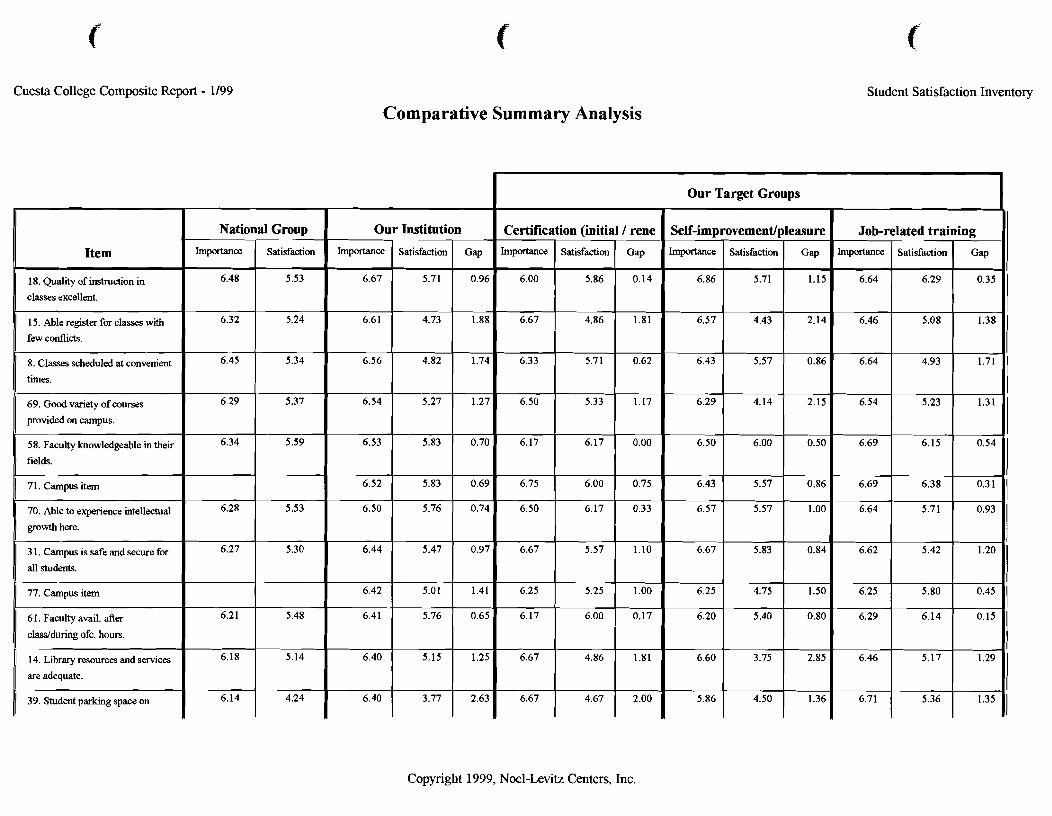
Cuesta College Composite Report - 1/99
National Group
18. Quality of instruction in
classes excellent.
15. Able register for classes with
few conflicts. 1 6.32 1 J24 8. Classes scheduled at convenient
times. 1 6.45 I 69. Good variety of courses
provided on campus. 1 6-29 I 5'37
58. Faculty knowledgeable in their
fields. I 6'34 I 5'59
71. Campus item I I I
all students. I I
70. Able to experience intellectual 6.28
growth here.
3 1. Campus is safe and secure for
I I --
77. Campus item
5.53
6.27 5.30
6 1. Faculty avail. after
class/during ofc. hours.
are adequate. I I
I I
6.21
14. Library resources and services 6.18
Comparative Summary Analysis
5.48
5.14
39. Student parking space on
Student Satisfaction Inventory
Our 'I
I
-
Self-imp
Im-=
6.14
arget Groups
1
4.24
Copyright 1999, Noel-Levitz Centers, Inc.
I ling
Gap
0 . 3 ~ -
0'14
0,31 - 0'93
- 0.45
0.15
I I I 1 1 1 I I 1 I I I
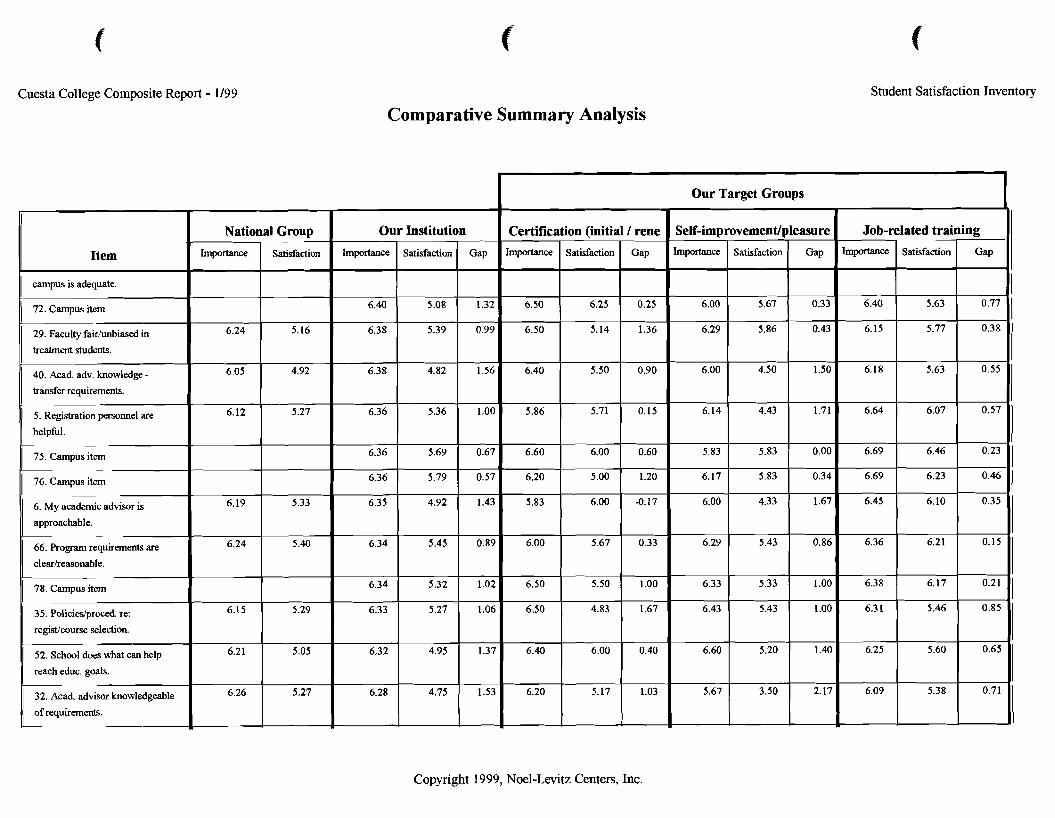
Cuesta College Composite Report - 1/99 Student Satisfaction Inventory
Comparative Summary Analysis
I Our Target Groups I
Copyright 1999, Noel-Levitz Centers, Inc.
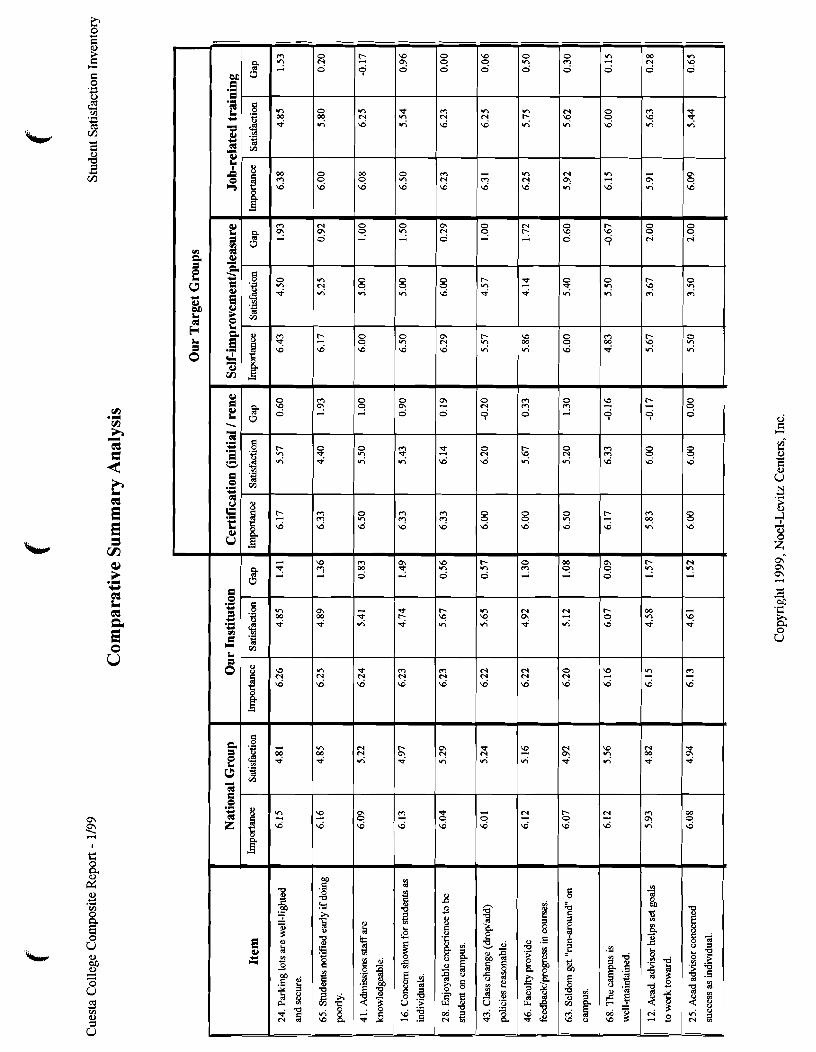
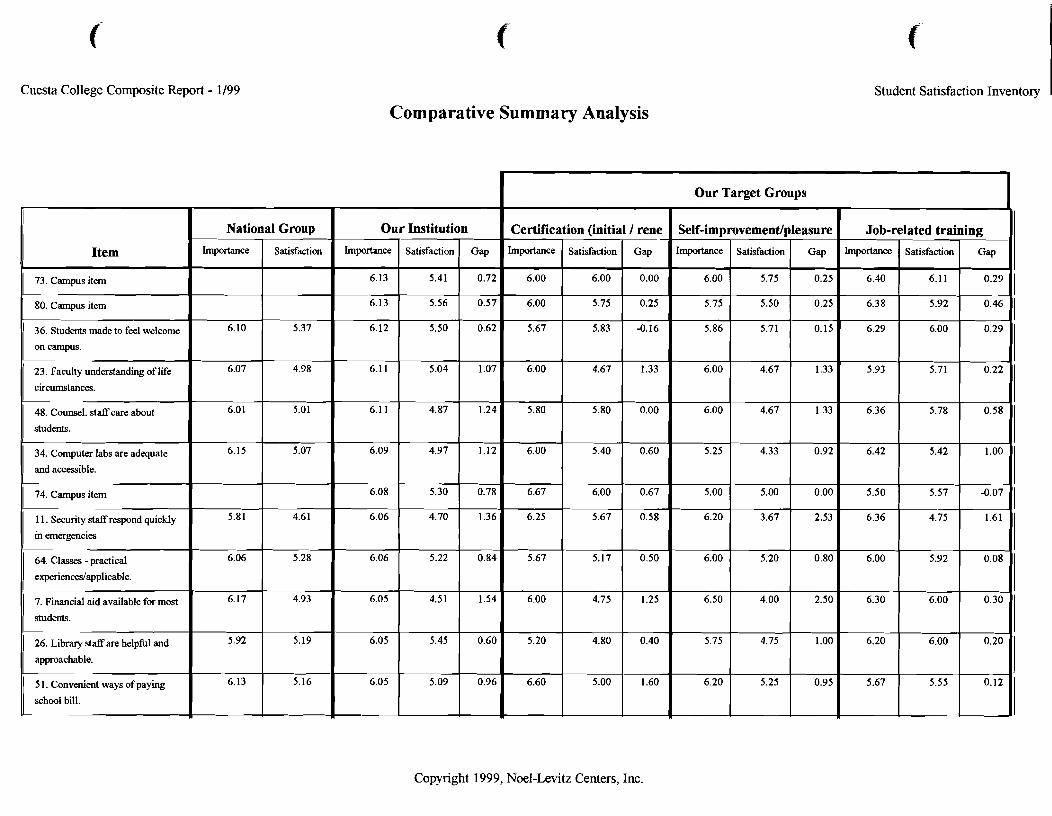
Cuesta College Composite Report - 1/99
Comparative Summary Analysis Student Satisfaction Inventory
Our Target Groups
Copyright 1999, Noel-Levitz Centers, Inc.
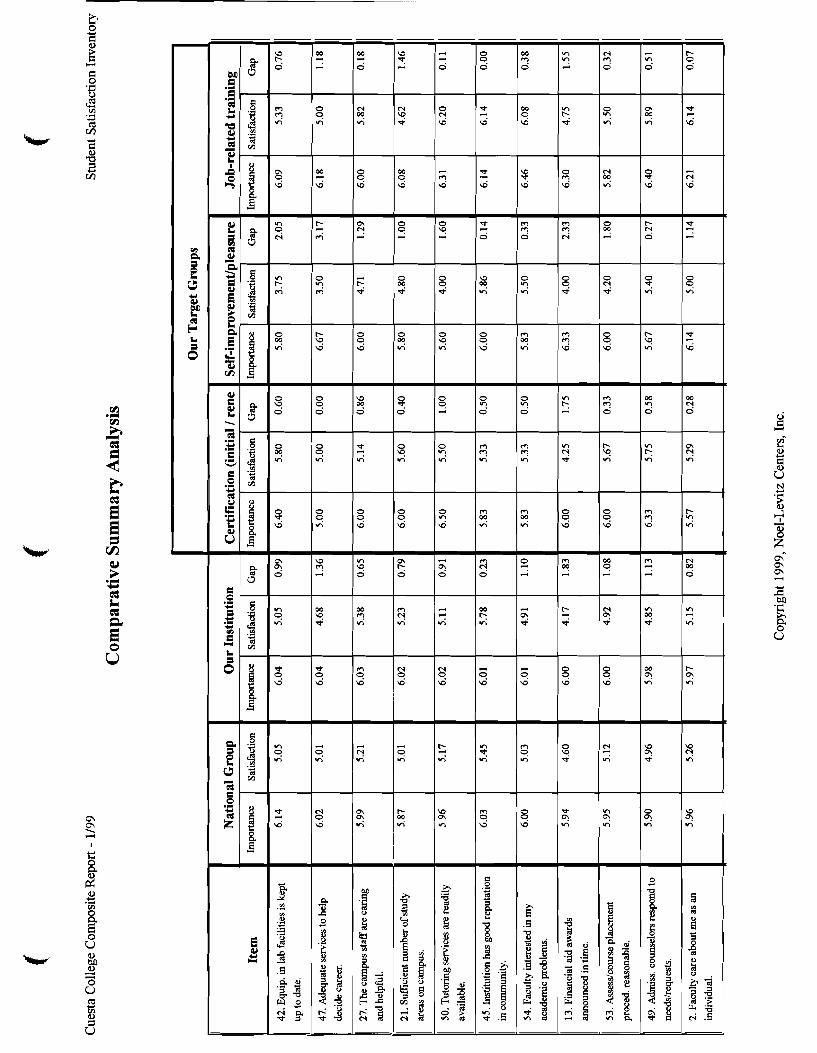
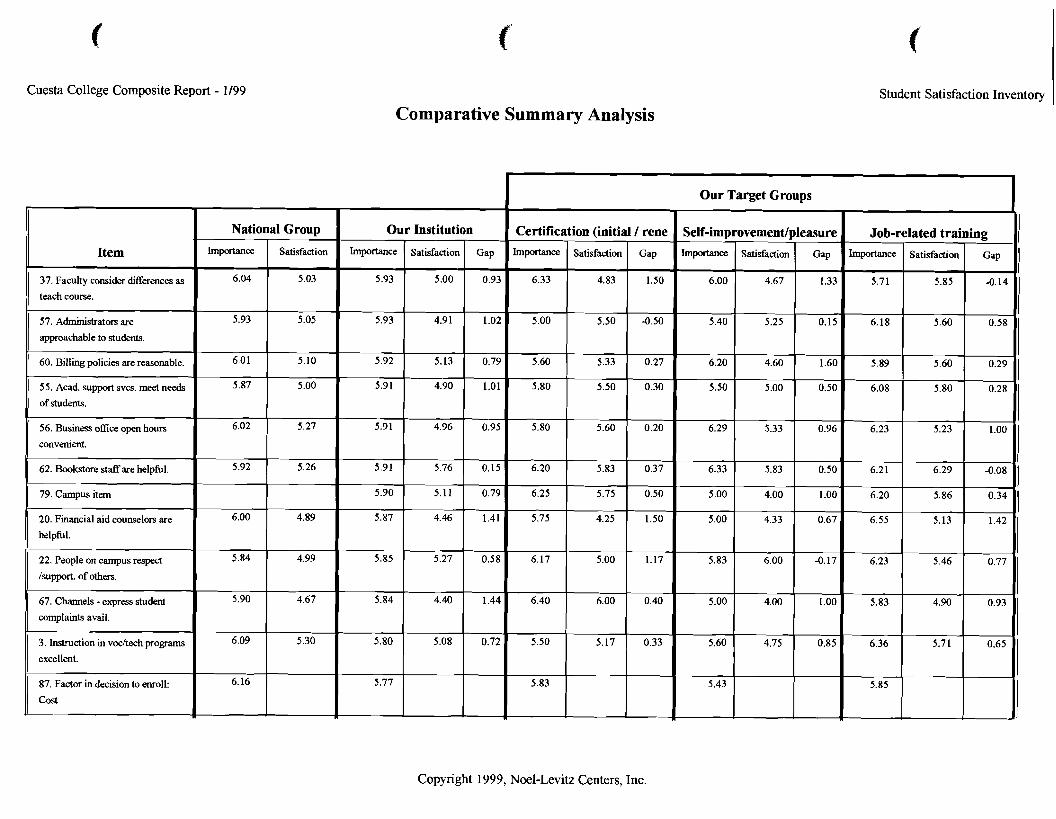
Cuesta College Composite Report - 1/99
Item
37. Faculty consider differences as
teach course.
57. Administrators are
approachable to students.
60. Billing policies are reasonable.
I 5 5. Acad. support svcs. meet needs
of students.
I 56. Business office open hours
convenient.
11 62. Bookstore M a r e helpful.
79. Campus item
20. Financial aid counselors are
helpful.
22. People on campus respect
/support. of others.
67. Channels - express student
complaints avail.
3. Instruction in vochech programs
excellent.
87. Factor in decision to enroll:
Cost
Comparative Summary Analysis
National Group I Our Institution
Student Satisfaction Inventory I
Our Target Groups
I I I
Copyright 1999, Noel-Levitz Centers, Inc.

Cuesta College Composite Report - 1/99
Comparative Summary Analysis Student Satisfaction Inventory
I Our Target Groups I
Copyright 1999, Noel-Levitz Centers, Inc.
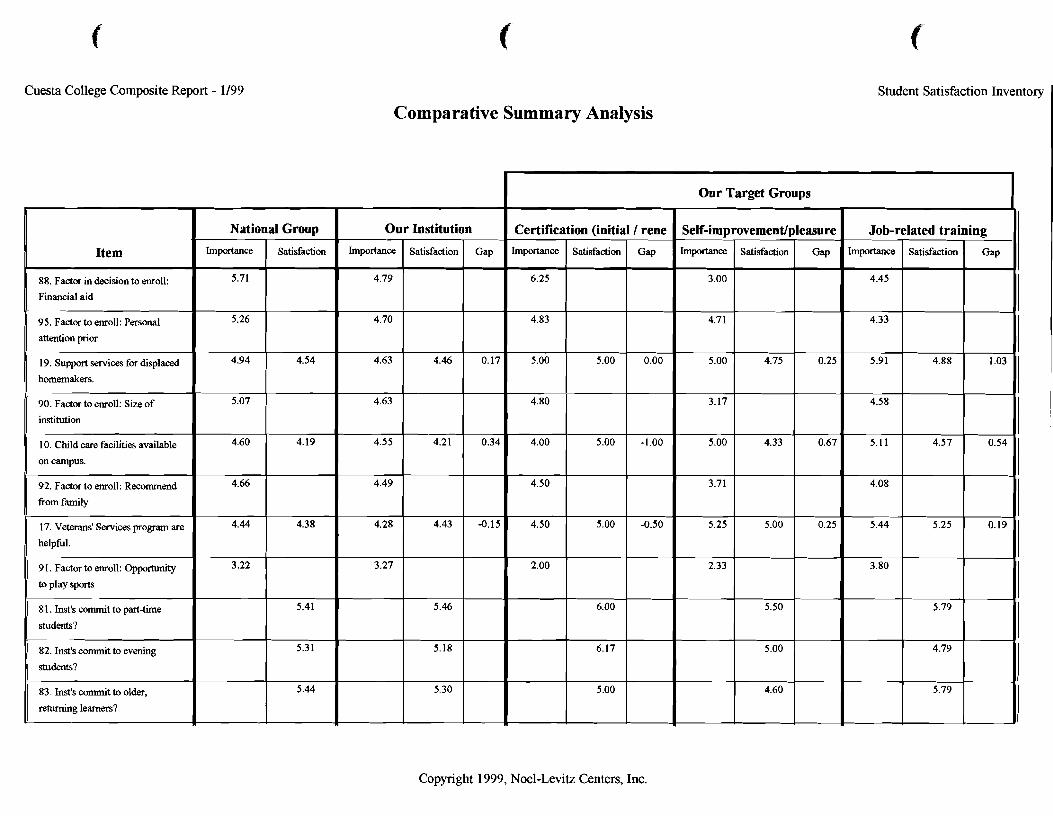
Cuesta College Composite Report - 1/99
Comparative Summary Analysis Student Satisfaction Inventory ,
I Our Target Groups I
Copyright 1999, Noel-Levitz Centers, Inc.
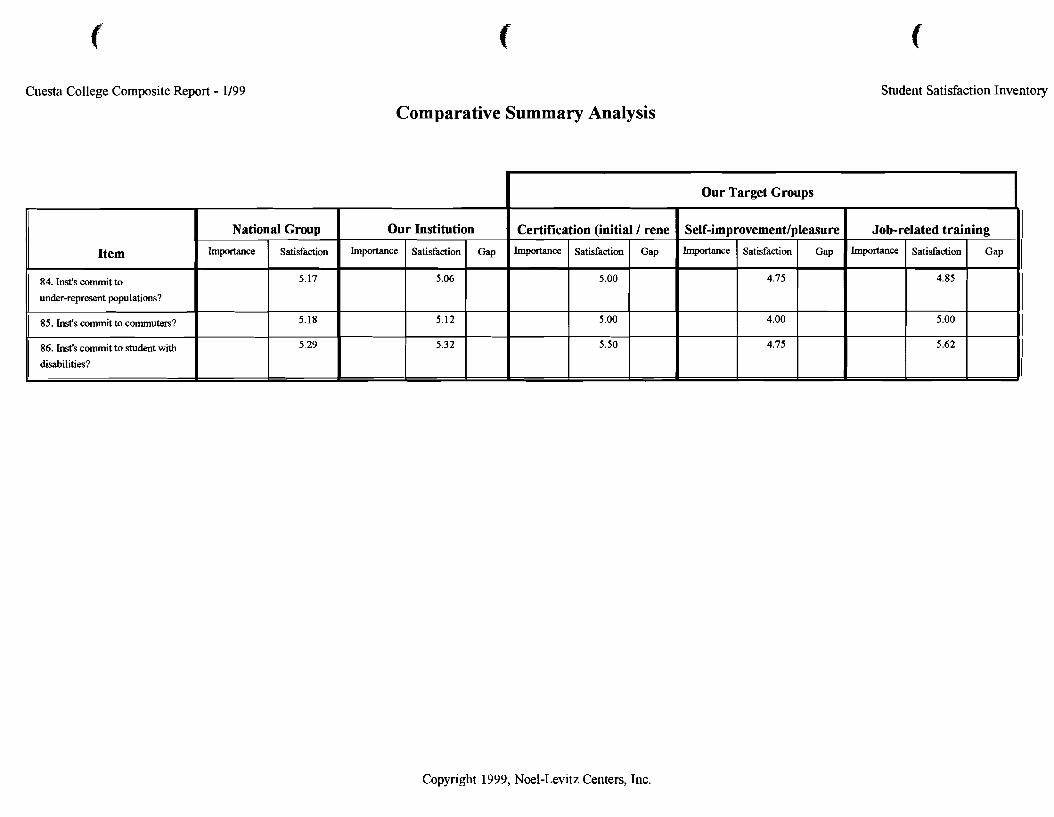
Cuesta College Composite Report - 1/99
Comparative Summary Analysis Student Satisfaction Invento~y
Copyright 1999, Noel-Levitz Centers, Inc.
Our Target Groups
Item
84. Inst's wmmit to
under-represent populations?
I 85. Inst's commit to commuters?
86. Inst's commit to student with
disabilities?
Our Institution Certification (initial / rene National Group
Importance Importance Gap
Self-improvement/pleasure
Satisfaction
5.17
5.18
5.29
Satisfaction
5.06
5.12
5.32
Importance
Job-related training Importance Gap Satisfaction
5.00
5.00
5.50
Gap Satisfaction
4.75
4.00
4.75
Importance Gap Satisfaction
4.85
5.00
5.62

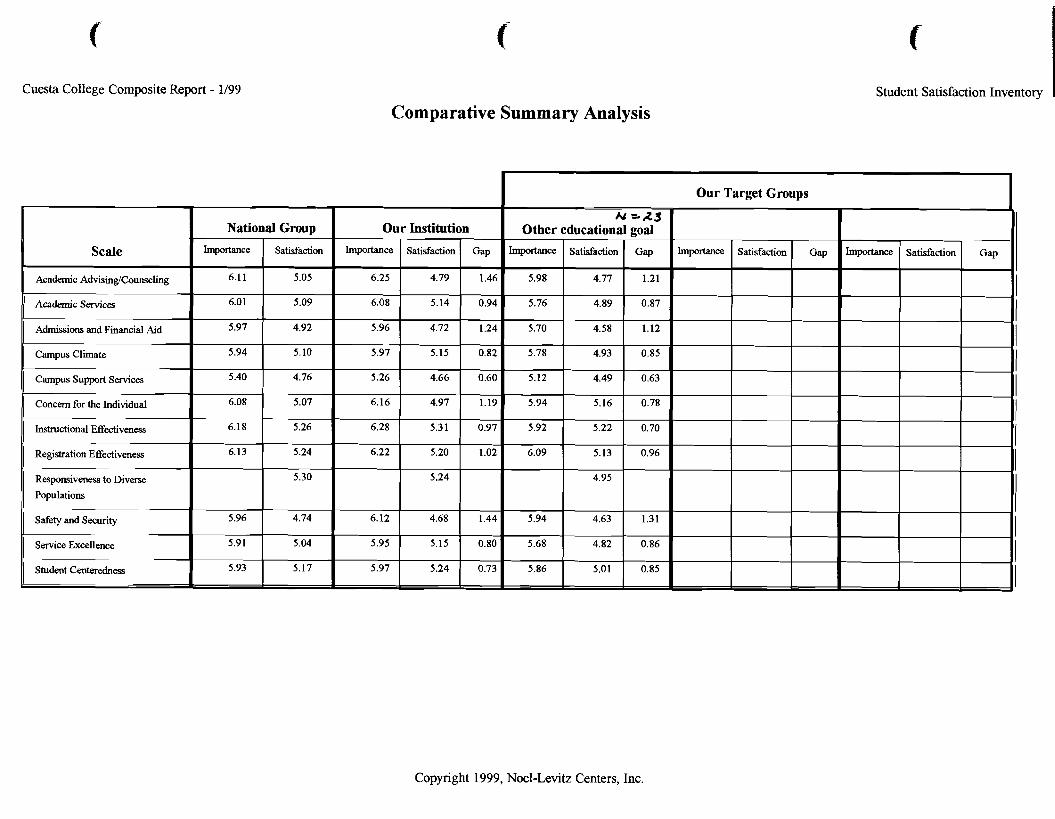
Cuesta College Composite Report - 1/99
Scale
Academic Services I~ )ions and Financial Aid
I I
5.97 4.92 . I
Campus Climate 1 I 5.94 5.10
11 campus support senices ( 5.40 1 4.76 I 1 I
1 Concern for the Individual 6.08 5.07 I I
Instructional Effectiveness 1 6.18 5.26
Responsiveness to Diverse
Populations
11 safety and security 1 5.96 1 4.74
Comparative Summary Analysis
Our Institution
Importance I Satisfaction I Gap
Student Satisfaction Inventory I
I Our Target Groups I E
Other educationa -
m c e 1 satisfaction
Copyright 1999, Noel-Levitz Centers, Inc.
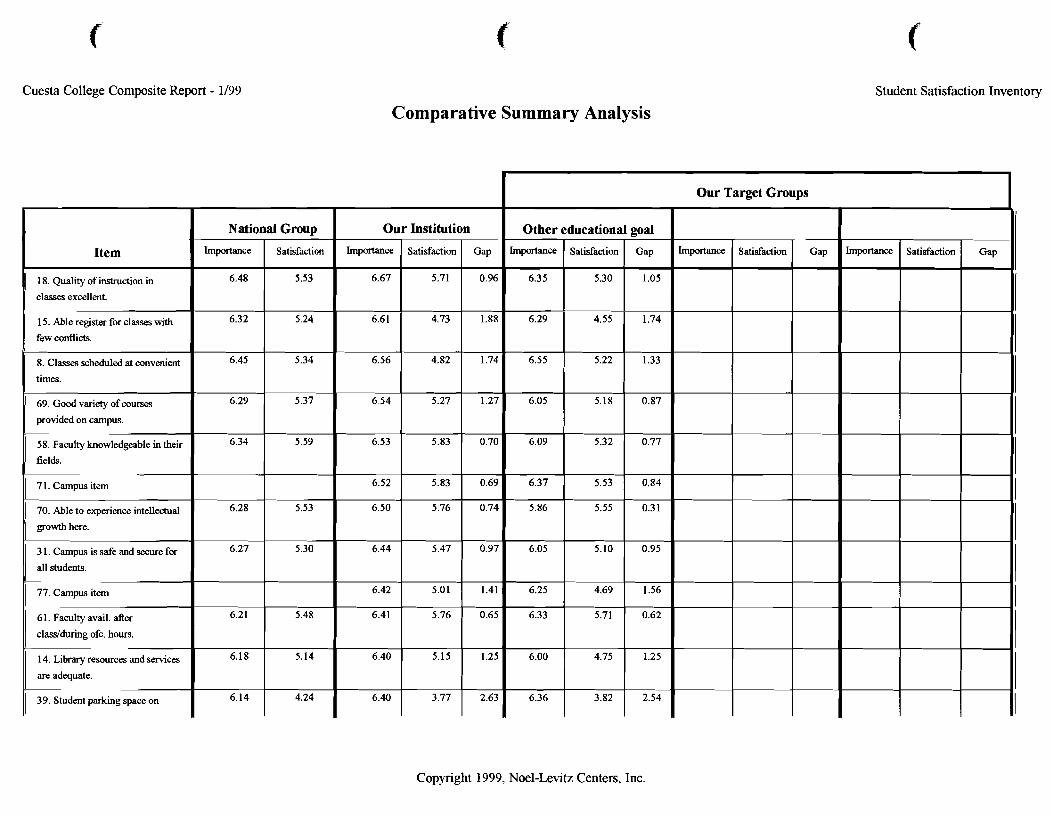
Cuesta College Composite Report - 1/99
Comparative Summary Analysis Student Satisfaction Inventory
Our Target Groups
Copyright 1999, Noel-Levitz Centers, Inc.
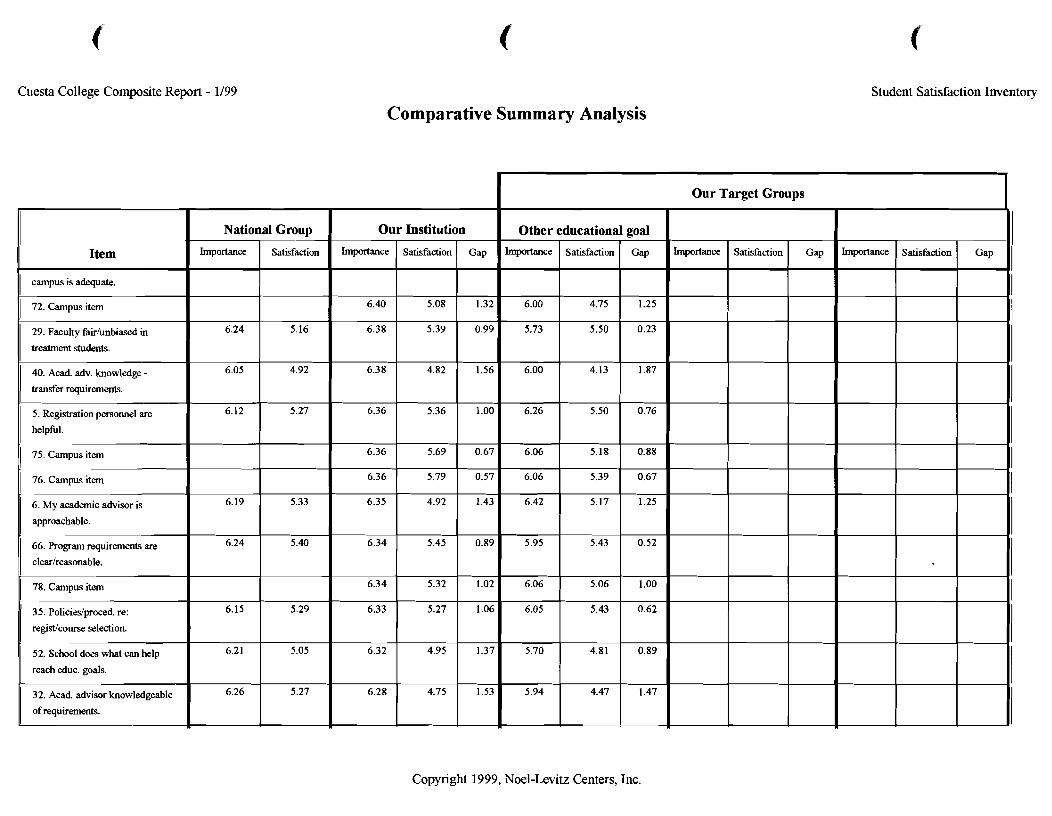
Cuesta College Composite Report - 1/99 Student Satisfaction Inventoq
Comparative Summary Analysis
Copyright 1999, Noel-Levitz Centers, Inc.
Item
I campus is adequate.
1 72. Campus item
29. Faculty fairlunbiased in
treatment students.
40. Acad. adv. knowledge - transfer requirements.
5. Registration personnel are
helpful.
1 75. campus item
1 76. Campus item
6. My academic advisor is
approachable.
66. Program requirements are
clearlreasonable.
1 78. Campusitem
35. Policiedproced. re:
regidcourse selection.
52. School does what can help
reach educ. goals.
32. Acad. advisor knowledgeable
of requirements. -
Our
Importance
6.40
6.38
6.38
6.36
6.36
6.36
6.35
6.34
6.34
6.33
6.32
6.28
Other
hportance
6.00
5.73
6.00
6.26
6.06
6.06
6.42
5.95
6.06
6.05
5.70
5.94
National
Importance
6.24
6.05
6.12
6.19
6.24
6.15
6.21
6.26
Group
Satisfaction
5.16
4.92
5.27
5.33
5.40
5.29
5.05
5.27
Institution
Satisfaction
5.08
5.39
4.82
5.36
5.69
5.79
4.92
5.45
5.32
5.27
4.95
4.75
educational
Satisfaction
4.75
5.50
4.13
5.50
5.18
5.39
5.17
5.43
5.06
5.43
4.81
4.47
-.
Our Target Groups
Gap
1.32
0.99
1.56
1.00
0.67
0.57
1.43
0.89
1.02
1.06
1.37
1.53
goal
Gap
1.25
0.23
1.87
0.76
0.88
0.67
1.25
0.52
1.00
0.62
0.89
1.47
hportance Gap Importance Satisfaction Satisfaction Gap
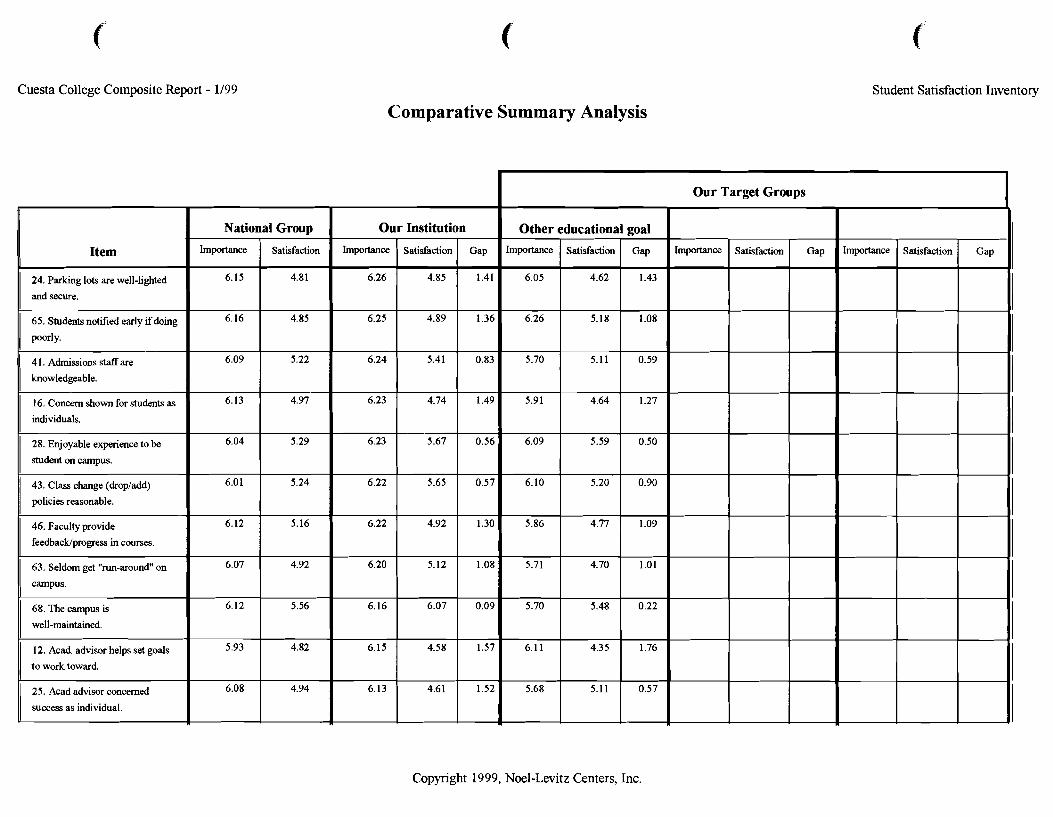
Cuesta College Composite Report - 1/99
Comparative Summary Analysis Student Satisfaction Inventory
I Our Target Groups I
Copyright 1999, Noel-Levitz Centers, Inc.
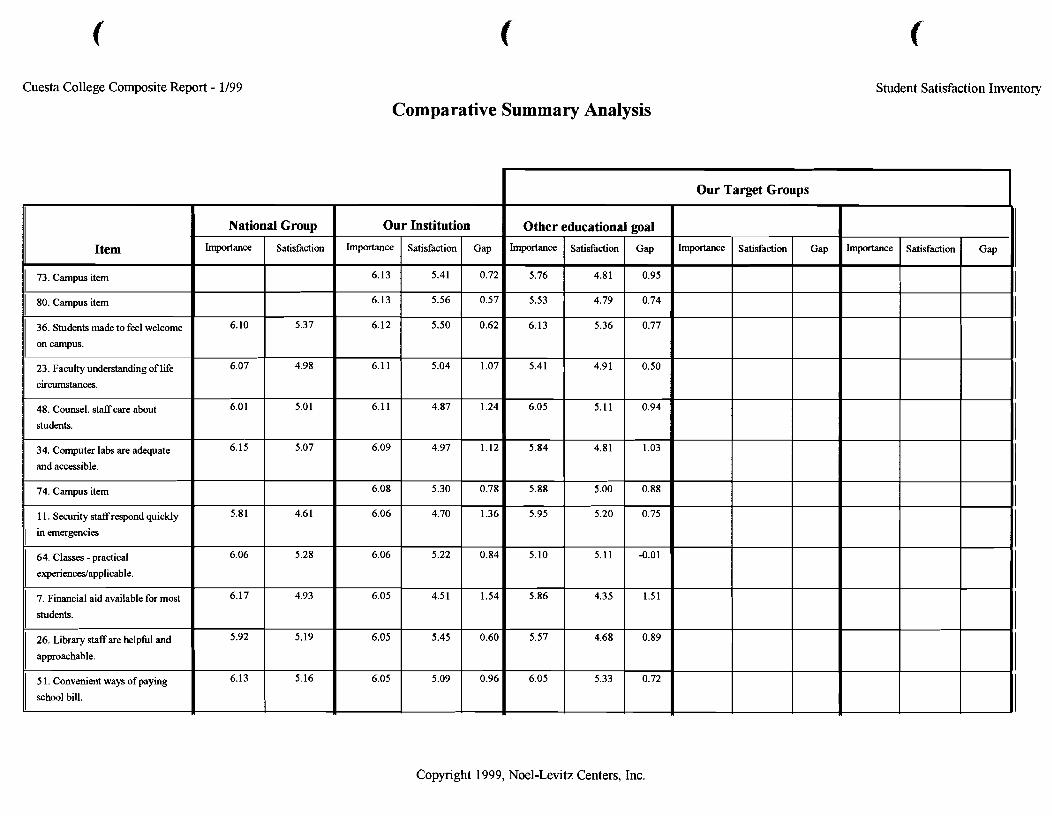
Cuesta College Composite Report - 1/99 Student Satisfaction Inventory
Comparative Summary Analysis
Copyright 1999, Noel-Levitz Centers, Inc.
Item
I 73. campus item
I 80. Campus item
36. Students made to feel welcome
on campus.
23. Faculty understanding of life
circumstances.
48. Counsel. staff care about
students.
34. Computer labs are adequate
and accessible.
74. Campus item
1 1. Security staff respond quickly
in emergencies
64. Classes - practical
experiences~applicable.
7. Financial aid available for most
students.
26. Library staffare helplid and
approachable.
5 1. Convenient ways of paying
school bill.
I
National
Importance
6.10
6.07
6.0 1
6.15
5.81
6.06
6.17
5.92
6.13
Other
hportance
5.76
5.53
Our
Importance
6.13
6.13
6.12
6.1 1
6.11
6.09
6.08
6.06
6.06
6.05
6.05
6.05
Group
Satisfaction
5.37
4.98
5.01
5.07
4.6 1
5.28
4.93
5.19
5.16
6.13
5.41
6.05
5.84
5.88
5.95
5.10
5.86
5.57
6.05
educational
Satisfaction
4.81
4.79
Our Target Groups
Institution
Satisfaction
5.41
5.56
5.50
5.04
4.87
4.97
5.30
4.70
5.22
4.5 1
5.45
5.09
goal
Gap
0.95
0.74
5.36
4.91
5.11
4.81
5.00
5.20
5.1 1
4.35
4.68
5.33
hnpatance Importance Gap
0.72
0.57
0.62
1.07
1.24
1.12
0.78
1.36
0.84
1.54
0.60
0.96
0.77
0.50
0.94
1.03
0.88
0.75
-0.01
1.51
0.89
0.72
Satisfaction Satisfaction Gap Gap
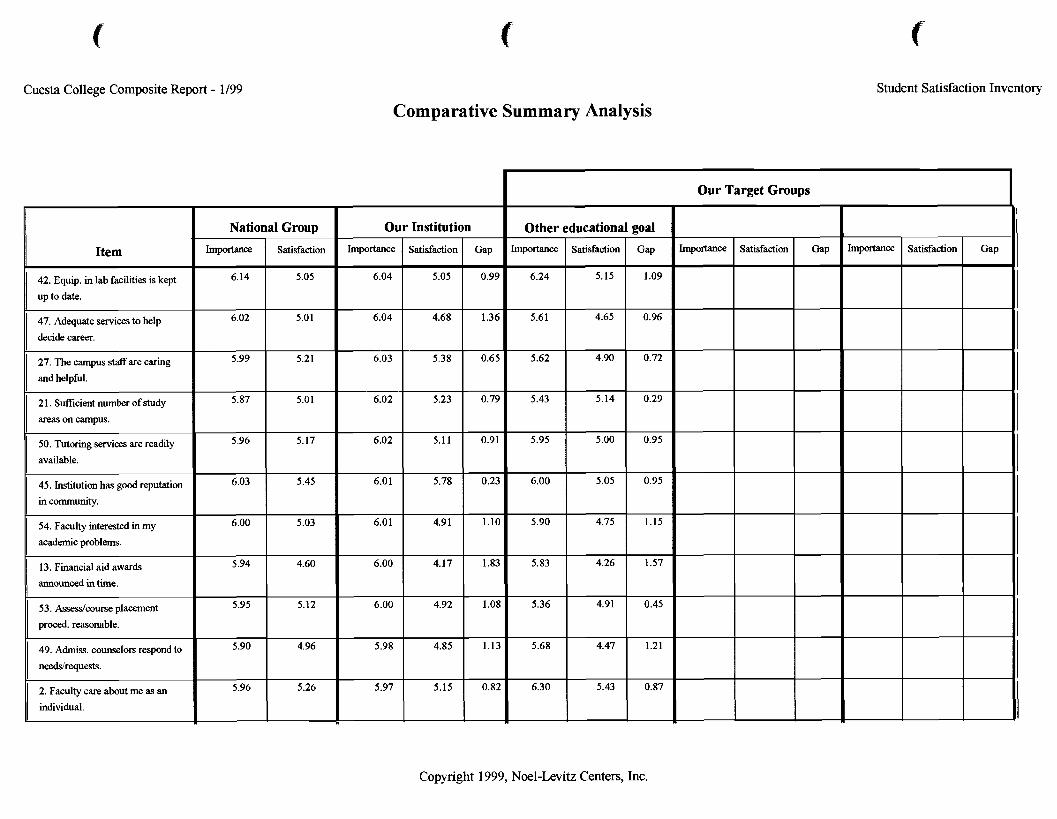
Cuesta College Composite Report - 1/99
Comparative Summary Analysis Student Satisfaction Inventory
I Our Target Groups I
Copyright 1999, Noel-Levitz Centers, Inc.
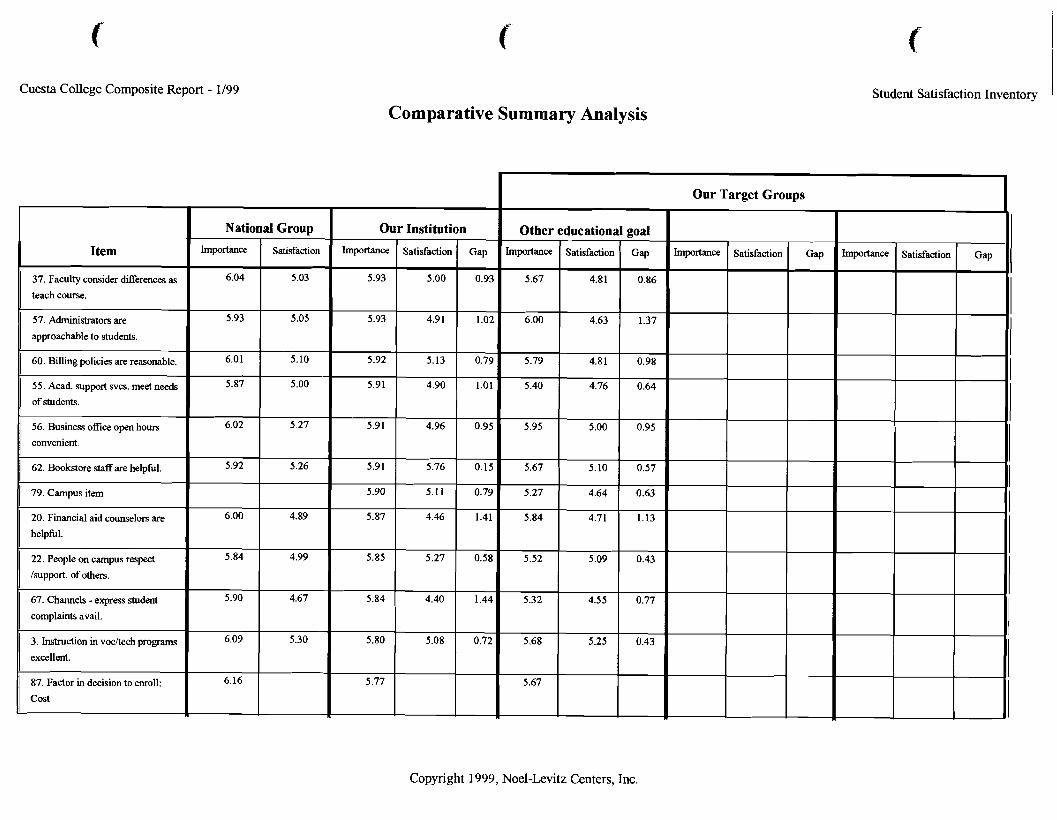
Cuesta College Composite Report - 1/99
Comparative Summary Analysis Student Satisfaction Inventory I
Copyright 1999, Noel-Levitz Centers, Inc.
Item
37. Faculty consider differences as
teach course.
57. Administrators are
approachable to students.
1 60. Billing policies are reasonable.
55. Acad. support svcs. meet needs
of students.
56. Business ofice open hours
convenient.
I 62. Bookstore care helpful.
I 79. campus item
20. Financial aid counselors are
helpful.
Our Target Groups I
22. People on campus respect 5.84 4.99
/support. of others.
67. Channels - express student 5.90 4.67
complaints avail. ----
3. Instruction in vochech programs 6.09 5.30
excellent.
87. Factor in decision to enroll: 6.16
National Group Other Importance
5.67
6.00
5.79
5.40
5.95
5.67
5.27
5.84
5.52
5.32
5.68
5.67
6.04
5.93
6.01
5.87
6.02
5.92
6.00
Our
Importance
5.93
5.93
5.92
5.91
5.91
5.91
5.90
5.87
------
Satisfaction
5.03
5.05
5.10
5.00
5.27
5.26
4.89
5.85
5.84
5.80
5.77
educational
Satisfaction
4.81
4.63
4.81
4.76
5.00
5.10
4.64
4.71
5.09
4.55
5.25
Importance
Institution
Satisfaction
5.00
4.9 1
5.13
4.90
4.96
5.76
5.11
4.46
goal
Gap
0.86
1.37
0.98
0.64
0.95
0.57
0.63
1.13
0.43
0.77
0.43
I
Gap
0.93
1.02
0.79
1.01
0.95
0.15
0.79
1.41
5.27
4.40
5.08
Satisfaction Importance
0.58
1.44
0.72
Gap Satisfaction Gap
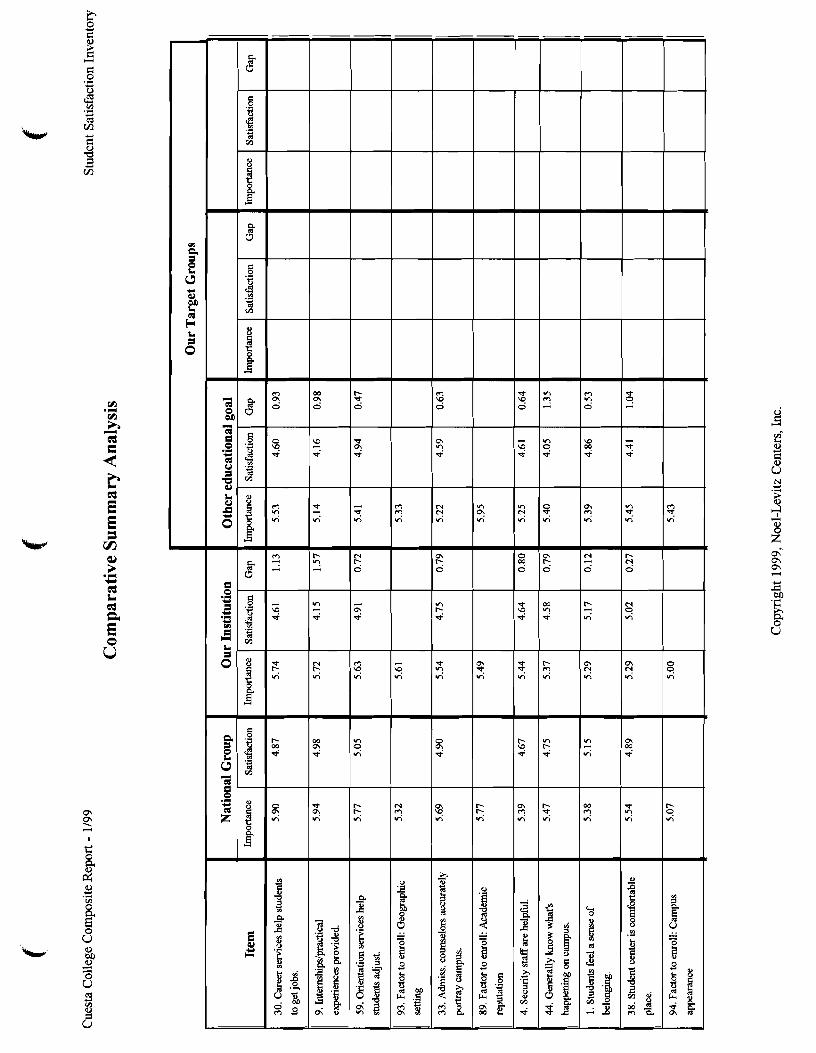
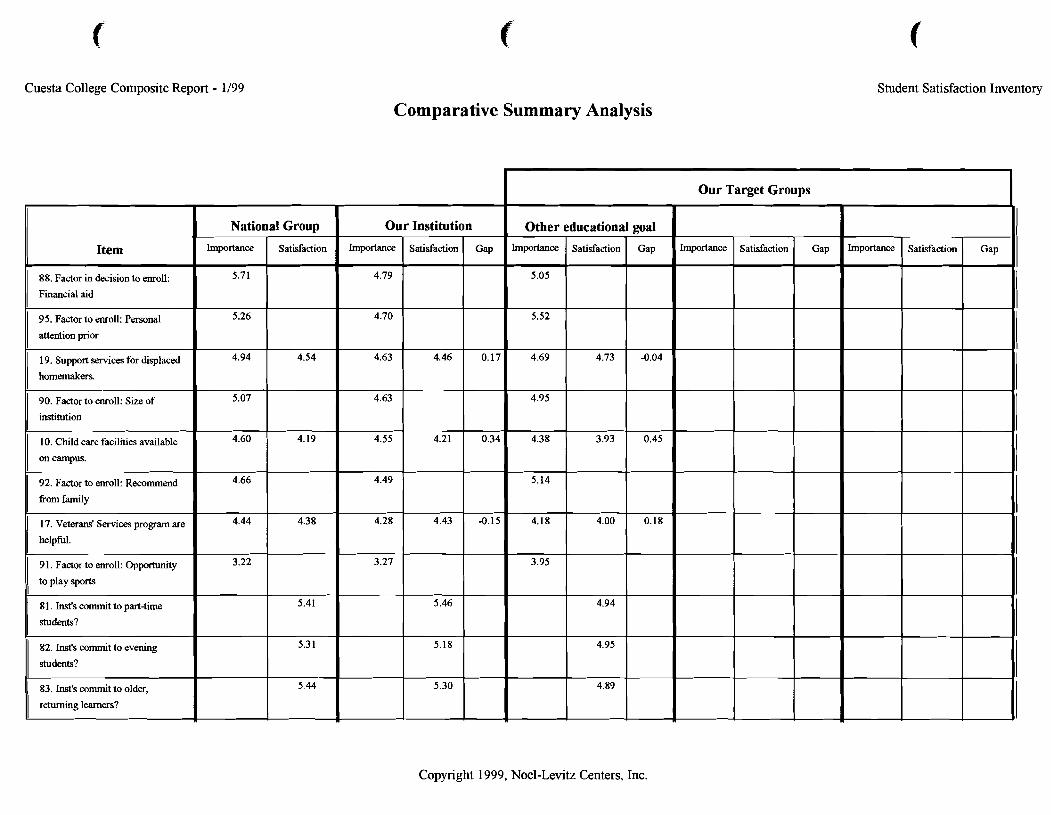
Cuesta College Composite Report - 1/99
Comparative Summary Analysis Student Satisfaction Inventory
Copyright 1999, Noel-Levitz Centers, Inc.
Item
88. Factor in decision to enroll:
Financial aid
95. Factor to enroll: Personal
attention prior
19. Support services for displaced
homemakers.
90. Factor to enroll: Size of
institution
10. Child care facilities available
on campus.
92. Factor to enroll: Recommend
fiom family
17. Veterans' Services program are
helpful.
9 1. Factor to enroll: Opportunity
to play sports
8 1. Inst's commit to part-time
students?
82. Inst's commit to evening
students?
83. Inst's commit to older,
returning learners?
Our Target Groups I Our
Importance
4.79
4.70
4.63
4.63
4.55
4.49
4.28
3.27
National
Importance
5.71
5.26
4.94
5.07
4.60
4.66
4.44
3.22
Institution
Satisfaction
4.46
4.21
4.43
5.46
5.18
5.30
Importance
Group
Satisfaction
4.54
4.19
4.38
5.41
5.3 1
5.44
Other Importance
5.05
5.52
4.69
4.95
4.38
5.14
4.18
3.95
Gap
0.17
0.34
-0.15
Satisfaction
educational
Satisfaction
4.73
3.93
4.00
4.94
4.95
4.89
Gap Importance
goal
Gap
-0.04
0.45
0.18
Satisfaction Gap
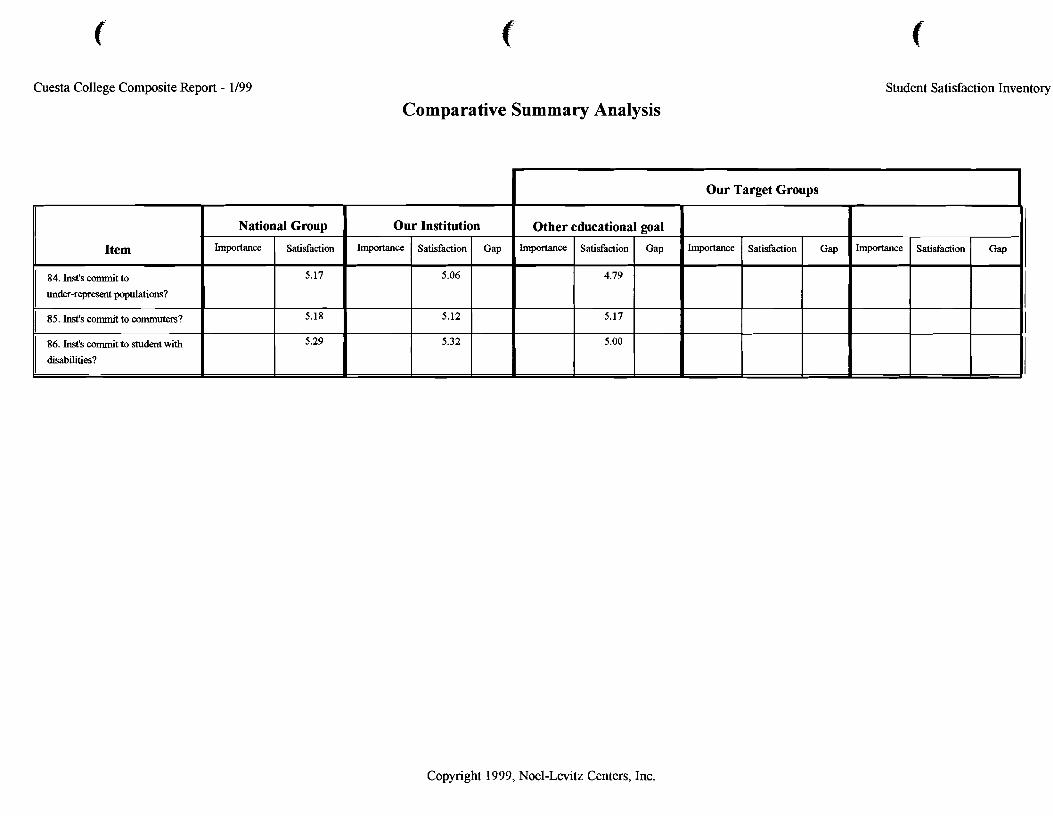
Cuesta College Composite Report - 1/99
Comparative Summary Analysis Student Satisfaction Inventory
I Our Target Groups I
Copyright 1999, Noel-Levitz Centers, Inc.
Item
84. Inst's cormnit to
under-represent populations?
I 85. Inst's commit to commuters?
86. Inst's commit to student with
disabilities?
National Group Importance Satisfaction
5.17
5.18
5.29
Our Institution
Importance
Other educational goal
Satisfaction
5.06
5.12
5.32
Importance Gap Importance Satisfaction
4.79
5.17
5.00
l q m a n c e Gap Satisfaction Gap Satisfaction Gap
g Priorities and Direction
lent Satisfaction
Setting Priorities and Direction
Now that you've identified the expectations of your students, you are ready to take the next critical step.
To effectively impact your campus, you'll want to focus on key campus issues that have been brought to light by this report, then proceed to develop awareness, increase readiness for action planning, and ultimately, design and implement your action agenda.
There are a variety of ways that campuses like yours are telling us they are using the Student Satisfaction Inventory data. These include:
Setting a retention agenda
Providing feedback to faculty, staff, and administrators
Marketing the institution
Strategic planning
Providing feedback to students
Preparing self-study materials for accreditation
Influencing budget decisions
Enhancing total quality management
Pinpointing the specific expectations of different ethnic groups
Targeting specific needs of on-campus residence vs. commuters
Providing direction to individual departments/majors/programs
Determining the satisfaction levels of special populations, including nontraditional students, part-time students, and students with disabilities
Institutions are telling us that sharing the information with all campus constituen- cies is important to begin the improvement process. It is important to balance the identified strengths and weaknesses when disseminating the information. Cabinet and trustee meetings, faculty meetings, committee sessions, the student newspaper and the student government are all vehicles being utilized on campuses to share the data and to begin assembling feedback. Further discussion in focus group sessions is a popular method to provide additional clarification of particular items and to begin problem-solving in targeted areas. (Campuses combining the use of the Student Satisfaction Inventory with the Institutional Priorities Survey focus first on those issues identified as priorities for action by both students and campus personnel.)
Copyright 2002, USA Group Noel-Levitz, Inc.
The process for improvemeilt can itself have a tremendous impact on your campus climate as you involve students, faculty, administration and staff in creating and implementing solutions.
As you move ahead, you are now in the best position to make significant gains in meeting your students' expectations because you know precisely where, and where not, to focus your time, money and effort. Setting priorities is easier than it was before, because no matter which efforts you apply these findings to, you know exactly what matters to your students.
For additional assistance in determining next steps, feel free to call Noel-Levitz at 800-876-1 117. Or e-mail [email protected] to arrange for a convenient time to meet.
Copyright 2002, USA Group Noel-Levitz, Inc.