springer handbook of medical technology - readingsample
TRANSCRIPT

Springer Handbooks
Springer Handbook of Medical Technology
Bearbeitet vonRüdiger Kramme, Klaus-Peter Hoffmann, Robert Pozos
1. Auflage 2011. Buch. xcvi, 1497 S. HardcoverISBN 978 3 540 74657 7
Format (B x L): 19,3 x 24,2 cm
Weitere Fachgebiete > Technik > Sonstige Technologien, Angewandte Technik >Medizintechnik
schnell und portofrei erhältlich bei
Die Online-Fachbuchhandlung beck-shop.de ist spezialisiert auf Fachbücher, insbesondere Recht, Steuern und Wirtschaft.Im Sortiment finden Sie alle Medien (Bücher, Zeitschriften, CDs, eBooks, etc.) aller Verlage. Ergänzt wird das Programmdurch Services wie Neuerscheinungsdienst oder Zusammenstellungen von Büchern zu Sonderpreisen. Der Shop führt mehr
als 8 Millionen Produkte.
95
Pulmonary Fu8. Pulmonary Function Testing
Rolf M. Schlegelmilch, Rüdiger Kramme
Pulmonary function tests (PFT) examine the func-
tionality of the lungs. This chapter describes the
working principles of major test techniques and
instruments including spirometry, peak flowmetry,
body plethysmography, nitrogen washout, and er-
gospirometry. Spirometry (Sect. 8.1), specifically the
measurement of the amount (volume) and speed
(flow) of air that can be inhaled or exhaled, is the
most basic of the pulmonary function tests. Body
plethysmography (Sect. 8.2.2) offers determination
of absolute lung volume and airway resistance
and is particularly sensitive in the detection of
obstructive pulmonary disease requiring little pa-
tient cooperation. Nitrogen washout (Sect. 8.2.4) is
a common test for measuring functional residual
lung capacity. Ergospirometry evaluates the com-
plex interaction between lung, heart, and muscle
by analysing the gas exchange under exercise
(Sect. 8.2.5). The chapter closes with considerations
of planning and laboratory space (Sect. 8.2.8).
8.1 Spirometry ........................................... 958.1.1 Flow Recording ............................ 968.1.2 Technology .................................. 968.1.3 Methodology of Spirometry ........... 1018.1.4 Cooperation-Free Pulmonary
Function Tests.............................. 104
8.2 Advanced CardiopulmonaryFunction Testing................................... 1058.2.1 Overview ..................................... 1058.2.2 Body Plethysmography ................. 1068.2.3 Diffusion Capacity ........................ 1098.2.4 Nitrogen-Washout Test
for Determination of FRC ............... 1118.2.5 Ergospirometry ............................ 1118.2.6 Noninvasive Determination
of Cardiac Output ......................... 1148.2.7 Metabolic Activity Monitoring ........ 1158.2.8 Planning and Laboratory Space
Considerations ............................. 116
References .................................................. 116
8.1 Spirometry
Spirometers are noninvasive diagnostic instruments forscreening and basic testing of pulmonary function. Of-fering essential diagnostic insight into the type andextent of lung function impairment, spirometry testscan be performed fast at fairly low cost. In the lightof an ever-increasing prevalence of airway diseasessuch as asthma, bronchitis, and emphysema, pulmonaryfunction instruments have become indispensable diag-nostic tools, in clinical and office settings, in industrialand preventive medicine, as well as in epidemiology.Screening of individuals at risk, basic testing of sick pa-tients, and treatment follow-up are key applications ofspirometry.
Two essential questions of pulmonary function test-ing (PF testing) can be answered by spirometry:
1. What is the size of lung volume which can be in-spired or expired?
2. What is the time it takes to exhale this volume, orwhat is the flow rate during exhalation?
Flow rates and resulting volumes are measured byconnecting a spirometry sensor through a mouthpieceto the test subject’s mouth. The most common and in-ternationally standardized test consists of an evaluationof forced expiration after a complete inhalation, allow-ing the determination of forced vital capacity (FVC)
PartB
8
96 Part B Functional Diagnostics Devices
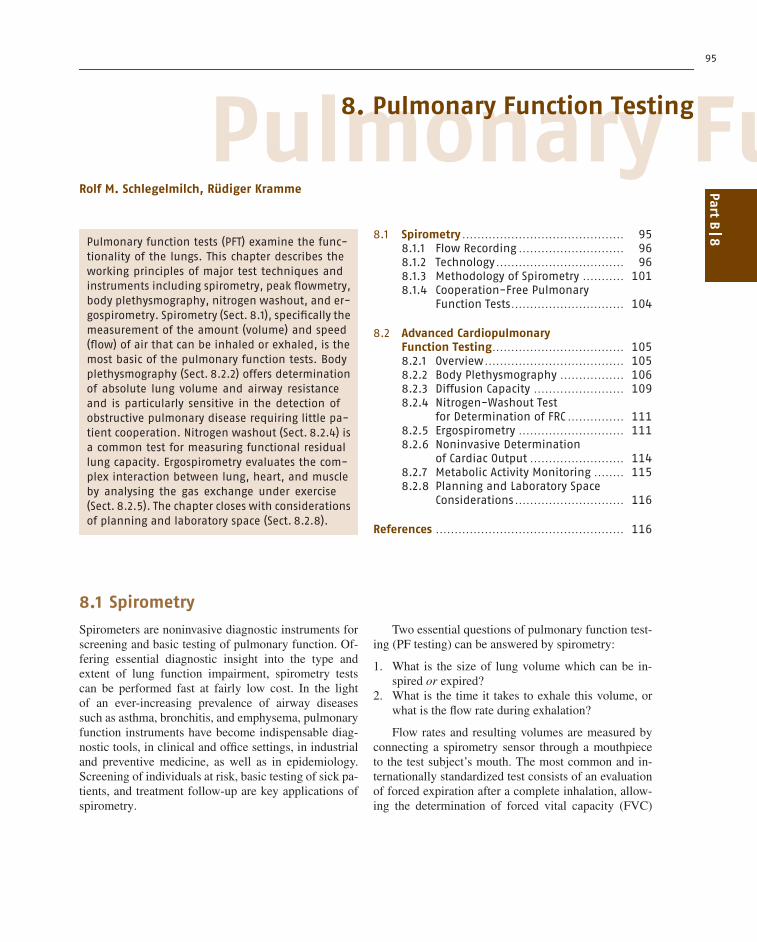
Volume-time spirogram Flow-volume loop
IVC = Inspiratory vital capacityIC = Inspiratory capacityVT = Tidal volumeIRV = Inspiratory reserve volumeERV = Expiratory reserve volumeFVC = Forced vital capacityFEV
1 = Forced expiratory volume in one second
PEF = Peak expiratory flowFEF25 = Forced expiratory flow when 25% of the FVC has been expiredFEF50 = Forced expiratory flow when 50% of the FVC has been expiredFEF25 = Forced expiratory flow when 75% of the FVC has been expiredPIF = Peak inspiratory flow
FEV1% = FEV
1 in % of vital capacityExpiration
V (l)
Flow(l/s)
PEFFEF25
FEF50
FEF75
FVC
Volume (l)
Flow(l /s)
EX
IN
IRVICVCIN
VT ERV
FEV1
t (s)
FVC
EVC
1
b)a)
Fig. 8.1 (a) Forced spirogram and (b) flow–volume loop
and the forced expired volume during the first sec-ond (FEV1). Recording of the test trace is taken asa forced spirogram (volume over time) or as a flow–volume loop (flow against volume). Although FVC andFEV1 are the most common, dozens of parameters canbe derived when evaluating forced expiration, all de-scribing the shape and size of recorded traces and loops(Fig. 8.1). Besides forced spirometry, slow spirometry,i.e., the recording of slow inspiration and expiration attidal breathing, may also be recorded, offering determi-nation of lung-volume subdivisions such as tidal volume(VT), inspiratory and expiratory reserve volume (IRVand ERV), as well as inspiratory capacity (IC). In mostcases, slow spirometry will be a part of advanced PFtests (Sect. 8.2.2).
8.1.1 Flow Recording
The basis of all PF tests consists in the recording ofair flow rates against time, a procedure also calledpneumotachography. Mostly, flow velocity [cm/s] ismeasured in a defined sensor geometry, yielding flow[l/s], also referred to as flow rate. In 1925 the Swissphysiologist Alfred Fleisch published about the clinicalapplication of pneumotachography. While registrationof spirometry traces and flow–volume loops requireda recorder and manual evaluation in the past, allcontemporary spirometers contain microprocessors foronline data processing, displaying results on a built-in screen or transferring data to a personal computer.
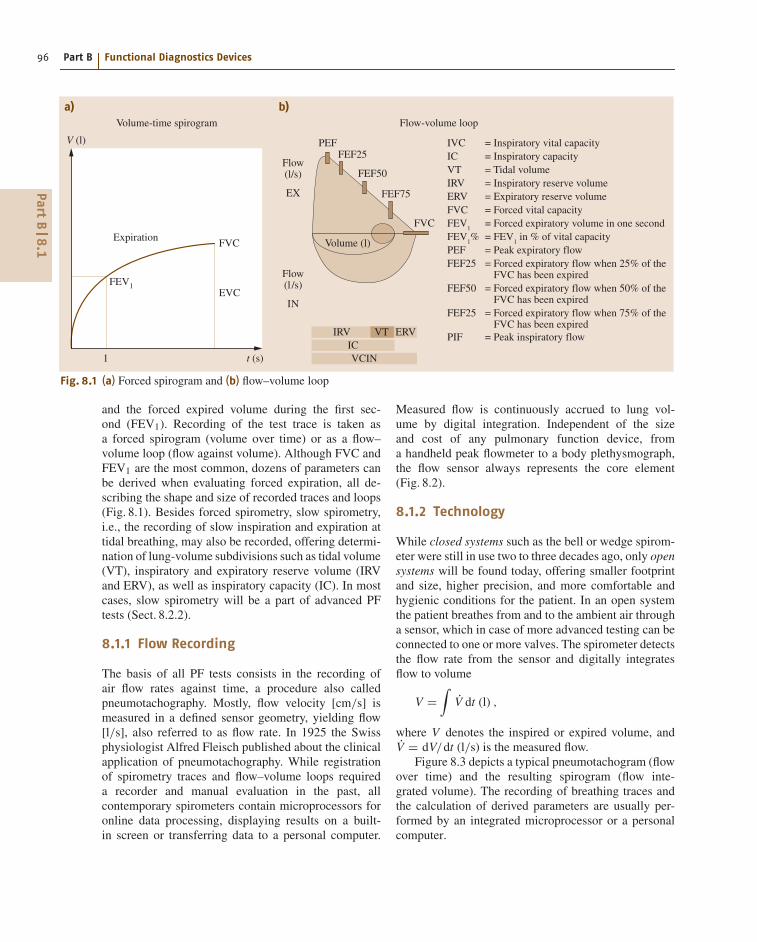
Measured flow is continuously accrued to lung vol-ume by digital integration. Independent of the sizeand cost of any pulmonary function device, froma handheld peak flowmeter to a body plethysmograph,the flow sensor always represents the core element(Fig. 8.2).
8.1.2 Technology
While closed systems such as the bell or wedge spirom-eter were still in use two to three decades ago, only opensystems will be found today, offering smaller footprintand size, higher precision, and more comfortable andhygienic conditions for the patient. In an open systemthe patient breathes from and to the ambient air througha sensor, which in case of more advanced testing can beconnected to one or more valves. The spirometer detectsthe flow rate from the sensor and digitally integratesflow to volume
V =∫
V̇ dt (l) ,
where V denotes the inspired or expired volume, andV̇ = dV/dt (l/s) is the measured flow.
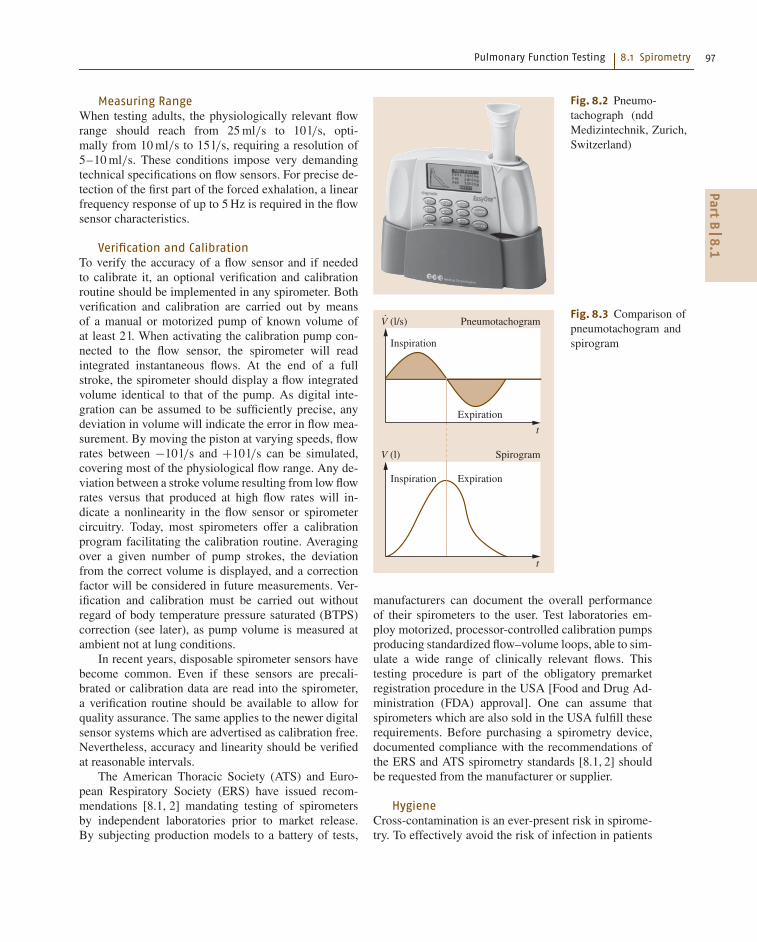
Figure 8.3 depicts a typical pneumotachogram (flowover time) and the resulting spirogram (flow inte-grated volume). The recording of breathing traces andthe calculation of derived parameters are usually per-formed by an integrated microprocessor or a personalcomputer.
PartB
8.1
Pulmonary Function Testing 8.1 Spirometry 97
Measuring RangeWhen testing adults, the physiologically relevant flowrange should reach from 25 ml/s to 10 l/s, opti-mally from 10 ml/s to 15 l/s, requiring a resolution of5–10 ml/s. These conditions impose very demandingtechnical specifications on flow sensors. For precise de-tection of the first part of the forced exhalation, a linearfrequency response of up to 5 Hz is required in the flowsensor characteristics.
Verification and CalibrationTo verify the accuracy of a flow sensor and if neededto calibrate it, an optional verification and calibrationroutine should be implemented in any spirometer. Bothverification and calibration are carried out by meansof a manual or motorized pump of known volume ofat least 2 l. When activating the calibration pump con-nected to the flow sensor, the spirometer will readintegrated instantaneous flows. At the end of a fullstroke, the spirometer should display a flow integratedvolume identical to that of the pump. As digital inte-gration can be assumed to be sufficiently precise, anydeviation in volume will indicate the error in flow mea-surement. By moving the piston at varying speeds, flowrates between −10 l/s and +10 l/s can be simulated,covering most of the physiological flow range. Any de-viation between a stroke volume resulting from low flowrates versus that produced at high flow rates will in-dicate a nonlinearity in the flow sensor or spirometercircuitry. Today, most spirometers offer a calibrationprogram facilitating the calibration routine. Averagingover a given number of pump strokes, the deviationfrom the correct volume is displayed, and a correctionfactor will be considered in future measurements. Ver-ification and calibration must be carried out withoutregard of body temperature pressure saturated (BTPS)correction (see later), as pump volume is measured atambient not at lung conditions.
In recent years, disposable spirometer sensors havebecome common. Even if these sensors are precali-brated or calibration data are read into the spirometer,a verification routine should be available to allow forquality assurance. The same applies to the newer digitalsensor systems which are advertised as calibration free.Nevertheless, accuracy and linearity should be verifiedat reasonable intervals.
The American Thoracic Society (ATS) and Euro-pean Respiratory Society (ERS) have issued recom-mendations [8.1, 2] mandating testing of spirometersby independent laboratories prior to market release.By subjecting production models to a battery of tests,
Fig. 8.2 Pneumo-tachograph (nddMedizintechnik, Zurich,Switzerland)
Spirogram
Pneumotachogram
Inspiration Expiration
Inspiration
Expiration
V (l)
V (l/s)
t
t
Fig. 8.3 Comparison ofpneumotachogram andspirogram
manufacturers can document the overall performanceof their spirometers to the user. Test laboratories em-ploy motorized, processor-controlled calibration pumpsproducing standardized flow–volume loops, able to sim-ulate a wide range of clinically relevant flows. Thistesting procedure is part of the obligatory premarketregistration procedure in the USA [Food and Drug Ad-ministration (FDA) approval]. One can assume thatspirometers which are also sold in the USA fulfill theserequirements. Before purchasing a spirometry device,documented compliance with the recommendations ofthe ERS and ATS spirometry standards [8.1, 2] shouldbe requested from the manufacturer or supplier.
HygieneCross-contamination is an ever-present risk in spirome-try. To effectively avoid the risk of infection in patients
PartB
8.1
98 Part B Functional Diagnostics Devices
or individuals tested with the same spirometer, suitablepreventive measures should be instituted. In case theflow sensor is a fixed installation which cannot easilybe exchanged, a disposable breathing filter is indispens-able. Like the sensor itself, the breathing filter must havea low resistance, minimizing any hindering effect onbreathing. Usually the flow sensor can be exchangedand replaced by one that has been cleaned and sani-tized. In regular clinical testing, sensors do not need tobe sterile; disinfection according to manufacturer’s rec-ommendations is sufficient. Many modern spirometersincorporate disposable sensors, favorably combiningadequate hygiene with ease of use. As single-use sen-sors should not cost much more than a good breathingfilter, their design is a contradiction in terms of lowcost versus good performance (in accuracy and resolu-tion, see above). In this regard a disposable item thatis not part of the sensor itself may be advantageous,as it ensures hygiene while not affecting accuracy. TheERS has published recommendations concerning theresistance of spirometry sensors and breathing filters,calibration, and hygiene of spirometers [8.2].
Conversion to Body ConditionsAn open system requires conversion of measured flowand integrated volume from ambient to lung or BTPSconditions (37 ◦C, 760 mmHg, 100% relative humid-ity). The conversion needs to correct inspiratory andexpiratory flows and volumes separately. While, dur-ing inspiration, 1 l of ambient air expands to about 1.1 lof lung air due to heating and humidification, 1 l oflung air will shrink during expiration to about 0.97 l
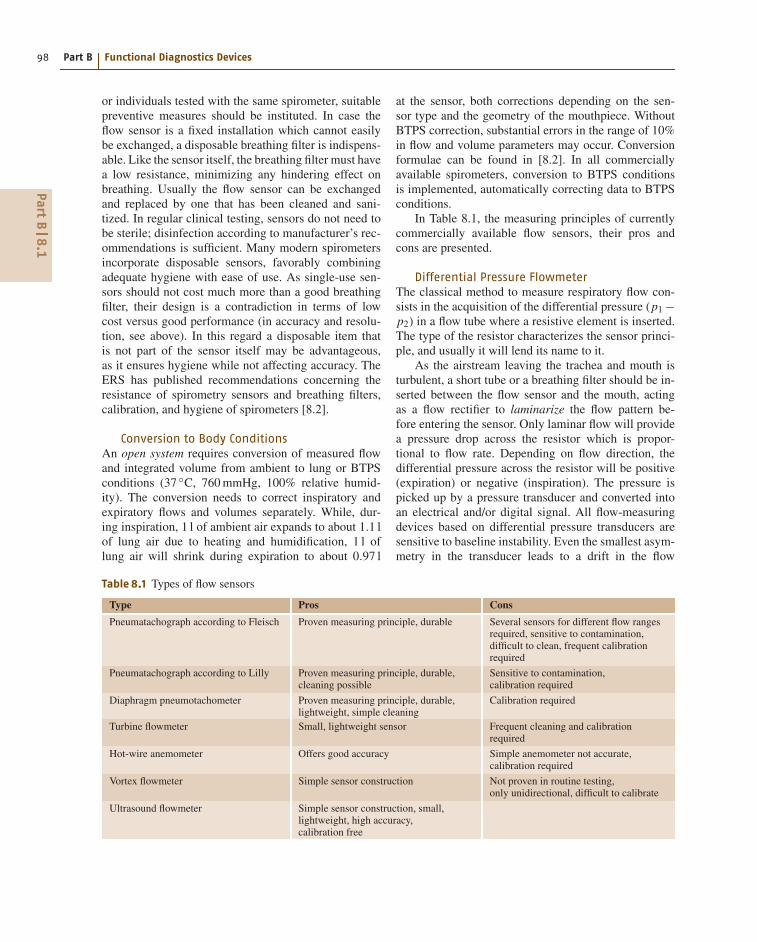
Table 8.1 Types of flow sensors
Type Pros Cons
Pneumatachograph according to Fleisch Proven measuring principle, durable Several sensors for different flow rangesrequired, sensitive to contamination,difficult to clean, frequent calibrationrequired
Pneumatachograph according to Lilly Proven measuring principle, durable,cleaning possible
Sensitive to contamination,calibration required
Diaphragm pneumotachometer Proven measuring principle, durable,lightweight, simple cleaning
Calibration required
Turbine flowmeter Small, lightweight sensor Frequent cleaning and calibrationrequired
Hot-wire anemometer Offers good accuracy Simple anemometer not accurate,calibration required
Vortex flowmeter Simple sensor construction Not proven in routine testing,only unidirectional, difficult to calibrate
Ultrasound flowmeter Simple sensor construction, small,lightweight, high accuracy,calibration free
at the sensor, both corrections depending on the sen-sor type and the geometry of the mouthpiece. WithoutBTPS correction, substantial errors in the range of 10%in flow and volume parameters may occur. Conversionformulae can be found in [8.2]. In all commerciallyavailable spirometers, conversion to BTPS conditionsis implemented, automatically correcting data to BTPSconditions.
In Table 8.1, the measuring principles of currentlycommercially available flow sensors, their pros andcons are presented.
Differential Pressure FlowmeterThe classical method to measure respiratory flow con-sists in the acquisition of the differential pressure (p1 −p2) in a flow tube where a resistive element is inserted.The type of the resistor characterizes the sensor princi-ple, and usually it will lend its name to it.
As the airstream leaving the trachea and mouth isturbulent, a short tube or a breathing filter should be in-serted between the flow sensor and the mouth, actingas a flow rectifier to laminarize the flow pattern be-fore entering the sensor. Only laminar flow will providea pressure drop across the resistor which is propor-tional to flow rate. Depending on flow direction, thedifferential pressure across the resistor will be positive(expiration) or negative (inspiration). The pressure ispicked up by a pressure transducer and converted intoan electrical and/or digital signal. All flow-measuringdevices based on differential pressure transducers aresensitive to baseline instability. Even the smallest asym-metry in the transducer leads to a drift in the flow
PartB
8.1
Pulmonary Function Testing 8.1 Spirometry 99
Inspiratory Breathing flowV
Capillaries = Resistor
Flow signal
Pressure transducer Integrator
Mouthpiece P1 P2
Volume signal
Expiratory
V
V dt = VΔp
0∫
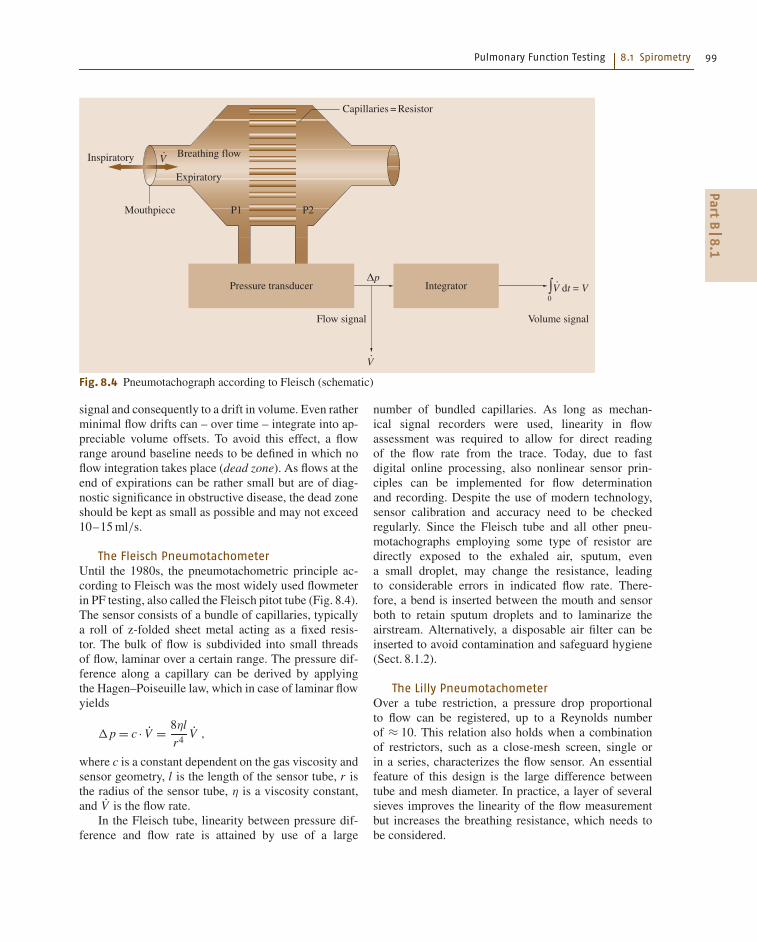
Fig. 8.4 Pneumotachograph according to Fleisch (schematic)
signal and consequently to a drift in volume. Even ratherminimal flow drifts can – over time – integrate into ap-preciable volume offsets. To avoid this effect, a flowrange around baseline needs to be defined in which noflow integration takes place (dead zone). As flows at theend of expirations can be rather small but are of diag-nostic significance in obstructive disease, the dead zoneshould be kept as small as possible and may not exceed10–15 ml/s.
The Fleisch PneumotachometerUntil the 1980s, the pneumotachometric principle ac-cording to Fleisch was the most widely used flowmeterin PF testing, also called the Fleisch pitot tube (Fig. 8.4).The sensor consists of a bundle of capillaries, typicallya roll of z-folded sheet metal acting as a fixed resis-tor. The bulk of flow is subdivided into small threadsof flow, laminar over a certain range. The pressure dif-ference along a capillary can be derived by applyingthe Hagen–Poiseuille law, which in case of laminar flowyields
Δp = c · V̇ = 8ηl
r4V̇ ,
where c is a constant dependent on the gas viscosity andsensor geometry, l is the length of the sensor tube, r isthe radius of the sensor tube, η is a viscosity constant,and V̇ is the flow rate.
In the Fleisch tube, linearity between pressure dif-ference and flow rate is attained by use of a large
number of bundled capillaries. As long as mechan-ical signal recorders were used, linearity in flowassessment was required to allow for direct readingof the flow rate from the trace. Today, due to fastdigital online processing, also nonlinear sensor prin-ciples can be implemented for flow determinationand recording. Despite the use of modern technology,sensor calibration and accuracy need to be checkedregularly. Since the Fleisch tube and all other pneu-motachographs employing some type of resistor aredirectly exposed to the exhaled air, sputum, evena small droplet, may change the resistance, leadingto considerable errors in indicated flow rate. There-fore, a bend is inserted between the mouth and sensorboth to retain sputum droplets and to laminarize theairstream. Alternatively, a disposable air filter can beinserted to avoid contamination and safeguard hygiene(Sect. 8.1.2).
The Lilly PneumotachometerOver a tube restriction, a pressure drop proportionalto flow can be registered, up to a Reynolds numberof ≈ 10. This relation also holds when a combinationof restrictors, such as a close-mesh screen, single orin a series, characterizes the flow sensor. An essentialfeature of this design is the large difference betweentube and mesh diameter. In practice, a layer of severalsieves improves the linearity of the flow measurementbut increases the breathing resistance, which needs tobe considered.
PartB
8.1
100 Part B Functional Diagnostics Devices
Diaphragm PneumotachometerIn this type of flowmeter a specially slotted foil di-aphragm is employed, acting as the resistor. A pressuredrop across the diaphragm will occur, being eitherproportional to flow over a certain range or needing lin-earization over a larger range. Depending on design, thediaphragm will exhibit a larger differential pressure atlower flows, an overproportionally smaller pressure dif-ference at higher flows. Certain applications, such asexercise testing or intensive care measurements, maybenefit from such varying resolution. The diaphragmis less prone to humidity and contamination by sputumand may be cleaned more easily.
Turbine FlowmeterA turbine or propeller built into the flow tube char-acterizes this sensor, which is also called a digitalvolume transducer. Excited by the passing gas flow,the rotating elements interrupt or reflect the light froma light-emitting diode (LED). Photodiodes register therotations, returning an electrical impulse frequency pro-portional to flow, while the total count is proportional tovolume.
To minimize inertia, the turbine bearing resistanceand turbine mass have to be as small as possible. Con-temporary turbine flowmeters can be dismantled easilyfor cleaning.
Hot-Wire AnemometerThis sensor consists of a Venturi tube in which twohot wires are installed, linked in an electric bridgecircuit (Wheatstone bridge). While one wire, consist-ing of two types of platinum, senses gas temperature,
Transducer 1
Transducer 2 Temperature
Gas flow
t1
t2
T
d
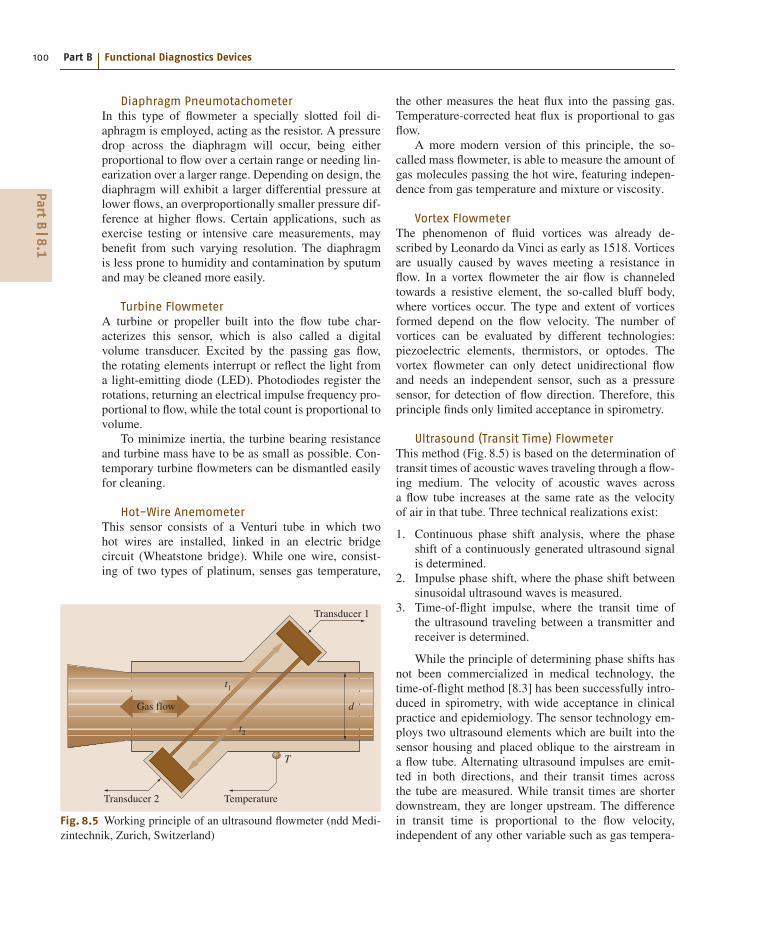
Fig. 8.5 Working principle of an ultrasound flowmeter (ndd Medi-zintechnik, Zurich, Switzerland)
the other measures the heat flux into the passing gas.Temperature-corrected heat flux is proportional to gasflow.
A more modern version of this principle, the so-called mass flowmeter, is able to measure the amount ofgas molecules passing the hot wire, featuring indepen-dence from gas temperature and mixture or viscosity.
Vortex FlowmeterThe phenomenon of fluid vortices was already de-scribed by Leonardo da Vinci as early as 1518. Vorticesare usually caused by waves meeting a resistance inflow. In a vortex flowmeter the air flow is channeledtowards a resistive element, the so-called bluff body,where vortices occur. The type and extent of vorticesformed depend on the flow velocity. The number ofvortices can be evaluated by different technologies:piezoelectric elements, thermistors, or optodes. Thevortex flowmeter can only detect unidirectional flowand needs an independent sensor, such as a pressuresensor, for detection of flow direction. Therefore, thisprinciple finds only limited acceptance in spirometry.
Ultrasound (Transit Time) FlowmeterThis method (Fig. 8.5) is based on the determination oftransit times of acoustic waves traveling through a flow-ing medium. The velocity of acoustic waves acrossa flow tube increases at the same rate as the velocityof air in that tube. Three technical realizations exist:
1. Continuous phase shift analysis, where the phaseshift of a continuously generated ultrasound signalis determined.
2. Impulse phase shift, where the phase shift betweensinusoidal ultrasound waves is measured.
3. Time-of-flight impulse, where the transit time ofthe ultrasound traveling between a transmitter andreceiver is determined.
While the principle of determining phase shifts hasnot been commercialized in medical technology, thetime-of-flight method [8.3] has been successfully intro-duced in spirometry, with wide acceptance in clinicalpractice and epidemiology. The sensor technology em-ploys two ultrasound elements which are built into thesensor housing and placed oblique to the airstream ina flow tube. Alternating ultrasound impulses are emit-ted in both directions, and their transit times acrossthe tube are measured. While transit times are shorterdownstream, they are longer upstream. The differencein transit time is proportional to the flow velocity,independent of any other variable such as gas tempera-
PartB
8.1
Pulmonary Function Testing 8.1 Spirometry 101
ture, viscosity or humidity. In a commercially availableultrasound flowmeter a disposable breathing tube isemployed, featuring sealed windows across from the ul-trasound elements. While the windows are transparentto ultrasound, germs cannot pass, effectively avoidingcross-contamination. In addition to being calibrationfree, this sensor design also has the advantages of highaccuracy and total hygiene. While the difference in tran-sit time yields the flow, the sum of the transit times isdirectly related to the molar mass, the molecular or spe-cific weight of the breathing gas, allowing instantaneousreading of the specific weight of the gas passing throughthe sensor. During expiration, the molar mass changesaccording to the composition of the exhaled gas, similarto a CO2 waveform (Sect. 8.1.4).
Peak FlowmeterFor monitoring obstructive diseases such as asthma andfor analyzing therapy response, peak flowmeters play animportant role, in particular for home use. The classicalmechanical peak flowmeter consists in a piston mov-ing in a scaled flow tube. A forced expiration moves thepiston up the vertically held tube, allowing a reading ofmaximum peak expiratory flow (PEF) in units of l/minor l/s. More modern peak flowmeters implement one ofthe above-mentioned measuring principles, most oftenturbines. Usually they offer electronic signal process-ing, display of results, memory and diary function, aswell as data logging through a modem or the Internet.When applied over a longer period of time, verificationand calibration of PEF meters should be warranted.
8.1.3 Methodology of Spirometry
Lung-Volume SubdivisionsPulmonary gas transport depends on the filling capac-ity of the lungs with breathing gas and the speed anduniformity of gas distribution. Markers of lung fillingare the lung-volume subdivisions, which are measuredat slow breathing, while flow rates are of minor interest.When two or more volume subdivisions are combined,lung capacities result. The most important role in PFtesting is played by vital capacity (VC), the volume ofcomplete inspiration (IVC) or slow expiration volume(EVC), both directly accessible by spirometry. At theend of a deep expiration, residual lung volume (RV)remains in the lungs, which can be determined by gasdilation methods (Sect. 8.2.4) or body plethysmographyonly (Sect. 8.2.2). Consequently, the sum of VC andresidual volume (RV) determines the volume at the endof a complete inspiration and is called the total lung ca-
pacity (TLC), an important measure of maximum lungvolume.
Vital capacity consists of the subdivisions:
• Tidal volume (VT), the volume ventilated duringa regular breathing cycle• Expiratory reserve volume (ERV), the volume thatcan be exhaled from breathing baseline, i. e., at theend of a regular breathing cycle• Inspiratory reserve volume (IRV), the volume whichcan be inhaled above the inspiratory breath of a reg-ular VT cycle• Inspiratory capacity (IC), i.e., the sum of VT andIRV.
As for TLC and RV, the functional residual capacity(FRC), being the sum of RV and ERV, can be deter-mined by more elaborate methods only (Sect. 8.2). Asdetermination of lung-volume subdivisions is time con-suming and diagnostically less significant, subdivisionswill be evaluated in combination with the more relevantFRC.
For standardization of lung volume testing referto [8.4].
Forced SpirometryOf the diagnostic arsenal of internal medicine, dynamiclung volumes, in particular forced vital capacity andforced expiratory volume in the first second (FEV1), areconsidered essential parameters. Forced expiration notonly delivers important information about an existingpulmonary obstruction in the sense of reduced airwaydiameter but may also indicate a loss in lung retrac-tion, parallel to diminished lung elasticity and enhancedairway instability. Reduced elasticity mirrors the lossof functional tissue structure, resulting in reduced sur-face area for gas exchange and accompanied by a highdemand in ventilation at reduced maximum oxygen up-take.
In contrast to the predominantly practiced forcedexpiration, forced inspiration can be used for differen-tial diagnosis of extrathoracic obstruction, e.g., trachealstenosis.
Being technically less demanding, the recordingof a forced spirogram prevailed traditionally; todaythe flow–volume loop is registered together with thespirogram. The time-based spirogram offers observa-tion of expiratory time, typically 3 s in a healthy subjectbut maybe as long as 10–20 s in an obstructed pa-tient. As the forced spirogram represents the shape ofan exponential function, analysis of its form requiresa certain understanding of the underlying pulmonary
PartB
8.1
102 Part B Functional Diagnostics Devices
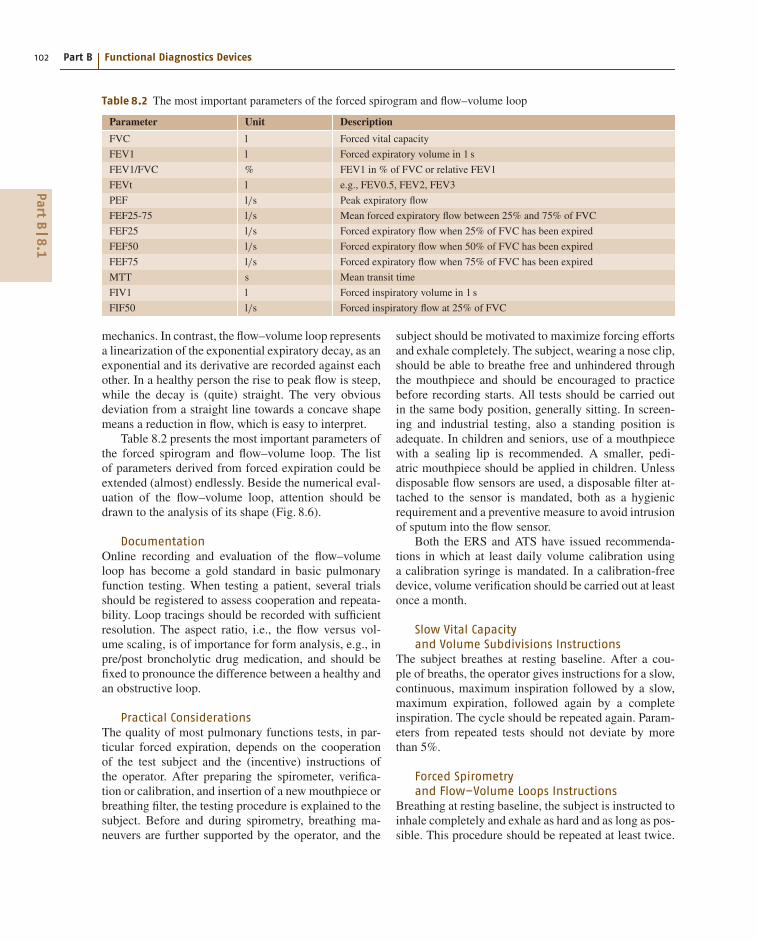
Table 8.2 The most important parameters of the forced spirogram and flow–volume loop
Parameter Unit Description
FVC l Forced vital capacity
FEV1 l Forced expiratory volume in 1 s
FEV1/FVC % FEV1 in % of FVC or relative FEV1
FEVt l e.g., FEV0.5, FEV2, FEV3
PEF l/s Peak expiratory flow
FEF25-75 l/s Mean forced expiratory flow between 25% and 75% of FVC
FEF25 l/s Forced expiratory flow when 25% of FVC has been expired
FEF50 l/s Forced expiratory flow when 50% of FVC has been expired
FEF75 l/s Forced expiratory flow when 75% of FVC has been expired
MTT s Mean transit time
FIV1 l Forced inspiratory volume in 1 s
FIF50 l/s Forced inspiratory flow at 25% of FVC
mechanics. In contrast, the flow–volume loop representsa linearization of the exponential expiratory decay, as anexponential and its derivative are recorded against eachother. In a healthy person the rise to peak flow is steep,while the decay is (quite) straight. The very obviousdeviation from a straight line towards a concave shapemeans a reduction in flow, which is easy to interpret.
Table 8.2 presents the most important parameters ofthe forced spirogram and flow–volume loop. The listof parameters derived from forced expiration could beextended (almost) endlessly. Beside the numerical eval-uation of the flow–volume loop, attention should bedrawn to the analysis of its shape (Fig. 8.6).
DocumentationOnline recording and evaluation of the flow–volumeloop has become a gold standard in basic pulmonaryfunction testing. When testing a patient, several trialsshould be registered to assess cooperation and repeata-bility. Loop tracings should be recorded with sufficientresolution. The aspect ratio, i.e., the flow versus vol-ume scaling, is of importance for form analysis, e.g., inpre/post broncholytic drug medication, and should befixed to pronounce the difference between a healthy andan obstructive loop.
Practical ConsiderationsThe quality of most pulmonary functions tests, in par-ticular forced expiration, depends on the cooperationof the test subject and the (incentive) instructions ofthe operator. After preparing the spirometer, verifica-tion or calibration, and insertion of a new mouthpiece orbreathing filter, the testing procedure is explained to thesubject. Before and during spirometry, breathing ma-neuvers are further supported by the operator, and the
subject should be motivated to maximize forcing effortsand exhale completely. The subject, wearing a nose clip,should be able to breathe free and unhindered throughthe mouthpiece and should be encouraged to practicebefore recording starts. All tests should be carried outin the same body position, generally sitting. In screen-ing and industrial testing, also a standing position isadequate. In children and seniors, use of a mouthpiecewith a sealing lip is recommended. A smaller, pedi-atric mouthpiece should be applied in children. Unlessdisposable flow sensors are used, a disposable filter at-tached to the sensor is mandated, both as a hygienicrequirement and a preventive measure to avoid intrusionof sputum into the flow sensor.
Both the ERS and ATS have issued recommenda-tions in which at least daily volume calibration usinga calibration syringe is mandated. In a calibration-freedevice, volume verification should be carried out at leastonce a month.
Slow Vital Capacityand Volume Subdivisions Instructions
The subject breathes at resting baseline. After a cou-ple of breaths, the operator gives instructions for a slow,continuous, maximum inspiration followed by a slow,maximum expiration, followed again by a completeinspiration. The cycle should be repeated again. Param-eters from repeated tests should not deviate by morethan 5%.
Forced Spirometryand Flow–Volume Loops Instructions
Breathing at resting baseline, the subject is instructed toinhale completely and exhale as hard and as long as pos-sible. This procedure should be repeated at least twice.
PartB
8.1
Pulmonary Function Testing 8.1 Spirometry 103
Normal loopsGood cooperation
Flow(l/s)
Inspiration
Expiration
No forcedexpiration
Intrathoracic tracheal stenosis
Fixed extra-thoracic stenosis
No maximumexpiration
Restriction Emphysema
Stenosis
Obstructiona) b)
c) d)
e)
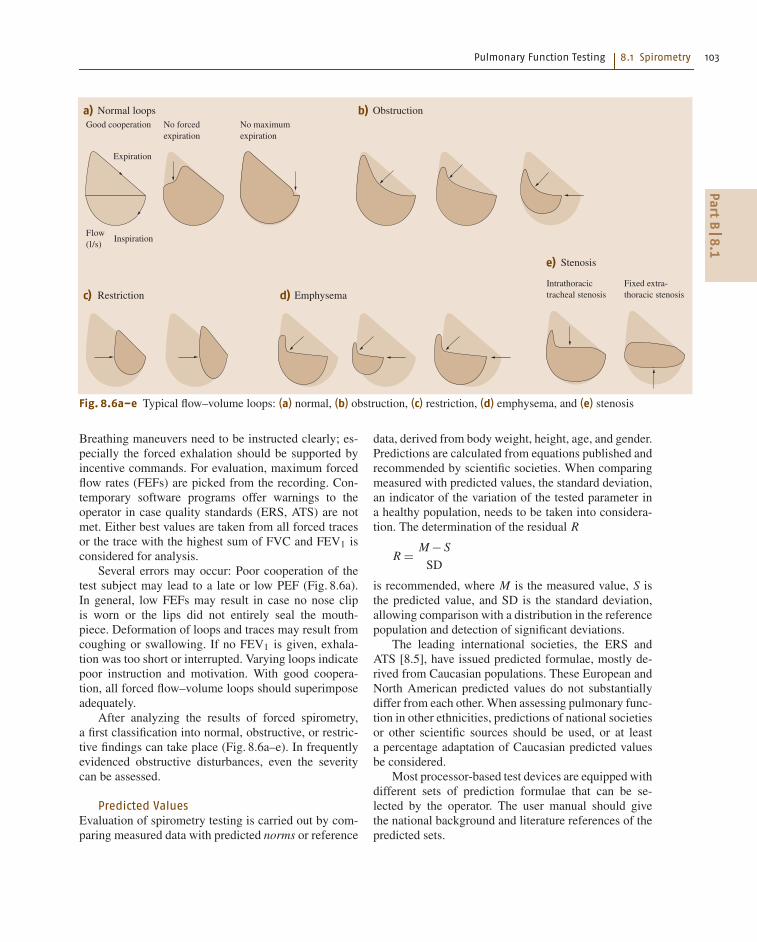
Fig. 8.6a–e Typical flow–volume loops: (a) normal, (b) obstruction, (c) restriction, (d) emphysema, and (e) stenosis
Breathing maneuvers need to be instructed clearly; es-pecially the forced exhalation should be supported byincentive commands. For evaluation, maximum forcedflow rates (FEFs) are picked from the recording. Con-temporary software programs offer warnings to theoperator in case quality standards (ERS, ATS) are notmet. Either best values are taken from all forced tracesor the trace with the highest sum of FVC and FEV1 isconsidered for analysis.
Several errors may occur: Poor cooperation of thetest subject may lead to a late or low PEF (Fig. 8.6a).In general, low FEFs may result in case no nose clipis worn or the lips did not entirely seal the mouth-piece. Deformation of loops and traces may result fromcoughing or swallowing. If no FEV1 is given, exhala-tion was too short or interrupted. Varying loops indicatepoor instruction and motivation. With good coopera-tion, all forced flow–volume loops should superimposeadequately.
After analyzing the results of forced spirometry,a first classification into normal, obstructive, or restric-tive findings can take place (Fig. 8.6a–e). In frequentlyevidenced obstructive disturbances, even the severitycan be assessed.
Predicted ValuesEvaluation of spirometry testing is carried out by com-paring measured data with predicted norms or reference
data, derived from body weight, height, age, and gender.Predictions are calculated from equations published andrecommended by scientific societies. When comparingmeasured with predicted values, the standard deviation,an indicator of the variation of the tested parameter ina healthy population, needs to be taken into considera-tion. The determination of the residual R
R = M − S
SD
is recommended, where M is the measured value, S isthe predicted value, and SD is the standard deviation,allowing comparison with a distribution in the referencepopulation and detection of significant deviations.
The leading international societies, the ERS andATS [8.5], have issued predicted formulae, mostly de-rived from Caucasian populations. These European andNorth American predicted values do not substantiallydiffer from each other. When assessing pulmonary func-tion in other ethnicities, predictions of national societiesor other scientific sources should be used, or at leasta percentage adaptation of Caucasian predicted valuesbe considered.
Most processor-based test devices are equipped withdifferent sets of prediction formulae that can be se-lected by the operator. The user manual should givethe national background and literature references of thepredicted sets.
PartB
8.1
104 Part B Functional Diagnostics Devices
Besides reporting measured, predicted, and percent-age values, spirometry reports should contain a markerfor significant deviation from certain limits, such as thestandard deviation. Testing in children and adolescentsrequires a set of pediatric formulae.
8.1.4 Cooperation-Free PulmonaryFunction Tests
For more than half a century spirometry has beena valued clinical tool and its importance has beendocumented in numerous publications. Forced spirom-etry can predict mortality better than smoking habits,existing cardiovascular morbidity, blood pressure, orgender [8.6].
As valuable as forced spirometry findings may be,it is often difficult to attain and ensure cooperation insubjects. Even well-equipped pulmonary function lab-oratories with well-trained staff will soon reach theirlimits when addressing and motivating children, geri-atric or foreign-language patients. In former times,cooperation-free tests were postulated mostly for pe-diatric departments and epidemiological and screeningstudies. More recently, the cataclysmic demographicchanges accompanied by a dramatic increase in thesenior generation underline the urgent necessity ofsuitable tests. Although FEV1 and FEV1/FVC% area recognized gold standard for detecting and assess-ing obstructive disease, more appropriate, more specificparameters might be available, correlating well withdyspnea (shortness of breath). Therefore, new, (almost)cooperation-free methods have been developed duringthe recent years, some of which are still pending com-mercial release. The next section gives an overview ofproven and new developments in this area.
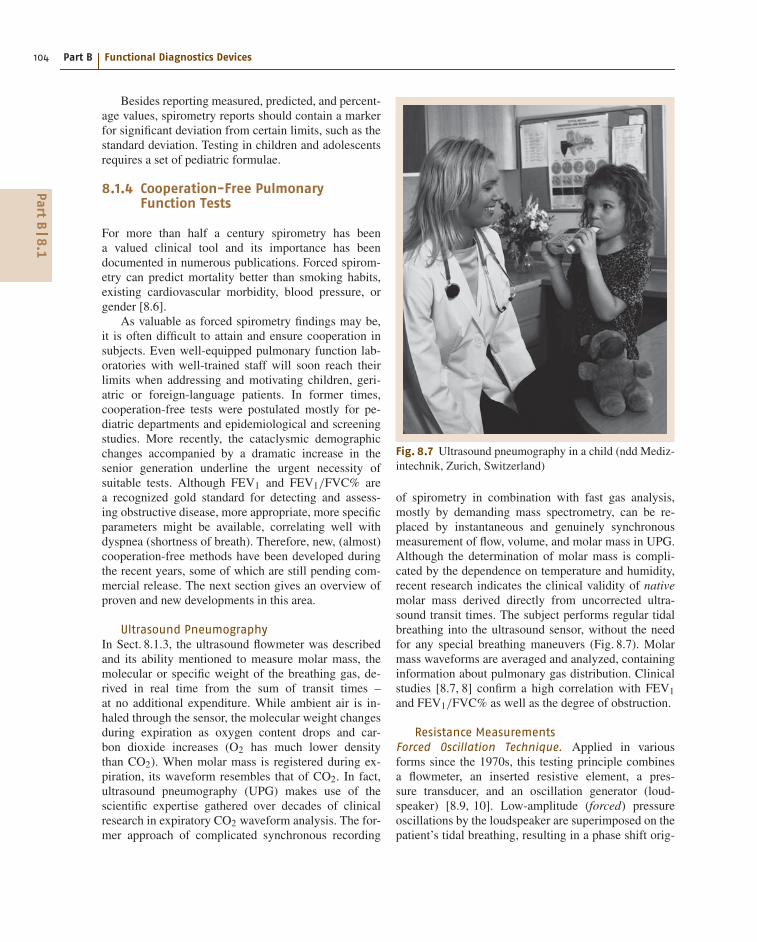
Ultrasound PneumographyIn Sect. 8.1.3, the ultrasound flowmeter was describedand its ability mentioned to measure molar mass, themolecular or specific weight of the breathing gas, de-rived in real time from the sum of transit times –at no additional expenditure. While ambient air is in-haled through the sensor, the molecular weight changesduring expiration as oxygen content drops and car-bon dioxide increases (O2 has much lower densitythan CO2). When molar mass is registered during ex-piration, its waveform resembles that of CO2. In fact,ultrasound pneumography (UPG) makes use of thescientific expertise gathered over decades of clinicalresearch in expiratory CO2 waveform analysis. The for-mer approach of complicated synchronous recording
Fig. 8.7 Ultrasound pneumography in a child (ndd Mediz-intechnik, Zurich, Switzerland)
of spirometry in combination with fast gas analysis,mostly by demanding mass spectrometry, can be re-placed by instantaneous and genuinely synchronousmeasurement of flow, volume, and molar mass in UPG.Although the determination of molar mass is compli-cated by the dependence on temperature and humidity,recent research indicates the clinical validity of nativemolar mass derived directly from uncorrected ultra-sound transit times. The subject performs regular tidalbreathing into the ultrasound sensor, without the needfor any special breathing maneuvers (Fig. 8.7). Molarmass waveforms are averaged and analyzed, containinginformation about pulmonary gas distribution. Clinicalstudies [8.7, 8] confirm a high correlation with FEV1and FEV1/FVC% as well as the degree of obstruction.
Resistance MeasurementsForced Oscillation Technique. Applied in variousforms since the 1970s, this testing principle combinesa flowmeter, an inserted resistive element, a pres-sure transducer, and an oscillation generator (loud-speaker) [8.9, 10]. Low-amplitude (forced) pressureoscillations by the loudspeaker are superimposed on thepatient’s tidal breathing, resulting in a phase shift orig-
PartB
8.1
Pulmonary Function Testing 8.2 Advanced Cardiopulmonary Function Testing 105
inating from the respiratory tract. Resulting flow andpressure signals are differentiated from the originatingpatient signals, independent from the patient’s breath-ing pattern. The analysis yields impedance Zrs with itscomponents, resistance R and reactance X, which canbe plotted in a frequency diagram. Today, this tech-nique is most often found in a variation called impulseoscillometry, applied in geriatric, pediatric, and indus-trial medicine as well as in drug studies. This method,only requiring passive patient cooperation, i. e., tidalbreathing at a mouthpiece, can complement standardpulmonary testing modalities and is suited for screen-ing of obstructive disease [8.11]. Previous concernsabout its technical complexity and limited hygiene have
been cleared with the advent of modern commercial in-struments. However, technical complexity and cost stillexceed that of conventional spirometry equipment.
Monofrequent Oscillatory Resistance Measurement.This much simpler version of the forced modality hasbeen proven clinically over decades [8.12]. Instead ofa loudspeaker a small sinusoidal pump is used, generat-ing small pressure swings superimposed on the patient’stidal breathing. Analysis of measured data again resultsin a phase diagram of resistance and reactance. In clin-ical practice, however, correlation with FEV1 is justadequate, offering lower specificity and therefore onlyserving as an orientation or screening tool.
8.2 Advanced Cardiopulmonary Function Testing
8.2.1 Overview
In contrast to simple spirometry, advanced cardiopul-monary function testing requires a much higher levelof methodology, instrumentation, and staff. This maybe the reason why advanced testing can be found pre-dominantly in internal and pulmonary departments ofhospitals and specialized practices. Nevertheless, slowand forced spirometry will always remain the founda-tion of any type of pulmonary function instrumentation,particularly in all more complex or advanced pulmonarydevices.
Among the more demanding modalities, bodyplethysmography takes a prime position, efficientlycombining measurement of lung-volume subdivisionsand airway resistance. Diffusion testing according to thesingle-breath method and determination of functionalresidual capacity (FRC) by N2 washout are sometimes
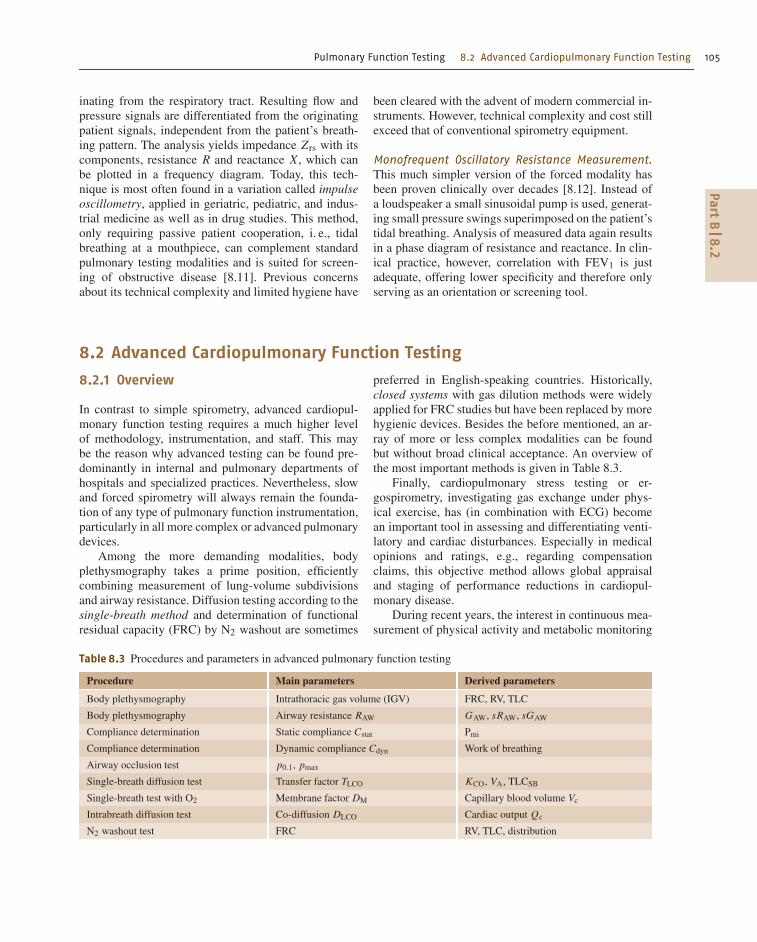
Table 8.3 Procedures and parameters in advanced pulmonary function testing
Procedure Main parameters Derived parameters
Body plethysmography Intrathoracic gas volume (IGV) FRC, RV, TLC
Body plethysmography Airway resistance RAW GAW, sRAW, sGAW
Compliance determination Static compliance Cstat Pmi
Compliance determination Dynamic compliance Cdyn Work of breathing
Airway occlusion test p0.1, pmax
Single-breath diffusion test Transfer factor TLCO KCO, VA, TLCSB
Single-breath test with O2 Membrane factor DM Capillary blood volume Vc
Intrabreath diffusion test Co-diffusion DLCO Cardiac output Qc
N2 washout test FRC RV, TLC, distribution
preferred in English-speaking countries. Historically,closed systems with gas dilution methods were widelyapplied for FRC studies but have been replaced by morehygienic devices. Besides the before mentioned, an ar-ray of more or less complex modalities can be foundbut without broad clinical acceptance. An overview ofthe most important methods is given in Table 8.3.
Finally, cardiopulmonary stress testing or er-gospirometry, investigating gas exchange under phys-ical exercise, has (in combination with ECG) becomean important tool in assessing and differentiating venti-latory and cardiac disturbances. Especially in medicalopinions and ratings, e.g., regarding compensationclaims, this objective method allows global appraisaland staging of performance reductions in cardiopul-monary disease.
During recent years, the interest in continuous mea-surement of physical activity and metabolic monitoring
PartB
8.2
106 Part B Functional Diagnostics Devices
has seen a tremendous rise. Practically all medicaldisciplines, from rehabilitation of obstructive patientsto dementia prophylaxis, have recognized and pub-lished the invaluable importance of physical activityfor improving, rehabilitating from, and particularlypreventing disease. Despite a host of technical innova-tions facilitating its application, ergospirometry remainsa demanding procedure in regards to test equipment,duration, and evaluation. This may be the reason whymuch more inexpensive portable devices have been de-veloped for activity monitoring.
Medical technology, as a part of the informationtechnology (IT) industry, undergoes the same fast-pacedcycles in innovation and cost reduction that the mi-croelectronics mass market exhibits. In the mid 1970sa computerized body box, as a body plethysmographis called colloquially, sold for about €100 000. To-day, almost 40 years later, a more operator friendly,even more accurate device can be purchased for lessthan €15 000. Practically all commercial instrumentsincorporate microelectronics, and a PC or notebook,most often implementing software under a certain op-erating system, featuring networking capabilities anddata exchange to a hospital information system, to-gether simplifying operation and enhancing laboratoryproductivity.
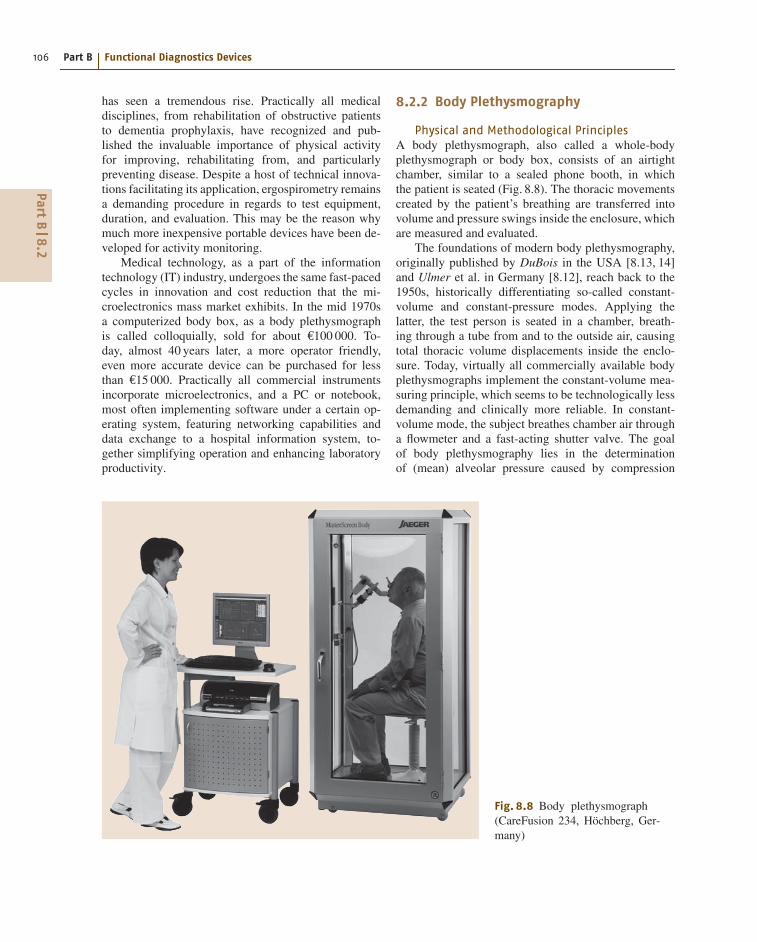
Fig. 8.8 Body plethysmograph(CareFusion 234, Höchberg, Ger-many)
8.2.2 Body Plethysmography
Physical and Methodological PrinciplesA body plethysmograph, also called a whole-bodyplethysmograph or body box, consists of an airtightchamber, similar to a sealed phone booth, in whichthe patient is seated (Fig. 8.8). The thoracic movementscreated by the patient’s breathing are transferred intovolume and pressure swings inside the enclosure, whichare measured and evaluated.
The foundations of modern body plethysmography,originally published by DuBois in the USA [8.13, 14]and Ulmer et al. in Germany [8.12], reach back to the1950s, historically differentiating so-called constant-volume and constant-pressure modes. Applying thelatter, the test person is seated in a chamber, breath-ing through a tube from and to the outside air, causingtotal thoracic volume displacements inside the enclo-sure. Today, virtually all commercially available bodyplethysmographs implement the constant-volume mea-suring principle, which seems to be technologically lessdemanding and clinically more reliable. In constant-volume mode, the subject breathes chamber air througha flowmeter and a fast-acting shutter valve. The goalof body plethysmography lies in the determinationof (mean) alveolar pressure caused by compression
PartB
8.2
Pulmonary Function Testing 8.2 Advanced Cardiopulmonary Function Testing 107
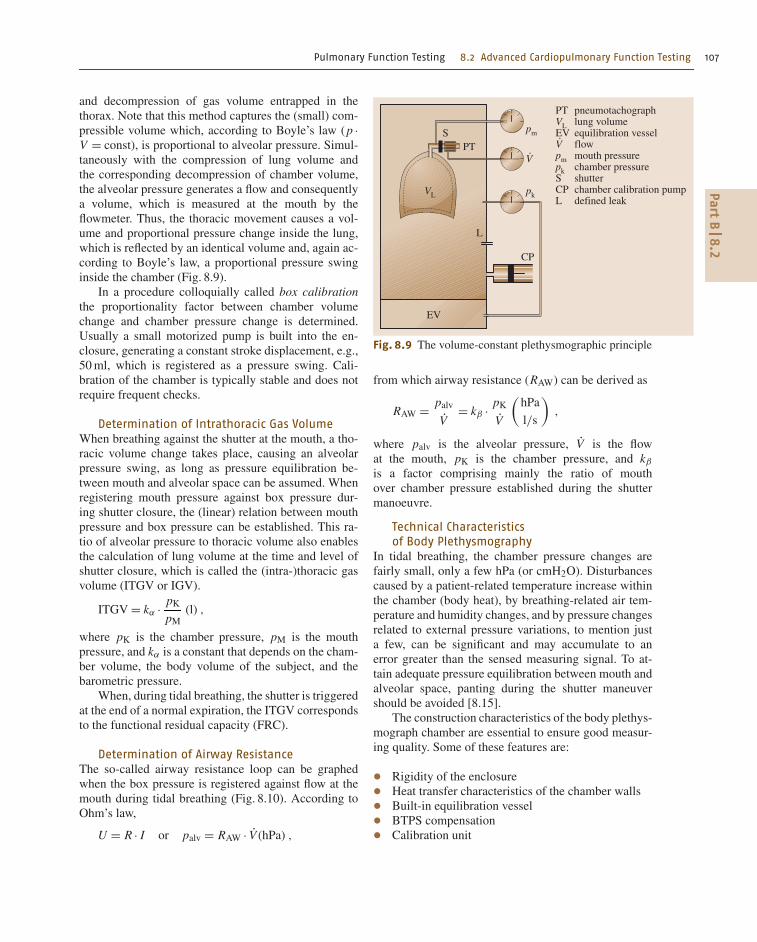
and decompression of gas volume entrapped in thethorax. Note that this method captures the (small) com-pressible volume which, according to Boyle’s law (p ·V = const), is proportional to alveolar pressure. Simul-taneously with the compression of lung volume andthe corresponding decompression of chamber volume,the alveolar pressure generates a flow and consequentlya volume, which is measured at the mouth by theflowmeter. Thus, the thoracic movement causes a vol-ume and proportional pressure change inside the lung,which is reflected by an identical volume and, again ac-cording to Boyle’s law, a proportional pressure swinginside the chamber (Fig. 8.9).
In a procedure colloquially called box calibrationthe proportionality factor between chamber volumechange and chamber pressure change is determined.Usually a small motorized pump is built into the en-closure, generating a constant stroke displacement, e.g.,50 ml, which is registered as a pressure swing. Cali-bration of the chamber is typically stable and does notrequire frequent checks.
Determination of Intrathoracic Gas VolumeWhen breathing against the shutter at the mouth, a tho-racic volume change takes place, causing an alveolarpressure swing, as long as pressure equilibration be-tween mouth and alveolar space can be assumed. Whenregistering mouth pressure against box pressure dur-ing shutter closure, the (linear) relation between mouthpressure and box pressure can be established. This ra-tio of alveolar pressure to thoracic volume also enablesthe calculation of lung volume at the time and level ofshutter closure, which is called the (intra-)thoracic gasvolume (ITGV or IGV).
ITGV = kα · pK
pM(l) ,
where pK is the chamber pressure, pM is the mouthpressure, and kα is a constant that depends on the cham-ber volume, the body volume of the subject, and thebarometric pressure.
When, during tidal breathing, the shutter is triggeredat the end of a normal expiration, the ITGV correspondsto the functional residual capacity (FRC).
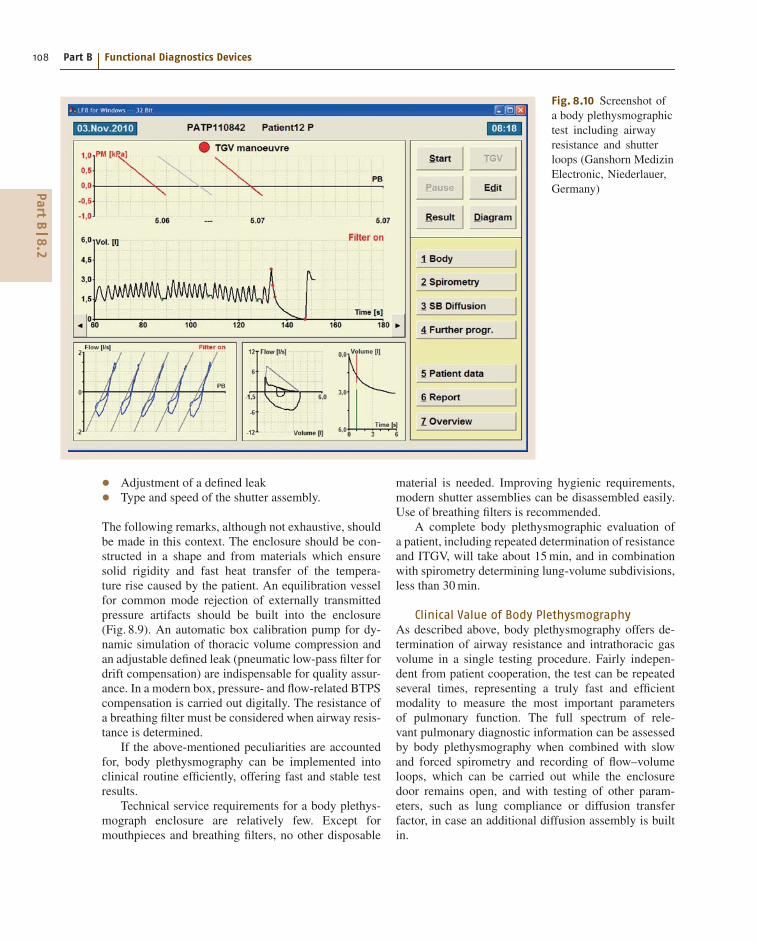
Determination of Airway ResistanceThe so-called airway resistance loop can be graphedwhen the box pressure is registered against flow at themouth during tidal breathing (Fig. 8.10). According toOhm’s law,
U = R · I or palv = RAW · V̇ (hPa) ,
SPT
EV
CP
L
pm
pkVL
V
PT pneumotachographVL lung volumeEV equilibration vesselV flowpm mouth pressurepk chamber pressureS shutterCP chamber calibration pumpL defined leak
Fig. 8.9 The volume-constant plethysmographic principle
from which airway resistance (RAW) can be derived as
RAW = palv
V̇= kβ · pK
V̇
(hPa
l/s
),
where palv is the alveolar pressure, V̇ is the flowat the mouth, pK is the chamber pressure, and kβ
is a factor comprising mainly the ratio of mouthover chamber pressure established during the shuttermanoeuvre.
Technical Characteristicsof Body Plethysmography
In tidal breathing, the chamber pressure changes arefairly small, only a few hPa (or cmH2O). Disturbancescaused by a patient-related temperature increase withinthe chamber (body heat), by breathing-related air tem-perature and humidity changes, and by pressure changesrelated to external pressure variations, to mention justa few, can be significant and may accumulate to anerror greater than the sensed measuring signal. To at-tain adequate pressure equilibration between mouth andalveolar space, panting during the shutter maneuvershould be avoided [8.15].
The construction characteristics of the body plethys-mograph chamber are essential to ensure good measur-ing quality. Some of these features are:
• Rigidity of the enclosure• Heat transfer characteristics of the chamber walls• Built-in equilibration vessel• BTPS compensation• Calibration unit
PartB
8.2
108 Part B Functional Diagnostics Devices
Fig. 8.10 Screenshot ofa body plethysmographictest including airwayresistance and shutterloops (Ganshorn MedizinElectronic, Niederlauer,Germany)
• Adjustment of a defined leak• Type and speed of the shutter assembly.
The following remarks, although not exhaustive, shouldbe made in this context. The enclosure should be con-structed in a shape and from materials which ensuresolid rigidity and fast heat transfer of the tempera-ture rise caused by the patient. An equilibration vesselfor common mode rejection of externally transmittedpressure artifacts should be built into the enclosure(Fig. 8.9). An automatic box calibration pump for dy-namic simulation of thoracic volume compression andan adjustable defined leak (pneumatic low-pass filter fordrift compensation) are indispensable for quality assur-ance. In a modern box, pressure- and flow-related BTPScompensation is carried out digitally. The resistance ofa breathing filter must be considered when airway resis-tance is determined.
If the above-mentioned peculiarities are accountedfor, body plethysmography can be implemented intoclinical routine efficiently, offering fast and stable testresults.
Technical service requirements for a body plethys-mograph enclosure are relatively few. Except formouthpieces and breathing filters, no other disposable
material is needed. Improving hygienic requirements,modern shutter assemblies can be disassembled easily.Use of breathing filters is recommended.
A complete body plethysmographic evaluation ofa patient, including repeated determination of resistanceand ITGV, will take about 15 min, and in combinationwith spirometry determining lung-volume subdivisions,less than 30 min.
Clinical Value of Body PlethysmographyAs described above, body plethysmography offers de-termination of airway resistance and intrathoracic gasvolume in a single testing procedure. Fairly indepen-dent from patient cooperation, the test can be repeatedseveral times, representing a truly fast and efficientmodality to measure the most important parametersof pulmonary function. The full spectrum of rele-vant pulmonary diagnostic information can be assessedby body plethysmography when combined with slowand forced spirometry and recording of flow–volumeloops, which can be carried out while the enclosuredoor remains open, and with testing of other param-eters, such as lung compliance or diffusion transferfactor, in case an additional diffusion assembly is builtin.
PartB
8.2
Pulmonary Function Testing 8.2 Advanced Cardiopulmonary Function Testing 109
Airway ResistanceAccording to Ulmer et al. [8.12] and Matthys [8.16],airway resistance can be determined as Rtot or Reff,offering a sensitive measure of bronchial obstruction.With high sensitivity, these parameters do not onlyreflect reduction in cross-section but also dynamiccompression of instable airways and reduced lung elas-ticity (loss of retraction). Shape analysis of resistanceloops enables differentiation of homogeneous obstruc-tion (e.g., bronchitis) from inhomogeneous obstruction(e.g., emphysema), therefore documentation of resis-tance loops is mandated.
Intrathoracic Gas Volume/FRCBesides FRC, intrathoracic gas volume comprises allgas compartments compressed during the shutter ma-neuver, also trapped air in the lungs as well asabdominal gas. This method is certainly false positive inhighly obstructive patients when pressure equilibrationbetween mouth and alveolar space cannot be attained.In contrast, the dilution and foreign gas methods willbe false negative, underestimating lung volume, whichtends to increase in the presence of severe obstruction.Because of its accuracy and high reproducibility, bodyplethysmography is considered a gold standard in lungvolume assessment. Combining ERV and VC obtainedduring spirometry with ITGV/FRC, all volume subdivi-sions including RV and TLC can be determined in onesequence.
8.2.3 Diffusion Capacity
Gas exchange between alveolar space and capillaryblood, i. e., the transfer of gas over the alveolar–capillary membrane, is called pulmonary diffusion. Thediffusion capacity of a gas is defined by the amount ofgas per unit of time exchanged over the membrane andthe partial pressure difference between gas and bloodphase. As the oxygen capillary partial pressure is inac-cessible to noninvasive testing, the diffusion capacity ofoxygen cannot be assessed. Instead, the diffusion capac-ity for carbon monoxide (CO) is measured. Only lowconcentrations of CO in the ppm range are added to theinspiratory air, as CO has high affinity to hemoglobinand patient exposure to CO should be minimized.
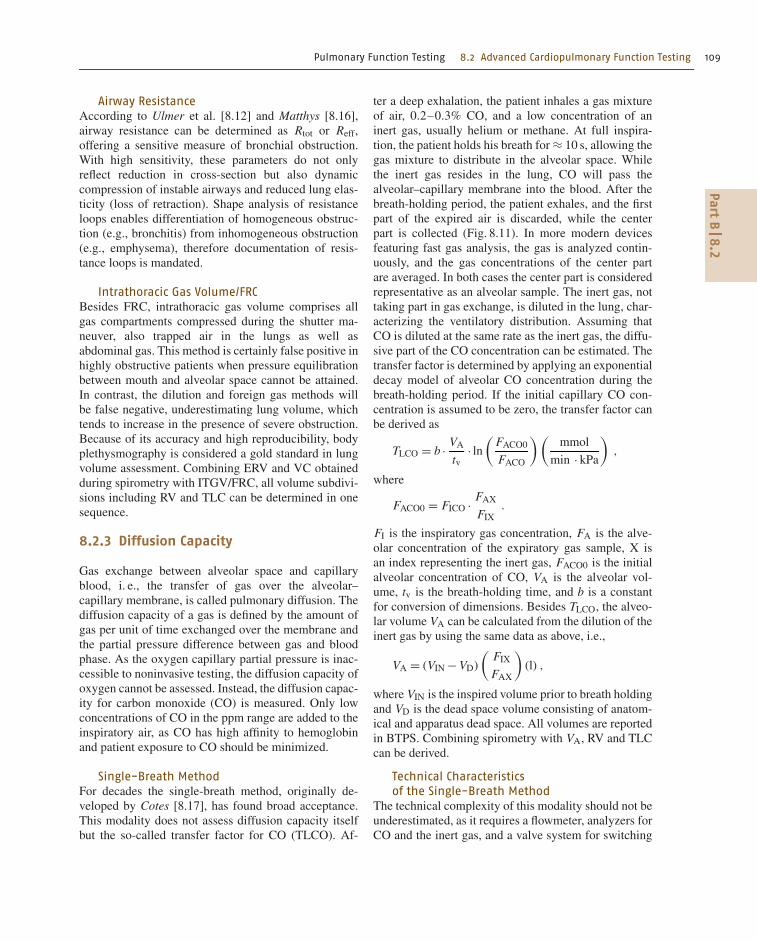
Single-Breath MethodFor decades the single-breath method, originally de-veloped by Cotes [8.17], has found broad acceptance.This modality does not assess diffusion capacity itselfbut the so-called transfer factor for CO (TLCO). Af-
ter a deep exhalation, the patient inhales a gas mixtureof air, 0.2–0.3% CO, and a low concentration of aninert gas, usually helium or methane. At full inspira-tion, the patient holds his breath for ≈ 10 s, allowing thegas mixture to distribute in the alveolar space. Whilethe inert gas resides in the lung, CO will pass thealveolar–capillary membrane into the blood. After thebreath-holding period, the patient exhales, and the firstpart of the expired air is discarded, while the centerpart is collected (Fig. 8.11). In more modern devicesfeaturing fast gas analysis, the gas is analyzed contin-uously, and the gas concentrations of the center partare averaged. In both cases the center part is consideredrepresentative as an alveolar sample. The inert gas, nottaking part in gas exchange, is diluted in the lung, char-acterizing the ventilatory distribution. Assuming thatCO is diluted at the same rate as the inert gas, the diffu-sive part of the CO concentration can be estimated. Thetransfer factor is determined by applying an exponentialdecay model of alveolar CO concentration during thebreath-holding period. If the initial capillary CO con-centration is assumed to be zero, the transfer factor canbe derived as
TLCO = b · VA
tv· ln
(FACO0
FACO
) (mmol
min · kPa
),
where
FACO0 = FICO · FAX
FIX.
FI is the inspiratory gas concentration, FA is the alve-olar concentration of the expiratory gas sample, X isan index representing the inert gas, FACO0 is the initialalveolar concentration of CO, VA is the alveolar vol-ume, tv is the breath-holding time, and b is a constantfor conversion of dimensions. Besides TLCO, the alveo-lar volume VA can be calculated from the dilution of theinert gas by using the same data as above, i.e.,
VA = (VIN − VD)
(FIX
FAX
)(l) ,
where VIN is the inspired volume prior to breath holdingand VD is the dead space volume consisting of anatom-ical and apparatus dead space. All volumes are reportedin BTPS. Combining spirometry with VA, RV and TLCcan be derived.
Technical Characteristicsof the Single-Breath Method
The technical complexity of this modality should not beunderestimated, as it requires a flowmeter, analyzers forCO and the inert gas, and a valve system for switching
PartB
8.2
110 Part B Functional Diagnostics Devices
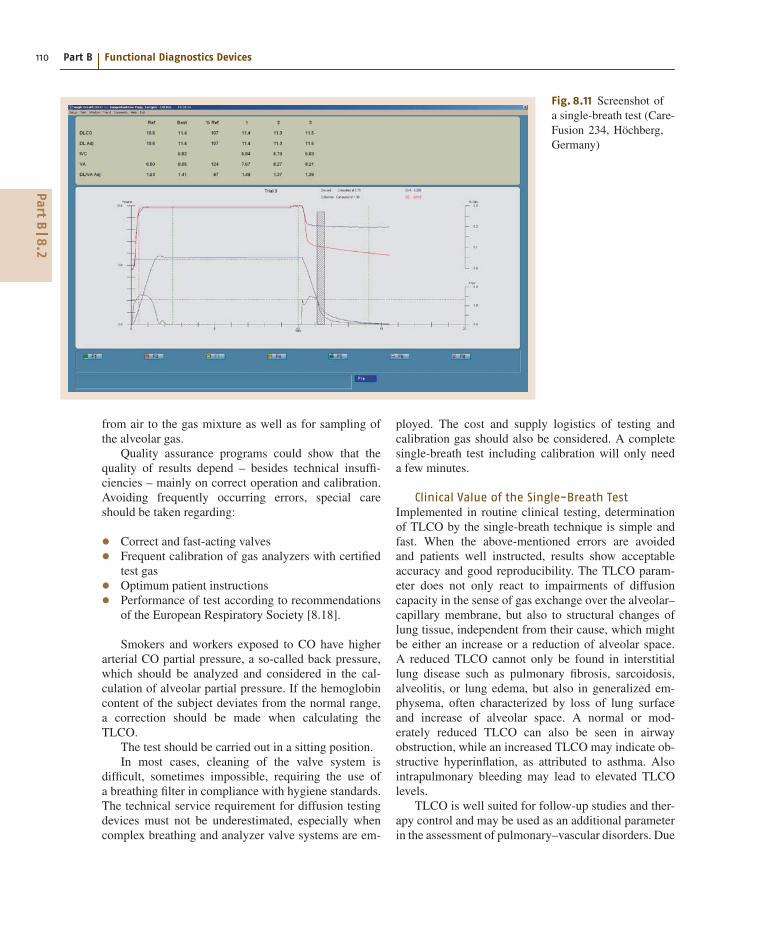
Fig. 8.11 Screenshot ofa single-breath test (Care-Fusion 234, Höchberg,Germany)
from air to the gas mixture as well as for sampling ofthe alveolar gas.
Quality assurance programs could show that thequality of results depend – besides technical insuffi-ciencies – mainly on correct operation and calibration.Avoiding frequently occurring errors, special careshould be taken regarding:
• Correct and fast-acting valves• Frequent calibration of gas analyzers with certifiedtest gas• Optimum patient instructions• Performance of test according to recommendationsof the European Respiratory Society [8.18].
Smokers and workers exposed to CO have higherarterial CO partial pressure, a so-called back pressure,which should be analyzed and considered in the cal-culation of alveolar partial pressure. If the hemoglobincontent of the subject deviates from the normal range,a correction should be made when calculating theTLCO.
The test should be carried out in a sitting position.In most cases, cleaning of the valve system is
difficult, sometimes impossible, requiring the use ofa breathing filter in compliance with hygiene standards.The technical service requirement for diffusion testingdevices must not be underestimated, especially whencomplex breathing and analyzer valve systems are em-
ployed. The cost and supply logistics of testing andcalibration gas should also be considered. A completesingle-breath test including calibration will only needa few minutes.
Clinical Value of the Single-Breath TestImplemented in routine clinical testing, determinationof TLCO by the single-breath technique is simple andfast. When the above-mentioned errors are avoidedand patients well instructed, results show acceptableaccuracy and good reproducibility. The TLCO param-eter does not only react to impairments of diffusioncapacity in the sense of gas exchange over the alveolar–capillary membrane, but also to structural changes oflung tissue, independent from their cause, which mightbe either an increase or a reduction of alveolar space.A reduced TLCO cannot only be found in interstitiallung disease such as pulmonary fibrosis, sarcoidosis,alveolitis, or lung edema, but also in generalized em-physema, often characterized by loss of lung surfaceand increase of alveolar space. A normal or mod-erately reduced TLCO can also be seen in airwayobstruction, while an increased TLCO may indicate ob-structive hyperinflation, as attributed to asthma. Alsointrapulmonary bleeding may lead to elevated TLCOlevels.
TLCO is well suited for follow-up studies and ther-apy control and may be used as an additional parameterin the assessment of pulmonary–vascular disorders. Due
PartB
8.2
Pulmonary Function Testing 8.2 Advanced Cardiopulmonary Function Testing 111
to its complexity, application of TLCO in screening maybe limited to specialized studies, e.g., in workers ex-posed to dust. In a variation of the single-breath methodusing a mixture of CO, inert gas, and oxygen the dif-fusing capacity of the alveolar–capillary membrane, theso-called membrane component, and the capillary bloodvolume can be assessed, an application that might beconfined to more specialized laboratories.
Additional Methods in Diffusion AssessmentDuring recent years, in addition to the classical modalitydescribed above, the IntraBreath method was intro-duced, featuring a single deep inhalation but nobreath-holding before exhalation, certainly advanta-geous in children and dyspneic patients. Using fastinfrared gas analyzers for continuous reading of low-dose CO, (inert) methane, and diffusible acetylene(soluble in blood), the capillary cardiac output can bedetermined in combination with the TLCO. The test canalso be carried out under exercise.
Due to its high patient exposure to CO, the previ-ously used steady-state method has been abandoned. Inaddition to the TLCO test mentioned, a variety of otherdiffusion modalities exist, in particular those using therebreathing technique. Nevertheless, their applicabilityin a regular laboratory and their international recogni-tion might be limited.
8.2.4 Nitrogen-Washout Testfor Determination of FRC
Widely applied for decades in the English-speakingworld, this modality requires a valve and gas deliv-ery system to allow inspiratory switching from air topure oxygen. With each inhaled breath of oxygen, ni-trogen present in the lung, not participating in the gasexchange, will be replaced. Continuous gas sampling atthe mouth by either a single N2 or combined O2/CO2analyzer allows determination of expired nitrogen vol-ume during the N2-washout procedure. Accumulatednitrogen volume is calculated breath by breath until theN2 concentration falls below 1%, marking the end of thewashout sequence. Before the start of the washout, theN2 concentration (including rare inert gases) is 79.2%,which allows the functional residual capacity (FRC) tobe derived as
FRC = VN2
0.79(l) .
For standardization of lung volume determination by N2washout refer to [8.4].
Technical Characteristicsof the N2-Washout Method
Historically, this method required a fast N2 analyzeror a mass spectrometer, both expensive and demand-ing in operation and service. Nowadays, with the adventof fast-response combi-analyzers, the complementarygases O2 and CO2 can be determined instead of N2,involving less complex and expensive technology. How-ever, this novel approach makes synchronization ofdigitized gas samples necessary. As most analyzersdraw a side-stream gas sample from the mouth, caus-ing a delay between gas sample and flow, the responsecharacteristic of the analyzer needs adjustment and cor-rection. In a dedicated calibration routine the operatorshould be offered verification of the response compen-sation. The valve systems employed in N2 washout aresimilar to those used in diffusion testing, compromisinghygiene unless a breathing filter is used.
The test duration of FRC determination by N2washout depends on the lung distribution of the subject,taking a few minutes in a healthy and more than 20 minin a severely obstructed individual.
While classical N2-washout devices use side-streamgas sampling, the novel ultrasound molar mass spirom-etry offers a less complex clinical approach withinstantaneous gas analysis (Sect. 8.1.2, Fig. 8.5). The ul-trasound sensor is able to determine both flow and molarmass, the specific weight of the gas, with a single trans-ducer in the main stream of the respired gas. As molarmasses of O2 and CO2 are distinctively different, theN2 concentration of the breathing gas can be assessedinstantaneously and synchronous to flow and volumechanges [8.19].
8.2.5 Ergospirometry
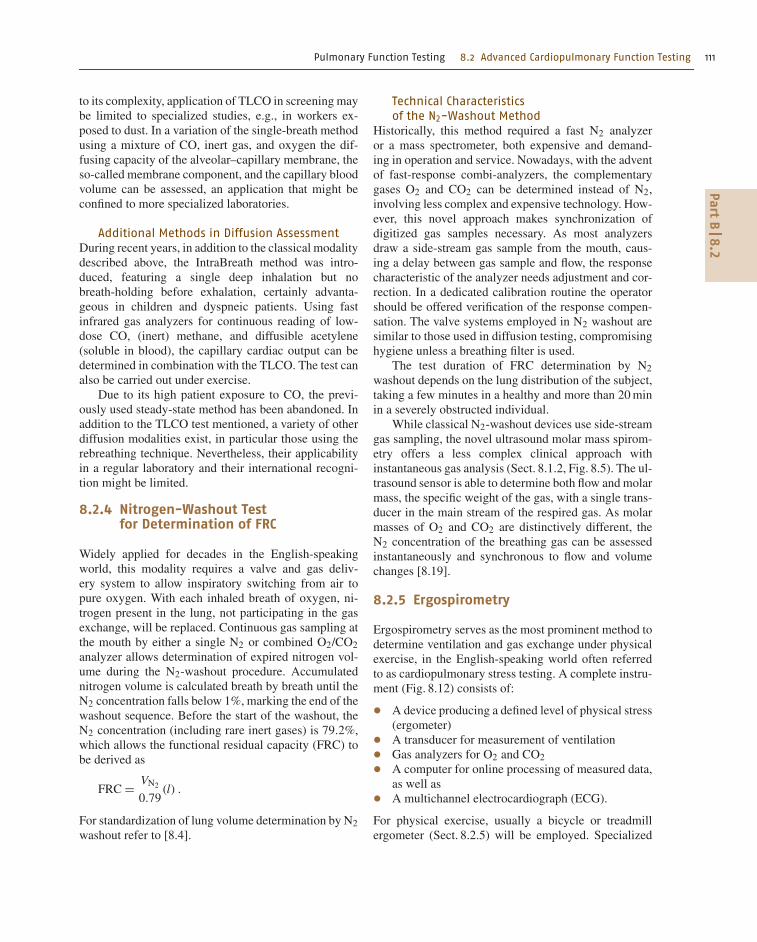
Ergospirometry serves as the most prominent method todetermine ventilation and gas exchange under physicalexercise, in the English-speaking world often referredto as cardiopulmonary stress testing. A complete instru-ment (Fig. 8.12) consists of:
• A device producing a defined level of physical stress(ergometer)• A transducer for measurement of ventilation• Gas analyzers for O2 and CO2• A computer for online processing of measured data,as well as• A multichannel electrocardiograph (ECG).
For physical exercise, usually a bicycle or treadmillergometer (Sect. 8.2.5) will be employed. Specialized
PartB
8.2
112 Part B Functional Diagnostics Devices
Fig. 8.12 Ergospirometry system(Medgraphics, St. Paul, USA)
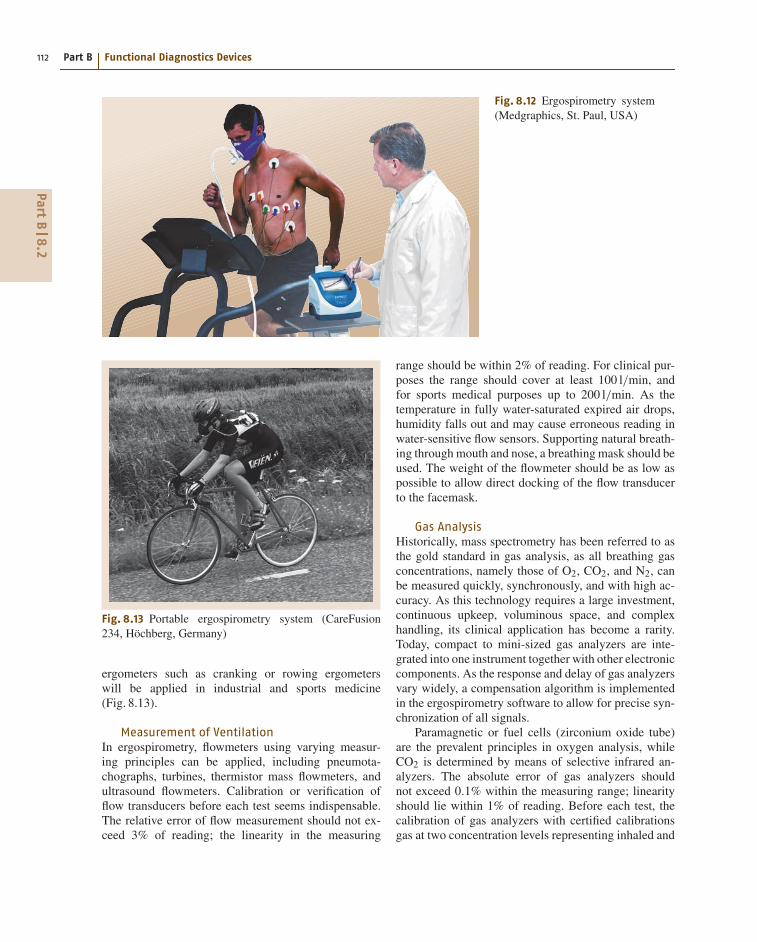
Fig. 8.13 Portable ergospirometry system (CareFusion234, Höchberg, Germany)
ergometers such as cranking or rowing ergometerswill be applied in industrial and sports medicine(Fig. 8.13).
Measurement of VentilationIn ergospirometry, flowmeters using varying measur-ing principles can be applied, including pneumota-chographs, turbines, thermistor mass flowmeters, andultrasound flowmeters. Calibration or verification offlow transducers before each test seems indispensable.The relative error of flow measurement should not ex-ceed 3% of reading; the linearity in the measuring
range should be within 2% of reading. For clinical pur-poses the range should cover at least 100 l/min, andfor sports medical purposes up to 200 l/min. As thetemperature in fully water-saturated expired air drops,humidity falls out and may cause erroneous reading inwater-sensitive flow sensors. Supporting natural breath-ing through mouth and nose, a breathing mask should beused. The weight of the flowmeter should be as low aspossible to allow direct docking of the flow transducerto the facemask.
Gas AnalysisHistorically, mass spectrometry has been referred to asthe gold standard in gas analysis, as all breathing gasconcentrations, namely those of O2, CO2, and N2, canbe measured quickly, synchronously, and with high ac-curacy. As this technology requires a large investment,continuous upkeep, voluminous space, and complexhandling, its clinical application has become a rarity.Today, compact to mini-sized gas analyzers are inte-grated into one instrument together with other electroniccomponents. As the response and delay of gas analyzersvary widely, a compensation algorithm is implementedin the ergospirometry software to allow for precise syn-chronization of all signals.
Paramagnetic or fuel cells (zirconium oxide tube)are the prevalent principles in oxygen analysis, whileCO2 is determined by means of selective infrared an-alyzers. The absolute error of gas analyzers shouldnot exceed 0.1% within the measuring range; linearityshould lie within 1% of reading. Before each test, thecalibration of gas analyzers with certified calibrationsgas at two concentration levels representing inhaled and
PartB
8.2
Pulmonary Function Testing 8.2 Advanced Cardiopulmonary Function Testing 113
expired air is indispensable for assurance of highly pre-cise results. Modern ergospirometry systems containa software-controlled module for automatic calibrationand verification.
Mixing Bag MethodReference to this method is made for didactic reasonsonly, as practically all presently available instrumentswork with the breath-by-breath method. The older mix-ing method separates inspiratory and expiratory air ofthe subject by use of a so-called Y-valve. The expiratorygas is collected in a mixing bag, from which a contin-uous sample is drawn and analyzed. The flowmeter ismounted on the expiratory side at the entrance port ofthe mixing bag, allowing determination of expiratorytidal volume and minute ventilation. Oxygen uptakeVO2 can be calculated according to
V̇O2 = c · VE(FIO2 · kS − FEO2
)(1/min) ,
where ks is the co-called shrinking factor given by
kS = (100− FEO2 − FECO2)
(100− FIO2),
where VE is the expiratory minute ventilation, and FI theinspiratory and FE the mean expiratory concentration ofO2 and CO2, respectively. Additionally a factor for theconversion from BTPS to standard temperature pressuredry (STPD) conditions has to be considered.
CO2 output can be calculated accordingly. Responseof gas analyzers or delay of the gas sample are of lesserimportance as the gas mixing introduces a fairly hightime constant. For decades, this modality has provenits clinical reliability. Due to its inability to followphysiological responses to changing exercise levels in-stantaneously, the mixing bag system has all but beenreplaced by the breath-by-breath method.
Breath-by-Breath MethodIn the breath-by-breath (B × B) mode, flow is con-tinuously measured at the mouthpiece or a breathingmask. A continuous gas sample is drawn as proximalas possible through thin moisture-absorbing tubing andanalyzed by fast-response gas analyzers. Flow and gasconcentrations need to be synchronized and preciselybrought into phase. Also, the response of each ana-lyzer needs software correction. The oxygen uptake iscalculated according to
V̇O2 =∫
FO2 · V̇ dt (1/min) ,
where VO2 is the oxygen uptake, FO2 is the O2 con-centration or fraction, and V̇ is the flow at the mouth.Additionally factors for conversion from BTPS to STPDmust be applied by the software. The CO2 output iscomputed accordingly.
As elegant as it seems, the B × B method can bringabout inaccuracies and errors which need to be ad-dressed by the operator and can only be avoided byfrequent calibration and consequent verification, in-cluding precise analyzer delay adjustment. Equipmentoperators should demand validation and documenta-tion of implemented algorithms from the manufacturersor suppliers of ergospirometry systems. Therefore, anopen structured software showing the delay and re-sponse adjustment of the analyzers in real time, offeringstep-by-step procedures for calibration and verification,facilitates quality assurance.
Clinical Value of ErgospirometryModern ergospirometry is based on the work of Holl-mann and Wasserman [8.20].
For clinical purposes, physical exercise is increasedstepwise, e.g., using a bicycle ergometer, by incrementsof 25 W of 2–3 min each. This form of exercise iswell suited for patients, allowing the cardiovascular sys-tem sufficient time to adapt to the exercise level, whileavoiding muscular fatigue, anaerobic metabolism, andlactate production.
As a valid measure of global physical performance,oxygen uptake directly relates to the interrelated organsystem of heart–lung circulation, while the maximumoxygen uptake or vita maxima offers an objective as-sessment of the maximal performance capacity of thetest subject. By visualizing the dynamics of ventila-tion, gas exchange, and heart rate, the latter derivedfrom ECG, reduced capacity of each involved organmay be determined and differentiated from a lim-ited degree of motoric efficiency [8.21]. Secondaryparameters such as respiratory ratio and breathingequivalent (Table 8.4) as well as exercise-related bloodgases assist in detecting compensation mechanismsand evaluating deficiencies even at submaximal stresslevels.
The determination of the aerobic–anaerobic meta-bolic transition, briefly called the anaerobic threshold,plays an important role is assessing and following theeffects of training in rehabilitation and fitness centers.After addition of blood gases and blood pressure data,a conclusive report of ergospirometry test results is bestgiven in graphical format, e.g., in the nine-field graphaccording to Wasserman [8.20].
PartB
8.2
114 Part B Functional Diagnostics Devices
Table 8.4 Parameters in ergospirometry
Parameter Abbreviation/definition Unit
Load (bicycle ergometer) P W
Speed (treadmill ergometer) v km/h
Elevation (treadmill ergometer) s %
Tidal volume VT l
Respiratory rate R f /min
Minute ventilation VE l/min
Oxygen uptake VO2 l/min
Carbon dioxide output VCO2 l/min
Heart rate HR min−1
Respiratory ratio RQ = VCO2/VO2 –
Breathing equivalent (for O2) EQO2 = VE/VO2 –
Breathing equivalent (for CO2) EQCO2 = VE/VCO2 –
Oxygen pulse VO2Pulse = VO2/HR ml/(min kg)
Alveolar-arterial difference AaDO2 mmHg
Functional dead space VDf %
For assessments in compensation claims and otherrating cases, in particular in industrial medicine, er-gospirometry is the tool of choice when an objectivemeasure of reduced capacity is required. Also in theassessment of athletes, an ergospirometry system repre-sents a valuable instrument which can be found in mostsports medicine centers today.
A minimum of 30 min should be considered forperforming a complete stress test, including patientpreparation, calibration, and evaluation of data.
8.2.6 Noninvasive Determinationof Cardiac Output
While ergospirometry allows only indirect assessmentof cardiac function, oxygen uptake can be instrumentalin determining cardiac output through the Fick equation
V̇O2 = Qt ·avDO2 (1/min) .
The arterio-venous O2 content difference, which is aneffort-dependent variable, requires invasive assessmentby catheterization.
One of the internationally recognized noninvasivestandards to determine cardiac output is the so-calledCO2-rebreathing method, an application of the Fickequation above to carbon dioxide rather than to oxygen
Qt = V̇CO2
avDCO2= V̇CO2
(CvCO2 −Ca CO2)(l/min) ,
where avDCO2 is the arterio-venous content differ-ence, and CvCO2 and CaCO2 are the mixed-venous
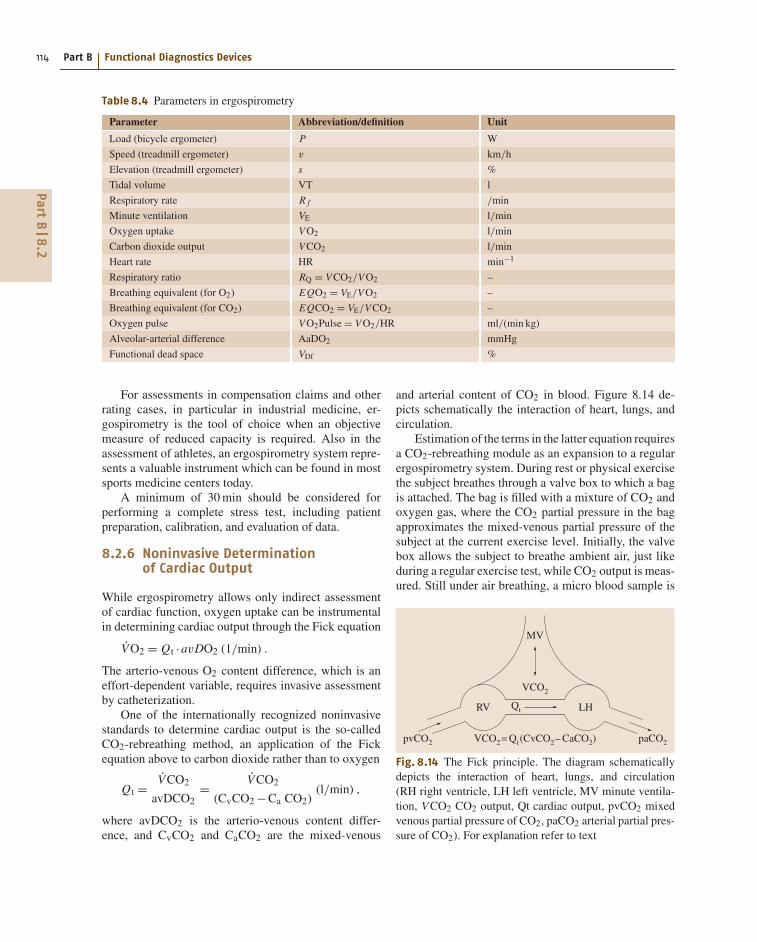
and arterial content of CO2 in blood. Figure 8.14 de-picts schematically the interaction of heart, lungs, andcirculation.
Estimation of the terms in the latter equation requiresa CO2-rebreathing module as an expansion to a regularergospirometry system. During rest or physical exercisethe subject breathes through a valve box to which a bagis attached. The bag is filled with a mixture of CO2 andoxygen gas, where the CO2 partial pressure in the bagapproximates the mixed-venous partial pressure of thesubject at the current exercise level. Initially, the valvebox allows the subject to breathe ambient air, just likeduring a regular exercise test, while CO2 output is meas-ured. Still under air breathing, a micro blood sample is
pvCO2
Qt
paCO2
MV
RV LH
VCO2
VCO2= Qt(CvCO2– CaCO2)
Fig. 8.14 The Fick principle. The diagram schematicallydepicts the interaction of heart, lungs, and circulation(RH right ventricle, LH left ventricle, MV minute ventila-tion, V CO2 CO2 output, Qt cardiac output, pvCO2 mixedvenous partial pressure of CO2, paCO2 arterial partial pres-sure of CO2). For explanation refer to text
PartB
8.2
Pulmonary Function Testing 8.2 Advanced Cardiopulmonary Function Testing 115
drawn from the subject’s ear lobe and analyzed, yieldingthe arterial partial pressure paCO2. From a digital disso-ciation curve, the arterial CO2 content CaCO2 is derived.If micro blood gas analysis is not available, paCO2 canbe estimated from the reading of the end-expiratory CO2partial pressure petCO2, an acceptable approximation inhealthy subjects. After switching the subject’s breathingto the bag at the end of an expiration, the CO2/O2 gasmixture is inhaled. While rebreathing to and from thebag continues for several breaths, CO2 partial pressurewill equilibrate between the lung and the bag as long asa constant pvCO2 is delivered from the right heart andno recirculation occurs. Only a few rebreathing breathcycles are needed to reach a CO2 equilibrium, which ismonitored, and the mixed-venous partial pressure deter-mined. Applying a digital dissociation curve, the CvCO2content is derived, the last component in the noninvasivedetermination of cardiac output.
The CO2-rebreathing method is a very elegant pro-cedure, bearing no risk for the subject while requiringlittle cooperation. Its accuracy compares well with thatof invasive methods [8.22]. In contrast to most of thecatheter procedures, the rebreathing method will onlydetermine pulmonary cardiac output without right-to-left shunt. While the expansion module for an existinginstrument may not be very complex, the software up-grade will determine the cost.
8.2.7 Metabolic Activity Monitoring
Although portable ergospirometry systems have seena lot of progress in size and versatility (Fig. 8.13), theirapplication in normal everyday life and at the work-place is still very limited. The biggest obstacle seems
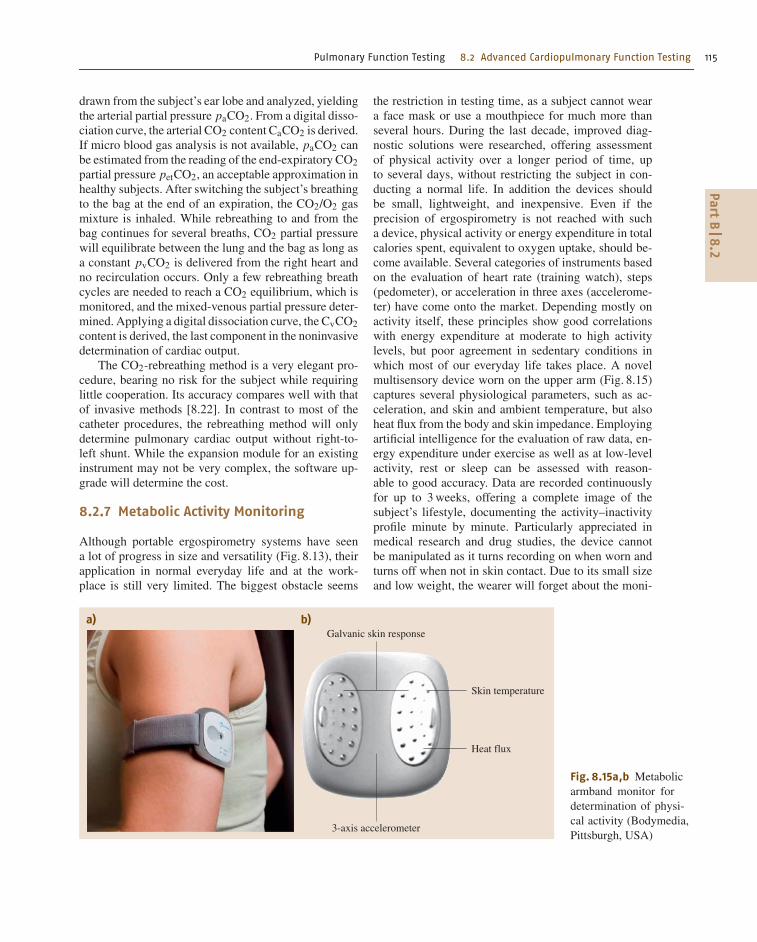
Galvanic skin responsea) b)
Skin temperature
Heat flux
3-axis accelerometer
Fig. 8.15a,b Metabolicarmband monitor fordetermination of physi-cal activity (Bodymedia,Pittsburgh, USA)
the restriction in testing time, as a subject cannot weara face mask or use a mouthpiece for much more thanseveral hours. During the last decade, improved diag-nostic solutions were researched, offering assessmentof physical activity over a longer period of time, upto several days, without restricting the subject in con-ducting a normal life. In addition the devices shouldbe small, lightweight, and inexpensive. Even if theprecision of ergospirometry is not reached with sucha device, physical activity or energy expenditure in totalcalories spent, equivalent to oxygen uptake, should be-come available. Several categories of instruments basedon the evaluation of heart rate (training watch), steps(pedometer), or acceleration in three axes (accelerome-ter) have come onto the market. Depending mostly onactivity itself, these principles show good correlationswith energy expenditure at moderate to high activitylevels, but poor agreement in sedentary conditions inwhich most of our everyday life takes place. A novelmultisensory device worn on the upper arm (Fig. 8.15)captures several physiological parameters, such as ac-celeration, and skin and ambient temperature, but alsoheat flux from the body and skin impedance. Employingartificial intelligence for the evaluation of raw data, en-ergy expenditure under exercise as well as at low-levelactivity, rest or sleep can be assessed with reason-able to good accuracy. Data are recorded continuouslyfor up to 3 weeks, offering a complete image of thesubject’s lifestyle, documenting the activity–inactivityprofile minute by minute. Particularly appreciated inmedical research and drug studies, the device cannotbe manipulated as it turns recording on when worn andturns off when not in skin contact. Due to its small sizeand low weight, the wearer will forget about the moni-
PartB
8.2
116 Part B Functional Diagnostics Devices
tor on his arm and just pursue his daily routine. A broadliterature base supports its application in different areasof pulmonary medicine, particularly severe chronic ob-structive pulmonary disease (COPD) [8.23] and cysticfibrosis [8.24] where activity is an important outcomeparameter.
8.2.8 Planning and Laboratory SpaceConsiderations
The laboratory room in which a body plethysmographwill be installed does not need to be particularly spa-cious but should be in a quiet location, separated from
any through traffic. Big windows adjacent to the bodybox may lead to pressure artifacts caused by wind gustsor sun exposure. The diffusion test can be performed inthe same room as the body plethysmograph or with anadd-on unit within the chamber while the box door isopen. N2-washout devices or spirometers can be placedin a laboratory room or on a trolley for mobile use.
In contrast, ergospirometry requires a spaciousroom with good ventilation, in particular when a tread-mill or ergometer, blood gas analyzer or other labo-ratory equipment should be placed in the same room.A changing room and a shower should be available forthe test subjects.
References
8.1 M.R. Miller, J. Hankinson, V. Brusasco, F. Bur-
gos, R. Casaburi, A. Coates, R. Crapo, P. Enright,
C.P.M. van der Grinten, P. Gustafsson, R. Jensen,
D.C. Johnson, N. MacIntyre, R. McKay, D. Navajas,
O.F. Pedersen, R. Pellegrino, G. Viegi, J. Wanger:
Standardisation of spirometry, Eur. Respir. J. 26,
319–338 (2005)
8.2 European Respiratory Society: Standardized lung
function testing, Eur. Respir. J. 6(Suppl 16), 3–52
(1993)
8.3 C. Buess, P. Pietsch, W. Guggenbühl, E.A. Koller:
A pulsed diagonal beam ultrasonic air flowmeter,
J. Appl. Physiol. 61(3), 1195–1199 (1986)
8.4 J. Wanger, J.L. Clausen, A. Coates, O.F. Peder-
sen, V. Brusasco, F. Burgos, R. Casaburi, R. Crapo,
P. Enright, C.P.M. van der Grinten, P. Gustafsson,
J. Hankinson, R. Jensen, D. Johnson, N. MacIntyre,
R. McKay, M.R. Miller, D. Navajas, R. Pellegrino,
G. Viegi: Standardisation of the measurement
of lung volumes, Eur. Respir. J. 26, 511–522
(2005)
8.5 R. Pellegrino, G. Viegi, V. Brusasco, R.O. Crapo,
F. Burgos, R. Casaburi, A. Coates, C.P.M. van der
Grinten, P. Gustafsson, J. Hankinson, R. Jensen,
D.C. Johnson, N. MacIntyre, R. McKay, M.R. Miller,
D. Navajas, O.F. Pedersen, J. Wanger: Interpretative
strategies for lung function tests, Eur. Respir. J. 26,
948–968 (2005)
8.6 T.I. Petty, D.J. Pierson, N.P. Dick, L.D. Hudson,
S.H. Walker: Follow-up evaluation of a prevalence
study for chronic bronchitis and chronic airway ob-
struction, Am. Rev. Respir. Dis. 114, 881–890 (1976)
8.7 M. Gappa, C. Buess, S.I. Fuchs: Slope indices from
ultrasonic tidal molar mass-volume curves, ERS
Congress, Copenhagen (2005)
8.8 R.L. Jensen, C. Buess, R.O. Crapo: Ultrasonic mea-
surements of CO2 during quiet breathing may
diagnose degree of airway obstruction, ATS Conven-
tion (2005)
8.9 E. Oostveen, D. MacLeod, H. Lorino, R. Farré, Z. Han-
tos, K. Desager, F. Marchal, ERS Task Force: The forced
oscillation technique in clinical practice: Method-
ology, recommendations and future developments,
Eur. Respir. J. 22, 1026–1041 (2003)
8.10 H.J. Smith, P. Reinhold, M.D. Goldman: Forced os-
cillation technique and impulse oscillometry, Eur.
Respir. J. 31, 72–105 (2005)
8.11 J. Winkler, A. Hagert-Winkler, H. Wirtz, G. Hoheisel:
Die moderne Impulsoszillometrie im Spektrum lun-
genfunktioneller Messmethoden, Pneumology 63,
461–469 (2009)
8.12 W.T. Ulmer, D. Nolte, J. Lecheler: Die Lungenfunk-tion. Methodik und klinische Anwendung (Thieme,
Stuttgart 2003)
8.13 A.B. DuBois, S.Y. Botelho, J.H. Comroe Jr.: A new
method for measuring airway resistance in man
using a body plethysmograph: Values in normal
subjects and in patients with respiratory disease,
J. Clin. Invest. 35(3), 327–335 (1956)
8.14 A.B. DuBois, S.Y. Botelho, G.N. Bedell, R. Marshall,
J.H. Comroe Jr.: A rapid plethysmographic method
for measuring thoracic gas volume: A comparison
with a nitrogen washout method for measuring
functional residual capacity in normal subjects,
J. Clin. Invest. 35(3), 322–326 (1956)
8.15 D.O. Rodenstein, D.C. Stanjescu: Frequency depen-
dence of plethysmographic volume in healthy and
asthmatic subjects, J. Appl. Physiol. 54, 159–165
(1983)
8.16 H. Matthys: Pneumologie (Springer, Berlin, Heidel-
berg 1988)
8.17 J.E. Cotes, A.M. Hall: The transfer factor for the
lung; normal values in adults. In: Normal Valuesfor Respiratory Function in Man, ed. by P. Arcangeli
(Panminerva Medica, Torino 1970) pp. 327–343
8.18 N. MacIntyre, R.O. Crapo, G. Viegi, D.C. Johnson,
C.P.M. van der Grinten, V. Brusasco, F. Burgos,
R. Casaburi, A. Coates, P. Enright, P. Gustafsson,
PartB
8

Pulmonary Function Testing References 117
J. Hankinson, R. Jensen, R. McKay, M.R. Miller,
D. Navajas, O.F. Pedersen, R. Pellegrino, J. Wanger:
Standardisation of the single-breath determination
of carbon monoxide uptake in the lung, Eur. Respir.
J. 26, 720–735 (2005)
8.19 S.I. Fuchs, C. Buess, S. Lum, W. Kozlowska,
J. Stocks, M. Gappa: Multiple breath washout with
a sidestream ultrasonic flow sensor and mass spec-
trometry: A comparative study, Pediatr. Pulmol. 41,1218–1225 (2006)
8.20 K. Wasserman, J.E. Hansen, D.Y. Sue: Principlesof Exercise Testing and Interpretation: IncludingPathophysiology and Clinical Applications (Lippin-
cott Raven, Philadelphia 2004)
8.21 N.L. Jones: Clinical Exercise Testing (Elsevier, Ams-
terdam 1997)
8.22 N.L. Jones: Evaluation of a microprocessor-
controlled exercise system, J. Appl. Physiol. 57,
1312–1318 (1984)
8.23 H. Watz, B. Waschki, T. Meyer, H. Magnussen: Phys-
ical activity in patients with COPD, Eur. Respir. J. 33,
262–272 (2009)
8.24 T. Troosters, D. Langer, B. Vrijsen, J. Segers,
K. Wouters, W. Janssens, R. Gosselink, M. De-
cramer, L. Dupont: Skeletal muscle weakness,
exercise tolerance and physical activity in adults
with cystic fibrosis, Eur. Respir. J. 33, 99–106
(2009)
PartB
8

http://www.springer.com/978-3-540-74657-7