speculative vacancies 7 empty investment … · 1 catherine cashmore investors empty homes...
TRANSCRIPT

1
Catherine Cashmore
INVESTORS EMPTY HOMES ARTIFICIALLY INFLATE HOUSING SUPPLY CRISIS. DO NOT TRESPASS!
SPECULATIVE VACANCIES 7 EMPTY INVESTMENT HOMES IGNORED
2
ContentsAbout ................................................................................................. 3
Melbourne Top 20 Vacancy Heat Map ................................. 4
Executive Summary .................................................................... 5
Introduction .................................................................................... 6
Methodology – How do you assess if a property is vacant? ................................................................ 9
Melbourne’s Speculative Vacancies report – Water Data Analysis. ................................................10
Findings and Analysis ...............................................................13
Conclusion ....................................................................................25
Recommendations ....................................................................28
Footnotes .....................................................................................29
Appendices ...................................................................................31
3
About
Prosper AustraliaProsper is a research-based organisation in Melbourne seeking to advance economic efficiency and social justice through tax reform and education. It is at the forefront of advocating the ideas and policies of the U.S. classical liberal economist Henry George (1839-1897), who believed poverty and social disorder stems from the misuse of the third factor of production, land.
The AuthorCatherine Cashmore Is an E J Craigie award winner, journalist and real estate industry expert, covering all aspects relating to the property market and economic policy. She can be contacted at [email protected] for report purposes. www.catherinecashmore.com.au
Acknowledgements The author would like to thank Paul D. Egan ([email protected]) for data analysis, editorial assistance and comments.
Project Director: Karl Fitzgerald - [email protected]
Thanks to Melbourne’s water utilities for providing the data
Responsibility for the content of this report lies with the author.
PrivacyThe privacy of individual homeowners has not been compromised in compiling this report. The water consumption of individual properties or personal details of homeowners was not provided by water retailers; data was aggregated at the suburb level.

4
No. Suburb Total 0L/day Ratio <=50L/day Ratio
1 Docklands 2,883 489 17.0% 779 27.0%
2 Cardinia/Clyde/Clyde North 1,258 156 12.4% 588 46.7%
3 Carlton South 1,584 115 7.3% 201 12.7%
4 Essendon North 1,381 78 5.6% 148 10.7%
5 West Melbourne 2,058 114 5.5% 227 11.0%
6 Essendon 9,180 442 4.8% 796 8.7%
7 Abbotsford 3,153 144 4.6% 396 12.6%
8 Niddrie 2,469 110 4.5% 228 9.2%
9 Altona 5,392 237 4.4% 533 9.9%
10 Airport West 3,604 143 4.0% 343 9.5%
11 Williams Landing 1,769 69 3.9% 146 8.3%
12 Highett 3,435 131 3.8% 319 9.3%
13 Sunshine 4,405 157 3.6% 339 7.7%
14 West Footscray 5,130 187 3.6% 391 7.6%
15 Moonee Ponds 6,203 209 3.4% 412 6.6%
16 Truganina 4,324 145 3.4% 396 9.2%
17 Flemington 3,361 112 3.3% 215 6.4%
18 Kingsville 1,786 57 3.2% 114 6.4%
19 Albion 1,964 61 3.1% 149 7.6%
20 Ascot Vale 6,062 185 3.1% 413 6.8%
1
2
3
4
5
6
7
810
11
16
13 14 15
1819
20
17
12
9
Melbourne Top 20 Vacancy Heat Map
5
Executive SummaryProsper Australia’s Speculative Vacancies Report demonstrates the consequential effect of current government housing, tax and supply policies through assessment of the number of potential long-term commercial and residential vacancies in the Greater Melbourne Metropolitan region, during the calendar year of 2013.
Melbourne’s three main metropolitan water retailers, City West Water (CWW), South East Water (SEW), and Yarra Valley Water (YVW), have made their data available for the purposes of this report, with very low recordings of water consumption data used as a proxy to determine vacant dwellings.
Speculative Vacancies (SVs) are measured as properties with abnormally low water usage. Any residential landholding using less than 50 litres per day (LpD), averaged over a 12 month period is deemed a speculative vacancy. In many cases, these are likely held for speculative gain by property investors.
Because they are not for rent, they are overlooked by current short-term vacancy measures reported by real estate firms - these are only based on ‘available for rent’ advertised dwellings as a percentage of total rental properties within a given locality.
For seven years this report has advocated for a SV measure in addition to available properties to rent, to give a holistic analysis of utilisation of the housing stock. In a market dominated by investors hiding under a mantra of ‘a housing supply crisis’, greater transparency has never been more urgent. Analysis was undertaken of 94.4% of 1,475,771 residential properties in 393 suburbs over the calendar year of 2013. Data indicates 64,386, or 4.4 per cent of Melbourne’s housing stock is potentially vacant and unused.
An examination of 126,529 non-residential properties in 399 suburbs over the same period identifies 29,357 or 23.2 per cent of Melbourne’s commercial stock is also potentially vacant and unused.1This level of latent supply is not usually identified outside of a significant downturn in economic activity. Yet, if the latent supply of withheld land were put to effective use, it would theoretically reduce cost-of-living pressures for tens-of-thousands of low-income families forced to live at the margins.
In light of this, government inaction on Australia’s housing affordability crisis is indefensible. Access to affordable shelter is a basic human right and vital to the prosperity of our nation.
The decline in housing affordability for first-time buyers has been exacerbated by impediments to the release of land for housing. Our current system of taxation compounds the problem by rewarding ‘property barons’ while tax inefficiencies such as developer charges are passed onto the buyer in the form of higher land and housing costs.
This report recommends fundamental reforms which are required to reduce the propensity toward volatile boom and bust land cycles. These are fuelled by speculation and unsustainable levels of household debt.
We submit that these causes would be alleviated or removed if current transaction taxes were replaced with a holding tax levied on the unimproved value of land. The report further advocates how the funds can be raised to aid infrastructure development as well as incentivising housing supply. The housing market must respond in a timely manner to homebuyer rather than speculator demand.
6
IntroductionGOVERNMENT INACTION ON AUSTRALIA’S HOUSING AFFORDABILITY CRISIS.
The fact that Australia has an affordability crisis is not in dispute. Government inaction for more than a decade must be questioned.
Since the early 2000s, there have been three Senate Inquiries to tackle Australia’s escalating land values and declining rates of homeownership, including Australia’s Future Tax System Review that made a number of recommendations on housing reform.
The first inquiry conducted by the Productivity Commission in 2004, determined that prices had surpassed levels explicable by demographic factors and supply constraints alone. They stressed that a large surge in demand had rather been “predicated on unrealistic expectations (in a ‘supportive’ tax environment) of on going capital gains.”2
The second inquiry overseen by a Select Senate Committee in 2008, found that the average house price in capital cities had climbed to over seven years of average earnings and once again, they identified inequitable disparities in the overall fairness of the tax system, that had lead to “speculative investment on second and third properties.”3
Australia’s Future Tax System’ review conducted in May 2010, stated that tax benefits and exemptions had been capitalised into higher land values, encouraging investors to chase ‘large’ capital gains over rental income and landowners to withhold supply.4
The third and last inquiry which is currently being conducted by the Senate Economics References Committee commencing in March 2014, received a key submission from Prosper Australia examining nine chief economic measures of land, debt, and finance – and found all to be at, or close to historic highs.5
“It took forty years from 1950 to 1990 for housing prices to double, but only fifteen years between 1996 and 2010 to double again.” 6
The submission demonstrated a sharp rise in the nominal house price to inflation, rent and income ratios, driven by a rapid and unsustainable
acceleration of mortgage-debt relative to GDP.
The current trend dwarfs the recessionary land bubbles of the 1830s, 1880s, 1920s, mid-1970s and late 1980s that triggered economic havoc. This land bubble results in Australian households suffering some of the highest levels of private debt in the developed world.
Today, the investor share of the market is close to 50 per cent.7 Investor finance commitments are rising at their fastest pace since 2007. Sixty-five per cent of loans to investors are on interest only terms and 95 per cent of all bank lending is being channelled into real estate – mostly residential.8
Yet despite these findings, policy makers and industry advocates repeatedly claim that the primary driver of Australia’s affordability crisis is a lack of supply - and that increasing the stock of housing alone will reduce prices enough to rectify the problem, without the need to address the demand side of the equation through necessary and far-reaching tax reform.
Ultimately, this is not possible because our policies work directly against it.
Investor and housing tax exemptions worth an estimated $36 billion a year9 have distorted the Australian dream of owning a home into a vehicle for financial speculation.
Consequently, rising land values that impoverish the most vulnerable sectors of our community are widely celebrated. Meanwhile Australia’s federal members of parliament have accumulated a $300 million portfolio of residential dwellings.10 Ninety four per cent of federal MP’s own investment properties. They stand solidly against all recommendations from previous Senate Inquiries for meaningful and equitable tax reform.
Under current tax policy, investors that withhold primary land and dilapidated housing out of use are rewarded with substantial unearned incomes due to government failure to collect the economic land rent (the ‘capital gains’) society generates through public investment into social services.
7
The subsequent uplift in values that comes as the result of neighborhood upgrades and taxpayer funded facilities - accelerated by plentiful mortgage debt and restrictive zoning constraints, capitalises into the upfront cost of land by tens of thousands of dollars year on year. Yet rental incomes, at typically no more than $18,000 to $19,000 per annum are a mere trifle in comparison.
In the 12 months to September 2014 alone, Melbourne’s median house price increased by 11.7 per cent – over $60,000. In contrast, gross rental yields at 3.3 per cent are currently the lowest in the country and the lowest on record.11
This broadening divergence between rental income and ‘capital growth’ typifies the commodification of housing used only as a tool for profit-seeking gain.
Indeed, net rental incomes in Australia have been declining since 2001. Growth in both the relative and absolute number of negatively-geared investors between 1994 and 2012 has soared by 153 per cent. In contrast, positively-geared investors have increased by a much lesser 31 per cent.12
Large divergences between rental income and land price inflation thus produce an unhealthy challenge to both housing affordability and economic stability.
They lead to ‘speculative vacancies’ (SVs) – properties that are denied to thousands of tenants and potential owner-occupiers, lowering relative vacancy rates and placing upwards pressure on both rents and prices. The housing supply crisis is therefore greatly obscured by current vacancy measures that cannot identify sites that are withheld from the market for rent-seeking purposes.
The consequential subversion of housing policy is evident. Philip Soos and Paul Egan found that since 1996 Australia has built on average one new dwelling for every two new net persons nation wide.13 Yet over the same period, government legislation, politically manufactured to protect the unearned profits of a large cohort of speculative investors, has resulted in vacant median land prices on the fringes of Australia’s capital cities ballooning from approximately $90 per square metre in 1996, to over $530 per square metre today. 14
Indeed, there is no better example of the astonishing escalation of land price inflation than the very recent report of a Melbourne family who purchased a 108 hectare Sunbury ‘hobby farm’ in 1982 for $300,000. Following residential rezoning, an estimated windfall gain of over $60 million was realised.15
This means of ‘creating wealth’ common in most western nations sits at the root of many of our current economic and social problems. Our tax and housing policies shift income to landowners, eroding the living standards of future generations of Australians who are required to shoulder an increasing burden of debt just to secure a foothold on the fabled ‘property ladder’.
The effect is to broaden the intergenerational divide as families are forced to live on the threshold, marginalised into areas lacking essential amenities and jobs, while 92 per cent of speculative investment into real estate pursues the ‘capital gains’ associated with second-hand dwellings, rather than increasing the stock of housing through the purchase of new supply.16
Aided by a complicit banking system, Australia’s rising house prices are gradually destabilising the economy. High land prices damage Australia’s competitiveness with higher living costs. The resulting demand on both business and wages channels investment away from genuine value adding activities. This leads to a gross and wasteful misallocation of credit to feed an elevated level of speculative rent-seeking demand.
The debilitating and destabilising effect on the economy can be evidenced clearly in a painful and rising trend of income and housing inequality that places an unsustainable strain on the capacity of the welfare state to compensate.17
As many as 105,000 Australians are currently homeless, while between the dates of 1991 and 2011 homeownership among 25-34 year olds has declined from 56 per cent to 47 per cent, among 35-44 year olds from 75 per cent to 64 per cent, and among 45-54 year olds from 81 per cent to 73 per cent.18
Homelessness is often blamed on dysfunctional relationships, mental illness, drug abuse, domestic violence, job losses and so forth. But at the root lays an acute lack of affordable accommodation available for the most impoverished members of our community in need of both security and shelter.
Prosper Australia’s seventh Speculative Vacancies report gives a unique insight into the impact of current housing policy by highlighting the total number of underutilised and empty residential and commercial properties currently withheld from market.
We identify a potential 64,386 vacant dwellings
8
across prime urban areas of the greater metropolitan region – ignored by members of both state and federal government.19
Melbourne is a perfect case study for this report.
• Its real estate is ranked among the most expensive in the developed world
• It has dominated Australia’s population growth, attracting the largest proportion of overseas immigrants
• Successive planning Ministers have engaged in a vigorous re-zoning process, enabling developers to attain their desired 15 years land supply objective ‘to enable more affordable housing’ - yet vacant dwellings are currently laid to waste...20
As government and the real estate industry are not sources of impartial information, this report adds a valuable dimension to understanding the divergence between real estate industry short-term vacancy rates (the percentage of properties available for rent as a proportion of the total rental stock) and the number of potentially vacant properties exacerbating Australia’s housing crisis. Throughout the report SQM Research’s short-term vacancy rates are referenced.21 The report believes these figures should be added to our Speculative Vacancy findings to provide a wider measurement of vacant housing supply.
9
Methodology – How do you assess if a property is vacant?International Studies:Since the onset of the sub-prime recession in 2008, there has been increasing international interest in assessing the number of vacant properties being held out of use.
Census DataThe vast majority of jurisdictions rely on Census data alone, but this is an imperfect measure that overstates the number of vacancies, as it captures those dwellings without anyone home on census night. Nonetheless, recent surveys suggest there are more than 11 million homes vacant across Europe - 300,000 in Greece, 400,000 in Ireland, and up to 3.4 million in Spain.22
UK Empty Homes CampaignThe ‘Empty Homes’ campaign in the UK obtains vacancy data from council tax information and annually published statistics. UK councils offer a range of exemptions and discounts from the council tax for empty homes. In some areas, they charge a higher level of council tax (‘premiums’). The number of empty dwellings is then estimated from the sum of exemptions, premiums and discounts.
There are currently 635,127 empty homes in England according to the 2013 Empty Homes Statistics report. However, this figure is conservative considering the categories of homes absent from the data: flats above shops, and uninhabitable homes in very poor condition or those awaiting demolition that can be excluded from the council tax. http://bit.ly/10u7YXa
France – Analysis of Electricity UseIn France, records from the EDF, the country’s national electricity company, suggest around 40,000 homes and offices in Paris, have been disconnected from the grid for an extended period of time. http://bit.ly/10u7XSX USA – Vacant Home ProgramsCertain jurisdictions in the USA also have vacant home programs. These include, San Diego, Los Angeles, Portland, and Winnipeg. However they are mostly reliant on reports from Neighbourhood Watch and Community-Planning Groups and therefore the data is subject to mis-reporting. The United States Federal Reserve identifies long-term vacancies of two years or more using community census data and information collected from the United States Postal Service (USPS), that tracks the addresses of dwellings have been “vacant”, or “No-Stat” each quarter. By this measure, there are currently more than 14 million long-term vacancies in America not for rent, or sale. http://1.usa.gov/10u7Oih
ChinaStudents from The Survey and Research Centre for China Household Finance (based at the Southwestern University of Finance and Economics) conduct a quarterly survey of households in 262 counties in 29 provinces across China via a combination of telephone and face-to-face to interviews.
Current statistics estimate that in these areas, China has 3.5 million homes that remain vacant, untenanted or unsold. http://bit.ly/10u7HmX

10
Melbourne’s Speculative Vacancies report – Water Data Analysis.For the purpose of this report, long-term Speculative Vacancies (SVs) are assessed using consumption figures over a 12-month period from Melbourne’s three major metropolitan water providers - City West Water, Yarra Valley Water and South East Water. Low water consumption is used as a proxy for identifying underutilised residential and commercial properties across the city.
Unlike electricity and gas companies, Melbourne households are not able to change their water retailer within the metropolitan area. This prevents fragmentation of the data, further assisting the consistency of the results. There is some minor overlap in servicing to suburbs that sit on the boundaries between retailers, although this has negligible impact on the aggregate data.
A property using no water (zero litres per day) is clearly vacant, however other factors need to be taken into account that can positively or negatively bias the results.
For this reason, a criterion of 50 litres or less per day (LpD) over a 12-month period has been chosen as the benchmark for assessing potential long term SVs and underutilised dwellings.
Current residential water use on a per person basis is 161LpD (2012–13) and total water use – residential, non-residential and non-revenue water – is 252LpD, including the loss of water through burst water mains and leaks.23
Meter readings are made once every quarter, so an exact measurement of daily water consumption is not possible. However, research undertaken by all three major water providers gives a good insight into patterns of daily use for the majority of households.
According to studies taken across the metropolitan region, only 3 per cent of households use less than 50 LpD, yet one slowly dripping tap can consume 5,000 litres of water over a three-month period - an amount that can add up to approximately 55 litres per day. Leaks constitute almost 6 per cent of all residential water usage and notably, many go unnoticed. 24
Melbourne’s total water usage can be separated into its constituent categories: residential purposes - 65 per cent, non-residential - 25 per cent, and non-revenue water (unpaid water supplies) - 10 per cent.
Research identifies that as the number of people in each household increases, the pattern of water use falls on a per capita basis. 25
According to the 2011 Census data, the average number of people per household for the greater Melbourne region is 2.6 persons.
As a percentage of all households, 23.3 per cent are single person households, 32 per cent two person households, 17 per cent three person households, 17.4 per cent four person households, 7.2 per cent 5 person households, and 3.2 per cent are households with six persons or more.26
Research undertaken on behalf of all three water providers, City West Water, South East Water and Yarra Valley Water show average daily water use per household per day over a winter period as 353LpD. This is more than 7 times the 50LpD benchmark.
The same study identified average daily usage for a two-person household as 320LpD – more than 6 times the 50LpD benchmark, while a single person household’s average daily usage is 157LpD, more then 3 times the 50LpD benchmark.27
11
There are several variables, which can slightly obscure the data. For instance, older units (those generally constructed prior to 1997) may have only one water meter servicing the block. This acts to conceal vacancies as the water bill is split between existing tenants who are likely to exceed the cut-off point of 50 LpD.
Individual metering is generally used in all new complexes and following legislative changes introduced by the Victorian government last year, all newly constructed buildings are now required to install individual water meters, while the retrofitting of separate water meters in older flats where practicable is encouraged. Therefore, it is expected that the propensity for this will reduce over time. 28
Another issue relevant to our methodology are water tanks. Households that have water tanks plumbed into the mains can theoretically reduce their consumption to very low levels, although available evidence suggests this is not generally the case.
In Melbourne, energy requirements stipulate that new homes must install either a 2000Lt rainwater tank or solar hot water service.
As ABS data for early 2013 reveals, 31 per cent of Melbourne households living in a dwelling suitable for a rainwater tank had one installed. This has risen from 28 per cent in 2010 and 11 per cent per cent in 2007. Previous studies show the highest proportions of rainwater tanks in Melbourne are found on properties in the Mornington Peninsula (40 per cent).29
Water savings from rain tanks are highly variable due to a number of factors influencing the efficiency and operation of rainwater tanks. These include: rainfall and locational factors, tank capacity, seasonal demands, and whether or not the tank is plumbed into the main dwelling.
Nevertheless, the data suggests that households with tanks installed do not significantly reduce their water consumption compared to those
without a tank. A two-year study undertaken during government imposed water restrictions found households using a rainwater tank reduced their consumption by 10.3 per cent, compared to a 10.8 per cent fall in consumption for those without a tank. Most households appear to install water saving devices to maintain previous levels of consumption (e.g. upkeep of a garden), rather than as a means to reduce overall consumption.30
Serviced apartments and holiday homes, which can sit vacant for extended periods of time, may also bias the results.
According to Tourism Victoria, Melbourne occupancy rates for serviced apartments have remained high over the 2013 calendar year - reaching a peak of 79 per cent in the second quarter of 2013 and not falling below 70 per cent throughout. 31
Holiday homes have less of an impact, as they are not commonly located within the city. Analysis of vacancy data from the census shows most unoccupied dwellings are situated in regional areas and coastal towns. Furthermore, a higher number would likely be tenanted for periods of non-use by the vendor.
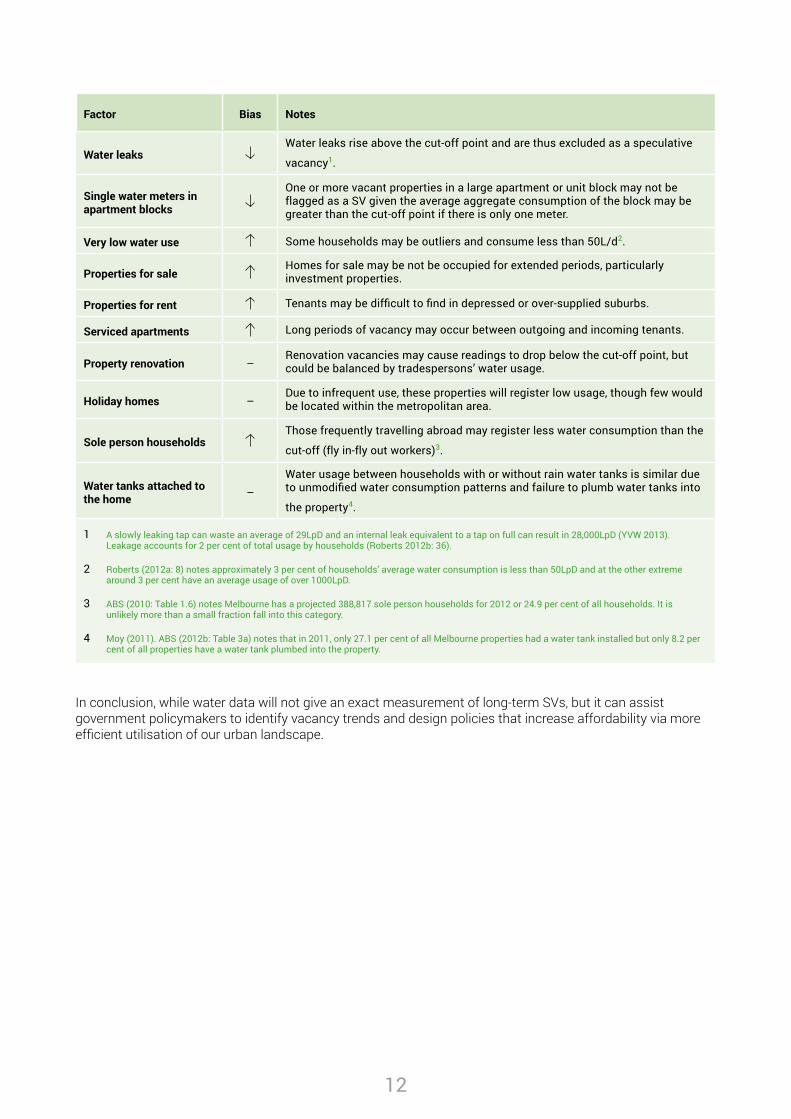
Other relevant factors include: the settlement of estates, homes undergoing renovation, properties for sale, or rental units struggling to attract a tenant. Vacancies in fringe suburbs can also be obscured depending on when the developer or purchaser arranges connection to a water meter. A full discussion of all the variables can be found in the 2012 Speculative Vacancy report however, for the sake of brevity, they are summarised in the table below.
12
Factor Bias Notes
Water leaksWater leaks rise above the cut-off point and are thus excluded as a speculative
vacancy1.
Single water meters in apartment blocks
One or more vacant properties in a large apartment or unit block may not be flagged as a SV given the average aggregate consumption of the block may be greater than the cut-off point if there is only one meter.
Very low water use Some households may be outliers and consume less than 50L/d2.
Properties for saleHomes for sale may be not be occupied for extended periods, particularly investment properties.
Properties for rent Tenants may be difficult to find in depressed or over-supplied suburbs.
Serviced apartments Long periods of vacancy may occur between outgoing and incoming tenants.
Property renovation –Renovation vacancies may cause readings to drop below the cut-off point, but could be balanced by tradespersons’ water usage.
Holiday homes –Due to infrequent use, these properties will register low usage, though few would be located within the metropolitan area.
Sole person householdsThose frequently travelling abroad may register less water consumption than the
cut-off (fly in-fly out workers)3.
Water tanks attached to the home –
Water usage between households with or without rain water tanks is similar due to unmodified water consumption patterns and failure to plumb water tanks into
the property4.
1 A slowly leaking tap can waste an average of 29LpD and an internal leak equivalent to a tap on full can result in 28,000LpD (YVW 2013). Leakage accounts for 2 per cent of total usage by households (Roberts 2012b: 36).
2 Roberts (2012a: 8) notes approximately 3 per cent of households’ average water consumption is less than 50LpD and at the other extreme around 3 per cent have an average usage of over 1000LpD.
3 ABS (2010: Table 1.6) notes Melbourne has a projected 388,817 sole person households for 2012 or 24.9 per cent of all households. It is unlikely more than a small fraction fall into this category.
4 Moy (2011). ABS (2012b: Table 3a) notes that in 2011, only 27.1 per cent of all Melbourne properties had a water tank installed but only 8.2 per cent of all properties have a water tank plumbed into the property.
In conclusion, while water data will not give an exact measurement of long-term SVs, but it can assist government policymakers to identify vacancy trends and design policies that increase affordability via more efficient utilisation of our urban landscape.
13
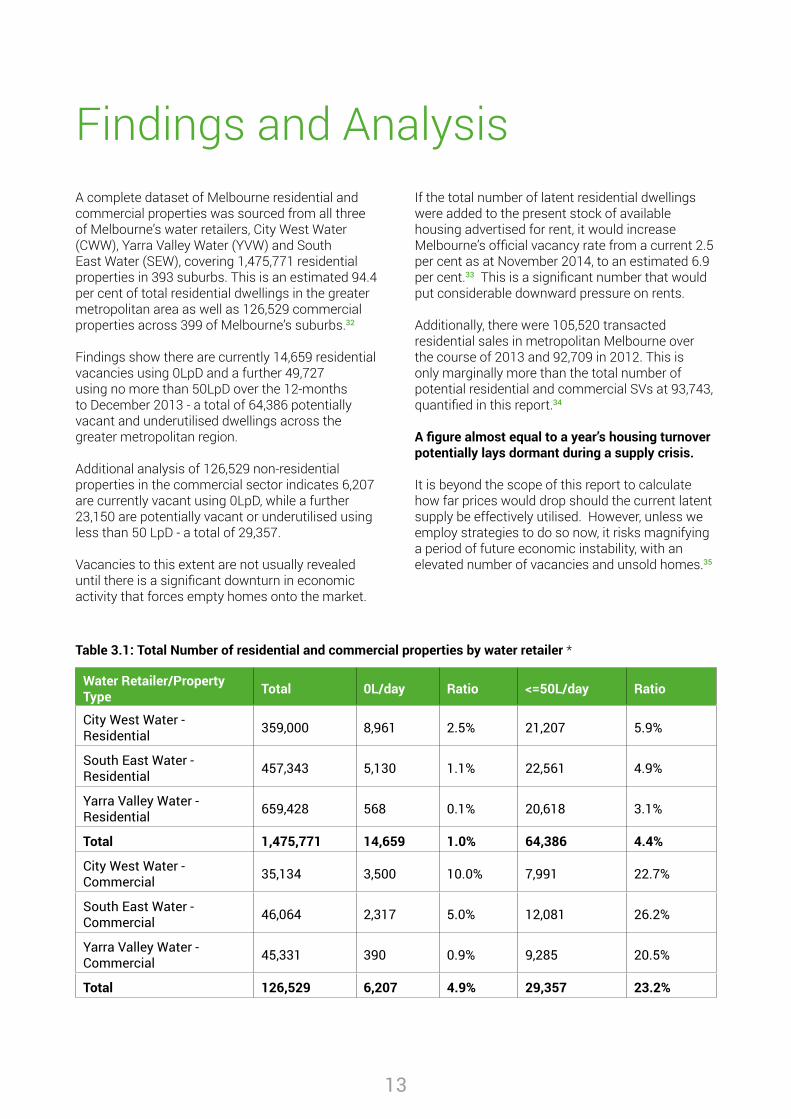
Findings and AnalysisA complete dataset of Melbourne residential and commercial properties was sourced from all three of Melbourne’s water retailers, City West Water (CWW), Yarra Valley Water (YVW) and South East Water (SEW), covering 1,475,771 residential properties in 393 suburbs. This is an estimated 94.4 per cent of total residential dwellings in the greater metropolitan area as well as 126,529 commercial properties across 399 of Melbourne’s suburbs.32
Findings show there are currently 14,659 residential vacancies using 0LpD and a further 49,727 using no more than 50LpD over the 12-months to December 2013 - a total of 64,386 potentially vacant and underutilised dwellings across the greater metropolitan region.
Additional analysis of 126,529 non-residential properties in the commercial sector indicates 6,207 are currently vacant using 0LpD, while a further 23,150 are potentially vacant or underutilised using less than 50 LpD - a total of 29,357.
Vacancies to this extent are not usually revealed until there is a significant downturn in economic activity that forces empty homes onto the market.
If the total number of latent residential dwellings were added to the present stock of available housing advertised for rent, it would increase Melbourne’s official vacancy rate from a current 2.5 per cent as at November 2014, to an estimated 6.9 per cent.33 This is a significant number that would put considerable downward pressure on rents.
Additionally, there were 105,520 transacted residential sales in metropolitan Melbourne over the course of 2013 and 92,709 in 2012. This is only marginally more than the total number of potential residential and commercial SVs at 93,743, quantified in this report.34
A figure almost equal to a year’s housing turnover potentially lays dormant during a supply crisis.
It is beyond the scope of this report to calculate how far prices would drop should the current latent supply be effectively utilised. However, unless we employ strategies to do so now, it risks magnifying a period of future economic instability, with an elevated number of vacancies and unsold homes.35
Table 3.1: Total Number of residential and commercial properties by water retailer *
Water Retailer/Property Type Total 0L/day Ratio <=50L/day Ratio
City West Water - Residential 359,000 8,961 2.5% 21,207 5.9%
South East Water - Residential 457,343 5,130 1.1% 22,561 4.9%
Yarra Valley Water - Residential 659,428 568 0.1% 20,618 3.1%
Total 1,475,771 14,659 1.0% 64,386 4.4%
City West Water - Commercial 35,134 3,500 10.0% 7,991 22.7%
South East Water - Commercial 46,064 2,317 5.0% 12,081 26.2%
Yarra Valley Water - Commercial 45,331 390 0.9% 9,285 20.5%
Total 126,529 6,207 4.9% 29,357 23.2%
14
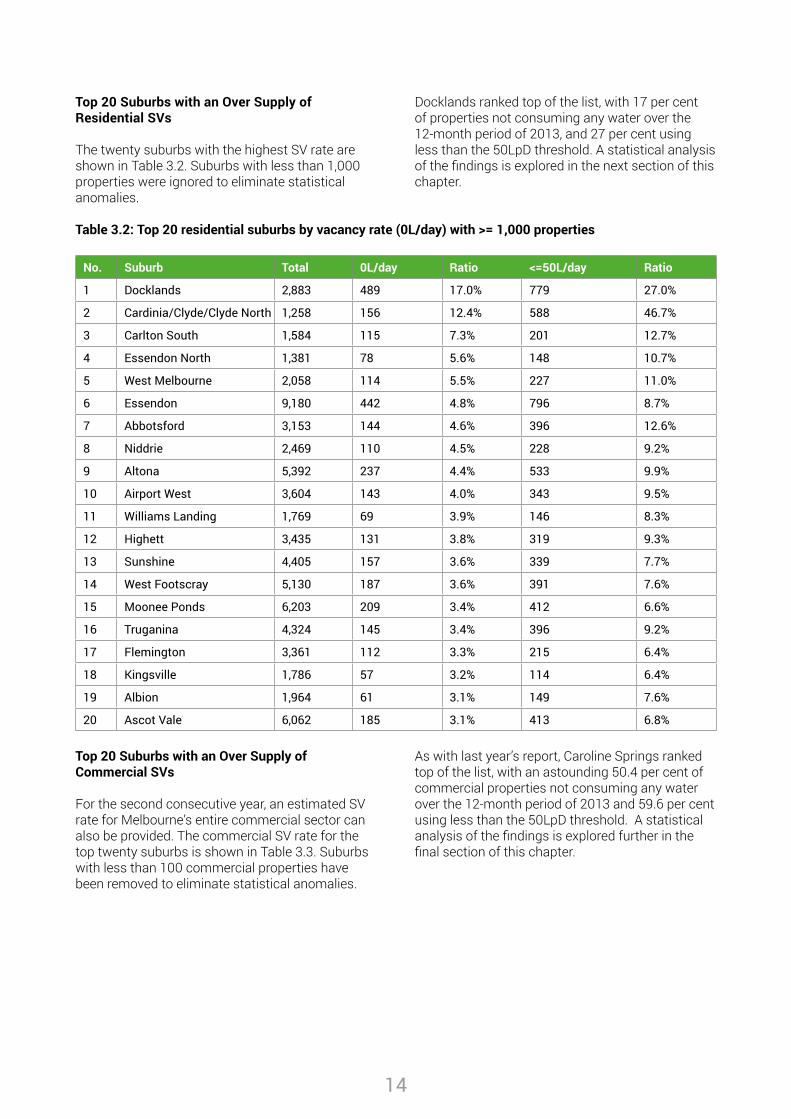
Top 20 Suburbs with an Over Supply of Residential SVs
The twenty suburbs with the highest SV rate are shown in Table 3.2. Suburbs with less than 1,000 properties were ignored to eliminate statistical anomalies.
Docklands ranked top of the list, with 17 per cent of properties not consuming any water over the 12-month period of 2013, and 27 per cent using less than the 50LpD threshold. A statistical analysis of the findings is explored in the next section of this chapter.
Table 3.2: Top 20 residential suburbs by vacancy rate (0L/day) with >= 1,000 properties
No. Suburb Total 0L/day Ratio <=50L/day Ratio
1 Docklands 2,883 489 17.0% 779 27.0%
2 Cardinia/Clyde/Clyde North 1,258 156 12.4% 588 46.7%
3 Carlton South 1,584 115 7.3% 201 12.7%
4 Essendon North 1,381 78 5.6% 148 10.7%
5 West Melbourne 2,058 114 5.5% 227 11.0%
6 Essendon 9,180 442 4.8% 796 8.7%
7 Abbotsford 3,153 144 4.6% 396 12.6%
8 Niddrie 2,469 110 4.5% 228 9.2%
9 Altona 5,392 237 4.4% 533 9.9%
10 Airport West 3,604 143 4.0% 343 9.5%
11 Williams Landing 1,769 69 3.9% 146 8.3%
12 Highett 3,435 131 3.8% 319 9.3%
13 Sunshine 4,405 157 3.6% 339 7.7%
14 West Footscray 5,130 187 3.6% 391 7.6%
15 Moonee Ponds 6,203 209 3.4% 412 6.6%
16 Truganina 4,324 145 3.4% 396 9.2%
17 Flemington 3,361 112 3.3% 215 6.4%
18 Kingsville 1,786 57 3.2% 114 6.4%
19 Albion 1,964 61 3.1% 149 7.6%
20 Ascot Vale 6,062 185 3.1% 413 6.8%
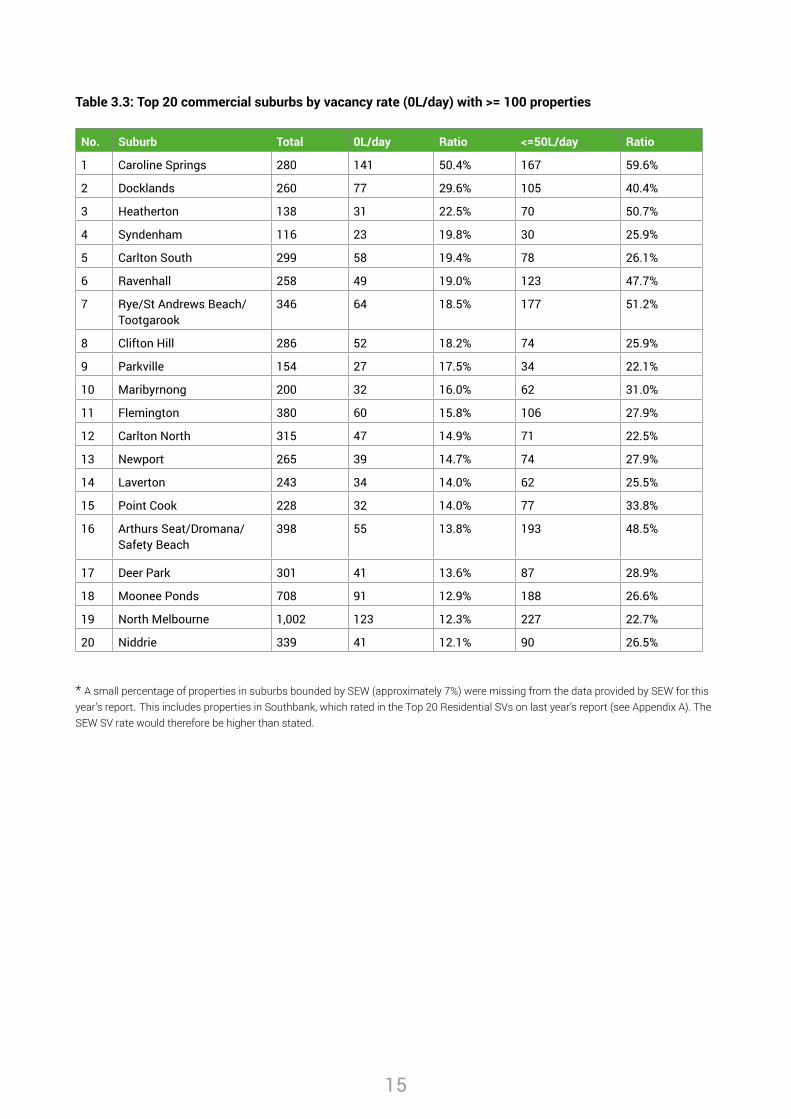
Top 20 Suburbs with an Over Supply of Commercial SVs
For the second consecutive year, an estimated SV rate for Melbourne’s entire commercial sector can also be provided. The commercial SV rate for the top twenty suburbs is shown in Table 3.3. Suburbs with less than 100 commercial properties have been removed to eliminate statistical anomalies.
As with last year’s report, Caroline Springs ranked top of the list, with an astounding 50.4 per cent of commercial properties not consuming any water over the 12-month period of 2013 and 59.6 per cent using less than the 50LpD threshold. A statistical analysis of the findings is explored further in the final section of this chapter.
15
Table 3.3: Top 20 commercial suburbs by vacancy rate (0L/day) with >= 100 properties
No. Suburb Total 0L/day Ratio <=50L/day Ratio
1 Caroline Springs 280 141 50.4% 167 59.6%
2 Docklands 260 77 29.6% 105 40.4%
3 Heatherton 138 31 22.5% 70 50.7%
4 Syndenham 116 23 19.8% 30 25.9%
5 Carlton South 299 58 19.4% 78 26.1%
6 Ravenhall 258 49 19.0% 123 47.7%
7 Rye/St Andrews Beach/Tootgarook
346 64 18.5% 177 51.2%
8 Clifton Hill 286 52 18.2% 74 25.9%
9 Parkville 154 27 17.5% 34 22.1%
10 Maribyrnong 200 32 16.0% 62 31.0%
11 Flemington 380 60 15.8% 106 27.9%
12 Carlton North 315 47 14.9% 71 22.5%
13 Newport 265 39 14.7% 74 27.9%
14 Laverton 243 34 14.0% 62 25.5%
15 Point Cook 228 32 14.0% 77 33.8%
16 Arthurs Seat/Dromana/Safety Beach
398 55 13.8% 193 48.5%
17 Deer Park 301 41 13.6% 87 28.9%
18 Moonee Ponds 708 91 12.9% 188 26.6%
19 North Melbourne 1,002 123 12.3% 227 22.7%
20 Niddrie 339 41 12.1% 90 26.5%
* A small percentage of properties in suburbs bounded by SEW (approximately 7%) were missing from the data provided by SEW for this year’s report. This includes properties in Southbank, which rated in the Top 20 Residential SVs on last year’s report (see Appendix A). The SEW SV rate would therefore be higher than stated.
16
Analysis of Residential SVsSV Analysis of the City Of MelbourneFollowing on from the trend in last year’s report, a large proportion of speculative vacancies can be found in the inner suburbs of the City of Melbourne, where there has been a boom in apartment construction and wide spread rumours of oversupply.
The stock is primarily built for an investment sector attracted by tax incentives for the purchase of new apartments (including stamp duty savings and higher depreciation benefits). Tight lending restrictions banks impose on first-home buyers for high-density accommodation further limit their involvement. Additional costing pressures arise from body corporate fees set aside for the servicing of lifts and on-site facilities, typically amounting to more than a few thousand per year.
Situated just 2km from Melbourne’s CBD, Docklands sits first on the list of the Top 20 Residential SVs. The area is one of Australia’s biggest urban renewal projects, housing 5,789 residents (as at 2013) - 6 per cent of the City of Melbourne’s population.36
Over 60 per cent of Docklands’ resident’s rent, indicating a large cohort of investor ownership. Thirty per cent of occupants are single person households, while a lack of essential education facilities and a peak in the demographic statistics between the ages of 0-4 indicates many families are forced out as their children approach school age.
The current vacancy rate in the Docklands is 4.6 per cent.37 However, our research reveals an SV rate of 27%.38
If this is combined with the short-term official vacancy rate of actual advertised sales, it lifts that figure to 31.6% – an alarming statistic.
The boom in apartment construction in Melbourne city has been done under the premises of improving affordability. However, the median rent a tenant can expect to pay to live in a one-bedroom Docklands’ apartment, is $432 per week, or a two-bedroom apartment, $530 per week.39
A blunt measure of housing affordability stipulates a maximum of 30 per cent of income being spent on housing. For a tenant in the Docklands, this would necessitate an after-tax income of over $70,000 just to rent a one bedroom flat - a statistic
severely exacerbated by the latent withheld supply.
The vacancy rate can be likened to the unemployment rate for land. If there were a 27.3 per cent unemployment rate in a suburb, politicians and the public would be up in arms. Why in a housing crisis is this largely ignored?
A better measure of housing affordability is the NATSEM (National Centre for Social and Economic Modelling) barometer of housing stress, which measures people in the lowest 40 per cent of equivalised incomes (income adjusted using equivalence factors to remove the effect of household size and composition) across Australia, who are paying more than 30 per cent of their usual gross weekly income on rent or mortgage repayments.
In this respect, the decline of dwellings for low-income residents across Docklands and the municipality between the census periods of 2001 to 2011 is evident.
In 2001 low rent dwellings suitable for the lowest 40 per cent of incomes in the municipality accounted for 39 per cent of total rental dwellings; by 2011 that proportion had fallen to just 13 per cent – leading to a natural increase in the number of residents crowded into accommodation beyond their means.40
The median purchase price for a one-bedroom apartment in this region is $410,000 and for a 2-bedroom apartment $595,000. Considering the units are internally between 60 – 80 square metres in size, when measured by rent or price on a per square metre basis, they are remarkably expensive.41
Notwithstanding, the challenge of keeping apartment prices low is problematic for a number of reasons outlined below.
• Zoning Laws - Melbourne’s new zoning regulations render a larger percentage of primary neighbourhoods immune from dense development, whilst others have been given the green light. This naturally limits the tight concentration of land where high-density construction can occur and from a micro perspective, escalates the already inflated values in the areas deemed suitable.
17
• Construction costs - Development levies and infrastructure contributions are a prerequisite to construction and naturally passed to the buyer in the form of higher prices. Additionally, the physical impediments of building residential towers raises efficiency costs relative to low rise considerably, with increased floor areas required for structural supports, elevators, service ducts and so forth. Albeit, even if building costs were to reduce, there is no guarantee the savings would be passed onto the buyer. Rather, current tax legislation ensures the extra funds would be soaked up in higher land values.
• Supply elasticity - Most developers currently gain funding offshore42, however, financing can require up to 100 per cent debt coverage with projects taking a number of years from concept to ‘lock up’ before supply can filter onto the market - a 3-6 year window not being unusual.
• Inflated Commissions and Rental Guarantees - Buyers typically purchase the stock through financial intermediaries who receive inflated commissions to achieve necessary presale targets. Meanwhile, investors are commonly ‘lured in’ with rental guarantees that promise a return that exceeds current market yields.
To build a 3-bedroom apartment suited to Melbourne’s biggest demographic - families with children - would therefore not be feasible under a purchase price of at least $700,000.43
However, the standard of accommodation is typically low grade. It is not uncommon to find bedrooms and bathrooms lacking external windows and requiring artificial lighting at all hours. Subsequently, even among the predominant demographic that live in apartments (renters in their 20s to early 30s), figures still only peak at around 14 per cent at the age of 27 years.44
In this regard, the avenue Melbourne is heading toward shares similarities to the building initiatives employed in Ireland in the run up to the 2008 financial crisis.
In Ireland, property related tax incentives fuelled a flood of demand from the buy-to-let sector, primarily in the form of high-density apartment construction as well as new housing in estates far from employment centres. The over supply of poor quality vacant dwellings was not broadly evident until the crisis hit. Subsequently, in the two years leading up to the market peak of 2007, almost half of all new Irish home purchases stemmed from
speculative investor activity rather than genuine homebuyer demand.45
The Docklands has been widely criticised as a planning disaster, lacking soul and the social facilities needed to cater to resident’s needs. However, the bigger disaster is that tracts of valuable urban land are being used for a large proportion of dwellings that are sitting long-term empty and unused – seemingly not for sale, or rent.
According to the City of Melbourne’s development monitor, there are currently 3,225 residential apartments currently approved or under construction in the Docklands, with a further 2,248 ‘mooted’ for construction over the next 2 – 5 years.46 Judging from the statistics presented in this report, they risk being dubbed ‘ghost towers’ should there be a marked decline in economic activity.
Other inner city areas highlighted in this report include West Melbourne, West Footscray, Flemington, Abbotsford and Carlton South.
Carlton North contains a number of period homes, which are popular with inner city homebuyers. However, small apartments and student accommodation dominate the southern region of the suburb and naturally have a high turnover.
The official vacancy rate of available rental dwellings in Carlton South is a tight 2 per cent, however our statistics reveal Carlton South’s long-term vacancy rate is 12.7 per cent.
If the SV rate is combined with the short-term official vacancy rate of actual advertised sales, it would lift Carlton South’s total vacancy rate to 14.7 per cent.47
This is akin to a 14.7 per cent unemployment rate during a housing crisis. With international students facing both high tuition fees and high rental fees, is the existence of such vacancies a reflection of how we should treat Victoria’s leading export industry?48
All the aforementioned suburbs have seen a marked uplift in high-density construction. For example, figures collated in last year’s SVs report identified 1,831-metred dwellings in Abbotsford. In contrast, this year’s figures show an additional 1,322 metred dwellings have been added to the stock of housing, a 43 per cent increase.
18
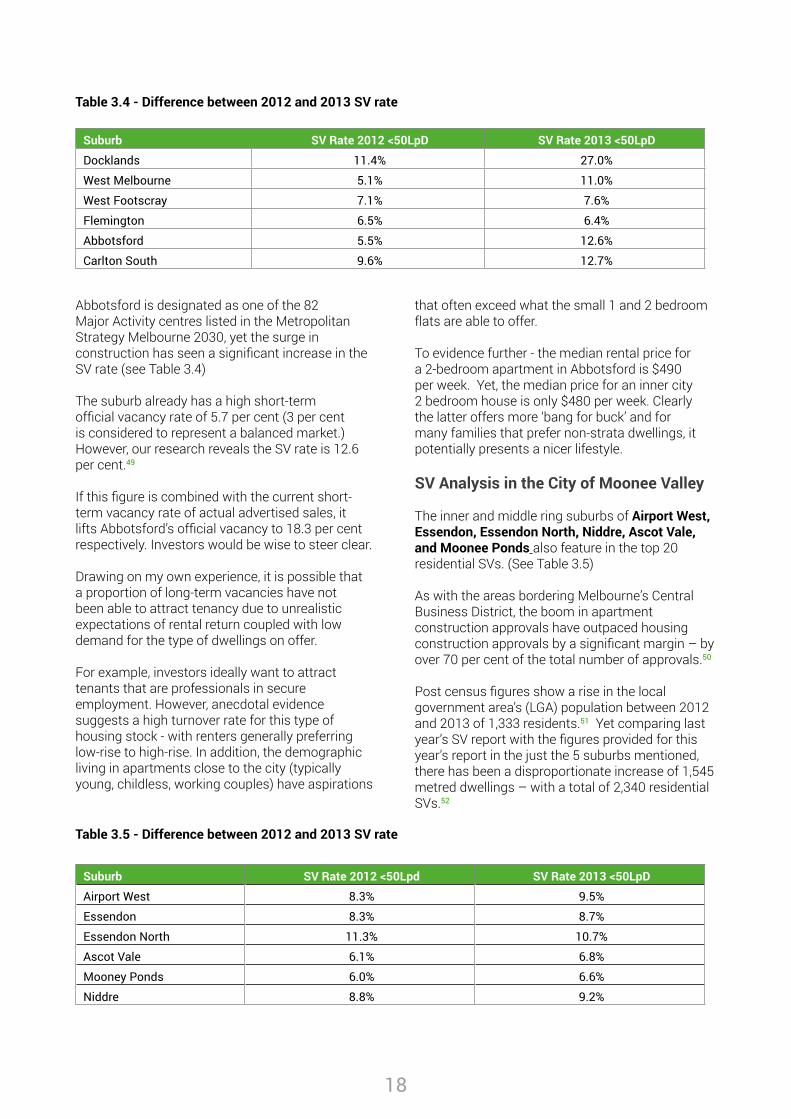
Table 3.4 - Difference between 2012 and 2013 SV rate
Suburb SV Rate 2012 <50LpD SV Rate 2013 <50LpD
Docklands 11.4% 27.0%
West Melbourne 5.1% 11.0%
West Footscray 7.1% 7.6%
Flemington 6.5% 6.4%
Abbotsford 5.5% 12.6%
Carlton South 9.6% 12.7%
Abbotsford is designated as one of the 82 Major Activity centres listed in the Metropolitan Strategy Melbourne 2030, yet the surge in construction has seen a significant increase in the SV rate (see Table 3.4)
The suburb already has a high short-term official vacancy rate of 5.7 per cent (3 per cent is considered to represent a balanced market.) However, our research reveals the SV rate is 12.6 per cent.49
If this figure is combined with the current short-term vacancy rate of actual advertised sales, it lifts Abbotsford’s official vacancy to 18.3 per cent respectively. Investors would be wise to steer clear.
Drawing on my own experience, it is possible that a proportion of long-term vacancies have not been able to attract tenancy due to unrealistic expectations of rental return coupled with low demand for the type of dwellings on offer.
For example, investors ideally want to attract tenants that are professionals in secure employment. However, anecdotal evidence suggests a high turnover rate for this type of housing stock - with renters generally preferring low-rise to high-rise. In addition, the demographic living in apartments close to the city (typically young, childless, working couples) have aspirations
that often exceed what the small 1 and 2 bedroom flats are able to offer.
To evidence further - the median rental price for a 2-bedroom apartment in Abbotsford is $490 per week. Yet, the median price for an inner city 2 bedroom house is only $480 per week. Clearly the latter offers more ‘bang for buck’ and for many families that prefer non-strata dwellings, it potentially presents a nicer lifestyle.
SV Analysis in the City of Moonee Valley
The inner and middle ring suburbs of Airport West, Essendon, Essendon North, Niddre, Ascot Vale, and Moonee Ponds also feature in the top 20 residential SVs. (See Table 3.5)
As with the areas bordering Melbourne’s Central Business District, the boom in apartment construction approvals have outpaced housing construction approvals by a significant margin – by over 70 per cent of the total number of approvals.50
Post census figures show a rise in the local government area’s (LGA) population between 2012 and 2013 of 1,333 residents.51 Yet comparing last year’s SV report with the figures provided for this year’s report in the just the 5 suburbs mentioned, there has been a disproportionate increase of 1,545 metred dwellings – with a total of 2,340 residential SVs.52
Table 3.5 - Difference between 2012 and 2013 SV rate
Suburb SV Rate 2012 <50Lpd SV Rate 2013 <50LpD
Airport West 8.3% 9.5%
Essendon 8.3% 8.7%
Essendon North 11.3% 10.7%
Ascot Vale 6.1% 6.8%
Mooney Ponds 6.0% 6.6%
Niddre 8.8% 9.2%
19
The official short-term vacancy rate in the aforementioned suburbs ranges from 1.9 per cent in Airport West to an elevated 4.8 per cent in Ascot Vale. Adding Ascot Vale’s SV rate to the published vacancy rates equates to 11.6%.
The median rent for a 2-bedroom apartment in the aforementioned suburbs is an average of $350 per week. Yet the fact that so many are sitting vacant and untenanted, clearly indicates purchasers are not investing for rental income, rather they are taking advantage of tax incentives to speculate on rising prices. Significantly, the larger proportion of new unit sales are on interest only terms.
Rising vacancy rates and rising housing prices indicate a market in distortion. The fundamental
drivers are failing the community in favour of investors.
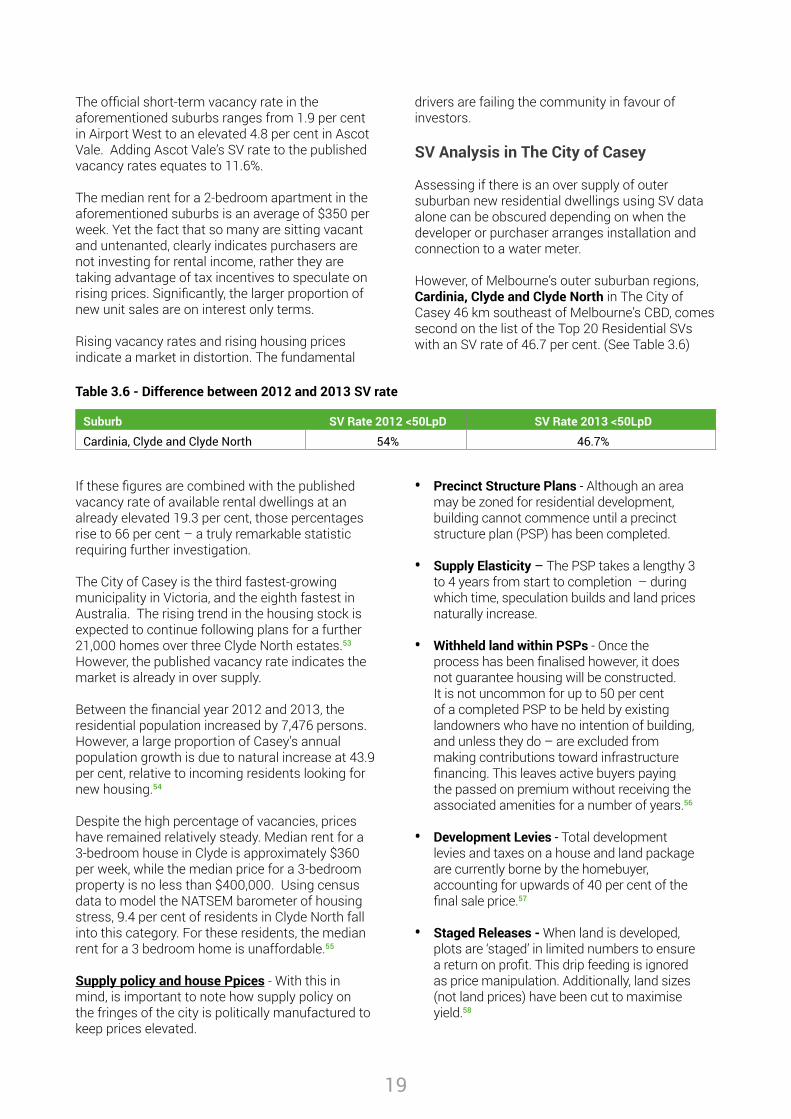
SV Analysis in The City of Casey
Assessing if there is an over supply of outer suburban new residential dwellings using SV data alone can be obscured depending on when the developer or purchaser arranges installation and connection to a water meter.
However, of Melbourne’s outer suburban regions, Cardinia, Clyde and Clyde North in The City of Casey 46 km southeast of Melbourne’s CBD, comes second on the list of the Top 20 Residential SVs with an SV rate of 46.7 per cent. (See Table 3.6)
Table 3.6 - Difference between 2012 and 2013 SV rate
Suburb SV Rate 2012 <50LpD SV Rate 2013 <50LpD
Cardinia, Clyde and Clyde North 54% 46.7%
If these figures are combined with the published vacancy rate of available rental dwellings at an already elevated 19.3 per cent, those percentages rise to 66 per cent – a truly remarkable statistic requiring further investigation.
The City of Casey is the third fastest-growing municipality in Victoria, and the eighth fastest in Australia. The rising trend in the housing stock is expected to continue following plans for a further 21,000 homes over three Clyde North estates.53 However, the published vacancy rate indicates the market is already in over supply.
Between the financial year 2012 and 2013, the residential population increased by 7,476 persons. However, a large proportion of Casey’s annual population growth is due to natural increase at 43.9 per cent, relative to incoming residents looking for new housing.54
Despite the high percentage of vacancies, prices have remained relatively steady. Median rent for a 3-bedroom house in Clyde is approximately $360 per week, while the median price for a 3-bedroom property is no less than $400,000. Using census data to model the NATSEM barometer of housing stress, 9.4 per cent of residents in Clyde North fall into this category. For these residents, the median rent for a 3 bedroom home is unaffordable.55
Supply policy and house Ppices - With this in mind, is important to note how supply policy on the fringes of the city is politically manufactured to keep prices elevated.
• Precinct Structure Plans - Although an area may be zoned for residential development, building cannot commence until a precinct structure plan (PSP) has been completed.
• Supply Elasticity – The PSP takes a lengthy 3 to 4 years from start to completion – during which time, speculation builds and land prices naturally increase.
• Withheld land within PSPs - Once the process has been finalised however, it does not guarantee housing will be constructed. It is not uncommon for up to 50 per cent of a completed PSP to be held by existing landowners who have no intention of building, and unless they do – are excluded from making contributions toward infrastructure financing. This leaves active buyers paying the passed on premium without receiving the associated amenities for a number of years.56
• Development Levies - Total development levies and taxes on a house and land package are currently borne by the homebuyer, accounting for upwards of 40 per cent of the final sale price.57
• Staged Releases - When land is developed, plots are ‘staged’ in limited numbers to ensure a return on profit. This drip feeding is ignored as price manipulation. Additionally, land sizes (not land prices) have been cut to maximise yield.58
20
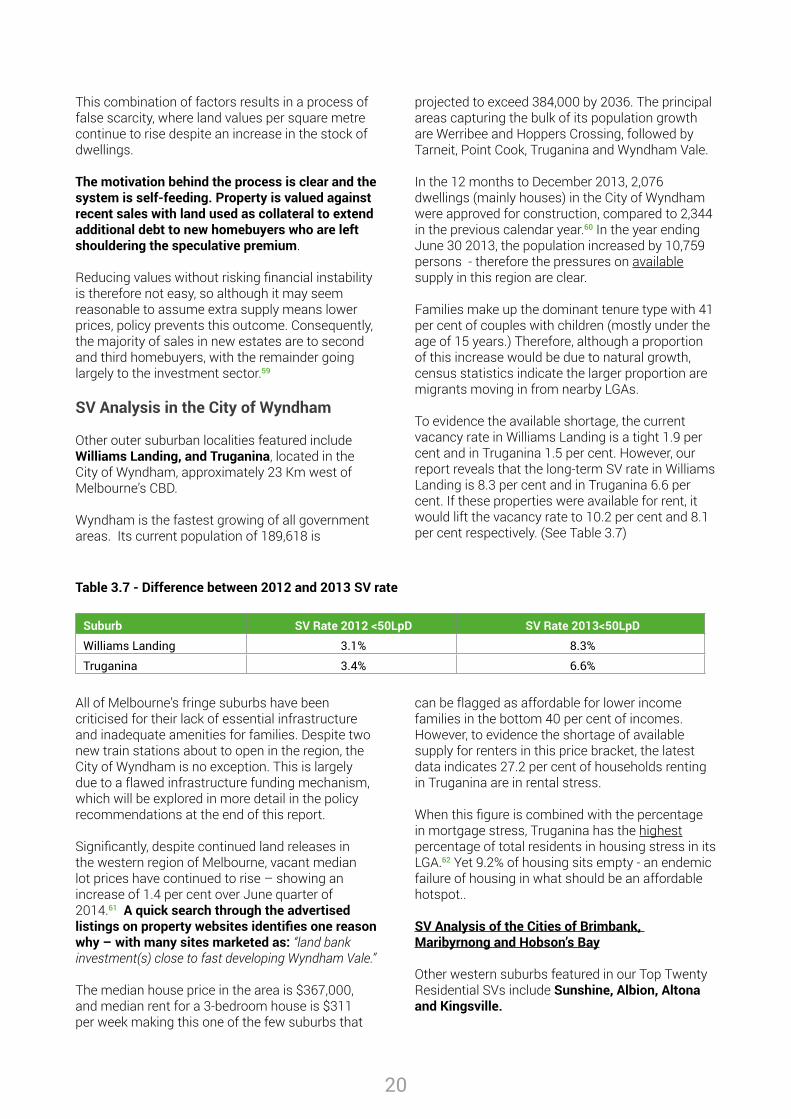
This combination of factors results in a process of false scarcity, where land values per square metre continue to rise despite an increase in the stock of dwellings.
The motivation behind the process is clear and the system is self-feeding. Property is valued against recent sales with land used as collateral to extend additional debt to new homebuyers who are left shouldering the speculative premium.
Reducing values without risking financial instability is therefore not easy, so although it may seem reasonable to assume extra supply means lower prices, policy prevents this outcome. Consequently, the majority of sales in new estates are to second and third homebuyers, with the remainder going largely to the investment sector.59
SV Analysis in the City of Wyndham
Other outer suburban localities featured include Williams Landing, and Truganina, located in the City of Wyndham, approximately 23 Km west of Melbourne’s CBD.
Wyndham is the fastest growing of all government areas. Its current population of 189,618 is
projected to exceed 384,000 by 2036. The principal areas capturing the bulk of its population growth are Werribee and Hoppers Crossing, followed by Tarneit, Point Cook, Truganina and Wyndham Vale.
In the 12 months to December 2013, 2,076 dwellings (mainly houses) in the City of Wyndham were approved for construction, compared to 2,344 in the previous calendar year.60 In the year ending June 30 2013, the population increased by 10,759 persons - therefore the pressures on available supply in this region are clear.
Families make up the dominant tenure type with 41 per cent of couples with children (mostly under the age of 15 years.) Therefore, although a proportion of this increase would be due to natural growth, census statistics indicate the larger proportion are migrants moving in from nearby LGAs.
To evidence the available shortage, the current vacancy rate in Williams Landing is a tight 1.9 per cent and in Truganina 1.5 per cent. However, our report reveals that the long-term SV rate in Williams Landing is 8.3 per cent and in Truganina 6.6 per cent. If these properties were available for rent, it would lift the vacancy rate to 10.2 per cent and 8.1 per cent respectively. (See Table 3.7)
Table 3.7 - Difference between 2012 and 2013 SV rate
Suburb SV Rate 2012 <50LpD SV Rate 2013<50LpD
Williams Landing 3.1% 8.3%
Truganina 3.4% 6.6%
All of Melbourne’s fringe suburbs have been criticised for their lack of essential infrastructure and inadequate amenities for families. Despite two new train stations about to open in the region, the City of Wyndham is no exception. This is largely due to a flawed infrastructure funding mechanism, which will be explored in more detail in the policy recommendations at the end of this report.
Significantly, despite continued land releases in the western region of Melbourne, vacant median lot prices have continued to rise – showing an increase of 1.4 per cent over June quarter of 2014.61 A quick search through the advertised listings on property websites identifies one reason why – with many sites marketed as: “land bank investment(s) close to fast developing Wyndham Vale.”
The median house price in the area is $367,000, and median rent for a 3-bedroom house is $311 per week making this one of the few suburbs that
can be flagged as affordable for lower income families in the bottom 40 per cent of incomes. However, to evidence the shortage of available supply for renters in this price bracket, the latest data indicates 27.2 per cent of households renting in Truganina are in rental stress.
When this figure is combined with the percentage in mortgage stress, Truganina has the highest percentage of total residents in housing stress in its LGA.62 Yet 9.2% of housing sits empty - an endemic failure of housing in what should be an affordable hotspot..
SV Analysis of the Cities of Brimbank, Maribyrnong and Hobson’s Bay
Other western suburbs featured in our Top Twenty Residential SVs include Sunshine, Albion, Altona and Kingsville.
21
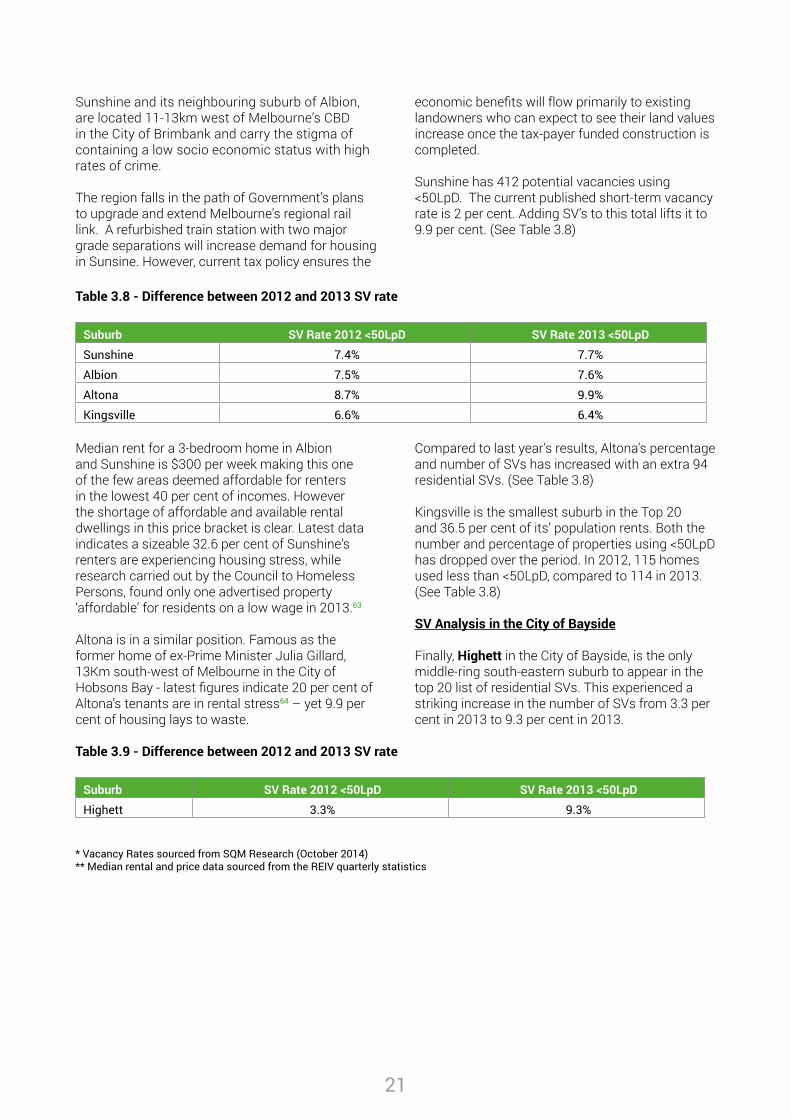
Sunshine and its neighbouring suburb of Albion, are located 11-13km west of Melbourne’s CBD in the City of Brimbank and carry the stigma of containing a low socio economic status with high rates of crime.
The region falls in the path of Government’s plans to upgrade and extend Melbourne’s regional rail link. A refurbished train station with two major grade separations will increase demand for housing in Sunsine. However, current tax policy ensures the
economic benefits will flow primarily to existing landowners who can expect to see their land values increase once the tax-payer funded construction is completed.
Sunshine has 412 potential vacancies using <50LpD. The current published short-term vacancy rate is 2 per cent. Adding SV’s to this total lifts it to 9.9 per cent. (See Table 3.8)
Table 3.8 - Difference between 2012 and 2013 SV rate
Suburb SV Rate 2012 <50LpD SV Rate 2013 <50LpD
Sunshine 7.4% 7.7%
Albion 7.5% 7.6%
Altona 8.7% 9.9%
Kingsville 6.6% 6.4%
Median rent for a 3-bedroom home in Albion and Sunshine is $300 per week making this one of the few areas deemed affordable for renters in the lowest 40 per cent of incomes. However the shortage of affordable and available rental dwellings in this price bracket is clear. Latest data indicates a sizeable 32.6 per cent of Sunshine’s renters are experiencing housing stress, while research carried out by the Council to Homeless Persons, found only one advertised property ‘affordable’ for residents on a low wage in 2013.63
Altona is in a similar position. Famous as the former home of ex-Prime Minister Julia Gillard, 13Km south-west of Melbourne in the City of Hobsons Bay - latest figures indicate 20 per cent of Altona’s tenants are in rental stress64 – yet 9.9 per cent of housing lays to waste.
Compared to last year’s results, Altona’s percentage and number of SVs has increased with an extra 94 residential SVs. (See Table 3.8)
Kingsville is the smallest suburb in the Top 20 and 36.5 per cent of its’ population rents. Both the number and percentage of properties using <50LpD has dropped over the period. In 2012, 115 homes used less than <50LpD, compared to 114 in 2013. (See Table 3.8)
SV Analysis in the City of Bayside
Finally, Highett in the City of Bayside, is the only middle-ring south-eastern suburb to appear in the top 20 list of residential SVs. This experienced a striking increase in the number of SVs from 3.3 per cent in 2013 to 9.3 per cent in 2013.
Table 3.9 - Difference between 2012 and 2013 SV rate
Suburb SV Rate 2012 <50LpD SV Rate 2013 <50LpD
Highett 3.3% 9.3%
* Vacancy Rates sourced from SQM Research (October 2014)** Median rental and price data sourced from the REIV quarterly statistics
22
Analysis of Commercial SVsTop 20 Commercial SVsCommercial listings are likely to have a slightly lower LpD meter reading than residential, therefore for the purposes of analysis, the 0LpD readings are used as the default. As outlined in the methodology, a dripping tap can easily consume 50 LpD, and this should be taken into account when viewing the results.
Additionally, commercial buildings and shopping centres commonly share water facilities – (e.g. toilets and kitchens). Therefore single water metering can obscure a higher proportion of long-term vacancies relative to individual premises that are billed separately.
It should also be noted that the data provided for this report classifies commercial listings as anything non-residential, which once again can affect results for buildings zoned for mixed use.
Compared to the residential sector, commercial properties may be withheld from the market for slightly different reasons. In the retail sector for example, location is vitally important, with revenue dependant on the premises position within the high-street.
Mason Gaffney, Professor of Economics at the University of California (Riverside), writes:
“Massed control of land is the most natural base for monopolising markets because land is limited. Buying land always does double duty: when A expands he ipso facto pre-empts opportunities from B. For example, a chain of service stations with most of the best corners in a town has market power…”65
It is therefore no surprise to hear of large retail chains amassing substantial land banks not so much for ‘future development’ but also as a tool to exclude the competition from gaining market share with the resulting effect driving up rents and prices on existing sites.
For example, in October 2012 a Fairfax investigation found a company majority owned by Woolworths and joint-venture partner Lowe’s had accumulated a land bank of ‘future’ development sites worth over $840 million. Twelve months later, ASIC documents revealed that value had increased to in-excess of $1.1 billion.66
The consumer may not consider this important, however ever increasing land prices have a flow on effect to the economy by forcing smaller traders out the market. This reduces employment options. Land banking is a waste that generates no productive value for the economy and therefore no employment. Such a distinction is important in recognising that with no productive role, such land banking incomes are unearned and should not be prioritised by the tax system.
There can be many reasons commercial sites are left vacant aside from the reasons pointed out above, demolition and renovation for example, industrial zoning constraints that restrict certain commercial activities from taking place, as well as recent robust building activity coupled with subdued tenant demand.
To demonstrate, new commercial zoning laws that came into effect across Melbourne in 2013 work on a ‘one size fits all policy’ and introduced new rules on some activities not previously permitted. This includes allowing large Supermarkets up to 1,800 square meters in size to open close to residential areas without requiring a planning permit.
This can potentially affect the viability of certain smaller-established retailers who are unable to compete effectively. This also increases development opportunities for supermarkets to hoard land under the guise of ‘future expansion’.
In such a scenario, commercial SVs would also see their land values rise but with no incentive to sell, may prevent other industries from moving in to trade with the increase in pedestrian traffic.
The recommendations put forward in this report would assist in both regards - as the change in land values would be reflected in the tax base which would adjust in favour of the smaller retailer aiding a competitive advantage, while withholding of prime commercial land would be discouraged.
Albeit, when long-term commercial SVs do occur, we should investigate whether the area could serve residents better with housing or community facilities for example, and employ zoning and tax policies to this effect.
23
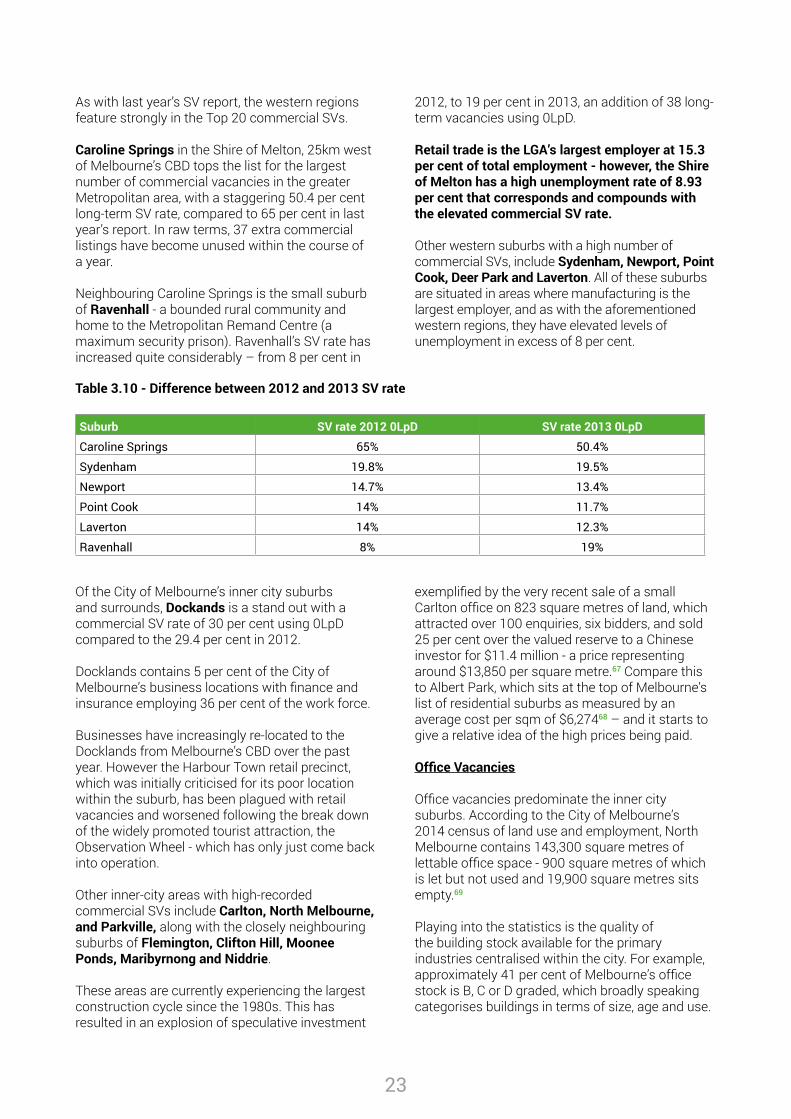
As with last year’s SV report, the western regions feature strongly in the Top 20 commercial SVs.
Caroline Springs in the Shire of Melton, 25km west of Melbourne’s CBD tops the list for the largest number of commercial vacancies in the greater Metropolitan area, with a staggering 50.4 per cent long-term SV rate, compared to 65 per cent in last year’s report. In raw terms, 37 extra commercial listings have become unused within the course of a year.
Neighbouring Caroline Springs is the small suburb of Ravenhall - a bounded rural community and home to the Metropolitan Remand Centre (a maximum security prison). Ravenhall’s SV rate has increased quite considerably – from 8 per cent in
2012, to 19 per cent in 2013, an addition of 38 long-term vacancies using 0LpD.
Retail trade is the LGA’s largest employer at 15.3 per cent of total employment - however, the Shire of Melton has a high unemployment rate of 8.93 per cent that corresponds and compounds with the elevated commercial SV rate.
Other western suburbs with a high number of commercial SVs, include Sydenham, Newport, Point Cook, Deer Park and Laverton. All of these suburbs are situated in areas where manufacturing is the largest employer, and as with the aforementioned western regions, they have elevated levels of unemployment in excess of 8 per cent.
Table 3.10 - Difference between 2012 and 2013 SV rate
Suburb SV rate 2012 0LpD SV rate 2013 0LpD
Caroline Springs 65% 50.4%
Sydenham 19.8% 19.5%
Newport 14.7% 13.4%
Point Cook 14% 11.7%
Laverton 14% 12.3%
Ravenhall 8% 19%
Of the City of Melbourne’s inner city suburbs and surrounds, Dockands is a stand out with a commercial SV rate of 30 per cent using 0LpD compared to the 29.4 per cent in 2012.
Docklands contains 5 per cent of the City of Melbourne’s business locations with finance and insurance employing 36 per cent of the work force.
Businesses have increasingly re-located to the Docklands from Melbourne’s CBD over the past year. However the Harbour Town retail precinct, which was initially criticised for its poor location within the suburb, has been plagued with retail vacancies and worsened following the break down of the widely promoted tourist attraction, the Observation Wheel - which has only just come back into operation.
Other inner-city areas with high-recorded commercial SVs include Carlton, North Melbourne, and Parkville, along with the closely neighbouring suburbs of Flemington, Clifton Hill, Moonee Ponds, Maribyrnong and Niddrie.
These areas are currently experiencing the largest construction cycle since the 1980s. This has resulted in an explosion of speculative investment
exemplified by the very recent sale of a small Carlton office on 823 square metres of land, which attracted over 100 enquiries, six bidders, and sold 25 per cent over the valued reserve to a Chinese investor for $11.4 million - a price representing around $13,850 per square metre.67 Compare this to Albert Park, which sits at the top of Melbourne’s list of residential suburbs as measured by an average cost per sqm of $6,27468 – and it starts to give a relative idea of the high prices being paid. Office Vacancies
Office vacancies predominate the inner city suburbs. According to the City of Melbourne’s 2014 census of land use and employment, North Melbourne contains 143,300 square metres of lettable office space - 900 square metres of which is let but not used and 19,900 square metres sits empty.69
Playing into the statistics is the quality of the building stock available for the primary industries centralised within the city. For example, approximately 41 per cent of Melbourne’s office stock is B, C or D graded, which broadly speaking categorises buildings in terms of size, age and use.
24
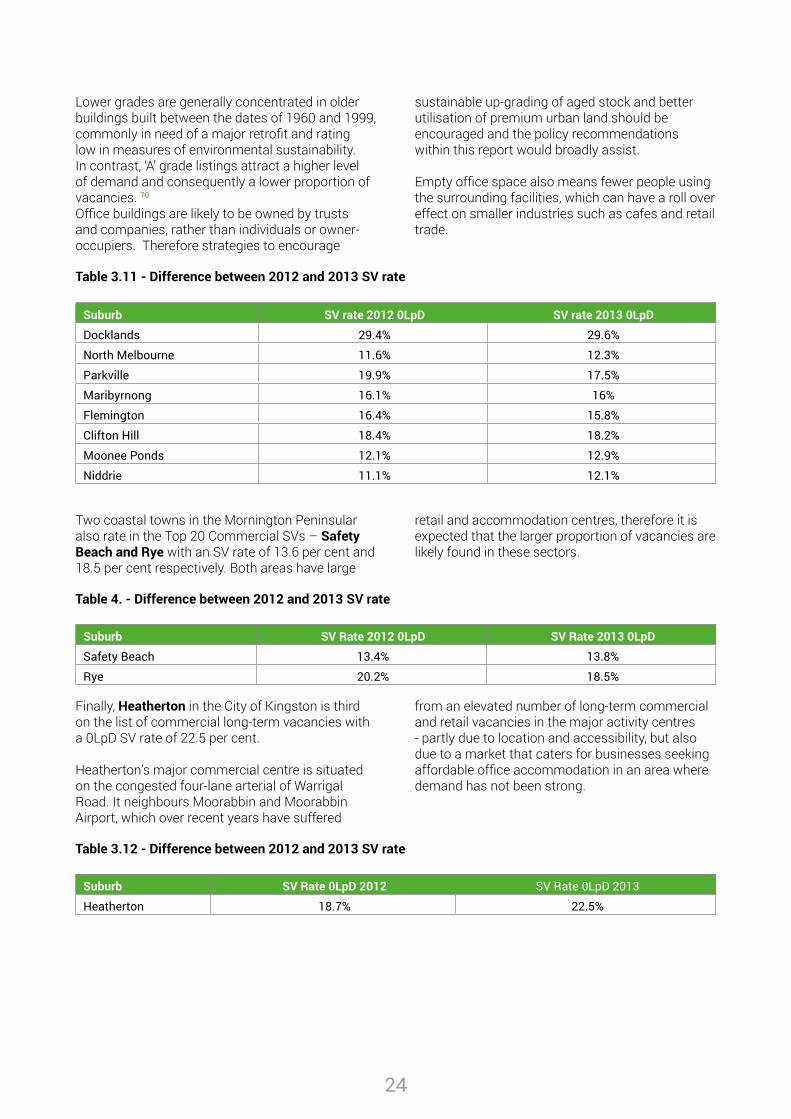
Lower grades are generally concentrated in older buildings built between the dates of 1960 and 1999, commonly in need of a major retrofit and rating low in measures of environmental sustainability. In contrast, ‘A’ grade listings attract a higher level of demand and consequently a lower proportion of vacancies. 70
Office buildings are likely to be owned by trusts and companies, rather than individuals or owner-occupiers. Therefore strategies to encourage
sustainable up-grading of aged stock and better utilisation of premium urban land should be encouraged and the policy recommendations within this report would broadly assist.
Empty office space also means fewer people using the surrounding facilities, which can have a roll over effect on smaller industries such as cafes and retail trade.
Table 3.11 - Difference between 2012 and 2013 SV rate
Suburb SV rate 2012 0LpD SV rate 2013 0LpD
Docklands 29.4% 29.6%
North Melbourne 11.6% 12.3%
Parkville 19.9% 17.5%
Maribyrnong 16.1% 16%
Flemington 16.4% 15.8%
Clifton Hill 18.4% 18.2%
Moonee Ponds 12.1% 12.9%
Niddrie 11.1% 12.1%
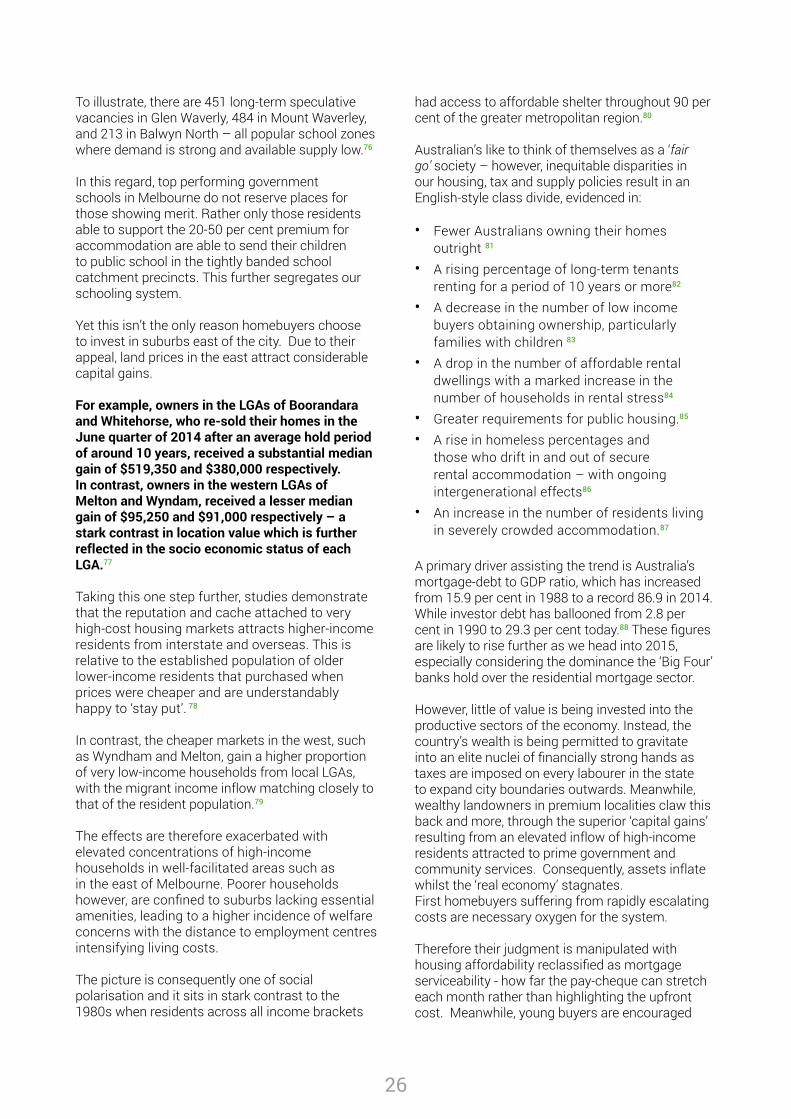
Two coastal towns in the Mornington Peninsular also rate in the Top 20 Commercial SVs – Safety Beach and Rye with an SV rate of 13.6 per cent and 18.5 per cent respectively. Both areas have large
retail and accommodation centres, therefore it is expected that the larger proportion of vacancies are likely found in these sectors.
Table 4. - Difference between 2012 and 2013 SV rate
Suburb SV Rate 2012 0LpD SV Rate 2013 0LpD
Safety Beach 13.4% 13.8%
Rye 20.2% 18.5%
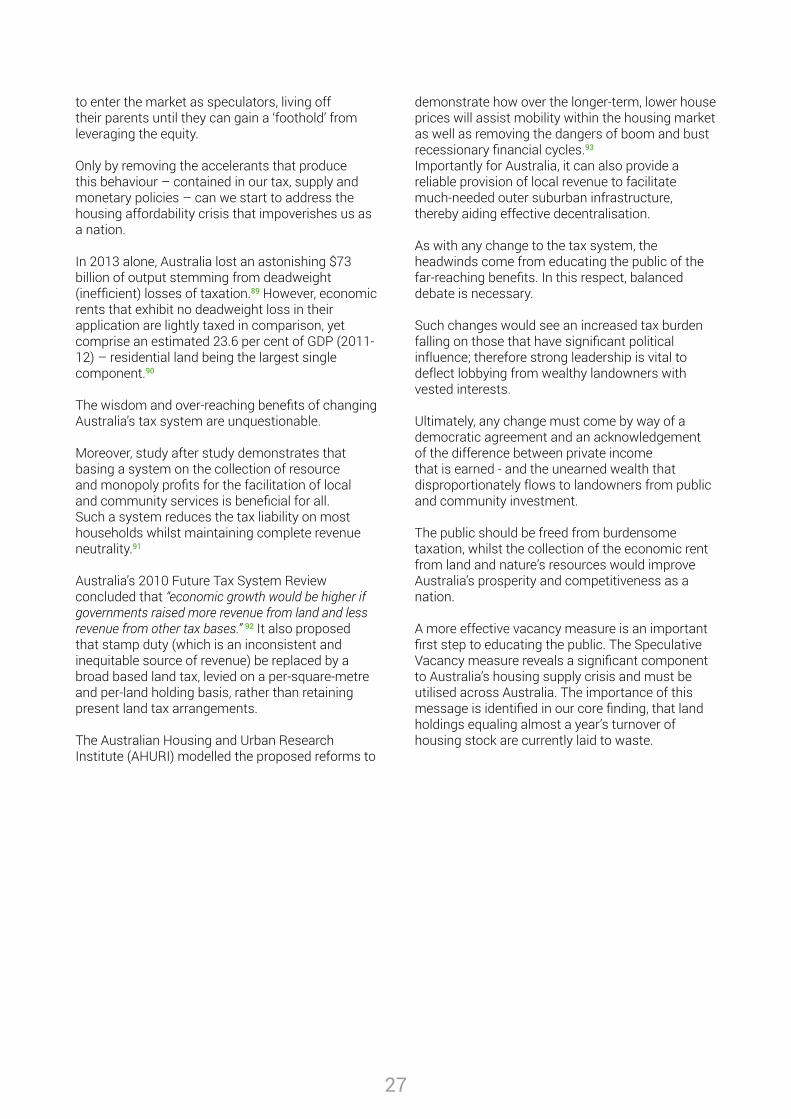
Finally, Heatherton in the City of Kingston is third on the list of commercial long-term vacancies with a 0LpD SV rate of 22.5 per cent.
Heatherton’s major commercial centre is situated on the congested four-lane arterial of Warrigal Road. It neighbours Moorabbin and Moorabbin Airport, which over recent years have suffered
from an elevated number of long-term commercial and retail vacancies in the major activity centres - partly due to location and accessibility, but also due to a market that caters for businesses seeking affordable office accommodation in an area where demand has not been strong.
Table 3.12 - Difference between 2012 and 2013 SV rate
Suburb SV Rate 0LpD 2012 SV Rate 0LpD 2013
Heatherton 18.7% 22.5%

25
ConclusionIn both the residential and commercial sector, the highest concentration of SVs are predominantly located in the suburbs bounded by City West Water. These comprise of a high proportion of low-grade apartment stock within the inner city boundary and additionally encompass the lower socio-economic regions of the state in the western expanse of the greater metropolitan area.
These are the suburbs that exhibit higher than average rates of crime and long-term unemployment, having sparse family and community facilities relative to the populace, yet currently capture the bulk of Melbourne and Australia’s population growth – principally low-middle income families seeking affordable shelter.
However, due to lower holding costs, they also contain a higher concentration of speculative investor activity compared to the eastern, northern and southern regions of the state. This is encouraged by a tax system that attracts predatory behaviour to what should be thriving communities of affordable housing, thereby accelerating both gentrification and inequity.
For example, more than 7 in 10 investors own residential units in the inner city suburbs of Kingsville, Docklands, Carlton, and North Melbourne - all flagged in the top 20 list of residential SVs.71
In the detached housing market, investors own more than 3 in every 10 properties on the western fringes of the state. Suburbs such as Point Cook, Tarneit and Truganina for example, see the investor share of the market at 41.9 per cent, 40.9 per cent and 39.8 per cent respectively.72
There are a couple of reasons that this may be the case. Firstly, they contain a larger proportion of stock fitting into the typical investor budget of around $450,000-$650,000.
Additionally, Victoria makes ineffective use of the State Land Tax (SLT), with a zero rate levied below an assessed value of $250,000.
This implies that a property valued at $450,000 will only be liable for a $675 annual Land Tax bill and approximately $900 per year in council rates. The $1600 total is nothing in comparison to the $30,000 in ‘capital gains’ that some properties in Sunshine have enjoyed over the past 12 months
- stimulated further by proposed upgrades to infrastructure within the area.
The SLT’s progressive schedule is also inequitably generous to large wealthy land-owners. Between 2004 and 2009 the marginal tax rate was reduced to 2.25 per cent for properties of $3 million or more in assessed value, saving commercial and industrial investors “$1,000 million in five years”.73
Furthermore, the minimum tax threshold for Victoria’s SLT has been climbing approximately $25,000 every year since 2001. Therefore, the State government is gifting landowners with a reduced tax liability. This encourages greater hoarding of land and dwellings in lower priced regions of the market, raising the SV rate and exacerbating Melbourne’s affordable housing crisis for both renter and homebuyer.
In contrast to the areas serviced by City West Water, the established middle ring suburbs bounded by Yarra Valley Water and South East Water in the eastern, northern and southern regions of the state have a much lower rate of SVs.
These areas come with a locational premium of situating close to taxpayer-funded infrastructure such as the state’s top schools, parks, entertainment facilities, and so forth, and thus hold the majority of Melbourne’s businesses and current population. Consequently they have a much higher concentration of owner-occupiers relative to investors, proportionally reducing the number of SVs. Kew East for example, which has an 88.1 per cent share of owner-occupiers, or Vermont South with 90.8 per cent share.74
Nevertheless, vacancies in these regions are potentially more damaging, as supply can only come from infill development - a problem further hampered due to Melbourne’s new zoning laws that protect ‘blue-ribbon’ areas from sub-division, while ‘poorer suburbs’ are given the green light.
This would include the high-priced suburbs within the LGAs of Boorondara, Stonnington, Manningham, and Whitehorse for example. These regions are currently experiencing high levels of speculative price growth and increased demand from a growing influx of new Chinese migrants that have established communities within these LGAs.75
26
To illustrate, there are 451 long-term speculative vacancies in Glen Waverly, 484 in Mount Waverley, and 213 in Balwyn North – all popular school zones where demand is strong and available supply low.76
In this regard, top performing government schools in Melbourne do not reserve places for those showing merit. Rather only those residents able to support the 20-50 per cent premium for accommodation are able to send their children to public school in the tightly banded school catchment precincts. This further segregates our schooling system.
Yet this isn’t the only reason homebuyers choose to invest in suburbs east of the city. Due to their appeal, land prices in the east attract considerable capital gains.
For example, owners in the LGAs of Boorandara and Whitehorse, who re-sold their homes in the June quarter of 2014 after an average hold period of around 10 years, received a substantial median gain of $519,350 and $380,000 respectively. In contrast, owners in the western LGAs of Melton and Wyndam, received a lesser median gain of $95,250 and $91,000 respectively – a stark contrast in location value which is further reflected in the socio economic status of each LGA.77
Taking this one step further, studies demonstrate that the reputation and cache attached to very high-cost housing markets attracts higher-income residents from interstate and overseas. This is relative to the established population of older lower-income residents that purchased when prices were cheaper and are understandably happy to ‘stay put’. 78
In contrast, the cheaper markets in the west, such as Wyndham and Melton, gain a higher proportion of very low-income households from local LGAs, with the migrant income inflow matching closely to that of the resident population.79
The effects are therefore exacerbated with elevated concentrations of high-income households in well-facilitated areas such as in the east of Melbourne. Poorer households however, are confined to suburbs lacking essential amenities, leading to a higher incidence of welfare concerns with the distance to employment centres intensifying living costs.
The picture is consequently one of social polarisation and it sits in stark contrast to the 1980s when residents across all income brackets
had access to affordable shelter throughout 90 per cent of the greater metropolitan region.80
Australian’s like to think of themselves as a ‘fair go’ society – however, inequitable disparities in our housing, tax and supply policies result in an English-style class divide, evidenced in:
• Fewer Australians owning their homes outright 81
• A rising percentage of long-term tenants renting for a period of 10 years or more82
• A decrease in the number of low income buyers obtaining ownership, particularly families with children 83
• A drop in the number of affordable rental dwellings with a marked increase in the number of households in rental stress84
• Greater requirements for public housing.85 • A rise in homeless percentages and
those who drift in and out of secure rental accommodation – with ongoing intergenerational effects86
• An increase in the number of residents living in severely crowded accommodation.87
A primary driver assisting the trend is Australia’s mortgage-debt to GDP ratio, which has increased from 15.9 per cent in 1988 to a record 86.9 in 2014. While investor debt has ballooned from 2.8 per cent in 1990 to 29.3 per cent today.88 These figures are likely to rise further as we head into 2015, especially considering the dominance the ‘Big Four’ banks hold over the residential mortgage sector.
However, little of value is being invested into the productive sectors of the economy. Instead, the country’s wealth is being permitted to gravitate into an elite nuclei of financially strong hands as taxes are imposed on every labourer in the state to expand city boundaries outwards. Meanwhile, wealthy landowners in premium localities claw this back and more, through the superior ‘capital gains’ resulting from an elevated inflow of high-income residents attracted to prime government and community services. Consequently, assets inflate whilst the ‘real economy’ stagnates.First homebuyers suffering from rapidly escalating costs are necessary oxygen for the system.
Therefore their judgment is manipulated with housing affordability reclassified as mortgage serviceability - how far the pay-cheque can stretch each month rather than highlighting the upfront cost. Meanwhile, young buyers are encouraged
27
to enter the market as speculators, living off their parents until they can gain a ‘foothold’ from leveraging the equity.
Only by removing the accelerants that produce this behaviour – contained in our tax, supply and monetary policies – can we start to address the housing affordability crisis that impoverishes us as a nation.
In 2013 alone, Australia lost an astonishing $73 billion of output stemming from deadweight (inefficient) losses of taxation.89 However, economic rents that exhibit no deadweight loss in their application are lightly taxed in comparison, yet comprise an estimated 23.6 per cent of GDP (2011-12) – residential land being the largest single component.90
The wisdom and over-reaching benefits of changing Australia’s tax system are unquestionable.
Moreover, study after study demonstrates that basing a system on the collection of resource and monopoly profits for the facilitation of local and community services is beneficial for all. Such a system reduces the tax liability on most households whilst maintaining complete revenue neutrality.91
Australia’s 2010 Future Tax System Review concluded that “economic growth would be higher if governments raised more revenue from land and less revenue from other tax bases.” 92 It also proposed that stamp duty (which is an inconsistent and inequitable source of revenue) be replaced by a broad based land tax, levied on a per-square-metre and per-land holding basis, rather than retaining present land tax arrangements.
The Australian Housing and Urban Research Institute (AHURI) modelled the proposed reforms to
demonstrate how over the longer-term, lower house prices will assist mobility within the housing market as well as removing the dangers of boom and bust recessionary financial cycles.93
Importantly for Australia, it can also provide a reliable provision of local revenue to facilitate much-needed outer suburban infrastructure, thereby aiding effective decentralisation.
As with any change to the tax system, the headwinds come from educating the public of the far-reaching benefits. In this respect, balanced debate is necessary.
Such changes would see an increased tax burden falling on those that have significant political influence; therefore strong leadership is vital to deflect lobbying from wealthy landowners with vested interests.
Ultimately, any change must come by way of a democratic agreement and an acknowledgement of the difference between private income that is earned - and the unearned wealth that disproportionately flows to landowners from public and community investment.
The public should be freed from burdensome taxation, whilst the collection of the economic rent from land and nature’s resources would improve Australia’s prosperity and competitiveness as a nation.
A more effective vacancy measure is an important first step to educating the public. The Speculative Vacancy measure reveals a significant component to Australia’s housing supply crisis and must be utilised across Australia. The importance of this message is identified in our core finding, that land holdings equaling almost a year’s turnover of housing stock are currently laid to waste.
28
Recommendations1. Improved State Land TaxThe centrepiece to any future reforms aiming to bring SVs to market is an enhanced State Land Tax (SLT). Current SLT is only levied on investors, potentially allowing the cost to be shifted onto tenants. Instead, a low flat-rate no threshold SLT should replace the progressive land tax scale that leads to distortions in ownership, evidenced by the elevated number of western SVs highlighted in this report.
This would act as a disincentive to withhold properties from use, with escalating land prices increasing the relative holding costs. A broad based SLT cannot be passed onto tenants and additionally stunts the size of speculative capital gains, while lowering after-tax rents. The removal of owner-occupier concessions – the largest segment of the market – would help stimulate building activity and improve the responsiveness of supply.
Additionally, the Capital Improved Value (CIV) rating system should be replaced with the superior site-rating system (SVR). The former penalises building activity by valuing homes and their improvements, while the latter values the site/land value only – leading to higher construction and employment levels, and broadly advantaging family homeowners and tenants.
A SLT would further encourage decentralisation, as the rise in land value (the site value) should be sufficient to cover the expenditure of enhanced infrastructure and transport arterials to fringe localities; effectively acting as a ‘betterment levy’.
2. Abolition of Transfer TaxesAs recommended by the Ken Henry Tax Review, an enhanced SLT should replace transfer taxes such as conveyance stamp duties, which decrease mobility and reduce the propensity for current homeowners to downsize.
Revenue derived from an enhanced SLT is more predictable and less volatile that stamp duties, which are dependent on the volume of housing transfers in addition to the transacted price.
Under this scenario, the upfront cost of land would fall, the higher tax base would blunt potential capital gains from speculation, and a steady source of revenue for state government provides greater control over public finances.
3. Better funding for Infrastructure in New estates Current infrastructure levies that fall on developers (when sites are subdivided for construction) increase the cost of land and discourage supply, as developers must recover the charge from consumers or leave land lying unused.
This system should be replaced by a bond system of financing, recouping costs from residents over a lengthy period through levies based on the locational value of their land. In this scenario, the costs of infrastructure are not folded into house prices, penalising lower income buyers.
4. Public HousingGovernments should dramatically increase the availability of public housing to ameliorate household budget stress for thousands of families at the threshold.
The current system of taxation encourages governments to speculate on crown land – ‘selling off the commons’ – rather, a much greater proportion of this land should be used for public housing. This is preferable to current rental assistance packages that enable landlords to charge more than the market would otherwise bear.
29
Footnotes Appendix A: All Residential Properties
1 Properties using less than <50LpD of water over a 12 month period.
2 Productivity Commission - First Home Ownership’ Key Findings, March 2004. p.XII
3 Select Committee on Housing Affordability in Australia - A good house is hard to find - Executive Summary, June 2008. p.2.
4 Dr Ken Henry - Australia’s Future Tax System Review: Final Report, Detailed Analysis Ch2-1
5 Philip Soos & Paul D. Egan - Australia’s Land Bubble: The Cause of Unaffordable Housing. Feb 2014
6 Soos & Egan 2014 p.37 RBA - Investor housing loans now account for
around half of all housing loans (excluding owner-occupier refinancing), which is a record high.
8 Jonathan Mott and Adam Lee - UBS 2014 analysis of lending data from APRA since 2012.
9 The Grattan Institute estimates that through policies such as exemptions for the family home from land and capital gains taxes and the eligibility test for the aged pension, governments provide benefits to homeowners worth $36 billion a year
10 Analysis of 226 members in both houses of parliament with an ownership stake in a total of 563 properties (Lindsay David, Paul D Egan & Philip Soos 2014)
11 RP Data Capital city rental rate growth the slowest in over a decade Nov 2014
12 Paul D. Egan & Philip Soos - Prosper Australia: Submission to Senate Inquiry on Housing Affordability. 2014
13 Philip Soos & Paul Egan Housing Shortage Chimera Rises September 2014)
14 RP Data – 201415 Marc Pallisco - Fairfax: The Age Domain Nice
Capital Gain for Sunbury Farm Owners 22 Oct 201416 Saul Eslake – 50 Years of Housing Policy Failure
201317 Effects of housing inequality are utlined in the
conclusion of this report.18 Saul Eslake - 50 years of Housing Policy Failure Sep
201319 Properties using <50LpD during the calendar year
of 2013.
20 David Collyer Land Banking Profits during a Housing Supply Crisis Oct 2014
21 SQM Research, a real estate research firm, calculates vacancy rates using online listings for rental properties that have been advertised for three weeks or more and compares them to the total number of established rental properties by area, extrapolated from ABS Census data.
22 Rupert Neate - The Guardian The Scandal of Europe’s 11m Empty Homes Feb 2014
23 Information sourced from Melbourne Water- www.melbournewater.com.au
24 Paul Roberts - Yarra Valley Water Appliance and Usage Statistics’ June 2012
25 Roberts, Athuraliya, & Brown - Residential Water Use Studies’ 2012
26 ABS Census data27 Michael Redhead, - Smart Water Fund Melbourne
Residential Water End Uses 201328 Michelle Ainsworth - Herald Sun, Savings Fear on
Water Metre Scheme’ March 201329 ABS: 4602.0.55.003 Environmental Issues: Water
use and Conservation March 2013, ABS 4602 Household Water and Energy Use, Victoria 2011
30 Candice Moy - Rainwater Tank Households: Water Savers or Water Users? Volume 50, Issue 2, p.204–216, May 2012
31 Tourism Australia - Melbourne Market Profile: Year ending December 2013
32 ABS (2010: Table 1.6)33 SQM Research34 Using less then <50LpD35 VG data.36 City Of Melbourne: Docklands Small Area
Demographic Profile 201337 All Vacancy Rate data sourced from SQM
Research38 Using <50LpD39 All median rental data sourced from the REIV40 City of Melbourne: Understanding the property and
economic drivers of housing 2013.41 Bob Birrell Melbourne’s High-Rise Apartment Boom
201342 Charter Keck Cramer 2013- offshore developers
account for half of all apartment projects in Melbourne central city areas – a rising trend
30
43 Private correspondence with inner-city developers44 Census Data: 14% in the age group of 20s – early
30s. ABS 2011 .id blog45 M. Kelly The Irish Property Bubble: Causes and
Consequences. 200946 *As at the end of 201347 Using <50LpD48 Stephen Connelly and Alan Olsen - Education
as an Export for Australia: Green Shoots, First Swallows, but Not Quite Out of the Woods Yet
49 Using <50LpD50 ABS, Building Approvals, Australia (8731.0) 51 Australian Bureau of Statistics, Regional
Population Growth, Australia (3218.0) 52 Using <50LpD53 Berwick Leader New development set to
provide 21,000 homes in Clyde North March 201454 .City of Casey .id profile55 ibid56 Bob Birrell End of Affordable housing in Melbourne
201257 Centre for International Economics (CIE) Taxation
of the Housing Sector Sep 201158 RP Data/HIA - median lot sizes have reduced from
615sqm in 2003 to 448 sqm in 2014.59 (Birrell 2012)60 City of Wyndham Council Data 201461 HIA and RP Data Residential Land Report –
October 201462 City of Wyndham .id profile - 201463 Miki Perkins – The Age Soaring rents make
‘cheap’ Melbourne suburbs inaccessible: Council to Homeless Persons’ May 2014
64 City of Hobsons Bay .id profile – 201465 Mason Gaffney. Land as a Distinctive Factor of
Production 200466 Eli Greenblat The Sydney Morning Herald: Woolies’
$1b land bank for hardware Nov 201367 Nichole Lindsay, The Sydney Morning Herald:
Buyer outlays $11m for Carlton office building Sep 2014
68 RP Data June 201469 City of Melbourne CLUE North Melbourne 201470 Langdon, Davis . Sustainability Victoria ‘The Next
Wave: Retrofitting Victoria’s Office Buildings’ The City of Melbourne Property Market Digest Sep 2013
71 RP Data research 201472 ibid73 David Collyer Bad taxes blight our land April 201374 RP Data research 201475 ABS Census 2011 data – Mapping Where
Migrants Were Born.76 Properties using <50LpD77 RP Data Pain and Gain report 201478 AHURI: Housing Inequality And The Role Of Social
Mobility 201079 ibid80 ibid81 ABS - In 1996/7, 42% of households owned their
home without a mortgage. This proportion is now down to 31%
82 ABS -A third of all private renters are long-term renters (defined as renting for periods of 10 years or more continuously), an increase from just over a quarter in 1994
83 ABS - A drop of 49% to 33% between 1982 and 2008
84 ABS - In 2009–10, 60% of lower-income rental households in Australia were in rental stress.
85 AHURI 2013 - 28% increased demand for public housing projected by 2023
86 ABS - Between 2006 and 2011 the rate of homelessness increased by 8% from 89,728 to 105,237
87 ABS - The total number of people living in ‘severely’ crowded dwellings jumped 31% (or 9,839 people) to 41,370 from 2006 - 2011
88 Philip Soos & Paul D Egan Abbott Government Ignores Australia’s actual Debt Crisis October 2014
89 Figures from economist Philip Soos90 Karl Fitzgerald. Total Resource Rents of Australia
2013 91 Correspondence with Joshua Vincent – Studies on
state and federal land tax reform from The Centre for the Study of Economics - at urbantoolsconsult.org
92 Dr Ken Henry - Australia’s Future Tax System Review 2010 Ch.C C2
93 AHURI Modelling The Impacts Of The Henry Review Tax Recommendations 2013
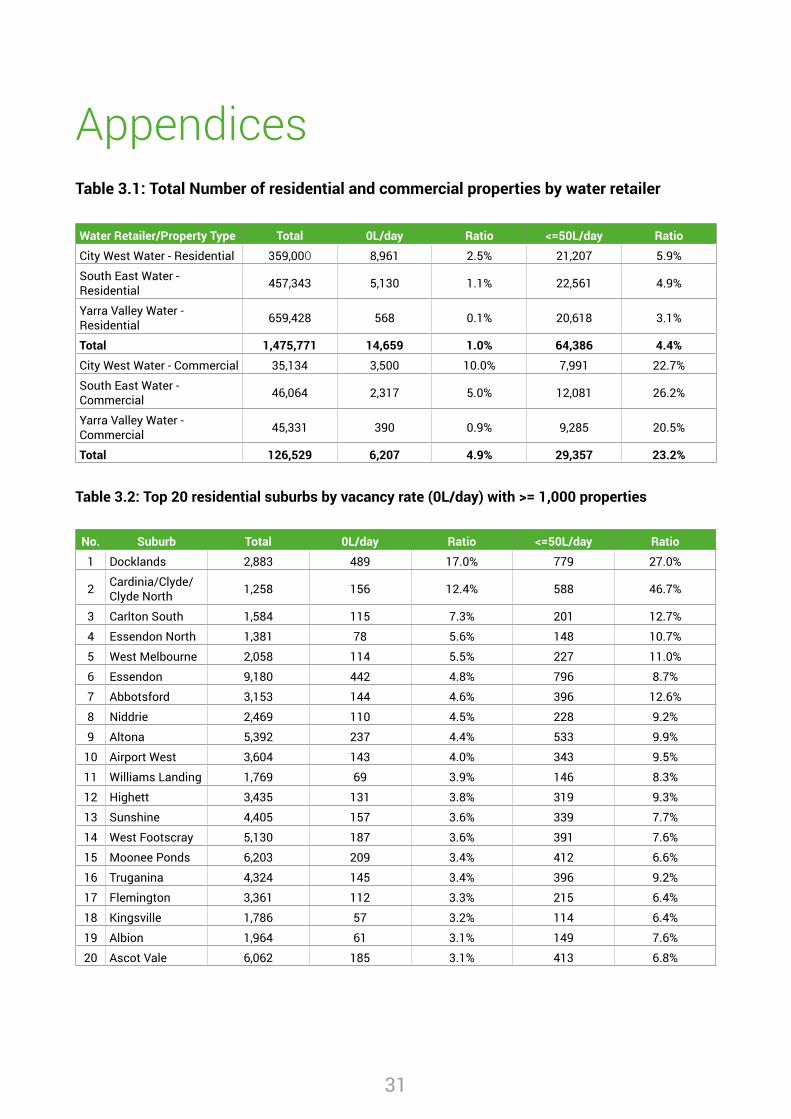
31
AppendicesTable 3.1: Total Number of residential and commercial properties by water retailer
Water Retailer/Property Type Total 0L/day Ratio <=50L/day Ratio
City West Water - Residential 359,000 8,961 2.5% 21,207 5.9%
South East Water - Residential 457,343 5,130 1.1% 22,561 4.9%
Yarra Valley Water - Residential 659,428 568 0.1% 20,618 3.1%
Total 1,475,771 14,659 1.0% 64,386 4.4%
City West Water - Commercial 35,134 3,500 10.0% 7,991 22.7%
South East Water - Commercial 46,064 2,317 5.0% 12,081 26.2%
Yarra Valley Water - Commercial 45,331 390 0.9% 9,285 20.5%
Total 126,529 6,207 4.9% 29,357 23.2%
Table 3.2: Top 20 residential suburbs by vacancy rate (0L/day) with >= 1,000 properties
No. Suburb Total 0L/day Ratio <=50L/day Ratio
1 Docklands 2,883 489 17.0% 779 27.0%
2 Cardinia/Clyde/Clyde North 1,258 156 12.4% 588 46.7%
3 Carlton South 1,584 115 7.3% 201 12.7%
4 Essendon North 1,381 78 5.6% 148 10.7%
5 West Melbourne 2,058 114 5.5% 227 11.0%
6 Essendon 9,180 442 4.8% 796 8.7%
7 Abbotsford 3,153 144 4.6% 396 12.6%
8 Niddrie 2,469 110 4.5% 228 9.2%
9 Altona 5,392 237 4.4% 533 9.9%
10 Airport West 3,604 143 4.0% 343 9.5%
11 Williams Landing 1,769 69 3.9% 146 8.3%
12 Highett 3,435 131 3.8% 319 9.3%
13 Sunshine 4,405 157 3.6% 339 7.7%
14 West Footscray 5,130 187 3.6% 391 7.6%
15 Moonee Ponds 6,203 209 3.4% 412 6.6%
16 Truganina 4,324 145 3.4% 396 9.2%
17 Flemington 3,361 112 3.3% 215 6.4%
18 Kingsville 1,786 57 3.2% 114 6.4%
19 Albion 1,964 61 3.1% 149 7.6%
20 Ascot Vale 6,062 185 3.1% 413 6.8%
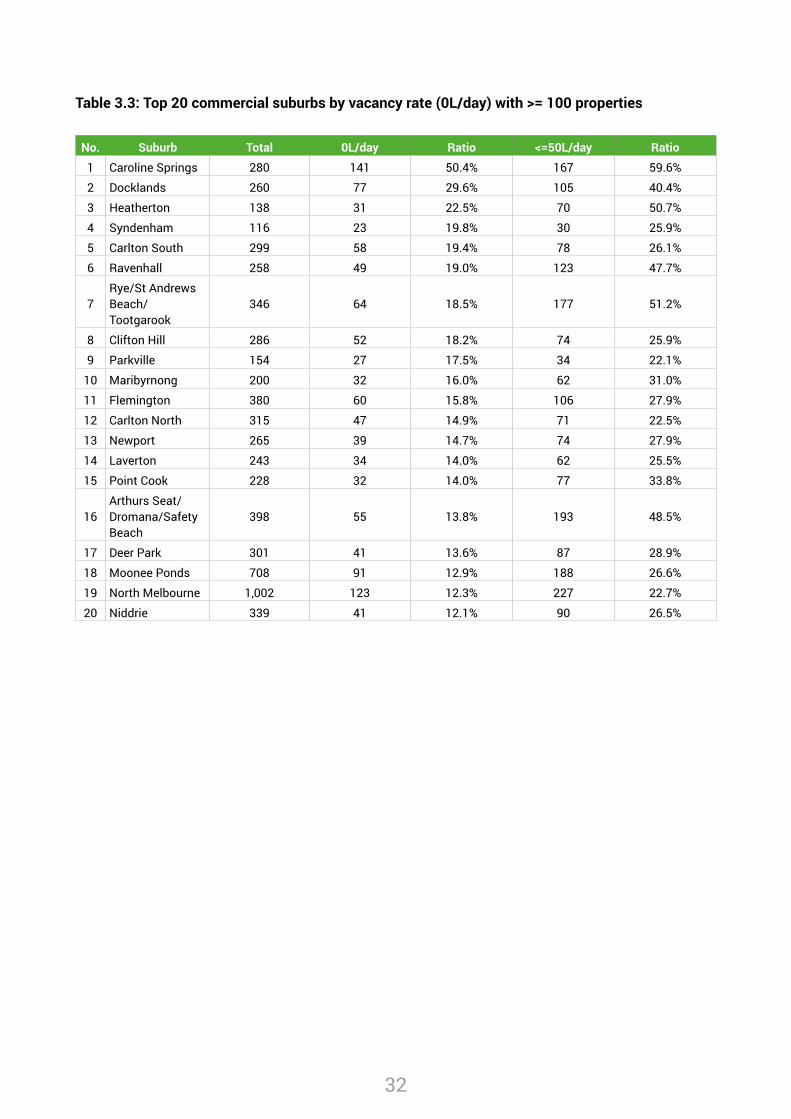
32
Table 3.3: Top 20 commercial suburbs by vacancy rate (0L/day) with >= 100 properties
No. Suburb Total 0L/day Ratio <=50L/day Ratio
1 Caroline Springs 280 141 50.4% 167 59.6%
2 Docklands 260 77 29.6% 105 40.4%
3 Heatherton 138 31 22.5% 70 50.7%
4 Syndenham 116 23 19.8% 30 25.9%
5 Carlton South 299 58 19.4% 78 26.1%
6 Ravenhall 258 49 19.0% 123 47.7%
7Rye/St Andrews Beach/Tootgarook
346 64 18.5% 177 51.2%
8 Clifton Hill 286 52 18.2% 74 25.9%
9 Parkville 154 27 17.5% 34 22.1%
10 Maribyrnong 200 32 16.0% 62 31.0%
11 Flemington 380 60 15.8% 106 27.9%
12 Carlton North 315 47 14.9% 71 22.5%
13 Newport 265 39 14.7% 74 27.9%
14 Laverton 243 34 14.0% 62 25.5%
15 Point Cook 228 32 14.0% 77 33.8%
16Arthurs Seat/Dromana/Safety Beach
398 55 13.8% 193 48.5%
17 Deer Park 301 41 13.6% 87 28.9%
18 Moonee Ponds 708 91 12.9% 188 26.6%
19 North Melbourne 1,002 123 12.3% 227 22.7%
20 Niddrie 339 41 12.1% 90 26.5%
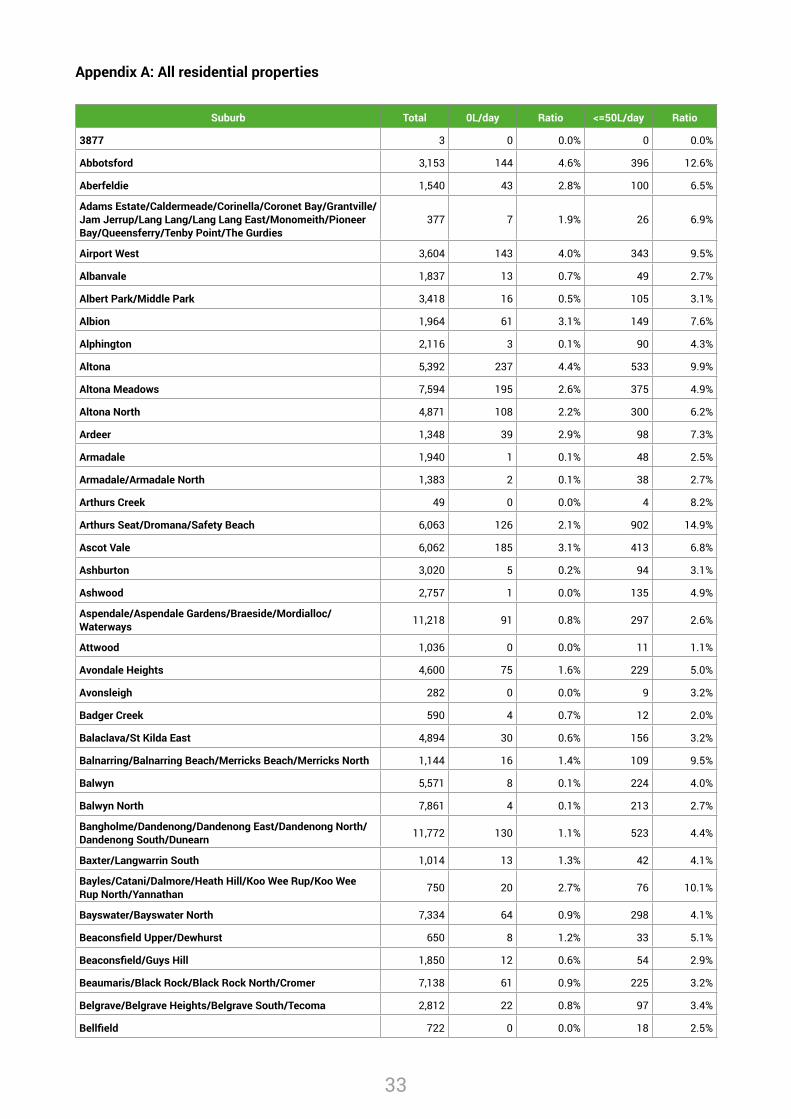
33
Appendix A: All residential properties
Suburb Total 0L/day Ratio <=50L/day Ratio
3877 3 0 0.0% 0 0.0%
Abbotsford 3,153 144 4.6% 396 12.6%
Aberfeldie 1,540 43 2.8% 100 6.5%
Adams Estate/Caldermeade/Corinella/Coronet Bay/Grantville/Jam Jerrup/Lang Lang/Lang Lang East/Monomeith/Pioneer Bay/Queensferry/Tenby Point/The Gurdies
377 7 1.9% 26 6.9%
Airport West 3,604 143 4.0% 343 9.5%
Albanvale 1,837 13 0.7% 49 2.7%
Albert Park/Middle Park 3,418 16 0.5% 105 3.1%
Albion 1,964 61 3.1% 149 7.6%
Alphington 2,116 3 0.1% 90 4.3%
Altona 5,392 237 4.4% 533 9.9%
Altona Meadows 7,594 195 2.6% 375 4.9%
Altona North 4,871 108 2.2% 300 6.2%
Ardeer 1,348 39 2.9% 98 7.3%
Armadale 1,940 1 0.1% 48 2.5%
Armadale/Armadale North 1,383 2 0.1% 38 2.7%
Arthurs Creek 49 0 0.0% 4 8.2%
Arthurs Seat/Dromana/Safety Beach 6,063 126 2.1% 902 14.9%
Ascot Vale 6,062 185 3.1% 413 6.8%
Ashburton 3,020 5 0.2% 94 3.1%
Ashwood 2,757 1 0.0% 135 4.9%
Aspendale/Aspendale Gardens/Braeside/Mordialloc/Waterways 11,218 91 0.8% 297 2.6%
Attwood 1,036 0 0.0% 11 1.1%
Avondale Heights 4,600 75 1.6% 229 5.0%
Avonsleigh 282 0 0.0% 9 3.2%
Badger Creek 590 4 0.7% 12 2.0%
Balaclava/St Kilda East 4,894 30 0.6% 156 3.2%
Balnarring/Balnarring Beach/Merricks Beach/Merricks North 1,144 16 1.4% 109 9.5%
Balwyn 5,571 8 0.1% 224 4.0%
Balwyn North 7,861 4 0.1% 213 2.7%
Bangholme/Dandenong/Dandenong East/Dandenong North/Dandenong South/Dunearn 11,772 130 1.1% 523 4.4%
Baxter/Langwarrin South 1,014 13 1.3% 42 4.1%
Bayles/Catani/Dalmore/Heath Hill/Koo Wee Rup/Koo Wee Rup North/Yannathan 750 20 2.7% 76 10.1%
Bayswater/Bayswater North 7,334 64 0.9% 298 4.1%
Beaconsfield Upper/Dewhurst 650 8 1.2% 33 5.1%
Beaconsfield/Guys Hill 1,850 12 0.6% 54 2.9%
Beaumaris/Black Rock/Black Rock North/Cromer 7,138 61 0.9% 225 3.2%
Belgrave/Belgrave Heights/Belgrave South/Tecoma 2,812 22 0.8% 97 3.4%
Bellfield 722 0 0.0% 18 2.5%
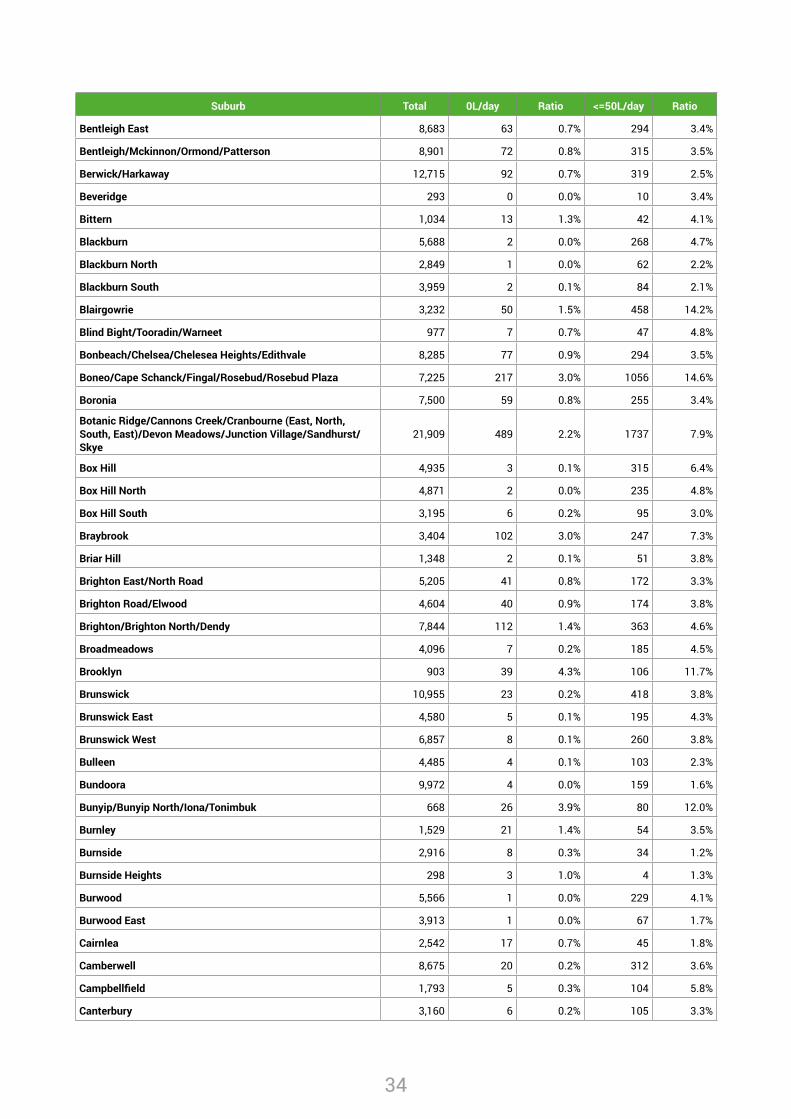
34
Suburb Total 0L/day Ratio <=50L/day Ratio
Bentleigh East 8,683 63 0.7% 294 3.4%
Bentleigh/Mckinnon/Ormond/Patterson 8,901 72 0.8% 315 3.5%
Berwick/Harkaway 12,715 92 0.7% 319 2.5%
Beveridge 293 0 0.0% 10 3.4%
Bittern 1,034 13 1.3% 42 4.1%
Blackburn 5,688 2 0.0% 268 4.7%
Blackburn North 2,849 1 0.0% 62 2.2%
Blackburn South 3,959 2 0.1% 84 2.1%
Blairgowrie 3,232 50 1.5% 458 14.2%
Blind Bight/Tooradin/Warneet 977 7 0.7% 47 4.8%
Bonbeach/Chelsea/Chelesea Heights/Edithvale 8,285 77 0.9% 294 3.5%
Boneo/Cape Schanck/Fingal/Rosebud/Rosebud Plaza 7,225 217 3.0% 1056 14.6%
Boronia 7,500 59 0.8% 255 3.4%
Botanic Ridge/Cannons Creek/Cranbourne (East, North, South, East)/Devon Meadows/Junction Village/Sandhurst/Skye
21,909 489 2.2% 1737 7.9%
Box Hill 4,935 3 0.1% 315 6.4%
Box Hill North 4,871 2 0.0% 235 4.8%
Box Hill South 3,195 6 0.2% 95 3.0%
Braybrook 3,404 102 3.0% 247 7.3%
Briar Hill 1,348 2 0.1% 51 3.8%
Brighton East/North Road 5,205 41 0.8% 172 3.3%
Brighton Road/Elwood 4,604 40 0.9% 174 3.8%
Brighton/Brighton North/Dendy 7,844 112 1.4% 363 4.6%
Broadmeadows 4,096 7 0.2% 185 4.5%
Brooklyn 903 39 4.3% 106 11.7%
Brunswick 10,955 23 0.2% 418 3.8%
Brunswick East 4,580 5 0.1% 195 4.3%
Brunswick West 6,857 8 0.1% 260 3.8%
Bulleen 4,485 4 0.1% 103 2.3%
Bundoora 9,972 4 0.0% 159 1.6%
Bunyip/Bunyip North/Iona/Tonimbuk 668 26 3.9% 80 12.0%
Burnley 1,529 21 1.4% 54 3.5%
Burnside 2,916 8 0.3% 34 1.2%
Burnside Heights 298 3 1.0% 4 1.3%
Burwood 5,566 1 0.0% 229 4.1%
Burwood East 3,913 1 0.0% 67 1.7%
Cairnlea 2,542 17 0.7% 45 1.8%
Camberwell 8,675 20 0.2% 312 3.6%
Campbellfield 1,793 5 0.3% 104 5.8%
Canterbury 3,160 6 0.2% 105 3.3%
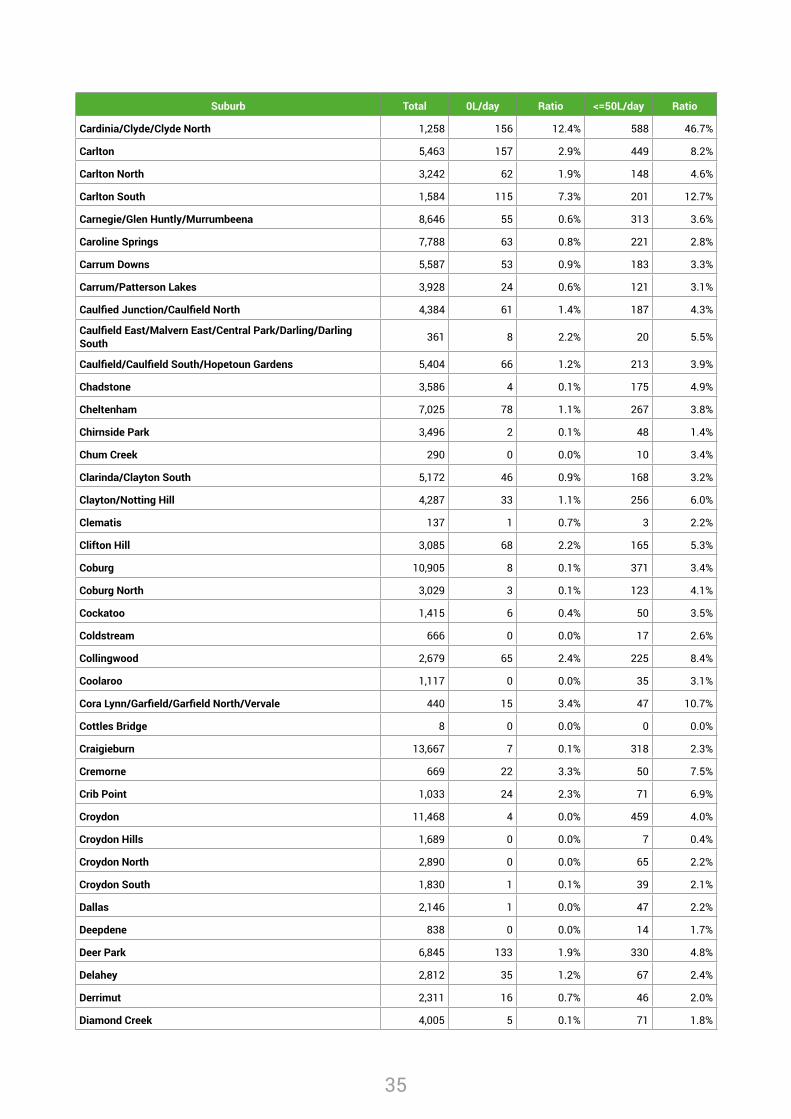
35
Suburb Total 0L/day Ratio <=50L/day Ratio
Cardinia/Clyde/Clyde North 1,258 156 12.4% 588 46.7%
Carlton 5,463 157 2.9% 449 8.2%
Carlton North 3,242 62 1.9% 148 4.6%
Carlton South 1,584 115 7.3% 201 12.7%
Carnegie/Glen Huntly/Murrumbeena 8,646 55 0.6% 313 3.6%
Caroline Springs 7,788 63 0.8% 221 2.8%
Carrum Downs 5,587 53 0.9% 183 3.3%
Carrum/Patterson Lakes 3,928 24 0.6% 121 3.1%
Caulfied Junction/Caulfield North 4,384 61 1.4% 187 4.3%
Caulfield East/Malvern East/Central Park/Darling/Darling South 361 8 2.2% 20 5.5%
Caulfield/Caulfield South/Hopetoun Gardens 5,404 66 1.2% 213 3.9%
Chadstone 3,586 4 0.1% 175 4.9%
Cheltenham 7,025 78 1.1% 267 3.8%
Chirnside Park 3,496 2 0.1% 48 1.4%
Chum Creek 290 0 0.0% 10 3.4%
Clarinda/Clayton South 5,172 46 0.9% 168 3.2%
Clayton/Notting Hill 4,287 33 1.1% 256 6.0%
Clematis 137 1 0.7% 3 2.2%
Clifton Hill 3,085 68 2.2% 165 5.3%
Coburg 10,905 8 0.1% 371 3.4%
Coburg North 3,029 3 0.1% 123 4.1%
Cockatoo 1,415 6 0.4% 50 3.5%
Coldstream 666 0 0.0% 17 2.6%
Collingwood 2,679 65 2.4% 225 8.4%
Coolaroo 1,117 0 0.0% 35 3.1%
Cora Lynn/Garfield/Garfield North/Vervale 440 15 3.4% 47 10.7%
Cottles Bridge 8 0 0.0% 0 0.0%
Craigieburn 13,667 7 0.1% 318 2.3%
Cremorne 669 22 3.3% 50 7.5%
Crib Point 1,033 24 2.3% 71 6.9%
Croydon 11,468 4 0.0% 459 4.0%
Croydon Hills 1,689 0 0.0% 7 0.4%
Croydon North 2,890 0 0.0% 65 2.2%
Croydon South 1,830 1 0.1% 39 2.1%
Dallas 2,146 1 0.0% 47 2.2%
Deepdene 838 0 0.0% 14 1.7%
Deer Park 6,845 133 1.9% 330 4.8%
Delahey 2,812 35 1.2% 67 2.4%
Derrimut 2,311 16 0.7% 46 2.0%
Diamond Creek 4,005 5 0.1% 71 1.8%
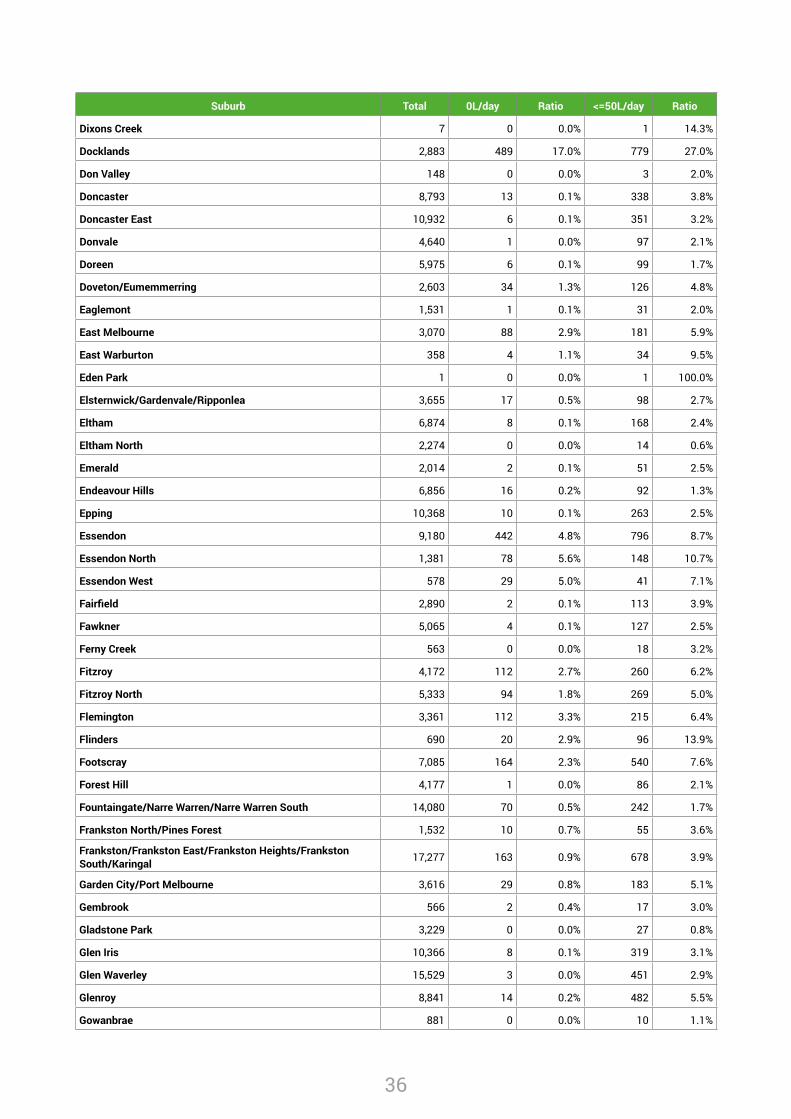
36
Suburb Total 0L/day Ratio <=50L/day Ratio
Dixons Creek 7 0 0.0% 1 14.3%
Docklands 2,883 489 17.0% 779 27.0%
Don Valley 148 0 0.0% 3 2.0%
Doncaster 8,793 13 0.1% 338 3.8%
Doncaster East 10,932 6 0.1% 351 3.2%
Donvale 4,640 1 0.0% 97 2.1%
Doreen 5,975 6 0.1% 99 1.7%
Doveton/Eumemmerring 2,603 34 1.3% 126 4.8%
Eaglemont 1,531 1 0.1% 31 2.0%
East Melbourne 3,070 88 2.9% 181 5.9%
East Warburton 358 4 1.1% 34 9.5%
Eden Park 1 0 0.0% 1 100.0%
Elsternwick/Gardenvale/Ripponlea 3,655 17 0.5% 98 2.7%
Eltham 6,874 8 0.1% 168 2.4%
Eltham North 2,274 0 0.0% 14 0.6%
Emerald 2,014 2 0.1% 51 2.5%
Endeavour Hills 6,856 16 0.2% 92 1.3%
Epping 10,368 10 0.1% 263 2.5%
Essendon 9,180 442 4.8% 796 8.7%
Essendon North 1,381 78 5.6% 148 10.7%
Essendon West 578 29 5.0% 41 7.1%
Fairfield 2,890 2 0.1% 113 3.9%
Fawkner 5,065 4 0.1% 127 2.5%
Ferny Creek 563 0 0.0% 18 3.2%
Fitzroy 4,172 112 2.7% 260 6.2%
Fitzroy North 5,333 94 1.8% 269 5.0%
Flemington 3,361 112 3.3% 215 6.4%
Flinders 690 20 2.9% 96 13.9%
Footscray 7,085 164 2.3% 540 7.6%
Forest Hill 4,177 1 0.0% 86 2.1%
Fountaingate/Narre Warren/Narre Warren South 14,080 70 0.5% 242 1.7%
Frankston North/Pines Forest 1,532 10 0.7% 55 3.6%
Frankston/Frankston East/Frankston Heights/Frankston South/Karingal 17,277 163 0.9% 678 3.9%
Garden City/Port Melbourne 3,616 29 0.8% 183 5.1%
Gembrook 566 2 0.4% 17 3.0%
Gladstone Park 3,229 0 0.0% 27 0.8%
Glen Iris 10,366 8 0.1% 319 3.1%
Glen Waverley 15,529 3 0.0% 451 2.9%
Glenroy 8,841 14 0.2% 482 5.5%
Gowanbrae 881 0 0.0% 10 1.1%
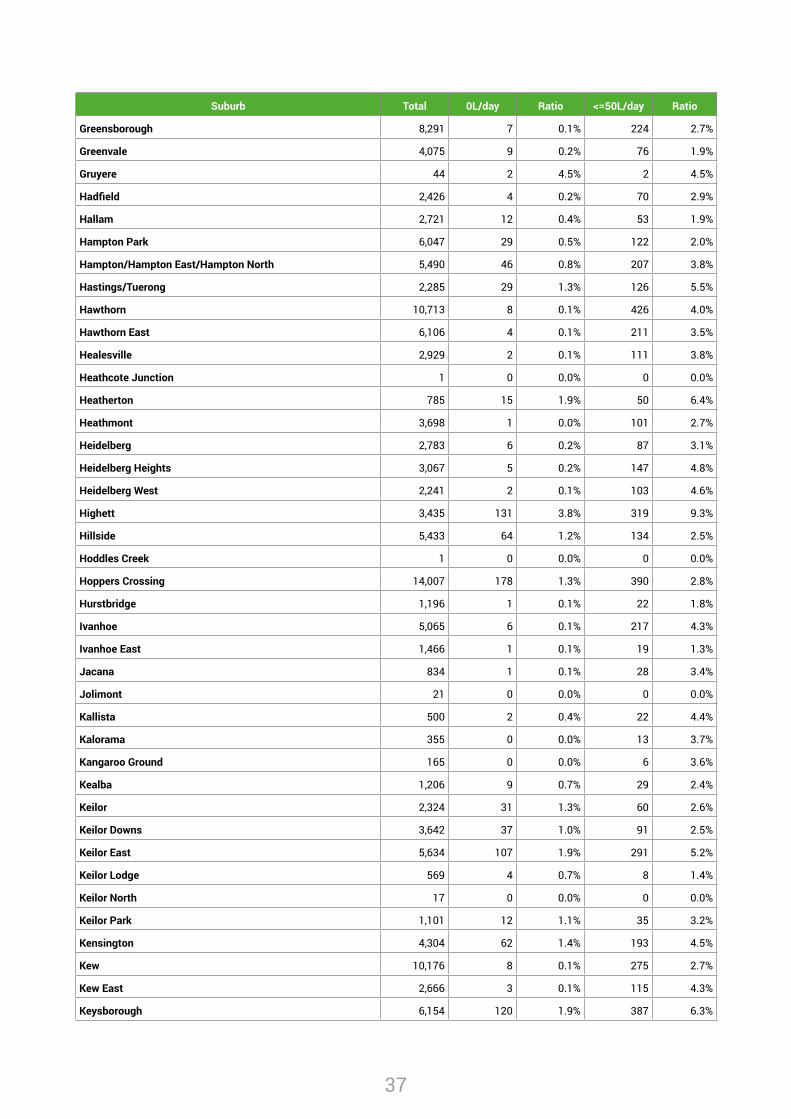
37
Suburb Total 0L/day Ratio <=50L/day Ratio
Greensborough 8,291 7 0.1% 224 2.7%
Greenvale 4,075 9 0.2% 76 1.9%
Gruyere 44 2 4.5% 2 4.5%
Hadfield 2,426 4 0.2% 70 2.9%
Hallam 2,721 12 0.4% 53 1.9%
Hampton Park 6,047 29 0.5% 122 2.0%
Hampton/Hampton East/Hampton North 5,490 46 0.8% 207 3.8%
Hastings/Tuerong 2,285 29 1.3% 126 5.5%
Hawthorn 10,713 8 0.1% 426 4.0%
Hawthorn East 6,106 4 0.1% 211 3.5%
Healesville 2,929 2 0.1% 111 3.8%
Heathcote Junction 1 0 0.0% 0 0.0%
Heatherton 785 15 1.9% 50 6.4%
Heathmont 3,698 1 0.0% 101 2.7%
Heidelberg 2,783 6 0.2% 87 3.1%
Heidelberg Heights 3,067 5 0.2% 147 4.8%
Heidelberg West 2,241 2 0.1% 103 4.6%
Highett 3,435 131 3.8% 319 9.3%
Hillside 5,433 64 1.2% 134 2.5%
Hoddles Creek 1 0 0.0% 0 0.0%
Hoppers Crossing 14,007 178 1.3% 390 2.8%
Hurstbridge 1,196 1 0.1% 22 1.8%
Ivanhoe 5,065 6 0.1% 217 4.3%
Ivanhoe East 1,466 1 0.1% 19 1.3%
Jacana 834 1 0.1% 28 3.4%
Jolimont 21 0 0.0% 0 0.0%
Kallista 500 2 0.4% 22 4.4%
Kalorama 355 0 0.0% 13 3.7%
Kangaroo Ground 165 0 0.0% 6 3.6%
Kealba 1,206 9 0.7% 29 2.4%
Keilor 2,324 31 1.3% 60 2.6%
Keilor Downs 3,642 37 1.0% 91 2.5%
Keilor East 5,634 107 1.9% 291 5.2%
Keilor Lodge 569 4 0.7% 8 1.4%
Keilor North 17 0 0.0% 0 0.0%
Keilor Park 1,101 12 1.1% 35 3.2%
Kensington 4,304 62 1.4% 193 4.5%
Kew 10,176 8 0.1% 275 2.7%
Kew East 2,666 3 0.1% 115 4.3%
Keysborough 6,154 120 1.9% 387 6.3%
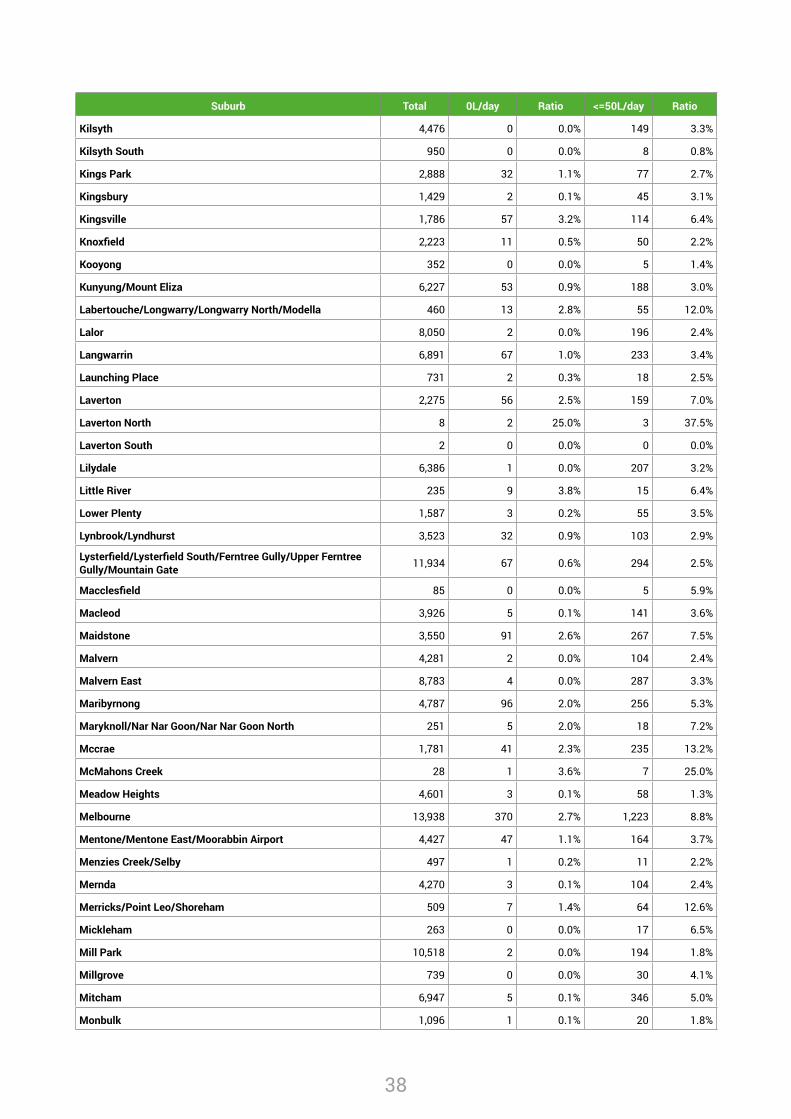
38
Suburb Total 0L/day Ratio <=50L/day Ratio
Kilsyth 4,476 0 0.0% 149 3.3%
Kilsyth South 950 0 0.0% 8 0.8%
Kings Park 2,888 32 1.1% 77 2.7%
Kingsbury 1,429 2 0.1% 45 3.1%
Kingsville 1,786 57 3.2% 114 6.4%
Knoxfield 2,223 11 0.5% 50 2.2%
Kooyong 352 0 0.0% 5 1.4%
Kunyung/Mount Eliza 6,227 53 0.9% 188 3.0%
Labertouche/Longwarry/Longwarry North/Modella 460 13 2.8% 55 12.0%
Lalor 8,050 2 0.0% 196 2.4%
Langwarrin 6,891 67 1.0% 233 3.4%
Launching Place 731 2 0.3% 18 2.5%
Laverton 2,275 56 2.5% 159 7.0%
Laverton North 8 2 25.0% 3 37.5%
Laverton South 2 0 0.0% 0 0.0%
Lilydale 6,386 1 0.0% 207 3.2%
Little River 235 9 3.8% 15 6.4%
Lower Plenty 1,587 3 0.2% 55 3.5%
Lynbrook/Lyndhurst 3,523 32 0.9% 103 2.9%
Lysterfield/Lysterfield South/Ferntree Gully/Upper Ferntree Gully/Mountain Gate 11,934 67 0.6% 294 2.5%
Macclesfield 85 0 0.0% 5 5.9%
Macleod 3,926 5 0.1% 141 3.6%
Maidstone 3,550 91 2.6% 267 7.5%
Malvern 4,281 2 0.0% 104 2.4%
Malvern East 8,783 4 0.0% 287 3.3%
Maribyrnong 4,787 96 2.0% 256 5.3%
Maryknoll/Nar Nar Goon/Nar Nar Goon North 251 5 2.0% 18 7.2%
Mccrae 1,781 41 2.3% 235 13.2%
McMahons Creek 28 1 3.6% 7 25.0%
Meadow Heights 4,601 3 0.1% 58 1.3%
Melbourne 13,938 370 2.7% 1,223 8.8%
Mentone/Mentone East/Moorabbin Airport 4,427 47 1.1% 164 3.7%
Menzies Creek/Selby 497 1 0.2% 11 2.2%
Mernda 4,270 3 0.1% 104 2.4%
Merricks/Point Leo/Shoreham 509 7 1.4% 64 12.6%
Mickleham 263 0 0.0% 17 6.5%
Mill Park 10,518 2 0.0% 194 1.8%
Millgrove 739 0 0.0% 30 4.1%
Mitcham 6,947 5 0.1% 346 5.0%
Monbulk 1,096 1 0.1% 20 1.8%
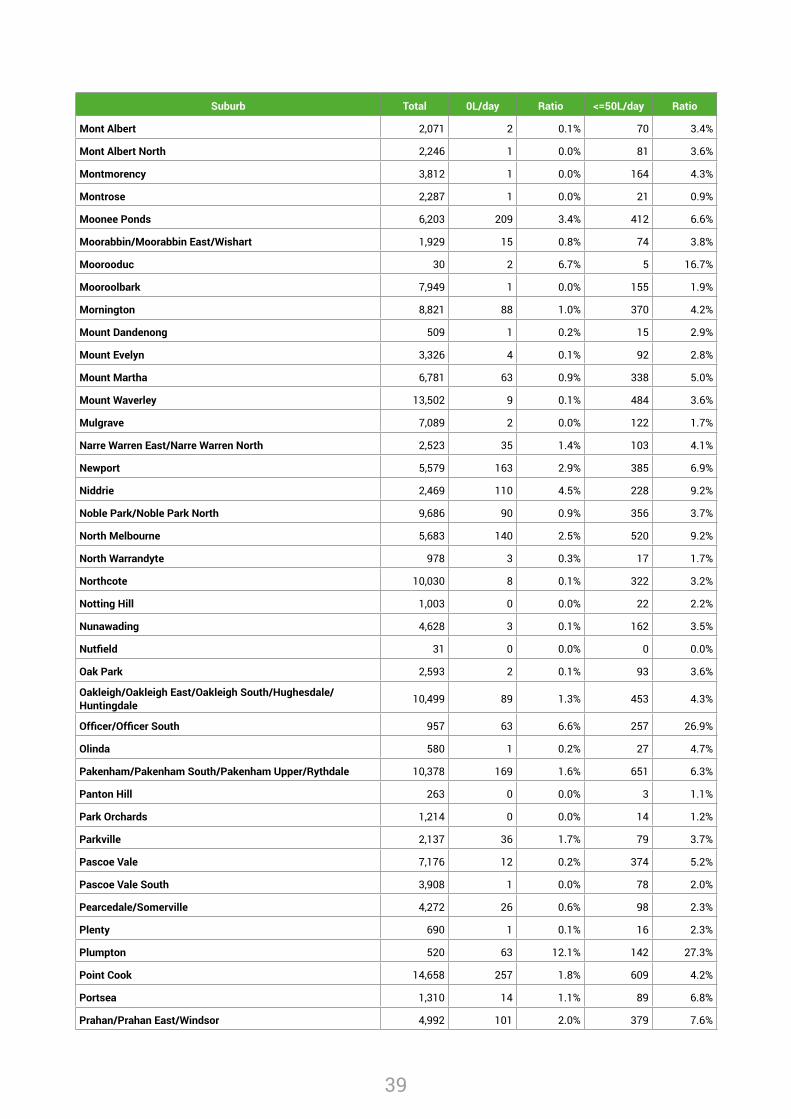
39
Suburb Total 0L/day Ratio <=50L/day Ratio
Mont Albert 2,071 2 0.1% 70 3.4%
Mont Albert North 2,246 1 0.0% 81 3.6%
Montmorency 3,812 1 0.0% 164 4.3%
Montrose 2,287 1 0.0% 21 0.9%
Moonee Ponds 6,203 209 3.4% 412 6.6%
Moorabbin/Moorabbin East/Wishart 1,929 15 0.8% 74 3.8%
Moorooduc 30 2 6.7% 5 16.7%
Mooroolbark 7,949 1 0.0% 155 1.9%
Mornington 8,821 88 1.0% 370 4.2%
Mount Dandenong 509 1 0.2% 15 2.9%
Mount Evelyn 3,326 4 0.1% 92 2.8%
Mount Martha 6,781 63 0.9% 338 5.0%
Mount Waverley 13,502 9 0.1% 484 3.6%
Mulgrave 7,089 2 0.0% 122 1.7%
Narre Warren East/Narre Warren North 2,523 35 1.4% 103 4.1%
Newport 5,579 163 2.9% 385 6.9%
Niddrie 2,469 110 4.5% 228 9.2%
Noble Park/Noble Park North 9,686 90 0.9% 356 3.7%
North Melbourne 5,683 140 2.5% 520 9.2%
North Warrandyte 978 3 0.3% 17 1.7%
Northcote 10,030 8 0.1% 322 3.2%
Notting Hill 1,003 0 0.0% 22 2.2%
Nunawading 4,628 3 0.1% 162 3.5%
Nutfield 31 0 0.0% 0 0.0%
Oak Park 2,593 2 0.1% 93 3.6%
Oakleigh/Oakleigh East/Oakleigh South/Hughesdale/Huntingdale 10,499 89 1.3% 453 4.3%
Officer/Officer South 957 63 6.6% 257 26.9%
Olinda 580 1 0.2% 27 4.7%
Pakenham/Pakenham South/Pakenham Upper/Rythdale 10,378 169 1.6% 651 6.3%
Panton Hill 263 0 0.0% 3 1.1%
Park Orchards 1,214 0 0.0% 14 1.2%
Parkville 2,137 36 1.7% 79 3.7%
Pascoe Vale 7,176 12 0.2% 374 5.2%
Pascoe Vale South 3,908 1 0.0% 78 2.0%
Pearcedale/Somerville 4,272 26 0.6% 98 2.3%
Plenty 690 1 0.1% 16 2.3%
Plumpton 520 63 12.1% 142 27.3%
Point Cook 14,658 257 1.8% 609 4.2%
Portsea 1,310 14 1.1% 89 6.8%
Prahan/Prahan East/Windsor 4,992 101 2.0% 379 7.6%
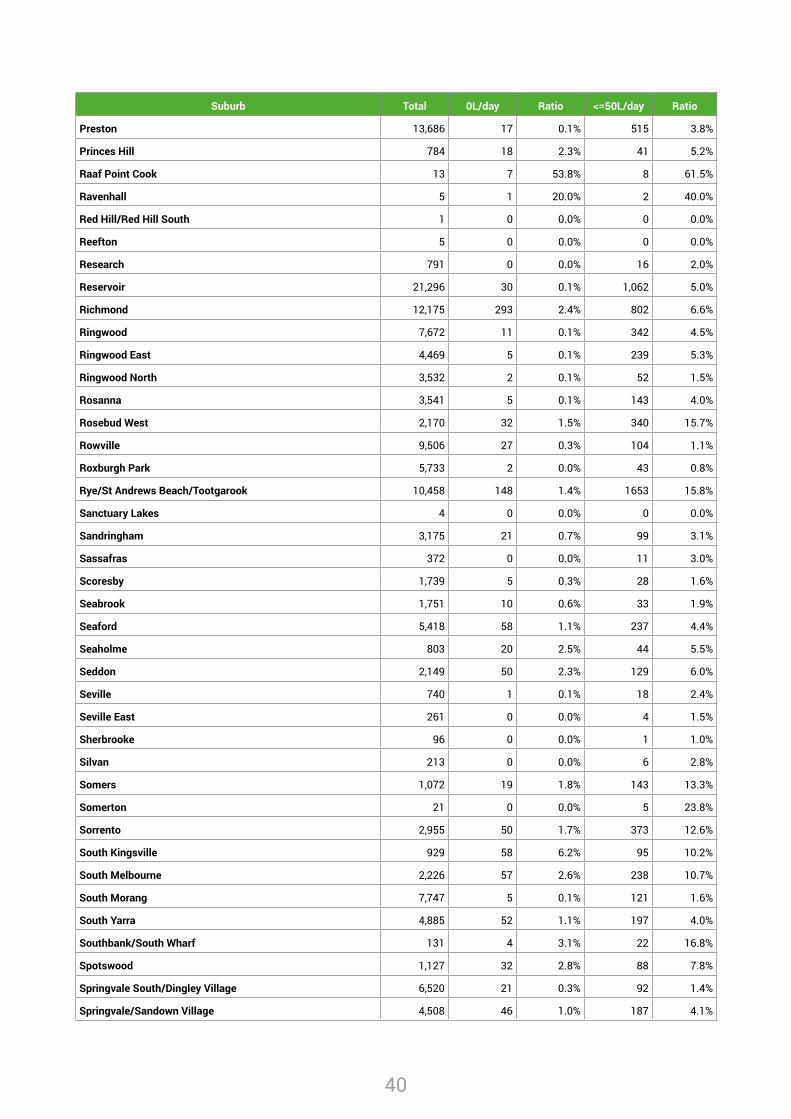
40
Suburb Total 0L/day Ratio <=50L/day Ratio
Preston 13,686 17 0.1% 515 3.8%
Princes Hill 784 18 2.3% 41 5.2%
Raaf Point Cook 13 7 53.8% 8 61.5%
Ravenhall 5 1 20.0% 2 40.0%
Red Hill/Red Hill South 1 0 0.0% 0 0.0%
Reefton 5 0 0.0% 0 0.0%
Research 791 0 0.0% 16 2.0%
Reservoir 21,296 30 0.1% 1,062 5.0%
Richmond 12,175 293 2.4% 802 6.6%
Ringwood 7,672 11 0.1% 342 4.5%
Ringwood East 4,469 5 0.1% 239 5.3%
Ringwood North 3,532 2 0.1% 52 1.5%
Rosanna 3,541 5 0.1% 143 4.0%
Rosebud West 2,170 32 1.5% 340 15.7%
Rowville 9,506 27 0.3% 104 1.1%
Roxburgh Park 5,733 2 0.0% 43 0.8%
Rye/St Andrews Beach/Tootgarook 10,458 148 1.4% 1653 15.8%
Sanctuary Lakes 4 0 0.0% 0 0.0%
Sandringham 3,175 21 0.7% 99 3.1%
Sassafras 372 0 0.0% 11 3.0%
Scoresby 1,739 5 0.3% 28 1.6%
Seabrook 1,751 10 0.6% 33 1.9%
Seaford 5,418 58 1.1% 237 4.4%
Seaholme 803 20 2.5% 44 5.5%
Seddon 2,149 50 2.3% 129 6.0%
Seville 740 1 0.1% 18 2.4%
Seville East 261 0 0.0% 4 1.5%
Sherbrooke 96 0 0.0% 1 1.0%
Silvan 213 0 0.0% 6 2.8%
Somers 1,072 19 1.8% 143 13.3%
Somerton 21 0 0.0% 5 23.8%
Sorrento 2,955 50 1.7% 373 12.6%
South Kingsville 929 58 6.2% 95 10.2%
South Melbourne 2,226 57 2.6% 238 10.7%
South Morang 7,747 5 0.1% 121 1.6%
South Yarra 4,885 52 1.1% 197 4.0%
Southbank/South Wharf 131 4 3.1% 22 16.8%
Spotswood 1,127 32 2.8% 88 7.8%
Springvale South/Dingley Village 6,520 21 0.3% 92 1.4%
Springvale/Sandown Village 4,508 46 1.0% 187 4.1%
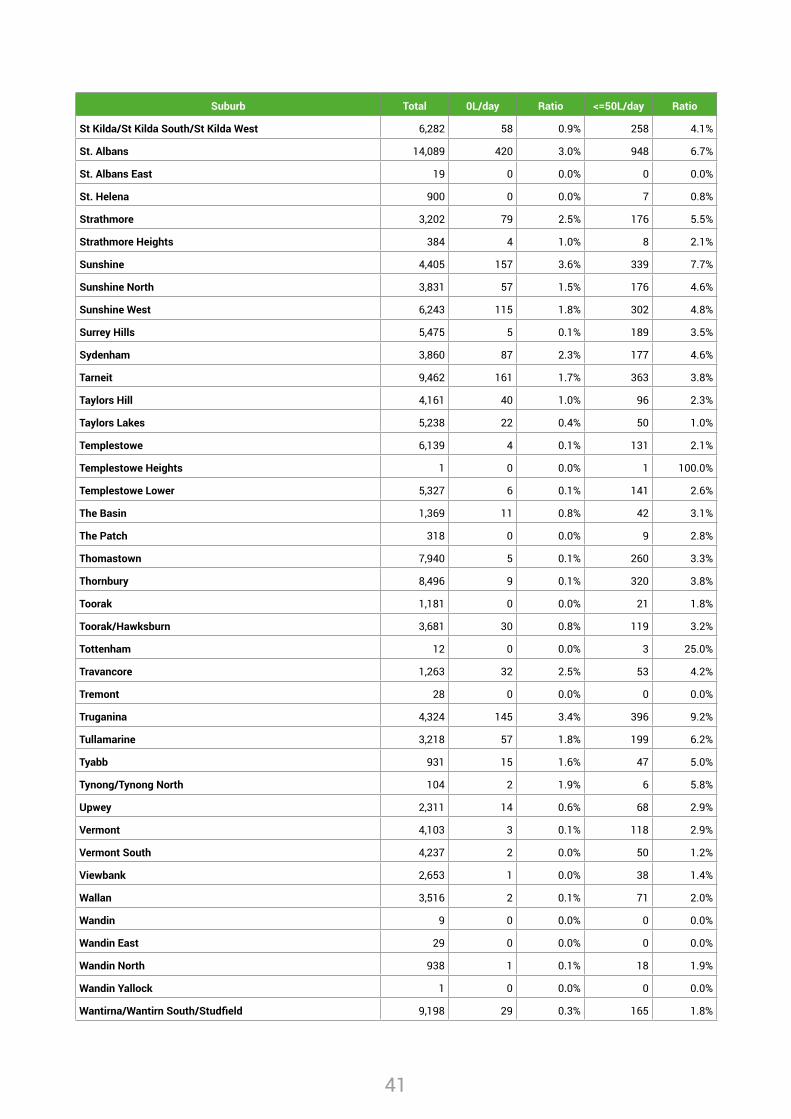
41
Suburb Total 0L/day Ratio <=50L/day Ratio
St Kilda/St Kilda South/St Kilda West 6,282 58 0.9% 258 4.1%
St. Albans 14,089 420 3.0% 948 6.7%
St. Albans East 19 0 0.0% 0 0.0%
St. Helena 900 0 0.0% 7 0.8%
Strathmore 3,202 79 2.5% 176 5.5%
Strathmore Heights 384 4 1.0% 8 2.1%
Sunshine 4,405 157 3.6% 339 7.7%
Sunshine North 3,831 57 1.5% 176 4.6%
Sunshine West 6,243 115 1.8% 302 4.8%
Surrey Hills 5,475 5 0.1% 189 3.5%
Sydenham 3,860 87 2.3% 177 4.6%
Tarneit 9,462 161 1.7% 363 3.8%
Taylors Hill 4,161 40 1.0% 96 2.3%
Taylors Lakes 5,238 22 0.4% 50 1.0%
Templestowe 6,139 4 0.1% 131 2.1%
Templestowe Heights 1 0 0.0% 1 100.0%
Templestowe Lower 5,327 6 0.1% 141 2.6%
The Basin 1,369 11 0.8% 42 3.1%
The Patch 318 0 0.0% 9 2.8%
Thomastown 7,940 5 0.1% 260 3.3%
Thornbury 8,496 9 0.1% 320 3.8%
Toorak 1,181 0 0.0% 21 1.8%
Toorak/Hawksburn 3,681 30 0.8% 119 3.2%
Tottenham 12 0 0.0% 3 25.0%
Travancore 1,263 32 2.5% 53 4.2%
Tremont 28 0 0.0% 0 0.0%
Truganina 4,324 145 3.4% 396 9.2%
Tullamarine 3,218 57 1.8% 199 6.2%
Tyabb 931 15 1.6% 47 5.0%
Tynong/Tynong North 104 2 1.9% 6 5.8%
Upwey 2,311 14 0.6% 68 2.9%
Vermont 4,103 3 0.1% 118 2.9%
Vermont South 4,237 2 0.0% 50 1.2%
Viewbank 2,653 1 0.0% 38 1.4%
Wallan 3,516 2 0.1% 71 2.0%
Wandin 9 0 0.0% 0 0.0%
Wandin East 29 0 0.0% 0 0.0%
Wandin North 938 1 0.1% 18 1.9%
Wandin Yallock 1 0 0.0% 0 0.0%
Wantirna/Wantirn South/Studfield 9,198 29 0.3% 165 1.8%
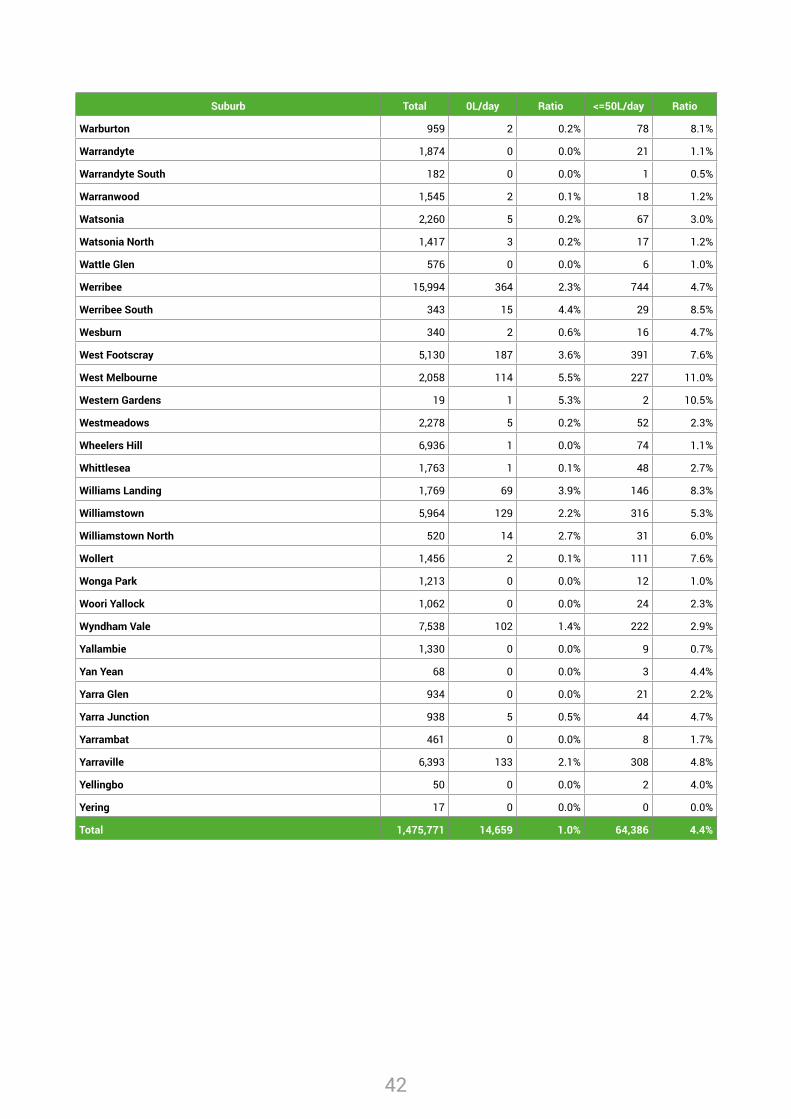
42
Suburb Total 0L/day Ratio <=50L/day Ratio
Warburton 959 2 0.2% 78 8.1%
Warrandyte 1,874 0 0.0% 21 1.1%
Warrandyte South 182 0 0.0% 1 0.5%
Warranwood 1,545 2 0.1% 18 1.2%
Watsonia 2,260 5 0.2% 67 3.0%
Watsonia North 1,417 3 0.2% 17 1.2%
Wattle Glen 576 0 0.0% 6 1.0%
Werribee 15,994 364 2.3% 744 4.7%
Werribee South 343 15 4.4% 29 8.5%
Wesburn 340 2 0.6% 16 4.7%
West Footscray 5,130 187 3.6% 391 7.6%
West Melbourne 2,058 114 5.5% 227 11.0%
Western Gardens 19 1 5.3% 2 10.5%
Westmeadows 2,278 5 0.2% 52 2.3%
Wheelers Hill 6,936 1 0.0% 74 1.1%
Whittlesea 1,763 1 0.1% 48 2.7%
Williams Landing 1,769 69 3.9% 146 8.3%
Williamstown 5,964 129 2.2% 316 5.3%
Williamstown North 520 14 2.7% 31 6.0%
Wollert 1,456 2 0.1% 111 7.6%
Wonga Park 1,213 0 0.0% 12 1.0%
Woori Yallock 1,062 0 0.0% 24 2.3%
Wyndham Vale 7,538 102 1.4% 222 2.9%
Yallambie 1,330 0 0.0% 9 0.7%
Yan Yean 68 0 0.0% 3 4.4%
Yarra Glen 934 0 0.0% 21 2.2%
Yarra Junction 938 5 0.5% 44 4.7%
Yarrambat 461 0 0.0% 8 1.7%
Yarraville 6,393 133 2.1% 308 4.8%
Yellingbo 50 0 0.0% 2 4.0%
Yering 17 0 0.0% 0 0.0%
Total 1,475,771 14,659 1.0% 64,386 4.4%
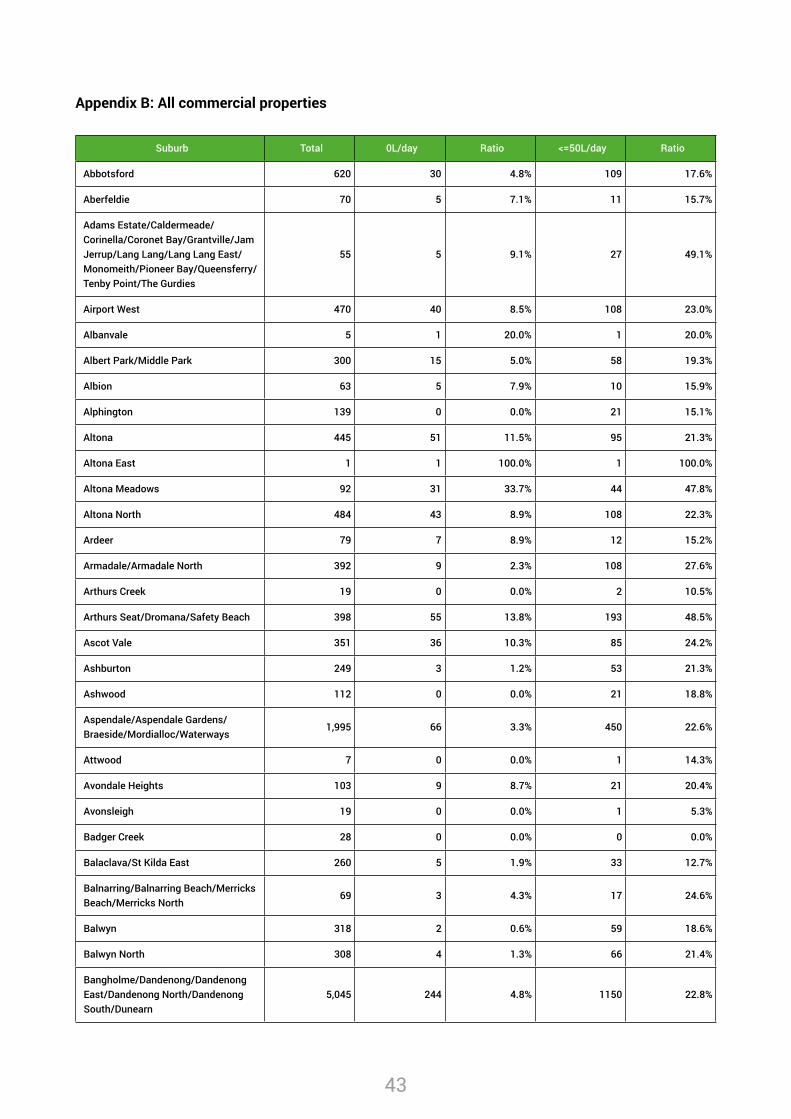
43
Appendix B: All commercial properties
Suburb Total 0L/day Ratio <=50L/day Ratio
Abbotsford 620 30 4.8% 109 17.6%
Aberfeldie 70 5 7.1% 11 15.7%
Adams Estate/Caldermeade/Corinella/Coronet Bay/Grantville/Jam Jerrup/Lang Lang/Lang Lang East/Monomeith/Pioneer Bay/Queensferry/Tenby Point/The Gurdies
55 5 9.1% 27 49.1%
Airport West 470 40 8.5% 108 23.0%
Albanvale 5 1 20.0% 1 20.0%
Albert Park/Middle Park 300 15 5.0% 58 19.3%
Albion 63 5 7.9% 10 15.9%
Alphington 139 0 0.0% 21 15.1%
Altona 445 51 11.5% 95 21.3%
Altona East 1 1 100.0% 1 100.0%
Altona Meadows 92 31 33.7% 44 47.8%
Altona North 484 43 8.9% 108 22.3%
Ardeer 79 7 8.9% 12 15.2%
Armadale/Armadale North 392 9 2.3% 108 27.6%
Arthurs Creek 19 0 0.0% 2 10.5%
Arthurs Seat/Dromana/Safety Beach 398 55 13.8% 193 48.5%
Ascot Vale 351 36 10.3% 85 24.2%
Ashburton 249 3 1.2% 53 21.3%
Ashwood 112 0 0.0% 21 18.8%
Aspendale/Aspendale Gardens/Braeside/Mordialloc/Waterways
1,995 66 3.3% 450 22.6%
Attwood 7 0 0.0% 1 14.3%
Avondale Heights 103 9 8.7% 21 20.4%
Avonsleigh 19 0 0.0% 1 5.3%
Badger Creek 28 0 0.0% 0 0.0%
Balaclava/St Kilda East 260 5 1.9% 33 12.7%
Balnarring/Balnarring Beach/Merricks Beach/Merricks North
69 3 4.3% 17 24.6%
Balwyn 318 2 0.6% 59 18.6%
Balwyn North 308 4 1.3% 66 21.4%
Bangholme/Dandenong/Dandenong East/Dandenong North/Dandenong South/Dunearn
5,045 244 4.8% 1150 22.8%
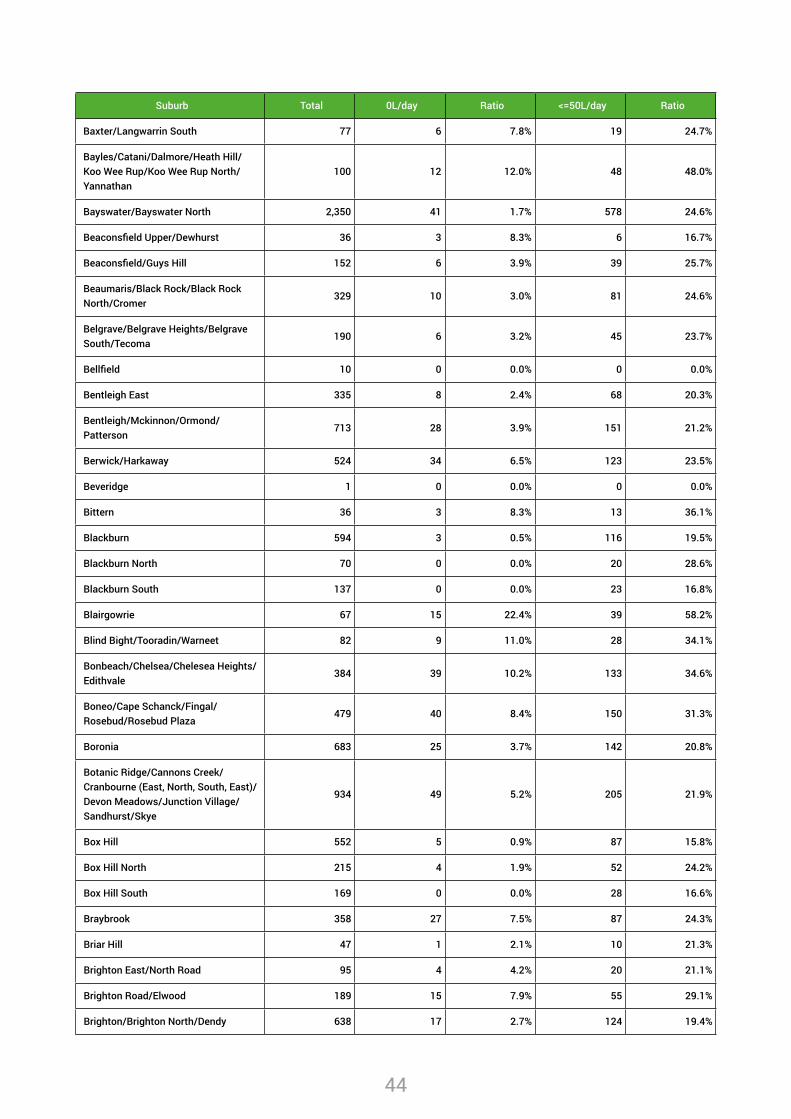
44
Suburb Total 0L/day Ratio <=50L/day Ratio
Baxter/Langwarrin South 77 6 7.8% 19 24.7%
Bayles/Catani/Dalmore/Heath Hill/Koo Wee Rup/Koo Wee Rup North/Yannathan
100 12 12.0% 48 48.0%
Bayswater/Bayswater North 2,350 41 1.7% 578 24.6%
Beaconsfield Upper/Dewhurst 36 3 8.3% 6 16.7%
Beaconsfield/Guys Hill 152 6 3.9% 39 25.7%
Beaumaris/Black Rock/Black Rock North/Cromer
329 10 3.0% 81 24.6%
Belgrave/Belgrave Heights/Belgrave South/Tecoma
190 6 3.2% 45 23.7%
Bellfield 10 0 0.0% 0 0.0%
Bentleigh East 335 8 2.4% 68 20.3%
Bentleigh/Mckinnon/Ormond/Patterson
713 28 3.9% 151 21.2%
Berwick/Harkaway 524 34 6.5% 123 23.5%
Beveridge 1 0 0.0% 0 0.0%
Bittern 36 3 8.3% 13 36.1%
Blackburn 594 3 0.5% 116 19.5%
Blackburn North 70 0 0.0% 20 28.6%
Blackburn South 137 0 0.0% 23 16.8%
Blairgowrie 67 15 22.4% 39 58.2%
Blind Bight/Tooradin/Warneet 82 9 11.0% 28 34.1%
Bonbeach/Chelsea/Chelesea Heights/Edithvale
384 39 10.2% 133 34.6%
Boneo/Cape Schanck/Fingal/Rosebud/Rosebud Plaza
479 40 8.4% 150 31.3%
Boronia 683 25 3.7% 142 20.8%
Botanic Ridge/Cannons Creek/Cranbourne (East, North, South, East)/Devon Meadows/Junction Village/Sandhurst/Skye
934 49 5.2% 205 21.9%
Box Hill 552 5 0.9% 87 15.8%
Box Hill North 215 4 1.9% 52 24.2%
Box Hill South 169 0 0.0% 28 16.6%
Braybrook 358 27 7.5% 87 24.3%
Briar Hill 47 1 2.1% 10 21.3%
Brighton East/North Road 95 4 4.2% 20 21.1%
Brighton Road/Elwood 189 15 7.9% 55 29.1%
Brighton/Brighton North/Dendy 638 17 2.7% 124 19.4%
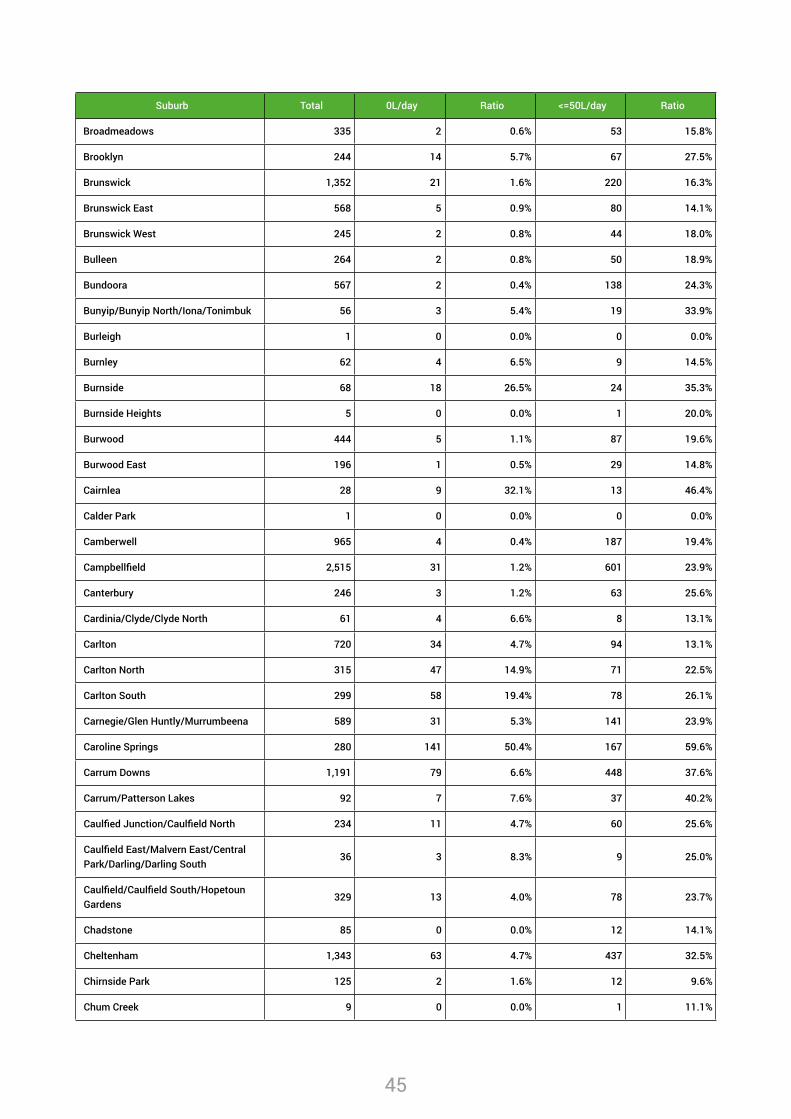
45
Suburb Total 0L/day Ratio <=50L/day Ratio
Broadmeadows 335 2 0.6% 53 15.8%
Brooklyn 244 14 5.7% 67 27.5%
Brunswick 1,352 21 1.6% 220 16.3%
Brunswick East 568 5 0.9% 80 14.1%
Brunswick West 245 2 0.8% 44 18.0%
Bulleen 264 2 0.8% 50 18.9%
Bundoora 567 2 0.4% 138 24.3%
Bunyip/Bunyip North/Iona/Tonimbuk 56 3 5.4% 19 33.9%
Burleigh 1 0 0.0% 0 0.0%
Burnley 62 4 6.5% 9 14.5%
Burnside 68 18 26.5% 24 35.3%
Burnside Heights 5 0 0.0% 1 20.0%
Burwood 444 5 1.1% 87 19.6%
Burwood East 196 1 0.5% 29 14.8%
Cairnlea 28 9 32.1% 13 46.4%
Calder Park 1 0 0.0% 0 0.0%
Camberwell 965 4 0.4% 187 19.4%
Campbellfield 2,515 31 1.2% 601 23.9%
Canterbury 246 3 1.2% 63 25.6%
Cardinia/Clyde/Clyde North 61 4 6.6% 8 13.1%
Carlton 720 34 4.7% 94 13.1%
Carlton North 315 47 14.9% 71 22.5%
Carlton South 299 58 19.4% 78 26.1%
Carnegie/Glen Huntly/Murrumbeena 589 31 5.3% 141 23.9%
Caroline Springs 280 141 50.4% 167 59.6%
Carrum Downs 1,191 79 6.6% 448 37.6%
Carrum/Patterson Lakes 92 7 7.6% 37 40.2%
Caulfied Junction/Caulfield North 234 11 4.7% 60 25.6%
Caulfield East/Malvern East/Central Park/Darling/Darling South
36 3 8.3% 9 25.0%
Caulfield/Caulfield South/Hopetoun Gardens
329 13 4.0% 78 23.7%
Chadstone 85 0 0.0% 12 14.1%
Cheltenham 1,343 63 4.7% 437 32.5%
Chirnside Park 125 2 1.6% 12 9.6%
Chum Creek 9 0 0.0% 1 11.1%
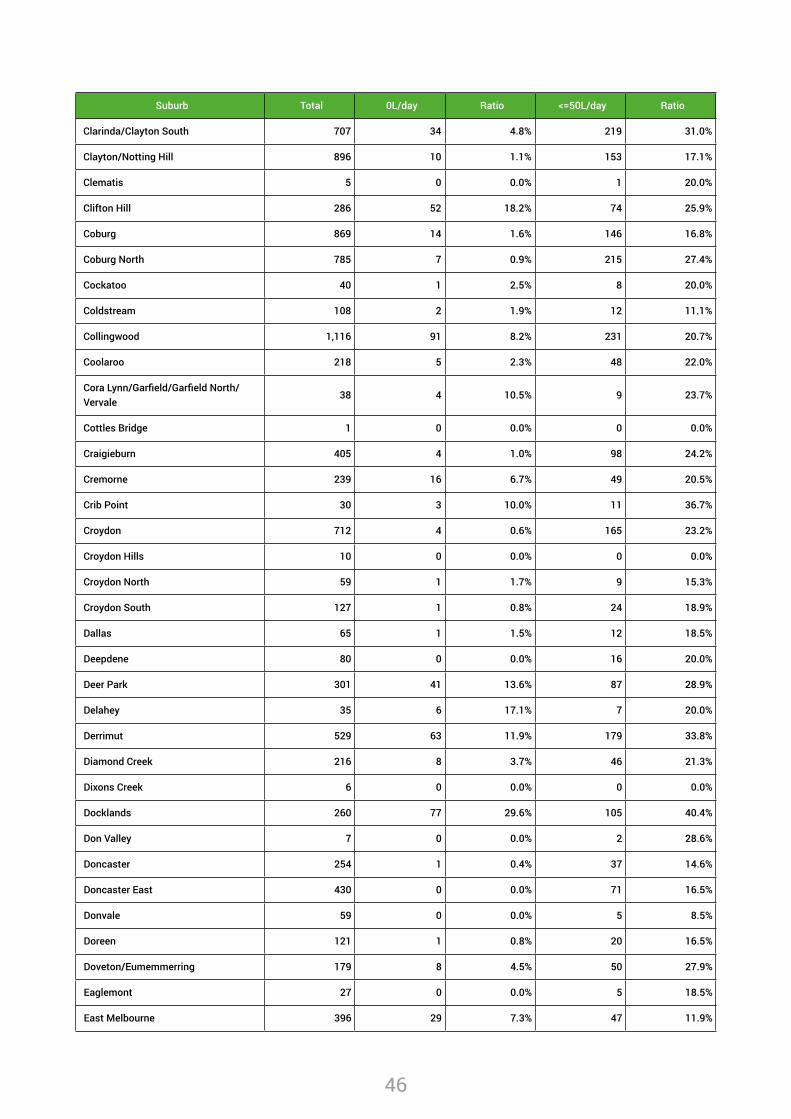
46
Suburb Total 0L/day Ratio <=50L/day Ratio
Clarinda/Clayton South 707 34 4.8% 219 31.0%
Clayton/Notting Hill 896 10 1.1% 153 17.1%
Clematis 5 0 0.0% 1 20.0%
Clifton Hill 286 52 18.2% 74 25.9%
Coburg 869 14 1.6% 146 16.8%
Coburg North 785 7 0.9% 215 27.4%
Cockatoo 40 1 2.5% 8 20.0%
Coldstream 108 2 1.9% 12 11.1%
Collingwood 1,116 91 8.2% 231 20.7%
Coolaroo 218 5 2.3% 48 22.0%
Cora Lynn/Garfield/Garfield North/Vervale
38 4 10.5% 9 23.7%
Cottles Bridge 1 0 0.0% 0 0.0%
Craigieburn 405 4 1.0% 98 24.2%
Cremorne 239 16 6.7% 49 20.5%
Crib Point 30 3 10.0% 11 36.7%
Croydon 712 4 0.6% 165 23.2%
Croydon Hills 10 0 0.0% 0 0.0%
Croydon North 59 1 1.7% 9 15.3%
Croydon South 127 1 0.8% 24 18.9%
Dallas 65 1 1.5% 12 18.5%
Deepdene 80 0 0.0% 16 20.0%
Deer Park 301 41 13.6% 87 28.9%
Delahey 35 6 17.1% 7 20.0%
Derrimut 529 63 11.9% 179 33.8%
Diamond Creek 216 8 3.7% 46 21.3%
Dixons Creek 6 0 0.0% 0 0.0%
Docklands 260 77 29.6% 105 40.4%
Don Valley 7 0 0.0% 2 28.6%
Doncaster 254 1 0.4% 37 14.6%
Doncaster East 430 0 0.0% 71 16.5%
Donvale 59 0 0.0% 5 8.5%
Doreen 121 1 0.8% 20 16.5%
Doveton/Eumemmerring 179 8 4.5% 50 27.9%
Eaglemont 27 0 0.0% 5 18.5%
East Melbourne 396 29 7.3% 47 11.9%
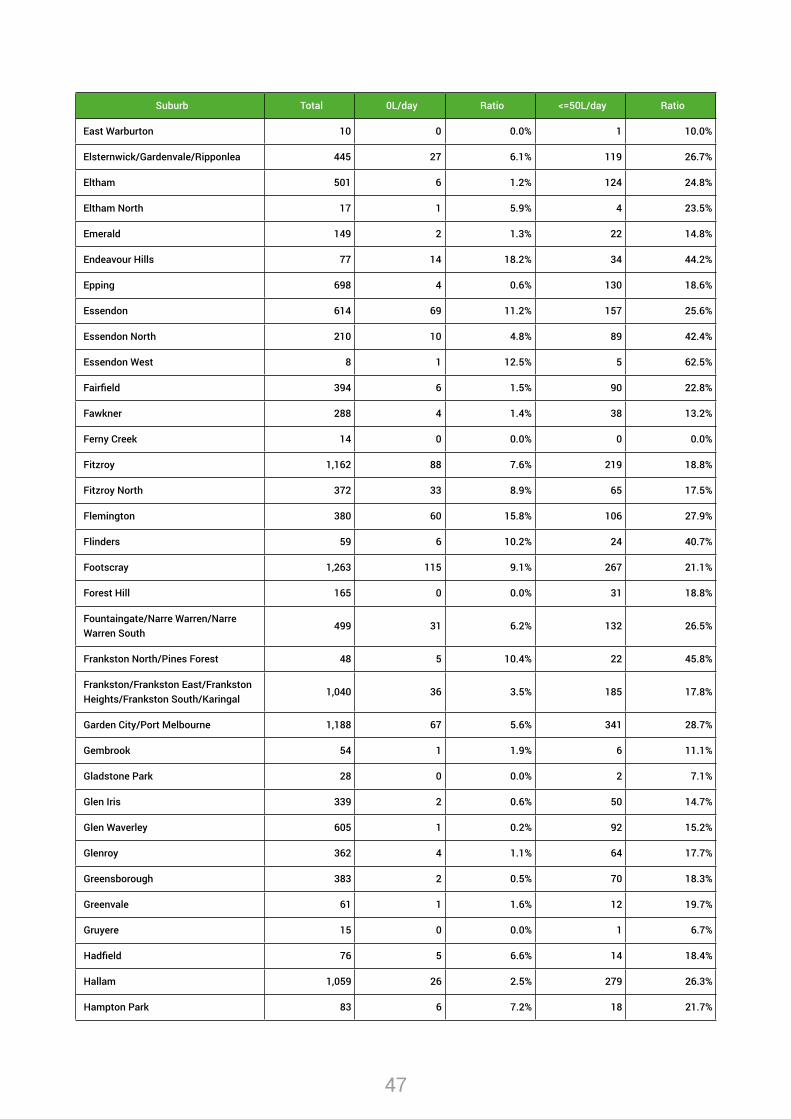
47
Suburb Total 0L/day Ratio <=50L/day Ratio
East Warburton 10 0 0.0% 1 10.0%
Elsternwick/Gardenvale/Ripponlea 445 27 6.1% 119 26.7%
Eltham 501 6 1.2% 124 24.8%
Eltham North 17 1 5.9% 4 23.5%
Emerald 149 2 1.3% 22 14.8%
Endeavour Hills 77 14 18.2% 34 44.2%
Epping 698 4 0.6% 130 18.6%
Essendon 614 69 11.2% 157 25.6%
Essendon North 210 10 4.8% 89 42.4%
Essendon West 8 1 12.5% 5 62.5%
Fairfield 394 6 1.5% 90 22.8%
Fawkner 288 4 1.4% 38 13.2%
Ferny Creek 14 0 0.0% 0 0.0%
Fitzroy 1,162 88 7.6% 219 18.8%
Fitzroy North 372 33 8.9% 65 17.5%
Flemington 380 60 15.8% 106 27.9%
Flinders 59 6 10.2% 24 40.7%
Footscray 1,263 115 9.1% 267 21.1%
Forest Hill 165 0 0.0% 31 18.8%
Fountaingate/Narre Warren/Narre Warren South
499 31 6.2% 132 26.5%
Frankston North/Pines Forest 48 5 10.4% 22 45.8%
Frankston/Frankston East/Frankston Heights/Frankston South/Karingal
1,040 36 3.5% 185 17.8%
Garden City/Port Melbourne 1,188 67 5.6% 341 28.7%
Gembrook 54 1 1.9% 6 11.1%
Gladstone Park 28 0 0.0% 2 7.1%
Glen Iris 339 2 0.6% 50 14.7%
Glen Waverley 605 1 0.2% 92 15.2%
Glenroy 362 4 1.1% 64 17.7%
Greensborough 383 2 0.5% 70 18.3%
Greenvale 61 1 1.6% 12 19.7%
Gruyere 15 0 0.0% 1 6.7%
Hadfield 76 5 6.6% 14 18.4%
Hallam 1,059 26 2.5% 279 26.3%
Hampton Park 83 6 7.2% 18 21.7%
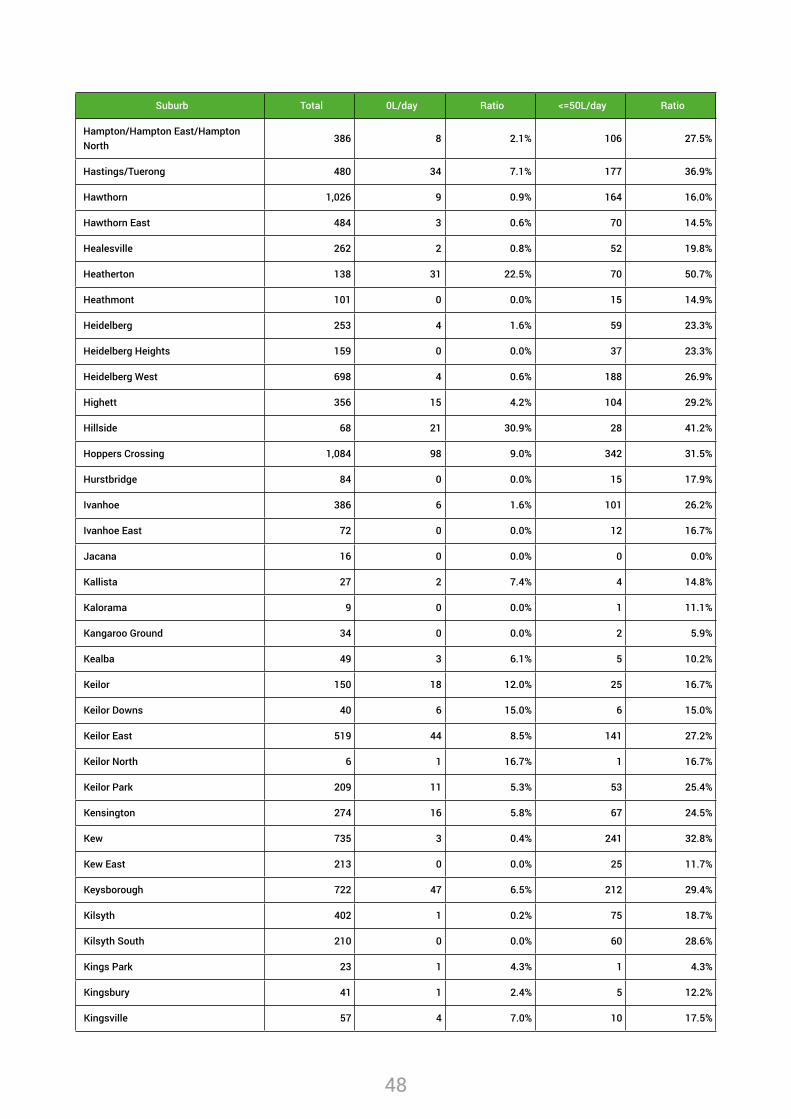
48
Suburb Total 0L/day Ratio <=50L/day Ratio
Hampton/Hampton East/Hampton North
386 8 2.1% 106 27.5%
Hastings/Tuerong 480 34 7.1% 177 36.9%
Hawthorn 1,026 9 0.9% 164 16.0%
Hawthorn East 484 3 0.6% 70 14.5%
Healesville 262 2 0.8% 52 19.8%
Heatherton 138 31 22.5% 70 50.7%
Heathmont 101 0 0.0% 15 14.9%
Heidelberg 253 4 1.6% 59 23.3%
Heidelberg Heights 159 0 0.0% 37 23.3%
Heidelberg West 698 4 0.6% 188 26.9%
Highett 356 15 4.2% 104 29.2%
Hillside 68 21 30.9% 28 41.2%
Hoppers Crossing 1,084 98 9.0% 342 31.5%
Hurstbridge 84 0 0.0% 15 17.9%
Ivanhoe 386 6 1.6% 101 26.2%
Ivanhoe East 72 0 0.0% 12 16.7%
Jacana 16 0 0.0% 0 0.0%
Kallista 27 2 7.4% 4 14.8%
Kalorama 9 0 0.0% 1 11.1%
Kangaroo Ground 34 0 0.0% 2 5.9%
Kealba 49 3 6.1% 5 10.2%
Keilor 150 18 12.0% 25 16.7%
Keilor Downs 40 6 15.0% 6 15.0%
Keilor East 519 44 8.5% 141 27.2%
Keilor North 6 1 16.7% 1 16.7%
Keilor Park 209 11 5.3% 53 25.4%
Kensington 274 16 5.8% 67 24.5%
Kew 735 3 0.4% 241 32.8%
Kew East 213 0 0.0% 25 11.7%
Keysborough 722 47 6.5% 212 29.4%
Kilsyth 402 1 0.2% 75 18.7%
Kilsyth South 210 0 0.0% 60 28.6%
Kings Park 23 1 4.3% 1 4.3%
Kingsbury 41 1 2.4% 5 12.2%
Kingsville 57 4 7.0% 10 17.5%
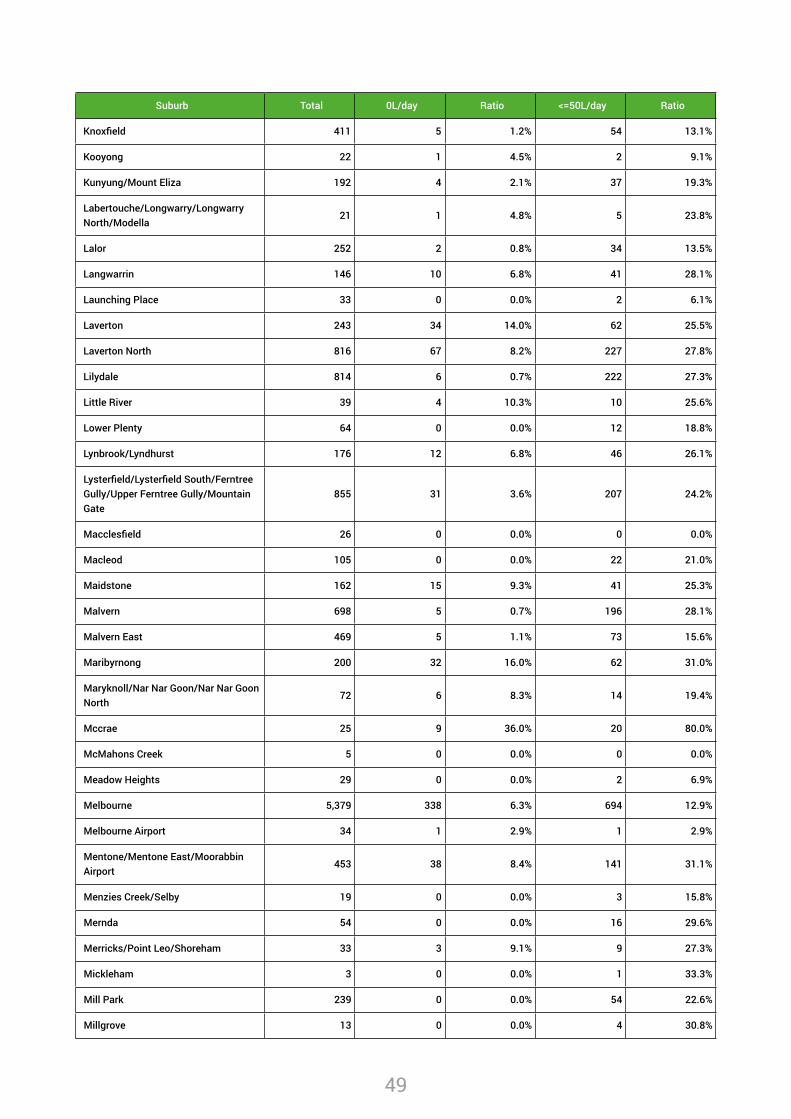
49
Suburb Total 0L/day Ratio <=50L/day Ratio
Knoxfield 411 5 1.2% 54 13.1%
Kooyong 22 1 4.5% 2 9.1%
Kunyung/Mount Eliza 192 4 2.1% 37 19.3%
Labertouche/Longwarry/Longwarry North/Modella
21 1 4.8% 5 23.8%
Lalor 252 2 0.8% 34 13.5%
Langwarrin 146 10 6.8% 41 28.1%
Launching Place 33 0 0.0% 2 6.1%
Laverton 243 34 14.0% 62 25.5%
Laverton North 816 67 8.2% 227 27.8%
Lilydale 814 6 0.7% 222 27.3%
Little River 39 4 10.3% 10 25.6%
Lower Plenty 64 0 0.0% 12 18.8%
Lynbrook/Lyndhurst 176 12 6.8% 46 26.1%
Lysterfield/Lysterfield South/Ferntree Gully/Upper Ferntree Gully/Mountain Gate
855 31 3.6% 207 24.2%
Macclesfield 26 0 0.0% 0 0.0%
Macleod 105 0 0.0% 22 21.0%
Maidstone 162 15 9.3% 41 25.3%
Malvern 698 5 0.7% 196 28.1%
Malvern East 469 5 1.1% 73 15.6%
Maribyrnong 200 32 16.0% 62 31.0%
Maryknoll/Nar Nar Goon/Nar Nar Goon North
72 6 8.3% 14 19.4%
Mccrae 25 9 36.0% 20 80.0%
McMahons Creek 5 0 0.0% 0 0.0%
Meadow Heights 29 0 0.0% 2 6.9%
Melbourne 5,379 338 6.3% 694 12.9%
Melbourne Airport 34 1 2.9% 1 2.9%
Mentone/Mentone East/Moorabbin Airport
453 38 8.4% 141 31.1%
Menzies Creek/Selby 19 0 0.0% 3 15.8%
Mernda 54 0 0.0% 16 29.6%
Merricks/Point Leo/Shoreham 33 3 9.1% 9 27.3%
Mickleham 3 0 0.0% 1 33.3%
Mill Park 239 0 0.0% 54 22.6%
Millgrove 13 0 0.0% 4 30.8%
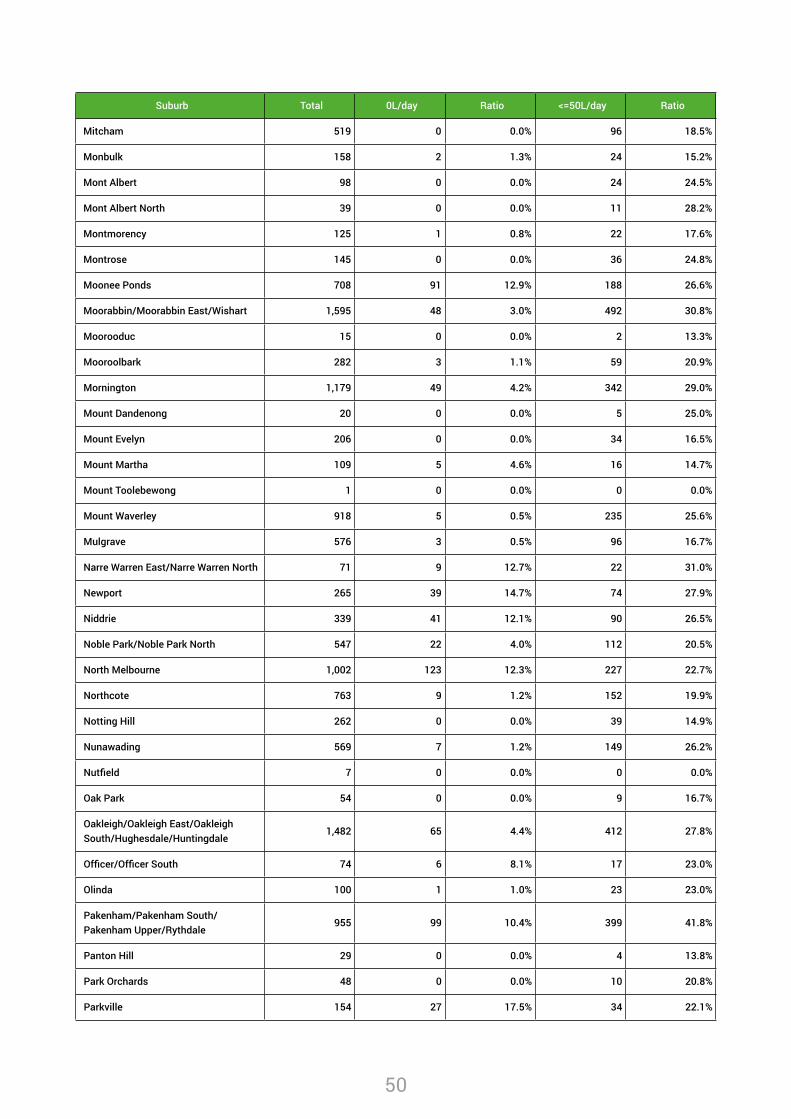
50
Suburb Total 0L/day Ratio <=50L/day Ratio
Mitcham 519 0 0.0% 96 18.5%
Monbulk 158 2 1.3% 24 15.2%
Mont Albert 98 0 0.0% 24 24.5%
Mont Albert North 39 0 0.0% 11 28.2%
Montmorency 125 1 0.8% 22 17.6%
Montrose 145 0 0.0% 36 24.8%
Moonee Ponds 708 91 12.9% 188 26.6%
Moorabbin/Moorabbin East/Wishart 1,595 48 3.0% 492 30.8%
Moorooduc 15 0 0.0% 2 13.3%
Mooroolbark 282 3 1.1% 59 20.9%
Mornington 1,179 49 4.2% 342 29.0%
Mount Dandenong 20 0 0.0% 5 25.0%
Mount Evelyn 206 0 0.0% 34 16.5%
Mount Martha 109 5 4.6% 16 14.7%
Mount Toolebewong 1 0 0.0% 0 0.0%
Mount Waverley 918 5 0.5% 235 25.6%
Mulgrave 576 3 0.5% 96 16.7%
Narre Warren East/Narre Warren North 71 9 12.7% 22 31.0%
Newport 265 39 14.7% 74 27.9%
Niddrie 339 41 12.1% 90 26.5%
Noble Park/Noble Park North 547 22 4.0% 112 20.5%
North Melbourne 1,002 123 12.3% 227 22.7%
Northcote 763 9 1.2% 152 19.9%
Notting Hill 262 0 0.0% 39 14.9%
Nunawading 569 7 1.2% 149 26.2%
Nutfield 7 0 0.0% 0 0.0%
Oak Park 54 0 0.0% 9 16.7%
Oakleigh/Oakleigh East/Oakleigh South/Hughesdale/Huntingdale
1,482 65 4.4% 412 27.8%
Officer/Officer South 74 6 8.1% 17 23.0%
Olinda 100 1 1.0% 23 23.0%
Pakenham/Pakenham South/Pakenham Upper/Rythdale
955 99 10.4% 399 41.8%
Panton Hill 29 0 0.0% 4 13.8%
Park Orchards 48 0 0.0% 10 20.8%
Parkville 154 27 17.5% 34 22.1%
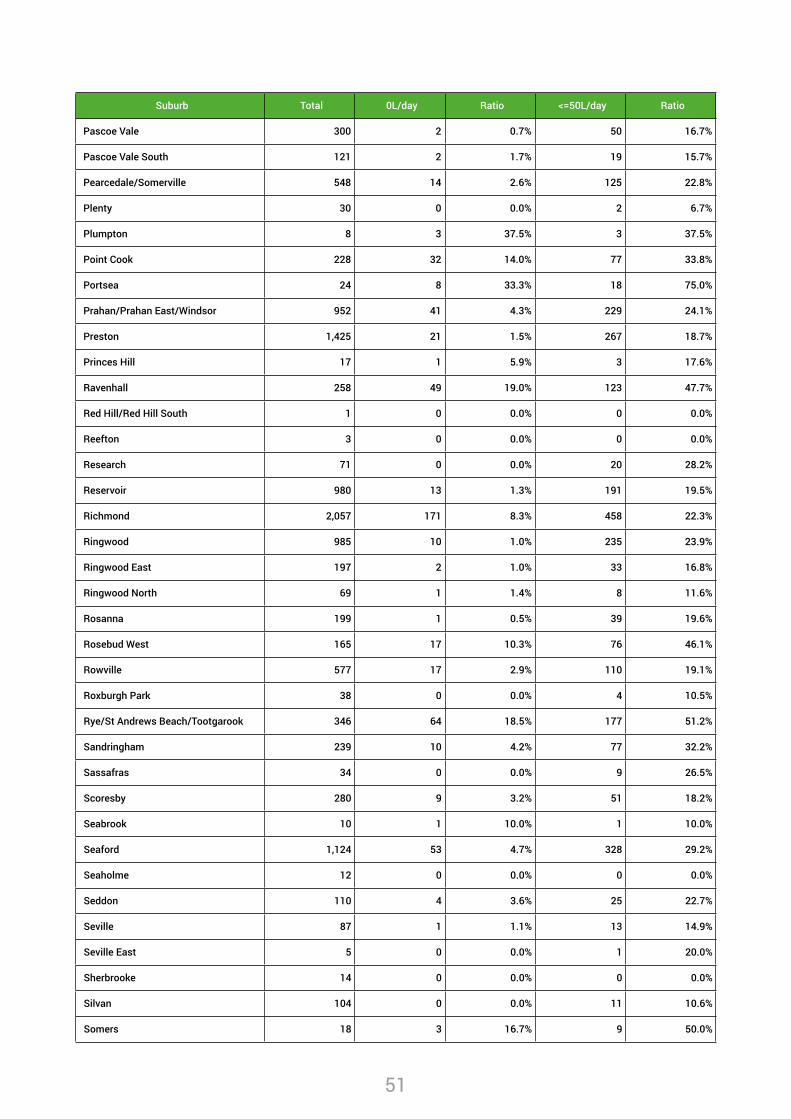
51
Suburb Total 0L/day Ratio <=50L/day Ratio
Pascoe Vale 300 2 0.7% 50 16.7%
Pascoe Vale South 121 2 1.7% 19 15.7%
Pearcedale/Somerville 548 14 2.6% 125 22.8%
Plenty 30 0 0.0% 2 6.7%
Plumpton 8 3 37.5% 3 37.5%
Point Cook 228 32 14.0% 77 33.8%
Portsea 24 8 33.3% 18 75.0%
Prahan/Prahan East/Windsor 952 41 4.3% 229 24.1%
Preston 1,425 21 1.5% 267 18.7%
Princes Hill 17 1 5.9% 3 17.6%
Ravenhall 258 49 19.0% 123 47.7%
Red Hill/Red Hill South 1 0 0.0% 0 0.0%
Reefton 3 0 0.0% 0 0.0%
Research 71 0 0.0% 20 28.2%
Reservoir 980 13 1.3% 191 19.5%
Richmond 2,057 171 8.3% 458 22.3%
Ringwood 985 10 1.0% 235 23.9%
Ringwood East 197 2 1.0% 33 16.8%
Ringwood North 69 1 1.4% 8 11.6%
Rosanna 199 1 0.5% 39 19.6%
Rosebud West 165 17 10.3% 76 46.1%
Rowville 577 17 2.9% 110 19.1%
Roxburgh Park 38 0 0.0% 4 10.5%
Rye/St Andrews Beach/Tootgarook 346 64 18.5% 177 51.2%
Sandringham 239 10 4.2% 77 32.2%
Sassafras 34 0 0.0% 9 26.5%
Scoresby 280 9 3.2% 51 18.2%
Seabrook 10 1 10.0% 1 10.0%
Seaford 1,124 53 4.7% 328 29.2%
Seaholme 12 0 0.0% 0 0.0%
Seddon 110 4 3.6% 25 22.7%
Seville 87 1 1.1% 13 14.9%
Seville East 5 0 0.0% 1 20.0%
Sherbrooke 14 0 0.0% 0 0.0%
Silvan 104 0 0.0% 11 10.6%
Somers 18 3 16.7% 9 50.0%
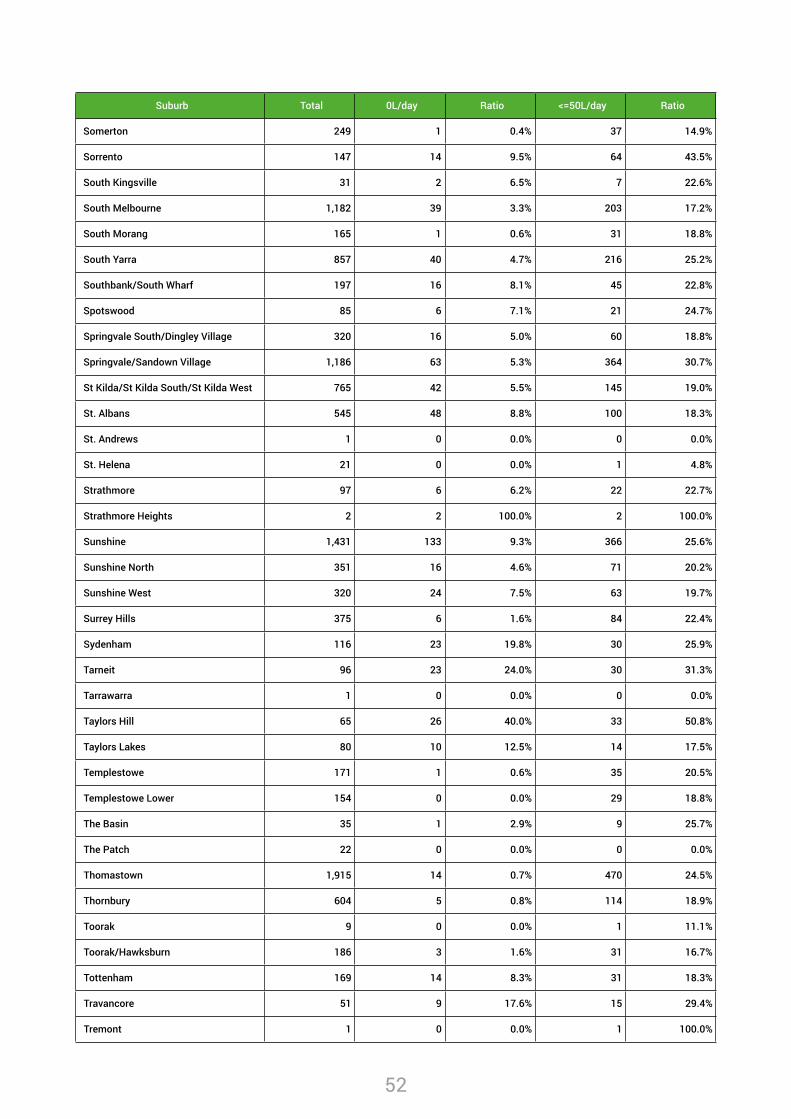
52
Suburb Total 0L/day Ratio <=50L/day Ratio
Somerton 249 1 0.4% 37 14.9%
Sorrento 147 14 9.5% 64 43.5%
South Kingsville 31 2 6.5% 7 22.6%
South Melbourne 1,182 39 3.3% 203 17.2%
South Morang 165 1 0.6% 31 18.8%
South Yarra 857 40 4.7% 216 25.2%
Southbank/South Wharf 197 16 8.1% 45 22.8%
Spotswood 85 6 7.1% 21 24.7%
Springvale South/Dingley Village 320 16 5.0% 60 18.8%
Springvale/Sandown Village 1,186 63 5.3% 364 30.7%
St Kilda/St Kilda South/St Kilda West 765 42 5.5% 145 19.0%
St. Albans 545 48 8.8% 100 18.3%
St. Andrews 1 0 0.0% 0 0.0%
St. Helena 21 0 0.0% 1 4.8%
Strathmore 97 6 6.2% 22 22.7%
Strathmore Heights 2 2 100.0% 2 100.0%
Sunshine 1,431 133 9.3% 366 25.6%
Sunshine North 351 16 4.6% 71 20.2%
Sunshine West 320 24 7.5% 63 19.7%
Surrey Hills 375 6 1.6% 84 22.4%
Sydenham 116 23 19.8% 30 25.9%
Tarneit 96 23 24.0% 30 31.3%
Tarrawarra 1 0 0.0% 0 0.0%
Taylors Hill 65 26 40.0% 33 50.8%
Taylors Lakes 80 10 12.5% 14 17.5%
Templestowe 171 1 0.6% 35 20.5%
Templestowe Lower 154 0 0.0% 29 18.8%
The Basin 35 1 2.9% 9 25.7%
The Patch 22 0 0.0% 0 0.0%
Thomastown 1,915 14 0.7% 470 24.5%
Thornbury 604 5 0.8% 114 18.9%
Toorak 9 0 0.0% 1 11.1%
Toorak/Hawksburn 186 3 1.6% 31 16.7%
Tottenham 169 14 8.3% 31 18.3%
Travancore 51 9 17.6% 15 29.4%
Tremont 1 0 0.0% 1 100.0%
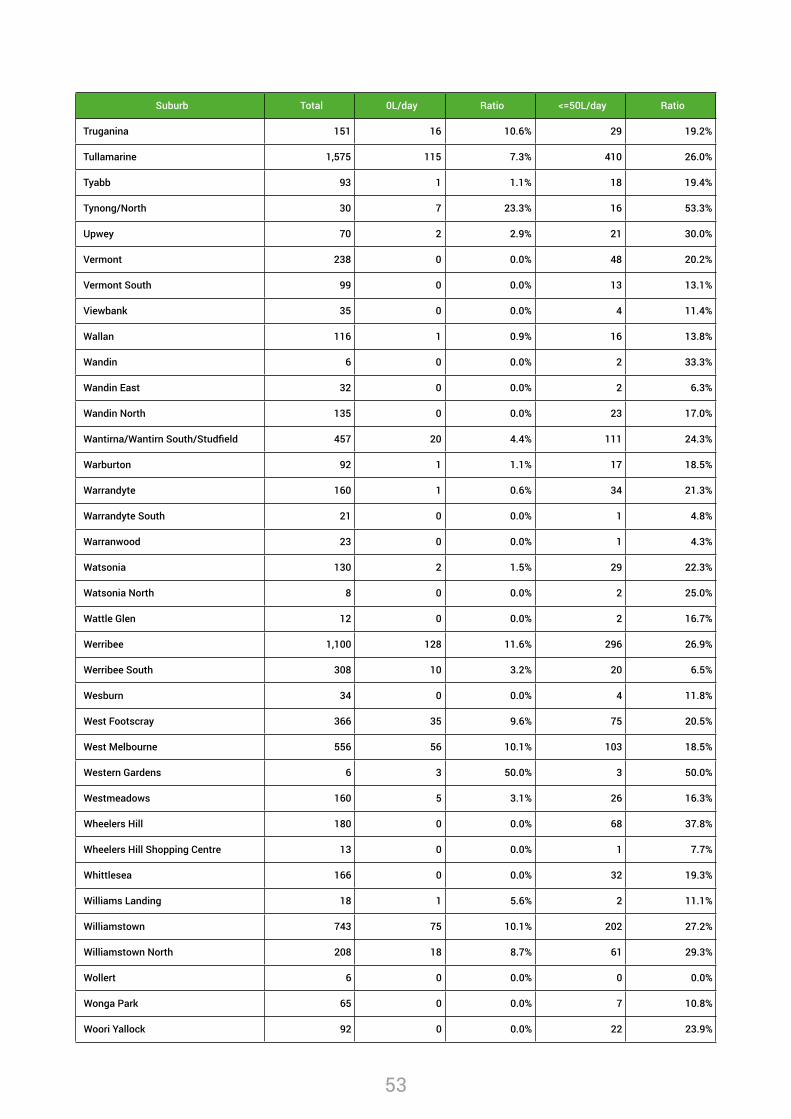
53
Suburb Total 0L/day Ratio <=50L/day Ratio
Truganina 151 16 10.6% 29 19.2%
Tullamarine 1,575 115 7.3% 410 26.0%
Tyabb 93 1 1.1% 18 19.4%
Tynong/North 30 7 23.3% 16 53.3%
Upwey 70 2 2.9% 21 30.0%
Vermont 238 0 0.0% 48 20.2%
Vermont South 99 0 0.0% 13 13.1%
Viewbank 35 0 0.0% 4 11.4%
Wallan 116 1 0.9% 16 13.8%
Wandin 6 0 0.0% 2 33.3%
Wandin East 32 0 0.0% 2 6.3%
Wandin North 135 0 0.0% 23 17.0%
Wantirna/Wantirn South/Studfield 457 20 4.4% 111 24.3%
Warburton 92 1 1.1% 17 18.5%
Warrandyte 160 1 0.6% 34 21.3%
Warrandyte South 21 0 0.0% 1 4.8%
Warranwood 23 0 0.0% 1 4.3%
Watsonia 130 2 1.5% 29 22.3%
Watsonia North 8 0 0.0% 2 25.0%
Wattle Glen 12 0 0.0% 2 16.7%
Werribee 1,100 128 11.6% 296 26.9%
Werribee South 308 10 3.2% 20 6.5%
Wesburn 34 0 0.0% 4 11.8%
West Footscray 366 35 9.6% 75 20.5%
West Melbourne 556 56 10.1% 103 18.5%
Western Gardens 6 3 50.0% 3 50.0%
Westmeadows 160 5 3.1% 26 16.3%
Wheelers Hill 180 0 0.0% 68 37.8%
Wheelers Hill Shopping Centre 13 0 0.0% 1 7.7%
Whittlesea 166 0 0.0% 32 19.3%
Williams Landing 18 1 5.6% 2 11.1%
Williamstown 743 75 10.1% 202 27.2%
Williamstown North 208 18 8.7% 61 29.3%
Wollert 6 0 0.0% 0 0.0%
Wonga Park 65 0 0.0% 7 10.8%
Woori Yallock 92 0 0.0% 22 23.9%
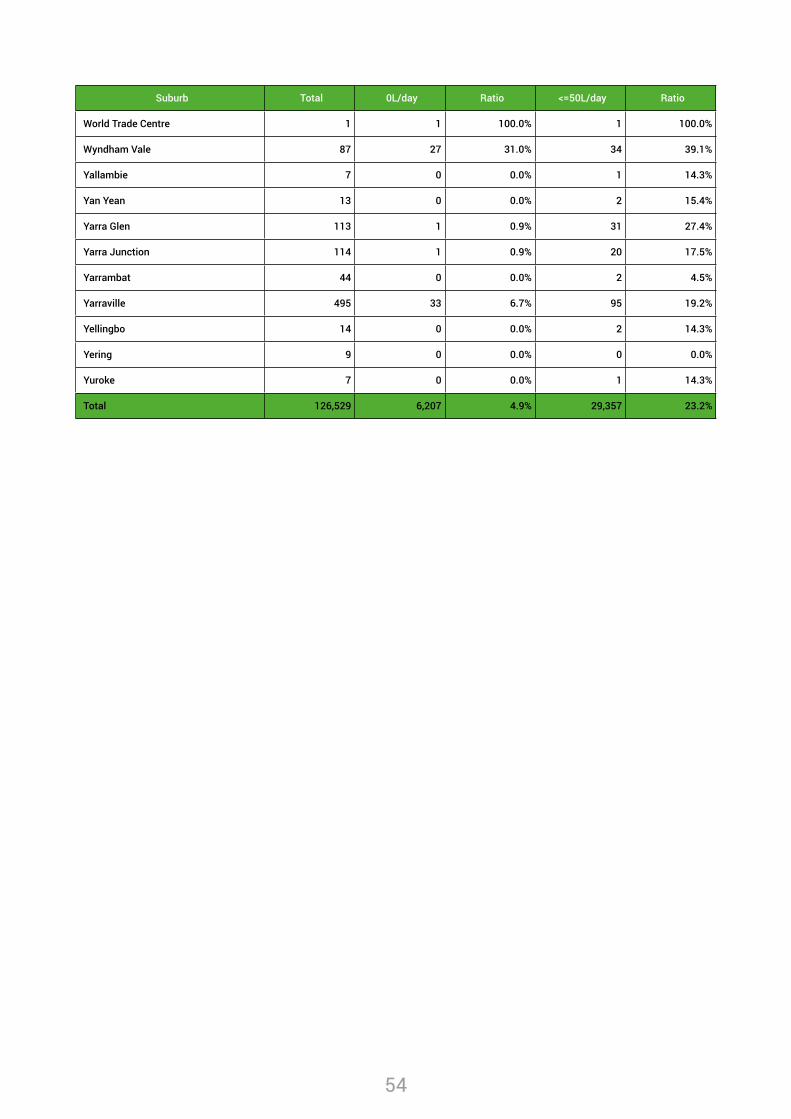
54
Suburb Total 0L/day Ratio <=50L/day Ratio
World Trade Centre 1 1 100.0% 1 100.0%
Wyndham Vale 87 27 31.0% 34 39.1%
Yallambie 7 0 0.0% 1 14.3%
Yan Yean 13 0 0.0% 2 15.4%
Yarra Glen 113 1 0.9% 31 27.4%
Yarra Junction 114 1 0.9% 20 17.5%
Yarrambat 44 0 0.0% 2 4.5%
Yarraville 495 33 6.7% 95 19.2%
Yellingbo 14 0 0.0% 2 14.3%
Yering 9 0 0.0% 0 0.0%
Yuroke 7 0 0.0% 1 14.3%
Total 126,529 6,207 4.9% 29,357 23.2%