speculation, returns, volumes and volatility in commodities
TRANSCRIPT
Speculation, Returns, Volumes and Volatility in Commodities Futures MarketsMatteo ManeraUniversity of Milano-Bicocca and FEEMjoint with Andrea Bastianin – University of Milano-Bicocca and FEEMMarcella Nicolini – University of Pavia and FEEMIlaria Vignati – FEEM
Financial Speculation in the Oil Market and the Determinants of the Oil Price
FEEM, 12-13 January

Speculation, Returns, Volumes and Volatility in Commodities Futures Markets1
1. Investigate the relationship between returns on futures prices of energy and non-energy commodities and financial speculation:−
Does speculation help to explain commodities returns?
−
Does speculation influence price volatility?−
Which macroeconomic factors are relevant in modeling returns?
2. Measure the “vulnerability”
of commodities futures markets to financial speculation:−
Volume-volatility relations
−
How much liquidity is needed to alter futures prices?−
Excess speculation and position limits
1. Motivation
Speculation, Returns, Volumes and Volatility in Commodities Futures Markets2
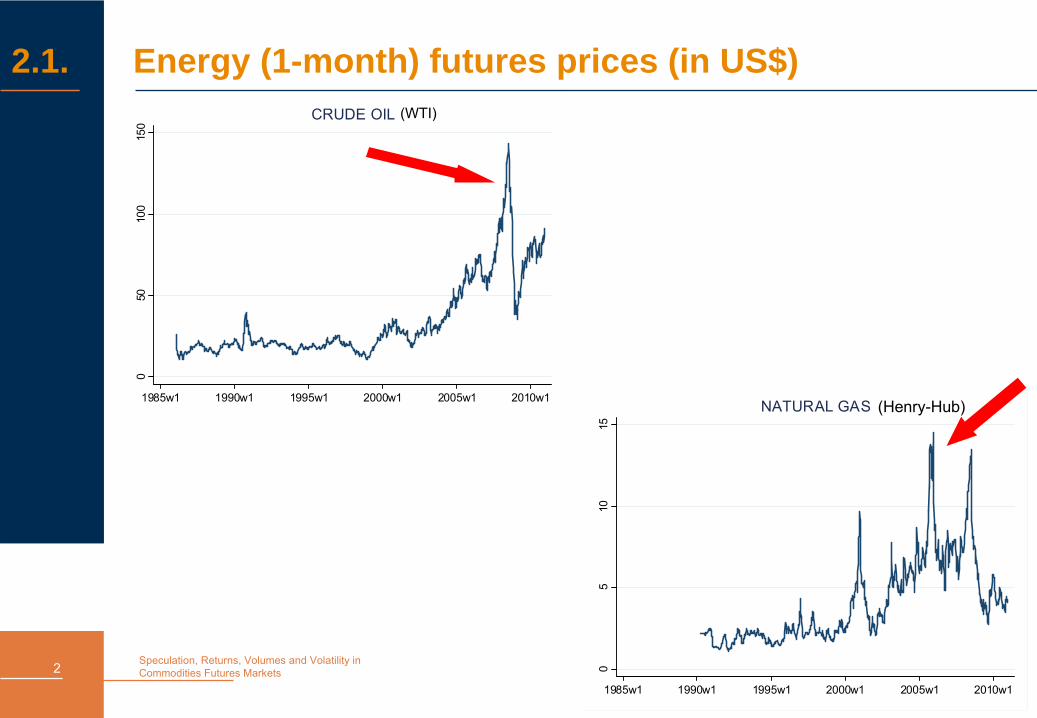
2.1. Energy (1-month) futures prices (in US$)
Sezione 2
Sezione 3
Sezione 2.1
050
100
150
1985w1 1990w1 1995w1 2000w1 2005w1 2010w1
CRUDE OIL
05
1015
1985w1 1990w1 1995w1 2000w1 2005w1 2010w1
NATURAL GAS
(WTI)
(Henry-Hub)
Speculation, Returns, Volumes and Volatility in Commodities Futures Markets3
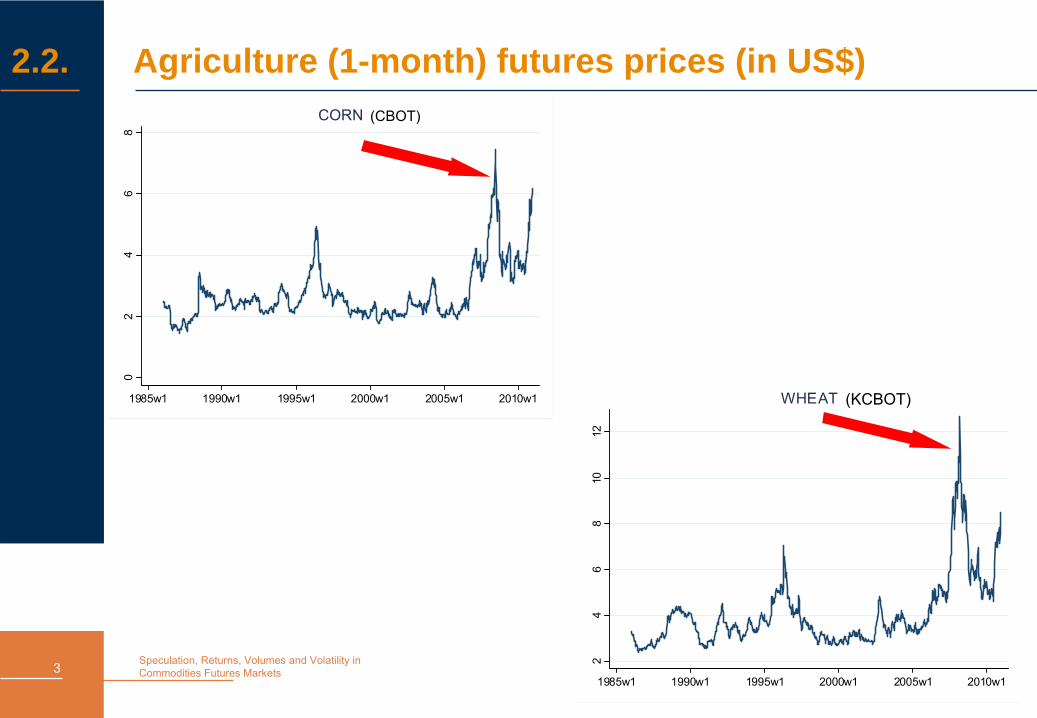
2.2. Agriculture (1-month) futures prices (in US$)
Sezione 2
Sezione 3
Sezione 2.1
02
46
8
1985w1 1990w1 1995w1 2000w1 2005w1 2010w1
CORN
24
68
1012
1985w1 1990w1 1995w1 2000w1 2005w1 2010w1
WHEAT (KCBOT)
(CBOT)
Speculation, Returns, Volumes and Volatility in Commodities Futures Markets4
2.3. Stylized facts on commodity prices
•
From 2000 to 2008 a sharp increase is observed in:Energy pricesFood pricesNumber of participants (both hedgers and speculators) in commodities futures markets
•
These stylized facts have led to claim that:oil/energy prices are responsible for food price increasesspeculators drive energy and food prices speculators affect commodities price volatility
Speculation, Returns, Volumes and Volatility in Commodities Futures Markets5
3.1. Literature review: oil prices and macroeconomic factors
•
Main macroeconomic factors which affect commodities futures returns:
Treasury bill yieldsEquity dividend yieldsJunk bond premiaExchange rates
(e.g. Sadorsky
2002; Chevallier
2009; Chen, Rogoff
and Rossi 2009)
Speculation, Returns, Volumes and Volatility in Commodities Futures Markets6
3.2. Literature review: oil prices and speculation
•
Several papers suggest that the increasing presence of speculators in the oil futures markets could explain the oil price spikes in 2007-2008 (e.g. Masters 2008; Medlock III and Jaffe, 2009)
•
However, other papers show that the two phenomena are not related (e.g. Irwin and Sanders 2010; Büyükşahin
and Harris, 2011)
Speculation, Returns, Volumes and Volatility in Commodities Futures Markets7
4.1. Data description: dependent variable
•
Dependent variable: returns on futures prices for4 energy commodities [crude oil, gasoline, heating oil, natural gas (NYMEX)]5 non-energy commodities [corn, oats, soybean oil, soybeans (CBOT) and wheat (KCBOT)]
•
Time period: 1986-2010
•
Frequency: weekly
•
Source: Datastream, CFTC (US Commodity Futures Trading Commission), FRED (Federal Reserve Economic Data)
Speculation, Returns, Volumes and Volatility in Commodities Futures Markets8
4.2.a Data description: explanatory variables
•
Macroeconomic factors:
Returns on the annual yield on the 90-day T-bill
Returns of S&P 500 Index
Junk bond yield = (returns on the annual yield on Moody’s long-term-BAA-rated corporate bonds) –(returns on the annual yield on Moody’s long-term-AAA-rated corporate bonds)
Weighted exchange rate index (of the US dollar against a subset of broad index of currencies outside US)
Speculation, Returns, Volumes and Volatility in Commodities Futures Markets9
4.2.b Data description: explanatory variables
•
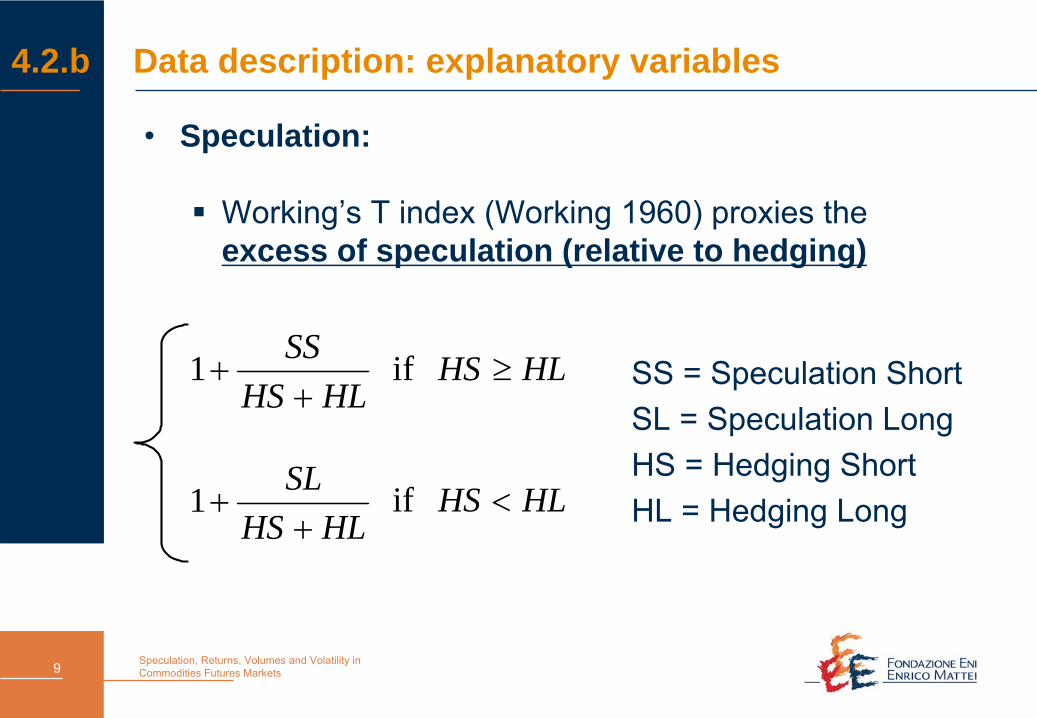
Speculation:
Working’s T index (Working 1960) proxies the excess of speculation (relative to hedging)
SS = Speculation ShortSL = Speculation LongHS = Hedging ShortHL = Hedging Long
HLHSSS+
+1 if HLHS ≥
HLHSSL+
+1 if HLHS <
Speculation, Returns, Volumes and Volatility in Commodities Futures Markets10
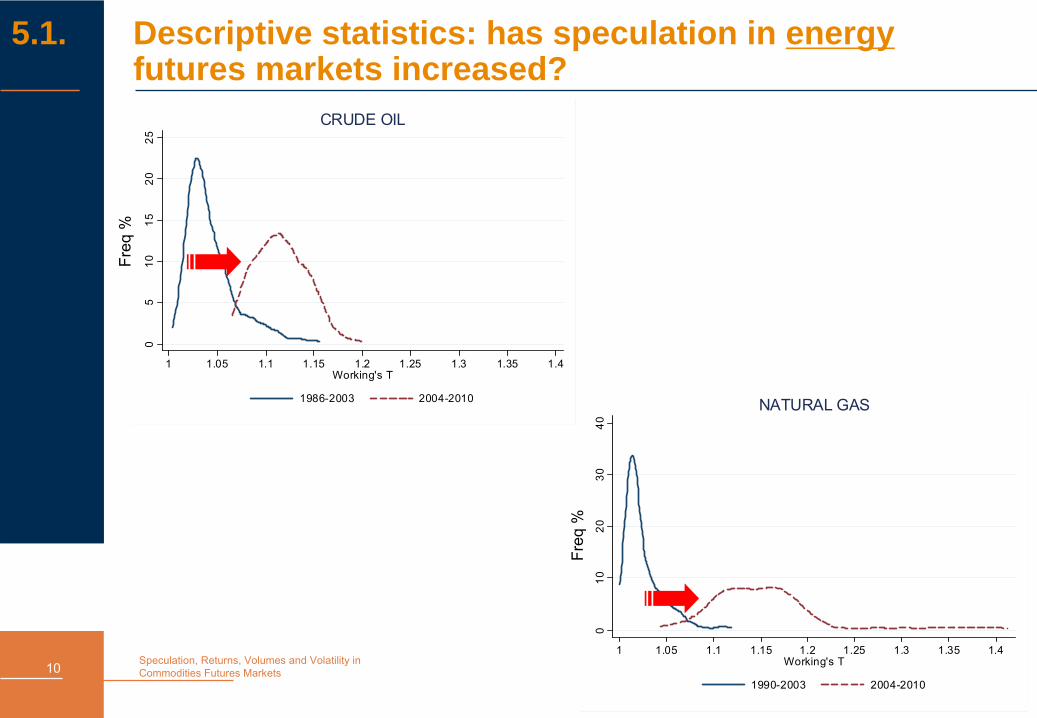
5.1. Descriptive statistics: has speculation in energy futures markets increased?
05
1015
2025
1 1.05 1.1 1.15 1.2 1.25 1.3 1.35 1.4Working's T
1986-2003 2004-2010
CRUDE OIL
010
2030
40
1 1.05 1.1 1.15 1.2 1.25 1.3 1.35 1.4Working's T
1990-2003 2004-2010
NATURAL GAS
Freq
%
Freq
%
Speculation, Returns, Volumes and Volatility in Commodities Futures Markets11
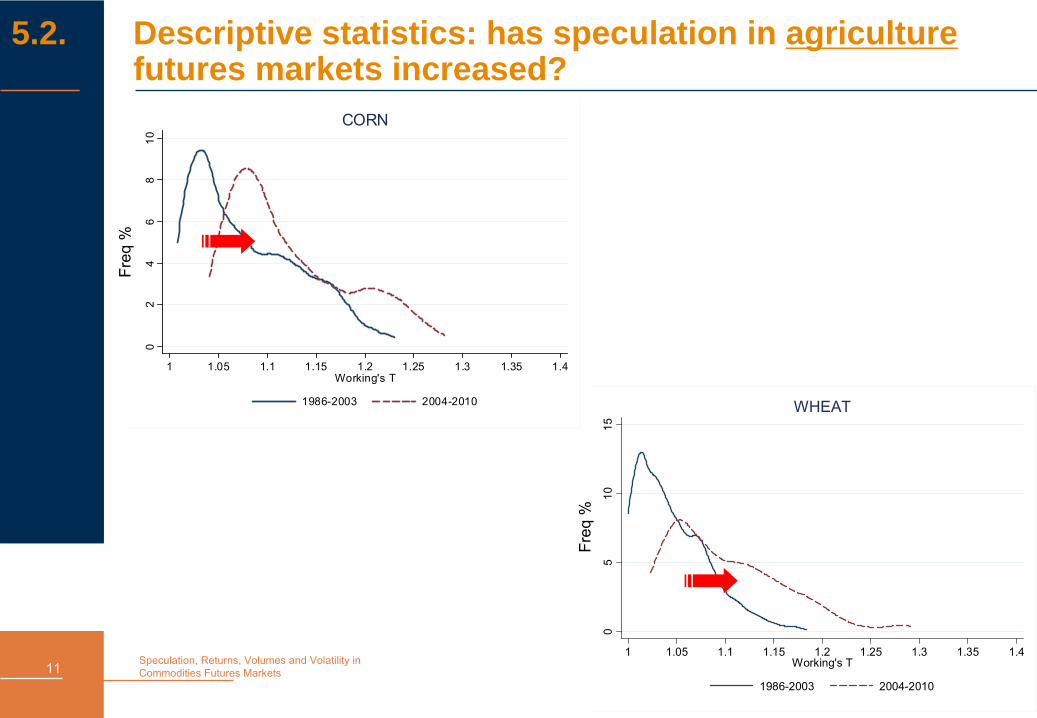
5.2. Descriptive statistics: has speculation in agriculture futures markets increased?
02
46
810
1 1.05 1.1 1.15 1.2 1.25 1.3 1.35 1.4Working's T
1986-2003 2004-2010
CORN
05
1015
1 1.05 1.1 1.15 1.2 1.25 1.3 1.35 1.4Working's T
1986-2003 2004-2010
WHEAT
Freq
%
Freq
%
Speculation, Returns, Volumes and Volatility in Commodities Futures Markets12
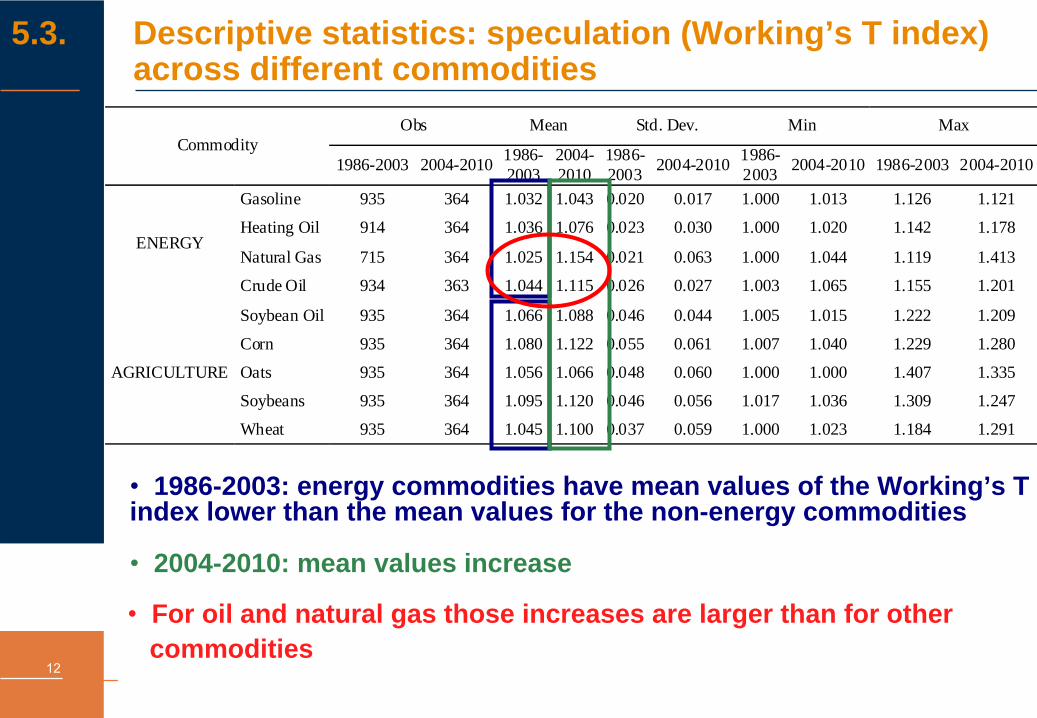
5.3. Descriptive statistics: speculation (Working’s T index) across different commodities
Obs Mean Std. Dev. Min Max Commodity
1986-2003 2004-2010 1986-2003
2004-2010
1986-2003 2004-2010 1986-
2003 2004-2010 1986-2003 2004-2010
Gasoline 935 364 1.032 1.043 0.020 0.017 1.000 1.013 1.126 1.121
Heating Oil 914 364 1.036 1.076 0.023 0.030 1.000 1.020 1.142 1.178
Natural Gas 715 364 1.025 1.154 0.021 0.063 1.000 1.044 1.119 1.413 ENERGY
Crude Oil 934 363 1.044 1.115 0.026 0.027 1.003 1.065 1.155 1.201
Soybean Oil 935 364 1.066 1.088 0.046 0.044 1.005 1.015 1.222 1.209
Corn 935 364 1.080 1.122 0.055 0.061 1.007 1.040 1.229 1.280
Oats 935 364 1.056 1.066 0.048 0.060 1.000 1.000 1.407 1.335
Soybeans 935 364 1.095 1.120 0.046 0.056 1.017 1.036 1.309 1.247
AGRICULTURE
Wheat 935 364 1.045 1.100 0.037 0.059 1.000 1.023 1.184 1.291
•
1986-2003: energy commodities have mean values of the Working’s T index lower than the mean values for the non-energy commodities
• For oil and natural gas those increases are larger than for othercommodities
• 2004-2010: mean values increase
Speculation, Returns, Volumes and Volatility in Commodities Futures Markets13
6.1. Univariate ARMA-GARCH
•
Returns on futures prices for each commodity are explained by:
Treasury bill yieldsJunk bond premiaEquity dividend yieldsExchange ratesMeasures of speculation (i.e. Working’s T index)
Speculation, Returns, Volumes and Volatility in Commodities Futures Markets14
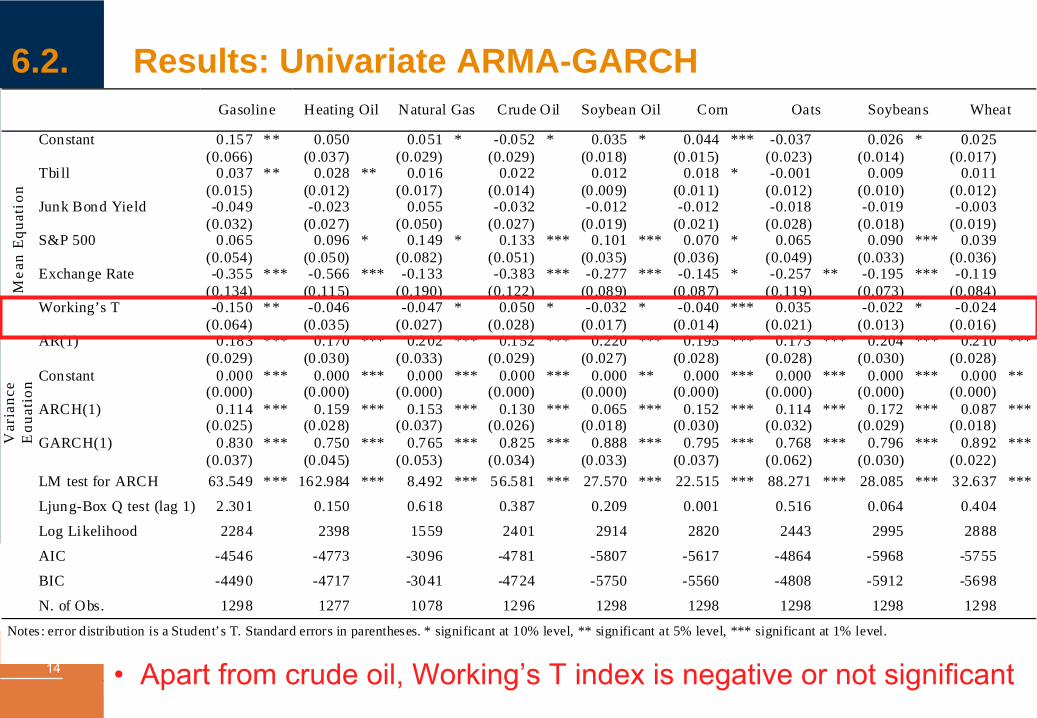
6.2. Results: Univariate ARMA-GARCH
Gasoline Heating Oil Natural Gas Crude Oil Soybean Oil Corn Oats Soybeans Wheat
Constant 0 .157 (0.066)
** 0.050(0.037)
0.051(0.029)
* -0.052(0.029)
* 0.035(0.018)
* 0.044(0.015)
*** -0.037(0.023)
0.026(0.014)
* 0.025 (0.017)
Tbill 0 .037 (0.015)
** 0.028(0.012)
** 0.016(0.017)
0.022(0.014)
0.012(0.009)
0.018(0.011)
* -0.001(0.012)
0.009(0.010)
0.011 (0.012)
Junk Bond Yield -0 .049 (0.032)
-0.023(0.027)
0.055(0.050)
-0.032(0.027)
-0.012(0.019)
-0.012(0.021)
-0.018(0.028)
-0.019(0.018)
-0.003 (0.019)
S&P 500 0 .065 (0.054)
0.096(0.050)
* 0.149(0.082)
* 0.133(0.051)
*** 0.101(0.035)
*** 0.070(0.036)
* 0.065(0.049)
0.090(0.033)
*** 0.039 (0.036)
Exchange Rate -0 .355 (0.134)
*** -0.566(0.115)
*** -0.133(0.190)
-0.383(0.122)
*** -0.277(0.089)
*** -0.145(0.087)
* -0.257(0.119)
** -0.195(0.073)
*** -0.119 (0.084)
Working’s T -0 .150 (0.064)
** -0.046(0.035)
-0.047(0.027)
* 0.050(0.028)
* -0.032(0.017)
* -0.040(0.014)
*** 0.035(0.021)
-0.022(0.013)
* -0.024 (0.016)
Mea
n E
quat
ion
AR(1) 0 .183 (0.029)
*** 0.170(0.030)
*** 0.202(0.033)
*** 0.152(0.029)
*** 0.220(0.027)
*** 0.195(0.028)
*** 0.173(0.028)
*** 0.204(0.030)
*** 0.210 (0.028)
***
Constant 0 .000 (0.000)
*** 0.000(0.000)
*** 0.000(0.000)
*** 0.000(0.000)
*** 0.000(0.000)
** 0.000(0.000)
*** 0.000(0.000)
*** 0.000(0.000)
*** 0.000 (0.000)
**
ARCH(1) 0 .114 (0.025)
*** 0.159(0.028)
*** 0.153(0.037)
*** 0.130(0.026)
*** 0.065(0.018)
*** 0.152(0.030)
*** 0.114(0.032)
*** 0.172(0.029)
*** 0.087 (0.018)
***
Var
ianc
e E
quat
ion
GARCH(1) 0 .830 (0.037)
*** 0.750(0.045)
*** 0.765(0.053)
*** 0.825(0.034)
*** 0.888(0.033)
*** 0.795(0.037)
*** 0.768(0.062)
*** 0.796(0.030)
*** 0.892 (0.022)
***
LM test for ARCH 63.549 *** 162.984 *** 8.492 *** 56.581 *** 27.570 *** 22.515 *** 88.271 *** 28.085 *** 32.637 *** Ljung-Box Q test (lag 1) 2 .301 0.150 0.618 0.387 0.209 0.001 0.516 0.064 0.404 Log Likelihood 2284 2398 1559 2401 2914 2820 2443 2995 2888 AIC -4546 -4773 -3096 -4781 -5807 -5617 -4864 -5968 -5755 BIC -4490 -4717 -3041 -4724 -5750 -5560 -4808 -5912 -5698 N. of Obs. 1298 1277 1078 1296 1298 1298 1298 1298 1298
Notes : error distribution is a Student’s T. Standard errors in parentheses. * significant at 10% level, ** significant at 5% level, *** significant at 1% level.
• Apart
from
crude oil, Working’s T index
is
negative or not
significant
Speculation, Returns, Volumes and Volatility in Commodities Futures Markets15
6.3.a Multivariate GARCH
•
It is more informative to estimate a system where returns for different commodities are jointly estimated, allowing spillover
effects in the mean, variance and covariance
equations
•
With a multivariate GARCH model is possible to indentify
if and how returns on oil/energy futures prices
are related to food/non-energy commodities futures prices
•
Models: Constant Conditional Correlations (CCC) and Dynamic (i.e. time-varying) Conditional Correlations (DCC)
Speculation, Returns, Volumes and Volatility in Commodities Futures Markets16
6.3.b Multivariate GARCH
•
We form two subgroups of commodities:
1.
Group “Fuels”: it includes the four energy commodities and soybean oil (spillovers between energy markets and bio-fuels)
2.
Group “Agriculture”: it includes the five agricultural commodities (spillovers between food markets and bio- fuels)
•
We consider a third group:
3.
Group “Agriculture + factor of energy commodities”: it includes the five agricultural commodities and a factor of the energy commodities (spillovers between energy and food markets and bio-fuels)
Speculation, Returns, Volumes and Volatility in Commodities Futures Markets17
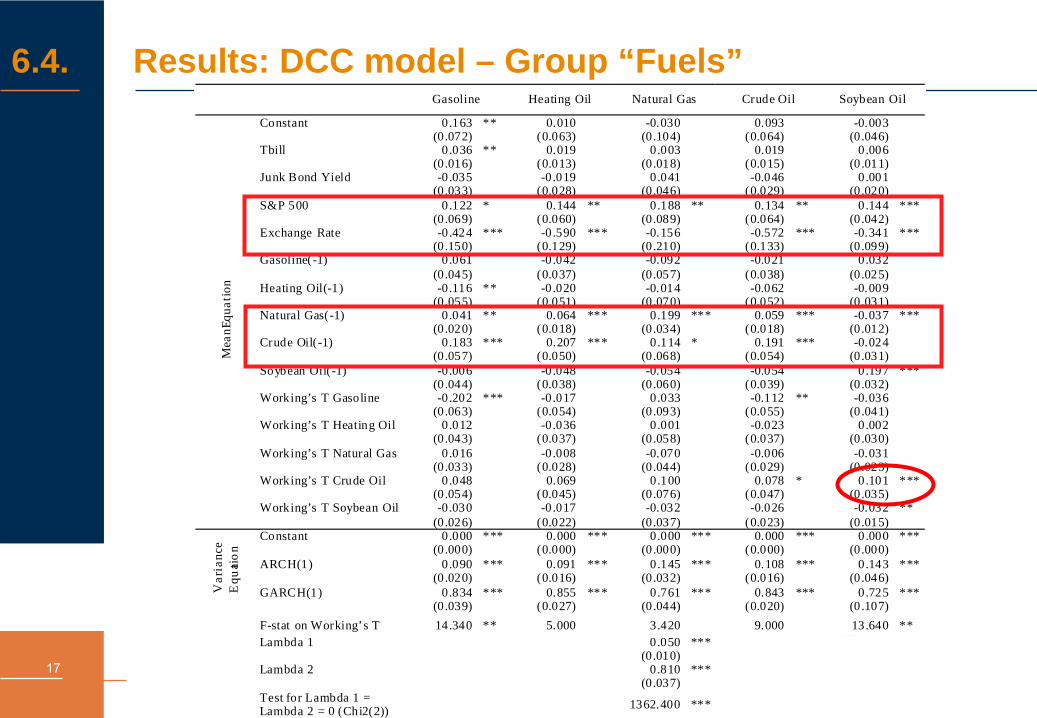
6.4. Results: DCC model – Group “Fuels”
Gasoline Heating Oil Natural Gas Crude Oil Soybean Oil
Constant 0.163(0.072)
** 0.010 (0.063)
-0.030(0.104)
0.093(0.064)
-0.003(0.046)
Tbill 0 .036(0.016)
** 0.019 (0.013)
0.003(0.018)
0.019(0.015)
0.006(0.011)
Junk Bond Yield -0.035(0.033)
-0.019 (0.028)
0.041(0.046)
-0.046(0.029)
0.001(0.020)
S&P 500 0.122(0.069)
* 0.144 (0.060)
** 0.188(0.089)
** 0.134(0.064)
** 0.144(0.042)
***
Exchange Rate -0.424(0.150)
*** -0.590 (0.129)
*** -0.156(0.210)
-0.572(0.133)
*** -0.341(0.099)
***
Gasoline(-1) 0.061(0.045)
-0.042 (0.037)
-0.092(0.057)
-0.021(0.038)
0.032(0.025)
Heating Oil(-1) -0.116(0.055)
** -0.020 (0.051)
-0.014(0.070)
-0.062(0.052)
-0.009(0.031)
Natural Gas(-1) 0.041(0.020)
** 0.064 (0.018)
*** 0.199(0.034)
*** 0.059(0.018)
*** -0.037(0.012)
***
Crude Oil(-1) 0.183(0.057)
*** 0.207 (0.050)
*** 0.114(0.068)
* 0.191(0.054)
*** -0.024(0.031)
Soybean Oil(-1) -0.006(0.044)
-0.048 (0.038)
-0.054(0.060)
-0.054(0.039)
0.197(0.032)
***
Working’s T Gasoline -0.202(0.063)
*** -0.017 (0.054)
0.033(0.093)
-0.112(0.055)
** -0.036(0.041)
Working’s T Heating Oil 0.012(0.043)
-0.036 (0.037)
0.001(0.058)
-0.023(0.037)
0.002(0.030)
Working’s T Natural Gas 0.016(0.033)
-0.008 (0.028)
-0.070(0.044)
-0.006(0.029)
-0.031(0.023)
Working’s T Crude Oil 0.048(0.054)
0.069 (0.045)
0.100(0.076)
0.078(0.047)
* 0.101(0.035)
***
Mea
n Equ
atio
n
Working’s T Soybean Oil -0.030(0.026)
-0.017 (0.022)
-0.032(0.037)
-0.026(0.023)
-0.032(0.015)
**
Constant 0.000(0.000)
*** 0.000 (0.000)
*** 0.000(0.000)
*** 0.000(0.000)
*** 0.000(0.000)
***
ARCH(1) 0.090(0.020)
*** 0.091 (0.016)
*** 0.145(0.032)
*** 0.108(0.016)
*** 0.143(0.046)
***
Var
ianc
e E
quati
on
GARCH(1) 0.834(0.039)
*** 0.855 (0.027)
*** 0.761(0.044)
*** 0.843(0.020)
*** 0.725(0.107)
***
F-stat on Working’s T 14.340 ** 5.000 3.420 9.000 13.640 **
Lambda 1 0.050(0.010)
***
Lambda 2 0.810(0.037)
***
Test for Lambda 1 = Lambda 2 = 0 (Chi2(2)) 1362.400 ***
Speculation, Returns, Volumes and Volatility in Commodities Futures Markets18
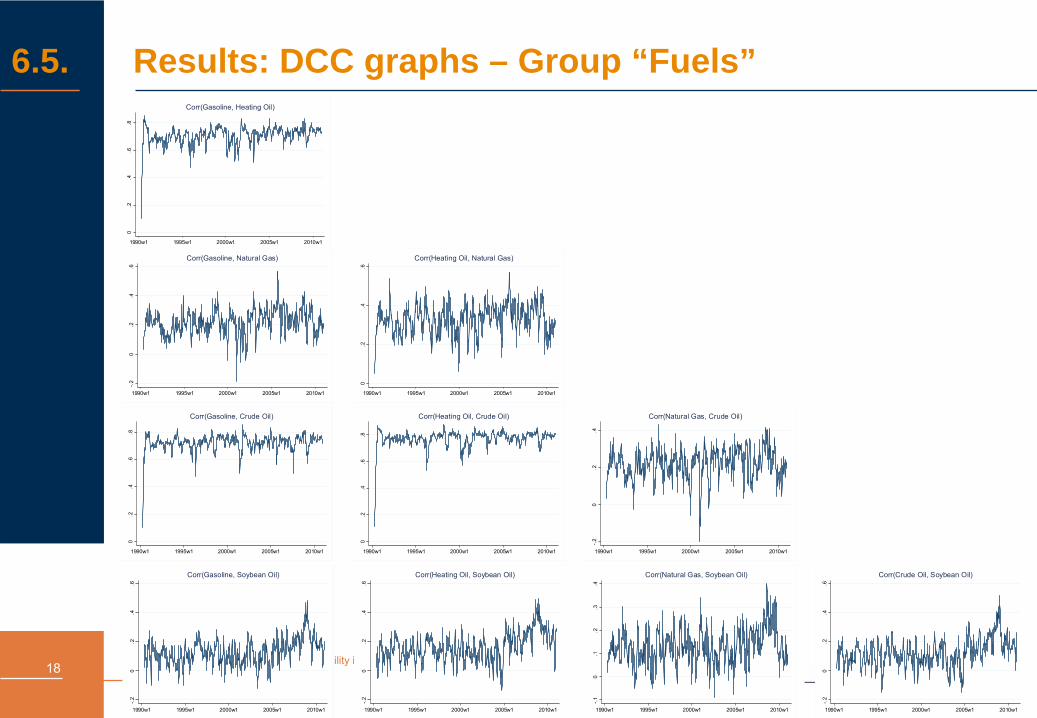
6.5. Results: DCC graphs – Group “Fuels”0
.2.4
.6.8
1990w1 1995w1 2000w1 2005w1 2010w1
Corr(Gasoline, Heating Oil)
-.2
0.2
.4.6
1990w1 1995w1 2000w1 2005w1 2010w1
Corr(Gasoline, Natural Gas)
0.2
.4.6
.8
1990w1 1995w1 2000w1 2005w1 2010w1
Corr(Gasoline, Crude Oil)
-.2
0.2
.4.6
1990w1 1995w1 2000w1 2005w1 2010w1
Corr(Gasoline, Soybean Oil)
0.2
.4.6
1990w1 1995w1 2000w1 2005w1 2010w1
Corr(Heating Oil, Natural Gas)
0.2
.4.6
.8
1990w1 1995w1 2000w1 2005w1 2010w1
Corr(Heating Oil, Crude Oil)
-.2
0.2
.4.6
1990w1 1995w1 2000w1 2005w1 2010w1
Corr(Heating Oil, Soybean Oil)
-.2
0.2
.4
1990w1 1995w1 2000w1 2005w1 2010w1
Corr(Natural Gas, Crude Oil)
-.1
0.1
.2.3
.4
1990w1 1995w1 2000w1 2005w1 2010w1
Corr(Natural Gas, Soybean Oil)
-.2
0.2
.4.6
1990w1 1995w1 2000w1 2005w1 2010w1
Corr(Crude Oil, Soybean Oil)
Speculation, Returns, Volumes and Volatility in Commodities Futures Markets19
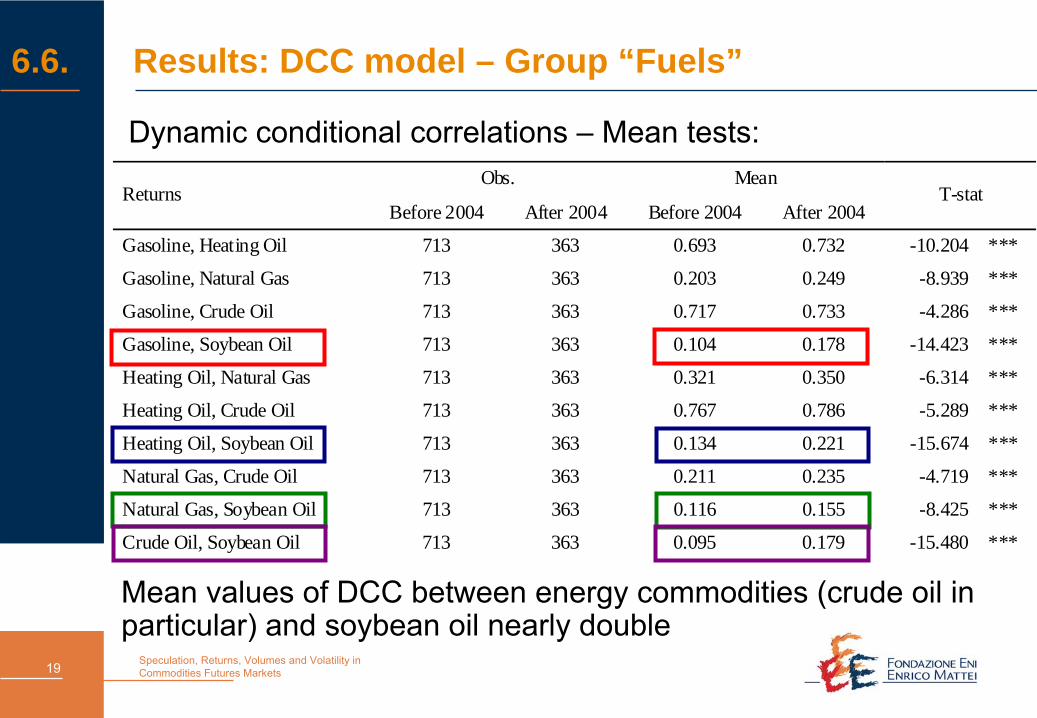
6.6. Results: DCC model – Group “Fuels”
Dynamic conditional correlations –
Mean tests:Obs. Mean
Returns Before 2004 After 2004 Before 2004 After 2004
T-stat
Gasoline, Heating Oil 713 363 0.693 0.732 -10.204 ***
Gasoline, Natural Gas 713 363 0.203 0.249 -8.939 ***
Gasoline, Crude Oil 713 363 0.717 0.733 -4.286 ***
Gasoline, Soybean Oil 713 363 0.104 0.178 -14.423 ***
Heating Oil, Natural Gas 713 363 0.321 0.350 -6.314 ***
Heating Oil, Crude Oil 713 363 0.767 0.786 -5.289 ***
Heating Oil, Soybean Oil 713 363 0.134 0.221 -15.674 ***
Natural Gas, Crude Oil 713 363 0.211 0.235 -4.719 ***
Natural Gas, Soybean Oil 713 363 0.116 0.155 -8.425 ***
Crude Oil, Soybean Oil 713 363 0.095 0.179 -15.480 ***
Mean values of DCC between energy commodities (crude oil in particular) and soybean oil nearly double
Speculation, Returns, Volumes and Volatility in Commodities Futures Markets20
7. Conclusions I
•
Speculation−
Working’s T index is poorly significant in both univariate
and multivariate models, suggesting that speculation is not relevant in explaining commodities’
returns
•
Macroeconomic factors−
Equity returns are generally positive and significant
−
Exchange rate is generally negative and significant
•
Spillovers−
Within
the two groups of commodities (“fuels”
and
“agriculture”)−
Between
the two groups of commodities (i.e. Working’s T
index of crude oil significant in the soybean oil equation; increased co-volatilities after 2004)
Speculation, Returns, Volumes and Volatility in Commodities Futures Markets21
8.1. “Market depth”
•
“Market depth” (e.g. Kyle 1985; Bessembinder
and Seguin 1993): “approximate unexpected dollar trading volume which is necessary to alter futures prices by ‘one unit’”
(“vulnerability” of a market to speculation)
•
Estimate a modified ARCH model for returns and volatility, augmented with (expected and unexpected) volume and open interest, where:
Expected volume (open interest): fitted values of ARIMA models applied to volume (open interest)Unexpected volume (open interest): residuals of ARIMA models applied to volume (open interest)
Speculation, Returns, Volumes and Volatility in Commodities Futures Markets22
8.2. “Market depth”
•
Markets: crude oil, natural gas, heating oil and gasoline (NYMEX)
•
Sizes of futures contracts:Crude oil: 1,000 barrelsNatural gas: 10,000 mmbtuHeating oil: 42,000 gallonsGasoline: 42,000 gallons
•
Time period: 1986-2010 (1990-2010 for natural gas)
•
Frequency: daily
•
Source: Datastream, CFTC
Speculation, Returns, Volumes and Volatility in Commodities Futures Markets23
8.3. “Market depth”
•
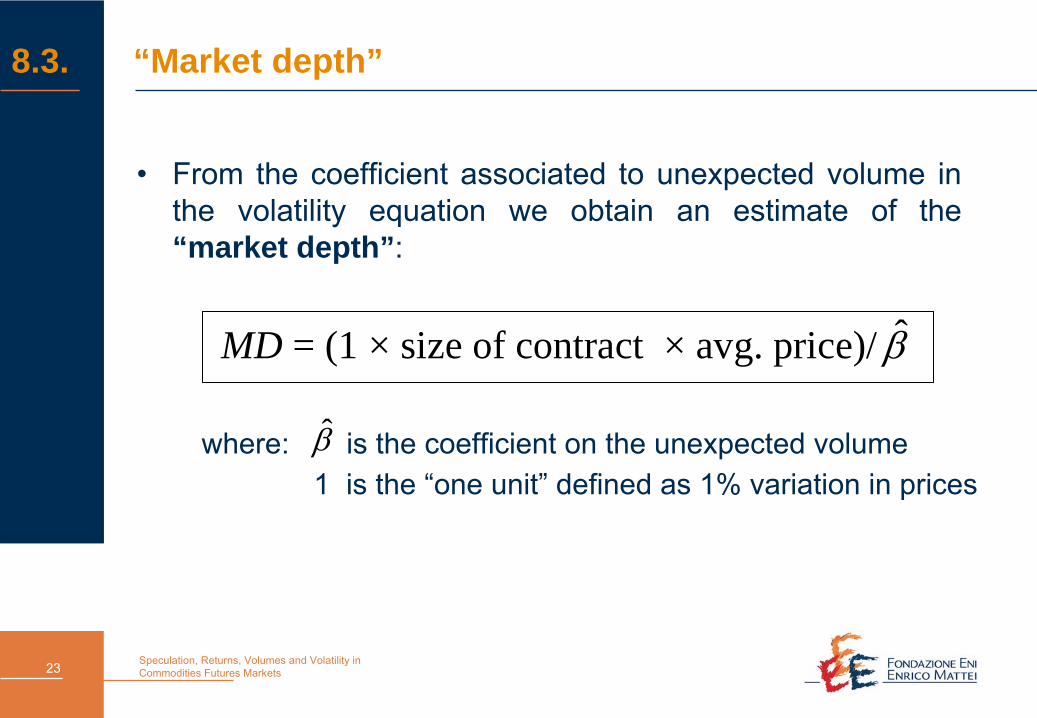
From the coefficient associated to unexpected volume in the volatility equation we obtain an estimate of the “market depth”:
MD = (1 × size of contract × avg. price)/ β̂
where: is the coefficient on the unexpected volume1 is the “one unit”
defined as 1% variation in prices
β̂
Speculation, Returns, Volumes and Volatility in Commodities Futures Markets24
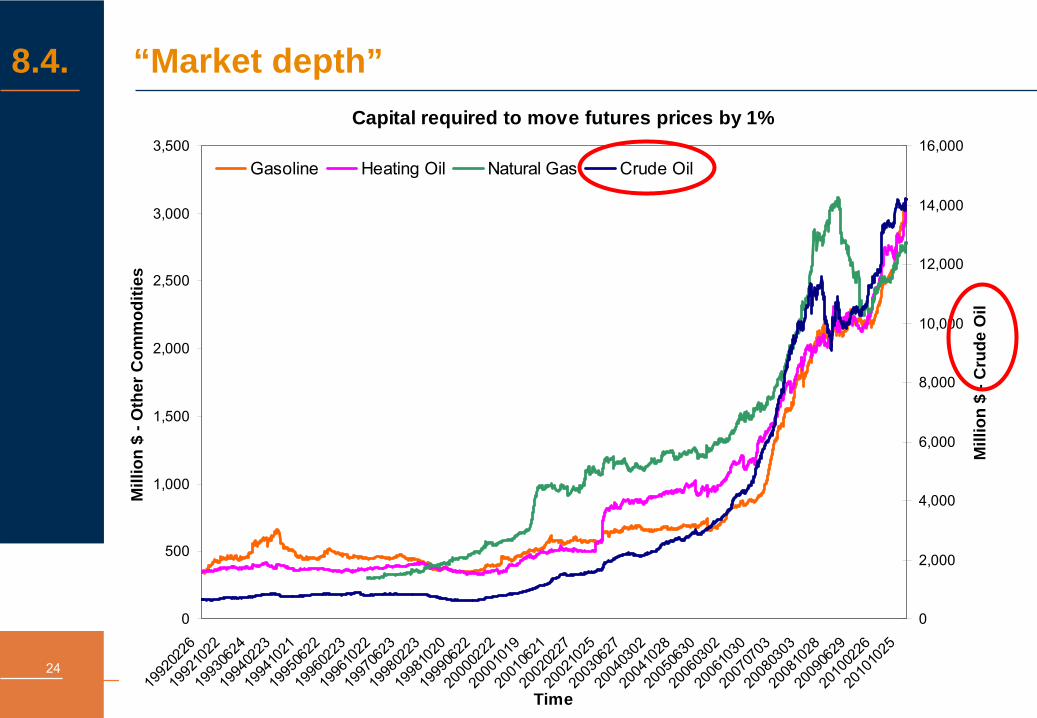
8.4. “Market depth”Capital required to move futures prices by 1%
0
500
1,000
1,500
2,000
2,500
3,000
3,500
1992
0226
1992
1022
1993
0624
1994
0223
1994
1021
1995
0622
1996
0223
1996
1022
1997
0623
1998
0223
1998
1020
1999
0622
2000
0222
2000
1019
2001
0621
2002
0227
2002
1025
2003
0627
2004
0302
2004
1028
2005
0630
2006
0302
2006
1030
2007
0703
2008
0303
2008
1028
2009
0629
2010
0226
2010
1025
Time
Mill
ion
$ - O
ther
Com
mod
ities
0
2,000
4,000
6,000
8,000
10,000
12,000
14,000
16,000
Mill
ion
$ - C
rude
Oil
Gasoline Heating Oil Natural Gas Crude Oil
Speculation, Returns, Volumes and Volatility in Commodities Futures Markets25
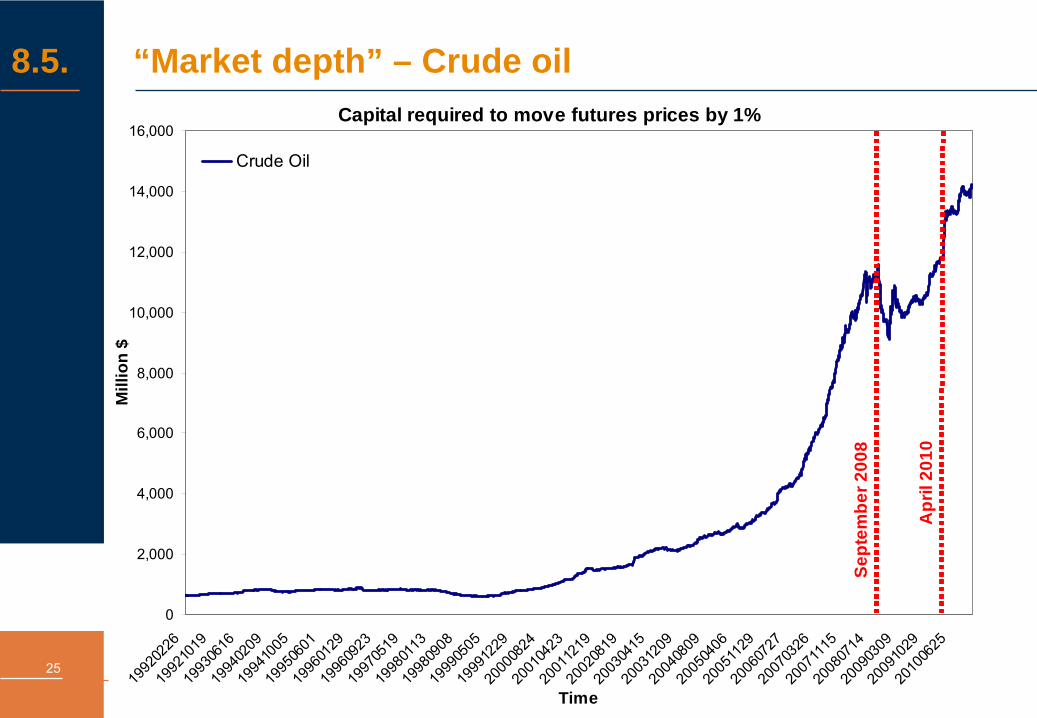
8.5. “Market depth” – Crude oilCapital required to move futures prices by 1%
0
2,000
4,000
6,000
8,000
10,000
12,000
14,000
16,000
1992
0226
1992
1019
1993
0616
1994
0209
1994
1005
1995
0601
1996
0129
1996
0923
1997
0519
1998
0113
1998
0908
1999
0505
1999
1229
2000
0824
2001
0423
2001
1219
2002
0819
2003
0415
2003
1209
2004
0809
2005
0406
2005
1129
2006
0727
2007
0326
2007
1115
2008
0714
2009
0309
2009
1029
2010
0625
Time
Mill
ion
$
Crude Oil
Sept
embe
r 200
8
Apr
il 20
10
Speculation, Returns, Volumes and Volatility in Commodities Futures Markets26
9. Conclusions II
•
Our empirical evidence suggests that:
“Market depth” has increased after 2000
In the financial crisis period (after 2008), “market depth” in the market of oil futures has dropped, i.e. this market is more vulnerable to speculation
•
Estimates of “market depth”
have to be interpreted with care
Corso Magenta 63, 20123 Milano - Italia - Tel +39 02.520.36934 - Fax +39 02.520.36946 - www.feem.it