specialists in satellite imagery and geospatial solutions · mt bruce 1:250 000 sheet images image...
TRANSCRIPT

ALOS IMAGE MOSAICS
GEOIMAGE2121
GEOIMAGESpecialists in Satellite Imagery
and GeoSpatial Solutions
2121
Specialists in Satellite Imagery and GeoSpatial Solutions
INTRODUCTIONThe Japanese ALOS satellite became operational on May 18, 2006 and since that time an impressive archive of 2.5m black/white (PRISM) and 10m multispectral (AVNIR-2) imagery has been collected. This imagery may be a more viable cost option to the Very High Resolution (sub-metre) imagery where large area coverage is required. The 2.5m black/white imagery can also be combined with Landsat multispectral imagery to give better spectral discrimination.
PRISMThe PRISM sensor can operate in several modes however Mode1, simultaneous collection of back/nadir/forward images covering 35km by 35km on the ground, and Mode2, collec-tion of 70km by 35km nadir imagery and 35km by 35km backward looking imagery, are the most important. Mode1 imagery is predominantly used for DEM generation while the Mode2 nadir imagery is often collected on the same overpass as the AVNIR-2 imagery to make pan-sharpened multispectral imagery. We have seen a trend towards the collection of a high proportion of Mode2 imagery over Australia in 2009 and this has resulted in an extensive archive of PRISM imagery.
AVNIR-2The AVNIR-2 sensor covers a ground track 70km wide in the spectral bands vis blue, vis green, vis red and near infrared. Although the sensor can capture at angles of up to 44 degrees cross-track, this is used only for emergency response and the main captures are in nadir mode. The AVNIR-2 and PRISM sensors are completely separate however the data from each sensor can be easily co-registered because of the similar collection parameters.
LANDSAT 5 FUSIONThere is a large archive of Landsat Thematic Mapper imagery available over most of the world’s land areas. Since 2006, when the ALOS satellite was launched, Landsat 5 has been the major source of such imagery because of the SLC-off problem on Landsat 7. The Thematic mapper sensor covers important spectral regions not covered by the AVNIR-2 sensor and for this reason, it is an important source of multispectral imagery to combine with the PRISM nadir imagery.
TEST AREASGEOIMAGE has worked with RESTEC/JAXA to prepare sample imagery over three regions in Australia:1. Mt Bruce 1:250,000 map sheet in Western Australia covering a sizeable area of the
Pilbara, including the Hamersley Basin and several iron ore mines including Mt Tom Price.
2. Dalby 1:100,000 map sheet in Queensland covering a rural region that edges the coal and coal seam gas region of the Surat Basin. The town of Dalby is centred in the image.
3. Little Swanport 1:100,000 map sheet in Tasmania extending over an area of mixed land use, covered with forestry and farming.
Each of these examples is described in more detail below, together with examples of how the data could be applied to support planning, operational and analytical applications.
GEOIMAGE has prepared the following image products for each area.1. PRISM 2.5m mosaic2. AVNIR 10m 4 band mosaic3. PRISM sharpened AVNIR 4 band mosaic4. PRISM sharpened Landsat 5 6 band mosaic.
ERMapper and TIFF files at full resolution and 3 band colour enhanced ECW compressed files for a 5km by 5km area for each of the three test areas are available for download from the GEOIMAGE ftp site. e.g. ftp.geoimage.com.au/public/DALBY_sample_ALOS.zip. A copy of the license conditions applying to the ALOS data is included in the zip file.
DISCUSSION AND ADVANTAGES OF ALOS IMAGERYALOS PRISM imagery has a 2.5m GSD (Ground Sample Distance) which would suggest a useable maximum scale of 1:10 000, however because of the compression noise in the data, GEOIMAGE would suggest a best scale of 1:15 000 and 1:25 000 scale as ideal for stereo viewing. Where the PRISM image has been used to pan-sharpen multispectral imagery, the data can be used at the same scales.
The nadir PRISM images are collected at less than 3 degrees off vertical even at the edges of the scenes and this allows orthorectification of the imagery using the SRTM except in areas of extreme variation in elevation. It is therefore easy to coregister the PRISM with multispectral imagery with similar characteristics such as the AVNIR-2 and Landsat. The AVNIR-2 multispectral imagery at 10m resolution and collected on the same overpass will be the spectral imagery of choice for many applications with bands in the visible blue-green-red and near infrared. For geological applications, the Landsat 5 Thematic Mapper imagery is even better because of the mid infrared bands ability to discriminate iron bearing rocks and soils. The availability of ongoing Landsat 5 may be an issue because of the age of the satellite, however the imagery used for the test areas was freely available on the EROS site and can normally be found in the same date range as the PRISM unless cloud is an issue.
COSTUnfortunately, it is not possible to give an easy per sq km pricing for this data without having to do archive data searches. The costs are very dependent on the availability of the 70km wide Mode2 PRISM imagery versus the Mode1 and for that reason the following table has been prepared to offer indicative per sq km costs for the three test areas that are described here. Note also that the costs will be dependent on the shape of the area of interest and how it relates to the path/row collection pattern of the ALOS imagery.
APPLICATIONS OF THE IMAGERYALOS AVNIR and pan-sharpened products can form the basis of derived dataset production, including applications to support environmental, ecological, infrastructure, mining, exploration and urban applications. The scale of application and extent makes this source an ideal broad scale feasibility or concept planning tool, enabling the user to hone in on detailed areas of interest, for which very high resolution satellite imagery can be acquired. This approach can significantly reduce overall project costs and provide the potential for analysis of areas of interest at a scale that is in alignment with the stage of the project.
Please contact us at:Brisbane 13/180 Moggill Road, Taringa QLD 4068 | Tel +61 7 3871 0088 | Fax +61 7 3871 0042 | [email protected]
Perth 27A Townshend Road, Subiaco WA 6008 | Tel +61 8 9381 7099 | Fax +61 8 9381 7399 | [email protected]
Sydney PO Box 208, Crows Nest NSW 1585 | Tel +61 2 9460 0929 | Fax +61 2 9460 0929 | [email protected]
www.geoimage.com.au
Photogeological interpretation over Hamersley Basin, Western Australia, showing previously unrecognised overturning in Hardey Syncline (Nash, C.R., 1998, ‘Geological Image Interpretation’. Adelaide, Australian Mineral Foundation, Course Notes 202/98) and PRISM sharpened Landsat B741. © JAXA/RESTEC . Example courtesy of Dr C. Nash of Colin Nash and Associates www.colnash.com.au/.
AREA PRISM PRISM+AVNIR PRISM+LANDSAT 5MT BRUCE 1.89 2.6 2.0DALBY 2.4 3.3 2.5LITTLE SWANPORT 1.7 2.2 1.9
Table:Costs of purchase and preparation of ALOS pan-sharpened products. A$ per sq km.

MT Bruce 1:250 000 SHEET Images Image A. Example of the individual scenes needed to cover the 1.5 by 1.0degrees sheet. There are 16 wide Mode2 PRISM scenes in blue and 7 AVNIR-2 scenes in green. The area falls within 4 Landsat scenes, paths 112-113 and rows 75-76 (not shown). Image B. AVNIR-2 natural colour mosaic. Image C. Landsat 5 B741 pan-sharpened with PRISM. All ALOS images © JAXA/RESTEC
MT BRUCE 1:250,000 SHEETThe Mt Bruce 1:250 000 sheet covers part of the Archean-Early Proterozoic Hamersley Province of Western Australia. The light-coloured, pinkish rocks (Image C) in the southern part are predominantly layered shales and mafic volcanics of the Fortescue Group, which rest upon Archean basement granites in the core of the Rocklea Dome. The overlying darker strata of the Hamersley Group occur as structural depres-sions such as the Mt Bruce and Brockman Synclines. These rocks include the economically-important Marra Mamba and Brockman Iron Formations, which form resistant, mappable features on ALOS imagery. Local supergene enrichment of these units at Mt Tom Price and other localities throughout the Hamersley Province has produced world-class hematite de-posits. In the north of the image area, the Hamersley Group rocks are extensively covered by a Tertiary ferruginous duricrust surface, which shows a distinctive reddish colour on imagery due to high content of ferric oxides.
The imagery provides both a regional and localised context to mining activity. At a regional scale, the broad scale geological features, lineaments and structures in this region of low vegetated cover can provide additional interpretation opportunities to the skilled analyst. Having stereo capability enables interpretation to be based on topography as well as spectral variability.
The level of detail offered from the pan-sharpened imagery provides users with an ideal baseline to generate metrics associated with mining footprint, rehabilitation activities, infra-structure development and associations with geo-scientific features for exploration. Very high resolution imagery can be used over areas of particular interest and in conjunction with the ALOS derived products reduce the coverage required for this higher-cost data source.
C
B
A

Examples of ALOS image mosaics, Mt Bruce 1:250 000 Sheet Western Australia at 1:35 000 scale. Image A. ALOS PRISM at 2.5m resolution. Image B. ALOS AVNIR 10m natural colour image pan-sharpened with ALOS PRISM. Image C. Landsat 5 30m multispectral imagery Bands 741 in RGB. Image D. Landsat 5 30m multispectral imagery Bands 741 in RGB pan-sharpened with ALOS PRISM. All ALOS images © JAXA/RESTEC
A B
C D

Examples of ALOS image mosaics, Mt Bruce 1:250 000 Sheet Western Australia at 1:35 000 scale. Mt Tom Price Mine area. Image A. ALOS PRISM at 2.5m resolution. Image B. ALOS AVNIR 10m natural colour image pan-sharpened with ALOS PRISM. Image C. Landsat 5 30m multispectral imagery Bands 741 in RGB. Image D. Landsat 5 30m multispectral imagery Bands 741 in RGB pan-sharpened with ALOS PRISM. All ALOS images © JAXA/RESTEC
A B
C D

DALBY 1:100 000 Sheet QueenslandPRISM sharpened Landsat 5 B741 © JAXA/RESTEC
DALBY 1:100 000 SHEET, QUEENSLANDDalby is an area of mixed land use, with intensive use of the fertile black soils for cropping. A wide assortment of crops are grown each year, including wheat, sorghum, barley, mung beans, chickpeas, corn and some cotton. This colour combination adds the short-wave infrared channel from Landsat to improve discrimination in the cropping areas surrounding the town.
The regular structure of the paddocks can cause issues when undertaking auto-correlation of control points. Areas that have a dominance of man-made structures need to be managed to ensure appropriate control is collected to generate an accurate ortho-rectified product. Geoimage has substantial holdings of ground control and will use the best available data and has also established strategic relationships with surveying organisations, such as Land Solutions, to enable field ground control collection, as required.
In competition with arable landuse in the south west of this image is the layout of active Coal Seam Gas mining. The regular structure of the access roads and well heads are clearly discernible from the pan-sharpened imagery, in close proximity to an irrigation circle. This combination of imagery provides the source data to assist in the management of assets for mining activities while supporting the assessment of crop variability and production constraints.
Mining activity: Sustainable development requires operators to manage resources using practices that minimise the impact of operations on the land. The images on the following page clearly shows the requirement, in Coal Seam Gas operations, to construct service corridors and access roads and infrastructure associated with the extraction and production of the resources. The gas field infrastructure can include workover operations, surface equipment connection, gas compression plants, coal seam gas water storage areas in addition to the well site and pipeline setups required. Most of this infrastructure would be clearly visible from satellite imagery.
Throughout the cycles of exploration and production, there are requirements in relation to minimising and reporting impacts to the landholders, to shareholders and to government. Under the Petroleum & Gas (Production and Safety) Act 2004, producers are required to report on activities through the development of Environmental Management Plans. Imagery such as that presented here can form the backdrop for mapping required by both the DERM and DEEDI in Queensland.
Operators are also required to report on rehabilitation activities and pay a guarantee to government to reconstitute any disturbance that may occur in the event of an unexpected
company closure. Imagery can provide a baseline record of land condition prior to the commencement of mining activity. GeoSpatial inputs can baseline any land feature in relation to topography, drainage, landuse, water management, cultural heritage, service and access corridors, flora and fauna communities and land tenure and landholder negotiations. It should be noted that ongoing records of impacts throughout the activities on the land are normally recorded, relying on spatially referenced data including imagery and these become particularly important through production to the final signoff stage associated with rehabilitation.
Agricultural production: The images on the following page produced at 1:50,000 scale clearly present variability within the paddocks on the eastern side of the image. Imagery provides one of the major sources of data to assist in interpreting and measuring these variations. Through the generation of indices that present the range of vegetation health, such as the Normalised Difference Vegetation Index (NDVI), Geoimage can provide an improved picture of the variability.
Imagery alone does not contribute the cause of the variability and this can be supported more fully through compilation of additional, relevant data sources such as topography (derived from precision agriculture sources, LiDAR or satellite imagery, depending on the availability and scale of reporting required), drainage, soil moisture content, micro-climate and / or pedology and most importantly, land management practices undertaken by the farmer during the active season.
Specialist knowledge is required to obtain some of these datasets and to integrate these data sources into a decision support system that will assist the farmer in managing the land. Geoimage can work with specialists in generating a comprehensive but informative package of data to assist in improved p r o d u c t i o n o r r e d u c e d c o s t s associated with the application of water and/or fertilizer.
DALBY 1:100 000 Sheet Queensland.PRISM sharpened AVNIR natural colour. © JAXA/RESTEC
Example of the individual scenes needed to cover the DALBY 1:100 00 Sheet. There are 4 standard Mode1 nadir PRISM scenes collected on 31 October 2008 (west) and on 12 July 2007 in blue and 2 AVNIR-2 scenes in green, 03 November 2009 (west) and 17 october 2009. The area falls within Landsat scene 90/79 and the Landsat 5 scene used was collected on 01 November 2009 (outline not shown).
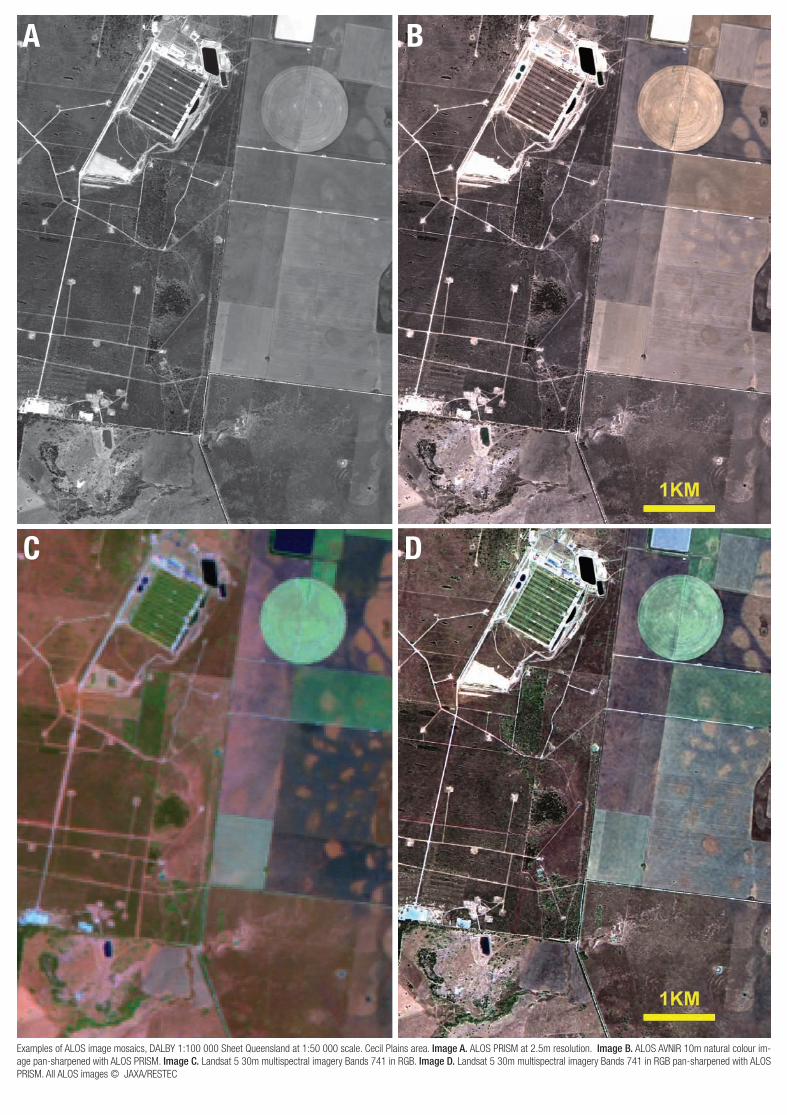
Examples of ALOS image mosaics, DALBY 1:100 000 Sheet Queensland at 1:50 000 scale. Cecil Plains area. Image A. ALOS PRISM at 2.5m resolution. Image B. ALOS AVNIR 10m natural colour im-age pan-sharpened with ALOS PRISM. Image C. Landsat 5 30m multispectral imagery Bands 741 in RGB. Image D. Landsat 5 30m multispectral imagery Bands 741 in RGB pan-sharpened with ALOS PRISM. All ALOS images © JAXA/RESTEC
A B
C D

LITTLE SWANPORT 1:100 000 Sheet TasmaniaPRISM sharpened AVNIR natural colour. © JAXA/RESTEC
LITTLE SWANPORT 1:100 000 SHEET, TASMANIAReporting on our natural resources, particularly in areas under pressure, is becoming increasingly important. Both urban development and agricultural pressures are resulting in the loss of forested regions. Governments now require reporting to show the extent and nature of change and for this change to be reported using robust and transparent methods. Land managers are often faced with challenges on how to show their management practices, especially in regions that are densely forested. Accessibility and locational issues can be overcome through the adoption of remotely-sensed approaches relying on satellite imagery.
With sustainable development and management, forestry resources, both natural and plantation, can be used as a basis for carbon accounting. Climate change is widely considered to be influenced by the “burning of fossil fuels, extensive global land clearing and agriculture” Source: DCC, 2008. Australia’s greenhouse gas emissions (2006) were reported as being derived 16% from agriculture and 7% from land use change and forestry.
An approach, based on satellite imagery, to mapping areas that contribute to both emissions and sequestration, can improve our understanding of change and how this might impact ongoing management practices and future policy.
Australia’s government has an active National Carbon Accounting System(NCAS) Program that comprehensively reports on land-based emissions, both carbon and nitrogen, from a single project up to a National level. Carbon accounting is also undertaken internationally
and outcomes from the NCAS are fed into the global system. As the requirement to report on carbon accounting includes project-based reporting, there is increasing need to identify suitable data sources that are robust, fit for purpose and accessible increases. Combining ALOS imagery with Landsat provides the potential input for finer level of reporting at sub-hectare levels. Remote sensing provides a cost-efficient method for providing the inputs required for carbon accounting, particularly in relation to change over time. The NCAS approach considers the principles of a remotely sensed approach to be “physically measurable, transparent and visible, contributing to continuous improvement, to progressively reduce uncertainty, to provide input to sensitive analysis and to be both top-down and bottom-up” (DCC, 2008). Geoimage can work with both approaches and is actively involved in the current NCAS program. As part of a program of continuous improvement combining ALOS imagery with Landsat could potentially provide input for validation and verification at sub-hectare levels
On a more general scale, satellite imagery, with adequate spatial and spectral resolution, can provide a sound basis for the reporting of both extent and community condition. Using ALOS AVNIR imagery pan-sharpened with ALOS PRISM imagery, coverage of large areas can be rapidly collected and processed to highlight variability within forest stands. At a scale of 1:100,000, this data source can be used to map land cover and with additional information be used to generate land use mapping products. Reporting on regional scale forest inventory can be undertaken using multiple dates of this enhanced product, providing a detailed map source for changes in forest coverage over time.
Forest management is required for a multitude of reasons, not least being the management of forest fuel loads prior to bushfire season, the to review the regeneration of forests after bushfire and the mapping of spatial variations in overstoreys. Typically, Landsat imagery has been used to map such variability, but through the pan-sharpening with PRISM imagery, an improved level of discrimination may be possible, either through maintaining the spectral content from Landsat, or through the adoption of AVNIR spectal content at 10m resolution.
LITTLE SWANPORT 1:100 000 Sheet TasmaniaPRISM sharpened Landsat 5 B741 © JAXA/RESTEC
Example of the individual scenes needed to cover the LITTLE SWANPORT 1:100 00 Sheet. There are 2 wide Mode2 nadir PRISM scenes collected on 15 November 2009 in blue and one AVNIR-2 scene in green, collected on the same date. The area falls within Landsat scene 90/89 and the Landsat 5 scene used was collected on 04 May 2007 (outline not shown).

Examples of ALOS image mosaics, LITTLE SWANPORT 1:100 000 Sheet Tasmania at 1:25 000 scale. Mt Tooms area. Image A. ALOS PRISM at 2.5m resolution. Image B. ALOS AVNIR 10m natural colour image. Image C. ALOS AVNIR 10m natural colour image pan-sharpened with ALOS PRISM. Image D. Landsat 5 30m multispectral imagery Bands 741 in RGB pan-sharpened with ALOS PRISM. All ALOS images © JAXA/RESTEC
A B
C D