acquisition guidelines for digital imagery and...
TRANSCRIPT

ACQUISITION GUIDELINES FOR DIGITAL IMAGERY AND TERRAIN DATA
FOR THE SAN DIEGO REGION
December 2003
Prepared by The Imagery Subcommittee of
The San Diego Regional GIS Council


i
TABLE OF CONTENTS INTRODUCTION...........................................................................................................................................IV GUIDELINES ..................................................................................................................................................3
I. Purpose and Goals ............................................................................................................................3 A. Statement of Purpose ............................................................................................................3
B. Goals .......................................................................................................................................3
C. Benefits ...................................................................................................................................3
D. Disclaimers ..............................................................................................................................4
II. Background on Previous Image Acquisition projects .....................................................................5 III. Roles and Responsibilities of an Acquisition Partnership ..............................................................6
A. Project Organization..............................................................................................................6
B. Forming the Partnership........................................................................................................6
C. Consultant Selection Process .................................................................................................7
D. Manage Imagery Consultant (Lead Agency(s) or Third Party)............................................8
E. Perform QA/QC.......................................................................................................................9
F. Distribute Data to Partners .................................................................................................10
G. Distribute Data to Non-Partners .........................................................................................10
H. Use of a Third Party Consultant for Project Oversight ......................................................11
DIGITAL IMAGERY ACQUISITION GUIDELINES.........................................................................................15 I. Plan A: Regional Scale Imagery.....................................................................................................15
A. Specifications........................................................................................................................17
1. Spectral Resolution: .............................................................................................................17
2. Spatial Resolution: ...............................................................................................................17
3. Temporal Resolution (Frequency of Updates): ..................................................................18
4. Temporal Resolution (Seasonal/Time of Day): ...................................................................18
5. Positional or Spatial Accuracy: ............................................................................................18
6. Radiometric or Color Balancing: .........................................................................................19

ii
7. Coordinate System: ..............................................................................................................19
8. Metadata: .............................................................................................................................20
9. Distribution/Licensing: .........................................................................................................20
10. Compression: ........................................................................................................................21
11. Horizontal and Vertical Control:.........................................................................................21
II. Plan B: Subregional Scale Imagery................................................................................................23 A. Specifications........................................................................................................................25
1. Spectral Resolution: .............................................................................................................25
2. Spatial Resolution: ...............................................................................................................25
3. Temporal Resolution (Frequency of Updates): ..................................................................26
4. Temporal Resolution (Seasonal/Time of Day): ...................................................................26
5. Positional or Spatial Accuracy: ............................................................................................26
6. Radiometric or Color Balancing: .........................................................................................27
7. Coordinate System: ..............................................................................................................27
8. Metadata: .............................................................................................................................28
9. Distribution/Licensing: .........................................................................................................28
10. Compression: ........................................................................................................................29
11. Horizontal and Vertical Control:.........................................................................................29
III. Plan C: Supplemental Imagery ......................................................................................................31 TERRAIN DATA ACQUISITION AND MANAGEMENT GUIDELINES ..........................................................35 APPENDIX A: HISTORICAL IMAGE ACQUISITION PROJECTS...................................................................43
I. 1992 Black and White Orthophotography – 6 inch resolution....................................................43
II. 1995 SPOT Satellite Imagery – 10 and 20-meter resolution.........................................................43
III. 1994/1995 USGS Black and White Digital Orthophoto Quarter Quads (DOQQ) –
3-foot resolution............................................................................................................................43 IV. 1996/1997 USGS Color Infrared (CIR) Digital Orthophoto Quarter Quads (DOQQ) –
3-foot resolution............................................................................................................................44
V. 1999 Black and White Orthophotography – 6 inch resolution....................................................44 VI. 2000 CIR Digital Imagery – 2-foot resolution................................................................................44 VII. 2001 True color Subregional Imagery – 6 inch resolution ...........................................................45
APPENDIX B: REFERENCES........................................................................................................................49 APPENDIX C: DEFINITIONS AND ACRONYMNS.......................................................................................53

iii
LIST OF TABLES
Table 1: Historical Regional Imagery Acquisition Projects.....................................................................16. Table 2: Historical Subregional Imagery Acquisition Projects ...............................................................24. Table 3: Historical Subregional Terrain Data Inventory.........................................................................37. Disclaimer The authors, the San Diego Regional GIS Council, or the imagery subcommittee assume no responsibility for the interpretation or application of the information by the readers of this document. The use of trade names and identification of firms or corporations is for the convenience of the reader; such use does not constitute an official endorsement of any product or service to the exclusion of others that may be suitable.

iv
INTRODUCTION
Member agencies of the San Diego Regional GIS Council have a continuing requirement to acquire updated digital imagery and terrain data. The high acquisition costs and complexity of these projects have led to the formation of image acquisition partnerships between Council members. After considering the lessons learned from these acquisition partnerships, the Council formed the Imagery Subcommittee to address the need for regional coordination and to define actions that will facilitate a cooperative approach to future imagery and terrain data acquisitions. The purpose of the Acquisition Guidelines for Digital Imagery and Terrain Data for the San Diego region is to provide guidance on the issues and complexities related to imagery acquisitions and to suggest a framework, schedule, and budget process for future coordinated imagery and terrain data acquisition projects among local agencies in the San Diego region. In addition, this document describes the benefits of coordinated, multi-agency acquisition projects; documents typical issues that need to be considered when acquiring digital imagery or terrain data; outlines the major tasks associated with successful imagery acquisition projects; and provides a history of regional and subregional imagery acquisitions to date. The San Diego Regional GIS Council strongly encourages local agencies to consider adopting this document and its proposed schedule for updating these data. Adoption of this document will assist in the planning and budgeting for future image acquisitions and lead to more coordinated, systematic approaches to obtaining up-to-date imagery. The Council anticipates that this document will be dynamic and updated after each coordinated, multi-agency imagery or terrain acquisition project or as needed.

GUIDELINES


3
GUIDELINES
I. PURPOSE AND GOALS
A. Statement of Purpose
The purpose of the Acquisition Guidelines for Digital Imagery and Terrain Data for the San Diego region is to provide a framework for coordinating imagery and terrain data acquisition projects, to facilitate procurement of digital imagery products which best meet the needs of regional and local agencies, and to facilitate and promote sharing of digital imagery between multiple agencies in the San Diego region.
B. Goals
• To reduce individual agency acquisition costs for digital imagery and terrain data by sharing workload and costs.
• To reduce data redundancy by promoting local, state, and federal cooperatives and partnerships.
• To promote regional coordination by sharing information, methods, and data related to digital imagery and terrain models.
• To standardize the process for acquiring imagery and for generating terrain data.
• To provide a common set of terms and standards related to digital imagery and terrain data.
• To provide a tentative schedule for digital imagery and terrain data acquisitions for planning and budgeting purposes.
• To provide a historical account of cooperative efforts for obtaining digital imagery and terrain data.
C. Benefits
• Partnerships and pooling of funds allow for economies of scale to be realized while lowering the cost to individual agencies.

4
• Partnerships and pooling of resources may allow for digital imagery to be obtained on a more frequent basis; thereby providing more current, up-to-date imagery to support homeland security, natural disasters, and other emergency efforts.
• Image acquisition projects that are cost prohibitive for one agency may be feasible through the use of partnerships.
• Without partnerships and pooling of funds, many image acquisition projects may not occur.
• In general, partnerships and pooling of funds and resources allow for higher resolution data and a broader area of coverage to be obtained, thereby making the data more useful to more agencies and a wider variety of applications and increasing the analysis area available for individual agencies.
• Image acquisition tasks, such as research, procurement, evaluation of imagery products, and distribution of final products, can be shared among partnering agencies thereby reducing the burden to any single agency.
• The interagency collaboration of partnerships provides for a broader use and acceptance of the imagery and promotes data sharing between agencies.
• A greater understanding of terminology, concepts, and acquisition procedures for imagery and terrain data will lead to a greater appreciation of the activities related to successful image acquisition projects, and will reduce the time required to educate, discuss, and plan for future image acquisition projects.
• A greater understanding of the past history and future direction of regional and subregional imagery and terrain data acquisition requirements will provide agencies with information to educate their staff and to facilitate financing strategies for future acquisitions.
D. Disclaimers
Acceptance of the Acquisition Guidelines for Digital Imagery and Terrain Data for the San Diego region is acknowledged by completing a letter of support or commitment. This letter signifies an informal commitment to partake in upcoming partnership acquisitions. It is not intended to be binding nor does it financially obligate any participating agency. Since each agency cannot assure future funding to such an acquisition program, it is impractical to require financial commitments at this time. However, understanding the level of intent will provide benefits to individual agencies. Specifically, individual agencies will be able to more realistically plan and budget for future acquisitions of imagery and terrain data. Participation doesn’t preclude individual agencies from acquiring digital imagery or terrain data via their own partnerships and/or internal methods. However, each multi-agency image acquisition partnership will require a formal letter of commitment or some formal agreement at some point in the project in order to ensure a successful partnership and successful completion of the project (see Section III for more details on project partnerships).

5
II. BACKGROUND ON PREVIOUS IMAGE ACQUISITION PROJECTS
It is generally cost prohibitive for a single agency to acquire high to very-high spatial resolution (5-meter to ½-foot) digital imagery to cover large areas or the entire San Diego region. Therefore, multi-agency partnerships are essential to funding large-scale image acquisition projects. In addition to cost savings, partnering to acquire digital imagery for an area as large as the San Diego region usually allows a higher resolution product and broader area of coverage to be obtained.
As the knowledge and use of digital imagery in the region has grown and become more sophisticated, the demand for more frequent, timely, higher resolution, and higher accuracy products have increased. In addition, there are now more competitive sources from which to obtain digital imagery. These sources include: satellites (which are making higher resolution image products more readily available); conventional capture by analog film and subsequent conversion to digital products; and more recently, image capture via digital cameras or imaging radiometers (e.g., scanners) flown on low altitude aircraft. Any high to very-high resolution image acquisition project for the region will be expensive. Costs increase significantly as spatial resolution and accuracy requirements increase.
Cooperative acquisition of digital imagery in the San Diego region began in the mid 1990s with a partnership formed to fund the acquisition of SPOT satellite imagery for use in updating land use vector databases. Partnerships to acquire the USGS DOQQs focused on providing local funding to obtain complete regionwide coverage and/or to create value added image products useful to the partnering agencies and local GIS community. Usable DOQQ imagery products were sometimes provided to the local GIS community two years after the date of image capture.
With the exception of the year 2000 CIR digital imagery partnership; historical regional imagery acquisition projects have not represented the true costs to acquire broad-scale regional imagery. This is generally because we formed partnerships to acquire existing imagery and did not pay for the acquisition and digitization components of image acquisition projects or for the project administration and overhead. In addition, the agency responsible for taking the lead role was not reimbursed for managing these partnerships. The resources required to lead a successful partnership are significant and include partnership outreach, writing Requests for Proposals (RFP), managing consultants, evaluating and proofing imagery products, determining fair pricing structures, invoicing, and distributing final products to the partners (see Section III for more details on specifics concerning an acquisition partnership).
Appendix A provides more details on each of the historical image acquisition projects.

6
III. ROLES AND RESPONSIBILITIES OF AN ACQUISITION PARTNERSHIP
A. Project Organization
Each acquisition project is unique, will require a lead agency or champion, and should be managed by a project team. The lead agency will most likely be the agency that is in need of a particular image product, and will most likely be the prime point of contact for the partnership and the contractor. The project team will be comprised of some or all of the partnering agencies and will assist in defining the specifications for the imagery; the methodology for the project; the roles and responsibilities of the lead agency and partners; and oversee the entire image acquisition project. It is expected that all partners will share an equitable portion of the project administration costs, although one or more agencies may function as the lead and be responsible for many of the tasks. Listed below are the typical tasks required for an acquisition project. The ordering of these tasks may differ for each image acquisition project.
B. Forming the Partnership
Partnership Outreach - The project team will prepare a written description of the image product (formal memo, letter, or email) and/or describe the desired imagery at a meeting(s). It is a good idea to have the image specifications in writing so that there are no misunderstandings about the image products being proposed and solicited for partnership. The project team will solicit responses in an effort to determine the level of interest, the scope of the project, and an approximate budget for the project. In addition to defining their imagery needs, the project team should also determine the needs of other agencies to see if the imagery product can be modified to be more useful to a larger number of agencies. It is a good idea to reach out to local, state, and federal agencies, and, if appropriate, universities, community colleges, utilities, and private firms. This phase may require several iterations over a period of a few months.
Formalize and Finalize the Partnership - Once the scope of the project and image products have been defined through the outreach effort, the partnership between the agencies needs to be formalized and finalized. At this point, the project team needs to have a fairly solid budget for the project, firm commitments from potential partnering agencies, and a plan on how cost will be split between participating agencies. Per-agency costs should be equitable based upon area of coverage required and simple to implement. Agencies may be able to participate in the partnership by contributing in-kind services in lieu of a monetary contribution. Additionally, the roles and responsibilities of each agency in the project team and partnership should be clearly identified. Formalization of the partnership can be handled through a Memorandum of Understanding that requests a funding commitment from each agency.
Obtain Funding Commitments and Identify Per Agency Costs - The last step in establishing the partnership is to get a standardized formal letter of commitment for funding from each

7
participating agency. The letter should come from a person that has budgetary discretion and should have some level of legal standing. If any agency decides not to participate at this point in the process, the per-agency costs of the remaining agencies will increase and the costs will need to be restructured. In addition to finalizing and legalizing the cost commitments, this document also can serve as a mechanism to describe the final image products that each partnering agency will receive. This will help ensure that there are no surprises to the partnering agencies at the end of the project.
C. Consultant Selection Process
The project team will draft a Request for Proposal (RFP) for the desired image acquisition project. The RFP should contain as much detail as possible on the desired specifications of the imagery (type, resolution, positional accuracy, area of coverage, etc.) and the scope of the project. The project team will assist in reviewing the RFP and proposals and selecting the final contractor/consultant. Below are some of the topics that should be considered when drafting an RFP.
Define Image Specifications
Defining the specifications of the desired imagery is an important step. They should include image type (panchromatic, true color, color infrared), image resolution, positional accuracy requirements, desired rectification (true orthos or simple rectification), and coordinate system. They should also define requirements for color/radiometric balancing, mosaicking, desired compression scheme, and acceptable compression ratios. In addition, the project team may want to specify the type of image acquisition method (conventional aerial camera, digital cameras/sensors or satellite remote sensors); describe the types of uses for which the imagery will be used; and if it is important to the project, the optimal time of year for image capture. This may help potential proposers better understand the image acquisition project and end user needs and assist them in recommending a particular type of image product.
Define Quality Assurance and Quality Control Procedures (QA/QC)
A QA/QC plan needs to be fully described, documented, and followed throughout the project. The plan should contain a schedule, the responsibilities for QA/QC by the contractor and the project team, the scale at which reviews will take place, and minimum standards that the contractor must meet. The imagery partners also must fully understand and agree to the QA/QC standards so that they are aware of the acceptable limitations/artifacts that may be contained in the final image products. The QA/QC plan establishes the expectations for the project and can be the difference between what is perceived as a good or a poor imagery product. Everyone involved must fully understand these expectations.
Define the Final Image Products to be Delivered to the Partners
The imagery products to be delivered to the lead agency and ultimately to the partnering agencies must be clearly defined. This includes defining the issues described

8
previously in the image specification section; as well as technical specifications defining the final image products partnering agencies will receive. These include whether the final image products will be compressed, the desired compression scheme, the tiling structure, what area of coverage each agency will receive, and the delivery media.
Project and Product Metadata
Complete metadata on the project and imagery products should also be specified in the RFP as a deliverable at the end of the project. The project metadata should consist of documentation on the specific procedures followed on the project, including imagery creation, rectification, and QA/QC procedures. The metadata should also include documentation on the positional accuracy of the imagery, the method used to derive the accuracy measures, and a discussion of any known issues or limitations to the imagery.
Define Licensing Structure
The partners must consider what type of licensing structure is acceptable. The terms of ownership and distribution rights must also be established. All partners must fully understand these rights and adhere to them. Many times a licensing structure is suggested in the contractor’s proposal or can be negotiated during the contract award.
Select an Imagery Consultant
The project team should independently review and rank the proposals that best fit the needs of the imagery project. The project team should discuss all proposals with greater emphasis focused on the most qualified proposals and a determination should be made as to which proposal is most suitable for the project.
Award a Contract
Once all the firms have been notified, contract negotiations begin with the winning firm. If an agreement cannot be reached with this firm, then the next firm should be contacted according to the rankings by the partnership.
D. Manage Imagery Consultant (Lead Agency(s) or Third Party)
In order to receive a high quality and timely product, it is critical that the consultant be properly monitored. It is suggested that regular communication with the contractor be established and maintained. Biweekly or monthly progress reports from the contractor are a good way to accomplish this. Progress reports provide information on what has been accomplished; identifies whether the project is on, ahead, or behind schedule and the reasons why; and if there are any upcoming resources or information required from the lead agency or project team.
Delays in imagery acquisition from aerial or satellite sources can be expected due to the weather. Although San Diego is known for its great weather, coastal haze, high clouds, or

9
thunderheads in the mountains can delay the image acquisition and therefore the entire project schedule. The lead agency needs to work with the vendor to ensure that they are ready to go when the weather is suitable. This will be slightly more difficult with satellite imagery.
Once the imagery is acquired it is a good idea to conduct a pilot project for a small area. For the pilot, the contractor should provide a sample of the raw imagery and a representation of what the final image deliverable will be. This should include georeferenced, rectified, mosaicked, and color balanced imagery for the pilot area; as well as samples of compressed imagery at various compression ratios (if final image products are to be delivered in a compressed format). This allows the contractor and the project team to have a mutual understanding of what is expected for the final image products and allows the contractor to identify and address any concerns up front. In addition, the resultant imagery from the pilot project can be provided to the partners in order for them to have a firm understanding of what to expect. In the case of a regional project, it is beneficial to pick additional pilot areas that cover different urban and environmental regimes.
For each milestone in the project, the contractor should provide a short report that summarizes work completed for that portion of the project. The reports should identify problems encountered, solutions for overcoming them, and modified timelines for completing the remaining steps of the project (if necessary). The lead agency or project team should sign off on these milestones so that the contractor knows they are heading in the right direction.
Additionally, it is the responsibility of the lead agency or project team to pass along pertinent information, such as delays, product adjustments, and samples to the other partners. It is in the best interest of the project team not to surprise any of the partners with products that they were not expecting.
E. Perform QA/QC
As previously stated, the QA/QC plan sets out the expectations for the project and can define the difference between what is perceived as a good or a poor project. The QA/QC procedures outlined in the contract should be followed by both the contractor and the agencies involved in the review process. This means that reviewing agencies should not critique the imagery at a scale larger than specified in the contract, nor should they expect the contractor to correct issues unless they are outside contractually agreed upon tolerances. Image attributes that should be of concern to the reviewing agencies conducting QA/QC analysis include: overall color consistency, uniform image brightness, tile-to-tile color balancing, image hot spots, vignetting, and feature matching along frame edges.
It is a good idea to ensure that the contractor has done their required QA/QC process before providing the images to the project team for review. Hopefully, the contractor will catch many of the errors before the client ever sees the product. There may be artifacts in the final imagery that the contractor may not be able to fix which are within the acceptable tolerances defined for the project. For example: recent cut and fill or landscape grading operations that are not reflected in the terrain model may cause roads to have a wavy appearance; bridges
10
along mosaic seamlines may not line up because their height is not recorded in the terrain model; or the vignetting is so strong on some images that they cannot be totally eliminated. In these and other cases, the project team will have to negotiate with the contractor on what can and cannot be fixed within the scope of the contract. This can be a very contentious time during the contract and emphasizes the necessity for a good, agreed upon QA/QC plan to be established early on in the project.
F. Distribute Data to Partners
Although this sounds like an easy part of the project, it takes a bit of up-front planning so that an undue burden is not placed on the lead agency(s). Depending on the size of the project, the final image products can be tens to hundreds of gigabytes of data. For regional projects, it is best to distribute images in a compressed format, such as MrSID or ECW, which can significantly reduce image file size by 80 percent or more.
Decisions also need to be made on a simple, easy to implement, tiling structure for compression and distribution to partnering agencies. These tiling systems can be defined as standard windows, jurisdictional or other geographic boundaries, or unique user-defined areas. In addition, system file size limitations need to be considered when defining the tiling structure. The project partners should be consulted on where the splits are made. Additionally, an acceptable common standard data transfer media needs to be found that will work for all partners. It is unlikely that a common tape format can be found amongst the partners. At present, the DVD is probably the most universal electronic medium in which to distribute imagery.
The lead agency(s) might consider including a provision in the contract making the contractor responsible for distributing the data to the partners. This is an especially good idea if the partners desire individual image tiles or unique user-defined compressed images. Writing large amounts of data to tape can consume significant amounts of both time and network resources.
G. Distribute Data to Non-Partners
It is very important for the partners to set up and agree on a pricing structure and policies for distributing the data to other agencies not involved in the partnership. Typically, inquiries about obtaining the imagery follow soon after product distribution to the partners. Historically, many of these inquires have come from agencies that were included in the outreach efforts but did not participate in the final partnership.
There are many options related to distributing the image products to non-partners. Some of these are listed below.
• The lead agency, project team, or partners could decide to have the contractor hold the licensing and resale rights to the imagery;

11
• The lead agency or one or more members of the partnership could be responsible for distributing the imagery to non-partners by inviting others to join the partnership after the fact, paying equivalent costs incurred by partnering agencies;
• The lead agency or one or more members of the partnership could distribute the imagery for the cost of time and materials; or
• The lead agency or one or more members of the partnership could distribute the imagery free of charge.
Each option has advantages and disadvantages. For example, having the contractor hold the licensing and resale rights to the imagery might be an easy solution to absolve any one agency from the responsibilities of distributing the imagery after the project is completed. Inquiries can simply be referred to the contractor. However, this method can severely limit the partnership’s ability to distribute the data, and may add an additional cost to the project since some contracting firms may lower the price for the initial image acquisition it if can profit from future sales of the licensed imagery.
The lead agency or partnership can hold the license to the imagery and take on the responsibility to distribute the data by charging a partnership fee to those who come in after the fact. The agency can use those additional fees to help support the next imagery purchase, cover some of its cost for leading the project, or distribute them back to the partnering agencies. Distributing the imagery for the cost of time and materials requires time by the lead agency to figure out what is needed for each request and to determine a common, efficient delivery medium. Distributing the imagery free of charge over an internet imagery server may be appropriate, but would require the lead agency to invest in the appropriate hardware and software. Methods to distribute the imagery free of charge or for time and materials do not encourage agencies to join future partnerships since they know they will be able to acquire the data at a later date for little or no cost.
H. Use of a Third Party Consultant for Project Oversight
The partnership may want to consider hiring a third party consultant to manage some or all of the tasks listed above. In this situation, the project team would put out an RFP for an image acquisition project manager. Desirable qualifications include: an intimate knowledge of the different types of available imagery; knowledge of the image processing techniques necessary to create high quality image products; good communication skills; proven QA/QC skills; and proven project management skills.
The use of a third party consultant is useful if there are insufficient resources or knowledge locally to undertake a particular image acquisition project. The third party consultant can work with the project team to establish a partnership, educate the partnership about the types of imagery available, narrow down what types of imagery will work for a majority of the partners’ applications, and identify what companies would be best to solicit. They can be responsible for drafting an RFP, managing the entire project, QA/QC of the imagery products, and for distributing the imagery to the partners after the project is complete. Using a third

12
party consultant reduces the burdens on the lead agency and project team but may increase the total cost of the project.

DIGITAL IMAGERY ACQUISITION GUIDELINES


15
DIGITAL IMAGERY ACQUISITION GUIDELINES
Historically multi-agency digital imagery acquisition partnerships have acquired digital imagery with the same spatial resolution across the entire project area. However, it is feasible to form multi-agency digital imagery partnerships to acquire multiple resolution image products. These types of partnerships would specify higher spatial resolution imagery for urbanized areas and lower resolution imagery for non-urban areas. Spatial resolution and accuracy requirements are generally different for regional and subregional scale digital imagery. The following sections describe issues to be considered when obtaining regional and subregional scale digital imagery.
I. PLAN A: REGIONAL SCALE IMAGERY
Generally, most regional agencies in San Diego now require medium to high spatial resolution imagery to support their work efforts and they usually require imagery that covers the entire 4300+ square miles of the region (and sometimes areas outside of or adjacent to the region). These medium to high-resolution image products range from the Spot 10-meter satellite imagery to the high resolution 1-meter USGS DOQQ image products. Although regional agencies may require lower resolution imagery than subregional agencies, the need for regionwide coverage tends to make the higher-end resolution image acquisition projects costly. Therefore, image acquisition partnerships are essential in reducing the per-agency costs. The extent of inter-agency cooperation will vary based upon the imagery requirements of each agency and budget limitations; but as more agencies are made aware of these specifications and suggested timeframes, agencies can plan for cooperative image acquisition projects. This section describes the specifications that agencies should consider when obtaining regional scale imagery.
Table 1 provides a brief summary of the historical regional image acquisition projects, costs, and partnerships. Appendix A describes and provides more details on the past regional image acquisition projects and partnerships.

16
Table 1. Historical Regional Imagery Acquisition Projects
General descripton of Project Imagery Specs Cost
Date Coverage Square Miles Type
Resolu-tion Accuracy Compression
Total Project Cost
# of Partners
Cost Per Partner
Cost per Sq Mi.
1995
San Diego Region &Tijuana River Watershed 5,500 Pan & XS
10m Pan & 20m XS 1:24,000 NMAS No 67,000$ 5 $ 13,500 12.00$
A 1997San Diego Region 4,355 Pan 3-foot 1:12,000 NMAS Yes, MrSID 115,000$ 30
$2,000 or $10,000 26.00$
B 1999San Diego Region 4,355 CIR 3-foot 1:12,000 NMAS Yes, MrSID 55,000$ 30
$2,000 or $4,300 13.00$
C 2000San Diego Region 4,355 CIR 2-foot 1:12,000 NMAS Yes, MrSID 113,000$ 30
$2,000 or $10,000 26.00$
Notes: All costs are for contractor costs only and do not include costs for the RFP process for consultant selection, QA/QCof imagery, project mangement, or project implementation. In addition, all of these image aqusition projects were basedon imagery captured by convential aerial cameras, with the exception of the 1995 project which was based on SPOT satelliteimagery
Footnotes:A Imagery acquired was 1994/96 panchromatic USGS DOQQs. For this project, the partnership also funded part of the acquisition costs, as well as the costs to create value added image products to make the imagery useable by local agencies in San Diego. Value added image processing includes reprojection to State Plane Coordinates, resampling pixels from 1 meter to 3-foot, color balancing, and image compression.
B Imagery acquired was 1996/97 color infra-red USGS DOQQs. This project only funded the cost of creating value-added image products.
C First Imagery acquisition project for the region funded from scratch. Costs incurred by partnering agencies for this project do not represent the true costs of a project of this magnitude. Consultant chosen to do this work did not completely appreciate the complexity of the project in San Diego and underbid the project cost, and SANDAG was not funded for the time and effort to lead the project.

17
A. Specifications
The specifications described below are guidelines and may vary depending on individual project needs. These specifications are based on past imagery acquisition projects and informal conversations with regional agencies. To date most regional agencies have used digital imagery as a back drop to assist with visual interpretations in updating land cover, vegetation, transportation, and other vector databases by displaying vector data layers contained within a Geographic Information Systems (GIS) database on top of the imagery. Most of the regional image acquisition partnerships focused on obtaining digital imagery captured from traditional aerial cameras rather than digital cameras or sensors.
Imagery captured with digital cameras or sensors can provide multi-spectral information. Multi-spectral imagery contains light reflectance captured from different wavelengths of the electromagnetic spectrum. This information can be used for both visual interpretation as well as automated image processing routines to extract and classify information obtained from the sensors. Automatic feature extraction and classification routines have not been used much in the region because they tend to yield coarser results than what is currently being maintained or desired. But these methods have proven cost effective in generating data from scratch over large areas. In order to maintain the vector databases to the level of detail required by regional agencies, visual interpretation is still the preferred methodology. Visual interpretation techniques generally require higher resolution imagery because human interpreters rely on context, pattern, and knowledge of the area, and less on the variation of reflectance values of the multi-spectral imagery.
1. Spectral Resolution:
Desired: Color infrared (CIR) or true color.
Discussion: Regional agencies generally prefer color infrared or true color imagery over panchromatic (black and white) because these products contain more information (both visually and spectrally) than panchromatic and therefore support a wider variety of applications and uses.
2. Spatial Resolution:
Desired: 2 to 3-foot is preferred.
Discussion: Two to three-foot resolution is desirable, but costly, and the cost may affect how often these data are updated. Regional agencies can generally use imagery coarser than 3-foot for most of their needs.

18
3. Temporal Resolution (Frequency of Updates):
Desired: 3 to 5 years.
Discussion: Because of the cost and work effort associated with obtaining regional scale imagery, most agencies may only be able to support updating the imagery every 5 to 10 years. Coarser resolution imagery or supplemental image products (described under Section III, Plan C: Supplemental Imagery) could be used in interim years.
4. Temporal Specifications (Season/Time of Day):
Desired: Generally between the months of March and October, and between the hours of 10 am and 2 pm local solar time.
Discussion: Seasonality and time of day of image capture affect image quality. Generally, the time of year and time of day where shadows are the longest should be avoided. In addition, In San Diego, spring/summer acquisitions are desirable for discriminating vegetation types but persistent coastal fog poses problems during these months. Imagery captured during the fall season can also be problematic in that the natural vegetation is typically dry; thereby reducing contrast between the natural features.
5. Positional or Spatial Accuracy:
Desired: Every image product/deliverable should contain information on its positional or spatial accuracy and how it was measured as part of its metadata. For regional scale digital imagery, generally accuracies between ± 33 to ± 50 feet are acceptable.
Discussion: There are many different ways to specify spatial accuracy for orthophotography and many methods to define, calculate, and measure positional accuracy. The National Map Accuracy Standards (NMAS), the American Society for Photogrammetry and Remote Sensing (ASPRS), and the National Standard for Spatial Data Accuracy (NSSDA) are ways to describe positional accuracy. The NMAS and ASPRS methods have been used for years. The NSSDA is a new method that was developed in 1998 by the Federal Geographic Data Committee (FGDC). Although the NSSDA has not been used in the San Diego region to date, it may be utilized more in the future to specify accuracy requirements for digital imagery as more agencies adopt FGDC guidelines. Root Mean Square Error (RMSE) and Circular Error (CE) are standard methods used for determining or measuring the positional

19
accuracy of digital image products. See Appendix C for more information on these accuracy measures.
6. Radiometric or Color Balancing:
Desired: Radiometric or color balanced across the entire project area.
Discussion: Most agencies want imagery (even panchromatic) radiometrically or color balanced across the project area. Since the San Diego region is so large and varied (oceans, urbanized areas, mountains, and deserts) image acquisitions may span several days (depending upon the type of imagery) and be comprised of multiple tiles/scenes. Each tile will vary in tonal quality. This is true even for the lower resolution products. Tonal variation within and between frames occurs due to weather conditions, time of day, and to differential reflectance as a function of view angle and type of terrain. Color balancing normalizes the color and brightness within and between image frames. Imagery that is not color balanced across the project area has an unpleasing look when viewed over large areas and detracts from the value of the product.
Radiometric balancing is a time-consuming and difficult process. Imagery is usually balanced locally, with nearby photos, and globally, with all the photos. The balancing becomes more difficult as the number of photos increases, which is influenced by the spatial resolution and area of coverage. Furthermore, the result of the balancing process is subjective to the viewer and the scale at which the data is viewed.
7. Coordinate System:
Desired: State Plane Coordinate System for California, Zone VI, US Survey feet, datum NAD83.
Discussion: Nearly all regional and local agencies in the San Diego region use the California State Plane coordinate system (with the exception of some state and federal agencies). If a different coordinate system is desired for special purposes (typically to meet data requirements of state or federal agencies), most GIS software can project imagery to a new coordinate system (although this can be a significant task for higher resolution imagery due to the number and size of images involved).

20
8. Metadata:
Desired: Complete documentation.
Discussion: All new imagery should be accompanied by complete metadata. The metadata should specify the technical specifications of the data including: the date(s) of image acquisition, spectral resolution, spatial resolution, spatial accuracy, spatial extent, whether the imagery has been orthorectified or simply georectified, brief description of rectification process used, description of the QA/QC procedures used to evaluate the quality of the imagery, tiling scheme, compression scheme (if any), coordinate system, availability for redistribution, and contact information. Optional information may include camera or digital sensor specifications, and update schedule (if applicable).
9. Distribution/Licensing:
Desired: Each image acquisition partnership needs to define a distribution policy for the end products.
Discussion: Each partnership should consider the benefits and costs of licensing the imagery. Many companies are willing to lower the price of image acquisitions if the company can retain ownership and be permitted to resell the imagery to others. For some agencies, licensing the imagery relieves them of the need to redistribute the imagery in response to requests from non-partnering public agencies, private firms, and the public. Responding to such requests can consume many hours of work. Alternatively, other agencies have no problem with redistributing the imagery. They argue that the information is public and was obtained using public funds and should be made available to them. They also see that providing such data should result in a more informed citizenry and adds to the ability of private firms to compete successfully. A potential drawback to allowing free access to the imagery after the fact is that agencies may not partner to fund these image acquisition projects and these data may not get developed at all.

21
10. Compression:
Desired: Imagery in a compressed format that is compatible with leading GIS software packages.
Discussion: Most image acquisition projects for the region will involve large amounts of data (generally 50 – 200 gigabytes) depending upon spatial resolution and type of imagery (single band versus multi-band) and will require that the imagery be delivered in compressed format. One of the most important considerations for the agencies involved in the partnership is to agree on a tiling scheme, because it is not likely that a single, seamless image can be prepared for any area of consequence. Providing the raw uncompressed image tiles is problematic due to the large amount of data to be transferred and in finding an efficient common transfer/delivery medium.
Currently, several compression schemes are commonly used by local agencies in the San Diego region. These include the multi-resolution seamless image database (MrSID) from LizardTech and ECW from ER Mapper. However, this technology is rapidly changing and other formats are becoming available and may become more commonly used in the future. These include open source JPEG2000, ImageSTOR, and other proprietary compression schemes.
11. Horizontal and Vertical Control:
Desired: Use of surveyed ground control points or GPS coordinates in the image georeferencing and rectification processes.
Discussion: For most orthophotography projects, acquiring or re-using ground control and digital terrain models (DEMs, DTMs) will be required to achieve high degrees of horizontal and vertical accuracy. With the common practice of using airborne GPS units and on-board inertial systems during the time of image capture, no specific requirements or guidelines on the density of control points are used these days. In general, digital imagery with tight vertical specifications will require more control, but not the density of control points that have been typically used in the past. If ground control points are to be used accurately, the epoch date associated with the survey data must be established. If ground control points are used that were collected over an extended period of time, these data may need to be converted to the most current epoch. Computer programs exist that can convert

22
measurements with one epoch date to another. See the glossary for more discussion on epoch dates.

23
II. PLAN B: SUBREGIONAL SCALE IMAGERY
Most cities, water districts, and other smaller agencies in the San Diego region need to obtain higher spatial resolution imagery than will likely be obtained for the regional scale imagery acquisition projects and partnerships. These agencies can expect to benefit from substantial savings by cooperating with other agencies in acquiring subregional scale imagery. The extent of inter-agency cooperation will vary based on the imagery requirements and budgets of individual agencies. But as more agencies are made aware of these specifications and suggested timeframes, they can plan for cooperative image acquisition projects. This section describes the specifications that agencies should consider when obtaining subregional imagery.
Table 2 provides a brief summary of the historical subregional image acquisition projects.

Table 2. Historical Subregional Imagery Acquistion Projects
General Description of Project Imagery Specs Cost
Date Coverage# Square
Miles Type Resolution Accuracy CompressionTotal Project
Cost Cost/sq mi
Costs include
topo
E 1992 City of Escondido 90.00 Pan1- foot & 2-foot ???? No 150,000$ 1,667$
Yes, 2- & 5-foot
1992 City of San Diego 330.00 Pan 6-inch ???? No 1,232,820$ 3,736$ Yes, 2-foot
A 1994 City of Chula Vista 127.00 Pan 6-inchASPRS Class 1 for 1:1,200
(RMS 1-foot) No 572,128$ 4,505$ Yes, 2-foot
B 1999 City of San Diego 330.00 Pan 6-inch ???? ??? 425,371$ 1,289$ Yes, 2-foot
1999 Otay Water District 147.00 Pan6-inch & 1-foot ???? Yes, MrSID 187,450$ 1,275$ Yes, 5-foot
D 2001 City of Carlsbad 55.00 True color 6-inchASPRS Class 1 for 1:1,200
(RMS 1-foot) Yes, MrSID 137,043$ 2,492$ Yes, 2-foot
D 2001 City of Chula Vista 8.25 True color 6-inchASPRS Class 1 for 1:1,200
(RMS 1-foot) No 40,322$ 4,888$ Yes, 2-foot
D 2001 City of Encinitas 35.00 True color 6-inchASPRS Class 1 for 1:1,200
(RMS 1-foot) Yes, MrSID 86,905$ 2,483$ Yes, 2-foot
D 2001 City of Oceanside 42.00 True color 6-inchASPRS Class 1 for 1:1,200
(RMS 1-foot) Yes, MrSID 110,303$ 2,626$ Yes, 2-foot
D 2001 City of Coronado 7.80 True color 6-inchASPRS Class 1 for 1:1,200
(RMS 1-foot) Yes, MrSID 64,074$ 8,215$ Yes, 2-foot
D 2001 CWA 215.00 True color 6-inchASPRS Class 1 for 1:1,200
(RMS 1-foot) Yes, MrSID 599,000$ 2,786$ Yes, 2-foot
2002 City of Solana Beach 3.40 Pan 6-inch ???? jpeg ?? 26,365$ 7,754$ Yes, 4-foot
2003MCB Camp Pendleton & NWS Fallbrook 279.52 True color 6-inch 1:2,400 Yes, MrSID 190,579$ 682$ No
Footnotes:A Most of the City was done at 6-inch resolution with 2-foot contours, but some areas were done at 2-foot resolution with 10-foot contours.B Costs were lower than those incurred in 1992 because a new DEM was not created, only 15% was updated for this project.D These agencies all partnered under one RFP prepared by CWA, but each agency had separate contracts with the selected consultant.E Urbanized area (approximate 45 sq. miles) at 2-foot contours, outlying areas at 5-foot contours
Notes: All costs are for contractor costs only and do not include costs for the RFP process for consultant selection, QA/QC of imagery, projectmanagement, or project implementation. It is difficult to compare costs across these projects due to the nuances and variances between projects. The footnotes below attempt to describe unique factors of the image acquisition project.
25
A. Specifications
Many of the specifications described on the following pages are based on the consensus of agencies that responded to a survey of image acquisition needs conducted in 2002 by the Image Subcommittee of the San Diego Regional GIS Council. The minimum specification reflects what the respondents typically said would be acceptable. It should be noted that while survey respondents indicated a need and desire for high resolution, high accuracy digital imagery, the budgets allotted for these products were not sufficient. Some specifications listed below were not included in the survey and reflect current industry practice.
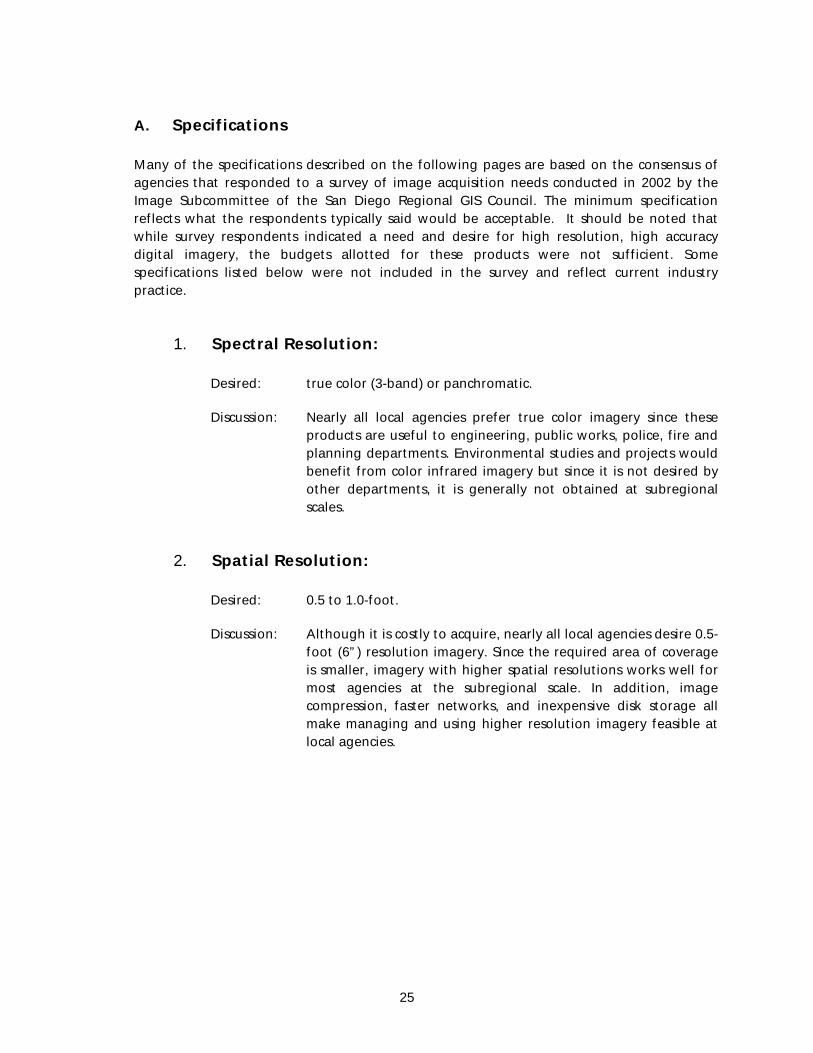
1. Spectral Resolution:
Desired: true color (3-band) or panchromatic.
Discussion: Nearly all local agencies prefer true color imagery since these products are useful to engineering, public works, police, fire and planning departments. Environmental studies and projects would benefit from color infrared imagery but since it is not desired by other departments, it is generally not obtained at subregional scales.
2. Spatial Resolution:
Desired: 0.5 to 1.0-foot.
Discussion: Although it is costly to acquire, nearly all local agencies desire 0.5-foot (6”) resolution imagery. Since the required area of coverage is smaller, imagery with higher spatial resolutions works well for most agencies at the subregional scale. In addition, image compression, faster networks, and inexpensive disk storage all make managing and using higher resolution imagery feasible at local agencies.
26
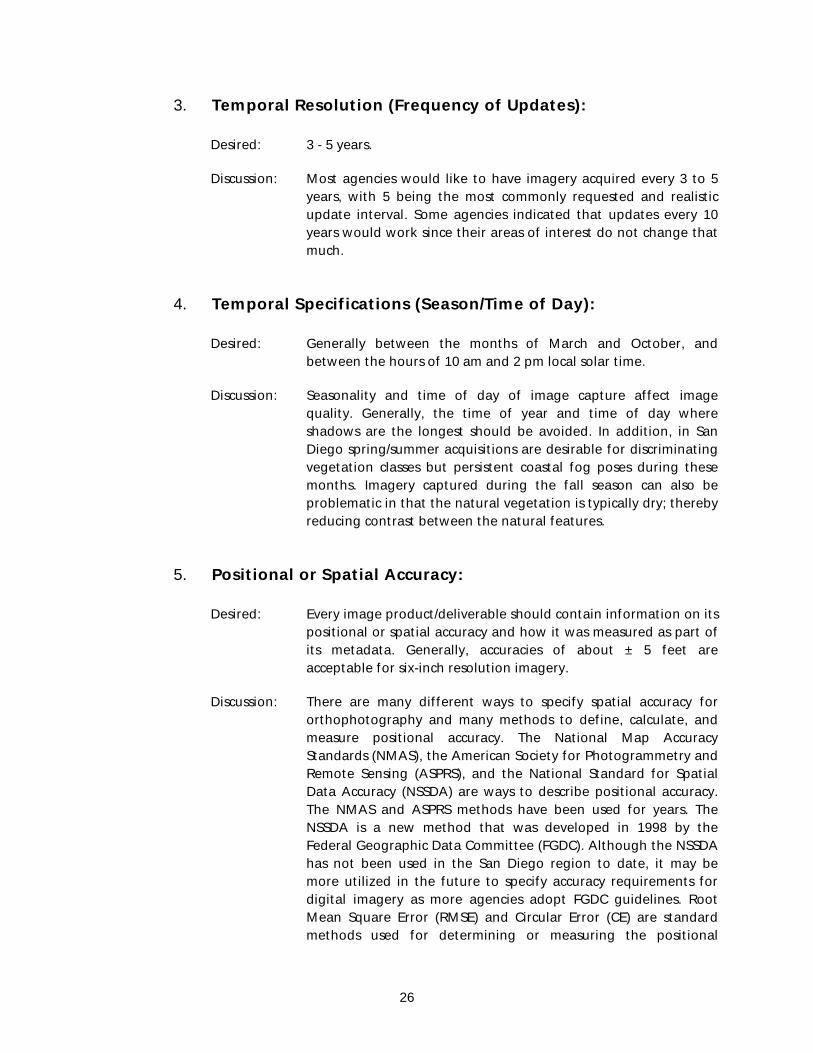
3. Temporal Resolution (Frequency of Updates):
Desired: 3 - 5 years.
Discussion: Most agencies would like to have imagery acquired every 3 to 5 years, with 5 being the most commonly requested and realistic update interval. Some agencies indicated that updates every 10 years would work since their areas of interest do not change that much.
4. Temporal Specifications (Season/Time of Day):
Desired: Generally between the months of March and October, and between the hours of 10 am and 2 pm local solar time.
Discussion: Seasonality and time of day of image capture affect image quality. Generally, the time of year and time of day where shadows are the longest should be avoided. In addition, in San Diego spring/summer acquisitions are desirable for discriminating vegetation classes but persistent coastal fog poses during these months. Imagery captured during the fall season can also be problematic in that the natural vegetation is typically dry; thereby reducing contrast between the natural features.
5. Positional or Spatial Accuracy:
Desired: Every image product/deliverable should contain information on its positional or spatial accuracy and how it was measured as part of its metadata. Generally, accuracies of about ± 5 feet are acceptable for six-inch resolution imagery.
Discussion: There are many different ways to specify spatial accuracy for orthophotography and many methods to define, calculate, and measure positional accuracy. The National Map Accuracy Standards (NMAS), the American Society for Photogrammetry and Remote Sensing (ASPRS), and the National Standard for Spatial Data Accuracy (NSSDA) are ways to describe positional accuracy. The NMAS and ASPRS methods have been used for years. The NSSDA is a new method that was developed in 1998 by the Federal Geographic Data Committee (FGDC). Although the NSSDA has not been used in the San Diego region to date, it may be more utilized in the future to specify accuracy requirements for digital imagery as more agencies adopt FGDC guidelines. Root Mean Square Error (RMSE) and Circular Error (CE) are standard methods used for determining or measuring the positional

27
accuracy of digital image products. See Appendix C for more information on these accuracy measures.
6. Radiometric or Color Balancing:
Desired: Radiometric or color balanced across the entire project area.
Discussion: Most agencies want imagery radiometrically or color balanced across the project area. Tonal variation within and between frames occurs due to the weather conditions, the time of day, and to differential reflectance as a function of view angle and type of terrain. Color balancing normalizes the color and brightness within and between image frames. Imagery that is not color balanced across the project area has an unpleasing look and detracts from the value of the product.
Radiometric balancing is a time-consuming and difficult process. Imagery is usually balanced locally, with nearby photos, and globally, with all the photos. The balancing becomes more difficult as the number of photos increases, which is influenced by the spatial resolution and area of coverage. Furthermore, the result of the balancing process is subjective to the viewer and the scale at which the data is viewed.
7. Coordinate System:
Desired: State Plane Coordinate System for California, Zone VI, US Survey feet, datum NAD83.
Discussion: Nearly all local agencies (except some state and federal agencies) in the San Diego region use the same coordinate system. If a different coordinate system is desired for special purposes (typically to meet data requirements of state or federal agencies), most GIS software can project imagery to a new coordinate system (although this can be a significant task for higher resolution imagery due to the number and size of images involved). If elevation data are to be obtained, most agencies specify that the NAVD 88 standard be followed. See the section on Terrain Data Acquisition and Management Guidelines for more information on digital terrain model requirements.

28
8. Metadata:
Desired: Complete documentation.
Discussion: All new imagery should be accompanied by complete metadata. The metadata should specify the date(s) of image acquisition and technical specifications of the data, including spectral and spatial resolutions, spatial accuracy, spatial extent of the image, whether the imagery has been orthorectified or simply georectified, brief description of rectification process used, description of the QA/QC process used to evaluate the quality of the imagery, tiling scheme, compression used (if any), coordinate system, availability for redistribution, and contact information. Optional information may include camera or digital sensor specifications and update schedule (if applicable).
9. Distribution/Licensing:
Desired: Each image acquisition partnership needs to define a distribution policy for the end products.
Discussion: Each agency should consider the benefits and costs of licensing the imagery. Many companies are willing to lower the price of image acquisitions if the company can retain ownership and be permitted to resell the imagery to others. For some agencies, licensing the imagery relieves them of the need to redistribute the imagery in response to requests from private firms and the public. Responding to such requests can consume many hours of work. Alternatively, other agencies have no problem with redistributing the imagery. They argue that the information is public and was obtained using public funds and should be made available to them. They also see that providing such data should result in a more informed citizenry and adds to the ability of private firms to compete successfully. A potential drawback to allowing free access to the imagery after the fact is that agencies may not partner to fund the creation and acquisition of these images and these data may not get developed at all.

29
10. Compression:
Desired: Imagery in a compressed format that is compatible with leading GIS software packages.
Discussion: Most subregional imagery acquisition projects will involve large amounts of data because of the higher resolutions usually required for subregional scale imagery and will most likely require that the imagery be delivered in compressed format. Some subregional image acquisition projects may wish to receive and distribute the tiled uncompressed imagery or compress the images in-house. The most important consideration for the agencies involved is to agree on a tiling scheme because it is not likely that a single, seamless image can be acquired for any area of consequence. Once the tiling scheme is agreed upon, then a determination regarding compression schemes can be made.
Currently, several compression schemes are used by local agencies in the San Diego region. These include the multi-resolution seamless image database (MrSID) from LizardTech and ECW from ER Mapper. However, this technology is rapidly changing and other formats are becoming available and may become more commonly used in the near future. These include open source JPEG2000, ImageSTOR, and other proprietary compression schemes.
11. Horizontal and Vertical Control:
Desired: Use of surveyed ground control points or GPS coordinates in the image georeferencing and rectification processes.
Discussion: For most orthophotography projects, acquiring or re-using ground control and digital terrain models (DEMs, DTMs) will be required to achieve high degrees of horizontal and vertical accuracy. With the common practice of using airborne GPS units and on-board inertial systems during the time of image capture, no specific requirements or guidelines on the density of control points are used these days. In general, digital imagery with tight vertical specifications will require more control, but not the density of control points that have been typically used in the past. If ground control points are to be used accurately, the epoch date associated with the survey data must be established. If ground control points are used that were collected over an extended period of time, these data may need to be converted to the most current epoch. Computer programs exist that can convert

30
measurements with one epoch date to another. See the glossary for more discussion on epoch dates.

31
III. PLAN C: SUPPLEMENTAL IMAGERY
Supplemental imagery refers to any imagery acquired without partnering with other agencies. Many agencies have unique needs for imagery, whether they are time dependent, product dependent, or project specific. Therefore, this document classifies any imagery obtained individually by a single agency as supplemental. The goal of this document, however, is to promote teaming and sharing of imagery.
Supplemental imagery can be used in interim years (the years between the ideal or scheduled acquisition timeframes) as a method to obtain a new ‘picture’ of the region. These supplemental image products tend to be available every year, have a quick turnaround between the dates of image capture and product delivery, and are relatively inexpensive. However, these products generally do not have a rigorous rectification process to provide the positional accuracy required by most agencies; do not contain rigorous color balancing procedures, although some products have been quite well balanced; do not provide regional coverage (but they do cover the faster growing areas of the region); and are packaged inside proprietary viewing software applications that do not directly integrate with GIS software packages used by local and regional agencies. In addition, the majority of this type of imagery is captured during the months of January and February when shadows are most noticeable.


TERRAIN DATA ACQUISITION AND MANAGEMENT GUIDELINES


35
TERRAIN DATA ACQUISITION AND MANAGEMENT GUIDELINES
A digital elevation model (DEM) is a digital file of raster data containing terrain elevations for ground positions at regularly spaced horizontal intervals. Digital terrain data can be created using a number of production methods including: manual profiling from photogrammetric stereo models; stereo model digitizing of contours; digitizing topographic map contour plates; converting hypsographic and hydrographic tagged vector files; performing autocorrelation via automated photogrammetric systems; and utilizing LIDAR and more recently interferometric synthetic aperture radar (ifSAR) remote sensing systems.
DEMs can be used to produce digital terrain models (DTMs) such as contours, breaklines, or triangulated irregular networks (TINs). They may also be used in the generation of three-dimensional graphics displaying terrain, slope, aspect (direction of slope), and terrain profiles between selected points. DEMs are essential in the production of digital orthophoto quadrangles (DOQs) to mathematically remove displacement caused by terrain relief, to enhance the visual information for data extraction and revision purposes, and to create aesthetically pleasing and dramatic hybrid digital images. DEMs also support non-graphic applications such as modeling terrain and gravity flows for use in the storm water/water runoff modeling, calculating the volume of proposed reservoirs, and determining landslide probability.
The San Diego region has two public domain regional scale DEMs: a 10-meter DEM generated by San Diego State University from the USGS 1:24,000 scale 7.5 minute topographic map contours, and the USGS 30-meter DEM. Both of these data sets were derived from USGS topographic information that is over 30 years old for the San Diego area. Historically, due to the coarse scale of the regional DEM, there was not a need to update these data as frequently as imagery or subregional scale DEMs since only large scale grading projects had an effect on the DEM. Therefore, a 10 to 20 year update timeframe was appropriate for regional scale DEMs. Given that an increasing number of agencies, even regional agencies, are working at higher resolutions and are requiring more accurate GIS data, having a higher resolution DEM with more frequent updates has become more critical.
Higher resolution DEMs do not exist for the entire San Diego region. Subregional scale DEMs or contours have been produced and maintained by several jurisdictions over the years on an as-needed time frame, on a project-by-project basis, or as part of a digital image acquisition project. Typically, subregional scale terrain data are in the form of contour lines (versus DEMs) generated during an orthophotogrammetric data collection effort. In many cases agencies will contract with a company to develop both the contour lines and orthophotography. Contours at 2-foot intervals are typically a common deliverable with 6-inch resolution imagery. The contour data is primarily used by city engineers for site-specific project design. DEMs can be created from these contour lines. Historically, in the San Diego region, subregional scale contours are generally produced at intervals from 2 to 5 feet. Table 3 summarizes the historical subregional terrain data generated for local

36
agencies. Information for this table was obtained from an informal survey of local jurisdictions conducted in January/February 2003.


38
Table 3. Historical Subregional Topography Inventory
General Description Topography Specs
Date Coverage# Square
Miles Type Resolution SourceDistribution Restrictions
Updates Desired
1989 City of Santee Contours 2-foot Orthophotograpy No Yes
E 1992 City of Escondido 90.00 Contours 2-foot & 5-foot Orthophotograpy Unknown Yes
1992 City of San Diego 336.00 Contours 2-foot OrthophotograpyYes, SanGIS
policies Yes
1992 City of Vista ??? 5-foot Orthophotograpy No Yes
A 1994 City of Chula Vista 127.00 Contours 2-foot Orthophotograpy NoYes, Areas of Change only
B 1999 City of San Diego 336.00 Contours 2-foot OrthophotograpyYes, SanGIS
policiesYes, Areas of Change only
D 2001 City of Carlsbad 55.00 Contours 2-footAirborne GPS & AeroTriangulation from
Orthophotography Unknown Yes
D 2001 City of Chula Vista 8.25 Contours 2-footAirborne GPS & AeroTriangulation from
Orthophotography No Yes
D 2001 City of Encinitas 35.00 Contours 2-footAirborne GPS & AeroTriangulation from
Orthophotography Yes Yes
D 2001 City of Oceanside 42.00 Contours 2-footAirborne GPS & AeroTriangulation from
Orthophotography Maybe Yes
D 2001 City of Coronado 7.80 Contours 1-foot & 2-footAirborne GPS & AeroTriangulation from
Orthophotography No Yes
D 2001 CWA 215.00 Contours 2-footAirborne GPS & AeroTriangulation from
Orthophotography Unknown Maybe
2002 City of Solana Beach 3.40 Contours 4-foot Orthophotograpy NoNo, City doesn't change much
2003MCB Camp Pendleton & NWS Fallbrook 279.52 DEM ?? LIDAR ?? ??
Notes: Many of these topographic datasets are tied to imagery acquisition projects (see tables 1 and 2 summarizing historical regionaland subregional imagery acquisition projects).
Footnotes:A Most of the City was done at 6-inch resolution with 2-foot contours, but some areas were done at 2-foot resolution with 10-foot contours.B Costs were lower than those incurred in 1992 because a new DEM was not created, only 15% was updated for this project.D These agencies all partnered under one RFP prepared by CWA, but each agency had separate contracts with the selected consultant.E Urbanized area (approximate 45 sq. miles) at 2-foot contours, outlying areas at 5-foot contours

39
At the time of this writing, the National Oceanographic and Atmospheric Administration (NOAA) is creating a 5-meter DEM for the region. This DEM is being created with the IfSAR RADAR technology and will be the first return (X-band) representation of the earth’s surface. A X-band representation of the earth’s surface means that the DEM elevation values will be based the first return reflective surface and will represent the elevations of tree tops, buildings, and bridge overpasses, etc., rather than the bald earth surface elevations. This terrain data will be very useful in preparing both regional and subregional orthorectified imagery. The X-band DEM will have a ± 1-meter vertical RMSE and a ± 2.5-meter or less horizontal RMSE. The project cost for creating the first return (X-band) DEM is approximately $250,000, but the San Diego region is getting this information free of charge through NOAA.
Currently there are no plans to process the X-band to derive the bald earth (P-band) elevations for the region. Bald earth DEMs are useful for developing slope and aspect models, for use in environmental and watershed modeling, emergency management, and transportation and land use planning. According to the prime contractor on the NOAA project, the estimated cost to create the bald earth DEM (P-band) for the entire region is $250,000.
New development and transportation projects may be more significant and have a greater affect on the 5-meter DEM than they typically have had on our 10 and 30-meter DEMs. This may require that the DEM be updated more frequently. Future DEM partnerships should focus on devising efficient ways to maintain and update this data and/or on obtaining a bald earth DEM from the NOAA project. Since the terrain data in many areas of the region do not change, it may be more efficient and cost effective to develop procedures to update DEMs with site-level project data than to re-create them from scratch.
There are many potential sources of information that could be used to update DEMs, but organizational issues will need to be addressed. These include, determining comprehensive methodologies to determine areas of change, determining who is responsible for updating the DEMs, determining how often the DEM should be updated, developing procedures for project-specific DEM/topographic data to be distributed to the updating agency, determining funding sources to update the DEMs, determining methodologies and procedures to update DEMs, etc.


APPENDIX A: HISTORICAL IMAGE ACQUISITION PROJECTS


43
APPENDIX A: HISTORICAL IMAGE ACQUISITION PROJECTS
I. 1992 BLACK AND WHITE ORTHOPHOTOGRAPHY – 6-INCH RESOLUTION
The City of San Diego acquired 6-inch resolution panchromatic ortho-rectified digital imagery to support engineering level planning for the City’s water service area. In addition to acquiring digital imagery, the City obtained digital terrain data in the form of 2-foot contours. These datasets cost the City $1,250,000 to acquire. Final image products were provided in GeoTIff and MrSID formats.
II. 1995 SPOT SATELLITE IMAGERY – 10 AND 20-METER RESOLUTION
This was the first digital imagery acquisition partnership project completed in the San Diego region. Five agencies (the San Diego Association of Governments (SANDAG), San Diego State University (SDSU), the County of San Diego, Caltrans, and the State of California Parks and Recreation) partnered to obtain 1995 SPOT satellite imagery. Both 10-meter panchromatic and 20-meter multi-spectral imagery were obtained for a 5,500 square mile area covering the San Diego region and the Tijuana River Valley watershed. The imagery was used for multi-date change detection projects to facilitate updating land cover vector databases; and as a backdrop to update transportation and other geographic boundaries. A single agency license for this imagery was $48,000. The cost for a five-agency license was $67,000, thereby reducing the cost per agency to only $13,500.
III. 1994/1995 USGS BLACK AND WHITE DIGITAL ORTHOPHOTO QUARTER QUADS (DOQQ) – 3-FOOT RESOLUTION
The 1994/1995 USGS DOQQs provided the San Diego GIS community with its first high resolution imagery of the region. A multi-agency partnership was formed to assist USGS in creating standard USGS DOOQs for the entire San Diego region, and to create value-added digital image products useful to the partnering agencies and local GIS community.
Standard raw USGS DOQQ products are created and delivered in the UTM coordinate system, with meters as the unit of measure, and are not tonally balanced across DOQQ tiles. Because most of the regional and local agencies in San Diego use the California State Plane coordinate system with feet as the unit of measure, the USGS products are not readily integrated into the agencies’ geographic information systems. In addition, there can be extreme tonal variation between the imagery of adjoining quads, thereby causing visible seamlines and checkerboard effects during viewing and plotting. The value-added image processing was conducted by a

44
private consulting firm and included; reprojecting the DOQQs from UTM to State Plane Coordinates, resampling the one-meter pixels to 3-foot pixels, balancing the tone or color across image tiles, and creating compressed products.
The total local contribution to this project was about $115,000 for complete regionwide coverage. About 30 agencies provided funding to make this project happen. Individual agency contributions ranged between $2,000 and $10,000, depending upon the phase contributed to and the required area of coverage.
IV. 1996/1997 USGS COLOR INFRARED (CIR) DIGITAL ORTHOPHOTO QUARTER QUADS (DOQQ) – 3-FOOT RESOLUTION
This digital imagery provided the region with its first high resolution coverage of the region that was not panchromatic. True color and color infrared imagery provides more information and is more useful in visual interpretation.
As part of the U.S./Mexico Aerial Photography Program, CIR photography was flown in 1996 along the International Border. A thirty-agency partnership was formed to fund the third party creation of value-added image products (reprojection, resampling pixel resolution, radiometric balancing, and creating compressed imagery) for the San Diego region from the standard USGS quarter quads. Image file sizes became more problematic in this project because the CIR DOQQs are 3-band images, and therefore three times the size of the black and white images. It required over 50 gigabytes of disk space to store the raw CIR DOQQs for the San Diego region.
The total consultant cost to prepare the value-added products for this partnership was $55,500. Smaller agencies requiring a smaller area of coverage contributed $2,000 or less; while agencies requiring regional coverage contributed only around $4,300.
V. 1999 BLACK AND WHITE ORTHOPHOTOGRAPHY – 6-INCH RESOLUTION
In 1999 the City of San Diego acquired new 6-inch resolution panchromatic ortho-retified digital imagery to provide more up-to-date imagery to support engineering level planning for the City’s water service area. In addition to acquiring digital imagery, the City updated the 2-foot contour data in areas of the City where the topography had changed. The cost to update the contours and to prepared new digital ortho-rectified imagery was $425,000. Final image products were provided in GeoTIff and MrSID formats.
VI. 2000 CIR DIGITAL IMAGERY – 2-FOOT RESOLUTION
Based upon local agency desires to have higher resolution, more up-to-date digital imagery, and more timely delivery of final image products; an RFP was issued to determine what types of digital imagery, what resolution, and what area of coverage could be obtained for what cost. This was the first project undertaken to obtain higher resolution imagery for the region

45
from scratch according to pre-defined specifications. The prior DOQQ imagery acquisition partnerships were formed to obtain useful products from existing imagery products (such as DOQQs) and delivery of usable image products was sometimes as much as two years after the date of image capture.
Based upon the proposals received in response to the RFP, a 30-agency partnership was formed to fund the consultant costs for the acquisition and creation of year 2000, color infrared, 2-foot resolution digital imagery for the entire region. The imagery was captured between June and September 2000, and was rectified using the 1996/97 USGS DOQQs as ground control and a 10-meter DEM for elevation control, thereby providing a positional accuracy similar to the USGS DOQQs (+/- 33 feet). Because of the increased resolution, image file sizes once again increased and final digital image products were provided to the partners in the compressed format.
The outside consultant cost of the project was just over $113,000. Individual agency contributions varied depending upon the area of coverage required. Agencies requiring digital imagery for the entire region contributed $10,000, whereas agencies only requiring coverage for a smaller portion of the region contributed $2,000.
VII. 2001 TRUE COLOR SUBREGIONAL IMAGERY – 6 INCH RESOLUTION
In 2001, the San Diego County Water Authority issued an RFP to acquire true color imagery and topographic data along the corridor of its major aqueduct system. Before issuing the RFP, the Water Authority solicited other agencies in the region, including water districts and municipalities, to participate in the RFP as an optional area of interest. Five local municipalities agreed to include their jurisdiction within the RFP without obligating funding to the project. Most importantly, the RFP included a public agency clause allowing any public agency in the San Diego region to participate in the award made by the result of the solicitation. Therefore, only one agency was responsible for conducting the solicitation process, and all agencies could then contract with the selected firm to acquire digital imagery for their area of interest. Six agencies negotiated six separate contracts with one aerial mapping firm. These included the San Diego County Water Authority, City of Carlsbad, City of Chula Vista, City of Coronado, City of Encinitas, and the City of Oceanside.
While this was not a formal partnership, the agencies involved did form a loose relationship and did realize cost savings. The core products of the project for all agencies involved were true color imagery with 6-inch pixel resolution and 2-foot contour data. Final digital image products were delivered to each agency in the compressed MrSID format.


APPENDIX B: REFERENCES


49
APPENDIX B: REFERENCES
References related to remotely sensed data Campbell, James B. 1987, Introduction to Remote Sensing, The Guilford Press, New York, NY. Lachowski, Henry, Maus, Paul, et al, 1996, Guidelines for the Use of Digital Imagery for Vegetation Mapping, US Dept of Agriculture, US Forest Service Washington DC, EM-7140-25. References related to map accuracy standards and control American Society for Photogrammetry and Remote Sensing (ASPRS) Specifications and Standards Committee, 1990, ASPRS Accuracy Standards for Large-Scale Maps: Photogrammetric Engineering and Remote Sensing, v. 56, no. 7, p. 1068-1070. U.S. Bureau of the Budget, 1947, United States National Map Accuracy Standards: U.S. Bureau of the Budget, Washington, D.C. Federal Geographic Data Committee, 1998. Geospatial Positioning Accuracy Standards; Part 3: National Standards for Spatial Data Accuracy, FGDC-STD-007.3. Federal Geographic Data Committee. Washington, D.C. www.fgdc.gov/standards Bock, Yehuda, Helmer, Greg, Green, Cecil H., and Green, Ida M. "A Master Plan for a Modern California Geodetic Control Network," California Spatial Reference Center. March 12, 2003. www.csrc.ucsd.edu http://www.vargis.com/pages/primer.htm http://www.imagingnotes.com/marapr00/ma00eoqu.htm http://www.fgdc.gov/framework/refmat/vermon~1.htm References related to DEMs http://rmmcweb.cr.usgs.gov/elevation/dpi_dem.html References used for Definitions and Acronyms: http://www.spaceimagingme.com/content/FAQ/Glossary/index.asp http://gis.leica-geosystems.com/glossary/ http://www.terramatrix.co.jp/faq/en_index.html


APPENDIX C: DEFINITIONS AND ACRONYMNS


53
APPENDIX C: DEFINITIONS AND ACRONYMNS
1. Accuracy (Spatial or Positional) – Spatial or positional accuracy refers to the location of an object in the imagery in relation to its actual ground location in the real world. Positional accuracy is often represented as a statistical error or as +/- units of measure. See CE and RMSE.
2. CE (Circular Error) – One of several methods for deriving or calculating the spatial or
positional accuracy of an image. CE is a horizontal measurement on the ground defining the radius of a circle within which an object of known coordinates should be found on an image. For CE90, the probability of a point in the image meeting the recorded accuracy is 90%.
3. Color Infrared (CIR) – Typically, this is multi-spectral imagery where one band of the image
represents the infrared portion of the color spectrum. Infrared is just beyond the red portion of the visible spectrum of light. Often called false color because colors are different than those seen by the human eye. CIR imagery is particularly helpful in the study of vegetation since healthy vegetation appears as very bright red.
4. Color balancing – The process of making the color/tone of individual image tiles look the same
across the project area. Individual image tiles/frames will have variable color or tonal quality based on time of day captured, sun angle, etc. Color balancing minimizes the tonal/color differences across the project area so the resultant images look visually pleasing. Also known as radiometric balancing.
5. Datum – The description of the shape of the earth as defined by the National Geodetic Survey.
Usually referred to as NAD27 or NAD83 for the horizontal datums and as NGVD29 or NAVD88 for the vertical datums. NAD27 uses surface reference points, whereas NAD83 uses the center of the earth as the reference point
6. DEM (Digital Elevation Model) – Digital information that provides a uniform matrix of
terrain elevation values. It provides basic quantitative data for deriving terrain elevation, slope, and/or surface roughness information. DEMs are available from the USGS at 1:24,000 scale (10 meter and 30 meter resolutions) and 1:250,000 scale (XX meter resolution).
7. DOQQ (Digital Ortho Quarter Quad) – A digital image prepared by the USGS that covers one-
fourth of a standard USGS 7.5 minute Quadrangle. Standard quadrangles have been established for the entire United States and are generally at one of two scales: 1:24,000 (7.5 minute quad) and 1:100,000 (15 minute quad).
8. DTM (Digital Terrain Model – A method of representing terrain data using a combination of
point elevations, contour lines, break lines, and other planimetric (x,y) coordinates. 9. ECW (Enhanced Compression Wavelet) – A method of compressing digital imagery. ECW
has widespread use in San Diego County, although not as widespread as MrSID (another image compression scheme). Licensed from Earth Resource Mapping, Inc., ECW imagery requires readily available and free software or extensions to view in most GIS software packages.

54
10. Epochs – The effective date or time of reference of a geodetic measurement, such as a ground control point or GPS, established via a survey. The reason for having an effective date is that the crust of the earth continues to move with time. This movement is significant in California because of continual movement of the underlying tectonic plates and episodic ground movement associated with earthquakes. Computer programs are available to convert survey points from one epoch to another. These programs account for both the gradual movement of the crust and the episodic movements due to major earthquakes
11. False color infrared – See Color Infrared (CIR). 12. Georectified –The photogrammetric adjustment of one or more images relative to an absolute
(fixed) ground reference system. An image or vector layer that is georectified is tied to a geographic reference system such that each pixel or point chosen can be identified by geographic coordinates. This does not mean that the image is orthorectified since a terrain model was not used in the rectification process to control for elevational distortions. Features shown on a georectified image may still be significantly displaced from their true positions on the earth.
13. GPS (Global Positioning Systems) – A network of US and foreign satellites that provide
highly accurate time and positional information via radio signals that can be used by receivers to measure horizontal and vertical locations on the earth; used extensively in surveying, navigation, rectification processes, and GIS.
14. Ground Control Points (GCPs) – GCPs are accurate positions of points on the Earth's surface
expressed in horizontal coordinates and in vertical (elevation above mean sea level) measurements which are usually obtained from a ground or field survey. GCPs are needed to orthorectify (spatially correct) an image.
15. Hot Spots - 16. Hydrographic – Depicting water features such as lakes and rivers. 17. Hypsographic – Depicting contours. 18. IfSAR (Interferometric Synthetic Aperture Radar) – IfSAR is based on SAR (microwave)
technology. Specifically, it was developed by HAMM (High Altitude Mapping Mission) Inc. Two antennas, each mounted on the wing tip pods of an airplane, form a long baseline that enables the interferometric processing of two images to derive terrain elevation data of relatively high precision. See SAR.
19. LANDSAT – A low resolution (15 to 30 meter) image product produced by EOSAT. Typically low
cost multi-spectral products covering a large footprint. 20. LIDAR (Light Detection and Ranging) – Very similar to RADAR except that it uses a different
portion of the electromagnetic spectrum – light instead of radio wave lengths. In the past several years, LIDAR has become a frequently used technology to acquire surface elevations from sensors on board aircraft.
21. MrSID (Multi-Resolution Seamless Image Database) – A method of compressing digital
imagery with widespread use in the San Diego region. Licensed from Lizard Tech, Inc., MrSID imagery requires readily available and free software or extensions to view in GIS software packages.

55
22. Multi-Spectral Imagery – Digital imagery representing multiple portions of the electromagnetic spectrum.
23. National Map Accuracy Standards (NMAS) – One of several methods for stating the spatial
or positional accuracy of an image. NMAS accuracy measures were based on hard-copy maps and although NMAS has less applicability when used for digital imagery it is still commonly used as an accuracy measure for imagery. NMAS accuracy uses an RMS error (RMSE) based calculation in determining positional or spatial accuracy. The RMSE is calculated with a distance equation and is the distance between the input (source) location of a known point (such as a Ground Control Point) and the retransformed location for the same point in the image. NMAS reports the accuracy as +/- feet. This means that features on an image are within the given range of their true position on the ground 90% of the time.
24. National Standard for Spatial Data Accuracy (NSSDA) – These guidelines were developed
in 1998 by the Federal Geographic Data Committee (FGDC) as an update to the NMAS standards developed in 1947. NSSDA is based on the American Society for Photogrammetry and Remote Sensing (ASPRS) accuracy standard for large scale maps. and implements a statistical and testing methodology for estimating the positional accuracy of points on a map and in digital geospatial data (including digital imagery). Positional accuracy is estimated using a Root Mean Square Error (RMSE) methodology and is reported in +/- ground distance units at the 95% confidence level.
25. Orthophotography – Aerial photography that has been orthorectified. See orthorectification. 26. Orthorectification – Orthorectified images are the most position-accurate products offered.
The orthorectification process removes image distortions introduced by the collection geometry and the terrain, and resamples the imagery to a uniform ground sample distance and user-specified map projection. A terrain model such as a DEM or DTM is required to produce an orthorectified image.
27. Panchromatic – A black and white or gray-scale image. Typically an 8-bit image, meaning it
has a potential range of 256 shades of gray. 28. Positional Accuracy – Spatial or positional accuracy refers to the location of an object in the
imagery in relation to its actual ground location in the real world. Positional accuracy is often represented as a statistical error or as +/- units of measure. See CE and RMSE.
29. RADAR (RAdio Detection and Ranging) – Remotely sensed data produced when a
microwave transmitter focused by an antenna emits a beam of micro or millimeter waves. The waves reflect from the surfaces they strike, and the backscattered radiation is detected by the same microwave antenna which is tuned to the frequency of the transmitted waves.
30. Radiometric balancing – See color balancing. 31. RMSE (Root Mean Square Error) – One of several methods for deriving or calculating the
spatial or positional accuracy of an image. RMS error (RSME) is calculated with a distance equation and is the distance between the input (source) location of a known point (such as a Ground Control Point) and the retransformed location for the same point in the image.
32. SAR (Synthetic Aperture Radar) – An active radio sensor that transmits microwave pulses to
the surface of the Earth and receives the reflected microwave signals to observe the ground elevation and other physical characteristics by performing many different analyses.

56
33. Spatial Accuracy – Spatial or positional accuracy refers to the location of an object in the imagery in relation to its actual ground location in the real world. Positional accuracy is often represented as a statistical error or as +/- units of measure. See CE and RMSE.
34. Spatial Resolution – The area on the ground represented by a single pixel in the image. 35. Spectral Resolution – The wavelength bandwidth for a portion of the electromagnetic
spectrum that is represented in an image. Multi-spectral imagery represents many portions of the electromagnet spectrum and is typically called multi-band imagery. If only one portion of the magnetic spectrum is represented in an image it is a single band image. Multi-band, multi-spectral imagery can be either true color (colors appear as seen by the human eye) or color infrared. See CIR.
36. SPOT – A digital image product produced by a series of earth-orbiting satellites operated by the
Centre National d'Etudes Spatiales (CNES) of France. 37. State Plane Coordinate System (California State Plane) –The projection and coordinate
system most commonly used in the San Diego region. It is based on the Lambert Conformal Conic Projection. It is one of many projection systems available for GIS, digital imagery, and terrain data.
38. Terrain data – Systematically recorded measurements of the surface elevation of the earth.
Typically, topography is represented in digital terrain data as digital contour lines with a fixed interval or as a raster data set where each pixel is assigned an elevation value.
39. UTM (Universal Transverse Mercator Projection) – One of several commonly used map
projections However, agencies in the San Diego region typically use the California State Plane Coordinate system. Many federal agencies use the UTM projection system.
40. Vignetting – a gradual shift in image tone, usually a darkening, from the center outwards
caused by the reduction of radiation intensity in the periphery of the camera’s field of view. Typically, cameras have a reduced capacity to gather light at the periphery of its field of view unless anti-vignetting methods are used.