spatial modelling and web-gis tools for climate change ... cavan.pdf · modelling climate and land...
TRANSCRIPT

Spatial modelling and web-GIS tools for climate change adaptation
planning in urban areas
Dr Gina Cavan School of Environment and Development
University of Manchester
Earth Systems Engineering Symposium, Newcastle University, 3-5 July 2012

Contents
• Introduction
• Modelling impacts of climate and land use change on temperatures
• Vulnerability of communities, climate hazards and green infrastructure
• Web-GIS tools for climate change adaptation planning
Co
nte
nts

Climate change impacts in the built environment
• The built environment
– High building mass
increases thermal capacity
– Surface sealing increases
rainfall run-off
• Climate change:
– Intensifies the urban heat
island effect
– Increases risk of flooding

Green Infrastructure (GI)
Life support system – the network of natural environmental components and green and blue spaces that lies within and between our cities, towns and villages, and provide multiple social, economic and environmental benefits

Benefits of GI
• Multiple benefits of GI – 11 economic benefits identified
• Climate adaptation benefits include:
– Heat amelioration
– Reducing flood risk
– Improving water quality
– Sustainable urban drainage
– Improving air quality
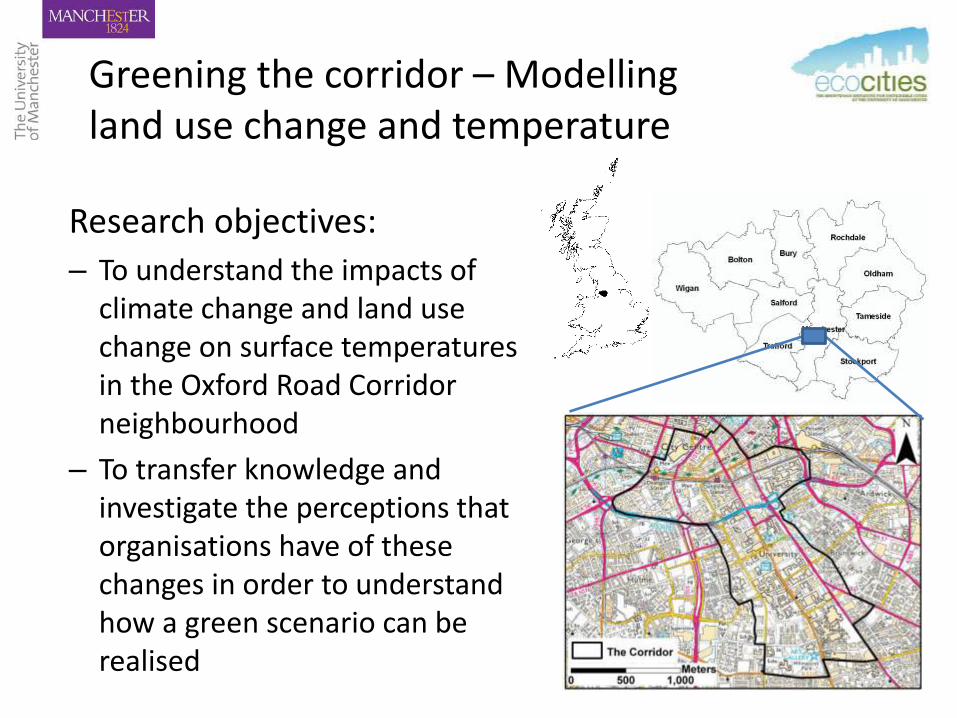
Research objectives:
– To understand the impacts of climate change and land use change on surface temperatures in the Oxford Road Corridor neighbourhood
– To transfer knowledge and investigate the perceptions that organisations have of these changes in order to understand how a green scenario can be realised
Greening the corridor – Modelling land use change and temperature
Modelling climate and land use change in The Corridor
Methodology:
• Surface cover analysis of current situation using aerial
photography
• Alteration of surface cover to create two potential future
greening/development scenarios
• Analysis of baseline climate & projections for Manchester
• Modelling of surface temperatures under different
development and climate scenarios
Using an energy exchange model to simulate surface
temperatures on the 2 hottest days in summer (Tso
1990; 1991; Whitford et al., 2001; Gill, 2006)

Surface cover analysis
0.0
0.1
0.2
0.3
0.4
0.5
0.6
0.7
0.8
0.9
1.0
Greater
Manchester
average
Town centre Offices The corridor
ASCCUE Urban Morphology Type EcoCities
case study
Pro
po
rtio
na
l c
ov
er
Bare soil
Evapotranspiring
Built
15% green space
56% impervious
surfaces
27% buildings
Where could land use
change?
• 161 flat roofs that could
be greened (9%)
• Large sealed surfaces
and carparks (8%)
• Green infrastructure
other than parks and water
(11%)

Future development scenarios
Business as usual
– current situation
15% green space
High development
4% green space
Deep green
34% green space
• Flat roofs greened by 100%
• Large sealed surfaces and
carparks greened by 50%
• Trees planted along roads
(greened by 30%)
All green space
(excluding parks and
water) is developed

Results: Impact of changing surface cover on surface temperature
High development
4% green space = +5ºC
Business as usual
15% green space
Deep green
34% green space = -6ºC
25
27
29
31
33
35
37
39
41
43
45
1961-1990 Business as
usual
Deep green High
development
Current
situation
Development scenarios for 2050s high
emissions scenario
Maxim
um
su
rface t
em
pera
ture
(°C
)
~21% green space will
maintain surface
temperatures at baseline

Common adaptation strategy
T O W S
The partnership working together • Strength of the structure • Presence of large organisations Focus on environmental agenda • A number of programmes, trials and models
focused around the corridor • Recognition of mitigation/adaptation • Individual & collective signatories to MCC CCAP
The partnership does not include all parties Institutional barriers • Governance structures • Investment – timing • Short time horizons Climate change agenda • Overall focus on mitigation • Understanding the consequences • Confusion mitigation / adaptation actions
Retrofit cost
Future changes (technology, policy, culture) • Sustainability becoming the priority • ITC development - less city working • Increasing public awareness of CC Adaptation = economic competitiveness: • Attractiveness of the area • Reputation Bright future for the partnership • City leadership • Peer pressure • Ongoing common schemes = stronger future
collaboration
Cost Ongoing political changes • Existence / functioning of organisations High numbers of climate change sceptics VAT penalty on services Short-termism • Investment • Political power

T O W S
GI awareness • Multiple benefits • GI and development not mutually exclusive GI aligned with The Corridor priorities • Quality of place • Attractiveness = competitiveness A number of ongoing greening initiatives Limited number of land owners
Realising the Green scenario
Financial issues: • Upfront investment & long payback time • Uncertainty over benefits Limited influence of spatial planning • Densely developed area • Large proportion owned by private sector Space • Limited green space provision • Space shortage Practical issues • Technology (green roofs) • Maintenance (brown grass; impact on utilities)
Future lifestyle and technological changes • Fewer roads & carparks = more green space
National funding for green infrastructure Working together • City planners on board • Learning from others & exchanging experience
Incorporating GI into daily business • Greening alongside infrastructure works • Green procurement
Weaknesses of the planning system • Driven by economic goals • Environmental agenda separate • Limited regulatory powers of the city Spending cuts in public sector
Public perceptions • Lack of respect for open spaces • Climate sceptics Maintaining functional green space under changing climate
(Cavan & Kazmierczak, 2011)

Surface Temperature And Runoff (STAR) tool
http://www.ppgis.manchester.ac.uk/grabs/

High temperature hazard – conurbation scale
(Gill, 2006)

Vulnerability of people & communities to climate change
• People have different capacity to deal with hazards
• So therefore not everyone is affected to the same extent
• Coping capacity is dependant on: Access to information – social networks; language
Ability to prepare for flooding / heat – resources e.g. insurance
Capacity to act in the case of emergency – knowledge; ability
Ability to recover after flooding – resources; physical & mental strength
(Kazmierczak & Cavan, 2011)

Spatial distribution of vulnerability
• Four principal groups • High scores of
poverty & diversity components concentrated around urban centres
• High scores of children component located in sub- and peri-urban areas
• High scores of old age component more scattered distribution across suburban areas
Poverty & poor health Diverse, transient communities
High percentage Elderly Families with children
(Kazmierczak & Cavan, 2011)

Vulnerable communities & climate-related hazards
• Correlations between vulnerability and surface water flooding
Aspects of vulnerability of communities and the intensity of the urban heat island
Principal components
All areas susceptible to flooding
High susceptibility
PC1: Poverty 0.056* Ns
PC2: Diversity
0.139*** -0.234***
PC3: Children -0.099*** -0.059*
PC4: Old age -0.111*** Ns
(Kazmierczak & Cavan, 2011; Kazmierczak, 2012)

Flood risk, housing and tenure
• Correlations between tenure and surface water flooding
Factors enhancing vulnerability e.g. housing and tenure
Percentage of LSOA in flood risk area
Tenure Owner-occupie
d
Social rented
Private rented
Surface flood >0.1m
-0.140**
*
0.095*** 0.181***
Surface flood >1.0m 0.071** ns -0.068**
(Kazmierczak & Cavan, 2011)

Vulnerable communities, green space and housing
(Kazmierczak & Cavan, 2011)

Climate adaptation planning: developing an urban climatic map
• Incorporating climate in urban planning
& design is not a new idea
• An Urban climatic map (UCMap) can be
a valuable tool to aid urban planners
• Implemented in over 15 countries
worldwide (Ren et al. 2011)
• Cities in Europe (particularly in
Germany) & Asia (e.g. Hong Kong) are
leading the development of UCMaps,
often as a response to critical events

Risk map for flood events
Hazard Exposure
Vulnerability Risk
Low
High
(Smith, Cavan & Lindley, 2012)

Urban climate recommendation map
(Smith, Cavan & Lindley, 2012)
Neutral
Redevelopment
not possible
(transport, etc) Climatically active
Green space in low
risk areas should
have restricted
development
Open, high
sensitivity
Unused or PDL
in high risk
areas restricted
from
development
Built-up, high sensitivity
Limited green space, high
risk areas; restricted
development &
adaptation
encouraged

EcoCities: The Bruntwood Initiative for Sustainable Cities
www.adaptingmanchester.ac.uk

EcoCities Spatial Portal www.ppgis.manchester.ac.uk/ecocities
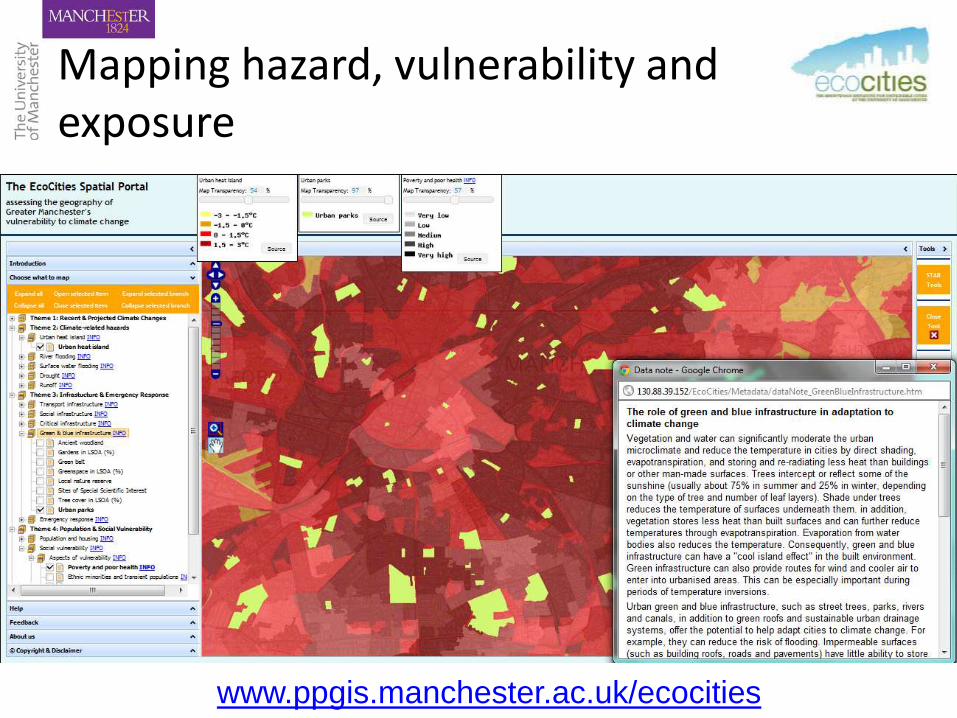
Mapping hazard, vulnerability and exposure
www.ppgis.manchester.ac.uk/ecocities

Conclusion
• Cities which understand and manage their climate are ahead in the challenge to adapt to climate change (Stuttgard, 2010)
• GI has multiple benefits and offers potential to help adapt cities for a changing climate
• Adaptation requires spatially targeted actions that consider differences in the physical environment, community development, social infrastructure, green infrastructure…

Thank you
References – Cavan & Kazmierczak (2011). Urban greening to adapt urban
areas to climate change. EcoCities, University of Manchester.
– Cavan & Kingston (2012). Development of a climate change risk and vulnerability assessment tool for urban areas. Int. J. Dis. Res. Built. Env.
– Gill (2006). Climate change and urban greenspace. PhD thesis, University of Manchester.
– Kazmierczak & Cavan (2011). Surface water flooding risk to urban communities: analysis of hazard, vulnerability and exposure. Lands. Urban Plan.
– Smith, Cavan & Lindley (2012). UCMaps in UK: Greater Manchester. In Ren et al. forthcoming, Urban Climatic Maps.
EcoCities website: www.adaptingmanchester.ac.uk
STAR tools: www.ppgis.manchester.ac.uk/grabs