source: jll asia pacific hotel investment by tom oakden
TRANSCRIPT
Source: JLL
Asia Pacific Hotel InvestmentBy Tom Oakden

Asia Pacific: 2013 was strongest performer since 2007
Source: JLL
2000 2001 2002 2003 2004 2005 2006 2007 2008 2009 2010 2011 2012 2013 2014 -
2,000,000,000
4,000,000,000
6,000,000,000
8,000,000,000
10,000,000,000
12,000,000,000
14,000,000,000
Asia Australasia Forecast 2014
Tran
sact
ion
Volu
me
USD
Billio
ns
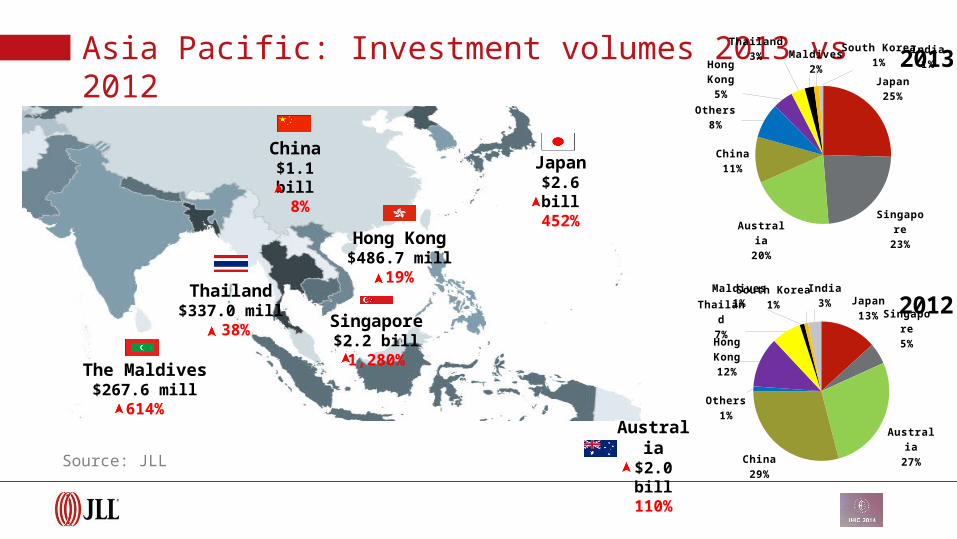
Japan$2.6 bill
452%
Thailand$337.0 mill
38% Singapore$2.2 bill1,280%
China$1.1 bill
8%
Hong Kong$486.7 mill
19%
The Maldives$267.6 mill
614%
Asia Pacific: Investment volumes 2013 vs 2012
Australia$2.0 bill
110%
Japan25%
Singapore23%Australia
20%
China11%
Others8%
Hong Kong5%
Thailand3% Maldives
2%
South Korea1%
India1%
2013
Japan13%
Singapore5%
Australia27%
China29%
Others1%
Hong Kong12%
Thailand7%
Maldives1%
South Korea1%
India3% 2012
Source: JLL

2000 2001 2002 2003 2004 2005 2006 2007 2008 2009 2010 2011 2012 2013 H2 2012
H2 2013
0
2,000,000,000
4,000,000,000
6,000,000,000
8,000,000,000
10,000,000,000
12,000,000,000
0
50,000
100,000
150,000
200,000
250,000
300,000
Total Investment Volume Price per Key
Tran
sact
ion
Volu
me
USD
Milli
ons
Price
per
Key
(USD
)
Asia Pacific: Price per key up 62% on strong sales activity
Source: JLL

RevPAR decline slowing
RevPAR growth
slowing
RevPAR falling
RevPAR risingBali, Maldives, Macau
Yangon, Tokyo, Surabaya, Sydney, Melbourne
Beijing, Sanya
Jakarta
Hong Kong, Mumbai
Taipei, Seoul
Shanghai, Guangzhou
Asia Pacific: RevPAR recording improvement across markets
Singapore, Kuala Lumpur, Osaka, Fukuoka, Delhi
Chengdu, Chennai
Manila
HCMC, Hanoi, Phuket
Bangkok

Asia Pacific: Investor profile dominated by investment funds
Source: JLL
Investment Fund / Private Equity
29%Corporates16%
Developer / Property Company
15%
HNWI15%
REIT9%
Sovereign Wealth Fund8%
Hotel / SA Operator7%
Bank / Institutional Investor
2%

7
Source: Ministry of Tourism and Creative Economy of the Republic of Indonesia
Bali Tourism Overview
1.1
1.5 1.51.3
1.7
2.1
2.42.5
2.82.9
3.3
3.75
0.70.8
-30%
-20%
-10%
0%
10%
20%
30%
40%
50%
60%
0.0
0.5
1.0
1.5
2.0
2.5
3.0
3.5
4.0
2003 2004 2005 2006 2007 2008 2009 2010 2011 2012 2013 2014 YTDMar2013
YTDMar2014
Ann
ual G
row
th (%
)
Num
ber o
f Arr
ival
s (m
illio
ns)
International Visitor Arrivals to Bali, 2003 - 2014
Visitor Arrivals (millions) Annual Growth (%)
Source: Ministry of Tourism and Creative Economy of the Republic of Indonesia
JW Marriott Jakarta
Bombing
Australian Embassy Bombing
Bali Bombing II
GFC and JW Marriott & Ritz-Carlton Jakarta
bombings

Source: JLL
Recent Transactions in Asia

Tune Hotel Indonesia PortfolioUSD 55 million
Semara Seminyakc. USD 20 million
Pan Pacific Bali Nirwana USD 115 million
Indon
esia

Windy Resort Lombok
The Latitude BaliIn excess of USD 6 million
Sold by
Sold by
Indon
esia

Buddy Resort, Koh Samui
Outrigger Laguna Resort, Phuket Manathai Resort, Phuket
Kamala Cove, PhuketIn excess of USD 55 million
Sold by
Sold by Sold by
Sold by
Thailan
d

Jumeirah Dhevanafushi USD 60 million(by JLL H&H)
Jumeirah DhevanafushiUSD 60 million
Angsana VelavaruUSD 71 million
Movenpick Mauritius USD 40 million
Six Senses LaamuUSD 70 million
Sold by
Sold by
Sold by
Sold by
Indian
Ocean

Park Hotel Clarke Quay USD 240 million
The WestinUSD 370 million
Grand Park Orchard USD 370 million
Gallery Hotel USD 186 million
Sold by
Sold by
Singap
ore

Namba Washington Hotel USD 87 million
Novotel Koshien USD 25 million
Japanese Portfolio c. USD 62 million
Sold by Sold by
Sold by
Japan

Source: JLL
Thank You