jll annual report
TRANSCRIPT

Shaping the future of real estate for a better world
2020 Annual ReportJones Lang LaSalle Incorporated

1 | JLL 2020 Annual Report
Shaping the future of real estate for a better worldA letter to our stakeholdersFrom Christian UlbrichPresident and Chief Executive Officer
1 | JLL 2020 Annual Report
2020 performance highlightsJLL closed the year with resilient financial performance and record operating cash flow, despite the considerable impact of the Covid-19 pandemic on businesses and economies across the globe through much of 2020. Consolidated revenue declined 8% year-on-year to $16.6 billion, while fee revenue was down 14% at $6.1 billion. Adjusted EBITDA for the year was $860 million, 24% lower than in 2019. Adjusted diluted earnings per share were down 34% year-on-year at $9.46. Cash generated by operating activities was $1.1 billion in 2020, compared with $484 million in 2019, predominantly the result of solid operating results and strong cash collection on receivables, while also helped by government-sponsored relief programs, and lower cash payments for taxes.
Overall, as pandemic-related lockdowns slowed global economic activity, the impact on commercial real estate fell most heavily on transactional business. For JLL, lower Capital Markets and Leasing fee revenue reflected a sharp year-on-year drop in total market volumes. However, the fourth quarter saw the beginnings of a recovery in Capital Markets, with JLL’s activity boosted by our diverse and comprehensive offering across products and asset classes, and by the ongoing success of the 2019 acquisition of HFF.
The significant growth of our Corporate Solutions, Property & Facility Management and Project & Development Services businesses over the last decade countered the declines in transactional revenues in 2020. The value of trusted client relationships, and the substantial capacity of JLL’s global platform to quickly adapt services and advice to the rapidly changing needs of our clients across all industry types, underpinned solid and dependable revenues and pipelines.
Turning to our LaSalle Investment Management business, the anticipated decline from near-record 2019 incentive fees was the primary driver of lower year-on-year fee revenue. However, LaSalle effectively countered this with solid advisory fees and continued strong private equity capital raising.
Transformation landmarkDuring 2020, we achieved an important landmark in our Beyond long-term strategic growth plan, completing a major two-year transformation program. In early 2019, we began by globally aligning all our corporate functions. Later that year, Corporate Solutions and Valuation Advisory moved to global business line structures, and we established JLL Technologies to bring together all our internal and external technology and data
JLL 2020 Annual Report | 2
Any reflection on 2020 is obviously dominated by the changes brought to our lives by the Covid-19 pandemic. From a JLL perspective, we can be very proud of how our 91,000 people around the world responded to the extraordinary challenges of the pandemic, and proud also of the strength and bonds of trust within our client relationships. Equally important is the role we played together with our clients in rapidly adapting to changed circumstances, maintaining essential operations and supporting the wider community.
In addition to delivering impressive annual results for 2020, we also completed a major two-year transformation program, significantly progressed our commitments toward sustainability, accelerated our journey to becoming the industry leader in technology and data, and further intensified our focus on promoting diversity and inclusion in all areas of our business. We have laid the foundations to support strong and sustained profitable growth over the next decade, guided by our purpose of shaping the future of real estate for a better world.
JLL 2020 Annual Report | 2

3 | JLL 2020 Annual Report
capabilities. At the start of 2020, Capital Markets moved to a global business line structure, including the newly integrated HFF business. In November, we announced the final key step on this transformation journey with all other local and regional services moving into global alignment within our new Markets business, effective January 1, 2021.
This fully-aligned structure will drive new growth while ensuring our clients receive seamless service around the world, enhancing the connectivity between countries and regions, facilitating knowledge flows, and accelerating the deployment of new technology and other innovations.
PeopleReflecting on a year like no other, this annual report is in part a celebration of the resilience and achievements of our people. We talk a lot about the importance of culture and our values of teamwork, ethics and excellence. The past year provides a unique illustration of why this is so important. We have seen compassion and commitment in abundant measures. We have also seen great agility in adapting advice and services, rethinking processes, and generating new products and solutions, always characterised by those hallmark JLL values of teamwork, ethics and excellence.
Along with most other businesses, we implemented rapid temporary changes to the ways we work. I would like to place on record my thanks to all my colleagues who so quickly and efficiently adapted to working from home, and to all those who participated in furloughs and similar arrangements. I would also like to give special thanks to the thousands of our people around the world who continued working on client sites throughout the pandemic, many supporting medical and other essential facilities, as well as key links in supply and distribution chains.
Looking ahead, even in this highly innovative digital age, the sustained success of our business will always remain primarily dependent on the culture, values and commitment of our people. JLL seeks to attract the very best talent in all areas of our work with the employee value proposition Achieve Your Ambitions. The successful completion of our transformation program, globally aligning all our core business lines and functions, further enhances the excellent career progression opportunities we provide.
A central strategic priority is to significantly advance our progress toward creating a truly diverse and inclusive business at all levels. For the last several years, we have been moving the needle in the right direction but going forward we would like to accelerate that journey. In 2020, we further expanded our existing programs and commitments, including through hosting the first annual Black Excellence Summit for our Americas region in November, adding to numerous other gender and ethnic diversity-oriented events around the world throughout the year.
In January 2021, Ingrid Jacobs (pictured) joined JLL in a new dedicated senior global role as Head of Diversity & Inclusion. In February 2021, JLL was named to the Bloomberg Gender-Equality Index for the second successive year.
Our commitment to diversity and inclusion, and all other aspects of our culture and values, stems from the most senior levels of the organisation. The tone is set at the top. After 15 years in the role, Sheila Penrose (pictured) decided to step down as Chairman of the JLL Board of Directors during 2020. Sheila’s role in guiding and shaping JLL’s values, culture and sustained success has been highly significant. We are delighted that she continues as a member of the Board.
Unanimously elected as Sheila’s successor, Bobby Mehta (pictured) became JLL’s new Chairman of the Board of Directors on June 1, 2020, having originally joined the Board in 2019. Bobby has a wealth of experience from his former CEO roles at TransUnion and major divisions of HSBC, and service on several other boards. Like Sheila before him, Bobby brings superb business acumen, leadership and judgment to the role, and he is an excellent global ambassador for JLL.
PlacesThe onset of the pandemic has accelerated trends that were already changing the way we live and work, bringing with them considerable implications and opportunities for the real estate industry. Most obviously, the sudden shift of office populations to home working has raised debate around the future of the office and, more broadly, the future of cities. The changing dynamics of retail and residential property have also been accentuated by the pandemic, while sectors such as logistics and industrial, healthcare and other specialist asset types have risen to new prominence.
Working in very close partnership with our clients, JLL is at the forefront in predicting, understanding and responding to these changes and opportunities. Through 2020 and into 2021, our Reimagine series of products and research has helped clients respond to the pandemic, re-enter their marketplaces, and plan for the next normal in a post-pandemic era.
It is our strong belief, borne out by our client surveys and detailed research analysis, that the prospects for the world’s major cities and urban hubs are bright and exciting. As the
Left to right: Ingrid Jacobs, Sheila Penrose and Bobby Mehta
JLL 2020 Annual Report | 4
pandemic recedes, the allure of the concentration of culture, creativity, learning, opportunity, innovation and convenience
— and much more besides — will again draw populations into the world’s leading cities.
The way we use offices, especially those in central business district locations, will continue to change. The hybrid model of part remote, part office-based working looks set to hold sway. However, offices will remain at the beating heart of leading organisations — the gathering places for shared working, learning, creative hubs, social events, client and customer meetings — and symbolic of the culture and identity of each employer. In fact, the central role of offices may become even more important as people settle into a hybrid working model. This is not the end of the office, although it may be the end of tightly packed rows of lookalike desks. It is instead the beginning of a very exciting new chapter in how we use space, and the role real estate plays in inspiring people and supporting productivity. The Future of Work will be fascinating and JLL will ensure our clients have access to the very best ideas and solutions.
PlanetThe built environment is responsible for nearly 40% of total global carbon emissions and therefore has an important and urgent role to play in the race to net zero. Fast execution is key, so that we all can make use of the positive momentum in reducing the carbon footprint that we have seen during the pandemic. Clearly, the most successful leading companies in each industry should go first and set an example.
JLL has worked with the Science Based Targets initiative (SBTi) to set a target to reduce carbon emissions from our own operations (scopes 1 and 2) by 68% by 2034. This goal aligns with the Paris Agreement’s ambition to limit global warming to 1.5°C above pre-industrial levels.
While ensuring our own policies and targets exemplify best practice, we recognise the biggest difference we can make is by helping our clients set and achieve their own ambitious sustainability goals for their real estate investments and operations. To underpin that responsibility, we have also committed to reduce scope 3 emissions (from properties we manage for our clients) by 53% per square foot over the same timeframe. More detail on all our sustainability targets and progress can be found in our Global Sustainability Report.
Cooperation and collaboration to tackle climate change are essential. JLL is an active member of the World Green Building Council’s Corporate Advisory Board, the World Economic Forum’s Alliance of CEO Climate Leaders, and a founding partner of Bloomberg Green, the dedicated global media platform focused on sustainability. In February 2021, JLL was named to Ethisphere’s list of the World’s Most Ethical Companies for the 14th successive year.
Building on many years of growing and expanding our services and expertise in countries and business lines around the world, in January 2021 we appointed Guy Grainger – previously our EMEA CEO – as our first Global Head of Sustainability Services & ESG, a senior role tasked with aligning and driving exponential growth in all aspects of this vital work. Our Global Executive Board has identified this as a core strategic priority, reflecting our guiding purpose of shaping the future of real estate for a better world.
OutlookThe past 12 months have proved that prospects can change unexpectedly and dramatically. However, writing in March 2021, it appears that an end to the worst ravages and disruptions of this terrible pandemic may be in sight. Many countries are making progress with vaccination programs and beginning to plan for reopening their economies and societies. It is to be hoped that global collaborative efforts will ensure vaccinations reach all parts of the world over the coming months. We expect business and economic activity to recover strongly through the second half of 2021, with momentum building through subsequent years.
The real estate sector will continue to benefit from five long-term secular trends that had already been driving growth and investment for several years prior to the onset of the pandemic: rising capital flows into real estate, increasing corporate outsourcing of real estate services, growth in urbanisation, the rise of new technology and data analytics, and growing demand for sustainability products and services. These trends and our Beyond strategic vision are discussed in more detail in the 10-K section of this annual report.
Working closely with all our stakeholders, our team of 91,000 people delivered a remarkable and impressive performance in 2020 in challenging circumstances. Post-pandemic, the outlook for JLL is particularly bright. Our company is very well positioned for strong and sustained long-term growth. Thank you for your continued interest in JLL.
Christian Ulbrich President and Chief Executive Officer March 2021

5 | JLL 2020 Annual Report
How 2020 changed real estate (and how it didn’t)Shopping, work, travel: In a turbulent year, commercial real estate was at the center of big changes
The pandemic left hardly any business or industry untouched, but real estate was front and center for many of the biggest shifts.
The offices where we work, the pivot to hybrid working models, warehouses facilitating the boom in online-shopping, hotels and malls that went quiet during travel restrictions and lockdowns — these sectors became a cornerstone of idle chats well beyond commercial real estate circles. But other parts of life and business have continued apace. Sustainability initiatives are forging ahead. Interest rates are low, and demand for commercial real estate continues to rise. Offices will change, but workers are eager to head back.
It’s worth looking back at a year that changed real estate, and crucially at trends that have largely stayed the course.

JLL 2020 Annual Report | 6

7 | JLL 2020 Annual Report
Shopping E-commerce accelerated massively in 2020 as shoppers stuck at home flocked online.
“What we’ve seen is a permanent shift in consumer habits,” says Michael Ignatiadis, head of Supply Chain Consultancy, Asia Pacific, at JLL. “And this means that e-commerce and logistics needs to transform at an incredible pace to keep up.”
Compared to traditional logistics operations, e-commerce is more labor intensive, and requires three times more warehouse space. That’s part of the reason behind increased investor demand for industrial real estate across the world.
Work A year of mass lockdowns that forced people to work from home demonstrated that many roles can be performed remotely, spurring companies to adopt new, hybrid working models.
The shift was already underway at many businesses, but likeso many things, the pace accelerated due to Covid-19.
“Companies of all kinds are seizing a once-in-a-lifetime opportunity to change the office model and lean into workforce preferences,” says Marie Puybaraud, Director of Global Research at JLL.
Travel From business trips to tourism, 2020 saw a dramatic decline in travel and a difficult year for the hospitality industry. While there is little doubt that travel will come back strong, hospitality operators in the meantime have had to get creative, for instance by looping themselves into the remote-working culture.
Room sizes are another expected change, says Geraldine Guichardo, Director of Research, Hotels, at JLL. Over the last decade, average room sizes shrunk 31 percent, according to JLL data. But now, as guest preferences change, spaces are likely to expand.
Bigger rooms “can provide a flexible environment for telecommuting, room for exercise and space for longer-term stays,” she says. “This will form a new guest-experience paradigm of ‘work, stay and play’.”
Compared to traditional logistics operations, e-commerce is more labor intensive, and requires three times more warehouse space.
What’s changed?

JLL 2020 Annual Report | 8
Work Many aspects of work won’t change. People will still need to collaborate and innovate with colleagues and managers on projects and to advance careers. These are some of the reasons why people missed the office and why offices will retain a central role in corporate life.
An independent survey comissioned by JLL of 2,000 office workers in 10 countries showed nearly three quarters of respondents still want the ability to come into an office, while 70% consider the office as the best place for team building and connecting with management.
Low interest rates Interest rates at central banks have been at record lows for over a decade, and in 2020 the Federal Reserve sent its key rate back to effectively zero.
With the low-rate environment expected to persist in the coming years alongside supportive government stimulus, allocations to commercial real estate are expected to continue rising.
Sustainability efforts During past economic downturns, projects around the environment and corporate responsibility often lost ground as companies turned attention to the bottom line. But during this crisis companies have remained focused on sustainability.
“Covid-19 heightened the need for resilience,” says Richard Batten, Global Chief Sustainability Officer at JLL.
“Not just the operation of the buildings and transportation but also for the people working, living and thriving in our cities. Covid-19 proved that what existed previously just did not work; it proved we all need to build back better, build back greener.”
From business trips to tourism, 2020 saw a dramatic decline in travel and a difficult year for the hospitality industry.
What’s more of the same?

9 | JLL 2020 Annual Report
Why workplace design is focusing on technology
Keeping the office germ-free through technologyLandlords and businesses are racing to redesign offices to meet new health requirements and a workforce’s heightened expectations around wellbeing.
It’s not just about moving desks six feet apart or putting barriers between them. New air filters, signage routing people to the coffee maker, and high-tech products previously seen as optional — like ultra-violet (UV) lights to disinfect surfaces, or ways to use elevators without pushing any buttons — have moved front and center.
Covid-19 is fundamentally changing how offices look and operate. Despite costs involved, workers’ wellbeing is driving the modifications.
“Knowing these precautions are in place can give employees confidence that their return to work will be safe,” says Ashley Rowland Taylor, Director, Strategy for Big Red Rooster, a JLL company. “The thing that we need to be cognizant of in designing post-Covid workspaces is to not over-engineer health and safety in a way that makes it feel sterile.”
With this in mind, companies are looking to technology-based solutions first.
Many organizations have already adopted touchless office technologies, such as bathrooms with light-activated sinks and hand dryers. Now, technologies that were seen as nice-to-have — from apps on mobile phones to control lighting, temperature and audio visual equipment, to doors and elevators that open with corporate badges — are being added to reduce employee contact and ensure cleanliness.
Blue Cross Blue Shield has even adopted a quick response (QR) code program for cleaning desks and conference rooms.
“Basically, after somebody finishes with their desk or meeting room, they scan a QR code, which then notifies a porter to immediately come in and clean it,” says Nakira Carter, Vice President, PDS at JLL. “So if someone comes in 15 minutes after you’ve left, they can feel very confident that the desk or meeting room they are in has been cleaned and sanitized.”
Companies have also started using UV light to disinfect offices when no one is around, since UV rays can be harmful to humans. Columbia University’s Center for Radiological Research has developed new light technology, called far-UVC, which in low doses can kill viruses and bacteria without producing harmful rays.
New health standards have companies adapting offices with a focus on tech

JLL 2020 Annual Report | 10
Shaping the futureCompanies have been finding creative ways for employees to keep their distance in the office. Some have installed “desk pods” for up to four employees that allow collaboration while still being physically distant. Others are utilizing unoccupied meeting rooms.
“You’re going to start seeing collaboration spaces being used more creatively,” says Carter. “They can house two or three employees at a time while still socially distancing from each other.”
Although employees might not go into the office every day — they may work from home or a coworking space to avoid long commutes — it’s going to become a place where people go to collaborate, engage and interact with their colleagues, and less so about sitting at a desk all day.
“I think (the office) will be much more dispersed, it will be more purpose-fit,” says Luke Rondel, Director of Channel Partnerships at Saltmine, speaking at the MIT World Real Estate Forum. “So less of a generic desk in a building with 1,000 of your colleagues.”

11 | JLL 2020 Annual Report
How the real estate industry is protecting cities from climate changeBetter building standards are among efforts to help the built environment withstand the changing climate

Wildfires, hurricanes and flooding are among the extreme weather events pressuring the real estate industry to ensure the that built environment can cope with the effects of climate change.
One solution gaining traction is a way to protect properties worth billions of dollars with better design and efficiency standards. These standards make sure buildings are able to withstand an increasing range of climate conditions and hazards.
In recent years, many global frameworks and standards have been introduced around low emissions, net-zero carbon and green buildings. But until recently, few provided guidance or measured resilience to climate-related impacts.
“Green and net-zero buildings are so important from a climate mitigation perspective, but we also need to consider resilience,” says Cynthia Curtis, SVP Sustainability Stakeholder Engagement in JLL’s global sustainability team.
“Building codes and standards can be an effective way of minimizing the effects of extreme weather on buildings and communities,” she says.
For instance, codes can promote the use of wind or heat-resistant construction, or better storm-water management.
Voluntary standards are also being developed to guide resilient design. Take RELi, a first-of-its-kind rating system and certification focused on climate resilience such as planning and design, emergency preparedness and social cohesion.
“Green building standards mitigate a property’s impact on the environment, but resilience is about ensuring the built environment can withstand outside effects,” Curtis says.
JLL 2020 Annual Report | 12

13 | JLL 2020 Annual Report
Designing for the decades aheadCities in the U.S., Canada and Australia are leading the way in implementing other new standards.
Boston has a climate advisory group as well as policies that require climate resilience measures in new developments. The city also has established the Climate Ready Boston initiative to ensure that major projects consider future climate scenarios in their planning.
Toronto and Melbourne have produced checklists and guidelines covering areas such as extreme temperature events, back-up power generation for critical services, flood mitigation and occupier preparedness to improve climate resilience planning in new developments or major redevelopments.
“Local authorities in these markets are putting a stake in the ground and saying resilience is an area of importance going forward,” says Matthew McAuley, Director, Global Research, JLL.
In accordance with the recommendations from the Taskforce on Climate-related Financial Disclosure (TCFD), we’ve undertaken an evaluation of the potential risks and opportunities to our business resulting from climate change.
Specifically, we analyzed the impacts of two climate scenarios that represent aggressive mitigation resulting in < 2° C warming, and intermediate mitigation resulting in 2°– 3.7° C warming. Our findings are published in JLL’s Global Sustainability Report.
The risk of ignoring resilience standards
Resilience is moving up the real estate agenda because investors increasingly want to understand how to guard against future risks and financial losses.
For example, more resilient buildings often require less ongoing expenditure, and can be better equipped to return to normal operations following short-term disruptions.
“A certain amount of climate change is now baked in and the industry needs to take that into account on construction or developments that are expected to last decades,” McAuley says.
The risks are clear. Assets that aren’t climate-proofed risk obsolescence and lack of interest from future investors. There is further regulatory risk as mandatory standards rise, as well as extra costs associated with retrofitting properties to meet new measures.

“There is a push on the regulatory front and investors are asking whether this trend is going to get stronger so they can be prepared,” says McAuley.
Taking transparency to new heightsThe imperative to tackle climate change has presented the property industry with new transparency pressures in recent years.
Climate action plans have helped countries like Belgium join the top improvers in JLL’s Global Transparency Index, which includes new benchmarks measuring resilience initiatives in anticipation of this growing trend.
But while sustainability becomes a mainstream issue for governments, real estate investors and corporate occupiers, mandatory measures are still limited.
McAuley expects resilience standards to quickly move up the agenda as investors phase out non-certified buildings from their portfolios and look for a minimum climate-proofing standard in new acquisitions. Others could retrofit properties to meet resilience criteria.
Investors who fail to take future climate impacts seriously could be left behind, McAuley says.
“To withstand the test of time, assets need to meet sustainability targets and resiliency measures will become an important aspect of that,” he says.
JLL 2020 Annual Report | 14
Hurricane Irma striking Miami, Florida
Click here to read the JLL’s Global Transparency Index
15 | JLL 2020 Annual Report
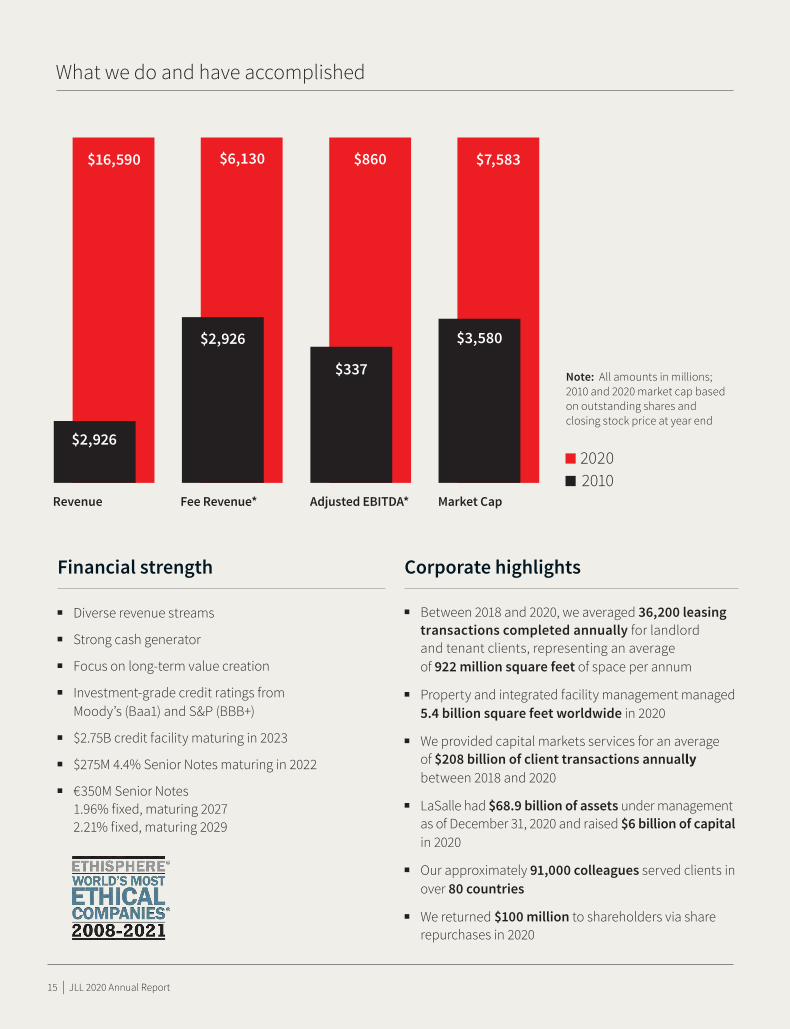
Financial strength
n Diverse revenue streams
�n Strong cash generator
��n Focus on long-term value creation
�n Investment-grade credit ratings from Moody’s (Baa1) and S&P (BBB+)
�n $2.75B credit facility maturing in 2023
�n $275M 4.4% Senior Notes maturing in 2022
�n €350M Senior Notes 1.96% fixed, maturing 2027 2.21% fixed, maturing 2029
Corporate highlights
�n Between 2018 and 2020, we averaged 36,200 leasing transactions completed annually for landlord and tenant clients, representing an average of 922 million square feet of space per annum
�n Property and integrated facility management managed 5.4 billion square feet worldwide in 2020
n We provided capital markets services for an average of $208 billion of client transactions annually between 2018 and 2020
�n LaSalle had $68.9 billion of assets under management as of December 31, 2020 and raised $6 billion of capital in 2020
�n Our approximately 91,000 colleagues served clients in over 80 countries
�n We returned $100 million to shareholders via share repurchases in 2020
What we do and have accomplished
Note: All amounts in millions; 2010 and 2020 market cap based on outstanding shares and closing stock price at year end
n�2020�n���2010 �
$2,926
$16,590
Revenue Fee Revenue*
$6,130
$2,926
Adjusted EBITDA*
$337
$860
Market Cap
$3,580
$7,583
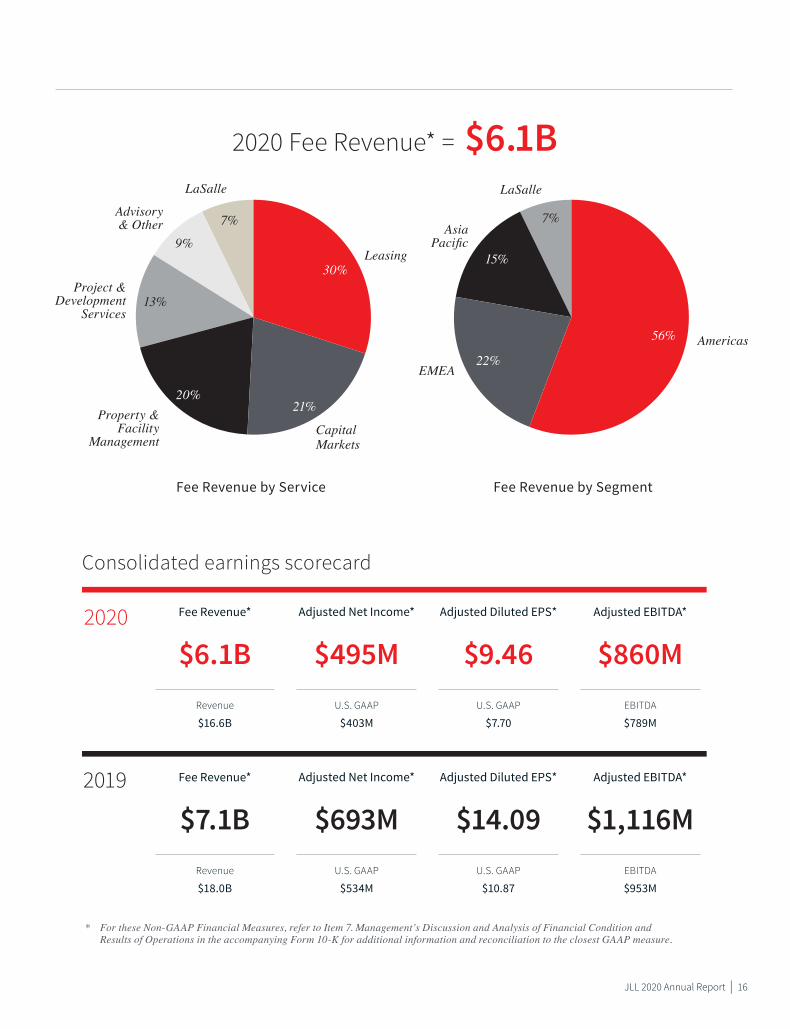
2020 Fee Revenue* = $6.1B
Consolidated earnings scorecard
* For these Non-GAAP Financial Measures, refer to Item 7. Management’s Discussion and Analysis of Financial Condition and Results of Operations in the accompanying Form 10-K for additional information and reconciliation to the closest GAAP measure.
U.S. GAAP
$534M
$693MRevenue
$18.0B
$7.1BU.S. GAAP
$10.87
$14.09EBITDA
$953M
$1,116M2019 Adjusted Net Income*Fee Revenue* Adjusted Diluted EPS* Adjusted EBITDA*
U.S. GAAP
$403M
$495MRevenue
$16.6B
$6.1B2020
U.S. GAAP
$7.70
$9.46EBITDA
$789M
$860MAdjusted Net Income*Fee Revenue* Adjusted Diluted EPS* Adjusted EBITDA*
Fee Revenue by Segment
Asia Pacific
LaSalle
9%
7%
22%
15%
20%
13%
56%
30%
21%
EMEA
Americas
Fee Revenue by Service
Leasing
Advisory & Other
Property & Facility
ManagementCapital Markets
Project & Development
Services
LaSalle
7%
JLL 2020 Annual Report | 16
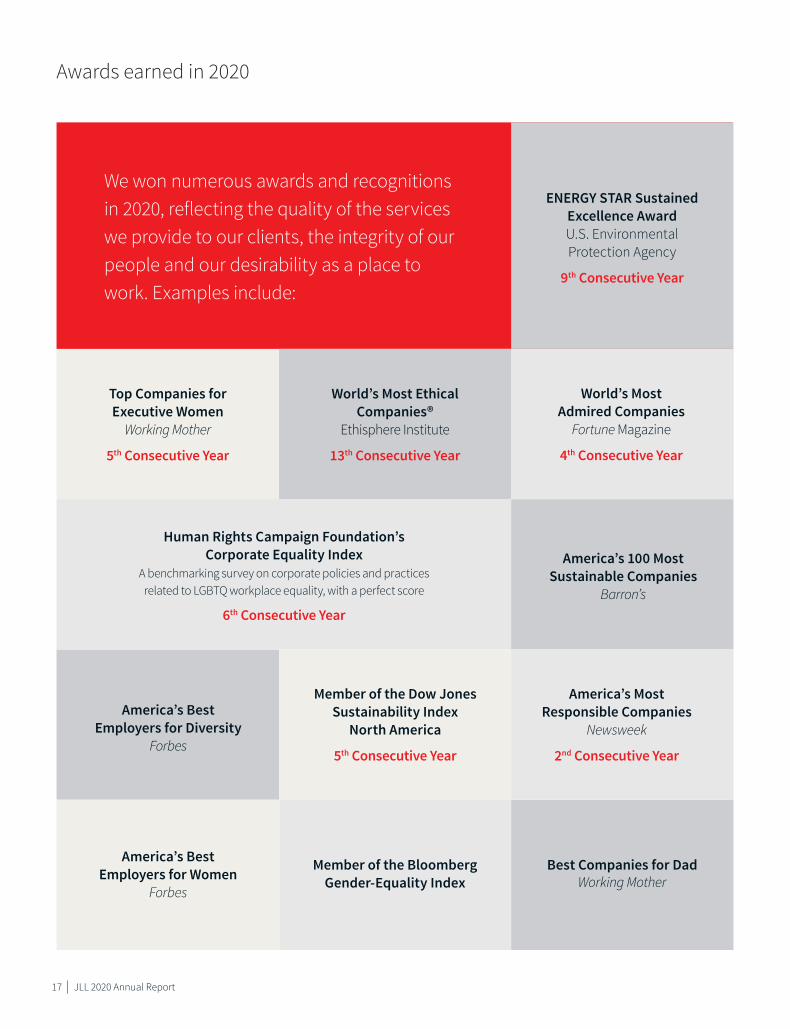
Awards earned in 2020
We won numerous awards and recognitions in 2020, reflecting the quality of the services we provide to our clients, the integrity of our people and our desirability as a place to work. Examples include:
Best Companies for Dad Working Mother
Human Rights Campaign Foundation’s Corporate Equality Index
A benchmarking survey on corporate policies and practices related to LGBTQ workplace equality, with a perfect score
6th Consecutive Year
Top Companies for Executive Women
Working Mother
5th Consecutive Year
World’s Most Ethical Companies®
Ethisphere Institute
13th Consecutive Year
Member of the Bloomberg Gender-Equality Index
America’s 100 Most Sustainable Companies
Barron’s
ENERGY STAR Sustained Excellence Award U.S. Environmental Protection Agency
9th Consecutive Year
America’s Best Employers for Diversity
Forbes
World’s Most Admired Companies
Fortune Magazine
4th Consecutive Year
Member of the Dow Jones Sustainability Index
North America
5th Consecutive Year
America’s Most Responsible Companies
Newsweek
2nd Consecutive Year
America’s Best Employers for Women
Forbes
17 | JLL 2020 Annual Report
United States Securities and Exchange Commission
Washington, D.C. 20549
Form 10-KAnnual Report Pursuant to Section 13 or 15(d) of the Securities Act of 1934
For the fiscal year ended December 31, 2020 Commission File Number 1-13145
Jones Lang LaSalle Incorporated (Exact name of registrant as specified in its charter)
Maryland 36-4150422(State or other jurisdiction of incorporation or organization) (I.R.S. Employer Identification No.)
200 East Randolph Drive Chicago, IL 60601
(Address of principal executive offices) (Zip Code)Registrant's telephone number, including area code: (312) 782-5800
Securities registered pursuant to Section 12(b) of the Act:Title of each class Trading Symbol Name of each exchange on which registered
Common Stock, par value $0.01 JLL The New York Stock ExchangeSecurities registered pursuant to Section 12(g) of the Act: None
Indicate by check mark if the registrant is a well-known seasoned issuer, as defined in Rule 405 of the Securities Act. Yes x No o
Indicate by check mark if the registrant is not required to file reports pursuant to Section 13 or 15(d) of the Act. Yes o No x
Indicate by check mark whether the registrant (1) has filed all reports required to be filed by Section 13 or 15(d) of the Securities Exchange Act of 1934 during the preceding 12 months (or for such shorter period that the registrant was required to file such reports), and (2) has been subject to such filing requirements for the past 90 days. Yes x No ☐
Indicate by check mark whether the registrant has submitted electronically every Interactive Data File required to be submitted pursuant to Rule 405 of Regulation S-T (§232.405 of this chapter) during the preceding 12 months (or for such period that the registrant was required to submit such files). Yes x No ☐
Indicate by check mark whether the registrant is a large accelerated filer, an accelerated filer, a non-accelerated filer, a smaller reporting company, or an emerging growth corporation (as defined in Rule 12b-2 of the Exchange Act).
Large accelerated filer x Accelerated filer ☐ Non-accelerated filer ☐Smaller reporting
company ☐Emerging growth
company ☐
If an emerging growth company, indicate by check mark if the registrant has elected not to use the extended transition period for complying with any new or revised financial accounting standards provided pursuant to Section 13(a) of the Exchange Act. ☐
Indicate by check mark whether the registrant has filed a report on and attestation to its management's assessment of the effectiveness of its internal control over financial reporting under Section 404(b) of the Sarbanes-Oxley Act (15 U.S.C. 7262(b)) by the registered public accounting firm that prepared or issued its audit report. x
Indicate by check mark whether the registrant is a shell company (as defined in Rule 12b-2 of the Exchange Act). Yes ☐ No x
The aggregate market value of the voting stock (common stock) held by non-affiliates of the registrant as of the close of business on June 30, 2020 was $5,309,965,418.
The number of shares outstanding of the registrant's common stock (par value $0.01) as of the close of business on February 12, 2021 was 51,110,770.
Portions of the Registrant's Proxy Statement for its 2021 Annual Meeting of Shareholders are incorporated by reference in Part III of this report.
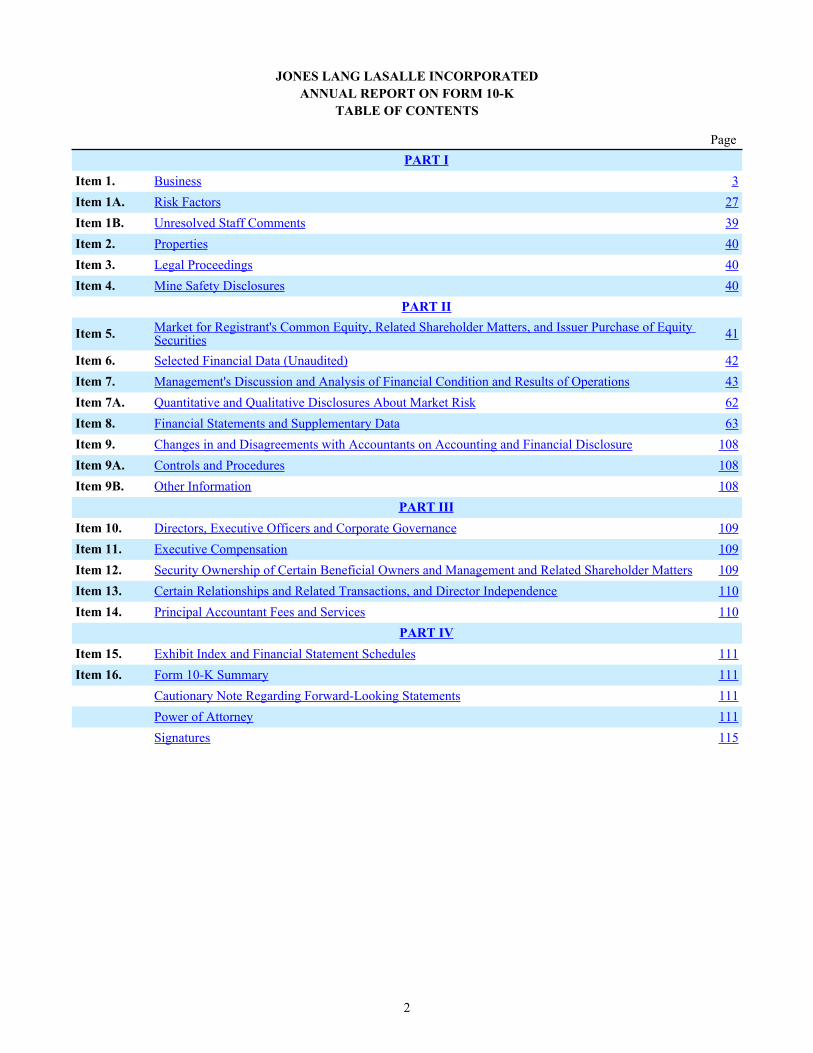
JONES LANG LASALLE INCORPORATEDANNUAL REPORT ON FORM 10-K
TABLE OF CONTENTS
PagePART I
Item 1. Business 3Item 1A. Risk Factors 27Item 1B. Unresolved Staff Comments 39Item 2. Properties 40Item 3. Legal Proceedings 40Item 4. Mine Safety Disclosures 40
PART II
Item 5. Market for Registrant's Common Equity, Related Shareholder Matters, and Issuer Purchase of Equity Securities 41
Item 6. Selected Financial Data (Unaudited) 42Item 7. Management's Discussion and Analysis of Financial Condition and Results of Operations 43Item 7A. Quantitative and Qualitative Disclosures About Market Risk 62Item 8. Financial Statements and Supplementary Data 63Item 9. Changes in and Disagreements with Accountants on Accounting and Financial Disclosure 108Item 9A. Controls and Procedures 108Item 9B. Other Information 108
PART IIIItem 10. Directors, Executive Officers and Corporate Governance 109Item 11. Executive Compensation 109Item 12. Security Ownership of Certain Beneficial Owners and Management and Related Shareholder Matters 109Item 13. Certain Relationships and Related Transactions, and Director Independence 110Item 14. Principal Accountant Fees and Services 110
PART IVItem 15. Exhibit Index and Financial Statement Schedules 111Item 16. Form 10-K Summary 111
Cautionary Note Regarding Forward-Looking Statements 111Power of Attorney 111Signatures 115
2
PART I
ITEM 1. BUSINESS
COMPANY OVERVIEW
Jones Lang LaSalle Incorporated, incorporated in 1997, is a Maryland corporation. References to “JLL,” “the Company,” “we,” “us” and “our” refer to Jones Lang LaSalle Incorporated and include all of its consolidated subsidiaries, unless otherwise indicated or the context requires otherwise. Our common stock is listed on The New York Stock Exchange ("NYSE") under the symbol “JLL.”
JLL is a leading professional services firm that specializes in real estate and investment management. We shape the future of real estate for a better world by using the most advanced technology to create rewarding opportunities, amazing spaces and sustainable real estate solutions for our clients, our people and our communities. JLL is a Fortune 500 company with annual revenue of $16.6 billion, operations in over 80 countries and a global workforce of approximately 91,000 as of December 31, 2020. We provide services for a broad range of clients who represent a wide variety of industries and are based in markets throughout the world. Our clients vary greatly in size and include for-profit and not-for-profit entities, public-private partnerships and governmental ("public sector") entities looking to outsource real estate services. Through LaSalle Investment Management, we invest for clients on a global basis in both private assets and publicly traded real estate securities.
We use JLL as our principal trading name. Jones Lang LaSalle Incorporated remains our legal name. JLL is a registered trademark in the countries in which we do business, as is our logo. In addition, LaSalle Investment Management, which uses LaSalle as its principal trading name, is a wholly-owned subsidiary of Jones Lang LaSalle Incorporated. LaSalle is also a registered trademark in the countries in which we conduct business, as is our logo.
We deliver an array of services across four business segments. We manage our Real Estate Services (“RES”) offerings across three geographic segments (i) the Americas, (ii) Europe, Middle East and Africa ("EMEA"), and (iii) Asia Pacific, and we manage our investment management business globally as (iv) LaSalle Investment Management. In our Americas, EMEA and Asia Pacific segments, we provide a full range of leasing, capital markets, integrated property and facility management, project management, advisory, consulting, valuations and digital solutions services locally, regionally and globally. LaSalle is one of the world's largest and most diversified real estate investment management companies.
Our global platform and diverse service and product offerings position us to take advantage of the opportunities in a consolidating industry and to successfully navigate the dynamic and challenging markets in which we compete worldwide.
OUR HISTORY
We began to establish our network of services across the globe through the 1999 merger of the Jones Lang Wootton companies ("JLW", founded in England in 1783) with LaSalle Partners Incorporated ("LaSalle Partners", founded in the United States in 1968 and incorporated in 1997). We have grown our business by expanding our client base and the range of our services and products, both organically and through a series of mergers and acquisitions. Our extensive global platform and in-depth knowledge of local real estate markets enable us to serve as a single-source provider of solutions for the full spectrum of our clients' real estate needs. These mergers and acquisitions have given us additional share in key geographical markets, expanded our capabilities in certain service offerings and further broadened the global platform we make available to our clients.
For information on recent acquisitions, refer to Note 4, Business Combinations, Goodwill and Other Intangible Assets, of the Notes to the Consolidated Financial Statements, included in Item 8.
Table of Contents
3
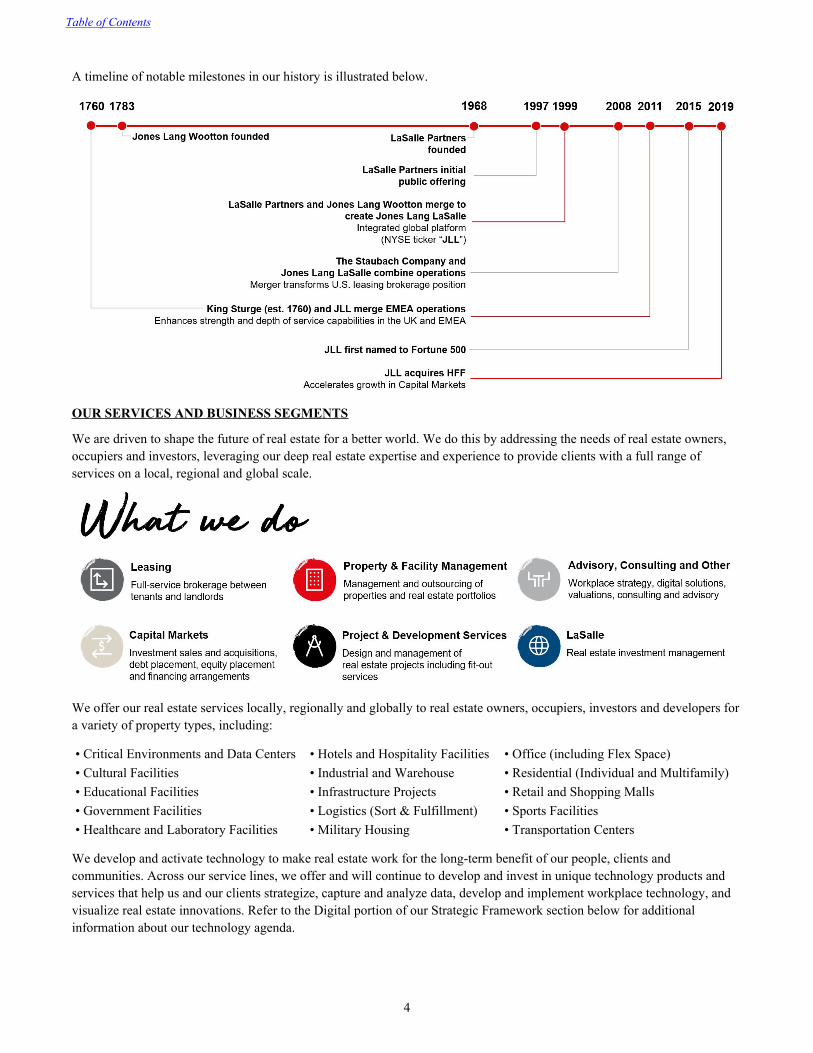
A timeline of notable milestones in our history is illustrated below.
OUR SERVICES AND BUSINESS SEGMENTS
We are driven to shape the future of real estate for a better world. We do this by addressing the needs of real estate owners, occupiers and investors, leveraging our deep real estate expertise and experience to provide clients with a full range of services on a local, regional and global scale.
We offer our real estate services locally, regionally and globally to real estate owners, occupiers, investors and developers for a variety of property types, including:
• Critical Environments and Data Centers • Hotels and Hospitality Facilities • Office (including Flex Space)• Cultural Facilities • Industrial and Warehouse • Residential (Individual and Multifamily)• Educational Facilities • Infrastructure Projects • Retail and Shopping Malls• Government Facilities • Logistics (Sort & Fulfillment) • Sports Facilities• Healthcare and Laboratory Facilities • Military Housing • Transportation Centers
We develop and activate technology to make real estate work for the long-term benefit of our people, clients and communities. Across our service lines, we offer and will continue to develop and invest in unique technology products and services that help us and our clients strategize, capture and analyze data, develop and implement workplace technology, and visualize real estate innovations. Refer to the Digital portion of our Strategic Framework section below for additional information about our technology agenda.
Table of Contents
4
We believe our market reach and depth of service offerings strengthen the long-term value of the enterprise in a number of ways, including (i) reducing the potential impact of episodic volatility or disruption in any specific region, (ii) enhancing the expertise of our people through knowledge sharing among colleagues across the globe, and (iii) allowing us to identify and quickly react to emerging trends, risks and opportunities.
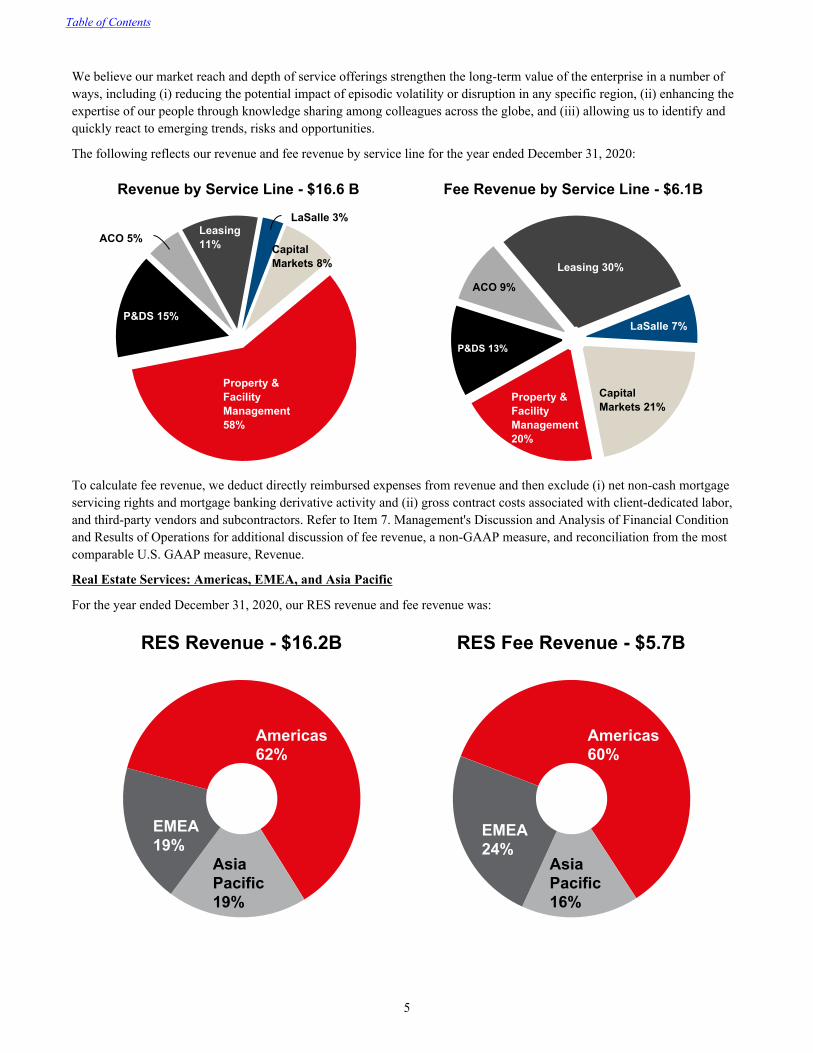
The following reflects our revenue and fee revenue by service line for the year ended December 31, 2020:
Revenue by Service Line - $16.6 B
Leasing11%
LaSalle 3%
CapitalMarkets 8%
Property &FacilityManagement58%
P&DS 15%
ACO 5%
Fee Revenue by Service Line - $6.1B
Leasing 30%
LaSalle 7%
CapitalMarkets 21%
Property &FacilityManagement20%
P&DS 13%
ACO 9%
To calculate fee revenue, we deduct directly reimbursed expenses from revenue and then exclude (i) net non-cash mortgage servicing rights and mortgage banking derivative activity and (ii) gross contract costs associated with client-dedicated labor, and third-party vendors and subcontractors. Refer to Item 7. Management's Discussion and Analysis of Financial Condition and Results of Operations for additional discussion of fee revenue, a non-GAAP measure, and reconciliation from the most comparable U.S. GAAP measure, Revenue.
Real Estate Services: Americas, EMEA, and Asia Pacific
For the year ended December 31, 2020, our RES revenue and fee revenue was:
RES Revenue - $16.2B
Americas62%
AsiaPacific19%
EMEA19%
RES Fee Revenue - $5.7B
Americas 60%
AsiaPacific16%
EMEA24%
Table of Contents
5
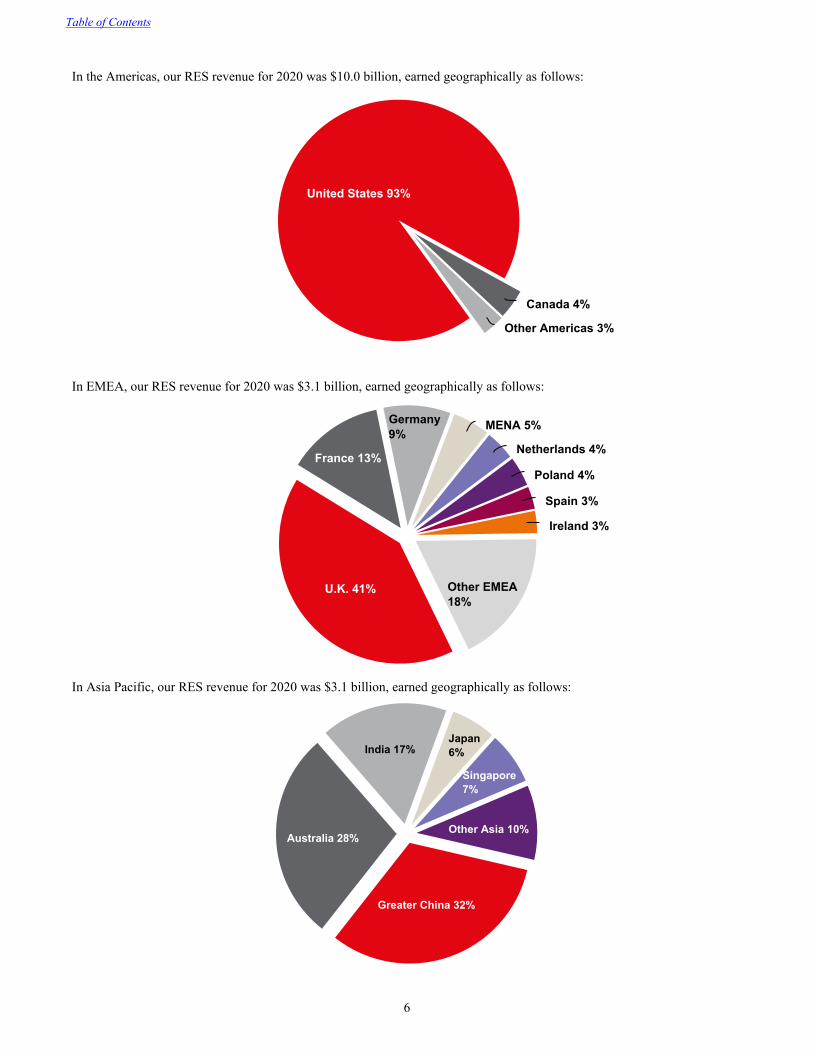
In the Americas, our RES revenue for 2020 was $10.0 billion, earned geographically as follows:
United States 93%
Canada 4%
Other Americas 3%
In EMEA, our RES revenue for 2020 was $3.1 billion, earned geographically as follows:
U.K. 41%
France 13%
Germany9%
MENA 5%
Netherlands 4%
Poland 4%
Spain 3%
Ireland 3%
Other EMEA18%
In Asia Pacific, our RES revenue for 2020 was $3.1 billion, earned geographically as follows:
Greater China 32%
Australia 28%
India 17%Japan6%
Singapore7%
Other Asia 10%
Table of Contents
6
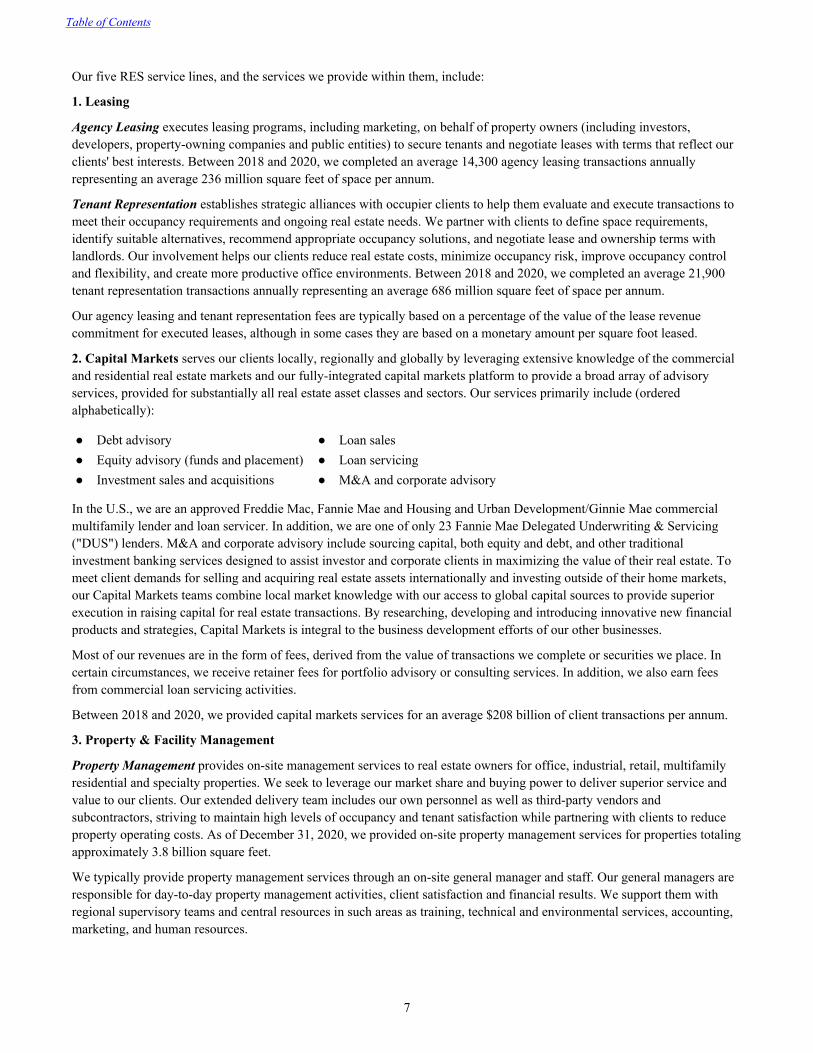
Our five RES service lines, and the services we provide within them, include:
1. Leasing
Agency Leasing executes leasing programs, including marketing, on behalf of property owners (including investors, developers, property-owning companies and public entities) to secure tenants and negotiate leases with terms that reflect our clients' best interests. Between 2018 and 2020, we completed an average 14,300 agency leasing transactions annually representing an average 236 million square feet of space per annum.
Tenant Representation establishes strategic alliances with occupier clients to help them evaluate and execute transactions to meet their occupancy requirements and ongoing real estate needs. We partner with clients to define space requirements, identify suitable alternatives, recommend appropriate occupancy solutions, and negotiate lease and ownership terms with landlords. Our involvement helps our clients reduce real estate costs, minimize occupancy risk, improve occupancy control and flexibility, and create more productive office environments. Between 2018 and 2020, we completed an average 21,900 tenant representation transactions annually representing an average 686 million square feet of space per annum.
Our agency leasing and tenant representation fees are typically based on a percentage of the value of the lease revenue commitment for executed leases, although in some cases they are based on a monetary amount per square foot leased.
2. Capital Markets serves our clients locally, regionally and globally by leveraging extensive knowledge of the commercial and residential real estate markets and our fully-integrated capital markets platform to provide a broad array of advisory services, provided for substantially all real estate asset classes and sectors. Our services primarily include (ordered alphabetically):
● Debt advisory ● Loan sales● Equity advisory (funds and placement) ● Loan servicing● Investment sales and acquisitions ● M&A and corporate advisory
In the U.S., we are an approved Freddie Mac, Fannie Mae and Housing and Urban Development/Ginnie Mae commercial multifamily lender and loan servicer. In addition, we are one of only 23 Fannie Mae Delegated Underwriting & Servicing ("DUS") lenders. M&A and corporate advisory include sourcing capital, both equity and debt, and other traditional investment banking services designed to assist investor and corporate clients in maximizing the value of their real estate. To meet client demands for selling and acquiring real estate assets internationally and investing outside of their home markets, our Capital Markets teams combine local market knowledge with our access to global capital sources to provide superior execution in raising capital for real estate transactions. By researching, developing and introducing innovative new financial products and strategies, Capital Markets is integral to the business development efforts of our other businesses.
Most of our revenues are in the form of fees, derived from the value of transactions we complete or securities we place. In certain circumstances, we receive retainer fees for portfolio advisory or consulting services. In addition, we also earn fees from commercial loan servicing activities.
Between 2018 and 2020, we provided capital markets services for an average $208 billion of client transactions per annum.
3. Property & Facility Management
Property Management provides on-site management services to real estate owners for office, industrial, retail, multifamily residential and specialty properties. We seek to leverage our market share and buying power to deliver superior service and value to our clients. Our extended delivery team includes our own personnel as well as third-party vendors and subcontractors, striving to maintain high levels of occupancy and tenant satisfaction while partnering with clients to reduce property operating costs. As of December 31, 2020, we provided on-site property management services for properties totaling approximately 3.8 billion square feet.
We typically provide property management services through an on-site general manager and staff. Our general managers are responsible for day-to-day property management activities, client satisfaction and financial results. We support them with regional supervisory teams and central resources in such areas as training, technical and environmental services, accounting, marketing, and human resources.
Table of Contents
7
We are generally compensated based upon a percentage of cash collections we make on behalf of our clients or square footage managed; in some cases, management agreements provide for incentive compensation relating to operating expense reductions, gross revenue or occupancy objectives, or tenant satisfaction levels. Consistent with industry custom, management contract terms typically range from one to three years, although some contracts can be terminated at will at any time following a short notice period, usually 30 to 120 days, as is typical in the industry.
Integrated Facilities Management ("IFM") provides comprehensive facility management services to corporations and institutions that outsource the management of the real estate they occupy, typically those with large portfolios (usually over one million square feet) that offer significant opportunities to reduce costs, meet sustainability targets, improve service delivery and enhance end-user experience. Our IFM offering blends human, digital and experiential elements to help clients achieve optimal financial and operational results from their facilities, while also enhancing the experience and productivity of the end-user. Our extended delivery team includes our own personnel as well as third-party vendors and subcontractors who can meet clients' needs by providing consistent service delivery worldwide and a single point of contact from their real estate service providers.
Solutions include:
• Full-service IFM outsourcing: Day-to-day operations management of client site locations, delivered through a globally integrated platform with standardized processes. Facilities under management cover all real estate asset classes, including corporate headquarters, distribution facilities, hospitals, research & development facilities, data centers and industrial complexes. As of December 31, 2020, IFM managed approximately 1.6 billion square feet of real estate for our clients.
• Technology-enabled IFM solutions: Technology is the backbone of our IFM offering. Facilities teams leverage advanced products to enhance the experience of end users as well as make faster and more informed decisions, manage compliance, and improve efficiency through automation, accountability, assets, and analytics. One example is Corrigo, which enables facilities managers to easily manage work orders, centralizing repair, maintenance, and analytics as well as automating tasks. We also provide technology-enabled predictive maintenance strategies and smart building technologies which can help extend the lifespan of costly equipment while preventing system failures.
• Mobile engineering services: We provide mobile engineering services to clients with large portfolios of sites or where we have multiple clients in proximity to each other. This model reduces clients' operating costs by offering a single point of contact for services, bundling on-site services, leveraging resources across multiple accounts, and reducing travel time between sites.
IFM contracts are typically structured to include reimbursement for costs of client-dedicated personnel and third-party vendors and subcontractors in addition to a base fee and performance-based fees. Performance-based fees result from achieving quantitative performance measures and/or target scores on recurring client satisfaction surveys. IFM agreements are typically three to seven years in duration, although most contracts can be terminated at will by the client upon a short notice period, usually 30 to 60 days, as is typical in the industry.
4. Project & Development Services provides consulting, design, management and build services to tenants of leased space, owners in self-occupied buildings and owners of real estate investments, leveraging technology to drive outstanding service delivery. We bring a "life cycle" perspective to our clients, from consulting and capital management through design, construction and occupancy. In addition, we provide these services to public-sector clients, particularly to military and government entities, as well as educational institutions, primarily in the U.S. and to a growing extent in other countries. Predominantly in Europe, we provide design, fit-out and refurbishment services under the Tétris brand.
Our Project & Development Services business is generally compensated on the basis of negotiated fees as well as reimbursement of costs when we are principal to a contract (or client). Individual projects are generally completed in less than one year, but client contracts may extend multiple years in duration and govern a number of discrete projects.
Table of Contents
8
5. Advisory, Consulting and Other
Advisory and Consulting provides clients with specialized, value-added real estate consulting services in such areas as technology implementation and optimization, mergers and acquisitions, asset management, occupier portfolio strategy, workplace solutions, location advisory, industry research, financial optimization strategies, organizational strategy and Six Sigma process solutions. Our professionals focus on translating global best practices into local real estate solutions, creating optimal financial and operational results for our clients across asset classes.
We typically negotiate compensation for Advisory and Consulting based on developed work plans that vary based on the scope and complexity of projects.
Valuations Advisory delivers customized solutions to enable clients to take the fastest, best informed decisions for their investment interests throughout the life cycle. The services include valuation, secured lending advisory, transaction support, data & analytics, development advisory, asset and infrastructure advisory, financial reporting, business valuation, property tax advisory, restructuring and complex litigation. We are a sector based organization and have strong expertise in retail, alternatives & special use, infrastructure, public sector, office, residential, hotels & hospitality, agribusiness, healthcare, senior living, and industrial and logistics.
We usually negotiate compensation for Valuation Advisory services based on the scale and complexity of each assignment, and our fees typically relate in part to the value of the underlying assets.
Energy and Sustainability Services help occupiers and investors realize the positive impact of sustainability on their brand, workforce, financial statements and the environment. Like JLL, our clients are increasingly recognizing that there are both potential risks and opportunities associated with addressing the impacts of climate change, and are turning to partners like us for guidance and assistance. Our accredited energy and sustainability specialists worldwide assist clients with technologies and strategic solutions to deliver measurable improvements that yield clear environmental and societal benefits, as well as operational and cost efficiencies. This includes managing energy consumption and carbon footprint through sustainable construction and operations; providing green building assessments; leading green retrofits/upgrades; advising on occupier experience and engagement, socio-economic impacts and site locations; and creating corporate social responsibility and sustainability reports. The breadth of sustainability expertise positions us as the best choice to partner with clients, regardless of their focus, from leasing to capital markets transactions, and projects to facility management.
Refer to our latest Global Sustainability Report, available on our website, for metrics on documented energy savings, reduction in greenhouse gas emissions and the work of our sustainability teams.
We have a variety of compensation models for Energy and Sustainability Services including those based on shared savings as well as a fee for service, depending on the scale and complexity of the project.
Corporate Solutions
As a strategic partner of clients with a global footprint, Corporate Solutions brings together services across four of the five JLL RES service lines described above (Capital Markets services fall outside of the Corporate Solutions remit). Our global delivery platform enables consistent outcomes on both a local and global scale, and places us in a small cohort of competitors who can deliver on clients’ multi-service, multi-geography needs.
Rapid and complex change, including digitization, increasing regulation, globalization and evolving workforce demographics, have transformed the world of work. Organizations are realizing the potential for workplaces and real estate portfolios to help address broader business objectives, such as talent attraction, customer experience, employee well-being and productivity, financial performance and environmental sustainability (See Growth of Corporate Outsourcing in the Industry Trends section below). As clients buy with an increasingly global and/or multi-service mindset, they are looking to simplify and consolidate their supply chain with more integrated solutions. This puts Corporate Solutions in a unique position to help clients bring together their real estate ecosystem, simplify decision making and maximize value of their real estate investments.
While each client is unique, they are consistent in looking for real estate to enable business transformation around three key value levers: (1) making informed, data-driven decisions and digital transformation, (2) achieving operational excellence through improved productivity and financial performance, and (3) attracting and retaining key talent through an enhanced user experience.
Table of Contents
9

Our offering addresses the entire life cycle, which we consider to include portfolio, capital and operations functions.
Portfolio. Through the nexus of services our Corporate Solutions business provides to clients, we gain deep knowledge and extensive data about their corporate real estate footprints, business strategies and organizational priorities. Combining this with the expertise we draw from JLL's integrated global platform, we advise clients on how to optimize their workplace strategies and occupancy planning efforts to improve utilization and ultimately enhance the productivity and well-being of those who use the space. More broadly, this advice may extend to our clients’ portfolio strategies, including location advisory, technology implementation and optimization, and options to add and integrate flexible space solutions. When evolution of strategies dictates change, our Corporate Solutions business partners work with other professionals throughout our organization to help clients execute leasing, acquisition and disposition strategies.
Capital. Viewing workplaces as living environments that can help individuals, organizations and communities innovate and thrive, Corporate Solutions advises clients about how and when to make critical capital decisions to maximize the human and financial returns on portfolio investments. Our design & build professionals work alongside clients to capture and advance their organization’s brand identity, purpose and sustainability commitments through the design of space they occupy, including owned, leased, static and flexible environments. We then manage, and in some cases are responsible for, the successful completion of the fit-out activities to achieve their vision. Helping our clients manage the costs they incur to realize their space and location objectives is essential to that strategy. When capital decisions involve a change in location, our relocation management professionals facilitate smooth transitions.
Operations. IFM is our largest Corporate Solutions service offering. Composed of integrated, digitally-enabled and flexible services that blend human, digital and experiential elements, this offering helps clients drive enhanced value from their facilities by improving operational performance and the experience of employees and other users of the space. Most frequently, new client relationships are formed through IFM business wins, which we accomplish through transitions from other service providers or conversions from insourced real estate management models. In addition to maximizing efficiency and quality of service delivery, our digitally-enabled platform also provides clients with opportunities to tailor the balance of services we provide versus what they self-perform.
Business Intelligence, Data Management and Technology. Data and technology are core to all clients’ workplace and business transformation agendas. Our comprehensive data and technology platform underpins all of our offerings, helping clients make fast, informed decisions that enhance the performance of their workplaces, portfolios and people. Experts in our JLL Technologies group guide clients’ selection, implementation and management of real estate-related software and applications. The Corrigo ecosystem opens new client segments by revolutionizing end-to-end facility repair and maintenance service delivery, and helping clients find the best service providers.
LaSalle
Complementing our real estate services capabilities, our global real estate investment management business, LaSalle, is one of the world's largest managers of institutional and individual capital invested in real estate assets and securities. We seek to establish and maintain relationships of trust with sophisticated investors who value our global platform and extensive local market knowledge. Our three strategic priorities:
• Deliver superior risk-adjusted investment returns to our clients• Develop and execute investment strategies that meet the specific investment objectives of our clients• Deliver uniformly high levels of client service globally
Table of Contents
10
LaSalle provides clients with a broad range of real estate investment products and services in private and public capital markets. We design these products and services to meet the differing strategic, asset allocation, risk/return and liquidity requirements of our clients. The range of investment solutions includes private and public equity investments in multiple real estate property types, including traditional sectors such as office, retail, industrial, and multifamily residential, as well as emerging or specialized sectors such as healthcare, life sciences, self-storage and data centers. We also have established commercial debt investment vehicles in Europe and North America that diversify our capital stack exposure. We act either through commingled investment funds or single client account relationships ("separate accounts"). We also offer global indirect investments, primarily in private equity funds, joint ventures and co-investments, as well as publicly traded real estate investment trusts ("REITs") and other real estate equities. Where consistent with client requirements and market terms and conditions, LaSalle retains JLL to provide services to assets in LaSalle funds in the ordinary course of business.
We believe LaSalle's success is the product of our strong investment performance, research capabilities, experienced investment professionals, innovative investment strategies, global presence and coordinated platform, local market knowledge and steadfast client focus.
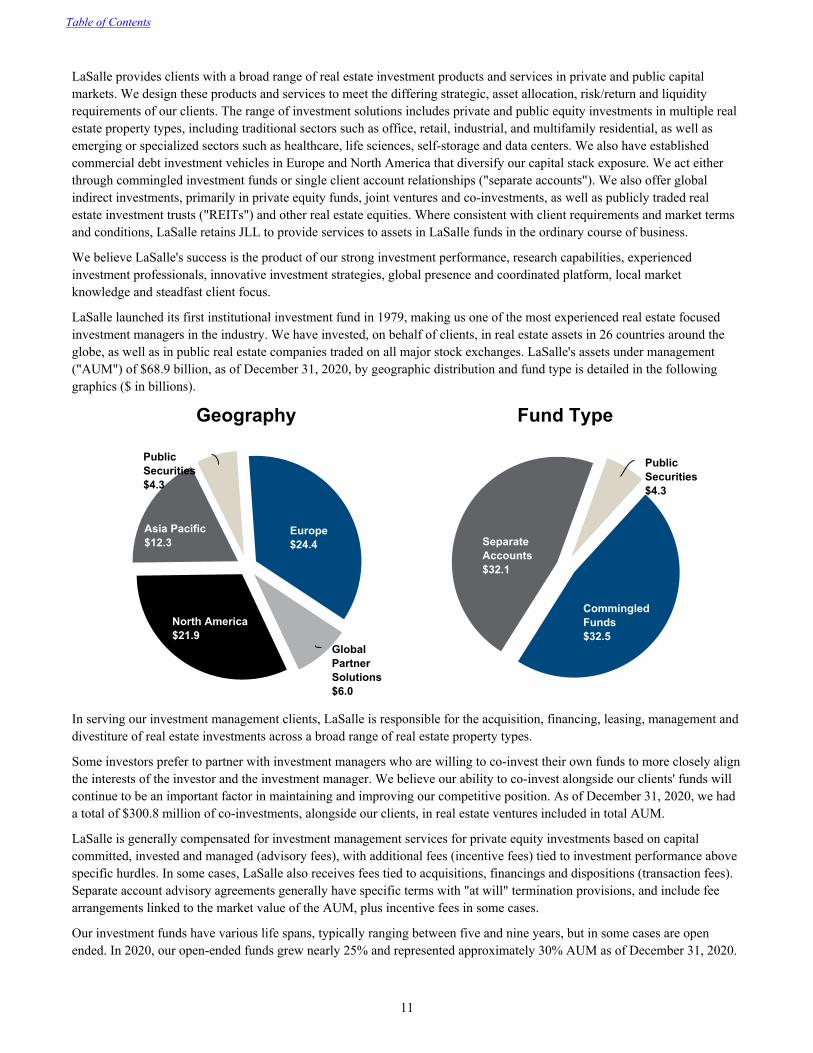
LaSalle launched its first institutional investment fund in 1979, making us one of the most experienced real estate focused investment managers in the industry. We have invested, on behalf of clients, in real estate assets in 26 countries around the globe, as well as in public real estate companies traded on all major stock exchanges. LaSalle's assets under management ("AUM") of $68.9 billion, as of December 31, 2020, by geographic distribution and fund type is detailed in the following graphics ($ in billions).
Geography
Europe$24.4
GlobalPartnerSolutions$6.0
North America$21.9
Asia Pacific$12.3
PublicSecurities$4.3
Fund Type
PublicSecurities $4.3
CommingledFunds$32.5
SeparateAccounts $32.1
In serving our investment management clients, LaSalle is responsible for the acquisition, financing, leasing, management and divestiture of real estate investments across a broad range of real estate property types.
Some investors prefer to partner with investment managers who are willing to co-invest their own funds to more closely align the interests of the investor and the investment manager. We believe our ability to co-invest alongside our clients' funds will continue to be an important factor in maintaining and improving our competitive position. As of December 31, 2020, we had a total of $300.8 million of co-investments, alongside our clients, in real estate ventures included in total AUM.
LaSalle is generally compensated for investment management services for private equity investments based on capital committed, invested and managed (advisory fees), with additional fees (incentive fees) tied to investment performance above specific hurdles. In some cases, LaSalle also receives fees tied to acquisitions, financings and dispositions (transaction fees). Separate account advisory agreements generally have specific terms with "at will" termination provisions, and include fee arrangements linked to the market value of the AUM, plus incentive fees in some cases.
Our investment funds have various life spans, typically ranging between five and nine years, but in some cases are open ended. In 2020, our open-ended funds grew nearly 25% and represented approximately 30% AUM as of December 31, 2020.
Table of Contents
11
ORGANIZATIONAL PURPOSE
JLL’s organizational purpose is to shape the future of real estate for a better world. Staying true to this purpose in all that we do enables us to fully align with the best interests and ambitions of our clients and all our stakeholders. It exemplifies our commitment to the highest standards of environmental, social and corporate governance ("ESG"), and to a more sustainable, diverse and inclusive future.
We shape the future of real estate for a better world
This core organizational purpose is fully aligned with, and supported by, our corporate values of teamwork, ethics and excellence. Ultimate responsibility for promoting awareness and ensuring adherence to our values and purpose across the enterprise is held by the JLL Global Executive Board ("GEB") and is endorsed by our Board of Directors. Our purpose guides our strategic growth vision and informs our response to the macro trends prevalent in the real estate industry. These trends and our strategic framework are summarized below.
INDUSTRY TRENDS
Informing our long-term growth strategy, we have identified five macro trends we see as major guiding influences on the continued growth and evolution of the real estate sector. Each of these trends has a multi-year lifespan, and while the COVID-19 pandemic (the "pandemic") has slowed some and accelerated others, we expect all five trends to maintain their long-term trajectory and relevance in the post-pandemic era. These macro trends are:
Rising investment allocations and globalization of capital flows to real estate
During the past decade, real estate has grown out of its previous 'alternative investment' classification to become a major defined asset class of its own, attracting a sustained long-term trend of rising investment allocations. In 2020, while the initial impacts of the pandemic slowed all transactional markets, this trend has reasserted as economic activity resumed. Indications from pension companies and other institutional investors and capital sources suggest it will further strengthen as we move into post-pandemic recovery, with real estate continuing to offer attractive returns.
Complementing this, we see long-term sustained strong transaction volumes and increasing capital flows across borders and between continents, creating new opportunities for advisors and investment managers equipped to source and facilitate these capital flows and execute cross-border transactions. Our real estate investment expertise, linking seamlessly across the world's major markets, is ideally placed to support our clients' investment ambitions.
Growth in corporate outsourcing
While corporate outsourcing of real estate services still represents a relatively small proportion of the total commercial-built real estate worldwide, the steady long-term trend towards outsourcing which began in the early 1990s, originally with U.S.-based corporations, is now a global trend. By focusing their own resources on core competencies and partnering with dedicated service providers like JLL to manage real estate strategy and activities, organizations are better positioned to advance their goals of financial and operational performance, talent attraction, customer experience, employee productivity and environmental sustainability.
In corporate boardrooms around the world, the global onset of the pandemic in 2020 rapidly accelerated the growing focus on reimagining workplaces and concepts for the future of work. These are areas in which JLL holds deep expertise and sector-leading specialist experience and resources. Across different industries we are positioned to provide highly adaptive and relevant solutions that promote organizational culture and prioritize health and well-being, flexible working models and digital enablement. In the post-pandemic era, we predict further growth in the strong and sustained trend for organizations to outsource real estate services while increasingly seeking strategic advice on reimagining their workspaces and workstyles to reinforce culture, attract talent and drive performance.
Table of Contents
12
Urbanization
While the world of urban living and working was thrown into temporary flux in 2020 by the pandemic, we believe its foundations are deep and secure, and a dynamic future is already taking discernible shape. With the successful rollout of vaccination programs, the concentrations of culture, diversity, opportunity, facilities and creative expression in the world’s major cities will continue to attract strong inflows of ambitious and aspirational people. In the post-pandemic era, cities will again thrive, characterized by vibrant and reimagined office, cultural, retail and residential profiles.
Growth in major urban populations around the world will continue to be a prevalent trend, and with it comes increasing demand for all forms of real estate services and advice. JLL has a well-established global research series - the City Momentum Index - exploring this and associated trends in more depth, including related dynamics in the way the world’s 130 emerging and established markets are growing, adapting and evolving.
Fourth Industrial Revolution
The World Economic Forum defines the Fourth Industrial Revolution as the wave of change being driven through advances in technology, data and artificial intelligence. The real estate industry is affected in many ways, a few examples include: (1) the transition to flexible and hybrid office working models, (2) new data-driven understanding of how all forms of real estate can be more efficient, sustainable and productive, (3) the rise of experiential and online retail, (4) new asset management technologies, and (5) the growth of the logistics sector.
While there is currently no single technology disruptor positioned to dominate the real estate industry, there are thousands of start-ups, applications and concepts vying to transform the marketplace, collectively known as proptech. The challenge to innovate and maximize the current and future benefits of proptech is constant. At the heart of our Beyond strategy (discussed below), supported by major ongoing investments and innovations, we continue to accelerate progress toward our goal of becoming the widely-recognized leading user of technology and data in real estate.
Sustainability
Addressing and managing climate change and the finite nature of global resources are defining issues for our time. According to the International Energy Agency, real estate and the built environment account for nearly 40% of total global direct and indirect CO₂ emissions. At the same time, stakeholders are demanding greater focus on ESG from businesses and organizations in all areas of society. These and other factors, including heightened awareness of the importance of promoting health and well-being, coalesce into strong rising demand for sustainability services and advice across the real estate industry. JLL has identified meeting this demand as a major growth opportunity and priority, aligning with our purpose to shape the future of real estate for a better world. Refer to our annual Global Sustainability Report for information on JLL’s commitment to net zero carbon operations for our leased offices and updates on progress toward achieving our science-based target, which was approved by the Science Based Target initiative in 2020.
Table of Contents
13
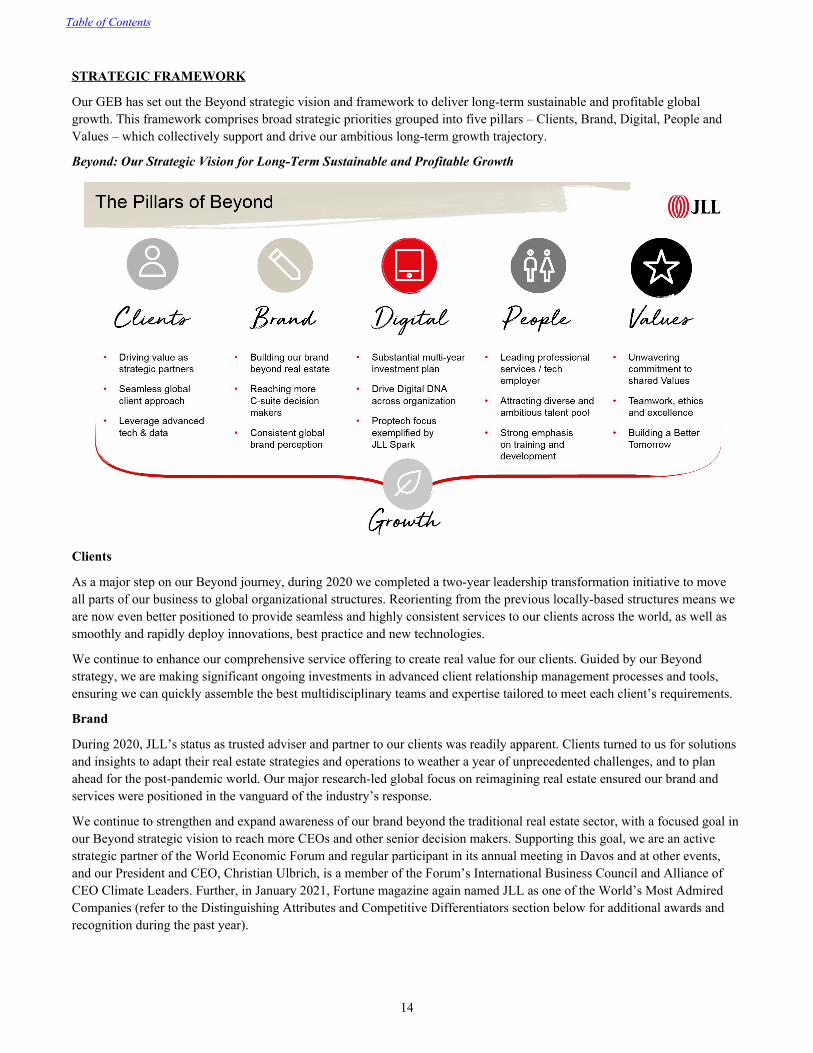
STRATEGIC FRAMEWORK
Our GEB has set out the Beyond strategic vision and framework to deliver long-term sustainable and profitable global growth. This framework comprises broad strategic priorities grouped into five pillars – Clients, Brand, Digital, People and Values – which collectively support and drive our ambitious long-term growth trajectory.
Beyond: Our Strategic Vision for Long-Term Sustainable and Profitable Growth
Clients
As a major step on our Beyond journey, during 2020 we completed a two-year leadership transformation initiative to move all parts of our business to global organizational structures. Reorienting from the previous locally-based structures means we are now even better positioned to provide seamless and highly consistent services to our clients across the world, as well as smoothly and rapidly deploy innovations, best practice and new technologies.
We continue to enhance our comprehensive service offering to create real value for our clients. Guided by our Beyond strategy, we are making significant ongoing investments in advanced client relationship management processes and tools, ensuring we can quickly assemble the best multidisciplinary teams and expertise tailored to meet each client’s requirements.
Brand
During 2020, JLL’s status as trusted adviser and partner to our clients was readily apparent. Clients turned to us for solutions and insights to adapt their real estate strategies and operations to weather a year of unprecedented challenges, and to plan ahead for the post-pandemic world. Our major research-led global focus on reimagining real estate ensured our brand and services were positioned in the vanguard of the industry’s response.
We continue to strengthen and expand awareness of our brand beyond the traditional real estate sector, with a focused goal in our Beyond strategic vision to reach more CEOs and other senior decision makers. Supporting this goal, we are an active strategic partner of the World Economic Forum and regular participant in its annual meeting in Davos and at other events, and our President and CEO, Christian Ulbrich, is a member of the Forum’s International Business Council and Alliance of CEO Climate Leaders. Further, in January 2021, Fortune magazine again named JLL as one of the World’s Most Admired Companies (refer to the Distinguishing Attributes and Competitive Differentiators section below for additional awards and recognition during the past year).
Table of Contents
14
Digital
The events of 2020 highlighted how technology is changing the way we work and where we do it more than ever before. JLL is embracing technology to meet the needs of clients today and anticipate the opportunities of tomorrow. Leading this transformation is core to our growth strategy and reflected in our significant investments. Our JLL Technologies group is a global leader in proptech – expanding and refining our technology capabilities to deliver significant competitive advantage and value for our clients and our company. This includes our $100 million commitment to JLL Spark Global Venture funds which incubate and drive proptech innovation as well as our recently launched workplace experience app, JLL Jet. Visit our website at www.jll.com to see the full portfolio of technology offerings.
Within our own operations, the substantial platform technology investments we made in the early phases of our Beyond journey are bearing significant fruit. Despite the impact of the pandemic, the ready availability and consistency of information in our Finance and HR systems enabled us to drive record cash flow from operating activities in 2020.
People
People are at the heart of our business. We are dedicated to helping our people achieve their ambitions by enabling them to explore new opportunities, build expertise, create long-term careers, and draw inspiration through working with talented colleagues and clients. We are committed to promoting and achieving true diversity and inclusion, as exemplified by the composition of our highly talented and experienced Board of Directors.
Values
All of our people are committed to the core values of teamwork, ethics and excellence. These values are the foundation of our organization. Clients, employees, business partners and potential recruits are strongly attracted to these values and to our commitments to a strong ESG, including ambitious goals and regular transparent reporting.
In April 2020, the Science Based Target Initiative (SBTi) confirmed its approval of our target of a 68% reduction in our total carbon emissions by 2030. In September 2020, we signed the World Green Building Council’s Net Zero Carbon Buildings Commitment, pledging to achieve net zero carbon emissions from JLL-occupied buildings by 2030. In November 2020, we announced the appointment of Guy Grainger – previously CEO of our EMEA segment – in a newly created senior role as Global Head of Sustainability Services and ESG, reflecting our core strategic focus in this area.
We have earned repeated recognition from organizations such as the Ethisphere Institute, which in 2020 named JLL as one of the World’s Most Ethical Companies for the 13th consecutive year.
Growth
Our Beyond priorities for clients, people, values, digital and brand combine to provide an integrated strategic vision and platform for growth. This vision is supported by our commitment to enhance productivity, optimize sustainable and profitable long-term growth, and create value for all of our stakeholders. Our Beyond strategic vision and priorities for growth are built on our closely integrated platform, which combines deep local market knowledge with seamless advice and services tailored to each client’s specific needs.
Table of Contents
15
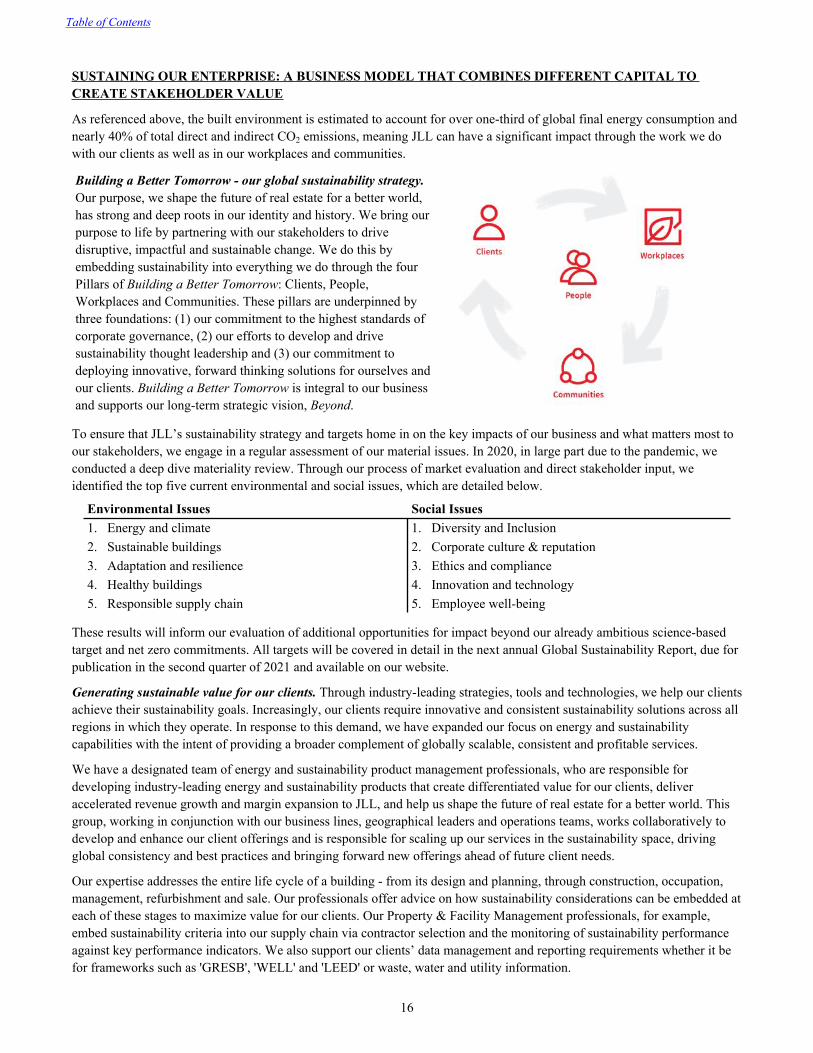
SUSTAINING OUR ENTERPRISE: A BUSINESS MODEL THAT COMBINES DIFFERENT CAPITAL TO CREATE STAKEHOLDER VALUE
As referenced above, the built environment is estimated to account for over one-third of global final energy consumption and nearly 40% of total direct and indirect CO2 emissions, meaning JLL can have a significant impact through the work we do with our clients as well as in our workplaces and communities.
Building a Better Tomorrow - our global sustainability strategy. Our purpose, we shape the future of real estate for a better world, has strong and deep roots in our identity and history. We bring our purpose to life by partnering with our stakeholders to drive disruptive, impactful and sustainable change. We do this by embedding sustainability into everything we do through the four Pillars of Building a Better Tomorrow: Clients, People, Workplaces and Communities. These pillars are underpinned by three foundations: (1) our commitment to the highest standards of corporate governance, (2) our efforts to develop and drive sustainability thought leadership and (3) our commitment to deploying innovative, forward thinking solutions for ourselves and our clients. Building a Better Tomorrow is integral to our business and supports our long-term strategic vision, Beyond.
To ensure that JLL’s sustainability strategy and targets home in on the key impacts of our business and what matters most to our stakeholders, we engage in a regular assessment of our material issues. In 2020, in large part due to the pandemic, we conducted a deep dive materiality review. Through our process of market evaluation and direct stakeholder input, we identified the top five current environmental and social issues, which are detailed below.
Environmental Issues Social Issues1. Energy and climate 1. Diversity and Inclusion2. Sustainable buildings 2. Corporate culture & reputation3. Adaptation and resilience 3. Ethics and compliance4. Healthy buildings 4. Innovation and technology5. Responsible supply chain 5. Employee well-being
These results will inform our evaluation of additional opportunities for impact beyond our already ambitious science-based target and net zero commitments. All targets will be covered in detail in the next annual Global Sustainability Report, due for publication in the second quarter of 2021 and available on our website.
Generating sustainable value for our clients. Through industry-leading strategies, tools and technologies, we help our clients achieve their sustainability goals. Increasingly, our clients require innovative and consistent sustainability solutions across all regions in which they operate. In response to this demand, we have expanded our focus on energy and sustainability capabilities with the intent of providing a broader complement of globally scalable, consistent and profitable services.
We have a designated team of energy and sustainability product management professionals, who are responsible for developing industry-leading energy and sustainability products that create differentiated value for our clients, deliver accelerated revenue growth and margin expansion to JLL, and help us shape the future of real estate for a better world. This group, working in conjunction with our business lines, geographical leaders and operations teams, works collaboratively to develop and enhance our client offerings and is responsible for scaling up our services in the sustainability space, driving global consistency and best practices and bringing forward new offerings ahead of future client needs.
Our expertise addresses the entire life cycle of a building - from its design and planning, through construction, occupation, management, refurbishment and sale. Our professionals offer advice on how sustainability considerations can be embedded at each of these stages to maximize value for our clients. Our Property & Facility Management professionals, for example, embed sustainability criteria into our supply chain via contractor selection and the monitoring of sustainability performance against key performance indicators. We also support our clients’ data management and reporting requirements whether it be for frameworks such as 'GRESB', 'WELL' and 'LEED' or waste, water and utility information.
Table of Contents
16
Our commitment to technological innovation extends to our sustainability service offering for our clients. We utilize a number of technology platforms, both in-house and externally sourced, to help deliver our clients’ sustainability objectives. Our OneView Energy and Sustainability Analytics (OVESA) platform is used to manage the ever-increasing volumes of complex sustainability data on behalf of our clients. This system, along with our other platforms such as the Portfolio Energy and Environment Reporting System (PEERS) and the Energy and Sustainability Platform (ESP), reflects our commitment to investing in digital, data and information management platforms. By deploying flexible technology solutions, we were able to measure, manage and improve environmental impacts for thousands of buildings included on these platforms in 2020. In 2021, JLL will see further investments to simplify, streamline and enhance our digital capabilities.
Creating sustainable value for all our stakeholders
We have designed our business model to (i) create value for our clients, shareholders and employees, (ii) establish high-quality relationships with the suppliers we engage and the communities in which we operate, and (iii) respond to macroeconomic trends impacting the real estate sector. Based on our intimate knowledge of local real estate and capital markets worldwide, as well as our investments in thought leadership and technology, we create value for clients by addressing their real estate needs as well as their broader business, strategic, operating and longer-term sustainability goals.
We strive to create a healthy and dynamic balance between activities that will produce short-term value and returns for our stakeholders through effective management of current transactions and business activities, and investments in people (such as new hires), acquisitions, technologies and systems designed to produce sustainable returns over the long term.
"Thinking Beyond" our value creation model (illustrated on the next page) summarizes how we create value for our shareholders and our broader stakeholders. It starts with the capital resources - or inputs - we need to do business. We use these resources in the context of our mission and vision to deliver services - or outputs - for our clients through the business activities we manage.
We apply our business model to the resources and capitals we employ to provide services. We provide these services through our own employees and, where necessary or appropriate in the case of property and facility management and project and development services, through the management of third-party contractors. The revenue and profits we earn from those efforts are allocated among further investments in our business, employee compensation and returns to our shareholders. We are increasingly focused on linking our business and sustainability strategies to promote the goal of creating long-term value for our shareholders, clients, employees and the global community of which JLL is a part. These efforts help our clients manage their real estate more effectively and efficiently, promote employment globally and create wealth for our shareholders and employees. In turn, they allow us to be an increasingly impactful member of, and positive force within, the communities in which we operate.
Table of Contents
17
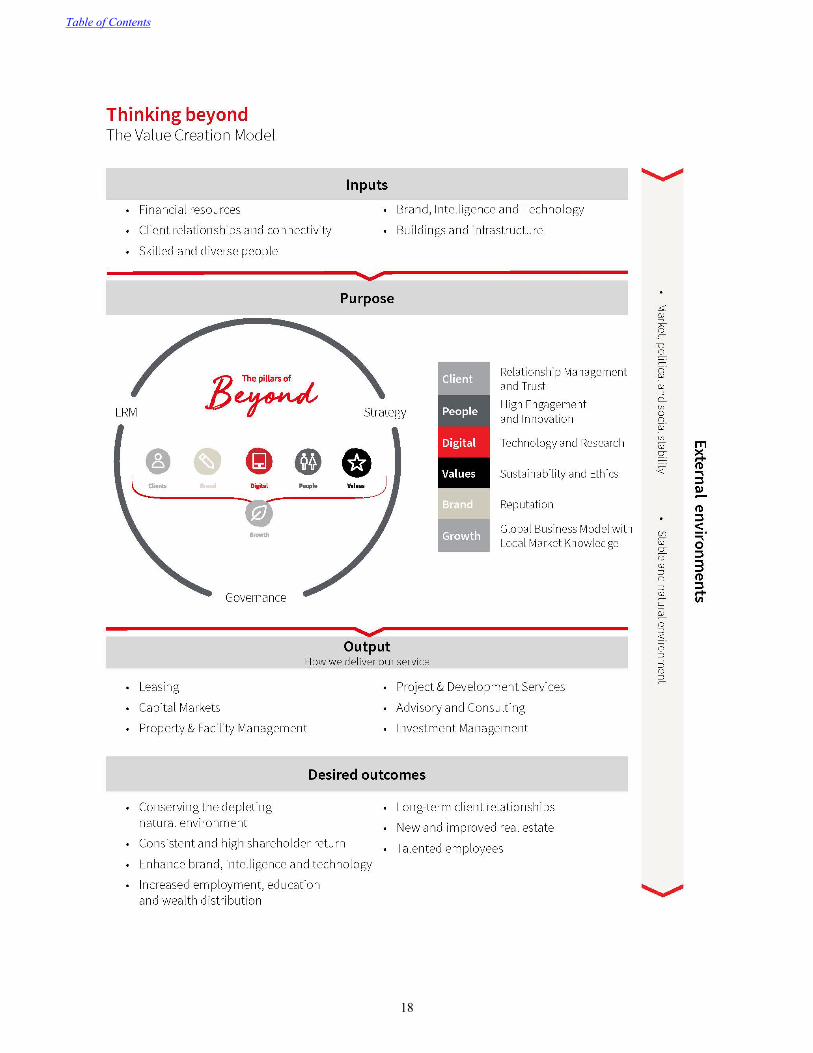
Table of Contents
18
COMPETITION
We operate across a wide variety of highly competitive business lines within the commercial real estate industry globally. Our significant growth over the last decade, and our ability to take advantage of the substantial consolidation which has taken place in our industry, have made us one of the largest commercial real estate services and investment management providers on a global basis.
Since we provide a broad range of commercial real estate and investment management services across many geographies, we face significant competition at international, regional and local levels. We also face competition from companies who may not traditionally be thought of as real estate service providers, including institutional lenders, insurance companies, investment banking firms, investment managers, accounting firms, technology firms, software-as-a-service companies, firms providing co-working space, firms providing outsourcing services of various types (including technology, food service and building products), and companies that self-perform their real estate services with in-house capabilities.
DISTINGUISHING ATTRIBUTES AND COMPETITIVE DIFFERENTIATORS
We deliver exceptional strategic, fully-integrated services, best practices and innovative solutions for real estate owners, occupiers, investors and developers worldwide through an integrated wholly-owned global platform. These characteristics among others distinguish us from our competitors, drive service excellence and customer loyalty, and demonstrate our commitment to a sustainable future. While we face formidable competition in individual markets, the following are key attributes differentiating JLL for clients seeking real estate and investment management services across the globe.
• Our focus on client relationship management to provide superior client service on a highly coordinated basis• Our globally-integrated business model with local market knowledge, including a highly diverse set of service
offerings, enabling our ability to deliver expertise wherever our clients need it• Leadership in leveraging technology to enhance the services we provide our clients and the way we operate• The strength of our brand, including our reputation as an ethical organization• The strength of our financial position• Our sustainability leadership, with a sustainability strategy that addresses long-term financial, environmental, and
social risks and opportunities for ourselves and our clients• The quality and worldwide reach of our industry-leading research function, enhanced by our ability to leverage
granular data at a global scale through technology and our ability to synthesize complex information into practical advice for clients
• Our employee engagement as well as our employee value proposition - Achieve your ambitions - which articulates what differentiates JLL as an employer
• The quality of our internal governance and enterprise risk management, which clients can rely on over the long term
The following is a detailed discussion of these distinguishing attributes and competitive differentiators.
Client Relationship Management. Our clients are the center of our business model, and we enable superior service delivery through ongoing investments in the people, processes and tools that support client relationship management. As an example, CapForce, our sophisticated CRM tool, links all our capital markets business lines and activities around the world. Our goal is to provide a seamless understanding of our clients' needs across our global capital markets platform, to drive a customized experience and accountability for all the activities we undertake for the client. We achieve superior client service through best practices in client relationship management, seeking and acting on regular client feedback, and recognizing each client's own specific definition of excellence. We also invest in developing the highest caliber talent dedicated to managing our client relationships through an employee compensation and evaluation system aligned with our global career framework and designed to reward client relationship building, teamwork and quality performance.
Our client-driven focus enables us to develop, sustain and grow long-term client relationships that generate repeat business and create recurring revenue opportunities. In many cases, we establish strategic alliances with clients whose ongoing service needs align with our ability to deliver fully integrated real estate services across multiple business units and locations.
Table of Contents
19
Globally-Integrated Business Model. Through the combination of a wide range of high-quality, complementary services we deliver at consistently high service levels globally, we develop and implement real estate strategies that meet the increasingly complex and far-reaching needs of our clients. With operations spanning the globe, we have in-depth knowledge of local and regional markets and can provide services which address the entire life cycle of real estate around the world. This geographic coverage, combined with the ability and connectivity of our people, positions us to serve the needs of our multinational clients and manage the flow of investment capital on a global basis. This model enables cross-selling opportunities across geographies and service lines that we expect will continue to develop new revenue sources and growth.
Technology Leadership. Our globally-coordinated investments in research, technology, data and analytics, people, quality control and innovation provide a foundation for us to develop, share and continually evaluate best practices across our global organization. In recent years, we launched a new global people information system, upgraded our digitally integrated finance system, and scaled the use of CRM tools globally to drive consistency across our organization. In addition, we have been heavily focused on acquiring and/or developing technology-enabled expertise, products and services to better serve our employees and clients. For example, in 2020, we launched the Investor Center, our global capital markets listings platform. This online marketplace helps our clients find their next investment opportunity across asset types and facilitates the due diligence process.
We will continue to develop and deploy technology to support our marketing and client development activities and to make our products and services increasingly accessible.
Brand. The combined strength of our JLL and LaSalle brands represents a significant advantage when we pursue new business opportunities and is also a major motivator for talented people to join our global brand. Large corporations, institutional investors and occupiers of real estate recognize our ability to create value reliably in changing market conditions, based on (i) evidence provided by brand perception surveys we have commissioned, (ii) extensive coverage we receive in top-tier business publications, (iii) awards we receive in real estate, sustainability, innovation, data/technology and ethics, as well as (iv) our significant, long-standing client relationships. Our reputation derives from our deep industry knowledge, excellence in service delivery, integrity and our global provision of high-quality, professional real estate and investment management services.
We believe in uncompromising integrity and the highest ethical conduct, where our Board of Directors and senior management lead by example. We are proud of the global reputation we have earned and are determined to protect and enhance it. The integrity our brand represents is one of our most valuable assets and a strong differentiator for JLL.
The JLL name is our primary trading name; Jones Lang LaSalle remains our legal name. Using the shorter JLL name facilitates its adaptation to different communication styles in different countries, languages and channels and especially to the use of digital and online channels for marketing and communications.
Financial Strength. Our broad geographic reach and the range of our global service offerings diversify the sources of our revenue, reducing overall volatility in operating a real estate services business. This further differentiates JLL from firms with more limited service offerings or that are only local/regional and must rely on fewer markets or services.
Confidence in the financial strength of long-term service providers is important to our clients, who require financial strength when they select real estate service providers. We focus on maintaining financial performance metrics, particularly our leverage and debt service coverage ratios, that support investment-grade financial ratings. We continue our long history of investment grade credit ratings from Moody’s Investors Service, Inc. ("Moody’s") and Standard & Poor’s Ratings Services ("S&P"). Our issuer and senior unsecured ratings as of December 31, 2020 are Baa1 from Moody’s and BBB+ from S&P. Accordingly, our ability to present a superior financial condition distinguishes us as we compete for business.
We have ample capacity to fund our business. A key source of liquidity is our unsecured credit facility (the "Facility") provided by an international syndicate of banks, which as of December 31, 2020 had a maximum borrowing capacity of $2.75 billion and a maturity date in May, 2023.
Table of Contents
20

Sustainability Leadership. Leading on sustainability is fundamental to both our purpose and our future long-term growth strategy because it’s about creating a positive impact not only today, but also in the future. Being a responsible corporate citizen is the right thing to do and is what our clients and employees expect from us.
To that end, and in alignment with the recommendations from the Taskforce on Climate-related Financial Disclosure ("TCFD"), we undertook an evaluation of the potential risks and opportunities to our business resulting from climate change. Specifically, we analyzed the impacts of two climate scenarios, (1) an aggressive mitigation resulting in <2° C warming and (2) an intermediate mitigation resulting in 2° - 3.7° C warming. Our findings were published in JLL’s first TCFD report included within our Global Sustainability Report published in 2020. With both scenarios, we anticipate significantly more climate-related opportunities than risks as our business model is not carbon-intensive and mitigation measures are already in place for many risks. Additionally, our existing investments in property technology, green building solutions and our climate change consulting provide significant and scalable avenues to realize the identified climate-related opportunities.
There is a strong and direct correlation between our ESG performance and the long-term health and success of our business. We address this by putting into action our sustainability strategy, Building a Better Tomorrow, which delivers transformative changes for our business, people, clients, communities and planet.
Our market position enables us to take actions that contribute to a better world. In so doing, it identifies us as a responsible organization, brings our purpose to life, adds value to our brand, and helps us attract and retain talent.
Industry-Leading Research Capabilities. We invest in and rely on comprehensive research to support and guide the development of real estate and investment strategy for our clients. With approximately 480 research professionals who gather data and cover market and economic conditions around the world, we are an authority on the economics and market dynamics of commercial real estate. Research plays a key role in keeping colleagues throughout the organization attuned to important trends and changing conditions in world markets. We continue to devise and invest in new approaches through data science techniques and other technology to make our research, services and property offerings more readily available to our people and clients.
We believe our investments in research, technology, data science and analytics, people and thought leadership position JLL as a leading innovator in our industry. Our research initiatives investigate emerging trends to help us anticipate future conditions and shape new services to benefit our clients, which in turn help us secure and maintain profitable long-term relationships with the clients we target: the world's leading real estate owners, occupiers, investors and developers.
Employee Engagement. Based on input from our employees about our culture and what makes us stand out as an employer, we developed the employee value proposition - Achieve your ambitions - a shared framework to inspire talent to join us, engage our employees and celebrate the values and culture of JLL around the world. An integral part of our brand, it is our promise to our people - employees and candidates alike - and centers on five unique pillars, depicted in the following graphic.
Our goal-setting framework uses three categories of goals (clients, growth and people) that align our people’s efforts with enterprise-wide strategy throughout all levels of the organization and build focus and attention on our priorities. Ongoing employee feedback is important to the continued improvement of our organization and to harness this valuable feedback, we complete an employee survey three times each year.
Table of Contents
21
Governance and Enterprise Risk Management. The Chairman of our Board of Directors is an independent Director and is separate from our CEO, who also serves as a Director. This structure together with our transparent senior management promotes an environment of best practices in corporate governance and controls. We believe these attributes allow us to infuse a culture of internal communication and connectivity throughout the organization.
Successful management of any organization's enterprise risks is critical to its long-term viability. We seek to promote, operate and continually improve a globally-integrated enterprise risk management model that optimizes our overall risk/reward profile through the coordinated and sophisticated interaction of business and corporate staff functions.
Awards. We won numerous awards and recognitions through January 2021 that reflect the quality of the services we provide to our clients, the integrity of our people and our desirability as a place to work. As examples, we were named:
• A member of the Bloomberg Gender-Equality Index, for the second consecutive year• A member of the Dow Jones Sustainability Index North America, for the fifth consecutive year• One of America's 100 Most Sustainable Companies by Barron's• An Energy Star Sustained Excellence Award recipient, by the U.S. Environmental Protection Agency, for the ninth
consecutive year• One of America's Most Responsible Companies by Newsweek, for the second consecutive year• One of the World's Most Ethical Companies by the Ethisphere Institute, for the 13th consecutive year• One of the World's Most Admired Companies by Fortune Magazine, for the fourth consecutive year• To the Human Rights Campaign Foundation's Corporate Equality Index, a benchmarking survey on corporate
policies and practices related to LGBTQ workplace equality, with a perfect score, for the seventh consecutive year• One of America's Best Employers for Diversity by Forbes, for the second consecutive year• One of America's Best Employers for Women by Forbes• One of the Top Companies for Executive Women by Working Mother, for the fifth consecutive year • One of Working Mother's Best Companies for Dad
INTEGRATED REPORTING
JLL was one of the first U.S. listed companies to participate in the International Integrated Reporting Council ("IIRC"), and we continue to support the general principles set forth by the IIRC, which are designed to promote communications and integrated thinking about how an organization's strategy, governance and financial and non-financial performance lead to the creation of value over the short, medium and long term.
Components of Our Integrated Report. This Annual Report on Form 10-K focuses on our business strategy and our financial performance, including an attempt to illustrate how being a sustainable enterprise is integral to our success. Our citizenship and sustainability efforts for ourselves and our clients are reflected primarily in our annual Global Sustainability Report, available on our website. Our governance and remuneration practices are reported primarily in the Proxy Statement for our Annual Meeting of Shareholders. The mechanisms we use to make our clients comfortable with respect to our transparency and fair dealing are summarized in our Transparency Report. The behaviors and standards we expect of our employees and of the suppliers we engage for our own company and on behalf of clients are presented in our Code of Business Ethics and our Vendor Code of Conduct. Our Corporate Facts document is intended to provide an overall summary of the information we believe will be of primary interest to our different stakeholders.
Responsibility for Integrated Reporting. Our Finance and Legal functions are primarily responsible for the integrity of our integrated reporting efforts, collaborating in the preparation and presentation of this report and engaging our organization's leadership.
Table of Contents
22
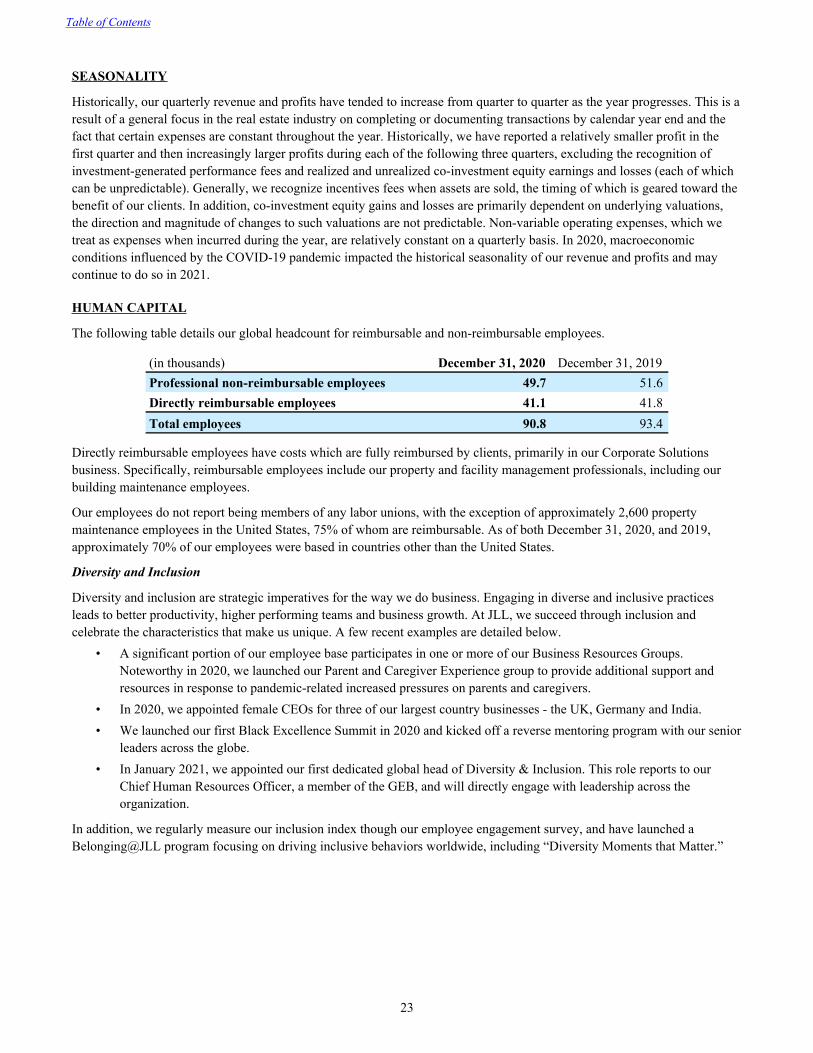
SEASONALITY
Historically, our quarterly revenue and profits have tended to increase from quarter to quarter as the year progresses. This is a result of a general focus in the real estate industry on completing or documenting transactions by calendar year end and the fact that certain expenses are constant throughout the year. Historically, we have reported a relatively smaller profit in the first quarter and then increasingly larger profits during each of the following three quarters, excluding the recognition of investment-generated performance fees and realized and unrealized co-investment equity earnings and losses (each of which can be unpredictable). Generally, we recognize incentives fees when assets are sold, the timing of which is geared toward the benefit of our clients. In addition, co-investment equity gains and losses are primarily dependent on underlying valuations, the direction and magnitude of changes to such valuations are not predictable. Non-variable operating expenses, which we treat as expenses when incurred during the year, are relatively constant on a quarterly basis. In 2020, macroeconomic conditions influenced by the COVID-19 pandemic impacted the historical seasonality of our revenue and profits and may continue to do so in 2021.
HUMAN CAPITAL
The following table details our global headcount for reimbursable and non-reimbursable employees.
(in thousands) December 31, 2020 December 31, 2019Professional non-reimbursable employees 49.7 51.6 Directly reimbursable employees 41.1 41.8 Total employees 90.8 93.4
Directly reimbursable employees have costs which are fully reimbursed by clients, primarily in our Corporate Solutions business. Specifically, reimbursable employees include our property and facility management professionals, including our building maintenance employees.
Our employees do not report being members of any labor unions, with the exception of approximately 2,600 property maintenance employees in the United States, 75% of whom are reimbursable. As of both December 31, 2020, and 2019, approximately 70% of our employees were based in countries other than the United States.
Diversity and Inclusion
Diversity and inclusion are strategic imperatives for the way we do business. Engaging in diverse and inclusive practices leads to better productivity, higher performing teams and business growth. At JLL, we succeed through inclusion and celebrate the characteristics that make us unique. A few recent examples are detailed below.
• A significant portion of our employee base participates in one or more of our Business Resources Groups. Noteworthy in 2020, we launched our Parent and Caregiver Experience group to provide additional support and resources in response to pandemic-related increased pressures on parents and caregivers.
• In 2020, we appointed female CEOs for three of our largest country businesses - the UK, Germany and India.• We launched our first Black Excellence Summit in 2020 and kicked off a reverse mentoring program with our senior
leaders across the globe.• In January 2021, we appointed our first dedicated global head of Diversity & Inclusion. This role reports to our
Chief Human Resources Officer, a member of the GEB, and will directly engage with leadership across the organization.
In addition, we regularly measure our inclusion index though our employee engagement survey, and have launched a Belonging@JLL program focusing on driving inclusive behaviors worldwide, including “Diversity Moments that Matter.”
Table of Contents
23
Training and Development
Using extensive internal and external research, we have a set of core capabilities that define our leadership behaviors to drive our near and long-term success. Those capabilities are the foundation for our employee talent assessments, succession planning and other talent processes. Our employees can self-assess and be assessed against these capabilities to participate in our award-winning development platform, Real Leadership. The platform provides specific programs to help our employees and leaders grow, develop their career, and become better leaders using in-person training, virtual programming, various assessments and coaching.
Just as our business needs to constantly evolve, so too does the Real Leadership platform -for example in 2020, we launched an online learning platform to accelerate the skills of employees’ working virtually. Over 25,000 employees were able to learn, in seven different languages, through our virtual on-demand offerings this year. Since we launched Real Leadership, we have had over 40,000 leaders and employees participate, through both virtual and instructor-led classes.
Well-being
In 2020, we launched a well-being framework consisting of four pillars: physical, mental, financial, and inclusion. We provided resources on our well-being site in 15 languages including online courses, webinars and resources for caregivers. This site has had more than 50,000 visits with over 12,000 employees attending webinars.
Health and Safety
Health and safety is at the forefront of JLL's operations. With over 450 health and safety professionals, we are committed to creating an environment that unequivocally protects our employees, clients and supply partners.
To effectively manage health and safety, our program is aligned to the principles of the internationally recognized health and safety management standard ISO 45001. We implement global health and safety standards that ensure we apply a consistent approach to harm prevention and operate assurance programs to ensure legal compliance.
We recognize that successful health and safety programs are built on proactive individual and collective safe behaviors. Through our health and safety vision, ‘One team S.A.F.E.R together’, we create a stronger culture of health and safety, underpinned by our S.A.F.E.R. behaviors: S – Speak about safety; A – Act safely; F – Focus on safety standards; E – Engage in safety initiatives; R – Recognize safe performance.
To monitor the strength of our safety culture, in 2020 we benchmarked our organization against data from 130 other companies using the UK Health and Safety Laboratory’s Safety Climate Survey Tool. Our global survey received 12,500 responses and showed our culture to be in the 95th percentile when compared against the all-industry scores. While this score sets a high internal benchmark, our goal is to improve our culture and improve our scores year on year.
Through our safety vision and our awareness and education programs, like Global Safety Week, the strength of our program is realized in the low accident rates for the year 2020, compared with the U.S. Occupational Safety and Health Administration ("OSHA") industry average accident rates for our industry (NAICS Code 531: Real Estate).
• Lost Time Incident Rate was 0.10 (OSHA industry average was 0.70): 12-month average of OSHA recordable illness and injuries per 100 JLL employees that resulted in days away from work.
• Total Recordable Incident Rate was 0.27 (OSHA industry average was 2.10): 12-month average of OSHA recordable illness and injuries per 100 JLL employees.
• Days Away, Restricted Duty and Transfer was 0.12 (OSHA industry average was 1.00): 12-month average of OSHA recordable illness and injuries per 100 full-time employees that resulted in days away from work or restricted duties.
• There were zero JLL employee workplace fatalities reported in 2020.
In addition, we closed, cleaned and reopened more than 350 corporate offices in the months following the onset of the pandemic, focusing on both employee safety and their office experience while complying with local regulations, incorporating proper social distancing practices and enhancing sanitation efforts.
Table of Contents
24
INTELLECTUAL PROPERTY
We regard our technology and other intellectual property, including our brands, as a critical part of our business.
We hold various trademarks, trade dress and trade names and rely on a combination of patent, copyright, trademark, service mark and trade secret laws, as well as contractual restrictions to establish and protect our proprietary rights. We own numerous domain names, have registered numerous trademarks, and have filed applications for the registration of a number of our other trademarks and service marks in the United States and in foreign countries. We hold the "Jones Lang LaSalle," "JLL" and "LaSalle Investment Management" trademarks and the related logos to conduct the material aspects of our business globally. We own the rights to use the ".jll" and ".lasalle" top level domain names.
Although we believe our intellectual property plays a role in maintaining our competitive position in a number of the markets we serve, we do not believe we would be materially adversely affected by the expiration or termination of our trademarks or trade names or the loss of any of our other intellectual property rights other than the “JLL,” "Jones Lang LaSalle," “LaSalle,” and "LaSalle Investment Management" names, and our Design (Three Circles) mark that is also trademarked. Our trademark registrations have to be renewed every ten years, which we expect to continue to renew, as necessary. Based on our most recent trademark registrations, the JLL mark would expire in 2024, while the Jones Lang LaSalle name would expire in 2022 and the Design (Three Circles) mark would expire in 2021. Our LaSalle and LaSalle Investment Management marks will expire in 2026.
In addition to our trademarks and trade names, we also have proprietary technologies for the provision of complex services and analysis. We also have a number of pending patent applications in the U.S. to further enable us to provide high levels of client service and operational excellence. We will continue to file additional patent applications on new inventions, as appropriate, demonstrating our commitment to technology and innovation.
CORPORATE GOVERNANCE; CODE OF BUSINESS ETHICS; CORPORATE SUSTAINABILITY AND RELATED MATTERS
We are committed to the values of effective corporate governance, operating our business to the highest ethical standards and conducting ourselves in an environmentally and socially responsible manner. We believe these values promote the best long-term performance of JLL for the benefit of our shareholders, clients, staff and other constituencies.
Corporate Governance. We believe our policies and practices reflect corporate governance initiatives that comply with the listing requirements of the NYSE, the corporate governance requirements of the Sarbanes‑Oxley Act of 2002, U.S. Securities and Exchange Commission ("SEC") regulations, the Dodd-Frank Wall Street Reform and Consumer Protection Act, and the General Corporation Law of the State of Maryland, where we are incorporated.
Our Board of Directors ("the Board") regularly reviews corporate governance developments and modifies our Bylaws, Guidelines and Committee Charters accordingly. As a result, we have adopted the following corporate governance policies and approaches considered to be best practices in corporate governance.
• Annual elections of all members of our Board• Annual "say on pay" votes by shareholders with respect to executive compensation• Right of shareholders owning 30% of the outstanding shares of our Common stock to call a special meeting of
shareholders for any purpose• Majority voting in Director elections• Separation of Chairman and CEO roles, with the Chairman serving as Lead Independent Director• Required approval by the Nominating and Governance Committee of any related-party transactions• Executive session among the Non-Executive Directors at each in-person meeting• Annual self-assessment by the Board and each of its Committees
Table of Contents
25
Code of Business Ethics. The ethics principles that guide our operations globally are embodied in our Code of Business Ethics, which applies to all employees of JLL and the members of our Board. The Code of Business Ethics is the cornerstone of our Ethics Everywhere Program, by which we establish, communicate and monitor the overall elements of our efforts. We are proud of, and are determined to protect and enhance, the global reputation we have established. As we operate in a service industry, the integrity our brand represents is one of our most valuable assets. For a number of years we have applied for and received Ethics Inside™ certification from NYSE Governance Services, a leading organization dedicated to best practices in ethics, compliance, corporate governance and citizenship. We believe it is the only available independent verification of a company's ethics program. As previously noted, we were named to Ethisphere Institute’s list of the World's Most Ethical Companies for the thirteenth consecutive time in 2020. We also were recertified under the Ethics Inside program by the Ethisphere Institute.
We support the principles of the United Nations Global Compact, the United Nations Principles of Responsible Investing and, given our clients include a number of the major companies within the electronic industry, the Electronic Industry Code of Conduct. We are also a member of the Partnering Against Corruption Initiative sponsored by the World Economic Forum.
Vendor Code of Conduct. We expect each of our vendors, meaning any firm or individual providing a product or service to us, or indirectly to our clients as a contractor or subcontractor, will share and embrace the letter and spirit of our commitment to integrity. While vendors are independent entities, their business practices may significantly reflect upon us, our reputation and our brand. Accordingly, we expect all vendors to adhere to the JLL Vendor Code of Conduct, which we publish in multiple languages on our website. We continue to evaluate and implement new ways to monitor the quality and integrity of our supply chain. This includes developing means to efficiently survey and compare responses about the ethical environment and riskiness of current and potential suppliers we engage both for our own company and on behalf of clients.
Professional Standards Guide. Our guide to professional standards seeks to establish principles under which our people will perform services for clients. It is published on our website.
Corporate Sustainability. We encourage and promote the principles of sustainability everywhere we operate, seeking to improve the communities and environment in which our people work and live. We design our corporate policies to reflect the highest standards of corporate governance and transparency, and we hold ourselves responsible for our social, environmental and economic performance. We seek to incorporate sustainability practices and principles into our client investments and asset management. These priorities guide the interactions we have with our shareholders, clients, employees, regulators and vendors, as well as with all others with whom we come into contact. We recognize both the risks and opportunities presented by climate change and seek to address these impacts both in and beyond our business.
We also work to foster an environment which values the richness of our differences and reflects the diverse world in which we live and work. By cultivating a dynamic mix of people and ideas, we enrich our performance, the communities in which we operate, and the lives of our employees. We seek to recruit a diverse workforce, develop and promote exceptional talent from diverse backgrounds, and embrace the varied experiences of all our employees.
Corporate Political Activities. Our general approach is to not take positions as an organization on social or political issues or on political campaigns. Accordingly, our use of corporate funds or other resources for political activities has been negligible. From time to time, we may comment on proposed legislation or regulations that directly affect our business interests and therefore the interests of our shareholders. We may also belong to industry trade associations that do become involved in attempts to influence legislation in the interests of the industry generally.
COMPANY WEBSITE AND AVAILABLE INFORMATION
JLL's website address is www.jll.com. We use our website as a channel of distribution for company, financial and other information. Our website also includes information about our corporate governance. We intend to post on our website any amendment or waiver of the Code of Business Ethics with respect to a member of our Board or any of the executive officers named in our proxy statement.
On the Investor Relations page on our website, we make available our Annual Report on Form 10-K, our Proxy Statement on Schedule14A, our Quarterly Reports on Form 10-Q, our Current Reports on Form 8-K and any amendments to those reports filed or furnished pursuant to Section 13(a) or 15(d) of the Securities Exchange Act of 1934 (the “Exchange Act”). The SEC maintains www.sec.gov, containing annual, quarterly and current reports, proxy statements and other information we file electronically with the SEC.
Table of Contents
26
ITEM 1A. RISK FACTORS
In addition to the other information set forth in this report, you should carefully consider the following risks that based upon current knowledge, information and assumptions could materially adversely affect our business, financial condition and results of operations. Some of these risks and uncertainties could affect particular service lines or geographies, while others could affect all of our businesses. Although each risk is discussed separately, many are interrelated.
These risk factors do not identify all risks we face; our operations could also be affected by factors not presently known to us or that we currently consider to be not significant to our operations. Our business is also subject to general risks and uncertainties which broadly affect all companies.
General Overview. Our business environment is complex, dynamic and international. Accordingly, it is subject to a number of significant risks in the ordinary course of its operations. If we cannot or do not successfully manage the risks associated with the services we provide, our operations, business, operating results, reputation and/or financial condition could be materially and adversely affected.
One of the challenges of a global business such as ours is to determine in a sophisticated manner the critical enterprise risks that exist or may newly develop over time as our business evolves. We must then determine how best to employ reasonably available resources to prevent, mitigate and/or minimize those risks we identify as having the greatest potential to cause significant damage from an operational, financial, or reputational standpoint.
Our Board and its Committees take active roles in overseeing management's identification, disclosure and mitigation of enterprise risks. Our ongoing enterprise risk management efforts have significantly shaped the following risk factors and their discussion.
Categorization of Enterprise Risks. This section reflects our current views, as of the issuance of this report, concerning the most significant risks we believe our business faces, both in the short and long term. For purposes of the following analysis and discussion, we group the risks we face according to five principal categories:
• Operational Risk Factors • Financial Risk Factors • Strategic Risk Factors • General Risk Factors • Legal and Compliance Risk Factors
We could appropriately place some of the risks we identify in more than one category, but we have chosen the one category we view as primary. We do not present the risks below in their order of significance, the relative likelihood we will experience a loss, or the magnitude of any such loss. Certain of these risks also may give rise to business opportunities for us, but our discussion of risk factors in Item 1A is limited to the adverse effects the risks may have on our business.
Operational Risk Factors
Operational risk relates to risks arising from systems, processes, people and external events that affect the operation of our businesses. It includes information management and data protection and security, including cyber security; supply chain and business disruption, including health and safety; and other risks, including human resources and reputation.
REPUTATIONAL AND BRAND RISKS.
The value and premium status of our brand is one of our most important assets. An inherent risk in maintaining our brand is that we may fail to successfully differentiate the scope and quality of our service and product offerings from those of our competitors, or that we may fail to sufficiently innovate or develop improved products or services that will be attractive to our clients.
The rapid dissemination and increasing transparency of information, particularly for public companies, increases the risks to our business that could result from negative media or announcements about ethics lapses or other operational problems, which could lead clients to terminate or reduce their relationships with us. As such, any negative media, allegations or litigation against us, irrespective of the final outcome, could potentially harm our professional reputation and damage our business. We are also subject to misappropriation of one of the names or trademarks we own by third parties that do not have the right to use them so they can benefit from the goodwill we have built up in our intellectual property; further, our efforts to police usage of our intellectual property may not be successful in all situations.
Table of Contents
27
COMPETITION FOR TALENT WORLD-WIDE; SUCCESSION OF KEY LEADERS.
We depend, in large part, on the members of our senior management team who possess extensive knowledge and a deep understanding of our business and strategy, as well as the colleagues who are critical to developing and retaining client relationships. Our business depends on the continued availability of skilled personnel with industry experience and knowledge, including our senior management team and other key employees. If we are unable to attract and retain qualified personnel, or to successfully plan for succession of employees holding key management positions, our business and operating results could suffer. There is a further risk of losing talent (and intellectual property and client contacts) to competitors, particularly in the context of increased use of social media networks and transparency of employment information. There is also the risk of losing top producers who provide a material margin contribution. These risks increase as we continue to grow as an organization and increase the number of staff, which has expanded significantly over the past decade. There may also be an increase in recruitment and compensation costs. We and our competitors use equity incentives and bonuses to help attract, retain and incentivize key personnel. As competition is significant for the services of such personnel, the expense of incentives and bonuses may increase and we may be unable to attract or retain such personnel to the same extent we have in the past.
The challenge to find and retain sufficiently trained staff is world-wide, including within emerging markets, and as a result, increases the risk of performance for clients. In particular, in successful emerging markets such as India and China, attrition by highly informed and mobile staff is a challenge for all companies. Labor costs are rising in emerging economies and are expected to increase further. Corporate payrolls are likely to increase as greater competition for labor and social pressure to raise salaries in line with productivity growth cause even greater wage inflation. It is increasingly challenging to predict regional and national labor policies, as well as regulations. The indirect implications of these changes are difficult to assess.
THIRD PARTY SPEND MANAGEMENT AND HEALTH AND SAFETY RISK.
We rely on third parties, and in some cases subcontractors, to perform activities on behalf of our organization to improve quality, increase efficiencies, reduce costs and lower operational risks across our business and support functions. We have instituted a Vendor Code of Conduct, which is published in multiple languages on our website, and which is intended to communicate to our vendors the standards of conduct we expect them to uphold. Our contracts with vendors also generally impose a contractual obligation to comply with our Vendor Code. In addition, we leverage technology at an increasing rate to help us better screen vendors, with the aim of gaining a deeper understanding of the risks posed to our business by potential and existing vendors. If our third parties do not have the proper safeguards and controls in place, or appropriate oversight cannot be provided, we could be exposed to increased operational, regulatory, financial or reputational risks. A failure by third parties to comply with service level agreements or regulatory or legal requirements in a high quality and timely manner, particularly during periods of peak demand for their services, could result in economic and reputational harm to us. In addition, these third parties face their own technology, operating, business and economic risks, and any significant failures by them, including the improper use or disclosure of our confidential client, employee or company information, could cause damage to our reputation and harm to our business.
Our contractors and their subcontractors are more integrated into our operations than ever before and, as a result, also involved in a significant proportion of the safety incidents we experience. Health and safety is a prominent part of our Beyond strategy, so we take steps to engage with our supply chain and improve our safety performance. This includes producing a dedicated Global Health and Safety Report detailing our approach to managing this important topic. Our goal is to ensure those we work and interact with are unharmed by our operations. We have a multi-disciplinary safety management structure, with executive sponsorship, aimed at managing existing and emerging health and safety risks, and achieving continuous improvement. However, despite investment in our safety platform, management systems and vendor due diligence program, additional efforts are necessary to ensure vendors are aware of our high health and safety expectations.
WE FACE POTENTIAL BUSINESS DISRUPTION AND RELATED RISKS RESULTING FROM HEALTH EPIDEMICS, ESPECIALLY THE NOVEL CORONAVIRUS (COVID-19) PANDEMIC.
Health epidemics that affect the general conduct of business in one or more urban areas (including as the result of travel restrictions and the inability to conduct face-to-face meetings), such as occurred in the past from influenza, occurring at present (COVID-19) or may occur in the future from other types of outbreak, can also adversely affect the volume of business transactions, real estate markets and the cost of operating real estate or providing real estate services.
Table of Contents
28
At present, efforts to contain and mitigate the COVID-19 pandemic are occurring in many countries where we operate, including the United States. The actions taken have resulted in unprecedented restrictions on businesses, including closures, with a substantial reduction in economic activity in most countries. The pandemic had a material effect on our financial results in 2020. Our transaction-based services lines had a significant year-over-year decline in activity as non-essential transactions were delayed, reduced in scope or cancelled, particularly in the last nine months of 2020. Certain costs in our operating structure are fixed in nature and given the uncertainty of the COVID-19 pandemic and its human and economic impact, immediate cuts to these fixed costs to mirror the declines in revenues were not practical.
Significant uncertainty remains as to the full impact of the COVID-19 pandemic on our operations, and on the global economy as a whole, including potential changes in commercial behavior. It is currently not possible to predict how long the pandemic will last or the time that it will take for economic activity to return to pre-pandemic levels. We expect the ultimate significance of the impact of these disruptions, including the extent of their adverse impact on our financial and operational results, will be dictated by the length of time that such disruptions continue, which will, in turn, depend on the currently unknowable duration of the COVID-19 pandemic and the impact of governmental regulations that might be imposed in response. COVID-19 also makes it more challenging for management to estimate future performance of our businesses, particularly over the near to medium term.
TECHNOLOGY AND INFORMATION SYSTEMS; MANAGEMENT OF DATA.
Our business is highly dependent on our ability to collect, use, store and manage organizational and client data. If any of our information and data management systems do not operate properly or are disabled, we could suffer a disruption of our businesses, liability to clients, loss of client data, loss of employee data, regulatory intervention, breach of confidentiality or other contract provisions, or reputational damage. These systems may fail to operate properly or become disabled as a result of events wholly or partially beyond our control, including disruptions of electrical or communications services, disruptions caused by natural disasters, political instability, terrorist attacks, sabotage, computer viruses, or problems with the internet, deliberate attempts to disrupt our computer systems through "hacking," "phishing," or other forms of cyber attack, or our inability to occupy one or more of our office locations. As we outsource significant portions of our information technology functions to third-party providers, such as cloud computing, we bear the risk of having somewhat less direct control over the manner and quality of performance.
We are exposed to the risk of cyber attacks in the normal course of business. In general, cyber incidents can result from deliberate attacks or unintentional events. We continue to observe an increased level of cyber threats focused on gaining unauthorized access to digital systems for purposes of misappropriating assets or sensitive information, corrupting data, or causing operational disruption.
We have experienced various types of cyber attack incidents, which to-date have been contained and have not been material to us as a whole. As the result of such incidents, we have continued to implement new controls, governance, technical protections and other procedures. We may incur substantial costs and suffer other negative consequences such as liability, reputational harm and significant remediation costs and experience material harm to our business and financial results if we fall victim to other successful cyber attacks.
The legislative and regulatory framework for privacy and data protection issues worldwide continues to evolve. We collect personally identifiable information ("PII") and other data as part of our business processes and activities. This data is subject to a variety of U.S. and foreign laws and regulations, including oversight by various regulatory or other governmental bodies. Many foreign countries and governmental bodies have laws and regulations concerning the collection and use of PII and other data obtained from their residents or by businesses operating within their jurisdictions. The European Union General Data Protection Regulation, for example, imposes stringent data protection requirements and provides significant penalties for noncompliance. Any inability, or perceived inability, to adequately address privacy and data protection concerns, even if unfounded, or comply with applicable laws, regulations, policies, industry standards, contractual obligations, or other legal obligations (including at newly acquired companies) could result in additional cost and liability to us or company officials, damage our reputation, inhibit sales, and otherwise adversely affect our business.
Table of Contents
29

CONCENTRATIONS OF BUSINESS WITH CORPORATE AND INVESTOR CLIENTS CAUSE INCREASED CREDIT RISK AND GREATER IMPACT FROM THE LOSS OF CERTAIN CLIENTS AND INCREASED RISKS FROM HIGHER LIMITATIONS OF LIABILITY IN CONTRACTS.
We value the expansion of business relationships with individual corporate clients and institutional investors because of the increased efficiency and economics (both to our clients and us) that can result from developing repeat business and performing an increasingly broad range of services for the same client. Having increasingly large and concentrated clients also can lead to greater or more concentrated risks of loss if, among other possibilities, such a client (i) experiences its own financial problems, which can lead to larger individual credit risks; (ii) becomes bankrupt or insolvent, which can lead to our failure to be paid for services we have previously provided or funds we have previously advanced; (iii) decides to reduce its operations or its real estate facilities; (iv) makes a change in its real estate strategy, such as no longer outsourcing its real estate operations; (v) decides to change its providers of real estate services; or (vi) merges with another corporation or otherwise undergoes a change of control, which may result in new management taking over with a different real estate philosophy or in different relationships with other real estate providers. In the case of LaSalle, concentration of investor clients can lead to fewer sources of investment capital, which can negatively affect assets under management in case a higher-volume client withdraws its funds or does not re-invest them. This is also the case within LaSalle's businesses which are dependent on the continued ability and willingness of certain brokerage firms to attract investment funds from their clients.
In addition, competitive conditions, particularly in connection with increasingly large clients, may require us to compromise on certain contract terms with respect to the payment of fees, the extent of risk transfer, or acting as principal rather than agent in connection with supplier relationships, liability limitations, credit terms and other contractual terms, or in connection with disputes or potential litigation. Where competitive pressures result in higher levels of potential liability under our contracts, the cost of operational errors and other activities for which we have indemnified our clients will be greater and may not be fully insured.
PERFORMANCE AND FIDUCIARY OBLIGATIONS UNDER CLIENT CONTRACTS; RISING COST OF INSURANCE RESULTING FROM NEGLIGENCE CLAIMS; RESPONSIBILITY FOR SAFETY OF CONTRACTORS; SCOPE CREEP.
In certain cases, we are subject to fiduciary obligations to our clients, which may result in a higher level of legal obligation compared to basic contractual obligations. These relate to, among other matters, the decisions we make on behalf of a client with respect to managing assets on its behalf or purchasing products or services from third parties or other divisions within our Company. Our services may involve handling substantial amounts of client funds in connection with managing their properties or complicated and high-profile transactions. We face legal and reputational risks in the event we do not perform, or are perceived to have not performed, under those contracts or in accordance with those obligations, or in the event we are negligent in the handling of client funds or in the way in which we have delivered our professional services. The increased potential for the fraudulent diversion of funds from a "hacking" or "phishing" attack exacerbates these risks.
The precautions we take to prevent these types of occurrences, which represent a significant commitment of corporate resources, may nevertheless be ineffective in certain cases. Any increased or unexpected costs or unanticipated delays in connection with the performance of these engagements, including delays caused by factors outside our control, could have an adverse effect on profit margins.
If we perform services for clients beyond, or different from, what were originally contemplated in the governing contracts (known as "scope creep"), we may not be fully reimbursed for the services provided, realize our full compensation potential or our potential liability in the case of a negligence claim may not have been as limited as it normally would have been or may be unclear.
Table of Contents
30
CORPORATE CONFLICTS OF INTEREST.
All providers of professional services to clients, including our Company, must manage potential conflicts of interest. This occurs principally where the primary duty of loyalty we owe to one client may potentially be weakened or compromised by a relationship we also maintain with another client or third party. Corporate conflicts of interest arise in the context of the services we provide as a company to our different clients. Personal conflicts of interest on the part of our employees are separately considered as issues within the context of our Code of Business Ethics. Our failure or inability to identify, disclose and resolve potential conflicts of interest in a significant situation could have a material adverse effect. In addition, it is possible that in some jurisdictions, regulations could be changed to limit our ability to act for certain parties where potential conflicts may exist even with informed consent, which could limit our market share in those markets. There can be no assurance potential conflicts of interest will not adversely affect us.
After reductions in the market values of the underlying properties, firms engaged in the business of providing valuations are inherently subject to a higher risk of claims with respect to conflicts of interest based on the circumstances of valuations they previously issued. Regardless of the ultimate merits of these claims, the allegations themselves can cause reputational damage and can be expensive to defend in terms of counsel fees and otherwise.
Strategic Risk Factors
Strategic risk relates to JLL’s future business plans and strategies, including the risks associated with: the global macro-environment in which we operate; mergers and acquisitions and restructuring activities; intellectual property; and other risks, including the demand for our services, competitive threats, technology and innovation, and public policy.
DISRUPTIVE TECHNOLOGIES, INNOVATION AND COMPETITION.
Mobile technologies and online collaboration tools are transforming how business gets done. Information technology has entered a “big data” era. The evolution of digital and information technology presents significant challenges for businesses and societies, which must find ways to capture the benefits of new technologies while dealing with the new threats those technologies present. Within the real estate services industry, managing big data is a critical competitive differentiator and we risk being surpassed if our peers leverage big data more effectively.
ABILITY TO PROTECT INTELLECTUAL PROPERTY; INFRINGEMENT OF THIRD-PARTY INTELLECTUAL PROPERTY RIGHTS.
Our business depends, in part, on our ability to identify and protect proprietary information and other intellectual property such as our service marks, domain names, client lists and information, business methods and technology innovations, and platforms we may create or acquire. Existing laws of some countries in which we provide or intend to provide services, or the extent to which their laws are actually enforced, may offer only limited protections of our intellectual property rights. We rely on a combination of trade secrets, confidentiality policies, non-disclosure and other contractual arrangements, and on patent, copyright and trademark laws to protect our intellectual property rights. In particular, we hold various trademarks and trade names, including our principal trade names, "JLL" and "LaSalle." If either of our registered trade names were to expire or terminate, our competitive position in certain markets could be materially and adversely affected. Our inability to detect unauthorized use (for example, by current or former employees) or take appropriate or timely steps to enforce our intellectual property rights may have an adverse effect on our business.
We cannot be sure the intellectual property we may use in the course of operating our business or the services we offer to clients do not infringe on the rights of third parties. Although, we do obtain representations and warranties, as well as indemnities, from the licensors in order to mitigate this risk. We may have infringement claims asserted against us or against our clients. These claims may harm our reputation, cost us money and prevent us from offering some services.
Table of Contents
31

GENERAL ECONOMIC CONDITIONS AND REAL ESTATE MARKET CONDITIONS.
The success of our business is significantly related to general economic conditions. Further, our business and financial conditions correlate strongly to local, national and regional economic and political conditions or, at least, the perceptions of and confidence in those conditions.
We have previously experienced and expect in the future that we will be negatively impacted by periods of economic slowdown or recession and corresponding declines in the demand for real estate and related services. The global economic crisis during the 2007-2009 period was extraordinary for its worldwide scope, severity and impact on major financial institutions, as well as for the extent of governmental stimulus and regulatory responses. Since then, many of our markets have been affected generally by various economic uncertainties, among them: continued significant volatility in oil and commodity prices; the developing effects of climate change and severe weather; and the continued uncertainty on the direction of global tax policy. Most recently, we have continued to assess the potential adverse effects of the ongoing global COVID-19 pandemic on general economic conditions.
In this environment, we have continued to grow our business largely by gaining market share and as the result of targeted acquisitions. It is inherently difficult for us to predict how these types of significant global forces will affect our business in the future and whether we will continue to be able to generate revenue growth to the same extent as we have in the past.
Negative economic conditions and declines in demand for real estate and related services in several markets or in significant markets could have a material adverse effect on our performance driven by (i) a decline in acquisition and disposition activity, (ii) a decline in real estate values and performance, leasing activity and rental rates, (iii) a decline in value of real estate securities, (iv) the cyclicality in the real estate markets; lag in recovery relative to broader markets, or (v) the effect of changes in non-real estate markets.
POLITICAL AND ECONOMIC INSTABILITY AND TRANSPARENCY: PROTECTIONISM; TERRORIST ACTIVITIES.
Global events could affect our business. These include the possibility of protectionist economic policies of the United States or foreign governments, the escalation of terrorist attacks and their increasing unpredictability, health epidemics, changing immigration policies of the United States or foreign governments and the increasing globalization of our multinational clients, which creates pressure to further expand our own geographical reach into less developed countries.
We provide services in over 80 countries with varying degrees of political and economic stability and transparency. For example, within the past few years, certain emerging as well as mature countries in which we operate have experienced serious political and economic instability that will likely continue to arise from time to time. In recent years there have been significant political changes in several countries where we have significant operations, resulting in changes to financial, tax, tariffs, healthcare, governance, immigration and other laws that may directly affect our business and continue to evolve.
The withdrawal of the United Kingdom from the European Union on January 31, 2020 and the ongoing uncertainty with respect to the future relationship of the United Kingdom and the European Union, notwithstanding the impact of the provisional free-trade agreement entered into between the United Kingdom and the European Union on December 24, 2020, may adversely affect business activity, political stability and economic conditions in the United Kingdom, the European Union and elsewhere. The economic conditions and outlook could be further adversely affected by (i) new or modified trading arrangements between the United Kingdom and other countries, (ii) the risk that one or more other European Union countries could come under increasing pressure to leave the European Union, or (iii) the risk the euro as the single currency of the Eurozone could cease to exist. Any of these developments, or the perception any of these developments are likely to occur, could significantly affect economic growth or business activity in the United Kingdom or the European Union, and could result in the relocation of businesses, cause business interruptions, lead to economic recession or depression, and impact the stability of the financial markets, availability of credit, currency exchange rates, interest rates, financial institutions, and political, financial and monetary systems. Any of these developments could affect our businesses, liquidity, results of operations and financial position.
Table of Contents
32
REAL ESTATE SERVICES AND INVESTMENT MANAGEMENT MARKETS ARE HIGHLY COMPETITIVE.
We provide a broad range of commercial real estate and investment management services. Depending on the service, we may face significant competition from other real estate service providers, institutional lenders, insurance companies, investment banking firms, investment managers, accounting firms, technology firms, consulting firms, co-locating providers, temporary space providers and firms providing outsourcing of various types (including technology and building products), any of which may be a global, regional or local firm, and from firms that self-perform their real estate services with in-house capabilities.
Many of our competitors are local or regional firms, which may be substantially smaller in size than we are but hold a larger share of a specific local market. Some of our competitors have expanded the services they offer in an attempt to gain additional business. Some may be providing outsourced facility management services to sell clients products that we do not offer. In some sectors of our business, particularly Corporate Solutions, some of our competitors may have greater financial, technical and marketing resources, larger customer bases, and more established relationships with their customers and suppliers than we have. Larger or better-capitalized competitors in those sectors may be able to respond faster to the need for technological change, price their services more aggressively, compete more effectively for skilled professionals, finance acquisitions more easily, develop innovative products more effectively, and generally compete more aggressively for market share. This can also lead to increasing commoditization of the services we provide and increasing downward pressure on the fees we can charge.
New competitors, or alliances among competitors that increase their ability to service clients, could emerge and gain market share, develop a lower cost structure, adopt more aggressive pricing policies, aggressively recruit our people at above-market compensation, develop a descriptive technology that captures market share, or provide services that gain greater market acceptance than the services we offer. Some of these may come from non-traditional sources, such as information aggregators or digital technology firms. To respond to increased competition and pricing pressure, we may have to lower our prices, loosen contractual terms (such as liability limitations), develop our own innovative approaches to mining data and using information, develop our own disruptive technologies, or increase compensation, which may have an adverse effect on our revenue and profit margins. We may also need to become increasingly productive and efficient in the way we deliver services, or with respect to the cost structure supporting our businesses, which may in turn require more innovative uses of technology as well as data gathering and data mining.
Our industry has continued to consolidate, and there is an inherent risk competitive firms may be more successful than we are at growing through merger and acquisition activity. While we have successfully grown organically and through a series of acquisitions, sourcing and completing acquisitions are complex and sensitive activities. Considering the continuing need to provide clients with more comprehensive services on a more productive and cost-efficient basis, we expect acquisition opportunities to continue to emerge. However, there is no assurance we will be able to continue our acquisition activity in the future at the same pace as we have in the past, particularly as we weigh acquisition opportunities against other potential uses of capital for technology and other investments in systems and human resources, as well as returning capital to shareholders.
Various factors may in some cases lead to a willingness on the part of a competitor to engage in aggressive pricing, advertising or hiring practices in order to maintain market share or client relationships. To the extent this occurs, it increases the competitive risks and the fee and compensation pressures we face, although ramifications will differ from one competitor to another given their different positions within the marketplace and their different financial situations.
We are substantially dependent on long-term client relationships and on revenue received for services under various service agreements. In this competitive market, if we are unable to maintain these relationships or are otherwise unable to retain existing clients and develop new clients, our business, results of operations and/or financial condition may be materially adversely affected. Weaknesses in the markets in which they themselves compete may lead to additional pricing pressure from clients as they themselves came under financial pressure.
THE SEASONALITY OF OUR REAL ESTATE SERVICES BUSINESS EXPOSES US TO RISKS.
Within our Real Estate Services business, our revenue and profits have historically grown progressively by quarter throughout the year mostly due to completing or documenting transactions by fiscal year-end and the fact that certain of our expenses are constant through the year. Historically, we have reported a relatively smaller profit in the first quarter and then increasingly larger profits during each of the following three quarters, excluding the recognition of investment-generated performance fees and co-investment equity gains or losses, each of which can vary from period to period.
Table of Contents
33
The seasonality of our business makes it difficult to determine during the course of the year whether planned results will be achieved, and thus to budget, and to adjust to changes in expectations. In addition, negative economic or other conditions that arise at a time when they impact performance in the fourth quarter, such as the particular timing of when larger transactions close or changes in the value of the U.S. dollar against other currencies occur, may have a more pronounced impact than if they occurred earlier in the year. To the extent we are not able to identify and adjust for changes in expectations, or we are confronted with negative conditions that disproportionately impact the fourth quarter of a calendar year, we could experience a material adverse effect on our financial performance.
Growth in our property management and integrated facilities management businesses and other services related to the growth of outsourcing of corporate real estate services has, to an extent, lessened the seasonality in our revenue and profits during the past few years. However, we believe some level of seasonality will always be inherent to our industry and outside of our control, as was the case in 2020.
RISKS INHERENT IN MAKING ACQUISITIONS AND ENTERING INTO JOINT VENTURES.
Historically, a significant component of our growth has been generated by acquisitions. Any future growth through acquisitions will depend in part on the continued availability of suitable acquisitions at favorable prices and with advantageous terms and conditions, which may not be available to us.
Acquisitions subject us to several significant risks, any of which may prevent us from realizing the anticipated benefits or synergies of the acquisition. The integration of companies is a complex and time-consuming process that could significantly disrupt the businesses of JLL and the acquired company such as: diversion of management attention, failure to identify certain liabilities and issues during the due diligence process, and the inability to retain personnel and clients of the acquired business.
To a much lesser degree, we have occasionally entered into joint ventures to conduct certain businesses or enter new geographies, and we will consider doing so in appropriate situations in the future. Joint ventures have many of the same risk characteristics as acquisitions, particularly with respect to the due diligence and ongoing relationship with joint venture partners, given each partner has inherently less control in a joint venture and will be subject to the authority and economics of the particular structure that is negotiated. Accordingly, we may not have the authority to direct the management and policies of the joint venture. If a joint venture participant acts contrary to our interests, it could harm our brand, business, results of operations and financial condition.
CO-INVESTMENT, INVESTMENT AND REAL ESTATE INVESTMENT BANKING ACTIVITIES.
An important part of our business strategy includes investing in real estate, both individually and along with our investment management clients. As of December 31, 2020, we have unfunded commitment obligations of up to $320.7 million to fund future co-investments. To remain competitive with well-capitalized financial services firms, we also may make merchant banking investments for which we may use our capital to acquire properties before the related investment management funds have been established or investment commitments have been received from third-party clients.
Certain service lines we operate have the acquisition, development, management and sale of real estate as part of their strategy. Investing in any of these types of situations exposes us to several risks.
Investing in real estate for the above reasons poses the following risks:
• We may lose some or all the capital we invest if the investments underperform. Real estate investments can underperform as the result of many factors outside of our control, including the general reduction in asset values within a particular geography or asset class. Starting in 2007 and continuing through 2009, for example, real estate prices in many markets declined as the result of the significant tightening of credit markets and the effects of recessionary economies and significant unemployment. Looking presently at the three years ended December 31, 2020, we had no notable impairment activity.
• We will have fluctuations in earnings and cash flow as we recognize gains or losses, and receive cash upon the disposition of investments, the timing of which is geared toward the benefit of our clients.
Table of Contents
34

• We generally hold our investments in real estate through subsidiaries with limited liability; however, in certain circumstances, it is possible this limited exposure may be expanded in the future based on, among other things, changes in applicable laws. To the extent this occurs, our liability could exceed the amount we have invested.
• We make co-investments in real estate in many countries, and this presents tax, political/legislative, currency, and other risks as described elsewhere in this Item.
In certain situations, we raise funds from outside investors where we are the sponsor of real estate investments, developments, or projects. To the extent we return less than the investors' original investments because the investments, developments, or projects have underperformed relative to expectations, the investors could attempt to recoup the full amount of their investments under securities law theories such as lack of adequate disclosure when funds were initially raised. Sponsoring funds into which retail investors can invest, such as the investment funds sponsored by LaSalle, may increase this risk.
Legal and Compliance Risk Factors
Legal and compliance risk relates to risks arising from the government and regulatory environment and action, and legal proceedings and compliance with integrity policies and procedures. Government and regulatory risks include the risk that government or regulatory actions will impose additional cost on us or cause us to have to change our business models or practices.
BURDEN OF COMPLYING WITH MULTIPLE AND POTENTIALLY CONFLICTING LAWS AND REGULATIONS AND DEALING WITH CHANGES IN LEGAL AND REGULATORY REQUIREMENTS.
We face a broad range of legal and regulatory environments in the countries in which we do business. Coordinating our activities to deal with these requirements presents significant challenges.
Changes in legal and regulatory requirements can impact our ability to engage in business in certain jurisdictions or increase the cost of doing so. The legal requirements of U.S. statutes may also conflict with local legal requirements in a particular country. Avoiding regulatory pitfalls as a result of conflicting laws will continue to be a key focus as non-U.S. statutory law and court decisions create more ambiguity. The jurisdictional reach of laws may be unclear as well, such as when laws in one country purport to regulate the behavior of our subsidiaries or affiliates operating in another country.
Identifying the regulations with which we must comply and then complying with them is complex. We may not be successful in complying with regulations in all situations, as a result of which we could be subject to regulatory actions and fines for non-compliance. We are also seeing increasing levels of labor regulation in emerging markets, such as China, which affect many of our businesses.
Our global operations must comply with all applicable anti-corruption laws, including the U.S. Foreign Corrupt Practices Act and the UK Bribery Act. These anti-corruption laws generally prohibit companies and their intermediaries from making improper payments or providing anything of value to improperly influence government officials or private individuals for the purpose of obtaining or retaining a business advantage. Such prohibitions exist regardless of whether those practices are legal or culturally expected in a particular jurisdiction. Although we have a compliance program in place designed to reduce the likelihood of potential violations of such laws, violations of these laws could result in criminal or civil sanctions and have an adverse effect on our reputation, business and results of operations and financial condition.
U.S. laws and regulations govern the provision of products and services to, and of other trade-related activities involving, certain targeted countries and parties. As a result, we have had longstanding policies and procedures to restrict or prohibit sales of our services into countries subject to embargoes and sanctions, or to countries designated as state sponsors of terrorism, such as Iran. In conjunction with such policies, we have also implemented certain procedures to evaluate whether existing or potential clients appear on the "Specially Designated Nationals and Blocked Persons List" maintained by OFAC.
Changes in governments or majority political parties may result in significant changes in enforcement priorities with respect to employment, health and safety, tax, securities disclosure and other regulations, which, in turn, could negatively affect our business.
Table of Contents
35

LICENSING AND REGULATORY REQUIREMENTS.
The brokerage of real estate sales and leasing transactions; multifamily real estate lending; servicing and asset management; property management; construction; mobile engineering; conducting valuations; trading in securities for clients; and the operation of the investment advisory business, among other business lines, may require us to maintain licenses in various jurisdictions in which we operate and to comply with particular regulations. We believe licensing requirements, including protectionist policies which favor local firms over foreign firms, have generally been increasing in recent years. If we fail to maintain our licenses or conduct regulated activities without a license or in contravention of applicable regulations, we may be required to pay fines, return commissions or investment capital from investors or may have a given license suspended or revoked. Our acquisition activity increases these risks, because we must successfully transfer licenses of acquired entities and their staff, as appropriate. Licensing requirements may also preclude us from engaging in certain types of transactions or change the way in which we conduct business or the cost of doing so. In addition, because the size and scope of real estate sales transactions, the number of countries in which we operate or invest, and the areas we offer services have increased significantly during the past several years, both the difficulty of ensuring compliance with the numerous licensing regimes and the possible loss resulting from noncompliance, have increased.
With respect to our status as an approved lender for Fannie Mae, Freddie Mac and as a HUD-approved originator and issuer of Ginnie Mae securities (collectively the “Agencies”), we are required to comply with various eligibility criteria established by the Agencies, such as minimum net worth, operational liquidity and collateral requirements. In addition, we are required to originate and service loans in accordance with the applicable program requirements and guidelines established from time to time by the Agencies. Failure to comply with any of these program requirements may result in the termination or withdrawal of our approval to sell loans to the Agencies and service their loans.
To fund the Agency loans we originate, we require short-term funding capacity. As of December 31, 2020, we had $3.2 billion of committed loan funding available through commercial banks. Consistent with industry practice, our existing warehouse facilities are short-term, requiring annual renewal. Although we believe our current warehouse facilities are sufficient to meet our current needs in connection with our participation in the Agency programs, in the event any of our warehouse lines are terminated or are not renewed, we may be unable to find replacement financing on favorable terms, or at all, and we might not be able to originate loans.
The regulatory environment facing the investment management industry has also grown significantly more complex in recent years. Countries are expanding the criteria requiring registration of investment advisors and funds, whether based in their country or not, and expanding the rules applicable to those that are registered, all to provide more protection to investors located within their countries. In some cases, rules from different countries are applicable to more than one of our investment advisory businesses and can conflict with those of their home countries. Although we believe we have good processes, policies and controls in place to address the new requirements, these additional registrations and increasingly complex rules increase the possibility violations may occur.
These risks also apply separately to the LaSalle-managed real estate investment trust we launched during 2012. That entity has registered the securities it is issuing with the SEC in the United States and is subject to regulation as a public company, albeit not one separately listed on a stock exchange.
Laws and regulations applicable to our business, both in the United States and in other countries, may change in ways that materially increase the costs of compliance. Particularly in emerging markets, there can be relatively less transparency around the standards and conditions under which licenses are granted, maintained, or renewed. It also may be difficult to defend against the arbitrary revocation of a license in a jurisdiction where the rule of law is less well developed.
As a licensed real estate service provider and advisor in various jurisdictions, we and our licensed employees may be subject to various due diligence, disclosure, standard-of-care, anti-money laundering and other obligations in the jurisdictions in which we operate. Failure to fulfill these obligations could subject us to litigation from parties who purchased, sold, or leased properties we brokered or managed, or who invested in our funds. We could become subject to claims by participants in real estate sales or other services claiming we did not fulfill our obligations as a service provider or broker. This may include claims with respect to conflicts of interest where we are acting, or are perceived to be acting, for two or more clients with potentially contrary interests.
Table of Contents
36
ENVIRONMENTAL LIABILITIES AND REGULATIONS; CLIMATE CHANGE RISKS; AND AIR QUALITY RISKS.
Our operations are affected by federal, state and/or local environmental laws in the countries in which we operate, and we may face liability with respect to environmental issues occurring at properties we manage or occupy, or in which we invest. We may face costs or liabilities under these laws as a result of our role as an on-site property manager or a manager of construction projects. Our risks for such liabilities may increase as we expand our services to include more industrial and/or manufacturing facilities than has been the case in the past, or with respect to our co-investments in real estate as discussed above. Within our own operations, we face additional costs from rising energy costs which make it more expensive to power our corporate offices.
The impact of climate change presents a significant risk. Damage to assets caused by extreme weather events linked to climate change is becoming more evident, highlighting the fragility of global infrastructure. We also anticipate the potential effects of climate change will increasingly impact our own operations and those of client properties we manage, especially when they are in coastal cities.
We anticipate the potential effects of climate change will increasingly impact the decisions and analysis LaSalle makes with respect to the properties it considers for acquisition on behalf of clients, since climate change considerations can impact the relative desirability of locations and the cost of operating and insuring acquired properties. Future legislation that requires specific performance levels for building operations could make non-compliant buildings obsolete, which could materially affect investments in properties we have made on behalf of clients, including those in which we may have co-invested. Climate change considerations will likely also increasingly be part of the consulting work JLL does for clients to the extent it is relevant to the decisions our clients are seeking to make.
Around the world, many countries are enacting stricter regulations to protect the environment and preserve their natural resources. Firms also may face several layers of national and regional regulations. In Europe, the EU’s Environmental Liability Directive establishes a comprehensive liability standard, but individual EU countries may have stricter regulations. The risks may not be limited to fines and the costs of remediation. In Brazil, employees can risk jail sentences as well as fines in connection with pollution incidents. In September 2020, China announced a commitment to be carbon neutral by 2060. This follows environmental protection laws passed in 2014 designed to limit contaminated water, air and soil linked to economic growth and public health.
Declining air quality in major cities may have consequences for our business in various ways, including the need to respond to new regulations that affect the management of buildings, declines in the desire of investors or corporates to invest in or occupy properties in such cities, and our ability to retain staff in locations that may be relatively undesirable as places to live.
Financial Risk Factors
Financial risk relates to our ability to meet financial obligations and mitigate exposure to broad market risks, including volatility in foreign currency exchange rates and interest rates; credit risk; and liquidity risk, including risk related to our credit ratings and our availability and cost of funding.
VOLATILITY IN TRANSACTIONAL-BASED REVENUE.
LaSalle's portfolio is of sufficient size to periodically generate large incentive fees and equity gains (losses) that significantly influence our earnings and the changes in earnings from one year to the next. Volatility in this component of our earnings is inevitable due to the nature of this aspect of our business, and the amount of incentive fees or equity earnings or losses we may recognize in future quarters is inherently unpredictable as it relates to client needs, the market and other dynamics in effect at the time.
We have business lines other than LaSalle that also generate fees based on the timing, size and pricing of closed transactions, and these fees may significantly contribute to our earnings and to changes in earnings from one quarter or year to the next. Volatility in this component of our earnings is inevitable due to the nature of these businesses and the amount of the fees we will recognize in future quarters is inherently unpredictable.
Table of Contents
37
CURRENCY RESTRICTIONS AND EXCHANGE RATE FLUCTUATIONS.
We produce positive cash flows in various countries and currencies that can be most effectively used to fund operations in other countries or to repay our indebtedness, which is currently primarily denominated in U.S. dollars and euros. We face restrictions in certain countries that limit or prevent the transfer of funds to other countries or the exchange of the local currency to other currencies. We also face risks associated with fluctuations in currency exchange rates that may lead to a decline in the value of the funds earned in certain jurisdictions.
Although we operate globally, we report our results in U.S. dollars, and thus our reported results are impacted by the strengthening or weakening of currencies against the U.S. dollar. As an example, the euro and the pound sterling, each a currency used in a significant portion of our operations, have fluctuated notably in recent years. Our revenue from outside of the United States approximated 43% our total revenue for 2020. In addition to the potential negative impact on reported earnings, fluctuations in currencies relative to the U.S. dollar may make it more difficult to perform period-to-period comparisons of the reported results of operations.
We are authorized to use currency-hedging instruments, including foreign currency forward contracts, purchased currency options and borrowings in foreign currency. There can be no assurance hedging will be economically effective. We do not use hedging instruments for speculative purposes.
As currency forward and option contracts are generally conducted off-exchange or over-the-counter ("OTC"), many of the safeguards accorded to participants on organized exchanges, such as the performance guarantee of an exchange clearing house, are generally unavailable in connection with OTC transactions. In addition, there can be no guarantee the counterparty will fulfill its obligations under the contractual agreement, especially in the event of a bankruptcy or insolvency of the counterparty, which would effectively leave us unhedged.
DOWNGRADES IN OUR CREDIT RATINGS COULD INCREASE OUR BORROWING COSTS OR REDUCE OUR ACCESS TO FUNDING SOURCES IN THE CREDIT AND CAPITAL MARKETS.
We are currently assigned corporate credit ratings from Moody's and S&P based on their evaluation of our creditworthiness. As of the date of this filing, our debt ratings remain investment grade, but there can be no assurance we will not be downgraded or that any of our ratings will remain investment grade in the future. If our credit ratings are downgraded or other negative action is taken, we could be required, among other things, to pay additional interest on certain of our senior notes. Credit rating reductions by one or more rating agencies could also adversely affect our access to funding sources, the cost and other terms of obtaining funding as well as our overall financial condition, operating results and cash flow.
INCREASING FINANCIAL RISK OF COUNTERPARTIES, INCLUDING REFINANCING RISK.
Unprecedented disruptions and dynamic changes in the financial markets, and particularly insofar as they have led to major changes in the status and creditworthiness of some of the world's largest banks, investment banks and insurance companies, among others, have generally increased the counterparty risk to us from a financial standpoint, including with respect to:
• Obtaining new credit commitments from lenders• Refinancing credit commitments or loans that have terminated or matured according to their terms, including funds
sponsored by our LaSalle which use leverage in the ordinary course of their investment activities• Placing insurance• Engaging in hedging transactions• Maintaining cash deposits or other investments, both our own and those we hold for the benefit of clients, which
are generally much larger than the maximum amount of government-sponsored deposit insurance in effect for a particular account
Table of Contents
38
General Risk Factors
ABILITY TO CONTINUE TO MAINTAIN SATISFACTORY INTERNAL FINANCIAL REPORTING CONTROLS AND PROCEDURES.
If we are not able to continue to operate successfully under the requirements of Section 404 of the United States Sarbanes-Oxley Act of 2002, or if there is a failure of one or more controls over financial reporting due to fraud, improper execution or the failure of such controls to adjust adequately as our business evolves, then our reputation, financial results and the market price of our stock could suffer. We may be exposed to potential risks from this legislation, which requires companies to evaluate the effectiveness of their internal controls, and such internal control over financial reporting is subject to audit by their independent registered public accounting firm on an annual basis. We have evaluated our internal control over financial reporting as required for purposes of this Annual Report on Form 10-K for the year ended December 31, 2020. Our management concluded our internal control over financial reporting was effective as of December 31, 2020. Our independent registered public accounting firm has issued an unqualified opinion on the effectiveness of our internal control over financial reporting. However, there can be no assurance we will continue to receive an unqualified opinion in future years, particularly since standards continue to evolve and are not necessarily being applied consistently from one independent registered public accounting firm to another. If we identify one or more material weaknesses in our internal control over financial reporting in the future that we cannot remediate in a timely fashion, we may be unable to receive an unqualified opinion at some time in the future from our independent registered public accounting firm.
POTENTIALLY ADVERSE TAX CONSEQUENCES; CHANGES IN TAX LEGISLATION, REGULATION AND TAX RATES.
We face a variety of risks of increased future taxation on our earnings as a corporate taxpayer in the countries in which we have operations. Moving funds between countries can produce adverse tax consequences. In addition, as our operations are global, we face challenges in effectively gaining a tax benefit for costs incurred in one country that benefit our operations in other countries.
Changes in tax legislation or tax rates may occur in one or more jurisdictions in which we operate that may materially impact the cost of operating our business. In December 2017, the U.S. government enacted comprehensive federal tax legislation commonly referred to as the Tax Cuts and Jobs Act (the "Act"). The Act included new limitations on business-related deductions and could increase the taxation of foreign earnings in the U.S., which could increase our future tax expense. Further changes to U.S. corporate tax law have been proposed in the past year, some of which could further increase our future tax expense if enacted.
In addition, the potential exists for significant legislative policy change in the taxation of multinational corporations, as has recently been the subject of the Base Erosion and Profit Shifting project of the Organization for Economic Co-operation and Development, the European Union Anti-Tax Avoidance Directives, and legislation inspired or required by those initiatives. It is also possible that some governments will make significant changes to their tax policies in response to factors such as budgetary needs, feedback from the business community and the public view on applicable tax planning activities. Further, interpretations of existing tax law in various countries may change due to the regulatory and examination policies of the tax authorities and the decisions of courts.
We face such risks both in our own business and in the investment funds LaSalle operates. Adverse or unanticipated tax consequences to the funds can negatively impact fund performance, incentive fees and the value of co-investments we have made. We are uncertain as to the ultimate results of these potential changes or what their effects will be on our business.
Table of Contents
39
ITEM 1B. UNRESOLVED STAFF COMMENTS
None.
ITEM 2. PROPERTIES
Our principal corporate holding company headquarters are located at 200 East Randolph Drive, Chicago, Illinois, where we currently occupy over 165,000 square feet of office space under a lease that expires in May 2032. Our regional headquarters for our Americas, EMEA and Asia Pacific businesses are located in Chicago, London and Singapore, respectively. We have 337 corporate offices worldwide located in most major cities and metropolitan areas as follows: 146 offices in 10 countries in the Americas (including 122 in the United States), 115 offices in 26 countries in EMEA, and 76 offices in 16 countries in Asia Pacific. In addition, we have on-site property and corporate offices located throughout the world. On-site property and facility management offices are generally located within properties we manage and are provided to us without cost.
ITEM 3. LEGAL PROCEEDINGS
We have contingent liabilities from various pending claims and litigation matters arising in the ordinary course of business, some of which involve claims for damages that are substantial in amount. Many of these matters are covered by insurance (including insurance provided through a captive insurance company), although they may nevertheless be subject to large deductibles or retentions, and the amounts being claimed may exceed the available insurance. Although the ultimate liability for these matters cannot be determined, based upon information currently available, we believe the ultimate resolution of such claims and litigation will not have a material adverse effect on our financial position, results of operations, or liquidity.
ITEM 4. MINE SAFETY DISCLOSURES
Not applicable.
Table of Contents
40
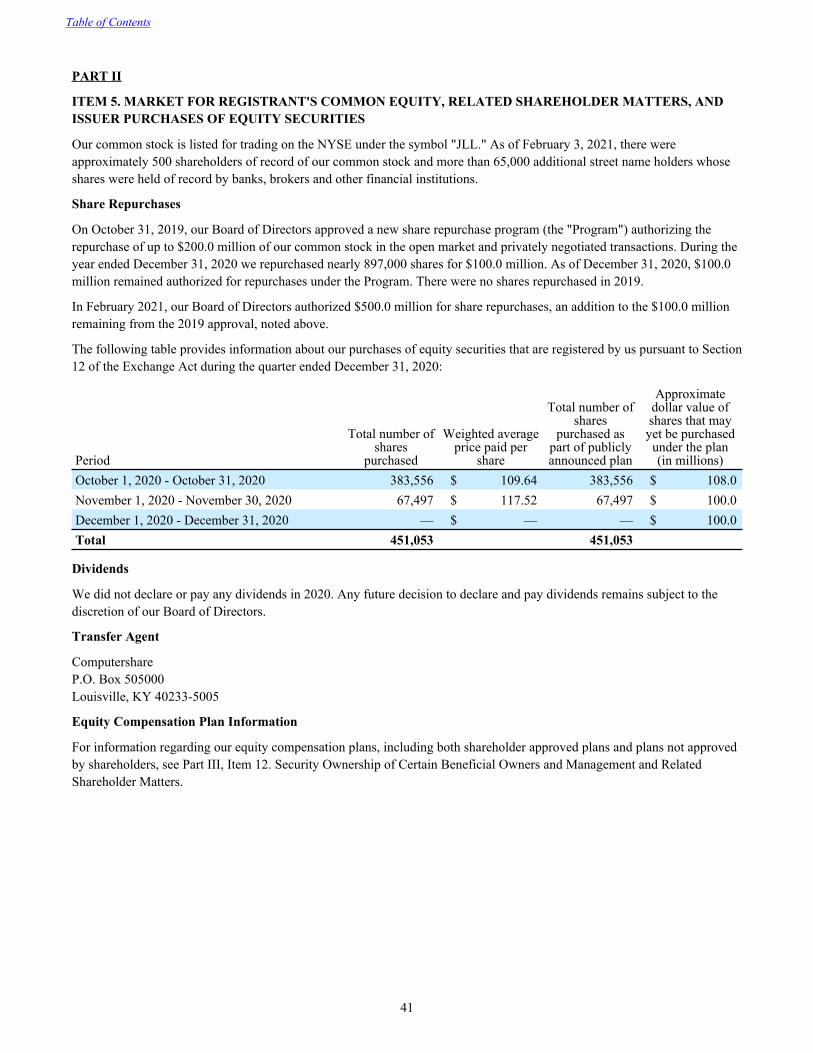
PART II
ITEM 5. MARKET FOR REGISTRANT'S COMMON EQUITY, RELATED SHAREHOLDER MATTERS, AND ISSUER PURCHASES OF EQUITY SECURITIES
Our common stock is listed for trading on the NYSE under the symbol "JLL." As of February 3, 2021, there were approximately 500 shareholders of record of our common stock and more than 65,000 additional street name holders whose shares were held of record by banks, brokers and other financial institutions.
Share Repurchases
On October 31, 2019, our Board of Directors approved a new share repurchase program (the "Program") authorizing the repurchase of up to $200.0 million of our common stock in the open market and privately negotiated transactions. During the year ended December 31, 2020 we repurchased nearly 897,000 shares for $100.0 million. As of December 31, 2020, $100.0 million remained authorized for repurchases under the Program. There were no shares repurchased in 2019.
In February 2021, our Board of Directors authorized $500.0 million for share repurchases, an addition to the $100.0 million remaining from the 2019 approval, noted above.
The following table provides information about our purchases of equity securities that are registered by us pursuant to Section 12 of the Exchange Act during the quarter ended December 31, 2020:
Period
Total number of shares
purchased
Weighted average price paid per
share
Total number of shares
purchased as part of publicly announced plan
Approximate dollar value of shares that may yet be purchased under the plan (in millions)
October 1, 2020 - October 31, 2020 383,556 $ 109.64 383,556 $ 108.0 November 1, 2020 - November 30, 2020 67,497 $ 117.52 67,497 $ 100.0 December 1, 2020 - December 31, 2020 — $ — — $ 100.0 Total 451,053 451,053
Dividends
We did not declare or pay any dividends in 2020. Any future decision to declare and pay dividends remains subject to the discretion of our Board of Directors.
Transfer Agent
ComputershareP.O. Box 505000Louisville, KY 40233-5005
Equity Compensation Plan Information
For information regarding our equity compensation plans, including both shareholder approved plans and plans not approved by shareholders, see Part III, Item 12. Security Ownership of Certain Beneficial Owners and Management and Related Shareholder Matters.
Table of Contents
41
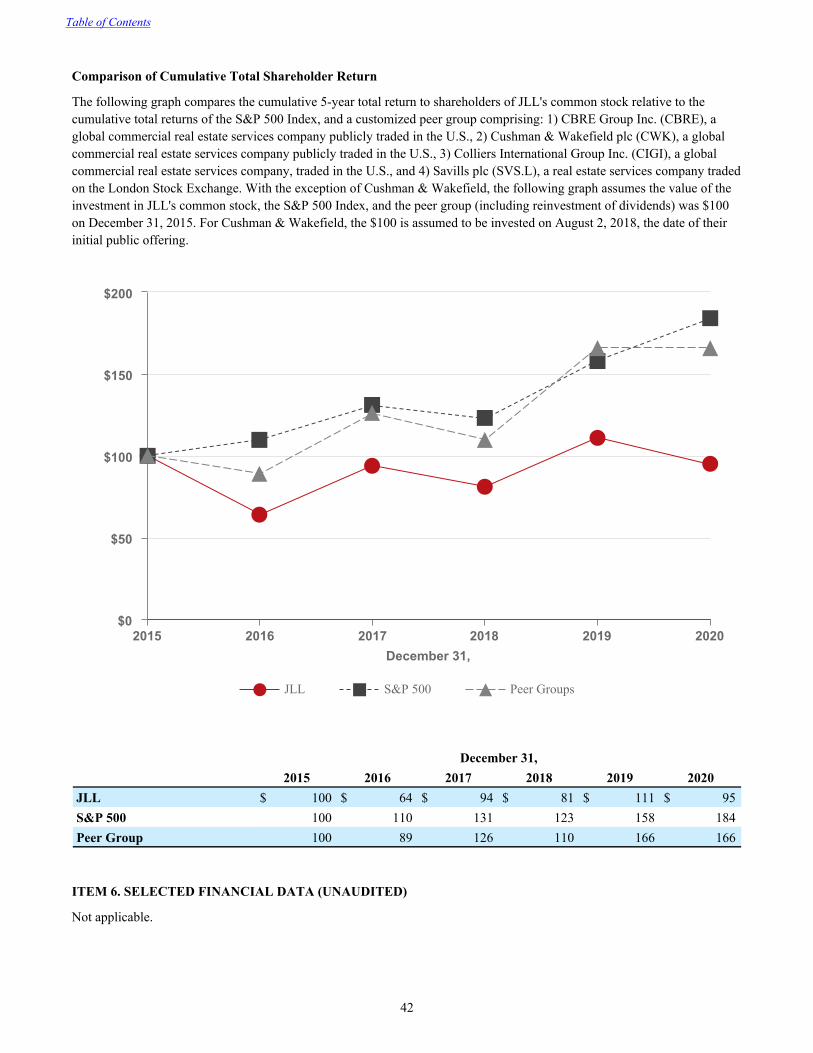
Comparison of Cumulative Total Shareholder Return
The following graph compares the cumulative 5-year total return to shareholders of JLL's common stock relative to the cumulative total returns of the S&P 500 Index, and a customized peer group comprising: 1) CBRE Group Inc. (CBRE), a global commercial real estate services company publicly traded in the U.S., 2) Cushman & Wakefield plc (CWK), a global commercial real estate services company publicly traded in the U.S., 3) Colliers International Group Inc. (CIGI), a global commercial real estate services company, traded in the U.S., and 4) Savills plc (SVS.L), a real estate services company traded on the London Stock Exchange. With the exception of Cushman & Wakefield, the following graph assumes the value of the investment in JLL's common stock, the S&P 500 Index, and the peer group (including reinvestment of dividends) was $100 on December 31, 2015. For Cushman & Wakefield, the $100 is assumed to be invested on August 2, 2018, the date of their initial public offering.
December 31,
JLL S&P 500 Peer Groups
2015 2016 2017 2018 2019 2020$0
$50
$100
$150
$200
December 31,2015 2016 2017 2018 2019 2020
JLL $ 100 $ 64 $ 94 $ 81 $ 111 $ 95 S&P 500 100 110 131 123 158 184 Peer Group 100 89 126 110 166 166
ITEM 6. SELECTED FINANCIAL DATA (UNAUDITED)
Not applicable.
Table of Contents
42

ITEM 7. MANAGEMENT'S DISCUSSION AND ANALYSIS OF FINANCIAL CONDITION AND RESULTS OF OPERATIONS
The following discussion and analysis contains certain forward-looking statements generally identified by the words: anticipates, believes, estimates, expects, forecasts, plans, intends and other similar expressions. Such forward-looking statements involve known and unknown risks, uncertainties, and other factors that may cause our actual results, performance, achievements, plans, and objectives to be materially different from any future results, performance, achievements, plans, and objectives expressed or implied by such forward-looking statements. See the Cautionary Note Regarding Forward-Looking Statements after Part IV, Item 15. Exhibits and Financial Statement Schedules.
We present our Management's Discussion and Analysis in the following sections:
(1) A summary of our critical accounting policies and estimates;(2) Certain items affecting the comparability of results;(3) Certain market and other risks we face;(4) The results of our operations, first on a consolidated basis and then for each of our business segments; and(5) Liquidity and capital resources.
In this Item, we discuss results for the years ended December 31, 2020 and 2019 and the comparison between these years. Discussions of results for the year ended December 31, 2018 and comparisons between 2019 and 2018 results can be found in Item 7. "Management's Discussion and Analysis of Financial Condition and Results of Operations" of our Annual Report on Form 10-K for the year ended December 31, 2019.
SUMMARY OF CRITICAL ACCOUNTING POLICIES AND ESTIMATES
An understanding of our accounting policies is necessary for a complete analysis of our results, financial position, liquidity and trends. The preparation of our financial statements requires management to make certain critical accounting estimates and judgments that impact (i) the stated amount of assets and liabilities, (ii) disclosure of contingent assets and liabilities as of the date of the financial statements and (iii) the reported amounts of revenue and expenses during the reporting periods. These accounting estimates are based on management's judgment. We consider them to be critical because of their significance to the financial statements and the possibility future events may differ from current judgments, or that the use of different assumptions could result in materially different estimates. We review these estimates on a periodic basis to ensure reasonableness. Although actual amounts may differ from such estimated amounts, we believe such differences are not likely to be material. For additional detail regarding our critical accounting policies and estimates discussed below, see Note 2, Summary of Significant Accounting Policies, of the Notes to Consolidated Financial Statements, included in Item 8.
Revenue Recognition
We earn revenue from the following:
• Leasing;• Capital Markets;• Property & Facility Management;• Project & Development Services;• Advisory, Consulting and Other; and • LaSalle.
Our services are generally earned and billed in the form of transaction commissions, advisory and management fees, and incentive fees. Some of the contractual terms related to the services we provide, and thus the revenue we recognize, can be complex and so requires us to make judgments about our performance obligations and the timing and extent of revenue to recognize. In addition, a significant portion of our revenue represents the reimbursement of costs we incur on behalf of clients.
Table of Contents
43
Goodwill and Other Intangible Assets
Consistent with the services nature of the businesses we have acquired, the largest asset on the Consolidated Balance Sheets is goodwill. We do not amortize goodwill; instead, we evaluate goodwill for impairment at least annually, or as events or changes in circumstances indicate the carrying value may be impaired.
In addition, we may record intangible assets as a result of acquisitions, which are primarily composed of customer relationships, management contracts and customer backlog, and are amortized on a straight-line basis over their estimated useful lives. We establish an intangible upon closing on the sale of a mortgage loan we originated, referred to as a warehouse receivable, concurrent with the retention of its servicing rights and amortize the intangible over the estimated period net servicing income is projected to be received. We evaluate our identified intangibles for impairment at least annually, or as events or changes in circumstances indicate the carrying value may be impaired.
Investments in Real Estate Ventures
We invest in certain real estate ventures that primarily own and operate commercial real estate. Historically, these investments have primarily been co-investments in funds that LaSalle establishes in the ordinary course of business for its clients. These investments include non-controlling ownership interests generally ranging from less than 1% to 10% of the respective ventures. We account for these investments at fair value or under the equity method of accounting. Where applicable, we estimate fair value using the net asset value ("NAV") per share (or its equivalent) our investees provide. Critical inputs to NAV estimates include valuations of the underlying real estate assets and borrowings, which incorporate investment-specific assumptions such as discount rates, capitalization rates, rental and expense growth rates, and asset-specific market borrowing rates. In circumstances where the NAV provided by the investee has a reporting date different than ours or when the NAV is not calculated consistent with U.S. GAAP measurement principles, we adjust the NAV accordingly. For Investments in real estate ventures reported at fair value, our investment is increased or decreased each reporting period by the difference between the fair value of the investment and the carrying value as of the balance sheet date. We reflect these fair value adjustments as gains or losses on the Consolidated Statements of Comprehensive Income within Equity earnings.
Income Taxes
We account for income taxes under the asset and liability method. We recognize deferred tax assets and liabilities for the expected future tax consequences attributable to (i) differences between the financial statement carrying amounts of existing assets and liabilities and their respective tax bases and (ii) operating loss and tax credit carryforwards. We measure deferred tax assets and liabilities using the enacted tax rates expected to apply to taxable income in the years in which we expect those temporary differences to be recovered or settled. We recognize into income the effect on deferred tax assets and liabilities of a change in tax rates in the period including the enactment date.
Because of the global and cross-border nature of our business, our corporate tax position is complex. We generally provide for taxes in each tax jurisdiction in which we operate based on local tax regulations and rules. Such taxes are provided on net earnings and include the provision for taxes on substantively all differences between financial statement amounts and amounts used in tax returns, excluding certain non-deductible items and permanent differences.
Our global effective tax rate is sensitive to the complexity of our operations as well as to changes in the mix of our geographic profitability. Local statutory tax rates range from 0% to 38.1% in the countries in which we have significant operations. We evaluate our estimated effective tax rate on a quarterly basis to reflect forecast changes in our geographic mix of income and legislative actions on statutory tax rates.
We provide for the effects of income taxes on interim financial statements based on our estimate of the effective tax rate for the full year.
Our effective tax rates are presented in the following table. In addition, we present the rate excluding the subsequent changes to the provisional estimate relating to the transition tax component of the U.S. tax legislation passed in December 2017 commonly known as the Tax Cuts and Jobs Act ("the Act").
For the year ended December 31,2020 2019 2018
Effective tax rate 20.2 % 22.9 % 30.4 %Effective tax rate excluding the impact of the transition tax 20.2 % 23.5 % 23.7 %
Table of Contents
44
Very low tax rate jurisdictions (those with effective national and local combined tax rates of 25% or lower) providing the most significant contributions to our effective tax rate include: Hong Kong (16.5%), Singapore (17%), the United Kingdom (19%) and Saudi Arabia (20%).
Based on our historical experience and future business plans, we do not expect to repatriate our foreign source earnings to the U.S. As of December 31, 2020, we have therefore not provided for withholding tax, dividend distribution tax, capital gains taxes, or other taxes which could arise upon such distribution. We believe our policy of permanently reinvesting earnings of foreign subsidiaries does not significantly impact our liquidity.
We have established valuation allowances against deferred tax assets where expected future taxable income does not support their realization on a more-likely-than-not basis. We formally assess the likelihood of being able to utilize current tax losses in the future on a country-by-country basis, commensurate with the determination of each quarter’s income tax provision. We establish or increase valuation allowances upon specific indications the carrying value of a tax asset may not be recoverable. Alternatively, we reduce valuation allowances upon (i) specific indications the carrying value of the related tax asset is more-likely-than-not recoverable or (ii) the implementation of tax planning strategies which allow an asset we previously determined to be not realizable to be viewed as realizable.
The table below summarizes certain information regarding the gross deferred tax assets and valuation allowance.
December 31,(in millions) 2020 2019Gross deferred tax assets $ 584.8 492.4 Valuation allowance 71.4 70.4
The increase in gross deferred tax assets in 2020 was primarily the result of increases in compensation accruals in certain jurisdictions.
We evaluate our segment operating performance before tax, and do not consider it meaningful to allocate tax by segment. Estimations and judgments relevant to the determination of tax expense, assets, and liabilities require analysis of the tax environment and the future profitability, for tax purposes, of local statutory legal entities rather than business segments. Our statutory legal entity structure generally does not mirror the way we organize, manage, and report our business operations. For example, the same legal entity may include both LaSalle and RES businesses in a particular country.
As of December 31, 2020, the amount of unrecognized tax benefits was $75.3 million. We believe it is reasonably possible that matters for which we have recorded $18.7 million of unrecognized tax benefits as of December 31, 2020, will be resolved during 2021. The recognition of tax benefits, and other changes to the amounts of our unrecognized tax benefits, may occur as the result of ongoing operations, the outcomes of audits or other examinations by tax authorities, or the passing of statutes of limitations. We do not expect changes to our unrecognized tax benefits to have a significant impact on net income, the financial position, or the cash flows of JLL. We do not believe we have material tax positions for which the ultimate deductibility is highly certain but for which there is uncertainty about the timing of such deductibility.
NEW ACCOUNTING STANDARDS
Refer to Note 2, Summary of Significant Accounting Policies of the Notes to Consolidated Financial Statements, included in Item 8.
Table of Contents
45
ITEMS AFFECTING COMPARABILITY
Macroeconomic Conditions
Our results of operations and the variability of these results are significantly influenced by (i) macroeconomic trends, (ii) the geopolitical environment, (iii) the global and regional real estate markets and (iv) the financial and credit markets. These macroeconomic and other conditions have had, and we expect will continue to have, a significant impact on the variability of our results of operations. Specifically in 2020, macroeconomic conditions influenced by the COVID-19 pandemic impacted our operations.
Acquisitions
The timing of acquisitions may impact the comparability of our results on a year-over-year basis. Our results include incremental revenues and expenses following the completion date of an acquisition. In addition, there is generally an initial adverse impact on net income from an acquisition as a result of pre-acquisition due diligence expenditures, transaction/deal costs and post-acquisition integration costs, such as fees from third-party advisors engaged to assist with onboarding and process alignment, retention and severance expense, early lease termination costs, and other integration expenses.
LaSalle Revenue and Equity Earnings
Our investment management business is, in part, compensated through incentive fees where performance of underlying funds' investments exceeds agreed-to return hurdles. Depending upon performance, disposition activity and the contractual timing of measurement periods with clients, these fees can be significant and vary substantially from period to period.
Equity earnings also may vary substantially from period to period for a variety of reasons, including as a result of (i) gains (losses) on investments reported at fair value, (ii) gains (losses) on asset dispositions and (iii) impairment charges. The timing of recognition of these items may impact comparability between quarters, in any one year, or compared to a prior year.
The comparability of these items can be seen in Note 3, Business Segments, of the Notes to Consolidated Financial Statements, included in Item 8, and is discussed further in Segment Operating Results included herein.
Foreign Currency
We conduct business using a variety of currencies, but we report our results in U.S. dollars. As a result, the volatility of currencies against the U.S. dollar may positively or negatively impact our results. This volatility can make it more difficult to perform period-to-period comparisons of the reported U.S. dollar results of operations, because such results may indicate a rate of growth or decline that might not have been consistent with the real underlying rate of growth or decline in the local operations. Consequently, we provide information about the impact of foreign currencies in the period-to-period comparisons of the reported results of operations in our discussion and analysis of financial condition in the Results of Operations section below.
Transactional-Based Revenue
Transactional-based fees, that are impacted by the size and timing of our clients' transactions, from capital markets activities, leasing activities and other services within our RES business, and LaSalle, increase the variability of the revenue we earn. The timing and the magnitude of these fees can vary significantly from year-to-year and quarter-to-quarter, and from segment-to-segment.
Table of Contents
46
MARKET RISKS
Market Risk
The principal market risks we face due to the risk of loss arising from adverse changes in market rates and prices are:
• Interest rates on our unsecured credit facility (the "Facility"); and
• Foreign exchange risks.
In the normal course of business, we manage these risks through a variety of strategies, including hedging transactions using various derivative financial instruments such as foreign currency forward contracts. We enter into derivative instruments that are short-term in duration with high credit-quality counterparties and diversify our positions across such counterparties in order to reduce our exposure to credit losses. We do not enter into derivative transactions for trading or speculative purposes.
Interest Rates
We centrally manage our debt, considering investment opportunities and risks, tax consequences, and overall financing strategies. Our overall interest rate risk management objective is to limit the impact of interest rate changes on earnings and cash flows and to lower our overall borrowing costs. We are primarily exposed to interest rate risk on our Facility, which had a borrowing capacity of $2.75 billion as of December 31, 2020. The Facility consists of revolving credit available for working capital, investments, capital expenditures and acquisitions. Our average outstanding borrowings under the Facility during 2020 were $865.1 million, with an effective interest rate of 1.6%. We had no outstanding borrowings under the Facility as of December 31, 2020. The Facility bears a variable rate of interest that fluctuates based on market rates.
Our Notes, $275.0 million face value due in November 2022, bear interest at an annual rate of 4.4%, subject to adjustment if a credit rating assigned to the Notes is downgraded below an investment grade rating (or subsequently upgraded). Our €350.0 million face value of Euro Notes is split between €175.0 million due in June 2027 and €175.0 million due in June 2029, bearing interest at an annual rate of 1.96% and 2.21%, respectively. The issuance of the Notes and Euro Notes at fixed interest rates has helped to limit our exposure to future movements in interest rates.
We assess interest rate sensitivity to estimate the potential effect of rising interest rates on our variable rate debt. If interest rates were 50 basis points higher during 2020, Interest expense, net of interest income, would have been $4.3 million higher.
Foreign Exchange
Foreign exchange risk is the risk we will incur economic losses due to adverse changes in foreign currency exchange rates. Our revenue from outside of the U.S. approximated 43% and 44% of our total revenue for 2020 and 2019, respectively, as outlined in the table below. Operating in international markets means we are exposed to movements in foreign exchange rates, most significantly the British pound and the euro.
We mitigate our foreign currency exchange risk principally by (i) establishing local operations in the markets we serve and (ii) invoicing customers in the same currency as the source of the costs. The impact of translating expenses incurred in foreign currencies into U.S. dollars reduces the impact of translating revenue earned in foreign currencies into U.S. dollars. In addition, British pound and Singapore dollar expenses incurred as a result of our regional headquarters being located in London and Singapore, respectively, act as ongoing partial operational hedges against our translation exposures to those currencies.
We enter into forward foreign currency exchange contracts to manage currency risks associated with intercompany loan balances. Generally, the maturity of these contracts is less than 60 days. As of December 31, 2020, we had forward exchange contracts in effect with a gross notional value of $2.34 billion ($1.42 billion on a net basis). The corresponding net carrying gain is generally offset by a carrying loss in associated intercompany loans.
Table of Contents
47
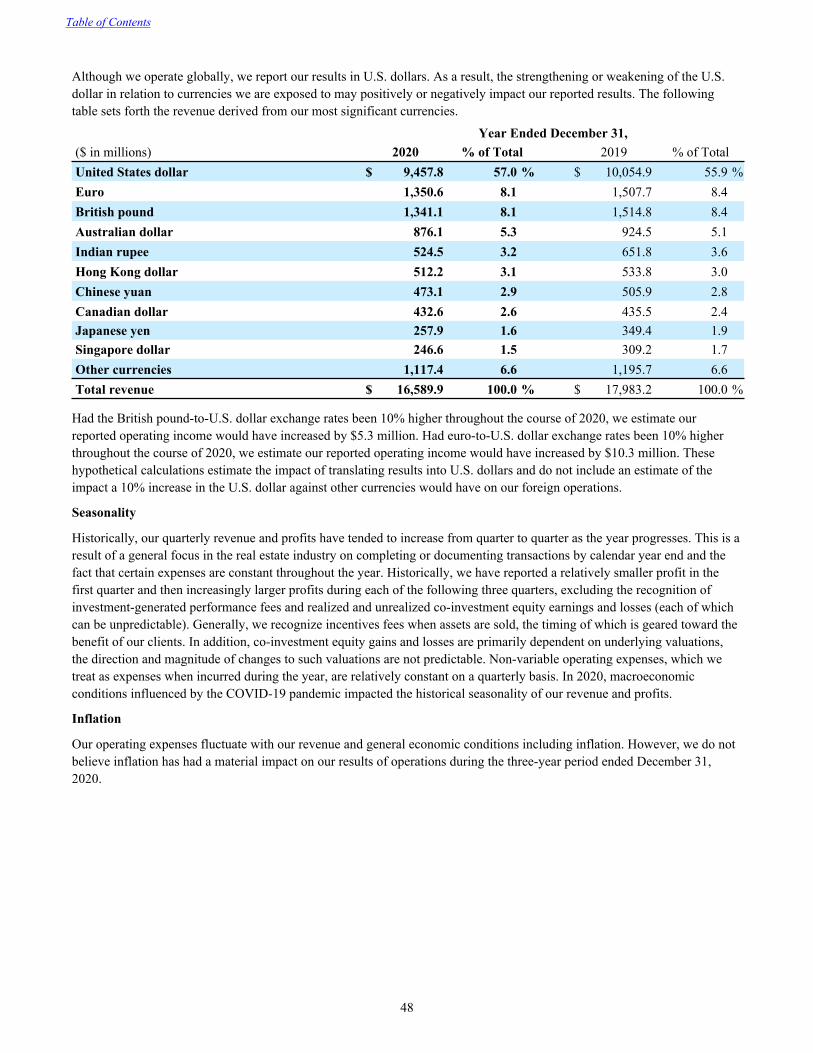
Although we operate globally, we report our results in U.S. dollars. As a result, the strengthening or weakening of the U.S. dollar in relation to currencies we are exposed to may positively or negatively impact our reported results. The following table sets forth the revenue derived from our most significant currencies.
Year Ended December 31,($ in millions) 2020 % of Total 2019 % of TotalUnited States dollar $ 9,457.8 57.0 % $ 10,054.9 55.9 %Euro 1,350.6 8.1 1,507.7 8.4 British pound 1,341.1 8.1 1,514.8 8.4 Australian dollar 876.1 5.3 924.5 5.1 Indian rupee 524.5 3.2 651.8 3.6 Hong Kong dollar 512.2 3.1 533.8 3.0 Chinese yuan 473.1 2.9 505.9 2.8 Canadian dollar 432.6 2.6 435.5 2.4 Japanese yen 257.9 1.6 349.4 1.9 Singapore dollar 246.6 1.5 309.2 1.7 Other currencies 1,117.4 6.6 1,195.7 6.6 Total revenue $ 16,589.9 100.0 % $ 17,983.2 100.0 %
Had the British pound-to-U.S. dollar exchange rates been 10% higher throughout the course of 2020, we estimate our reported operating income would have increased by $5.3 million. Had euro-to-U.S. dollar exchange rates been 10% higher throughout the course of 2020, we estimate our reported operating income would have increased by $10.3 million. These hypothetical calculations estimate the impact of translating results into U.S. dollars and do not include an estimate of the impact a 10% increase in the U.S. dollar against other currencies would have on our foreign operations.
Seasonality
Historically, our quarterly revenue and profits have tended to increase from quarter to quarter as the year progresses. This is a result of a general focus in the real estate industry on completing or documenting transactions by calendar year end and the fact that certain expenses are constant throughout the year. Historically, we have reported a relatively smaller profit in the first quarter and then increasingly larger profits during each of the following three quarters, excluding the recognition of investment-generated performance fees and realized and unrealized co-investment equity earnings and losses (each of which can be unpredictable). Generally, we recognize incentives fees when assets are sold, the timing of which is geared toward the benefit of our clients. In addition, co-investment equity gains and losses are primarily dependent on underlying valuations, the direction and magnitude of changes to such valuations are not predictable. Non-variable operating expenses, which we treat as expenses when incurred during the year, are relatively constant on a quarterly basis. In 2020, macroeconomic conditions influenced by the COVID-19 pandemic impacted the historical seasonality of our revenue and profits.
Inflation
Our operating expenses fluctuate with our revenue and general economic conditions including inflation. However, we do not believe inflation has had a material impact on our results of operations during the three-year period ended December 31, 2020.
Table of Contents
48
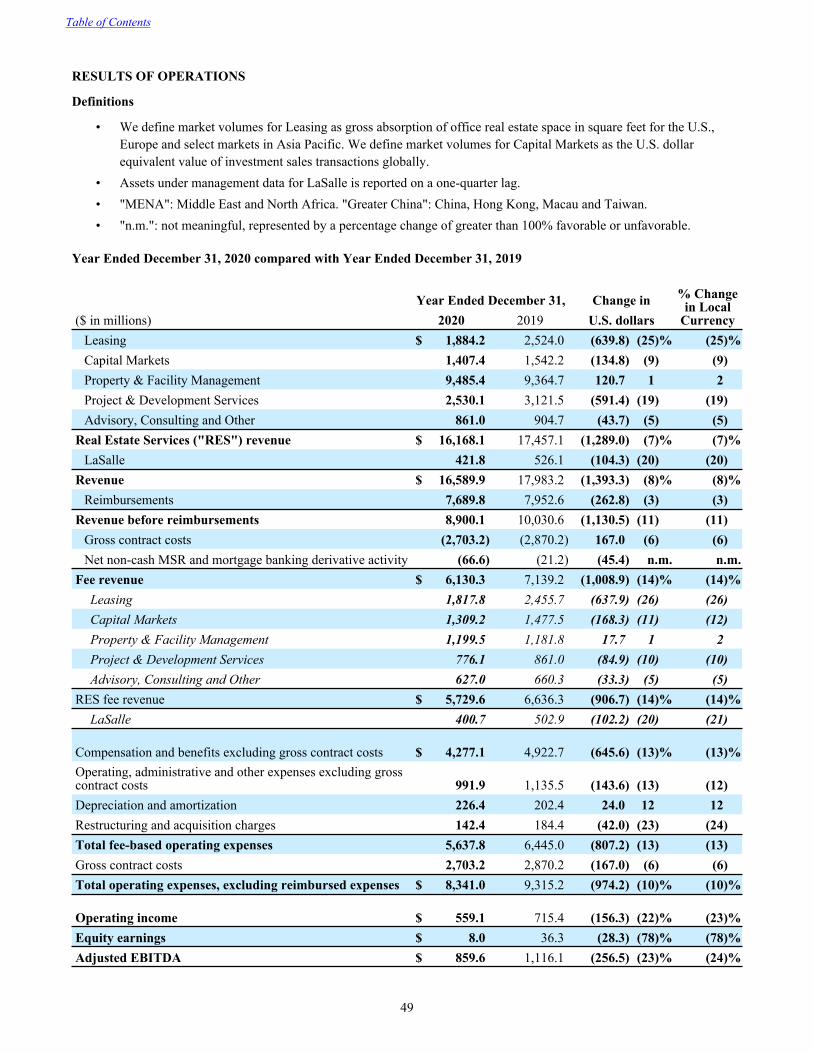
RESULTS OF OPERATIONS
Definitions
• We define market volumes for Leasing as gross absorption of office real estate space in square feet for the U.S., Europe and select markets in Asia Pacific. We define market volumes for Capital Markets as the U.S. dollar equivalent value of investment sales transactions globally.
• Assets under management data for LaSalle is reported on a one-quarter lag.• "MENA": Middle East and North Africa. "Greater China": China, Hong Kong, Macau and Taiwan.• "n.m.": not meaningful, represented by a percentage change of greater than 100% favorable or unfavorable.
Year Ended December 31, 2020 compared with Year Ended December 31, 2019
Year Ended December 31, Change in % Change in Local
Currency($ in millions) 2020 2019 U.S. dollarsLeasing $ 1,884.2 2,524.0 (639.8) (25) % (25) %Capital Markets 1,407.4 1,542.2 (134.8) (9) (9) Property & Facility Management 9,485.4 9,364.7 120.7 1 2 Project & Development Services 2,530.1 3,121.5 (591.4) (19) (19) Advisory, Consulting and Other 861.0 904.7 (43.7) (5) (5)
Real Estate Services ("RES") revenue $ 16,168.1 17,457.1 (1,289.0) (7) % (7) %LaSalle 421.8 526.1 (104.3) (20) (20)
Revenue $ 16,589.9 17,983.2 (1,393.3) (8) % (8) %Reimbursements 7,689.8 7,952.6 (262.8) (3) (3)
Revenue before reimbursements 8,900.1 10,030.6 (1,130.5) (11) (11) Gross contract costs (2,703.2) (2,870.2) 167.0 (6) (6) Net non-cash MSR and mortgage banking derivative activity (66.6) (21.2) (45.4) n.m. n.m.
Fee revenue $ 6,130.3 7,139.2 (1,008.9) (14) % (14) %Leasing 1,817.8 2,455.7 (637.9) (26) (26) Capital Markets 1,309.2 1,477.5 (168.3) (11) (12) Property & Facility Management 1,199.5 1,181.8 17.7 1 2 Project & Development Services 776.1 861.0 (84.9) (10) (10) Advisory, Consulting and Other 627.0 660.3 (33.3) (5) (5)
RES fee revenue $ 5,729.6 6,636.3 (906.7) (14) % (14) %LaSalle 400.7 502.9 (102.2) (20) (21)
Compensation and benefits excluding gross contract costs $ 4,277.1 4,922.7 (645.6) (13) % (13) %Operating, administrative and other expenses excluding gross contract costs 991.9 1,135.5 (143.6) (13) (12) Depreciation and amortization 226.4 202.4 24.0 12 12 Restructuring and acquisition charges 142.4 184.4 (42.0) (23) (24) Total fee-based operating expenses 5,637.8 6,445.0 (807.2) (13) (13) Gross contract costs 2,703.2 2,870.2 (167.0) (6) (6) Total operating expenses, excluding reimbursed expenses $ 8,341.0 9,315.2 (974.2) (10) % (10) %
Operating income $ 559.1 715.4 (156.3) (22) % (23) %Equity earnings $ 8.0 36.3 (28.3) (78) % (78) %Adjusted EBITDA $ 859.6 1,116.1 (256.5) (23) % (24) %
Table of Contents
49
Non-GAAP Financial Measures
Management uses certain non-GAAP financial measures to develop budgets and forecasts, measure and reward performance against those budgets and forecasts, and enhance comparability to prior periods. These measures are believed to be useful to investors and other external stakeholders as supplemental measures of core operating performance and include the following.
(i) Fee revenue and fee-based operating expenses
(ii) Adjusted EBITDA and Adjusted EBITDA margin
(iii) Percentage changes against prior periods, presented on a local currency basis
However, non-GAAP financial measures should not be considered alternatives to measures determined in accordance with U.S. GAAP. Any measure that eliminates components of a company’s capital structure, cost of operations or investments, or other results has limitations as a performance measure. In light of these limitations, management also considers U.S. GAAP financial measures and does not rely solely on non-GAAP financial measures. Because our non-GAAP financial measures are not calculated in accordance with U.S. GAAP, they may not be comparable to similarly titled measures used by other companies.
Adjustments to GAAP Financial Measures Used to Calculate non-GAAP Financial Measures
Gross contract costs represent certain costs associated with client-dedicated employees and third-party vendors and subcontractors and are indirectly reimbursed through the fees we receive. These costs are presented on a gross basis in Operating expenses with the equal amount of corresponding fees in Revenue before reimbursements. Consistent with our treatment of directly reimbursed expenses, excluding gross contract costs from both Fee revenue and Fee-based operating expenses more accurately reflects how we manage our expense base and operating margins and also enables a more consistent performance assessment across a portfolio of contracts with varying payment terms and structures, including those with direct versus indirect reimbursement of such costs.
Net non-cash mortgage servicing rights ("MSR") and mortgage banking derivative activity consists of the balances presented within Revenue composed of (i) derivative gains/losses resulting from mortgage banking loan commitment and warehousing activity and (ii) gains recognized from the retention of MSR upon origination and sale of mortgage loans, offset by (iii) amortization of MSR intangible assets over the period net servicing income is projected to be received. Non-cash derivative gains/losses resulting from mortgage banking loan commitment and warehousing activity are calculated as the estimated fair value of loan commitments and subsequent changes thereof, primarily represented by the estimated net cash flows associated with future servicing rights. MSR gains and corresponding MSR intangible assets are calculated as the present value of estimated net cash flows over the estimated mortgage servicing periods. The above activity is reported entirely within Revenue of the Capital Markets service line of the Americas segment. Excluding net non-cash MSR and mortgage banking derivative activity reflects how we manage and evaluate performance because the excluded activity is non-cash in nature.
Restructuring and acquisition charges primarily consist of (i) severance and employment-related charges, including those related to external service providers, incurred in conjunction with a structural business shift, which can be represented by a notable change in headcount, change in leadership or transformation of business processes, (ii) acquisition, transaction and integration-related charges, including non-cash fair value adjustments to assets and liabilities recorded in purchase accounting such as earn-out liabilities and intangible assets and (iii) lease exit charges. Such activity is excluded as the amounts are generally either non-cash in nature or the anticipated benefits from the expenditures would not likely be fully realized until future periods. Restructuring and acquisition charges are excluded from segment operating results and therefore not a line item in the segments’ reconciliation to Adjusted EBITDA.
Gain on Disposition reflects the net gain recognized on the sale of property management businesses in continental Europe. Given the low frequency of business disposals by the company historically, the gain directly associated with such activity is excluded as it is not considered indicative of core operating performance.
Table of Contents
50
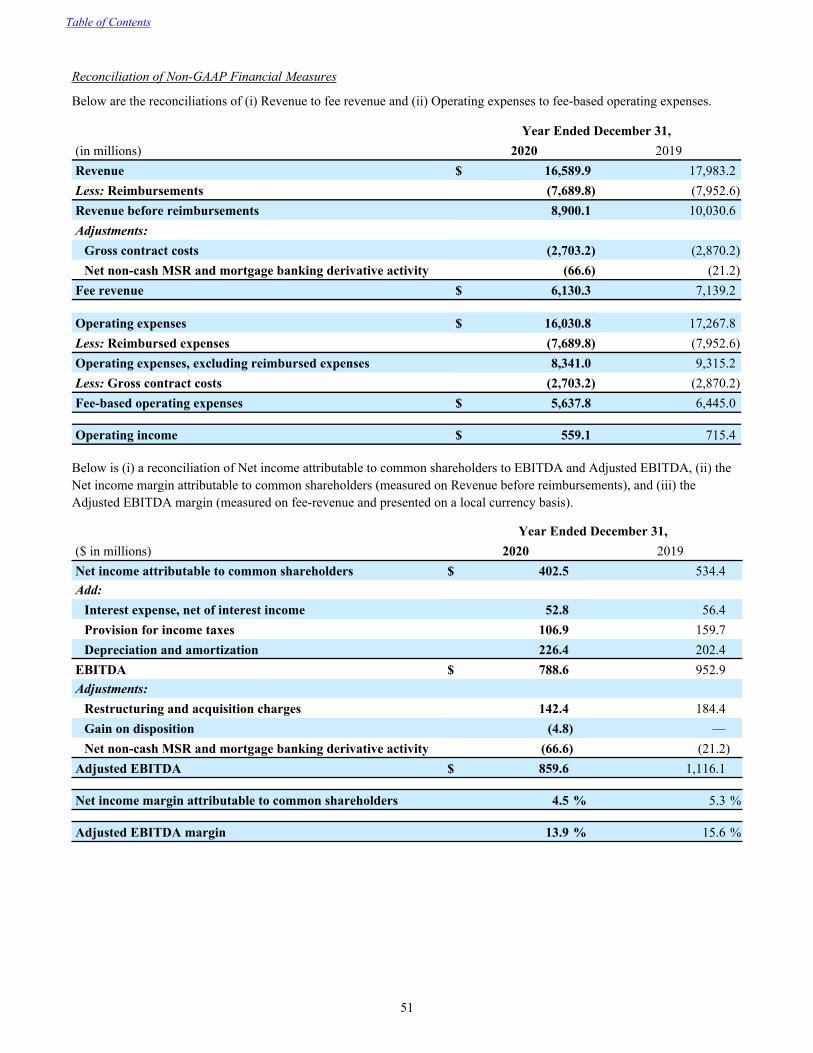
Reconciliation of Non-GAAP Financial Measures
Below are the reconciliations of (i) Revenue to fee revenue and (ii) Operating expenses to fee-based operating expenses.
Year Ended December 31,(in millions) 2020 2019Revenue $ 16,589.9 17,983.2 Less: Reimbursements (7,689.8) (7,952.6) Revenue before reimbursements 8,900.1 10,030.6 Adjustments:
Gross contract costs (2,703.2) (2,870.2) Net non-cash MSR and mortgage banking derivative activity (66.6) (21.2)
Fee revenue $ 6,130.3 7,139.2
Operating expenses $ 16,030.8 17,267.8 Less: Reimbursed expenses (7,689.8) (7,952.6) Operating expenses, excluding reimbursed expenses 8,341.0 9,315.2 Less: Gross contract costs (2,703.2) (2,870.2) Fee-based operating expenses $ 5,637.8 6,445.0
Operating income $ 559.1 715.4
Below is (i) a reconciliation of Net income attributable to common shareholders to EBITDA and Adjusted EBITDA, (ii) the Net income margin attributable to common shareholders (measured on Revenue before reimbursements), and (iii) the Adjusted EBITDA margin (measured on fee-revenue and presented on a local currency basis).
Year Ended December 31,($ in millions) 2020 2019Net income attributable to common shareholders $ 402.5 534.4 Add:
Interest expense, net of interest income 52.8 56.4 Provision for income taxes 106.9 159.7 Depreciation and amortization 226.4 202.4
EBITDA $ 788.6 952.9 Adjustments:
Restructuring and acquisition charges 142.4 184.4 Gain on disposition (4.8) — Net non-cash MSR and mortgage banking derivative activity (66.6) (21.2)
Adjusted EBITDA $ 859.6 1,116.1
Net income margin attributable to common shareholders 4.5 % 5.3 %
Adjusted EBITDA margin 13.9 % 15.6 %
Table of Contents
51
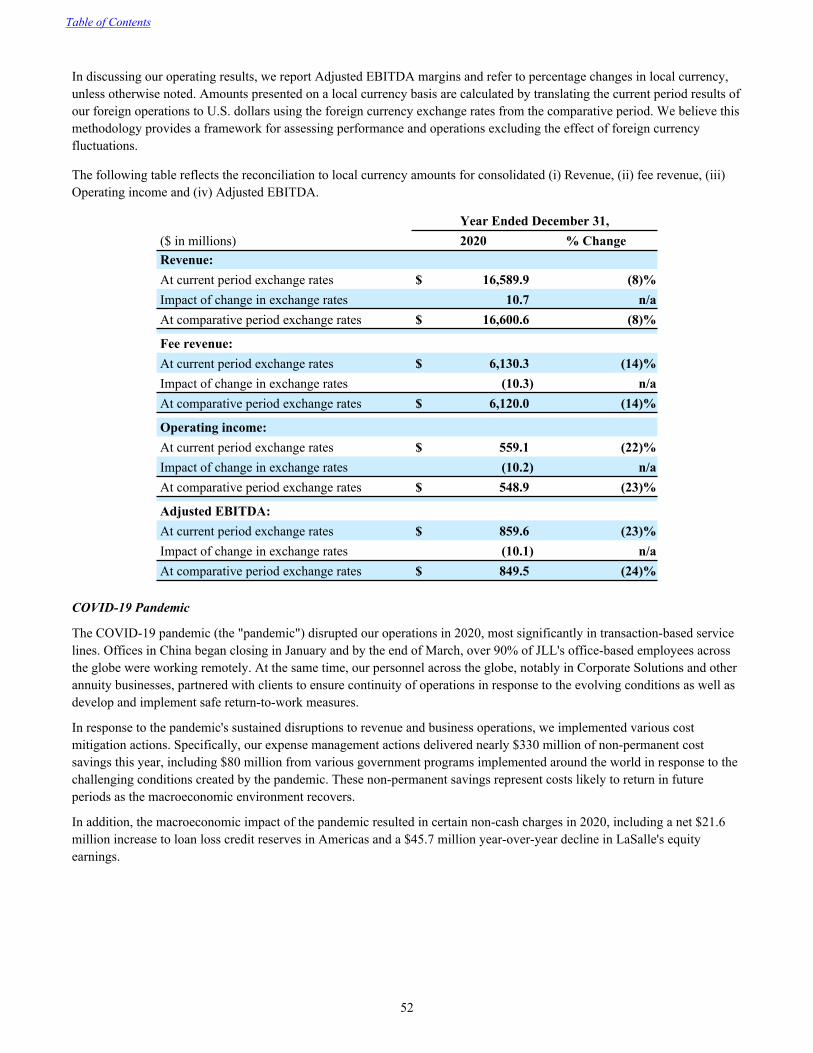
In discussing our operating results, we report Adjusted EBITDA margins and refer to percentage changes in local currency, unless otherwise noted. Amounts presented on a local currency basis are calculated by translating the current period results of our foreign operations to U.S. dollars using the foreign currency exchange rates from the comparative period. We believe this methodology provides a framework for assessing performance and operations excluding the effect of foreign currency fluctuations.
The following table reflects the reconciliation to local currency amounts for consolidated (i) Revenue, (ii) fee revenue, (iii) Operating income and (iv) Adjusted EBITDA.
Year Ended December 31,($ in millions) 2020 % ChangeRevenue:At current period exchange rates $ 16,589.9 (8) %Impact of change in exchange rates 10.7 n/aAt comparative period exchange rates $ 16,600.6 (8) %
Fee revenue:At current period exchange rates $ 6,130.3 (14) %Impact of change in exchange rates (10.3) n/aAt comparative period exchange rates $ 6,120.0 (14) %
Operating income:At current period exchange rates $ 559.1 (22) %Impact of change in exchange rates (10.2) n/aAt comparative period exchange rates $ 548.9 (23) %
Adjusted EBITDA:At current period exchange rates $ 859.6 (23) %Impact of change in exchange rates (10.1) n/aAt comparative period exchange rates $ 849.5 (24) %
COVID-19 Pandemic
The COVID-19 pandemic (the "pandemic") disrupted our operations in 2020, most significantly in transaction-based service lines. Offices in China began closing in January and by the end of March, over 90% of JLL's office-based employees across the globe were working remotely. At the same time, our personnel across the globe, notably in Corporate Solutions and other annuity businesses, partnered with clients to ensure continuity of operations in response to the evolving conditions as well as develop and implement safe return-to-work measures.
In response to the pandemic's sustained disruptions to revenue and business operations, we implemented various cost mitigation actions. Specifically, our expense management actions delivered nearly $330 million of non-permanent cost savings this year, including $80 million from various government programs implemented around the world in response to the challenging conditions created by the pandemic. These non-permanent savings represent costs likely to return in future periods as the macroeconomic environment recovers.
In addition, the macroeconomic impact of the pandemic resulted in certain non-cash charges in 2020, including a net $21.6 million increase to loan loss credit reserves in Americas and a $45.7 million year-over-year decline in LaSalle's equity earnings.
Table of Contents
52
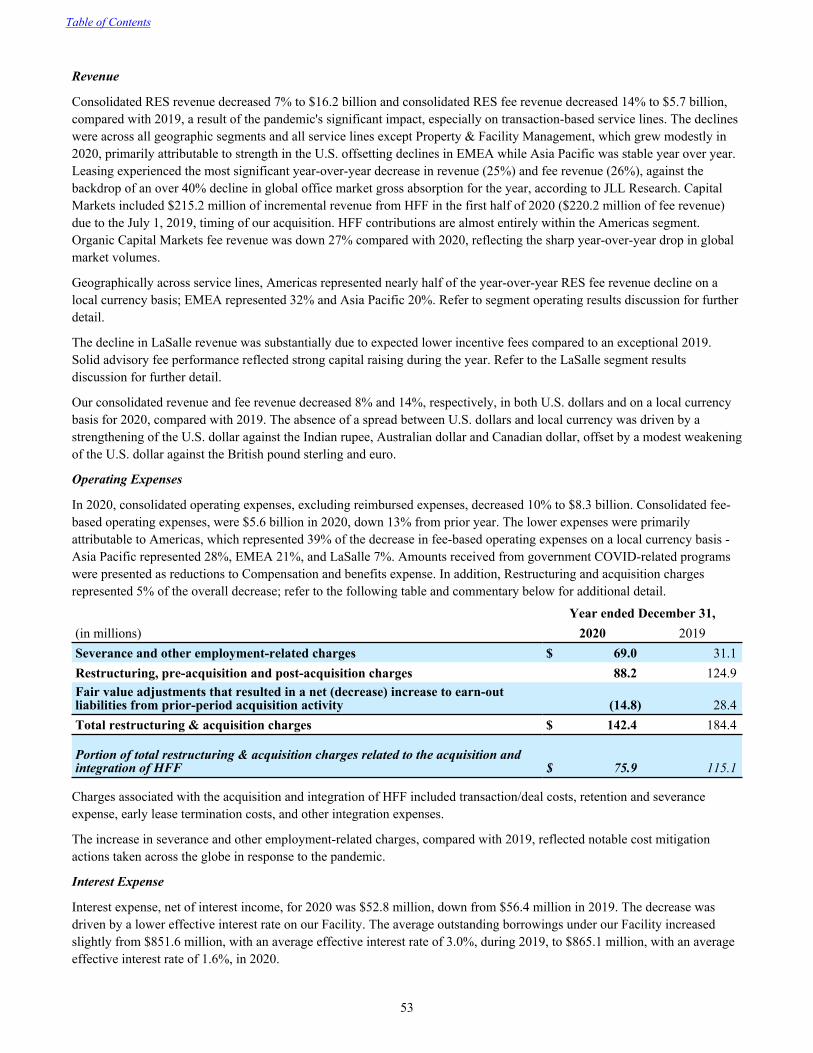
Revenue
Consolidated RES revenue decreased 7% to $16.2 billion and consolidated RES fee revenue decreased 14% to $5.7 billion, compared with 2019, a result of the pandemic's significant impact, especially on transaction-based service lines. The declines were across all geographic segments and all service lines except Property & Facility Management, which grew modestly in 2020, primarily attributable to strength in the U.S. offsetting declines in EMEA while Asia Pacific was stable year over year. Leasing experienced the most significant year-over-year decrease in revenue (25%) and fee revenue (26%), against the backdrop of an over 40% decline in global office market gross absorption for the year, according to JLL Research. Capital Markets included $215.2 million of incremental revenue from HFF in the first half of 2020 ($220.2 million of fee revenue) due to the July 1, 2019, timing of our acquisition. HFF contributions are almost entirely within the Americas segment. Organic Capital Markets fee revenue was down 27% compared with 2020, reflecting the sharp year-over-year drop in global market volumes.
Geographically across service lines, Americas represented nearly half of the year-over-year RES fee revenue decline on a local currency basis; EMEA represented 32% and Asia Pacific 20%. Refer to segment operating results discussion for further detail.
The decline in LaSalle revenue was substantially due to expected lower incentive fees compared to an exceptional 2019. Solid advisory fee performance reflected strong capital raising during the year. Refer to the LaSalle segment results discussion for further detail.
Our consolidated revenue and fee revenue decreased 8% and 14%, respectively, in both U.S. dollars and on a local currency basis for 2020, compared with 2019. The absence of a spread between U.S. dollars and local currency was driven by a strengthening of the U.S. dollar against the Indian rupee, Australian dollar and Canadian dollar, offset by a modest weakening of the U.S. dollar against the British pound sterling and euro.
Operating Expenses
In 2020, consolidated operating expenses, excluding reimbursed expenses, decreased 10% to $8.3 billion. Consolidated fee-based operating expenses, were $5.6 billion in 2020, down 13% from prior year. The lower expenses were primarily attributable to Americas, which represented 39% of the decrease in fee-based operating expenses on a local currency basis - Asia Pacific represented 28%, EMEA 21%, and LaSalle 7%. Amounts received from government COVID-related programs were presented as reductions to Compensation and benefits expense. In addition, Restructuring and acquisition charges represented 5% of the overall decrease; refer to the following table and commentary below for additional detail.
Year ended December 31,(in millions) 2020 2019Severance and other employment-related charges $ 69.0 31.1 Restructuring, pre-acquisition and post-acquisition charges 88.2 124.9 Fair value adjustments that resulted in a net (decrease) increase to earn-out liabilities from prior-period acquisition activity (14.8) 28.4 Total restructuring & acquisition charges $ 142.4 184.4
Portion of total restructuring & acquisition charges related to the acquisition and integration of HFF $ 75.9 115.1
Charges associated with the acquisition and integration of HFF included transaction/deal costs, retention and severance expense, early lease termination costs, and other integration expenses.
The increase in severance and other employment-related charges, compared with 2019, reflected notable cost mitigation actions taken across the globe in response to the pandemic.
Interest Expense
Interest expense, net of interest income, for 2020 was $52.8 million, down from $56.4 million in 2019. The decrease was driven by a lower effective interest rate on our Facility. The average outstanding borrowings under our Facility increased slightly from $851.6 million, with an average effective interest rate of 3.0%, during 2019, to $865.1 million, with an average effective interest rate of 1.6%, in 2020.
Table of Contents
53
Equity Earnings
Equity earnings decreased from $36.3 million in 2019 to $8.0 million in 2020. LaSalle is a key driver of activity in both years; refer to the LaSalle segment results discussion for additional detail. In addition, $12.7 million of equity earnings were recognized in the first quarter of 2020 for the Americas segment, substantially attributable to gains by consolidated variable interest entities in which JLL held no equity interest. These gains are also reflected in net income attributable to noncontrolling interest and, therefore, had no impact to Net income attributable to common shareholders.
Income Taxes
The provision for income taxes was $106.9 million and $159.7 million for the years ended December 31, 2020 and 2019, respectively, representing effective tax rates ("ETR") of 20.2% and 22.9%, respectively. In 2019, there was a change in the estimated liability associated with the transition tax from the Act; excluding the $4.3 million benefit from this change in estimate, the ETR was 23.5%. Refer to the Income Tax discussion in the Summary of Critical Accounting Policies and Estimates and Note 8, Income Taxes, of the Notes to Consolidated Financial Statements, included in Item 8, for a further discussion of our ETR.
Net Income and Adjusted EBITDA
Net income attributable to common shareholders was $402.5 million for the year, or $7.70 per diluted common share, compared with $534.4 million for 2019, or $10.87 per diluted common share. The July 2019 issuance of 5.7 million shares in conjunction with the HFF acquisition increased the weighted average shares outstanding in 2020, compared with 2019, impacting earnings per share. Adjusted EBITDA decreased 24% from the prior year to $859.6 million in 2020. Net income margin attributable to common shareholders was 4.5% in 2020, down from 5.3% in the prior year. Adjusted EBITDA margin, calculated on a fee revenue basis, was 14.0% in USD for 2020 (13.9% in local currency), compared with 15.6% last year. The 160 basis-point net reduction was driven by (i) lower transaction-based revenues in RES, (ii) the year-over-year differential in LaSalle incentive fees and equity earnings and (iii) the non-cash charge to increase loan loss credit reserves, partially offset by savings from cost mitigation actions.
Segment Operating Results
We manage and report our operations as four business segments. Our three geographic RES segments include Americas, EMEA and Asia Pacific. Our fourth segment, LaSalle, offers investment management services on a global basis.
Each geographic region offers our full range of real estate services, including agency leasing and tenant representation, capital markets, property management, facility management, project and development services, and advisory, consulting and valuation services, including digital solutions. We define "property management" to be services we provide to non-occupying property investors and "facility management" to be services we provide to owner-occupiers.
For segment reporting, (i) gross contract costs and (ii) net non-cash MSR and mortgage banking derivative activity are both excluded from revenue in determining "fee revenue". Gross contract costs are excluded from operating expenses in determining "fee-based operating expenses". In addition, our measure of segment results, Segment income, excludes Restructuring and acquisition charges.
Table of Contents
54
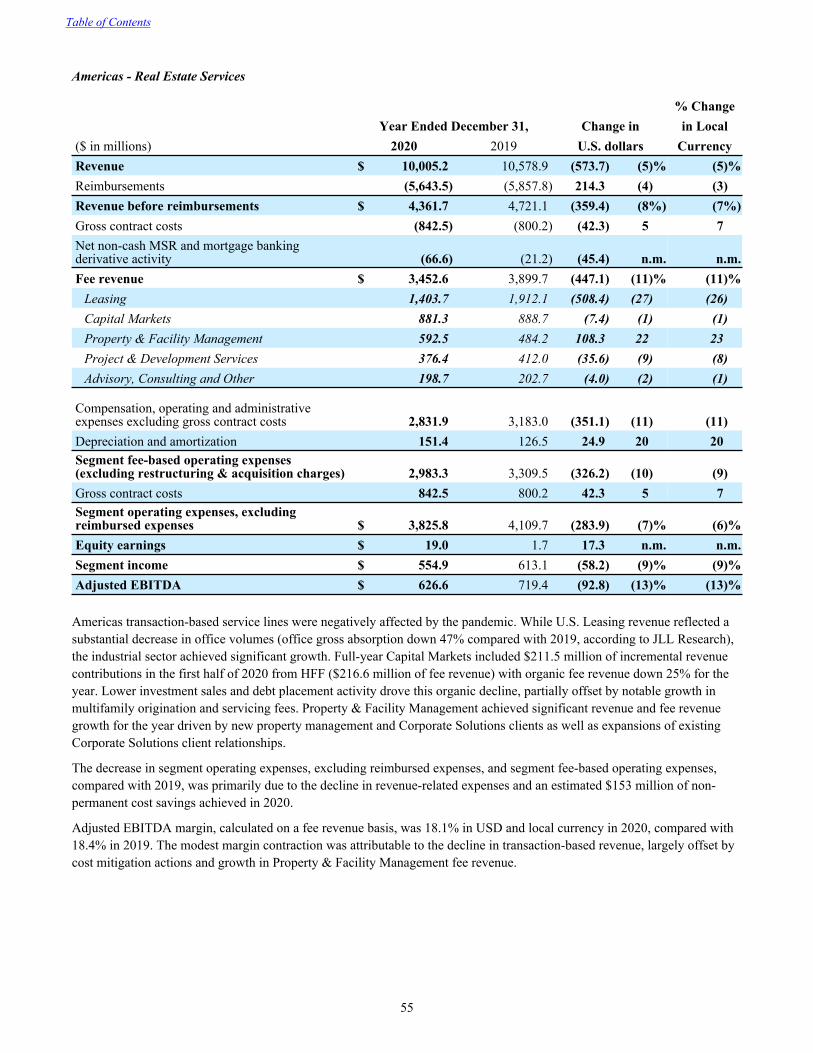
Americas - Real Estate Services
% ChangeYear Ended December 31, Change in in Local
($ in millions) 2020 2019 U.S. dollars CurrencyRevenue $ 10,005.2 10,578.9 (573.7) (5) % (5) %Reimbursements (5,643.5) (5,857.8) 214.3 (4) (3) Revenue before reimbursements $ 4,361.7 4,721.1 (359.4) (8%) (7%) Gross contract costs (842.5) (800.2) (42.3) 5 7 Net non-cash MSR and mortgage banking derivative activity (66.6) (21.2) (45.4) n.m. n.m.Fee revenue $ 3,452.6 3,899.7 (447.1) (11) % (11) %
Leasing 1,403.7 1,912.1 (508.4) (27) (26) Capital Markets 881.3 888.7 (7.4) (1) (1) Property & Facility Management 592.5 484.2 108.3 22 23 Project & Development Services 376.4 412.0 (35.6) (9) (8) Advisory, Consulting and Other 198.7 202.7 (4.0) (2) (1)
Compensation, operating and administrative expenses excluding gross contract costs 2,831.9 3,183.0 (351.1) (11) (11) Depreciation and amortization 151.4 126.5 24.9 20 20 Segment fee-based operating expenses (excluding restructuring & acquisition charges) 2,983.3 3,309.5 (326.2) (10) (9) Gross contract costs 842.5 800.2 42.3 5 7 Segment operating expenses, excluding reimbursed expenses $ 3,825.8 4,109.7 (283.9) (7) % (6) %Equity earnings $ 19.0 1.7 17.3 n.m. n.m.Segment income $ 554.9 613.1 (58.2) (9) % (9) %Adjusted EBITDA $ 626.6 719.4 (92.8) (13) % (13) %
Americas transaction-based service lines were negatively affected by the pandemic. While U.S. Leasing revenue reflected a substantial decrease in office volumes (office gross absorption down 47% compared with 2019, according to JLL Research), the industrial sector achieved significant growth. Full-year Capital Markets included $211.5 million of incremental revenue contributions in the first half of 2020 from HFF ($216.6 million of fee revenue) with organic fee revenue down 25% for the year. Lower investment sales and debt placement activity drove this organic decline, partially offset by notable growth in multifamily origination and servicing fees. Property & Facility Management achieved significant revenue and fee revenue growth for the year driven by new property management and Corporate Solutions clients as well as expansions of existing Corporate Solutions client relationships.
The decrease in segment operating expenses, excluding reimbursed expenses, and segment fee-based operating expenses, compared with 2019, was primarily due to the decline in revenue-related expenses and an estimated $153 million of non-permanent cost savings achieved in 2020.
Adjusted EBITDA margin, calculated on a fee revenue basis, was 18.1% in USD and local currency in 2020, compared with 18.4% in 2019. The modest margin contraction was attributable to the decline in transaction-based revenue, largely offset by cost mitigation actions and growth in Property & Facility Management fee revenue.
Table of Contents
55
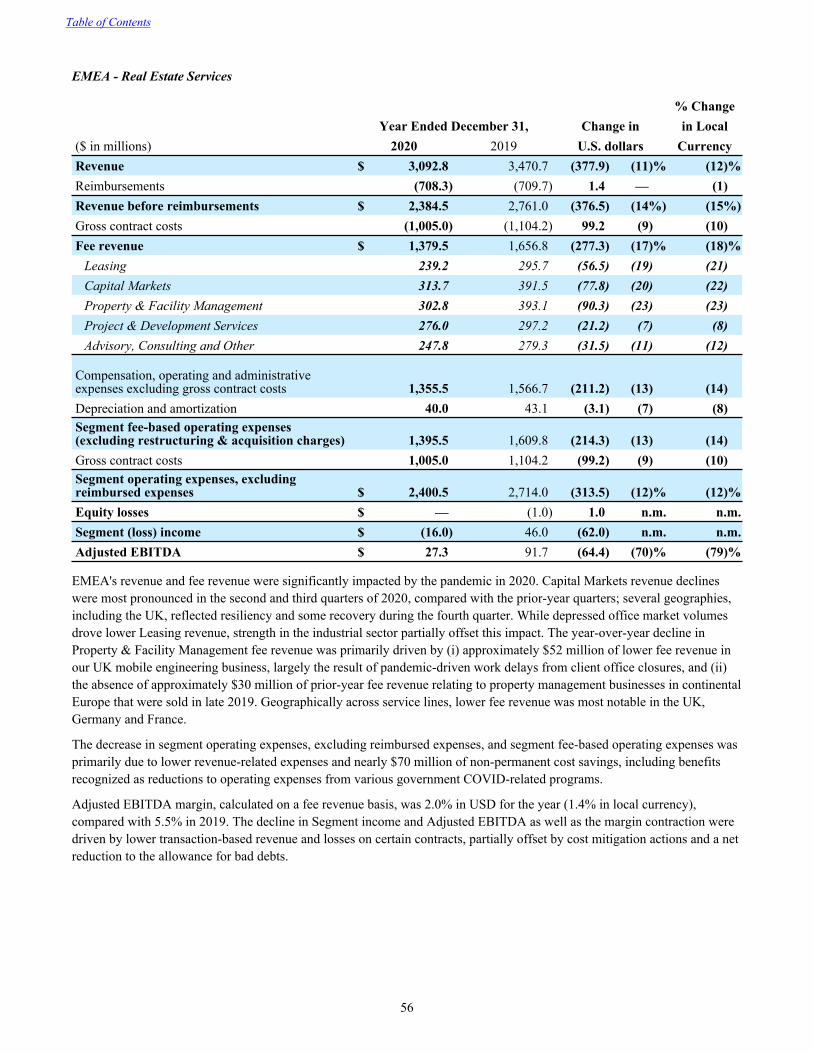
EMEA - Real Estate Services
% ChangeYear Ended December 31, Change in in Local
($ in millions) 2020 2019 U.S. dollars CurrencyRevenue $ 3,092.8 3,470.7 (377.9) (11) % (12) %Reimbursements (708.3) (709.7) 1.4 — (1) Revenue before reimbursements $ 2,384.5 2,761.0 (376.5) (14%) (15%) Gross contract costs (1,005.0) (1,104.2) 99.2 (9) (10) Fee revenue $ 1,379.5 1,656.8 (277.3) (17) % (18) %
Leasing 239.2 295.7 (56.5) (19) (21) Capital Markets 313.7 391.5 (77.8) (20) (22) Property & Facility Management 302.8 393.1 (90.3) (23) (23) Project & Development Services 276.0 297.2 (21.2) (7) (8) Advisory, Consulting and Other 247.8 279.3 (31.5) (11) (12)
Compensation, operating and administrative expenses excluding gross contract costs 1,355.5 1,566.7 (211.2) (13) (14) Depreciation and amortization 40.0 43.1 (3.1) (7) (8) Segment fee-based operating expenses (excluding restructuring & acquisition charges) 1,395.5 1,609.8 (214.3) (13) (14) Gross contract costs 1,005.0 1,104.2 (99.2) (9) (10) Segment operating expenses, excluding reimbursed expenses $ 2,400.5 2,714.0 (313.5) (12) % (12) %Equity losses $ — (1.0) 1.0 n.m. n.m.Segment (loss) income $ (16.0) 46.0 (62.0) n.m. n.m.Adjusted EBITDA $ 27.3 91.7 (64.4) (70) % (79) %
EMEA's revenue and fee revenue were significantly impacted by the pandemic in 2020. Capital Markets revenue declines were most pronounced in the second and third quarters of 2020, compared with the prior-year quarters; several geographies, including the UK, reflected resiliency and some recovery during the fourth quarter. While depressed office market volumes drove lower Leasing revenue, strength in the industrial sector partially offset this impact. The year-over-year decline in Property & Facility Management fee revenue was primarily driven by (i) approximately $52 million of lower fee revenue in our UK mobile engineering business, largely the result of pandemic-driven work delays from client office closures, and (ii) the absence of approximately $30 million of prior-year fee revenue relating to property management businesses in continental Europe that were sold in late 2019. Geographically across service lines, lower fee revenue was most notable in the UK, Germany and France.
The decrease in segment operating expenses, excluding reimbursed expenses, and segment fee-based operating expenses was primarily due to lower revenue-related expenses and nearly $70 million of non-permanent cost savings, including benefits recognized as reductions to operating expenses from various government COVID-related programs.
Adjusted EBITDA margin, calculated on a fee revenue basis, was 2.0% in USD for the year (1.4% in local currency), compared with 5.5% in 2019. The decline in Segment income and Adjusted EBITDA as well as the margin contraction were driven by lower transaction-based revenue and losses on certain contracts, partially offset by cost mitigation actions and a net reduction to the allowance for bad debts.
Table of Contents
56
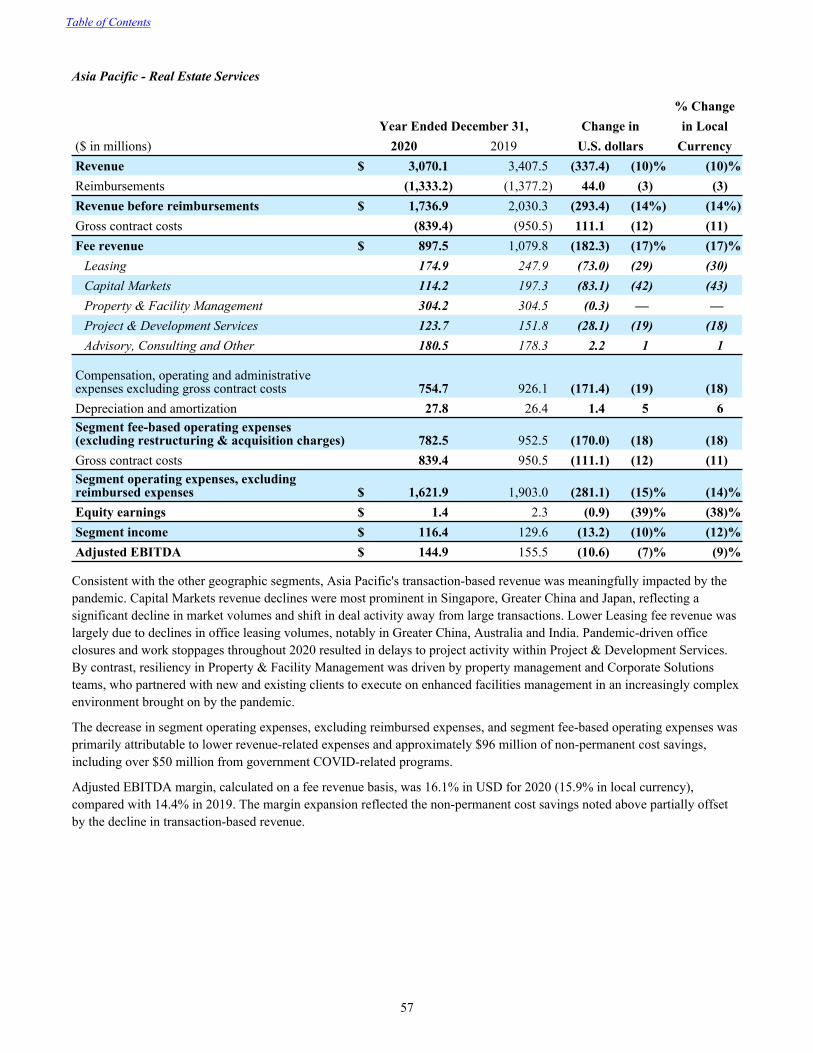
Asia Pacific - Real Estate Services
% ChangeYear Ended December 31, Change in in Local
($ in millions) 2020 2019 U.S. dollars CurrencyRevenue $ 3,070.1 3,407.5 (337.4) (10) % (10) %Reimbursements (1,333.2) (1,377.2) 44.0 (3) (3) Revenue before reimbursements $ 1,736.9 2,030.3 (293.4) (14%) (14%) Gross contract costs (839.4) (950.5) 111.1 (12) (11) Fee revenue $ 897.5 1,079.8 (182.3) (17) % (17) %
Leasing 174.9 247.9 (73.0) (29) (30) Capital Markets 114.2 197.3 (83.1) (42) (43) Property & Facility Management 304.2 304.5 (0.3) — — Project & Development Services 123.7 151.8 (28.1) (19) (18) Advisory, Consulting and Other 180.5 178.3 2.2 1 1
Compensation, operating and administrative expenses excluding gross contract costs 754.7 926.1 (171.4) (19) (18) Depreciation and amortization 27.8 26.4 1.4 5 6 Segment fee-based operating expenses (excluding restructuring & acquisition charges) 782.5 952.5 (170.0) (18) (18) Gross contract costs 839.4 950.5 (111.1) (12) (11) Segment operating expenses, excluding reimbursed expenses $ 1,621.9 1,903.0 (281.1) (15) % (14) %Equity earnings $ 1.4 2.3 (0.9) (39) % (38) %Segment income $ 116.4 129.6 (13.2) (10) % (12) %Adjusted EBITDA $ 144.9 155.5 (10.6) (7) % (9) %
Consistent with the other geographic segments, Asia Pacific's transaction-based revenue was meaningfully impacted by the pandemic. Capital Markets revenue declines were most prominent in Singapore, Greater China and Japan, reflecting a significant decline in market volumes and shift in deal activity away from large transactions. Lower Leasing fee revenue was largely due to declines in office leasing volumes, notably in Greater China, Australia and India. Pandemic-driven office closures and work stoppages throughout 2020 resulted in delays to project activity within Project & Development Services. By contrast, resiliency in Property & Facility Management was driven by property management and Corporate Solutions teams, who partnered with new and existing clients to execute on enhanced facilities management in an increasingly complex environment brought on by the pandemic.
The decrease in segment operating expenses, excluding reimbursed expenses, and segment fee-based operating expenses was primarily attributable to lower revenue-related expenses and approximately $96 million of non-permanent cost savings, including over $50 million from government COVID-related programs.
Adjusted EBITDA margin, calculated on a fee revenue basis, was 16.1% in USD for 2020 (15.9% in local currency), compared with 14.4% in 2019. The margin expansion reflected the non-permanent cost savings noted above partially offset by the decline in transaction-based revenue.
Table of Contents
57
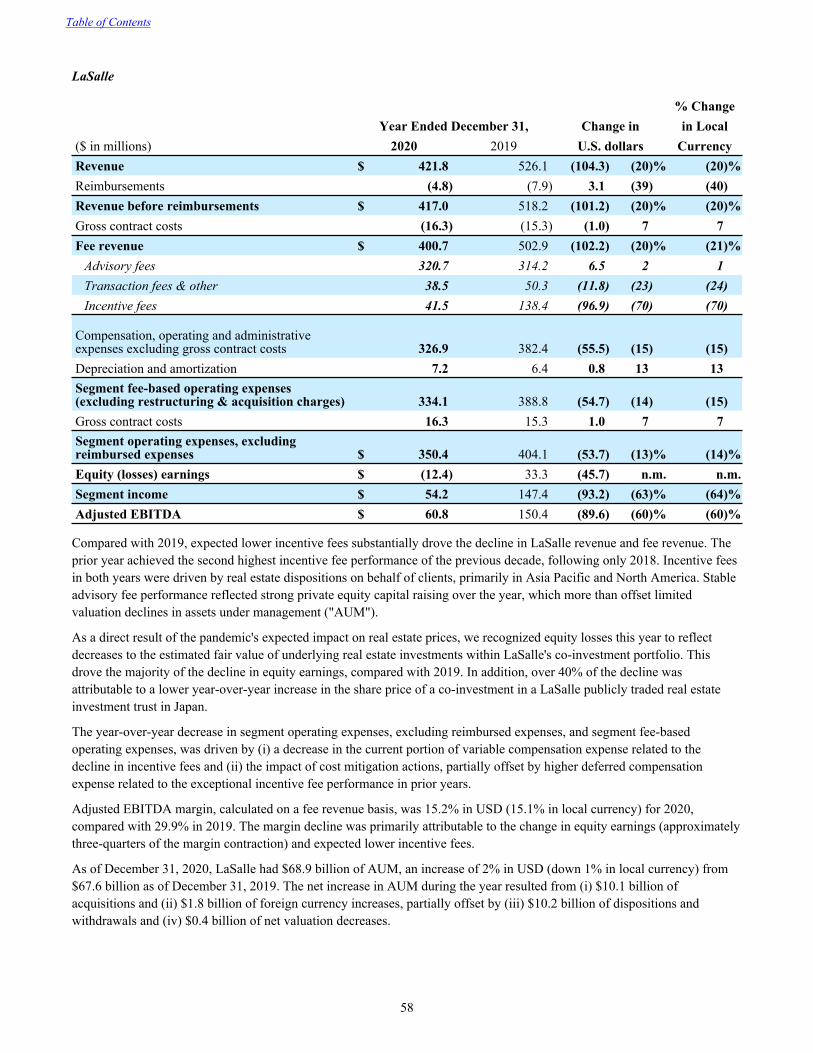
LaSalle
% ChangeYear Ended December 31, Change in in Local
($ in millions) 2020 2019 U.S. dollars CurrencyRevenue $ 421.8 526.1 (104.3) (20) % (20) %Reimbursements (4.8) (7.9) 3.1 (39) (40) Revenue before reimbursements $ 417.0 518.2 (101.2) (20) % (20) %Gross contract costs (16.3) (15.3) (1.0) 7 7 Fee revenue $ 400.7 502.9 (102.2) (20) % (21) %
Advisory fees 320.7 314.2 6.5 2 1 Transaction fees & other 38.5 50.3 (11.8) (23) (24) Incentive fees 41.5 138.4 (96.9) (70) (70)
Compensation, operating and administrative expenses excluding gross contract costs 326.9 382.4 (55.5) (15) (15) Depreciation and amortization 7.2 6.4 0.8 13 13 Segment fee-based operating expenses (excluding restructuring & acquisition charges) 334.1 388.8 (54.7) (14) (15) Gross contract costs 16.3 15.3 1.0 7 7 Segment operating expenses, excluding reimbursed expenses $ 350.4 404.1 (53.7) (13) % (14) %Equity (losses) earnings $ (12.4) 33.3 (45.7) n.m. n.m.Segment income $ 54.2 147.4 (93.2) (63) % (64) %Adjusted EBITDA $ 60.8 150.4 (89.6) (60) % (60) %
Compared with 2019, expected lower incentive fees substantially drove the decline in LaSalle revenue and fee revenue. The prior year achieved the second highest incentive fee performance of the previous decade, following only 2018. Incentive fees in both years were driven by real estate dispositions on behalf of clients, primarily in Asia Pacific and North America. Stable advisory fee performance reflected strong private equity capital raising over the year, which more than offset limited valuation declines in assets under management ("AUM").
As a direct result of the pandemic's expected impact on real estate prices, we recognized equity losses this year to reflect decreases to the estimated fair value of underlying real estate investments within LaSalle's co-investment portfolio. This drove the majority of the decline in equity earnings, compared with 2019. In addition, over 40% of the decline was attributable to a lower year-over-year increase in the share price of a co-investment in a LaSalle publicly traded real estate investment trust in Japan.
The year-over-year decrease in segment operating expenses, excluding reimbursed expenses, and segment fee-based operating expenses, was driven by (i) a decrease in the current portion of variable compensation expense related to the decline in incentive fees and (ii) the impact of cost mitigation actions, partially offset by higher deferred compensation expense related to the exceptional incentive fee performance in prior years.
Adjusted EBITDA margin, calculated on a fee revenue basis, was 15.2% in USD (15.1% in local currency) for 2020, compared with 29.9% in 2019. The margin decline was primarily attributable to the change in equity earnings (approximately three-quarters of the margin contraction) and expected lower incentive fees.
As of December 31, 2020, LaSalle had $68.9 billion of AUM, an increase of 2% in USD (down 1% in local currency) from $67.6 billion as of December 31, 2019. The net increase in AUM during the year resulted from (i) $10.1 billion of acquisitions and (ii) $1.8 billion of foreign currency increases, partially offset by (iii) $10.2 billion of dispositions and withdrawals and (iv) $0.4 billion of net valuation decreases.
Table of Contents
58
LIQUIDITY AND CAPITAL RESOURCES
Cash Flows from Operating Activities
Operating activities provided a record $1,114.7 million of cash in 2020, compared with $483.8 million in 2019. The substantial increase in cash flows from operating activities was driven by strong cash collection on receivables, participation in government COVID-related programs this year (including payment deferral opportunities for government cash obligations) and lower cash taxes paid in 2020, compared with 2019. These items were partially offset by lower net income this year as well as increased annual incentive compensation paid in the first quarter of 2020 compared with 2019.
Cash Flows from Investing Activities
We used $170.6 million of cash for investing activities during 2020, compared with $1,049.7 million used in 2019. The significant decrease in cash used was primarily driven by an absence of business acquisitions in 2020 (HFF, Inc. was acquired in July 2019) and a decrease in net acquisitions of investment properties (less than wholly-owned) this year. We discuss these key drivers individually below in further detail.
Cash Flows from Financing Activities
Financing activities used $771.2 million of cash during 2020, compared with $584.6 million provided by financing activities during 2019. The significant year-over-year change in cash flows from financing activities is substantially driven by $525.0 million of net repayments on our Facility this year, compared with $525.0 million of net borrowings in 2019, reflecting outstanding operating cash flows generated during 2020 and cash consideration needs in 2019 for acquisitions, respectively.
Debt
Our $2.75 billion Facility matures on May 17, 2023. As of December 31, 2020, we had no outstanding borrowings under the Facility and outstanding letters of credit of $0.7 million. As of December 31, 2019, we had $525.0 million of outstanding borrowings under the Facility and outstanding letters of credit of $0.8 million. The average outstanding borrowings under the Facility were $865.1 million and $851.6 million during the years ended December 31, 2020 and 2019, respectively.
In addition to our Facility, we had the capacity to borrow up to an additional $64.7 million under local overdraft facilities as of December 31, 2020. We had Short-term borrowings (including capital lease obligations, overdrawn bank accounts and local overdraft facilities) of $62.0 million and $120.1 million as of December 31, 2020 and 2019, respectively, of which $12.0 million and $44.8 million as of December 31, 2020 and 2019, respectively, were attributable to local overdraft facilities.
We will continue to use the Facility for working capital needs (including payment of accrued incentive compensation), co-investment activities, share repurchases, capital expenditures and acquisitions. See Note 10, Debt, of the Notes to Consolidated Financial Statements, included in Item 8, for additional information on our Facility, Short-term borrowings and Long-term debt.
Investment Activity
As of December 31, 2020, we had $430.8 million of total Investments in real estate ventures, primarily related to LaSalle co-investments. In addition, since 2018, we have invested in a number of early-stage proptech (property technology) companies through our JLL Spark Global Venture funds. In 2020 and 2019, funding of investments exceeded returns of capital by $38.8 million and $23.9 million, respectively. We expect to continue to pursue strategic co-investment opportunities with our investment management clients across the globe as co-investment remains an important foundation to the continued growth of LaSalle's business. In addition, we expect continued investments by our JLL Spark funds.
See Note 5, Investments in Real Estate Ventures, of the Notes to Consolidated Financial Statements, included in Item 8, for additional information on our co-investment activity.
Share Repurchases
On October 31, 2019, our Board of Directors approved a new share repurchase program (the "Program") authorizing the repurchase of up to $200.0 million of our common stock in the open market and privately negotiated transactions. During the year ended December 31, 2020 we repurchased nearly 897,000 shares for $100.0 million. As of December 31, 2020, $100.0 million remained authorized for repurchases under the Program. There were no shares repurchased in 2019.
Table of Contents
59

Capital Expenditures
Capital expenditures, excluding those made by a consolidated VIE in which we held no equity interest, were $149.4 million and $187.8 million in 2020 and 2019, respectively. Our capital expenditures are primarily for purchased and developed software, computer hardware and improvements to leased office space. The decrease of capital expenditures compared with 2019 is primarily due to lower computer hardware and software expenditures, reflecting cash preservation decisions we made during the pandemic.
In addition, property acquisitions and capital expenditures, net of proceeds from distributions, made by consolidated VIEs in which we hold no direct equity interest were net proceeds of $1.0 million in 2020 and net acquisitions of $79.2 million in 2019, primarily to acquire real estate. Refer to Note 5, Investments in Real Estate Ventures, of the Notes to the Consolidated Financial Statements, included in Item 8, for further information on our consolidated VIE investments.
Business Acquisitions
In 2020, we paid $67.7 million for deferred business acquisition and earn-out obligations related to acquisitions completed in prior years. This activity is included in cash flows from operating and financing activities. The net cash paid for acquisitions compares with $906.0 million paid in 2019, predominantly for the HFF acquisition.
Terms for our acquisitions have typically included cash paid at closing with provisions for additional consideration and earn-out payments subject to certain contract provisions and performance. Deferred business acquisition obligations totaled $32.2 million and $50.1 million on the Consolidated Balance Sheets as of December 31, 2020 and 2019, respectively. These obligations represent the current discounted values of payments to sellers of businesses for which our acquisition has closed as of the balance sheet dates and for which the only remaining condition on those payments is the passage of time. As of December 31, 2020, we had $85.7 million accrued for potential earn-out payments, of a potential maximum of $199.2 million (undiscounted), subject to the achievement of certain performance conditions. These earn-outs will come due at various times over the next five years, assuming the achievement of the applicable performance conditions.
We will continue to consider acquisitions we believe will strengthen our market position, increase our profitability and supplement our organic growth. Refer to Note 4, Business Combinations, Goodwill and Other Intangible Assets, of the Notes to the Consolidated Financial Statements, included in Item 8, for further information on business acquisitions.
Repatriation of Foreign Earnings
Based on our historical experience and future business plans, we do not expect to repatriate our foreign source earnings to the U.S. We believe our policy of permanently reinvesting earnings of foreign subsidiaries does not significantly impact our liquidity. As of December 31, 2020 and 2019, we had total Cash and cash equivalents of $574.3 million and $451.9 million, respectively, of which approximately $445.2 million and $385.4 million, respectively, was held by our foreign subsidiaries.
Restricted Net Assets
We face regulatory restrictions in certain countries that limit or prevent the transfer of funds to other countries or the exchange of the local currency to other currencies, however, we generally face no such restrictions with regard to the use or application of funds for ordinary course business activities within such countries. The total assets of these countries in aggregate totaled approximately 4% and 5% of our total assets as of December 31, 2020 and 2019, respectively.
Table of Contents
60
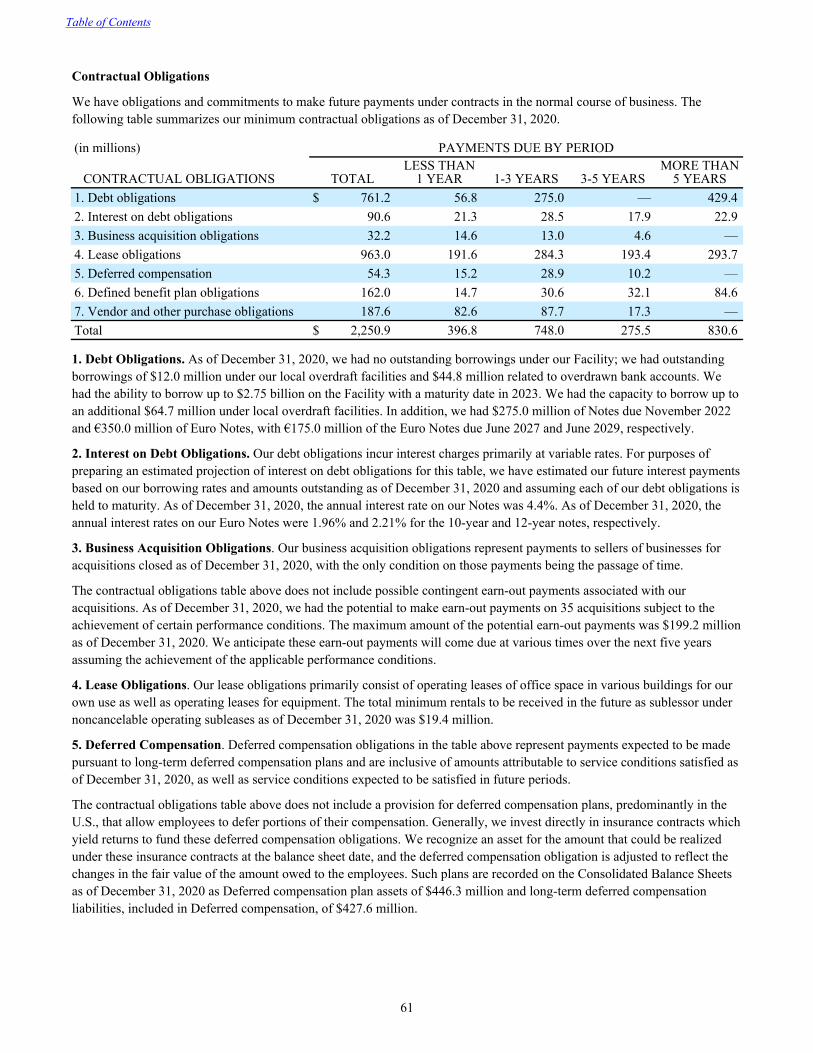
Contractual Obligations
We have obligations and commitments to make future payments under contracts in the normal course of business. The following table summarizes our minimum contractual obligations as of December 31, 2020.
(in millions) PAYMENTS DUE BY PERIOD
CONTRACTUAL OBLIGATIONS TOTALLESS THAN
1 YEAR 1-3 YEARS 3-5 YEARSMORE THAN
5 YEARS1. Debt obligations $ 761.2 56.8 275.0 — 429.4 2. Interest on debt obligations 90.6 21.3 28.5 17.9 22.9 3. Business acquisition obligations 32.2 14.6 13.0 4.6 — 4. Lease obligations 963.0 191.6 284.3 193.4 293.7 5. Deferred compensation 54.3 15.2 28.9 10.2 — 6. Defined benefit plan obligations 162.0 14.7 30.6 32.1 84.6 7. Vendor and other purchase obligations 187.6 82.6 87.7 17.3 — Total $ 2,250.9 396.8 748.0 275.5 830.6
1. Debt Obligations. As of December 31, 2020, we had no outstanding borrowings under our Facility; we had outstanding borrowings of $12.0 million under our local overdraft facilities and $44.8 million related to overdrawn bank accounts. We had the ability to borrow up to $2.75 billion on the Facility with a maturity date in 2023. We had the capacity to borrow up to an additional $64.7 million under local overdraft facilities. In addition, we had $275.0 million of Notes due November 2022 and €350.0 million of Euro Notes, with €175.0 million of the Euro Notes due June 2027 and June 2029, respectively.
2. Interest on Debt Obligations. Our debt obligations incur interest charges primarily at variable rates. For purposes of preparing an estimated projection of interest on debt obligations for this table, we have estimated our future interest payments based on our borrowing rates and amounts outstanding as of December 31, 2020 and assuming each of our debt obligations is held to maturity. As of December 31, 2020, the annual interest rate on our Notes was 4.4%. As of December 31, 2020, the annual interest rates on our Euro Notes were 1.96% and 2.21% for the 10-year and 12-year notes, respectively.
3. Business Acquisition Obligations. Our business acquisition obligations represent payments to sellers of businesses for acquisitions closed as of December 31, 2020, with the only condition on those payments being the passage of time.
The contractual obligations table above does not include possible contingent earn-out payments associated with our acquisitions. As of December 31, 2020, we had the potential to make earn-out payments on 35 acquisitions subject to the achievement of certain performance conditions. The maximum amount of the potential earn-out payments was $199.2 million as of December 31, 2020. We anticipate these earn-out payments will come due at various times over the next five years assuming the achievement of the applicable performance conditions.
4. Lease Obligations. Our lease obligations primarily consist of operating leases of office space in various buildings for our own use as well as operating leases for equipment. The total minimum rentals to be received in the future as sublessor under noncancelable operating subleases as of December 31, 2020 was $19.4 million.
5. Deferred Compensation. Deferred compensation obligations in the table above represent payments expected to be made pursuant to long-term deferred compensation plans and are inclusive of amounts attributable to service conditions satisfied as of December 31, 2020, as well as service conditions expected to be satisfied in future periods.
The contractual obligations table above does not include a provision for deferred compensation plans, predominantly in the U.S., that allow employees to defer portions of their compensation. Generally, we invest directly in insurance contracts which yield returns to fund these deferred compensation obligations. We recognize an asset for the amount that could be realized under these insurance contracts at the balance sheet date, and the deferred compensation obligation is adjusted to reflect the changes in the fair value of the amount owed to the employees. Such plans are recorded on the Consolidated Balance Sheets as of December 31, 2020 as Deferred compensation plan assets of $446.3 million and long-term deferred compensation liabilities, included in Deferred compensation, of $427.6 million.
Table of Contents
61
6. Defined Benefit Plan Obligations. The defined benefit plan obligations represent estimates of the expected benefits to be paid out by our defined benefit plans over the next ten years. We will fund these obligations from the assets held by these plans. If the assets these plans hold are not sufficient to fund these payments, JLL will fund the remaining obligations. We have historically funded pension costs as actuarially determined and as applicable laws and regulations require. We expect to contribute $8.4 million to our defined benefit pension plans in 2021.
7. Vendor and Other Purchase Obligations. Our other purchase obligations primarily relate to various information technology servicing agreements, telephone communications and other administrative support functions.
Other/Off-Balance Sheet Arrangements
We have unfunded capital commitments to investment vehicles and direct investments totaling a maximum of $320.7 million as of December 31, 2020. We are not able to predict if, when, or in what amounts such capital calls will be made, and therefore we exclude such commitments from the above table.
For additional information on the contractual obligations presented above, see our discussion in Note 4, Business Combinations, Goodwill and Other Intangible Assets, Note 5, Investments in Real Estate Ventures, Note 7, Retirement Plans, Note 10, Debt and Note 11, Leases, in the Notes to Consolidated Financial Statements, included in Item 8.
ITEM 7A. QUANTITATIVE AND QUALITATIVE DISCLOSURES ABOUT MARKET RISK
Information regarding market risk is included in Item 7. Management's Discussion and Analysis of Financial Condition and Results of Operations under the caption "Market Risks" and is incorporated by reference herein.
Disclosure of Limitations
As the information presented above includes only those exposures that exist as of December 31, 2020, it does not consider those exposures or positions which could arise after that date. The information we present has limited predictive value. As a result, the ultimate realized gain or loss with respect to interest rate and foreign currency fluctuations will depend on the exposures that arise during the applicable period, the hedging strategies at the time, and interest and foreign currency rates.
Table of Contents
62
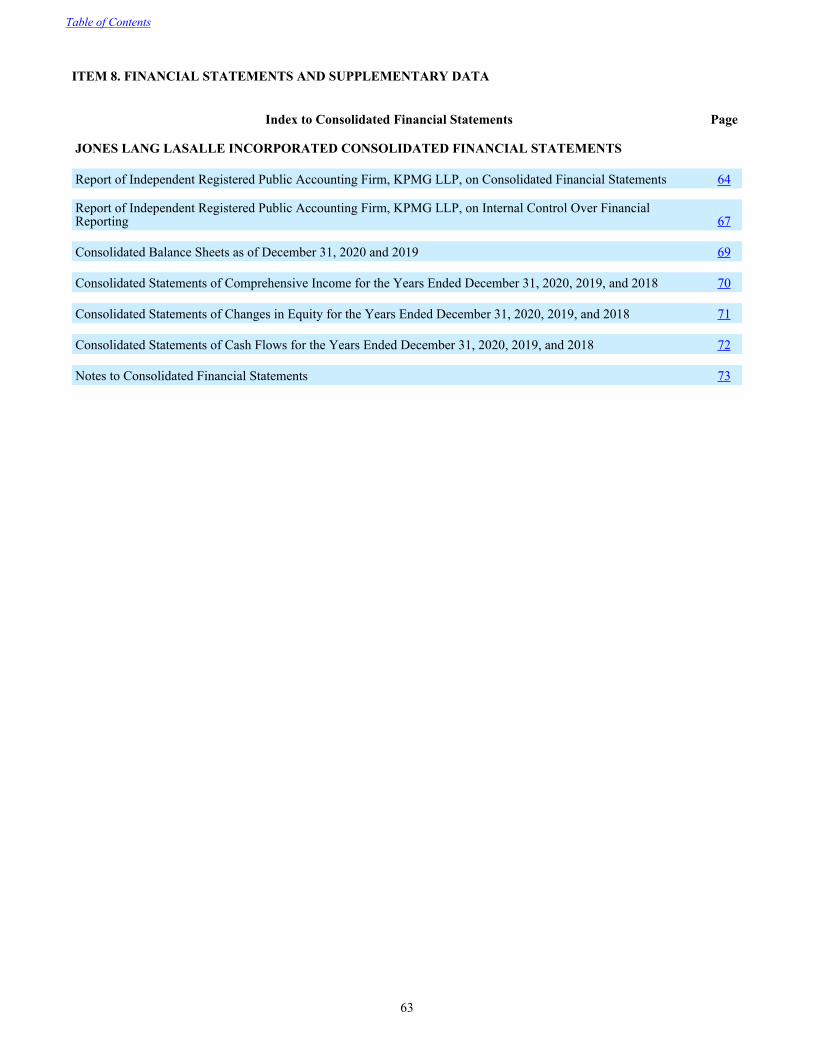
ITEM 8. FINANCIAL STATEMENTS AND SUPPLEMENTARY DATA
Index to Consolidated Financial Statements Page
JONES LANG LASALLE INCORPORATED CONSOLIDATED FINANCIAL STATEMENTS
Report of Independent Registered Public Accounting Firm, KPMG LLP, on Consolidated Financial Statements 64
Report of Independent Registered Public Accounting Firm, KPMG LLP, on Internal Control Over Financial Reporting 67
Consolidated Balance Sheets as of December 31, 2020 and 2019 69
Consolidated Statements of Comprehensive Income for the Years Ended December 31, 2020, 2019, and 2018 70
Consolidated Statements of Changes in Equity for the Years Ended December 31, 2020, 2019, and 2018 71
Consolidated Statements of Cash Flows for the Years Ended December 31, 2020, 2019, and 2018 72
Notes to Consolidated Financial Statements 73
Table of Contents
63
Report of Independent Registered Public Accounting Firm
To the Shareholders and Board of DirectorsJones Lang LaSalle Incorporated:
Opinion on the Consolidated Financial Statements
We have audited the accompanying consolidated balance sheets of Jones Lang LaSalle Incorporated and subsidiaries (the Company) as of December 31, 2020 and 2019, the related consolidated statements of comprehensive income, changes in equity, and cash flows for each of the years in the three-year period ended December 31, 2020, and the related notes (collectively, the consolidated financial statements). In our opinion, the consolidated financial statements present fairly, in all material respects, the financial position of the Company as of December 31, 2020 and 2019, and the results of its operations and its cash flows for each of the years in the three-year period ended December 31, 2020, in conformity with U.S. generally accepted accounting principles.
We also have audited, in accordance with the standards of the Public Company Accounting Oversight Board (United States) (PCAOB), the Company’s internal control over financial reporting as of December 31, 2020, based on criteria established in Internal Control – Integrated Framework (2013) issued by the Committee of Sponsoring Organizations of the Treadway Commission, and our report dated February 18, 2021 expressed an unqualified opinion on the effectiveness of the Company’s internal control over financial reporting.
Change in Accounting Principle
As discussed in Note 2 to the consolidated financial statements, the Company changed its method of accounting for leases as of January 1, 2019 due to the adoption of Financial Accounting Standards Board’s Accounting Standards Codification (ASC) Topic 842, Leases.
Basis for Opinion
These consolidated financial statements are the responsibility of the Company’s management. Our responsibility is to express an opinion on these consolidated financial statements based on our audits. We are a public accounting firm registered with the PCAOB and are required to be independent with respect to the Company in accordance with the U.S. federal securities laws and the applicable rules and regulations of the Securities and Exchange Commission and the PCAOB.
We conducted our audits in accordance with the standards of the PCAOB. Those standards require that we plan and perform the audit to obtain reasonable assurance about whether the consolidated financial statements are free of material misstatement, whether due to error or fraud. Our audits included performing procedures to assess the risks of material misstatement of the consolidated financial statements, whether due to error or fraud, and performing procedures that respond to those risks. Such procedures included examining, on a test basis, evidence regarding the amounts and disclosures in the consolidated financial statements. Our audits also included evaluating the accounting principles used and significant estimates made by management, as well as evaluating the overall presentation of the consolidated financial statements. We believe that our audits provide a reasonable basis for our opinion.
Table of Contents
64
Critical Audit Matters
The critical audit matters communicated below are matters arising from the current period audit of the consolidated financial statements that were communicated or required to be communicated to the audit committee and that: (1) relate to accounts or disclosures that are material to the consolidated financial statements and (2) involved our especially challenging, subjective, or complex judgments. The communication of critical audit matters does not alter in any way our opinion on the consolidated financial statements, taken as a whole, and we are not, by communicating the critical audit matters below, providing separate opinions on the critical audit matters or on the accounts or disclosures to which they relate.
Goodwill impairment analysis for the Europe, Middle East, and Africa reporting unit
As described in Notes 2 and 4 to the consolidated financial statements, the Company performs goodwill impairment testing on an annual basis and whenever events or changes in circumstances indicate that the carrying value of a reporting unit might exceed its fair value. The goodwill balance was $4,224.7 million as of December 31, 2020, of which $959.7 million related to the Europe, Middle East, and Africa (EMEA) reporting unit.
We identified the evaluation of the quantitative goodwill impairment analysis for the EMEA reporting unit as a critical audit matter. The estimated fair value of the EMEA reporting unit required the evaluation of a discounted cash flow model. Our evaluation of the discounted cash flow model required us to assess assumptions that are determined based on especially subjective judgment. Specifically, the forecasted revenue growth rates, forecasted profitability margins, and the discount rate assumption used to calculate the fair value of the reporting unit were challenging to test as changes to those assumptions could have a significant effect on the Company’s assessment of the carrying value of goodwill.
The following are the primary procedures we performed to address this critical audit matter. We evaluated the design and tested the operating effectiveness of certain internal controls over the Company’s goodwill impairment assessment process, including controls related to the determination of the fair value of the reporting unit, forecasted revenue growth rates, forecasted profitability margins, and discount rate assumptions. We evaluated the Company’s forecasted revenue growth rates and forecasted profitability margins for the EMEA reporting unit, by comparing these assumptions to current and historical performance and analysts’ revenue growth and profitability margin expectations for the Company and its peer companies. In addition, we involved valuation professionals with specialized skills and knowledge who assisted in the following:
– evaluating the discount rate used in the discounted cash flow model, by comparing it against a discount rate range that was independently developed using publicly available market data for comparable entities
– researching analysts’ expectations of the forecasted revenue growth rates and forecasted profitability margins for the Company and its peer companies, to assist in evaluating these assumptions
– developing an estimate of the EMEA reporting unit’s fair value using the reporting unit’s cash flow assumptions, and an independently developed discount rate range, and comparing the result of our estimate of fair value to the Company’s fair value estimate.
Sufficiency of audit evidence over income taxes
As described in Notes 2 and 8 to the consolidated financial statements, the Company recorded a provision for income taxes of $106.9 million for the year ended December 31, 2020 based on local tax rules and regulations for the tax jurisdictions in which they operate. The Company has operations which constitute a taxable income presence in 92 countries or other taxable jurisdictions outside of the U.S.
We identified the evaluation of the sufficiency of audit evidence over income tax expense as a critical audit matter. The Company’s global tax structure adds complexity that required subjective auditor judgment to evaluate the sufficiency of audit of evidence obtained. This required the involvement of domestic and international tax professionals with specialized skills and knowledge, in order to assess the nature and extent of procedures performed in relation to the amounts recorded and disclosed in the consolidated financial statements.
Table of Contents
65

The following are the primary procedures we performed to address this critical audit matter. We evaluated the design and tested the operating effectiveness of certain internal controls over the Company’s income tax process, including controls over the amounts recorded. We applied auditor judgment to determine the nature and extent of procedures to be performed over income tax expense. For certain taxing jurisdictions, we analyzed supporting documentation for the provision for income taxes. In addition, we involved tax professionals with specialized skills and knowledge who evaluated certain of the Company’s interpretations and applications of the tax rules and regulations. We evaluated the sufficiency of audit evidence obtained by assessing the results of procedures performed over income tax expense, including the appropriateness of the nature and extent of such evidence.
/s/ KPMG LLP
We have served as the Company’s auditor since 1988.
Chicago, IllinoisFebruary 18, 2021
Table of Contents
66
Report of Independent Registered Public Accounting Firm
To the Shareholders and Board of DirectorsJones Lang LaSalle Incorporated:
Opinion on Internal Control Over Financial Reporting
We have audited Jones Lang LaSalle Incorporated and subsidiaries' (the Company) internal control over financial reporting as of December 31, 2020, based on criteria established in Internal Control – Integrated Framework (2013) issued by the Committee of Sponsoring Organizations of the Treadway Commission. In our opinion, the Company maintained, in all material respects, effective internal control over financial reporting as of December 31, 2020, based on criteria established in Internal Control – Integrated Framework (2013) issued by the Committee of Sponsoring Organizations of the Treadway Commission.
We also have audited, in accordance with the standards of the Public Company Accounting Oversight Board (United States) (PCAOB), the consolidated balance sheets of the Company as of December 31, 2020 and 2019, the related consolidated statements of comprehensive income, changes in equity, and cash flows for each of the years in the three-year period ended December 31, 2020, and related notes (collectively, the consolidated financial statements), and our report dated February 18, 2021 expressed an unqualified opinion on those consolidated financial statements.
Basis for Opinion
The Company’s management is responsible for maintaining effective internal control over financial reporting and for its assessment of the effectiveness of internal control over financial reporting, included in the accompanying Management’s Report on Internal Control over Financial Reporting. Our responsibility is to express an opinion on the Company’s internal control over financial reporting based on our audit. We are a public accounting firm registered with the PCAOB and are required to be independent with respect to the Company in accordance with the U.S. federal securities laws and the applicable rules and regulations of the Securities and Exchange Commission and the PCAOB.
We conducted our audit in accordance with the standards of the PCAOB. Those standards require that we plan and perform the audit to obtain reasonable assurance about whether effective internal control over financial reporting was maintained in all material respects. Our audit of internal control over financial reporting included obtaining an understanding of internal control over financial reporting, assessing the risk that a material weakness exists, and testing and evaluating the design and operating effectiveness of internal control based on the assessed risk. Our audit also included performing such other procedures as we considered necessary in the circumstances. We believe that our audit provides a reasonable basis for our opinion.
Table of Contents
67
Definition and Limitations of Internal Control Over Financial Reporting
A company’s internal control over financial reporting is a process designed to provide reasonable assurance regarding the reliability of financial reporting and the preparation of financial statements for external purposes in accordance with generally accepted accounting principles. A company’s internal control over financial reporting includes those policies and procedures that (1) pertain to the maintenance of records that, in reasonable detail, accurately and fairly reflect the transactions and dispositions of the assets of the company; (2) provide reasonable assurance that transactions are recorded as necessary to permit preparation of financial statements in accordance with generally accepted accounting principles, and that receipts and expenditures of the company are being made only in accordance with authorizations of management and directors of the company; and (3) provide reasonable assurance regarding prevention or timely detection of unauthorized acquisition, use, or disposition of the company’s assets that could have a material effect on the financial statements.
Because of its inherent limitations, internal control over financial reporting may not prevent or detect misstatements. Also, projections of any evaluation of effectiveness to future periods are subject to the risk that controls may become inadequate because of changes in conditions, or that the degree of compliance with the policies or procedures may deteriorate.
/s/ KPMG LLP
Chicago, IllinoisFebruary 18, 2021
Table of Contents
68
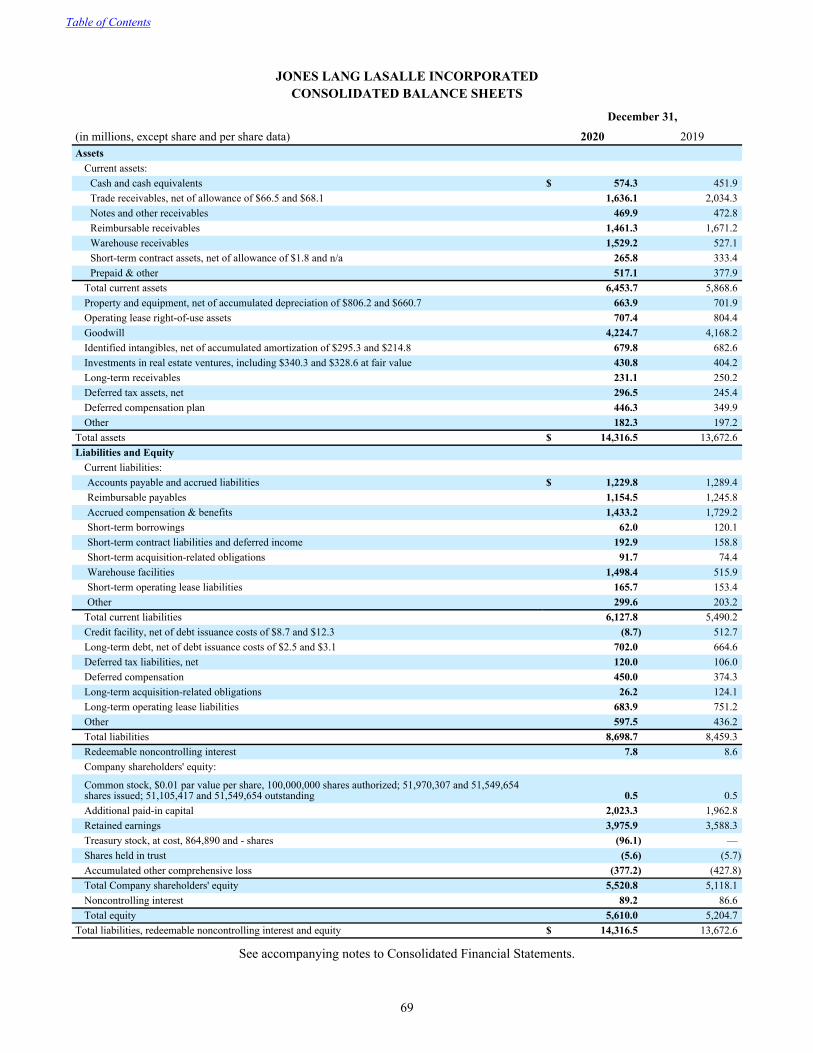
JONES LANG LASALLE INCORPORATEDCONSOLIDATED BALANCE SHEETS
December 31,
(in millions, except share and per share data) 2020 2019Assets
Current assets: Cash and cash equivalents $ 574.3 451.9 Trade receivables, net of allowance of $66.5 and $68.1 1,636.1 2,034.3 Notes and other receivables 469.9 472.8 Reimbursable receivables 1,461.3 1,671.2 Warehouse receivables 1,529.2 527.1 Short-term contract assets, net of allowance of $1.8 and n/a 265.8 333.4 Prepaid & other 517.1 377.9
Total current assets 6,453.7 5,868.6 Property and equipment, net of accumulated depreciation of $806.2 and $660.7 663.9 701.9 Operating lease right-of-use assets 707.4 804.4 Goodwill 4,224.7 4,168.2 Identified intangibles, net of accumulated amortization of $295.3 and $214.8 679.8 682.6 Investments in real estate ventures, including $340.3 and $328.6 at fair value 430.8 404.2 Long-term receivables 231.1 250.2 Deferred tax assets, net 296.5 245.4 Deferred compensation plan 446.3 349.9 Other 182.3 197.2
Total assets $ 14,316.5 13,672.6 Liabilities and Equity
Current liabilities: Accounts payable and accrued liabilities $ 1,229.8 1,289.4 Reimbursable payables 1,154.5 1,245.8 Accrued compensation & benefits 1,433.2 1,729.2 Short-term borrowings 62.0 120.1 Short-term contract liabilities and deferred income 192.9 158.8 Short-term acquisition-related obligations 91.7 74.4 Warehouse facilities 1,498.4 515.9 Short-term operating lease liabilities 165.7 153.4 Other 299.6 203.2
Total current liabilities 6,127.8 5,490.2 Credit facility, net of debt issuance costs of $8.7 and $12.3 (8.7) 512.7 Long-term debt, net of debt issuance costs of $2.5 and $3.1 702.0 664.6 Deferred tax liabilities, net 120.0 106.0 Deferred compensation 450.0 374.3 Long-term acquisition-related obligations 26.2 124.1 Long-term operating lease liabilities 683.9 751.2 Other 597.5 436.2 Total liabilities 8,698.7 8,459.3 Redeemable noncontrolling interest 7.8 8.6 Company shareholders' equity:
Common stock, $0.01 par value per share, 100,000,000 shares authorized; 51,970,307 and 51,549,654 shares issued; 51,105,417 and 51,549,654 outstanding 0.5 0.5 Additional paid-in capital 2,023.3 1,962.8 Retained earnings 3,975.9 3,588.3 Treasury stock, at cost, 864,890 and - shares (96.1) — Shares held in trust (5.6) (5.7) Accumulated other comprehensive loss (377.2) (427.8) Total Company shareholders' equity 5,520.8 5,118.1 Noncontrolling interest 89.2 86.6 Total equity 5,610.0 5,204.7
Total liabilities, redeemable noncontrolling interest and equity $ 14,316.5 13,672.6
See accompanying notes to Consolidated Financial Statements.
Table of Contents
69
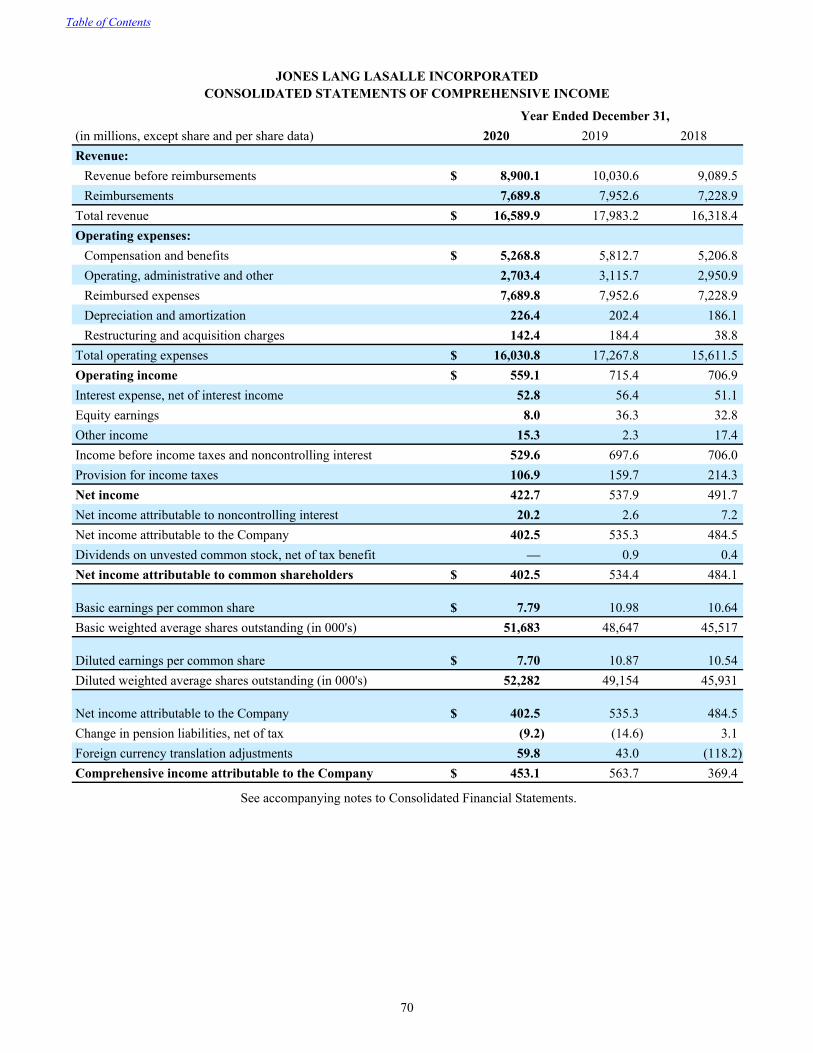
JONES LANG LASALLE INCORPORATEDCONSOLIDATED STATEMENTS OF COMPREHENSIVE INCOME
Year Ended December 31,(in millions, except share and per share data) 2020 2019 2018Revenue:
Revenue before reimbursements $ 8,900.1 10,030.6 9,089.5 Reimbursements 7,689.8 7,952.6 7,228.9
Total revenue $ 16,589.9 17,983.2 16,318.4 Operating expenses:
Compensation and benefits $ 5,268.8 5,812.7 5,206.8 Operating, administrative and other 2,703.4 3,115.7 2,950.9 Reimbursed expenses 7,689.8 7,952.6 7,228.9 Depreciation and amortization 226.4 202.4 186.1 Restructuring and acquisition charges 142.4 184.4 38.8
Total operating expenses $ 16,030.8 17,267.8 15,611.5 Operating income $ 559.1 715.4 706.9 Interest expense, net of interest income 52.8 56.4 51.1 Equity earnings 8.0 36.3 32.8 Other income 15.3 2.3 17.4 Income before income taxes and noncontrolling interest 529.6 697.6 706.0 Provision for income taxes 106.9 159.7 214.3 Net income 422.7 537.9 491.7 Net income attributable to noncontrolling interest 20.2 2.6 7.2 Net income attributable to the Company 402.5 535.3 484.5 Dividends on unvested common stock, net of tax benefit — 0.9 0.4 Net income attributable to common shareholders $ 402.5 534.4 484.1
Basic earnings per common share $ 7.79 10.98 10.64 Basic weighted average shares outstanding (in 000's) 51,683 48,647 45,517
Diluted earnings per common share $ 7.70 10.87 10.54 Diluted weighted average shares outstanding (in 000's) 52,282 49,154 45,931
Net income attributable to the Company $ 402.5 535.3 484.5 Change in pension liabilities, net of tax (9.2) (14.6) 3.1 Foreign currency translation adjustments 59.8 43.0 (118.2) Comprehensive income attributable to the Company $ 453.1 563.7 369.4
See accompanying notes to Consolidated Financial Statements.
Table of Contents
70
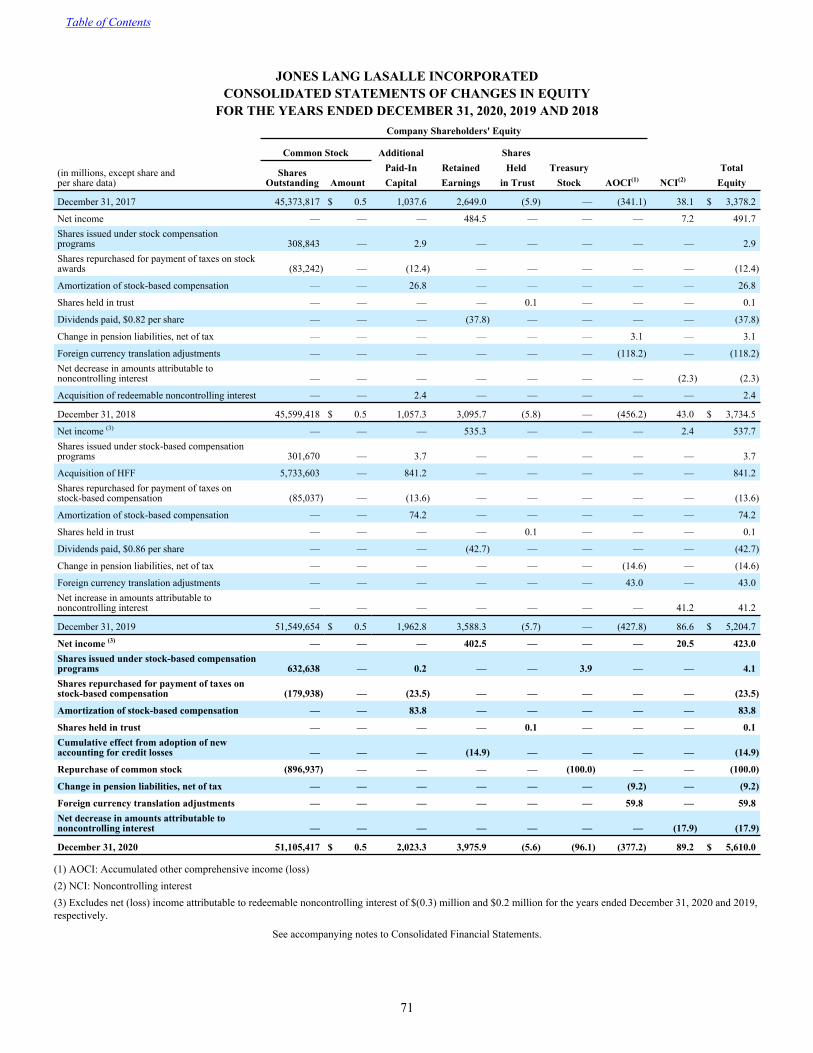
JONES LANG LASALLE INCORPORATEDCONSOLIDATED STATEMENTS OF CHANGES IN EQUITY
FOR THE YEARS ENDED DECEMBER 31, 2020, 2019 AND 2018
(in millions, except share and per share data)
Company Shareholders' Equity
Common Stock Additional Shares
Shares Outstanding Amount
Paid-In Retained Held Treasury TotalCapital Earnings in Trust Stock AOCI(1) NCI(2) Equity
December 31, 2017 45,373,817 $ 0.5 1,037.6 2,649.0 (5.9) — (341.1) 38.1 $ 3,378.2
Net income — — — 484.5 — — — 7.2 491.7 Shares issued under stock compensation programs 308,843 — 2.9 — — — — — 2.9 Shares repurchased for payment of taxes on stock awards (83,242) — (12.4) — — — — — (12.4)
Amortization of stock-based compensation — — 26.8 — — — — — 26.8
Shares held in trust — — — — 0.1 — — — 0.1
Dividends paid, $0.82 per share — — — (37.8) — — — — (37.8)
Change in pension liabilities, net of tax — — — — — — 3.1 — 3.1
Foreign currency translation adjustments — — — — — — (118.2) — (118.2) Net decrease in amounts attributable to noncontrolling interest — — — — — — — (2.3) (2.3)
Acquisition of redeemable noncontrolling interest — — 2.4 — — — — — 2.4
December 31, 2018 45,599,418 $ 0.5 1,057.3 3,095.7 (5.8) — (456.2) 43.0 $ 3,734.5
Net income (3) — — — 535.3 — — — 2.4 537.7 Shares issued under stock-based compensation programs 301,670 — 3.7 — — — — — 3.7
Acquisition of HFF 5,733,603 — 841.2 — — — — — 841.2 Shares repurchased for payment of taxes on stock-based compensation (85,037) — (13.6) — — — — — (13.6)
Amortization of stock-based compensation — — 74.2 — — — — — 74.2
Shares held in trust — — — — 0.1 — — — 0.1
Dividends paid, $0.86 per share — — — (42.7) — — — — (42.7)
Change in pension liabilities, net of tax — — — — — — (14.6) — (14.6)
Foreign currency translation adjustments — — — — — — 43.0 — 43.0 Net increase in amounts attributable to noncontrolling interest — — — — — — — 41.2 41.2
December 31, 2019 51,549,654 $ 0.5 1,962.8 3,588.3 (5.7) — (427.8) 86.6 $ 5,204.7
Net income (3) — — — 402.5 — — — 20.5 423.0 Shares issued under stock-based compensation programs 632,638 — 0.2 — — 3.9 — — 4.1 Shares repurchased for payment of taxes on stock-based compensation (179,938) — (23.5) — — — — — (23.5)
Amortization of stock-based compensation — — 83.8 — — — — — 83.8
Shares held in trust — — — — 0.1 — — — 0.1 Cumulative effect from adoption of new accounting for credit losses — — — (14.9) — — — — (14.9)
Repurchase of common stock (896,937) — — — — (100.0) — — (100.0)
Change in pension liabilities, net of tax — — — — — — (9.2) — (9.2)
Foreign currency translation adjustments — — — — — — 59.8 — 59.8 Net decrease in amounts attributable to noncontrolling interest — — — — — — — (17.9) (17.9)
December 31, 2020 51,105,417 $ 0.5 2,023.3 3,975.9 (5.6) (96.1) (377.2) 89.2 $ 5,610.0
(1) AOCI: Accumulated other comprehensive income (loss)(2) NCI: Noncontrolling interest(3) Excludes net (loss) income attributable to redeemable noncontrolling interest of $(0.3) million and $0.2 million for the years ended December 31, 2020 and 2019, respectively.
See accompanying notes to Consolidated Financial Statements.
Table of Contents
71
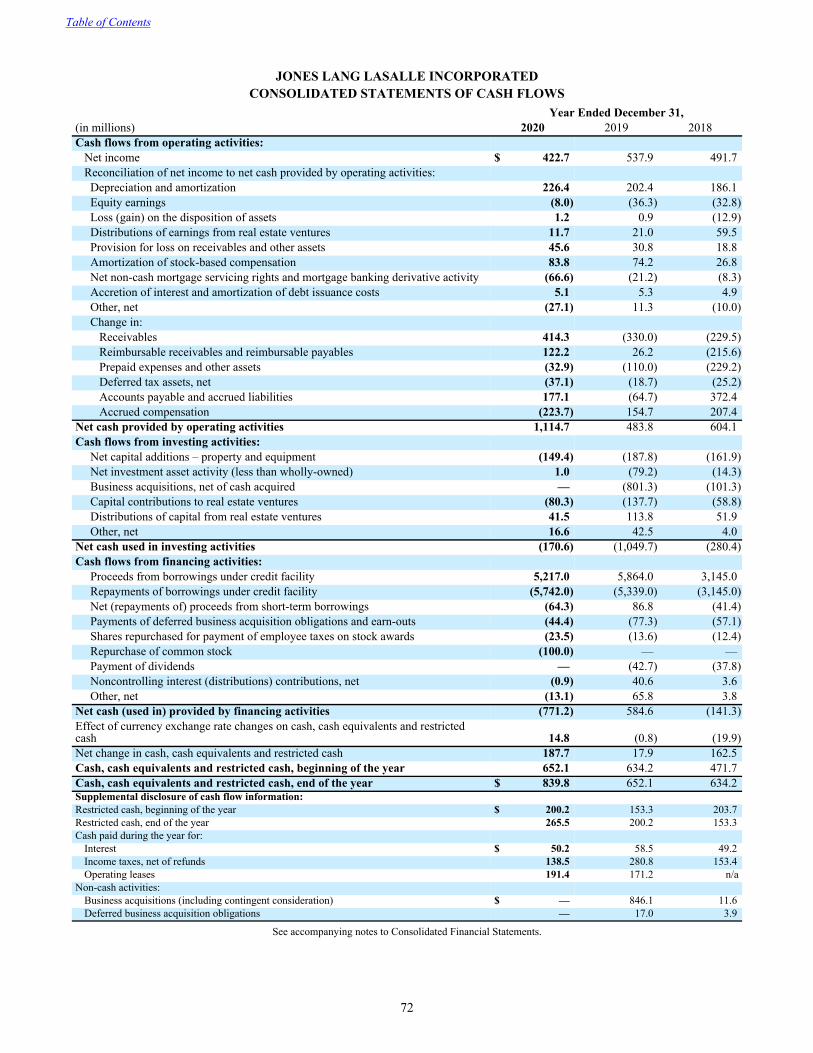
JONES LANG LASALLE INCORPORATEDCONSOLIDATED STATEMENTS OF CASH FLOWS
Year Ended December 31,(in millions) 2020 2019 2018Cash flows from operating activities:
Net income $ 422.7 537.9 491.7 Reconciliation of net income to net cash provided by operating activities: Depreciation and amortization 226.4 202.4 186.1 Equity earnings (8.0) (36.3) (32.8) Loss (gain) on the disposition of assets 1.2 0.9 (12.9) Distributions of earnings from real estate ventures 11.7 21.0 59.5 Provision for loss on receivables and other assets 45.6 30.8 18.8 Amortization of stock-based compensation 83.8 74.2 26.8 Net non-cash mortgage servicing rights and mortgage banking derivative activity (66.6) (21.2) (8.3) Accretion of interest and amortization of debt issuance costs 5.1 5.3 4.9 Other, net (27.1) 11.3 (10.0) Change in:
Receivables 414.3 (330.0) (229.5) Reimbursable receivables and reimbursable payables 122.2 26.2 (215.6) Prepaid expenses and other assets (32.9) (110.0) (229.2) Deferred tax assets, net (37.1) (18.7) (25.2) Accounts payable and accrued liabilities 177.1 (64.7) 372.4 Accrued compensation (223.7) 154.7 207.4
Net cash provided by operating activities 1,114.7 483.8 604.1 Cash flows from investing activities:
Net capital additions – property and equipment (149.4) (187.8) (161.9) Net investment asset activity (less than wholly-owned) 1.0 (79.2) (14.3) Business acquisitions, net of cash acquired — (801.3) (101.3) Capital contributions to real estate ventures (80.3) (137.7) (58.8) Distributions of capital from real estate ventures 41.5 113.8 51.9 Other, net 16.6 42.5 4.0
Net cash used in investing activities (170.6) (1,049.7) (280.4) Cash flows from financing activities:
Proceeds from borrowings under credit facility 5,217.0 5,864.0 3,145.0 Repayments of borrowings under credit facility (5,742.0) (5,339.0) (3,145.0) Net (repayments of) proceeds from short-term borrowings (64.3) 86.8 (41.4) Payments of deferred business acquisition obligations and earn-outs (44.4) (77.3) (57.1) Shares repurchased for payment of employee taxes on stock awards (23.5) (13.6) (12.4) Repurchase of common stock (100.0) — — Payment of dividends — (42.7) (37.8) Noncontrolling interest (distributions) contributions, net (0.9) 40.6 3.6 Other, net (13.1) 65.8 3.8
Net cash (used in) provided by financing activities (771.2) 584.6 (141.3) Effect of currency exchange rate changes on cash, cash equivalents and restricted cash 14.8 (0.8) (19.9) Net change in cash, cash equivalents and restricted cash 187.7 17.9 162.5 Cash, cash equivalents and restricted cash, beginning of the year 652.1 634.2 471.7 Cash, cash equivalents and restricted cash, end of the year $ 839.8 652.1 634.2 Supplemental disclosure of cash flow information:Restricted cash, beginning of the year $ 200.2 153.3 203.7 Restricted cash, end of the year 265.5 200.2 153.3 Cash paid during the year for:
Interest $ 50.2 58.5 49.2 Income taxes, net of refunds 138.5 280.8 153.4 Operating leases 191.4 171.2 n/a
Non-cash activities: Business acquisitions (including contingent consideration) $ — 846.1 11.6 Deferred business acquisition obligations — 17.0 3.9
See accompanying notes to Consolidated Financial Statements.
Table of Contents
72
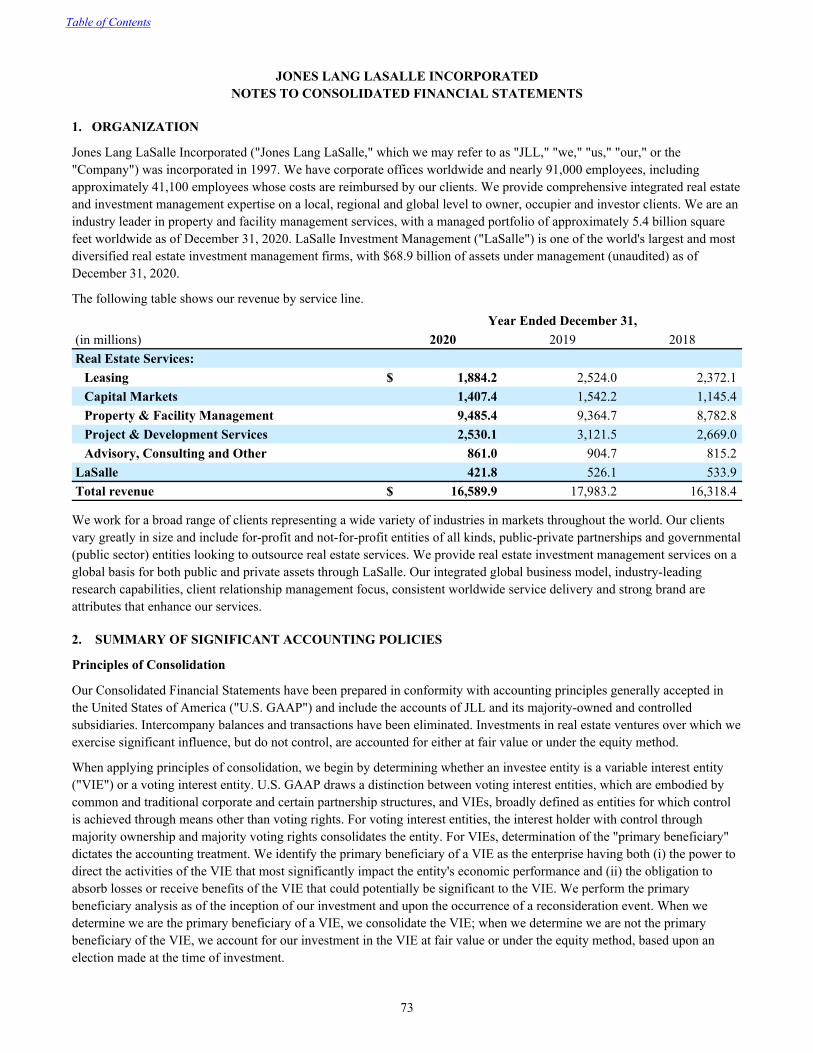
JONES LANG LASALLE INCORPORATEDNOTES TO CONSOLIDATED FINANCIAL STATEMENTS
1. ORGANIZATION
Jones Lang LaSalle Incorporated ("Jones Lang LaSalle," which we may refer to as "JLL," "we," "us," "our," or the "Company") was incorporated in 1997. We have corporate offices worldwide and nearly 91,000 employees, including approximately 41,100 employees whose costs are reimbursed by our clients. We provide comprehensive integrated real estate and investment management expertise on a local, regional and global level to owner, occupier and investor clients. We are an industry leader in property and facility management services, with a managed portfolio of approximately 5.4 billion square feet worldwide as of December 31, 2020. LaSalle Investment Management ("LaSalle") is one of the world's largest and most diversified real estate investment management firms, with $68.9 billion of assets under management (unaudited) as of December 31, 2020.
The following table shows our revenue by service line.
Year Ended December 31,(in millions) 2020 2019 2018Real Estate Services:
Leasing $ 1,884.2 2,524.0 2,372.1 Capital Markets 1,407.4 1,542.2 1,145.4 Property & Facility Management 9,485.4 9,364.7 8,782.8 Project & Development Services 2,530.1 3,121.5 2,669.0 Advisory, Consulting and Other 861.0 904.7 815.2
LaSalle 421.8 526.1 533.9 Total revenue $ 16,589.9 17,983.2 16,318.4
We work for a broad range of clients representing a wide variety of industries in markets throughout the world. Our clients vary greatly in size and include for-profit and not-for-profit entities of all kinds, public-private partnerships and governmental (public sector) entities looking to outsource real estate services. We provide real estate investment management services on a global basis for both public and private assets through LaSalle. Our integrated global business model, industry-leading research capabilities, client relationship management focus, consistent worldwide service delivery and strong brand are attributes that enhance our services.
2. SUMMARY OF SIGNIFICANT ACCOUNTING POLICIES
Principles of Consolidation
Our Consolidated Financial Statements have been prepared in conformity with accounting principles generally accepted in the United States of America ("U.S. GAAP") and include the accounts of JLL and its majority-owned and controlled subsidiaries. Intercompany balances and transactions have been eliminated. Investments in real estate ventures over which we exercise significant influence, but do not control, are accounted for either at fair value or under the equity method.
When applying principles of consolidation, we begin by determining whether an investee entity is a variable interest entity ("VIE") or a voting interest entity. U.S. GAAP draws a distinction between voting interest entities, which are embodied by common and traditional corporate and certain partnership structures, and VIEs, broadly defined as entities for which control is achieved through means other than voting rights. For voting interest entities, the interest holder with control through majority ownership and majority voting rights consolidates the entity. For VIEs, determination of the "primary beneficiary" dictates the accounting treatment. We identify the primary beneficiary of a VIE as the enterprise having both (i) the power to direct the activities of the VIE that most significantly impact the entity's economic performance and (ii) the obligation to absorb losses or receive benefits of the VIE that could potentially be significant to the VIE. We perform the primary beneficiary analysis as of the inception of our investment and upon the occurrence of a reconsideration event. When we determine we are the primary beneficiary of a VIE, we consolidate the VIE; when we determine we are not the primary beneficiary of the VIE, we account for our investment in the VIE at fair value or under the equity method, based upon an election made at the time of investment.
Table of Contents
73
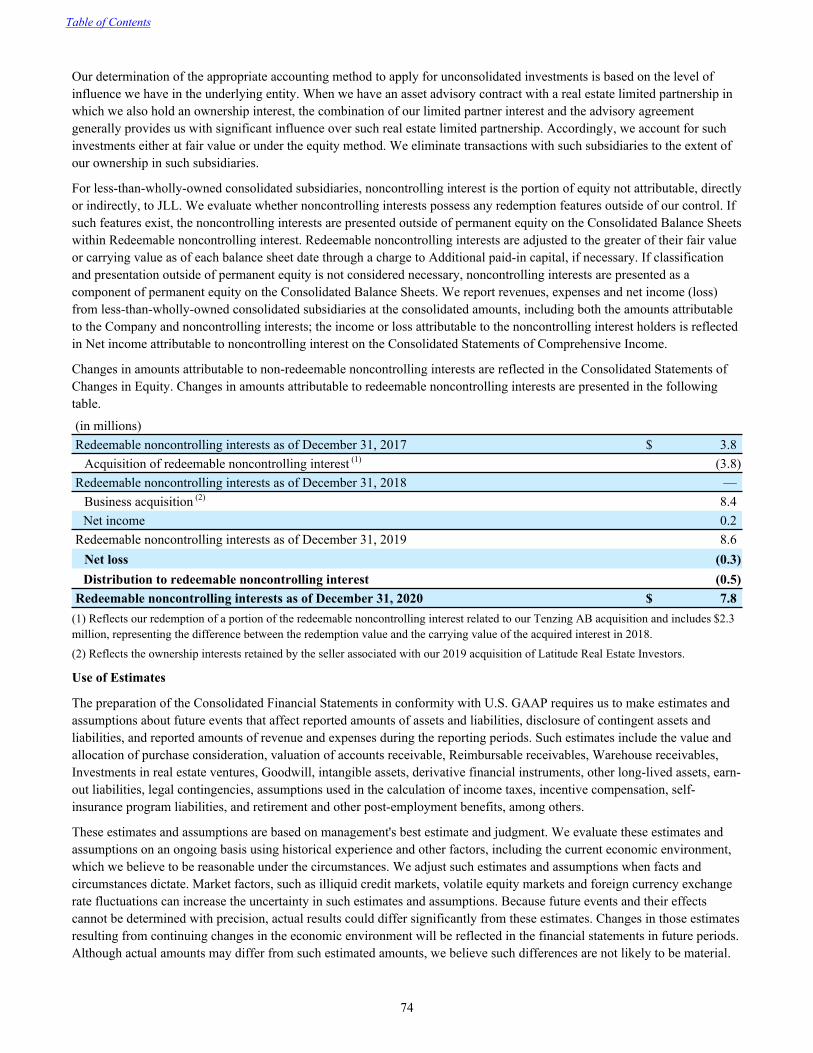
Our determination of the appropriate accounting method to apply for unconsolidated investments is based on the level of influence we have in the underlying entity. When we have an asset advisory contract with a real estate limited partnership in which we also hold an ownership interest, the combination of our limited partner interest and the advisory agreement generally provides us with significant influence over such real estate limited partnership. Accordingly, we account for such investments either at fair value or under the equity method. We eliminate transactions with such subsidiaries to the extent of our ownership in such subsidiaries.
For less-than-wholly-owned consolidated subsidiaries, noncontrolling interest is the portion of equity not attributable, directly or indirectly, to JLL. We evaluate whether noncontrolling interests possess any redemption features outside of our control. If such features exist, the noncontrolling interests are presented outside of permanent equity on the Consolidated Balance Sheets within Redeemable noncontrolling interest. Redeemable noncontrolling interests are adjusted to the greater of their fair value or carrying value as of each balance sheet date through a charge to Additional paid-in capital, if necessary. If classification and presentation outside of permanent equity is not considered necessary, noncontrolling interests are presented as a component of permanent equity on the Consolidated Balance Sheets. We report revenues, expenses and net income (loss) from less-than-wholly-owned consolidated subsidiaries at the consolidated amounts, including both the amounts attributable to the Company and noncontrolling interests; the income or loss attributable to the noncontrolling interest holders is reflected in Net income attributable to noncontrolling interest on the Consolidated Statements of Comprehensive Income.
Changes in amounts attributable to non-redeemable noncontrolling interests are reflected in the Consolidated Statements of Changes in Equity. Changes in amounts attributable to redeemable noncontrolling interests are presented in the following table.
(in millions)Redeemable noncontrolling interests as of December 31, 2017 $ 3.8
Acquisition of redeemable noncontrolling interest (1) (3.8) Redeemable noncontrolling interests as of December 31, 2018 —
Business acquisition (2) 8.4 Net income 0.2
Redeemable noncontrolling interests as of December 31, 2019 8.6 Net loss (0.3) Distribution to redeemable noncontrolling interest (0.5)
Redeemable noncontrolling interests as of December 31, 2020 $ 7.8 (1) Reflects our redemption of a portion of the redeemable noncontrolling interest related to our Tenzing AB acquisition and includes $2.3 million, representing the difference between the redemption value and the carrying value of the acquired interest in 2018.(2) Reflects the ownership interests retained by the seller associated with our 2019 acquisition of Latitude Real Estate Investors.
Use of Estimates
The preparation of the Consolidated Financial Statements in conformity with U.S. GAAP requires us to make estimates and assumptions about future events that affect reported amounts of assets and liabilities, disclosure of contingent assets and liabilities, and reported amounts of revenue and expenses during the reporting periods. Such estimates include the value and allocation of purchase consideration, valuation of accounts receivable, Reimbursable receivables, Warehouse receivables, Investments in real estate ventures, Goodwill, intangible assets, derivative financial instruments, other long-lived assets, earn-out liabilities, legal contingencies, assumptions used in the calculation of income taxes, incentive compensation, self-insurance program liabilities, and retirement and other post-employment benefits, among others.
These estimates and assumptions are based on management's best estimate and judgment. We evaluate these estimates and assumptions on an ongoing basis using historical experience and other factors, including the current economic environment, which we believe to be reasonable under the circumstances. We adjust such estimates and assumptions when facts and circumstances dictate. Market factors, such as illiquid credit markets, volatile equity markets and foreign currency exchange rate fluctuations can increase the uncertainty in such estimates and assumptions. Because future events and their effects cannot be determined with precision, actual results could differ significantly from these estimates. Changes in those estimates resulting from continuing changes in the economic environment will be reflected in the financial statements in future periods. Although actual amounts may differ from such estimated amounts, we believe such differences are not likely to be material.
Table of Contents
74
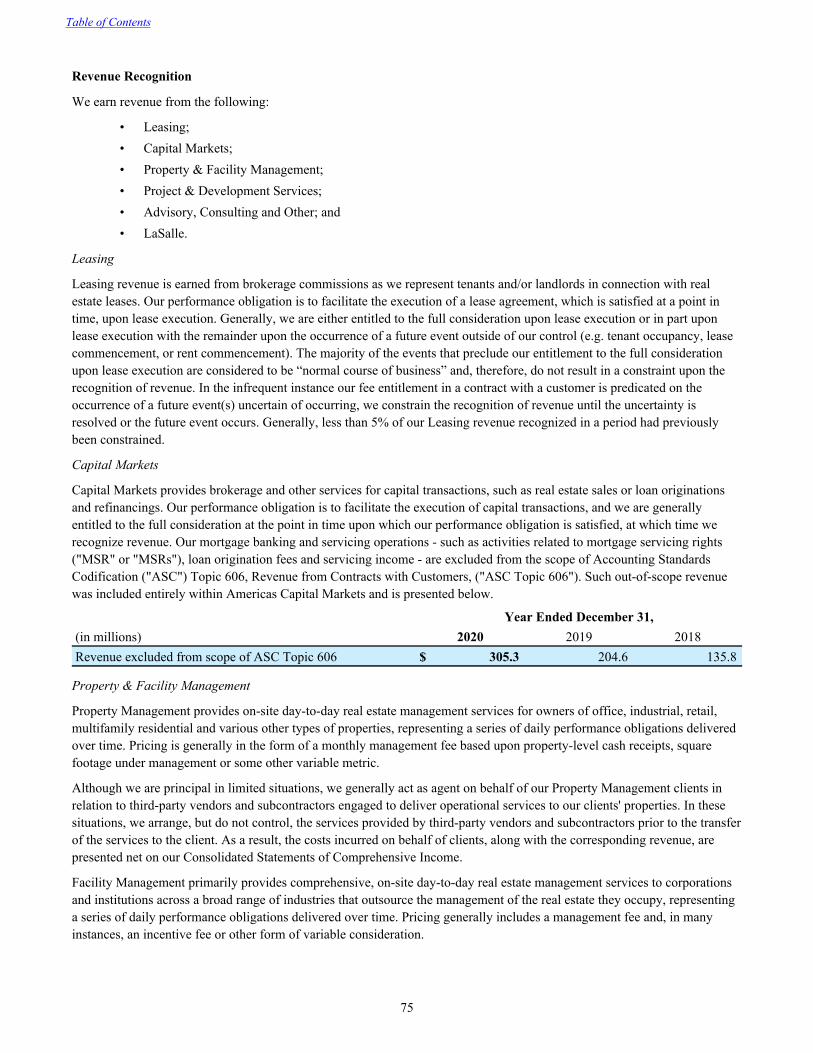
Revenue Recognition
We earn revenue from the following:
• Leasing;• Capital Markets;• Property & Facility Management;• Project & Development Services;• Advisory, Consulting and Other; and• LaSalle.
Leasing
Leasing revenue is earned from brokerage commissions as we represent tenants and/or landlords in connection with real estate leases. Our performance obligation is to facilitate the execution of a lease agreement, which is satisfied at a point in time, upon lease execution. Generally, we are either entitled to the full consideration upon lease execution or in part upon lease execution with the remainder upon the occurrence of a future event outside of our control (e.g. tenant occupancy, lease commencement, or rent commencement). The majority of the events that preclude our entitlement to the full consideration upon lease execution are considered to be “normal course of business” and, therefore, do not result in a constraint upon the recognition of revenue. In the infrequent instance our fee entitlement in a contract with a customer is predicated on the occurrence of a future event(s) uncertain of occurring, we constrain the recognition of revenue until the uncertainty is resolved or the future event occurs. Generally, less than 5% of our Leasing revenue recognized in a period had previously been constrained.
Capital Markets
Capital Markets provides brokerage and other services for capital transactions, such as real estate sales or loan originations and refinancings. Our performance obligation is to facilitate the execution of capital transactions, and we are generally entitled to the full consideration at the point in time upon which our performance obligation is satisfied, at which time we recognize revenue. Our mortgage banking and servicing operations - such as activities related to mortgage servicing rights ("MSR" or "MSRs"), loan origination fees and servicing income - are excluded from the scope of Accounting Standards Codification ("ASC") Topic 606, Revenue from Contracts with Customers, ("ASC Topic 606"). Such out-of-scope revenue was included entirely within Americas Capital Markets and is presented below.
Year Ended December 31,(in millions) 2020 2019 2018Revenue excluded from scope of ASC Topic 606 $ 305.3 204.6 135.8
Property & Facility Management
Property Management provides on-site day-to-day real estate management services for owners of office, industrial, retail, multifamily residential and various other types of properties, representing a series of daily performance obligations delivered over time. Pricing is generally in the form of a monthly management fee based upon property-level cash receipts, square footage under management or some other variable metric.
Although we are principal in limited situations, we generally act as agent on behalf of our Property Management clients in relation to third-party vendors and subcontractors engaged to deliver operational services to our clients' properties. In these situations, we arrange, but do not control, the services provided by third-party vendors and subcontractors prior to the transfer of the services to the client. As a result, the costs incurred on behalf of clients, along with the corresponding revenue, are presented net on our Consolidated Statements of Comprehensive Income.
Facility Management primarily provides comprehensive, on-site day-to-day real estate management services to corporations and institutions across a broad range of industries that outsource the management of the real estate they occupy, representing a series of daily performance obligations delivered over time. Pricing generally includes a management fee and, in many instances, an incentive fee or other form of variable consideration.
Table of Contents
75
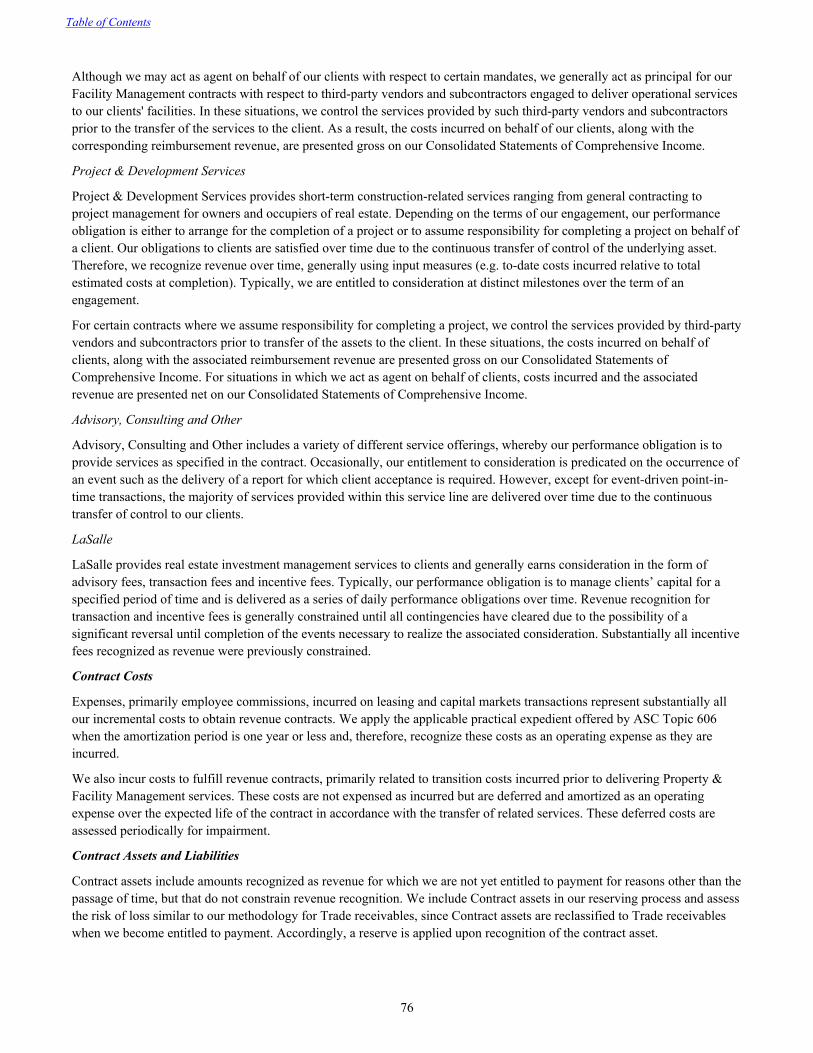
Although we may act as agent on behalf of our clients with respect to certain mandates, we generally act as principal for our Facility Management contracts with respect to third-party vendors and subcontractors engaged to deliver operational services to our clients' facilities. In these situations, we control the services provided by such third-party vendors and subcontractors prior to the transfer of the services to the client. As a result, the costs incurred on behalf of our clients, along with the corresponding reimbursement revenue, are presented gross on our Consolidated Statements of Comprehensive Income.
Project & Development Services
Project & Development Services provides short-term construction-related services ranging from general contracting to project management for owners and occupiers of real estate. Depending on the terms of our engagement, our performance obligation is either to arrange for the completion of a project or to assume responsibility for completing a project on behalf of a client. Our obligations to clients are satisfied over time due to the continuous transfer of control of the underlying asset. Therefore, we recognize revenue over time, generally using input measures (e.g. to-date costs incurred relative to total estimated costs at completion). Typically, we are entitled to consideration at distinct milestones over the term of an engagement.
For certain contracts where we assume responsibility for completing a project, we control the services provided by third-party vendors and subcontractors prior to transfer of the assets to the client. In these situations, the costs incurred on behalf of clients, along with the associated reimbursement revenue are presented gross on our Consolidated Statements of Comprehensive Income. For situations in which we act as agent on behalf of clients, costs incurred and the associated revenue are presented net on our Consolidated Statements of Comprehensive Income.
Advisory, Consulting and Other
Advisory, Consulting and Other includes a variety of different service offerings, whereby our performance obligation is to provide services as specified in the contract. Occasionally, our entitlement to consideration is predicated on the occurrence of an event such as the delivery of a report for which client acceptance is required. However, except for event-driven point-in-time transactions, the majority of services provided within this service line are delivered over time due to the continuous transfer of control to our clients.
LaSalle
LaSalle provides real estate investment management services to clients and generally earns consideration in the form of advisory fees, transaction fees and incentive fees. Typically, our performance obligation is to manage clients’ capital for a specified period of time and is delivered as a series of daily performance obligations over time. Revenue recognition for transaction and incentive fees is generally constrained until all contingencies have cleared due to the possibility of a significant reversal until completion of the events necessary to realize the associated consideration. Substantially all incentive fees recognized as revenue were previously constrained.
Contract Costs
Expenses, primarily employee commissions, incurred on leasing and capital markets transactions represent substantially all our incremental costs to obtain revenue contracts. We apply the applicable practical expedient offered by ASC Topic 606 when the amortization period is one year or less and, therefore, recognize these costs as an operating expense as they are incurred.
We also incur costs to fulfill revenue contracts, primarily related to transition costs incurred prior to delivering Property & Facility Management services. These costs are not expensed as incurred but are deferred and amortized as an operating expense over the expected life of the contract in accordance with the transfer of related services. These deferred costs are assessed periodically for impairment.
Contract Assets and Liabilities
Contract assets include amounts recognized as revenue for which we are not yet entitled to payment for reasons other than the passage of time, but that do not constrain revenue recognition. We include Contract assets in our reserving process and assess the risk of loss similar to our methodology for Trade receivables, since Contract assets are reclassified to Trade receivables when we become entitled to payment. Accordingly, a reserve is applied upon recognition of the contract asset.
Table of Contents
76
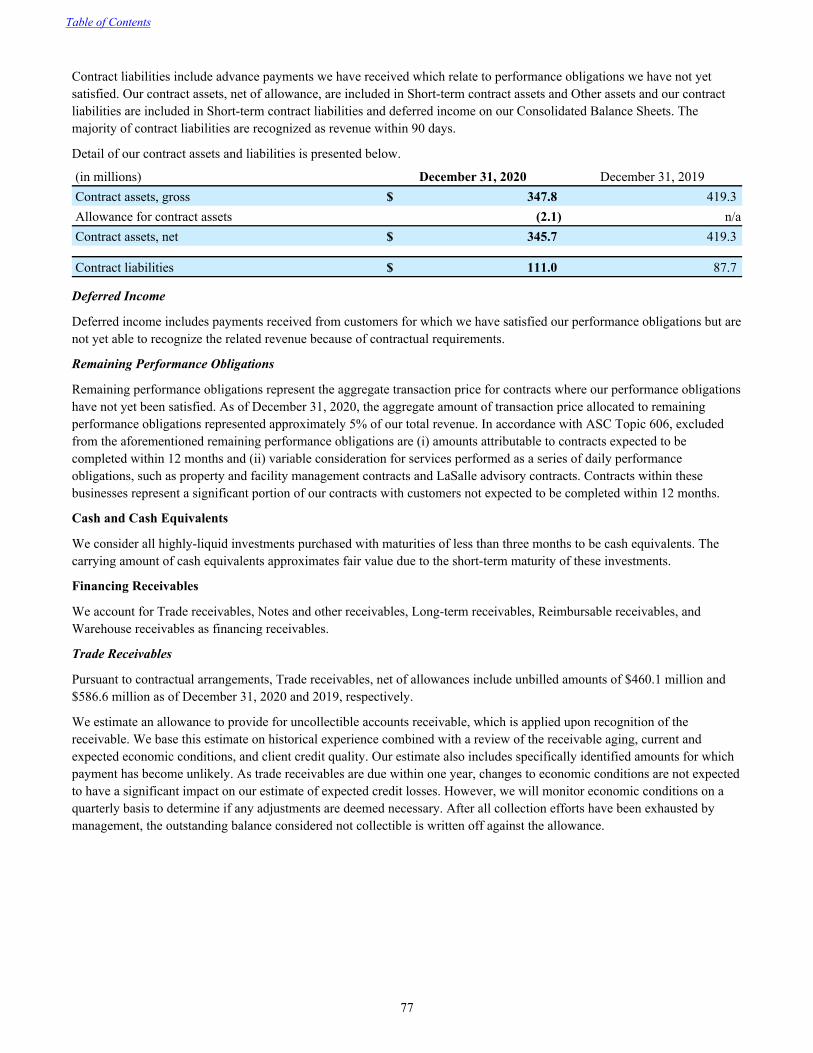
Contract liabilities include advance payments we have received which relate to performance obligations we have not yet satisfied. Our contract assets, net of allowance, are included in Short-term contract assets and Other assets and our contract liabilities are included in Short-term contract liabilities and deferred income on our Consolidated Balance Sheets. The majority of contract liabilities are recognized as revenue within 90 days.
Detail of our contract assets and liabilities is presented below.
(in millions) December 31, 2020 December 31, 2019Contract assets, gross $ 347.8 419.3 Allowance for contract assets (2.1) n/aContract assets, net $ 345.7 419.3
Contract liabilities $ 111.0 87.7
Deferred Income
Deferred income includes payments received from customers for which we have satisfied our performance obligations but are not yet able to recognize the related revenue because of contractual requirements.
Remaining Performance Obligations
Remaining performance obligations represent the aggregate transaction price for contracts where our performance obligations have not yet been satisfied. As of December 31, 2020, the aggregate amount of transaction price allocated to remaining performance obligations represented approximately 5% of our total revenue. In accordance with ASC Topic 606, excluded from the aforementioned remaining performance obligations are (i) amounts attributable to contracts expected to be completed within 12 months and (ii) variable consideration for services performed as a series of daily performance obligations, such as property and facility management contracts and LaSalle advisory contracts. Contracts within these businesses represent a significant portion of our contracts with customers not expected to be completed within 12 months.
Cash and Cash Equivalents
We consider all highly-liquid investments purchased with maturities of less than three months to be cash equivalents. The carrying amount of cash equivalents approximates fair value due to the short-term maturity of these investments.
Financing Receivables
We account for Trade receivables, Notes and other receivables, Long-term receivables, Reimbursable receivables, and Warehouse receivables as financing receivables.
Trade Receivables
Pursuant to contractual arrangements, Trade receivables, net of allowances include unbilled amounts of $460.1 million and $586.6 million as of December 31, 2020 and 2019, respectively.
We estimate an allowance to provide for uncollectible accounts receivable, which is applied upon recognition of the receivable. We base this estimate on historical experience combined with a review of the receivable aging, current and expected economic conditions, and client credit quality. Our estimate also includes specifically identified amounts for which payment has become unlikely. As trade receivables are due within one year, changes to economic conditions are not expected to have a significant impact on our estimate of expected credit losses. However, we will monitor economic conditions on a quarterly basis to determine if any adjustments are deemed necessary. After all collection efforts have been exhausted by management, the outstanding balance considered not collectible is written off against the allowance.
Table of Contents
77
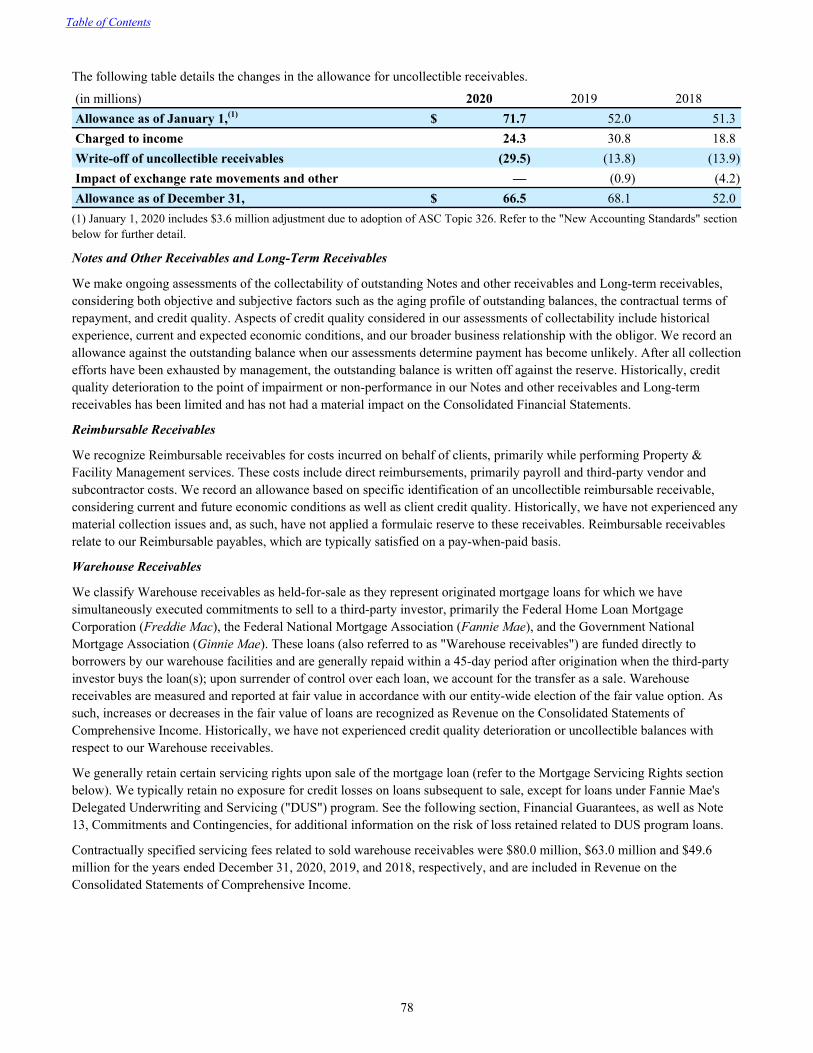
The following table details the changes in the allowance for uncollectible receivables.
(in millions) 2020 2019 2018Allowance as of January 1,(1) $ 71.7 52.0 51.3 Charged to income 24.3 30.8 18.8 Write-off of uncollectible receivables (29.5) (13.8) (13.9) Impact of exchange rate movements and other — (0.9) (4.2) Allowance as of December 31, $ 66.5 68.1 52.0
(1) January 1, 2020 includes $3.6 million adjustment due to adoption of ASC Topic 326. Refer to the "New Accounting Standards" section below for further detail.
Notes and Other Receivables and Long-Term Receivables
We make ongoing assessments of the collectability of outstanding Notes and other receivables and Long-term receivables, considering both objective and subjective factors such as the aging profile of outstanding balances, the contractual terms of repayment, and credit quality. Aspects of credit quality considered in our assessments of collectability include historical experience, current and expected economic conditions, and our broader business relationship with the obligor. We record an allowance against the outstanding balance when our assessments determine payment has become unlikely. After all collection efforts have been exhausted by management, the outstanding balance is written off against the reserve. Historically, credit quality deterioration to the point of impairment or non-performance in our Notes and other receivables and Long-term receivables has been limited and has not had a material impact on the Consolidated Financial Statements.
Reimbursable Receivables
We recognize Reimbursable receivables for costs incurred on behalf of clients, primarily while performing Property & Facility Management services. These costs include direct reimbursements, primarily payroll and third-party vendor and subcontractor costs. We record an allowance based on specific identification of an uncollectible reimbursable receivable, considering current and future economic conditions as well as client credit quality. Historically, we have not experienced any material collection issues and, as such, have not applied a formulaic reserve to these receivables. Reimbursable receivables relate to our Reimbursable payables, which are typically satisfied on a pay-when-paid basis.
Warehouse Receivables
We classify Warehouse receivables as held-for-sale as they represent originated mortgage loans for which we have simultaneously executed commitments to sell to a third-party investor, primarily the Federal Home Loan Mortgage Corporation (Freddie Mac), the Federal National Mortgage Association (Fannie Mae), and the Government National Mortgage Association (Ginnie Mae). These loans (also referred to as "Warehouse receivables") are funded directly to borrowers by our warehouse facilities and are generally repaid within a 45-day period after origination when the third-party investor buys the loan(s); upon surrender of control over each loan, we account for the transfer as a sale. Warehouse receivables are measured and reported at fair value in accordance with our entity-wide election of the fair value option. As such, increases or decreases in the fair value of loans are recognized as Revenue on the Consolidated Statements of Comprehensive Income. Historically, we have not experienced credit quality deterioration or uncollectible balances with respect to our Warehouse receivables.
We generally retain certain servicing rights upon sale of the mortgage loan (refer to the Mortgage Servicing Rights section below). We typically retain no exposure for credit losses on loans subsequent to sale, except for loans under Fannie Mae's Delegated Underwriting and Servicing ("DUS") program. See the following section, Financial Guarantees, as well as Note 13, Commitments and Contingencies, for additional information on the risk of loss retained related to DUS program loans.
Contractually specified servicing fees related to sold warehouse receivables were $80.0 million, $63.0 million and $49.6 million for the years ended December 31, 2020, 2019, and 2018, respectively, and are included in Revenue on the Consolidated Statements of Comprehensive Income.
Table of Contents
78
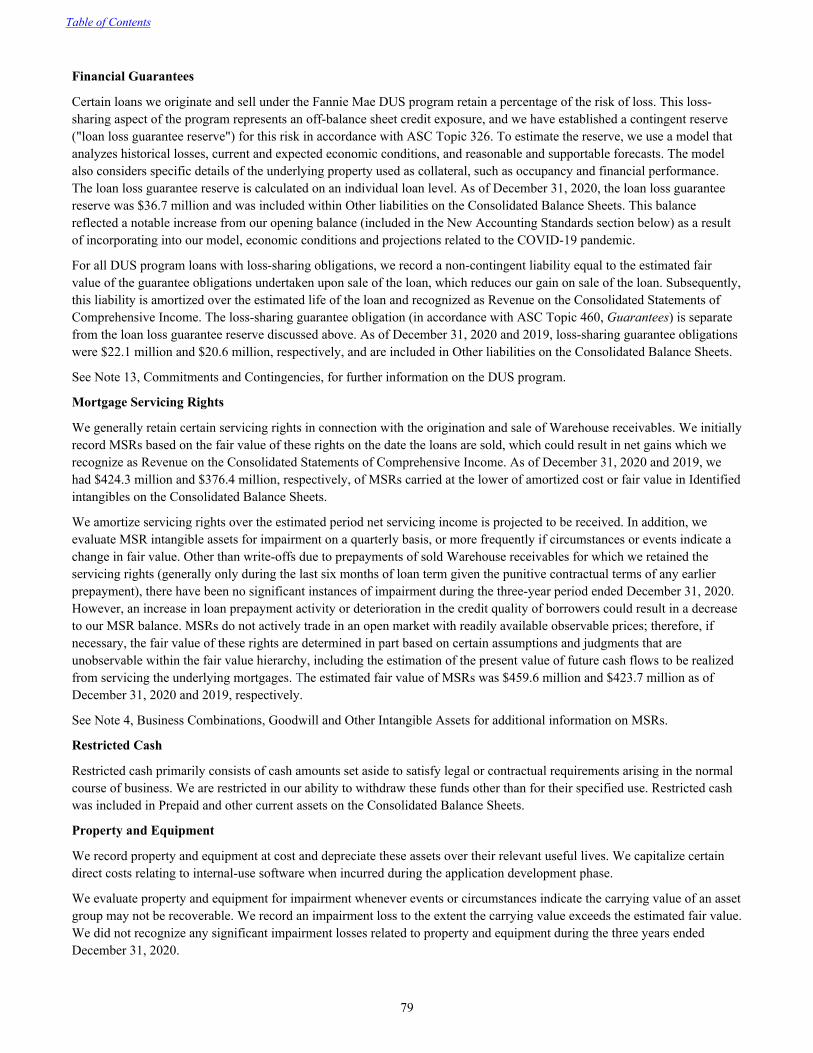
Financial Guarantees
Certain loans we originate and sell under the Fannie Mae DUS program retain a percentage of the risk of loss. This loss-sharing aspect of the program represents an off-balance sheet credit exposure, and we have established a contingent reserve ("loan loss guarantee reserve") for this risk in accordance with ASC Topic 326. To estimate the reserve, we use a model that analyzes historical losses, current and expected economic conditions, and reasonable and supportable forecasts. The model also considers specific details of the underlying property used as collateral, such as occupancy and financial performance. The loan loss guarantee reserve is calculated on an individual loan level. As of December 31, 2020, the loan loss guarantee reserve was $36.7 million and was included within Other liabilities on the Consolidated Balance Sheets. This balance reflected a notable increase from our opening balance (included in the New Accounting Standards section below) as a result of incorporating into our model, economic conditions and projections related to the COVID-19 pandemic.
For all DUS program loans with loss-sharing obligations, we record a non-contingent liability equal to the estimated fair value of the guarantee obligations undertaken upon sale of the loan, which reduces our gain on sale of the loan. Subsequently, this liability is amortized over the estimated life of the loan and recognized as Revenue on the Consolidated Statements of Comprehensive Income. The loss-sharing guarantee obligation (in accordance with ASC Topic 460, Guarantees) is separate from the loan loss guarantee reserve discussed above. As of December 31, 2020 and 2019, loss-sharing guarantee obligations were $22.1 million and $20.6 million, respectively, and are included in Other liabilities on the Consolidated Balance Sheets.
See Note 13, Commitments and Contingencies, for further information on the DUS program.
Mortgage Servicing Rights
We generally retain certain servicing rights in connection with the origination and sale of Warehouse receivables. We initially record MSRs based on the fair value of these rights on the date the loans are sold, which could result in net gains which we recognize as Revenue on the Consolidated Statements of Comprehensive Income. As of December 31, 2020 and 2019, we had $424.3 million and $376.4 million, respectively, of MSRs carried at the lower of amortized cost or fair value in Identified intangibles on the Consolidated Balance Sheets.
We amortize servicing rights over the estimated period net servicing income is projected to be received. In addition, we evaluate MSR intangible assets for impairment on a quarterly basis, or more frequently if circumstances or events indicate a change in fair value. Other than write-offs due to prepayments of sold Warehouse receivables for which we retained the servicing rights (generally only during the last six months of loan term given the punitive contractual terms of any earlier prepayment), there have been no significant instances of impairment during the three-year period ended December 31, 2020. However, an increase in loan prepayment activity or deterioration in the credit quality of borrowers could result in a decrease to our MSR balance. MSRs do not actively trade in an open market with readily available observable prices; therefore, if necessary, the fair value of these rights are determined in part based on certain assumptions and judgments that are unobservable within the fair value hierarchy, including the estimation of the present value of future cash flows to be realized from servicing the underlying mortgages. The estimated fair value of MSRs was $459.6 million and $423.7 million as of December 31, 2020 and 2019, respectively.
See Note 4, Business Combinations, Goodwill and Other Intangible Assets for additional information on MSRs.
Restricted Cash
Restricted cash primarily consists of cash amounts set aside to satisfy legal or contractual requirements arising in the normal course of business. We are restricted in our ability to withdraw these funds other than for their specified use. Restricted cash was included in Prepaid and other current assets on the Consolidated Balance Sheets.
Property and Equipment
We record property and equipment at cost and depreciate these assets over their relevant useful lives. We capitalize certain direct costs relating to internal-use software when incurred during the application development phase.
We evaluate property and equipment for impairment whenever events or circumstances indicate the carrying value of an asset group may not be recoverable. We record an impairment loss to the extent the carrying value exceeds the estimated fair value. We did not recognize any significant impairment losses related to property and equipment during the three years ended December 31, 2020.
Table of Contents
79
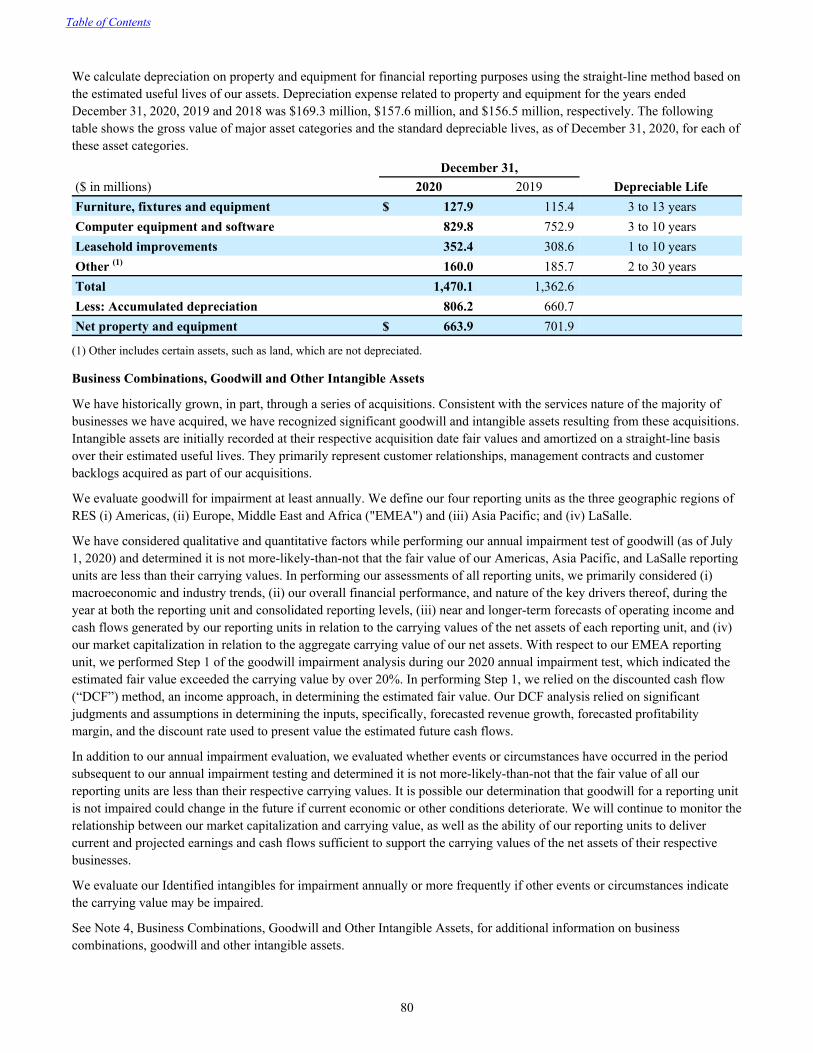
We calculate depreciation on property and equipment for financial reporting purposes using the straight-line method based on the estimated useful lives of our assets. Depreciation expense related to property and equipment for the years ended December 31, 2020, 2019 and 2018 was $169.3 million, $157.6 million, and $156.5 million, respectively. The following table shows the gross value of major asset categories and the standard depreciable lives, as of December 31, 2020, for each of these asset categories.
December 31,($ in millions) 2020 2019 Depreciable LifeFurniture, fixtures and equipment $ 127.9 115.4 3 to 13 yearsComputer equipment and software 829.8 752.9 3 to 10 yearsLeasehold improvements 352.4 308.6 1 to 10 yearsOther (1) 160.0 185.7 2 to 30 yearsTotal 1,470.1 1,362.6 Less: Accumulated depreciation 806.2 660.7 Net property and equipment $ 663.9 701.9
(1) Other includes certain assets, such as land, which are not depreciated.
Business Combinations, Goodwill and Other Intangible Assets
We have historically grown, in part, through a series of acquisitions. Consistent with the services nature of the majority of businesses we have acquired, we have recognized significant goodwill and intangible assets resulting from these acquisitions. Intangible assets are initially recorded at their respective acquisition date fair values and amortized on a straight-line basis over their estimated useful lives. They primarily represent customer relationships, management contracts and customer backlogs acquired as part of our acquisitions.
We evaluate goodwill for impairment at least annually. We define our four reporting units as the three geographic regions of RES (i) Americas, (ii) Europe, Middle East and Africa ("EMEA") and (iii) Asia Pacific; and (iv) LaSalle.
We have considered qualitative and quantitative factors while performing our annual impairment test of goodwill (as of July 1, 2020) and determined it is not more-likely-than-not that the fair value of our Americas, Asia Pacific, and LaSalle reporting units are less than their carrying values. In performing our assessments of all reporting units, we primarily considered (i) macroeconomic and industry trends, (ii) our overall financial performance, and nature of the key drivers thereof, during the year at both the reporting unit and consolidated reporting levels, (iii) near and longer-term forecasts of operating income and cash flows generated by our reporting units in relation to the carrying values of the net assets of each reporting unit, and (iv) our market capitalization in relation to the aggregate carrying value of our net assets. With respect to our EMEA reporting unit, we performed Step 1 of the goodwill impairment analysis during our 2020 annual impairment test, which indicated the estimated fair value exceeded the carrying value by over 20%. In performing Step 1, we relied on the discounted cash flow (“DCF”) method, an income approach, in determining the estimated fair value. Our DCF analysis relied on significant judgments and assumptions in determining the inputs, specifically, forecasted revenue growth, forecasted profitability margin, and the discount rate used to present value the estimated future cash flows.
In addition to our annual impairment evaluation, we evaluated whether events or circumstances have occurred in the period subsequent to our annual impairment testing and determined it is not more-likely-than-not that the fair value of all our reporting units are less than their respective carrying values. It is possible our determination that goodwill for a reporting unit is not impaired could change in the future if current economic or other conditions deteriorate. We will continue to monitor the relationship between our market capitalization and carrying value, as well as the ability of our reporting units to deliver current and projected earnings and cash flows sufficient to support the carrying values of the net assets of their respective businesses.
We evaluate our Identified intangibles for impairment annually or more frequently if other events or circumstances indicate the carrying value may be impaired.
See Note 4, Business Combinations, Goodwill and Other Intangible Assets, for additional information on business combinations, goodwill and other intangible assets.
Table of Contents
80

Investments in Real Estate Ventures
We invest in certain ventures that primarily own and operate commercial real estate on a global basis across a wide array of sectors including retail, residential and office. Historically, these investments have primarily been co-investments in funds our LaSalle business establishes in the ordinary course of business for its clients. These investments take the form of equity ownership interests generally ranging from less than 1% to 10% of the respective ventures and, based upon investment-specific objectives, have generally included five to nine-year investment periods. Typically, our investments in real estate ventures are not redeemable until the earlier of the disposition of the underlying real estate investments or the end of the fund's life. When in place, such restrictions are a result of our role beyond that of a passive investor, which generally means an advisory or management responsibility on behalf of the other investors who are typically clients of our LaSalle business. We primarily account for these investments at fair value utilizing information provided by investees, however, as further discussed below, we report certain of our investments under the equity method.
In addition to our LaSalle investments, we invest, primarily through the JLL Spark Global Venture funds, in property technology funds and early-stage companies to improve our strategic position within the real estate technology landscape. We generally account for these investments at fair value. The fair value of these investments was $69.9 million and $42.9 million as of December 31, 2020, and 2019, respectively.
For limited partnerships in which we are a general partner, the entities are generally well-capitalized and grant the limited partners substantive participating rights, such as the right to replace the general partner without cause, to dissolve or liquidate the partnership, to approve the sale or refinancing of the principal partnership assets, or to approve the acquisition of principal partnership assets. We account for such general partner interests at fair value or under the equity method.
For limited partnerships in which we are a limited partner, management has concluded we do not have a controlling interest in these limited partnerships. When we have an asset advisory contract with the limited partnership, the combination of our limited partner interest and the advisory agreement generally provides us with significant influence over the real estate limited partnership venture. Accordingly, we account for such investments at fair value or under the equity method.
See "Principles of Consolidation" above for additional discussion of the accounting for our co-investments.
For investments in real estate ventures reported at fair value, we maintain an investment account that is increased or decreased each reporting period by the difference between the fair value of the investment and the carrying value as of the balance sheet date. These fair value adjustments are reflected as gains or losses on the Consolidated Statements of Comprehensive Income within Equity earnings. The fair value of these investments as of the balance sheet date is generally determined using NAV per share (or its equivalent), an unobservable input in the fair value hierarchy, provided by the investee.
For investments in real estate ventures accounted for under the equity method, we maintain an investment account that is (i) increased by contributions made and by our share of net income earned by the real estate ventures, and (ii) decreased by distributions received and by our share of net losses realized by the real estate ventures. Our share of each real estate venture's net income or loss, including gains and losses from capital transactions, is reflected on the Consolidated Statements of Comprehensive Income as Equity earnings. We evaluate our investments in real estate ventures accounted for under the equity method for other-than-temporary impairment on a quarterly basis, or as events or changes in circumstances warrant such an evaluation. Our evaluations consider the existence of impairment indicators in the underlying real estate assets that compose the majority of our investments. We base such evaluations, in regard to both the investment and the investment’s underlying asset levels, on regular updates to future cash flow models, our share of co-investment cash flows, and factors such as operational performance, market conditions, major tenancy matters, legal and environmental concerns, and our ability and intent to hold each investment. If an investment is considered other-than-temporarily impaired, we record the excess of the carrying value over the estimated fair value as an impairment charge.
Impairment charges to write down the carrying value of the real estate assets underlying our investments are generally based on the result of discounted cash flow models that primarily rely upon unobservable inputs to determine fair value. We recognize our proportionate share of such impairment within Equity earnings on the Consolidated Statements of Comprehensive Income.
See Note 5, Investments in Real Estate Ventures and Note 9, Fair Value Measurements for additional information on Investments in real estate ventures.
Table of Contents
81
Stock-Based Compensation
Stock-based compensation in the form of restricted stock units ("RSUs") and performance stock units ("PSUs") is an important element of our compensation programs. We determine the fair value of RSUs, subject only to service requirements, based on the closing market price of our common stock on the grant date. PSUs are subject to service requirements and performance measures. All PSUs contain one or more performance conditions, such as a pre-defined target based on the Company’s cumulative earnings per share over a multi-year period. For certain executives there is an additional performance measure, a market condition, based on total shareholder return ("TSR") against a peer group. The number of shares that will be issued upon vesting of these PSUs can range from 0% to 150% of the target award, depending on the achievement of each performance condition. We determine the fair value of PSUs based on the (i) closing market price of our common stock on the grant date taking, (ii) the achievement probability for each performance condition, and (iii) the market condition valuation, as applicable, based on the output of Monte Carlo simulations. We periodically assess the achievement probability for performance conditions. As of December 31, 2020, less than 3% of unvested shares were subject to a market condition.
Employees of a specific age, with a sum of age plus years of service with the Company which meets or exceeds 65, based on the terms of the Jones Lang LaSalle 2019 Stock Award and Incentive Plan ("SAIP"), are eligible to be considered for receipt of retirement benefits upon departure from the Company. These award provisions require acceleration of compensation expense such that all expense is recognized by the time these employees are considered retirement eligible.
We do not estimate forfeitures; instead, we recognize forfeitures in Compensation & benefits expense as they occur.
We also have a "noncompensatory" Employee Stock Purchase Plan ("ESPP") for U.S. employees and a Jones Lang LaSalle Savings Related Share Option Plan ("Save As You Earn" or "SAYE") for U.K. employees. The fair value of options granted under the SAYE plan are determined on the grant date and amortized over the associated vesting period.
See Note 6, Stock-Based Compensation, for additional information on our stock-based compensation plans.
Income Taxes
We account for income taxes under the asset and liability method. We recognize deferred tax assets and liabilities for the expected future tax consequences of events that have been included in our financial statements or tax returns. Under this method, we determine deferred tax assets and liabilities based on the differences between the financial reporting and tax bases of assets and liabilities using enacted tax rates in effect for the year in which the differences are expected to reverse.
An increase or decrease in a deferred tax asset or liability that results from a change in circumstances, and that causes a change in our judgment about expected future tax consequences of events, would be included in the tax provision when the changes in circumstances and our judgment occurs. Deferred income taxes also reflect the impact of operating loss and tax credit carryforwards. A valuation allowance is established if we believe it is more-likely-than-not all or some portion of a deferred tax asset will not be realized. An increase or decrease in a valuation allowance that results from a change in circumstances, and that causes a change in our judgment about the ability to realize the related deferred tax asset, would be included in the tax provision when the changes in circumstances and our judgment occurs.
See Note 8, Income Taxes, for additional information on income taxes.
Derivatives and Hedging Activities
We do not enter into derivative financial instruments for trading or speculative purposes. However, in the normal course of business, we do use derivative financial instruments in the form of foreign currency forward contracts to manage our foreign currency exchange rate risk. We currently do not use hedge accounting for these contracts, which are marked-to-market each period with changes in unrealized gains or losses recognized in earnings and offset by foreign currency gains and losses on associated intercompany loans and other foreign currency balances. Gains and losses from the revaluation of these contracts are recognized as a component of Operating, administrative and other expense and are offset by the gains and losses recognized on the revaluation of intercompany loans and other foreign currency balances such that the impact to net income was not significant for the three years ended December 31, 2020.
For presentation and disclosure, we net our exposure by counterparty for all counterparties subject to International Swaps and Derivatives Association Master Agreements.
Table of Contents
82
We have considered the counterparty credit risk related to these forward foreign currency exchange contracts and do not deem any counterparty credit risk to be material as of December 31, 2020, in part due to the short-term nature of these contracts.
In addition, certain loan commitments and forward sales commitments related to our Warehouse receivables meet the definition of a derivative and are recorded at fair value on the Consolidated Balance Sheets. The estimated fair value of loan commitments includes the fair value of the expected net cash flows associated with servicing of the loan, other net cash flows associated with origination and sale of the loan, and the effects of market interest rate movements. The estimated fair value of forward sale commitments includes the effects of market interest rate movements. Therefore, the effect of market interest rate movements on estimated fair value offset between the loan commitments and the forward sale commitments. Adjustments to fair value related to loan and forward sale commitments are included within Revenue on the Consolidated Statements of Comprehensive Income.
See Note 9, Fair Value Measurements, for additional information on derivative financial instruments.
Leases
Substantially all of our operating leases are related to office space we lease in various buildings for our own use. The terms of these non-cancelable operating leases typically require us to pay rent and a share of operating expenses and real estate taxes, generally with an inflation-based rent increase included. We also lease equipment under both operating and finance lease arrangements. Our lease agreements do not contain any material residual value guarantees or material restrictive covenants.
Operating lease right-of-use assets and operating lease liabilities are recognized based on the present value of the future minimum lease payments (e.g. rent) over the lease term beginning at the commencement date. The Operating lease right-of-use assets are adjusted for lease incentives, deferred rent, and initial direct costs, if incurred. Our leases generally do not include an implicit rate; therefore, we use an incremental borrowing rate based on information available at the lease commencement date in determining the present value of future minimum lease payments. The related lease expense is recognized on a straight-line basis over the lease term.
Finance leases are included in Property and equipment, net of accumulated depreciation, Short-term borrowings, and Other liabilities on our Consolidated Balance Sheets. Our finance leases do not represent a significant portion of our leasing activity.
See Note 11, Leases, for additional information on leases.
Foreign Currency Translation
We prepare the financial statements of our subsidiaries located outside the U.S. using local currency as the functional currency. The assets and liabilities of these subsidiaries are translated to U.S. dollars at the rates of exchange as of the balance sheet date with the resulting translation adjustments included as a separate component of equity on the Consolidated Balance Sheets (Accumulated other comprehensive loss) and on the Consolidated Statements of Comprehensive Income (Other comprehensive income-foreign currency translation adjustments).
See Note 15, Accumulated Other Comprehensive Income (Loss), for additional information on the components of Accumulated other comprehensive loss.
Income and expenses are translated at the average monthly rates of exchange. We include gains and losses from foreign currency transactions in net earnings as a component of Operating, administrative and other expense. For the years ended December 31, 2020, 2019 and 2018 we had net foreign currency transaction losses of $4.6 million, $2.4 million, and $4.1 million, respectively.
The effect of foreign currency exchange rate changes on Cash, cash equivalents and restricted cash is presented as a separate caption in the Consolidated Statements of Cash Flows.
Cash Held for Others
We manage significant amounts of cash and cash equivalents in our role as agent for certain of our investment, facility management and property management clients. We do not include such amounts on the Consolidated Balance Sheets.
Table of Contents
83
Taxes Collected from Clients and Remitted to Governmental Authorities
We account for tax assessed by a governmental authority that is based on a revenue or transaction value (i.e., sales, use and value-added taxes) on a net basis, excluded from revenue, and recorded as current liabilities until paid.
Other Commitments and Contingencies
We are subject to various claims and contingencies related to disputes, lawsuits and taxes as well as commitments under contractual obligations. Many of these claims are covered under our current insurance programs, subject to deductibles. Our current insurance programs include professional, auto and general liability.
For professional indemnity coverage, the level of risk retained by our captive insurance company is limited per claim, inclusive of the deductible. We contract third-party insurance companies to provide coverage of risk in excess of the policy limits. We recognize the liability associated with a loss contingency when a loss is probable and estimable.
See Note 13, Commitments and Contingencies, for additional information on our captive insurance company as well as our commitments and contingencies.
Earnings Per Share; Net Income Available to Common Shareholders
The difference between basic weighted average shares outstanding and diluted weighted average shares outstanding represents the dilutive impact of our common stock equivalents. Common stock equivalents consist of shares to be issued under employee stock-based compensation programs. Anti-dilutive shares were de minimus for all periods presented.
See Note 6, Stock-Based Compensation, for additional information on our stock-based compensation plans.
New Accounting Standards
Recently adopted accounting guidance
In June 2016, the Financial Accounting Standards Board ("FASB") issued Accounting Standards Update ("ASU") No. 2016-13, Financial Instruments - Credit Losses (ASC Topic 326), which created a new framework to evaluate financial instruments, such as trade receivables, for expected credit losses. This new framework replaced the existing incurred loss approach and is expected to result in more timely recognition of credit losses. On January 1, 2020, we adopted ASU No. 2016-13 using a modified-retrospective approach, as required by the ASU.
The adoption impacted our methodology of reserving for (i) Trade receivables, (ii) other receivable-related financial assets, specifically contract assets, and (iii) off-balance sheet credit exposures within the scope of this ASU. Specifically, we evaluated our historical reserve balances for Trade receivables and the related write-off activity and developed a forward-looking process for adoption. We also evaluated our loss-sharing guarantee obligation for certain mortgage loans we originate, sell and retain the servicing rights.
The following table details the cumulative impact to Retained earnings upon adoption of ASC Topic 326.
Published Adjustment due to Reported Under ASC Topic 326(in millions) December 31, 2019 adoption of ASC Topic 326 on January 1, 2020Assets
Allowance for trade receivables $ (68.1) (3.6) $ (71.7) Deferred tax assets, net 245.4 5.5 250.9 Allowance for contract assets (1) — (1.7) (1.7)
Liabilities and equityLoan loss guarantee reserve (2) $ — 15.1 $ 15.1 Retained earnings 3,588.3 (14.9) 3,573.4
(1) The portion of the allowance for long-term contract assets is included within Other assets on the Consolidated Balance Sheets.
(2) Included within Other liabilities on the Consolidated Balance Sheets
Table of Contents
84
In February 2016, the FASB issued ASU No. 2016-02, Leases (Topic 842), which increased transparency and comparability by requiring the recognition of lease assets and lease liabilities on the balance sheet, as well as requiring the disclosure of key information about leasing arrangements. On January 1, 2019, we adopted this, on a modified retrospective basis under the optional transition method. Therefore, the application of the provisions of this ASU are effective January 1, 2019, and any prior periods are presented in accordance with ASC Topic 840. Additionally, we elected the package of practical expedients permitted under the transition guidance within the new standard, which allowed us to carry forward (i) our historical lease classification and assessments for expired and existing leases, and (ii) our historical accounting for initial direct costs for existing leases. We elected not to record on the Consolidated Balance Sheets any lease whose term is 12 months or less and does not include a purchase option that we are reasonably certain to exercise.
We also elected to account for the non-lease components within our leases as part of the single lease component to which they are related. The most significant impact of the adoption of this ASU was an increase to the Consolidated Balance Sheets to reflect operating lease right-of-use assets and lease liabilities, which are primarily associated with our office leases around the world. Our accounting for finance leases was not materially impacted.
3. BUSINESS SEGMENTS
We manage and report our operations as four business segments:
The three geographic regions of RES including:(1) Americas,(2) Europe, Middle East and Africa ("EMEA"), and(3) Asia Pacific;
and(4) LaSalle.
Each geographic region offers our full range of real estate services, including agency leasing and tenant representation, capital markets, property and facility management, project and development management, energy management and sustainability, construction management, and advisory, consulting and valuation services. LaSalle provides investment management services on a global basis to institutional investors and high-net-worth individuals.
We allocate all indirect expenses to our segments, other than interest and income taxes, as nearly all expenses incurred benefit one or more of the segments. Allocated expenses primarily consist of corporate global overhead, which we allocate to the business segments based on the budgeted operating expenses of each segment.
Segment income does not include (i) restructuring and acquisition charges, (ii) interest expense, net of interest income, (iii) other income, and (iv) provision for income tax, which are otherwise included in Net income on the Consolidated Statements of Comprehensive Income.
The Chief Operating Decision Maker ("CODM") of JLL measures and evaluates the segment results based on Segment income for purposes of making decisions about allocating resources and assessing performance. Our CODM is not provided with total asset information by segment and, accordingly, does not measure performance or allocate resources based on total asset information. Therefore, we have not disclosed asset information by segment. As of December 31, 2020, we define the CODM collectively as our Global Executive Board, which comprises the following:
• Chief Executive Officer and President • Chief Executive Officers of each of our four business segments• Chief Financial Officer • Chief Executive Officer of Corporate Solutions• Chief Human Resources Officer • Chief Executive Officer of Capital Markets
• Co-Chief Executive Officers of JLL Technologies
Table of Contents
85
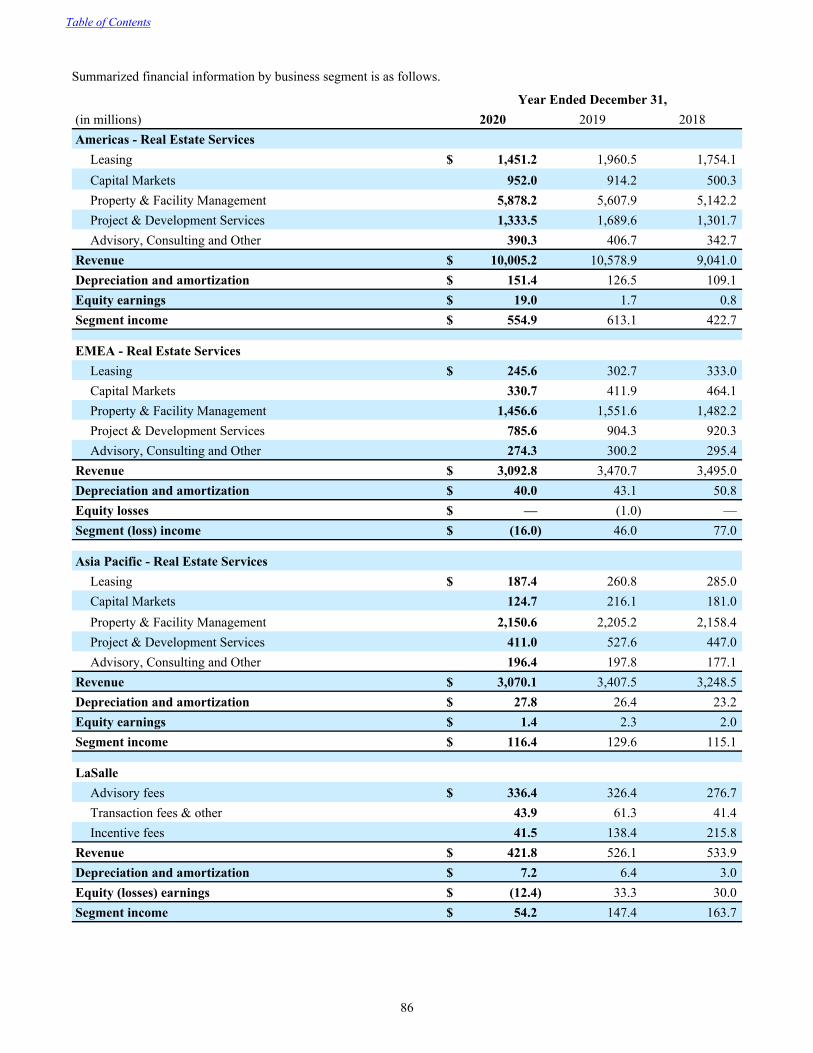
Summarized financial information by business segment is as follows.
Year Ended December 31,(in millions) 2020 2019 2018Americas - Real Estate Services
Leasing $ 1,451.2 1,960.5 1,754.1 Capital Markets 952.0 914.2 500.3 Property & Facility Management 5,878.2 5,607.9 5,142.2 Project & Development Services 1,333.5 1,689.6 1,301.7 Advisory, Consulting and Other 390.3 406.7 342.7
Revenue $ 10,005.2 10,578.9 9,041.0 Depreciation and amortization $ 151.4 126.5 109.1 Equity earnings $ 19.0 1.7 0.8 Segment income $ 554.9 613.1 422.7
EMEA - Real Estate ServicesLeasing $ 245.6 302.7 333.0 Capital Markets 330.7 411.9 464.1 Property & Facility Management 1,456.6 1,551.6 1,482.2 Project & Development Services 785.6 904.3 920.3 Advisory, Consulting and Other 274.3 300.2 295.4
Revenue $ 3,092.8 3,470.7 3,495.0 Depreciation and amortization $ 40.0 43.1 50.8 Equity losses $ — (1.0) — Segment (loss) income $ (16.0) 46.0 77.0
Asia Pacific - Real Estate ServicesLeasing $ 187.4 260.8 285.0 Capital Markets 124.7 216.1 181.0 Property & Facility Management 2,150.6 2,205.2 2,158.4 Project & Development Services 411.0 527.6 447.0 Advisory, Consulting and Other 196.4 197.8 177.1
Revenue $ 3,070.1 3,407.5 3,248.5 Depreciation and amortization $ 27.8 26.4 23.2 Equity earnings $ 1.4 2.3 2.0 Segment income $ 116.4 129.6 115.1
LaSalleAdvisory fees $ 336.4 326.4 276.7 Transaction fees & other 43.9 61.3 41.4 Incentive fees 41.5 138.4 215.8
Revenue $ 421.8 526.1 533.9 Depreciation and amortization $ 7.2 6.4 3.0 Equity (losses) earnings $ (12.4) 33.3 30.0 Segment income $ 54.2 147.4 163.7
Table of Contents
86
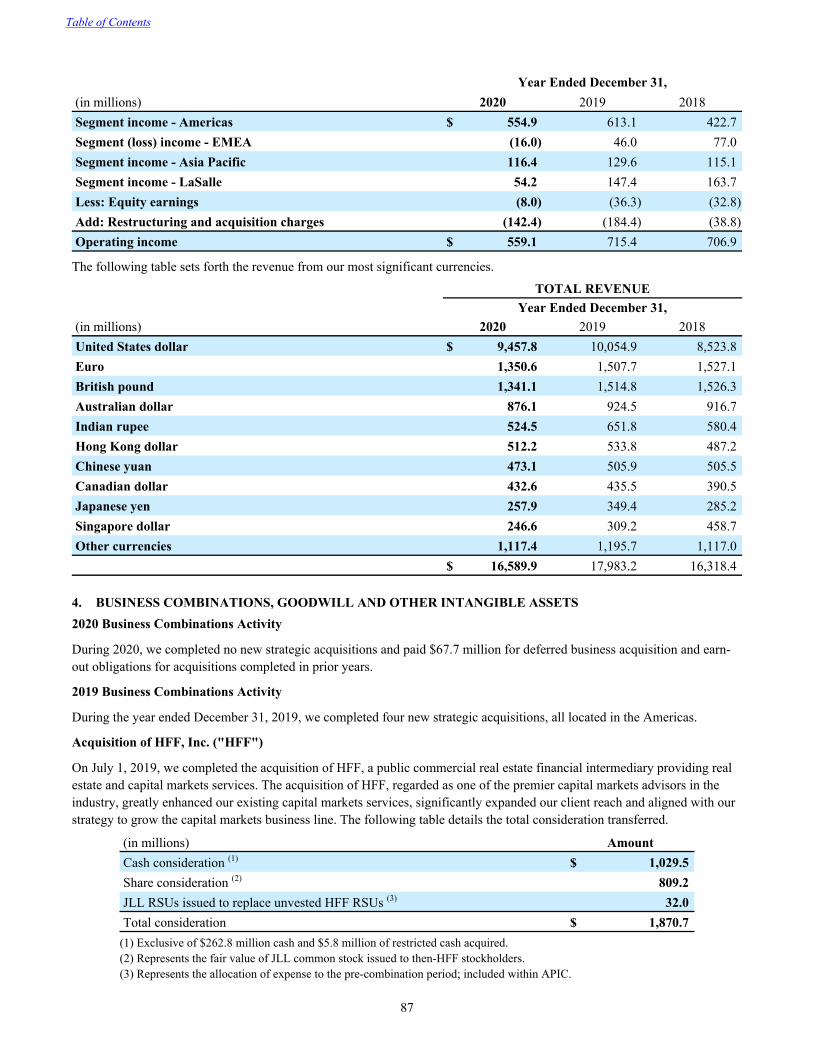
Year Ended December 31,(in millions) 2020 2019 2018Segment income - Americas $ 554.9 613.1 422.7 Segment (loss) income - EMEA (16.0) 46.0 77.0 Segment income - Asia Pacific 116.4 129.6 115.1 Segment income - LaSalle 54.2 147.4 163.7 Less: Equity earnings (8.0) (36.3) (32.8) Add: Restructuring and acquisition charges (142.4) (184.4) (38.8) Operating income $ 559.1 715.4 706.9
The following table sets forth the revenue from our most significant currencies.
TOTAL REVENUEYear Ended December 31,
(in millions) 2020 2019 2018United States dollar $ 9,457.8 10,054.9 8,523.8 Euro 1,350.6 1,507.7 1,527.1 British pound 1,341.1 1,514.8 1,526.3 Australian dollar 876.1 924.5 916.7 Indian rupee 524.5 651.8 580.4 Hong Kong dollar 512.2 533.8 487.2 Chinese yuan 473.1 505.9 505.5 Canadian dollar 432.6 435.5 390.5 Japanese yen 257.9 349.4 285.2 Singapore dollar 246.6 309.2 458.7 Other currencies 1,117.4 1,195.7 1,117.0
$ 16,589.9 17,983.2 16,318.4
4. BUSINESS COMBINATIONS, GOODWILL AND OTHER INTANGIBLE ASSETS2020 Business Combinations Activity
During 2020, we completed no new strategic acquisitions and paid $67.7 million for deferred business acquisition and earn-out obligations for acquisitions completed in prior years.
2019 Business Combinations Activity
During the year ended December 31, 2019, we completed four new strategic acquisitions, all located in the Americas.
Acquisition of HFF, Inc. ("HFF")
On July 1, 2019, we completed the acquisition of HFF, a public commercial real estate financial intermediary providing real estate and capital markets services. The acquisition of HFF, regarded as one of the premier capital markets advisors in the industry, greatly enhanced our existing capital markets services, significantly expanded our client reach and aligned with our strategy to grow the capital markets business line. The following table details the total consideration transferred.
(in millions) AmountCash consideration (1) $ 1,029.5 Share consideration (2) 809.2 JLL RSUs issued to replace unvested HFF RSUs (3) 32.0 Total consideration $ 1,870.7
(1) Exclusive of $262.8 million cash and $5.8 million of restricted cash acquired.(2) Represents the fair value of JLL common stock issued to then-HFF stockholders.(3) Represents the allocation of expense to the pre-combination period; included within APIC.
Table of Contents
87
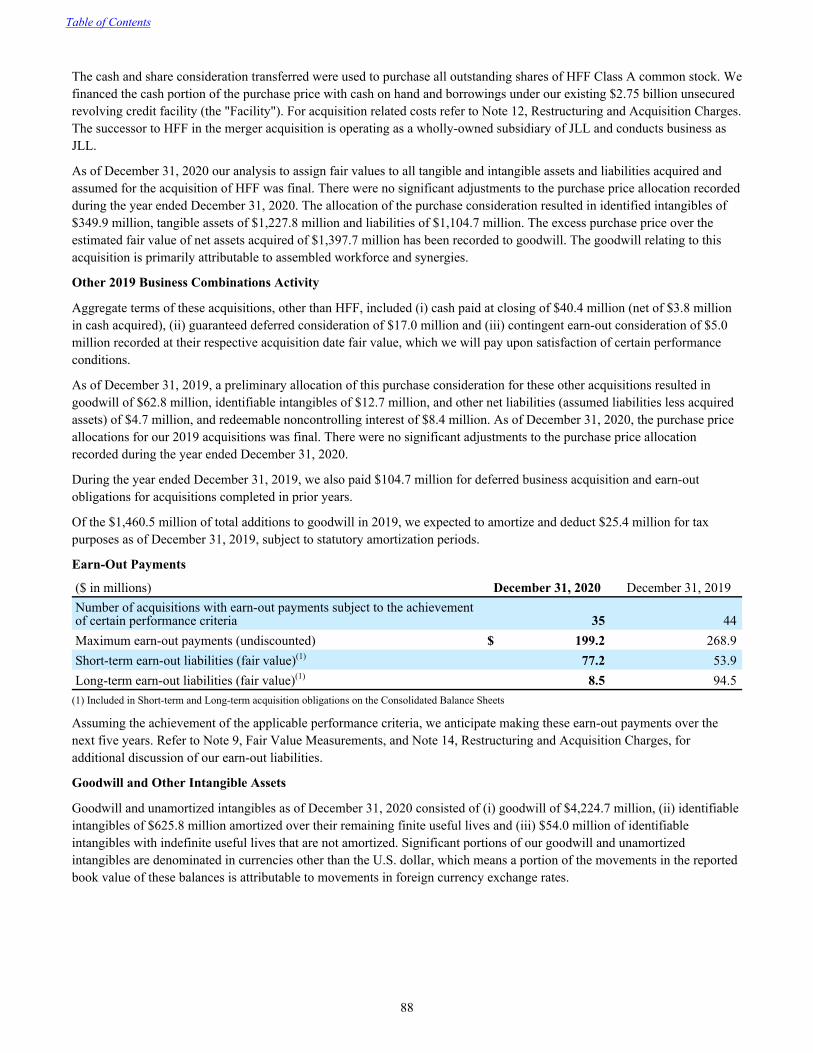
The cash and share consideration transferred were used to purchase all outstanding shares of HFF Class A common stock. We financed the cash portion of the purchase price with cash on hand and borrowings under our existing $2.75 billion unsecured revolving credit facility (the "Facility"). For acquisition related costs refer to Note 12, Restructuring and Acquisition Charges. The successor to HFF in the merger acquisition is operating as a wholly-owned subsidiary of JLL and conducts business as JLL.
As of December 31, 2020 our analysis to assign fair values to all tangible and intangible assets and liabilities acquired and assumed for the acquisition of HFF was final. There were no significant adjustments to the purchase price allocation recorded during the year ended December 31, 2020. The allocation of the purchase consideration resulted in identified intangibles of $349.9 million, tangible assets of $1,227.8 million and liabilities of $1,104.7 million. The excess purchase price over the estimated fair value of net assets acquired of $1,397.7 million has been recorded to goodwill. The goodwill relating to this acquisition is primarily attributable to assembled workforce and synergies.
Other 2019 Business Combinations Activity
Aggregate terms of these acquisitions, other than HFF, included (i) cash paid at closing of $40.4 million (net of $3.8 million in cash acquired), (ii) guaranteed deferred consideration of $17.0 million and (iii) contingent earn-out consideration of $5.0 million recorded at their respective acquisition date fair value, which we will pay upon satisfaction of certain performance conditions.
As of December 31, 2019, a preliminary allocation of this purchase consideration for these other acquisitions resulted in goodwill of $62.8 million, identifiable intangibles of $12.7 million, and other net liabilities (assumed liabilities less acquired assets) of $4.7 million, and redeemable noncontrolling interest of $8.4 million. As of December 31, 2020, the purchase price allocations for our 2019 acquisitions was final. There were no significant adjustments to the purchase price allocation recorded during the year ended December 31, 2020.
During the year ended December 31, 2019, we also paid $104.7 million for deferred business acquisition and earn-out obligations for acquisitions completed in prior years.
Of the $1,460.5 million of total additions to goodwill in 2019, we expected to amortize and deduct $25.4 million for tax purposes as of December 31, 2019, subject to statutory amortization periods.
Earn-Out Payments
($ in millions) December 31, 2020 December 31, 2019Number of acquisitions with earn-out payments subject to the achievement of certain performance criteria 35 44 Maximum earn-out payments (undiscounted) $ 199.2 268.9 Short-term earn-out liabilities (fair value)(1) 77.2 53.9 Long-term earn-out liabilities (fair value)(1) 8.5 94.5
(1) Included in Short-term and Long-term acquisition obligations on the Consolidated Balance Sheets
Assuming the achievement of the applicable performance criteria, we anticipate making these earn-out payments over the next five years. Refer to Note 9, Fair Value Measurements, and Note 14, Restructuring and Acquisition Charges, for additional discussion of our earn-out liabilities.
Goodwill and Other Intangible Assets
Goodwill and unamortized intangibles as of December 31, 2020 consisted of (i) goodwill of $4,224.7 million, (ii) identifiable intangibles of $625.8 million amortized over their remaining finite useful lives and (iii) $54.0 million of identifiable intangibles with indefinite useful lives that are not amortized. Significant portions of our goodwill and unamortized intangibles are denominated in currencies other than the U.S. dollar, which means a portion of the movements in the reported book value of these balances is attributable to movements in foreign currency exchange rates.
Table of Contents
88
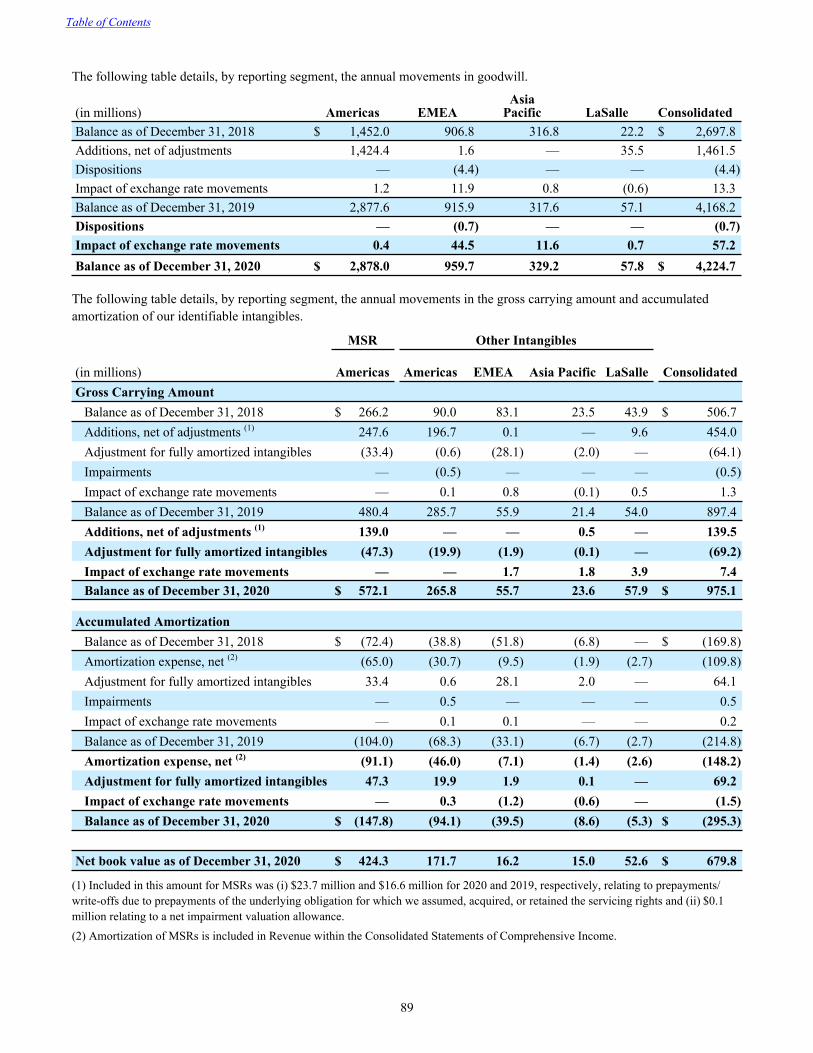
The following table details, by reporting segment, the annual movements in goodwill.
(in millions) Americas EMEAAsia
Pacific LaSalle ConsolidatedBalance as of December 31, 2018 $ 1,452.0 906.8 316.8 22.2 $ 2,697.8 Additions, net of adjustments 1,424.4 1.6 — 35.5 1,461.5 Dispositions — (4.4) — — (4.4) Impact of exchange rate movements 1.2 11.9 0.8 (0.6) 13.3 Balance as of December 31, 2019 2,877.6 915.9 317.6 57.1 4,168.2 Dispositions — (0.7) — — (0.7) Impact of exchange rate movements 0.4 44.5 11.6 0.7 57.2 Balance as of December 31, 2020 $ 2,878.0 959.7 329.2 57.8 $ 4,224.7
The following table details, by reporting segment, the annual movements in the gross carrying amount and accumulated amortization of our identifiable intangibles.
MSR Other Intangibles
(in millions) Americas Americas EMEA Asia Pacific LaSalle ConsolidatedGross Carrying Amount
Balance as of December 31, 2018 $ 266.2 90.0 83.1 23.5 43.9 $ 506.7 Additions, net of adjustments (1) 247.6 196.7 0.1 — 9.6 454.0 Adjustment for fully amortized intangibles (33.4) (0.6) (28.1) (2.0) — (64.1) Impairments — (0.5) — — — (0.5) Impact of exchange rate movements — 0.1 0.8 (0.1) 0.5 1.3 Balance as of December 31, 2019 480.4 285.7 55.9 21.4 54.0 897.4 Additions, net of adjustments (1) 139.0 — — 0.5 — 139.5 Adjustment for fully amortized intangibles (47.3) (19.9) (1.9) (0.1) — (69.2) Impact of exchange rate movements — — 1.7 1.8 3.9 7.4 Balance as of December 31, 2020 $ 572.1 265.8 55.7 23.6 57.9 $ 975.1
Accumulated Amortization Balance as of December 31, 2018 $ (72.4) (38.8) (51.8) (6.8) — $ (169.8) Amortization expense, net (2) (65.0) (30.7) (9.5) (1.9) (2.7) (109.8) Adjustment for fully amortized intangibles 33.4 0.6 28.1 2.0 — 64.1 Impairments — 0.5 — — — 0.5 Impact of exchange rate movements — 0.1 0.1 — — 0.2 Balance as of December 31, 2019 (104.0) (68.3) (33.1) (6.7) (2.7) (214.8) Amortization expense, net (2) (91.1) (46.0) (7.1) (1.4) (2.6) (148.2) Adjustment for fully amortized intangibles 47.3 19.9 1.9 0.1 — 69.2 Impact of exchange rate movements — 0.3 (1.2) (0.6) — (1.5) Balance as of December 31, 2020 $ (147.8) (94.1) (39.5) (8.6) (5.3) $ (295.3)
Net book value as of December 31, 2020 $ 424.3 171.7 16.2 15.0 52.6 $ 679.8
(1) Included in this amount for MSRs was (i) $23.7 million and $16.6 million for 2020 and 2019, respectively, relating to prepayments/write-offs due to prepayments of the underlying obligation for which we assumed, acquired, or retained the servicing rights and (ii) $0.1 million relating to a net impairment valuation allowance.(2) Amortization of MSRs is included in Revenue within the Consolidated Statements of Comprehensive Income.
Table of Contents
89
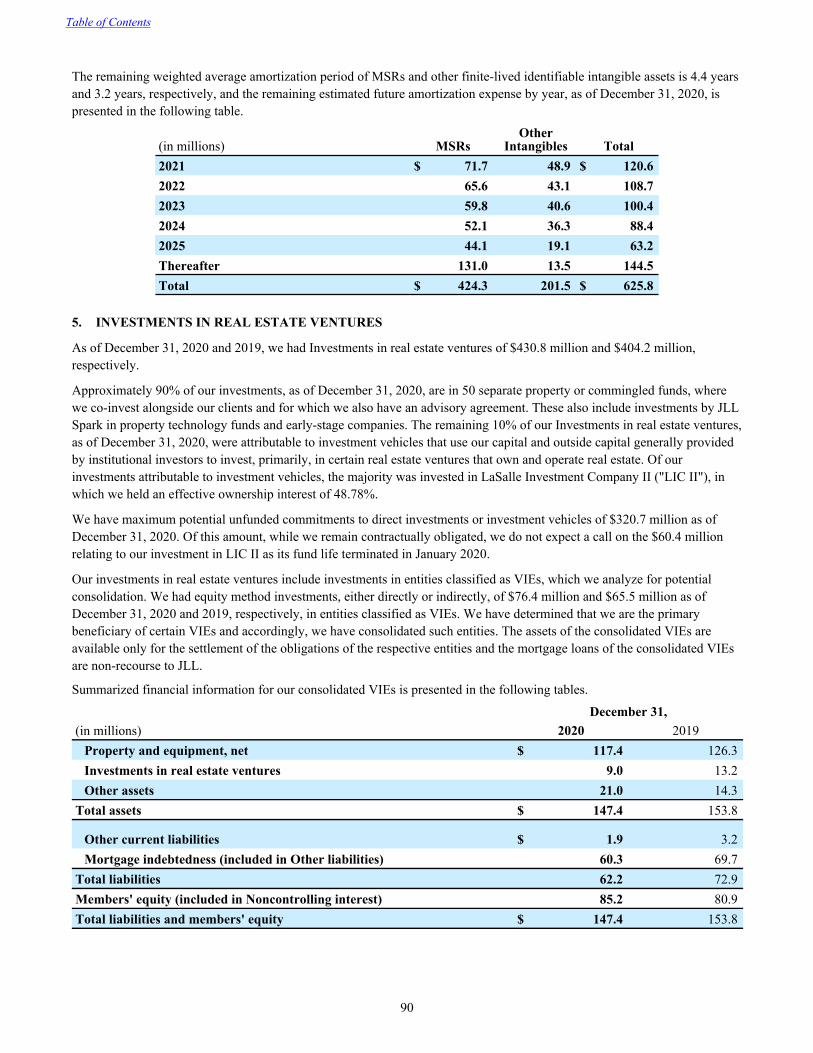
The remaining weighted average amortization period of MSRs and other finite-lived identifiable intangible assets is 4.4 years and 3.2 years, respectively, and the remaining estimated future amortization expense by year, as of December 31, 2020, is presented in the following table.
(in millions) MSRsOther
Intangibles Total2021 $ 71.7 48.9 $ 120.6 2022 65.6 43.1 108.7 2023 59.8 40.6 100.4 2024 52.1 36.3 88.4 2025 44.1 19.1 63.2 Thereafter 131.0 13.5 144.5 Total $ 424.3 201.5 $ 625.8
5. INVESTMENTS IN REAL ESTATE VENTURES
As of December 31, 2020 and 2019, we had Investments in real estate ventures of $430.8 million and $404.2 million, respectively.
Approximately 90% of our investments, as of December 31, 2020, are in 50 separate property or commingled funds, where we co-invest alongside our clients and for which we also have an advisory agreement. These also include investments by JLL Spark in property technology funds and early-stage companies. The remaining 10% of our Investments in real estate ventures, as of December 31, 2020, were attributable to investment vehicles that use our capital and outside capital generally provided by institutional investors to invest, primarily, in certain real estate ventures that own and operate real estate. Of our investments attributable to investment vehicles, the majority was invested in LaSalle Investment Company II ("LIC II"), in which we held an effective ownership interest of 48.78%.
We have maximum potential unfunded commitments to direct investments or investment vehicles of $320.7 million as of December 31, 2020. Of this amount, while we remain contractually obligated, we do not expect a call on the $60.4 million relating to our investment in LIC II as its fund life terminated in January 2020.
Our investments in real estate ventures include investments in entities classified as VIEs, which we analyze for potential consolidation. We had equity method investments, either directly or indirectly, of $76.4 million and $65.5 million as of December 31, 2020 and 2019, respectively, in entities classified as VIEs. We have determined that we are the primary beneficiary of certain VIEs and accordingly, we have consolidated such entities. The assets of the consolidated VIEs are available only for the settlement of the obligations of the respective entities and the mortgage loans of the consolidated VIEs are non-recourse to JLL.
Summarized financial information for our consolidated VIEs is presented in the following tables.
December 31,(in millions) 2020 2019
Property and equipment, net $ 117.4 126.3 Investments in real estate ventures 9.0 13.2 Other assets 21.0 14.3
Total assets $ 147.4 153.8
Other current liabilities $ 1.9 3.2 Mortgage indebtedness (included in Other liabilities) 60.3 69.7
Total liabilities 62.2 72.9 Members' equity (included in Noncontrolling interest) 85.2 80.9 Total liabilities and members' equity $ 147.4 153.8
Table of Contents
90
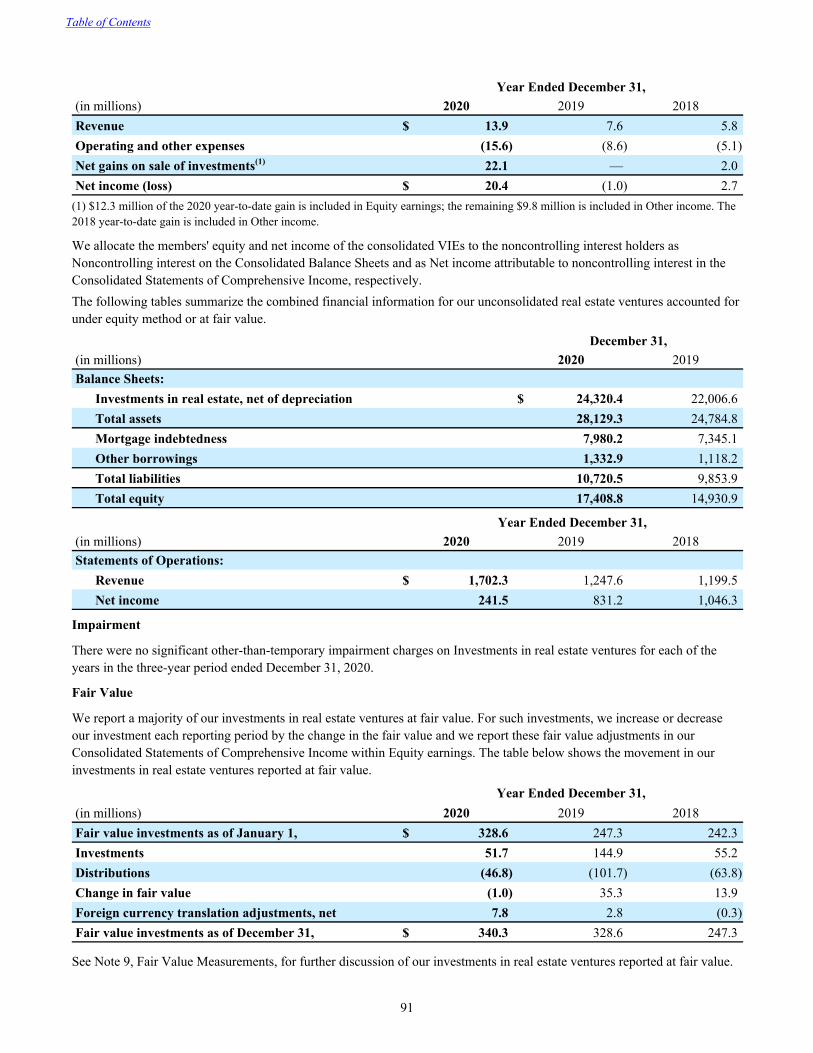
Year Ended December 31,(in millions) 2020 2019 2018Revenue $ 13.9 7.6 5.8 Operating and other expenses (15.6) (8.6) (5.1) Net gains on sale of investments(1) 22.1 — 2.0 Net income (loss) $ 20.4 (1.0) 2.7
(1) $12.3 million of the 2020 year-to-date gain is included in Equity earnings; the remaining $9.8 million is included in Other income. The 2018 year-to-date gain is included in Other income.
We allocate the members' equity and net income of the consolidated VIEs to the noncontrolling interest holders as Noncontrolling interest on the Consolidated Balance Sheets and as Net income attributable to noncontrolling interest in the Consolidated Statements of Comprehensive Income, respectively.The following tables summarize the combined financial information for our unconsolidated real estate ventures accounted for under equity method or at fair value.
December 31,(in millions) 2020 2019Balance Sheets:
Investments in real estate, net of depreciation $ 24,320.4 22,006.6 Total assets 28,129.3 24,784.8 Mortgage indebtedness 7,980.2 7,345.1 Other borrowings 1,332.9 1,118.2 Total liabilities 10,720.5 9,853.9 Total equity 17,408.8 14,930.9
Year Ended December 31,(in millions) 2020 2019 2018Statements of Operations:
Revenue $ 1,702.3 1,247.6 1,199.5 Net income 241.5 831.2 1,046.3
Impairment
There were no significant other-than-temporary impairment charges on Investments in real estate ventures for each of the years in the three-year period ended December 31, 2020.
Fair Value
We report a majority of our investments in real estate ventures at fair value. For such investments, we increase or decrease our investment each reporting period by the change in the fair value and we report these fair value adjustments in our Consolidated Statements of Comprehensive Income within Equity earnings. The table below shows the movement in our investments in real estate ventures reported at fair value.
Year Ended December 31,(in millions) 2020 2019 2018Fair value investments as of January 1, $ 328.6 247.3 242.3 Investments 51.7 144.9 55.2 Distributions (46.8) (101.7) (63.8) Change in fair value (1.0) 35.3 13.9 Foreign currency translation adjustments, net 7.8 2.8 (0.3) Fair value investments as of December 31, $ 340.3 328.6 247.3
See Note 9, Fair Value Measurements, for further discussion of our investments in real estate ventures reported at fair value.
Table of Contents
91
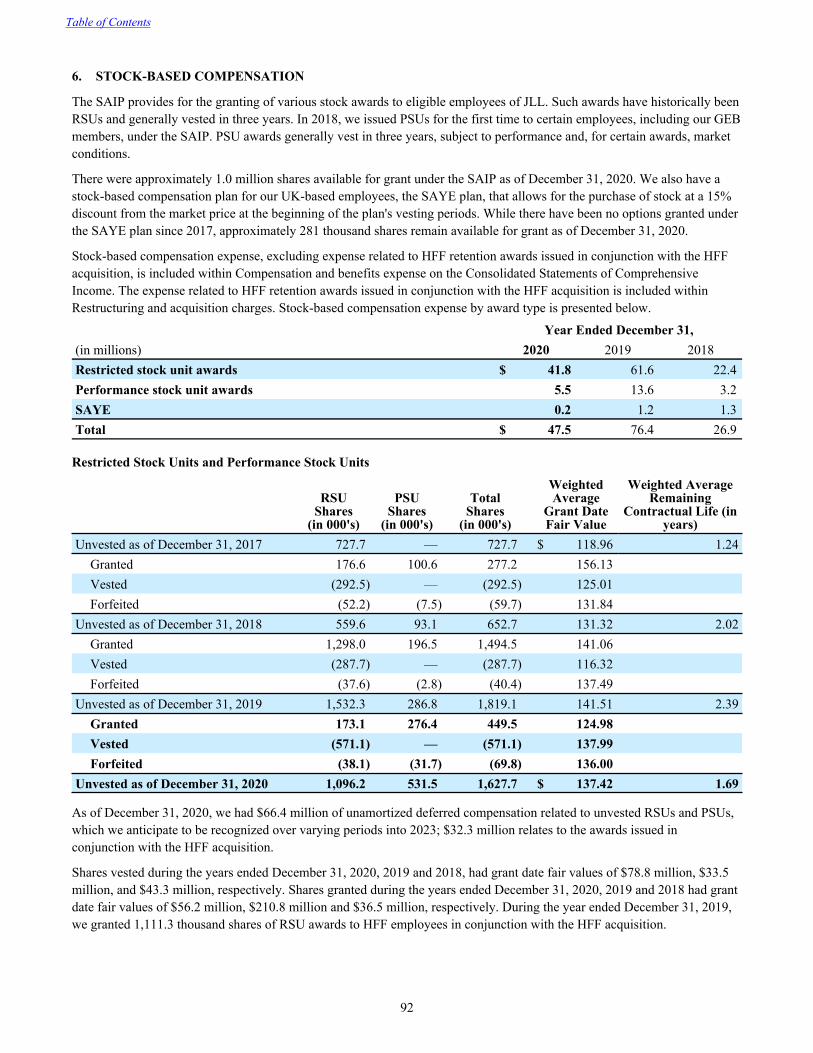
6. STOCK-BASED COMPENSATION
The SAIP provides for the granting of various stock awards to eligible employees of JLL. Such awards have historically been RSUs and generally vested in three years. In 2018, we issued PSUs for the first time to certain employees, including our GEB members, under the SAIP. PSU awards generally vest in three years, subject to performance and, for certain awards, market conditions.
There were approximately 1.0 million shares available for grant under the SAIP as of December 31, 2020. We also have a stock-based compensation plan for our UK-based employees, the SAYE plan, that allows for the purchase of stock at a 15% discount from the market price at the beginning of the plan's vesting periods. While there have been no options granted under the SAYE plan since 2017, approximately 281 thousand shares remain available for grant as of December 31, 2020.
Stock-based compensation expense, excluding expense related to HFF retention awards issued in conjunction with the HFF acquisition, is included within Compensation and benefits expense on the Consolidated Statements of Comprehensive Income. The expense related to HFF retention awards issued in conjunction with the HFF acquisition is included within Restructuring and acquisition charges. Stock-based compensation expense by award type is presented below.
Year Ended December 31,(in millions) 2020 2019 2018Restricted stock unit awards $ 41.8 61.6 22.4 Performance stock unit awards 5.5 13.6 3.2 SAYE 0.2 1.2 1.3 Total $ 47.5 76.4 26.9
Restricted Stock Units and Performance Stock Units
RSU Shares
(in 000's)
PSU Shares
(in 000's)
Total Shares
(in 000's)
Weighted Average
Grant DateFair Value
Weighted AverageRemaining
Contractual Life (in years)
Unvested as of December 31, 2017 727.7 — 727.7 $ 118.96 1.24Granted 176.6 100.6 277.2 156.13 Vested (292.5) — (292.5) 125.01 Forfeited (52.2) (7.5) (59.7) 131.84
Unvested as of December 31, 2018 559.6 93.1 652.7 131.32 2.02Granted 1,298.0 196.5 1,494.5 141.06 Vested (287.7) — (287.7) 116.32 Forfeited (37.6) (2.8) (40.4) 137.49
Unvested as of December 31, 2019 1,532.3 286.8 1,819.1 141.51 2.39Granted 173.1 276.4 449.5 124.98 Vested (571.1) — (571.1) 137.99 Forfeited (38.1) (31.7) (69.8) 136.00
Unvested as of December 31, 2020 1,096.2 531.5 1,627.7 $ 137.42 1.69
As of December 31, 2020, we had $66.4 million of unamortized deferred compensation related to unvested RSUs and PSUs, which we anticipate to be recognized over varying periods into 2023; $32.3 million relates to the awards issued in conjunction with the HFF acquisition.
Shares vested during the years ended December 31, 2020, 2019 and 2018, had grant date fair values of $78.8 million, $33.5 million, and $43.3 million, respectively. Shares granted during the years ended December 31, 2020, 2019 and 2018 had grant date fair values of $56.2 million, $210.8 million and $36.5 million, respectively. During the year ended December 31, 2019, we granted 1,111.3 thousand shares of RSU awards to HFF employees in conjunction with the HFF acquisition.
Table of Contents
92
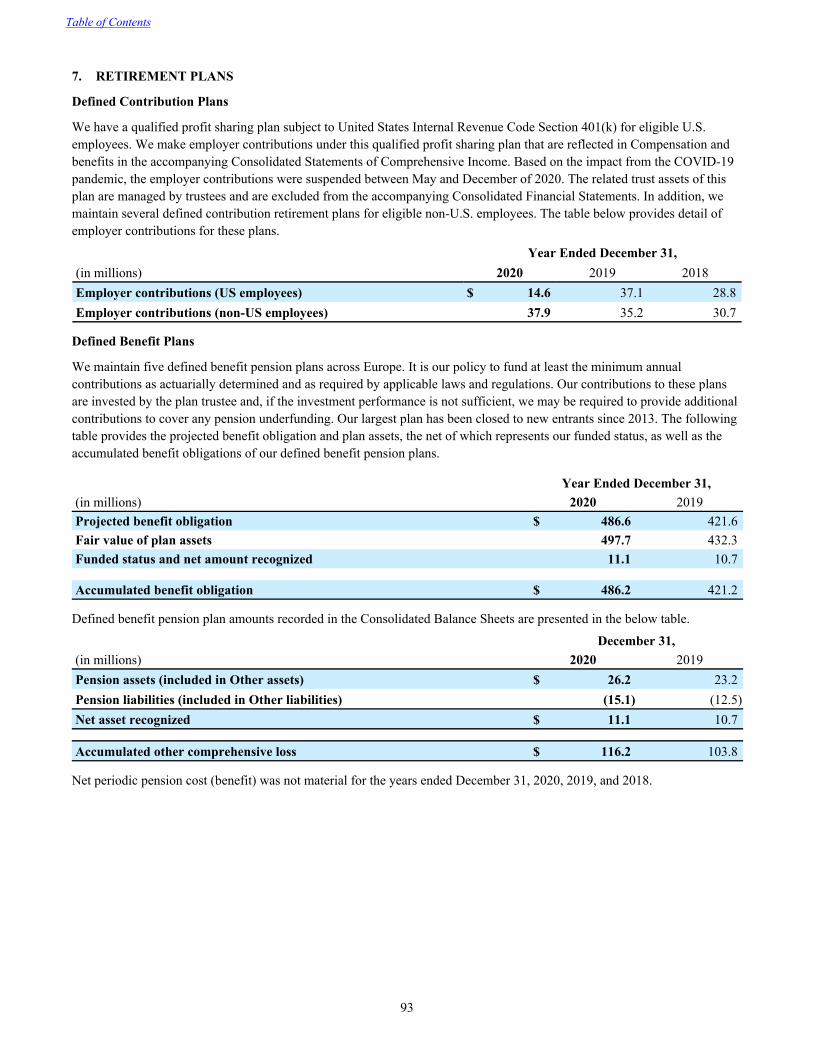
7. RETIREMENT PLANS
Defined Contribution Plans
We have a qualified profit sharing plan subject to United States Internal Revenue Code Section 401(k) for eligible U.S. employees. We make employer contributions under this qualified profit sharing plan that are reflected in Compensation and benefits in the accompanying Consolidated Statements of Comprehensive Income. Based on the impact from the COVID-19 pandemic, the employer contributions were suspended between May and December of 2020. The related trust assets of this plan are managed by trustees and are excluded from the accompanying Consolidated Financial Statements. In addition, we maintain several defined contribution retirement plans for eligible non-U.S. employees. The table below provides detail of employer contributions for these plans.
Year Ended December 31,(in millions) 2020 2019 2018Employer contributions (US employees) $ 14.6 37.1 28.8 Employer contributions (non-US employees) 37.9 35.2 30.7
Defined Benefit Plans
We maintain five defined benefit pension plans across Europe. It is our policy to fund at least the minimum annual contributions as actuarially determined and as required by applicable laws and regulations. Our contributions to these plans are invested by the plan trustee and, if the investment performance is not sufficient, we may be required to provide additional contributions to cover any pension underfunding. Our largest plan has been closed to new entrants since 2013. The following table provides the projected benefit obligation and plan assets, the net of which represents our funded status, as well as the accumulated benefit obligations of our defined benefit pension plans.
Year Ended December 31,(in millions) 2020 2019Projected benefit obligation $ 486.6 421.6 Fair value of plan assets 497.7 432.3 Funded status and net amount recognized 11.1 10.7
Accumulated benefit obligation $ 486.2 421.2
Defined benefit pension plan amounts recorded in the Consolidated Balance Sheets are presented in the below table.
December 31,(in millions) 2020 2019Pension assets (included in Other assets) $ 26.2 23.2 Pension liabilities (included in Other liabilities) (15.1) (12.5) Net asset recognized $ 11.1 10.7
Accumulated other comprehensive loss $ 116.2 103.8
Net periodic pension cost (benefit) was not material for the years ended December 31, 2020, 2019, and 2018.
Table of Contents
93
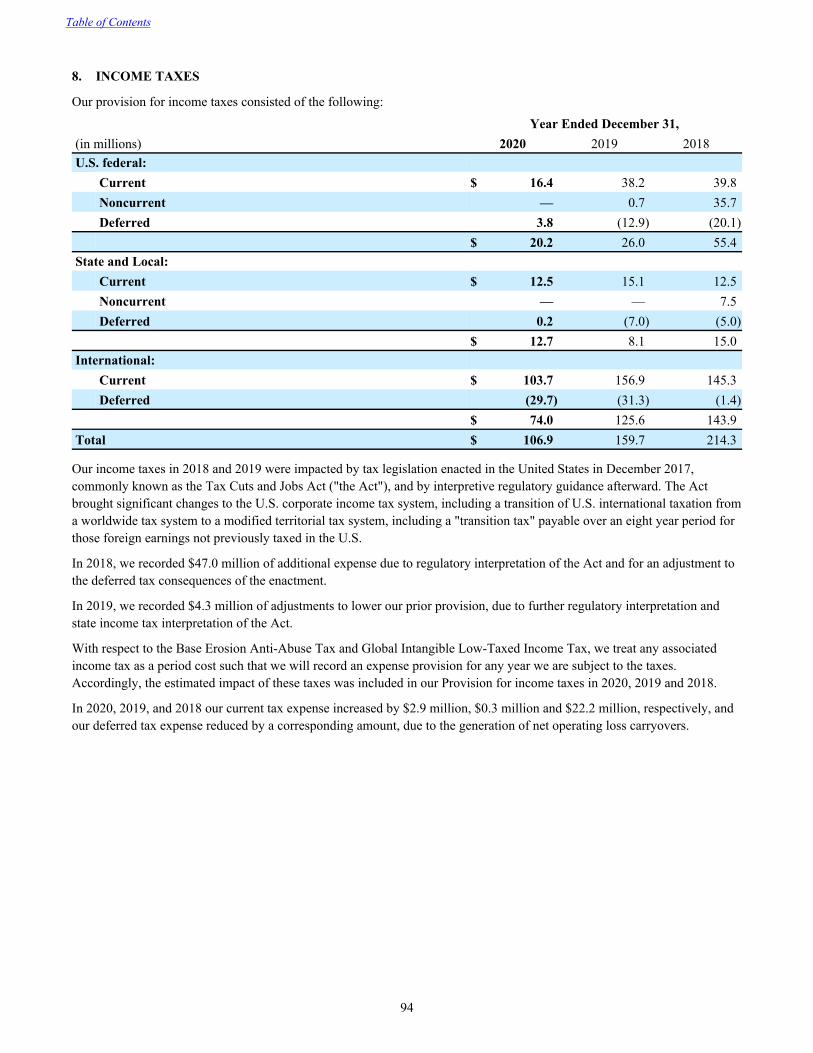
8. INCOME TAXES
Our provision for income taxes consisted of the following:
Year Ended December 31,(in millions) 2020 2019 2018U.S. federal:
Current $ 16.4 38.2 39.8 Noncurrent — 0.7 35.7 Deferred 3.8 (12.9) (20.1)
$ 20.2 26.0 55.4 State and Local:
Current $ 12.5 15.1 12.5 Noncurrent — — 7.5 Deferred 0.2 (7.0) (5.0)
$ 12.7 8.1 15.0 International:
Current $ 103.7 156.9 145.3 Deferred (29.7) (31.3) (1.4)
$ 74.0 125.6 143.9 Total $ 106.9 159.7 214.3
Our income taxes in 2018 and 2019 were impacted by tax legislation enacted in the United States in December 2017, commonly known as the Tax Cuts and Jobs Act ("the Act"), and by interpretive regulatory guidance afterward. The Act brought significant changes to the U.S. corporate income tax system, including a transition of U.S. international taxation from a worldwide tax system to a modified territorial tax system, including a "transition tax" payable over an eight year period for those foreign earnings not previously taxed in the U.S.
In 2018, we recorded $47.0 million of additional expense due to regulatory interpretation of the Act and for an adjustment to the deferred tax consequences of the enactment.
In 2019, we recorded $4.3 million of adjustments to lower our prior provision, due to further regulatory interpretation and state income tax interpretation of the Act.
With respect to the Base Erosion Anti-Abuse Tax and Global Intangible Low-Taxed Income Tax, we treat any associated income tax as a period cost such that we will record an expense provision for any year we are subject to the taxes. Accordingly, the estimated impact of these taxes was included in our Provision for income taxes in 2020, 2019 and 2018.
In 2020, 2019, and 2018 our current tax expense increased by $2.9 million, $0.3 million and $22.2 million, respectively, and our deferred tax expense reduced by a corresponding amount, due to the generation of net operating loss carryovers.
Table of Contents
94

Income tax expense differed from the amounts computed by applying the U.S. federal income tax rate of 21% to earnings before provision for income taxes as a result of the following:
Year Ended December 31,($ in millions) 2020 2019 2018Income tax expense at statutory rates $ 111.2 21.0 % $ 146.5 21.0 % $ 148.3 21.0 %
Increase (reduction) in income taxes from:State and local income taxes, net of federal income tax benefit 9.4 1.8 8.9 1.3 2.8 0.4 Amortization of goodwill and other intangibles (3.3) (0.6) (3.7) (0.5) (3.4) (0.5) Nondeductible expenses 11.2 2.1 18.9 2.7 14.6 2.1 International earnings taxed at various rates (20.5) (3.9) (8.7) (1.3) (21.1) (3.0) Valuation allowances 4.3 0.8 7.2 1.0 12.4 1.8 Transition tax and deferred tax due to the Act — — (4.3) (0.6) 47.0 6.7 Other, net (5.4) (1.0) (5.1) (0.7) 13.7 1.9
Total $ 106.9 20.2 % $ 159.7 22.9 % $ 214.3 30.4 %
With respect to international earnings taxed at varying rates, we have operations which constitute a taxable income presence in 92 countries or other taxable jurisdictions outside of the U.S. which are treated as such by the U.S. Internal Revenue Code. Of those countries or other taxable jurisdictions, 66 had income tax rates lower than the combined U.S. federal and state income tax rate in 2020.
In defining "very low tax rate jurisdictions", we consider effective tax rates which applied in 2020 based upon income levels and including national and municipal, state or provincial taxes also based upon income levels, which may cause those effective rates to differ from the maximum national statutory rates for the jurisdictions. We consider jurisdictions with a tax rate of 25% or lower to be very low tax rate jurisdictions, based upon our historical practice. Effective January 1, 2018, the U.S. federal income tax rate was reduced to 21%. However, factoring in the impact of state income taxes, we do not consider the U.S. to be a very low tax rate jurisdiction. With respect to very low tax rate jurisdictions in which we operate, income from Hong Kong (16.5%), Singapore (17%), the United Kingdom (19%) and Saudi Arabia (20%) represent the most significant components of the international earnings line item in the effective tax rate reconciliation above. In the aggregate, these very low rate jurisdictions were the primary driver of the difference between the actual income tax provision for international earnings and the equivalent provision at the U.S. federal and state statutory rate in 2020.
Our income before taxes from domestic (U.S.) and international sources is presented in the following table.
Year Ended December 31,(in millions) 2020 2019 2018Domestic $ 165.2 145.9 101.3 International 364.4 551.7 604.7 Total $ 529.6 697.6 706.0
Table of Contents
95
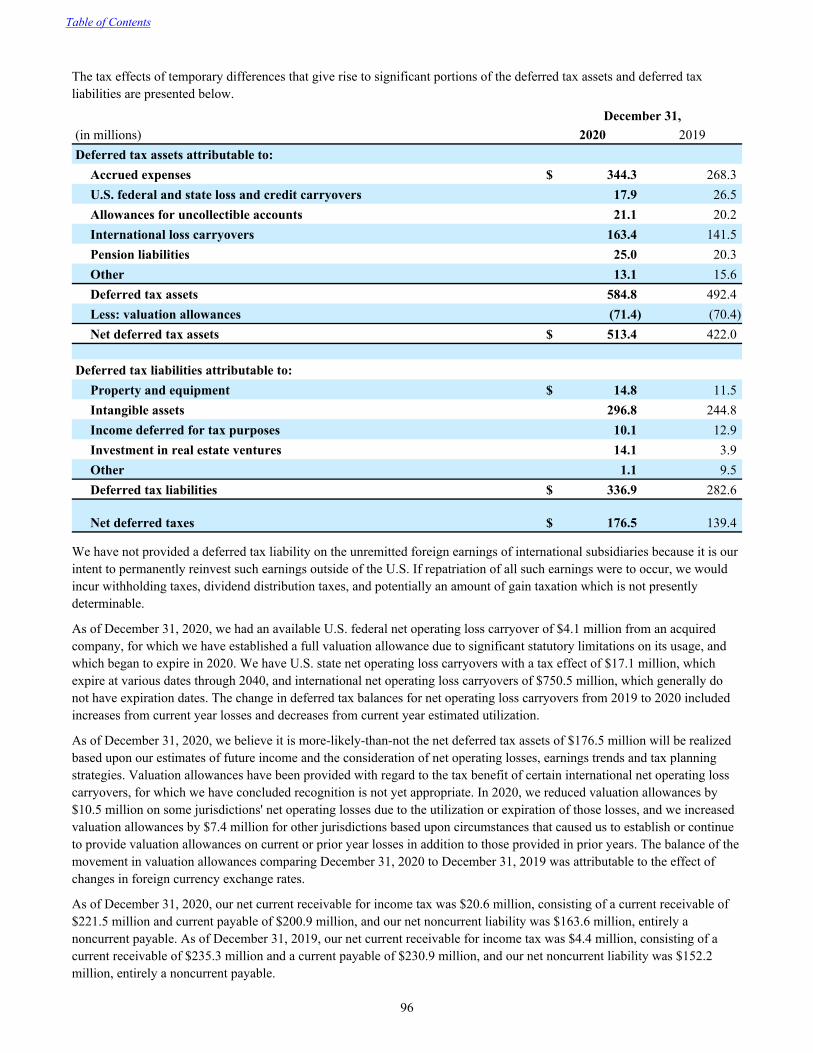
The tax effects of temporary differences that give rise to significant portions of the deferred tax assets and deferred tax liabilities are presented below.
December 31,(in millions) 2020 2019Deferred tax assets attributable to:
Accrued expenses $ 344.3 268.3 U.S. federal and state loss and credit carryovers 17.9 26.5 Allowances for uncollectible accounts 21.1 20.2 International loss carryovers 163.4 141.5 Pension liabilities 25.0 20.3 Other 13.1 15.6 Deferred tax assets 584.8 492.4 Less: valuation allowances (71.4) (70.4) Net deferred tax assets $ 513.4 422.0
Deferred tax liabilities attributable to:Property and equipment $ 14.8 11.5 Intangible assets 296.8 244.8 Income deferred for tax purposes 10.1 12.9 Investment in real estate ventures 14.1 3.9 Other 1.1 9.5 Deferred tax liabilities $ 336.9 282.6
Net deferred taxes $ 176.5 139.4
We have not provided a deferred tax liability on the unremitted foreign earnings of international subsidiaries because it is our intent to permanently reinvest such earnings outside of the U.S. If repatriation of all such earnings were to occur, we would incur withholding taxes, dividend distribution taxes, and potentially an amount of gain taxation which is not presently determinable.
As of December 31, 2020, we had an available U.S. federal net operating loss carryover of $4.1 million from an acquired company, for which we have established a full valuation allowance due to significant statutory limitations on its usage, and which began to expire in 2020. We have U.S. state net operating loss carryovers with a tax effect of $17.1 million, which expire at various dates through 2040, and international net operating loss carryovers of $750.5 million, which generally do not have expiration dates. The change in deferred tax balances for net operating loss carryovers from 2019 to 2020 included increases from current year losses and decreases from current year estimated utilization.
As of December 31, 2020, we believe it is more-likely-than-not the net deferred tax assets of $176.5 million will be realized based upon our estimates of future income and the consideration of net operating losses, earnings trends and tax planning strategies. Valuation allowances have been provided with regard to the tax benefit of certain international net operating loss carryovers, for which we have concluded recognition is not yet appropriate. In 2020, we reduced valuation allowances by $10.5 million on some jurisdictions' net operating losses due to the utilization or expiration of those losses, and we increased valuation allowances by $7.4 million for other jurisdictions based upon circumstances that caused us to establish or continue to provide valuation allowances on current or prior year losses in addition to those provided in prior years. The balance of the movement in valuation allowances comparing December 31, 2020 to December 31, 2019 was attributable to the effect of changes in foreign currency exchange rates.
As of December 31, 2020, our net current receivable for income tax was $20.6 million, consisting of a current receivable of $221.5 million and current payable of $200.9 million, and our net noncurrent liability was $163.6 million, entirely a noncurrent payable. As of December 31, 2019, our net current receivable for income tax was $4.4 million, consisting of a current receivable of $235.3 million and a current payable of $230.9 million, and our net noncurrent liability was $152.2 million, entirely a noncurrent payable.
Table of Contents
96
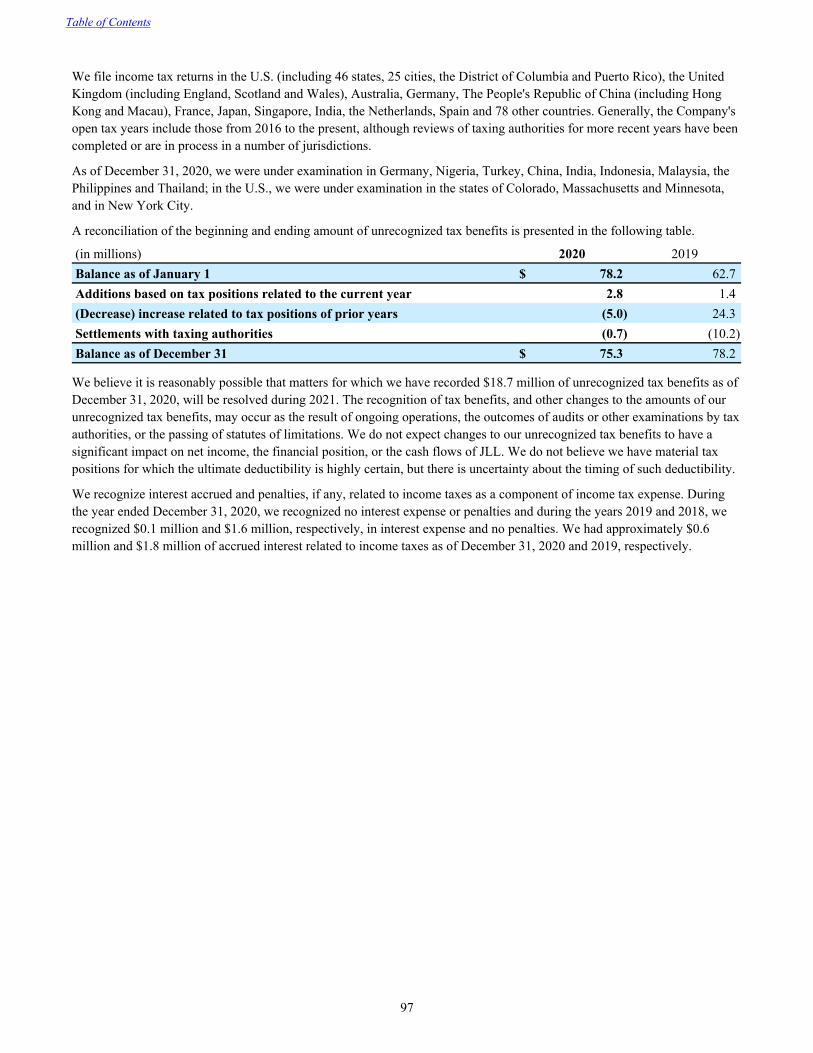
We file income tax returns in the U.S. (including 46 states, 25 cities, the District of Columbia and Puerto Rico), the United Kingdom (including England, Scotland and Wales), Australia, Germany, The People's Republic of China (including Hong Kong and Macau), France, Japan, Singapore, India, the Netherlands, Spain and 78 other countries. Generally, the Company's open tax years include those from 2016 to the present, although reviews of taxing authorities for more recent years have been completed or are in process in a number of jurisdictions.
As of December 31, 2020, we were under examination in Germany, Nigeria, Turkey, China, India, Indonesia, Malaysia, the Philippines and Thailand; in the U.S., we were under examination in the states of Colorado, Massachusetts and Minnesota, and in New York City.
A reconciliation of the beginning and ending amount of unrecognized tax benefits is presented in the following table.
(in millions) 2020 2019Balance as of January 1 $ 78.2 62.7 Additions based on tax positions related to the current year 2.8 1.4 (Decrease) increase related to tax positions of prior years (5.0) 24.3 Settlements with taxing authorities (0.7) (10.2) Balance as of December 31 $ 75.3 78.2
We believe it is reasonably possible that matters for which we have recorded $18.7 million of unrecognized tax benefits as of December 31, 2020, will be resolved during 2021. The recognition of tax benefits, and other changes to the amounts of our unrecognized tax benefits, may occur as the result of ongoing operations, the outcomes of audits or other examinations by tax authorities, or the passing of statutes of limitations. We do not expect changes to our unrecognized tax benefits to have a significant impact on net income, the financial position, or the cash flows of JLL. We do not believe we have material tax positions for which the ultimate deductibility is highly certain, but there is uncertainty about the timing of such deductibility.
We recognize interest accrued and penalties, if any, related to income taxes as a component of income tax expense. During the year ended December 31, 2020, we recognized no interest expense or penalties and during the years 2019 and 2018, we recognized $0.1 million and $1.6 million, respectively, in interest expense and no penalties. We had approximately $0.6 million and $1.8 million of accrued interest related to income taxes as of December 31, 2020 and 2019, respectively.
Table of Contents
97
9. FAIR VALUE MEASUREMENTS
We measure certain assets and liabilities in accordance with ASC 820, Fair Value Measurements and Disclosures, which defines fair value as the price that would be received for an asset, or paid to transfer a liability, in an orderly transaction between market participants on the measurement date. In addition, it establishes a framework for measuring fair value according to the following three-tier fair value hierarchy:
• Level 1 - Quoted prices for identical assets or liabilities in active markets accessible as of the measurement date;
• Level 2 - Inputs, other than quoted prices in active markets, that are observable either directly or indirectly; and
• Level 3 - Unobservable inputs in which there is little or no market data, which require the reporting entity to develop its own assumptions.
Financial Instruments
Our financial instruments include Cash and cash equivalents, Trade receivables, Notes and other receivables, Reimbursable receivables, Warehouse receivables, restricted cash, contract assets, Accounts payable, Reimbursable payables, Short-term borrowings, contract liabilities, Warehouse facilities, Credit facility, Long-term debt and foreign currency forward contracts. The carrying amounts of Cash and cash equivalents, Trade receivables, Notes and other receivables, Reimbursable receivables, restricted cash, contract assets, Accounts payable, Reimbursable payables, contract liabilities and the Warehouse facilities approximate their estimated fair values due to the short-term nature of these instruments. The carrying values of our Credit facility and Short-term borrowings approximate their estimated fair values given the variable interest rate terms and market spreads.
We estimated the fair value of our Long-term debt as $723.7 million and $685.9 million as of December 31, 2020 and 2019, respectively, using dealer quotes that are Level 2 inputs in the fair value hierarchy. The carrying value of our Long-term debt was $702.0 million and $664.6 million as of December 31, 2020 and 2019, respectively, which included debt issuance costs of $2.5 million and $3.1 million, respectively.
Investments in Real Estate Ventures at Fair Value - Net Asset Value ("NAV")
For the majority of our investments reported at fair value, we estimate the fair value using the NAV per share (or its equivalent) our investees provide. Critical inputs to NAV estimates included valuations of the underlying real estate assets and borrowings, which incorporate investment-specific assumptions such as discount rates, capitalization rates, rental and expense growth rates, and asset-specific market borrowing rates. In instances where the reported NAV per share did not fully incorporate the COVID-19 pandemic’s impact on the fair value of underlying investments, we recognized an adjustment to decrease the reported NAV. As of December 31, 2020, such adjustments totaled $22.8 million. We did not consider any other adjustments to NAV estimates provided by investees, including adjustments for any restrictions to the transferability of ownership interests embedded within investment agreements to which we are a party, to be necessary based upon (i) our understanding of the methodology utilized and inputs incorporated to estimate NAV at the investee level, (ii) consideration of market demand for the specific types of real estate assets held by each venture and (iii) contemplation of real estate and capital markets conditions in the localities in which these ventures operate. As of December 31, 2020 and 2019, investments in real estate ventures at fair value using NAV were $203.8 million and $224.8 million, respectively. As these investments are not required to be classified in the fair value hierarchy, they have been excluded from the following table.
Table of Contents
98
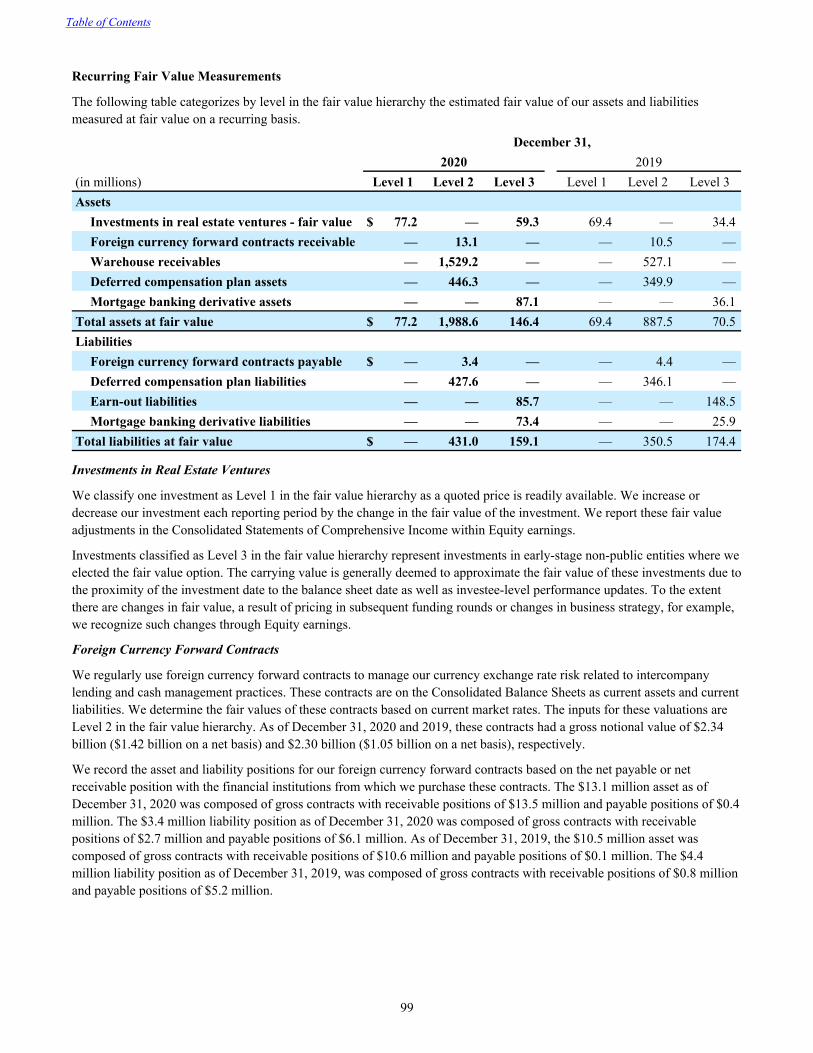
Recurring Fair Value Measurements
The following table categorizes by level in the fair value hierarchy the estimated fair value of our assets and liabilities measured at fair value on a recurring basis.
December 31,2020 2019
(in millions) Level 1 Level 2 Level 3 Level 1 Level 2 Level 3Assets
Investments in real estate ventures - fair value $ 77.2 — 59.3 69.4 — 34.4 Foreign currency forward contracts receivable — 13.1 — — 10.5 — Warehouse receivables — 1,529.2 — — 527.1 — Deferred compensation plan assets — 446.3 — — 349.9 — Mortgage banking derivative assets — — 87.1 — — 36.1
Total assets at fair value $ 77.2 1,988.6 146.4 69.4 887.5 70.5 Liabilities
Foreign currency forward contracts payable $ — 3.4 — — 4.4 — Deferred compensation plan liabilities — 427.6 — — 346.1 — Earn-out liabilities — — 85.7 — — 148.5 Mortgage banking derivative liabilities — — 73.4 — — 25.9
Total liabilities at fair value $ — 431.0 159.1 — 350.5 174.4
Investments in Real Estate Ventures
We classify one investment as Level 1 in the fair value hierarchy as a quoted price is readily available. We increase or decrease our investment each reporting period by the change in the fair value of the investment. We report these fair value adjustments in the Consolidated Statements of Comprehensive Income within Equity earnings.
Investments classified as Level 3 in the fair value hierarchy represent investments in early-stage non-public entities where we elected the fair value option. The carrying value is generally deemed to approximate the fair value of these investments due to the proximity of the investment date to the balance sheet date as well as investee-level performance updates. To the extent there are changes in fair value, a result of pricing in subsequent funding rounds or changes in business strategy, for example, we recognize such changes through Equity earnings.
Foreign Currency Forward Contracts
We regularly use foreign currency forward contracts to manage our currency exchange rate risk related to intercompany lending and cash management practices. These contracts are on the Consolidated Balance Sheets as current assets and current liabilities. We determine the fair values of these contracts based on current market rates. The inputs for these valuations are Level 2 in the fair value hierarchy. As of December 31, 2020 and 2019, these contracts had a gross notional value of $2.34 billion ($1.42 billion on a net basis) and $2.30 billion ($1.05 billion on a net basis), respectively.
We record the asset and liability positions for our foreign currency forward contracts based on the net payable or net receivable position with the financial institutions from which we purchase these contracts. The $13.1 million asset as of December 31, 2020 was composed of gross contracts with receivable positions of $13.5 million and payable positions of $0.4 million. The $3.4 million liability position as of December 31, 2020 was composed of gross contracts with receivable positions of $2.7 million and payable positions of $6.1 million. As of December 31, 2019, the $10.5 million asset was composed of gross contracts with receivable positions of $10.6 million and payable positions of $0.1 million. The $4.4 million liability position as of December 31, 2019, was composed of gross contracts with receivable positions of $0.8 million and payable positions of $5.2 million.
Table of Contents
99
Warehouse Receivables
The fair value of the Warehouse receivables is based on already locked-in security-buy prices. As of December 31, 2020 and 2019, all of our Warehouse receivables included in the Consolidated Balance Sheets were under commitment to be purchased by government-sponsored enterprises ("GSEs") or by a qualifying investor as part of a U.S. government or GSE mortgage-backed security program. The Warehouse receivables are classified as Level 2 in the fair value hierarchy as all significant inputs are readily observable.
Deferred Compensation Plan
We maintain a deferred compensation plan for certain of our U.S. employees that allows them to defer portions of their compensation. We invest directly in insurance contracts which yield returns to fund these deferred compensation obligations. We recognize an asset for the amount that could be realized under these insurance contracts as of the balance sheet date, and we adjust the deferred compensation obligation to reflect the changes in the fair value of the amount owed to the employees. The inputs for this valuation are Level 2 in the fair value hierarchy. We recorded this plan on the Consolidated Balance Sheets as of December 31, 2020 as Deferred compensation plan assets of $446.3 million, long-term deferred compensation plan liabilities of $427.6 million, included in Deferred compensation, and as a reduction of equity, Shares held in trust, of $5.6 million. We recorded this plan on the Consolidated Balance Sheets as of December 31, 2019 as Deferred compensation plan assets of $349.9 million, long-term deferred compensation plan liabilities of $346.1 million, included in Deferred compensation, and as a reduction of equity, Shares held in trust, of $5.7 million.
Earn-Out Liabilities
We classify our Earn-out liabilities within Level 3 in the fair value hierarchy because the inputs we use to develop the estimated fair value include unobservable inputs. We base the fair value of our Earn-out liabilities on the present value of probability-weighted future cash flows related to the earn-out performance criteria on each reporting date. We determine the probabilities of achievement we assign to the performance criteria based on the due diligence we performed at the time of acquisition as well as actual performance achieved subsequent to acquisition. An increase to a probability of achievement would result in a higher fair value measurement. See Note 4, Business Combinations, Goodwill and Other Intangible Assets, for additional discussion of our Earn-out liabilities.
Mortgage Banking Derivatives
In the normal course of business, we enter into simultaneous contractual commitments to originate and sell multi-family mortgage loans at fixed prices with fixed expiration dates. Commitments to borrowers become effective when the borrowers "lock-in" a specified interest rate and maximum principal balance for an established time frame (hereinafter referred to as an interest rate lock commitment or "IRLC"). All mortgagors are evaluated for creditworthiness prior to execution of an IRLC.
We are exposed to market interest risk (the risk of movement in market interest rates following the execution of an IRLC) until a loan is funded and onwards through delivery. To mitigate the effect of the interest rate risk inherent in providing IRLCs to borrowers, we simultaneously enter into a forward commitment to sell the eventual loan associated with the IRLC to a GSE or other investor. Similar to the IRLC, the forward sale commitment locks in an interest rate, maximum principal balance, and price for the sale of the loan. Ultimately, the terms of the forward sale commitment and the IRLC are matched in substantially all respects, with the objective of eliminating market interest rate and other balance sheet risk to the extent practical. As an additional element of protection, forward sale commitments extend for a longer period of time as compared to IRLCs to allow, among other things, for the closing of the loan and processing of paperwork to deliver the loan in accordance with the terms of the sale commitment.
The fair value of our IRLCs to prospective borrowers and the related inputs primarily include, as applicable, the expected net cash flows associated with servicing the loan and the effects of interest rate movements between the date of the IRLC and the balance sheet date based on applicable published U.S. Treasury rates.
The fair value of our forward sales contracts to prospective investors considers the market price movement of a similar security between the trade date and the balance sheet date. The market price changes are multiplied by the notional amount of the forward sales contracts to measure the fair value.
Table of Contents
100
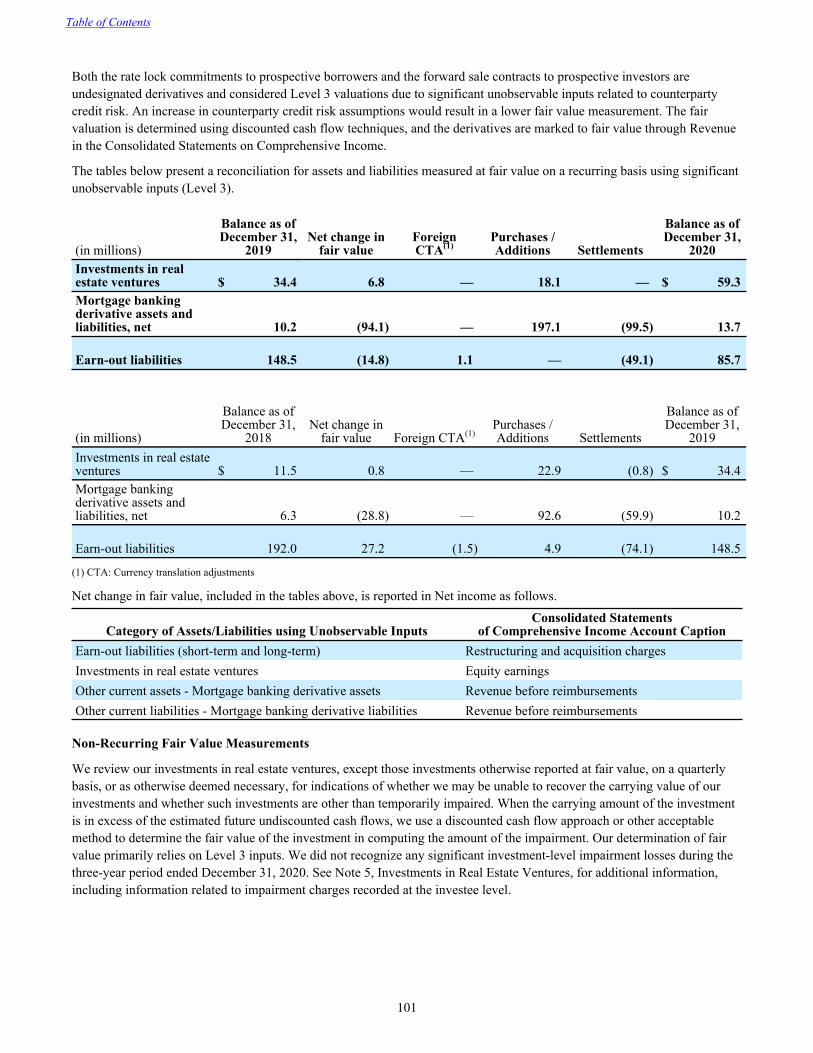
Both the rate lock commitments to prospective borrowers and the forward sale contracts to prospective investors are undesignated derivatives and considered Level 3 valuations due to significant unobservable inputs related to counterparty credit risk. An increase in counterparty credit risk assumptions would result in a lower fair value measurement. The fair valuation is determined using discounted cash flow techniques, and the derivatives are marked to fair value through Revenue in the Consolidated Statements on Comprehensive Income.
The tables below present a reconciliation for assets and liabilities measured at fair value on a recurring basis using significant unobservable inputs (Level 3).
(in millions)
Balance as of December 31,
2019Net change in
fair valueForeign CTA(1)
Purchases / Additions Settlements
Balance as of December 31,
2020Investments in real estate ventures $ 34.4 6.8 — 18.1 — $ 59.3 Mortgage banking derivative assets and liabilities, net 10.2 (94.1) — 197.1 (99.5) 13.7
Earn-out liabilities 148.5 (14.8) 1.1 — (49.1) 85.7
(in millions)
Balance as of December 31,
2018Net change in
fair value Foreign CTA(1)Purchases / Additions Settlements
Balance as of December 31,
2019Investments in real estate ventures $ 11.5 0.8 — 22.9 (0.8) $ 34.4 Mortgage banking derivative assets and liabilities, net 6.3 (28.8) — 92.6 (59.9) 10.2
Earn-out liabilities 192.0 27.2 (1.5) 4.9 (74.1) 148.5
(1) CTA: Currency translation adjustments
Net change in fair value, included in the tables above, is reported in Net income as follows.
Category of Assets/Liabilities using Unobservable InputsConsolidated Statements
of Comprehensive Income Account CaptionEarn-out liabilities (short-term and long-term) Restructuring and acquisition chargesInvestments in real estate ventures Equity earningsOther current assets - Mortgage banking derivative assets Revenue before reimbursementsOther current liabilities - Mortgage banking derivative liabilities Revenue before reimbursements
Non-Recurring Fair Value Measurements
We review our investments in real estate ventures, except those investments otherwise reported at fair value, on a quarterly basis, or as otherwise deemed necessary, for indications of whether we may be unable to recover the carrying value of our investments and whether such investments are other than temporarily impaired. When the carrying amount of the investment is in excess of the estimated future undiscounted cash flows, we use a discounted cash flow approach or other acceptable method to determine the fair value of the investment in computing the amount of the impairment. Our determination of fair value primarily relies on Level 3 inputs. We did not recognize any significant investment-level impairment losses during the three-year period ended December 31, 2020. See Note 5, Investments in Real Estate Ventures, for additional information, including information related to impairment charges recorded at the investee level.
Table of Contents
101
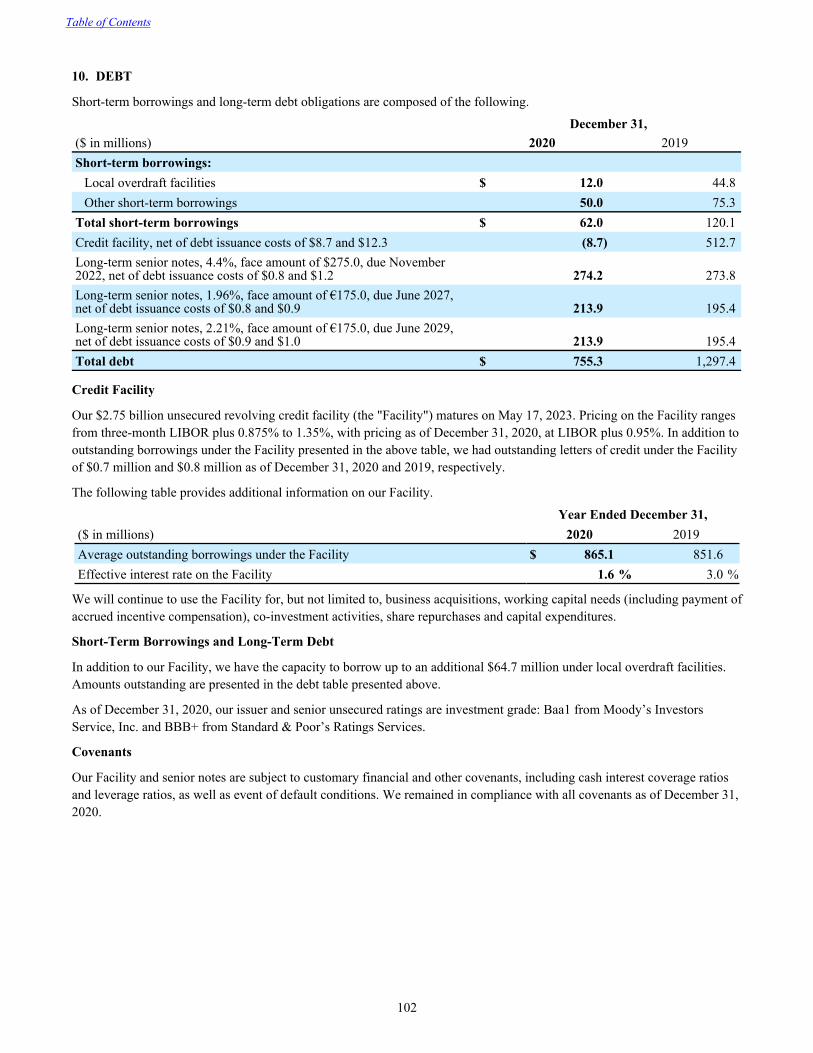
10. DEBT
Short-term borrowings and long-term debt obligations are composed of the following.
December 31,($ in millions) 2020 2019Short-term borrowings:
Local overdraft facilities $ 12.0 44.8 Other short-term borrowings 50.0 75.3
Total short-term borrowings $ 62.0 120.1 Credit facility, net of debt issuance costs of $8.7 and $12.3 (8.7) 512.7 Long-term senior notes, 4.4%, face amount of $275.0, due November 2022, net of debt issuance costs of $0.8 and $1.2 274.2 273.8 Long-term senior notes, 1.96%, face amount of €175.0, due June 2027, net of debt issuance costs of $0.8 and $0.9 213.9 195.4 Long-term senior notes, 2.21%, face amount of €175.0, due June 2029, net of debt issuance costs of $0.9 and $1.0 213.9 195.4 Total debt $ 755.3 1,297.4
Credit Facility
Our $2.75 billion unsecured revolving credit facility (the "Facility") matures on May 17, 2023. Pricing on the Facility ranges from three-month LIBOR plus 0.875% to 1.35%, with pricing as of December 31, 2020, at LIBOR plus 0.95%. In addition to outstanding borrowings under the Facility presented in the above table, we had outstanding letters of credit under the Facility of $0.7 million and $0.8 million as of December 31, 2020 and 2019, respectively.
The following table provides additional information on our Facility.
Year Ended December 31,($ in millions) 2020 2019Average outstanding borrowings under the Facility $ 865.1 851.6 Effective interest rate on the Facility 1.6 % 3.0 %
We will continue to use the Facility for, but not limited to, business acquisitions, working capital needs (including payment of accrued incentive compensation), co-investment activities, share repurchases and capital expenditures.
Short-Term Borrowings and Long-Term Debt
In addition to our Facility, we have the capacity to borrow up to an additional $64.7 million under local overdraft facilities. Amounts outstanding are presented in the debt table presented above.
As of December 31, 2020, our issuer and senior unsecured ratings are investment grade: Baa1 from Moody’s Investors Service, Inc. and BBB+ from Standard & Poor’s Ratings Services.
Covenants
Our Facility and senior notes are subject to customary financial and other covenants, including cash interest coverage ratios and leverage ratios, as well as event of default conditions. We remained in compliance with all covenants as of December 31, 2020.
Table of Contents
102
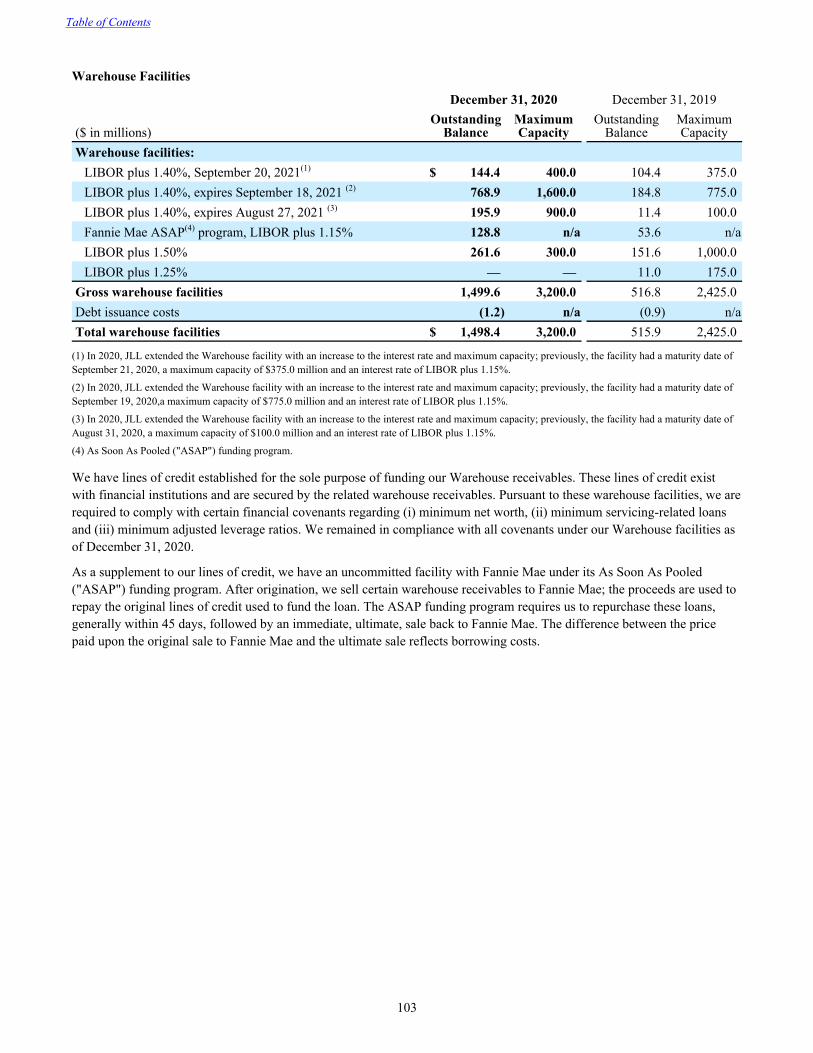
Warehouse Facilities
December 31, 2020 December 31, 2019
($ in millions)Outstanding
BalanceMaximum Capacity
Outstanding Balance
Maximum Capacity
Warehouse facilities:LIBOR plus 1.40%, September 20, 2021(1) $ 144.4 400.0 104.4 375.0 LIBOR plus 1.40%, expires September 18, 2021 (2) 768.9 1,600.0 184.8 775.0 LIBOR plus 1.40%, expires August 27, 2021 (3) 195.9 900.0 11.4 100.0 Fannie Mae ASAP(4) program, LIBOR plus 1.15% 128.8 n/a 53.6 n/aLIBOR plus 1.50% 261.6 300.0 151.6 1,000.0 LIBOR plus 1.25% — — 11.0 175.0
Gross warehouse facilities 1,499.6 3,200.0 516.8 2,425.0 Debt issuance costs (1.2) n/a (0.9) n/aTotal warehouse facilities $ 1,498.4 3,200.0 515.9 2,425.0
(1) In 2020, JLL extended the Warehouse facility with an increase to the interest rate and maximum capacity; previously, the facility had a maturity date of September 21, 2020, a maximum capacity of $375.0 million and an interest rate of LIBOR plus 1.15%.
(2) In 2020, JLL extended the Warehouse facility with an increase to the interest rate and maximum capacity; previously, the facility had a maturity date of September 19, 2020,a maximum capacity of $775.0 million and an interest rate of LIBOR plus 1.15%.
(3) In 2020, JLL extended the Warehouse facility with an increase to the interest rate and maximum capacity; previously, the facility had a maturity date of August 31, 2020, a maximum capacity of $100.0 million and an interest rate of LIBOR plus 1.15%.
(4) As Soon As Pooled ("ASAP") funding program.
We have lines of credit established for the sole purpose of funding our Warehouse receivables. These lines of credit exist with financial institutions and are secured by the related warehouse receivables. Pursuant to these warehouse facilities, we are required to comply with certain financial covenants regarding (i) minimum net worth, (ii) minimum servicing-related loans and (iii) minimum adjusted leverage ratios. We remained in compliance with all covenants under our Warehouse facilities as of December 31, 2020.
As a supplement to our lines of credit, we have an uncommitted facility with Fannie Mae under its As Soon As Pooled ("ASAP") funding program. After origination, we sell certain warehouse receivables to Fannie Mae; the proceeds are used to repay the original lines of credit used to fund the loan. The ASAP funding program requires us to repurchase these loans, generally within 45 days, followed by an immediate, ultimate, sale back to Fannie Mae. The difference between the price paid upon the original sale to Fannie Mae and the ultimate sale reflects borrowing costs.
Table of Contents
103
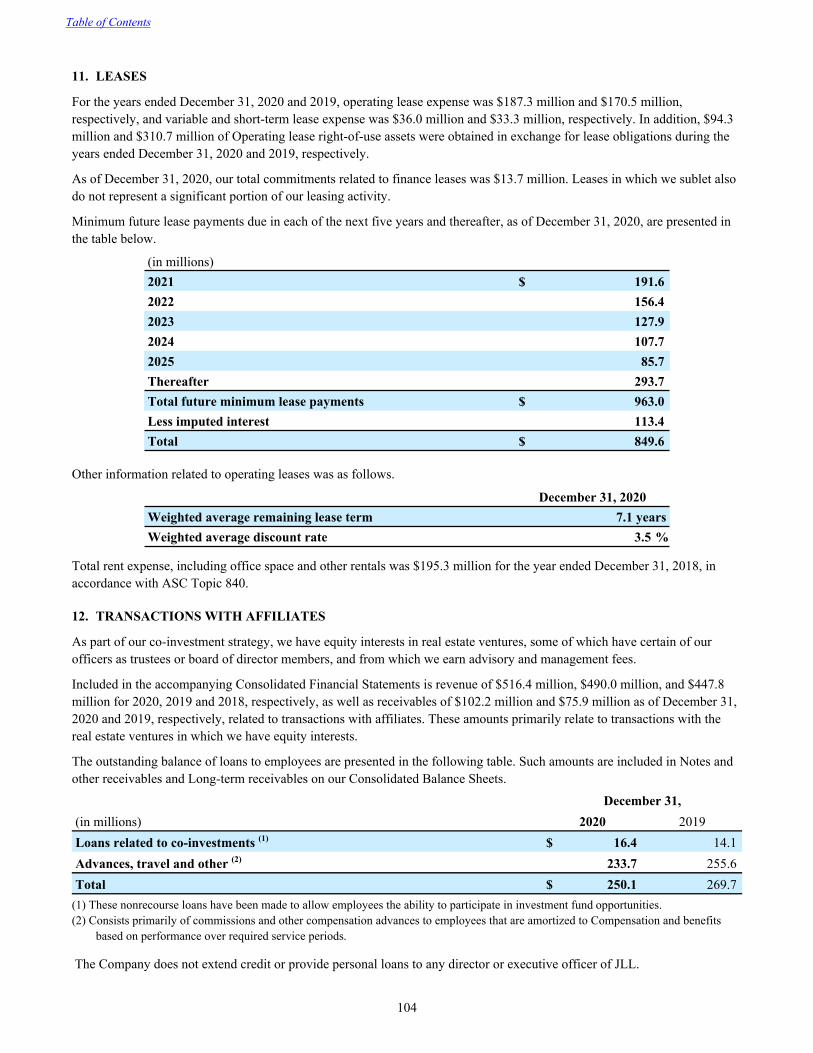
11. LEASES
For the years ended December 31, 2020 and 2019, operating lease expense was $187.3 million and $170.5 million, respectively, and variable and short-term lease expense was $36.0 million and $33.3 million, respectively. In addition, $94.3 million and $310.7 million of Operating lease right-of-use assets were obtained in exchange for lease obligations during the years ended December 31, 2020 and 2019, respectively.
As of December 31, 2020, our total commitments related to finance leases was $13.7 million. Leases in which we sublet also do not represent a significant portion of our leasing activity.
Minimum future lease payments due in each of the next five years and thereafter, as of December 31, 2020, are presented in the table below.
(in millions)2021 $ 191.6 2022 156.4 2023 127.9 2024 107.7 2025 85.7 Thereafter 293.7 Total future minimum lease payments $ 963.0 Less imputed interest 113.4 Total $ 849.6
Other information related to operating leases was as follows.
December 31, 2020Weighted average remaining lease term 7.1 yearsWeighted average discount rate 3.5 %
Total rent expense, including office space and other rentals was $195.3 million for the year ended December 31, 2018, in accordance with ASC Topic 840.
12. TRANSACTIONS WITH AFFILIATES
As part of our co-investment strategy, we have equity interests in real estate ventures, some of which have certain of our officers as trustees or board of director members, and from which we earn advisory and management fees.
Included in the accompanying Consolidated Financial Statements is revenue of $516.4 million, $490.0 million, and $447.8 million for 2020, 2019 and 2018, respectively, as well as receivables of $102.2 million and $75.9 million as of December 31, 2020 and 2019, respectively, related to transactions with affiliates. These amounts primarily relate to transactions with the real estate ventures in which we have equity interests.
The outstanding balance of loans to employees are presented in the following table. Such amounts are included in Notes and other receivables and Long-term receivables on our Consolidated Balance Sheets.
December 31,(in millions) 2020 2019Loans related to co-investments (1) $ 16.4 14.1 Advances, travel and other (2) 233.7 255.6 Total $ 250.1 269.7
(1) These nonrecourse loans have been made to allow employees the ability to participate in investment fund opportunities.(2) Consists primarily of commissions and other compensation advances to employees that are amortized to Compensation and benefits
based on performance over required service periods.
The Company does not extend credit or provide personal loans to any director or executive officer of JLL.
Table of Contents
104

13. COMMITMENTS AND CONTINGENCIES
We are a defendant in various litigation matters arising in the ordinary course of business, some of which involve claims for damages that are substantial in amount. Many of these litigation matters are covered by insurance (including insurance provided through a consolidated captive insurance company as further discussed below), but they may nevertheless be subject to large deductibles and the amounts being claimed may exceed the available insurance. Although we cannot determine the ultimate liability for these matters, based upon information currently available, we believe the ultimate resolution of such claims and litigation will not have a material adverse effect on our financial position, results of operations or liquidity.
Professional Indemnity Insurance
In order to better manage our global insurance program and support our risk management efforts, we supplement our traditional insurance coverage for certain types of claims by using a wholly-owned captive insurance company. The level of risk retained by our captive insurance company, with respect to professional indemnity claims, is up to $2.5 million per claim, inclusive of the deductible. We contract third-party insurance companies to provide coverage of risk in excess of this amount. When a potential loss event occurs, we estimate the ultimate cost of the claim and accrue the amount in Other current and long-term liabilities on the Consolidated Balance Sheets when probable and estimable. In addition, we have established receivables from third-party insurance providers for claim amounts in excess of the risk retained by our captive insurance company. In total, these receivables were $44.0 million and $37.7 million as of December 31, 2020 and 2019, respectively, and are included in Notes and other receivables and Long-term receivables on the Consolidated Balance Sheets.
The following table shows the professional indemnity accrual activity and related payments.
(in millions)December 31, 2017 $ 26.7 New claims 3.5 Prior year claims adjustments (including foreign currency changes) 20.5 Claims paid (7.6) December 31, 2018 43.1 New claims 0.1 Prior year claims adjustments (including foreign currency changes) (2.9) Claims paid (2.2) December 31, 2019 38.1 New claims 6.7 Prior year claims adjustments (including foreign currency changes) 3.8 Claims paid (0.4) December 31, 2020 $ 48.2
DUS Program Loan Loss-Sharing
As a participant in the DUS program, we retain a portion of the risk of loss for loans that are originated and sold under the DUS program. Net losses on defaulted loans are shared with Fannie Mae based upon established loss-sharing ratios. Generally, we share approximately one-third of incurred losses, subject to a cap of 20% of the principal balance of the mortgage at origination. As of December 31, 2020 and 2019, we had loans, funded and sold, subject to loss-sharing arrangements with an aggregate unpaid principal balance of $12.2 billion and $9.7 billion, respectively. There were no loan losses incurred for the years ended December 31, 2020, 2019 and 2018. See "Financial Guarantees" section of Note 2, Summary of Significant Accounting Policies for additional information.
Table of Contents
105
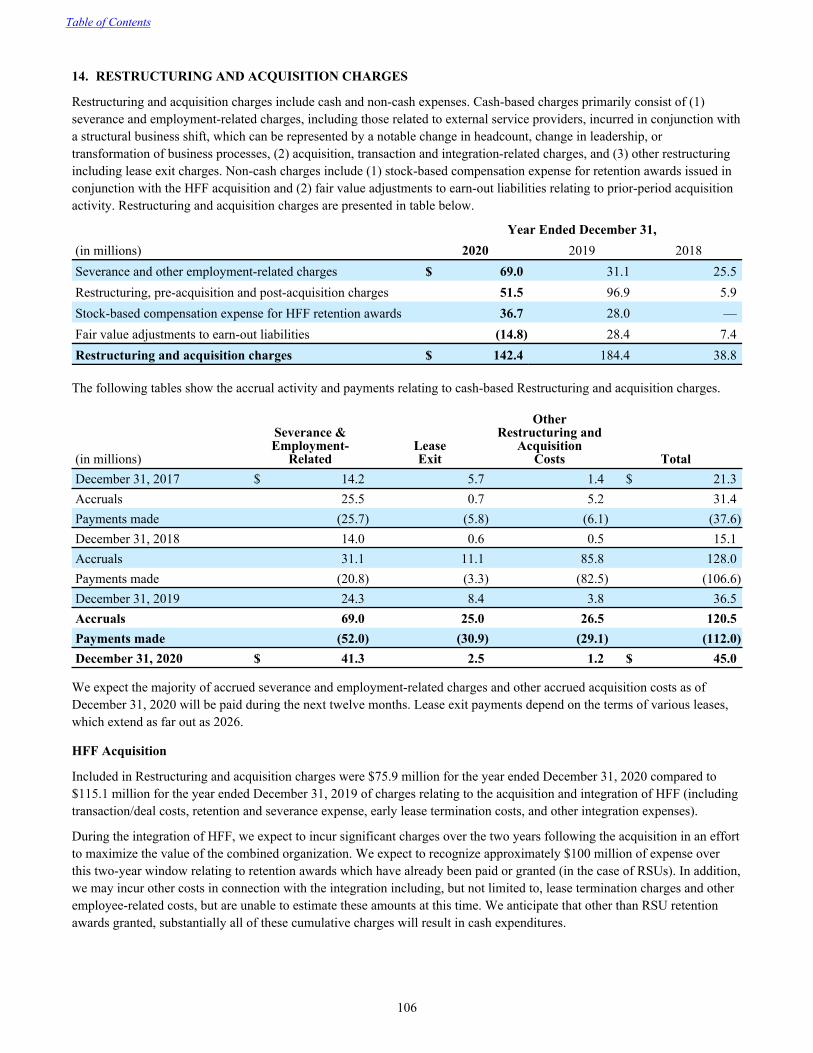
14. RESTRUCTURING AND ACQUISITION CHARGES
Restructuring and acquisition charges include cash and non-cash expenses. Cash-based charges primarily consist of (1) severance and employment-related charges, including those related to external service providers, incurred in conjunction with a structural business shift, which can be represented by a notable change in headcount, change in leadership, or transformation of business processes, (2) acquisition, transaction and integration-related charges, and (3) other restructuring including lease exit charges. Non-cash charges include (1) stock-based compensation expense for retention awards issued in conjunction with the HFF acquisition and (2) fair value adjustments to earn-out liabilities relating to prior-period acquisition activity. Restructuring and acquisition charges are presented in table below.
Year Ended December 31,(in millions) 2020 2019 2018Severance and other employment-related charges $ 69.0 31.1 25.5 Restructuring, pre-acquisition and post-acquisition charges 51.5 96.9 5.9 Stock-based compensation expense for HFF retention awards 36.7 28.0 — Fair value adjustments to earn-out liabilities (14.8) 28.4 7.4 Restructuring and acquisition charges $ 142.4 184.4 38.8
The following tables show the accrual activity and payments relating to cash-based Restructuring and acquisition charges.
(in millions)
Severance & Employment-
RelatedLeaseExit
Other Restructuring and
AcquisitionCosts Total
December 31, 2017 $ 14.2 5.7 1.4 $ 21.3 Accruals 25.5 0.7 5.2 31.4 Payments made (25.7) (5.8) (6.1) (37.6) December 31, 2018 14.0 0.6 0.5 15.1 Accruals 31.1 11.1 85.8 128.0 Payments made (20.8) (3.3) (82.5) (106.6) December 31, 2019 24.3 8.4 3.8 36.5 Accruals 69.0 25.0 26.5 120.5 Payments made (52.0) (30.9) (29.1) (112.0) December 31, 2020 $ 41.3 2.5 1.2 $ 45.0
We expect the majority of accrued severance and employment-related charges and other accrued acquisition costs as of December 31, 2020 will be paid during the next twelve months. Lease exit payments depend on the terms of various leases, which extend as far out as 2026.
HFF Acquisition
Included in Restructuring and acquisition charges were $75.9 million for the year ended December 31, 2020 compared to $115.1 million for the year ended December 31, 2019 of charges relating to the acquisition and integration of HFF (including transaction/deal costs, retention and severance expense, early lease termination costs, and other integration expenses).
During the integration of HFF, we expect to incur significant charges over the two years following the acquisition in an effort to maximize the value of the combined organization. We expect to recognize approximately $100 million of expense over this two-year window relating to retention awards which have already been paid or granted (in the case of RSUs). In addition, we may incur other costs in connection with the integration including, but not limited to, lease termination charges and other employee-related costs, but are unable to estimate these amounts at this time. We anticipate that other than RSU retention awards granted, substantially all of these cumulative charges will result in cash expenditures.
Table of Contents
106
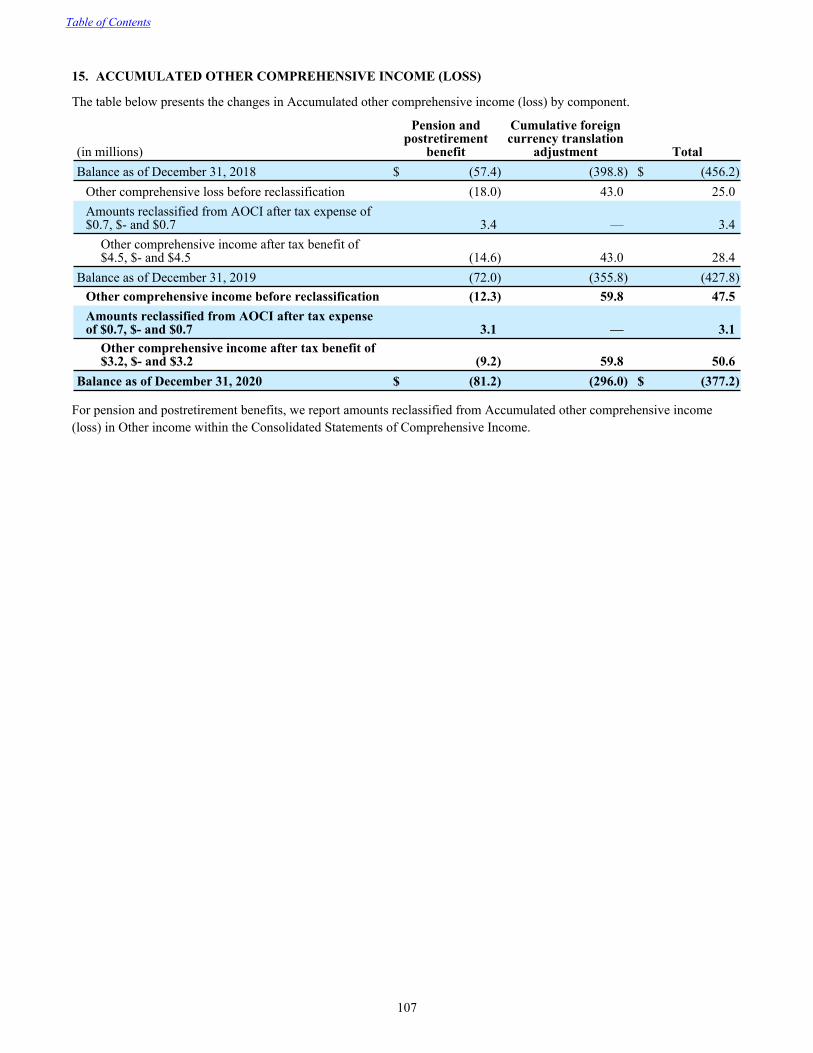
15. ACCUMULATED OTHER COMPREHENSIVE INCOME (LOSS)
The table below presents the changes in Accumulated other comprehensive income (loss) by component.
(in millions)
Pension and postretirement
benefit
Cumulative foreign currency translation
adjustment TotalBalance as of December 31, 2018 $ (57.4) (398.8) $ (456.2)
Other comprehensive loss before reclassification (18.0) 43.0 25.0 Amounts reclassified from AOCI after tax expense of $0.7, $- and $0.7 3.4 — 3.4
Other comprehensive income after tax benefit of $4.5, $- and $4.5 (14.6) 43.0 28.4
Balance as of December 31, 2019 (72.0) (355.8) (427.8) Other comprehensive income before reclassification (12.3) 59.8 47.5 Amounts reclassified from AOCI after tax expense of $0.7, $- and $0.7 3.1 — 3.1
Other comprehensive income after tax benefit of $3.2, $- and $3.2 (9.2) 59.8 50.6
Balance as of December 31, 2020 $ (81.2) (296.0) $ (377.2)
For pension and postretirement benefits, we report amounts reclassified from Accumulated other comprehensive income (loss) in Other income within the Consolidated Statements of Comprehensive Income.
Table of Contents
107
ITEM 9. CHANGES IN AND DISAGREEMENTS WITH ACCOUNTANTS ON ACCOUNTING AND FINANCIAL DISCLOSURE
None.
ITEM 9A. CONTROLS AND PROCEDURES EVALUATION OF DISCLOSURE CONTROLS AND PROCEDURES
The Company has established disclosure controls and procedures to ensure material information relating to the Company, including its consolidated subsidiaries, is made known to the officers who certify the Company's financial reports and to the members of senior management and the Board of Directors.
Based on management's evaluation as of December 31, 2020, the principal executive officer and principal financial officer of the Company have concluded the Company's disclosure controls and procedures (as defined in Rules 13a-15(e) and 15d-15(e) under the Securities Exchange Act of 1934) are effective.
MANAGEMENT'S REPORT ON INTERNAL CONTROL OVER FINANCIAL REPORTING
The Company's management is responsible for establishing and maintaining adequate internal control over financial reporting, as such term is defined in Exchange Act Rules 13a-15(f) and 15d-15(f). Under the supervision and with the participation of our management, including our principal executive officer, we conducted an evaluation of the effectiveness of our internal control over financial reporting based on the framework in Internal Control-Integrated Framework (2013) issued by the Committee of Sponsoring Organizations of the Treadway Commission. Based on our evaluation under the framework in Internal Control-Integrated Framework (2013), our management concluded our internal control over financial reporting was effective as of December 31, 2020.
KPMG LLP, the Independent Registered Public Accounting Firm that audited the Consolidated Financial Statements included in this Annual Report on Form 10-K, issued an audit report on the Company's internal control over financial reporting. That Report of Independent Registered Public Accounting Firm is included in Item 8. Financial Statements and Supplementary Data.
CHANGES IN INTERNAL CONTROLS OVER FINANCIAL REPORTING
There were no changes to the Company's internal controls over financial reporting during the quarter ended December 31, 2020 that have materially affected, or are reasonably likely to materially affect, the Company's internal controls over financial reporting.
ITEM 9B. OTHER INFORMATION
Not applicable.
Table of Contents
108
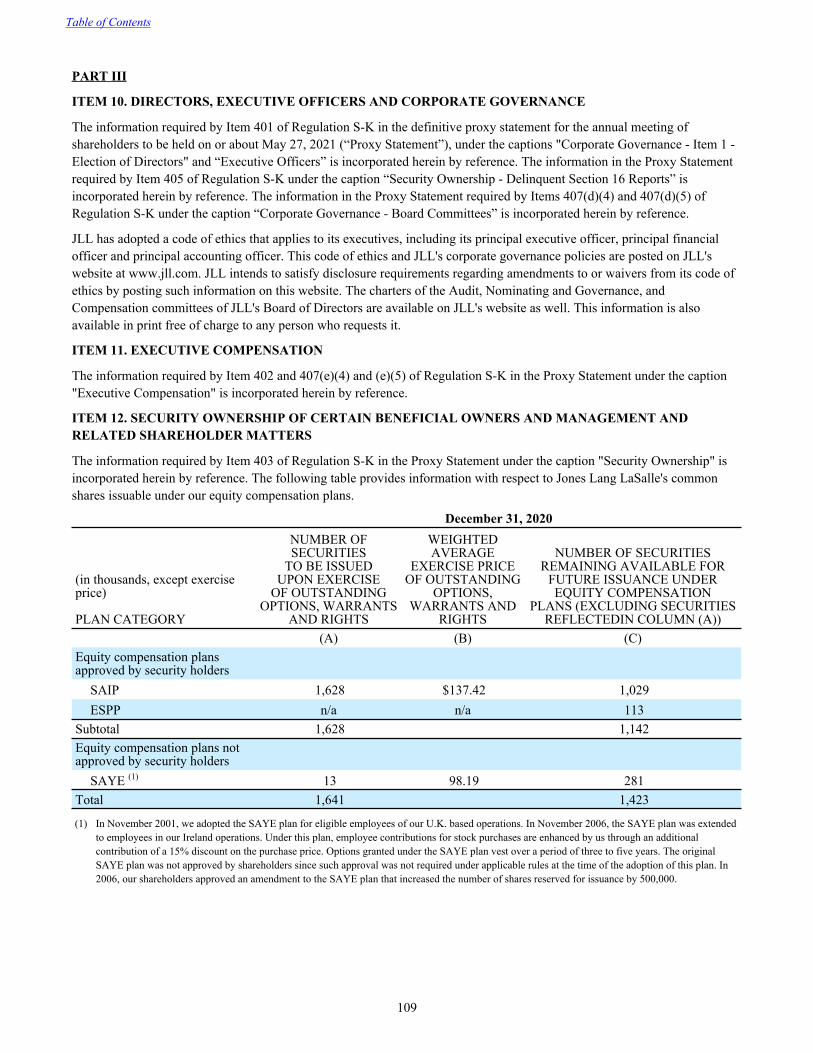
PART III
ITEM 10. DIRECTORS, EXECUTIVE OFFICERS AND CORPORATE GOVERNANCE
The information required by Item 401 of Regulation S-K in the definitive proxy statement for the annual meeting of shareholders to be held on or about May 27, 2021 (“Proxy Statement”), under the captions "Corporate Governance - Item 1 - Election of Directors" and “Executive Officers” is incorporated herein by reference. The information in the Proxy Statement required by Item 405 of Regulation S-K under the caption “Security Ownership - Delinquent Section 16 Reports” is incorporated herein by reference. The information in the Proxy Statement required by Items 407(d)(4) and 407(d)(5) of Regulation S-K under the caption “Corporate Governance - Board Committees” is incorporated herein by reference.
JLL has adopted a code of ethics that applies to its executives, including its principal executive officer, principal financial officer and principal accounting officer. This code of ethics and JLL's corporate governance policies are posted on JLL's website at www.jll.com. JLL intends to satisfy disclosure requirements regarding amendments to or waivers from its code of ethics by posting such information on this website. The charters of the Audit, Nominating and Governance, and Compensation committees of JLL's Board of Directors are available on JLL's website as well. This information is also available in print free of charge to any person who requests it.
ITEM 11. EXECUTIVE COMPENSATION
The information required by Item 402 and 407(e)(4) and (e)(5) of Regulation S-K in the Proxy Statement under the caption "Executive Compensation" is incorporated herein by reference.
ITEM 12. SECURITY OWNERSHIP OF CERTAIN BENEFICIAL OWNERS AND MANAGEMENT AND RELATED SHAREHOLDER MATTERS
The information required by Item 403 of Regulation S-K in the Proxy Statement under the caption "Security Ownership" is incorporated herein by reference. The following table provides information with respect to Jones Lang LaSalle's common shares issuable under our equity compensation plans.
December 31, 2020
(in thousands, except exercise price)
PLAN CATEGORY
NUMBER OFSECURITIES
TO BE ISSUEDUPON EXERCISE
OF OUTSTANDINGOPTIONS, WARRANTS
AND RIGHTS
WEIGHTEDAVERAGE
EXERCISE PRICEOF OUTSTANDING
OPTIONS,WARRANTS AND
RIGHTS
NUMBER OF SECURITIESREMAINING AVAILABLE FOR
FUTURE ISSUANCE UNDER EQUITY COMPENSATION
PLANS (EXCLUDING SECURITIESREFLECTEDIN COLUMN (A))
(A) (B) (C)Equity compensation plans approved by security holders
SAIP 1,628 $137.42 1,029ESPP n/a n/a 113
Subtotal 1,628 1,142Equity compensation plans not approved by security holders
SAYE (1) 13 98.19 281Total 1,641 1,423
(1) In November 2001, we adopted the SAYE plan for eligible employees of our U.K. based operations. In November 2006, the SAYE plan was extended to employees in our Ireland operations. Under this plan, employee contributions for stock purchases are enhanced by us through an additional contribution of a 15% discount on the purchase price. Options granted under the SAYE plan vest over a period of three to five years. The original SAYE plan was not approved by shareholders since such approval was not required under applicable rules at the time of the adoption of this plan. In 2006, our shareholders approved an amendment to the SAYE plan that increased the number of shares reserved for issuance by 500,000.
Table of Contents
109

ITEM 13. CERTAIN RELATIONSHIPS AND RELATED TRANSACTIONS, AND DIRECTOR INDEPENDENCE
The information required by Item 404 of Regulation S-K in the Proxy Statement under the caption “Security Ownership - Certain Relationships and Related Transactions” is incorporated herein by reference. The information required by Item 407(a) of Regulation S-K in the Proxy Statement under the caption “Corporate Governance-Director Independence” is incorporated herein by reference.
ITEM 14. PRINCIPAL ACCOUNTING FEES AND SERVICES
The information required by this Item 14 is set forth in the Proxy Statement under the captions "Audit Matters - Information About Our Independent Registered Public Accounting Firm” and incorporated herein by reference.
Table of Contents
110
PART IV
ITEM 15. EXHIBITS AND FINANCIAL STATEMENT SCHEDULES
The following documents are filed as part of this report:
1. Financial Statements. See Index to Consolidated Financial Statements in Part II, Item 8 of this report.
2. Financial Statement Schedules. No financial statement schedules are included because they are not required or are not applicable, or the required information is set forth in the applicable statements or related notes.
3. Exhibits. A list of exhibits is set forth in the Exhibit Index, included following the Power of Attorney section.
ITEM 16. FORM 10-K SUMMARY
None.
Cautionary Note Regarding Forward-Looking Statements
This report, including this Management's Discussion and Analysis of Financial Condition and Results of Operations, contains “forward-looking statements” within the meaning of the federal securities laws. All such statements are qualified by this cautionary note, which is provided pursuant to the safe harbor provisions of Section 27A of the Securities Act of 1933, as amended, and Section 21E of the Securities Exchange Act of 1934, as amended. Forward-looking statements may also be included in our other public filings, press releases, our website, and oral and written presentations by management.
Statements in the future tense, and all statements accompanied by terms such as “believe,” “project,” “expect,” “estimate,” “assume,” “intend,” “anticipate,” “target,” “plan” and variations thereof and similar terms, are intended to be forward-looking statements. Such statements do not relate strictly to historical or current facts as they relate to our intent, belief and current expectations about our strategic direction, prospects and future results, and give our current expectations or forecasts of future events. This includes, but is not limited to, our expectations regarding the potential impact of the COVID-19 outbreak and the efficacy of vaccines and therapeutics on reducing the spread of the virus, as well as any further impacts to us, the economy as a whole, and/or related government and regulatory restrictions issued to combat the global pandemic, including any adverse changes in such restrictions that may impact us. Management believes that these forward-looking statements are reasonable as and when made. However, caution should be taken not to place undue reliance on any such forward-looking statements because such statements speak only as of the date when made.
Forward-looking statements are subject to certain risks and uncertainties that could cause actual results to differ materially from our historical experience and our present expectations or anticipated results. These risks and uncertainties are described in Part I, Item 1A. Risk Factors and may also be described from time to time in our future reports filed with the SEC. You should consider the limitations on, and risks associated with, forward-looking statements and not unduly rely on the accuracy of predictions contained in such forward-looking statements. We do not undertake any obligation to update forward-looking statements to reflect events, circumstances, changes in expectations or the occurrence of unanticipated events after the date of those statements.
Power of Attorney
KNOW ALL MEN BY THESE PRESENTS, that each of Jones Lang LaSalle Incorporated, a Maryland corporation, and the undersigned Directors and officers of Jones Lang LaSalle Incorporated, hereby constitutes and appoints Christian Ulbrich, Karen Brennan and Louis F. Bowers its, his or her true and lawful attorneys-in-fact and agents, for it, him or her and in its, his or her name, place and stead, in any and all capacities, with full power to act alone, to sign any and all amendments to this report, and to file each such amendment to this report, with all exhibits thereto, and any and all documents in connection therewith, with the Securities and Exchange Commission, hereby granting unto said attorneys-in-fact and agents, and each of them, full power and authority to do and perform any and all acts and things requisite and necessary to be done in and about the premises, as fully to all intents and purposes as it, he or she might or could do in person, hereby ratifying and confirming all that said attorneys-in-fact and agents, or any of them, may lawfully do or cause to be done by virtue hereof.
Table of Contents
111
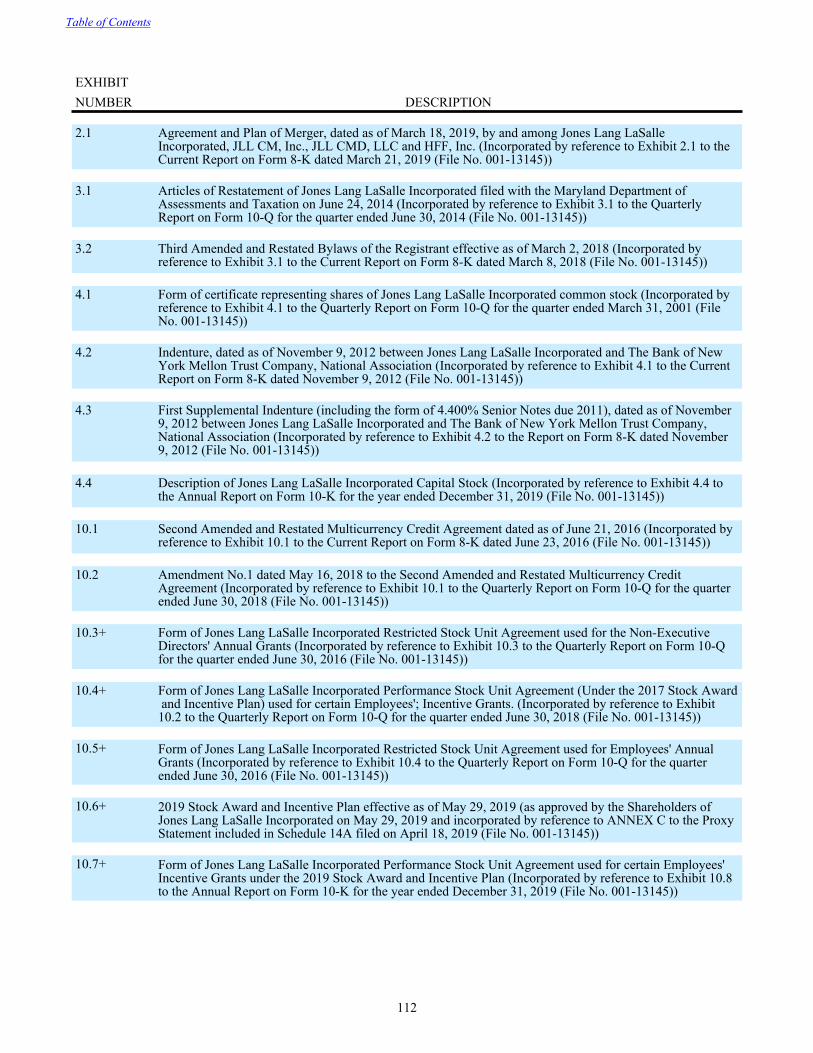
EXHIBITNUMBER DESCRIPTION
2.1 Agreement and Plan of Merger, dated as of March 18, 2019, by and among Jones Lang LaSalle Incorporated, JLL CM, Inc., JLL CMD, LLC and HFF, Inc. (Incorporated by reference to Exhibit 2.1 to the Current Report on Form 8-K dated March 21, 2019 (File No. 001-13145))
3.1 Articles of Restatement of Jones Lang LaSalle Incorporated filed with the Maryland Department of Assessments and Taxation on June 24, 2014 (Incorporated by reference to Exhibit 3.1 to the Quarterly Report on Form 10-Q for the quarter ended June 30, 2014 (File No. 001-13145))
3.2 Third Amended and Restated Bylaws of the Registrant effective as of March 2, 2018 (Incorporated by reference to Exhibit 3.1 to the Current Report on Form 8-K dated March 8, 2018 (File No. 001-13145))
4.1 Form of certificate representing shares of Jones Lang LaSalle Incorporated common stock (Incorporated by reference to Exhibit 4.1 to the Quarterly Report on Form 10-Q for the quarter ended March 31, 2001 (File No. 001-13145))
4.2 Indenture, dated as of November 9, 2012 between Jones Lang LaSalle Incorporated and The Bank of New York Mellon Trust Company, National Association (Incorporated by reference to Exhibit 4.1 to the Current Report on Form 8-K dated November 9, 2012 (File No. 001-13145))
4.3 First Supplemental Indenture (including the form of 4.400% Senior Notes due 2011), dated as of November 9, 2012 between Jones Lang LaSalle Incorporated and The Bank of New York Mellon Trust Company, National Association (Incorporated by reference to Exhibit 4.2 to the Report on Form 8-K dated November 9, 2012 (File No. 001-13145))
4.4 Description of Jones Lang LaSalle Incorporated Capital Stock (Incorporated by reference to Exhibit 4.4 to the Annual Report on Form 10-K for the year ended December 31, 2019 (File No. 001-13145))
10.1 Second Amended and Restated Multicurrency Credit Agreement dated as of June 21, 2016 (Incorporated by reference to Exhibit 10.1 to the Current Report on Form 8-K dated June 23, 2016 (File No. 001-13145))
10.2 Amendment No.1 dated May 16, 2018 to the Second Amended and Restated Multicurrency Credit Agreement (Incorporated by reference to Exhibit 10.1 to the Quarterly Report on Form 10-Q for the quarter ended June 30, 2018 (File No. 001-13145))
10.3+ Form of Jones Lang LaSalle Incorporated Restricted Stock Unit Agreement used for the Non-Executive Directors' Annual Grants (Incorporated by reference to Exhibit 10.3 to the Quarterly Report on Form 10-Q for the quarter ended June 30, 2016 (File No. 001-13145))
10.4+ Form of Jones Lang LaSalle Incorporated Performance Stock Unit Agreement (Under the 2017 Stock Award and Incentive Plan) used for certain Employees'; Incentive Grants. (Incorporated by reference to Exhibit 10.2 to the Quarterly Report on Form 10-Q for the quarter ended June 30, 2018 (File No. 001-13145))
10.5+ Form of Jones Lang LaSalle Incorporated Restricted Stock Unit Agreement used for Employees' Annual Grants (Incorporated by reference to Exhibit 10.4 to the Quarterly Report on Form 10-Q for the quarter ended June 30, 2016 (File No. 001-13145))
10.6+ 2019 Stock Award and Incentive Plan effective as of May 29, 2019 (as approved by the Shareholders of Jones Lang LaSalle Incorporated on May 29, 2019 and incorporated by reference to ANNEX C to the Proxy Statement included in Schedule 14A filed on April 18, 2019 (File No. 001-13145))
10.7+ Form of Jones Lang LaSalle Incorporated Performance Stock Unit Agreement used for certain Employees' Incentive Grants under the 2019 Stock Award and Incentive Plan (Incorporated by reference to Exhibit 10.8 to the Annual Report on Form 10-K for the year ended December 31, 2019 (File No. 001-13145))
Table of Contents
112

EXHIBITNUMBER DESCRIPTION
10.8+ Form of Jones Lang LaSalle Incorporated Restricted Stock Unit Agreement used for Employees' Annual Grants Agreement under the 2019 Stock Award and Incentive Plan (Incorporated by reference to Exhibit 10.9 to the Annual Report on Form 10-K for the year ended December 31, 2019 (File No. 001-13145))
10.9+ HFF, Inc. 2016 Equity Incentive Plan (assumed by the Company in connection with its acquisition of HFF, Inc. pursuant to an Agreement and Plan of Merger, dated as of March 18, 2019, by and among the Company, JLL CM, Inc., JLL CMD, LCC and HFF, Inc. (Incorporated by reference to Exhibit 99.1 to the Registration Statement on Form S-8 dated July 1, 2019 (File No. 333-232500))
10.10+ HFF, Inc. 2006 Omnibus Incentive Compensation Plan (assumed by the Company in connection with its acquisition of HFF, Inc. pursuant to an Agreement and Plan of Merger, dated as of March 18, 2019, by and among the Company, JLL CM, Inc., JLL CMD, LLC and HFF, Inc. (Incorporated by reference to Exhibit 99.2 to Post-Effective Amendment No. 1 dated July 1, 2019 on Form S-8 to Registration Statement on Form S-4 (File No. 333-231099))
10.11+ Amended and Restated Severance Pay Plan effective July 1, 2010 (Incorporated by reference to Exhibit 10.9 to the Annual Report on Form 10-K for the year ended December 31, 2011 (File No. 001-13145))
10.12+ LaSalle Investment Management Long Term Incentive Compensation Program, amended and restated January 1, 2013 (Incorporated by reference to Exhibit 10.12 to the Annual Report on Form 10-K for the year ended December 31, 2013 (File No. 001-13145))
10.13+ Jones Lang LaSalle Incorporated Deferred Compensation Plan, as amended and restated effective January 1, 2009 (Incorporated by reference to Exhibit 10.25 to the Annual Report on Form 10-K for the year ended December 31, 2008 (File No. 001-13145))
10.14+ Jones Lang LaSalle Incorporated First Amendment to Deferred Compensation Plan dated as of December 5, 2011 (Incorporated by reference to Exhibit 4.2 to the Registration Statement on Form S-8 dated March 28, 2012 (File No. 333-180405))
10.15+ Jones Lang LaSalle Incorporated Non-Executive Director Compensation Plan Summary of Terms and Conditions, Amended and Restated as of May 28, 2016 (Incorporated by reference to Exhibit 10.5 to the Quarterly Report on Form 10-Q for the quarter ended June 30, 2016 (File No. 001-13145))
10.16+ Jones Lang LaSalle Incorporated GEB 2015-2020 Long-Term Incentive Compensation Program effective as of January 1, 2015 (Incorporated by reference to Exhibit 10.2 to the Current Report on Form 8-K dated July 15, 2015 (File 001-13145))
10.17+ Letter Agreement dated January 16, 2014 between Jones Lang LaSalle Incorporated and Gregory P. O'Brien (Incorporated by reference to Exhibit 10.1 to the Current Report on Form 8-K (File No. 001-13145))
10.18+ Letter Agreement dated August 23, 2016 between Jones Lang LaSalle Incorporated and Christian Ulbrich (Incorporated by reference to Exhibit 10.2 to the Current Report on Form 8-K dated August 25, 2016 (File 001-13145))
10.19+ Letter Agreement dated February 27, 2019, between Jones Lang LaSalle Incorporated and Stephanie Plaines (Incorporated by reference to Exhibit 10.1 to the Current Report on Form 80K dated March 31, 2019 (File No. 001-13145))
10.20+ Letter Agreement dated September 22, 2019 between Jones Lang LaSalle Incorporated and Mihir Shah (Incorporated by reference to Exhibit 10.1 to the Quarterly Report on Form 10-Q for the quarter ended September 30, 2019 (File No. 001-13145))
Table of Contents
113

EXHIBITNUMBER DESCRIPTION
10.21+ Letter Agreement dated September 22, 2019 between Jones Lang LaSalle Incorporated and Yishai Lerner (Incorporated by reference to Exhibit 10.2 to the Quarterly Report on Form 10-Q for the quarter ended September 30, 2019 (File No. 001-13145))
10.22+ Form of Global Executive Board Salary Reduction Agreement (Incorporated by reference to Exhibit 10.1 to the Quarterly Report on Form 10-Q for the quarter ended March 31, 2020 (File No. 001-13145))
10.23+ Letter Agreement, dated June 18, 2020, between Jones Lang LaSalle Incorporated and Karen Brennan (Incorporated by reference to Exhibit 10.1 to the Current Report on Form 8-K dated June 22, 2020 (File No. 001-13145))
10.24+ Letter Agreement, dated June 20, 2020, between Jones Lang LaSalle Incorporated and Stephanie Plaines (Incorporated by reference to Exhibit 10.2 to the Quarterly Report on Form 10-Q for the quarter ended June 30, 2020 (File No. 001-13145))
10.25*+ Letter Agreement dated December 4, 2020, between Jones Lang LaSalle Incorporated and Jeff A. Jacobson
11 Statement concerning computation of per share earnings (filed in Item 8, Consolidated Statements of Comprehensive Income)
21.1* List of Subsidiaries
23.1* Consent of Independent Registered Public Accounting Firm
24.1* Power of Attorney (Set forth immediately preceding this exhibit index)
31.1* Certification of Chief Executive Officer pursuant to Rule 13a-14(a) under the Securities and Exchange Act of 1934, as adopted pursuant to Section 302 of the Sarbanes-Oxley Act of 2002
31.2* Certification of Chief Financial Officer pursuant to Rule 13a-14(a) under the Securities and Exchange Act of 1934, as adopted pursuant to Section 302 of the Sarbanes-Oxley Act of 2002
32.1* Certification of Chief Executive Officer and Chief Financial Officer pursuant to 18 U.S.C. Section 1350, as adopted pursuant to Section 906 of the Sarbanes-Oxley Act of 2002
101.INS Inline XBRL Instance Document - the instance document does not appear in the Interactive Data File because its XBRL tags are embedded within the Inline XBRL document
101.SCH Inline XBRL Taxonomy Extension Schema Document
101.CAL Inline XBRL Taxonomy Extension Calculation Linkbase Document
101.DEF Inline XBRL Taxonomy Extension Definition Linkbase Document
101.LAB Inline XBRL Taxonomy Extension Label Linkbase Document
101.PRE Inline XBRL Taxonomy Extension Presentation Linkbase Document
104 Cover Page Interactive Data File (formatted as Inline XBRL and contained in Exhibit 101)
* Filed herewith+ Indicates management compensatory plan, contract, or arrangement.
Table of Contents
114
SIGNATURES
Pursuant to the requirements of Section 13 or 15(d) of the Securities Exchange Act of 1934, the Registrant has duly caused this report to be signed on its behalf by the undersigned, thereunto duly authorized, on the 18th day of February, 2021.
JONES LANG LASALLE INCORPORATED
By /s/ Karen Brennan Karen Brennan
Chief Financial Officer(Authorized Officer and Principal Financial Officer)
Pursuant to the requirements of the Securities Exchange Act of 1934, this report has been signed below by the following persons on behalf of the Registrant and in the capacities indicated on the 18th day of February, 2021.
Signature Title
/s/ Siddharth N. Mehta Chairman of the Board of Directors and DirectorSiddharth N. Mehta
/s/ Christian Ulbrich President, Chief Executive Officer and DirectorChristian Ulbrich (Principal Executive Officer)
/s/ Hugo Bagué DirectorHugo Bagué
/s/ Matthew Carter DirectorMatthew Carter
/s/ Samuel A. Di Piazza, Jr. DirectorSamuel A. Di Piazza, Jr.
/s/ Ming Lu DirectorMing Lu
/s/ Bridget Macaskill DirectorBridget Macaskill
/s/ Deborah H. McAneny DirectorDeborah H. McAneny
/s/ Martin H. Nesbitt DirectorMartin H. Nesbitt
/s/ Jeetu Patel DirectorJeetu Patel
/s/ Sheila A. Penrose DirectorSheila A. Penrose
/s/ Ann Marie Petach DirectorAnn Marie Petach
/s/ Karen Brennan Chief Financial OfficerKaren Brennan (Principal Financial Officer)
/s/ Louis F. Bowers Global ControllerLouis F. Bowers (Principal Accounting Officer)
Table of Contents
115

Jones Lang LaSalle Incorporated 200 East Randolph Drive Chicago, Illinois 60601 tel +1 312 782 5800
JLL www.jll.com
LaSalle www.lasalle.com
Regional contact informationEach of our businesses — JLL Real Estate Services and LaSalle — operates in the Americas, EMEA and Asia Pacific. Regional contact information for these businesses may be found on the websites referenced above.
Independent registered public accounting firm KPMG LLP 200 East Randolph Drive Chicago, Illinois 60601
Stock transfer agent, registrar and dividend paying agent Computershare 462 South 4th Street, Louisville, KY 40202 tel +1 866 210 8055 www.computershare.com/investor
Shareholder online inquiries [email protected]
Investor relations Inquiries from investors should be directed to:
Jones Lang LaSalle Incorporated Investor Relations Department 200 East Randolph Drive Chicago, Illinois 60601 tel +1 312 252 8943 ir.jll.com
NYSE and SEC certificationsAs required, during 2020 our Chief Executive Officer certified to the New York Stock Exchange that he was not aware of any violation by JLL of NYSE corporate governance listing standards. In addition, JLL has filed with the Securities and Exchange Commission, as exhibits to its 2020 Annual Report on Form 10-K, the certifications of its Chief Executive Officer and Chief Financial Officer required under Section 302 of the Sarbanes-Oxley Act of 2002 regarding the quality of its public disclosure.
JLL Code of Business EthicsJLL stands for uncompromising integrity and the highest ethical conduct. We are proud of, and are determined to protect
and enhance, the global reputation we have established. In a service business such as ours, the integrity that our brand represents is one of
our most valuable assets. The JLL Code of Business Ethics, which may be found in multiple languages on our website, contains the ethics policies that everyone who does business on behalf of our firm must follow. Reports of possible violations of our Code of Business Ethics may be made to our global Ethics Helpline at +1 877 540 5066 or by contacting www.jllethicsreports.com.
JLL Vendor Code of ConductJLL expects that each of its vendors, meaning any firm or individual providing a product or service to JLL or indirectly to our clients as a contractor or subcontractor, will share and embrace the letter and spirit of our commitment to integrity, safety and respect for all individuals. While vendors are independent entities, their business practices may significantly reflect upon us, our reputation and our brand. Accordingly, we expect all vendors to adhere to the JLL Vendor Code of Conduct, which may be found in multiple languages on our website. Reports of possible violations of our Vendor Code of Conduct may be made to our global Ethics Helpline or through the Web address indicated above.
Sustainability: Building a Better TomorrowWe shape the future of real estate for a better world by partnering with our stakeholders to drive disruptive, impactful and sustainable change. We do this by embedding sustainability into everything we do through the four pillars of Building a Better Tomorrow: Clients, People, Workplaces and Communities. Sustainability facilitates our ability to deliver long-term value to our shareholders and create productive, healthy spaces for our clients and employees, while allowing us to energize and support our communities. We’ve already achieved much to be proud of by meeting and exceeding our sustainability targets, but our vision is
to embed sustainability across our entire business. For more information on our sustainability efforts visit us.jll.com/en/about-jll/our-sustainability-leadership
Cautionary note regarding forward-looking statementsCertain statements in this Annual Report may constitute forward-looking statements that involve known and unknown risks, uncertainties, and other factors that may cause JLL’s actual results to be materially different from any future results implied by such forward-looking statements. See our 2020 Form 10-K for a discussion of such risks, uncertainties and other factors.
Integrated reportingJLL was one of the first U.S. listed companies to participate in the International Integrated Reporting Council and has continued to adopt the principles of the Integrated Reporting (<IR>) Framework in our financial reporting and sustainability materials. Our Annual Report focuses on our business strategy and our financial performance and reflects the majority of our corporate efforts. In addition, our governance and remuneration practices are reported primarily in the Proxy Statement for our Annual Meeting of Shareholders and our sustainability strategy and performance are reported in our Global Sustainability Report.
Company information
“World’s Most Ethical Companies” and “Ethisphere” names and marks are registered trademarks of Ethisphere LLC.

Copyright 2021 Jones Lang LaSalle IP, Inc. | www.jll.com