source book2014 - west virginia department of...
TRANSCRIPT
SOURCEBOOK2014

West Virginia Board of education
2014-2015
Gayle C. Manchin, PresidentMichael I. Green, Vice President
Tina H. Combs, Secretary
Thomas W. Campbell, MemberLloyd G. Jackson II, MemberBeverly E. Kingery, MemberL. Wade Linger, Jr., MemberWilliam M. White, MemberJames S. Wilson, Member
Paul L. Hill, Ex OfficioChancellor
West Virginia Higher Education Policy Commission
James L. Skidmore, Ex OfficioChancellor
West Virginia Council for Community and Technical College Education
Michael J. Martirano, Ex OfficioState Superintendent of Schools
West Virginia Department of Education

Public Education
In West Virginia
SOURCE BOOK
2014
No. 34
Michael J. Martirano, Ed.D.
State Superintendent of Schools
West Virginia Department of Education

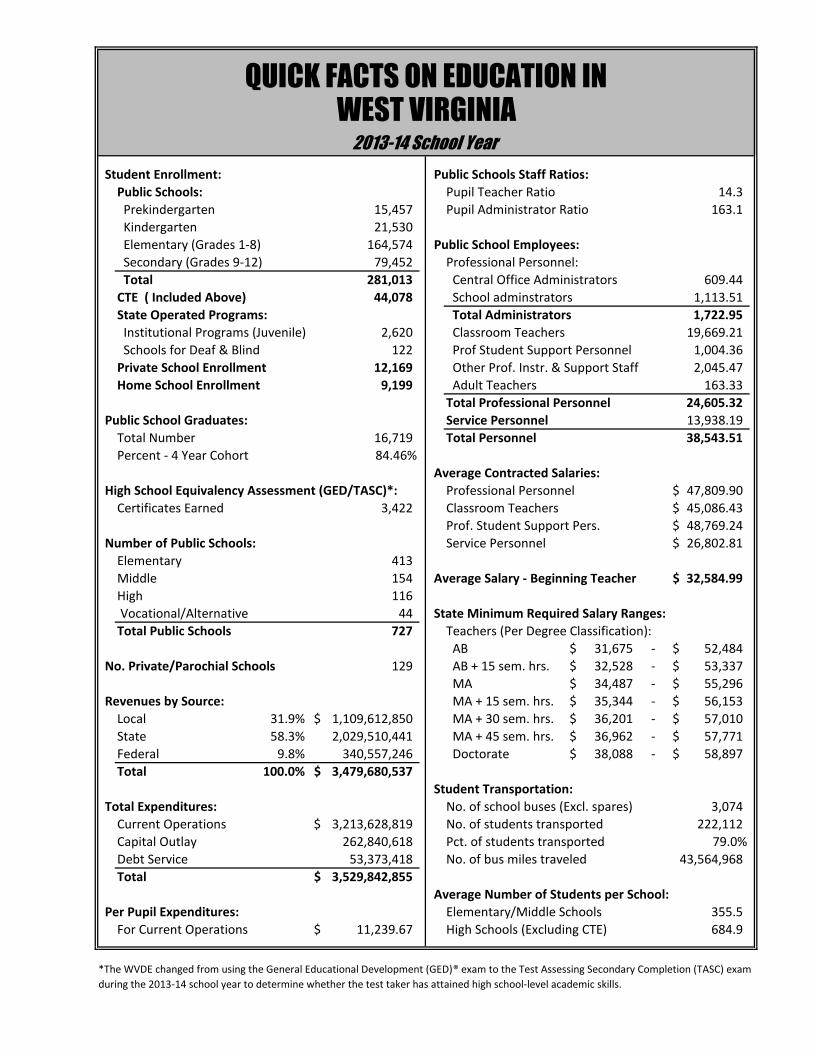
WEST VIRGINIA2013-14 School Year
Student Enrollment: Public Schools Staff Ratios:
Public Schools: Pupil Teacher Ratio 14.3
Prekindergarten 15,457 Pupil Administrator Ratio 163.1
Kindergarten 21,530
Elementary (Grades 1-8) 164,574 Public School Employees:
Secondary (Grades 9-12) 79,452 Professional Personnel:
Total 281,013 Central Office Administrators 609.44
CTE ( Included Above) 44,078 School adminstrators 1,113.51
State Operated Programs: Total Administrators 1,722.95
Institutional Programs (Juvenile) 2,620 Classroom Teachers 19,669.21
Schools for Deaf & Blind 122 Prof Student Support Personnel 1,004.36
Private School Enrollment 12,169 Other Prof. Instr. & Support Staff 2,045.47
Home School Enrollment 9,199 Adult Teachers 163.33
Total Professional Personnel 24,605.32
Public School Graduates: Service Personnel 13,938.19
Total Number 16,719 Total Personnel 38,543.51
Percent - 4 Year Cohort 84.46%
Average Contracted Salaries:
High School Equivalency Assessment (GED/TASC)*: Professional Personnel 47,809.90$
Certificates Earned 3,422 Classroom Teachers 45,086.43$
Prof. Student Support Pers. 48,769.24$
Number of Public Schools: Service Personnel 26,802.81$
Elementary 413
Middle 154 Average Salary - Beginning Teacher 32,584.99$
High 116
Vocational/Alternative 44 State Minimum Required Salary Ranges:
Total Public Schools 727 Teachers (Per Degree Classification):
AB 31,675$ - 52,484$
No. Private/Parochial Schools 129 AB + 15 sem. hrs. 32,528$ - 53,337$
MA 34,487$ - 55,296$
Revenues by Source: MA + 15 sem. hrs. 35,344$ - 56,153$
Local 31.9% 1,109,612,850$ MA + 30 sem. hrs. 36,201$ - 57,010$
State 58.3% 2,029,510,441 MA + 45 sem. hrs. 36,962$ - 57,771$
Federal 9.8% 340,557,246 Doctorate 38,088$ - 58,897$
Total 100.0% 3,479,680,537$
Student Transportation:
Total Expenditures: No. of school buses (Excl. spares) 3,074
Current Operations 3,213,628,819$ No. of students transported 222,112
Capital Outlay 262,840,618 Pct. of students transported 79.0%
Debt Service 53,373,418 No. of bus miles traveled 43,564,968
Total 3,529,842,855$
Average Number of Students per School:
Per Pupil Expenditures: Elementary/Middle Schools 355.5
For Current Operations 11,239.67$ High Schools (Excluding CTE) 684.9
QUICK FACTS ON EDUCATION IN
*The WVDE changed from using the General Educational Development (GED)® exam to the Test Assessing Secondary Completion (TASC) exam
during the 2013-14 school year to determine whether the test taker has attained high school-level academic skills.

This Page Intentionally Left Blank

PUBLIC EDUCATION IN WEST VIRGINIASOURCE BOOK 2014
Table of Contents
Topics Page
Property Taxes:
Executive Summary ‐ Ad Valorem Taxes . . . . . . . . . . . . . . . . . . . . . . . . . . . . . . . . . . . . . . . . . . . . 1
Taxable Assessed Valuations . . . . . . . . . . . . . . . . . . . . . . . . . . . . . . . . . . . . . . . . . . . . . . . . . . . . . 7
Levy Rates . . . . . . . . . . . . . . . . . . . . . . . . . . . . . . . . . . . . . . . . . . . . . . . . . . . . . . . . . . . . . . . . . . . . 8
Projected Gross Tax Collections . . . . . . . . . . . . . . . . . . . . . . . . . . . . . . . . . . . . . . . . . . . . . . . . . . 9
Local Share Calculations . . . . . . . . . .. . . . . . . . . . . . . . . . . . . . . . . . . . . . . . . . . . . . . . . . . . . . . . . 10
Excess Levies In Effect . . . . . . . . . . . . . . . . . . . . . . . . . . . . . . . . . . . . . . . . . . . . . . . . . . . . . . . . . . 11
Bonding Potential . . . . . . . . . . . . . . . . . . . . . . . . . . . . . . . . . . . . . . . . . . . . . . . . . . . . . . . . . . . . . 12
Bond Elections Attempted Since 1971 ‐ Alpahbetical . . . . . . . . . . . . . . . . . . . . . . . . . . . . . . . . . 13
Bond Elections Attempted Since 1971 ‐ Chronological . . . . . . . . . . . . . . . . . . . . . . . . . . . . . . . . 19
Public School Support Program (PSSP):
Abbreviated Executive Summary ‐ PSSP . . . . . . . . . . . . . . . . . . . . . . . . . . . . . . . . . . . . . . . . . . . 25
Summary of Basic State Allowances . . . . . . . . . . . . . . . . . . . . . . . . . . . . . . . . . . . . . . . . . . . . . . . 28
State Aid on a Percentage Basis . . . . . . . . . . . . . . . . . . . . . . . . . . . . . . . . . . . . . . . . . . . . . . . 29
State Aid on a Percentage Basis ‐ Sorted . . . . . . . . . . . . . . . . . . . . . . . . . . . . . . . . . . . . . . . . . . . 30
Final Computations . . . . . . . . . . . . . . . . . . . . . . . . . . . . . . . . . . . . . . . . . . . . . . . . . . . . . . . . . . . . 31
Final PEIA Allocations . . . . . . . . . . . . . . . . . . . . . . . . . . . . . . . . . . . . . . . . . . . . . . . . . . . . . . . . . . . 45
Final Retirement System Allocations . . . . . . . . . . . . . . . . . . . . . . . . . . . . . . . . . . . . . . . . . . . . . . . 46
Approved Budgets ‐ County Boards of Education:
Executive Summary ‐ Proposed Budgets . . . . . . . . . . . . . . . . . . . . . . . . . . . . . . . . . . . . . . . . . . . 47
Summary of Approved Proposed Budgets . . . . . . . . . . . . . . . . . . . . . . . . . . . . . . . . . . . . . . . . . . 51
Revenues and Expenditures:
Total Revenues Classified By Source ‐ Alphabetical . . . . . . . . . . . . . . . . . . . . . . . . . . . . . . . . . . 53
Total Revenues Classified By Source ‐ Sorted Order . . . . . . . . . . . . . . . . . . . . . . . . . . . . . . . . . . 54
Summary of Local Revenues . . . . . . . . . . . . . . . . . . . . . . . . . . . . . . . . . . . . . . . . . . . . . . . . . . . . . 55
Summary of State Revenues . . . . . . . . . . . . . . . . . . . . . . . . . . . . . . . . . . . . . . . . . . . . . . . . . . . . . 57
Summary of Federal Revenues . . . . . . . . . . . . . . . . . . . . . . . . . . . . . . . . . . . . . . . . . . . . . . . . . . . 59
Description of Federal Progams . . . . . . . . . . . . . . . . . . . . . . . . . . . . . . . . . . . . . . . . . . . . . . . . . . 61
Total Expenditures ‐ Alphabetical . . . . . . . . . . . . . . . . . . . . . . . . . . . . . . . . . . . . . . . . . . . . . . . . . 69
Total Expenditures ‐ Sorted Order . . . . . . . . . . . . . . . . . . . . . . . . . . . . . . . . . . . . . . . . . . . . . . . . 70
Total Expenditures Classified by Function . . . . . . . . . . . . . . . . . . . . . . . . . . . . . . . . . . . . . . . . . . 71
Current Expenditures Classified by Object of Expenditure . . . . . . . . . . . . . . . . . . . . . . . . . . . . . 75
Professional Personnel Substitute Costs as a Percent of Regular Salary Costs . . . . . . . . . . . . . 85
Professional Personnel Substitute Costs as a Percent of Regular Salary Costs ‐ Sorted . . . . . . 86
Service Personnel Substitute Costs as a Percent of Regular Salary Costs . . . . . . . . . . . . . . . . . 87
Service Personnel Substitute Costs as a Percent of Regular Salary Costs ‐ Sorted . . . . . . . . . . 88
‐ i ‐

PUBLIC EDUCATION IN WEST VIRGINIASOURCE BOOK 2014
Table of Contents (Continued)
Topics Page
Revenues and Expenditures (Continued):
Expenditures for Student Transportation . . . . . . . . . . . . . . . . . . . . . . . . . . . . . . . . . . . . . . . . . . . 89
Expenditures for Professional Development . . . . . . . . . . . . . . . . . . . . . . . . . . . . . . . . . . . . . . . . . 91
Expenditures for Instructional Supplies . . . . . . . . . . . . . . . . . . . . . . . . . . . . . . . . . . . . . . . . . . . . . 92
Per Pupil Expenditures ‐ Alphabetical . . . . . . . . . . . . . . . . . . . . . . . . . . . . . . . . . . . . . . . . . . . . . . 93
Per Pupil Expenditures ‐ Sorted . . . . . . . . . . . . . . . . . . . . . . . . . . . . . . . . . . . . . . . . . . . . . . . . . . . 94
Student Enrollment Data:
Summary of Headcount Enrollment ‐ Alphabetical . . . . . . . . . . . . . . . . . . . . . . . . . . . . . . . . . . . . 95
Summary of Headcount Enrollment ‐ Sorted . . . . . . . . . . . . . . . . . . . . . . . . . . . . . . . . . . . . . . . . . 96
Headcount Enrollment ‐ 2nd Month ‐ By Grade . . . . . . . . . . . . . . . . . . . . . . . . . . . . . . . . . . . . . . 97
Advanced Placement Enrollment . . . . . . . . . . . . . . . . . . . . . . . . . . . . . . . . . . . . . . . . . . . . . . . . . . 99
Special Education Enrollment . . . . . . . . . . . . . . . . . . . . . . . . . . . . . . . . . . . . . . . . . . . . . . . . . . . . . 100
Average Daily Attendance . . . . . . . . . . . . . . . . . . . . . . . . . . . . . . . . . . . . . . . . . . . . . . . . . . . . . . . . 101
Comparison of ADA to FTE Enrollment . . . . . . . . . . . . . . . . . . . . . . . . . . . . . . . . . . . . . . . . . . . . . 102
Comparison of ADA to FTE Enrollment ‐ Sorted. . . . . . . . . . . . . . . . . . . . . . . . . . . . . . . . . . . . . . 103
Comparison of Enrollment Factors . . . . . . . . . . . . . . . . . . . . . . . . . . . . . . . . . . . . . . . . . . . . . . . . . 105
Personnel Data:
Number of Personnel Employed by Position ‐ Statewide . . . . . . . . . . . . . . . . . . . . . . . . . . . . . . . 113
Classification of Professional Personnel by Funding Source ‐ Statewide . . . . . . . . . . . . . . . . . . 117
Classification of Service Personnel by Funding Source ‐ Statewide . . . . . . . . . . . . . . . . . . . . . . . 118
Distribution of Professional Pers. by Salary Class. & Yrs. Exp. ‐ Statewide . . . . . . . . . . . . . . . . . 119
Distribution of Service Personnel by Pay Grade and Yrs. Exp. ‐ Statewide . . . . . . . . . . . . . . . . . 120
Total Number of Personnel Employed by County Boards ‐ Alphabetical . . . . . . . . . . . . . . . . . . 121
Total Number of Personnel Employed by County Boards ‐ Sorted . . . . . . . . . . . . . . . . . . . . . . . 122
Pupil to Teacher Ratio by County ‐ Alphabetical . . . . . . . . . . . . . . . . . . . . . . . . . . . . . . . . . . . . . . 123
Pupil to Teacher Ratio by County ‐ Sorted . . . . . . . . . . . . . . . . . . . . . . . . . . . . . . . . . . . . . . . . . . . 124
Pupil to Administrator Ratio by County ‐ Alphabetical . . . . . . . . . . . . . . . . . . . . . . . . . . . . . . . . . 125
Pupil to Administrator Ratio by County ‐ Sorted by Central Office Administrators . . . . . . . . . . 126
Pupil to Administrator Ratio by County ‐ Sorted by School Administrators . . . . . . . . . . . . . . . . 127
Pupil to Administrator Ratio by County ‐ Sorted by Total Administrators . . . . . . . . . . . . . . . . . 128
Salary Data:
Average Contracted Salaries by Position ‐ Statewide . . . . . . . . . . . . . . . . . . . . . . . . . . . . . . . . . . 129
Average Contracted Salaries ‐ All Professional Personnel by County ‐ Alphabetical . . . . . . . . . 133
Average Contracted Salaries ‐ All Professional Personnel by County ‐ Sorted . . . . . . . . . . . . . . 134
Average Contracted Salaries ‐ Classroom Teachers by County ‐ Alphabetical . . . . . . . . . . . . . . 135
Average Contracted Salaries ‐ Classroom Teachers by County ‐ Sorted . . . . . . . . . . . . . . . . . . . 136
‐ ii ‐
PUBLIC EDUCATION IN WEST VIRGINIASOURCE BOOK 2014
Table of Contents (Continued)
Topics Page
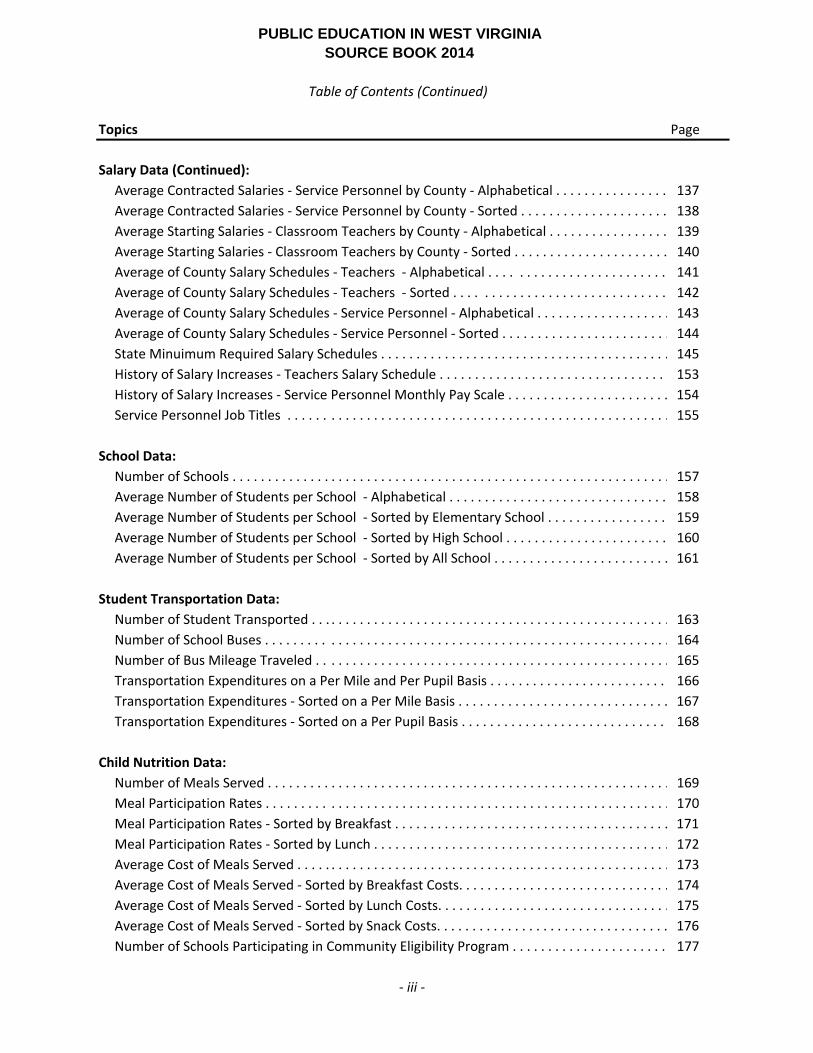
Salary Data (Continued):
Average Contracted Salaries ‐ Service Personnel by County ‐ Alphabetical . . . . . . . . . . . . . . . . 137
Average Contracted Salaries ‐ Service Personnel by County ‐ Sorted . . . . . . . . . . . . . . . . . . . . . 138
Average Starting Salaries ‐ Classroom Teachers by County ‐ Alphabetical . . . . . . . . . . . . . . . . . 139
Average Starting Salaries ‐ Classroom Teachers by County ‐ Sorted . . . . . . . . . . . . . . . . . . . . . . 140
Average of County Salary Schedules ‐ Teachers ‐ Alphabetical . . . . . . . . . . . . . . . . . . . . . . . . . 141
Average of County Salary Schedules ‐ Teachers ‐ Sorted . . . . . . . . . . . . . . . . . . . . . . . . . . . . . . 142
Average of County Salary Schedules ‐ Service Personnel ‐ Alphabetical . . . . . . . . . . . . . . . . . . . 143
Average of County Salary Schedules ‐ Service Personnel ‐ Sorted . . . . . . . . . . . . . . . . . . . . . . . . 144
State Minuimum Required Salary Schedules . . . . . . . . . . . . . . . . . . . . . . . . . . . . . . . . . . . . . . . . . 145
History of Salary Increases ‐ Teachers Salary Schedule . . . . . . . . . . . . . . . . . . . . . . . . . . . . . . . . 153
History of Salary Increases ‐ Service Personnel Monthly Pay Scale . . . . . . . . . . . . . . . . . . . . . . . 154
Service Personnel Job Titles . . . . . . . . . . . . . . . . . . . . . . . . . . . . . . . . . . . . . . . . . . . . . . . . . . . . . . 155
School Data:
Number of Schools . . . . . . . . . . . . . . . . . . . . . . . . . . . . . . . . . . . . . . . . . . . . . . . . . . . . . . . . . . . . . . 157
Average Number of Students per School ‐ Alphabetical . . . . . . . . . . . . . . . . . . . . . . . . . . . . . . . 158
Average Number of Students per School ‐ Sorted by Elementary School . . . . . . . . . . . . . . . . . 159
Average Number of Students per School ‐ Sorted by High School . . . . . . . . . . . . . . . . . . . . . . . 160
Average Number of Students per School ‐ Sorted by All School . . . . . . . . . . . . . . . . . . . . . . . . . 161
Student Transportation Data:
Number of Student Transported . . . . . . . . . . . . . . . . . . . . . . . . . . . . . . . . . . . . . . . . . . . . . . . . . . . 163
Number of School Buses . . . . . . . . . . . . . . . . . . . . . . . . . . . . . . . . . . . . . . . . . . . . . . . . . . . . . . . . . 164
Number of Bus Mileage Traveled . . . . . . . . . . . . . . . . . . . . . . . . . . . . . . . . . . . . . . . . . . . . . . . . . . 165
Transportation Expenditures on a Per Mile and Per Pupil Basis . . . . . . . . . . . . . . . . . . . . . . . . . 166
Transportation Expenditures ‐ Sorted on a Per Mile Basis . . . . . . . . . . . . . . . . . . . . . . . . . . . . . . 167
Transportation Expenditures ‐ Sorted on a Per Pupil Basis . . . . . . . . . . . . . . . . . . . . . . . . . . . . . 168
Child Nutrition Data:
Number of Meals Served . . . . . . . . . . . . . . . . . . . . . . . . . . . . . . . . . . . . . . . . . . . . . . . . . . . . . . . . . 169
Meal Participation Rates . . . . . . . . . . . . . . . . . . . . . . . . . . . . . . . . . . . . . . . . . . . . . . . . . . . . . . . . . 170
Meal Participation Rates ‐ Sorted by Breakfast . . . . . . . . . . . . . . . . . . . . . . . . . . . . . . . . . . . . . . . 171
Meal Participation Rates ‐ Sorted by Lunch . . . . . . . . . . . . . . . . . . . . . . . . . . . . . . . . . . . . . . . . . . 172
Average Cost of Meals Served . . . . . . . . . . . . . . . . . . . . . . . . . . . . . . . . . . . . . . . . . . . . . . . . . . . . . 173
Average Cost of Meals Served ‐ Sorted by Breakfast Costs. . . . . . . . . . . . . . . . . . . . . . . . . . . . . . 174
Average Cost of Meals Served ‐ Sorted by Lunch Costs. . . . . . . . . . . . . . . . . . . . . . . . . . . . . . . . . 175
Average Cost of Meals Served ‐ Sorted by Snack Costs. . . . . . . . . . . . . . . . . . . . . . . . . . . . . . . . . 176
Number of Schools Participating in Community Eligibility Program . . . . . . . . . . . . . . . . . . . . . . 177
‐ iii ‐

This Page Intentionally Left Blank

PROPERTY
TAXES


EXECUTIVE SUMMARY
AD VALOREM PROPERTY TAXES
FOR SCHOOL PURPOSES
2013-14 YEAR
Property Classes: All property in the State of West Virginia is classified as follows for ad valorem tax purposes (WVC §11-8-5):
Class I All tangible personal property employed exclusively in agriculture, including horticulture and grazing; all products of agriculture, including livestock, while owned by the producer; all notes, bonds and accounts receivable, stocks and any other evidences of indebtedness.
Class II All property owned, used and occupied by the owner exclusively for residential purposes;
all farms, including land used for horticulture and grazing, occupied and cultivated by their owners or bona fide tenants.
Class III All real and personal property situated outside of municipalities, exclusive of Class I and
II property.
Class IV All real and personal property situated inside of municipalities, exclusive of Class I and II property.
Note: A five year phase-in began in 1998 to exempt intangible personal property from assessment for property tax purposes and now intangible personal property is fully exempt from property taxation (WVC §11-1C-1b). Consequently, the taxable assessed valuation of Class I property was zero in all fifty-five counties for the year.
Maximum Levy Rates – All Levying Bodies:
According to Article X,§1, of the State Constitution and WVC §11-8-6, the rates of levy for all levying bodies in the State for the regular property tax levy cannot exceed the following rates for each class of property: 50¢ per each $100 of assessed valuation for Class I property; $1.00 for Class II property; $1.50 for Class III property; and $2.00 for Class IV property. According to the Constitution, the levy rates are to be apportioned among the various levying bodies by the Legislature, which has been done by various statutes. The maximum levy rates specified by statute (WVC §11-8-6a through §11-8-7) for each type of levying body for Class I property are:
Boards of education - 22.95¢ per each $100 of assessed valuation County governments - 14.30¢ per each $100 of assessed valuation Municipalities - 12.50¢ per each $100 of assessed valuation State - 00.25¢ per each $100 of assessed valuation Total – All levying bodies - 50.00¢ per each $100 of assessed valuation
The Constitution also grants all levying bodies the authority to increase the maximum regular levy rates, as discussed above, by allowing a levying body to submit the question of an additional or excess levy to the voters of the taxing unit affected. For county boards of education, 50% of the voters must approve the additional levies, the levy rates cannot exceed 100% of the maximum regular rates authorized, and the additional levies cannot extend beyond five years. For municipalities and county governments, 60% of the voters must approve the additional levies, the levy rates cannot exceed 50% of the maximum regular levy rates authorized, and the additional levies cannot extend beyond three years.
Tax Increment Financing: Pursuant to the provisions of WVC §7-11B-1 et seq. the Tax Increment Financing (TIF) Act was enacted in 2002, which authorized the issuance of revenue bonds or other obligations by counties and cities to assist in
-1-

financing qualified economic development or redevelopment projects that benefit public health, welfare and safety. The bonds or other obligations are payable from property tax revenues generated by the increases in value of property located within the development or redevelopment project area or district due to capital investment in the project. Property taxes from the regular levy that is attributable to any increase in the aggregate assessed valuation of property in the TIF project area (increment tax increase) are deposited into the Tax Increment Financing Fund to service the debt. The tax amount is determined by comparing the property’s current assessed valuation to the base assessed valuation, which is the assessed valuation of the property prior to the designation of the project area. Taxes on the increased assessed valuation from any excess or bond levy is distributed to each levy body in which the TIF project is located.
Taxable Assessed Valuations: The total statewide aggregate taxable assessed valuation for the 2013-14 fiscal year (2012-13 Tax Year) increased by $4.6 billion over the previous year, an overall increase of 5.93%. Among the individual counties, taxable assessed valuations increased in forty-five (45) counties and decreased in ten (10). The total assessed valuations for each county are presented in Attachment 1. Comparable total taxable assessed valuations statewide for the most recent two years are:
2012-13 2013-14 Difference Percent
Non-public utility property $ 69,480,676,149 $ 73,616,287,514 $ 4,135,611,365 5.95% Public utility property 8,460,701,440 8,950,607,400 489,905,960 5.79%
Total $ 77,941,377,589 $ 82,566,894,914 $ 4,625,517,325 5.93%
Levy Rates – County Boards of Education:
As discussed in a preceding section, county boards of education are considered to be local levying bodies, and as such have the authority under State statutes to levy taxes on the various classes of property specified in WVC §11-8-5. However, as a result of the fair and equitable property valuation program (WVC §11-1C-1 et seq.), which was implemented in 1990 to ensure that all property in the State is assessed at 60% of fair market value, the levy rates for county boards of education regular levies are set by the Legislature so that the rates are uniform throughout the State. In addition, a provision of the fair and equitable property valuation program requires that the regular levy rates be reduced so that the amount of the projected gross tax revenues does not increase by more than 2% over the projected gross tax revenues of the previous year, unless the Legislature holds a public hearing. Excluded from the calculation are increases in projected tax collections due to new construction, improvements to existing real property, or newly acquired personal property. The amounts to be paid to the Assessor’s Valuation Fund are also excluded from the calculation. The levy rates for the 2013-14 year did not need to be reduced because the assessed valuation did not increase by more than the 2% limit. Therefore, the levy rates of the regular levy for school districts for the year remained the same as they were for the previous year, which are:
Class I 19.40¢ per $100 of assessed valuation Class II 38.80¢ per $100 of assessed valuation Class III 77.60¢ per $100 of assessed valuation Class IV 77.60¢ per $100 of assessed valuation
The rates of levy set by a levying body for each class of property must remain in the same proportion as the maximum authorized levy rates. Therefore, for Class II property, the levy rates must be twice the rates for Class I property, and for classes III and IV property, the levy rates must be four times the rates for Class I property.
-2-

The county boards have the authority to set the levy rates for all other property tax levies (excess, permanent improvement, and bond). The Class I levy rates of all county boards of education for the 2013-14 year are reflected in Attachment 2.
Summary of Projected Gross Tax Collections – County Boards of Education:
The total projected gross tax collections for county boards from all levies, statewide, for the 2013-14 year is $1.048 billion, an increase of $58.2 million or 5.88% over the previous year’s amount. The total projected gross tax collections for each county board by levy are presented in Attachment 3. The total projected gross tax collections from all levies, statewide, are:
2012-13 2013-14 Difference Percent
Regular Levy $ 483,004,100 $ 514,371,448 $ 31,367,348 6.49% Excess Levy 448,158,490 475,214,512 27,056,022 6.04% Bond Levy 55,779,349 54,900,123 (879,226) (1.58)% Permanent Improvement Levy 2,947,121 3,652,888 705,767 23.95% Total $ 989,889,060 $ 1,048,138,971 $ 58,249,911 5.88%
Regular Levy Collections – County Boards of Education:
The total projected regular levy gross tax collections, statewide, for the 2013-14 year is $514.4 million, an increase of $31.4 million or 6.49% over the previous year’s amount. Under the Public School Support Program (PSSP), which is commonly referred to as the State Aid funding formula, 90% of the project gross tax collections, plus an allowance of 5% for uncollectible taxes (discounts, exonerations and delinquencies) and other allowance are subtracted to arrive at the state aid. See a subsequent section for a more detailed discussion of the calculation of local share. The total projected gross tax collections for each county board by levy are presented in Attachment 3.
Excess Levies – County Boards of Education: Pursuant to the provisions of WVC §11-8-16, county boards of education may impose an excess levy in addition to the regular levy, if approved by at least a majority of the voters who cast their ballots during the election. The election may be held during a primary, general or special election and the levy may not extend beyond five years. In order to authorize the election, a county board must enter into its record of proceedings an order setting forth: (1) the purpose for which additional funds are needed; (2) the amount for each purpose; (3) the total amount needed; (4) the separate and aggregate assessed valuation of each class of taxable property within its jurisdiction; (5) the proposed additional rate of levy in cents on each class of property; (6) the proposed number of years, not to exceed five, to which the additional levy applies; and (7) the fact that the local levying body will or will not issue bonds, as provided by this section of the Code, upon approval of the increased levy. The maximum levy rates that county boards may impose are the same as those authorized for the regular levy, which are: 22.95¢ / $100 of assessed valuation for Class I property; 45.90¢ / $100 of assessed valuation for Class II property; and 91.80¢ / $100 of assessed valuation for classes III and IV property. Upon approval of an increased levy, a county board may issue bonds in an amount not to exceed the amount of the increased levy plus the total interest thereon, but the term of the bonds may not extend beyond the period of the excess levy. Generally, boards do not elect to issue bonds for an excess levy, and none of the boards that currently have excess levies in effect have made such election. Although there are no restrictions as to what purposes may be included in an excess levy call, other than they must be purposes for which the county board has statutory authority to expend public funds, excess levies are generally imposed to provide additional operating revenues. These include such expenditures as the
-3-

employment of additional personnel; payment of county salary supplements and other employment benefit costs, such as optical and dental medical coverage; purchase of textbooks and other instructional materials; operation and maintenance of facilities; and the support of community organizations, such as public libraries. Forty-three county boards of education have excess levies in effect for the 2013-14 year, which is one less than the previous year. Preston County Schools was not able to renew its excess levy. The excess levies of four other county boards of education were scheduled to expire at June 30, 2013, but they were able to renew their levies for the upcoming years. It should be noted that the total collections from the Calhoun County Schools excess levy, however, are dedicated completely to support the Calhoun County Public Library. The total projected excess levy gross tax collections for the year is $475.2 million, an increase of $27.1 million or 6.04% increase over the previous year’s amount. As mentioned in the preceding section, the projected gross tax collections by purpose are presented in Attachment 3. The excess levy rates for the year range from 100% of the maximum rates authorized by statute (22.95¢ for Class I property) to a low of 1.7% (0.40¢ for Calhoun County Schools). Twenty-one county boards set their excess levy rates at 100% of the maximum allowed by statute, the same number as the previous year. As discussed in a preceding section, the levy rates for Class I property for all fifty-five county boards are reflected in Attachment 2. If all fifty-five county boards were able to pass an excess levy at the maximum rates allowed, the potential excess levy gross tax collections would be $612.8 million, which leaves an unused excess levy tax capacity among the fifty-five school districts of $137.6 million.
Bond Levies – County Boards of Education:
County boards of education are also authorized, pursuant to the provisions of WVC §13-1-1 et seq., to incur debt through the issuance of bonds, if approved by at least a majority of the voters of a district who cast their ballots during the election. Bonds can be issued for the purpose of acquiring, constructing, and erecting, enlarging, extending, reconstructing, or improving any building or facility, or for furnishing, equipping and acquiring or procuring the necessary apparatus for any building for which the board is authorized to levy taxes or expend public funds. County boards, however, are limited on the amount of indebtedness that they may incur by any bond issuance to no more than 5% of the taxable assessed valuation of the real and personal property within the school district. In addition, bond levies may not extend beyond 34 years. Upon passage of a bond levy, county boards are required to levy and collect each year sufficient property taxes to pay the principal and interest maturing in such year, together with any deficiencies for prior years. Twenty-two county boards have bond levies in effect for the 2013-14 year, one less than the previous year. The total projected gross tax collections for bond purposes for the year is $54.9 million, a decrease of $879 thousand over the previous year’s amount. As discussed in a preceding section, the projected gross tax collections by purpose for each county board are presented in Attachment 3.
Permanent Improvement Levies – County Boards of Education:
County boards are also authorized, pursuant to the provisions of WVC §18-9B-14, to establish a permanent improvement fund and to allocate a portion of their regular levy tax collections to such fund. The levy rates so dedicated may not exceed 1.5¢ / $100 of assessed valuation for Class I property, 3.0¢ /$100 of assessed valuation for Class II property; and 6.0¢ / $100 of assessed valuation for classes III and IV property. The proceeds of the fund may be used only for the support of building and permanent improvement projects. Fourteen county boards are maintaining a permanent improvement fund during the 2013-14 year. Five of the county boards allocate a portion of their gross tax collections from their regular levy for this purpose; they are: Cabell, Mingo, Monroe, Wayne, and Wyoming. Rather than dedicate a portion of their regular levy collections to the fund, the other nine county boards periodically transfer available funds from the general current expense fund or other funds to the permanent improvement fund.
-4-

The total projected permanent improvement gross tax collections for the 2013-14 year for the five county boards that have dedicated a portion of their regular tax collections for this purpose is $3.7 million, an increase of $706 thousand over the previous year’s amount. As discussed in a preceding section, the projected gross tax collections by purpose for each county board are presented in Attachment 3. Funds in the fund may be accumulated from year to year, but the total assets of the fund may not exceed 25% of the district’s Public School Support Allowance for the year.
Designation of Levies for Public Libraries and Park Board: Through special acts of the Legislature passed over the years, a portion of the tax levies of eleven county boards of education used to be designated for public libraries, nine from their regular levies and two (Cabell and Lincoln) from their excess levies. The West Virginia Supreme Court ruled in 2013, however, that the special acts requiring county boards to set aside a portion of their levy funds for the support of public libraries from their regular levies were unconstitutionally. The Court let stand as constitutional, however, the support of the public libraries by the two county boards (Cabell and Lincoln) that have included the funding requirement in their excess levy calls. The Court also let stand the support Cabell County Schools provides to the Huntington Park Board, since this support is also included in the district’s excess levy call.
Assessment Date: The assessed valuation of all property other than public utility property is determined locally by the county assessor and is based on the assessment date of July 1. For the 2013-14 fiscal year (2012-13 tax year), the assessment date was July 1, 2012. The assessed valuation of public utility property is established by the Board of Public Works from appraised valuations provided by the state tax commissioner and is based on the assessment date of December 31st. For the 2013-14 Fiscal Year, the assessment date was December 31, 2011.
Levy Dates:
The rates of levy are imposed on the assessed valuation of all taxable real and personal property as certified by the county assessors on March 3rd of each year. Each levying body in the State is required to hold a meeting or meetings between the seventh and twenty-eighth days of March each year to ascertain the fiscal condition of the entity and determine the amount to be raised from the levy of taxes. The proposed levy rates are submitted to the State Auditor for approval. The session is then to stand adjourned until the third Tuesday in April. On the third Tuesday in April, every levying body in the State is required to reconvene the previous meeting(s) held between the seventh and twenty-eighth days of March to officially enter the levies and issue a levy order, after having received approval from the State Auditor. The assessed valuation of property for the current year is used to determine the projected tax collections for the succeeding year. For example, the assessed valuation of property for the 2012-13 tax year, as certified by the assessor on March 3, 2013, was used to determine the projected tax collections for the 2013-14 fiscal year. After the assessments are certified, the county assessor reports the assessed valuations to the county sheriff, who is responsible for applying the levy rates, as established by all the levying bodies in the county, to arrive at the amount of property taxes due on each parcel of property within the county. The sheriff is also responsible for preparing and issuing the tax tickets to all property owners and collecting the taxes.
Tax Payment Date: The taxes on real property and the interest and other charges upon such taxes attach as an enforceable lien on the first day of July each year. There is no lien denominated as such on personal property. However, statutes provide that the sheriff of a county may distrain for delinquent taxes any goods and chattels belonging to a person assessed.
-5-
All current taxes assessed on real and personal property may be paid in two installments. The first installment is payable on September first of the year for which the assessment is made, and becomes delinquent on October first, and the second installment is payable on the first day of the following March and becomes delinquent on April first. Taxes paid on or before the date when they are payable, including both first and second installments, are subject to a discount of two and one-half percent. If taxes are not paid on or before the date on which they become delinquent, including both first and second installments, interest at the rate of nine percent per annum is added from the date they become delinquent until paid.
Local Share Calculations – County Boards of Education: The Public School Support Program (PSSP) is a plan of financial support for the public schools in the State of West Virginia, which specifies statutorily the responsibilities of both the State and the fifty-five county school districts. The State’s responsibility for the basic program allowance is the total of the allowances calculated under steps 1 through 7, less the aggregate amount calculated as the school district’s local share. Local share is a computation of each school district's projected regular levy property tax collections for the year. Projected excess levy tax collections are not included. The local share calculated for a particular year is based on the assessed valuations on which the taxes will be collected for that year. For example, the local share calculations for the 2013-14 fiscal year were based on the assessed valuation certified by each county assessor as of March 3, 2013. Local share is computed by multiplying the taxable assessed valuation of all property in the district for the current fiscal year as certified by the county assessor by 90% of the regular levy rates for the year as set by the Legislature and then deducting five percent (5%) as an allowance for discounts, exonerations, delinquencies, and reducing the amount further by the amount that is to be paid to the Assessor's Valuation Fund, which generally is 2% for each county board. In addition, according to WVC §11-8-6f(c), in any school district in which tax increment financing is in effect pursuant to the provisions of WVC §7-11B-1 et seq., the assessed valuation used for the local share calculation is the base assessed valuation of the property located within the project area in the year the project was initiated.
Furthermore, for the school districts that are designated as a “growth county” and have by resolution elected to participate in the Growth County School Facilities Act established by WVC §11-8-6f (d), the estimated revenues from application of the regular school board levy rate to the taxable assessed valuation of new property and improvements to property is subtracted from the local share calculation. The local share calculations for the 2013-14 year are reflected in Attachment 4. Attachment 5 reflects the percent of the total public school program allowance that is comprised by state aid and local share on an alphabetical basis and Attachment 6 reflects the same information sorted by percent of net state aid to total allowance. Note that for the 2013-14 year, the percent of the total program allowance comprised by state aid ranges from a high of 90.59% for Wirt County Schools to a low of 37.32% for Marshall County Schools. Prop Tax Summary 14
-6-

COUNTY BOARDS OF EDUCATION COUNTY BOARDS OF EDUCATION
TAXABLE ASSESSED VALUATIONS COMPARISON OF TAXABLE ASSESSED VALUATIONS
FOR THE 2013-14 FISCAL YEAR FOR THE 2012-13 AND 2013-14 FISCAL YEARS
Class I Class II Class III Class IV Total
Assessed Assessed Assessed Assessed Assessed
County Valuations Valuations Valuations Valuations Valuations
Barbour - 199,339,585 292,886,588 62,836,170 555,062,343
Berkeley - 2,758,515,547 1,464,593,815 431,013,744 4,654,123,106
Boone - 202,810,631 1,359,260,473 63,595,596 1,625,666,700
Braxton - 159,734,484 256,174,489 39,698,119 455,607,092
Brooke - 269,705,472 109,192,702 465,549,916 844,448,090
Cabell - 1,333,070,050 927,636,995 1,169,723,230 3,430,430,275
Calhoun - 80,915,232 129,622,278 9,961,252 220,498,762
Clay - 69,828,046 202,647,602 11,989,180 284,464,828
Doddridge - 122,792,020 479,582,277 10,465,683 612,839,980
Fayette - 512,742,130 707,335,475 246,956,366 1,467,033,971
Gilmer - 88,125,426 209,589,365 26,520,137 324,234,928
Grant - 258,184,908 667,266,621 45,673,257 971,124,786
Greenbrier - 727,393,530 721,006,931 228,213,738 1,676,614,199
Hampshire - 736,123,970 518,063,014 50,328,614 1,304,515,598
Hancock - 361,016,090 316,715,571 280,533,914 958,265,575
Hardy - 439,789,418 367,189,394 94,529,713 901,508,525
Harrison - 1,198,528,596 1,648,915,748 931,637,944 3,779,082,288
Jackson - 449,329,178 625,334,845 142,056,232 1,216,720,255
Jefferson - 1,837,314,930 847,249,885 364,890,027 3,049,454,842
Kanawha - 3,657,259,413 2,863,669,967 3,264,058,541 9,784,987,921
Lewis - 278,497,536 631,677,401 65,232,077 975,407,014
Lincoln - 131,222,434 326,562,161 16,085,311 473,869,906
Logan - 276,104,236 1,166,155,152 118,340,213 1,560,599,601
Marion - 1,022,173,290 859,769,816 589,942,452 2,471,885,558
Marshall - 380,364,545 2,053,878,470 292,227,768 2,726,470,783
Mason - 374,597,696 628,056,551 99,161,376 1,101,815,623
McDowell - 48,133,581 817,407,450 93,106,206 958,647,237
Mercer - 687,276,912 645,520,010 337,723,179 1,670,520,101
Mineral - 560,576,341 396,663,812 89,379,858 1,046,620,011
Mingo - 150,276,786 945,772,071 100,570,574 1,196,619,431
Monongalia - 1,931,442,304 1,995,500,905 917,041,956 4,843,985,165
Monroe - 218,980,241 141,668,997 16,176,480 376,825,718
Morgan - 645,773,628 312,483,617 43,812,059 1,002,069,304
Nicholas - 343,918,172 565,043,723 130,756,430 1,039,718,325
Ohio - 774,765,354 441,393,439 645,646,595 1,861,805,388
Pendleton - 254,626,844 135,707,664 15,643,248 405,977,756
Pleasants - 115,019,252 422,236,743 43,711,844 580,967,839
Pocahontas - 261,332,112 361,875,998 32,638,930 655,847,040
Preston - 606,961,886 547,863,900 116,350,486 1,271,176,272
Putnam - 1,437,494,294 1,230,416,971 184,618,156 2,852,529,421
Raleigh - 1,131,240,824 1,512,516,285 520,914,781 3,164,671,890
Randolph - 456,956,546 489,319,139 160,942,926 1,107,218,611
Ritchie - 191,895,242 200,259,755 49,683,087 441,838,084
Roane - 223,995,640 183,729,969 45,174,200 452,899,809
Summers - 179,824,668 184,357,086 49,164,307 413,346,061
Taylor - 311,741,940 332,688,498 66,852,491 711,282,929
Tucker - 174,889,834 342,867,489 55,067,043 572,824,366
Tyler - 141,193,293 211,672,979 32,942,095 385,808,367
Upshur - 415,067,793 579,087,337 127,392,364 1,121,547,494
Wayne - 421,997,060 694,599,815 147,176,954 1,263,773,829
Webster - 51,280,987 186,766,674 19,160,068 257,207,729
Wetzel - 186,052,446 912,619,873 143,700,276 1,242,372,595
Wirt - 73,043,053 48,144,153 10,038,720 131,225,926
Wood - 1,623,473,052 809,380,781 756,494,139 3,189,347,972
Wyoming - 77,653,724 787,124,663 56,709,308 921,487,695
Total - 31,622,362,202 36,814,723,382 14,129,809,330 82,566,894,914
Source: Levy Order and Rate Sheet submitted by each county board for the 2013-14 fiscal year.
OSF
06/07/13
Taxable Assessed Valuations 14 -7-

COUNTY BOARDS OF EDUCATION
LEVY RATES - CLASS I PROPERTY
FOR THE 2013-14 FISCAL YEAR
Current Permanent Excess Percent Total
Expense Improvement Levy of Maximum Bond LevyCounty Purposes Purposes Purposes (22.95) Purposes Rates
Barbour 19.40 - - - - 19.40
Berkeley 19.40 - 22.50 98.0% 5.71 47.61
Boone 19.40 - 22.95 100.0% - 42.35
Braxton 19.40 - - - 9.04 28.44
Brooke 19.40 - 22.95 100.0% 5.09 47.44
Cabell 17.90 1.50 22.95 100.0% 5.28 47.63
Calhoun 19.40 - 0.40 1.7% 3.71 23.51
Clay 19.40 - 6.50 28.3% - 25.90
Doddridge 19.40 - 22.95 100.0% 3.95 46.30
Fayette 19.40 - 22.95 100.0% - 42.35
Gilmer 19.40 - 9.18 40.0% - 28.58
Grant 19.40 - - - - 19.40
Greenbrier 19.40 - 11.475 50.0% 8.56 39.44
Hampshire 19.40 - - - - 19.40
Hancock 19.40 - 22.95 100.0% 8.47 50.82
Hardy 19.40 - - - 5.25 24.65
Harrison 19.40 - 20.33 88.6% - 39.73
Jackson 19.40 - 22.95 100.0% - 42.35
Jefferson 19.40 - 22.95 100.0% 2.06 44.41
Kanawha 19.40 - 14.91 65.0% - 34.31
Lewis 19.40 - 10.32 45.0% - 29.72
Lincoln 19.40 - 22.95 100.0% - 42.35
Logan 19.40 - 22.95 100.0% - 42.35
Marion 19.40 - 22.95 100.0% 2.63 44.98
Marshall 19.40 - 22.49 98.0% 2.75 44.64
Mason 19.40 - 20.48 89.2% 3.68 43.56
McDowell 19.40 - 22.95 100.0% - 42.35
Mercer 19.40 - 22.95 100.0% - 42.35
Mineral 19.40 - 22.95 100.0% - 42.35
Mingo 17.90 1.50 22.95 100.0% - 42.35
Monongalia 19.40 - 17.21 75.0% 2.27 38.88
Monroe 17.90 1.50 17.21 75.0% - 36.61
Morgan 19.40 - 22.03 96.0% - 41.43
Nicholas 19.40 - 13.31 58.0% - 32.71
Ohio 19.40 - 21.92 95.5% 2.06 43.38
Pendleton 19.40 - - - - 19.40
Pleasants 19.40 - 19.06 83.1% 8.08 46.54
Pocahontas 19.40 - - - - 19.40
Preston 19.40 - - - 9.69 29.09
Putnam 19.40 - 22.95 100.0% 6.63 48.98
Raleigh 19.40 - 22.95 100.0% - 42.35
Randolph 19.40 - 8.55 37.3% - 27.95
Ritchie 19.40 - 14.92 65.0% - 34.32
Roane 19.40 - - - 2.21 21.61
Summers 19.40 - - - - 19.40
Taylor 19.40 - 11.475 50.0% 4.48 35.36
Tucker 19.40 - - - - 19.40
Tyler 19.40 - 22.95 100.0% - 42.35
Upshur 19.40 - 9.83 42.8% - 29.23
Wayne 17.90 1.50 22.95 100.0% - 42.35
Webster 19.40 - - - - 19.40
Wetzel 19.40 - 22.95 100.0% - 42.35
Wirt 19.40 - 20.66 90.0% - 40.06
Wood 19.40 - 18.36 80.0% 3.39 41.15
Wyoming 17.90 1.50 22.95 100.0% 2.17 44.52
State 55 5 43 43 22 55
Source: Levy Order and Rate Sheet submitted by each county board for the 2013-14 fiscal year.
OSF
06/07/13
Taxable Assessed Valuations 14
-8-

COUNTY BOARDS OF EDUCATION
SUMMARY OF PROJECTED GROSS TAX COLLECTIONS
FOR THE 2013-14 FISCAL YEAR
Current Permanent Excess
Expense Improvement Levy Bond
County Purposes Purposes Purposes Purposes Total
Barbour 3,533,847 - - - 3,533,847
Berkeley 25,412,955 - 29,473,788 7,479,792 62,366,535
Boone 11,828,268 - 13,992,720 - 25,820,988
Braxton 2,915,741 - - 1,358,675 4,274,416
Brooke 5,506,459 - 6,514,085 1,444,736 13,465,280
Cabell 19,789,490 1,658,337 25,372,559 5,837,346 52,657,732
Calhoun 1,397,119 - 28,807 267,180 1,693,106
Clay 1,936,514 - 648,832 - 2,585,346
Doddridge 4,279,205 - 5,062,255 871,282 10,212,742
Fayette 9,394,743 - 11,113,885 - 20,508,628
Gilmer 2,174,136 - 1,028,792 - 3,202,928
Grant 6,534,170 - - - 6,534,170
Greenbrier 10,188,240 - 6,026,291 4,495,430 20,709,961
Hampshire 7,266,880 - - - 7,266,880
Hancock 6,035,398 - 7,139,814 2,635,042 15,810,254
Hardy 5,289,324 - - 1,431,389 6,720,713
Harrison 24,675,387 - 25,858,280 - 50,533,667
Jackson 7,698,351 - 9,107,071 - 16,805,422
Jefferson 16,534,988 - 19,560,720 1,755,777 37,851,485
Kanawha 61,741,340 - 47,451,721 - 109,193,061
Lewis 6,488,588 - 3,451,661 - 9,940,249
Lincoln 3,168,087 - 3,747,815 - 6,915,902
Logan 11,038,968 - 13,058,985 - 24,097,953
Marion 15,215,799 - 18,000,134 2,062,760 35,278,693
Marshall 19,681,598 - 22,816,452 2,789,917 45,287,967
Mason 7,096,650 - 7,491,721 1,346,169 15,934,540
McDowell 7,252,344 - 8,579,448 - 15,831,792
Mercer 10,296,601 - 12,180,774 - 22,477,375
Mineral 5,946,735 - 7,034,926 - 12,981,661
Mingo 8,029,804 672,888 10,295,196 - 18,997,888
Monongalia 30,095,329 - 26,697,969 3,521,464 60,314,762
Monroe 1,914,123 160,401 1,840,338 - 3,914,862
Morgan 5,270,457 - 5,984,957 - 11,255,414
Nicholas 6,733,812 - 4,619,950 - 11,353,762
Ohio 11,441,521 - 12,927,738 1,214,924 25,584,183
Pendleton 2,162,435 - - - 2,162,435
Pleasants 4,062,036 - 3,990,845 1,691,817 9,744,698
Pocahontas 4,075,405 - - - 4,075,405
Preston 7,509,316 - - 3,750,786 11,260,102
Putnam 16,558,151 - 19,588,122 5,658,790 41,805,063
Raleigh 20,168,639 - 23,859,292 - 44,027,931
Randolph 6,819,025 - 3,005,292 - 9,824,317
Ritchie 2,684,111 - 2,064,274 - 4,748,385
Roane 2,645,400 - - 301,357 2,946,757
Summers 2,509,846 - - - 2,509,846
Taylor 4,309,997 - 2,549,341 995,299 7,854,637
Tucker 3,766,545 - - - 3,766,545
Tyler 2,446,043 - 2,893,643 - 5,339,686
Upshur 7,092,746 - 3,593,901 - 10,686,647
Wayne 7,537,871 631,665 9,664,477 - 17,834,013
Webster 1,796,961 - - - 1,796,961
Wetzel 8,918,927 - 10,551,000 - 19,469,927
Wirt 734,906 - 782,637 - 1,517,543
Wood 18,450,265 - 17,461,178 3,224,041 39,135,484
Wyoming 6,319,852 529,597 8,102,826 766,150 15,718,425
Total 514,371,448 3,652,888 475,214,512 54,900,123 1,048,138,971
Source: Levy Order and Rate Sheet submitted by each county board for the 2013-14 fiscal year.
OSF
06/07/13
Taxable Assessed Valuations 14
Note: Excludes projected gross tax collections from Tax Increment Financing (TIF) projects that are deposited into an escrow account.
-9-
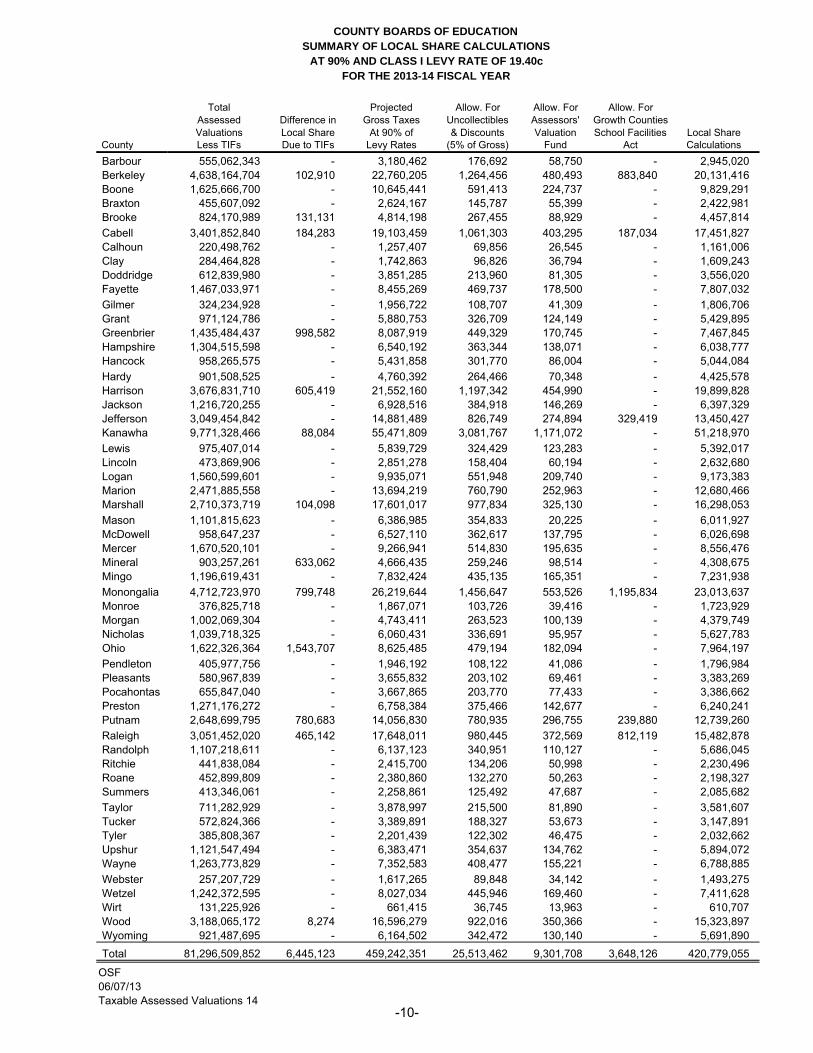
COUNTY BOARDS OF EDUCATIONSUMMARY OF LOCAL SHARE CALCULATIONS
AT 90% AND CLASS I LEVY RATE OF 19.40cFOR THE 2013-14 FISCAL YEAR
Total Projected Allow. For Allow. For Allow. ForAssessed Difference in Gross Taxes Uncollectibles Assessors' Growth CountiesValuations Local Share At 90% of & Discounts Valuation School Facilities Local Share
County Less TIFs Due to TIFs Levy Rates (5% of Gross) Fund Act CalculationsBarbour 555,062,343 - 3,180,462 176,692 58,750 - 2,945,020 Berkeley 4,638,164,704 102,910 22,760,205 1,264,456 480,493 883,840 20,131,416 Boone 1,625,666,700 - 10,645,441 591,413 224,737 - 9,829,291 Braxton 455,607,092 - 2,624,167 145,787 55,399 - 2,422,981 Brooke 824,170,989 131,131 4,814,198 267,455 88,929 - 4,457,814 Cabell 3,401,852,840 184,283 19,103,459 1,061,303 403,295 187,034 17,451,827 Calhoun 220,498,762 - 1,257,407 69,856 26,545 - 1,161,006 Clay 284,464,828 - 1,742,863 96,826 36,794 - 1,609,243 Doddridge 612,839,980 - 3,851,285 213,960 81,305 - 3,556,020 Fayette 1,467,033,971 - 8,455,269 469,737 178,500 - 7,807,032 Gilmer 324,234,928 - 1,956,722 108,707 41,309 - 1,806,706 Grant 971,124,786 - 5,880,753 326,709 124,149 - 5,429,895 Greenbrier 1,435,484,437 998,582 8,087,919 449,329 170,745 - 7,467,845 Hampshire 1,304,515,598 - 6,540,192 363,344 138,071 - 6,038,777 Hancock 958,265,575 - 5,431,858 301,770 86,004 - 5,044,084 Hardy 901,508,525 - 4,760,392 264,466 70,348 - 4,425,578 Harrison 3,676,831,710 605,419 21,552,160 1,197,342 454,990 - 19,899,828 Jackson 1,216,720,255 - 6,928,516 384,918 146,269 - 6,397,329 Jefferson 3,049,454,842 - 14,881,489 826,749 274,894 329,419 13,450,427 Kanawha 9,771,328,466 88,084 55,471,809 3,081,767 1,171,072 - 51,218,970 Lewis 975,407,014 - 5,839,729 324,429 123,283 - 5,392,017 Lincoln 473,869,906 - 2,851,278 158,404 60,194 - 2,632,680 Logan 1,560,599,601 - 9,935,071 551,948 209,740 - 9,173,383 Marion 2,471,885,558 - 13,694,219 760,790 252,963 - 12,680,466 Marshall 2,710,373,719 104,098 17,601,017 977,834 325,130 - 16,298,053 Mason 1,101,815,623 - 6,386,985 354,833 20,225 - 6,011,927 McDowell 958,647,237 - 6,527,110 362,617 137,795 - 6,026,698 Mercer 1,670,520,101 - 9,266,941 514,830 195,635 - 8,556,476 Mineral 903,257,261 633,062 4,666,435 259,246 98,514 - 4,308,675 Mingo 1,196,619,431 - 7,832,424 435,135 165,351 - 7,231,938 Monongalia 4,712,723,970 799,748 26,219,644 1,456,647 553,526 1,195,834 23,013,637 Monroe 376,825,718 - 1,867,071 103,726 39,416 - 1,723,929 Morgan 1,002,069,304 - 4,743,411 263,523 100,139 - 4,379,749 Nicholas 1,039,718,325 - 6,060,431 336,691 95,957 - 5,627,783 Ohio 1,622,326,364 1,543,707 8,625,485 479,194 182,094 - 7,964,197 Pendleton 405,977,756 - 1,946,192 108,122 41,086 - 1,796,984 Pleasants 580,967,839 - 3,655,832 203,102 69,461 - 3,383,269 Pocahontas 655,847,040 - 3,667,865 203,770 77,433 - 3,386,662 Preston 1,271,176,272 - 6,758,384 375,466 142,677 - 6,240,241 Putnam 2,648,699,795 780,683 14,056,830 780,935 296,755 239,880 12,739,260 Raleigh 3,051,452,020 465,142 17,648,011 980,445 372,569 812,119 15,482,878 Randolph 1,107,218,611 - 6,137,123 340,951 110,127 - 5,686,045 Ritchie 441,838,084 - 2,415,700 134,206 50,998 - 2,230,496 Roane 452,899,809 - 2,380,860 132,270 50,263 - 2,198,327 Summers 413,346,061 - 2,258,861 125,492 47,687 - 2,085,682 Taylor 711,282,929 - 3,878,997 215,500 81,890 - 3,581,607 Tucker 572,824,366 - 3,389,891 188,327 53,673 - 3,147,891 Tyler 385,808,367 - 2,201,439 122,302 46,475 - 2,032,662 Upshur 1,121,547,494 - 6,383,471 354,637 134,762 - 5,894,072 Wayne 1,263,773,829 - 7,352,583 408,477 155,221 - 6,788,885 Webster 257,207,729 - 1,617,265 89,848 34,142 - 1,493,275 Wetzel 1,242,372,595 - 8,027,034 445,946 169,460 - 7,411,628 Wirt 131,225,926 - 661,415 36,745 13,963 - 610,707 Wood 3,188,065,172 8,274 16,596,279 922,016 350,366 - 15,323,897 Wyoming 921,487,695 - 6,164,502 342,472 130,140 - 5,691,890 Total 81,296,509,852 6,445,123 459,242,351 25,513,462 9,301,708 3,648,126 420,779,055
OSF06/07/13Taxable Assessed Valuations 14
-10-

COUNTY BOARDS OF EDUCATIONEXCESS LEVIES IN EFFECT
2013-14 YEAR
Percent of Class I Percent of Max RateDate of Votes for Levy Rate Maximum Allowed By Number Expiration
County Election Levy Per $100 (22.95) Levy Call of Years DateBarbour - - - - - - -Berkeley 11-02-10 57.0% 22.50 98.0% 22.50 4 6-30-15Boone 05-11-10 83.1% 22.95 100.0% 22.95 5 6-30-15Braxton - - - - - - -Brooke 11-04-08 66.6% 22.95 100.0% 22.95 5 6-30-14Cabell 11-08-08 65.1% 22.95 100.0% 22.95 5 6-30-15Calhoun 11-02-10 63.0% 0.40 1.7% 0.40 5 6-30-17Clay 01-28-12 61.0% 6.50 28.3% 6.50 5 6-30-17Doddridge 11-04-08 54.5% 22.95 100.0% 22.95 5 6-30-14Fayette 05-13-08 71.3% 22.95 100.0% 22.95 5 6-30-14Gilmer 11-06-12 50.3% 9.18 40.0% 9.18 5 6-30-18Grant - - - - - - -Greenbrier 05-23-08 69.0% 11.48 50.0% 11.48 5 6-30-14Hampshire - - - - - - -Hancock 11-04-08 66.3% 22.95 100.0% 22.95 5 6-30-14Hardy - - - - - - -Harrison 11-02-10 68.0% 20.33 88.6% 20.66 5 6-30-16Jackson 05-13-08 64.4% 22.95 100.0% 22.95 5 6-30-14Jefferson 11-02-10 62.0% 22.95 100.0% 22.95 5 6-30-16Kanawha 05-13-08 60.4% 14.91 65.0% 22.95 5 6-30-14Lewis 02-20-10 80.5% 10.32 45.0% 10.32 5 6-30-15Lincoln 11-04-08 61.7% 22.95 100.0% 22.95 5 6-30-14Logan 11-04-08 78.4% 22.95 100.0% 22.95 5 6-30-14Marion 02-07-09 65.7% 22.95 100.0% 22.95 5 6-30-14Marshall 12-15-12 60.0% 22.49 98.0% 22.95 5 6-30-18Mason 11-04-08 57.1% 20.48 89.2% 20.48 5 6-30-14McDowell 02-07-09 93.5% 22.95 100.0% 22.95 5 6-30-14Mercer 01-30-10 83.3% 22.95 100.0% 22.95 5 6-30-15Mineral 05-06-10 77.5% 22.95 100.0% 22.95 5 6-30-16Mingo 01-17-09 78.2% 22.95 100.0% 22.95 5 6-30-14Monongalia 10/04/11 68.9% 17.21 75.0% 17.21 5 6-30-17Monroe 01-30-10 66.7% 17.21 75.0% 17.21 5 6-30-15Morgan 11-04-08 57.2% 22.03 96.0% 22.95 5 6-30-14Nicholas 11-02-10 56.0% 13.31 58.0% 13.31 5 6-30-16Ohio 05-30-09 83.9% 21.92 95.5% 22.95 5 6-30-15Pendleton - - - - - - -Pleasants 11-04-08 70.1% 19.06 83.1% 19.06 5 6-30-14Pocahontas - - - - - - -Preston - - - - - - -Putnam 05-11-10 65.6% 22.95 100.0% 22.95 5 6-30-16Raleigh 02-28-09 86.9% 22.95 100.0% 22.95 5 6-30-14Randolph 11-08-10 54.0% 8.55 37.3% 9.44 5 6-30-16Ritchie 12-12-09 80.4% 14.92 65.0% 14.92 5 6-30-15Roane - - - - - - -Summers - - - - - - -Taylor 01-22-11 62.8% 11.48 50.0% 11.48 5 6-30-16Tucker - - - - - - -Tyler 12-15-12 83.2% 22.95 100.0% 22.95 5 6-30-18Upshur 02-07-09 51.2% 9.83 42.8% 9.83 5 6-30-14Wayne 12-20-08 80.9% 22.95 100.0% 22.95 5 6-30-14Webster - - - - - - -Wetzel 12-14-12 75.3% 22.95 100.0% 22.95 5 6-30-18Wirt 10/04/11 66.0% 20.66 90.0% 20.66 5 6-30-17Wood 11-04-08 68.7% 18.36 80.0% 18.36 5 6-30-14Wyoming 11-10-08 78.0% 22.95 100.0% 22.95 5 6-30-14
State (With Levies) 43 68.7% 18.85 82.1% 19.23 5.0 - OSF09/23/13EXCLVY 14
-11-
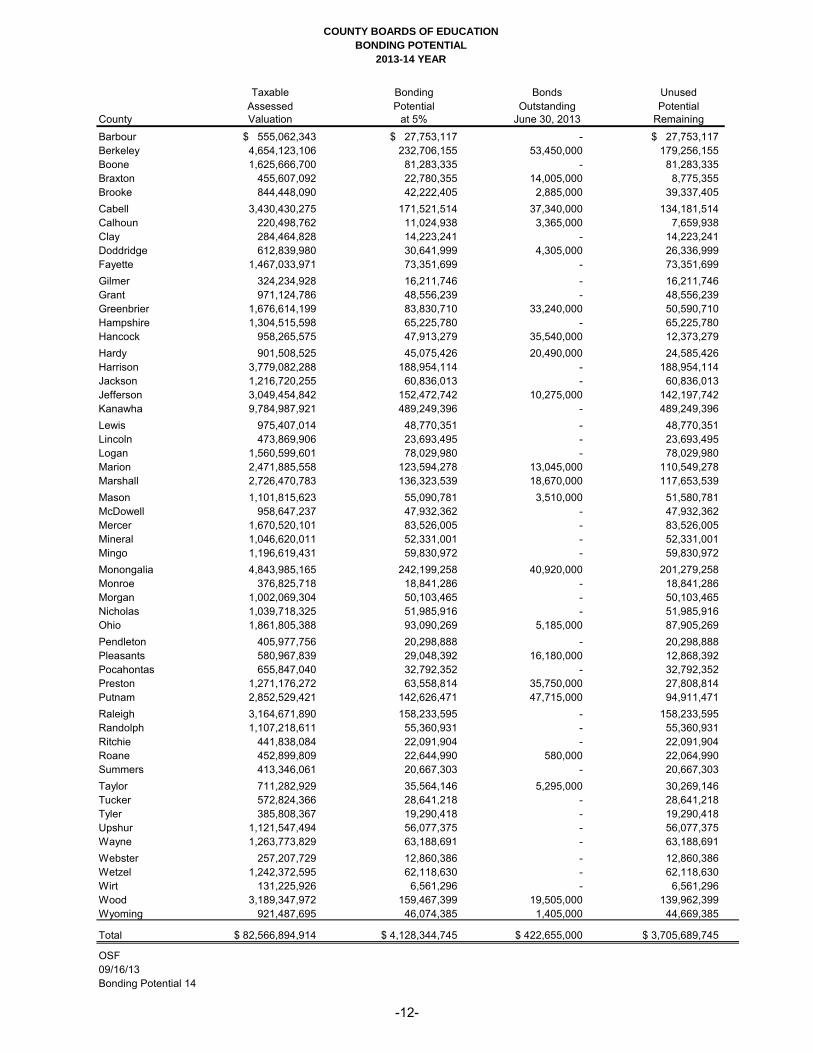
COUNTY BOARDS OF EDUCATION
BONDING POTENTIAL
2013-14 YEAR
Taxable Bonding Bonds Unused
Assessed Potential Outstanding Potential
County Valuation at 5% June 30, 2013 Remaining
Barbour $ 555,062,343 $ 27,753,117 - $ 27,753,117
Berkeley 4,654,123,106 232,706,155 53,450,000 179,256,155
Boone 1,625,666,700 81,283,335 - 81,283,335
Braxton 455,607,092 22,780,355 14,005,000 8,775,355
Brooke 844,448,090 42,222,405 2,885,000 39,337,405
Cabell 3,430,430,275 171,521,514 37,340,000 134,181,514
Calhoun 220,498,762 11,024,938 3,365,000 7,659,938
Clay 284,464,828 14,223,241 - 14,223,241
Doddridge 612,839,980 30,641,999 4,305,000 26,336,999
Fayette 1,467,033,971 73,351,699 - 73,351,699
Gilmer 324,234,928 16,211,746 - 16,211,746
Grant 971,124,786 48,556,239 - 48,556,239
Greenbrier 1,676,614,199 83,830,710 33,240,000 50,590,710
Hampshire 1,304,515,598 65,225,780 - 65,225,780
Hancock 958,265,575 47,913,279 35,540,000 12,373,279
Hardy 901,508,525 45,075,426 20,490,000 24,585,426
Harrison 3,779,082,288 188,954,114 - 188,954,114
Jackson 1,216,720,255 60,836,013 - 60,836,013
Jefferson 3,049,454,842 152,472,742 10,275,000 142,197,742
Kanawha 9,784,987,921 489,249,396 - 489,249,396
Lewis 975,407,014 48,770,351 - 48,770,351
Lincoln 473,869,906 23,693,495 - 23,693,495
Logan 1,560,599,601 78,029,980 - 78,029,980
Marion 2,471,885,558 123,594,278 13,045,000 110,549,278
Marshall 2,726,470,783 136,323,539 18,670,000 117,653,539
Mason 1,101,815,623 55,090,781 3,510,000 51,580,781
McDowell 958,647,237 47,932,362 - 47,932,362
Mercer 1,670,520,101 83,526,005 - 83,526,005
Mineral 1,046,620,011 52,331,001 - 52,331,001
Mingo 1,196,619,431 59,830,972 - 59,830,972
Monongalia 4,843,985,165 242,199,258 40,920,000 201,279,258
Monroe 376,825,718 18,841,286 - 18,841,286
Morgan 1,002,069,304 50,103,465 - 50,103,465
Nicholas 1,039,718,325 51,985,916 - 51,985,916
Ohio 1,861,805,388 93,090,269 5,185,000 87,905,269
Pendleton 405,977,756 20,298,888 - 20,298,888
Pleasants 580,967,839 29,048,392 16,180,000 12,868,392
Pocahontas 655,847,040 32,792,352 - 32,792,352
Preston 1,271,176,272 63,558,814 35,750,000 27,808,814
Putnam 2,852,529,421 142,626,471 47,715,000 94,911,471
Raleigh 3,164,671,890 158,233,595 - 158,233,595
Randolph 1,107,218,611 55,360,931 - 55,360,931
Ritchie 441,838,084 22,091,904 - 22,091,904
Roane 452,899,809 22,644,990 580,000 22,064,990
Summers 413,346,061 20,667,303 - 20,667,303
Taylor 711,282,929 35,564,146 5,295,000 30,269,146
Tucker 572,824,366 28,641,218 - 28,641,218
Tyler 385,808,367 19,290,418 - 19,290,418
Upshur 1,121,547,494 56,077,375 - 56,077,375
Wayne 1,263,773,829 63,188,691 - 63,188,691
Webster 257,207,729 12,860,386 - 12,860,386
Wetzel 1,242,372,595 62,118,630 - 62,118,630
Wirt 131,225,926 6,561,296 - 6,561,296
Wood 3,189,347,972 159,467,399 19,505,000 139,962,399
Wyoming 921,487,695 46,074,385 1,405,000 44,669,385
Total $ 82,566,894,914 $ 4,128,344,745 $ 422,655,000 $ 3,705,689,745
OSF
09/16/13
Bonding Potential 14
-12-

COUNTY BOARDS OF EDUCATION
BOND ELECTIONS ATTEMPTED SINCE 1971
PRESENTED IN ALPHABETICAL ORDER
AS OF JUNE 30, 2014
Year of Previous Amount of Amount of Amount of Percent
Bond Issue Bond Issue Bond Issue Bond Issue of VotersCounty Election Passed Proposed Approved Defeated For Bond
Barbour (1) 1978 1969 4,529,000 -- 4,529,000 50.6%
Barbour (2) 1978 1969 4,529,000 -- 4,529,000 55.0%
Barbour (3) 1979 1969 4,529,000 4,529,000 -- 61.3%
Barbour (4) 1998 1979 8,000,000 -- 8,000,000 45.8%
Barbour (5) 2000 1979 7,500,000 7,500,000 -- 55.4%
Barbour (6) 2012 2000 5,480,000 -- 5,480,000 37.3%
Berkeley (1) 1974 -- 3,560,000 3,560,000 -- 69.2%
Berkeley (2) 1983 1974 12,700,000 -- 12,700,000 47.7%
Berkeley (3) 1984 1974 12,000,000 -- 12,000,000 49.6%
Berkeley (4) 1987 1974 10,960,000 10,960,000 -- 66.0%
Berkeley (5) 1993 1987 42,200,000 -- 42,200,000 35.7%
Berkeley (6) 1995 1987 15,950,000 15,950,000 -- 56.4%
Berkeley (7) 2001 1995 27,800,000 27,800,000 -- 63.3%
Berkeley (8) 2009 2001 51,500,000 51,500,000 -- 63.6%
Boone (1) 1977 -- 6,745,000 6,745,000 -- 81.1%
Boone (2) 2011 1977 45,160,000 -- 45,160,000 26.1%
Braxton (1) 1977 1965 2,200,000 -- 2,200,000 26.0%
Braxton (2) 1978 1965 2,840,000 -- 2,840,000 32.4%
Braxton (3) 1997 1965 11,660,000 -- 11,660,000 20.7%
Braxton (4) 2003 1965 7,200,000 -- 7,200,000 42.7%
Braxton (5) 2008 1965 16,100,000 16,100,000 52.0%
Brooke (1) 1977 1965 5,565,000 -- 5,565,000 32.7%
Brooke (2) 1981 1965 9,865,000 9,865,000 -- 63.1%
Brooke (3) 2000 1981 15,000,000 15,000,000 -- 57.7%
Brooke (4) 2014 2000 15,000,000 15,000,000 -- 51.0%
Cabell (1) 1980 1938 32,890,000 -- 32,890,000 35.6%
Cabell (2) 1990 1938 45,000,000 45,000,000 -- 57.2%
Cabell (3) 2006 1990 60,455,000 60,455,000 -- 55.4%
Calhoun (1) 1975 1949 2,100,000 -- 2,100,000 32.0%
Calhoun (2) 1975 1949 2,100,000 -- 2,100,000 32.5%
Calhoun (3) 1990 1949 5,375,000 -- 5,375,000 40.1%
Calhoun (4) 1990 1949 5,375,000 -- 5,375,000 37.1%
Calhoun (5) 1996 1949 3,370,000 3,370,000 -- 50.7%
Calhoun (6) 2011 1996 3,560,000 3,560,000 -- 67.0%
Clay -- 1969 -- -- -- --
Doddridge (1) 1977 1940 1,871,358 -- 1,871,358 17.2%
Doddridge (2) 2003 1940 8,900,000 8,900,000 -- 61.5%
Fayette (1) 1973 1951 7,600,000 7,600,000 -- 76.1%
Fayette (2) 2001 1973 39,000,000 -- 39,000,000 13.8%
Fayette (3) 2009 1973 49,000,000 -- 49,000,000 22.6%
Gilmer (1) 1974 1955 1,825,000 -- 1,825,000 33.0%
Gilmer (2) 1974 1955 2,125,000 -- 2,125,000 48.0%
Gilmer (3) 1975 1955 2,125,000 -- 2,125,000 50.0%
Gilmer (4) 1976 1955 2,459,000 -- 2,459,000 53.6%
Gilmer (5) 1976 1955 2,459,000 -- 2,459,000 51.6%
Gilmer (6) 2010 1955 11,915,000 -- 11,915,000 37.3%
Grant (1) 1998 1996 3,500,000 -- 3,500,000 49.4%
Grant (2) 2008 1996 2,495,500 -- 2,495,500 42.0%
Greenbrier (1) 1981 1966 10,539,000 -- 10,539,000 31.0%
Greenbrier (2) 1991 1966 20,200,000 -- 20,200,000 26.0%
-13-

COUNTY BOARDS OF EDUCATION
BOND ELECTIONS ATTEMPTED SINCE 1971
PRESENTED IN ALPHABETICAL ORDER
AS OF JUNE 30, 2014
Year of Previous Amount of Amount of Amount of Percent
Bond Issue Bond Issue Bond Issue Bond Issue of VotersCounty Election Passed Proposed Approved Defeated For Bond
Greenbrier (3) 1996 1966 8,000,000 8,000,000 -- 60.6%
Greenbrier (4) 2001 1996 8,000,000 8,000,000 -- 69.0%
Greenbrier (5) 2005 2001 12,500,000 -- 12,500,000 25.8%
Greenbrier (6) 2008 2001 37,745,000 37,745,000 50.8%
Hampshire (1) 1988 1962 8,680,000 -- 8,680,000 49.0%
Hampshire (2) 1989 1962 8,680,000 -- 8,680,000 23.0%
Hampshire (3) 1997 1962 11,060,000 -- 11,060,000 43.8%
Hampshire (4) 1998 1962 3,740,000 3,740,000 -- 55.1%
Hancock (1) 1978 1961 13,885,000 -- 13,885,000 47.6%
Hancock (2) 1980 1961 13,885,000 13,885,000 -- 64.6%
Hancock (3) 1996 1980 12,800,000 -- 12,800,000 35.0%
Hancock (4) 1997 1980 12,500,000 -- 12,500,000 27.9%
Hancock (5) 2005 1980 34,000,000 -- 34,000,000 28.0%
Hancock (6) 2010 1980 37,000,000 37,000,000 -- 51.0%
Hancock (7) 2010 1980 39,600,000 39,600,000 -- 53.1%
Hardy (1) 1972 -- 950,000 950,000 -- 65.0%
Hardy (2) 1977 1972 2,430,000 2,430,000 -- 68.1%
Hardy (3) 1992 1977 8,000,000 -- 8,000,000 32.0%
Hardy (4) 1994 1977 3,700,000 3,700,000 -- 61.5%
Hardy (5) 2002 1994 11,970,000 -- 11,970,000 46.0%
Hardy (6) 2003 1994 11,970,000 -- 11,970,000 46.0%
Harrison (1) 1975 -- 12,800,000 -- 12,800,000 54.1%
Harrison (2) 1975 -- 12,800,000 -- 12,800,000 47.2%
Harrison (3) 1988 -- 39,700,000 -- 39,700,000 42.0%
Harrison (4) 1991 -- 37,925,000 37,925,000 -- 51.0%
Harrison (5) 2007 1991 42,465,000 -- 42,465,000 39.2%
Harrison (6) 2011 1991 71,250,000 -- 71,250,000 24.0%
Harrison (7) 2012 1991 19,000,000 -- 19,000,000 34.0%
Jackson (1) 1974 1959 5,525,000 -- 5,525,000 35.0%
Jackson (2) 2006 1959 39,380,000 -- 39,380,000 25.1%
Jefferson (1) 1974 -- 1,520,000 1,520,000 -- 63.3%
Jefferson (2) 1989 1974 18,000,000 18,000,000 -- 74.1%
Jefferson (3) 2000 1989 39,000,000 -- 39,000,000 35.0%
Jefferson (4) 2004 1989 19,000,000 19,000,000 71.2%
Kanawha (1) 1976 1967 39,467,000 -- 39,467,000 44.0%
Kanawha (2) 1989 1967 103,670,000 -- 103,670,000 34.1%
Kanawha (3) 1992 1967 73,705,000 -- 73,705,000 49.3%
Kanawha (4) 1995 1967 12,670,000 12,670,000 -- 68.3%
Kanawha (5) 1997 1995 98,165,000 -- 98,165,000 36.9%
Kanawha (6) 2000 1995 27,505,000 27,505,000 -- 59.9%
Lewis (1) 1979 -- 6,430,000 -- 6,430,000 39.4%
Lewis (2) 2002 -- 8,000,000 -- 8,000,000 42.0%
Lewis (3) 2003 -- 3,980,000 -- 3,980,000 36.7%
Lincoln (1) 1976 1952 2,966,658 -- 2,966,658 42.5%
Lincoln (2) 1976 1952 2,966,658 -- 2,966,658 38.5%
Lincoln (3) 1978 1952 3,157,000 3,157,000 -- 66.4%
Lincoln (4) 1991 1978 6,375,000 -- 6,375,000 38.1%
Lincoln (5) 2013 1978 24,000,000 -- 24,000,000 25.1%
Logan (1) 1983 1969 10,000,000 -- 10,000,000 34.0%
Logan (2) 1991 1969 23,205,000 -- 23,205,000 27.0%
Logan (3) 2003 1969 6,500,000 -- 6,500,000 48.0%
-14-

COUNTY BOARDS OF EDUCATION
BOND ELECTIONS ATTEMPTED SINCE 1971
PRESENTED IN ALPHABETICAL ORDER
AS OF JUNE 30, 2014
Year of Previous Amount of Amount of Amount of Percent
Bond Issue Bond Issue Bond Issue Bond Issue of VotersCounty Election Passed Proposed Approved Defeated For Bond
Marion (1) 1975 -- 12,800,000 -- 12,800,000 52.5%
Marion (2) 1975 -- 12,800,000 -- 12,800,000 58.7%
Marion (3) 1976 -- 13,475,000 -- 13,475,000 46.7%
Marion (4) 1983 -- 29,930,000 -- 29,930,000 35.1%
Marion (5) 1988 -- 32,100,000 -- 32,100,000 45.0%
Marion (6) 1989 -- 12,330,000 12,330,000 -- 55.7%
Marion (7) 1996 1989 3,250,000 3,250,000 -- 59.3%
Marion (8) 2000 1996 29,705,000 -- 29,705,000 25.0%
Marion (9) 2001 1996 12,000,000 -- 12,000,000 42.0%
Marion (10) 2002 1996 4,500,000 4,500,000 -- 53.8%
Marion (11) 2008 2002 40,200,000 -- 40,200,000 48.0%
Marion (12) 2010 2002 15,760,000 15,760,000 -- 53.7%
Marion (13) 2012 2010 10,000,000 -- 10,000,000 47.7%
Marshall (1) 1974 1965 4,350,000 4,350,000 -- 75.2%
Marshall (2) 1995 1974 37,790,000 -- 37,790,000 26.7%
Marshall (3) 1996 1974 19,870,000 -- 19,870,000 36.8%
Marshall (4) 2006 1974 27,900,000 27,900,000 -- 51.0%
Mason (1) 1980 1950 8,307,332 -- 8,307,332 51.6%
Mason (2) 1980 1950 9,366,000 -- 9,366,000 58.5%
Mason (3) 1980 1950 9,366,000 -- 9,366,000 49.5%
Mason (4) 1989 1950 18,700,000 -- 18,700,000 43.0%
Mason (5) 1990 1950 16,300,000 -- 16,300,000 32.0%
Mason (6) 1991 1950 16,300,000 -- 16,300,000 42.0%
Mason (7) 2000 1950 24,610,000 -- 24,610,000 29.0%
Mason (8) 2004 1950 12,000,000 12,000,000 - 55.0%
McDowell (1) 1974 1964 4,000,000 4,000,000 -- 73.0%
McDowell (2) 1996 1974 21,865,000 -- 21,865,000 16.0%
Mercer (1) 1979 1954 16,737,000 16,737,000 -- 66.2%
Mercer (2) 2001 1979 21,900,000 -- 21,900,000 14.0%
Mineral (1) 1973 1938 3,354,000 3,354,000 -- 79.0%
Mineral (2) 1990 1973 15,300,000 -- 15,300,000 36.0%
Mineral (3) 1991 1973 7,500,000 -- 7,500,000 48.0%
Mineral (4) 2001 1973 14,950,000 -- 14,950,000 36.0%
Mineral (5) 2004 1973 15,800,000 -- 15,800,000 42.0%
Mineral (6) 2008 1973 15,800,000 -- 15,800,000 47.9%
Mineral (7) 2008 1973 15,800,000 -- 15,800,000 41.6%
Mingo (1) 1978 1967 4,220,000 -- 4,220,000 55.9%
Mingo (2) 1979 1967 4,220,000 4,220,000 -- 61.6%
Mingo (3) 1984 1979 7,850,000 7,850,000 -- 70.6%
Mingo (4) 1990 1984 13,000,000 -- 13,000,000 33.0%
Mingo (5) 1990 1984 10,970,000 -- 10,970,000 38.0%
Mingo (6) 1993 1984 27,000,000 -- 27,000,000 29.8%
Monongalia (1) 1974 1952 7,500,000 -- 7,500,000 57.1%
Monongalia (2) 1976 1952 6,995,000 6,995,000 -- 66.8%
Monongalia (3) 1987 1976 29,525,000 -- 29,525,000 48.0%
Monongalia (4) 1989 1976 32,500,000 32,500,000 -- 62.0%
Monongalia (5) 2000 1989 80,079,000 -- 80,079,000 28.0%
Monongalia (6) 2003 1989 50,000,000 50,000,000 -- 73.2%
Monroe (1) 1975 1961 1,725,000 -- 1,725,000 25.9%
Monroe (2) 1993 1961 3,177,915 -- 3,177,915 39.3%
Monroe (3) 1998 1961 2,995,000 -- 2,995,000 44.0%
Monroe (4) 1999 1961 2,100,000 2,100,000 -- 53.9%
Morgan (1) 1972 1964 1,835,000 -- 1,835,000 54.7%
-15-

COUNTY BOARDS OF EDUCATION
BOND ELECTIONS ATTEMPTED SINCE 1971
PRESENTED IN ALPHABETICAL ORDER
AS OF JUNE 30, 2014
Year of Previous Amount of Amount of Amount of Percent
Bond Issue Bond Issue Bond Issue Bond Issue of VotersCounty Election Passed Proposed Approved Defeated For Bond
Morgan (2) 1972 1964 1,595,000 -- 1,595,000 54.8%
Morgan (3) 1974 1964 1,835,000 1,835,000 -- 77.0%
Morgan (4) 1993 1974 7,500,000 -- 7,500,000 32.4%
Nicholas (1) 1975 -- 4,500,000 4,500,000 -- 70.0%
Nicholas (2) 1988 1975 8,000,000 8,000,000 -- 53.0%
Ohio (1) 1973 1940 14,235,000 14,235,000 -- 68.4%
Ohio (2) 1986 1973 2,300,000 2,300,000 -- 68.2%
Ohio (3) 1993 1986 14,800,000 14,800,000 -- 77.5%
Pendleton 1979 -- 1,800,000 -- 1,800,000 38.8%
Pleasants (1) 1973 1959 1,800,000 1,800,000 -- 60.7%
Pleasants (2) 2000 1973 15,000,000 -- 15,000,000 28.0%
Pleasants (3) 2010 1973 18,050,000 18,050,000 -- 60.0%
Pocahontas (1) 1976 1968 1,818,000 -- 1,818,000 35.1%
Pocahontas (2) 1980 1968 3,280,000 -- 3,280,000 37.5%
Pocahontas (3) 1980 1968 3,280,000 -- 3,280,000 33.8%
Pocahontas (4) 1994 1968 400,000 -- 400,000 25.0%
Preston (1) 1973 1947 4,965,000 -- 4,965,000 46.6%
Preston (2) 1974 1947 5,320,000 -- 5,320,000 57.3%
Preston (3) 1974 1947 5,320,000 -- 5,320,000 49.2%
Preston (4) 1976 1947 6,140,000 -- 6,140,000 47.1%
Preston (5) 1984 1947 10,735,000 -- 10,735,000 35.1%
Preston (6) 1985 1947 11,690,000 -- 11,690,000 45.3%
Preston (7) 1986 1947 15,690,000 -- 15,690,000 38.5%
Preston (8) 1989 1947 8,850,000 8,850,000 -- 55.0%
Preston (9) 2008 1989 49,995,000 -- 49,995,000 49.7%
Preston (10) 2010 1989 39,600,000 39,600,000 -- 53.0%
Putnam (1) 1974 1967 4,900,000 -- 4,900,000 59.1%
Putnam (2) 1974 1967 4,900,000 -- 4,900,000 48.0%
Putnam (3) 1976 1967 5,795,000 5,795,000 -- 68.3%
Putnam (4) 1993 1976 39,500,000 -- 39,500,000 27.1%
Putnam (5) 2001 1976 35,850,000 -- 35,850,000 25.2%
Putnam (6) 2002 1976 20,500,000 -- 20,500,000 46.5%
Putnam (7) 2009 1976 56,750,000 56,750,000 -- 56.0%
Raleigh (1) 1973 1963 7,760,000 7,760,000 -- 80.6%
Raleigh (2) 1980 1973 14,825,000 14,825,000 -- 63.4%
Raleigh (3) 1991 1980 30,965,000 -- 30,965,000 25.1%
Raleigh (4) 1998 1980 14,500,000 14,500,000 -- 54.5%
Raleigh (5) 2004 1998 13,000,000 13,000,000 -- 76.1%
Raleigh (6) 2014 2004 39,895,000 -- 39,895,000 29.8%
Randolph (1) 1974 1951 3,580,000 3,580,000 -- 64.4%
Randolph (2) 1996 1974 19,365,000 -- 19,365,000 35.0%
Randolph (3) 1996 1974 19,365,500 -- 19,365,500 36.9%
Randolph (4) 2012 1974 13,500,000 -- 13,500,000 40.1%
Ritchie (1) 1973 -- 1,972,000 -- 1,972,000 47.0%
Ritchie (2) 1979 -- 3,326,528 -- 3,326,528 35.3%
Roane (1) 1976 1946 3,430,000 -- 3,430,000 54.1%
Roane (2) 1977 1946 7,386,500 3,710,000 3,676,500 63.7%
Roane (3) 1994 1977 3,700,000 3,700,000 -- 64.3%
Summers 1992 -- 3,300,000 -- 3,300,000 46.7%
Taylor (1) 1974 1968 939,000 -- 939,000 25.4%
-16-

COUNTY BOARDS OF EDUCATION
BOND ELECTIONS ATTEMPTED SINCE 1971
PRESENTED IN ALPHABETICAL ORDER
AS OF JUNE 30, 2014
Year of Previous Amount of Amount of Amount of Percent
Bond Issue Bond Issue Bond Issue Bond Issue of VotersCounty Election Passed Proposed Approved Defeated For Bond
Taylor (2) 1976 1968 1,515,533 -- 1,515,533 43.3%
Taylor (3) 1978 1968 3,000,000 -- 3,000,000 45.7%
Taylor (4) 1987 1968 6,700,000 6,700,000 -- 61.6%
Taylor (5) 1999 1987 9,700,000 -- 9,700,000 37.0%
Taylor (6) 2001 1987 5,120,995 5,120,995 -- 77.7%
Taylor (7) 2002 2001 10,990,000 10,990,000 -- 57.5%
Tucker (1) 1975 1938 1,285,000 1,285,000 -- 60.3%
Tucker (2) 1994 1975 6,385,000 -- 6,385,000 33.0%
Tyler (1) 1973 -- 1,855,000 1,855,000 -- 83.3%
Tyler (2) 1990 1973 6,200,000 6,200,000 -- 63.9%
Upshur (1) 1973 1956 3,552,000 3,552,000 -- 70.6%
Upshur (2) 2011 1973 35,000,000 -- 35,000,000 29.0%
Wayne (1) 1977 -- 7,155,000 -- 7,155,000 46.5%
Wayne (2) 1985 -- 14,300,000 14,300,000 -- 53.0%
Wayne (3) 1999 1985 32,000,000 -- 32,000,000 20.0%
Wayne (4) 2012 1985 33,100,000 -- 33,100,000 29.0%
Wayne (5) 2014 1985 18,000,000 18,000,000 -- 56.0%
Webster (1) 1972 1953 1,535,000 1,535,000 -- 75.9%
Wetzel (1) 1972 -- 3,740,000 -- 3,740,000 48.9%
Wetzel (2) 1974 -- 4,955,000 4,955,000 -- 72.5%
Wetzel (3) 1986 1974 8,900,000 8,900,000 -- 61.5%
Wirt (1) 1975 1961 935,000 -- 935,000 27.6%
Wirt (2) 1991 1961 1,500,000 1,500,000 -- 56.0%
Wood (1) 1971 1964 8,995,000 8,995,000 -- 61.4%
Wood (2) 1982 1971 18,100,000 -- 18,100,000 46.8%
Wood (3) 1984 1971 3,950,000 3,950,000 -- 57.8%
Wood (4) 1990 1984 9,995,000 9,995,000 -- 56.8%
Wood (5) 1990 1990 12,550,000 -- 12,550,000 31.2%
Wood (6) 1991 1990 7,637,000 -- 7,637,000 36.3%
Wood (7) 2004 1990 35,000,000 35,000,000 -- 67.2%
Wyoming (1) 1975 1959 5,875,000 -- 5,875,000 50.5%
Wyoming (2) 1976 1959 7,720,000 -- 7,720,000 57.9%
Wyoming (3) 1977 1959 7,720,000 -- 7,720,000 55.0%
Wyoming (4) 1992 1959 10,000,000 -- 10,000,000 42.0%
Wyoming (5) 1995 1959 14,000,000 -- 14,000,000 35.0%
Wyoming (6) 2000 1959 7,000,000 7,000,000 -- 61.0%
OSF
01/28/15
Bonds 14
NOTE: Percent of votes required for approval of bond levy changed from 60% to 50% by constitutional amendment adopted at
the General Election on Nov. 2, 1982.
-17-

This Page Intentionally Left Blank
-18-

COUNTY BOARDS OF EDUCATION
BOND ELECTIONS ATTEMPTED SINCE 1971
PRESENTED IN CHRONOLOGICAL ORDER
AS OF JUNE 30, 2014
Year of Previous Amount of Amount of Amount of Percent
Bond Issue Bond Issue Bond Issue Bond Issue of Voters
County Election Passed Proposed Approved Defeated For Bond
Wood (1) 1971 1964 8,995,000 8,995,000 -- 61.4%
Hardy (1) 1972 -- 950,000 950,000 -- 65.0%
Morgan (1) 1972 1964 1,835,000 -- 1,835,000 54.7%
Morgan (2) 1972 1964 1,595,000 -- 1,595,000 54.8%
Webster (1) 1972 1953 1,535,000 1,535,000 -- 75.9%
Wetzel (1) 1972 -- 3,740,000 -- 3,740,000 48.9%
Fayette (1) 1973 1951 7,600,000 7,600,000 -- 76.1%
Mineral (1) 1973 1938 3,354,000 3,354,000 -- 79.0%
Ohio (1) 1973 1940 14,235,000 14,235,000 -- 68.4%
Pleasants (1) 1973 1959 1,800,000 1,800,000 -- 60.7%
Preston (1) 1973 1947 4,965,000 -- 4,965,000 46.6%
Raleigh (1) 1973 1963 7,760,000 7,760,000 -- 80.6%
Ritchie (1) 1973 -- 1,972,000 -- 1,972,000 47.0%
Tyler (1) 1973 -- 1,855,000 1,855,000 -- 83.3%
Upshur (1) 1973 1956 3,552,000 3,552,000 -- 70.6%
Berkeley (1) 1974 -- 3,560,000 3,560,000 -- 69.2%
Gilmer (1) 1974 1955 1,825,000 -- 1,825,000 33.0%
Gilmer (2) 1974 1955 2,125,000 -- 2,125,000 48.0%
Jackson (1) 1974 1959 5,525,000 -- 5,525,000 35.0%
Jefferson (1) 1974 -- 1,520,000 1,520,000 -- 63.3%
Marshall (1) 1974 1965 4,350,000 4,350,000 -- 75.2%
McDowell (1) 1974 1964 4,000,000 4,000,000 -- 73.0%
Monongalia (1) 1974 1952 7,500,000 -- 7,500,000 57.1%
Morgan (3) 1974 1964 1,835,000 1,835,000 -- 77.0%
Preston (2) 1974 1947 5,320,000 -- 5,320,000 57.3%
Preston (3) 1974 1947 5,320,000 -- 5,320,000 49.2%
Putnam (1) 1974 1967 4,900,000 -- 4,900,000 59.1%
Putnam (2) 1974 1967 4,900,000 -- 4,900,000 48.0%
Randolph (1) 1974 1951 3,580,000 3,580,000 -- 64.4%
Taylor (1) 1974 1968 939,000 -- 939,000 25.4%
Wetzel (2) 1974 -- 4,955,000 4,955,000 -- 72.5%
Calhoun (1) 1975 1949 2,100,000 -- 2,100,000 32.0%
Calhoun (2) 1975 1949 2,100,000 -- 2,100,000 32.5%
Gilmer (3) 1975 1955 2,125,000 -- 2,125,000 50.0%
Harrison (1) 1975 -- 12,800,000 -- 12,800,000 54.1%
Harrison (2) 1975 -- 12,800,000 -- 12,800,000 47.2%
Marion (1) 1975 -- 12,800,000 -- 12,800,000 52.5%
Marion (2) 1975 -- 12,800,000 -- 12,800,000 58.7%
Monroe (1) 1975 1961 1,725,000 -- 1,725,000 25.9%
Nicholas (1) 1975 -- 4,500,000 4,500,000 -- 70.0%
Tucker (1) 1975 1938 1,285,000 1,285,000 -- 60.3%
Wirt (1) 1975 1961 935,000 -- 935,000 27.6%
Wyoming (1) 1975 1959 5,875,000 -- 5,875,000 50.5%
Gilmer (4) 1976 1955 2,459,000 -- 2,459,000 53.6%
Gilmer (5) 1976 1955 2,459,000 -- 2,459,000 51.6%
Kanawha (1) 1976 1967 39,467,000 -- 39,467,000 44.0%
Lincoln (1) 1976 1952 2,966,658 -- 2,966,658 42.5%
Lincoln (2) 1976 1952 2,966,658 -- 2,966,658 38.5%
Marion (3) 1976 -- 13,475,000 -- 13,475,000 46.7%
Monongalia (2) 1976 1952 6,995,000 6,995,000 -- 66.8%
Pocahontas (1) 1976 1968 1,818,000 -- 1,818,000 35.1%
Preston (4) 1976 1947 6,140,000 -- 6,140,000 47.1%
Putnam (3) 1976 1967 5,795,000 5,795,000 -- 68.3%
Roane (1) 1976 1946 3,430,000 -- 3,430,000 54.1%
Taylor (2) 1976 1968 1,515,533 -- 1,515,533 43.3%
-19-

COUNTY BOARDS OF EDUCATION
BOND ELECTIONS ATTEMPTED SINCE 1971
PRESENTED IN CHRONOLOGICAL ORDER
AS OF JUNE 30, 2014
Year of Previous Amount of Amount of Amount of Percent
Bond Issue Bond Issue Bond Issue Bond Issue of Voters
County Election Passed Proposed Approved Defeated For Bond
Wyoming (2) 1976 1959 7,720,000 -- 7,720,000 57.9%
Boone (1) 1977 -- 6,745,000 6,745,000 -- 81.1%
Braxton (1) 1977 1965 2,200,000 -- 2,200,000 26.0%
Brooke (1) 1977 1965 5,565,000 -- 5,565,000 32.7%
Doddridge (1) 1977 1940 1,871,358 -- 1,871,358 17.2%
Hardy (2) 1977 1972 2,430,000 2,430,000 -- 68.1%
Roane (2) 1977 1946 7,386,500 3,710,000 3,676,500 63.7%
Wayne (1) 1977 -- 7,155,000 -- 7,155,000 46.5%
Wyoming (3) 1977 1959 7,720,000 -- 7,720,000 55.0%
Barbour (1) 1978 1969 4,529,000 -- 4,529,000 50.6%
Barbour (2) 1978 1969 4,529,000 -- 4,529,000 55.0%
Braxton (2) 1978 1965 2,840,000 -- 2,840,000 32.4%
Hancock (1) 1978 1961 13,885,000 -- 13,885,000 47.6%
Lincoln (3) 1978 1952 3,157,000 3,157,000 -- 66.4%
Mingo (1) 1978 1967 4,220,000 -- 4,220,000 55.9%
Taylor (3) 1978 1968 3,000,000 -- 3,000,000 45.7%
Barbour (3) 1979 1969 4,529,000 4,529,000 -- 61.3%
Lewis (1) 1979 -- 6,430,000 -- 6,430,000 39.4%
Mercer (1) 1979 1954 16,737,000 16,737,000 -- 66.2%
Mingo (2) 1979 1967 4,220,000 4,220,000 -- 61.6%
Pendleton 1979 -- 1,800,000 -- 1,800,000 38.8%
Ritchie (2) 1979 -- 3,326,528 -- 3,326,528 35.3%
Cabell (1) 1980 1938 32,890,000 -- 32,890,000 35.6%
Hancock (2) 1980 1961 13,885,000 13,885,000 -- 64.6%
Mason (1) 1980 1950 8,307,332 -- 8,307,332 51.6%
Mason (2) 1980 1950 9,366,000 -- 9,366,000 58.5%
Mason (3) 1980 1950 9,366,000 -- 9,366,000 49.5%
Pocahontas (2) 1980 1968 3,280,000 -- 3,280,000 37.5%
Pocahontas (3) 1980 1968 3,280,000 -- 3,280,000 33.8%
Raleigh (2) 1980 1973 14,825,000 14,825,000 -- 63.4%
Brooke (2) 1981 1965 9,865,000 9,865,000 -- 63.1%
Greenbrier (1) 1981 1966 10,539,000 -- 10,539,000 31.0%
Wood (2) 1982 1971 18,100,000 -- 18,100,000 46.8%
Berkeley (2) 1983 1974 12,700,000 -- 12,700,000 47.7%
Logan (1) 1983 1969 10,000,000 -- 10,000,000 34.0%
Marion (4) 1983 -- 29,930,000 -- 29,930,000 35.1%
Berkeley (3) 1984 1974 12,000,000 -- 12,000,000 49.6%
Mingo (3) 1984 1979 7,850,000 7,850,000 -- 70.6%
Preston (5) 1984 1947 10,735,000 -- 10,735,000 35.1%
Wood (3) 1984 1971 3,950,000 3,950,000 -- 57.8%
Preston (6) 1985 1947 11,690,000 -- 11,690,000 45.3%
Wayne (2) 1985 -- 14,300,000 14,300,000 -- 53.0%
Ohio (2) 1986 1973 2,300,000 2,300,000 -- 68.2%
Preston (7) 1986 1947 15,690,000 -- 15,690,000 38.5%
Wetzel (3) 1986 1974 8,900,000 8,900,000 -- 61.5%
Berkeley (4) 1987 1974 10,960,000 10,960,000 -- 66.0%
Monongalia (3) 1987 1976 29,525,000 -- 29,525,000 48.0%
Taylor (4) 1987 1968 6,700,000 6,700,000 -- 61.6%
-20-
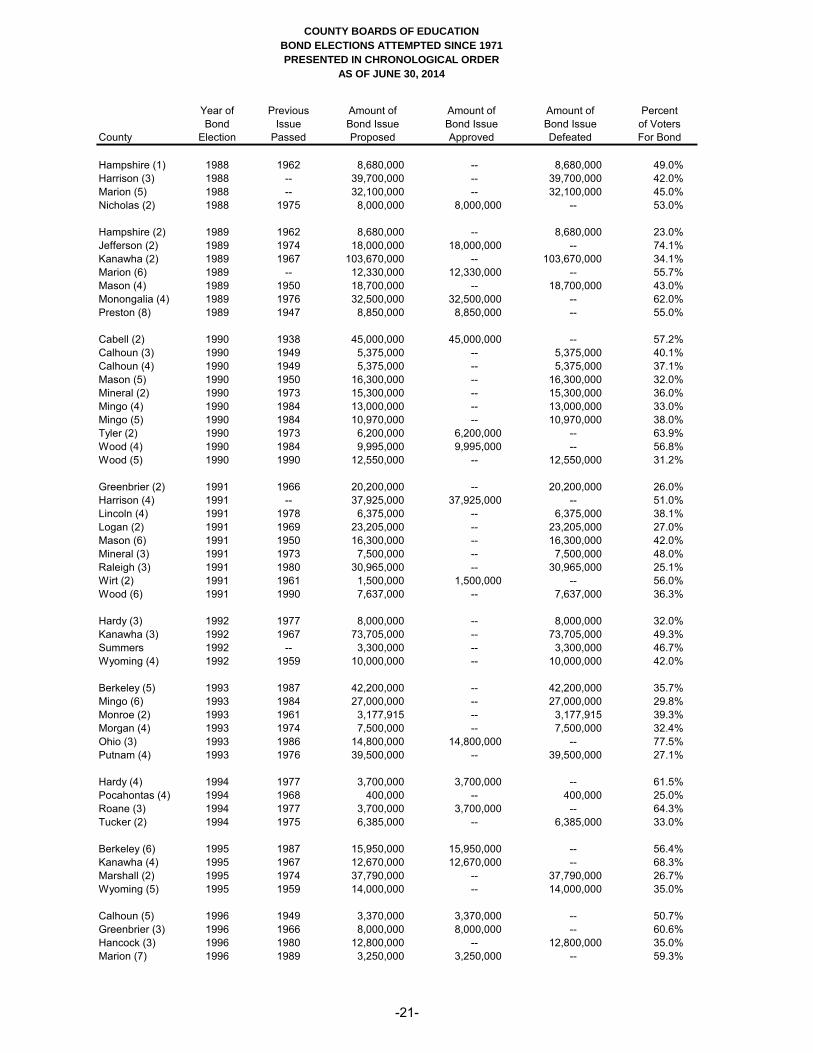
COUNTY BOARDS OF EDUCATION
BOND ELECTIONS ATTEMPTED SINCE 1971
PRESENTED IN CHRONOLOGICAL ORDER
AS OF JUNE 30, 2014
Year of Previous Amount of Amount of Amount of Percent
Bond Issue Bond Issue Bond Issue Bond Issue of Voters
County Election Passed Proposed Approved Defeated For Bond
Hampshire (1) 1988 1962 8,680,000 -- 8,680,000 49.0%
Harrison (3) 1988 -- 39,700,000 -- 39,700,000 42.0%
Marion (5) 1988 -- 32,100,000 -- 32,100,000 45.0%
Nicholas (2) 1988 1975 8,000,000 8,000,000 -- 53.0%
Hampshire (2) 1989 1962 8,680,000 -- 8,680,000 23.0%
Jefferson (2) 1989 1974 18,000,000 18,000,000 -- 74.1%
Kanawha (2) 1989 1967 103,670,000 -- 103,670,000 34.1%
Marion (6) 1989 -- 12,330,000 12,330,000 -- 55.7%
Mason (4) 1989 1950 18,700,000 -- 18,700,000 43.0%
Monongalia (4) 1989 1976 32,500,000 32,500,000 -- 62.0%
Preston (8) 1989 1947 8,850,000 8,850,000 -- 55.0%
Cabell (2) 1990 1938 45,000,000 45,000,000 -- 57.2%
Calhoun (3) 1990 1949 5,375,000 -- 5,375,000 40.1%
Calhoun (4) 1990 1949 5,375,000 -- 5,375,000 37.1%
Mason (5) 1990 1950 16,300,000 -- 16,300,000 32.0%
Mineral (2) 1990 1973 15,300,000 -- 15,300,000 36.0%
Mingo (4) 1990 1984 13,000,000 -- 13,000,000 33.0%
Mingo (5) 1990 1984 10,970,000 -- 10,970,000 38.0%
Tyler (2) 1990 1973 6,200,000 6,200,000 -- 63.9%
Wood (4) 1990 1984 9,995,000 9,995,000 -- 56.8%
Wood (5) 1990 1990 12,550,000 -- 12,550,000 31.2%
Greenbrier (2) 1991 1966 20,200,000 -- 20,200,000 26.0%
Harrison (4) 1991 -- 37,925,000 37,925,000 -- 51.0%
Lincoln (4) 1991 1978 6,375,000 -- 6,375,000 38.1%
Logan (2) 1991 1969 23,205,000 -- 23,205,000 27.0%
Mason (6) 1991 1950 16,300,000 -- 16,300,000 42.0%
Mineral (3) 1991 1973 7,500,000 -- 7,500,000 48.0%
Raleigh (3) 1991 1980 30,965,000 -- 30,965,000 25.1%
Wirt (2) 1991 1961 1,500,000 1,500,000 -- 56.0%
Wood (6) 1991 1990 7,637,000 -- 7,637,000 36.3%
Hardy (3) 1992 1977 8,000,000 -- 8,000,000 32.0%
Kanawha (3) 1992 1967 73,705,000 -- 73,705,000 49.3%
Summers 1992 -- 3,300,000 -- 3,300,000 46.7%
Wyoming (4) 1992 1959 10,000,000 -- 10,000,000 42.0%
Berkeley (5) 1993 1987 42,200,000 -- 42,200,000 35.7%
Mingo (6) 1993 1984 27,000,000 -- 27,000,000 29.8%
Monroe (2) 1993 1961 3,177,915 -- 3,177,915 39.3%
Morgan (4) 1993 1974 7,500,000 -- 7,500,000 32.4%
Ohio (3) 1993 1986 14,800,000 14,800,000 -- 77.5%
Putnam (4) 1993 1976 39,500,000 -- 39,500,000 27.1%
Hardy (4) 1994 1977 3,700,000 3,700,000 -- 61.5%
Pocahontas (4) 1994 1968 400,000 -- 400,000 25.0%
Roane (3) 1994 1977 3,700,000 3,700,000 -- 64.3%
Tucker (2) 1994 1975 6,385,000 -- 6,385,000 33.0%
Berkeley (6) 1995 1987 15,950,000 15,950,000 -- 56.4%
Kanawha (4) 1995 1967 12,670,000 12,670,000 -- 68.3%
Marshall (2) 1995 1974 37,790,000 -- 37,790,000 26.7%
Wyoming (5) 1995 1959 14,000,000 -- 14,000,000 35.0%
Calhoun (5) 1996 1949 3,370,000 3,370,000 -- 50.7%
Greenbrier (3) 1996 1966 8,000,000 8,000,000 -- 60.6%
Hancock (3) 1996 1980 12,800,000 -- 12,800,000 35.0%
Marion (7) 1996 1989 3,250,000 3,250,000 -- 59.3%
-21-
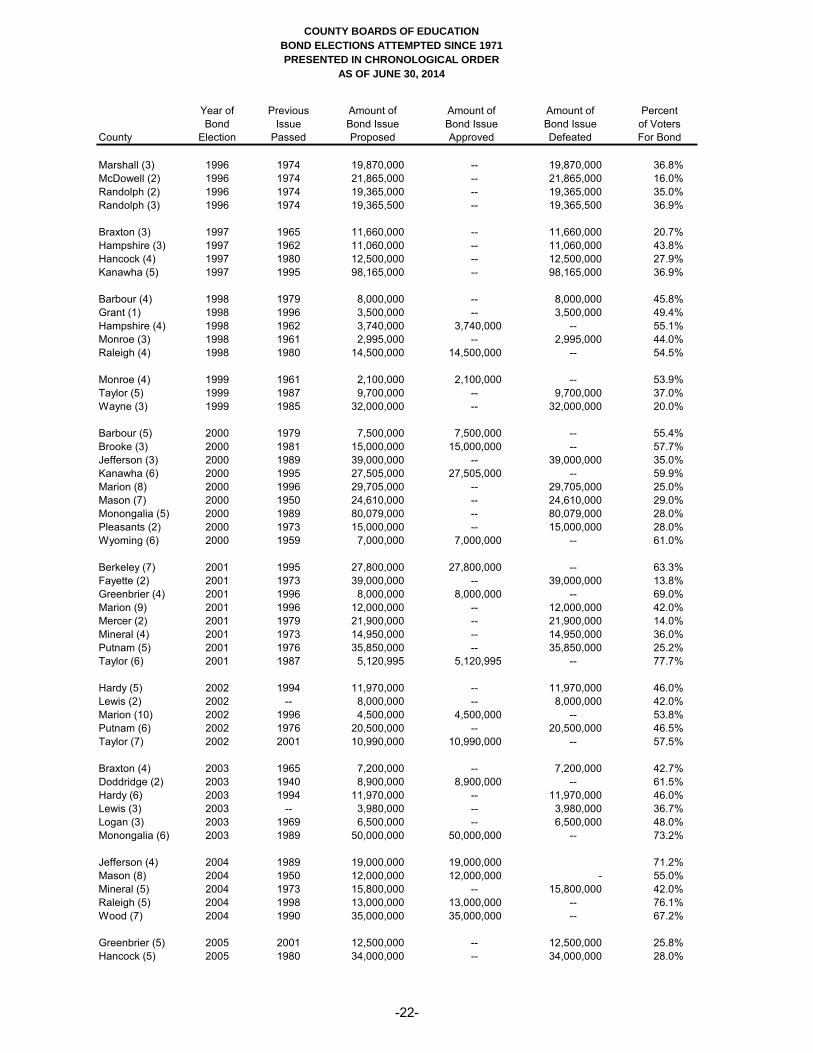
COUNTY BOARDS OF EDUCATION
BOND ELECTIONS ATTEMPTED SINCE 1971
PRESENTED IN CHRONOLOGICAL ORDER
AS OF JUNE 30, 2014
Year of Previous Amount of Amount of Amount of Percent
Bond Issue Bond Issue Bond Issue Bond Issue of Voters
County Election Passed Proposed Approved Defeated For Bond
Marshall (3) 1996 1974 19,870,000 -- 19,870,000 36.8%
McDowell (2) 1996 1974 21,865,000 -- 21,865,000 16.0%
Randolph (2) 1996 1974 19,365,000 -- 19,365,000 35.0%
Randolph (3) 1996 1974 19,365,500 -- 19,365,500 36.9%
Braxton (3) 1997 1965 11,660,000 -- 11,660,000 20.7%
Hampshire (3) 1997 1962 11,060,000 -- 11,060,000 43.8%
Hancock (4) 1997 1980 12,500,000 -- 12,500,000 27.9%
Kanawha (5) 1997 1995 98,165,000 -- 98,165,000 36.9%
Barbour (4) 1998 1979 8,000,000 -- 8,000,000 45.8%
Grant (1) 1998 1996 3,500,000 -- 3,500,000 49.4%
Hampshire (4) 1998 1962 3,740,000 3,740,000 -- 55.1%
Monroe (3) 1998 1961 2,995,000 -- 2,995,000 44.0%
Raleigh (4) 1998 1980 14,500,000 14,500,000 -- 54.5%
Monroe (4) 1999 1961 2,100,000 2,100,000 -- 53.9%
Taylor (5) 1999 1987 9,700,000 -- 9,700,000 37.0%
Wayne (3) 1999 1985 32,000,000 -- 32,000,000 20.0%
Barbour (5) 2000 1979 7,500,000 7,500,000 -- 55.4%
Brooke (3) 2000 1981 15,000,000 15,000,000 -- 57.7%
Jefferson (3) 2000 1989 39,000,000 -- 39,000,000 35.0%
Kanawha (6) 2000 1995 27,505,000 27,505,000 -- 59.9%
Marion (8) 2000 1996 29,705,000 -- 29,705,000 25.0%
Mason (7) 2000 1950 24,610,000 -- 24,610,000 29.0%
Monongalia (5) 2000 1989 80,079,000 -- 80,079,000 28.0%
Pleasants (2) 2000 1973 15,000,000 -- 15,000,000 28.0%
Wyoming (6) 2000 1959 7,000,000 7,000,000 -- 61.0%
Berkeley (7) 2001 1995 27,800,000 27,800,000 -- 63.3%
Fayette (2) 2001 1973 39,000,000 -- 39,000,000 13.8%
Greenbrier (4) 2001 1996 8,000,000 8,000,000 -- 69.0%
Marion (9) 2001 1996 12,000,000 -- 12,000,000 42.0%
Mercer (2) 2001 1979 21,900,000 -- 21,900,000 14.0%
Mineral (4) 2001 1973 14,950,000 -- 14,950,000 36.0%
Putnam (5) 2001 1976 35,850,000 -- 35,850,000 25.2%
Taylor (6) 2001 1987 5,120,995 5,120,995 -- 77.7%
Hardy (5) 2002 1994 11,970,000 -- 11,970,000 46.0%
Lewis (2) 2002 -- 8,000,000 -- 8,000,000 42.0%
Marion (10) 2002 1996 4,500,000 4,500,000 -- 53.8%
Putnam (6) 2002 1976 20,500,000 -- 20,500,000 46.5%
Taylor (7) 2002 2001 10,990,000 10,990,000 -- 57.5%
Braxton (4) 2003 1965 7,200,000 -- 7,200,000 42.7%
Doddridge (2) 2003 1940 8,900,000 8,900,000 -- 61.5%
Hardy (6) 2003 1994 11,970,000 -- 11,970,000 46.0%
Lewis (3) 2003 -- 3,980,000 -- 3,980,000 36.7%
Logan (3) 2003 1969 6,500,000 -- 6,500,000 48.0%
Monongalia (6) 2003 1989 50,000,000 50,000,000 -- 73.2%
Jefferson (4) 2004 1989 19,000,000 19,000,000 71.2%
Mason (8) 2004 1950 12,000,000 12,000,000 - 55.0%
Mineral (5) 2004 1973 15,800,000 -- 15,800,000 42.0%
Raleigh (5) 2004 1998 13,000,000 13,000,000 -- 76.1%
Wood (7) 2004 1990 35,000,000 35,000,000 -- 67.2%
Greenbrier (5) 2005 2001 12,500,000 -- 12,500,000 25.8%
Hancock (5) 2005 1980 34,000,000 -- 34,000,000 28.0%
-22-

COUNTY BOARDS OF EDUCATION
BOND ELECTIONS ATTEMPTED SINCE 1971
PRESENTED IN CHRONOLOGICAL ORDER
AS OF JUNE 30, 2014
Year of Previous Amount of Amount of Amount of Percent
Bond Issue Bond Issue Bond Issue Bond Issue of Voters
County Election Passed Proposed Approved Defeated For Bond
Cabell (3) 2006 1990 60,455,000 60,455,000 -- 55.4%
Jackson (2) 2006 1959 39,380,000 -- 39,380,000 25.1%
Marshall (4) 2006 1974 27,900,000 27,900,000 -- 51.0%
Harrison (5) 2007 1991 42,465,000 -- 42,465,000 39.2%
Braxton (5) 2008 1965 16,100,000 16,100,000 52.0%
Grant (2) 2008 1996 2,495,500 -- 2,495,500 42.0%
Greenbrier (6) 2008 2001 37,745,000 37,745,000 50.8%
Marion (11) 2008 2002 40,200,000 -- 40,200,000 48.0%
Mineral (6) 2008 1973 15,800,000 -- 15,800,000 47.9%
Mineral (7) 2008 1973 15,800,000 -- 15,800,000 41.6%
Preston (9) 2008 1989 49,995,000 -- 49,995,000 49.7%
Berkeley (8) 2009 2001 51,500,000 51,500,000 -- 63.6%
Fayette (3) 2009 1973 49,000,000 -- 49,000,000 22.6%
Putnam (7) 2009 1976 56,750,000 56,750,000 -- 56.0%
Gilmer (6) 2010 1955 11,915,000 -- 11,915,000 37.3%
Hancock (6) 2010 1980 37,000,000 37,000,000 -- 51.0%
Hancock (7) 2010 1980 39,600,000 39,600,000 -- 53.1%
Marion (12) 2010 2002 15,760,000 15,760,000 -- 53.7%
Pleasants (3) 2010 1973 18,050,000 18,050,000 -- 60.0%
Preston (10) 2010 1989 39,600,000 39,600,000 -- 53.0%
Boone (2) 2011 1977 45,160,000 -- 45,160,000 26.1%
Calhoun (6) 2011 1996 3,560,000 3,560,000 -- 67.0%
Harrison (6) 2011 1991 71,250,000 -- 71,250,000 24.0%
Upshur (2) 2011 1973 35,000,000 -- 35,000,000 29.0%
Barbour (6) 2012 2000 5,480,000 -- 5,480,000 37.3%
Harrison (7) 2012 1991 19,000,000 -- 19,000,000 34.0%
Marion (13) 2012 2010 10,000,000 -- 10,000,000 47.7%
Randolph (4) 2012 1974 13,500,000 -- 13,500,000 40.1%
Wayne (4) 2012 1985 33,100,000 -- 33,100,000 29.0%
Lincoln (5) 2013 1978 24,000,000 -- 24,000,000 25.1%
Brooke (4) 2014 2000 15,000,000 15,000,000 -- 51.0%
Raleigh (6) 2014 2004 39,895,000 -- 39,895,000 29.8%
Wayne (5) 2014 1985 18,000,000 18,000,000 -- 56.0%
OSF2
01/28/15
Bonds 14
NOTE: Percent of votes required for approval of bond levy changed from 60% to 50% by constitutional amendment adopted
at the General Election on Nov. 2, 1982.
-23-

This Page Intentionally Left Blank
-24-

PUBLIC SCHOOL
SUPPORT PROGRAM


STATE OF WEST VIRGINIA
ABBREVIATED SUMMARY OF THE
PUBLIC SCHOOL SUPPORT PROGRAM
FOR THE 2013-14 YEAR
The Public School Support Program (PSSP) is a plan of financial support for the public schools in the State of West Virginia that specifies statutorily the responsibilities of both the State and the fifty-five county school districts. The State’s responsibility for the basic program allowance is the total of the allowances calculated under Steps 1 through 7, less the aggregate amount calculated as the school districts’ local share. The PSSP provides allowances for personnel salaries (Steps 1, 2, and 5), employee benefit costs (Step 3), transportation operating costs (Step 4), general operating costs, substitute costs and allowances for faculty senates (Step 6), and improvement of instructional programs, increase in technology funding, and advanced placement programs (Step 7). Additional allowances are provided for alternative education, increased enrollment over the previous year, and other programs. The PSSP divides the school districts into four separate categories based on student population density and provides funding for a specified number of professional educators, professional student support personnel (nurses and counselors), and service personnel to each district based on the district’s student enrollment, with the districts with lower student population densities being funded at higher personnel ratios. Funding for student transportation operating costs is also based on these four categories, with the districts with lower student population densities receiving a higher allowance. The allowances for salaries are based on the state basic salary schedules included in Code and state equity funding. Equity funding was started in 1984 to ensure equity among the salaries paid by the various school districts through the state and is determined by computing the difference between each district’s county supplement schedule in place in 1984 and state required equity. Each school district’s local share is subtracted from that district’s total PSSP allowance to arrive at the state aid that the district is entitled to receive. Local share is a computation of a district's projected regular levy property tax collections for the year. School districts are authorized to levy an excess levy if approved by at least a majority of the voters, and 43 of the 55 districts have such levies in place for the current year, however, the projected tax collections from the excess levies are not included in determining the local share amount. Local share is computed by multiplying the taxable assessed valuation of all property in the district for the current fiscal year as certified by the county assessor by 90% of the regular levy rates for the year as set by the Legislature and then deducting five percent (5%) as an allowance for discounts, exonerations, delinquencies, with other allowances also deducted. As a result of this equalization process, West Virginia is consistently ranked near the top regarding the equability of its state aid funding formula. For example, Education Week in its 2009 edition of Quality Counts reported that the difference in per pupil expenditures between the district with the highest per pupil expenditures and the district with the lowest per pupil expenditures was the smallest in the nation. Comprehensive changes were made to the Public School Support Program beginning with the 2008-09 year, with the increased allowances between the old and revised provisions being phased-in over a five year period, and a hold harmless provision included for the districts that are projected to receive less state aid as a result of implementing these revisions during the five year phase-in period. The changes included: Eliminated adjusted enrollment as a funding ratio; divided the districts into four groups based on student net enrolment per square mile and increased the funding limits for the more sparse districts; funds the districts with student net enrollments of less than 1,400 at a base determined by computing the district’s enrollment difference between its actual enrollment and 1,400, and further adjusting the difference by the percent that the district’s student population density is to the district with the lowest density; created the personnel classification of Professional Student Support Personnel (SSP) for school counselors and school nurses and funds this category under a separate step of the formula (Step 5); uses the same four groups created for personnel to determine the allowance for student transportation operating costs; and added a few other allowances.
-25-

A brief description of each step, and the amounts appropriated for each step for the 2013-14 year, are:
Description Appropriation 1. Professional Educators - Allowance to pay the annual state minimum salary and supplemental equity for professional educators (PE), limited to the following applicable funding limits per each 1,000 students in net enrollment, based on the district’s student population density. The funding limits for the 2011-12 year were: Sparse – 72.75, Low – 72.60, Medium – 72.45, or High - 72.30.
$ 871,207,235 2. Service Personnel - Allowance to pay the annual state minimum salary and supplemental equity for service personnel (SP), limited to the following applicable funding limits per each 1,000 students in net enrollment, based on the district’s student population density. The funding limits for the 2011-12 year were: Sparse – 45.88, Low – 45.30, Medium – 44.73, or High – 44.17.
290,524,089 3. Fixed charges - Allowance for the district’s share of contributions for social security, unemployment compensation and workers’ compensation on the salaries determined in steps 1, 2 and 5 (8.71%).
104,250,383
4. Transportation - Allowance for student transportation operating costs. (a) Allowance for operating costs based on the actual maintenance, operations and contracted services multiplied by the appropriate percentage based on the county’s population density (b) an additional 10% allowance of the actual expenditures for maintenance, operations and contracted services for the portion of the bus fleet that uses alternative fuels (c) an additional 10% allowance of actual expenditures for operations, maintenance and contracted services for the portion of the bus fleet used to transport students to and from multi-county centers (d) 100% of insurance premium costs; and (e) aid paid to students in lieu of transportation, based on state average rate. Allowance for bus replacement based on 8.33% of the current replacement value of the bus fleet, plus the remaining value for buses purchased after July 1999 with 180,000 miles. Districts with increased net enrollments able to apply for funding for additional buses. Each district’s allowance is limited to 1/3 above the state average allowance on a per mile basis, exclusive of the allowance for additional buses.
84,860,000
5. Professional Student Support Services - Allowance to pay the annual state minimum salary and supplemental equity for professional student support personnel (counselors and school nurses) employed.
37,927,850
6. Allowance for Other Current Expenses, Substitute Employee Salaries and Faculty Senates - Allowance determined as follows: (a) 10% of the allowance for steps 1, 2 and 5 for current expense distributed to each school district proportionally on the basis of the average of each school district’s average daily attendance and net enrollment; (b) & (c) 2.5% of steps 1 & 5 and step 2 for substitutes distributed on the basis of the number of personnel allowed for funding; and (d) $200 per professional instructional personnel and professional student support personnel employed for faculty senates.
154,113,184
7. Improvement of Instructional Programs - Step 7a is the allowance for the improvement of instructional programs; the amount appropriated is to be the amount appropriated the preceding year plus 15% of the growth in local share; distributed to each school district is made on the following basis: $150,000 equally with the balance distributed proportionally on the basis of the average of each school district’s average daily attendance and net enrollment. Step 7b is the allowance for the 21st Century Strategic Technology Learning Plan. The amount appropriated is the amount appropriated the preceding year plus 15%of the grown in local share. Step 7c is the allowance for advanced placement, dual credit and international baccalaureate programs. It is based on one percent of the state average per pupil state aid multiplied by the number of students enrolled in such classes in each district.
56,499,972 8. Total Basic Foundation Allowance - The total of the seven preceding allowances.
1,599,382,713
9. Local Share - Computation of each district’s projected regular levy net property tax collections for the year, determined by multiplying the current assessed valuation of all taxable property in the county from the March 3rd Certificates of Valuation completed by the county assessor, exclusive of the increased valuation for Tax Increment Financing (TIF) projects, by 90% of the regular levy rates as set by the Legislature and then deducting: (a) an allowance of 5% for discounts, exonerations and delinquencies; (b) the amount paid to the Assessor’s Valuation Fund; and (c) the amount required to fund the Growth Counties Facilities Fund. Excess levies are not included in the local share calculation.
(420,779,055)
10. State Aid Allowance for County School Districts - The State’s share of the Public School Support Program for school districts.
$ 1,178,603,658
-26-

In addition, the following additional amounts were appropriated under the Public School Support Program for county boards of education for the 2013-14 year:
State Teachers= Retirement System:
o Normal Cost 66,275,000 o Actuarial Accrued Liability (General – Fund 0317) 370,469,000 o Actuarial Accrued Liability (Other – Fund 7007 (Note (1) 20,000,000 o Sub-total Teachers’ Retirement System - PSSP 456,744,000
Public Employees Insurance Agency Note (2) 213,130,337
School Building Authority for debt service on bonds issued prior to Jan. 1, 1994 23,308,583
Basic State Aid (Including PEIA, Retirement and Debt Service for SBA) $1,871,786,578 Notes: (1) An additional $20,000,000 was appropriated for the State Teachers’ Retirement System – Unfunded Liability under Fund 7007, Acct. 77500 (Office of the Secretary of Revenue) as a part of the PSSP, and another $13,333,000 was appropriated for the State Teachers’ Retirement System from the Teachers’ Retirement Savings Realized Account outside of the PSSP from two separate funds and transferred directly to the Consolidated Public Retirement Board (CPRB). The amounts appropriated from the latter two funds outside of the PSSP are reflected below. (2) The appropriation for PEIA was reduced by $15,758,995 for the 2013-14 year to distribute a portion of the balance on deposit in the PEIA Excess Appropriation Reserve Account which has accumulated over prior years.
In addition to the previously discussed allowances, the following amounts were appropriated for other allowances under the PSSP for the 2013-14 year:
Allowance for increased enrollment $ 7,360,000
Allowance for safe schools (Alternative education programs) 5,060,312
English as a Second Language 100,000
Allowance for Sustained Growth 39,148
Regional Education Service Agencies (RESAs) 3,690,750
Total other allowance under the Public School Support Program 16,250,210
Total State Aid Appropriated under the PSSP – 2013-14 Year $1,888,036,788
In addition, the following appropriation was made directly to the Teachers’ Retirement System for the 2013-14 year from the savings realized by closing the Teachers’ Defined Contribution (TDC) Plan in 2005:
Teachers’ Retirement Savings Realized (From General Fund – Acct. 0313) $ 13,333,000
Teachers’ Retirement Savings Realized (From Excess Lottery – Acct. 7208) 28,061,000
Total – Teachers’ Retirement Savings Realized 41,394,000
Total appropriation for the Teachers’ Retirement System – 2013-14 $ 498,138,000
PSSP Abbreviated Summary 14
-27-
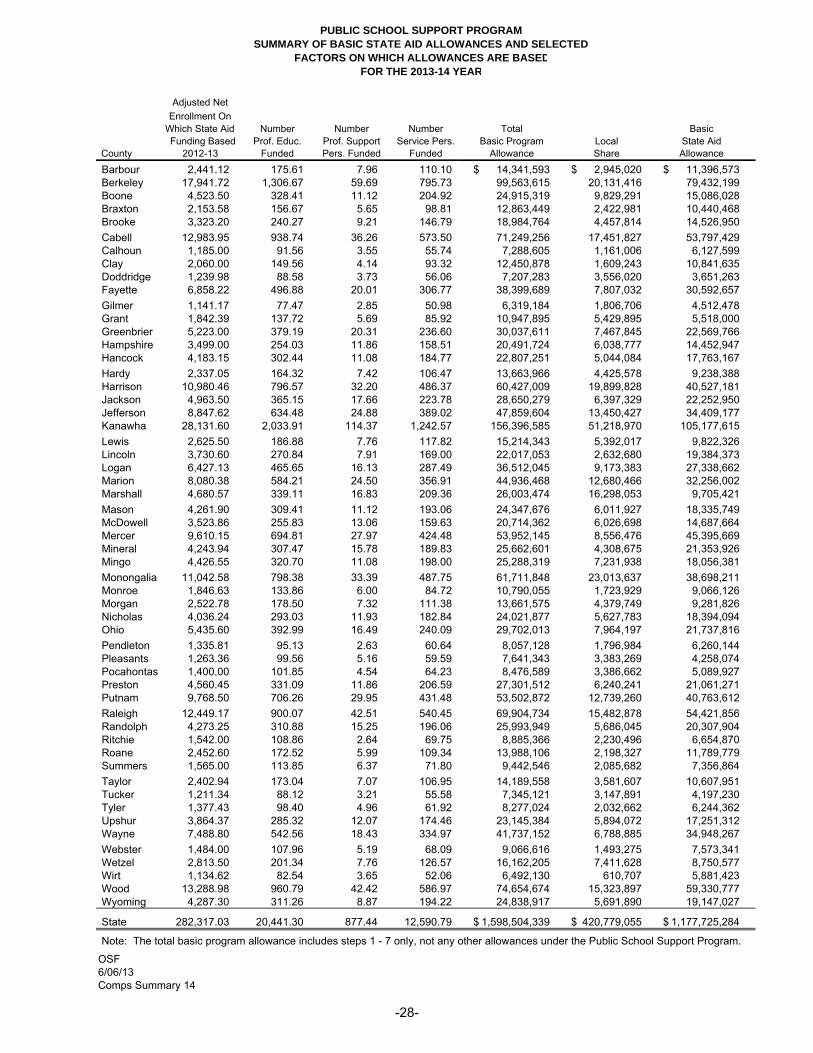
PUBLIC SCHOOL SUPPORT PROGRAMSUMMARY OF BASIC STATE AID ALLOWANCES AND SELECTED
FACTORS ON WHICH ALLOWANCES ARE BASEDFOR THE 2013-14 YEAR
Adjusted NetEnrollment On
Which State Aid Number Number Number Total BasicFunding Based Prof. Educ. Prof. Support Service Pers. Basic Program Local State Aid
County 2012-13 Funded Pers. Funded Funded Allowance Share Allowance
Barbour 2,441.12 175.61 7.96 110.10 14,341,593$ 2,945,020$ 11,396,573$ Berkeley 17,941.72 1,306.67 59.69 795.73 99,563,615 20,131,416 79,432,199 Boone 4,523.50 328.41 11.12 204.92 24,915,319 9,829,291 15,086,028 Braxton 2,153.58 156.67 5.65 98.81 12,863,449 2,422,981 10,440,468 Brooke 3,323.20 240.27 9.21 146.79 18,984,764 4,457,814 14,526,950 Cabell 12,983.95 938.74 36.26 573.50 71,249,256 17,451,827 53,797,429 Calhoun 1,185.00 91.56 3.55 55.74 7,288,605 1,161,006 6,127,599 Clay 2,060.00 149.56 4.14 93.32 12,450,878 1,609,243 10,841,635 Doddridge 1,239.98 88.58 3.73 56.06 7,207,283 3,556,020 3,651,263 Fayette 6,858.22 496.88 20.01 306.77 38,399,689 7,807,032 30,592,657 Gilmer 1,141.17 77.47 2.85 50.98 6,319,184 1,806,706 4,512,478 Grant 1,842.39 137.72 5.69 85.92 10,947,895 5,429,895 5,518,000 Greenbrier 5,223.00 379.19 20.31 236.60 30,037,611 7,467,845 22,569,766 Hampshire 3,499.00 254.03 11.86 158.51 20,491,724 6,038,777 14,452,947 Hancock 4,183.15 302.44 11.08 184.77 22,807,251 5,044,084 17,763,167 Hardy 2,337.05 164.32 7.42 106.47 13,663,966 4,425,578 9,238,388 Harrison 10,980.46 796.57 32.20 486.37 60,427,009 19,899,828 40,527,181 Jackson 4,963.50 365.15 17.66 223.78 28,650,279 6,397,329 22,252,950 Jefferson 8,847.62 634.48 24.88 389.02 47,859,604 13,450,427 34,409,177 Kanawha 28,131.60 2,033.91 114.37 1,242.57 156,396,585 51,218,970 105,177,615 Lewis 2,625.50 186.88 7.76 117.82 15,214,343 5,392,017 9,822,326 Lincoln 3,730.60 270.84 7.91 169.00 22,017,053 2,632,680 19,384,373 Logan 6,427.13 465.65 16.13 287.49 36,512,045 9,173,383 27,338,662 Marion 8,080.38 584.21 24.50 356.91 44,936,468 12,680,466 32,256,002 Marshall 4,680.57 339.11 16.83 209.36 26,003,474 16,298,053 9,705,421 Mason 4,261.90 309.41 11.12 193.06 24,347,676 6,011,927 18,335,749 McDowell 3,523.86 255.83 13.06 159.63 20,714,362 6,026,698 14,687,664 Mercer 9,610.15 694.81 27.97 424.48 53,952,145 8,556,476 45,395,669 Mineral 4,243.94 307.47 15.78 189.83 25,662,601 4,308,675 21,353,926 Mingo 4,426.55 320.70 11.08 198.00 25,288,319 7,231,938 18,056,381 Monongalia 11,042.58 798.38 33.39 487.75 61,711,848 23,013,637 38,698,211 Monroe 1,846.63 133.86 6.00 84.72 10,790,055 1,723,929 9,066,126 Morgan 2,522.78 178.50 7.32 111.38 13,661,575 4,379,749 9,281,826 Nicholas 4,036.24 293.03 11.93 182.84 24,021,877 5,627,783 18,394,094 Ohio 5,435.60 392.99 16.49 240.09 29,702,013 7,964,197 21,737,816 Pendleton 1,335.81 95.13 2.63 60.64 8,057,128 1,796,984 6,260,144 Pleasants 1,263.36 99.56 5.16 59.59 7,641,343 3,383,269 4,258,074 Pocahontas 1,400.00 101.85 4.54 64.23 8,476,589 3,386,662 5,089,927 Preston 4,560.45 331.09 11.86 206.59 27,301,512 6,240,241 21,061,271 Putnam 9,768.50 706.26 29.95 431.48 53,502,872 12,739,260 40,763,612 Raleigh 12,449.17 900.07 42.51 540.45 69,904,734 15,482,878 54,421,856 Randolph 4,273.25 310.88 15.25 196.06 25,993,949 5,686,045 20,307,904 Ritchie 1,542.00 108.86 2.64 69.75 8,885,366 2,230,496 6,654,870 Roane 2,452.60 172.52 5.99 109.34 13,988,106 2,198,327 11,789,779 Summers 1,565.00 113.85 6.37 71.80 9,442,546 2,085,682 7,356,864 Taylor 2,402.94 173.04 7.07 106.95 14,189,558 3,581,607 10,607,951 Tucker 1,211.34 88.12 3.21 55.58 7,345,121 3,147,891 4,197,230 Tyler 1,377.43 98.40 4.96 61.92 8,277,024 2,032,662 6,244,362 Upshur 3,864.37 285.32 12.07 174.46 23,145,384 5,894,072 17,251,312 Wayne 7,488.80 542.56 18.43 334.97 41,737,152 6,788,885 34,948,267 Webster 1,484.00 107.96 5.19 68.09 9,066,616 1,493,275 7,573,341 Wetzel 2,813.50 201.34 7.76 126.57 16,162,205 7,411,628 8,750,577 Wirt 1,134.62 82.54 3.65 52.06 6,492,130 610,707 5,881,423 Wood 13,288.98 960.79 42.42 586.97 74,654,674 15,323,897 59,330,777 Wyoming 4,287.30 311.26 8.87 194.22 24,838,917 5,691,890 19,147,027
State 282,317.03 20,441.30 877.44 12,590.79 1,598,504,339$ 420,779,055$ 1,177,725,284$
Note: The total basic program allowance includes steps 1 - 7 only, not any other allowances under the Public School Support Program.
OSF6/06/13Comps Summary 14
-28-

PUBLIC SCHOOL SUPPORT PROGRAMSTATE AID ALLOWANCE ON A PERCENTAGE BASIS
BASED ON THE FINAL COMPUTATIONSFOR THE 2013-14 YEAR
% of Local Basic % of StateTotal Local Share to Total State Aid Aid to Total
County Allowance Share Allowance Allowance AllowanceBarbour 14,341,593 2,945,020 20.53% 11,396,573 79.47%Berkeley 99,563,615 20,131,416 20.22% 79,432,199 79.78%Boone 24,915,319 9,829,291 39.45% 15,086,028 60.55%Braxton 12,863,449 2,422,981 18.84% 10,440,468 81.16%Brooke 18,984,764 4,457,814 23.48% 14,526,950 76.52%Cabell 71,249,256 17,451,827 24.49% 53,797,429 75.51%Calhoun 7,288,605 1,161,006 15.93% 6,127,599 84.07%Clay 12,450,878 1,609,243 12.92% 10,841,635 87.08%Doddridge 7,207,283 3,556,020 49.34% 3,651,263 50.66%Fayette 38,399,689 7,807,032 20.33% 30,592,657 79.67%Gilmer 6,319,184 1,806,706 28.59% 4,512,478 71.41%Grant 10,947,895 5,429,895 49.60% 5,518,000 50.40%Greenbrier 30,037,611 7,467,845 24.86% 22,569,766 75.14%Hampshire 20,491,724 6,038,777 29.47% 14,452,947 70.53%Hancock 22,807,251 5,044,084 22.12% 17,763,167 77.88%Hardy 13,663,966 4,425,578 32.39% 9,238,388 67.61%Harrison 60,427,009 19,899,828 32.93% 40,527,181 67.07%Jackson 28,650,279 6,397,329 22.33% 22,252,950 77.67%Jefferson 47,859,604 13,450,427 28.10% 34,409,177 71.90%Kanawha 156,396,585 51,218,970 32.75% 105,177,615 67.25%Lewis 15,214,343 5,392,017 35.44% 9,822,326 64.56%Lincoln 22,017,053 2,632,680 11.96% 19,384,373 88.04%Logan 36,512,045 9,173,383 25.12% 27,338,662 74.88%Marion 44,936,468 12,680,466 28.22% 32,256,002 71.78%Marshall 26,003,474 16,298,053 62.68% 9,705,421 37.32%Mason 24,347,676 6,011,927 24.69% 18,335,749 75.31%McDowell 20,714,362 6,026,698 29.09% 14,687,664 70.91%Mercer 53,952,145 8,556,476 15.86% 45,395,669 84.14%Mineral 25,662,601 4,308,675 16.79% 21,353,926 83.21%Mingo 25,288,319 7,231,938 28.60% 18,056,381 71.40%Monongalia 61,711,848 23,013,637 37.29% 38,698,211 62.71%Monroe 10,790,055 1,723,929 15.98% 9,066,126 84.02%Morgan 13,661,575 4,379,749 32.06% 9,281,826 67.94%Nicholas 24,021,877 5,627,783 23.43% 18,394,094 76.57%Ohio 29,702,013 7,964,197 26.81% 21,737,816 73.19%Pendleton 8,057,128 1,796,984 22.30% 6,260,144 77.70%Pleasants 7,641,343 3,383,269 44.28% 4,258,074 55.72%Pocahontas 8,476,589 3,386,662 39.95% 5,089,927 60.05%Preston 27,301,512 6,240,241 22.86% 21,061,271 77.14%Putnam 53,502,872 12,739,260 23.81% 40,763,612 76.19%Raleigh 69,904,734 15,482,878 22.15% 54,421,856 77.85%Randolph 25,993,949 5,686,045 21.87% 20,307,904 78.13%Ritchie 8,885,366 2,230,496 25.10% 6,654,870 74.90%Roane 13,988,106 2,198,327 15.72% 11,789,779 84.28%Summers 9,442,546 2,085,682 22.09% 7,356,864 77.91%Taylor 14,189,558 3,581,607 25.24% 10,607,951 74.76%Tucker 7,345,121 3,147,891 42.86% 4,197,230 57.14%Tyler 8,277,024 2,032,662 24.56% 6,244,362 75.44%Upshur 23,145,384 5,894,072 25.47% 17,251,312 74.53%Wayne 41,737,152 6,788,885 16.27% 34,948,267 83.73%Webster 9,066,616 1,493,275 16.47% 7,573,341 83.53%Wetzel 16,162,205 7,411,628 45.86% 8,750,577 54.14%Wirt 6,492,130 610,707 9.41% 5,881,423 90.59%Wood 74,654,674 15,323,897 20.53% 59,330,777 79.47%Wyoming 24,838,917 5,691,890 22.92% 19,147,027 77.08%
State 1,598,504,339 420,779,055 26.32% 1,177,725,284 73.68%
Note: Basic state aid includes steps 1 - 7 only, not any other allowances under the Public School Support Program.
OSF5/09/13Comps Pct 14 -29-

PUBLIC SCHOOL SUPPORT PROGRAMSTATE AID ALLOWANCE ON A PERCENTAGE BASIS
ARRANGED IN DESCENDING ORDER BY PERCENTAGEBASED ON THE FINAL COMPUTATIONS
FOR THE 2013-14 YEAR
% of Local Basic % of StateTotal Local Share to Total State Aid Aid to Total
Ct. County Allowance Share Allowance Allowance Allowance1 Wirt 6,492,130 610,707 9.41% 5,881,423 90.59%2 Lincoln 22,017,053 2,632,680 11.96% 19,384,373 88.04%3 Clay 12,450,878 1,609,243 12.92% 10,841,635 87.08%4 Roane 13,988,106 2,198,327 15.72% 11,789,779 84.28%5 Mercer 53,952,145 8,556,476 15.86% 45,395,669 84.14%6 Calhoun 7,288,605 1,161,006 15.93% 6,127,599 84.07%7 Monroe 10,790,055 1,723,929 15.98% 9,066,126 84.02%8 Wayne 41,737,152 6,788,885 16.27% 34,948,267 83.73%9 Webster 9,066,616 1,493,275 16.47% 7,573,341 83.53%10 Mineral 25,662,601 4,308,675 16.79% 21,353,926 83.21%11 Braxton 12,863,449 2,422,981 18.84% 10,440,468 81.16%12 Berkeley 99,563,615 20,131,416 20.22% 79,432,199 79.78%13 Fayette 38,399,689 7,807,032 20.33% 30,592,657 79.67%14 Wood 74,654,674 15,323,897 20.53% 59,330,777 79.47%15 Barbour 14,341,593 2,945,020 20.53% 11,396,573 79.47%16 Randolph 25,993,949 5,686,045 21.87% 20,307,904 78.13%17 Summers 9,442,546 2,085,682 22.09% 7,356,864 77.91%18 Hancock 22,807,251 5,044,084 22.12% 17,763,167 77.88%19 Raleigh 69,904,734 15,482,878 22.15% 54,421,856 77.85%20 Pendleton 8,057,128 1,796,984 22.30% 6,260,144 77.70%21 Jackson 28,650,279 6,397,329 22.33% 22,252,950 77.67%22 Preston 27,301,512 6,240,241 22.86% 21,061,271 77.14%23 Wyoming 24,838,917 5,691,890 22.92% 19,147,027 77.08%24 Nicholas 24,021,877 5,627,783 23.43% 18,394,094 76.57%25 Brooke 18,984,764 4,457,814 23.48% 14,526,950 76.52%26 Putnam 53,502,872 12,739,260 23.81% 40,763,612 76.19%27 Cabell 71,249,256 17,451,827 24.49% 53,797,429 75.51%28 Tyler 8,277,024 2,032,662 24.56% 6,244,362 75.44%29 Mason 24,347,676 6,011,927 24.69% 18,335,749 75.31%30 Greenbrier 30,037,611 7,467,845 24.86% 22,569,766 75.14%31 Ritchie 8,885,366 2,230,496 25.10% 6,654,870 74.90%32 Logan 36,512,045 9,173,383 25.12% 27,338,662 74.88%33 Taylor 14,189,558 3,581,607 25.24% 10,607,951 74.76%34 Upshur 23,145,384 5,894,072 25.47% 17,251,312 74.53%35 Ohio 29,702,013 7,964,197 26.81% 21,737,816 73.19%36 Jefferson 47,859,604 13,450,427 28.10% 34,409,177 71.90%37 Marion 44,936,468 12,680,466 28.22% 32,256,002 71.78%38 Gilmer 6,319,184 1,806,706 28.59% 4,512,478 71.41%39 Mingo 25,288,319 7,231,938 28.60% 18,056,381 71.40%40 McDowell 20,714,362 6,026,698 29.09% 14,687,664 70.91%41 Hampshire 20,491,724 6,038,777 29.47% 14,452,947 70.53%42 Morgan 13,661,575 4,379,749 32.06% 9,281,826 67.94%43 Hardy 13,663,966 4,425,578 32.39% 9,238,388 67.61%44 Kanawha 156,396,585 51,218,970 32.75% 105,177,615 67.25%45 Harrison 60,427,009 19,899,828 32.93% 40,527,181 67.07%46 Lewis 15,214,343 5,392,017 35.44% 9,822,326 64.56%47 Monongalia 61,711,848 23,013,637 37.29% 38,698,211 62.71%48 Boone 24,915,319 9,829,291 39.45% 15,086,028 60.55%49 Pocahontas 8,476,589 3,386,662 39.95% 5,089,927 60.05%50 Tucker 7,345,121 3,147,891 42.86% 4,197,230 57.14%51 Pleasants 7,641,343 3,383,269 44.28% 4,258,074 55.72%52 Wetzel 16,162,205 7,411,628 45.86% 8,750,577 54.14%53 Doddridge 7,207,283 3,556,020 49.34% 3,651,263 50.66%54 Grant 10,947,895 5,429,895 49.60% 5,518,000 50.40%55 Marshall 26,003,474 16,298,053 62.68% 9,705,421 37.32%
- State 1,598,504,339 420,779,055 26.32% 1,177,725,284 73.68%
Note: Basic state aid includes steps 1 - 7 only, not any other allowances under the Public School Support Program.
OSF
Comps Pct 145/09/13 -30-
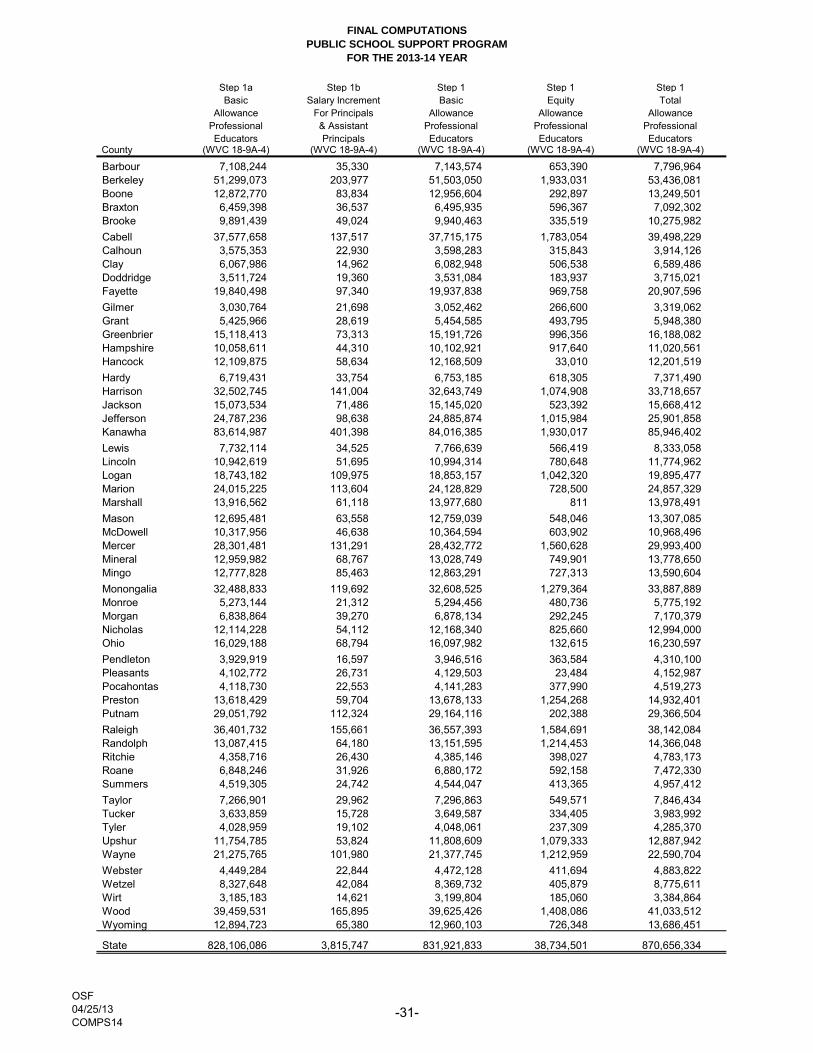
FINAL COMPUTATIONS
PUBLIC SCHOOL SUPPORT PROGRAM
FOR THE 2013-14 YEAR
Step 1a Step 1b Step 1 Step 1 Step 1
Basic Salary Increment Basic Equity Total
Allowance For Principals Allowance Allowance Allowance
Professional & Assistant Professional Professional Professional
Educators Principals Educators Educators EducatorsCounty (WVC 18-9A-4) (WVC 18-9A-4) (WVC 18-9A-4) (WVC 18-9A-4) (WVC 18-9A-4)
Barbour 7,108,244 35,330 7,143,574 653,390 7,796,964
Berkeley 51,299,073 203,977 51,503,050 1,933,031 53,436,081
Boone 12,872,770 83,834 12,956,604 292,897 13,249,501
Braxton 6,459,398 36,537 6,495,935 596,367 7,092,302
Brooke 9,891,439 49,024 9,940,463 335,519 10,275,982
Cabell 37,577,658 137,517 37,715,175 1,783,054 39,498,229
Calhoun 3,575,353 22,930 3,598,283 315,843 3,914,126
Clay 6,067,986 14,962 6,082,948 506,538 6,589,486
Doddridge 3,511,724 19,360 3,531,084 183,937 3,715,021
Fayette 19,840,498 97,340 19,937,838 969,758 20,907,596
Gilmer 3,030,764 21,698 3,052,462 266,600 3,319,062
Grant 5,425,966 28,619 5,454,585 493,795 5,948,380
Greenbrier 15,118,413 73,313 15,191,726 996,356 16,188,082
Hampshire 10,058,611 44,310 10,102,921 917,640 11,020,561
Hancock 12,109,875 58,634 12,168,509 33,010 12,201,519
Hardy 6,719,431 33,754 6,753,185 618,305 7,371,490
Harrison 32,502,745 141,004 32,643,749 1,074,908 33,718,657
Jackson 15,073,534 71,486 15,145,020 523,392 15,668,412
Jefferson 24,787,236 98,638 24,885,874 1,015,984 25,901,858
Kanawha 83,614,987 401,398 84,016,385 1,930,017 85,946,402
Lewis 7,732,114 34,525 7,766,639 566,419 8,333,058
Lincoln 10,942,619 51,695 10,994,314 780,648 11,774,962
Logan 18,743,182 109,975 18,853,157 1,042,320 19,895,477
Marion 24,015,225 113,604 24,128,829 728,500 24,857,329
Marshall 13,916,562 61,118 13,977,680 811 13,978,491
Mason 12,695,481 63,558 12,759,039 548,046 13,307,085
McDowell 10,317,956 46,638 10,364,594 603,902 10,968,496
Mercer 28,301,481 131,291 28,432,772 1,560,628 29,993,400
Mineral 12,959,982 68,767 13,028,749 749,901 13,778,650
Mingo 12,777,828 85,463 12,863,291 727,313 13,590,604
Monongalia 32,488,833 119,692 32,608,525 1,279,364 33,887,889
Monroe 5,273,144 21,312 5,294,456 480,736 5,775,192
Morgan 6,838,864 39,270 6,878,134 292,245 7,170,379
Nicholas 12,114,228 54,112 12,168,340 825,660 12,994,000
Ohio 16,029,188 68,794 16,097,982 132,615 16,230,597
Pendleton 3,929,919 16,597 3,946,516 363,584 4,310,100
Pleasants 4,102,772 26,731 4,129,503 23,484 4,152,987
Pocahontas 4,118,730 22,553 4,141,283 377,990 4,519,273
Preston 13,618,429 59,704 13,678,133 1,254,268 14,932,401
Putnam 29,051,792 112,324 29,164,116 202,388 29,366,504
Raleigh 36,401,732 155,661 36,557,393 1,584,691 38,142,084
Randolph 13,087,415 64,180 13,151,595 1,214,453 14,366,048
Ritchie 4,358,716 26,430 4,385,146 398,027 4,783,173
Roane 6,848,246 31,926 6,880,172 592,158 7,472,330
Summers 4,519,305 24,742 4,544,047 413,365 4,957,412
Taylor 7,266,901 29,962 7,296,863 549,571 7,846,434
Tucker 3,633,859 15,728 3,649,587 334,405 3,983,992
Tyler 4,028,959 19,102 4,048,061 237,309 4,285,370
Upshur 11,754,785 53,824 11,808,609 1,079,333 12,887,942
Wayne 21,275,765 101,980 21,377,745 1,212,959 22,590,704
Webster 4,449,284 22,844 4,472,128 411,694 4,883,822
Wetzel 8,327,648 42,084 8,369,732 405,879 8,775,611
Wirt 3,185,183 14,621 3,199,804 185,060 3,384,864
Wood 39,459,531 165,895 39,625,426 1,408,086 41,033,512
Wyoming 12,894,723 65,380 12,960,103 726,348 13,686,451
State 828,106,086 3,815,747 831,921,833 38,734,501 870,656,334
OSF
04/25/13
COMPS14-31-
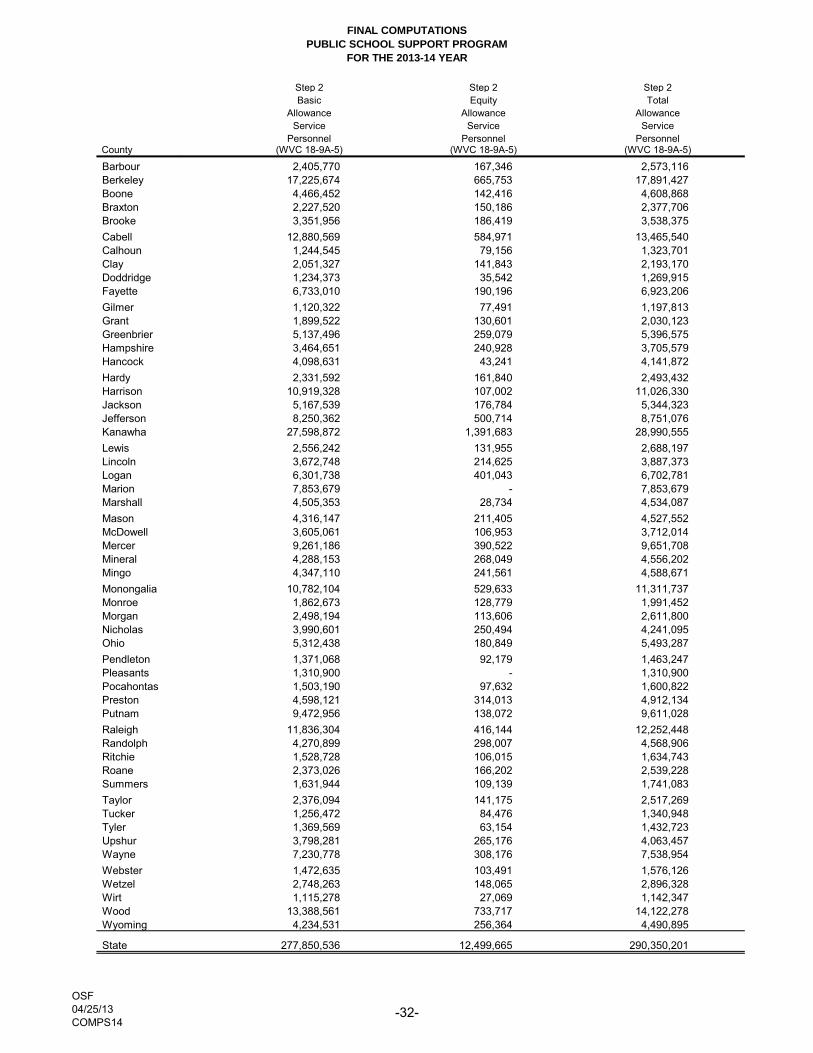
FINAL COMPUTATIONS
PUBLIC SCHOOL SUPPORT PROGRAM
FOR THE 2013-14 YEAR
County
Barbour
Berkeley
Boone
Braxton
Brooke
Cabell
Calhoun
Clay
Doddridge
Fayette
Gilmer
Grant
Greenbrier
Hampshire
Hancock
Hardy
Harrison
Jackson
Jefferson
Kanawha
Lewis
Lincoln
Logan
Marion
Marshall
Mason
McDowell
Mercer
Mineral
Mingo
Monongalia
Monroe
Morgan
Nicholas
Ohio
Pendleton
Pleasants
Pocahontas
Preston
Putnam
Raleigh
Randolph
Ritchie
Roane
Summers
Taylor
Tucker
Tyler
Upshur
Wayne
Webster
Wetzel
Wirt
Wood
Wyoming
State
Step 2 Step 2 Step 2
Basic Equity Total
Allowance Allowance Allowance
Service Service Service
Personnel Personnel Personnel(WVC 18-9A-5) (WVC 18-9A-5) (WVC 18-9A-5)
2,405,770 167,346 2,573,116
17,225,674 665,753 17,891,427
4,466,452 142,416 4,608,868
2,227,520 150,186 2,377,706
3,351,956 186,419 3,538,375
12,880,569 584,971 13,465,540
1,244,545 79,156 1,323,701
2,051,327 141,843 2,193,170
1,234,373 35,542 1,269,915
6,733,010 190,196 6,923,206
1,120,322 77,491 1,197,813
1,899,522 130,601 2,030,123
5,137,496 259,079 5,396,575
3,464,651 240,928 3,705,579
4,098,631 43,241 4,141,872
2,331,592 161,840 2,493,432
10,919,328 107,002 11,026,330
5,167,539 176,784 5,344,323
8,250,362 500,714 8,751,076
27,598,872 1,391,683 28,990,555
2,556,242 131,955 2,688,197
3,672,748 214,625 3,887,373
6,301,738 401,043 6,702,781
7,853,679 - 7,853,679
4,505,353 28,734 4,534,087
4,316,147 211,405 4,527,552
3,605,061 106,953 3,712,014
9,261,186 390,522 9,651,708
4,288,153 268,049 4,556,202
4,347,110 241,561 4,588,671
10,782,104 529,633 11,311,737
1,862,673 128,779 1,991,452
2,498,194 113,606 2,611,800
3,990,601 250,494 4,241,095
5,312,438 180,849 5,493,287
1,371,068 92,179 1,463,247
1,310,900 - 1,310,900
1,503,190 97,632 1,600,822
4,598,121 314,013 4,912,134
9,472,956 138,072 9,611,028
11,836,304 416,144 12,252,448
4,270,899 298,007 4,568,906
1,528,728 106,015 1,634,743
2,373,026 166,202 2,539,228
1,631,944 109,139 1,741,083
2,376,094 141,175 2,517,269
1,256,472 84,476 1,340,948
1,369,569 63,154 1,432,723
3,798,281 265,176 4,063,457
7,230,778 308,176 7,538,954
1,472,635 103,491 1,576,126
2,748,263 148,065 2,896,328
1,115,278 27,069 1,142,347
13,388,561 733,717 14,122,278
4,234,531 256,364 4,490,895
277,850,536 12,499,665 290,350,201
OSF
04/25/13
COMPS14-32-
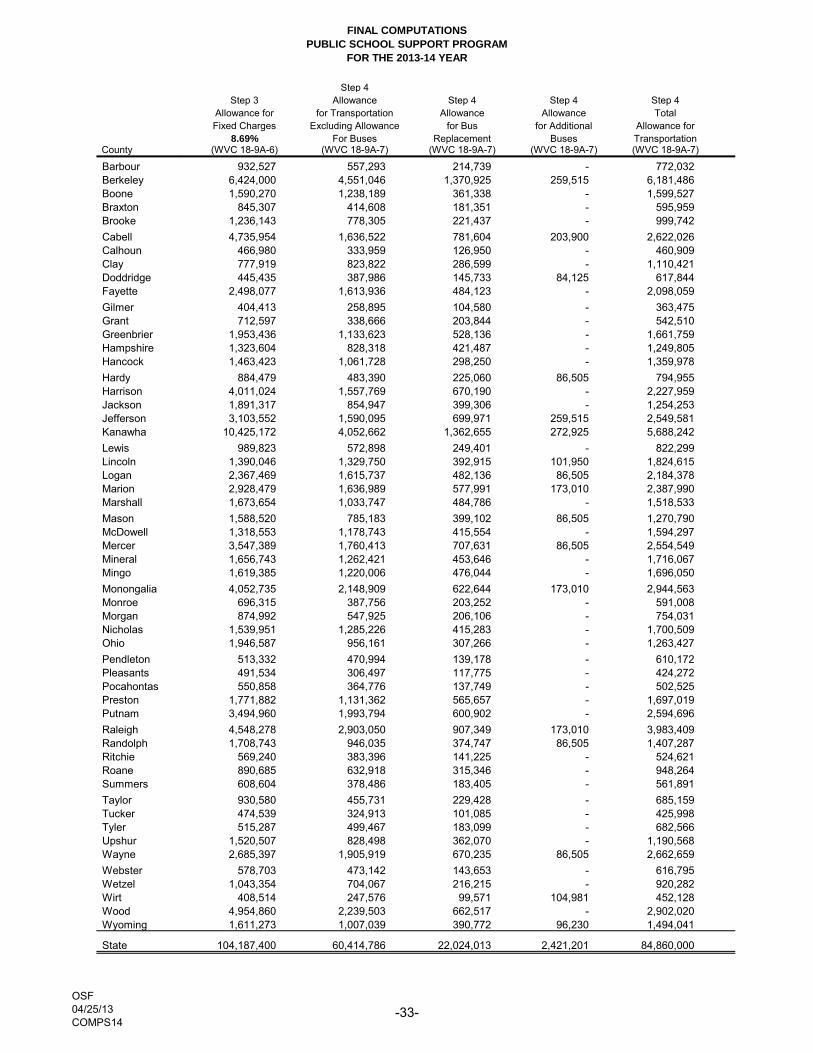
FINAL COMPUTATIONS
PUBLIC SCHOOL SUPPORT PROGRAM
FOR THE 2013-14 YEAR
County
Barbour
Berkeley
Boone
Braxton
Brooke
Cabell
Calhoun
Clay
Doddridge
Fayette
Gilmer
Grant
Greenbrier
Hampshire
Hancock
Hardy
Harrison
Jackson
Jefferson
Kanawha
Lewis
Lincoln
Logan
Marion
Marshall
Mason
McDowell
Mercer
Mineral
Mingo
Monongalia
Monroe
Morgan
Nicholas
Ohio
Pendleton
Pleasants
Pocahontas
Preston
Putnam
Raleigh
Randolph
Ritchie
Roane
Summers
Taylor
Tucker
Tyler
Upshur
Wayne
Webster
Wetzel
Wirt
Wood
Wyoming
State
Step 4
Step 3 Allowance Step 4 Step 4 Step 4
Allowance for for Transportation Allowance Allowance Total
Fixed Charges Excluding Allowance for Bus for Additional Allowance for
8.69% For Buses Replacement Buses Transportation(WVC 18-9A-6) (WVC 18-9A-7) (WVC 18-9A-7) (WVC 18-9A-7) (WVC 18-9A-7)
932,527 557,293 214,739 - 772,032
6,424,000 4,551,046 1,370,925 259,515 6,181,486
1,590,270 1,238,189 361,338 - 1,599,527
845,307 414,608 181,351 - 595,959
1,236,143 778,305 221,437 - 999,742
4,735,954 1,636,522 781,604 203,900 2,622,026
466,980 333,959 126,950 - 460,909
777,919 823,822 286,599 - 1,110,421
445,435 387,986 145,733 84,125 617,844
2,498,077 1,613,936 484,123 - 2,098,059
404,413 258,895 104,580 - 363,475
712,597 338,666 203,844 - 542,510
1,953,436 1,133,623 528,136 - 1,661,759
1,323,604 828,318 421,487 - 1,249,805
1,463,423 1,061,728 298,250 - 1,359,978
884,479 483,390 225,060 86,505 794,955
4,011,024 1,557,769 670,190 - 2,227,959
1,891,317 854,947 399,306 - 1,254,253
3,103,552 1,590,095 699,971 259,515 2,549,581
10,425,172 4,052,662 1,362,655 272,925 5,688,242
989,823 572,898 249,401 - 822,299
1,390,046 1,329,750 392,915 101,950 1,824,615
2,367,469 1,615,737 482,136 86,505 2,184,378
2,928,479 1,636,989 577,991 173,010 2,387,990
1,673,654 1,033,747 484,786 - 1,518,533
1,588,520 785,183 399,102 86,505 1,270,790
1,318,553 1,178,743 415,554 - 1,594,297
3,547,389 1,760,413 707,631 86,505 2,554,549
1,656,743 1,262,421 453,646 - 1,716,067
1,619,385 1,220,006 476,044 - 1,696,050
4,052,735 2,148,909 622,644 173,010 2,944,563
696,315 387,756 203,252 - 591,008
874,992 547,925 206,106 - 754,031
1,539,951 1,285,226 415,283 - 1,700,509
1,946,587 956,161 307,266 - 1,263,427
513,332 470,994 139,178 - 610,172
491,534 306,497 117,775 - 424,272
550,858 364,776 137,749 - 502,525
1,771,882 1,131,362 565,657 - 1,697,019
3,494,960 1,993,794 600,902 - 2,594,696
4,548,278 2,903,050 907,349 173,010 3,983,409
1,708,743 946,035 374,747 86,505 1,407,287
569,240 383,396 141,225 - 524,621
890,685 632,918 315,346 - 948,264
608,604 378,486 183,405 - 561,891
930,580 455,731 229,428 - 685,159
474,539 324,913 101,085 - 425,998
515,287 499,467 183,099 - 682,566
1,520,507 828,498 362,070 - 1,190,568
2,685,397 1,905,919 670,235 86,505 2,662,659
578,703 473,142 143,653 - 616,795
1,043,354 704,067 216,215 - 920,282
408,514 247,576 99,571 104,981 452,128
4,954,860 2,239,503 662,517 - 2,902,020
1,611,273 1,007,039 390,772 96,230 1,494,041
104,187,400 60,414,786 22,024,013 2,421,201 84,860,000
OSF
04/25/13
COMPS14-33-

FINAL COMPUTATIONS
PUBLIC SCHOOL SUPPORT PROGRAM
FOR THE 2013-14 YEAR
County
Barbour
Berkeley
Boone
Braxton
Brooke
Cabell
Calhoun
Clay
Doddridge
Fayette
Gilmer
Grant
Greenbrier
Hampshire
Hancock
Hardy
Harrison
Jackson
Jefferson
Kanawha
Lewis
Lincoln
Logan
Marion
Marshall
Mason
McDowell
Mercer
Mineral
Mingo
Monongalia
Monroe
Morgan
Nicholas
Ohio
Pendleton
Pleasants
Pocahontas
Preston
Putnam
Raleigh
Randolph
Ritchie
Roane
Summers
Taylor
Tucker
Tyler
Upshur
Wayne
Webster
Wetzel
Wirt
Wood
Wyoming
State
Step 5 Step 5 Step 5
Basic Equity Total Allowance
Allowance for Allowance for For Professional
Professional Student Professional Student Student Support
Support Personnel Support Personnel Personnel(WVC 18-9A-8) (WVC 18-9A-8) (WVC 18-9A-8)
330,397 30,556 360,953
2,491,274 105,269 2,596,543
431,977 9,657 441,634
235,531 21,819 257,350
396,701 13,837 410,538
1,466,774 68,359 1,535,132
125,312 10,627 135,939
156,618 12,617 169,235
134,713 6,183 140,896
868,270 47,498 915,768
125,298 11,599 136,897
203,817 17,873 221,690
838,736 55,727 894,463
463,143 42,061 505,204
495,558 1,361 496,919
287,096 26,108 313,204
1,362,217 49,577 1,411,794
726,350 25,209 751,559
1,016,160 44,963 1,061,123
4,910,698 119,804 5,030,502
342,827 26,289 369,116
312,015 21,578 333,593
614,192 31,152 645,344
963,717 24,684 988,401
746,725 234 746,959
428,891 16,338 445,229
469,272 23,436 492,708
1,117,619 58,779 1,176,398
688,071 42,016 730,087
433,263 22,503 455,766
1,382,329 54,806 1,437,135
226,250 19,942 246,192
275,652 11,124 286,776
457,645 28,218 485,863
672,059 4,368 676,427
121,985 11,823 133,808
192,148 281 192,429
200,122 18,771 218,893
498,879 46,485 545,364
1,234,478 6,168 1,240,646
1,853,346 91,335 1,944,681
665,832 62,535 728,367
121,029 11,568 132,597
219,744 18,241 237,985
278,875 26,127 305,002
319,607 25,326 344,933
124,466 11,342 135,808
200,176 11,381 211,557
499,598 46,212 545,810
731,570 40,928 772,498
183,490 15,976 199,466
318,860 15,574 334,434
162,834 10,916 173,750
1,795,265 66,899 1,862,164
346,967 17,354 364,321
36,266,438 1,661,412 37,927,850
OSF
04/25/13
COMPS14-34-
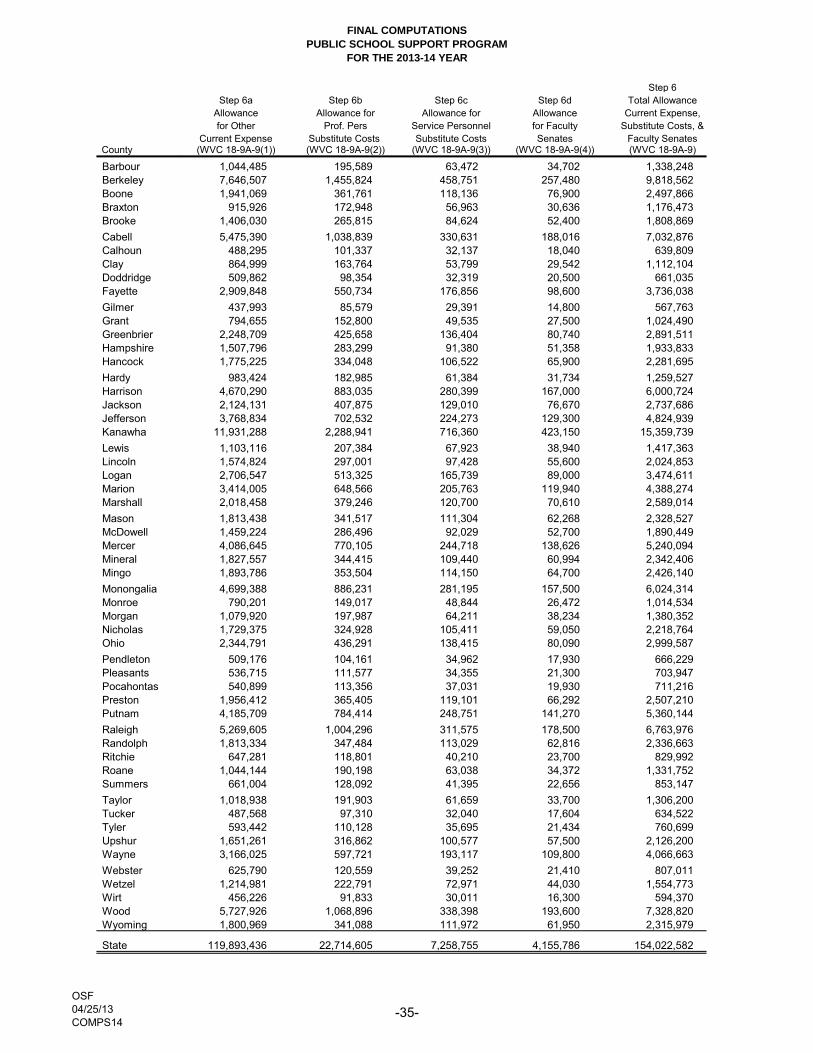
FINAL COMPUTATIONS
PUBLIC SCHOOL SUPPORT PROGRAM
FOR THE 2013-14 YEAR
County
Barbour
Berkeley
Boone
Braxton
Brooke
Cabell
Calhoun
Clay
Doddridge
Fayette
Gilmer
Grant
Greenbrier
Hampshire
Hancock
Hardy
Harrison
Jackson
Jefferson
Kanawha
Lewis
Lincoln
Logan
Marion
Marshall
Mason
McDowell
Mercer
Mineral
Mingo
Monongalia
Monroe
Morgan
Nicholas
Ohio
Pendleton
Pleasants
Pocahontas
Preston
Putnam
Raleigh
Randolph
Ritchie
Roane
Summers
Taylor
Tucker
Tyler
Upshur
Wayne
Webster
Wetzel
Wirt
Wood
Wyoming
State
Step 6
Step 6a Step 6b Step 6c Step 6d Total Allowance
Allowance Allowance for Allowance for Allowance Current Expense,
for Other Prof. Pers Service Personnel for Faculty Substitute Costs, &
Current Expense Substitute Costs Substitute Costs Senates Faculty Senates(WVC 18-9A-9(1)) (WVC 18-9A-9(2)) (WVC 18-9A-9(3)) (WVC 18-9A-9(4)) (WVC 18-9A-9)
1,044,485 195,589 63,472 34,702 1,338,248
7,646,507 1,455,824 458,751 257,480 9,818,562
1,941,069 361,761 118,136 76,900 2,497,866
915,926 172,948 56,963 30,636 1,176,473
1,406,030 265,815 84,624 52,400 1,808,869
5,475,390 1,038,839 330,631 188,016 7,032,876
488,295 101,337 32,137 18,040 639,809
864,999 163,764 53,799 29,542 1,112,104
509,862 98,354 32,319 20,500 661,035
2,909,848 550,734 176,856 98,600 3,736,038
437,993 85,579 29,391 14,800 567,763
794,655 152,800 49,535 27,500 1,024,490
2,248,709 425,658 136,404 80,740 2,891,511
1,507,796 283,299 91,380 51,358 1,933,833
1,775,225 334,048 106,522 65,900 2,281,695
983,424 182,985 61,384 31,734 1,259,527
4,670,290 883,035 280,399 167,000 6,000,724
2,124,131 407,875 129,010 76,670 2,737,686
3,768,834 702,532 224,273 129,300 4,824,939
11,931,288 2,288,941 716,360 423,150 15,359,739
1,103,116 207,384 67,923 38,940 1,417,363
1,574,824 297,001 97,428 55,600 2,024,853
2,706,547 513,325 165,739 89,000 3,474,611
3,414,005 648,566 205,763 119,940 4,388,274
2,018,458 379,246 120,700 70,610 2,589,014
1,813,438 341,517 111,304 62,268 2,328,527
1,459,224 286,496 92,029 52,700 1,890,449
4,086,645 770,105 244,718 138,626 5,240,094
1,827,557 344,415 109,440 60,994 2,342,406
1,893,786 353,504 114,150 64,700 2,426,140
4,699,388 886,231 281,195 157,500 6,024,314
790,201 149,017 48,844 26,472 1,014,534
1,079,920 197,987 64,211 38,234 1,380,352
1,729,375 324,928 105,411 59,050 2,218,764
2,344,791 436,291 138,415 80,090 2,999,587
509,176 104,161 34,962 17,930 666,229
536,715 111,577 34,355 21,300 703,947
540,899 113,356 37,031 19,930 711,216
1,956,412 365,405 119,101 66,292 2,507,210
4,185,709 784,414 248,751 141,270 5,360,144
5,269,605 1,004,296 311,575 178,500 6,763,976
1,813,334 347,484 113,029 62,816 2,336,663
647,281 118,801 40,210 23,700 829,992
1,044,144 190,198 63,038 34,372 1,331,752
661,004 128,092 41,395 22,656 853,147
1,018,938 191,903 61,659 33,700 1,306,200
487,568 97,310 32,040 17,604 634,522
593,442 110,128 35,695 21,434 760,699
1,651,261 316,862 100,577 57,500 2,126,200
3,166,025 597,721 193,117 109,800 4,066,663
625,790 120,559 39,252 21,410 807,011
1,214,981 222,791 72,971 44,030 1,554,773
456,226 91,833 30,011 16,300 594,370
5,727,926 1,068,896 338,398 193,600 7,328,820
1,800,969 341,088 111,972 61,950 2,315,979
119,893,436 22,714,605 7,258,755 4,155,786 154,022,582
OSF
04/25/13
COMPS14-35-

FINAL COMPUTATIONS
PUBLIC SCHOOL SUPPORT PROGRAM
FOR THE 2013-14 YEAR
County
Barbour
Berkeley
Boone
Braxton
Brooke
Cabell
Calhoun
Clay
Doddridge
Fayette
Gilmer
Grant
Greenbrier
Hampshire
Hancock
Hardy
Harrison
Jackson
Jefferson
Kanawha
Lewis
Lincoln
Logan
Marion
Marshall
Mason
McDowell
Mercer
Mineral
Mingo
Monongalia
Monroe
Morgan
Nicholas
Ohio
Pendleton
Pleasants
Pocahontas
Preston
Putnam
Raleigh
Randolph
Ritchie
Roane
Summers
Taylor
Tucker
Tyler
Upshur
Wayne
Webster
Wetzel
Wirt
Wood
Wyoming
State
Step 7a Step 7b Step 7c Step 7
Allowance for Allowance for Allowance Total Allow for
Improvement of 21st Century For Advanced Improvement of
Substitute Costs, & Instructional Technology Placement Instructional
Programs Systems Programs Programs(WVC 18-9A-10(1)) (WVC 18-9A-10(2)) (WVC 18-9A-10(3)) (WVC 18-9A-10)
465,846 99,480 2,427 567,753
2,462,260 731,158 22,098 3,215,516
736,968 184,341 6,344 927,653
426,971 87,762 3,619 518,352
575,175 135,427 4,513 715,115
1,805,726 529,120 24,653 2,359,499
297,658 48,291 1,192 347,141
411,571 83,949 3,023 498,543
304,179 50,531 2,427 357,137
1,029,921 279,485 11,539 1,320,945
282,447 46,505 809 329,761
390,299 75,081 2,725 468,105
829,997 212,847 8,941 1,051,785
605,949 142,591 4,598 753,138
686,818 170,471 4,556 861,845
447,382 95,239 4,258 546,879
1,562,269 447,474 20,778 2,030,521
792,325 202,272 8,132 1,002,729
1,289,674 360,557 17,244 1,667,475
3,757,953 1,146,415 51,605 4,955,973
483,576 106,994 3,917 594,487
626,218 152,029 3,364 781,611
968,444 261,917 11,624 1,241,985
1,182,376 329,290 20,650 1,532,316
760,370 190,742 11,624 962,736
698,373 173,680 7,920 879,973
591,261 143,604 2,980 737,845
1,385,778 391,631 11,198 1,788,607
702,643 172,948 6,855 882,446
722,670 180,390 8,643 911,703
1,571,068 450,005 32,402 2,053,475
388,952 75,254 11,156 475,362
476,562 102,808 3,875 583,245
672,953 164,484 4,258 841,695
859,051 221,511 11,539 1,092,101
303,972 54,437 1,831 360,240
312,300 51,484 1,490 365,274
313,565 57,053 2,384 373,002
741,608 185,847 8,047 935,502
1,415,734 398,084 21,076 1,834,894
1,743,498 507,327 19,033 2,269,858
698,342 174,143 5,450 877,935
345,734 62,839 2,427 411,000
465,743 99,948 2,171 567,862
349,884 63,777 1,746 415,407
458,121 97,924 2,938 558,983
297,438 49,364 2,512 349,314
329,453 56,133 3,236 388,822
649,332 157,480 4,088 810,900
1,107,388 305,182 7,707 1,420,277
339,235 60,476 4,982 404,693
517,403 114,655 5,365 637,423
287,960 46,238 1,959 336,157
1,882,092 541,550 27,378 2,451,020
694,601 174,714 6,642 875,957
44,505,086 11,504,938 489,948 56,499,972
OSF
04/25/13
COMPS14-36-
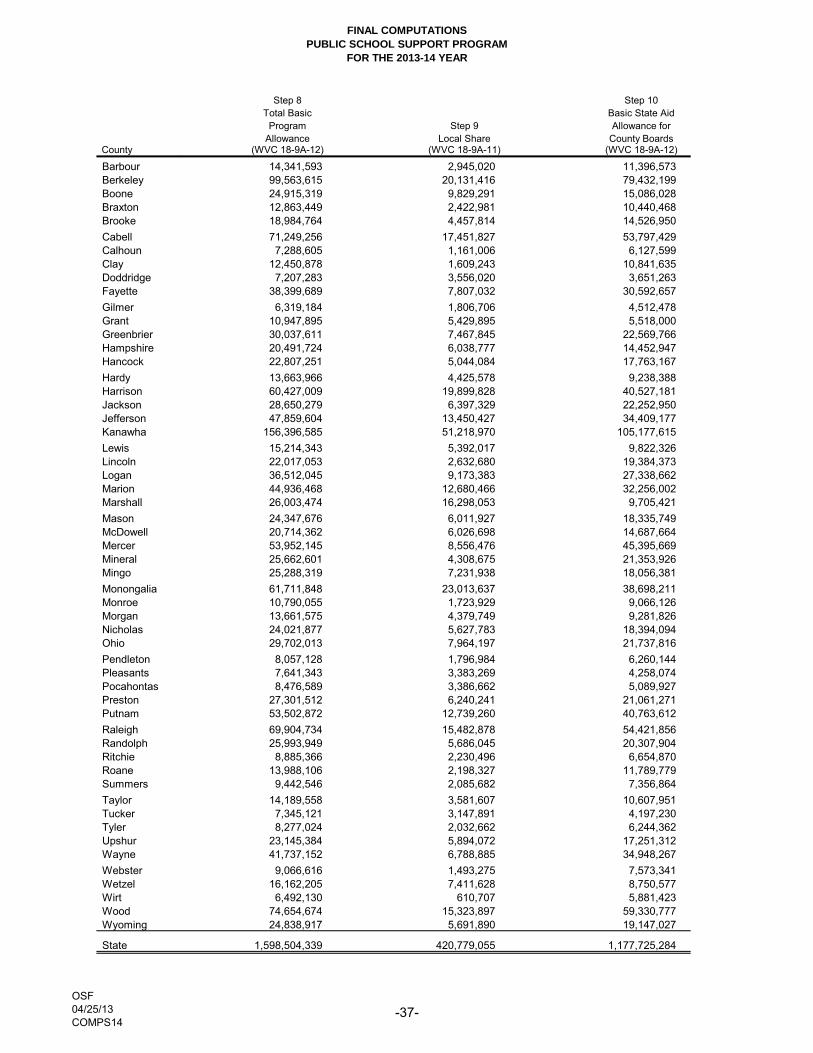
FINAL COMPUTATIONS
PUBLIC SCHOOL SUPPORT PROGRAM
FOR THE 2013-14 YEAR
County
Barbour
Berkeley
Boone
Braxton
Brooke
Cabell
Calhoun
Clay
Doddridge
Fayette
Gilmer
Grant
Greenbrier
Hampshire
Hancock
Hardy
Harrison
Jackson
Jefferson
Kanawha
Lewis
Lincoln
Logan
Marion
Marshall
Mason
McDowell
Mercer
Mineral
Mingo
Monongalia
Monroe
Morgan
Nicholas
Ohio
Pendleton
Pleasants
Pocahontas
Preston
Putnam
Raleigh
Randolph
Ritchie
Roane
Summers
Taylor
Tucker
Tyler
Upshur
Wayne
Webster
Wetzel
Wirt
Wood
Wyoming
State
Step 8 Step 10
Total Basic Basic State Aid
Program Step 9 Allowance for
Allowance Local Share County Boards(WVC 18-9A-12) (WVC 18-9A-11) (WVC 18-9A-12)
14,341,593 2,945,020 11,396,573
99,563,615 20,131,416 79,432,199
24,915,319 9,829,291 15,086,028
12,863,449 2,422,981 10,440,468
18,984,764 4,457,814 14,526,950
71,249,256 17,451,827 53,797,429
7,288,605 1,161,006 6,127,599
12,450,878 1,609,243 10,841,635
7,207,283 3,556,020 3,651,263
38,399,689 7,807,032 30,592,657
6,319,184 1,806,706 4,512,478
10,947,895 5,429,895 5,518,000
30,037,611 7,467,845 22,569,766
20,491,724 6,038,777 14,452,947
22,807,251 5,044,084 17,763,167
13,663,966 4,425,578 9,238,388
60,427,009 19,899,828 40,527,181
28,650,279 6,397,329 22,252,950
47,859,604 13,450,427 34,409,177
156,396,585 51,218,970 105,177,615
15,214,343 5,392,017 9,822,326
22,017,053 2,632,680 19,384,373
36,512,045 9,173,383 27,338,662
44,936,468 12,680,466 32,256,002
26,003,474 16,298,053 9,705,421
24,347,676 6,011,927 18,335,749
20,714,362 6,026,698 14,687,664
53,952,145 8,556,476 45,395,669
25,662,601 4,308,675 21,353,926
25,288,319 7,231,938 18,056,381
61,711,848 23,013,637 38,698,211
10,790,055 1,723,929 9,066,126
13,661,575 4,379,749 9,281,826
24,021,877 5,627,783 18,394,094
29,702,013 7,964,197 21,737,816
8,057,128 1,796,984 6,260,144
7,641,343 3,383,269 4,258,074
8,476,589 3,386,662 5,089,927
27,301,512 6,240,241 21,061,271
53,502,872 12,739,260 40,763,612
69,904,734 15,482,878 54,421,856
25,993,949 5,686,045 20,307,904
8,885,366 2,230,496 6,654,870
13,988,106 2,198,327 11,789,779
9,442,546 2,085,682 7,356,864
14,189,558 3,581,607 10,607,951
7,345,121 3,147,891 4,197,230
8,277,024 2,032,662 6,244,362
23,145,384 5,894,072 17,251,312
41,737,152 6,788,885 34,948,267
9,066,616 1,493,275 7,573,341
16,162,205 7,411,628 8,750,577
6,492,130 610,707 5,881,423
74,654,674 15,323,897 59,330,777
24,838,917 5,691,890 19,147,027
1,598,504,339 420,779,055 1,177,725,284
OSF
04/25/13
COMPS14-37-

FINAL COMPUTATIONS
PUBLIC SCHOOL SUPPORT PROGRAM
ENROLLMENT INFORMATION
FOR THE 2013-14 YEAR
2012-13 Net Additional Net
2nd Month Adjustments 2011-12 Enrollment Adjustments/ Enrollment
Headcount Headcount to FTE Certified With Certified WVC 18-5-16 & Adjusted For
County Enrollment FTE Enrollment Adults Adults WVC 18-9A-2 SA Funding
Barbour 2,441 (0.50) 2,440.50 0.62 2,441.12 - 2,441.12
Berkeley 18,171 (235.57) 17,935.43 6.29 17,941.72 - 17,941.72
Boone 4,526 (2.50) 4,523.50 - 4,523.50 - 4,523.50
Braxton 2,156 (2.42) 2,153.58 - 2,153.58 - 2,153.58
Brooke 3,332 (8.80) 3,323.20 - 3,323.20 - 3,323.20
Cabell 12,979 (1.06) 12,977.95 6.00 12,983.95 - 12,983.95
Calhoun 1,083 (1.50) 1,081.50 6.91 1,088.41 96.59 1,185.00
Clay 2,060 - 2,060.00 - 2,060.00 - 2,060.00
Doddridge 1,161 - 1,161.00 - 1,161.00 78.98 1,239.98
Fayette 6,867 (10.78) 6,856.22 2.00 6,858.22 - 6,858.22
Gilmer 945 - 945.00 - 945.00 196.17 1,141.17
Grant 1,840 (3.60) 1,836.40 5.99 1,842.39 - 1,842.39
Greenbrier 5,223 - 5,223.00 - 5,223.00 - 5,223.00
Hampshire 3,499 - 3,499.00 - 3,499.00 - 3,499.00
Hancock 4,202 (20.60) 4,181.40 1.75 4,183.15 - 4,183.15
Hardy 2,348 (10.95) 2,337.05 - 2,337.05 - 2,337.05
Harrison 10,935 (10.80) 10,924.20 56.26 10,980.46 - 10,980.46
Jackson 4,965 (4.00) 4,961.00 2.50 4,963.50 - 4,963.50
Jefferson 8,958 (110.38) 8,847.62 - 8,847.62 - 8,847.62
Kanawha 28,548 (416.40) 28,131.60 - 28,131.60 - 28,131.60
Lewis 2,626 (0.50) 2,625.50 - 2,625.50 - 2,625.50
Lincoln 3,736 (5.40) 3,730.60 - 3,730.60 - 3,730.60
Logan 6,426 (2.40) 6,423.60 3.53 6,427.13 - 6,427.13
Marion 8,096 (33.05) 8,062.95 17.43 8,080.38 - 8,080.38
Marshall 4,691 (10.43) 4,680.57 - 4,680.57 - 4,680.57
Mason 4,323 (61.60) 4,261.40 0.50 4,261.90 - 4,261.90
McDowell 3,537 (13.44) 3,523.56 0.30 3,523.86 - 3,523.86
Mercer 9,673 (63.60) 9,609.40 0.75 9,610.15 - 9,610.15
Mineral 4,244 (1.68) 4,242.32 1.62 4,243.94 - 4,243.94
Mingo 4,441 (14.45) 4,426.55 - 4,426.55 - 4,426.55
Monongalia 11,029 (5.90) 11,023.11 19.47 11,042.58 - 11,042.58
Monroe 1,852 (5.37) 1,846.63 - 1,846.63 - 1,846.63
Morgan 2,572 (49.22) 2,522.78 - 2,522.78 - 2,522.78
Nicholas 4,035 - 4,035.00 1.24 4,036.24 - 4,036.24
Ohio 5,485 (49.40) 5,435.60 - 5,435.60 - 5,435.60
Pendleton 1,007 - 1,007.00 - 1,007.00 328.81 1,335.81
Pleasants 1,243 - 1,243.00 - 1,243.00 20.36 1,263.36
Pocahontas 1,133 (1.63) 1,131.38 - 1,131.38 268.63 1,400.00
Preston 4,575 (14.80) 4,560.20 0.25 4,560.45 - 4,560.45
Putnam 9,788 (40.75) 9,747.25 21.25 9,768.50 - 9,768.50
Raleigh 12,580 (151.20) 12,428.80 20.37 12,449.17 - 12,449.17
Randolph 4,273 - 4,273.00 0.25 4,273.25 - 4,273.25
Ritchie 1,549 (7.00) 1,542.00 - 1,542.00 - 1,542.00
Roane 2,455 (4.90) 2,450.10 2.50 2,452.60 - 2,452.60
Summers 1,569 (4.00) 1,565.00 - 1,565.00 - 1,565.00
Taylor 2,409 (6.80) 2,402.20 0.74 2,402.94 - 2,402.94
Tucker 1,031 (2.12) 1,028.88 - 1,028.88 182.46 1,211.34
Tyler 1,373 (2.25) 1,370.75 - 1,370.75 6.68 1,377.43
Upshur 3,854 (0.50) 3,853.50 10.87 3,864.37 - 3,864.37
Wayne 7,508 (19.20) 7,488.80 - 7,488.80 - 7,488.80
Webster 1,493 (9.00) 1,484.00 - 1,484.00 - 1,484.00
Wetzel 2,818 (4.50) 2,813.50 - 2,813.50 - 2,813.50
Wirt 1,035 - 1,035.00 - 1,035.00 99.62 1,134.62
Wood 13,341 (52.02) 13,288.98 - 13,288.98 - 13,288.98
Wyoming 4,270 (2.70) 4,267.30 20.00 4,287.30 - 4,287.30
State 282,309 (1,479.66) 280,829.34 209.39 281,038.73 1,278.30 282,317.03
OSF
04/25/13
COMPS14
-38-

FINAL COMPUTATIONS
PUBLIC SCHOOL SUPPORT PROGRAM
PROFESSIONAL EDUCATOR DATA
FOR THE 2013-14 YEAR
NE Limits
2012-13 72.75 - S Number Proration
State Aid Student 72.60 - L Employed Multi-County
Eligible PE Population 72.45 - M In Excess Number PE Vocational Number PE
County Employed Density 72.30 - H Of Limits Funded Centers Chargeable
Barbour 179.01 Low 175.61 (3.40) 175.61 1.62 177.23
Berkeley 1,307.35 High 1,306.67 (0.68) 1,306.67 (9.48) 1,297.19
Boone 396.55 Low 328.41 (68.14) 328.41 - 328.41
Braxton 160.02 Sparse 156.67 (3.35) 156.67 - 156.67
Brooke 270.45 High 240.27 (30.18) 240.27 - 240.27
Cabell 953.53 High 938.74 (14.79) 938.74 - 938.74
Calhoun 95.48 Sparse 91.56 (3.92) 91.56 (5.35) 86.21
Clay 150.31 Low 149.56 (0.75) 149.56 - 149.56
Doddridge 105.50 Sparse 88.58 (16.92) 88.58 1.63 90.21
Fayette 508.40 Medium 496.88 (11.52) 496.88 - 496.88
Gilmer 77.47 Sparse 77.67 - 77.47 5.35 82.82
Grant 142.80 Sparse 137.72 (5.08) 137.72 (3.69) 134.03
Greenbrier 413.46 Low 379.19 (34.27) 379.19 - 379.19
Hampshire 260.00 Low 254.03 (5.97) 254.03 - 254.03
Hancock 341.16 High 302.44 (38.72) 302.44 - 302.44
Hardy 164.32 Sparse 168.03 - 164.32 1.99 166.31
Harrison 854.35 High 796.57 (57.78) 796.57 (2.68) 793.89
Jackson 389.75 Medium 365.15 (24.60) 365.15 (5.54) 359.61
Jefferson 655.50 High 634.48 (21.02) 634.48 5.20 639.68
Kanawha 2,128.10 High 2,033.91 (94.19) 2,033.91 - 2,033.91
Lewis 198.80 Low 186.88 (11.92) 186.88 3.73 190.61
Lincoln 287.50 Low 270.84 (16.66) 270.84 - 270.84
Logan 470.20 Medium 465.65 (4.55) 465.65 - 465.65
Marion 614.45 High 584.21 (30.24) 584.21 - 584.21
Marshall 360.05 Medium 339.11 (20.94) 339.11 - 339.11
Mason 319.84 Low 309.41 (10.43) 309.41 - 309.41
McDowell 269.08 Low 255.83 (13.25) 255.83 - 255.83
Mercer 711.33 High 694.81 (16.52) 694.81 - 694.81
Mineral 313.80 Medium 307.47 (6.33) 307.47 - 307.47
Mingo 343.50 Medium 320.70 (22.80) 320.70 - 320.70
Monongalia 799.00 High 798.38 (0.62) 798.38 - 798.38
Monroe 133.86 Sparse 134.34 - 133.86 - 133.86
Morgan 198.52 Medium 178.50 (20.02) 178.50 4.28 182.78
Nicholas 303.55 Low 293.03 (10.52) 293.03 - 293.03
Ohio 410.95 High 392.99 (17.96) 392.99 - 392.99
Pendleton 95.13 Sparse 95.48 - 95.13 1.70 96.83
Pleasants 112.50 Low 99.56 (12.94) 99.56 (7.84) 91.72
Pocahontas 104.05 Sparse 101.85 (2.20) 101.85 - 101.85
Preston 336.31 Low 331.09 (5.22) 331.09 - 331.09
Putnam 716.45 High 706.26 (10.19) 706.26 - 706.26
Raleigh 907.50 High 900.07 (7.43) 900.07 - 900.07
Randolph 323.88 Sparse 310.88 (13.00) 310.88 - 310.88
Ritchie 126.00 Sparse 108.86 (17.14) 108.86 3.32 112.18
Roane 175.36 Low 172.52 (2.84) 172.52 5.54 178.06
Summers 115.78 Sparse 113.85 (1.93) 113.85 - 113.85
Taylor 173.15 Medium 173.04 (0.11) 173.04 1.05 174.09
Tucker 90.68 Sparse 88.12 (2.56) 88.12 - 88.12
Tyler 109.09 Low 98.40 (10.69) 98.40 1.60 100.00
Upshur 294.10 Medium 285.32 (8.78) 285.32 (5.35) 279.97
Wayne 566.90 Medium 542.56 (24.34) 542.56 - 542.56
Webster 110.65 Sparse 107.96 (2.69) 107.96 - 107.96
Wetzel 227.15 Low 201.34 (25.81) 201.34 2.92 204.26
Wirt 83.20 Sparse 82.54 (0.66) 82.54 - 82.54
Wood 985.50 High 960.79 (24.71) 960.79 - 960.79
Wyoming 320.45 Low 311.26 (9.19) 311.26 - 311.26
State 21,261.77 - 20,446.04 (820.47) 20,441.30 - 20,441.30
OSF
04/25/13
COMPS14 -39-

FINAL COMPUTATIONS
PUBLIC SCHOOL SUPPORT PROGRAM
SERVICE PERSONNEL DATA
FOR THE 2013-14 YEAR
NE Limits
2012-13 45.880 - S Number Proration
State Aid Student 45.300 - L Employed Number Multi-County Number
Eligible SP Population 44.730 - M In Excess Serv Pers Vocational Service Pers
County Employed Density 44.170 - H Of Limits Funded Centers Chargeable
Barbour 110.989 Low 110.096 (0.893) 110.096 0.487 110.583
Berkeley 914.104 High 795.734 (118.370) 795.734 (3.248) 792.486
Boone 250.001 Low 204.915 (45.086) 204.915 - 204.915
Braxton 99.311 Sparse 98.806 (0.505) 98.806 - 98.806
Brooke 171.102 High 146.786 (24.316) 146.786 - 146.786
Cabell 591.680 High 573.501 (18.179) 573.501 - 573.501
Calhoun 61.040 Sparse 55.744 (5.296) 55.744 (1.376) 54.368
Clay 107.855 Low 93.318 (14.537) 93.318 - 93.318
Doddridge 70.132 Sparse 56.059 (14.073) 56.059 0.831 56.890
Fayette 354.886 Medium 306.768 (48.118) 306.768 - 306.768
Gilmer 52.600 Sparse 50.981 (1.619) 50.981 1.376 52.357
Grant 90.968 Sparse 85.922 (5.046) 85.922 (1.393) 84.529
Greenbrier 286.268 Low 236.602 (49.666) 236.602 - 236.602
Hampshire 188.000 Low 158.505 (29.495) 158.505 - 158.505
Hancock 213.321 High 184.770 (28.551) 184.770 - 184.770
Hardy 109.150 Sparse 106.474 (2.676) 106.474 0.750 107.224
Harrison 515.755 High 486.371 (29.384) 486.371 (1.364) 485.007
Jackson 237.002 Medium 223.777 (13.225) 223.777 (1.760) 222.017
Jefferson 464.983 High 389.017 (75.966) 389.017 1.783 390.800
Kanawha 1,386.046 High 1,242.573 (143.473) 1,242.573 - 1,242.573
Lewis 142.375 Low 117.817 (24.558) 117.817 1.118 118.935
Lincoln 180.725 Low 168.996 (11.729) 168.996 - 168.996
Logan 324.313 Medium 287.486 (36.827) 287.486 - 287.486
Marion 420.965 High 356.910 (64.055) 356.910 - 356.910
Marshall 283.428 Medium 209.362 (74.066) 209.362 - 209.362
Mason 214.615 Low 193.064 (21.551) 193.064 - 193.064
McDowell 218.585 Low 159.631 (58.954) 159.631 - 159.631
Mercer 448.624 High 424.480 (24.144) 424.480 - 424.480
Mineral 217.745 Medium 189.831 (27.914) 189.831 - 189.831
Mingo 262.870 Medium 198.000 (64.870) 198.000 - 198.000
Monongalia 513.808 High 487.751 (26.057) 487.751 - 487.751
Monroe 95.660 Sparse 84.723 (10.937) 84.723 - 84.723
Morgan 125.730 Medium 111.379 (14.351) 111.379 1.465 112.844
Nicholas 209.006 Low 182.842 (26.164) 182.842 - 182.842
Ohio 259.140 High 240.090 (19.050) 240.090 - 240.090
Pendleton 62.050 Sparse 60.644 (1.406) 60.644 0.643 61.287
Pleasants 82.075 Low 59.591 (22.484) 59.591 (2.361) 57.230
Pocahontas 74.111 Sparse 64.232 (9.879) 64.232 - 64.232
Preston 209.980 Low 206.588 (3.392) 206.588 - 206.588
Putnam 455.598 High 431.475 (24.123) 431.475 - 431.475
Raleigh 540.447 High 549.880 - 540.447 - 540.447
Randolph 203.550 Sparse 196.057 (7.493) 196.057 - 196.057
Ritchie 87.773 Sparse 69.747 (18.026) 69.747 1.000 70.747
Roane 126.879 Low 109.343 (17.536) 109.343 1.760 111.103
Summers 75.650 Sparse 71.802 (3.848) 71.802 - 71.802
Taylor 118.960 Medium 106.951 (12.009) 106.951 0.533 107.484
Tucker 57.000 Sparse 55.576 (1.424) 55.576 - 55.576
Tyler 84.248 Low 61.916 (22.332) 61.916 0.482 62.398
Upshur 194.450 Medium 174.458 (19.992) 174.458 (1.605) 172.853
Wayne 380.778 Medium 334.974 (45.804) 334.974 - 334.974
Webster 83.350 Sparse 68.086 (15.264) 68.086 - 68.086
Wetzel 155.321 Low 126.573 (28.748) 126.573 0.879 127.452
Wirt 52.787 Sparse 52.056 (0.731) 52.056 - 52.056
Wood 616.378 High 586.974 (29.404) 586.974 - 586.974
Wyoming 217.825 Low 194.215 (23.610) 194.215 - 194.215
State 14,071.992 -- 12,600.219 (1,481.206) 12,590.786 - 12,590.786
OSF
04/25/13
COMPS14 -40-

FINAL COMPUTATIONS
PUBLIC SCHOOL SUPPORT PROGRAM
PERSONNEL RATIOS PER 1,000 STUDENTS
FOR THE 2013-14 YEAR
Professional Educators Servicel Personnel
Chargeable Actual Chargeable Actual
Net Net Net Net
Enrollment Enrollment Enrollment Enrollment
County Ratio/1,000 Ratio/1,000 Ratio/1,000 Ratio/1,000
Barbour 72.60 73.99 45.30 45.67
Berkeley 72.30 72.34 44.17 50.77
Boone 72.60 87.66 45.30 55.27
Braxton 72.75 74.30 45.88 46.11
Brooke 72.30 81.38 44.17 51.49
Cabell 72.30 73.44 44.17 45.57
Calhoun 72.75 76.06 45.88 50.35
Clay 72.60 72.97 45.30 52.36
Doddridge 72.75 86.40 45.88 57.23
Fayette 72.45 74.13 44.73 51.75
Gilmer 72.57 72.57 45.88 47.30
Grant 72.75 75.51 45.88 48.62
Greenbrier 72.60 79.16 45.30 54.81
Hampshire 72.60 74.31 45.30 53.73
Hancock 72.30 81.56 44.17 51.00
Hardy 71.16 71.16 45.88 47.03
Harrison 72.30 77.56 44.17 46.85
Jackson 72.45 77.41 44.73 47.39
Jefferson 72.30 74.68 44.17 52.76
Kanawha 72.30 75.65 44.17 49.27
Lewis 72.60 77.14 45.30 54.65
Lincoln 72.60 77.07 45.30 48.44
Logan 72.45 73.16 44.73 50.46
Marion 72.30 76.04 44.17 52.10
Marshall 72.45 76.92 44.73 60.55
Mason 72.60 75.05 45.30 50.36
McDowell 72.60 76.36 45.30 62.03
Mercer 72.30 74.02 44.17 46.68
Mineral 72.45 73.94 44.73 51.31
Mingo 72.45 77.60 44.73 59.38
Monongalia 72.30 72.36 44.17 46.53
Monroe 72.49 72.49 45.88 51.80
Morgan 72.45 80.39 44.73 50.42
Nicholas 72.60 75.21 45.30 51.78
Ohio 72.30 75.60 44.17 47.67
Pendleton 72.49 72.49 45.88 46.93
Pleasants 72.60 82.84 45.30 63.10
Pocahontas 72.75 74.32 45.88 52.94
Preston 72.60 73.74 45.30 46.04
Putnam 72.30 73.34 44.17 46.64
Raleigh 72.30 72.90 43.41 43.41
Randolph 72.75 75.79 45.88 47.63
Ritchie 72.75 83.87 45.88 57.57
Roane 72.60 73.76 45.30 52.45
Summers 72.75 73.98 45.88 48.34
Taylor 72.45 72.49 44.73 49.73
Tucker 72.75 74.86 45.88 47.06
Tyler 72.60 80.36 45.30 61.51
Upshur 72.45 74.72 44.73 49.90
Wayne 72.45 75.70 44.73 50.85
Webster 72.75 74.56 45.88 56.17
Wetzel 72.60 81.77 45.30 55.52
Wirt 72.75 73.33 45.88 46.52
Wood 72.30 74.16 44.17 46.38
Wyoming 72.60 74.74 45.30 50.81
State 72.41 75.31 44.60 49.84
OSF
04/25/13
COMPS14 -41-

FINAL COMPUTATIONS
PUBLIC SCHOOL SUPPORT PROGRAM
PROFESSIONAL INSTRUCTIONAL PERSONNEL DATA
FOR THE 2013-14 YEAR
PI Required Under
2012-13 Proration Professional 66.26 - S PI Limits
Net Enrollment Student Professional Multi-County Professional Instructional 66.20 - L Without
With Total Population Instructional Vocational Instructional Chargeable 66.10 - M Enrollment
County Adjustments Density Employed Centers Chargeable Ratio/1,000 66.00 - H Increase
Barbour 2,441.12 Low 166.01 1.33 167.34 68.55 161.60 -
Berkeley 17,941.72 High 1,225.15 (8.65) 1,216.50 67.80 1,184.15 -
Boone 4,523.50 Low 365.50 - 365.50 80.80 299.46 -
Braxton 2,153.58 Sparse 147.18 - 147.18 68.34 142.70 -
Brooke 3,323.20 High 252.00 - 252.00 75.83 219.33 -
Cabell 12,983.95 High 902.93 - 902.93 69.54 856.94 -
Calhoun 1,185.00 Sparse 86.20 (4.59) 81.61 68.87 78.52 -
Clay 2,060.00 Low 142.21 - 142.21 69.03 136.37 -
Doddridge 1,239.98 Sparse 97.50 1.44 98.94 79.79 82.16 -
Fayette 6,858.22 Medium 473.00 - 473.00 68.97 453.33 -
Gilmer 1,141.17 Sparse 70.00 4.59 74.59 65.36 75.61 -
Grant 1,842.39 Sparse 131.50 (2.46) 129.04 70.04 122.08 -
Greenbrier 5,223.00 Low 382.50 - 382.50 73.23 345.76 -
Hampshire 3,499.00 Low 244.79 - 244.79 69.96 231.63 -
Hancock 4,183.15 High 316.50 - 316.50 75.66 276.09 -
Hardy 2,337.05 Sparse 151.17 1.32 152.49 65.25 154.85 -
Harrison 10,980.46 High 802.50 (2.36) 800.14 72.87 724.71 -
Jackson 4,963.50 Medium 362.35 (4.93) 357.42 72.01 328.09 -
Jefferson 8,847.62 High 616.50 4.75 621.25 70.22 583.94 -
Kanawha 28,131.60 High 1,995.35 - 1,995.35 70.93 1,856.69 -
Lewis 2,625.50 Low 185.70 3.05 188.75 71.89 173.81 -
Lincoln 3,730.60 Low 268.00 - 268.00 71.84 246.97 -
Logan 6,427.13 Medium 427.00 - 427.00 66.44 424.83 -
Marion 8,080.38 High 574.70 - 574.70 71.12 533.31 -
Marshall 4,680.57 Medium 337.05 - 337.05 72.01 309.39 -
Mason 4,261.90 Low 295.34 - 295.34 69.30 282.14 -
McDowell 3,523.86 Low 250.50 - 250.50 71.09 233.28 -
Mercer 9,610.15 High 663.13 - 663.13 69.00 634.27 -
Mineral 4,243.94 Medium 289.45 - 289.45 68.20 280.52 -
Mingo 4,426.55 Medium 310.50 - 310.50 70.14 292.59 -
Monongalia 11,042.58 High 753.75 - 753.75 68.26 728.81 -
Monroe 1,846.63 Sparse 125.36 - 125.36 67.89 122.36 -
Morgan 2,522.78 Medium 182.17 3.90 186.07 73.76 166.76 -
Nicholas 4,036.24 Low 285.25 - 285.25 70.67 267.20 -
Ohio 5,435.60 High 384.45 - 384.45 70.73 358.75 -
Pendleton 1,335.81 Sparse 87.03 1.14 88.17 66.00 88.51 -
Pleasants 1,263.36 Low 101.50 (6.64) 94.86 75.09 83.63 -
Pocahontas 1,400.00 Sparse 94.65 - 94.65 67.61 92.76 -
Preston 4,560.45 Low 317.86 - 317.86 69.70 301.90 -
Putnam 9,768.50 High 674.35 - 674.35 69.03 644.72 -
Raleigh 12,449.17 High 852.50 - 852.50 68.48 821.65 -
Randolph 4,273.25 Sparse 299.83 - 299.83 70.16 283.15 -
Ritchie 1,542.00 Sparse 115.50 2.81 118.31 76.73 102.17 -
Roane 2,452.60 Low 164.86 4.93 169.79 69.23 162.36 -
Summers 1,565.00 Sparse 106.78 - 106.78 68.23 103.70 -
Taylor 2,402.94 Medium 161.50 0.92 162.42 67.59 158.83 -
Tucker 1,211.34 Sparse 85.02 - 85.02 70.19 80.26 -
Tyler 1,377.43 Low 101.17 1.36 102.53 74.44 91.19 -
Upshur 3,864.37 Medium 275.50 (4.38) 271.12 70.16 255.43 -
Wayne 7,488.80 Medium 531.00 - 531.00 70.91 495.01 -
Webster 1,484.00 Sparse 101.95 - 101.95 68.70 98.33 -
Wetzel 2,813.50 Low 211.15 2.47 213.62 75.93 186.25 -
Wirt 1,134.62 Sparse 77.50 - 77.50 68.30 75.18 -
Wood 13,288.98 High 921.50 - 921.50 69.34 877.07 -
Wyoming 4,287.30 Low 297.75 - 297.75 69.45 283.82 -
State 282,317.03 19,842.09 - 19,842.09 70.28 18,654.92 -
OSF
04/25/13
COMPS14 -42-

FINAL COMPUTATIONS
PUBLIC SCHOOL SUPPORT PROGRAM
PROFESSIONAL EDUCATOR AND PROFESSIONAL
STUDENT SUPPORT PERSONNEL DATA
FOR THE 2013-14 YEAR
Number Step 5 Under Adjusted
Prof. Student Allowance Number Number PI Limits Total Number
Support Pers Divided by SSP Prof. Student Prof. Student Number PE Without Professional Professional
Employed Avg. State Support Pers Support Pers Allowed Enrollment Educators Educators
County SA Eligible Funded Salary Not Funded Funded For Funding Increase Not Funded Funded
Barbour 7.50 7.96 0.46 7.96 175.61 - (3.40) 175.61
Berkeley 62.25 59.69 (2.56) 59.69 1,306.67 - (0.68) 1,306.67
Boone 19.00 11.12 (7.88) 11.12 328.41 - (68.14) 328.41
Braxton 6.00 5.65 (0.35) 5.65 156.67 - (3.35) 156.67
Brooke 10.00 9.21 (0.79) 9.21 240.27 - (30.18) 240.27
Cabell 37.15 36.26 (0.89) 36.26 938.74 - (14.79) 938.74
Calhoun 4.00 3.55 (0.45) 3.55 91.56 - (3.92) 91.56
Clay 5.50 4.14 (1.36) 4.14 149.56 - (0.75) 149.56
Doddridge 5.00 3.73 (1.27) 3.73 88.58 - (16.92) 88.58
Fayette 20.00 20.01 0.01 20.01 496.88 - (11.52) 496.88
Gilmer 4.00 2.85 (1.15) 2.85 77.47 - - 77.47
Grant 6.00 5.69 (0.31) 5.69 137.72 - (5.08) 137.72
Greenbrier 21.20 20.31 (0.89) 20.31 379.19 - (34.27) 379.19
Hampshire 12.00 11.86 (0.14) 11.86 254.03 - (5.97) 254.03
Hancock 13.00 11.08 (1.92) 11.08 302.44 - (38.72) 302.44
Hardy 7.50 7.42 (0.08) 7.42 164.32 - - 164.32
Harrison 32.50 32.20 (0.30) 32.20 796.57 - (57.78) 796.57
Jackson 21.00 17.66 (3.34) 17.66 365.15 - (24.60) 365.15
Jefferson 30.00 24.88 (5.12) 24.88 634.48 - (21.02) 634.48
Kanawha 120.40 114.37 (6.03) 114.37 2,033.91 - (94.19) 2,033.91
Lewis 9.00 7.76 (1.24) 7.76 186.88 - (11.92) 186.88
Lincoln 10.00 7.91 (2.09) 7.91 270.84 - (16.66) 270.84
Logan 18.00 16.13 (1.87) 16.13 465.65 - (4.55) 465.65
Marion 25.00 24.50 (0.50) 24.50 584.21 - (30.24) 584.21
Marshall 16.00 16.83 0.83 16.83 339.11 - (20.94) 339.11
Mason 16.00 11.12 (4.88) 11.12 309.41 - (10.43) 309.41
McDowell 13.00 13.06 0.06 13.06 255.83 - (13.25) 255.83
Mercer 30.00 27.97 (2.03) 27.97 694.81 - (16.52) 694.81
Mineral 15.52 15.78 0.26 15.78 307.47 - (6.33) 307.47
Mingo 13.00 11.08 (1.92) 11.08 320.70 - (22.80) 320.70
Monongalia 33.75 33.39 (0.36) 33.39 798.38 - (0.62) 798.38
Monroe 7.00 6.00 (1.00) 6.00 133.86 - - 133.86
Morgan 9.00 7.32 (1.68) 7.32 178.50 - (20.02) 178.50
Nicholas 10.00 11.93 1.93 11.93 293.03 - (10.52) 293.03
Ohio 16.00 16.49 0.49 16.49 392.99 - (17.96) 392.99
Pendleton 2.62 2.63 0.01 2.63 95.13 - - 95.13
Pleasants 5.00 5.16 0.16 5.16 99.56 - (12.94) 99.56
Pocahontas 5.00 4.54 (0.46) 4.54 101.85 - (2.20) 101.85
Preston 13.60 11.86 (1.74) 11.86 331.09 - (5.22) 331.09
Putnam 32.00 29.95 (2.05) 29.95 706.26 - (10.19) 706.26
Raleigh 40.00 42.51 2.51 42.51 900.07 - (7.43) 900.07
Randolph 14.25 15.25 1.00 15.25 310.88 - (13.00) 310.88
Ritchie 3.00 2.64 (0.36) 2.64 108.86 - (17.14) 108.86
Roane 7.00 5.99 (1.01) 5.99 172.52 - (2.84) 172.52
Summers 6.50 6.37 (0.13) 6.37 113.85 - (1.93) 113.85
Taylor 7.00 7.07 0.07 7.07 173.04 - (0.11) 173.04
Tucker 3.00 3.21 0.21 3.21 88.12 - (2.56) 88.12
Tyler 6.00 4.96 (1.04) 4.96 98.40 - (10.69) 98.40
Upshur 12.00 12.07 0.07 12.07 285.32 - (8.78) 285.32
Wayne 18.00 18.43 0.43 18.43 542.56 - (24.34) 542.56
Webster 5.10 5.19 0.09 5.19 107.96 - (2.69) 107.96
Wetzel 9.00 7.76 (1.24) 7.76 201.34 - (25.81) 201.34
Wirt 4.00 3.65 (0.35) 3.65 82.54 - (0.66) 82.54
Wood 46.50 42.42 (4.08) 42.42 960.79 - (24.71) 960.79
Wyoming 12.00 8.87 (3.13) 8.87 311.26 - (9.19) 311.26
State 936.84 877.44 (59.40) 877.44 20,441.30 - (820.47) 20,441.30
OSF
04/25/13
COMPS14
-43-

FINAL COMPUTATIONS
PUBLIC SCHOOL SUPPORT PROGRAM
PROFESSIONAL EDUCATOR AND PROFESSIONAL
STUDENT SUPPORT PERSONNEL DATA
FOR THE 2013-14 YEAR
Professional Student Support Personnel Professional Educators Total Professional Personnel
2012-13 2013-14 2012-13 2013-14 2012-13 2013-14
State Aid No. Employed No. Student State Aid No. Employed Adjusted No. State Aid No. Employed Adjusted No.
Eligible In Excess Support Pers Eligible In Excess Prof Educ. Eligible In Excess Prof. Pers.
County Employed Of Limits Funded Employed Of Limits Funded Employed Of Limits Funded
Barbour 7.50 0.46 7.96 179.01 (3.40) 175.61 186.51 (2.94) 183.57
Berkeley 62.25 (2.56) 59.69 1,307.35 (0.68) 1,306.67 1,369.60 (3.24) 1,366.36
Boone 19.00 (7.88) 11.12 396.55 (68.14) 328.41 415.55 (76.02) 339.53
Braxton 6.00 (0.35) 5.65 160.02 (3.35) 156.67 166.02 (3.70) 162.32
Brooke 10.00 (0.79) 9.21 270.45 (30.18) 240.27 280.45 (30.97) 249.48
Cabell 37.15 (0.89) 36.26 953.53 (14.79) 938.74 990.68 (15.68) 975.00
Calhoun 4.00 (0.45) 3.55 95.48 (3.92) 91.56 99.48 (4.37) 95.11
Clay 5.50 (1.36) 4.14 150.31 (0.75) 149.56 155.81 (2.11) 153.70
Doddridge 5.00 (1.27) 3.73 105.50 (16.92) 88.58 110.50 (18.19) 92.31
Fayette 20.00 0.01 20.01 508.40 (11.52) 496.88 528.40 (11.51) 516.89
Gilmer 4.00 (1.15) 2.85 77.47 - 77.47 81.47 (1.15) 80.32
Grant 6.00 (0.31) 5.69 142.80 (5.08) 137.72 148.80 (5.39) 143.41
Greenbrier 21.20 (0.89) 20.31 413.46 (34.27) 379.19 434.66 (35.16) 399.50
Hampshire 12.00 (0.14) 11.86 260.00 (5.97) 254.03 272.00 (6.11) 265.89
Hancock 13.00 (1.92) 11.08 341.16 (38.72) 302.44 354.16 (40.64) 313.52
Hardy 7.50 (0.08) 7.42 164.32 - 164.32 171.82 (0.08) 171.74
Harrison 32.50 (0.30) 32.20 854.35 (57.78) 796.57 886.85 (58.08) 828.77
Jackson 21.00 (3.34) 17.66 389.75 (24.60) 365.15 410.75 (27.94) 382.81
Jefferson 30.00 (5.12) 24.88 655.50 (21.02) 634.48 685.50 (26.14) 659.36
Kanawha 120.40 (6.03) 114.37 2,128.10 (94.19) 2,033.91 2,248.50 (100.22) 2,148.28
Lewis 9.00 (1.24) 7.76 198.80 (11.92) 186.88 207.80 (13.16) 194.64
Lincoln 10.00 (2.09) 7.91 287.50 (16.66) 270.84 297.50 (18.75) 278.75
Logan 18.00 (1.87) 16.13 470.20 (4.55) 465.65 488.20 (6.42) 481.78
Marion 25.00 (0.50) 24.50 614.45 (30.24) 584.21 639.45 (30.74) 608.71
Marshall 16.00 0.83 16.83 360.05 (20.94) 339.11 376.05 (20.11) 355.94
Mason 16.00 (4.88) 11.12 319.84 (10.43) 309.41 335.84 (15.31) 320.53
McDowell 13.00 0.06 13.06 269.08 (13.25) 255.83 282.08 (13.19) 268.89
Mercer 30.00 (2.03) 27.97 711.33 (16.52) 694.81 741.33 (18.55) 722.78
Mineral 15.52 0.26 15.78 313.80 (6.33) 307.47 329.32 (6.07) 323.25
Mingo 13.00 (1.92) 11.08 343.50 (22.80) 320.70 356.50 (24.72) 331.78
Monongalia 33.75 (0.36) 33.39 799.00 (0.62) 798.38 832.75 (0.98) 831.77
Monroe 7.00 (1.00) 6.00 133.86 - 133.86 140.86 (1.00) 139.86
Morgan 9.00 (1.68) 7.32 198.52 (20.02) 178.50 207.52 (21.70) 185.82
Nicholas 10.00 1.93 11.93 303.55 (10.52) 293.03 313.55 (8.59) 304.96
Ohio 16.00 0.49 16.49 410.95 (17.96) 392.99 426.95 (17.47) 409.48
Pendleton 2.62 0.01 2.63 95.13 - 95.13 97.75 0.01 97.76
Pleasants 5.00 0.16 5.16 112.50 (12.94) 99.56 117.50 (12.78) 104.72
Pocahontas 5.00 (0.46) 4.54 104.05 (2.20) 101.85 109.05 (2.66) 106.39
Preston 13.60 (1.74) 11.86 336.31 (5.22) 331.09 349.91 (6.96) 342.95
Putnam 32.00 (2.05) 29.95 716.45 (10.19) 706.26 748.45 (12.24) 736.21
Raleigh 40.00 2.51 42.51 907.50 (7.43) 900.07 947.50 (4.92) 942.58
Randolph 14.25 1.00 15.25 323.88 (13.00) 310.88 338.13 (12.00) 326.13
Ritchie 3.00 (0.36) 2.64 126.00 (17.14) 108.86 129.00 (17.50) 111.50
Roane 7.00 (1.01) 5.99 175.36 (2.84) 172.52 182.36 (3.85) 178.51
Summers 6.50 (0.13) 6.37 115.78 (1.93) 113.85 122.28 (2.06) 120.22
Taylor 7.00 0.07 7.07 173.15 (0.11) 173.04 180.15 (0.04) 180.11
Tucker 3.00 0.21 3.21 90.68 (2.56) 88.12 93.68 (2.35) 91.33
Tyler 6.00 (1.04) 4.96 109.09 (10.69) 98.40 115.09 (11.73) 103.36
Upshur 12.00 0.07 12.07 294.10 (8.78) 285.32 306.10 (8.71) 297.39
Wayne 18.00 0.43 18.43 566.90 (24.34) 542.56 584.90 (23.91) 560.99
Webster 5.10 0.09 5.19 110.65 (2.69) 107.96 115.75 (2.60) 113.15
Wetzel 9.00 (1.24) 7.76 227.15 (25.81) 201.34 236.15 (27.05) 209.10
Wirt 4.00 (0.35) 3.65 83.20 (0.66) 82.54 87.20 (1.01) 86.19
Wood 46.50 (4.08) 42.42 985.50 (24.71) 960.79 1,032.00 (28.79) 1,003.21
Wyoming 12.00 (3.13) 8.87 320.45 (9.19) 311.26 332.45 (12.32) 320.13
State 936.84 (59.40) 877.44 21,261.77 (820.47) 20,441.30 22,198.61 (879.87) 21,318.74
OSF
04/25/13
COMPS14
-44-
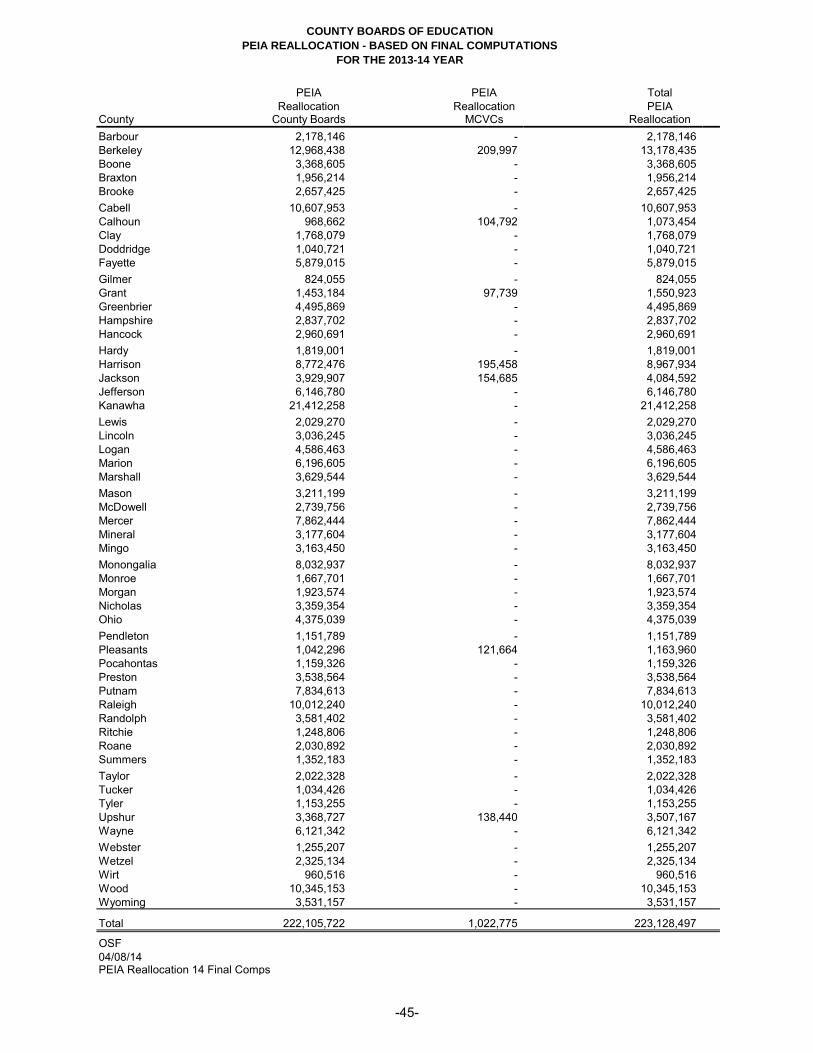
COUNTY BOARDS OF EDUCATION
PEIA REALLOCATION - BASED ON FINAL COMPUTATIONS
FOR THE 2013-14 YEAR
PEIA PEIA Total
Reallocation Reallocation PEIACounty County Boards MCVCs Reallocation
Barbour 2,178,146 - 2,178,146
Berkeley 12,968,438 209,997 13,178,435
Boone 3,368,605 - 3,368,605
Braxton 1,956,214 - 1,956,214
Brooke 2,657,425 - 2,657,425
Cabell 10,607,953 - 10,607,953
Calhoun 968,662 104,792 1,073,454
Clay 1,768,079 - 1,768,079
Doddridge 1,040,721 - 1,040,721
Fayette 5,879,015 - 5,879,015
Gilmer 824,055 - 824,055
Grant 1,453,184 97,739 1,550,923
Greenbrier 4,495,869 - 4,495,869
Hampshire 2,837,702 - 2,837,702
Hancock 2,960,691 - 2,960,691
Hardy 1,819,001 - 1,819,001
Harrison 8,772,476 195,458 8,967,934
Jackson 3,929,907 154,685 4,084,592
Jefferson 6,146,780 - 6,146,780
Kanawha 21,412,258 - 21,412,258
Lewis 2,029,270 - 2,029,270
Lincoln 3,036,245 - 3,036,245
Logan 4,586,463 - 4,586,463
Marion 6,196,605 - 6,196,605
Marshall 3,629,544 - 3,629,544
Mason 3,211,199 - 3,211,199
McDowell 2,739,756 - 2,739,756
Mercer 7,862,444 - 7,862,444
Mineral 3,177,604 - 3,177,604
Mingo 3,163,450 - 3,163,450
Monongalia 8,032,937 - 8,032,937
Monroe 1,667,701 - 1,667,701
Morgan 1,923,574 - 1,923,574
Nicholas 3,359,354 - 3,359,354
Ohio 4,375,039 - 4,375,039
Pendleton 1,151,789 - 1,151,789
Pleasants 1,042,296 121,664 1,163,960
Pocahontas 1,159,326 - 1,159,326
Preston 3,538,564 - 3,538,564
Putnam 7,834,613 - 7,834,613
Raleigh 10,012,240 - 10,012,240
Randolph 3,581,402 - 3,581,402
Ritchie 1,248,806 - 1,248,806
Roane 2,030,892 - 2,030,892
Summers 1,352,183 - 1,352,183
Taylor 2,022,328 - 2,022,328
Tucker 1,034,426 - 1,034,426
Tyler 1,153,255 - 1,153,255
Upshur 3,368,727 138,440 3,507,167
Wayne 6,121,342 - 6,121,342
Webster 1,255,207 - 1,255,207
Wetzel 2,325,134 - 2,325,134
Wirt 960,516 - 960,516
Wood 10,345,153 - 10,345,153
Wyoming 3,531,157 - 3,531,157
Total 222,105,722 1,022,775 223,128,497
OSF
04/08/14PEIA Reallocation 14 Final Comps
-45-

COUNTY BOARDS OF EDUCATION RETIREMENT ALLOCATION FOR BUDGETING PURPOSES
INCLUDING ON BEHALF PAYMENTS FOR UNFUNDED LIABILITY(BASED ON FINAL COMPUTATIONS)
FOR THE 2013-14 YEAR
Retirement Retirement Retirement RetirementAllocation Allocation Allocation Allocation
For Budgeting For Budgeting For Budgeting For Budgeting TotalCurrent Cost Current Cost Unfunded Liability Unfunded Liability Retirement
County Co. Bds. MCVCs Co. Bds MCVCs AllocationBarbour 978,670 - 2,661,671 - 3,640,341 Berkeley 6,749,058 119,469 18,355,289 322,915 25,546,731 Boone 1,831,937 - 4,982,286 - 6,814,223 Braxton 858,926 - 2,336,005 - 3,194,931 Brooke 1,462,730 - 3,978,160 - 5,440,890 Cabell 5,290,639 - 14,388,854 - 19,679,493 Calhoun 426,583 56,698 1,160,170 153,250 1,796,701 Clay 809,444 - 2,201,430 - 3,010,874 Doddridge 497,707 - 1,353,605 - 1,851,312 Fayette 2,714,761 - 7,383,286 - 10,098,047 Gilmer 382,277 - 1,039,672 - 1,421,949 Grant 721,993 40,778 1,963,591 110,220 2,836,582 Greenbrier 2,075,493 - 5,644,680 - 7,720,173 Hampshire 1,373,867 - 3,736,481 - 5,110,348 Hancock 1,710,495 - 4,652,002 - 6,362,497 Hardy 935,370 - 2,543,909 - 3,479,279 Harrison 4,512,715 88,629 12,273,148 239,557 17,114,049 Jackson 2,053,062 79,976 5,583,675 216,169 7,932,882 Jefferson 3,314,760 - 9,015,092 - 12,329,852 Kanawha 12,362,884 - 33,623,109 - 45,985,993 Lewis 1,051,027 - 2,858,460 - 3,909,487 Lincoln 1,608,648 - 4,375,010 - 5,983,658 Logan 2,734,871 - 7,437,979 - 10,172,850 Marion 3,434,032 - 9,339,474 - 12,773,506 Marshall 2,029,855 - 5,520,559 - 7,550,414 Mason 1,716,337 - 4,667,890 - 6,384,227 McDowell 1,567,687 - 4,263,610 - 5,831,297 Mercer 4,018,106 - 10,927,969 - 14,946,075 Mineral 1,976,162 - 5,374,532 - 7,350,694 Mingo 1,758,642 - 4,782,946 - 6,541,588 Monongalia 4,501,932 - 12,243,822 - 16,745,754 Monroe 714,745 - 1,943,879 - 2,658,624 Morgan 922,799 - 2,509,720 - 3,432,519 Nicholas 1,734,310 - 4,716,771 - 6,451,081 Ohio 2,209,881 - 6,010,173 - 8,220,054 Pendleton 608,437 - 1,654,755 - 2,263,192 Pleasants 538,226 49,593 1,463,803 134,046 2,185,668 Pocahontas 633,265 - 1,722,279 - 2,355,544 Preston 1,990,054 - 5,412,313 - 7,402,367 Putnam 4,004,295 - 10,890,408 - 14,894,703 Raleigh 5,126,205 - 13,941,646 - 19,067,851 Randolph 1,999,760 - 5,438,711 - 7,438,471 Ritchie 579,065 - 1,574,872 - 2,153,937 Roane 946,313 - 2,573,670 - 3,519,983 Summers 712,956 - 1,939,013 - 2,651,969 Taylor 1,072,823 - 2,917,737 - 3,990,560 Tucker 512,218 - 1,393,070 - 1,905,288 Tyler 612,920 - 1,666,947 - 2,279,867 Upshur 1,622,949 49,238 4,413,905 133,086 6,219,178 Wayne 2,788,799 - 7,584,646 - 10,373,445 Webster 634,642 - 1,726,024 - 2,360,666 Wetzel 1,207,380 - 3,283,689 - 4,491,069 Wirt 433,271 - 1,178,359 - 1,611,630 Wood 5,831,866 - 15,860,819 - 21,692,685 Wyoming 2,034,301 - 5,532,651 - 7,566,952 Total 116,932,150 484,381 318,018,226 1,309,243 436,744,000
WVDE - OSF04/29/13Retirement - Budget - Final 14
-46-

APPROVED
PROPOSED BUDGETS


EXECUTIVE SUMMARY
PROPOSED BUDGETS OF COUNTY BOARDS OF EDUCATION,
REGIONAL EDUCATION SERVICE AGENCIES, AND
MULTI-COUNTY VOCATIONAL CENTERS
FOR THE 2013-14 YEAR
According to WVC §18-9B-6, all county board of education are required to submit their proposed budgets for the upcoming year to the State Board of School Finance on or before the day fixed by the budget calendar, together with such supporting schedules as the Board may require. According to WVC §18-9A-17, the functions of the Board of School Finance are now performed by the State Board of Education, through its chief executive officer (State Superintendent of Schools).
According to WVC §11-8-9, county boards of education are required to hold a meeting or meetings between March 7 and March 28. WVC §11-8-12 specifies that the purpose of the meeting is to, among other things, ascertain the fiscal condition of the board and determine the amount to be raised by the levy of taxes. The board is then required to submit its Schedule of Proposed Levy Rates to the State Auditor’s Office for review and approval. A levying body may extend the time for this meeting until the first day of June if a special levy is being placed on the ballot for consideration during a primary election. The meeting is then to stand adjourned until the third Tuesday in April, at which time the board is to reconvene the meeting to finally enter the levy order, after having received approval from the State Auditor’s Office. Although the Legislature will set the regular levy rates for boards of educations, boards are responsible for setting the levy rates for all other levies, including those for permanent improvement, excess and bond levy purposes. County boards of education must hold a public hearing on the proposed budget before the document is adopted and submitted to the State Superintendent of Schools for approval. The board meeting for conducting the public hearing and adopting the proposed budget may be held on any date between the time the final computations schedules of state aid are received and May 31. WVC §18-9B-6 specifies that a county board of education is not to finally adopt its budget until after written approval has been received from the State Superintendent of Schools. Before giving final approval, the State Superintendent of Schools is required to ensure that estimates of revenues and receipts are reasonable and accurate, that amounts are budgeted so as to cover actual requirements of school operations, and that amounts are budgeted so as to maintain the schools of the county for the minimum 200 day employment term and the instructional term, as defined in WVC §18-5-45. If the State Superintendent of Schools finds that the proposed budget for a county will not maintain the proposed educational program as well as other financial obligations, it may require that the budget be revised. Any required revision for this purpose may be made in the following order: postpone expenditures for permanent improvements and capital outlays except from the permanent improvement fund; reduce the amount budgeted for maintenance exclusive of service personnel salaries, so as to guarantee the payment of salaries for the employment term, or adjust amount budgeted in any other way so as to assure the required employment term of 200 days and the required instructional term of 180 days.
A summary of taxable assessed valuations, levy rates, projected regular levy gross tax collections, and summaries of the proposed budgets submitted by the fifty-five county boards of education, eight regional education service agencies, and seven multi-county vocational centers for the 2013-14 year follows:
Taxable Assessed Valuations: The total statewide aggregate taxable assessed valuation for the 2013-14 year increased by $4.6 billion over the previous year, an overall increase of 5.93%. Total taxable assessed valuations decreased in twelve of the fifty-five counties. The total assessed valuations for each county are presented in Attachment 1.
-47-

The total taxable assessed valuations for the State for 2013-14 and the previous year are:
2012-13 2013-14 Difference Percent
Non-public utility property $ 69,480,676,149 $ 73,616,287,514 $4,135,611,365 5.95% Public utility property 8,460,701,440 8,950,607,400 489,905,960 5.79%
Total $ 77,941,377,589 $ 82,566,894,914 $ 4,625,517,325 5.93%
Levy Rates:
County boards of education are considered to be local levying bodies, and as such have the authority under State statutes to levy taxes on the various classes of property specified in WVC §11-8-5. However, as a result of the fair and equitable property valuation program (WVC §11-1C-1 et seq.), which was implemented in 1990 to ensure that all property in the State is assessed at 60% of fair market value, the levy rates for county boards of education regular levies are set by the Legislature so that the rates are uniform throughout the State. In addition, a provision of the fair and equitable property valuation program requires that the regular levy rates be reduced so that the amount of the projected gross tax revenues does not increase by more than 2% over the projected gross tax revenues of the previous year, unless the Legislature holds a public hearing. Excluded from the calculation are increases in projected tax collections due to new construction, improvements to existing real property, or newly acquired personal property. The amounts to be paid to the Assessor’s Valuation Fund are also excluded from the calculation. The levy rates for the 2013-14 year, however, did not need to be reduced because the assessed valuation did not increase by more than the 2% limit. Therefore, the levy rates of the regular levy for school districts for the 2013-14 year remained the same as they were for the previous year.
Summary of Projected Gross Tax Collections:
2012-13 2013-14 Difference Percent
Regular Levy $ 483,004,100 $ 514,371,448 $ 31,367,348 6.49% Excess Levy 448,158,490 475,214,512 27,056,022 6.04% Bond Levy 55,779,349 54,900,123 (879,226) (1.58%) Permanent Improvement Levy 2,947,121 3,652,888 705,767 23.95% Total $ 989,889,060 $ 1,048,138,971 $ 58,249,911 5.88%
Projected Regular Levy Gross Tax Collections:
The total projected regular levy gross tax collections statewide for the 2013-14 year is $514.4 million, an increase of $31.4 million or 6.49% more than the previous year’s amount. Forty-four county boards realized an increase in projected regular levy gross tax collections over the previous year and eleven realized a decrease. The total projected gross tax collections by purpose for each county board are presented in Attachment 3. Under the Public School Support Program (PSSP), which is commonly referred to as the State Aid funding formula, an increase in the regular levy projected gross tax collections causes a decrease in state aid appropriated for the public schools and vice versa.
Excess Levies: Forty-three county boards of education have excess levies in effect for the 2013-14 year, which is one less than the previous year. Preston County Schools was not able to renew its excess levy. The excess levies of four other county boards of education were scheduled to expire at June 30, 2013, but they were able to renew their levies for the upcoming years. It should be noted that the total collections from the Calhoun County
-48-

Schools excess levy, however, are dedicated completely to support the Calhoun County Public Library. The total projected excess levy gross tax collections for the year is $475.2 million, an increase of $27.1 million or 6.04% increase over the previous year’s amount. The excess levy rates for the year range from 100% of the maximum rates authorized by statute (22.95 ¢ for Class I property) to a low of 1.7% (0.40 ¢ for Calhoun County Schools). Twenty-one county boards set their excess levy rates at 100% of the maximum allowed by statute, the same as the previous year.
Bond Levies:
Twenty-two county boards have bond levies in effect for the 2013-14 year, one less than the previous year. The total projected gross tax collections for bond purposes for the year is $54.9 million, a decrease of $879 thousand over the previous year’s amount.
Permanent Improvement Levies:
Five county boards of education have established a permanent improvement fund and allocate a portion of their gross tax collections from their regular levy for this purpose; they are: Cabell, Mingo, Monroe, Wayne, and Wyoming. In addition, seven other county boards are maintaining a permanent improvement fund during the 2013-14 year, but rather than dedicate a portion of their regular levy tax collections for this purpose, they periodically transfer available funds from the general current expense fund or other funds to the permanent improvement fund. The total projected permanent improvement gross tax collections for the 2013-14 year for the five county boards that have dedicated a portion of their regular tax collections for this purpose is $3.7 million, an increase of $706 thousand over the previous year’s amount.
Proposed Budgets of County Boards of Education: The total aggregate revenues, expenditures, and beginning fund balances budgeted by the fifty-five county boards of education for the 2013-14 year are: Projected
Estimated Beginning Budgeted Fund Revenues Balances Expenditures
Current Expense $ 2,497,406,035 $ 64,670,991 $ 2,562,077,026 Special Revenue 471,440,164 140,146 471,580,310 Debt Service 52,087,963 5,369,674 57,457,637 Bond Construction 1,174,191 59,064,215 60,238,406 Permanent Improvement 5,550,764 31,676,000 37,226,764 Capital Projects Fund 63,663,679 1,161,910 64,825,589
Total $ 3,091,322,796 $ 162,082,936 $ 3,253,405,732
County boards are required to include major federal programs in their proposed budgets using projected revenue estimates. Non-major state and federal programs and local revenues will be supplemented into the budgets when the amounts are known. The proposed budgets of all fifty-five county boards are summarized in the following schedule.
Projected Deficits as of June 30, 2013: Four county boards of education projected deficits in their General Current Expense Fund at the end of the 2012-13 fiscal year, which will create a deficit beginning balance for the 2013-14 year. The county boards and amount of the projected deficits are: Calhoun - $250,000; Clay - $1,746,109; Preston - $2,000,000; and Tucker - $3,500, These projected deficits are exclusive of the liability for other post-employment benefits (OPEB). Calhoun, Clay and Preston reported deficits for the fiscal year ended June 30, 2012, so the projected
-49-

deficits are recurring deficits; Tucker County did not have a deficit balance at June 30, 2012.
Proposed Budgets of Regional Education Service Agencies:
Total aggregate revenues, expenditures, and beginning fund balances budgeted by the eight regional education service agencies (RESAs) for the 2013-14 year are: Projected
Estimated Beginning Budgeted Fund Revenues Balances Expenditures
General Current Expense Fund $ 10,103,231 $1,198,595 $ 11,301,826 Special Revenue Fund 20,765,246 - 20,765,246
Total $ 30,868,477 $ 1,198,595 $ 32,067,072
Like boards of education, RESAs are required to include all major federal, state and local projects in their proposed budgets, using projected revenue estimates. Non-major state and federal programs and local revenues will be supplemented into the budgets when the amounts are known.
None of the eight RESAs are projecting a deficit at June 30, 2013.
Proposed Budgets of Multi-County Vocational Centers:
Total aggregate revenues, expenditures and beginning fund balances budgeted by the seven multi-county vocational centers (MCVCs) for the 2013-14 year are: Projected
Estimated Beginning Budgeted Fund Revenues Balances Expenditures
General Current Expense Fund $ 10,554,670 $ 147,056 $10,701,726 Special Revenue Fund 2,966,257 - 2,966,257
Total $ 13,520,927 $ 147,056 $ 13,667,983
Like boards of education, MCVCs are required to include major federal projects in their proposed budgets, using projected revenue estimates. Non-major state and federal programs and local revenues will be supplemented into the budgets when the amounts are known. Proposed Budgets - Executive Summary 14
-50-

COUNTY BOARDS OF EDUCATIONSUMMARY OF APPROVED PROPOSED BUDGETS
FOR THE 2013-14 YEAR
Current Special Debt Bond Permanent CapitalExpense Revenue Service Construction Improvement Projects Total
County Fund Fund Fund Fund Fund Fund All Funds
Barbour 18,201,239 4,166,021 - - - - 22,367,260 Berkeley 163,254,644 25,117,682 6,917,318 - - - 195,289,644 Boone 46,360,660 7,813,734 - - - - 54,174,394 Braxton 16,100,331 4,805,975 1,236,338 - - - 22,142,644 Brooke 29,584,708 4,931,597 1,386,550 - 1,000 - 35,903,855 Cabell 129,212,565 22,472,054 8,564,288 - 1,481,629 - 161,730,536 Calhoun 7,688,224 2,266,723 267,276 1,174,191 - 2,225,000 13,621,414 Clay 13,677,756 4,309,545 - - - - 17,987,301 Doddridge 14,163,750 2,408,010 792,240 - - - 17,364,000 Fayette 69,674,553 12,214,028 - - - - 81,888,581 Gilmer 9,702,560 1,986,065 - - - - 11,688,625 Grant 13,392,078 3,032,585 66,643 - - 50,000 16,541,306 Greenbrier 43,700,270 10,633,030 4,347,660 400,000 - 300,000 59,380,960 Hampshire 26,639,007 6,274,533 - - - - 32,913,540 Hancock 37,267,764 6,131,461 2,395,650 - - - 45,794,875 Hardy 17,144,153 3,776,771 1,302,366 18,000,000 - - 40,223,290 Harrison 117,659,080 16,381,142 - - - - 134,040,222 Jackson 42,196,262 7,535,925 - - - - 49,732,187 Jefferson 85,304,571 11,833,978 1,676,000 - - - 98,814,549 Kanawha 238,944,840 46,129,374 - - 21,000,000 - 306,074,214 Lewis 22,502,692 4,841,567 - - - 12,136,140 39,480,399 Lincoln 37,149,450 7,250,228 - - - - 44,399,678 Logan 64,102,706 10,943,722 - - 9,115,000 - 84,161,428 Marion 71,860,482 11,953,211 1,876,325 - - - 85,690,018 Marshall 55,789,386 8,182,060 2,788,880 - - 4,700,000 71,460,326 Mason 42,186,834 7,584,345 1,700,998 - - - 51,472,177 McDowell 34,034,922 9,470,967 - - 300,000 - 43,805,889 Mercer 77,829,178 19,001,318 - - - 602,500 97,432,996 Mineral 37,129,955 8,057,545 - - 600,000 4,100,000 49,887,500 Mingo 43,823,183 8,852,462 - - 594,542 983,485 54,253,672 Monongalia 102,990,850 18,932,850 3,407,220 - 1,395,830 - 126,726,750 Monroe 16,016,588 3,926,593 - - 424,333 - 20,367,514 Morgan 23,905,865 4,052,442 - - - 261,910 28,220,217 Nicholas 39,221,572 6,821,659 - - - - 46,043,231 Ohio 51,857,576 8,832,366 2,681,638 750,000 311,910 - 64,433,490 Pendleton 10,045,733 1,969,299 - - - - 12,015,032 Pleasants 13,564,159 2,193,941 1,537,350 10,740,925 - 7,560,925 35,597,300 Pocahontas 11,073,490 2,276,070 - - - - 13,349,560 Preston 30,771,568 6,735,224 3,411,200 29,173,290 - 22,166,900 92,258,182 Putnam 93,140,000 12,951,732 5,140,950 - - 1,124,149 112,356,831 Raleigh 113,902,405 21,780,052 - - - - 135,682,457 Randolph 34,948,168 7,641,627 - - - - 42,589,795 Ritchie 13,205,239 2,969,820 - - - - 16,175,059 Roane 17,176,806 4,690,942 301,357 - - - 22,169,105 Summers 12,586,973 3,332,085 - - - - 15,919,058 Taylor 20,469,498 4,035,027 948,850 - - - 25,453,375 Tucker 9,300,915 1,897,852 - - - - 11,198,767 Tyler 15,853,216 2,549,453 - - - - 18,402,669 Upshur 36,246,707 5,609,591 - - - - 41,856,298 Wayne 67,875,694 12,175,580 - - 1,076,320 - 81,127,594 Webster 11,388,615 3,074,042 - - - - 14,462,657 Wetzel 30,296,394 4,424,333 - - - - 34,720,727 Wirt 8,390,780 2,050,152 - - - 1,000,000 11,440,932 Wood 112,024,402 18,526,630 3,218,050 - - - 133,769,082 Wyoming 39,546,010 7,773,290 1,492,490 - 926,200 7,614,580 57,352,570
Total 2,562,077,026 471,580,310 57,457,637 60,238,406 37,226,764 64,825,589 3,253,405,732
OSF04/15/15PBS 14
-51-

This Page Intentionally Left Blank
-52-

REVENUES &
EXPENDITURES


COUNTY BOARDS OF EDUCATION
TOTAL REVENUES CLASSIFIED BY SOURCE
FOR THE 2013-14 YEAR
Local Revenues State Revenues Federal Revenues Total
County Amount Percent Amount Percent Amount Percent Revenues
Barbour 3,811,260$ 14.4% 19,229,174$ 72.6% 3,452,987$ 13.0% 26,493,421$
Berkeley 69,214,413 31.3% 134,642,715 60.9% 17,401,528 7.9% 221,258,656
Boone 26,503,845 45.6% 26,547,405 45.7% 5,084,653 8.7% 58,135,903
Braxton 4,833,050 19.5% 16,164,955 65.3% 3,758,476 15.2% 24,756,481
Brooke 13,207,928 33.5% 22,853,587 58.0% 3,361,957 8.5% 39,423,472
Cabell 55,109,241 33.6% 91,039,298 55.5% 17,970,178 10.9% 164,118,717
Calhoun 1,816,140 10.6% 13,460,032 78.7% 1,833,810 10.7% 17,109,982
Clay 3,026,757 13.2% 16,467,609 71.7% 3,484,059 15.2% 22,978,425
Doddridge 10,519,666 54.6% 7,261,496 37.7% 1,501,905 7.8% 19,283,067
Fayette 21,056,147 26.6% 49,283,922 62.3% 8,794,467 11.1% 79,134,536
Gilmer 3,239,686 27.4% 7,131,224 60.3% 1,452,047 12.3% 11,822,957
Grant 6,952,779 32.3% 12,090,587 56.3% 2,450,023 11.4% 21,493,389
Greenbrier 20,316,317 31.7% 36,163,924 56.5% 7,569,715 11.8% 64,049,956
Hampshire 8,091,517 21.3% 24,427,791 64.3% 5,485,380 14.4% 38,004,688
Hancock 17,041,322 29.8% 36,005,837 63.0% 4,092,671 7.2% 57,139,830
Hardy 7,082,441 25.0% 18,582,974 65.5% 2,705,886 9.5% 28,371,301
Harrison 53,749,663 38.7% 73,660,075 53.0% 11,546,203 8.3% 138,955,941
Jackson 17,682,997 27.0% 42,117,368 64.2% 5,792,661 8.8% 65,593,026
Jefferson 47,416,706 42.2% 57,953,029 51.6% 6,864,543 6.1% 112,234,278
Kanawha 111,990,774 34.0% 182,407,766 55.3% 35,293,510 10.7% 329,692,050
Lewis 10,504,920 32.8% 19,381,247 60.6% 2,103,401 6.6% 31,989,568
Lincoln 8,032,553 18.4% 29,398,582 67.3% 6,235,323 14.3% 43,666,458
Logan 25,255,262 33.3% 43,064,299 56.8% 7,493,455 9.9% 75,813,016
Marion 37,322,172 35.5% 59,960,924 57.0% 7,946,776 7.6% 105,229,872
Marshall 44,803,749 60.7% 22,995,586 31.2% 6,018,930 8.2% 73,818,265
Mason 17,698,321 34.3% 28,606,796 55.4% 5,356,318 10.4% 51,661,435
McDowell 14,799,244 29.7% 24,803,381 49.8% 10,202,449 20.5% 49,805,074
Mercer 25,359,724 22.2% 75,717,297 66.3% 13,076,963 11.5% 114,153,984
Mineral 12,759,406 24.1% 35,081,198 66.3% 5,106,662 9.6% 52,947,266
Mingo 18,630,381 34.1% 29,059,000 53.2% 6,938,370 12.7% 54,627,751
Monongalia 64,417,043 45.1% 67,137,363 47.0% 11,343,993 7.9% 142,898,399
Monroe 4,400,395 20.6% 14,048,322 65.8% 2,903,227 13.6% 21,351,944
Morgan 11,801,486 39.8% 15,355,571 51.8% 2,470,537 8.3% 29,627,594
Nicholas 12,090,809 25.4% 29,786,012 62.7% 5,652,833 11.9% 47,529,654
Ohio 25,378,838 37.6% 35,519,016 52.6% 6,585,179 9.8% 67,483,033
Pendleton 2,420,295 11.8% 16,783,248 81.8% 1,316,134 6.4% 20,519,677
Pleasants 10,463,897 41.1% 13,797,655 54.1% 1,224,663 4.8% 25,486,215
Pocahontas 4,237,672 25.8% 10,412,911 63.3% 1,805,912 11.0% 16,456,495
Preston 11,941,881 21.0% 40,502,058 71.3% 4,327,025 7.6% 56,770,964
Putnam 45,074,047 35.9% 73,518,222 58.5% 6,999,866 5.6% 125,592,135
Raleigh 46,062,847 31.2% 86,386,063 58.6% 15,077,349 10.2% 147,526,259
Randolph 10,504,951 21.5% 32,949,731 67.4% 5,449,052 11.1% 48,903,734
Ritchie 4,901,657 27.3% 11,190,106 62.4% 1,849,132 10.3% 17,940,895
Roane 3,648,203 14.2% 17,828,100 69.4% 4,213,731 16.4% 25,690,034
Summers 2,770,765 16.1% 11,810,069 68.6% 2,647,495 15.4% 17,228,329
Taylor 8,086,419 28.2% 17,532,515 61.1% 3,061,072 10.7% 28,680,006
Tucker 3,935,193 30.9% 7,546,044 59.2% 1,265,866 9.9% 12,747,103
Tyler 6,033,673 33.4% 10,164,652 56.2% 1,878,574 10.4% 18,076,899
Upshur 11,596,715 25.2% 29,402,526 63.9% 5,040,580 10.9% 46,039,821
Wayne 19,253,255 23.2% 54,919,882 66.3% 8,683,168 10.5% 82,856,305
Webster 2,028,824 11.6% 12,803,597 72.9% 2,721,925 15.5% 17,554,346
Wetzel 20,038,416 50.6% 16,217,805 41.0% 3,339,286 8.4% 39,595,507
Wirt 1,649,379 13.5% 9,148,860 74.9% 1,408,887 11.5% 12,207,126
Wood 42,554,781 28.1% 95,179,482 62.9% 13,626,865 9.0% 151,361,128
Wyoming 16,493,028 25.1% 44,011,553 66.9% 5,289,589 8.0% 65,794,170
Total 1,109,612,850$ 31.9% 2,029,510,441$ 58.3% 340,557,246$ 9.8% 3,479,680,537$
Bond and capital lease proceeds, not classified above 3,717,234$
Note: RESA funds are not included.
OSF
1/13/2015
Rev Classified by Source 14
-53-
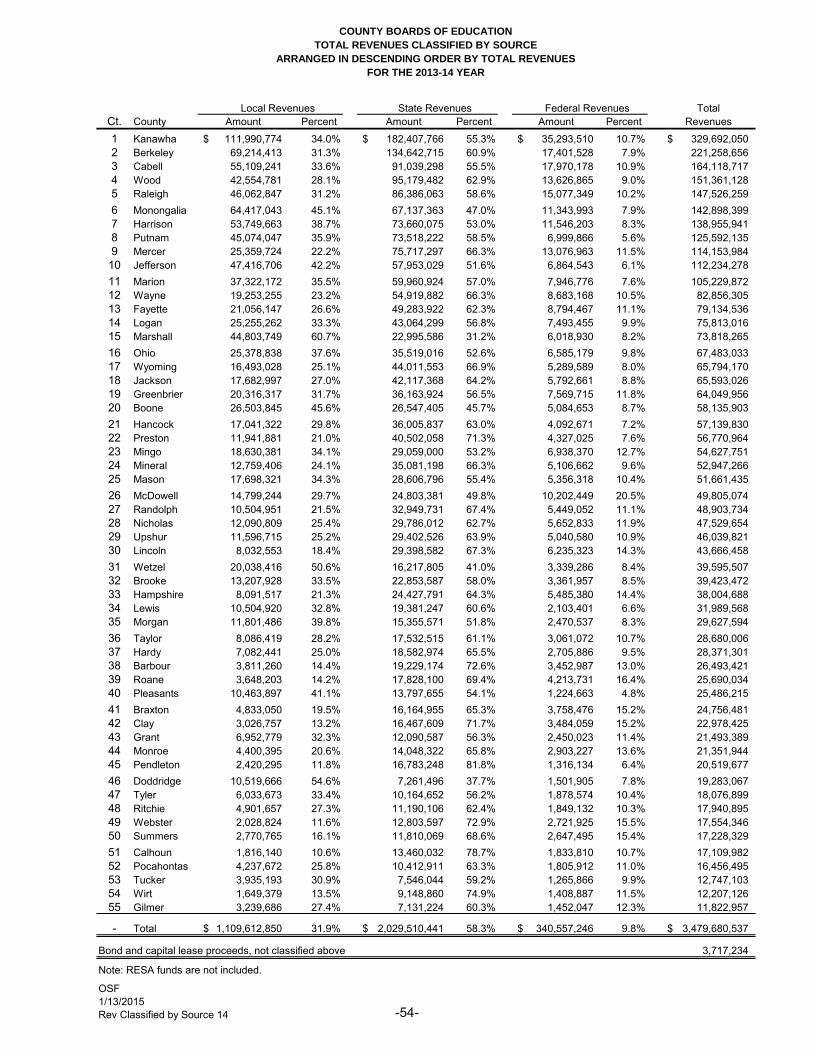
COUNTY BOARDS OF EDUCATION
TOTAL REVENUES CLASSIFIED BY SOURCE
ARRANGED IN DESCENDING ORDER BY TOTAL REVENUES
FOR THE 2013-14 YEAR
Local Revenues State Revenues Federal Revenues Total
Ct. County Amount Percent Amount Percent Amount Percent Revenues
1 Kanawha 111,990,774$ 34.0% 182,407,766$ 55.3% 35,293,510$ 10.7% 329,692,050$
2 Berkeley 69,214,413 31.3% 134,642,715 60.9% 17,401,528 7.9% 221,258,656
3 Cabell 55,109,241 33.6% 91,039,298 55.5% 17,970,178 10.9% 164,118,717
4 Wood 42,554,781 28.1% 95,179,482 62.9% 13,626,865 9.0% 151,361,128
5 Raleigh 46,062,847 31.2% 86,386,063 58.6% 15,077,349 10.2% 147,526,259
6 Monongalia 64,417,043 45.1% 67,137,363 47.0% 11,343,993 7.9% 142,898,399
7 Harrison 53,749,663 38.7% 73,660,075 53.0% 11,546,203 8.3% 138,955,941
8 Putnam 45,074,047 35.9% 73,518,222 58.5% 6,999,866 5.6% 125,592,135
9 Mercer 25,359,724 22.2% 75,717,297 66.3% 13,076,963 11.5% 114,153,984
10 Jefferson 47,416,706 42.2% 57,953,029 51.6% 6,864,543 6.1% 112,234,278
11 Marion 37,322,172 35.5% 59,960,924 57.0% 7,946,776 7.6% 105,229,872
12 Wayne 19,253,255 23.2% 54,919,882 66.3% 8,683,168 10.5% 82,856,305
13 Fayette 21,056,147 26.6% 49,283,922 62.3% 8,794,467 11.1% 79,134,536
14 Logan 25,255,262 33.3% 43,064,299 56.8% 7,493,455 9.9% 75,813,016
15 Marshall 44,803,749 60.7% 22,995,586 31.2% 6,018,930 8.2% 73,818,265
16 Ohio 25,378,838 37.6% 35,519,016 52.6% 6,585,179 9.8% 67,483,033
17 Wyoming 16,493,028 25.1% 44,011,553 66.9% 5,289,589 8.0% 65,794,170
18 Jackson 17,682,997 27.0% 42,117,368 64.2% 5,792,661 8.8% 65,593,026
19 Greenbrier 20,316,317 31.7% 36,163,924 56.5% 7,569,715 11.8% 64,049,956
20 Boone 26,503,845 45.6% 26,547,405 45.7% 5,084,653 8.7% 58,135,903
21 Hancock 17,041,322 29.8% 36,005,837 63.0% 4,092,671 7.2% 57,139,830
22 Preston 11,941,881 21.0% 40,502,058 71.3% 4,327,025 7.6% 56,770,964
23 Mingo 18,630,381 34.1% 29,059,000 53.2% 6,938,370 12.7% 54,627,751
24 Mineral 12,759,406 24.1% 35,081,198 66.3% 5,106,662 9.6% 52,947,266
25 Mason 17,698,321 34.3% 28,606,796 55.4% 5,356,318 10.4% 51,661,435
26 McDowell 14,799,244 29.7% 24,803,381 49.8% 10,202,449 20.5% 49,805,074
27 Randolph 10,504,951 21.5% 32,949,731 67.4% 5,449,052 11.1% 48,903,734
28 Nicholas 12,090,809 25.4% 29,786,012 62.7% 5,652,833 11.9% 47,529,654
29 Upshur 11,596,715 25.2% 29,402,526 63.9% 5,040,580 10.9% 46,039,821
30 Lincoln 8,032,553 18.4% 29,398,582 67.3% 6,235,323 14.3% 43,666,458
31 Wetzel 20,038,416 50.6% 16,217,805 41.0% 3,339,286 8.4% 39,595,507
32 Brooke 13,207,928 33.5% 22,853,587 58.0% 3,361,957 8.5% 39,423,472
33 Hampshire 8,091,517 21.3% 24,427,791 64.3% 5,485,380 14.4% 38,004,688
34 Lewis 10,504,920 32.8% 19,381,247 60.6% 2,103,401 6.6% 31,989,568
35 Morgan 11,801,486 39.8% 15,355,571 51.8% 2,470,537 8.3% 29,627,594
36 Taylor 8,086,419 28.2% 17,532,515 61.1% 3,061,072 10.7% 28,680,006
37 Hardy 7,082,441 25.0% 18,582,974 65.5% 2,705,886 9.5% 28,371,301
38 Barbour 3,811,260 14.4% 19,229,174 72.6% 3,452,987 13.0% 26,493,421
39 Roane 3,648,203 14.2% 17,828,100 69.4% 4,213,731 16.4% 25,690,034
40 Pleasants 10,463,897 41.1% 13,797,655 54.1% 1,224,663 4.8% 25,486,215
41 Braxton 4,833,050 19.5% 16,164,955 65.3% 3,758,476 15.2% 24,756,481
42 Clay 3,026,757 13.2% 16,467,609 71.7% 3,484,059 15.2% 22,978,425
43 Grant 6,952,779 32.3% 12,090,587 56.3% 2,450,023 11.4% 21,493,389
44 Monroe 4,400,395 20.6% 14,048,322 65.8% 2,903,227 13.6% 21,351,944
45 Pendleton 2,420,295 11.8% 16,783,248 81.8% 1,316,134 6.4% 20,519,677
46 Doddridge 10,519,666 54.6% 7,261,496 37.7% 1,501,905 7.8% 19,283,067
47 Tyler 6,033,673 33.4% 10,164,652 56.2% 1,878,574 10.4% 18,076,899
48 Ritchie 4,901,657 27.3% 11,190,106 62.4% 1,849,132 10.3% 17,940,895
49 Webster 2,028,824 11.6% 12,803,597 72.9% 2,721,925 15.5% 17,554,346
50 Summers 2,770,765 16.1% 11,810,069 68.6% 2,647,495 15.4% 17,228,329
51 Calhoun 1,816,140 10.6% 13,460,032 78.7% 1,833,810 10.7% 17,109,982
52 Pocahontas 4,237,672 25.8% 10,412,911 63.3% 1,805,912 11.0% 16,456,495
53 Tucker 3,935,193 30.9% 7,546,044 59.2% 1,265,866 9.9% 12,747,103
54 Wirt 1,649,379 13.5% 9,148,860 74.9% 1,408,887 11.5% 12,207,126
55 Gilmer 3,239,686 27.4% 7,131,224 60.3% 1,452,047 12.3% 11,822,957
- Total 1,109,612,850$ 31.9% 2,029,510,441$ 58.3% 340,557,246$ 9.8% 3,479,680,537$
Bond and capital lease proceeds, not classified above 3,717,234
Note: RESA funds are not included.
OSF
Rev Classified by Source 14
1/13/2015-54-

COUNTY BOARDS OF EDUCATION
SCHEDULE OF LOCAL REVENUES RECEIVED
DURING THE 2013-14 YEAR
Property Taxes Interstate Public Utilities Penalties Payments
Reg, PI & Excess Sales, Redmpt, Registration Tax Loss & Interest on In Lieu ofCounty Bond Levies Levies Delinquencies Plan (IRP) Fee Restoration Prop. Taxes Taxes
Barbour 3,515,817 - 30,189 23,331 - 40,707 -
Berkeley 32,703,568 29,563,003 - - 39,235 459,014 2,030,203
Boone 11,400,239 13,758,000 - 27,110 - - -
Braxton 4,239,547 - 791 52,628 - 21,202 -
Brooke 6,326,588 6,298,216 47,656 - 1,575 64,387 -
Cabell 26,606,635 25,461,003 86,950 89,537 - - -
Calhoun 1,151,269 25,366 - 280,967 39,196 - -
Clay 1,937,590 614,917 - - - - -
Doddridge 5,114,774 5,069,142 - - - - -
Fayette 8,940,929 10,775,523 61,866 92,836 - - 12,626
Gilmer 2,082,116 1,006,324 - - - 16,779 -
Grant 6,250,196 28 - 14,880 - - -
Greenbrier 13,320,244 6,008,229 33,187 145,022 - - -
Hampshire 7,209,072 18 - - - - -
Hancock 8,745,926 7,276,807 25,316 - - - -
Hardy 6,533,716 85,828 - 21,543 - - -
Harrison 23,337,613 25,581,416 - 107,585 - 322,725 -
Jackson 7,494,685 9,039,000 5,323 114,444 - 146,160 -
Jefferson 18,764,500 18,571,289 417,857 22,569 - 298,709 -
Kanawha 58,787,056 46,244,163 62,834 333,489 - - -
Lewis 6,354,050 3,444,678 2,213 69,113 - 150 -
Lincoln 3,193,310 3,856,977 4,731 - - 50,150 -
Logan 11,291,272 13,179,223 - - - 111,195 -
Marion 15,856,317 15,710,947 3,588,422 - 71,326 - -
Marshall 21,550,456 22,344,668 52,358 35,412 - 108,274 43,420
Mason 8,772,434 7,806,967 11,472 37,777 196,229 204,982 -
McDowell 6,824,568 7,338,201 3,185 44,402 - - -
Mercer 10,565,858 12,767,806 - 153,505 - 195,223 -
Mineral 4,729,904 6,562,022 21,241 28,077 917,576 - -
Mingo 8,270,441 10,037,258 - 30,667 - 24,201 -
Monongalia 32,501,221 26,316,604 1,523 145,568 - - 1,764,529
Monroe 2,093,955 1,803,124 - - 1,300 - -
Morgan 5,224,026 6,040,053 29,634 19,791 - 102,892 -
Nicholas 6,141,217 4,278,066 5,487 34,379 842,806 94,716 -
Ohio 10,940,845 12,466,833 48,904 69,978 - 135,450 -
Pendleton 2,128,226 - - 25,815 - 11,542 -
Pleasants 5,551,009 3,837,475 - - - 38,269 381,976
Pocahontas 3,895,242 - 2,635 31,625 - 1,276 -
Preston 11,160,862 100,752 6,697 61,176 3,929 27,510 -
Putnam 21,927,534 20,053,739 20,698 64,998 - 351,942 -
Raleigh 19,677,712 24,661,944 56,627 166,980 - - 37,498
Randolph 6,812,557 3,031,000 - 31,944 - 917 -
Ritchie 2,679,323 1,905,131 - 34,787 5,839 - -
Roane 2,985,614 - - - - 35,665 -
Summers 2,542,302 - 595 14,052 - 29,966 -
Taylor 4,932,399 2,310,017 432,739 13,071 - 63,374 -
Tucker 3,642,654 2 - - - 30,226 -
Tyler 2,606,252 3,121,350 - - 12,626 92 -
Upshur 6,963,479 3,595,083 - - - - -
Wayne 8,402,051 9,814,091 - - - - -
Webster 1,708,114 - - 17,344 - - -
Wetzel 10,022,012 8,857,976 59,377 31,037 - 65,776 338,269
Wirt 717,686 779,579 - 16,901 2,899 19,350 -
Wood 21,639,157 17,874,007 94,922 - - 226,624 741,330
Wyoming 7,662,005 8,285,808 16,292 36,041 - 232,453 -
Total 556,428,139 467,559,650 5,231,719 2,540,381 2,134,537 3,531,896 5,349,850
WVDE - OSF
03/13/15
Local Rev. 14
Notes: (1) The source for this schedule was the WVEIS financial data file, so amounts reported above may not agree with related allocation
schedules for the year due to timing differences of when funds were actually distributed and receipted. (2) The amounts reflected as Accrued
(Unearned) adjustments are journal entry adjustments to report receipts as revenue in the year earned, in accordance with Generally Accepted
Accounting Principles.
-55-

COUNTY BOARDS OF EDUCATION
SCHEDULE OF LOCAL REVENUES RECEIVED
DURING THE 2013-14 YEAR
Vocational, Interest Contributions Child Accrued
Adult & Earned On Donations Nutrition Prgm Miscellaneous (Unearned) Total LocalCounty Misc. Tuition Investments Received Charges Revenues Adjustments Revenues
Barbour - 4,856 11,189 65,713 119,764 (305) 3,811,260
Berkeley 1,388,930 485,059 11,477 1,588,039 844,109 101,775 69,214,413
Boone 34,371 31,171 975 39,471 1,136,453 76,054 26,503,845
Braxton 1,800 2,803 7,000 88,326 418,953 - 4,833,050
Brooke - 28,373 - 230,698 211,911 (1,476) 13,207,928
Cabell 97,345 724,412 - 849,688 1,193,670 - 55,109,241
Calhoun 2,287 2,463 100,000 13,899 174,835 25,859 1,816,140
Clay - 3,756 - 32,067 438,427 - 3,026,757
Doddridge - 26,928 21,188 88,749 198,885 - 10,519,666
Fayette 102,255 303,087 - 90,408 676,618 - 21,056,147
Gilmer - 6,237 5,325 61,917 60,988 - 3,239,686
Grant - 4,032 - 142,530 537,544 3,570 6,952,779
Greenbrier - 7,577 - 324,945 477,112 - 20,316,317
Hampshire - 221,751 - 366,009 215,075 79,592 8,091,517
Hancock - 24,320 51,000 285,415 581,767 50,772 17,041,322
Hardy - 5,779 - 211,752 223,825 - 7,082,441
Harrison 65,626 238,270 - 931,930 2,136,033 1,028,466 53,749,663
Jackson 219,882 43,181 - 97,695 502,719 19,907 17,682,997
Jefferson 55,468 78,250 3,146,847 880,664 4,902,223 278,331 47,416,706
Kanawha 1,538,330 193,325 - 986,897 3,865,175 (20,495) 111,990,774
Lewis - 11,678 30,852 281,703 310,484 - 10,504,920
Lincoln - 19,366 120,000 42,748 616,207 129,063 8,032,553
Logan 50,748 100,436 - 77,493 1,133,609 (688,713) 25,255,262
Marion 16,340 452,052 106,467 444,358 1,075,943 - 37,322,172
Marshall 4,965 29,887 263,391 103,157 439,652 (171,891) 44,803,749
Mason - 20,836 214,728 112,984 319,913 - 17,698,321
McDowell 30,898 48,679 207,992 33,999 267,319 - 14,799,244
Mercer 348,822 42,255 589,410 43,825 563,954 89,065 25,359,724
Mineral 27,654 36,621 600 406,693 399,060 (370,043) 12,759,406
Mingo 15,400 25,724 - 43,289 183,401 - 18,630,381
Monongalia 152,675 1,038,609 121,734 1,171,640 1,099,766 103,175 64,417,043
Monroe - 6,444 - 315,450 180,121 - 4,400,395
Morgan 432 83,569 11,876 9,206 260,143 19,865 11,801,486
Nicholas 13,500 18,727 - 208,328 453,582 - 12,090,809
Ohio 24,841 36,017 79,272 310,781 1,265,917 - 25,378,838
Pendleton - 2,728 7,409 101,828 142,747 - 2,420,295
Pleasants 306,640 65,588 8,731 117,138 157,070 - 10,463,897
Pocahontas - 11,376 4,195 71,405 219,919 - 4,237,672
Preston 11,698 (12,198) 3,611 304,878 272,966 - 11,941,881
Putnam 356,866 264,317 148,000 1,222,516 782,742 (119,306) 45,074,047
Raleigh 61,407 275,140 12,871 534,436 1,190,003 (611,772) 46,062,847
Randolph - 1,485 8,192 132,409 486,446 - 10,504,951
Ritchie - 17,476 - 153,589 101,120 4,391 4,901,657
Roane - 2,962 236,215 235,526 127,409 24,813 3,648,203
Summers - 6,490 11,500 7,466 156,725 1,669 2,770,765
Taylor - 8,792 53,731 157,406 191,621 (76,730) 8,086,419
Tucker - 1,730 2,000 101,150 141,400 16,031 3,935,193
Tyler - 1,049 114,635 101,088 79,529 (2,947) 6,033,673
Upshur 358,233 3,312 15,926 259,476 198,836 202,369 11,596,715
Wayne 62,218 17,165 9,050 184,877 763,803 - 19,253,255
Webster - 1,708 2,000 12,739 286,920 - 2,028,824
Wetzel - 27,088 56,300 224,767 355,815 - 20,038,416
Wirt - 4,903 3,474 14,501 105,325 (15,241) 1,649,379
Wood 59,967 27,811 636,666 659,592 629,085 (34,381) 42,554,781
Wyoming - 26,298 - 23,459 210,673 - 16,493,028
Total 5,409,600 5,161,754 6,435,830 15,602,712 34,085,311 141,470 1,109,612,850
WVDE - OSF
03/13/15
Local Rev. 14
Notes: (1) The source for this schedule was the WVEIS financial data file, so amounts reported above may not agree with related allocation
schedules for the year due to timing differences of when funds were actually distributed and receipted. (2) The amounts reflected as Accrued
(Unearned) adjustments are journal entry adjustments to report receipts as revenue in the year earned, in accordance with Generally Accepted
Accounting Principles.
-56-

COUNTY BOARDS OF EDUCATION
SCHEDULE OF STATE REVENUES RECEIVED
DURING THE 2013-14 YEAR
Public School Support Program State State School
Unrestricted Restricted PEIA Retirement Special Ed. Vocational BuildingCounty State Aid State Aid Allocation Allocation Program Programs Authority
Barbour 10,614,015 836,478 2,200,831 3,640,341 57,922 68,383 1,217,283
Berkeley 75,424,464 5,256,106 13,137,201 25,546,731 466,457 298,161 11,371,252
Boone 13,699,716 1,398,516 3,384,014 6,922,194 90,548 174,731 150,706
Braxton 9,702,712 742,789 1,953,220 3,194,931 115,848 182,217 -
Brooke 13,541,441 1,007,765 2,657,963 5,546,741 108,159 65,191 -
Cabell 50,495,488 3,599,093 10,601,469 19,679,493 267,263 162,485 5,587,080
Calhoun 5,624,957 492,131 1,061,400 1,800,660 40,535 161,946 3,661,605
Clay 10,012,758 833,478 1,768,079 3,010,874 134,879 39,917 276,546
Doddridge 3,035,839 615,565 1,040,279 1,851,315 56,165 40,978 448,489
Fayette 28,694,304 1,943,933 5,858,114 10,098,047 289,390 134,652 997,148
Gilmer 4,058,084 455,481 790,517 1,416,367 53,976 14,023 78,147
Grant 4,810,346 715,004 1,516,645 2,837,249 66,877 148,012 1,270,846
Greenbrier 20,918,772 1,690,561 4,495,869 7,720,170 289,266 174,547 32,471
Hampshire 13,207,901 1,246,959 2,829,324 5,110,348 352,101 44,230 282,863
Hancock 16,545,769 1,259,139 2,940,999 6,362,497 153,914 243,285 8,478,771
Hardy 8,349,982 908,821 1,813,261 3,479,279 69,513 58,039 3,675,774
Harrison 37,666,718 2,950,447 8,945,805 17,111,650 501,269 330,447 3,833,868
Jackson 20,779,389 1,514,395 4,058,090 7,932,882 128,354 181,873 6,483,357
Jefferson 32,122,038 2,847,204 6,041,029 12,339,636 189,937 57,022 3,037,276
Kanawha 98,191,338 7,158,103 21,322,861 45,985,993 355,777 373,621 3,709,075
Lewis 8,931,312 967,020 1,980,153 3,909,487 90,241 28,872 3,066,118
Lincoln 18,053,928 1,356,861 3,022,801 5,983,660 121,283 102,860 -
Logan 25,443,384 2,026,236 4,586,463 10,172,850 130,004 57,570 -
Marion 29,858,322 2,447,907 5,956,287 12,773,506 124,519 133,135 7,554,805
Marshall 8,192,215 1,544,232 3,589,024 7,596,525 57,448 51,536 1,475,519
Mason 16,952,309 1,452,037 3,213,409 6,384,227 114,024 88,291 -
McDowell 13,483,196 1,228,750 2,723,328 5,873,788 96,501 119,864 334,229
Mercer 42,681,266 2,788,233 7,806,660 14,946,075 227,833 138,597 4,692,886
Mineral 19,035,395 1,431,577 3,696,976 7,350,694 16,667 76,196 2,424,566
Mingo 16,607,880 1,479,107 3,155,822 6,541,588 130,761 65,222 -
Monongalia 36,128,559 3,083,145 7,986,924 16,969,760 243,493 124,454 423,189
Monroe 8,441,132 723,683 1,663,908 2,675,676 52,522 121,060 18,290
Morgan 8,509,394 841,137 1,921,180 3,432,519 142,196 17,418 -
Nicholas 17,081,327 1,341,766 3,359,354 6,451,081 123,255 49,025 773,092
Ohio 20,258,359 1,640,354 4,401,557 8,304,780 130,966 43,467 -
Pendleton 5,734,236 564,791 1,138,405 2,263,192 58,277 10,849 6,770,482
Pleasants 3,746,703 511,934 1,167,942 2,185,658 59,093 130,087 6,356,996
Pocahontas 4,551,010 539,311 1,159,326 2,355,549 85,448 30,925 1,270,019
Preston 19,530,962 1,603,693 3,513,720 7,354,196 60,203 133,247 7,241,935
Putnam 39,105,237 2,629,017 7,869,685 14,963,333 232,862 215,573 7,024,520
Raleigh 51,500,908 4,792,386 10,040,220 19,067,851 421,625 136,809 12,020
Randolph 19,283,215 1,435,408 3,539,473 7,438,471 115,293 160,816 (0)
Ritchie 6,078,945 588,784 1,248,806 2,153,937 68,710 20,772 -
Roane 10,873,112 932,332 2,026,948 3,519,983 76,447 19,049 22,921
Summers 6,909,945 631,200 1,378,180 2,651,969 57,645 32,579 -
Taylor 9,867,204 841,374 2,028,620 3,990,560 71,236 61,693 697,381
Tucker 3,774,592 475,458 1,027,511 1,905,288 53,684 18,538 -
Tyler 5,644,322 602,486 1,143,325 2,279,867 95,674 30,183 301,608
Upshur 16,032,252 1,253,374 3,507,339 6,219,178 95,611 110,755 715,870
Wayne 32,671,234 2,330,260 6,121,342 10,373,445 221,531 112,865 2,186,313
Webster 7,096,249 584,599 1,255,207 2,360,666 56,905 24,558 1,240,028
Wetzel 7,841,607 913,941 2,309,405 4,491,069 147,667 32,512 -
Wirt 5,091,153 570,797 932,934 1,611,630 67,027 19,252 1,031,771
Wood 55,963,758 3,399,479 10,209,702 21,692,685 223,794 228,848 126,280
Wyoming 17,756,382 1,450,559 4,122,363 7,566,951 92,682 72,931 14,261,136
Total 1,096,207,035 88,475,196 223,221,265 437,399,092 7,951,277 5,774,168 124,614,529
WVDE - OSF
03/13/15
State Revenues 14
Notes: (1) The source for this schedule was the WVEIS financial data file, so amounts reported above may not agree with related allocation
schedules for the year due to timing differences of when funds were actually distributed and receipted. (2) The amounts reflected as Accrued
(Unearned) adjustments are journal entry adjustments to report receipts as revenue in the year earned, in accordance with Generally Accepted
Accounting Principles.
-57-

COUNTY BOARDS OF EDUCATION
SCHEDULE OF STATE REVENUES RECEIVED
DURING THE 2013-14 YEAR
Tools for Alternative Community State Child Other Accrued
Schools Education Participation Nutrition State Program (Unearned) Total StateCounty Allowance Allowance Grants Grants Grants Adjustments Revenues
Barbour 89,535 43,061 - 14,488 516,042 (69,205) 19,229,174
Berkeley 658,061 316,492 35,758 43,500 2,113,549 (25,016) 134,642,715
Boone 165,912 79,795 29,000 21,000 516,139 (84,866) 26,547,405
Braxton - 37,989 5,000 12,000 225,099 (6,850) 16,164,955
Brooke 121,887 58,622 20,000 15,000 111,636 (400,818) 22,853,587
Cabell 476,221 229,037 98,000 72,678 1,525,081 (1,754,089) 91,039,298
Calhoun - 19,199 10,000 13,276 230,383 343,939 13,460,032
Clay - 36,338 25,000 10,000 324,945 (5,204) 16,467,609
Doddridge 45,480 20,480 4,000 15,255 90,922 (3,271) 7,261,496
Fayette 251,544 120,979 51,000 39,112 858,157 (52,458) 49,283,922
Gilmer 41,855 16,670 5,000 10,000 133,817 57,287 7,131,224
Grant - 32,500 11,700 15,000 280,038 386,369 12,090,587
Greenbrier 191,568 93,502 6,000 25,500 525,699 - 36,163,924
Hampshire 128,335 61,722 5,500 19,696 937,278 201,534 24,427,791
Hancock 153,428 73,791 50,000 21,114 562,084 (838,954) 36,005,837
Hardy 85,718 41,226 12,000 14,405 74,955 - 18,582,974
Harrison 402,738 193,695 52,000 50,873 726,953 893,613 73,660,075
Jackson 182,050 268,375 12,500 16,820 535,942 23,341 42,117,368
Jefferson 324,511 156,072 60,000 25,500 200,829 551,975 57,953,029
Kanawha - 496,242 203,700 111,000 4,638,386 (138,330) 182,407,766
Lewis 96,297 46,314 10,000 11,238 244,196 - 19,381,247
Lincoln 136,830 65,808 25,000 12,925 559,552 (42,926) 29,398,582
Logan - 113,374 31,000 25,500 569,591 (91,673) 43,064,299
Marion 296,370 142,538 60,000 31,026 582,510 - 59,960,924
Marshall 171,673 82,565 33,500 29,964 233,200 (61,815) 22,995,586
Mason - 75,180 11,000 46,082 270,236 - 28,606,796
McDowell 129,247 62,160 30,000 121,067 616,278 (15,027) 24,803,381
Mercer 352,478 394,642 26,500 45,381 1,261,570 355,175 75,717,297
Mineral - 74,863 18,300 1,403,408 (25,973) (421,472) 35,081,198
Mingo 162,356 78,084 34,000 87,900 716,280 - 29,059,000
Monongalia 405,211 412,665 40,000 46,000 1,768,462 (494,498) 67,137,363
Monroe 67,730 32,574 - - 161,726 90,020 14,048,322
Morgan 92,530 44,502 5,000 17,210 118,525 213,960 15,355,571
Nicholas 148,040 215,818 15,200 22,500 199,954 5,601 29,786,012
Ohio - 95,884 18,000 24,500 624,065 (22,916) 35,519,016
Pendleton 48,994 17,763 8,075 11,388 156,797 - 16,783,248
Pleasants 46,337 21,927 22,500 10,000 236,148 (697,670) 13,797,655
Pocahontas 51,349 19,958 27,075 14,000 308,941 - 10,412,911
Preston - 80,446 58,500 19,405 548,132 357,619 40,502,058
Putnam 358,286 172,316 33,000 57,415 881,167 (24,189) 73,518,222
Raleigh 456,607 219,603 52,000 43,794 (342,977) (14,784) 86,386,063
Randolph - 75,381 12,075 34,421 855,178 - 32,949,731
Ritchie - 27,201 - 28,659 979,226 (4,934) 11,190,106
Roane 179,912 43,264 10,000 11,541 68,547 44,044 17,828,100
Summers 57,401 27,607 5,500 10,000 204,861 (156,818) 11,810,069
Taylor 88,134 42,388 5,000 13,766 105,692 (280,533) 17,532,515
Tucker 44,429 18,150 - 10,000 131,804 86,591 7,546,044
Tyler 50,521 24,181 2,000 11,951 80,922 (102,387) 10,164,652
Upshur 141,736 68,168 3,075 21,513 621,944 611,711 29,402,526
Wayne 274,672 132,102 84,500 35,500 376,118 - 54,919,882
Webster 54,430 26,178 14,000 10,000 111,052 (30,275) 12,803,597
Wetzel 103,193 49,630 42,000 13,500 130,613 142,669 16,217,805
Wirt 41,615 18,257 5,000 275,762 68,251 (584,589) 9,148,860
Wood 487,409 234,418 32,500 45,500 837,416 1,697,694 95,179,482
Wyoming 157,247 75,628 16,000 21,406 327,473 (1,909,205) 44,011,553
Total 8,019,877 5,727,324 1,486,458 3,190,437 29,715,411 (2,271,628) 2,029,510,441
WVDE - OSF
03/13/15
State Revenues 14
Notes: (1) The source for this schedule was the WVEIS financial data file, so amounts reported above may not agree with related allocation
schedules for the year due to timing differences of when funds were actually distributed and receipted. (2) The amounts reflected as Accrued
(Unearned) adjustments are journal entry adjustments to report receipts as revenue in the year earned, in accordance with Generally Accepted
Accounting Principles.
-58-

COUNTY BOARDS OF EDUCATION
SCHEDULE OF FEDERAL REVENUES RECEIVED
DURING THE 2013-14 YEAR
Elementary and Secondary Act (ESEA) IDEA Carl Perkins Adult
Title I Title II Title IV Title VI (Special Ed Vocational Basic
County Programs Programs Programs Programs Program) Program Programs
Barbour 1,098,365 271,523 42,756 53,870 602,189 37,046 18,699
Berkeley 3,975,970 538,680 - - 2,835,909 306,666 75,263
Boone 1,383,409 321,978 142,645 - 1,185,132 144,477 -
Braxton 746,308 205,159 - 35,658 660,702 45,233 -
Brooke 814,343 222,089 - - 714,173 80,720 24,484
Cabell 5,061,497 869,820 192,470 - 2,892,246 209,447 318,793
Calhoun 472,650 106,942 184,583 - 339,159 43,935 9,324
Clay 814,166 145,707 - - 511,658 33,500 -
Doddridge 592,046 72,426 - 18,602 288,945 16,375 19,492
Fayette 2,541,179 675,786 133,429 101,182 1,540,370 100,906 85,894
Gilmer 309,177 128,929 - 11,744 219,927 8,214 -
Grant 985,928 135,427 66,264 70,963 557,235 60,257 -
Greenbrier 1,513,202 359,000 - 132,280 1,319,115 122,237 94,411
Hampshire 1,824,336 170,861 - 60,498 947,702 82,053 22,105
Hancock 879,860 199,534 - - 1,219,063 82,940 20,909
Hardy 649,820 96,071 - 36,991 474,069 42,554 -
Harrison 2,866,550 344,327 32,990 217,918 2,393,736 108,252 28,461
Jackson 2,344,040 235,017 - 11,599 1,440,466 130,937 46,729
Jefferson 1,228,063 483,182 - - 1,832,931 80,288 125,890
Kanawha 11,629,434 1,916,558 157,297 - 7,421,051 421,466 -
Lewis 233,129 55,879 26,850 - 362,361 7,382 -
Lincoln 2,022,349 294,368 392,995 43,200 886,567 92,320 5,320
Logan 2,446,947 440,829 69,835 244,981 1,524,186 75,014 541
Marion 3,200,900 507,116 191,669 91,210 1,926,230 150,432 141,819
Marshall 1,368,667 364,593 - - 1,353,532 79,811 54,559
Mason 1,394,809 292,468 - 89,864 1,138,571 91,286 14,967
McDowell 5,954,496 690,288 399,698 64,427 1,096,948 122,743 8,611
Mercer 3,358,129 973,052 77,836 170,450 2,283,058 193,032 131,498
Mineral 1,085,738 293,858 - - 842,242 68,877 -
Mingo 1,848,460 286,417 - 93,653 1,622,019 68,965 -
Monongalia 2,350,846 445,765 156,463 - 2,141,759 67,685 282,384
Monroe 811,047 198,297 80,023 44,219 402,459 20,694 43,525
Morgan 464,050 46,531 - - 621,114 25,586 893
Nicholas 1,834,341 396,496 115,255 101,044 1,015,143 106,125 -
Ohio 2,042,571 487,411 160,388 - 1,900,540 157,298 7,736
Pendleton 314,912 66,803 - 16,600 325,435 12,684 -
Pleasants 251,571 65,135 - - 398,237 50,896 -
Pocahontas 385,186 66,353 - 22,224 298,874 29,048 -
Preston 1,192,167 339,403 125,658 - 1,003,546 71,472 -
Putnam 1,258,406 429,342 - - 2,089,420 184,165 -
Raleigh 3,688,530 826,463 - 278,660 3,784,964 175,679 127,941
Randolph 1,363,008 222,331 - 60,933 1,018,183 67,805 69,373
Ritchie 596,055 126,361 165,023 44,232 408,495 26,965 5,923
Roane 1,684,967 225,973 64,844 37,226 510,010 26,960 -
Summers 755,195 245,598 79,940 50,841 387,809 51,764 69,721
Taylor 845,153 185,759 - 28,982 632,724 28,514 35,746
Tucker 249,396 77,597 33,044 6,173 183,292 5,313 10,784
Tyler 413,376 104,700 - 46,024 412,081 21,294 -
Upshur 1,214,704 248,000 - 52,600 832,049 82,708 -
Wayne 2,270,261 495,197 581,627 - 1,819,104 152,871 77,534
Webster 806,330 126,618 75,572 39,437 416,983 8,883 -
Wetzel 877,360 230,416 70,749 56,567 901,674 37,308 3,715
Wirt 298,102 130,341 - 19,772 352,069 25,831 -
Wood 4,566,248 783,422 - - 3,120,843 302,308 77,974
Wyoming 166,852 321,353 - 48,046 397,428 - 4,630
Total 95,344,603 18,589,549 3,819,907 2,502,668 67,805,726 4,847,218 2,065,646
WVDE - OSF
03/13/15
Federal Revenues 14
Notes: (1) The source for this schedule was the WVEIS financial data file, so amounts reported above may not agree with related allocation
schedules due to timing differences of when funds were actually drawdown and receipted, in compliance with the Cash Management Improvement
Act (CMIA). (2) The amounts reflected as Accrued (Unearned) adjustments are journal entry adjustments to report receipts as revenue in the year
earned, in accordance with Generally Accepted Accounting Principles.
-59-

COUNTY BOARDS OF EDUCATION
SCHEDULE OF FEDERAL REVENUES RECEIVED
DURING THE 2013-14 YEAR
Medicaid Child Fed. Payments Other Accrued Total
Reimburse - Nutrition Headstart In Lieu of Federal Unearned Revenues
County ments Program Program Taxes (PILT) Programs Adjustments Federal Prgms.
Barbour 246,874 1,096,318 - 9 1,000 (15,661) 3,452,987
Berkeley 2,451,843 5,861,546 - - 214,128 1,141,524 17,401,528
Boone 640,292 1,893,035 - - 64,003 (690,318) 5,084,653
Braxton 321,293 855,822 581,439 12,871 4,465 289,527 3,758,476
Brooke 720,224 918,949 - - - (133,025) 3,361,957
Cabell 1,886,341 6,009,802 - - 171,829 357,932 17,970,178
Calhoun 52,000 583,240 - - 131,569 (89,591) 1,833,810
Clay 314,288 1,379,100 - - 64,186 221,454 3,484,059
Doddridge 153,388 402,716 - - 1,973 (64,057) 1,501,905
Fayette 461,220 2,623,409 - - 87,671 443,420 8,794,467
Gilmer 229,499 468,902 - - 1,415 74,241 1,452,047
Grant 504,307 726,531 - 24,755 17,045 (698,691) 2,450,023
Greenbrier 856,804 1,571,872 1,229,462 130,046 422,120 (180,834) 7,569,715
Hampshire 785,813 1,319,113 - - 270,060 2,839 5,485,380
Hancock 999,816 1,000,618 - - 3,282 (313,351) 4,092,671
Hardy 306,319 1,018,523 - 68,775 12,763 - 2,705,886
Harrison 1,293,561 3,102,270 - - 155,095 1,003,042 11,546,203
Jackson 465,955 1,845,904 - - 10,726 (738,711) 5,792,661
Jefferson 633,588 2,546,810 - - 25,055 (91,265) 6,864,543
Kanawha 2,251,466 10,925,937 2,914,846 - 269,935 (2,614,480) 35,293,510
Lewis 405,843 943,746 - - 68,211 - 2,103,401
Lincoln 450,325 2,020,314 - - 1,458 26,107 6,235,323
Logan 587,101 2,310,198 - - 12,433 (218,611) 7,493,455
Marion 882,073 1,887,068 - - 141 (1,031,881) 7,946,776
Marshall 983,125 1,935,345 - - (108,372) (12,329) 6,018,930
Mason 242,939 2,141,690 - - 112,250 (162,524) 5,356,318
McDowell 306,694 2,174,764 - - 526,337 (1,142,557) 10,202,449
Mercer 726,474 4,679,216 - 6,884 799,180 (321,847) 13,076,963
Mineral 562,632 1,175,790 855,399 4,522 31,174 186,431 5,106,662
Mingo 381,157 2,472,581 - - 325,988 (160,868) 6,938,370
Monongalia 964,192 2,085,416 2,350,929 - 151,756 346,798 11,343,993
Monroe 104,155 408,747 478,108 26,530 296,903 (11,480) 2,903,227
Morgan 388,644 971,175 - 221 23,856 (71,533) 2,470,537
Nicholas 617,711 1,445,844 - 35,521 28,406 (43,055) 5,652,833
Ohio 1,016,838 1,895,434 - - 141 (1,083,178) 6,585,179
Pendleton 204,295 387,947 - 119,509 - (132,051) 1,316,134
Pleasants 166,737 423,258 - - 1,141 (132,311) 1,224,663
Pocahontas 61,166 427,868 - 408,301 - 106,892 1,805,912
Preston 726,247 1,206,724 - 6,607 (350,173) 5,373 4,327,025
Putnam 656,898 2,414,612 - - 47,962 (80,939) 6,999,866
Raleigh 1,255,213 4,653,716 - - 81,875 204,308 15,077,349
Randolph 543,487 1,800,960 - 231,565 89,075 (17,667) 5,449,052
Ritchie 189,111 542,732 - - - (255,764) 1,849,132
Roane 396,797 906,733 - - 210,604 149,616 4,213,731
Summers 133,889 845,375 - - 27,058 305 2,647,495
Taylor 491,382 789,668 - - 282 22,862 3,061,072
Tucker 121,012 382,952 - 164,294 32,010 - 1,265,866
Tyler 374,070 618,325 - - 12,410 (123,708) 1,878,574
Upshur 1,186,472 1,271,563 - - - 152,484 5,040,580
Wayne 740,593 2,599,068 - - 7,724 (60,809) 8,683,168
Webster 302,703 785,661 - 136,374 28,834 (5,469) 2,721,925
Wetzel 587,429 815,640 - - - (241,572) 3,339,286
Wirt 138,213 501,942 - - 58,950 (116,334) 1,408,887
Wood 1,249,742 3,689,728 - - 118,885 (282,285) 13,626,865
Wyoming 476,528 1,592,572 - - 68,148 2,214,032 5,289,589
Total 34,196,776 101,354,789 8,410,183 1,376,783 4,632,967 (4,389,572) 340,557,246
WVDE - OSF
03/13/15
Federal Revenues 14
Notes: (1) The source for this schedule was the WVEIS financial data file, so amounts reported above may not agree with related allocation
schedules due to timing differences of when funds were actually drawdown and receipted, in compliance with the Cash Management
Improvement Act (CMIA). (2) The amounts reflected as Accrued (Unearned) adjustments are journal entry adjustments to report receipts as
revenue in the year earned, in accordance with Generally Accepted Accounting Principles.
-60-

WEST VIRGINIA DEPARTMENT OF EDUCATION 2014 SOURCE BOOK
Description of Federal Programs
Following is a brief description of each federal program from which the county boards of education in the
State received funding from during the 2013-14 fiscal year. Not every program described is uniquely
listed in the accompanying schedule preceding this description; some of the smaller programs are
included under the other categories.
ELEMENTARY AND SECONDARY EDUCATION ACT (ESEA):
The Elementary and Secondary Education Act was originally passed in 1965 as a part of the “War on
Poverty” and has been reauthorized by Congress multiple times since. It has been the most far-
reaching federal legislation affecting education ever passed by Congress.
The Act emphasizes equal access to education and establishes high standards and accountability. In
addition, the bill aims to shorten the achievement gaps between students by providing each child with
fair and equal opportunities to achieve an exceptional education.
As mandated in the act, the funds are authorized for professional development, supplement
instructional supports, materials and resources to support educational programs, and for the
promotion of parental involvement.
The Act is currently authorized as the No Child Left Behind Act (NCLB). NCLB requires each state to
develop and implement a system for holding all school districts and schools accountable for the
education of students. Reform efforts focus on accountability for results; an emphasis on scientific
research and doing what works; expanded parental options; and expanded local control and flexibility.
Information on Federal Accountability programs including Adequate Yearly Progress (AYP)
measurements and the 2012 ESEA Flexibility Request (also known as the NCLB Waiver) can be
found on the Federal Accountability page.
Programs under the ESEA include:
Title I – Financial Assistance to Local Educational Agencies for the Education of Dis-
advantaged Children
Title I, Part A (Formula Grants) – This program provides financial assistance to local education
agencies (LEAs) and schools with high percentages of children from low-income families to help
ensure that all children meet challenging state academic standards.
There are two types of assistance that can be provided by Title I funds. The first is a “school wide
program” in which schools can dispense resources in a flexible manner. The second is a
“targeted assistance program” which allows schools to identify students who are failing or at risk
of failing.
Federal funds are currently allocated through four statutory formulas that are based primarily on
census poverty estimates. They are:
1. Basic Grants provide funds to LEAs in which the number of children counted in the formula is
at least 10 and exceeds 2% of an LEA’s school-age population;
-61-
WEST VIRGINIA DEPARTMENT OF EDUCATION 2014 SOURCE BOOK
Description of Federal Programs
2. Concentration Grants are allocated to LEAs where the number of formula children exceeds
6,500 or 15% of the total school-age population;
3. Targeted Grants are based on the same data used for Basic and Concentration Grants
except that the data are weighted so that LEAs with higher numbers or higher percentages of
children from low-income families receive more funds;
4. Education Finance Incentive Grants distribute funds to states based on factors that measure:
a. A state’s effort to provide financial support for education compared to its relative wealth
as measured by its per capita income; and,
b. The degree to which education expenditures among LEAs within the state are equalized.
Title I, Part D, Sub-part 1 – Neglected and Delinquent – The purpose of this program is to help
provide education continuity for children in intervention programs who are neglected and/or at risk
of abuse for the prevention of dropouts.
Title I – School Improvement Grants (SIG) – A program that provides grants to SEAs to make
competitive grants to LEAs that demonstrate the greatest need for the funds and the strongest
commitment to use the funds to provide adequate resources in order to raise substantially the
achievement of students in their lowest-performing schools.
Title II, Part A – Teacher and Principal Training and Recruiting Fund – The purpose of this
program is to provide grants to SEAs, LEAs, State agencies for higher education, and eligible
partnerships in order to:
1. Increase student academic achievement through strategies such as improving teacher and
principal quality and increasing the number of highly qualified teachers in the classroom and
highly qualified principals and assistant principals in the schools; and,
2. Hold LEAs and schools accountable for improvements in student academic achievement.
Title III – Part A – English Language Acquisition and Academic Achievement Act - The
purposes of this program include:
1. To help ensure that children who are limited English proficient, including immigrant children and
youth, attain English proficiency, develop high levels of academic attainment in English, and meet
the same challenging State academic content and student academic achievement standards as
all children are expected to meet;
2. To assist SEAs, LEAs, and schools to build their capacities to establish, implement, and sustain
language instruction educational programs for limited English proficient children; and,
3. To promote parental and community participation in language instruction educational programs
for the parents and communities of limited English proficient children.
-62-

WEST VIRGINIA DEPARTMENT OF EDUCATION 2014 SOURCE BOOK
Description of Federal Programs
Title IV, Part B – 21st
Century Learning Centers – This program supports the creation of
opportunities for academic enrichment during non-school hours for children, particularly students who
attend high-poverty and low-performing schools. The program helps students meet state and local
standards in core academic subjects, such as reading and mathematics, offers students enrichment
activities that complement regular academic programs, and offers literacy and other educational
services to the families of participating children.
Title VI, Part B, Sub-part 2 – Rural and Low-Income School Program – The purpose of this
program is to provide financial assistance to rural districts to assist them in meeting their state’s
definition of academic progress. Applicants do not compete, but rather are entitled to funds if they
meet basic eligibility requirements.
INDIVIDUALS WITH DISABILITIES EDUCATION IMPROVEMENT ACT (IDEA):
The Individuals with Disabilities Education Act (IDEA) is a United States federal law that governs how
states and public agencies provide early intervention, special education, and related services to children
with disabilities. It addresses the educational needs of children with disabilities from age 3 to age 21.
The IDEA and its predecessor statute, the Education for All Handicapped Children Act, arose from federal
case law holding the deprivation of free public education to disabled children constitutes a deprivation of
due process.
The Act requires that public schools create an Individualized Education Program (IEP) for each student
who is found to be eligible under both the federal and state eligibility/disability standards. IDEA also
provides very specific requirements to guarantee that a Free Appropriate Public Education (FAPE) is
provided for students with disabilities in the least restrictive environment (LRE). FAPE and LRE are the
protected rights of every eligible child, in all 50 states and U.S. Territories.
CARL D. PERKINS VOCATIONAL AND TECHNICAL EDUCATION ACT (Perkins IV):
The Carl D. Perkins Career and Technical Education Improvement Act supports the development of
academic and career and technical skills among secondary education students and postsecondary
education students who elect to enroll in career and technical education (CTE) programs. The Act
authorized several different programs. These include:
Basic State Grant Program – The largest program authorized under the Act, this program provides
formula grants to states to develop, implement, and improve CTE programs, services, and activities.
The formula awards proportionally larger grants to states with larger populations that are in the age
range traditionally enrolled in high school or within two years of high school graduation and to states
with a lower than average per capital income. Two key requirements for receiving funds under the
Basic State Grants program are offering CTE programs of study and compliance with accountability
requirements. Perkins IV also requires that states and secondary and postsecondary education
providers meet targets on statutorily defined performance measurers or face sanctions;
ADULT BASIC EDUCATION PROGRAM:
This program provides grants to states to fund local programs of adult education and literacy services,
including workplace literacy services; family literacy services; English literacy programs and integrated
-63-
WEST VIRGINIA DEPARTMENT OF EDUCATION 2014 SOURCE BOOK
Description of Federal Programs
English literacy-civics education programs. Participation in these programs is limited to adults and out-of-
school youths age 16 and older who are not enrolled or required to be enrolled in secondary school under
state law.
The USDE provides grants to state eligible agencies that under state law are solely responsible for
administering or supervising statewide policy for adult education and literacy, including such entities as
SEAs, postsecondary agencies, or workforce agencies. These agencies, in turn, fund local projects. The
types of entities that are eligible to apply for funds include: LEAs; community-based organizations of
demonstrated effectiveness; volunteer literacy organizations of demonstrated effectiveness; institutions of
higher education (IHEs); public or private nonprofit agencies, libraries, public housing authorities; other
nonprofit institutions that have the ability to provide literacy services to adults and families; and consortia
of these agencies, organizations, institutions, libraries or authorities.
TEMPORARY ASSISTANCE FOR NEEDY FAMILIES (TANF):
The Temporary Assistance for Needy Families program is a federal welfare benefit program designed to
help needy families achieve self-sufficiency. TANF was created in 1996 by the welfare reform law (P.L.
104-193). States are provided block grants to design and operate programs that accomplish one of the
purposes of the TANF program, which include:
Provide assistance to needy families so that children can be cared for in their own homes;
Reduce the dependency of needy parents by promoting job preparation, work and marriage;
Prevent and reduce the incidence of out-of-wedlock pregnancies;
Encourage the formation and maintenance of two-parent families.
The West Virginia Department of Health and Human Resources (WVDHHR) is the primary recipient of the
TANF funds in West Virginia, which in turn provides an annual grant to the Department of Education to
conduct assessments for TANF recipients to identify barriers that they may have to employment. The
amount for the 2013-14 year was $525,000. The funds are allocated primarily to three Regional
Education Service Agencies (RESAs) and a county board to employ four assessment specialists to
conduct the assessments. The results of the assessments are used to determine appropriate referrals for
educational and employment purposes and physical and mental health services.
STRATEGIC PLANNING IN OCCUPATIONAL KNOWLEDGE AND SUCCESS (SPOKES):
The Strategic Planning in Occupational Knowledge and Success (SPOKES) program was developed in
2003 by the West Virginia Department of Education, Office of Adult Education, in cooperation with
Workforce Development and the Department of Health and Human Services (DHHR) to provide intense
daily activities that address academic and “soft skills” necessary for adults to pursue gainful employment.
The targeted population is limited to eligible TANF recipients referred to the program by the DHHR.
The SPOKES program consists of assessment, a repeating cycle of modules related to job readiness,
work process skills, technology skills, work-related academics, and vocational training in computer
software applications. Participants referred to the program and enrolled in SPOKES classes must have
an identified need for instruction and/or enhancement in one or more of the module areas that prevents
them from obtaining employment or advancing in a job.
-64-

WEST VIRGINIA DEPARTMENT OF EDUCATION 2014 SOURCE BOOK
Description of Federal Programs
The funds are primarily distributed to selected Regional Education Service Agencies (RESAs) and a
county board to conduct the training. Approximately a total of $5.6 million was allocated during FY2014.
In addition to academic and job preparation skills, the SPOKES program emphasizes healthy lifestyle
development through nutrition classes presented by the West Virginia University Extension Office; STD,
HIV/AIDs, and Hepatitis education classes presented by the WV Bureau for Public Health, and parenting
and relationship classes presented by the West Virginia State University Extension Office.
SCHOOL-BASED HEALTH AND RELATED SERVICES - MEDICAID REIMBURSEMENT PROGRAM:
The Medicaid program, which is a Federal-state matching entitlement program to provide medical
assistance for certain low-income individuals, was established in 1965 through Title XIX of the Social
Security Act.
School-Based Health and Related Services is a Medicaid program that is designed to reimburse school
districts for the cost of providing direct school- based health services to Medicaid eligible students and for
the administrative activities expended in support of these direct services. Services are reimbursed
according to cost-based rates established by the Centers for Medicare and Medicaid Services (CMS), an
agency within the US Department of Health and Human Services responsible for the administration of
several key federal health care programs.
In addition to Medicare (the federal health insurance program for seniors), and Medicaid (the federal
needs-based program), CMS oversees the Children’s Health Insurance Program (CHIP), the Health
Insurance Portability and Accountability Act (HIPPA) and the Clinical Laboratory Improvement
Amendments (CLIA), among other services.
School-based health services play an important role in the health care of adolescents and children.
Whether implemented for children with special needs under the Individuals with Disabilities Act (IDEA), or
for routine preventive care, on-going primary care and treatment in the form of a school-based or linked
health clinic, school-centered program are often able to provide medical care efficiently and easily without
extended absences from school. Recognizing the important role school health services can play, the
Medicaid program has been supportive of school-centered health care as an effective method of
providing access to essential medical care to eligible children.
Expenditures for direct school-based services that are within the scope of Medicaid coverage and
furnished to Medicaid eligible children may be claimed as “medical assistance”. Expenditures for
administrative activities in support of these school-based services, including outreach and coordination,
may also be claimed as costs of administering the state Medicaid plan.
Direct services can include: assessments, speech therapy, occupations therapy, physical therapy,
psychology services audiology, counseling, medical, nursing, personal care services, and transportation
provided for the purpose of receiving medical services.
FEDERAL PAYMENTS IN LIEU OF TAXES (PILT):
The federal Payment in Lieu of Taxes (PILT) program, administered by the U.S. Department of the
Interior (DOI), is the most widely applicable program that compensates local governments for the
reduction of property tax bases due to the presence of federally owned land. Eligible federal lands consist
-65-

WEST VIRGINIA DEPARTMENT OF EDUCATION 2014 SOURCE BOOK
Description of Federal Programs
of those in the National Park Service, National Forest System, or Bureau of Land Management, lands in
the National Wildlife Refuge System that have been withdrawn from the public domain; lands dedicated to
the use of federal water resources development projects; dredge disposal areas under jurisdiction of the
U.S. Army Corps of Engineers; certain lands located in the vicinity of Purgatory River Canyon and Pinon
Canyon, Colorado, acquired after December 31, 1981 to expand the Fort Carson military reservation;
lands on which are located semi-active or inactive Army installations used for mobilization and for reserve
component training; and certain lands acquired by DOI or the Department of Agriculture under the
Southern Nevada Public Land Management Act.
The authorized level of PILT payments is calculated under a complex formula, based on five factors that
affect the calculation for each particular county. These include: the number of acres eligible for PILT
payments, the county’s population, payments in prior years from other specified federal land payment
programs, state laws directing payments to a particular government purpose, and the Consumer Price
Index as calculated by the Bureau of Labor Statistics.
Funding for the PILT program has been in doubt for a number of years, but the Emergency Economic
Stabilization Act of 2008 provided for mandatory spending of the full authorized level of funding for five
years – FY2008 through FY2012. The mandatory spending provision has been subsequently extended
for another two years through FY2014 by other appropriation acts.
HEALTHY, HUNGER-FREE KIDS ACT OF 2010:
The Healthy, Hunger-Free Kids Act of 2010 reauthorized funding and sets policy for the United States
Department of Agriculture’s (USDA) core child nutrition programs, which include: the National School
Lunch and Breakfast programs, the Special Supplemental Nutrition Program for Women, Infants and
Children (WIC), the Child and Adult Care Food Program (CACFP), the Summer Food Service Program,
the Afterschool Meal Program, and the Supplemental Nutrition Assistance Program Education (SNAP-
Ed). The purpose of the programs is to fight hunger and obesity by reimbursing organizations such as
schools, child care centers and after-school programs for providing healthy meals to children.
In addition to reauthorizing the funding for these programs, the Act established several new nutritional
standards, increased eligibility access, and established additional program monitoring requirements. The
act amended the National School Lunch Act and the Child Nutrition Act of 1966.
The programs included under the Healthy, Hunger-free Kids Act from which public school receive funds
include:
National School Lunch Program (NSLP) – The National School Lunch Program (NSLP) is a
federally assisted meal program operating in public and nonprofit private schools and residential child
care institutions. It provides nutritionally balanced, low-cost or free lunches to children each school
day. The program was established under the National School Lunch Act in 1946. The majority of the
support provided to schools participating in the program comes in the form of a cash reimbursement
for each meal served. Schools are also entitled to receive commodity foods and additional
commodities as they are available from surplus agricultural stocks;
Child and Adult Care Food Program (CACFP) – The Child and Adult Care Food Program
(CACFP), is a federally assisted meal program operating in for-profit and nonprofit Child care centers,
-66-
WEST VIRGINIA DEPARTMENT OF EDUCATION 2014 SOURCE BOOK
Description of Federal Programs
head start center, family day care homes and in after school programs. It provides nutritionally
balanced, low-cost or free meals to children each day.
School Breakfast Program (SBP) – The School Breakfast Program (SBP) provides cash assistance
to states to operate nonprofit breakfast programs in schools and residential childcare institutions;
Fresh Fruits and Vegetables Program (FFVP) – The purpose of the Fresh Fruits and Vegetables
Program (FFVP) is to introduce school children to a variety of fresh produce that they might not have
the opportunity to sample. FFVP is consistent with and supports the Institute of Medicine’s
recommendations to provide healthier snack choices in schools;
Special Milk Program (SMP) – The Special Milk Program (SMP) provides milk to children in schools
and childcare institutions who do not participate in other Federal meal service programs. The program
reimburses schools for the milk they serve. Schools in the National School Lunch or School Breakfast
programs may also participate in the Special Milk Program to provide milk to children in pre-
kindergarten and kindergarten programs;
Summer Food Service Program (SFSP) - The Summer Food Service Program (SFSP) was
established to ensure that low-income children continue to receive nutritious meals when school is
not in session. Free meals that meet Federal nutrition guidelines are provided to all children 18 years
old and under at approved SFSP sites in areas with significant concentrations of low-income children.
USDA FOODS:
Nationwide, 15 to 20 percent of the food used in the child nutrition program is government commodity,
supplied through a program called USDA Foods, administered by the USDA’s Food and Nutrition Service
(FNS). Originally conceived during the 1930s to help stabilize the farm economy, it was installed in the
National School Lunch Program (NSLP) in 1946 and has been a fixture ever since.
Today, USDA Foods still has the dual purpose of meeting both the economic needs of farmers and the
nutritional needs of children. The foods must be of domestic origin, and nearly 60 percent of the foods
purchased for the Child Nutrition Programs must be determined by USDA to be in surplus at the time of
purchase.
This does not mean that schools are restricted to the excess product the government wants to keep out of
the marketplace. In fact, most of the food that goes to schools through the program, so-called “entitlement
commodity”, is carefully ordered and planned for. A second, much smaller supply of “bonus commodities”
is an offloading of unexpected agricultural surplus. These foods, offered to districts in additional to their
regular entitlement, comprise less than two percent of the total commodity foods distributed to schools.
The amount of entitlement commodities schools are eligible to receive is determined by the number of
lunches served, at a value that varies from year to year, based on an annual adjustment that reflects
changes in the Price Index of Foods used in schools and institutions. The national average minimum
value of donated foods per lunch served was 23.25¢ for the 2013-14 school year.
-67-

This Page Intentionally Left Blank
-68-
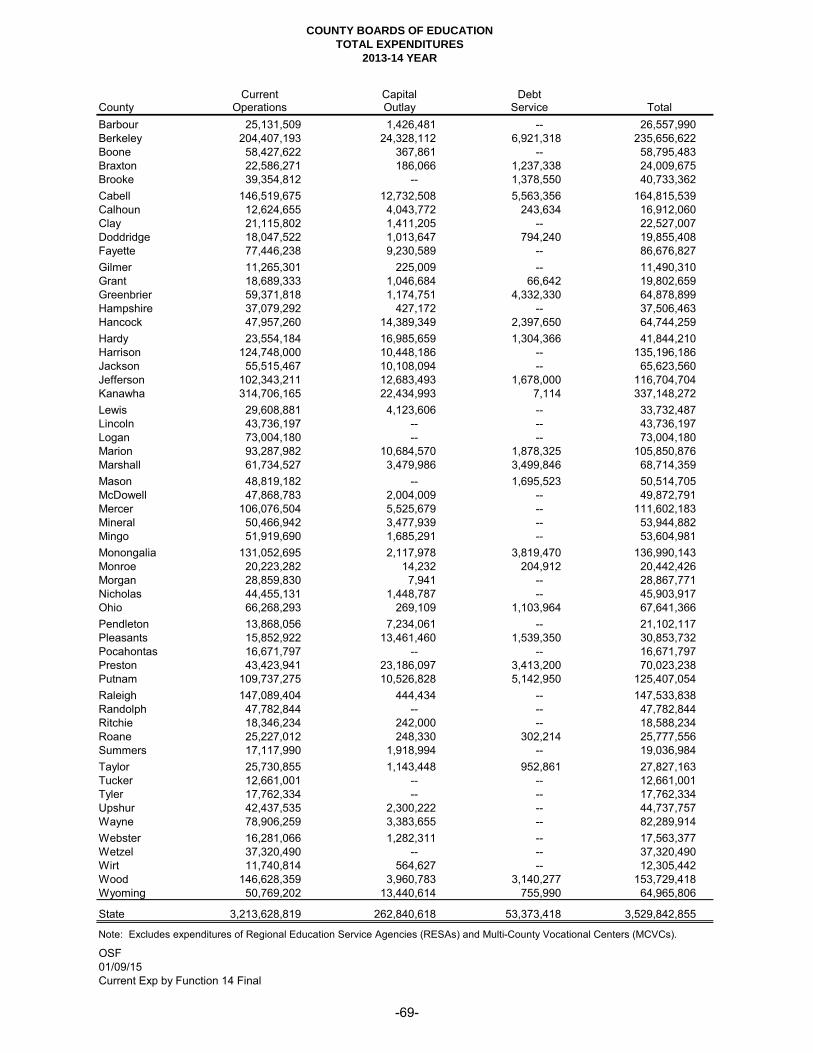
COUNTY BOARDS OF EDUCATION
TOTAL EXPENDITURES
2013-14 YEAR
Current Capital DebtCounty Operations Outlay Service Total
Barbour 25,131,509 1,426,481 -- 26,557,990
Berkeley 204,407,193 24,328,112 6,921,318 235,656,622
Boone 58,427,622 367,861 -- 58,795,483
Braxton 22,586,271 186,066 1,237,338 24,009,675
Brooke 39,354,812 -- 1,378,550 40,733,362
Cabell 146,519,675 12,732,508 5,563,356 164,815,539
Calhoun 12,624,655 4,043,772 243,634 16,912,060
Clay 21,115,802 1,411,205 -- 22,527,007
Doddridge 18,047,522 1,013,647 794,240 19,855,408
Fayette 77,446,238 9,230,589 -- 86,676,827
Gilmer 11,265,301 225,009 -- 11,490,310
Grant 18,689,333 1,046,684 66,642 19,802,659
Greenbrier 59,371,818 1,174,751 4,332,330 64,878,899
Hampshire 37,079,292 427,172 -- 37,506,463
Hancock 47,957,260 14,389,349 2,397,650 64,744,259
Hardy 23,554,184 16,985,659 1,304,366 41,844,210
Harrison 124,748,000 10,448,186 -- 135,196,186
Jackson 55,515,467 10,108,094 -- 65,623,560
Jefferson 102,343,211 12,683,493 1,678,000 116,704,704
Kanawha 314,706,165 22,434,993 7,114 337,148,272
Lewis 29,608,881 4,123,606 -- 33,732,487
Lincoln 43,736,197 -- -- 43,736,197
Logan 73,004,180 -- -- 73,004,180
Marion 93,287,982 10,684,570 1,878,325 105,850,876
Marshall 61,734,527 3,479,986 3,499,846 68,714,359
Mason 48,819,182 -- 1,695,523 50,514,705
McDowell 47,868,783 2,004,009 -- 49,872,791
Mercer 106,076,504 5,525,679 -- 111,602,183
Mineral 50,466,942 3,477,939 -- 53,944,882
Mingo 51,919,690 1,685,291 -- 53,604,981
Monongalia 131,052,695 2,117,978 3,819,470 136,990,143
Monroe 20,223,282 14,232 204,912 20,442,426
Morgan 28,859,830 7,941 -- 28,867,771
Nicholas 44,455,131 1,448,787 -- 45,903,917
Ohio 66,268,293 269,109 1,103,964 67,641,366
Pendleton 13,868,056 7,234,061 -- 21,102,117
Pleasants 15,852,922 13,461,460 1,539,350 30,853,732
Pocahontas 16,671,797 -- -- 16,671,797
Preston 43,423,941 23,186,097 3,413,200 70,023,238
Putnam 109,737,275 10,526,828 5,142,950 125,407,054
Raleigh 147,089,404 444,434 -- 147,533,838
Randolph 47,782,844 -- -- 47,782,844
Ritchie 18,346,234 242,000 -- 18,588,234
Roane 25,227,012 248,330 302,214 25,777,556
Summers 17,117,990 1,918,994 -- 19,036,984
Taylor 25,730,855 1,143,448 952,861 27,827,163
Tucker 12,661,001 -- -- 12,661,001
Tyler 17,762,334 -- -- 17,762,334
Upshur 42,437,535 2,300,222 -- 44,737,757
Wayne 78,906,259 3,383,655 -- 82,289,914
Webster 16,281,066 1,282,311 -- 17,563,377
Wetzel 37,320,490 -- -- 37,320,490
Wirt 11,740,814 564,627 -- 12,305,442
Wood 146,628,359 3,960,783 3,140,277 153,729,418
Wyoming 50,769,202 13,440,614 755,990 64,965,806
State 3,213,628,819 262,840,618 53,373,418 3,529,842,855
OSF
Current Exp by Function 14 Final
Note: Excludes expenditures of Regional Education Service Agencies (RESAs) and Multi-County Vocational Centers (MCVCs).
01/09/15
-69-
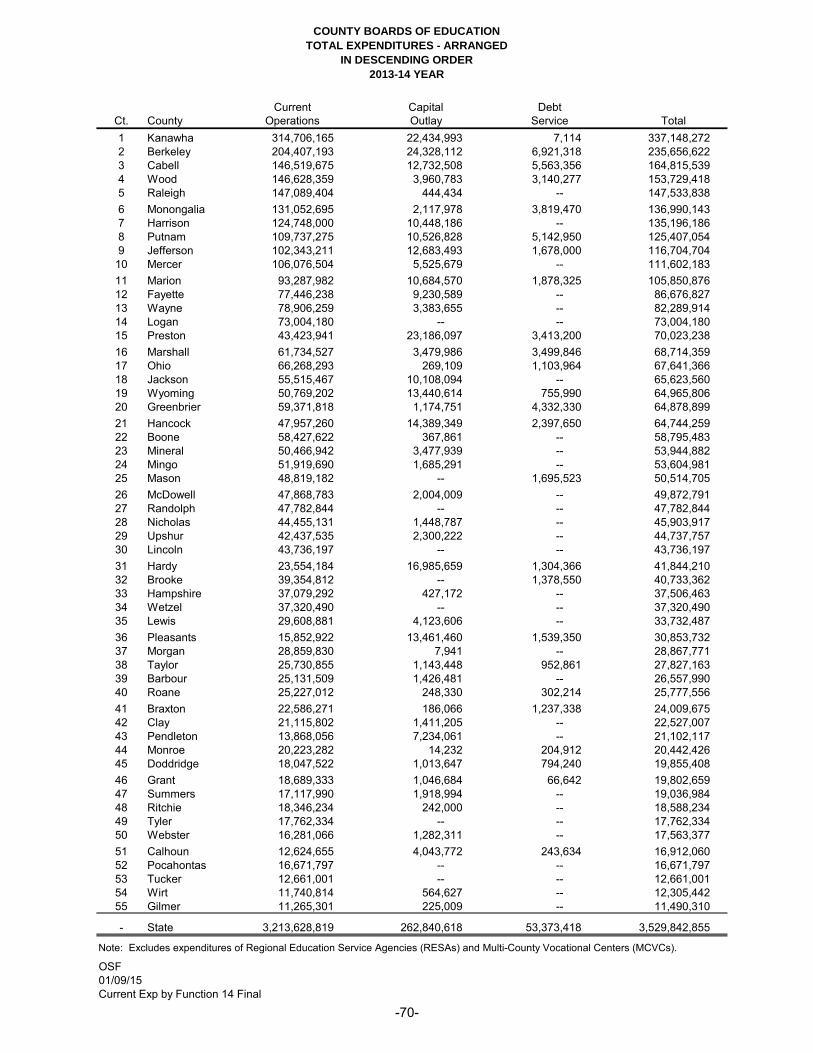
COUNTY BOARDS OF EDUCATION
TOTAL EXPENDITURES - ARRANGED
IN DESCENDING ORDER
2013-14 YEAR
Current Capital Debt
Ct. County Operations Outlay Service Total
1 Kanawha 314,706,165 22,434,993 7,114 337,148,272
2 Berkeley 204,407,193 24,328,112 6,921,318 235,656,622
3 Cabell 146,519,675 12,732,508 5,563,356 164,815,539
4 Wood 146,628,359 3,960,783 3,140,277 153,729,418
5 Raleigh 147,089,404 444,434 -- 147,533,838
6 Monongalia 131,052,695 2,117,978 3,819,470 136,990,143
7 Harrison 124,748,000 10,448,186 -- 135,196,186
8 Putnam 109,737,275 10,526,828 5,142,950 125,407,054
9 Jefferson 102,343,211 12,683,493 1,678,000 116,704,704
10 Mercer 106,076,504 5,525,679 -- 111,602,183
11 Marion 93,287,982 10,684,570 1,878,325 105,850,876
12 Fayette 77,446,238 9,230,589 -- 86,676,827
13 Wayne 78,906,259 3,383,655 -- 82,289,914
14 Logan 73,004,180 -- -- 73,004,180
15 Preston 43,423,941 23,186,097 3,413,200 70,023,238
16 Marshall 61,734,527 3,479,986 3,499,846 68,714,359
17 Ohio 66,268,293 269,109 1,103,964 67,641,366
18 Jackson 55,515,467 10,108,094 -- 65,623,560
19 Wyoming 50,769,202 13,440,614 755,990 64,965,806
20 Greenbrier 59,371,818 1,174,751 4,332,330 64,878,899
21 Hancock 47,957,260 14,389,349 2,397,650 64,744,259
22 Boone 58,427,622 367,861 -- 58,795,483
23 Mineral 50,466,942 3,477,939 -- 53,944,882
24 Mingo 51,919,690 1,685,291 -- 53,604,981
25 Mason 48,819,182 -- 1,695,523 50,514,705
26 McDowell 47,868,783 2,004,009 -- 49,872,791
27 Randolph 47,782,844 -- -- 47,782,844
28 Nicholas 44,455,131 1,448,787 -- 45,903,917
29 Upshur 42,437,535 2,300,222 -- 44,737,757
30 Lincoln 43,736,197 -- -- 43,736,197
31 Hardy 23,554,184 16,985,659 1,304,366 41,844,210
32 Brooke 39,354,812 -- 1,378,550 40,733,362
33 Hampshire 37,079,292 427,172 -- 37,506,463
34 Wetzel 37,320,490 -- -- 37,320,490
35 Lewis 29,608,881 4,123,606 -- 33,732,487
36 Pleasants 15,852,922 13,461,460 1,539,350 30,853,732
37 Morgan 28,859,830 7,941 -- 28,867,771
38 Taylor 25,730,855 1,143,448 952,861 27,827,163
39 Barbour 25,131,509 1,426,481 -- 26,557,990
40 Roane 25,227,012 248,330 302,214 25,777,556
41 Braxton 22,586,271 186,066 1,237,338 24,009,675
42 Clay 21,115,802 1,411,205 -- 22,527,007
43 Pendleton 13,868,056 7,234,061 -- 21,102,117
44 Monroe 20,223,282 14,232 204,912 20,442,426
45 Doddridge 18,047,522 1,013,647 794,240 19,855,408
46 Grant 18,689,333 1,046,684 66,642 19,802,659
47 Summers 17,117,990 1,918,994 -- 19,036,984
48 Ritchie 18,346,234 242,000 -- 18,588,234
49 Tyler 17,762,334 -- -- 17,762,334
50 Webster 16,281,066 1,282,311 -- 17,563,377
51 Calhoun 12,624,655 4,043,772 243,634 16,912,060
52 Pocahontas 16,671,797 -- -- 16,671,797
53 Tucker 12,661,001 -- -- 12,661,001
54 Wirt 11,740,814 564,627 -- 12,305,442
55 Gilmer 11,265,301 225,009 -- 11,490,310
- State 3,213,628,819 262,840,618 53,373,418 3,529,842,855
Current Exp by Function 14 Final
Note: Excludes expenditures of Regional Education Service Agencies (RESAs) and Multi-County Vocational Centers (MCVCs).
01/09/15
OSF
-70-

COUNTY BOARDS OF EDUCATION
EXPENDITURES FOR CURRENT OPERATIONS
CLASSIFIED BY FUNCTION
FOR THE 2013-14 YEAR
Instructional Support Services Total Other Support Services
Instruction Students Instructional Staff Instructional and General Administration
County Amount Pct. Amount Pct. Amount Pct. Instr. Support Pct.
Barbour 14,597,240$ 58.1% 1,127,520$ 4.5% 999,544$ 4.0% 16,724,305$ 66.6%
Berkeley 117,710,926 57.6% 11,700,867 5.7% 7,272,532 3.6% 136,684,325 66.9%
Boone 32,003,729 54.8% 3,050,997 5.2% 1,162,477 2.0% 36,217,202 62.0%
Braxton 13,000,236 57.6% 1,245,820 5.5% 996,970 4.4% 15,243,026 67.5%
Brooke 22,513,396 57.2% 1,979,132 5.0% 1,530,557 3.9% 26,023,085 66.1%
Cabell 86,520,128 59.1% 6,343,127 4.3% 6,265,792 4.3% 99,129,047 67.7%
Calhoun 6,232,861 49.4% 443,462 3.5% 493,398 3.9% 7,169,720 56.8%
Clay 11,521,683 54.6% 861,326 4.1% 1,126,505 5.3% 13,509,514 64.0%
Doddridge 8,922,216 49.4% 620,971 3.4% 953,505 5.3% 10,496,691 58.2%
Fayette 44,374,852 57.3% 3,024,083 3.9% 3,136,862 4.1% 50,535,796 65.3%
Gilmer 5,815,890 51.6% 554,961 4.9% 438,472 3.9% 6,809,323 60.5%
Grant 10,249,035 54.8% 925,878 5.0% 1,037,131 5.6% 12,212,044 65.3%
Greenbrier 36,164,490 60.9% 1,218,681 2.1% 2,180,431 3.7% 39,563,603 66.6%
Hampshire 21,625,707 58.3% 1,924,719 5.2% 1,191,477 3.2% 24,741,904 66.7%
Hancock 27,810,962 58.0% 1,727,145 3.6% 981,995 2.1% 30,520,102 63.6%
Hardy 12,739,100 54.1% 1,388,170 5.9% 1,176,607 5.0% 15,303,878 65.0%
Harrison 72,812,858 58.4% 6,033,597 4.8% 4,281,928 3.4% 83,128,384 66.6%
Jackson 31,592,174 56.9% 3,170,413 5.7% 1,768,519 3.2% 36,531,106 65.8%
Jefferson 58,806,661 57.5% 5,523,216 5.4% 3,666,417 3.6% 67,996,293 66.4%
Kanawha 186,767,349 59.4% 16,220,060 5.2% 7,624,416 2.4% 210,611,824 66.9%
Lewis 16,471,632 55.6% 1,274,603 4.3% 908,127 3.1% 18,654,363 63.0%
Lincoln 24,076,207 55.1% 2,383,008 5.5% 1,696,987 3.9% 28,156,201 64.4%
Logan 40,834,824 55.9% 2,041,109 2.8% 3,939,563 5.4% 46,815,497 64.1%
Marion 53,359,329 57.2% 2,965,518 3.2% 4,945,871 5.3% 61,270,717 65.7%
Marshall 35,266,100 57.1% 2,341,471 3.8% 833,227 1.4% 38,440,798 62.3%
Mason 28,742,562 58.9% 1,928,037 4.0% 2,029,928 4.2% 32,700,527 67.0%
McDowell 23,781,169 49.7% 2,386,307 5.0% 4,504,991 9.4% 30,672,466 64.1%
Mercer 61,112,597 57.6% 4,607,469 4.3% 3,417,783 3.2% 69,137,849 65.2%
Mineral 27,141,413 53.8% 2,866,607 5.7% 1,586,076 3.1% 31,594,096 62.6%
Mingo 28,601,453 55.1% 2,670,758 5.1% 2,059,742 4.0% 33,331,953 64.2%
Monongalia 75,774,430 57.8% 6,614,187 5.1% 3,499,931 2.7% 85,888,548 65.5%
Monroe 11,732,973 58.0% 1,013,054 5.0% 759,230 3.8% 13,505,257 66.8%
Morgan 15,154,029 52.5% 1,559,256 5.4% 1,451,706 5.0% 18,164,990 62.9%
Nicholas 25,994,746 58.5% 1,791,708 4.0% 1,952,812 4.4% 29,739,266 66.9%
Ohio 37,063,937 55.9% 4,015,932 6.1% 1,333,013 2.0% 42,412,882 64.0%
Pendleton 7,164,079 51.7% 674,403 4.9% 641,349 4.6% 8,479,831 61.2%
Pleasants 7,958,346 50.2% 960,747 6.1% 565,506 3.6% 9,484,599 59.8%
Pocahontas 8,319,469 49.9% 705,352 4.2% 548,886 3.3% 9,573,707 57.4%
Preston 26,700,070 61.5% 2,167,812 5.0% 836,976 1.9% 29,704,858 68.4%
Putnam 64,984,622 59.2% 5,203,745 4.7% 3,899,157 3.6% 74,087,524 67.5%
Raleigh 82,891,590 56.4% 7,108,077 4.8% 4,188,748 2.9% 94,188,416 64.0%
Randolph 27,877,733 58.3% 2,448,248 5.1% 1,794,378 3.8% 32,120,360 67.2%
Ritchie 10,259,427 55.9% 568,135 3.1% 336,175 1.8% 11,163,737 60.9%
Roane 14,034,406 55.6% 1,280,538 5.1% 990,643 3.9% 16,305,587 64.6%
Summers 9,258,588 54.1% 779,287 4.6% 602,683 3.5% 10,640,557 62.2%
Taylor 14,477,844 56.3% 1,150,213 4.5% 887,380 3.5% 16,515,438 64.2%
Tucker 7,844,493 62.0% 388,458 3.1% 346,728 2.7% 8,579,679 67.8%
Tyler 9,082,102 51.1% 753,893 4.2% 507,764 2.9% 10,343,759 58.2%
Upshur 23,937,253 56.4% 2,300,156 5.4% 1,205,264 2.8% 27,442,673 64.7%
Wayne 46,510,334 58.9% 2,801,351 3.6% 3,245,014 4.1% 52,556,698 66.6%
Webster 9,560,596 58.7% 688,071 4.2% 392,625 2.4% 10,641,292 65.4%
Wetzel 20,509,956 55.0% 2,186,448 5.9% 1,368,612 3.7% 24,065,016 64.5%
Wirt 6,338,493 54.0% 594,679 5.1% 397,759 3.4% 7,330,931 62.4%
Wood 86,115,139 58.7% 9,448,160 6.4% 7,403,589 5.1% 102,966,888 70.2%
Wyoming 28,968,278 57.1% 1,609,805 3.2% 1,522,425 3.0% 32,100,508 63.2%
Total 1,839,681,710$ 57.3% 153,360,746$ 4.8% 114,886,184$ 3.6% 2,107,928,640$ 65.6%
OSF
01/09/15
Current Exp by Function 14 Final
-71-
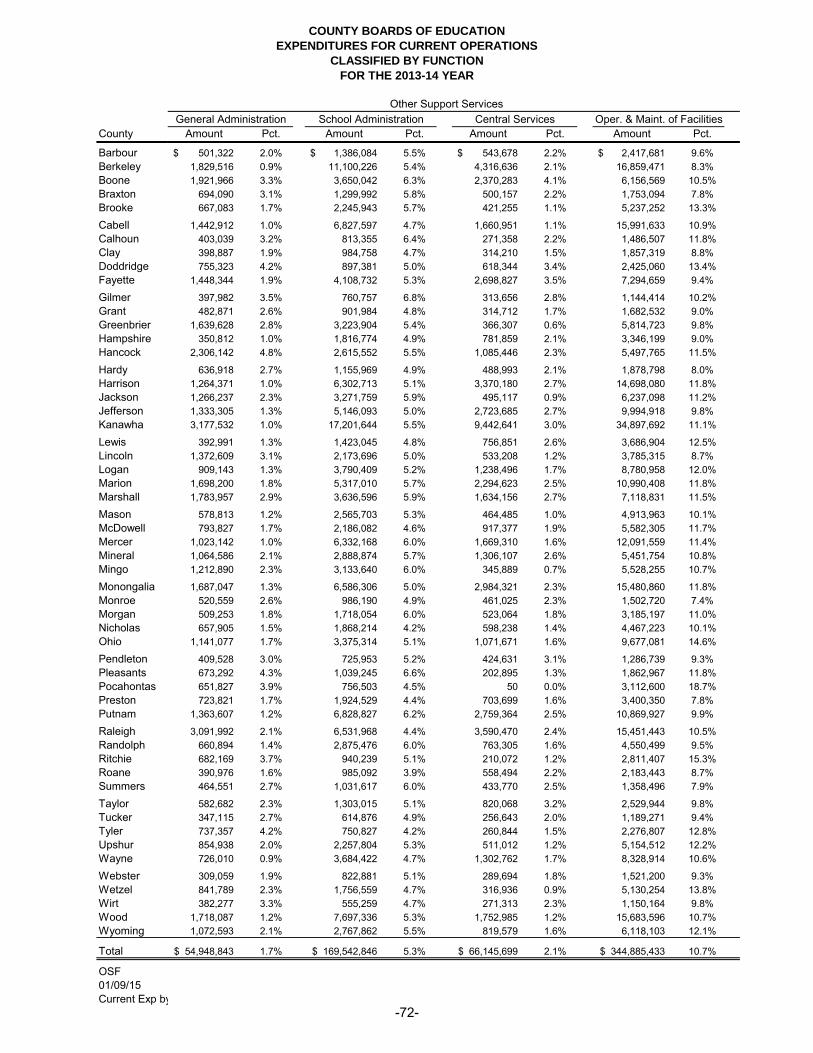
COUNTY BOARDS OF EDUCATION
EXPENDITURES FOR CURRENT OPERATIONS
CLASSIFIED BY FUNCTION
FOR THE 2013-14 YEAR
Instructional Support Services
Instruction
County
Barbour
Berkeley
Boone
Braxton
Brooke
Cabell
Calhoun
Clay
Doddridge
Fayette
Gilmer
Grant
Greenbrier
Hampshire
Hancock
Hardy
Harrison
Jackson
Jefferson
Kanawha
Lewis
Lincoln
Logan
Marion
Marshall
Mason
McDowell
Mercer
Mineral
Mingo
Monongalia
Monroe
Morgan
Nicholas
Ohio
Pendleton
Pleasants
Pocahontas
Preston
Putnam
Raleigh
Randolph
Ritchie
Roane
Summers
Taylor
Tucker
Tyler
Upshur
Wayne
Webster
Wetzel
Wirt
Wood
Wyoming
Total
OSF
01/09/15
Current Exp by Function 14 Final
Other Support Services Other Support Services
General Administration School Administration Central Services Oper. & Maint. of Facilities Student Transportation
Amount Pct. Amount Pct. Amount Pct. Amount Pct.
501,322$ 2.0% 1,386,084$ 5.5% 543,678$ 2.2% 2,417,681$ 9.6%
1,829,516 0.9% 11,100,226 5.4% 4,316,636 2.1% 16,859,471 8.3%
1,921,966 3.3% 3,650,042 6.3% 2,370,283 4.1% 6,156,569 10.5%
694,090 3.1% 1,299,992 5.8% 500,157 2.2% 1,753,094 7.8%
667,083 1.7% 2,245,943 5.7% 421,255 1.1% 5,237,252 13.3%
1,442,912 1.0% 6,827,597 4.7% 1,660,951 1.1% 15,991,633 10.9%
403,039 3.2% 813,355 6.4% 271,358 2.2% 1,486,507 11.8%
398,887 1.9% 984,758 4.7% 314,210 1.5% 1,857,319 8.8%
755,323 4.2% 897,381 5.0% 618,344 3.4% 2,425,060 13.4%
1,448,344 1.9% 4,108,732 5.3% 2,698,827 3.5% 7,294,659 9.4%
397,982 3.5% 760,757 6.8% 313,656 2.8% 1,144,414 10.2%
482,871 2.6% 901,984 4.8% 314,712 1.7% 1,682,532 9.0%
1,639,628 2.8% 3,223,904 5.4% 366,307 0.6% 5,814,723 9.8%
350,812 1.0% 1,816,774 4.9% 781,859 2.1% 3,346,199 9.0%
2,306,142 4.8% 2,615,552 5.5% 1,085,446 2.3% 5,497,765 11.5%
636,918 2.7% 1,155,969 4.9% 488,993 2.1% 1,878,798 8.0%
1,264,371 1.0% 6,302,713 5.1% 3,370,180 2.7% 14,698,080 11.8%
1,266,237 2.3% 3,271,759 5.9% 495,117 0.9% 6,237,098 11.2%
1,333,305 1.3% 5,146,093 5.0% 2,723,685 2.7% 9,994,918 9.8%
3,177,532 1.0% 17,201,644 5.5% 9,442,641 3.0% 34,897,692 11.1%
392,991 1.3% 1,423,045 4.8% 756,851 2.6% 3,686,904 12.5%
1,372,609 3.1% 2,173,696 5.0% 533,208 1.2% 3,785,315 8.7%
909,143 1.3% 3,790,409 5.2% 1,238,496 1.7% 8,780,958 12.0%
1,698,200 1.8% 5,317,010 5.7% 2,294,623 2.5% 10,990,408 11.8%
1,783,957 2.9% 3,636,596 5.9% 1,634,156 2.7% 7,118,831 11.5%
578,813 1.2% 2,565,703 5.3% 464,485 1.0% 4,913,963 10.1%
793,827 1.7% 2,186,082 4.6% 917,377 1.9% 5,582,305 11.7%
1,023,142 1.0% 6,332,168 6.0% 1,669,310 1.6% 12,091,559 11.4%
1,064,586 2.1% 2,888,874 5.7% 1,306,107 2.6% 5,451,754 10.8%
1,212,890 2.3% 3,133,640 6.0% 345,889 0.7% 5,528,255 10.7%
1,687,047 1.3% 6,586,306 5.0% 2,984,321 2.3% 15,480,860 11.8%
520,559 2.6% 986,190 4.9% 461,025 2.3% 1,502,720 7.4%
509,253 1.8% 1,718,054 6.0% 523,064 1.8% 3,185,197 11.0%
657,905 1.5% 1,868,214 4.2% 598,238 1.4% 4,467,223 10.1%
1,141,077 1.7% 3,375,314 5.1% 1,071,671 1.6% 9,677,081 14.6%
409,528 3.0% 725,953 5.2% 424,631 3.1% 1,286,739 9.3%
673,292 4.3% 1,039,245 6.6% 202,895 1.3% 1,862,967 11.8%
651,827 3.9% 756,503 4.5% 50 0.0% 3,112,600 18.7%
723,821 1.7% 1,924,529 4.4% 703,699 1.6% 3,400,350 7.8%
1,363,607 1.2% 6,828,827 6.2% 2,759,364 2.5% 10,869,927 9.9%
3,091,992 2.1% 6,531,968 4.4% 3,590,470 2.4% 15,451,443 10.5%
660,894 1.4% 2,875,476 6.0% 763,305 1.6% 4,550,499 9.5%
682,169 3.7% 940,239 5.1% 210,072 1.2% 2,811,407 15.3%
390,976 1.6% 985,092 3.9% 558,494 2.2% 2,183,443 8.7%
464,551 2.7% 1,031,617 6.0% 433,770 2.5% 1,358,496 7.9%
582,682 2.3% 1,303,015 5.1% 820,068 3.2% 2,529,944 9.8%
347,115 2.7% 614,876 4.9% 256,643 2.0% 1,189,271 9.4%
737,357 4.2% 750,827 4.2% 260,844 1.5% 2,276,807 12.8%
854,938 2.0% 2,257,804 5.3% 511,012 1.2% 5,154,512 12.2%
726,010 0.9% 3,684,422 4.7% 1,302,762 1.7% 8,328,914 10.6%
309,059 1.9% 822,881 5.1% 289,694 1.8% 1,521,200 9.3%
841,789 2.3% 1,756,559 4.7% 316,936 0.9% 5,130,254 13.8%
382,277 3.3% 555,259 4.7% 271,313 2.3% 1,150,164 9.8%
1,718,087 1.2% 7,697,336 5.3% 1,752,985 1.2% 15,683,596 10.7%
1,072,593 2.1% 2,767,862 5.5% 819,579 1.6% 6,118,103 12.1%
54,948,843$ 1.7% 169,542,846$ 5.3% 66,145,699$ 2.1% 344,885,433$ 10.7%
-72-

COUNTY BOARDS OF EDUCATION
EXPENDITURES FOR CURRENT OPERATIONS
CLASSIFIED BY FUNCTION
FOR THE 2013-14 YEAR
Instructional Support Services
Instruction
County
Barbour
Berkeley
Boone
Braxton
Brooke
Cabell
Calhoun
Clay
Doddridge
Fayette
Gilmer
Grant
Greenbrier
Hampshire
Hancock
Hardy
Harrison
Jackson
Jefferson
Kanawha
Lewis
Lincoln
Logan
Marion
Marshall
Mason
McDowell
Mercer
Mineral
Mingo
Monongalia
Monroe
Morgan
Nicholas
Ohio
Pendleton
Pleasants
Pocahontas
Preston
Putnam
Raleigh
Randolph
Ritchie
Roane
Summers
Taylor
Tucker
Tyler
Upshur
Wayne
Webster
Wetzel
Wirt
Wood
Wyoming
Total
OSF
01/09/15
Current Exp by Function 14 Final
Other Support Services
Student Transportation Food Service Operations Community Service Operations Total Expendures
Amount Pct. Amount Pct. Amount Pct. Current Operations
2,157,384$ 8.6% 1,384,771$ 5.5% 16,285$ 0.1% 25,131,509$
19,532,964 9.6% 13,240,055 6.5% 844,000 0.4% 204,407,193
4,712,902 8.1% 3,386,543 5.8% 12,115 0.0% 58,427,622
1,705,050 7.6% 1,362,022 6.0% 28,839 0.1% 22,586,271
2,928,554 7.4% 1,670,467 4.2% 161,174 0.4% 39,354,812
9,698,771 6.6% 9,755,726 6.7% 2,013,039 1.4% 146,519,675
1,617,828 12.8% 833,438 6.6% 29,411 0.2% 12,624,655
2,320,864 11.0% 1,711,775 8.1% 18,474 0.1% 21,115,802
1,755,059 9.7% 1,063,394 5.9% 36,270 0.2% 18,047,522
6,748,369 8.7% 4,474,648 5.8% 136,862 0.2% 77,446,238
1,048,132 9.3% 782,545 7.0% 8,493 0.1% 11,265,301
1,683,049 9.0% 1,410,140 7.6% 2,000 0.0% 18,689,333
5,245,249 8.8% 3,425,702 5.8% 92,702 0.2% 59,371,818
3,990,755 10.8% 2,050,989 5.5% - 0.0% 37,079,292
3,861,921 8.1% 1,996,822 4.2% 73,510 0.2% 47,957,260
2,246,715 9.5% 1,667,395 7.1% 175,519 0.8% 23,554,184
9,247,296 7.4% 6,462,725 5.2% 274,252 0.2% 124,748,000
4,804,389 8.7% 2,817,926 5.1% 91,837 0.2% 55,515,467
9,203,952 9.0% 5,854,964 5.7% 90,000 0.1% 102,343,211
16,169,466 5.1% 19,273,777 6.1% 3,931,590 1.3% 314,706,165
2,769,154 9.4% 1,809,482 6.1% 116,093 0.4% 29,608,881
4,561,332 10.4% 2,744,595 6.3% 409,242 0.9% 43,736,197
6,974,175 9.6% 4,335,579 5.9% 159,923 0.2% 73,004,180
6,901,190 7.4% 4,722,247 5.1% 93,586 0.1% 93,287,982
5,726,239 9.3% 3,341,931 5.4% 52,018 0.1% 61,734,527
4,401,572 9.0% 3,154,120 6.5% 40,000 0.1% 48,819,182
4,484,750 9.4% 3,161,011 6.6% 70,965 0.2% 47,868,783
7,703,827 7.3% 7,839,467 7.4% 279,182 0.3% 106,076,504
4,939,398 9.8% 3,159,113 6.3% 63,014 0.1% 50,466,942
4,822,983 9.3% 3,363,174 6.5% 180,907 0.4% 51,919,690
10,442,049 8.0% 6,797,805 5.2% 1,185,757 0.9% 131,052,695
1,865,944 9.2% 1,200,760 5.9% 180,827 0.9% 20,223,282
2,755,074 9.6% 1,880,705 6.5% 123,492 0.4% 28,859,830
4,213,402 9.5% 2,831,883 6.4% 79,000 0.2% 44,455,131
4,162,770 6.3% 3,853,957 5.8% 573,542 0.9% 66,268,293
1,702,268 12.3% 823,305 5.9% 15,800 0.1% 13,868,056
1,527,211 9.6% 1,028,561 6.5% 34,151 0.2% 15,852,922
1,662,888 10.0% 845,248 5.1% 68,974 0.4% 16,671,797
4,834,638 11.1% 2,130,887 4.9% 1,160 0.0% 43,423,941
7,709,211 7.0% 5,911,068 5.4% 207,748 0.2% 109,737,275
14,315,080 9.7% 9,328,908 6.3% 591,127 0.4% 147,089,404
3,518,689 7.4% 3,242,182 6.8% 51,439 0.1% 47,782,844
1,423,048 7.8% 1,095,725 6.0% 19,837 0.1% 18,346,234
2,880,403 11.4% 1,896,438 7.5% 26,581 0.1% 25,227,012
1,882,737 11.0% 1,201,673 7.0% 104,588 0.6% 17,117,990
2,471,637 9.6% 1,460,404 5.7% 47,668 0.2% 25,730,855
912,519 7.2% 760,898 6.0% - 0.0% 12,661,001
2,347,007 13.2% 1,007,133 5.7% 38,600 0.2% 17,762,334
3,893,974 9.2% 2,199,924 5.2% 122,700 0.3% 42,437,535
7,441,462 9.4% 4,795,729 6.1% 70,263 0.1% 78,906,259
1,736,756 10.7% 945,185 5.8% 15,000 0.1% 16,281,066
3,521,426 9.4% 1,659,351 4.5% 29,160 0.1% 37,320,490
1,203,115 10.3% 844,649 7.2% 3,106 0.0% 11,740,814
8,431,120 5.8% 7,879,113 5.4% 499,234 0.3% 146,628,359
4,299,173 8.5% 3,450,684 6.8% 140,699 0.3% 50,769,202
265,116,888$ 8.3% 191,328,715$ 6.0% 13,731,756$ 0.4% 3,213,628,819$
-73-

This Page Intentionally Left Blank
-74-

COUNTY BOARDS OF EDUCATION
EXPENDITURES BY OBJECT OF EXPENDITURE
FOR CURRENT OPERATIONS
FOR THE 2013-14 YEAR
Expenditures Barbour Berkeley Boone Braxton Brooke Cabell
Salaries:
Professional personnel 9,473,228 81,738,172 22,623,962 9,161,390 14,994,514 54,412,111
Service personnel 2,890,632 26,839,991 7,152,069 2,707,433 4,879,076 16,984,355
Professional substitutes 428,638 2,052,579 1,484,162 306,285 577,211 1,754,672
Service substitutes 155,922 1,554,641 619,812 176,608 316,396 804,768
Temporary part time professional - 604,217 - - - 265,175
Temporary part time service - 6,762 - - 10,935 532,969
Board members 20,320 18,880 40,160 25,600 38,080 39,680
Students 1,184 6,976 - - - 11,378
Total salaries 12,969,924 112,822,218 31,920,165 12,377,316 20,816,212 74,805,108
Employee benefits:
Group insurance 2,478,025 17,795,700 5,299,689 2,260,144 3,462,378 11,926,929
Social security 946,159 8,385,678 2,400,606 899,789 1,526,401 5,542,377
Retirement 3,745,427 26,718,395 7,640,331 3,309,725 5,867,004 20,562,962
Tuition reimbursement 21,433 107,636 73,424 18,067 19,272 52,658
Unemployment compensation 16,339 62,862 6,196 17,228 936 39,357
Workers' compensation 147,952 485,604 395,368 87,396 244,947 750,290
Other employee benefits - 38,271 - - - 23,030
Total employee benefits 7,355,335 53,594,146 15,815,614 6,592,349 11,120,938 38,897,603
Total salaries and employee benefits 20,325,259 166,416,364 47,735,779 18,969,665 31,937,150 113,702,711
Purchased professional & technical services:
Administration - 165,678 - - 37,596 10,000
Professional educators 60,000 2,206,656 43,127 7,874 216,560 3,800,659
Employee training and development 96,764 540,499 244,399 50,251 131,659 895,081
Other professional 184,157 1,901,135 1,231,424 214,161 903,662 1,711,186
Technical 9,671 227,285 20,893 - - -
Total purchased prof.& technical serv. 350,592 5,041,253 1,539,843 272,286 1,289,477 6,416,926
Purchased services-other:
Utilities 62,181 401,008 163,970 65,810 98,208 464,823
Cleaning 127,107 255,420 133,817 48,840 28,999 152,284
Repair & maintenance 223,094 2,415,920 120,379 67,878 172,719 1,051,943
Rentals 36,311 615,469 94,636 30,816 - 39,661
Construction services 7,734 200 - - 220,789 35,543
Student transportation services 10,572 1,610,885 220,806 10,857 17,147 94,248
Insurance 117,126 595,036 372,720 134,154 217,187 656,052
Communications 187,117 728,792 471,864 212,481 368,890 623,454
Advertising 5,388 10,875 5,913 4,871 5,104 76,045
Printing/binding 5,474 5,870 1,273 22,507 - 882
Tuition - 843,876 - 21,511 67,244 159,330
Food services management 12,011 7,031 - 64 1,961 107,731
Travel 68,736 566,917 225,878 132,464 40,386 647,969
Interagency purchased services 211,480 112,500 25,270 1,096 19,921 42,232
Total purchased services-other 1,074,331 8,169,799 1,836,526 753,349 1,258,555 4,152,197
Supplies:
General 460,958 4,490,923 1,686,983 432,868 1,491,976 7,127,649
Energy 713,161 4,498,186 1,106,687 497,242 876,262 2,761,366
Food 637,165 5,517,199 1,459,098 569,257 634,505 5,035,850
Books, periodicals and software 320,315 2,265,313 373,026 216,639 336,465 1,027,859
Technology supplies 492,913 1,247,726 1,272,535 287,251 289,319 3,299,821
Vehicle supplies 338,757 2,720,666 830,103 244,519 764,482 1,613,728
Control Level Equipment - 1,792,173 - - 5,091 33,932
Total supplies 2,963,269 22,532,186 6,728,432 2,247,776 4,398,100 20,900,205
Plant and equipment:
Land - 260,000 - - - 63,968
Buildings - 60,578 - - - -
Equipment 35,410 201,520 57,868 - 112,517 180,824
Bus replacement 280,912 1,633,174 448,185 200,103 355,830 1,000,383
Total plant and equipment 316,322 2,155,272 506,053 200,103 468,347 1,245,175
Other:
Dues and fees 11,532 55,612 25,148 16,692 3,183 102,360
Judgements - - - - - 101
Debt related 86,529 36,207 - 126,400 - -
Taxes - - - - - -
Student Assistance - - - - - -
Miscellaneous - 500 - - - -
Transfers Out 3,675 - 55,841 - - -
Pmts to Escrow Agents for Defeasance of Debt - - - - - -
Special Items - - - - - -
Total other 101,736 92,319 80,989 143,092 3,183 102,461
Total expenditures 25,131,509 204,407,193 58,427,622 22,586,271 39,354,812 146,519,675
Expenditures by Object 14 (Co. Bds) - Current Operations 14
OSF (1/9/2015)
-75-

COUNTY BOARDS OF EDUCATION
EXPENDITURES BY OBJECT OF EXPENDITURE
FOR CURRENT OPERATIONS
FOR THE 2013-14 YEAR
Expenditures
Salaries:
Professional personnel
Service personnel
Professional substitutes
Service substitutes
Temporary part time professional
Temporary part time service
Board members
Students
Total salaries
Employee benefits:
Group insurance
Social security
Retirement
Tuition reimbursement
Unemployment compensation
Workers' compensation
Other employee benefits
Total employee benefits
Total salaries and employee benefits
Purchased professional & technical services:
Administration
Professional educators
Employee training and development
Other professional
Technical
Total purchased prof.& technical serv.
Purchased services-other:
Utilities
Cleaning
Repair & maintenance
Rentals
Construction services
Student transportation services
Insurance
Communications
Advertising
Printing/binding
Tuition
Food services management
Travel
Interagency purchased services
Total purchased services-other
Supplies:
General
Energy
Food
Books, periodicals and software
Technology supplies
Vehicle supplies
Control Level Equipment
Total supplies
Plant and equipment:
Land
Buildings
Equipment
Bus replacement
Total plant and equipment
Other:
Dues and fees
Judgements
Debt related
Taxes
Student Assistance
Miscellaneous
Transfers Out
Pmts to Escrow Agents for Defeasance of Debt
Special Items
Total other
Total expenditures
Expenditures by Object 14 (Co. Bds) - Current Operations 14
OSF (1/9/2015)
Calhoun Clay Doddridge Fayette Gilmer Grant
4,482,563 8,373,423 6,170,802 28,248,089 4,337,034 6,738,112
1,689,193 2,608,957 2,173,481 9,544,626 1,349,124 2,259,770
89,893 226,643 321,788 1,662,349 144,661 531,955
82,348 174,100 132,764 558,350 56,528 123,827
- - 17,525 69,026 19,205 -
- - - 19,895 26,232 36,569
19,680 17,920 31,040 23,840 22,080 15,200
- 4,469 - - - 4,140
6,363,677 11,405,512 8,847,400 40,126,175 5,954,864 9,709,573
1,038,869 2,038,900 1,470,213 7,137,895 917,800 1,687,288
465,656 827,569 646,856 2,962,023 443,901 707,969
1,666,012 3,153,108 2,065,493 10,746,675 1,485,767 2,757,313
17,629 27,991 27,193 24,213 5,971 2,000
1,091 15,470 1,845 51,452 382 35,788
84,424 63,985 102,653 385,607 48,089 105,576
- - (7,192) - - -
3,273,681 6,127,023 4,307,061 21,307,865 2,901,910 5,295,934
9,637,358 17,532,535 13,154,461 61,434,040 8,856,774 15,005,507
- - 16,455 325 - -
3,634 20,426 52,716 52,234 - 206,447
32,744 - 82,394 515,469 1,951 81,272
216,325 168,252 201,299 1,156,453 177,107 212,282
1,000 114,529 - 1,628 - 20,904
253,703 303,207 352,864 1,726,109 179,058 520,905
29,423 61,903 38,507 172,251 23,815 34,945
55,327 33,850 62,005 144,006 66,586 58,133
153,367 - 246,950 742,416 83,538 50,937
10,492 300 50,381 132,124 40,444 49,835
- - 693,274 246,208 - 80,066
66,580 253,644 4,318 17,928 8,189 765
47,140 70,449 63,442 356,122 46,567 72,053
69,680 168,352 125,311 509,362 86,655 121,821
1,007 1,790 2,555 19,397 10,956 4,474
1,353 3,100 11,643 50,706 - -
12,180 - - 43,448 61,747 -
1,127 - - 31,502 - -
65,876 58,929 88,401 213,449 71,267 61,980
- - 377,850 322,076 85,954 85,565
513,552 652,317 1,764,637 3,000,995 585,718 620,574
268,094 451,446 517,968 1,712,439 327,080 302,395
339,197 463,345 314,241 984,625 333,335 522,502
443,130 902,269 335,633 2,053,343 387,222 676,390
111,594 184,354 158,367 892,867 90,628 220,739
288,938 84,634 416,990 2,722,877 136,517 110,387
254,862 481,382 279,876 1,402,659 185,118 232,477
35,382 22 197,426 20,469 11,935 -
1,741,197 2,567,452 2,220,501 9,789,279 1,471,835 2,064,890
14,867 - - - - -
298,642 - - - - -
63,413 10,000 108,040 69,573 6,778 177,302
93,296 - 327,633 475,180 100,855 197,868
470,218 10,000 435,673 544,753 107,633 375,170
6,596 43,380 2,205 21,865 139 34,799
- - - - - 57,500
- - 113,358 928,597 64,144 -
- - - - - -
- - - - - -
- - - 600 - -
2,031 - 3,823 - - 9,988
- 6,911 - - - -
- - - - - -
8,627 50,291 119,386 951,062 64,283 102,287
12,624,655 21,115,802 18,047,522 77,446,238 11,265,301 18,689,333
-76-

COUNTY BOARDS OF EDUCATION
EXPENDITURES BY OBJECT OF EXPENDITURE
FOR CURRENT OPERATIONS
FOR THE 2013-14 YEAR
Expenditures
Salaries:
Professional personnel
Service personnel
Professional substitutes
Service substitutes
Temporary part time professional
Temporary part time service
Board members
Students
Total salaries
Employee benefits:
Group insurance
Social security
Retirement
Tuition reimbursement
Unemployment compensation
Workers' compensation
Other employee benefits
Total employee benefits
Total salaries and employee benefits
Purchased professional & technical services:
Administration
Professional educators
Employee training and development
Other professional
Technical
Total purchased prof.& technical serv.
Purchased services-other:
Utilities
Cleaning
Repair & maintenance
Rentals
Construction services
Student transportation services
Insurance
Communications
Advertising
Printing/binding
Tuition
Food services management
Travel
Interagency purchased services
Total purchased services-other
Supplies:
General
Energy
Food
Books, periodicals and software
Technology supplies
Vehicle supplies
Control Level Equipment
Total supplies
Plant and equipment:
Land
Buildings
Equipment
Bus replacement
Total plant and equipment
Other:
Dues and fees
Judgements
Debt related
Taxes
Student Assistance
Miscellaneous
Transfers Out
Pmts to Escrow Agents for Defeasance of Debt
Special Items
Total other
Total expenditures
Expenditures by Object 14 (Co. Bds) - Current Operations 14
OSF (1/9/2015)
Greenbrier Hampshire Hancock Hardy Harrison Jackson
22,073,766 13,623,572 19,106,493 8,648,724 48,635,006 21,508,780
8,014,599 4,632,206 5,736,444 2,799,850 16,660,669 7,079,832
914,839 480,896 468,051 427,827 1,158,714 934,783
615,798 212,626 309,355 185,589 596,264 366,683
52,449 112,159 81,154 135,957 37,647 23,490
- 26,132 245 - 3,588 84,207
31,040 21,120 39,840 26,560 37,440 24,960
15,426 - - - - 65,148
31,717,917 19,108,711 25,741,582 12,224,507 67,129,328 30,087,883
6,082,511 3,467,399 4,093,918 1,911,499 10,986,026 4,990,367
2,316,819 1,391,927 1,901,540 896,761 4,921,960 2,217,347
8,104,022 5,296,994 6,800,991 3,532,903 17,980,479 8,173,266
31,089 11,369 32,039 5,682 4,391 30,689
7,354 5,048 24,652 5,096 9,341 28,495
268,088 197,011 279,901 134,502 633,932 355,293
- - - - - -
16,809,883 10,369,748 13,133,041 6,486,443 34,536,129 15,795,457
48,527,800 29,478,459 38,874,623 18,710,950 101,665,457 45,883,340
- - 21,937 - - 26,883
8,311 296,276 173,600 242,681 342,014 137,817
6,499 2,200 2,521 46,306 220,696 56,703
1,212,351 221,446 915,816 512,811 767,554 252,020
333,817 - - 19,931 456,907 441,979
1,560,978 519,922 1,113,874 821,729 1,787,171 915,402
170,815 115,478 93,871 40,258 235,561 62,306
55,937 92,963 61,570 89,407 548,884 158,314
205,181 326,844 250,704 352,153 313,815 957,427
25,718 544 188,625 103,802 53,005 65,254
42,915 - 748,151 - 795,439 81,500
17,727 13,450 32,959 8,143 10,270 19,170
275,398 167,694 181,364 108,258 592,792 195,642
261,942 243,079 396,379 113,402 1,093,037 98,553
11,788 5,764 16,118 2,775 8,162 17,115
4,000 - 3,572 9,300 181,688 2,628
1,464 133,195 104,177 433 596,839 -
4,200 - - 20,067 141,265 2,253
238,900 159,778 187,183 69,301 367,987 158,226
41,452 55,337 368,768 173,510 1,372,982 399,025
1,357,437 1,314,126 2,633,441 1,090,809 6,311,726 2,217,413
1,617,056 1,337,631 1,074,701 304,937 3,008,110 1,172,707
1,737,828 882,320 1,188,800 565,800 2,468,127 922,591
1,562,870 987,556 822,584 740,498 2,997,479 1,314,781
419,961 295,063 342,734 241,281 1,473,016 595,465
146,578 506,835 654,043 107,904 1,816,134 361,620
881,700 599,027 720,810 409,958 1,161,967 798,755
640,791 293,082 - 224,273 217,416 806,524
7,006,784 4,901,514 4,803,672 2,594,651 13,142,249 5,972,443
- - - 3,188 - -
- 16,424 - - - -
346,267 147,331 180,130 41,571 681,430 56,050
580,960 442,084 267,855 282,650 726,496 372,344
927,227 605,839 447,985 327,409 1,407,926 428,394
50,714 16,348 38,991 8,636 95,179 9,118
- - - - 1,500 -
(72,124) 241,059 42,442 - 155,113 84,857
- - - - - -
- - - - - -
- - - - - -
13,002 2,025 2,232 - 181,679 4,500
- - - - - -
- - - - - -
(8,408) 259,432 83,665 8,636 433,471 98,475
59,371,818 37,079,292 47,957,260 23,554,184 124,748,000 55,515,467
-77-

COUNTY BOARDS OF EDUCATION
EXPENDITURES BY OBJECT OF EXPENDITURE
FOR CURRENT OPERATIONS
FOR THE 2013-14 YEAR
Expenditures
Salaries:
Professional personnel
Service personnel
Professional substitutes
Service substitutes
Temporary part time professional
Temporary part time service
Board members
Students
Total salaries
Employee benefits:
Group insurance
Social security
Retirement
Tuition reimbursement
Unemployment compensation
Workers' compensation
Other employee benefits
Total employee benefits
Total salaries and employee benefits
Purchased professional & technical services:
Administration
Professional educators
Employee training and development
Other professional
Technical
Total purchased prof.& technical serv.
Purchased services-other:
Utilities
Cleaning
Repair & maintenance
Rentals
Construction services
Student transportation services
Insurance
Communications
Advertising
Printing/binding
Tuition
Food services management
Travel
Interagency purchased services
Total purchased services-other
Supplies:
General
Energy
Food
Books, periodicals and software
Technology supplies
Vehicle supplies
Control Level Equipment
Total supplies
Plant and equipment:
Land
Buildings
Equipment
Bus replacement
Total plant and equipment
Other:
Dues and fees
Judgements
Debt related
Taxes
Student Assistance
Miscellaneous
Transfers Out
Pmts to Escrow Agents for Defeasance of Debt
Special Items
Total other
Total expenditures
Expenditures by Object 14 (Co. Bds) - Current Operations 14
OSF (1/9/2015)
Jefferson Kanawha Lewis Lincoln Logan Marion
38,690,516 123,250,106 11,057,887 15,380,815 26,422,024 34,235,450
13,764,559 37,408,592 4,046,835 5,024,309 9,331,024 12,392,257
2,010,946 3,445,289 451,877 839,781 628,416 1,597,193
948,128 2,648,952 212,055 389,637 315,734 656,340
500 1,397,632 - 79,113 89,779 -
66,321 1,627,858 7,345 28,282 45,126 -
31,040 36,320 27,200 31,520 27,520 25,869
116 13,333 - 4,914 - 135
55,512,126 169,828,082 15,803,199 21,778,371 36,859,623 48,907,244
8,418,497 28,174,636 2,555,406 3,861,562 5,974,826 7,756,234
4,096,134 12,646,037 1,162,610 1,597,048 2,714,190 3,595,199
13,253,772 47,006,525 4,176,702 6,239,797 10,570,264 13,664,592
77,972 57,644 3,363 25,312 10,748 28,032
19,110 92,485 1,234 9,386 22,679 932
390,849 909,535 204,870 504,311 380,416 376,162
- - - 174,394 - -
26,256,334 88,886,862 8,104,185 12,411,810 19,673,123 25,421,151
81,768,460 258,714,944 23,907,384 34,190,181 56,532,746 74,328,395
- 649,452 46,127 - 62,330 66,615
1,100,355 2,193,962 56,257 19,117 572,737 113,249
36,596 121,711 117,375 38,346 69,184 531,016
2,132,395 2,694,930 386,834 907,458 834,765 1,063,729
38,276 103,510 - 209,013 7,284 -
3,307,622 5,763,565 606,593 1,173,934 1,546,300 1,774,609
201,014 1,090,229 87,724 64,203 225,387 186,988
380,888 997,567 93,823 79,468 131,987 218,138
1,402,473 3,409,551 285,185 434,663 328,075 1,822,091
110,164 1,719,206 57,693 104,248 195,447 113,952
484,044 161,490 - 231,979 256,474 9,207
166,129 501,256 2,359 24,831 13,369 43,000
314,594 1,555,153 274,806 242,091 394,271 363,221
612,857 526,364 188,374 260,983 499,316 640,046
5,832 121,117 8,410 14,670 6,377 23,373
9,319 17,326 9,007 36,829 - 47,017
1,295,786 60,594 700 33,622 - -
- 16,515 5,169 - - 5,662
237,823 529,915 93,349 234,844 291,993 194,011
335,971 102,054 13,672 159,141 4,489 268,348
5,556,894 10,808,337 1,120,271 1,921,572 2,347,185 3,935,054
2,208,389 7,170,239 704,123 1,238,301 1,985,864 2,627,344
2,638,438 6,183,946 599,049 726,247 1,823,455 1,705,637
2,267,772 8,997,169 727,159 1,407,947 1,987,117 1,988,037
810,679 3,416,484 275,156 421,739 1,394,004 902,224
1,406,240 7,736,722 542,894 174,623 400,903 2,766,517
1,329,683 2,755,906 463,523 884,400 1,464,750 1,475,360
82,184 41,527 - 667,291 1,435,321 -
10,743,385 36,301,993 3,311,904 5,520,548 10,491,414 11,465,119
- - 73,086 - 64 -
- - 258,074 - 309,225 336,000
84,543 1,076,243 17,156 190,519 965,027 202,454
787,994 1,813,966 301,721 474,976 721,580 779,631
872,537 2,890,209 650,037 665,495 1,995,896 1,318,085
50,346 75,083 12,692 22,039 21,426 54,864
- - - - - -
150 140,728 - 118,638 69,213 411,856
- - - - - -
- - - - - -
1,400 - - - - -
42,417 11,306 - 123,790 - -
- - - - - -
- - - - - -
94,313 227,117 12,692 264,467 90,639 466,720
102,343,211 314,706,165 29,608,881 43,736,197 73,004,180 93,287,982
-78-

COUNTY BOARDS OF EDUCATION
EXPENDITURES BY OBJECT OF EXPENDITURE
FOR CURRENT OPERATIONS
FOR THE 2013-14 YEAR
Expenditures
Salaries:
Professional personnel
Service personnel
Professional substitutes
Service substitutes
Temporary part time professional
Temporary part time service
Board members
Students
Total salaries
Employee benefits:
Group insurance
Social security
Retirement
Tuition reimbursement
Unemployment compensation
Workers' compensation
Other employee benefits
Total employee benefits
Total salaries and employee benefits
Purchased professional & technical services:
Administration
Professional educators
Employee training and development
Other professional
Technical
Total purchased prof.& technical serv.
Purchased services-other:
Utilities
Cleaning
Repair & maintenance
Rentals
Construction services
Student transportation services
Insurance
Communications
Advertising
Printing/binding
Tuition
Food services management
Travel
Interagency purchased services
Total purchased services-other
Supplies:
General
Energy
Food
Books, periodicals and software
Technology supplies
Vehicle supplies
Control Level Equipment
Total supplies
Plant and equipment:
Land
Buildings
Equipment
Bus replacement
Total plant and equipment
Other:
Dues and fees
Judgements
Debt related
Taxes
Student Assistance
Miscellaneous
Transfers Out
Pmts to Escrow Agents for Defeasance of Debt
Special Items
Total other
Total expenditures
Expenditures by Object 14 (Co. Bds) - Current Operations 14
OSF (1/9/2015)
Marshall Mason McDowell Mercer Mineral Mingo
22,347,734 17,735,138 15,331,888 39,619,754 18,556,780 19,190,350
8,129,905 6,211,874 5,896,192 12,359,396 6,408,507 5,979,596
943,905 1,280,028 1,150,368 2,538,094 678,624 1,535,965
575,003 447,775 402,965 1,169,277 278,165 822,198
- 143,865 64,129 62,000 1,720 48,238
- 6,415 25,086 - 148,245 66,950
33,600 37,760 28,000 29,600 29,600 13,120
- - - - 1,675 -
32,030,147 25,862,855 22,898,628 55,778,121 26,103,316 27,656,417
5,745,831 4,441,565 3,155,395 9,459,146 4,537,857 4,897,492
2,403,694 1,930,735 1,720,548 4,126,359 1,919,748 2,062,056
8,253,687 6,643,320 6,238,983 15,724,140 7,762,296 6,967,264
7,144 15,800 87,965 332,750 62,990 14,092
8,959 46,204 53,691 25,249 13,027 147,063
257,143 190,010 310,316 670,346 239,756 347,579
- - - - - -
16,676,458 13,267,634 11,566,898 30,337,990 14,535,674 14,435,546
48,706,605 39,130,489 34,465,526 86,116,111 40,638,990 42,091,963
(4,197) - - 315 9,836 -
28,613 627,844 925,390 679,904 480,347 13,006
325,359 745 534,030 79,078 29,887 84,987
1,063,523 621,178 1,027,652 1,501,181 490,965 486,403
44,612 57,072 29,086 127 350 49,000
1,457,910 1,306,839 2,516,158 2,260,605 1,011,385 633,396
132,991 83,791 176,152 355,520 144,045 210,588
159,675 125,136 107,447 342,299 77,209 99,058
642,531 103,000 250,116 1,361,569 771,900 505,532
7,182 19,392 126,418 549,120 61,978 77,646
329,829 91,574 168,051 1,028,776 99,085 -
32,675 19,271 5,926 21,997 13,117 5,902
223,974 245,094 368,451 469,601 185,981 345,499
331,713 284,407 380,068 372,601 311,206 334,520
26,622 451 9,031 25,546 7,302 10,937
- - 12,739 15,551 22,618 10,099
- 37,912 18,752 100,866 56,733 21,773
- 43,770 20,286 135,830 6,653 23,175
242,522 87,746 441,663 301,203 220,129 228,184
1,014,280 23,175 636,752 300,996 15,235 626,830
3,143,994 1,164,719 2,721,852 5,381,475 1,993,191 2,499,743
1,457,111 1,351,607 1,727,159 1,630,854 1,009,407 838,325
1,220,822 992,514 1,150,488 2,282,940 1,286,800 1,259,640
1,592,942 1,972,427 1,652,267 3,484,029 1,358,763 1,748,624
888,393 401,099 774,139 1,029,451 406,969 476,520
581,954 622,521 1,106,930 162,220 241,843 529,711
781,956 688,489 953,734 1,238,533 898,335 1,114,091
202,352 48 - 1,182,883 325,825 93,414
6,725,530 6,028,705 7,364,717 11,010,910 5,527,942 6,060,325
3,344 - - - - -
334,907 - 7,570 - 1,680 -
325,695 350,908 152,257 366,414 334,815 114,442
745,920 541,249 364,344 754,408 454,575 513,708
1,409,866 892,157 524,171 1,120,822 791,070 628,150
30,983 188,473 22,101 119,914 26,528 4,154
- 107,800 - - 1,117 -
259,639 - 228,586 66,667 476,719 -
- - - - - -
- - - - - -
- - - - - -
- - 25,672 - - 1,959
- - - - - -
- - - - - -
290,622 296,273 276,359 186,581 504,364 6,113
61,734,527 48,819,182 47,868,783 106,076,504 50,466,942 51,919,690
-79-
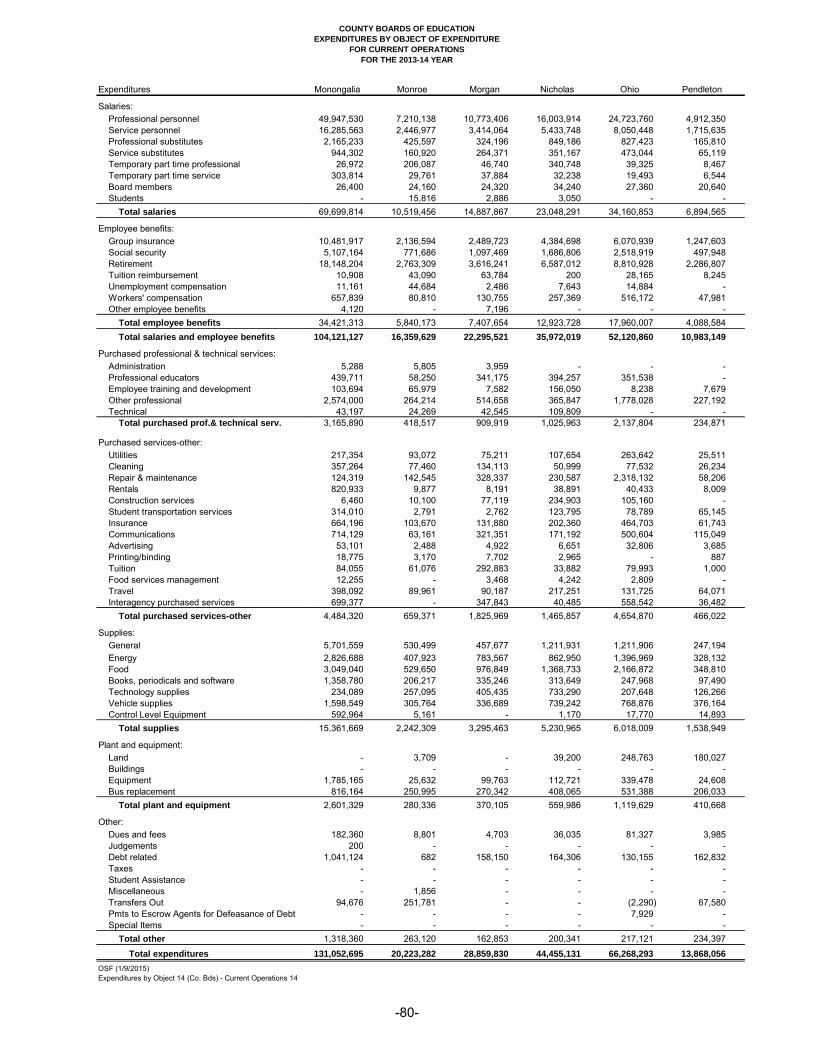
COUNTY BOARDS OF EDUCATION
EXPENDITURES BY OBJECT OF EXPENDITURE
FOR CURRENT OPERATIONS
FOR THE 2013-14 YEAR
Expenditures
Salaries:
Professional personnel
Service personnel
Professional substitutes
Service substitutes
Temporary part time professional
Temporary part time service
Board members
Students
Total salaries
Employee benefits:
Group insurance
Social security
Retirement
Tuition reimbursement
Unemployment compensation
Workers' compensation
Other employee benefits
Total employee benefits
Total salaries and employee benefits
Purchased professional & technical services:
Administration
Professional educators
Employee training and development
Other professional
Technical
Total purchased prof.& technical serv.
Purchased services-other:
Utilities
Cleaning
Repair & maintenance
Rentals
Construction services
Student transportation services
Insurance
Communications
Advertising
Printing/binding
Tuition
Food services management
Travel
Interagency purchased services
Total purchased services-other
Supplies:
General
Energy
Food
Books, periodicals and software
Technology supplies
Vehicle supplies
Control Level Equipment
Total supplies
Plant and equipment:
Land
Buildings
Equipment
Bus replacement
Total plant and equipment
Other:
Dues and fees
Judgements
Debt related
Taxes
Student Assistance
Miscellaneous
Transfers Out
Pmts to Escrow Agents for Defeasance of Debt
Special Items
Total other
Total expenditures
Expenditures by Object 14 (Co. Bds) - Current Operations 14
OSF (1/9/2015)
Monongalia Monroe Morgan Nicholas Ohio Pendleton
49,947,530 7,210,138 10,773,406 16,003,914 24,723,760 4,912,350
16,285,563 2,446,977 3,414,064 5,433,748 8,050,448 1,715,635
2,165,233 425,597 324,196 849,186 827,423 165,810
944,302 160,920 264,371 351,167 473,044 65,119
26,972 206,087 46,740 340,748 39,325 8,467
303,814 29,761 37,884 32,238 19,493 6,544
26,400 24,160 24,320 34,240 27,360 20,640
- 15,816 2,886 3,050 - -
69,699,814 10,519,456 14,887,867 23,048,291 34,160,853 6,894,565
10,481,917 2,136,594 2,489,723 4,384,698 6,070,939 1,247,603
5,107,164 771,686 1,097,469 1,686,806 2,518,919 497,948
18,148,204 2,763,309 3,616,241 6,587,012 8,810,928 2,286,807
10,908 43,090 63,784 200 28,165 8,245
11,161 44,684 2,486 7,643 14,884 -
657,839 80,810 130,755 257,369 516,172 47,981
4,120 - 7,196 - - -
34,421,313 5,840,173 7,407,654 12,923,728 17,960,007 4,088,584
104,121,127 16,359,629 22,295,521 35,972,019 52,120,860 10,983,149
5,288 5,805 3,959 - - -
439,711 58,250 341,175 394,257 351,538 -
103,694 65,979 7,582 156,050 8,238 7,679
2,574,000 264,214 514,658 365,847 1,778,028 227,192
43,197 24,269 42,545 109,809 - -
3,165,890 418,517 909,919 1,025,963 2,137,804 234,871
217,354 93,072 75,211 107,654 263,642 25,511
357,264 77,460 134,113 50,999 77,532 26,234
124,319 142,545 328,337 230,587 2,318,132 58,206
820,933 9,877 8,191 38,891 40,433 8,009
6,460 10,100 77,119 234,903 105,160 -
314,010 2,791 2,762 123,795 78,789 65,145
664,196 103,670 131,880 202,360 464,703 61,743
714,129 63,161 321,351 171,192 500,604 115,049
53,101 2,488 4,922 6,651 32,806 3,685
18,775 3,170 7,702 2,965 - 887
84,055 61,076 292,883 33,882 79,993 1,000
12,255 - 3,468 4,242 2,809 -
398,092 89,961 90,187 217,251 131,725 64,071
699,377 - 347,843 40,485 558,542 36,482
4,484,320 659,371 1,825,969 1,465,857 4,654,870 466,022
5,701,559 530,499 457,677 1,211,931 1,211,906 247,194
2,826,688 407,923 783,567 862,950 1,396,969 328,132
3,049,040 529,650 976,849 1,368,733 2,166,872 348,810
1,358,780 206,217 335,246 313,649 247,968 97,490
234,089 257,095 405,435 733,290 207,648 126,266
1,598,549 305,764 336,689 739,242 768,876 376,164
592,964 5,161 - 1,170 17,770 14,893
15,361,669 2,242,309 3,295,463 5,230,965 6,018,009 1,538,949
- 3,709 - 39,200 248,763 180,027
- - - - - -
1,785,165 25,632 99,763 112,721 339,478 24,608
816,164 250,995 270,342 408,065 531,388 206,033
2,601,329 280,336 370,105 559,986 1,119,629 410,668
182,360 8,801 4,703 36,035 81,327 3,985
200 - - - - -
1,041,124 682 158,150 164,306 130,155 162,832
- - - - - -
- - - - - -
- 1,856 - - - -
94,676 251,781 - - (2,290) 67,580
- - - - 7,929 -
- - - - - -
1,318,360 263,120 162,853 200,341 217,121 234,397
131,052,695 20,223,282 28,859,830 44,455,131 66,268,293 13,868,056
-80-

COUNTY BOARDS OF EDUCATION
EXPENDITURES BY OBJECT OF EXPENDITURE
FOR CURRENT OPERATIONS
FOR THE 2013-14 YEAR
Expenditures
Salaries:
Professional personnel
Service personnel
Professional substitutes
Service substitutes
Temporary part time professional
Temporary part time service
Board members
Students
Total salaries
Employee benefits:
Group insurance
Social security
Retirement
Tuition reimbursement
Unemployment compensation
Workers' compensation
Other employee benefits
Total employee benefits
Total salaries and employee benefits
Purchased professional & technical services:
Administration
Professional educators
Employee training and development
Other professional
Technical
Total purchased prof.& technical serv.
Purchased services-other:
Utilities
Cleaning
Repair & maintenance
Rentals
Construction services
Student transportation services
Insurance
Communications
Advertising
Printing/binding
Tuition
Food services management
Travel
Interagency purchased services
Total purchased services-other
Supplies:
General
Energy
Food
Books, periodicals and software
Technology supplies
Vehicle supplies
Control Level Equipment
Total supplies
Plant and equipment:
Land
Buildings
Equipment
Bus replacement
Total plant and equipment
Other:
Dues and fees
Judgements
Debt related
Taxes
Student Assistance
Miscellaneous
Transfers Out
Pmts to Escrow Agents for Defeasance of Debt
Special Items
Total other
Total expenditures
Expenditures by Object 14 (Co. Bds) - Current Operations 14
OSF (1/9/2015)
Pleasants Pocahontas Preston Putnam Raleigh Randolph
5,821,890 5,559,800 17,248,853 43,831,786 50,957,227 18,664,139
2,335,894 1,906,817 5,058,739 13,338,001 16,566,618 5,064,054
184,945 207,892 755,477 2,307,324 4,062,862 675,641
114,451 128,367 227,244 1,029,244 1,562,422 265,877
- 48,081 5,735 288,771 192,421 5,244
- - 48,512 - 59,494 -
22,080 24,800 14,880 18,400 38,400 29,760
- - 2,291 - - -
8,479,260 7,875,757 23,361,731 60,813,526 73,439,444 24,704,715 -
1,474,771 1,345,530 3,682,654 9,678,808 11,815,978 3,882,575
620,857 578,382 1,710,323 4,458,631 5,437,818 1,807,244
2,242,280 2,356,910 7,429,070 15,947,071 19,704,305 7,763,582
7,080 4,320 25,162 22,945 41,171 27,199
671 2,872 23,614 26,012 33,589 27,652
90,809 66,157 194,621 302,450 855,886 283,151
6,415 - - 623,781 - 1,050
4,442,883 4,354,171 13,065,444 31,059,698 37,888,747 13,792,453 -
12,922,143 12,229,928 36,427,175 91,873,224 111,328,191 38,497,168
85 - - 79,033 3,775 -
51,173 187,889 352,962 1,228,400 423,026 227,791
25,792 5,372 9,646 175,610 166,797 46,922
258,928 268,560 286,998 943,790 1,440,164 587,844
- 13,326 1,887 49,873 480,711 48,751
335,978 475,147 651,493 2,476,706 2,514,473 911,308 -
60,690 31,908 108,991 458,823 309,670 101,438
13,170 27,324 190,700 159,024 200,304 90,990
172,250 48,262 81,323 890,957 1,547,133 130,498
4,450 15,098 46,370 140,851 192,188 11,215
- 52,283 14,203 568,084 1,211,767 627,341
551 8,524 17,884 62,085 142,754 3,047
79,465 113,708 212,614 478,388 702,285 186,762
148,950 87,131 144,412 550,980 708,276 159,486
11,208 1,202,660 7,015 32,416 14,789 8,405
- 1,641 2,552 26,587 14,296 11,651
7,392 15,120 - 16,811 50,433 50,433
697 8,950 1,191 30,503 66,759 -
70,125 107,473 69,139 256,429 266,461 209,094
191,898 - 194,948 37,425 669,283 7,936
760,846 1,720,082 1,091,342 3,709,363 6,096,398 1,598,296 -
310,648 429,720 589,251 2,014,988 3,617,952 1,047,066
348,102 522,398 964,640 1,897,342 3,206,353 1,117,630
405,240 305,480 885,929 2,803,744 4,211,246 1,432,162
142,162 154,926 287,551 988,429 456,345 246,655
303,034 173,496 345,063 363,583 1,798,142 1,135,289
195,124 262,727 934,124 1,129,762 2,756,741 539,644
- 56,953 195,099 1,111,904 422,902 195,332
1,704,310 1,905,700 4,201,657 10,309,752 16,469,681 5,713,778 -
- - 3,332 1,657 - -
- 5,498 - 31,085 4,800 -
12,995 141,692 37,680 322,369 7,993,922 162,993
92,520 183,606 637,767 572,010 1,195,470 452,566
105,515 330,796 678,779 927,121 9,194,192 615,559 -
5,030 6,648 13,788 20,477 26,204 32,059
- - - - 2,874 1,000
- - 358,453 420,632 1,448,351 359,613
- - - - - -
- - - - - -
- - - - - -
- 3,496 1,254 - 9,040 54,063
19,100 - - - - -
- - - - - -
24,130 10,144 373,495 441,109 1,486,469 446,735
15,852,922 16,671,797 43,423,941 109,737,275 147,089,404 47,782,844
-81-

COUNTY BOARDS OF EDUCATION
EXPENDITURES BY OBJECT OF EXPENDITURE
FOR CURRENT OPERATIONS
FOR THE 2013-14 YEAR
Expenditures
Salaries:
Professional personnel
Service personnel
Professional substitutes
Service substitutes
Temporary part time professional
Temporary part time service
Board members
Students
Total salaries
Employee benefits:
Group insurance
Social security
Retirement
Tuition reimbursement
Unemployment compensation
Workers' compensation
Other employee benefits
Total employee benefits
Total salaries and employee benefits
Purchased professional & technical services:
Administration
Professional educators
Employee training and development
Other professional
Technical
Total purchased prof.& technical serv.
Purchased services-other:
Utilities
Cleaning
Repair & maintenance
Rentals
Construction services
Student transportation services
Insurance
Communications
Advertising
Printing/binding
Tuition
Food services management
Travel
Interagency purchased services
Total purchased services-other
Supplies:
General
Energy
Food
Books, periodicals and software
Technology supplies
Vehicle supplies
Control Level Equipment
Total supplies
Plant and equipment:
Land
Buildings
Equipment
Bus replacement
Total plant and equipment
Other:
Dues and fees
Judgements
Debt related
Taxes
Student Assistance
Miscellaneous
Transfers Out
Pmts to Escrow Agents for Defeasance of Debt
Special Items
Total other
Total expenditures
Expenditures by Object 14 (Co. Bds) - Current Operations 14
OSF (1/9/2015)
Ritchie Roane Summers Taylor Tucker Tyler
6,664,277 9,166,210 6,580,588 9,719,788 4,731,282 6,533,969
2,229,529 3,220,638 2,033,416 2,990,669 1,543,037 2,086,793
274,993 536,772 278,609 354,232 137,244 202,556
137,219 180,342 101,151 207,667 79,539 141,641
80,259 - 15,909 31,480 3,206 -
250 20,650 - 14,378 - -
24,000 21,120 27,200 29,160 22,400 25,120
20,079 21,266 - - - 1,000
9,430,606 13,166,998 9,036,873 13,347,374 6,516,708 8,991,079
1,424,555 2,296,014 1,546,010 2,436,159 1,200,994 1,468,288
678,774 965,662 658,654 976,257 479,497 656,099
2,329,945 3,614,639 2,712,771 4,164,503 1,941,210 2,491,428
16,799 26,423 21,309 39,859 6,180 28,823
19,168 12,394 499 8,314 14,139 62
82,410 84,035 125,296 90,972 36,945 72,863
122,381 - - - 1,400 -
4,674,032 6,999,167 5,064,539 7,716,064 3,680,365 4,717,563
14,104,638 20,166,165 14,101,412 21,063,438 10,197,073 13,708,642
- - - - - 500
56,558 93,532 21,514 18,175 1,008 50,048
12,071 412 11,428 16,252 39,411 8,839
1,235,409 518,415 111,471 226,494 203,724 151,270
81,852 - - 6,916 - 93,178
1,385,890 612,359 144,413 267,837 244,143 303,835
37,842 68,544 61,031 62,067 37,427 66,803
29,747 72,305 34,634 40,183 46,546 40,410
54,040 90,631 72,319 338,225 154,125 424,097
17,506 6,352 13,119 8,399 - 20,753
(4,258) 32,500 - 56,220 - 282,772
27,797 74,131 3,176 526 - -
98,624 105,378 68,872 114,406 39,778 106,312
121,101 69,709 44,470 180,934 139,667 79,820
6,621 4,449 3,746 3,772 2,845 1,834
- 1,393 1,668 12,692 - -
72,534 33,622 - 41,254 - 51,815
400 - - 20,584 - -
73,659 84,656 43,599 73,605 70,763 79,406
10,000 110,466 76,421 102,154 - 6,382
545,613 754,136 423,055 1,055,021 491,151 1,160,404
346,431 601,264 217,298 353,883 385,471 539,062
378,702 492,430 354,245 588,447 373,271 445,205
571,366 822,536 656,696 601,430 406,710 547,679
113,786 138,959 198,483 308,265 96,685 183,878
272,459 277,147 109,090 646,870 118,255 246,578
233,209 434,422 368,792 306,538 173,894 396,268
- 488,301 138,322 96,549 52,047 -
1,915,953 3,255,059 2,042,926 2,901,982 1,606,333 2,358,670
- - - - - -
290,284 - 526 - - -
3,750 116,768 82,629 66,990 36,870 28,565
91,964 277,221 182,765 279,921 92,962 185,650
385,998 393,989 265,920 346,911 129,832 214,215
5,092 7,346 10,111 27,809 1,971 (1,453)
- - - - - -
- 32,037 81,070 64,200 - -
- - - - - -
- - - - - -
- - 500 - - -
3,050 5,921 48,583 3,657 (9,502) -
- - - - - 18,021
- - - - - -
8,142 45,304 140,264 95,666 (7,531) 16,568
18,346,234 25,227,012 17,117,990 25,730,855 12,661,001 17,762,334
-82-
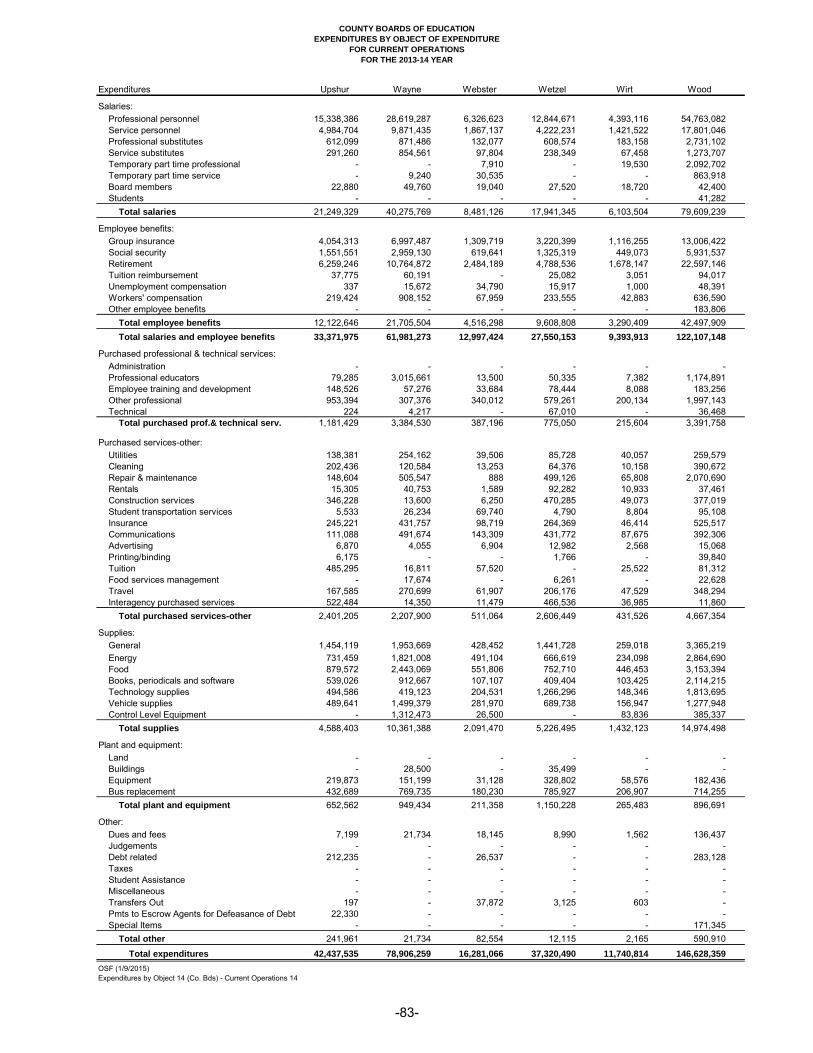
COUNTY BOARDS OF EDUCATION
EXPENDITURES BY OBJECT OF EXPENDITURE
FOR CURRENT OPERATIONS
FOR THE 2013-14 YEAR
Expenditures
Salaries:
Professional personnel
Service personnel
Professional substitutes
Service substitutes
Temporary part time professional
Temporary part time service
Board members
Students
Total salaries
Employee benefits:
Group insurance
Social security
Retirement
Tuition reimbursement
Unemployment compensation
Workers' compensation
Other employee benefits
Total employee benefits
Total salaries and employee benefits
Purchased professional & technical services:
Administration
Professional educators
Employee training and development
Other professional
Technical
Total purchased prof.& technical serv.
Purchased services-other:
Utilities
Cleaning
Repair & maintenance
Rentals
Construction services
Student transportation services
Insurance
Communications
Advertising
Printing/binding
Tuition
Food services management
Travel
Interagency purchased services
Total purchased services-other
Supplies:
General
Energy
Food
Books, periodicals and software
Technology supplies
Vehicle supplies
Control Level Equipment
Total supplies
Plant and equipment:
Land
Buildings
Equipment
Bus replacement
Total plant and equipment
Other:
Dues and fees
Judgements
Debt related
Taxes
Student Assistance
Miscellaneous
Transfers Out
Pmts to Escrow Agents for Defeasance of Debt
Special Items
Total other
Total expenditures
Expenditures by Object 14 (Co. Bds) - Current Operations 14
OSF (1/9/2015)
Upshur Wayne Webster Wetzel Wirt Wood
15,338,386 28,619,287 6,326,623 12,844,671 4,393,116 54,763,082
4,984,704 9,871,435 1,867,137 4,222,231 1,421,522 17,801,046
612,099 871,486 132,077 608,574 183,158 2,731,102
291,260 854,561 97,804 238,349 67,458 1,273,707
- - 7,910 - 19,530 2,092,702
- 9,240 30,535 - - 863,918
22,880 49,760 19,040 27,520 18,720 42,400
- - - - - 41,282
21,249,329 40,275,769 8,481,126 17,941,345 6,103,504 79,609,239
4,054,313 6,997,487 1,309,719 3,220,399 1,116,255 13,006,422
1,551,551 2,959,130 619,641 1,325,319 449,073 5,931,537
6,259,246 10,764,872 2,484,189 4,788,536 1,678,147 22,597,146
37,775 60,191 - 25,082 3,051 94,017
337 15,672 34,790 15,917 1,000 48,391
219,424 908,152 67,959 233,555 42,883 636,590
- - - - - 183,806
12,122,646 21,705,504 4,516,298 9,608,808 3,290,409 42,497,909
33,371,975 61,981,273 12,997,424 27,550,153 9,393,913 122,107,148
- - - - - -
79,285 3,015,661 13,500 50,335 7,382 1,174,891
148,526 57,276 33,684 78,444 8,088 183,256
953,394 307,376 340,012 579,261 200,134 1,997,143
224 4,217 - 67,010 - 36,468
1,181,429 3,384,530 387,196 775,050 215,604 3,391,758
138,381 254,162 39,506 85,728 40,057 259,579
202,436 120,584 13,253 64,376 10,158 390,672
148,604 505,547 888 499,126 65,808 2,070,690
15,305 40,753 1,589 92,282 10,933 37,461
346,228 13,600 6,250 470,285 49,073 377,019
5,533 26,234 69,740 4,790 8,804 95,108
245,221 431,757 98,719 264,369 46,414 525,517
111,088 491,674 143,309 431,772 87,675 392,306
6,870 4,055 6,904 12,982 2,568 15,068
6,175 - - 1,766 - 39,840
485,295 16,811 57,520 - 25,522 81,312
- 17,674 - 6,261 - 22,628
167,585 270,699 61,907 206,176 47,529 348,294
522,484 14,350 11,479 466,536 36,985 11,860
2,401,205 2,207,900 511,064 2,606,449 431,526 4,667,354
1,454,119 1,953,669 428,452 1,441,728 259,018 3,365,219
731,459 1,821,008 491,104 666,619 234,098 2,864,690
879,572 2,443,069 551,806 752,710 446,453 3,153,394
539,026 912,667 107,107 409,404 103,425 2,114,215
494,586 419,123 204,531 1,266,296 148,346 1,813,695
489,641 1,499,379 281,970 689,738 156,947 1,277,948
- 1,312,473 26,500 - 83,836 385,337
4,588,403 10,361,388 2,091,470 5,226,495 1,432,123 14,974,498
- - - - - -
- 28,500 - 35,499 - -
219,873 151,199 31,128 328,802 58,576 182,436
432,689 769,735 180,230 785,927 206,907 714,255
652,562 949,434 211,358 1,150,228 265,483 896,691
7,199 21,734 18,145 8,990 1,562 136,437
- - - - - -
212,235 - 26,537 - - 283,128
- - - - - -
- - - - - -
- - - - - -
197 - 37,872 3,125 603 -
22,330 - - - - -
- - - - - 171,345
241,961 21,734 82,554 12,115 2,165 590,910
42,437,535 78,906,259 16,281,066 37,320,490 11,740,814 146,628,359
-83-

COUNTY BOARDS OF EDUCATION
EXPENDITURES BY OBJECT OF EXPENDITURE
FOR CURRENT OPERATIONS
FOR THE 2013-14 YEAR
Expenditures
Salaries:
Professional personnel
Service personnel
Professional substitutes
Service substitutes
Temporary part time professional
Temporary part time service
Board members
Students
Total salaries
Employee benefits:
Group insurance
Social security
Retirement
Tuition reimbursement
Unemployment compensation
Workers' compensation
Other employee benefits
Total employee benefits
Total salaries and employee benefits
Purchased professional & technical services:
Administration
Professional educators
Employee training and development
Other professional
Technical
Total purchased prof.& technical serv.
Purchased services-other:
Utilities
Cleaning
Repair & maintenance
Rentals
Construction services
Student transportation services
Insurance
Communications
Advertising
Printing/binding
Tuition
Food services management
Travel
Interagency purchased services
Total purchased services-other
Supplies:
General
Energy
Food
Books, periodicals and software
Technology supplies
Vehicle supplies
Control Level Equipment
Total supplies
Plant and equipment:
Land
Buildings
Equipment
Bus replacement
Total plant and equipment
Other:
Dues and fees
Judgements
Debt related
Taxes
Student Assistance
Miscellaneous
Transfers Out
Pmts to Escrow Agents for Defeasance of Debt
Special Items
Total other
Total expenditures
Expenditures by Object 14 (Co. Bds) - Current Operations 14
OSF (1/9/2015)
State Total
Wyoming Amount Percent
18,112,571 1,205,616,826 37.52%
5,704,062 394,548,130 12.28%
1,218,592 52,159,512 1.62%
422,925 25,588,759 0.80%
98,123 6,862,690 0.21%
- 4,245,873 0.13%
28,320 1,507,669 0.05%
- 236,564 0.01%
25,584,593 1,690,766,023 52.61%
4,970,620 281,763,022 8.77%
1,981,730 124,901,867 3.89%
7,955,670 457,546,230 14.24%
39,412 1,917,748 0.06%
16 1,134,918 0.04%
291,540 15,928,535 0.50%
- 1,178,652 0.04%
15,238,988 884,370,972 27.52%
40,823,581 2,575,136,995 80.13%
- 1,207,797 0.04%
16,128 23,336,002 0.73%
75,650 6,428,420 0.20%
612,594 42,317,374 1.32%
78,662 3,369,769 0.10%
783,034 76,659,362 2.39%
136,906 8,435,762 0.26%
211,487 7,668,049 0.24%
895,755 30,444,355 0.95%
- 6,280,821 0.20%
164,274 10,513,711 0.33%
8,809 4,414,275 0.14%
290,904 15,089,977 0.47%
43,479 16,644,351 0.52%
16,224 1,937,849 0.06%
- 638,261 0.02%
- 5,230,945 0.16%
3,978 788,671 0.02%
158,901 10,183,796 0.32%
142,917 11,492,214 0.36%
2,073,634 129,763,037 4.04%
890,438 81,341,087 2.53%
989,241 68,138,804 2.12%
1,492,791 88,071,049 2.74%
685,548 31,509,409 0.98%
351,115 42,966,621 1.34%
903,570 45,125,328 1.40%
487,184 13,994,058 0.44%
5,799,887 371,146,356 11.55%
- 895,205 0.03%
- 2,019,292 0.06%
260,833 19,283,934 0.60%
515,228 26,372,260 0.82%
776,061 48,570,691 1.51%
6,056 1,843,516 0.06%
- 172,092 0.01%
432,024 8,954,307 0.28%
- - 0.00%
- - 0.00%
- 4,856 0.00%
74,925 1,131,971 0.04%
- 74,291 0.00%
- 171,345 0.01%
513,005 12,352,378 0.38%
50,769,202 3,213,628,819 100.00%
-84-

COUNTY BOARDS OF EDUCATION
PROFESSIONAL PERSONNEL SUBSTITUTE SALARY EXPENDITURES AS A PERCENT
OF REGULAR PROFESSIONAL PERSONNEL SALARY EXPENDITURES - ALL FUNDS
FOR THE 2013-14 YEAR
Regular Substitute Percent
Personnel Personnel SubstituteCounty (Object 11) (Object 13) of Regular
Barbour 9,473,229 428,638 4.52%
Berkeley 81,738,173 2,052,579 2.51%
Boone 22,623,962 1,484,162 6.56%
Braxton 9,161,391 306,285 3.34%
Brooke 14,994,514 577,211 3.85%
Cabell 54,412,112 1,754,672 3.22%
Calhoun 4,482,561 89,893 2.01%
Clay 8,373,422 226,643 2.71%
Doddridge 6,170,801 321,788 5.21%
Fayette 28,248,087 1,662,349 5.88%
Gilmer 4,337,034 144,661 3.34%
Grant 6,738,116 531,955 7.89%
Greenbrier 22,073,940 914,839 4.14%
Hampshire 13,623,573 480,896 3.53%
Hancock 19,106,495 468,051 2.45%
Hardy 8,648,719 427,827 4.95%
Harrison 48,635,008 1,158,714 2.38%
Jackson 21,508,778 934,783 4.35%
Jefferson 38,690,515 2,010,946 5.20%
Kanawha 123,250,107 3,445,289 2.80%
Lewis 11,057,883 451,877 4.09%
Lincoln 15,380,815 839,781 5.46%
Logan 26,422,024 628,416 2.38%
Marion 34,235,501 1,597,193 4.67%
Marshall 22,347,734 943,905 4.22%
Mason 17,735,138 1,280,028 7.22%
McDowell 15,331,887 1,150,368 7.50%
Mercer 39,619,754 2,538,094 6.41%
Mineral 18,556,781 678,624 3.66%
Mingo 19,190,354 1,535,965 8.00%
Monongalia 49,947,530 2,165,233 4.34%
Monroe 7,210,139 425,597 5.90%
Morgan 10,773,404 324,196 3.01%
Nicholas 16,003,916 849,186 5.31%
Ohio 24,723,759 827,423 3.35%
Pendleton 4,912,351 165,810 3.38%
Pleasants 5,821,889 184,945 3.18%
Pocahontas 5,559,804 207,892 3.74%
Preston 17,248,853 755,477 4.38%
Putnam 43,831,786 2,307,324 5.26%
Raleigh 50,957,228 4,062,862 7.97%
Randolph 18,664,138 675,641 3.62%
Ritchie 6,664,276 279,798 4.20%
Roane 9,166,214 536,772 5.86%
Summers 6,580,587 278,609 4.23%
Taylor 9,719,791 354,232 3.64%
Tucker 4,731,282 137,244 2.90%
Tyler 6,533,970 202,556 3.10%
Upshur 15,338,387 612,099 3.99%
Wayne 28,619,290 871,486 3.05%
Webster 6,326,627 132,077 2.09%
Wetzel 12,844,672 608,574 4.74%
Wirt 4,393,117 183,158 4.17%
Wood 54,763,082 2,731,102 4.99%
Wyoming 18,112,572 1,218,592 6.73%
Total 1,205,617,074 52,164,315 4.33%
Note: Does not include RESA or MCVC expenditures.
OSF
12/31/14
Salary and Sub Expenditures 14 - SB -85-
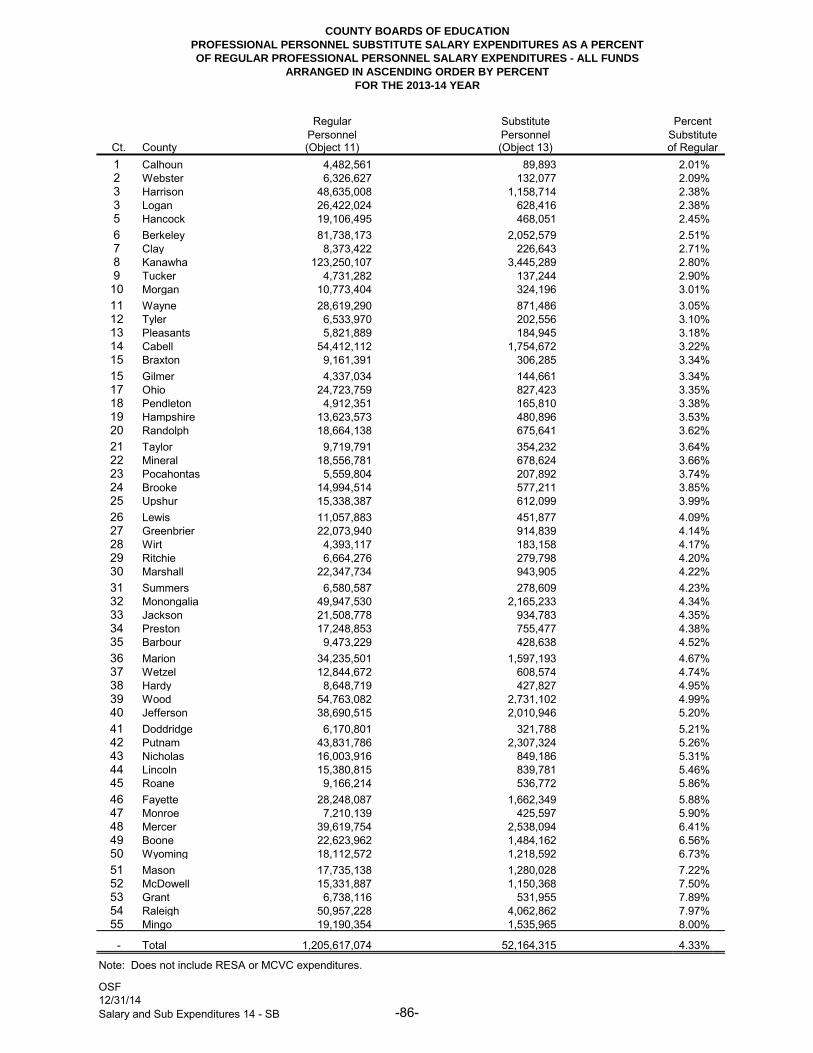
COUNTY BOARDS OF EDUCATION
PROFESSIONAL PERSONNEL SUBSTITUTE SALARY EXPENDITURES AS A PERCENT
OF REGULAR PROFESSIONAL PERSONNEL SALARY EXPENDITURES - ALL FUNDS
ARRANGED IN ASCENDING ORDER BY PERCENT
FOR THE 2013-14 YEAR
Regular Substitute Percent
Personnel Personnel SubstituteCt. County (Object 11) (Object 13) of Regular
1 Calhoun 4,482,561 89,893 2.01%
2 Webster 6,326,627 132,077 2.09%
3 Harrison 48,635,008 1,158,714 2.38%
3 Logan 26,422,024 628,416 2.38%
5 Hancock 19,106,495 468,051 2.45%
6 Berkeley 81,738,173 2,052,579 2.51%
7 Clay 8,373,422 226,643 2.71%
8 Kanawha 123,250,107 3,445,289 2.80%
9 Tucker 4,731,282 137,244 2.90%
10 Morgan 10,773,404 324,196 3.01%
11 Wayne 28,619,290 871,486 3.05%
12 Tyler 6,533,970 202,556 3.10%
13 Pleasants 5,821,889 184,945 3.18%
14 Cabell 54,412,112 1,754,672 3.22%
15 Braxton 9,161,391 306,285 3.34%
15 Gilmer 4,337,034 144,661 3.34%
17 Ohio 24,723,759 827,423 3.35%
18 Pendleton 4,912,351 165,810 3.38%
19 Hampshire 13,623,573 480,896 3.53%
20 Randolph 18,664,138 675,641 3.62%
21 Taylor 9,719,791 354,232 3.64%
22 Mineral 18,556,781 678,624 3.66%
23 Pocahontas 5,559,804 207,892 3.74%
24 Brooke 14,994,514 577,211 3.85%
25 Upshur 15,338,387 612,099 3.99%
26 Lewis 11,057,883 451,877 4.09%
27 Greenbrier 22,073,940 914,839 4.14%
28 Wirt 4,393,117 183,158 4.17%
29 Ritchie 6,664,276 279,798 4.20%
30 Marshall 22,347,734 943,905 4.22%
31 Summers 6,580,587 278,609 4.23%
32 Monongalia 49,947,530 2,165,233 4.34%
33 Jackson 21,508,778 934,783 4.35%
34 Preston 17,248,853 755,477 4.38%
35 Barbour 9,473,229 428,638 4.52%
36 Marion 34,235,501 1,597,193 4.67%
37 Wetzel 12,844,672 608,574 4.74%
38 Hardy 8,648,719 427,827 4.95%
39 Wood 54,763,082 2,731,102 4.99%
40 Jefferson 38,690,515 2,010,946 5.20%
41 Doddridge 6,170,801 321,788 5.21%
42 Putnam 43,831,786 2,307,324 5.26%
43 Nicholas 16,003,916 849,186 5.31%
44 Lincoln 15,380,815 839,781 5.46%
45 Roane 9,166,214 536,772 5.86%
46 Fayette 28,248,087 1,662,349 5.88%
47 Monroe 7,210,139 425,597 5.90%
48 Mercer 39,619,754 2,538,094 6.41%
49 Boone 22,623,962 1,484,162 6.56%
50 Wyoming 18,112,572 1,218,592 6.73%
51 Mason 17,735,138 1,280,028 7.22%
52 McDowell 15,331,887 1,150,368 7.50%
53 Grant 6,738,116 531,955 7.89%
54 Raleigh 50,957,228 4,062,862 7.97%
55 Mingo 19,190,354 1,535,965 8.00%
- Total 1,205,617,074 52,164,315 4.33%
Note: Does not include RESA or MCVC expenditures.
OSF
Salary and Sub Expenditures 14 - SB
12/31/14
-86-

COUNTY BOARDS OF EDUCATION
SERVICE PERSONNEL SUBSTITUTE SALARY EXPENDITURES AS A PERCENT
OF REGULAR SERVICE PERSONNEL SALARY EXPENDITURES - ALL FUNDS
FOR THE 2013-14 YEAR
Regular Substitute Percent
Personnel Personnel SubstituteCounty (Object 12) (Object 14) of Regular
Barbour 2,890,632 155,922 5.39%
Berkeley 26,839,991 1,554,641 5.79%
Boone 7,152,069 619,812 8.67%
Braxton 2,707,433 176,608 6.52%
Brooke 4,879,076 316,396 6.48%
Cabell 16,984,355 804,768 4.74%
Calhoun 1,689,193 82,348 4.87%
Clay 2,608,957 174,100 6.67%
Doddridge 2,173,481 132,764 6.11%
Fayette 9,544,626 558,350 5.85%
Gilmer 1,349,124 56,528 4.19%
Grant 2,259,770 123,827 5.48%
Greenbrier 8,014,599 615,798 7.68%
Hampshire 4,632,206 212,626 4.59%
Hancock 5,736,444 309,355 5.39%
Hardy 2,799,850 185,589 6.63%
Harrison 16,660,669 596,264 3.58%
Jackson 7,079,832 366,683 5.18%
Jefferson 13,764,559 948,128 6.89%
Kanawha 37,408,592 2,648,952 7.08%
Lewis 4,046,835 212,055 5.24%
Lincoln 5,024,309 389,637 7.76%
Logan 9,331,024 315,734 3.38%
Marion 12,393,236 656,340 5.30%
Marshall 8,129,905 575,003 7.07%
Mason 6,211,874 447,775 7.21%
McDowell 5,896,192 402,965 6.83%
Mercer 12,359,396 1,169,277 9.46%
Mineral 6,408,507 278,165 4.34%
Mingo 5,979,596 822,198 13.75%
Monongalia 16,285,563 944,302 5.80%
Monroe 2,446,977 160,920 6.58%
Morgan 3,414,064 264,371 7.74%
Nicholas 5,433,748 351,167 6.46%
Ohio 8,050,448 473,044 5.88%
Pendleton 1,715,635 65,119 3.80%
Pleasants 2,335,894 114,451 4.90%
Pocahontas 1,906,817 128,367 6.73%
Preston 5,058,739 227,244 4.49%
Putnam 13,338,001 1,029,244 7.72%
Raleigh 16,566,618 1,562,422 9.43%
Randolph 5,064,054 265,877 5.25%
Ritchie 2,229,529 137,219 6.15%
Roane 3,220,638 180,342 5.60%
Summers 2,033,416 101,151 4.97%
Taylor 2,990,669 207,667 6.94%
Tucker 1,543,037 79,539 5.15%
Tyler 2,086,793 141,641 6.79%
Upshur 4,984,704 291,260 5.84%
Wayne 9,871,435 854,561 8.66%
Webster 1,867,137 97,804 5.24%
Wetzel 4,222,231 238,349 5.65%
Wirt 1,421,522 67,458 4.75%
Wood 17,801,046 1,273,707 7.16%
Wyoming 5,704,555 422,925 7.41%
Total 394,549,607 25,588,761 6.49%
Note: Does not include RESA or MCVC expenditures.
OSF
12/31/14
Salary and Sub Expenditures 14 - SB -87-

COUNTY BOARDS OF EDUCATION
SERVICE PERSONNEL SUBSTITUTE SALARY EXPENDITURES AS A PERCENT
OF REGULAR SERVICE PERSONNEL SALARY EXPENDITURES - ALL FUNDS
ARRANGED IN ASCENDING ORDER BY PERCENT
FOR THE 2013-14 YEAR
Regular Substitute Percent
Personnel Personnel SubstituteCt. County (Object 12) (Object 14) of Regular
1 Logan 9,331,024 315,734 3.38%
2 Harrison 16,660,669 596,264 3.58%
3 Pendleton 1,715,635 65,119 3.80%
4 Gilmer 1,349,124 56,528 4.19%
5 Mineral 6,408,507 278,165 4.34%
6 Preston 5,058,739 227,244 4.49%
7 Hampshire 4,632,206 212,626 4.59%
8 Cabell 16,984,355 804,768 4.74%
9 Wirt 1,421,522 67,458 4.75%
10 Calhoun 1,689,193 82,348 4.87%
11 Pleasants 2,335,894 114,451 4.90%
12 Summers 2,033,416 101,151 4.97%
13 Tucker 1,543,037 79,539 5.15%
14 Jackson 7,079,832 366,683 5.18%
15 Lewis 4,046,835 212,055 5.24%
15 Webster 1,867,137 97,804 5.24%
17 Randolph 5,064,054 265,877 5.25%
18 Marion 12,393,236 656,340 5.30%
19 Barbour 2,890,632 155,922 5.39%
19 Hancock 5,736,444 309,355 5.39%
21 Grant 2,259,770 123,827 5.48%
22 Roane 3,220,638 180,342 5.60%
23 Wetzel 4,222,231 238,349 5.65%
24 Berkeley 26,839,991 1,554,641 5.79%
25 Monongalia 16,285,563 944,302 5.80%
26 Upshur 4,984,704 291,260 5.84%
27 Fayette 9,544,626 558,350 5.85%
28 Ohio 8,050,448 473,044 5.88%
29 Doddridge 2,173,481 132,764 6.11%
30 Ritchie 2,229,529 137,219 6.15%
31 Nicholas 5,433,748 351,167 6.46%
32 Brooke 4,879,076 316,396 6.48%
33 Braxton 2,707,433 176,608 6.52%
34 Monroe 2,446,977 160,920 6.58%
35 Hardy 2,799,850 185,589 6.63%
36 Clay 2,608,957 174,100 6.67%
37 Pocahontas 1,906,817 128,367 6.73%
38 Tyler 2,086,793 141,641 6.79%
39 McDowell 5,896,192 402,965 6.83%
40 Jefferson 13,764,559 948,128 6.89%
41 Taylor 2,990,669 207,667 6.94%
42 Marshall 8,129,905 575,003 7.07%
43 Kanawha 37,408,592 2,648,952 7.08%
44 Wood 17,801,046 1,273,707 7.16%
45 Mason 6,211,874 447,775 7.21%
46 Wyoming 5,704,555 422,925 7.41%
47 Greenbrier 8,014,599 615,798 7.68%
48 Putnam 13,338,001 1,029,244 7.72%
49 Morgan 3,414,064 264,371 7.74%
50 Lincoln 5,024,309 389,637 7.76%
51 Wayne 9,871,435 854,561 8.66%
52 Boone 7,152,069 619,812 8.67%
53 Raleigh 16,566,618 1,562,422 9.43%
54 Mercer 12,359,396 1,169,277 9.46%
55 Mingo 5,979,596 822,198 13.75%
- Total 394,549,607 25,588,761 6.49%
Note: Does not include RESA or MCVC expenditures.
OSF
12/31/14
Salary and Sub Expenditures 14 - SB -88-

COUNTY BOARDS OF EDUCATION
SCHOOL TRANSPORTATION EXPENDITURES
BY PURPOSE OF EXPENDITURE - ALL FUNDS
FOR THE 2013-14 YEAR
Employee Vehicle
County Salaries Benefits Maintenance Insurance Utilities Supplies
Barbour 834,233$ 559,690$ 4,178$ 87,056$ 20,101$ 338,423$
Berkeley 8,070,201 4,608,242 65,585 459,951 9,823 2,867,318
Boone 1,916,733 1,056,789 50,398 133,534 16,667 782,378
Braxton 659,580 434,542 5,700 80,000 10,389 271,863
Brooke 1,045,905 678,338 2,207 87,948 24,153 668,161
Cabell 4,033,616 2,620,681 53,167 217,016 46,613 1,558,563
Calhoun 656,629 281,641 - 31,602 13,053 256,932
Clay 923,835 583,722 - 67,749 503 457,882
Doddridge 608,628 374,638 36,834 41,228 10,835 304,207
Fayette 2,702,756 1,793,384 50,150 221,174 19,629 1,390,607
Gilmer 451,989 271,190 - - 3,449 185,118
Grant 674,092 481,190 3,243 53,670 13,582 237,559
Greenbrier 2,096,402 1,392,477 - 157,554 17,932 893,478
Hampshire 1,458,838 1,089,491 41,199 118,262 20,306 617,433
Hancock 1,611,446 961,796 93,290 89,903 29,894 734,721
Hardy 797,908 539,728 115,640 69,324 - 402,262
Harrison 4,038,846 2,653,426 78,355 352,111 64,246 1,184,956
Jackson 2,013,119 1,318,651 159,380 109,371 26,003 743,712
Jefferson 4,092,287 2,244,350 100,698 156,511 24,021 1,327,471
Kanawha 6,389,380 3,817,691 77,330 818,000 113,838 2,472,579
Lewis 1,248,291 869,693 9,215 98,111 1,020 483,251
Lincoln 1,539,529 1,128,393 82,957 168,374 6,450 911,774
Logan 2,479,009 1,720,448 67,515 182,528 80,334 1,405,776
Marion 2,571,543 1,676,271 - 172,500 46,942 1,512,374
Marshall 2,446,982 1,534,705 26,870 2,802 17,177 849,339
Mason 1,843,660 1,049,539 8,600 183,119 12,241 709,859
McDowell 1,739,978 1,081,283 - 183,127 32,506 884,825
Mercer 3,024,028 1,926,790 465,707 188,473 - 1,243,558
Mineral 1,833,241 1,309,960 14,677 139,923 25,442 1,002,038
Mingo 1,829,046 1,144,614 13,900 156,000 415 1,125,942
Monongalia 4,571,984 2,578,044 49,539 144,221 61,940 1,596,114
Monroe 805,695 382,235 - 91,002 - 284,747
Morgan 1,133,162 676,947 10,653 64,456 2,185 342,720
Nicholas 1,579,269 988,422 43,608 134,178 14,581 755,090
Ohio 1,643,895 926,758 7,039 67,525 - 783,197
Pendleton 554,971 430,354 165 47,379 20,162 359,299
Pleasants 683,294 439,828 30,926 35,672 20,181 186,467
Pocahontas 655,419 432,503 5,859 61,653 9,846 283,933
Preston 1,827,703 1,262,278 1,534 49,231 10,200 957,808
Putnam 3,413,451 1,996,310 107,717 365,996 - 1,142,980
Raleigh 5,816,403 3,865,435 48,235 167,285 71,856 2,633,335
Randolph 1,265,626 850,983 1,089 160,231 15,394 544,670
Ritchie 621,364 357,179 - 50,424 8,986 232,726
Roane 1,092,196 843,310 6,121 56,994 15,520 433,088
Summers 771,251 520,020 30,403 28,311 15,088 289,317
Taylor 1,004,417 669,979 44,419 90,062 9,228 312,196
Tucker 375,522 175,419 30,584 38,811 7,662 179,720
Tyler 923,098 604,277 65,825 65,385 11,892 444,525
Upshur 1,556,466 1,112,616 1,235 132,947 10,680 531,982
Wayne 2,747,614 1,930,859 12,280 321,647 14,969 1,513,038
Webster 622,421 441,054 - 75,697 24,756 286,643
Wetzel 1,114,239 640,651 900 50,543 11,369 677,643
Wirt 442,131 312,911 18,597 40,652 4,202 161,454
Wood 3,494,136 2,057,381 7,205 372,103 81,881 1,493,882
Wyoming 1,633,561 1,060,794 - 62,376 - 908,230
Total 105,981,018$ 66,759,900$ 2,150,728$ 7,601,702$ 1,150,142$ 45,159,163$
OSF
3/30/2015
Trans Expenditures 14 -89-

COUNTY BOARDS OF EDUCATION
SCHOOL TRANSPORTATION EXPENDITURES
BY PURPOSE OF EXPENDITURE - ALL FUNDS
FOR THE 2013-14 YEAR
County
Barbour
Berkeley
Boone
Braxton
Brooke
Cabell
Calhoun
Clay
Doddridge
Fayette
Gilmer
Grant
Greenbrier
Hampshire
Hancock
Hardy
Harrison
Jackson
Jefferson
Kanawha
Lewis
Lincoln
Logan
Marion
Marshall
Mason
McDowell
Mercer
Mineral
Mingo
Monongalia
Monroe
Morgan
Nicholas
Ohio
Pendleton
Pleasants
Pocahontas
Preston
Putnam
Raleigh
Randolph
Ritchie
Roane
Summers
Taylor
Tucker
Tyler
Upshur
Wayne
Webster
Wetzel
Wirt
Wood
Wyoming
Total
OSF
3/30/2015
Trans Expenditures 14
Other
Bus Contract Purchased
Replacement Equipment Transportation Services Other Total
10,708$ -$ -$ 8,026$ 1,132$ 1,863,547$
- - 1,570,165 158,235 7,278 17,816,798
86,847 - 201,639 32,154 12,288 4,289,427
- - 10,857 12,462 2,178 1,487,571
134,393 - 17,147 25,370 261 2,683,883
14,879 - 88,914 36,553 10,480 8,680,482
- - 64,427 26,714 2,279 1,333,277
- - 200,137 12,418 1,448 2,247,694
24,998 - 4,318 7,944 1,524 1,415,154
- - 3,449 56,257 2,878 6,240,284
- - 5,163 793 2,108 919,810
- - 569 21,217 6,361 1,491,483
- 5,199 17,727 35,754 13,312 4,629,835
- - 10,800 28,098 7,236 3,391,663
- - 25,769 37,743 5,000 3,589,562
- - 8,143 22,597 2,028 1,957,630
56,306 - 10,191 92,839 4,963 8,536,239
- - 16,200 23,511 4,322 4,414,269
- - 166,129 74,134 13,811 8,199,412
178,386 104,472 385,395 58,981 19,038 14,435,090
- - 2,075 27,611 12,692 2,751,959
- 45,113 13,961 51,612 971 3,949,134
91,792 8,660 13,369 114,504 27,870 6,191,805
19,446 - 43,000 30,947 2,733 6,075,756
184,385 33,497 25,526 53,040 6,935 5,181,258
11,323 - 358 42,543 2,986 3,864,228
- 29,999 2,480 30,778 18,521 4,003,497
- - 21,997 57,306 6,910 6,934,769
- - 11,733 52,455 2,961 4,392,430
- - 5,902 23,910 1,066 4,300,795
- 99,732 267,792 79,502 7,750 9,456,618
- - 2,791 8,340 5,943 1,580,753
- 9,532 615 142,569 6,025 2,388,864
- 41,581 120,906 85,404 8,494 3,771,533
33,448 - 66,491 115,772 5,822 3,649,947
- 2,800 65,145 12,661 - 1,492,936
- - 551 22,658 2,721 1,422,298
- - 8,524 13,567 6,659 1,477,963
- - 8,444 50,678 4,702 4,172,578
- - 62,085 15,744 1,700 7,105,983
100,000 258,308 141,954 36,771 12,785 13,152,367
- 33,990 3,047 45,258 21,677 2,941,965
- - 27,797 4,923 5,648 1,309,047
- - 57,151 30,000 3,699 2,538,079
- 7,361 1,965 15,611 447 1,679,774
9,839 7,000 264 19,614 5,488 2,172,506
- - - 8,281 250 816,249
2,551 - - 38,295 3,326 2,159,174
758 26,034 1,854 21,669 1,464 3,397,705
12,499 8,995 26,234 63,470 3,012 6,654,617
- - 63,256 13,582 1,744 1,529,153
541,554 101,154 924 40,230 10,141 3,189,348
- - - 4,343 71 984,361
29,588 25,062 28,223 92,009 31,002 7,712,472
- 13,202 4,709 28,862 2,471 3,714,205
1,543,700$ 861,691$ 3,908,260$ 2,266,319$ 356,611$ 237,739,234$
-90-
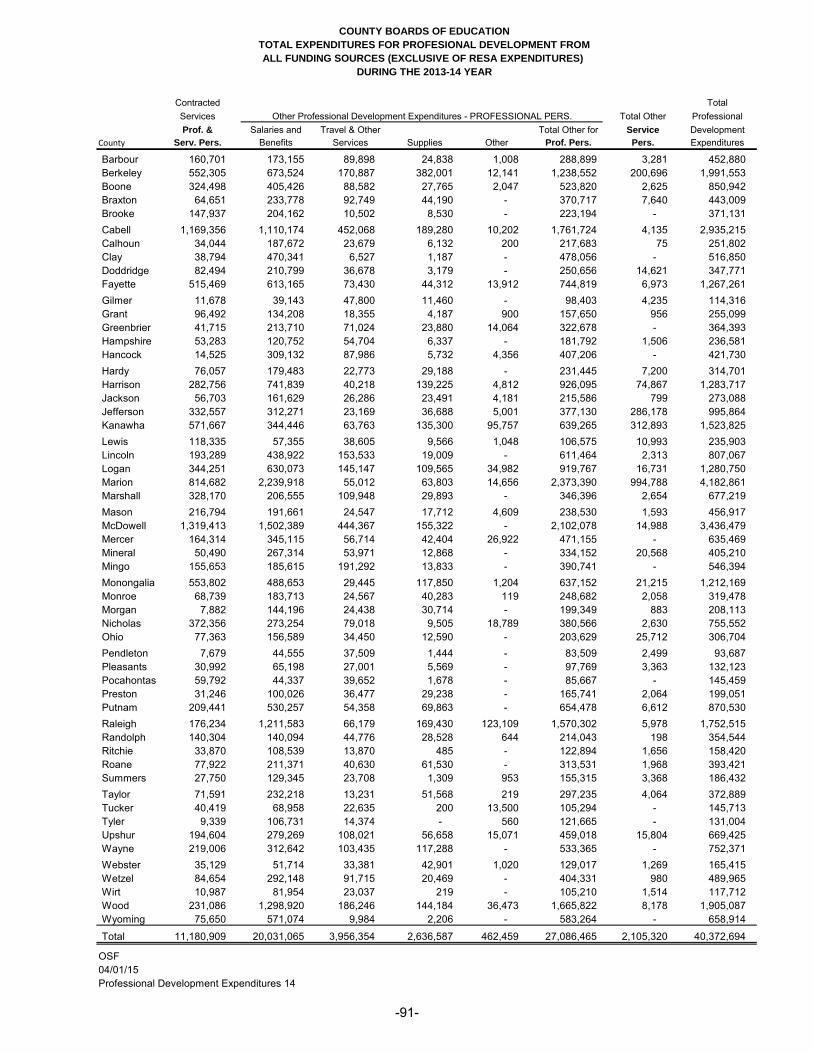
COUNTY BOARDS OF EDUCATION
TOTAL EXPENDITURES FOR PROFESIONAL DEVELOPMENT FROM
ALL FUNDING SOURCES (EXCLUSIVE OF RESA EXPENDITURES)
DURING THE 2013-14 YEAR
Contracted Total
Services Total Other Professional
Prof. & Salaries and Travel & Other Total Other for Service Development
County Serv. Pers. Benefits Services Supplies Other Prof. Pers. Pers. Expenditures
Barbour 160,701 173,155 89,898 24,838 1,008 288,899 3,281 452,880
Berkeley 552,305 673,524 170,887 382,001 12,141 1,238,552 200,696 1,991,553
Boone 324,498 405,426 88,582 27,765 2,047 523,820 2,625 850,942
Braxton 64,651 233,778 92,749 44,190 - 370,717 7,640 443,009
Brooke 147,937 204,162 10,502 8,530 - 223,194 - 371,131
Cabell 1,169,356 1,110,174 452,068 189,280 10,202 1,761,724 4,135 2,935,215
Calhoun 34,044 187,672 23,679 6,132 200 217,683 75 251,802
Clay 38,794 470,341 6,527 1,187 - 478,056 - 516,850
Doddridge 82,494 210,799 36,678 3,179 - 250,656 14,621 347,771
Fayette 515,469 613,165 73,430 44,312 13,912 744,819 6,973 1,267,261
Gilmer 11,678 39,143 47,800 11,460 - 98,403 4,235 114,316
Grant 96,492 134,208 18,355 4,187 900 157,650 956 255,099
Greenbrier 41,715 213,710 71,024 23,880 14,064 322,678 - 364,393
Hampshire 53,283 120,752 54,704 6,337 - 181,792 1,506 236,581
Hancock 14,525 309,132 87,986 5,732 4,356 407,206 - 421,730
Hardy 76,057 179,483 22,773 29,188 - 231,445 7,200 314,701
Harrison 282,756 741,839 40,218 139,225 4,812 926,095 74,867 1,283,717
Jackson 56,703 161,629 26,286 23,491 4,181 215,586 799 273,088
Jefferson 332,557 312,271 23,169 36,688 5,001 377,130 286,178 995,864
Kanawha 571,667 344,446 63,763 135,300 95,757 639,265 312,893 1,523,825
Lewis 118,335 57,355 38,605 9,566 1,048 106,575 10,993 235,903
Lincoln 193,289 438,922 153,533 19,009 - 611,464 2,313 807,067
Logan 344,251 630,073 145,147 109,565 34,982 919,767 16,731 1,280,750
Marion 814,682 2,239,918 55,012 63,803 14,656 2,373,390 994,788 4,182,861
Marshall 328,170 206,555 109,948 29,893 - 346,396 2,654 677,219
Mason 216,794 191,661 24,547 17,712 4,609 238,530 1,593 456,917
McDowell 1,319,413 1,502,389 444,367 155,322 - 2,102,078 14,988 3,436,479
Mercer 164,314 345,115 56,714 42,404 26,922 471,155 - 635,469
Mineral 50,490 267,314 53,971 12,868 - 334,152 20,568 405,210
Mingo 155,653 185,615 191,292 13,833 - 390,741 - 546,394
Monongalia 553,802 488,653 29,445 117,850 1,204 637,152 21,215 1,212,169
Monroe 68,739 183,713 24,567 40,283 119 248,682 2,058 319,478
Morgan 7,882 144,196 24,438 30,714 - 199,349 883 208,113
Nicholas 372,356 273,254 79,018 9,505 18,789 380,566 2,630 755,552
Ohio 77,363 156,589 34,450 12,590 - 203,629 25,712 306,704
Pendleton 7,679 44,555 37,509 1,444 - 83,509 2,499 93,687
Pleasants 30,992 65,198 27,001 5,569 - 97,769 3,363 132,123
Pocahontas 59,792 44,337 39,652 1,678 - 85,667 - 145,459
Preston 31,246 100,026 36,477 29,238 - 165,741 2,064 199,051
Putnam 209,441 530,257 54,358 69,863 - 654,478 6,612 870,530
Raleigh 176,234 1,211,583 66,179 169,430 123,109 1,570,302 5,978 1,752,515
Randolph 140,304 140,094 44,776 28,528 644 214,043 198 354,544
Ritchie 33,870 108,539 13,870 485 - 122,894 1,656 158,420
Roane 77,922 211,371 40,630 61,530 - 313,531 1,968 393,421
Summers 27,750 129,345 23,708 1,309 953 155,315 3,368 186,432
Taylor 71,591 232,218 13,231 51,568 219 297,235 4,064 372,889
Tucker 40,419 68,958 22,635 200 13,500 105,294 - 145,713
Tyler 9,339 106,731 14,374 - 560 121,665 - 131,004
Upshur 194,604 279,269 108,021 56,658 15,071 459,018 15,804 669,425
Wayne 219,006 312,642 103,435 117,288 - 533,365 - 752,371
Webster 35,129 51,714 33,381 42,901 1,020 129,017 1,269 165,415
Wetzel 84,654 292,148 91,715 20,469 - 404,331 980 489,965
Wirt 10,987 81,954 23,037 219 - 105,210 1,514 117,712
Wood 231,086 1,298,920 186,246 144,184 36,473 1,665,822 8,178 1,905,087
Wyoming 75,650 571,074 9,984 2,206 - 583,264 - 658,914
Total 11,180,909 20,031,065 3,956,354 2,636,587 462,459 27,086,465 2,105,320 40,372,694
OSF
04/01/15
Professional Development Expenditures 14
Other Professional Development Expenditures - PROFESSIONAL PERS.
-91-

COUNTY BOARDS OF EDUCATION
EXPENDITURES FOR INSTRUCTIONAL SUPPLIES
2013-14 YEAR
Textbooks, Technology-
General Books and Related MiscellaneousCounty Supplies Periodicals Supplies Supplies Total
Barbour 169,403 311,939 515,803 487 997,632
Berkeley 2,508,375 2,303,066 979,508 52,787 5,843,736
Boone 655,505 364,802 1,176,617 2,380 2,199,303
Braxton 247,371 215,012 265,809 - 728,193
Brooke 616,763 319,598 283,266 - 1,219,628
Cabell 5,503,205 907,203 3,142,307 - 9,552,715
Calhoun 276,465 113,091 300,271 585 690,413
Clay 291,260 183,514 84,634 - 559,408
Doddridge 245,756 146,178 368,065 - 759,998
Fayette 1,197,988 824,671 1,712,438 2,192 3,737,290
Gilmer 199,481 90,628 128,211 - 418,320
Grant 289,220 227,344 105,246 - 621,810
Greenbrier 985,914 397,789 84,514 10,042 1,478,259
Hampshire 733,208 295,063 506,835 8,761 1,543,867
Hancock 954,033 333,185 484,003 - 1,771,221
Hardy 169,455 238,104 86,743 1,280 495,581
Harrison 1,776,238 1,417,219 1,524,997 15 4,718,468
Jackson 597,190 558,176 241,402 4,396 1,401,164
Jefferson 1,310,742 810,398 1,152,801 6,610 3,280,552
Kanawha 2,632,042 3,344,376 7,225,786 6,480 13,208,685
Lewis 356,853 232,033 423,478 3,207 1,015,571
Lincoln 796,360 392,811 169,959 - 1,359,130
Logan 1,021,952 1,341,848 359,198 187,791 2,910,788
Marion 3,195,979 891,874 2,377,710 - 6,465,562
Marshall 752,008 842,482 376,190 - 1,970,681
Mason 855,841 371,037 416,856 - 1,643,734
McDowell 940,645 695,550 832,256 - 2,468,452
Mercer 1,156,478 1,001,533 135,890 - 2,293,900
Mineral 441,034 405,269 221,378 - 1,067,680
Mingo 401,767 442,796 345,520 - 1,190,082
Monongalia 1,487,774 1,154,107 230,945 460 2,873,286
Monroe 295,393 190,407 211,638 26,475 723,913
Morgan 201,841 326,005 269,829 - 797,675
Nicholas 846,842 254,953 524,324 5,250 1,631,369
Ohio 450,063 245,632 190,802 - 886,497
Pendleton 106,943 93,202 121,944 431 322,521
Pleasants 247,236 151,221 347,749 1,530 747,736
Pocahontas 210,197 154,926 172,091 (3,584) 533,630
Preston 276,780 262,043 331,583 - 870,406
Putnam 1,044,618 917,625 331,622 - 2,293,865
Raleigh 1,831,435 451,565 1,684,833 11,361 3,979,195
Randolph 628,721 241,579 618,691 - 1,488,991
Ritchie 200,572 112,531 265,332 - 578,435
Roane 268,107 135,989 275,948 - 680,044
Summers 118,417 194,317 101,836 969 415,539
Taylor 169,185 274,322 569,104 2,074 1,014,686
Tucker 254,052 96,685 116,897 1,092 468,726
Tyler 249,005 181,276 223,463 - 653,744
Upshur 593,541 516,567 478,739 27,938 1,616,785
Wayne 1,089,018 912,135 376,381 14,041 2,391,575
Webster 279,704 107,107 203,505 - 590,316
Wetzel 471,450 387,947 1,239,822 1,151 2,100,370
Wirt 139,004 98,470 148,346 - 385,820
Wood 1,786,903 1,953,765 1,591,502 357 5,332,526
Wyoming 553,655 646,031 350,569 - 1,550,255
Total 45,078,987 30,078,995 37,005,185 376,558 112,539,726
Note: RESA expenditures are not included.
OSF
04/02/15
Instructional supplies 14-92-

COUNTY BOARDS OF EDUCATION
PER PUPIL EXPENDITURES FOR CURRENT OPERATIONS
FOR THE 2013-14 YEAR
Per PupilCounty Expenditures
Barbour 10,284.51Berkeley 11,123.60Boone 12,685.66Braxton 10,497.75Brooke 11,800.74
Cabell 10,892.42
Calhoun 12,187.97
Clay 10,658.12
Doddridge 15,086.64
Fayette 11,199.24
Gilmer 13,013.72
Grant 10,481.76
Greenbrier 11,281.94
Hampshire 10,689.76
Hancock 11,324.88
Hardy 10,117.41Harrison 11,368.55Jackson 11,474.77Jefferson 11,215.21Kanawha 10,682.14
Lewis 10,971.87Lincoln 11,627.49Logan 11,321.32Marion 11,405.72Marshall 12,879.23
Mason 11,255.55McDowell 13,770.94Mercer 10,642.04Mineral 11,828.25Mingo 11,646.97
Monongalia 11,359.58Monroe 11,084.08Morgan 11,109.82Nicholas 11,131.75Ohio 11,935.01
Pendleton 13,742.33Pleasants 13,157.32Pocahontas 13,579.14Preston 9,388.53Putnam 10,771.09
Raleigh 11,429.30Randolph 11,154.75Ritchie 11,506.18Roane 10,403.54Summers 10,477.96
Taylor 10,566.65Tucker 12,164.28Tyler 12,989.50Upshur 11,075.79Wayne 10,536.05
Webster 11,266.00Wetzel 13,544.03Wirt 11,418.83Wood 10,883.55Wyoming 11,820.40
Total 11,239.67
OSF
01/13/15
Per Pupil Expenditures 2014
Notes: (a) The enrollments used are second month student (headcount) enrollments. (b) All expenditures by county boards are included
except those for capital improvements, debt service, community services, adult education, transits/transfers and the expenses being
recorded for other post-employment benefits (OPEB) pursuant to WVC §5-16D-6 in excess of the minimum annual employer payment (pay-
go) established by the PEIA Finance Board. (c) Beginning with FY10, also included is the portion of the legislative appropriation for the
Teachers' Retirement System in excess of the employers' contribution rates of 7.5% or 15%, depending on the retirement plan, which is
considered to be the State's annual required contribution towards the past service unfunded liability. (d) RESA expenditures are not
included and expenditures of the seven MCVCs are allocated among the 20 county boards served by each MCVC.
Notes: (a) The method of calculating expenditures on a per pupil basis conforms with instructions from the National Center for Education
-93-

COUNTY BOARDS OF EDUCATION
PER PUPIL EXPENDITURES FOR CURRENT OPERATIONS
ARRANGED IN DESCENDING ORDER
FOR THE 2013-14 YEAR
Per PupilCt. County Expenditures
1 Doddridge 15,086.642 McDowell 13,770.943 Pendleton 13,742.334 Pocahontas 13,579.145 Wetzel 13,544.03
6 Pleasants 13,157.32
7 Gilmer 13,013.72
8 Tyler 12,989.50
9 Marshall 12,879.23
10 Boone 12,685.66
11 Calhoun 12,187.97
12 Tucker 12,164.28
13 Ohio 11,935.01
14 Mineral 11,828.25
15 Wyoming 11,820.40
16 Brooke 11,800.7417 Mingo 11,646.9718 Lincoln 11,627.4919 Ritchie 11,506.1820 Jackson 11,474.77
21 Raleigh 11,429.3022 Wirt 11,418.8323 Marion 11,405.7224 Harrison 11,368.5525 Monongalia 11,359.58
26 Hancock 11,324.8827 Logan 11,321.3228 Greenbrier 11,281.9429 Webster 11,266.0030 Mason 11,255.55
31 Jefferson 11,215.2132 Fayette 11,199.2433 Randolph 11,154.7534 Nicholas 11,131.7535 Berkeley 11,123.60
36 Morgan 11,109.8237 Monroe 11,084.0838 Upshur 11,075.7939 Lewis 10,971.8740 Cabell 10,892.42
41 Wood 10,883.5542 Putnam 10,771.0943 Hampshire 10,689.7644 Kanawha 10,682.1445 Clay 10,658.12
46 Mercer 10,642.0447 Taylor 10,566.6548 Wayne 10,536.0549 Braxton 10,497.7550 Grant 10,481.76
51 Summers 10,477.9652 Roane 10,403.5453 Barbour 10,284.5154 Hardy 10,117.4155 Preston 9,388.53
- Total 11,239.67
OSF
Per Pupil Expenditures 2014
Notes: (a) The enrollments used are second month student (headcount) enrollments. (b) All expenditures by county boards are included
except those for capital improvements, debt service, community services, adult education, transits/transfers and the expenses being recorded
for other post-employment benefits (OPEB) pursuant to WVC §5-16D-6 in excess of the minimum annual employer payment (pay-go)
established by the PEIA Finance Board. (c) Beginning with FY10, also included is the portion of the legislative appropriation for the Teachers'
Retirement System in excess of the employers' contribution rates of 7.5% or 15%, depending on the retirement plan, which is considered to be
the State's annual required contribution towards the past service unfunded liability. (d) RESA expenditures are not included and expenditures of
the seven MCVCs are allocated among the 20 county boards served by each MCVC.
01/13/15
Notes: (a) The method of calculating expenditures on a per pupil basis conforms with instructions from the National Center for Education
-94-

STUDENT
ENROLLMENT
DATA


COUNTY BOARDS OF EDUCATION
SUMMARY OF HEADCOUNT (STUDENT) ENROLLMENT - 2ND MONTH
2013-14 YEAR
Headcount
County Enrollment
Barbour 2,454
Berkeley 18,221
Boone 4,541
Braxton 2,128
Brooke 3,246
Cabell 13,085
Calhoun 1,069
Clay 1,975
Doddridge 1,159
Fayette 6,810
Gilmer 903
Grant 1,819
Greenbrier 5,191
Hampshire 3,422
Hancock 4,181
Hardy 2,321
Harrison 10,913
Jackson 4,914
Jefferson 9,061
Kanawha 28,378
Lewis 2,624
Lincoln 3,691
Logan 6,271
Marion 8,036
Marshall 4,708
Mason 4,312
McDowell 3,437
Mercer 9,585
Mineral 4,187
Mingo 4,403
Monongalia 11,192
Monroe 1,820
Morgan 2,580
Nicholas 3,956
Ohio 5,428
Pendleton 1,001
Pleasants 1,232
Pocahontas 1,112
Preston 4,583
Putnam 9,907
Raleigh 12,568
Randolph 4,225
Ritchie 1,516
Roane 2,443
Summers 1,596
Taylor 2,423
Tucker 1,029
Tyler 1,348
Upshur 3,822
Wayne 7,446
Webster 1,446
Wetzel 2,757
Wirt 1,022
Wood 13,260
Wyoming 4,256
Total 281,013
OSF
10/22/13
Headcount Enroll 2nd Mo 14
-95-

COUNTY BOARDS OF EDUCATION
SUMMARY OF HEADCOUNT (STUDENT) ENROLLMENT - 2ND MONTH
ARRANGED IN DESCENDING ORDER
2013-14 YEAR
Headcount
Ct. County Enrollment
1. Kanawha 28,378
2. Berkeley 18,221
3. Wood 13,260
4. Cabell 13,085
5. Raleigh 12,568
6. Monongalia 11,192
7. Harrison 10,913
8. Putnam 9,907
9. Mercer 9,585
10. Jefferson 9,061
11. Marion 8,036
12. Wayne 7,446
13. Fayette 6,810
14. Logan 6,271
15. Ohio 5,428
16. Greenbrier 5,191
17. Jackson 4,914
18. Marshall 4,708
19. Preston 4,583
20. Boone 4,541
21. Mingo 4,403
22. Mason 4,312
23. Wyoming 4,256
24. Randolph 4,225
25. Mineral 4,187
26. Hancock 4,181
27. Nicholas 3,956
28. Upshur 3,822
29. Lincoln 3,691
30. McDowell 3,437
31. Hampshire 3,422
32. Brooke 3,246
33. Wetzel 2,757
34. Lewis 2,624
35. Morgan 2,580
36. Barbour 2,454
37. Roane 2,443
38. Taylor 2,423
39. Hardy 2,321
40. Braxton 2,128
41. Clay 1,975
42. Monroe 1,820
43. Grant 1,819
44. Summers 1,596
45. Ritchie 1,516
46. Webster 1,446
47. Tyler 1,348
48. Pleasants 1,232
49. Doddridge 1,159
50. Pocahontas 1,112
51. Calhoun 1,069
52. Tucker 1,029
53. Wirt 1,022
54. Pendleton 1,001
55. Gilmer 903
- Total 281,013
OSF
Headcount Enroll 2nd Mo 14
10/22/13
-96-

COUNTY BOARDS OF EDUCATION
HEADCOUNT (STUDENT) ENROLLMENT BY GRADE - 2nd MONTH
2013-14 YEAR
Early Kinder-
County Childhood garten First Second Third Fourth Fifth
Barbour 155 186 194 182 179 170 161
Berkeley 823 1,448 1,475 1,386 1,353 1,376 1,336
Boone 288 344 350 308 330 327 350
Braxton 133 180 158 146 151 148 150
Brooke 137 238 238 227 237 226 231
Cabell 840 1,037 1,014 972 942 941 935
Calhoun 74 80 74 77 88 65 79
Clay 160 152 159 144 140 142 157
Doddridge 69 82 74 79 91 79 64
Fayette 333 521 512 485 473 468 484
Gilmer 57 60 74 71 62 68 53
Grant 105 122 124 129 116 133 137
Greenbrier 253 368 412 351 352 394 350
Hampshire 175 231 245 215 240 205 267
Hancock 232 352 282 289 303 305 302
Hardy 149 173 196 166 164 169 175
Harrison 668 849 835 793 842 765 767
Jackson 258 390 356 353 357 353 360
Jefferson 370 688 732 633 668 683 644
Kanawha 1,446 2,144 2,128 2,035 2,033 2,117 2,082
Lewis 144 222 193 194 179 153 202
Lincoln 235 336 289 295 268 286 292
Logan 313 443 439 427 439 462 452
Marion 452 630 590 603 567 591 590
Marshall 280 377 316 368 348 318 319
Mason 257 342 323 307 316 326 274
McDowell 205 252 284 234 244 244 245
Mercer 564 788 774 669 639 675 673
Mineral 256 322 302 265 298 299 285
Mingo 245 366 354 317 320 317 347
Monongalia 652 838 870 843 815 846 792
Monroe 102 149 136 130 130 117 114
Morgan 133 174 165 174 190 163 184
Nicholas 193 308 339 308 281 282 278
Ohio 333 392 409 389 408 374 372
Pendleton 78 65 67 64 64 68 86
Pleasants 74 80 96 60 79 82 75
Pocahontas 74 68 84 78 66 85 76
Preston 242 374 339 350 320 344 334
Putnam 442 713 692 741 692 753 741
Raleigh 826 949 990 923 927 892 904
Randolph 218 338 356 292 348 327 317
Ritchie 88 112 100 105 113 123 121
Roane 115 201 189 162 160 190 173
Summers 100 135 140 110 147 120 112
Taylor 135 190 185 179 181 190 201
Tucker 68 68 56 69 61 88 77
Tyler 74 92 100 91 97 94 72
Upshur 177 270 306 315 287 278 273
Wayne 412 583 569 510 492 535 513
Webster 103 118 111 102 96 99 95
Wetzel 142 188 189 221 167 206 183
Wirt 58 67 78 80 71 73 65
Wood 660 979 947 966 986 980 930
Wyoming 282 356 305 289 297 299 304
Total 15,457 21,530 21,314 20,271 20,214 20,413 20,155
OSF
10/22/13
Headcount Enroll 2nd Mo 14
-97-

COUNTY BOARDS OF EDUCATION
HEADCOUNT (STUDENT) ENROLLMENT BY GRADE - 2nd MONTH
2013-14 YEAR
County
Barbour
Berkeley
Boone
Braxton
Brooke
Cabell
Calhoun
Clay
Doddridge
Fayette
Gilmer
Grant
Greenbrier
Hampshire
Hancock
Hardy
Harrison
Jackson
Jefferson
Kanawha
Lewis
Lincoln
Logan
Marion
Marshall
Mason
McDowell
Mercer
Mineral
Mingo
Monongalia
Monroe
Morgan
Nicholas
Ohio
Pendleton
Pleasants
Pocahontas
Preston
Putnam
Raleigh
Randolph
Ritchie
Roane
Summers
Taylor
Tucker
Tyler
Upshur
Wayne
Webster
Wetzel
Wirt
Wood
Wyoming
Total
OSF
10/22/13
Headcount Enroll 2nd Mo 14
(Same information as Sheet 5 for printing)
Sixth Seventh Eight Ninth Tenth Eleventh Twelfth Total
190 166 167 188 174 165 177 2,454
1,415 1,394 1,349 1,443 1,312 1,091 1,020 18,221
313 355 342 357 324 289 264 4,541
170 134 154 175 159 133 137 2,128
224 232 260 278 261 230 227 3,246
942 984 954 946 960 877 741 13,085
89 73 79 69 72 69 81 1,069
129 134 125 141 147 112 133 1,975
86 90 94 98 81 87 85 1,159
481 549 492 518 514 476 504 6,810
55 66 62 72 68 67 68 903
122 129 145 146 140 142 129 1,819
397 410 423 417 353 352 359 5,191
238 244 306 272 245 273 266 3,422
316 323 316 341 299 256 265 4,181
170 176 148 172 149 166 148 2,321
746 782 816 816 826 714 694 10,913
372 366 349 410 360 335 295 4,914
726 720 701 710 633 559 594 9,061
2,206 2,070 2,110 2,435 2,017 1,828 1,727 28,378
187 203 189 195 209 175 179 2,624
275 248 290 244 261 193 179 3,691
461 448 462 525 482 461 457 6,271
591 577 593 621 592 559 480 8,036
344 342 367 319 352 336 322 4,708
297 317 324 307 312 303 307 4,312
254 252 246 291 253 214 219 3,437
730 684 737 698 702 630 622 9,585
304 303 320 346 300 316 271 4,187
353 317 342 325 293 253 254 4,403
781 813 751 859 820 766 746 11,192
146 141 142 157 135 99 122 1,820
179 188 194 238 207 191 200 2,580
278 271 296 291 291 283 257 3,956
381 384 372 401 414 379 420 5,428
68 59 66 87 81 64 84 1,001
89 89 107 114 100 83 104 1,232
87 76 78 100 79 77 84 1,112
324 316 329 349 330 312 320 4,583
738 746 768 814 724 654 689 9,907
944 889 922 931 905 811 755 12,568
294 322 296 269 301 280 267 4,225
115 109 103 106 119 91 111 1,516
172 167 191 209 174 169 171 2,443
103 117 108 106 112 95 91 1,596
179 170 156 186 179 150 142 2,423
64 70 89 86 88 66 79 1,029
108 89 116 119 105 88 103 1,348
302 310 261 332 251 221 239 3,822
569 569 557 684 519 442 492 7,446
99 115 102 92 96 114 104 1,446
212 183 197 218 236 215 200 2,757
83 48 87 78 77 72 85 1,022
965 982 985 1,075 1,030 933 842 13,260
295 305 298 336 301 284 305 4,256
20,758 20,616 20,833 22,112 20,524 18,600 18,216 281,013
-98-
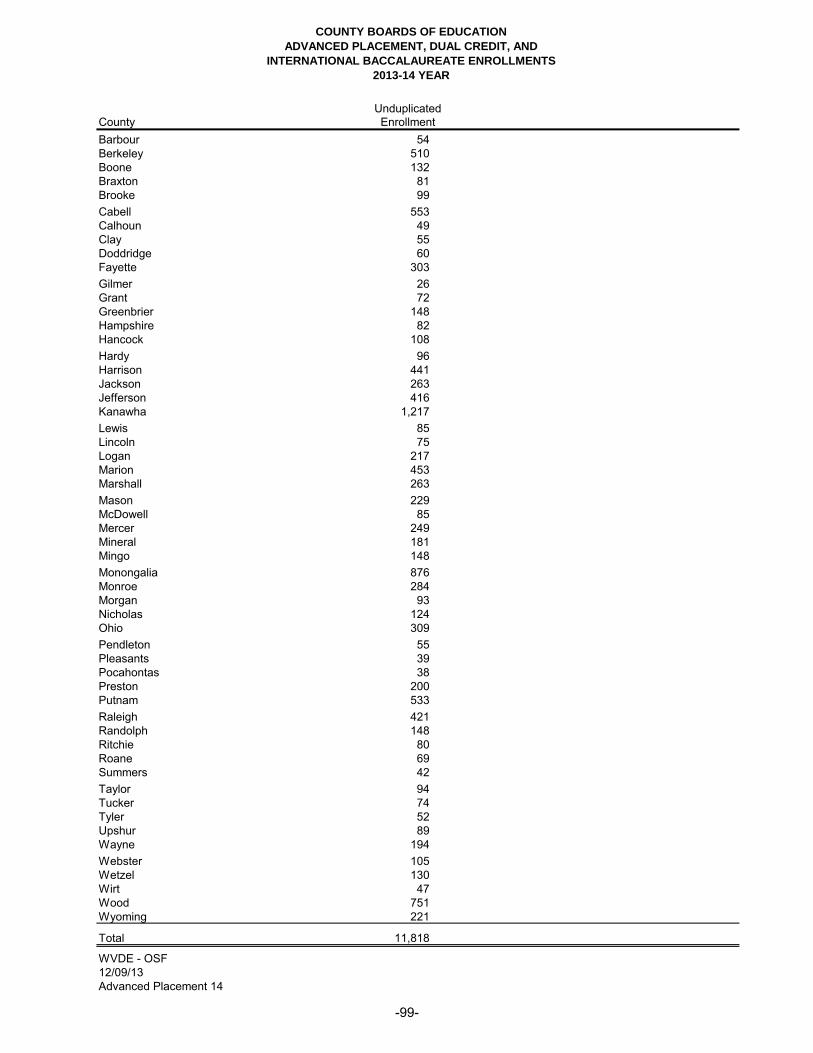
COUNTY BOARDS OF EDUCATION
ADVANCED PLACEMENT, DUAL CREDIT, AND
INTERNATIONAL BACCALAUREATE ENROLLMENTS
2013-14 YEAR
Unduplicated
County Enrollment
Barbour 54
Berkeley 510
Boone 132
Braxton 81
Brooke 99
Cabell 553
Calhoun 49
Clay 55
Doddridge 60
Fayette 303
Gilmer 26
Grant 72
Greenbrier 148
Hampshire 82
Hancock 108
Hardy 96
Harrison 441
Jackson 263
Jefferson 416
Kanawha 1,217
Lewis 85
Lincoln 75
Logan 217
Marion 453
Marshall 263
Mason 229
McDowell 85
Mercer 249
Mineral 181
Mingo 148
Monongalia 876
Monroe 284
Morgan 93
Nicholas 124
Ohio 309
Pendleton 55
Pleasants 39
Pocahontas 38
Preston 200
Putnam 533
Raleigh 421
Randolph 148
Ritchie 80
Roane 69
Summers 42
Taylor 94
Tucker 74
Tyler 52
Upshur 89
Wayne 194
Webster 105
Wetzel 130
Wirt 47
Wood 751
Wyoming 221
Total 11,818
WVDE - OSF
12/09/13
Advanced Placement 14
-99-
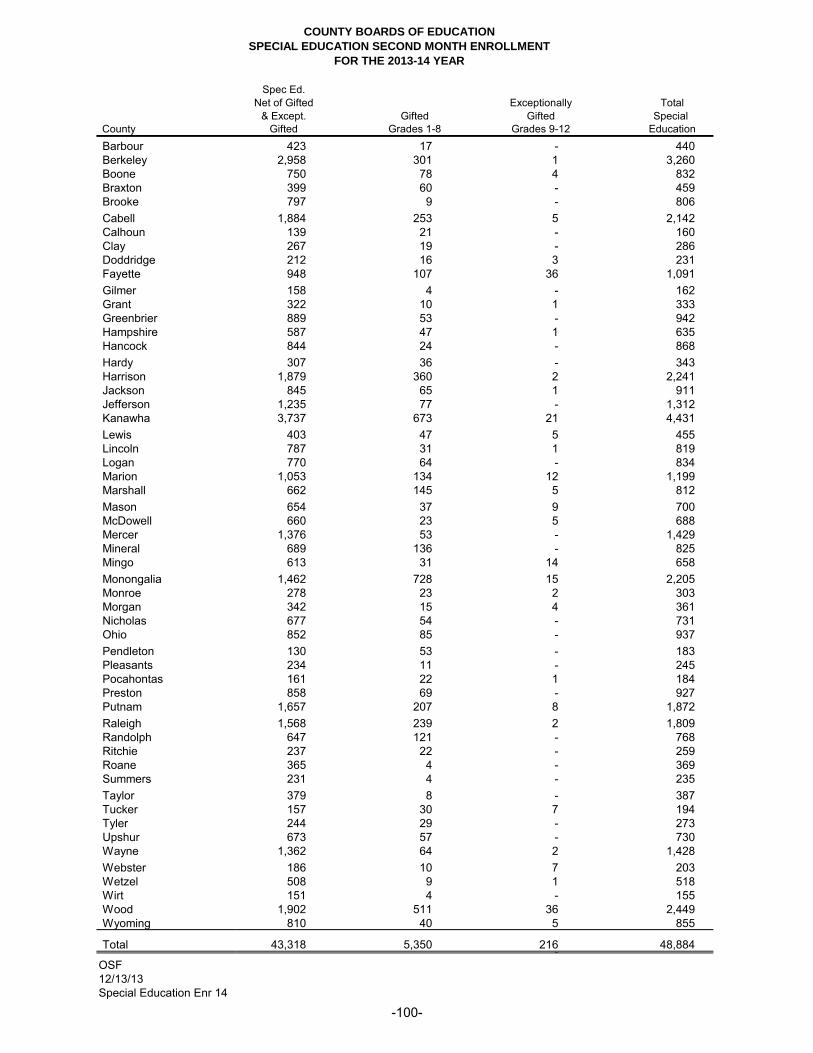
COUNTY BOARDS OF EDUCATION
SPECIAL EDUCATION SECOND MONTH ENROLLMENT
FOR THE 2013-14 YEAR
Spec Ed.
Net of Gifted Exceptionally Total
& Except. Gifted Gifted Special
County Gifted Grades 1-8 Grades 9-12 Education
Barbour 423 17 - 440
Berkeley 2,958 301 1 3,260
Boone 750 78 4 832
Braxton 399 60 - 459
Brooke 797 9 - 806
Cabell 1,884 253 5 2,142
Calhoun 139 21 - 160
Clay 267 19 - 286
Doddridge 212 16 3 231
Fayette 948 107 36 1,091
Gilmer 158 4 - 162
Grant 322 10 1 333
Greenbrier 889 53 - 942
Hampshire 587 47 1 635
Hancock 844 24 - 868
Hardy 307 36 - 343
Harrison 1,879 360 2 2,241
Jackson 845 65 1 911
Jefferson 1,235 77 - 1,312
Kanawha 3,737 673 21 4,431
Lewis 403 47 5 455
Lincoln 787 31 1 819
Logan 770 64 - 834
Marion 1,053 134 12 1,199
Marshall 662 145 5 812
Mason 654 37 9 700
McDowell 660 23 5 688
Mercer 1,376 53 - 1,429
Mineral 689 136 - 825
Mingo 613 31 14 658
Monongalia 1,462 728 15 2,205
Monroe 278 23 2 303
Morgan 342 15 4 361
Nicholas 677 54 - 731
Ohio 852 85 - 937
Pendleton 130 53 - 183
Pleasants 234 11 - 245
Pocahontas 161 22 1 184
Preston 858 69 - 927
Putnam 1,657 207 8 1,872
Raleigh 1,568 239 2 1,809
Randolph 647 121 - 768
Ritchie 237 22 - 259
Roane 365 4 - 369
Summers 231 4 - 235
Taylor 379 8 - 387
Tucker 157 30 7 194
Tyler 244 29 - 273
Upshur 673 57 - 730
Wayne 1,362 64 2 1,428
Webster 186 10 7 203
Wetzel 508 9 1 518
Wirt 151 4 - 155
Wood 1,902 511 36 2,449
Wyoming 810 40 5 855
Total 43,318 5,350 216 48,884 -
OSF
12/13/13
Special Education Enr 14
-100-
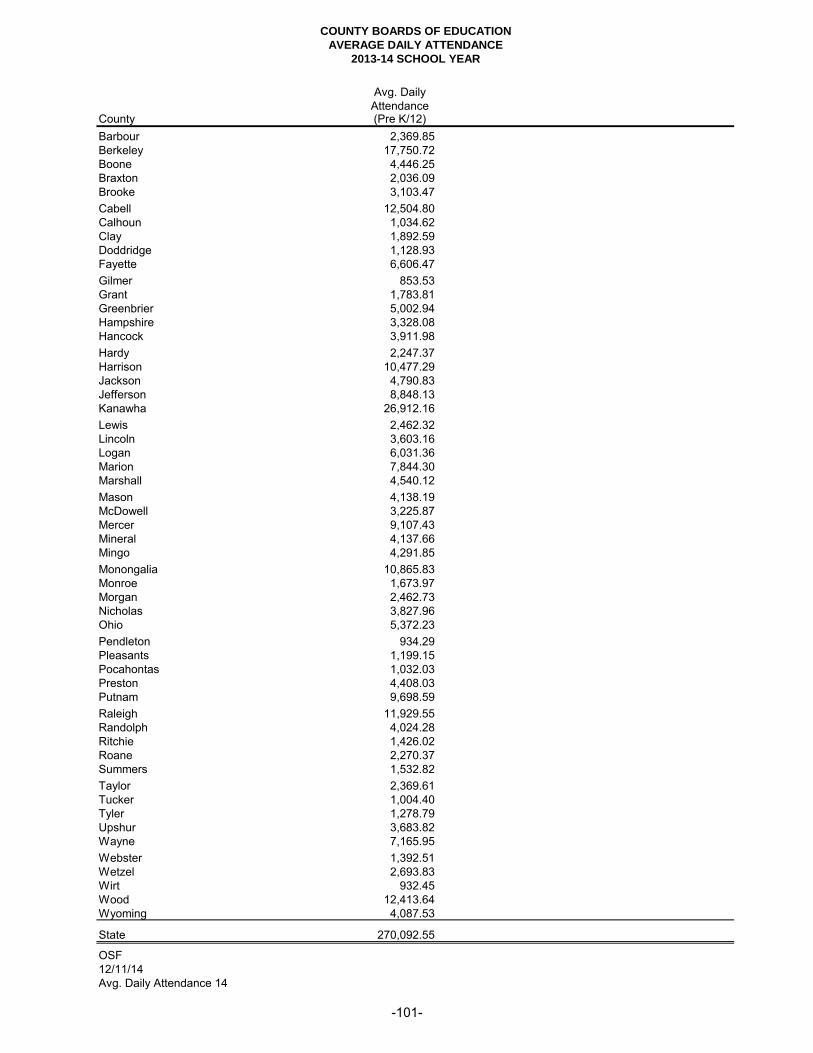
COUNTY BOARDS OF EDUCATION
AVERAGE DAILY ATTENDANCE
2013-14 SCHOOL YEAR
Avg. Daily
AttendanceCounty (Pre K/12)
Barbour 2,369.85
Berkeley 17,750.72
Boone 4,446.25
Braxton 2,036.09
Brooke 3,103.47
Cabell 12,504.80
Calhoun 1,034.62
Clay 1,892.59
Doddridge 1,128.93
Fayette 6,606.47
Gilmer 853.53
Grant 1,783.81
Greenbrier 5,002.94
Hampshire 3,328.08
Hancock 3,911.98
Hardy 2,247.37
Harrison 10,477.29
Jackson 4,790.83
Jefferson 8,848.13
Kanawha 26,912.16
Lewis 2,462.32
Lincoln 3,603.16
Logan 6,031.36
Marion 7,844.30
Marshall 4,540.12
Mason 4,138.19
McDowell 3,225.87
Mercer 9,107.43
Mineral 4,137.66
Mingo 4,291.85
Monongalia 10,865.83
Monroe 1,673.97
Morgan 2,462.73
Nicholas 3,827.96
Ohio 5,372.23
Pendleton 934.29
Pleasants 1,199.15
Pocahontas 1,032.03
Preston 4,408.03
Putnam 9,698.59
Raleigh 11,929.55
Randolph 4,024.28
Ritchie 1,426.02
Roane 2,270.37
Summers 1,532.82
Taylor 2,369.61
Tucker 1,004.40
Tyler 1,278.79
Upshur 3,683.82
Wayne 7,165.95
Webster 1,392.51
Wetzel 2,693.83
Wirt 932.45
Wood 12,413.64
Wyoming 4,087.53
State 270,092.55
OSF
12/11/14
Avg. Daily Attendance 14
-101-

COUNTY BOARDS OF EDUCATION
COMPARISON OF AVERAGE DAILY ATTENDANCE
TO FTE ENROLLMENT - SAME YEAR
2013-14 SCHOOL YEAR
Avg. Daily
Attendance FTE Number PercentCounty (PRE K/12) Enrollment Difference Difference
Barbour 2,369.85 2,448.50 (78.65) -3.32%
Berkeley 17,750.72 18,153.82 (403.10) -2.27%
Boone 4,446.25 4,500.00 (53.75) -1.21%
Braxton 2,036.09 2,120.00 (83.91) -4.12%
Brooke 3,103.47 3,240.00 (136.53) -4.40%
Cabell 12,504.80 13,034.43 (529.63) -4.24%
Calhoun 1,034.62 1,069.00 (34.38) -3.32%
Clay 1,892.59 1,975.00 (82.41) -4.35%
Doddridge 1,128.93 1,155.20 (26.27) -2.33%
Fayette 6,606.47 6,810.00 (203.53) -3.08%
Gilmer 853.53 901.24 (47.71) -5.59%
Grant 1,783.81 1,814.00 (30.19) -1.69%
Greenbrier 5,002.94 5,184.04 (181.10) -3.62%
Hampshire 3,328.08 3,421.00 (92.92) -2.79%
Hancock 3,911.98 4,173.40 (261.42) -6.68%
Hardy 2,247.37 2,314.25 (66.88) -2.98%
Harrison 10,477.29 10,899.40 (422.11) -4.03%
Jackson 4,790.83 4,914.00 (123.17) -2.57%
Jefferson 8,848.13 8,969.00 (120.87) -1.37%
Kanawha 26,912.16 28,072.70 (1,160.54) -4.31%
Lewis 2,462.32 2,619.50 (157.18) -6.38%
Lincoln 3,603.16 3,680.00 (76.84) -2.13%
Logan 6,031.36 6,270.00 (238.64) -3.96%
Marion 7,844.30 8,033.50 (189.20) -2.41%
Marshall 4,540.12 4,690.28 (150.16) -3.31%
Mason 4,138.19 4,260.60 (122.41) -2.96%
McDowell 3,225.87 3,436.50 (210.63) -6.53%
Mercer 9,107.43 9,512.00 (404.57) -4.44%
Mineral 4,137.66 4,177.89 (40.23) -0.97%
Mingo 4,291.85 4,398.65 (106.80) -2.49%
Monongalia 10,865.83 11,164.03 (298.20) -2.74%
Monroe 1,673.97 1,812.00 (138.03) -8.25%
Morgan 2,462.73 2,541.21 (78.48) -3.19%
Nicholas 3,827.96 3,950.10 (122.14) -3.19%
Ohio 5,372.23 5,386.90 (14.67) -0.27%
Pendleton 934.29 1,001.00 (66.71) -7.14%
Pleasants 1,199.15 1,232.00 (32.85) -2.74%
Pocahontas 1,032.03 1,112.00 (79.97) -7.75%
Preston 4,408.03 4,572.68 (164.65) -3.74%
Putnam 9,698.59 9,898.00 (199.41) -2.06%
Raleigh 11,929.55 12,517.60 (588.05) -4.93%
Randolph 4,024.28 4,219.95 (195.67) -4.86%
Ritchie 1,426.02 1,511.20 (85.18) -5.97%
Roane 2,270.37 2,442.05 (171.68) -7.56%
Summers 1,532.82 1,594.00 (61.18) -3.99%
Taylor 2,369.61 2,420.80 (51.19) -2.16%
Tucker 1,004.40 1,028.08 (23.68) -2.36%
Tyler 1,278.79 1,342.00 (63.21) -4.94%
Upshur 3,683.82 3,822.00 (138.18) -3.75%
Wayne 7,165.95 7,437.00 (271.05) -3.78%
Webster 1,392.51 1,445.00 (52.49) -3.77%
Wetzel 2,693.83 2,752.50 (58.67) -2.18%
Wirt 932.45 1,022.00 (89.55) -9.60%
Wood 12,413.64 13,237.53 (823.89) -6.64%
Wyoming 4,087.53 4,256.00 (168.47) -4.12%
State 270,092.55 279,965.52 (9,872.97) -3.66%
OSF
12/11/14
Avg. Daily Attendance 14
-102-

COUNTY BOARDS OF EDUCATION
COMPARISON OF AVERAGE DAILY ATTENDANCE
TO FTE ENROLLMENT - SAME YEAR
SORTED IN DESCENDING ORDER BY PERCENTAGE DIFFERENCE
2013-14 SCHOOL YEAR
Avg. Daily
Attendance FTE Number PercentCt. County (PRE K/12) Enrollment Difference Difference
1 Ohio 5,372.23 5,386.90 (14.67) -0.27%
2 Mineral 4,137.66 4,177.89 (40.23) -0.97%
3 Boone 4,446.25 4,500.00 (53.75) -1.21%
4 Jefferson 8,848.13 8,969.00 (120.87) -1.37%
5 Grant 1,783.81 1,814.00 (30.19) -1.69%
6 Putnam 9,698.59 9,898.00 (199.41) -2.06%
7 Lincoln 3,603.16 3,680.00 (76.84) -2.13%
8 Taylor 2,369.61 2,420.80 (51.19) -2.16%
9 Wetzel 2,693.83 2,752.50 (58.67) -2.18%
10 Berkeley 17,750.72 18,153.82 (403.10) -2.27%
11 Doddridge 1,128.93 1,155.20 (26.27) -2.33%
12 Tucker 1,004.40 1,028.08 (23.68) -2.36%
13 Marion 7,844.30 8,033.50 (189.20) -2.41%
14 Mingo 4,291.85 4,398.65 (106.80) -2.49%
15 Jackson 4,790.83 4,914.00 (123.17) -2.57%
16 Monongalia 10,865.83 11,164.03 (298.20) -2.74%
16 Pleasants 1,199.15 1,232.00 (32.85) -2.74%
18 Hampshire 3,328.08 3,421.00 (92.92) -2.79%
19 Mason 4,138.19 4,260.60 (122.41) -2.96%
20 Hardy 2,247.37 2,314.25 (66.88) -2.98%
21 Fayette 6,606.47 6,810.00 (203.53) -3.08%
22 Morgan 2,462.73 2,541.21 (78.48) -3.19%
22 Nicholas 3,827.96 3,950.10 (122.14) -3.19%
24 Marshall 4,540.12 4,690.28 (150.16) -3.31%
25 Barbour 2,369.85 2,448.50 (78.65) -3.32%
25 Calhoun 1,034.62 1,069.00 (34.38) -3.32%
27 Greenbrier 5,002.94 5,184.04 (181.10) -3.62%
28 Preston 4,408.03 4,572.68 (164.65) -3.74%
29 Upshur 3,683.82 3,822.00 (138.18) -3.75%
30 Webster 1,392.51 1,445.00 (52.49) -3.77%
31 Wayne 7,165.95 7,437.00 (271.05) -3.78%
32 Logan 6,031.36 6,270.00 (238.64) -3.96%
33 Summers 1,532.82 1,594.00 (61.18) -3.99%
34 Harrison 10,477.29 10,899.40 (422.11) -4.03%
35 Braxton 2,036.09 2,120.00 (83.91) -4.12%
35 Wyoming 4,087.53 4,256.00 (168.47) -4.12%
37 Cabell 12,504.80 13,034.43 (529.63) -4.24%
38 Kanawha 26,912.16 28,072.70 (1,160.54) -4.31%
39 Clay 1,892.59 1,975.00 (82.41) -4.35%
40 Brooke 3,103.47 3,240.00 (136.53) -4.40%
41 Mercer 9,107.43 9,512.00 (404.57) -4.44%
42 Randolph 4,024.28 4,219.95 (195.67) -4.86%
43 Raleigh 11,929.55 12,517.60 (588.05) -4.93%
44 Tyler 1,278.79 1,342.00 (63.21) -4.94%
45 Gilmer 853.53 901.24 (47.71) -5.59%
46 Ritchie 1,426.02 1,511.20 (85.18) -5.97%
47 Lewis 2,462.32 2,619.50 (157.18) -6.38%
48 McDowell 3,225.87 3,436.50 (210.63) -6.53%
49 Wood 12,413.64 13,237.53 (823.89) -6.64%
50 Hancock 3,911.98 4,173.40 (261.42) -6.68%
51 Pendleton 934.29 1,001.00 (66.71) -7.14%
52 Roane 2,270.37 2,442.05 (171.68) -7.56%
53 Pocahontas 1,032.03 1,112.00 (79.97) -7.75%
54 Monroe 1,673.97 1,812.00 (138.03) -8.25%
55 Wirt 932.45 1,022.00 (89.55) -9.60%
- State 270,092.55 279,965.52 (9,872.97) -3.66%
OSF
Avg. Daily Attendance 14
12/11/14
-103-

This Page Intentionally Left Blank
-104-

COMPARISON OF ENROLLMENT FACTORS
AS OF SECOND SCHOOL MONTH
2012-13 AND 2013-14
Early Childhood Headcount Early Childhood FTE Kindergarten (5 Year Olds) Headcount
Increase/ Increase/County 2012-13 2013-14 Decrease 2012-13 2013-14 Decrease
Barbour 142 155 13 141.50 150.00 8.50
Berkeley 872 823 (49) 640.30 764.99 124.69
Boone 265 288 23 262.50 247.00 (15.50)
Braxton 142 133 (9) 140.08 125.00 (15.08)
Brooke 154 137 (17) 145.20 131.00 (14.20)
Cabell 758 840 82 758.00 803.48 45.48
Calhoun 65 74 9 63.50 74.00 10.50
Clay 135 160 25 135.00 160.00 25.00
Doddridge 73 69 (4) 73.00 65.20 (7.80)
Fayette 396 333 (63) 385.22 333.00 (52.22)
Gilmer 60 57 (3) 60.00 55.24 (4.76)
Grant 100 105 5 96.40 100.00 3.60
Greenbrier 253 253 - 253.00 247.04 (5.96)
Hampshire 176 175 (1) 176.00 174.00 (2.00)
Hancock 250 232 (18) 229.40 224.40 (5.00)
Hardy 149 149 - 138.05 142.25 4.20
Harrison 649 668 19 639.20 655.90 16.70
Jackson 309 258 (51) 305.00 258.00 (47.00)
Jefferson 323 370 47 216.00 279.00 63.00
Kanawha 1,494 1,446 (48) 1,077.60 1,142.50 64.90
Lewis 165 144 (21) 165.00 139.50 (25.50)
Lincoln 264 235 (29) 258.60 224.00 (34.60)
Logan 376 313 (63) 373.60 312.00 (61.60)
Marion 492 452 (40) 459.20 449.90 (9.30)
Marshall 275 280 5 269.80 269.40 (0.40)
Mason 296 257 (39) 236.80 205.60 (31.20)
McDowell 216 205 (11) 202.56 205.00 2.44
Mercer 564 564 - 500.40 491.00 (9.40)
Mineral 295 256 (39) 294.07 249.14 (44.93)
Mingo 259 245 (14) 259.00 243.20 (15.80)
Monongalia 647 652 5 641.48 633.15 (8.33)
Monroe 121 102 (19) 115.63 94.00 (21.63)
Morgan 128 133 5 81.10 95.00 13.90
Nicholas 235 193 (42) 235.00 187.10 (47.90)
Ohio 308 333 25 258.60 291.90 33.30
Pendleton 67 78 11 67.00 78.00 11.00
Pleasants 65 74 9 65.00 74.00 9.00
Pocahontas 58 74 16 57.25 74.00 16.75
Preston 269 242 (27) 254.20 232.08 (22.12)
Putnam 415 442 27 376.00 433.00 57.00
Raleigh 769 826 57 617.80 775.60 157.80
Randolph 227 218 (9) 227.00 214.14 (12.86)
Ritchie 98 88 (10) 91.00 83.20 (7.80)
Roane 123 115 (8) 119.08 114.05 (5.03)
Summers 117 100 (17) 113.00 98.00 (15.00)
Taylor 130 135 5 123.20 132.80 9.60
Tucker 62 68 6 62.00 67.08 5.08
Tyler 76 74 (2) 74.00 68.00 (6.00)
Upshur 180 177 (3) 180.00 177.00 (3.00)
Wayne 405 412 7 385.80 403.00 17.20
Webster 99 103 4 90.00 102.00 12.00
Wetzel 149 142 (7) 145.00 138.00 (7.00)
Wirt 57 58 1 57.00 58.00 1.00
Wood 680 660 (20) 658.50 643.50 (15.00)
Wyoming 314 282 (32) 311.30 282.00 (29.30)
Total 15,766 15,457 (309) 14,359.92 14,469.34 109.42
OSF
12/13/13
Enrollment Factor Comparisons 14
-105-

COMPARISON OF ENROLLMENT FACTORS
AS OF SECOND SCHOOL MONTH
2012-13 AND 2013-14
Early Childhood Headcount
County
Barbour
Berkeley
Boone
Braxton
Brooke
Cabell
Calhoun
Clay
Doddridge
Fayette
Gilmer
Grant
Greenbrier
Hampshire
Hancock
Hardy
Harrison
Jackson
Jefferson
Kanawha
Lewis
Lincoln
Logan
Marion
Marshall
Mason
McDowell
Mercer
Mineral
Mingo
Monongalia
Monroe
Morgan
Nicholas
Ohio
Pendleton
Pleasants
Pocahontas
Preston
Putnam
Raleigh
Randolph
Ritchie
Roane
Summers
Taylor
Tucker
Tyler
Upshur
Wayne
Webster
Wetzel
Wirt
Wood
Wyoming
Total
OSF
12/13/13
Enrollment Factor Comparisons 14
Kindergarten (5 Year Olds) Headcount Kindergarten (5 Year Olds) FTE Grades 1 - 8 Headcount
Increase/ Increase/2012-13 2013-14 Decrease 2012-13 2013-14 Decrease
182 186 4 182.00 186.00 4.00
1,448 1,448 - 1,448.00 1,448.00 -
362 344 (18) 362.00 344.00 (18.00)
174 180 6 174.00 180.00 6.00
251 238 (13) 251.00 238.00 (13.00)
1,100 1,037 (63) 1,100.00 1,036.10 (63.90)
88 80 (8) 88.00 80.00 (8.00)
172 152 (20) 172.00 152.00 (20.00)
74 82 8 74.00 82.00 8.00
525 521 (4) 525.00 521.00 (4.00)
75 60 (15) 75.00 60.00 (15.00)
126 122 (4) 126.00 122.00 (4.00)
416 368 (48) 416.00 368.00 (48.00)
256 231 (25) 256.00 231.00 (25.00)
314 352 38 314.00 352.00 38.00
190 173 (17) 190.00 173.00 (17.00)
842 849 7 842.00 849.00 7.00
345 390 45 345.00 390.00 45.00
728 688 (40) 728.00 688.00 (40.00)
2,144 2,144 - 2,144.00 2,144.00 -
193 222 29 193.00 222.00 29.00
326 336 10 326.00 336.00 10.00
442 443 1 442.00 443.00 1.00
612 630 18 612.00 630.00 18.00
336 377 41 336.00 377.00 41.00
318 342 24 317.20 342.00 24.80
303 252 (51) 303.00 252.00 (51.00)
792 788 (4) 792.00 788.00 (4.00)
309 322 13 309.00 322.00 13.00
362 366 4 362.00 366.00 4.00
865 838 (27) 865.00 838.00 (27.00)
145 149 4 145.00 149.00 4.00
159 174 15 159.00 174.00 15.00
356 308 (48) 356.00 308.00 (48.00)
424 392 (32) 424.00 392.00 (32.00)
63 65 2 63.00 65.00 2.00
102 80 (22) 102.00 80.00 (22.00)
80 68 (12) 80.00 68.00 (12.00)
333 374 41 333.00 374.00 41.00
724 713 (11) 724.00 713.00 (11.00)
1,021 949 (72) 1,021.00 949.00 (72.00)
374 338 (36) 374.00 338.00 (36.00)
111 112 1 111.00 112.00 1.00
196 201 5 196.00 201.00 5.00
132 135 3 132.00 135.00 3.00
177 190 13 177.00 190.00 13.00
61 68 7 61.00 68.00 7.00
104 92 (12) 104.00 92.00 (12.00)
305 270 (35) 305.00 270.00 (35.00)
581 583 2 581.00 583.00 2.00
118 118 - 118.00 118.00 -
212 188 (24) 212.00 188.00 (24.00)
70 67 (3) 70.00 67.00 (3.00)
944 979 35 944.00 979.00 35.00
314 356 42 314.00 356.00 42.00
21,776 21,530 (246) 21,775.20 21,529.10 (246.10)
-106-

COMPARISON OF ENROLLMENT FACTORS
AS OF SECOND SCHOOL MONTH
2012-13 AND 2013-14
Early Childhood Headcount
County
Barbour
Berkeley
Boone
Braxton
Brooke
Cabell
Calhoun
Clay
Doddridge
Fayette
Gilmer
Grant
Greenbrier
Hampshire
Hancock
Hardy
Harrison
Jackson
Jefferson
Kanawha
Lewis
Lincoln
Logan
Marion
Marshall
Mason
McDowell
Mercer
Mineral
Mingo
Monongalia
Monroe
Morgan
Nicholas
Ohio
Pendleton
Pleasants
Pocahontas
Preston
Putnam
Raleigh
Randolph
Ritchie
Roane
Summers
Taylor
Tucker
Tyler
Upshur
Wayne
Webster
Wetzel
Wirt
Wood
Wyoming
Total
OSF
12/13/13
Enrollment Factor Comparisons 14
Grades 1 - 8 Headcount Grades 1 -8 FTE Grades 9 - 12 Headcount
Increase/ Increase/2012-13 2013-14 Decrease 2012-13 2013-14 Decrease
1,409 1,409 - 1,409.00 1,409.00 -
10,871 11,084 213 10,868.27 11,079.02 210.76
2,675 2,675 - 2,675.00 2,675.00 -
1,229 1,211 (18) 1,229.00 1,211.00 (18.00)
1,903 1,875 (28) 1,903.00 1,875.00 (28.00)
7,569 7,684 115 7,568.38 7,676.32 107.95
621 624 3 621.00 624.00 3.00
1,157 1,130 (27) 1,157.00 1,130.00 (27.00)
664 657 (7) 664.00 657.00 (7.00)
3,966 3,944 (22) 3,966.00 3,944.00 (22.00)
514 511 (3) 514.00 511.00 (3.00)
1,066 1,035 (31) 1,066.00 1,035.00 (31.00)
3,045 3,089 44 3,045.00 3,088.50 43.50
1,981 1,960 (21) 1,981.00 1,960.00 (21.00)
2,466 2,436 (30) 2,466.00 2,436.00 (30.00)
1,348 1,364 16 1,348.00 1,364.00 16.00
6,334 6,346 12 6,334.00 6,346.00 12.00
2,918 2,866 (52) 2,918.00 2,866.00 (52.00)
5,467 5,507 40 5,465.63 5,507.00 41.38
16,845 16,781 (64) 16,845.00 16,781.00 (64.00)
1,506 1,500 (6) 1,506.00 1,500.00 (6.00)
2,239 2,243 4 2,239.00 2,243.00 4.00
3,680 3,590 (90) 3,680.00 3,590.00 (90.00)
4,732 4,702 (30) 4,732.00 4,702.00 (30.00)
2,712 2,722 10 2,706.77 2,715.77 9.00
2,469 2,484 15 2,467.40 2,484.00 16.60
2,051 2,003 (48) 2,051.00 2,003.00 (48.00)
5,529 5,581 52 5,529.00 5,581.00 52.00
2,424 2,376 (48) 2,424.00 2,375.50 (48.50)
2,689 2,667 (22) 2,683.90 2,667.00 (16.90)
6,317 6,511 194 6,317.00 6,504.88 187.88
1,070 1,056 (14) 1,070.00 1,056.00 (14.00)
1,445 1,437 (8) 1,444.10 1,436.21 (7.89)
2,331 2,333 2 2,331.00 2,333.00 2.00
3,103 3,089 (14) 3,103.00 3,089.00 (14.00)
574 542 (32) 574.00 542.00 (32.00)
672 677 5 672.00 677.00 5.00
645 630 (15) 644.13 630.00 (14.13)
2,642 2,656 14 2,642.00 2,656.00 14.00
5,818 5,871 53 5,818.00 5,871.00 53.00
7,372 7,391 19 7,372.00 7,391.00 19.00
2,504 2,552 48 2,504.00 2,551.56 47.56
880 889 9 880.00 889.00 9.00
1,432 1,404 (28) 1,431.02 1,404.00 (27.02)
903 957 54 903.00 957.00 54.00
1,444 1,441 (3) 1,444.00 1,441.00 (3.00)
600 574 (26) 600.00 574.00 (26.00)
783 767 (16) 783.00 767.00 (16.00)
2,312 2,332 20 2,312.00 2,332.00 20.00
4,395 4,314 (81) 4,395.00 4,314.00 (81.00)
826 819 (7) 826.00 819.00 (7.00)
1,590 1,558 (32) 1,590.00 1,558.00 (32.00)
588 585 (3) 588.00 585.00 (3.00)
7,865 7,741 (124) 7,861.20 7,735.90 (125.30)
2,437 2,392 (45) 2,437.00 2,392.00 (45.00)
164,627 164,574 (53) 164,603.78 164,541.66 (62.12)
-107-
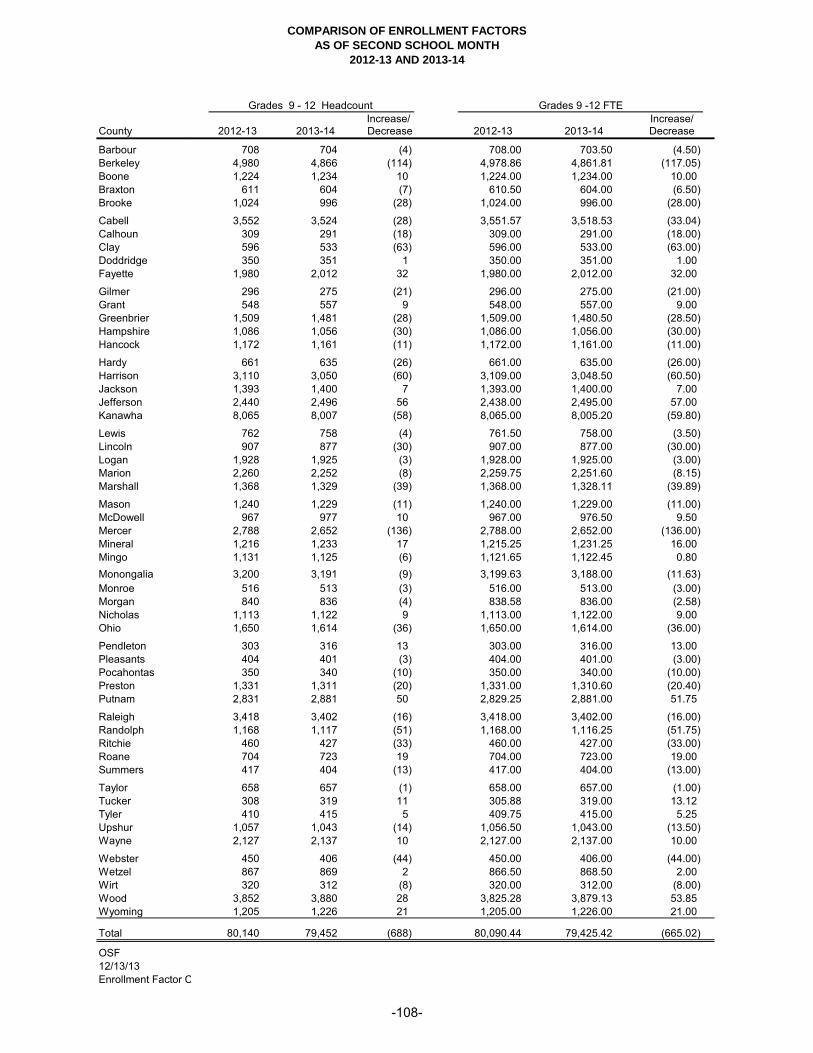
COMPARISON OF ENROLLMENT FACTORS
AS OF SECOND SCHOOL MONTH
2012-13 AND 2013-14
Early Childhood Headcount
County
Barbour
Berkeley
Boone
Braxton
Brooke
Cabell
Calhoun
Clay
Doddridge
Fayette
Gilmer
Grant
Greenbrier
Hampshire
Hancock
Hardy
Harrison
Jackson
Jefferson
Kanawha
Lewis
Lincoln
Logan
Marion
Marshall
Mason
McDowell
Mercer
Mineral
Mingo
Monongalia
Monroe
Morgan
Nicholas
Ohio
Pendleton
Pleasants
Pocahontas
Preston
Putnam
Raleigh
Randolph
Ritchie
Roane
Summers
Taylor
Tucker
Tyler
Upshur
Wayne
Webster
Wetzel
Wirt
Wood
Wyoming
Total
OSF
12/13/13
Enrollment Factor Comparisons 14
Grades 9 - 12 Headcount Grades 9 -12 FTE Grades PK - 12 Headcount
Increase/ Increase/2012-13 2013-14 Decrease 2012-13 2013-14 Decrease
708 704 (4) 708.00 703.50 (4.50)
4,980 4,866 (114) 4,978.86 4,861.81 (117.05)
1,224 1,234 10 1,224.00 1,234.00 10.00
611 604 (7) 610.50 604.00 (6.50)
1,024 996 (28) 1,024.00 996.00 (28.00)
3,552 3,524 (28) 3,551.57 3,518.53 (33.04)
309 291 (18) 309.00 291.00 (18.00)
596 533 (63) 596.00 533.00 (63.00)
350 351 1 350.00 351.00 1.00
1,980 2,012 32 1,980.00 2,012.00 32.00
296 275 (21) 296.00 275.00 (21.00)
548 557 9 548.00 557.00 9.00
1,509 1,481 (28) 1,509.00 1,480.50 (28.50)
1,086 1,056 (30) 1,086.00 1,056.00 (30.00)
1,172 1,161 (11) 1,172.00 1,161.00 (11.00)
661 635 (26) 661.00 635.00 (26.00)
3,110 3,050 (60) 3,109.00 3,048.50 (60.50)
1,393 1,400 7 1,393.00 1,400.00 7.00
2,440 2,496 56 2,438.00 2,495.00 57.00
8,065 8,007 (58) 8,065.00 8,005.20 (59.80)
762 758 (4) 761.50 758.00 (3.50)
907 877 (30) 907.00 877.00 (30.00)
1,928 1,925 (3) 1,928.00 1,925.00 (3.00)
2,260 2,252 (8) 2,259.75 2,251.60 (8.15)
1,368 1,329 (39) 1,368.00 1,328.11 (39.89)
1,240 1,229 (11) 1,240.00 1,229.00 (11.00)
967 977 10 967.00 976.50 9.50
2,788 2,652 (136) 2,788.00 2,652.00 (136.00)
1,216 1,233 17 1,215.25 1,231.25 16.00
1,131 1,125 (6) 1,121.65 1,122.45 0.80
3,200 3,191 (9) 3,199.63 3,188.00 (11.63)
516 513 (3) 516.00 513.00 (3.00)
840 836 (4) 838.58 836.00 (2.58)
1,113 1,122 9 1,113.00 1,122.00 9.00
1,650 1,614 (36) 1,650.00 1,614.00 (36.00)
303 316 13 303.00 316.00 13.00
404 401 (3) 404.00 401.00 (3.00)
350 340 (10) 350.00 340.00 (10.00)
1,331 1,311 (20) 1,331.00 1,310.60 (20.40)
2,831 2,881 50 2,829.25 2,881.00 51.75
3,418 3,402 (16) 3,418.00 3,402.00 (16.00)
1,168 1,117 (51) 1,168.00 1,116.25 (51.75)
460 427 (33) 460.00 427.00 (33.00)
704 723 19 704.00 723.00 19.00
417 404 (13) 417.00 404.00 (13.00)
658 657 (1) 658.00 657.00 (1.00)
308 319 11 305.88 319.00 13.12
410 415 5 409.75 415.00 5.25
1,057 1,043 (14) 1,056.50 1,043.00 (13.50)
2,127 2,137 10 2,127.00 2,137.00 10.00
450 406 (44) 450.00 406.00 (44.00)
867 869 2 866.50 868.50 2.00
320 312 (8) 320.00 312.00 (8.00)
3,852 3,880 28 3,825.28 3,879.13 53.85
1,205 1,226 21 1,205.00 1,226.00 21.00
80,140 79,452 (688) 80,090.44 79,425.42 (665.02)
-108-
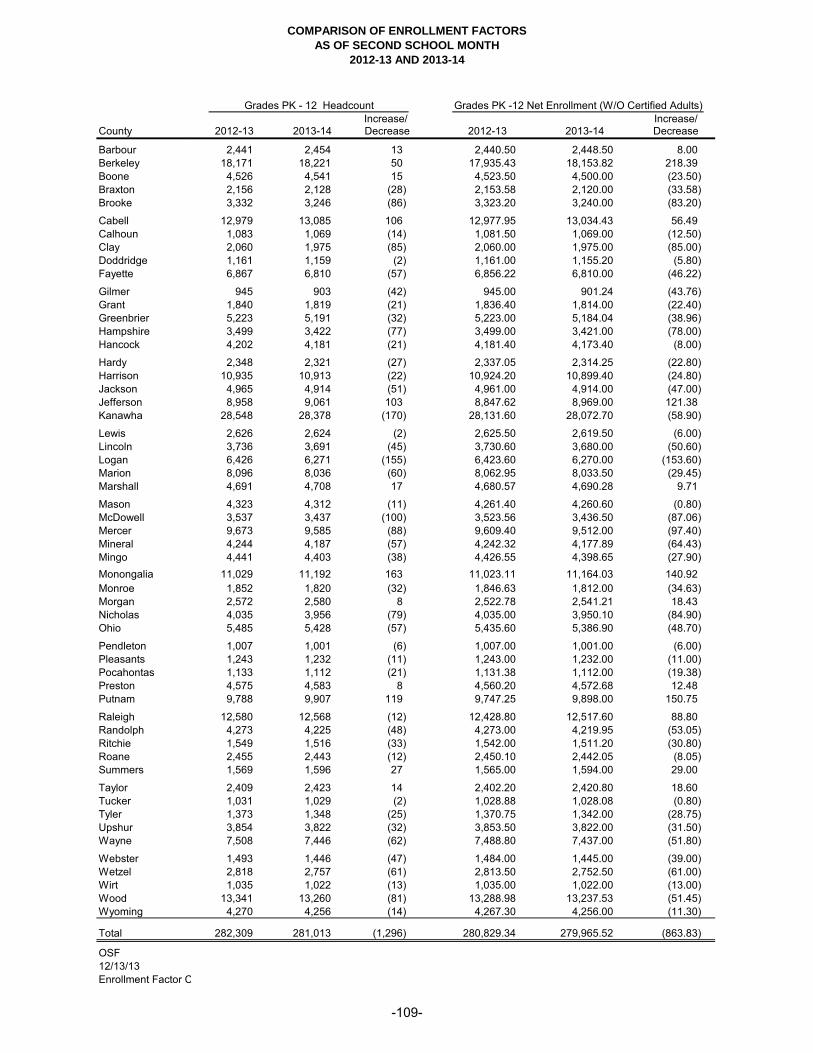
COMPARISON OF ENROLLMENT FACTORS
AS OF SECOND SCHOOL MONTH
2012-13 AND 2013-14
Early Childhood Headcount
County
Barbour
Berkeley
Boone
Braxton
Brooke
Cabell
Calhoun
Clay
Doddridge
Fayette
Gilmer
Grant
Greenbrier
Hampshire
Hancock
Hardy
Harrison
Jackson
Jefferson
Kanawha
Lewis
Lincoln
Logan
Marion
Marshall
Mason
McDowell
Mercer
Mineral
Mingo
Monongalia
Monroe
Morgan
Nicholas
Ohio
Pendleton
Pleasants
Pocahontas
Preston
Putnam
Raleigh
Randolph
Ritchie
Roane
Summers
Taylor
Tucker
Tyler
Upshur
Wayne
Webster
Wetzel
Wirt
Wood
Wyoming
Total
OSF
12/13/13
Enrollment Factor Comparisons 14
Grades PK - 12 Headcount Grades PK -12 Net Enrollment (W/O Certified Adults) Certified Adult Students
Increase/ Increase/2012-13 2013-14 Decrease 2012-13 2013-14 Decrease
2,441 2,454 13 2,440.50 2,448.50 8.00
18,171 18,221 50 17,935.43 18,153.82 218.39
4,526 4,541 15 4,523.50 4,500.00 (23.50)
2,156 2,128 (28) 2,153.58 2,120.00 (33.58)
3,332 3,246 (86) 3,323.20 3,240.00 (83.20)
12,979 13,085 106 12,977.95 13,034.43 56.49
1,083 1,069 (14) 1,081.50 1,069.00 (12.50)
2,060 1,975 (85) 2,060.00 1,975.00 (85.00)
1,161 1,159 (2) 1,161.00 1,155.20 (5.80)
6,867 6,810 (57) 6,856.22 6,810.00 (46.22)
945 903 (42) 945.00 901.24 (43.76)
1,840 1,819 (21) 1,836.40 1,814.00 (22.40)
5,223 5,191 (32) 5,223.00 5,184.04 (38.96)
3,499 3,422 (77) 3,499.00 3,421.00 (78.00)
4,202 4,181 (21) 4,181.40 4,173.40 (8.00)
2,348 2,321 (27) 2,337.05 2,314.25 (22.80)
10,935 10,913 (22) 10,924.20 10,899.40 (24.80)
4,965 4,914 (51) 4,961.00 4,914.00 (47.00)
8,958 9,061 103 8,847.62 8,969.00 121.38
28,548 28,378 (170) 28,131.60 28,072.70 (58.90)
2,626 2,624 (2) 2,625.50 2,619.50 (6.00)
3,736 3,691 (45) 3,730.60 3,680.00 (50.60)
6,426 6,271 (155) 6,423.60 6,270.00 (153.60)
8,096 8,036 (60) 8,062.95 8,033.50 (29.45)
4,691 4,708 17 4,680.57 4,690.28 9.71
4,323 4,312 (11) 4,261.40 4,260.60 (0.80)
3,537 3,437 (100) 3,523.56 3,436.50 (87.06)
9,673 9,585 (88) 9,609.40 9,512.00 (97.40)
4,244 4,187 (57) 4,242.32 4,177.89 (64.43)
4,441 4,403 (38) 4,426.55 4,398.65 (27.90)
11,029 11,192 163 11,023.11 11,164.03 140.92
1,852 1,820 (32) 1,846.63 1,812.00 (34.63)
2,572 2,580 8 2,522.78 2,541.21 18.43
4,035 3,956 (79) 4,035.00 3,950.10 (84.90)
5,485 5,428 (57) 5,435.60 5,386.90 (48.70)
1,007 1,001 (6) 1,007.00 1,001.00 (6.00)
1,243 1,232 (11) 1,243.00 1,232.00 (11.00)
1,133 1,112 (21) 1,131.38 1,112.00 (19.38)
4,575 4,583 8 4,560.20 4,572.68 12.48
9,788 9,907 119 9,747.25 9,898.00 150.75
12,580 12,568 (12) 12,428.80 12,517.60 88.80
4,273 4,225 (48) 4,273.00 4,219.95 (53.05)
1,549 1,516 (33) 1,542.00 1,511.20 (30.80)
2,455 2,443 (12) 2,450.10 2,442.05 (8.05)
1,569 1,596 27 1,565.00 1,594.00 29.00
2,409 2,423 14 2,402.20 2,420.80 18.60
1,031 1,029 (2) 1,028.88 1,028.08 (0.80)
1,373 1,348 (25) 1,370.75 1,342.00 (28.75)
3,854 3,822 (32) 3,853.50 3,822.00 (31.50)
7,508 7,446 (62) 7,488.80 7,437.00 (51.80)
1,493 1,446 (47) 1,484.00 1,445.00 (39.00)
2,818 2,757 (61) 2,813.50 2,752.50 (61.00)
1,035 1,022 (13) 1,035.00 1,022.00 (13.00)
13,341 13,260 (81) 13,288.98 13,237.53 (51.45)
4,270 4,256 (14) 4,267.30 4,256.00 (11.30)
282,309 281,013 (1,296) 280,829.34 279,965.52 (863.83)
-109-
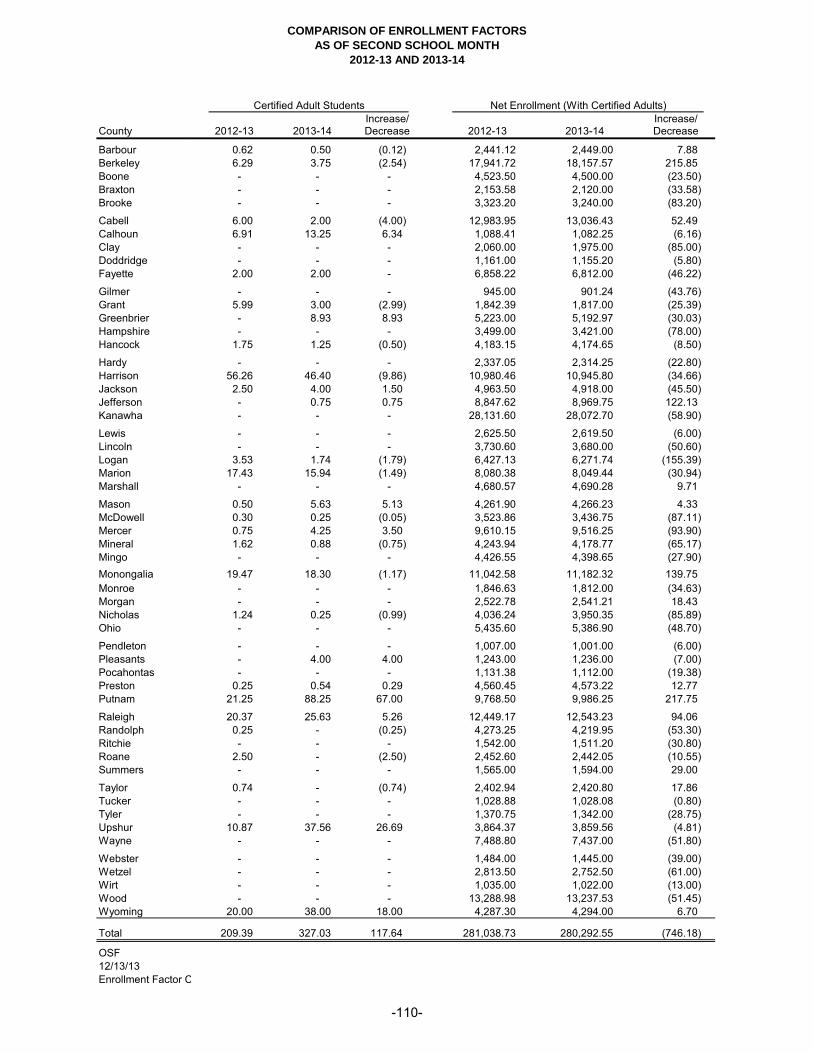
COMPARISON OF ENROLLMENT FACTORS
AS OF SECOND SCHOOL MONTH
2012-13 AND 2013-14
Early Childhood Headcount
County
Barbour
Berkeley
Boone
Braxton
Brooke
Cabell
Calhoun
Clay
Doddridge
Fayette
Gilmer
Grant
Greenbrier
Hampshire
Hancock
Hardy
Harrison
Jackson
Jefferson
Kanawha
Lewis
Lincoln
Logan
Marion
Marshall
Mason
McDowell
Mercer
Mineral
Mingo
Monongalia
Monroe
Morgan
Nicholas
Ohio
Pendleton
Pleasants
Pocahontas
Preston
Putnam
Raleigh
Randolph
Ritchie
Roane
Summers
Taylor
Tucker
Tyler
Upshur
Wayne
Webster
Wetzel
Wirt
Wood
Wyoming
Total
OSF
12/13/13
Enrollment Factor Comparisons 14
Certified Adult Students Net Enrollment (With Certified Adults) Additional Adjustments Below 1,400
Increase/ Increase/2012-13 2013-14 Decrease 2012-13 2013-14 Decrease
0.62 0.50 (0.12) 2,441.12 2,449.00 7.88
6.29 3.75 (2.54) 17,941.72 18,157.57 215.85
- - - 4,523.50 4,500.00 (23.50)
- - - 2,153.58 2,120.00 (33.58)
- - - 3,323.20 3,240.00 (83.20)
6.00 2.00 (4.00) 12,983.95 13,036.43 52.49
6.91 13.25 6.34 1,088.41 1,082.25 (6.16)
- - - 2,060.00 1,975.00 (85.00)
- - - 1,161.00 1,155.20 (5.80)
2.00 2.00 - 6,858.22 6,812.00 (46.22)
- - - 945.00 901.24 (43.76)
5.99 3.00 (2.99) 1,842.39 1,817.00 (25.39)
- 8.93 8.93 5,223.00 5,192.97 (30.03)
- - - 3,499.00 3,421.00 (78.00)
1.75 1.25 (0.50) 4,183.15 4,174.65 (8.50)
- - - 2,337.05 2,314.25 (22.80)
56.26 46.40 (9.86) 10,980.46 10,945.80 (34.66)
2.50 4.00 1.50 4,963.50 4,918.00 (45.50)
- 0.75 0.75 8,847.62 8,969.75 122.13
- - - 28,131.60 28,072.70 (58.90)
- - - 2,625.50 2,619.50 (6.00)
- - - 3,730.60 3,680.00 (50.60)
3.53 1.74 (1.79) 6,427.13 6,271.74 (155.39)
17.43 15.94 (1.49) 8,080.38 8,049.44 (30.94)
- - - 4,680.57 4,690.28 9.71
0.50 5.63 5.13 4,261.90 4,266.23 4.33
0.30 0.25 (0.05) 3,523.86 3,436.75 (87.11)
0.75 4.25 3.50 9,610.15 9,516.25 (93.90)
1.62 0.88 (0.75) 4,243.94 4,178.77 (65.17)
- - - 4,426.55 4,398.65 (27.90)
19.47 18.30 (1.17) 11,042.58 11,182.32 139.75
- - - 1,846.63 1,812.00 (34.63)
- - - 2,522.78 2,541.21 18.43
1.24 0.25 (0.99) 4,036.24 3,950.35 (85.89)
- - - 5,435.60 5,386.90 (48.70)
- - - 1,007.00 1,001.00 (6.00)
- 4.00 4.00 1,243.00 1,236.00 (7.00)
- - - 1,131.38 1,112.00 (19.38)
0.25 0.54 0.29 4,560.45 4,573.22 12.77
21.25 88.25 67.00 9,768.50 9,986.25 217.75
20.37 25.63 5.26 12,449.17 12,543.23 94.06
0.25 - (0.25) 4,273.25 4,219.95 (53.30)
- - - 1,542.00 1,511.20 (30.80)
2.50 - (2.50) 2,452.60 2,442.05 (10.55)
- - - 1,565.00 1,594.00 29.00
0.74 - (0.74) 2,402.94 2,420.80 17.86
- - - 1,028.88 1,028.08 (0.80)
- - - 1,370.75 1,342.00 (28.75)
10.87 37.56 26.69 3,864.37 3,859.56 (4.81)
- - - 7,488.80 7,437.00 (51.80)
- - - 1,484.00 1,445.00 (39.00)
- - - 2,813.50 2,752.50 (61.00)
- - - 1,035.00 1,022.00 (13.00)
- - - 13,288.98 13,237.53 (51.45)
20.00 38.00 18.00 4,287.30 4,294.00 6.70
209.39 327.03 117.64 281,038.73 280,292.55 (746.18)
-110-

COMPARISON OF ENROLLMENT FACTORS
AS OF SECOND SCHOOL MONTH
2012-13 AND 2013-14
Early Childhood Headcount
County
Barbour
Berkeley
Boone
Braxton
Brooke
Cabell
Calhoun
Clay
Doddridge
Fayette
Gilmer
Grant
Greenbrier
Hampshire
Hancock
Hardy
Harrison
Jackson
Jefferson
Kanawha
Lewis
Lincoln
Logan
Marion
Marshall
Mason
McDowell
Mercer
Mineral
Mingo
Monongalia
Monroe
Morgan
Nicholas
Ohio
Pendleton
Pleasants
Pocahontas
Preston
Putnam
Raleigh
Randolph
Ritchie
Roane
Summers
Taylor
Tucker
Tyler
Upshur
Wayne
Webster
Wetzel
Wirt
Wood
Wyoming
Total
OSF
12/13/13
Enrollment Factor Comparisons 14
Additional Adjustments Below 1,400 Net Enrollment (With All Adjustments) Special Education Enrollment (Unduplicated)
Increase/ Increase/ 2012-13 2013-14 Decrease 2012-13 2013-14 Decrease
- - - 2,441.12 2,449.00 7.88
- - - 17,941.72 18,157.57 215.85
- - - 4,523.50 4,500.00 (23.50)
- - - 2,153.58 2,120.00 (33.58)
- - - 3,323.20 3,240.00 (83.20)
- - - 12,983.95 13,036.43 52.49
96.59 97.22 0.63 1,185.00 1,179.47 (5.53)
- - - 2,060.00 1,975.00 (85.00)
78.98 80.23 1.25 1,239.98 1,235.43 (4.55)
- - - 6,858.22 6,812.00 (46.22)
196.17 222.02 25.85 1,141.17 1,123.26 (17.91)
- - - 1,842.39 1,817.00 (25.39)
- - - 5,223.00 5,192.97 (30.03)
- - - 3,499.00 3,421.00 (78.00)
- - - 4,183.15 4,174.65 (8.50)
- - - 2,337.05 2,314.25 (22.80)
- - - 10,980.46 10,945.80 (34.66)
- - - 4,963.50 4,918.00 (45.50)
- - - 8,847.62 8,969.75 122.13
- - - 28,131.60 28,072.70 (58.90)
- - - 2,625.50 2,619.50 (6.00)
- - - 3,730.60 3,680.00 (50.60)
- - - 6,427.13 6,271.74 (155.39)
- - - 8,080.38 8,049.44 (30.94)
- - - 4,680.57 4,690.28 9.71
- - - 4,261.90 4,266.23 4.33
- - - 3,523.86 3,436.75 (87.11)
- - - 9,610.15 9,516.25 (93.90)
- - - 4,243.94 4,178.77 (65.17)
- - - 4,426.55 4,398.65 (27.90)
- - - 11,042.58 11,182.32 139.75
- - - 1,846.63 1,812.00 (34.63)
- - - 2,522.78 2,541.21 18.43
- - - 4,036.24 3,950.35 (85.89)
- - - 5,435.60 5,386.90 (48.70)
328.81 328.62 (0.19) 1,335.81 1,329.62 (6.19)
20.36 21.09 0.73 1,263.36 1,257.09 (6.27)
268.63 288.00 19.38 1,400.00 1,400.00 -
- - - 4,560.45 4,573.22 12.77
- - - 9,768.50 9,986.25 217.75
- - - 12,449.17 12,543.23 94.06
- - - 4,273.25 4,219.95 (53.30)
- - - 1,542.00 1,511.20 (30.80)
- - - 2,452.60 2,442.05 (10.55)
- - - 1,565.00 1,594.00 29.00
- - - 2,402.94 2,420.80 17.86
182.46 179.86 (2.60) 1,211.34 1,207.94 (3.40)
6.68 13.31 6.63 1,377.43 1,355.31 (22.12)
- - - 3,864.37 3,859.56 (4.81)
- - - 7,488.80 7,437.00 (51.80)
- - - 1,484.00 1,445.00 (39.00)
- - - 2,813.50 2,752.50 (61.00)
99.62 102.69 3.07 1,134.62 1,124.69 (9.93)
- - - 13,288.98 13,237.53 (51.45)
- - - 4,287.30 4,294.00 6.70
1,278.30 1,333.04 54.75 282,317.03 281,625.59 (691.44)
-111-

COMPARISON OF ENROLLMENT FACTORS
AS OF SECOND SCHOOL MONTH
2012-13 AND 2013-14
Early Childhood Headcount
County
Barbour
Berkeley
Boone
Braxton
Brooke
Cabell
Calhoun
Clay
Doddridge
Fayette
Gilmer
Grant
Greenbrier
Hampshire
Hancock
Hardy
Harrison
Jackson
Jefferson
Kanawha
Lewis
Lincoln
Logan
Marion
Marshall
Mason
McDowell
Mercer
Mineral
Mingo
Monongalia
Monroe
Morgan
Nicholas
Ohio
Pendleton
Pleasants
Pocahontas
Preston
Putnam
Raleigh
Randolph
Ritchie
Roane
Summers
Taylor
Tucker
Tyler
Upshur
Wayne
Webster
Wetzel
Wirt
Wood
Wyoming
Total
OSF
12/13/13
Enrollment Factor Comparisons 14
Special Education Enrollment (Unduplicated) Advanced Placement, Dual Credit, & Int'l Baccalaureate
Increase/ Increase/2012-13 2013-14 Decrease 2012-13 2013-14 Decrease
432 440 8 57 54 (3)
3,131 3,260 129 519 510 (9)
876 832 (44) 149 132 (17)
457 459 2 85 81 (4)
828 806 (22) 106 99 (7)
2,128 2,142 14 579 553 (26)
156 160 4 28 49 21
284 286 2 71 55 (16)
210 231 21 57 60 3
1,099 1,091 (8) 271 303 32
162 162 - 19 26 7
318 333 15 64 72 8
944 942 (2) 210 148 (62)
655 635 (20) 108 82 (26)
841 868 27 107 108 1
360 343 (17) 100 96 (4)
2,229 2,241 12 488 441 (47)
913 911 (2) 191 263 72
1,232 1,312 80 405 416 11
4,432 4,431 (1) 1,212 1,217 5
479 455 (24) 92 85 (7)
748 819 71 79 75 (4)
837 834 (3) 273 217 (56)
1,231 1,199 (32) 485 453 (32)
782 812 30 273 263 (10)
673 700 27 186 229 43
663 688 25 70 85 15
1,439 1,429 (10) 263 249 (14)
814 825 11 161 181 20
673 658 (15) 203 148 (55)
2,179 2,205 26 761 876 115
295 303 8 262 284 22
350 361 11 91 93 2
798 731 (67) 100 124 24
956 937 (19) 271 309 38
194 183 (11) 43 55 12
250 245 (5) 35 39 4
201 184 (17) 56 38 (18)
943 927 (16) 189 200 11
1,815 1,872 57 495 533 38
1,796 1,809 13 447 421 (26)
797 768 (29) 128 148 20
284 259 (25) 57 80 23
382 369 (13) 51 69 18
214 235 21 41 42 1
380 387 7 69 94 25
179 194 15 59 74 15
270 273 3 76 52 (24)
695 730 35 96 89 (7)
1,370 1,428 58 181 194 13
217 203 (14) 117 105 (12)
514 518 4 126 130 4
141 155 14 46 47 1
2,423 2,449 26 643 751 108
849 855 6 156 221 65
48,518 48,884 366 11,507 11,818 311
-112-

PERSONNEL
DATA


COUNTY BOARDS OF EDUCATION
NUMBER OF PERSONNEL EMPLOYED (FTE BASIS)
(EXCLUDES RESA PERSONNEL)
ALL FUNDING SOURCES
2013-14 YEAR
Professional Personnel:
Administrators:
Central Office Administrators: FTE
Superintendent (*) 55.00
Deputy Associate, or Assistant Superintendent (*) 61.10
Administrative Assistant 16.00
Director/Manager (Instructional) (*) 198.01
Director/Manager Supportive Services 198.03
Chief School Business Official 54.50
Director of Child Nutrition 26.80
Total Central Office Administrators 609.44
School Administrators:
Principals:
Elementary (*) 406.90
Middle/Junior High (*) 131.50
High School (*) 131.50
Combined (*) 24.50
Total Principals 694.40
Assistant Principals:
Elementary (*) 74.90
Middle/Junior High (*) 120.86
High School (*) 207.85
Combined (*) 15.50
Total Assistant Principals 419.11
Total School Administrators 1,113.51
Total Administrators 1,722.95
Classroom Teachers (K - 12):
Head Teacher (#) 19.50
Teacher Pre-K (#) 366.67
Kindergarten (#) 1,094.50
Elementary (#) 6,300.51
Middle/Junior High (#) 3,426.62
High School (#) 4,135.84
Special Education (#) 3,300.48
Homebound (#) 19.50
Vocational (K-12) (#) 904.00
JROTC Instructor (#) 65.00
Permanent Substitutes (#) 36.60
Total Classroom Teachers 19,669.21
OSF
12/30/13
AllPer14 FTE
-113-

COUNTY BOARDS OF EDUCATION
NUMBER OF PERSONNEL EMPLOYED (FTE BASIS)
(EXCLUDES RESA PERSONNEL)
ALL FUNDING SOURCES
2013-14 YEAR
Professional Student Support Personnel: FTE
Counselor (@) 723.14
School Nurse (AB) (@) 281.22
Total Professional Student Support Personnel 1,004.36
Other Instructional Staff:
Curriculum Specialist (*) 136.89
Librarian (#) 311.53
Psychologist (#) 122.00
Speech Language Pathologist (#) 443.80
Speech Assistant (#) 36.60
Remedial Specialist (#) 379.95
Academic Coach (#) 118.00
Activities Director (*) 9.50
Attendance Director (#) 72.98
Curriculum Enrichment Instructor 9.00
Technology Integration Specialist (#) 122.65
Total Other Instructional Staff 1,762.90
Other Support Staff:
School Nurse (Below AB) 5.50
Registered Nurse 5.00
Attendance Officer (*) 12.50
Social Worker 43.32
Dental Hygienist 1.50
Professional Educational Interpreter 2.00
Physical Therapist 22.25
Occupational Therapist 39.50
Athletic Trainer 7.00
Audiologist 3.00
Psychometrist 2.00
Professional Accountant 41.00
Technology Systems Specialist 98.00
Total Other Support Staff 282.57
Total Pre-K - 12 Grade Professional Personnel 24,441.99
Adult Teachers:
Vocational (Post Secondary) 86.28
Vocational (Adult) 67.05
Community Education 10.00
Total Adult Teachers 163.33
Total Professional Educators - PK-12 23,867.59
Total Professional Personnel 24,605.32
OSF
12/30/13
AllPer14 FTE
-114-
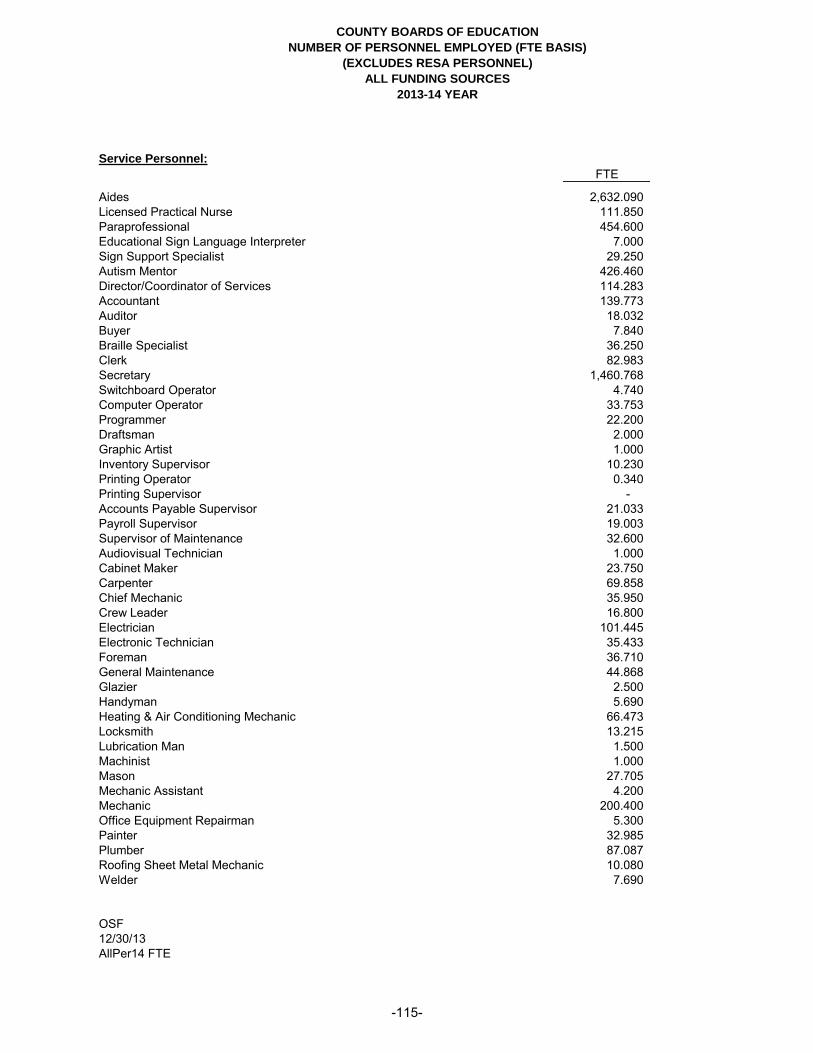
COUNTY BOARDS OF EDUCATION
NUMBER OF PERSONNEL EMPLOYED (FTE BASIS)
(EXCLUDES RESA PERSONNEL)
ALL FUNDING SOURCES
2013-14 YEAR
Service Personnel:
FTE
Aides 2,632.090
Licensed Practical Nurse 111.850
Paraprofessional 454.600
Educational Sign Language Interpreter 7.000
Sign Support Specialist 29.250
Autism Mentor 426.460
Director/Coordinator of Services 114.283
Accountant 139.773
Auditor 18.032
Buyer 7.840
Braille Specialist 36.250
Clerk 82.983
Secretary 1,460.768
Switchboard Operator 4.740
Computer Operator 33.753
Programmer 22.200
Draftsman 2.000
Graphic Artist 1.000
Inventory Supervisor 10.230
Printing Operator 0.340
Printing Supervisor -
Accounts Payable Supervisor 21.033
Payroll Supervisor 19.003
Supervisor of Maintenance 32.600
Audiovisual Technician 1.000
Cabinet Maker 23.750
Carpenter 69.858
Chief Mechanic 35.950
Crew Leader 16.800
Electrician 101.445
Electronic Technician 35.433
Foreman 36.710
General Maintenance 44.868
Glazier 2.500
Handyman 5.690
Heating & Air Conditioning Mechanic 66.473
Locksmith 13.215
Lubrication Man 1.500
Machinist 1.000
Mason 27.705
Mechanic Assistant 4.200
Mechanic 200.400
Office Equipment Repairman 5.300
Painter 32.985
Plumber 87.087
Roofing Sheet Metal Mechanic 10.080
Welder 7.690
OSF
12/30/13
AllPer14 FTE
-115-

COUNTY BOARDS OF EDUCATION
NUMBER OF PERSONNEL EMPLOYED (FTE BASIS)
(EXCLUDES RESA PERSONNEL)
ALL FUNDING SOURCES
2013-14 YEAR
Service Personnel (Continued):
FTE
Supervisor of Transportation 34.000
School Bus Supervisor 11.750
Bus Operator 2,896.460
Heavy Equipment Operator 11.525
Truck Driver 51.135
Food Services Supervisor 3.200
Cafeteria Manager 423.440
Cooks 1,773.080
Custodian 2,210.479
Groundsman 4.950
Watchman 2.300
Sanitation Plant Operator 16.150
Total Service Personnel 13,938.19
TOTAL ALL PERSONNEL 38,543.509
Legend - Professional Personnel:
OSF
12/30/13
AllPer14 FTE
(*) Denotes positions defined in WVC §18-9A-2 as professional educators that are eligible for funding under the PSSP.
(#) Denotes positions defined as professional educators that are further considered professional instructional personnel.
(@) Denotes positions defined as professional educators that are further considered prof. student support personnel.
-116-

CLASSIFICATION OF PROFESSIONAL PERSONNEL
BY ASSIGNMENT AND FUNDING SOURCE (FTE BASIS)
AS OF SECOND SCHOOL MONTH
(EXCLUDING RESA PERSONNEL)
2013-14 YEAR
State Aid Other State Federal County OtherPosition Assignment Eligible Funds Funds Funds Donations Sources Total
Superintendent 55.00 - - - - - 55.00
Deputy, Assoc. or Asst. Supt. 57.55 0.50 2.05 1.00 - - 61.10
Administrative Assistant - - - 16.00 - - 16.00
Director/Manager (Instructional) 131.96 4.92 59.09 2.04 - - 198.01
Director/Manager (Supportive Serv) - 2.25 2.17 193.62 - - 198.03
Treasurer/Chief School Business Off. - - - 54.50 - - 54.50
Child Nutrition Director - - 1.50 25.30 - - 26.80
Principal, Elementary 405.90 - 1.00 - - - 406.90
Principal, Middle/Junior High 131.50 - - - - - 131.50
Principal, High School 130.00 0.50 1.00 - - - 131.50
Principal, Combined 23.00 1.50 - - - - 24.50
Asst. Principal, Elementary 67.40 - 7.50 - - - 74.90
Asst. Principal, Middle/Jr High 119.86 - 1.00 - - - 120.86
Asst. Principal, High School 205.85 1.50 0.50 - - - 207.85
Asst. Principal, Combined 15.50 - - - - - 15.50
Head Teacher 16.50 1.00 2.00 - - - 19.50
Academic Coach 37.40 2.46 78.14 - - - 118.00
Curriculum Specialist 54.04 2.00 79.85 1.00 - - 136.89
Technology Integration Specialist 62.36 - 60.29 - - - 122.65
Librarian 309.53 - - 2.00 - - 311.53
Remedial Specialist 22.45 1.00 356.50 - - - 379.95
Counselor, Elementary 244.30 1.00 6.50 3.00 - - 254.80
Counselor, Middle/Junior High 153.50 0.50 1.75 1.00 - - 156.75
Counselor, High 268.19 4.50 3.65 3.00 - - 279.34
Counselor, Combined 27.15 1.50 3.60 - - - 32.25
Teacher, Pre-Kindergarten 335.67 - 31.00 - - - 366.67
Teacher, Kindergarten 1,092.50 - 1.00 1.00 - - 1,094.50
Teacher, Elementary 5,878.99 12.50 405.02 4.00 - - 6,300.51
Teacher, Middle/Junior High 3,377.62 13.25 29.75 6.00 - - 3,426.62
Teacher, High School 4,098.81 15.30 9.23 12.50 - - 4,135.84
Teacher, Special Education 3,014.84 8.80 264.34 11.50 1.00 - 3,300.48
Teacher, Homebound 19.50 - - - - - 19.50
Teacher, Vocational (K-12) 879.75 7.00 6.25 11.00 - - 904.00
Teacher, Vocational (PS) - 83.28 0.50 2.50 - - 86.28
Teacher, Vocational (Adult) - 10.32 9.48 47.25 - - 67.05
Teacher, Community Education - 5.00 3.00 2.00 - - 10.00
JROTC Instructor, Middle/Jr High - - - - - - -
JROTC Instructor, High 39.70 - 14.30 10.50 - 0.50 65.00
Permanent Substitute, Elementary 12.60 - 2.00 - - - 14.60
Permanent Substitute, Middle/Jr. 8.00 - - - - - 8.00
Permanent Substitute, High 14.00 - - - - - 14.00
Speech Language Pathologist 419.62 - 22.18 2.00 - - 443.80
Speech Assistant - PE 25.10 1.00 10.50 - - - 36.60
Curriculum Enrichment Instructor - 1.00 - 2.00 6.00 - 9.00
Professional Accountant - - 1.00 40.00 - - 41.00
Activities Director 9.50 - - - - - 9.50
Technology Systems Specialist 9.54 27.89 - 60.57 - - 98.00
Psychologist 107.60 4.00 10.40 - - - 122.00
Registered Nurse - - - 5.00 - - 5.00
School Nurse (Below AB) - - - 5.50 - - 5.50
School Nurse (AB) 269.37 4.60 3.87 3.00 - 0.38 281.22
Attendance Director 59.98 1.00 4.50 7.50 - - 72.98
Attendance Officer 11.35 - 1.15 - - - 12.50
Social Worker - 1.32 26.50 15.50 - - 43.32
Professional Educational Interpreter - - - 2.00 - - 2.00
Physical Therapist - - 5.00 17.25 - - 22.25
Occupational Therapist - - 16.55 22.95 - - 39.50
Athletic Trainer - - - 7.00 - - 7.00
Dental Hygienist - - - 1.50 - - 1.50
Audiologist - - 1.00 2.00 - - 3.00
Psychometrist - - 1.00 1.00 - - 2.00
Total 22,222.97 221.38 1,547.61 605.48 7.00 0.88 24,605.32
OSF
12/30/13
Classification Report 14 -117-

CLASSIFICATION OF SERVICE PERSONNEL
BY ASSIGNMENT AND FUNDING SOURCE (FTE BASIS)*
AS OF SECOND SCHOOL MONTH
(EXCLUDING RESA PERSONNEL)
2013-14 YEAR
State Aid Other State Federal County Other
Position Assignment Eligible Funds Funds Funds Donations Sources Total
Aide 2,178.24 10.00 440.85 - - 3.00 2,632.09
Licensed Practical Nurse 96.45 - 15.40 - - - 111.85
Paraprofessional 366.20 3.00 85.41 - - - 454.60
Educational Sign Language Interpreter 5.00 - 1.00 1.00 - - 7.00
Sign Support Specialist 20.25 - 9.00 - - - 29.25
Autism Mentor 288.64 1.00 136.82 - - - 426.46
Director or Coordinator of Services 110.03 - 4.25 - - - 114.28
Accountant 133.98 0.50 5.29 - - - 139.77
Auditor 17.53 - 0.50 - - - 18.03
Buyer 7.84 - - - - - 7.84
Braille/Sign Language Specialist 26.25 - 10.00 - - - 36.25
Clerk 80.19 - 2.79 - - - 82.98
Secretary 1,383.20 11.50 64.99 - - 1.08 1,460.77
Switchboard Operator/Receptionist 4.69 - 0.05 - - - 4.74
Computer Operator 16.75 - 17.00 - - - 33.75
Programmer 22.20 - - - - - 22.20
Draftsman 2.00 - - - - - 2.00
Graphic Artist 1.00 - - - - - 1.00
Inventory Supervisor 10.23 - - - - - 10.23
Printing Operator 0.34 - - - - - 0.34
Printing Supervisor - - - - - - -
Accounts Payable Supervisor 21.03 - - - - - 21.03
Payroll Supervisor 19.00 - - - - - 19.00
Supervisor of Maintenance 32.60 - - - - - 32.60
Audiovisual Technician 1.00 - - - - - 1.00
Cabinet Maker 23.75 - - - - - 23.75
Carpenter 68.86 1.00 - - - - 69.86
Chief Mechanic 35.95 - - - - - 35.95
Crew Leader 16.80 - - - - - 16.80
Electrician 101.45 - - - - - 101.45
Electronic Technician 33.43 2.00 - - - - 35.43
Foreman 36.71 - - - - - 36.71
General Maintenance 44.87 - - - - - 44.87
Glazier 2.50 - - - - - 2.50
Handyman 5.69 - - - - - 5.69
Heating & Air Conditioning Mechanic 66.47 - - - - - 66.47
Locksmith 13.22 - - - - - 13.22
Lubrication Man 1.50 - - - - - 1.50
Machinist 1.00 - - - - - 1.00
Mason 27.71 - - - - - 27.71
Mechanic Assistant 4.20 - - - - - 4.20
Mechanic 200.40 - - - - - 200.40
Office Equipment Repairman 5.30 - - - - - 5.30
Painter 32.99 - - - - - 32.99
Plumber 87.09 - - - - - 87.09
Roofing/Sheet Metal Mechanic 10.08 - - - - - 10.08
Welder 7.69 - - - - - 7.69
Supervisor of Transportation 34.00 - - - - - 34.00
School Bus Supervisor 11.75 - - - - - 11.75
Bus Operator 2,888.96 - 7.50 - - - 2,896.46
Heavy Equipment Operator 11.53 - - - - - 11.53
Truck Driver 51.14 - - - - - 51.14
Food Services Supervisor 3.20 - - - - - 3.20
Cafeteria Manager 423.44 - - - - - 423.44
Cook 1,773.08 - - - - - 1,773.08
Custodian 2,206.07 0.16 3.25 1.00 - - 2,210.48
Groundsman 4.95 - - - - - 4.95
Watchman 2.30 - - - - - 2.30
Sanitation Plant Operator 16.15 - - - - - 16.15
Total 13,098.85 29.16 804.10 2.00 - 4.08 13,938.19
OSF
12/30/13
Classification Report 14
Note: Service personnel are presented on a regular FTE basis with full-time personnel employed beyond 200 days counted as 1.00, as
opposed to an extended FTE basis where the FTE is determined by dividing each employee's number of days employed by 200 days.
-118-

COUNTY BOARDS OF EDUCATIONPROFESSIONAL PERSONNEL DISTRIBUTION REPORTS BY YEARS OF
EXPERIENCE AND SALARY CLASSIFICATION - ALL FUNDING SOURCESFOR THE 2013-14 YEAR
Yrs Exp. 3rd Class AB AB+15 MA MA+15 MA+30 MA+45 DR Total0 9.00 775.11 41.50 222.00 33.50 36.50 28.50 5.00 1,151.11 1 3.00 635.10 67.50 189.00 69.50 31.00 22.00 3.00 1,020.10 2 3.00 514.10 111.00 201.94 91.00 54.00 44.00 1.00 1,020.04 3 2.00 398.00 187.50 196.49 93.00 57.50 51.00 3.50 988.99 4 - 317.00 195.00 188.00 119.00 74.98 65.50 2.00 961.48 5 1.00 311.00 202.00 173.50 124.50 108.50 83.00 2.00 1,005.50 6 3.00 286.30 201.00 160.50 155.00 97.50 77.50 3.50 984.30 7 3.00 241.50 213.00 182.50 137.50 106.50 123.00 3.00 1,010.00 8 2.00 183.50 225.50 150.50 146.50 107.00 121.50 3.00 939.50 9 1.00 150.00 201.00 131.45 131.00 133.00 131.00 2.00 880.45 10 1.00 131.00 173.00 100.00 125.00 95.50 150.50 1.50 777.50 11 3.00 93.60 165.50 105.50 115.60 91.00 130.50 7.50 712.20 12 2.00 74.25 186.50 79.60 94.00 115.00 116.00 5.00 672.35 13 2.00 66.22 163.50 57.00 94.00 92.00 120.00 2.00 596.72 14 - 61.50 179.40 73.50 88.10 109.00 158.50 6.00 676.00 15 2.00 52.00 143.50 58.00 94.50 126.50 156.50 4.00 637.00 16 1.00 45.00 173.80 45.00 61.00 103.00 161.00 2.00 591.80 17 2.00 28.00 147.30 43.00 78.50 97.00 140.00 6.00 541.80 18 1.00 25.00 117.00 36.50 56.00 88.00 129.50 6.00 459.00 19 - 24.50 105.00 30.50 58.00 84.00 148.50 3.00 453.50 20 1.00 19.75 112.50 27.00 45.50 65.00 148.63 8.00 427.38 21 2.00 17.00 94.00 15.00 46.00 66.50 168.00 5.00 413.50 22 - 17.00 117.50 23.00 33.00 57.00 131.50 5.00 384.00 23 - 16.00 115.50 26.00 39.00 75.50 179.00 3.00 454.00 24 - 22.50 138.00 26.00 41.00 92.00 202.00 3.00 524.50 25 - 17.00 147.50 20.00 34.00 58.00 233.50 7.00 517.00 26 - 15.00 129.00 22.00 53.00 67.00 188.50 2.00 476.50 27 - 13.00 150.00 20.00 47.00 75.00 218.00 3.00 526.00 28 1.00 17.00 139.00 25.00 41.00 69.00 229.00 6.00 527.00 29 - 13.00 120.00 16.50 43.00 76.00 252.50 8.00 529.00 30 - 11.00 141.00 19.50 35.00 55.00 236.50 7.00 505.00 31 - 8.75 98.00 15.00 25.80 76.00 203.75 5.00 432.30 32 1.00 9.50 75.10 16.50 28.10 47.00 220.00 9.00 406.20 33 - 11.00 86.50 15.00 18.00 58.50 220.00 6.00 415.00 34 1.00 4.00 81.00 17.00 19.00 57.00 226.00 5.00 410.00 35 - 5.00 69.00 13.00 22.00 43.00 193.00 4.00 349.00 36 - 3.00 43.00 10.00 14.50 34.00 190.00 2.00 296.50 37 - 7.00 34.00 9.00 16.00 30.00 142.50 3.00 241.50 38 - 2.00 47.00 6.00 6.50 29.00 145.50 3.00 239.00 39 - 6.00 28.50 8.00 7.00 15.00 91.00 2.00 157.50 40 - 1.00 11.00 1.00 4.00 13.00 69.50 1.50 101.00 41 - - 7.00 4.00 3.00 12.00 43.00 - 69.00 42 - 1.00 9.00 1.00 1.00 4.00 29.60 4.00 49.60 43 - 0.50 4.00 2.00 1.00 7.00 24.00 1.00 39.50 44 - - 2.00 1.00 - 1.00 10.00 1.00 15.00 45 - - 3.00 - - - 2.00 - 5.00 46 - - - - 1.00 2.00 1.00 - 4.00 47 - - 2.00 - - - - - 2.00 48 - - - - - 1.00 1.00 - 2.00 49 - - - - - 1.00 - - 1.00 50 - - - - - - 2.00 - 2.00 51 - - 1.00 - - - 2.00 - 3.00 56 - - - - - - - 1.00 1.00 57 - - - - 1.00 - - - 1.00
Total 47.00 4,649.68 5,204.60 2,782.98 2,590.60 2,993.98 6,160.98 175.50 24,605.32
Note: Excludes RESA personnel.
OSF02/18/14Pers. Distributriton Reports - 14 (All Funding Sources) -119-

COUNTY BOARDS OF EDUCATIONSERVICE PERSONNEL DISTRIBUTION REPORTS BY YEARS OF
EXPERIENCE AND PAY GRADE - ALL FUNDING SOURCESFOR THE 2013-14 YEAR
Yrs. Exp A B C D E F G H Total0 38.500 58.000 126.500 147.500 65.000 55.500 28.990 1.000 520.990 1 54.500 70.000 159.000 203.000 72.500 68.000 35.500 3.000 665.500 2 66.500 75.500 147.000 280.500 102.500 58.000 30.000 2.000 762.000 3 65.000 64.500 149.500 220.500 89.700 92.500 30.500 9.000 721.200 4 47.500 55.000 131.500 220.500 102.000 80.160 48.340 10.000 695.000 5 24.500 68.500 146.013 209.000 91.100 71.500 42.900 12.000 665.513 6 20.500 78.500 143.000 239.500 80.500 83.000 61.500 31.000 737.500 7 16.000 84.500 126.550 208.000 94.000 76.000 57.500 19.000 681.550 8 7.500 87.500 120.013 228.000 46.500 68.500 54.500 12.000 624.513 9 11.500 50.500 134.000 199.000 44.000 80.000 58.700 15.800 593.500 10 6.500 46.500 108.000 187.010 43.500 57.660 65.340 10.000 524.510 11 5.000 38.500 99.013 181.500 31.000 72.500 60.500 16.000 504.013 12 4.000 58.500 93.000 177.500 56.500 54.400 57.500 17.000 518.400 13 4.000 48.000 96.000 163.000 40.000 71.500 58.000 15.000 495.500 14 6.000 49.500 88.000 150.500 42.000 63.000 51.500 9.000 459.500 15 2.500 39.500 86.000 149.000 34.500 61.500 44.700 18.800 436.500 16 2.000 32.000 60.500 156.500 45.500 58.000 56.000 16.000 426.500 17 6.000 22.000 63.000 129.700 39.000 46.000 46.800 9.000 361.500 18 2.000 27.500 66.000 127.000 32.000 32.500 47.500 16.000 350.500 19 2.000 20.500 55.500 117.000 31.500 37.500 36.000 20.000 320.000 20 4.000 13.000 49.000 100.000 19.000 33.500 39.000 9.000 266.500 21 - 17.500 30.000 74.000 16.000 27.500 31.000 5.000 201.000 22 1.000 10.500 35.500 59.500 13.000 19.500 23.000 8.000 170.000 23 4.000 13.500 36.000 82.000 14.500 26.500 24.000 4.000 204.500 24 3.500 10.500 33.500 91.000 20.000 45.000 29.000 12.500 245.000 25 2.000 14.500 35.500 92.000 13.000 34.000 32.000 7.000 230.000 26 2.000 3.500 36.000 76.000 22.000 30.000 35.500 3.500 208.500 27 3.000 8.500 32.000 57.000 10.000 15.000 34.000 10.000 169.500 28 1.000 5.500 18.000 53.000 17.000 29.000 17.000 11.000 151.500 29 2.000 1.000 19.000 52.000 14.000 20.000 21.000 4.000 133.000 30 1.000 2.000 15.000 48.700 11.000 18.000 17.300 9.000 122.000 31 2.000 1.000 12.000 30.000 16.000 15.000 7.000 10.000 93.000 32 3.000 1.000 13.000 31.000 10.000 16.000 18.000 10.000 102.000 33 1.000 1.000 13.000 46.000 14.000 16.000 24.500 13.000 128.500 34 - - 15.000 32.000 11.000 12.000 23.000 10.000 103.000 35 1.000 2.000 11.500 22.000 6.000 13.500 15.000 14.000 85.000 36 1.000 1.000 4.000 16.000 4.000 7.000 14.000 6.000 53.000 37 - - 7.000 15.000 5.000 8.000 9.000 2.000 46.000 38 - 1.000 4.000 11.000 5.000 3.000 12.000 4.000 40.000 39 - - 4.000 9.000 2.000 4.000 10.000 6.000 35.000 40 1.000 - 2.000 3.500 2.500 11.000 6.000 - 26.000 41 - - - 2.000 6.000 1.000 3.000 5.000 17.000 42 - - 1.000 5.000 4.000 8.000 4.000 1.000 23.000 43 - - - 1.000 2.000 2.000 2.000 1.000 8.000 44 - - - 1.000 - 1.000 2.000 1.000 5.000 45 - - - - 1.000 2.000 - - 3.000 46 - - - - 1.000 - - - 1.000 47 - - - - - - 1.000 - 1.000 50 - - - - - - 1.000 - 1.000 51 - - - - - 1.000 - - 1.000 53 - - - 1.000 - - - - 1.000
Total 424.500 1,182.000 2,624.089 4,704.910 1,442.300 1,706.220 1,426.570 427.600 13,938.189
OSF02/18/14Pers. Distributriton Reports - 14 (All Funding Sources)
Note: (1) Excludes RESA personnel. (2) The FTE utilized for service personnel is the regular FTE, not the extended FTE utilized for state aid funding purposes. Employees working in excess of 200 daysare treated as a 1.0 FTE.
-120-
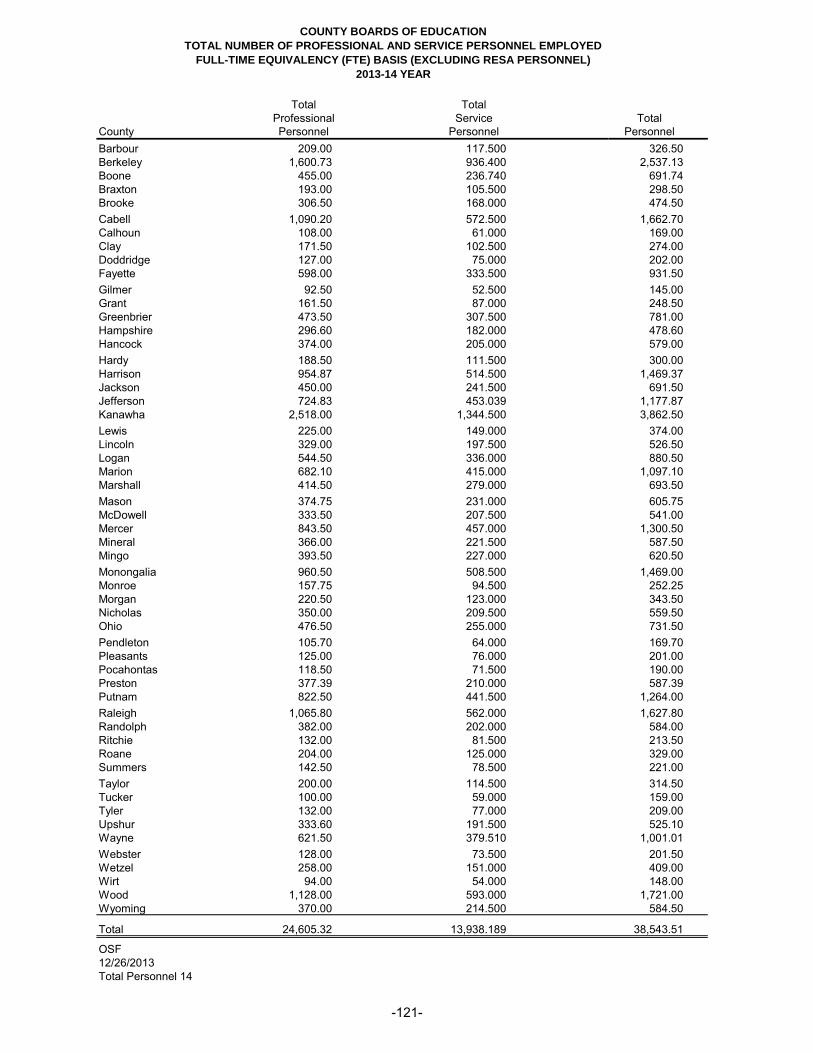
COUNTY BOARDS OF EDUCATION
TOTAL NUMBER OF PROFESSIONAL AND SERVICE PERSONNEL EMPLOYED
FULL-TIME EQUIVALENCY (FTE) BASIS (EXCLUDING RESA PERSONNEL)
2013-14 YEAR
Total Total
Professional Service Total
County Personnel Personnel Personnel
Barbour 209.00 117.500 326.50
Berkeley 1,600.73 936.400 2,537.13
Boone 455.00 236.740 691.74
Braxton 193.00 105.500 298.50
Brooke 306.50 168.000 474.50
Cabell 1,090.20 572.500 1,662.70
Calhoun 108.00 61.000 169.00
Clay 171.50 102.500 274.00
Doddridge 127.00 75.000 202.00
Fayette 598.00 333.500 931.50
Gilmer 92.50 52.500 145.00
Grant 161.50 87.000 248.50
Greenbrier 473.50 307.500 781.00
Hampshire 296.60 182.000 478.60
Hancock 374.00 205.000 579.00
Hardy 188.50 111.500 300.00
Harrison 954.87 514.500 1,469.37
Jackson 450.00 241.500 691.50
Jefferson 724.83 453.039 1,177.87
Kanawha 2,518.00 1,344.500 3,862.50
Lewis 225.00 149.000 374.00
Lincoln 329.00 197.500 526.50
Logan 544.50 336.000 880.50
Marion 682.10 415.000 1,097.10
Marshall 414.50 279.000 693.50
Mason 374.75 231.000 605.75
McDowell 333.50 207.500 541.00
Mercer 843.50 457.000 1,300.50
Mineral 366.00 221.500 587.50
Mingo 393.50 227.000 620.50
Monongalia 960.50 508.500 1,469.00
Monroe 157.75 94.500 252.25
Morgan 220.50 123.000 343.50
Nicholas 350.00 209.500 559.50
Ohio 476.50 255.000 731.50
Pendleton 105.70 64.000 169.70
Pleasants 125.00 76.000 201.00
Pocahontas 118.50 71.500 190.00
Preston 377.39 210.000 587.39
Putnam 822.50 441.500 1,264.00
Raleigh 1,065.80 562.000 1,627.80
Randolph 382.00 202.000 584.00
Ritchie 132.00 81.500 213.50
Roane 204.00 125.000 329.00
Summers 142.50 78.500 221.00
Taylor 200.00 114.500 314.50
Tucker 100.00 59.000 159.00
Tyler 132.00 77.000 209.00
Upshur 333.60 191.500 525.10
Wayne 621.50 379.510 1,001.01
Webster 128.00 73.500 201.50
Wetzel 258.00 151.000 409.00
Wirt 94.00 54.000 148.00
Wood 1,128.00 593.000 1,721.00
Wyoming 370.00 214.500 584.50
Total 24,605.32 13,938.189 38,543.51
OSF
12/26/2013
Total Personnel 14
-121-
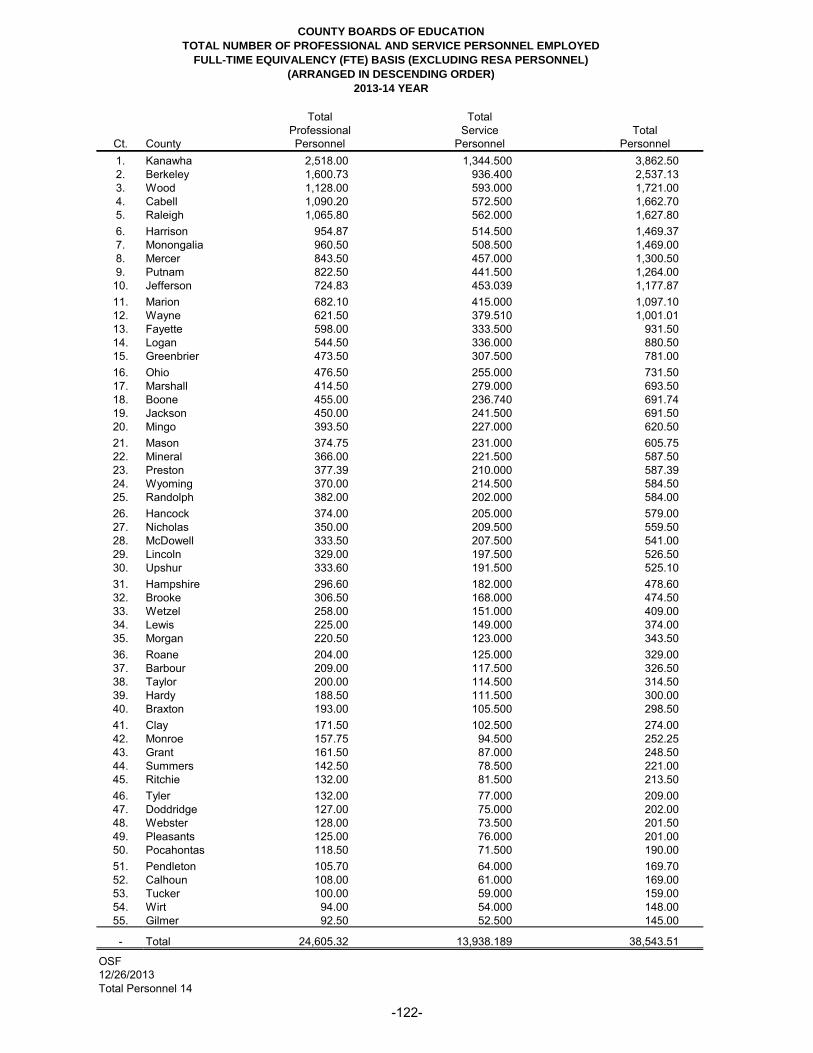
COUNTY BOARDS OF EDUCATION
TOTAL NUMBER OF PROFESSIONAL AND SERVICE PERSONNEL EMPLOYED
FULL-TIME EQUIVALENCY (FTE) BASIS (EXCLUDING RESA PERSONNEL)
(ARRANGED IN DESCENDING ORDER)
2013-14 YEAR
Total Total
Professional Service Total
Ct. County Personnel Personnel Personnel
1. Kanawha 2,518.00 1,344.500 3,862.50
2. Berkeley 1,600.73 936.400 2,537.13
3. Wood 1,128.00 593.000 1,721.00
4. Cabell 1,090.20 572.500 1,662.70
5. Raleigh 1,065.80 562.000 1,627.80
6. Harrison 954.87 514.500 1,469.37
7. Monongalia 960.50 508.500 1,469.00
8. Mercer 843.50 457.000 1,300.50
9. Putnam 822.50 441.500 1,264.00
10. Jefferson 724.83 453.039 1,177.87
11. Marion 682.10 415.000 1,097.10
12. Wayne 621.50 379.510 1,001.01
13. Fayette 598.00 333.500 931.50
14. Logan 544.50 336.000 880.50
15. Greenbrier 473.50 307.500 781.00
16. Ohio 476.50 255.000 731.50
17. Marshall 414.50 279.000 693.50
18. Boone 455.00 236.740 691.74
19. Jackson 450.00 241.500 691.50
20. Mingo 393.50 227.000 620.50
21. Mason 374.75 231.000 605.75
22. Mineral 366.00 221.500 587.50
23. Preston 377.39 210.000 587.39
24. Wyoming 370.00 214.500 584.50
25. Randolph 382.00 202.000 584.00
26. Hancock 374.00 205.000 579.00
27. Nicholas 350.00 209.500 559.50
28. McDowell 333.50 207.500 541.00
29. Lincoln 329.00 197.500 526.50
30. Upshur 333.60 191.500 525.10
31. Hampshire 296.60 182.000 478.60
32. Brooke 306.50 168.000 474.50
33. Wetzel 258.00 151.000 409.00
34. Lewis 225.00 149.000 374.00
35. Morgan 220.50 123.000 343.50
36. Roane 204.00 125.000 329.00
37. Barbour 209.00 117.500 326.50
38. Taylor 200.00 114.500 314.50
39. Hardy 188.50 111.500 300.00
40. Braxton 193.00 105.500 298.50
41. Clay 171.50 102.500 274.00
42. Monroe 157.75 94.500 252.25
43. Grant 161.50 87.000 248.50
44. Summers 142.50 78.500 221.00
45. Ritchie 132.00 81.500 213.50
46. Tyler 132.00 77.000 209.00
47. Doddridge 127.00 75.000 202.00
48. Webster 128.00 73.500 201.50
49. Pleasants 125.00 76.000 201.00
50. Pocahontas 118.50 71.500 190.00
51. Pendleton 105.70 64.000 169.70
52. Calhoun 108.00 61.000 169.00
53. Tucker 100.00 59.000 159.00
54. Wirt 94.00 54.000 148.00
55. Gilmer 92.50 52.500 145.00
- Total 24,605.32 13,938.189 38,543.51
OSF
Total Personnel 14
12/26/2013
-122-
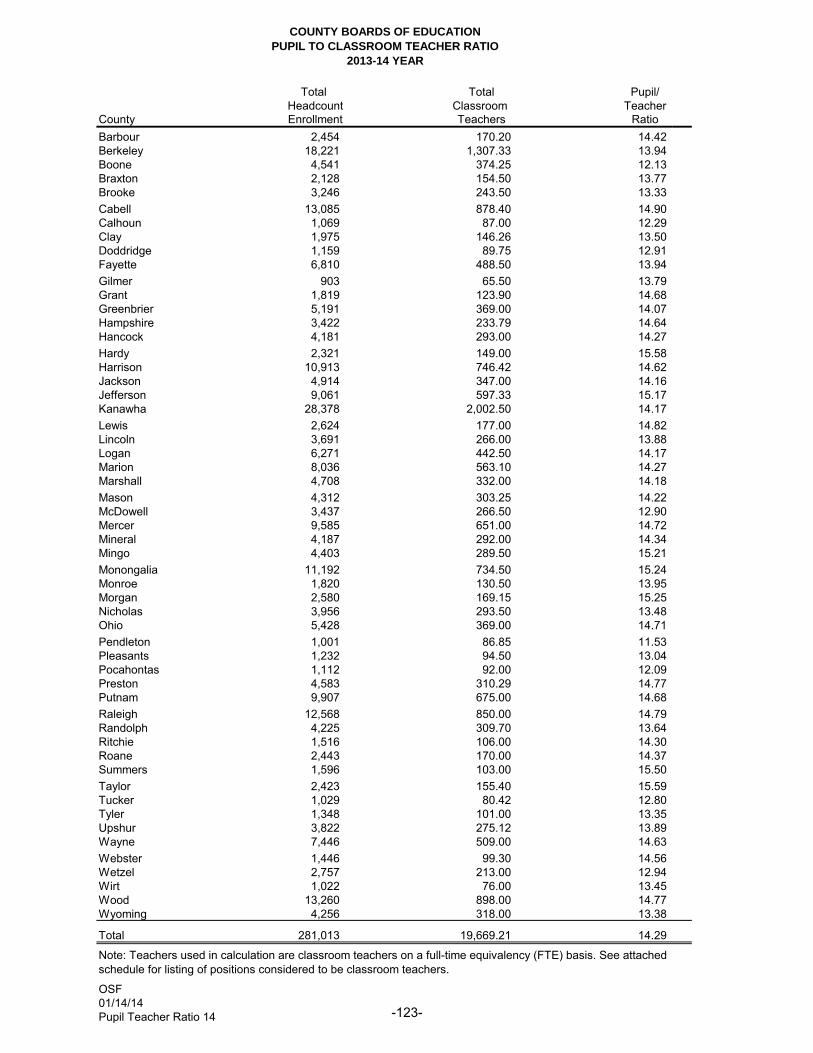
COUNTY BOARDS OF EDUCATION
2013-14 YEAR
Total Total Pupil/
Headcount Classroom Teacher
County Enrollment Teachers Ratio
Barbour 2,454 170.20 14.42
Berkeley 18,221 1,307.33 13.94
Boone 4,541 374.25 12.13
Braxton 2,128 154.50 13.77
Brooke 3,246 243.50 13.33
Cabell 13,085 878.40 14.90
Calhoun 1,069 87.00 12.29
Clay 1,975 146.26 13.50
Doddridge 1,159 89.75 12.91
Fayette 6,810 488.50 13.94
Gilmer 903 65.50 13.79
Grant 1,819 123.90 14.68
Greenbrier 5,191 369.00 14.07
Hampshire 3,422 233.79 14.64
Hancock 4,181 293.00 14.27
Hardy 2,321 149.00 15.58
Harrison 10,913 746.42 14.62
Jackson 4,914 347.00 14.16
Jefferson 9,061 597.33 15.17
Kanawha 28,378 2,002.50 14.17
Lewis 2,624 177.00 14.82
Lincoln 3,691 266.00 13.88
Logan 6,271 442.50 14.17
Marion 8,036 563.10 14.27
Marshall 4,708 332.00 14.18
Mason 4,312 303.25 14.22
McDowell 3,437 266.50 12.90
Mercer 9,585 651.00 14.72
Mineral 4,187 292.00 14.34
Mingo 4,403 289.50 15.21
Monongalia 11,192 734.50 15.24
Monroe 1,820 130.50 13.95
Morgan 2,580 169.15 15.25
Nicholas 3,956 293.50 13.48
Ohio 5,428 369.00 14.71
Pendleton 1,001 86.85 11.53
Pleasants 1,232 94.50 13.04
Pocahontas 1,112 92.00 12.09
Preston 4,583 310.29 14.77
Putnam 9,907 675.00 14.68
Raleigh 12,568 850.00 14.79
Randolph 4,225 309.70 13.64
Ritchie 1,516 106.00 14.30
Roane 2,443 170.00 14.37
Summers 1,596 103.00 15.50
Taylor 2,423 155.40 15.59
Tucker 1,029 80.42 12.80
Tyler 1,348 101.00 13.35
Upshur 3,822 275.12 13.89
Wayne 7,446 509.00 14.63
Webster 1,446 99.30 14.56
Wetzel 2,757 213.00 12.94
Wirt 1,022 76.00 13.45
Wood 13,260 898.00 14.77
Wyoming 4,256 318.00 13.38
Total 281,013 19,669.21 14.29
OSF
01/14/14
Pupil Teacher Ratio 14
PUPIL TO CLASSROOM TEACHER RATIO
Note: Teachers used in calculation are classroom teachers on a full-time equivalency (FTE) basis. See attached
schedule for listing of positions considered to be classroom teachers.
-123-

SORTED IN DESCENDING ORDER
Total Total Pupil/
Headcount Classroom Teacher
Ct. County Enrollment Teachers Ratio
1 Taylor 2,423 155.40 15.59
2 Hardy 2,321 149.00 15.58
3 Summers 1,596 103.00 15.50
4 Morgan 2,580 169.15 15.25
5 Monongalia 11,192 734.50 15.24
6 Mingo 4,403 289.50 15.21
7 Jefferson 9,061 597.33 15.17
8 Cabell 13,085 878.40 14.90
9 Lewis 2,624 177.00 14.82
10 Raleigh 12,568 850.00 14.79
11 Preston 4,583 310.29 14.77
11 Wood 13,260 898.00 14.77
13 Mercer 9,585 651.00 14.72
14 Ohio 5,428 369.00 14.71
15 Grant 1,819 123.90 14.68
15 Putnam 9,907 675.00 14.68
17 Hampshire 3,422 233.79 14.64
18 Wayne 7,446 509.00 14.63
19 Harrison 10,913 746.42 14.62
20 Webster 1,446 99.30 14.56
21 Barbour 2,454 170.20 14.42
22 Roane 2,443 170.00 14.37
23 Mineral 4,187 292.00 14.34
24 Ritchie 1,516 106.00 14.30
25 Hancock 4,181 293.00 14.27
25 Marion 8,036 563.10 14.27
27 Mason 4,312 303.25 14.22
28 Marshall 4,708 332.00 14.18
29 Kanawha 28,378 2,002.50 14.17
29 Logan 6,271 442.50 14.17
31 Jackson 4,914 347.00 14.16
32 Greenbrier 5,191 369.00 14.07
33 Monroe 1,820 130.50 13.95
34 Berkeley 18,221 1,307.33 13.94
34 Fayette 6,810 488.50 13.94
36 Upshur 3,822 275.12 13.89
37 Lincoln 3,691 266.00 13.88
38 Gilmer 903 65.50 13.79
39 Braxton 2,128 154.50 13.77
40 Randolph 4,225 309.70 13.64
41 Clay 1,975 146.26 13.50
42 Nicholas 3,956 293.50 13.48
43 Wirt 1,022 76.00 13.45
44 Wyoming 4,256 318.00 13.38
45 Tyler 1,348 101.00 13.35
46 Brooke 3,246 243.50 13.33
47 Pleasants 1,232 94.50 13.04
48 Wetzel 2,757 213.00 12.94
49 Doddridge 1,159 89.75 12.91
50 McDowell 3,437 266.50 12.90
51 Tucker 1,029 80.42 12.80
52 Calhoun 1,069 87.00 12.29
53 Boone 4,541 374.25 12.13
54 Pocahontas 1,112 92.00 12.09
55 Pendleton 1,001 86.85 11.53
- Total 281,013 19,669.21 14.29
OSF
Pupil Teacher Ratio 14
01/14/14
COUNTY BOARDS OF EDUCATION
PUPIL TO CLASSROOM TEACHER RATIO
2013-14 YEAR
Note: Teachers used in calculation are classroom teachers on a full-time equivalency (FTE) basis. See attached
schedule for listing of positions considered to be classroom teachers.
-124-
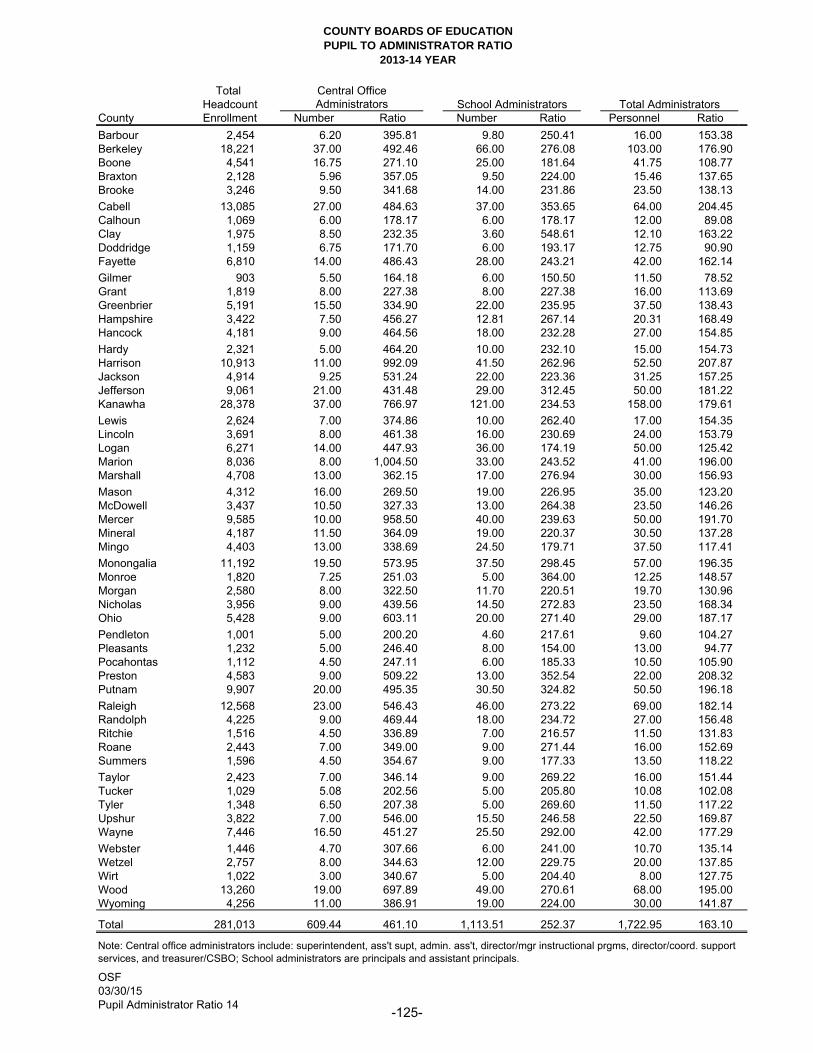
COUNTY BOARDS OF EDUCATION
2013-14 YEAR
Total Central OfficeHeadcount School Administrators Total Administrators
County Enrollment Number Ratio Number Ratio Personnel RatioBarbour 2,454 6.20 395.81 9.80 250.41 16.00 153.38 Berkeley 18,221 37.00 492.46 66.00 276.08 103.00 176.90 Boone 4,541 16.75 271.10 25.00 181.64 41.75 108.77 Braxton 2,128 5.96 357.05 9.50 224.00 15.46 137.65 Brooke 3,246 9.50 341.68 14.00 231.86 23.50 138.13 Cabell 13,085 27.00 484.63 37.00 353.65 64.00 204.45 Calhoun 1,069 6.00 178.17 6.00 178.17 12.00 89.08 Clay 1,975 8.50 232.35 3.60 548.61 12.10 163.22 Doddridge 1,159 6.75 171.70 6.00 193.17 12.75 90.90 Fayette 6,810 14.00 486.43 28.00 243.21 42.00 162.14 Gilmer 903 5.50 164.18 6.00 150.50 11.50 78.52 Grant 1,819 8.00 227.38 8.00 227.38 16.00 113.69 Greenbrier 5,191 15.50 334.90 22.00 235.95 37.50 138.43 Hampshire 3,422 7.50 456.27 12.81 267.14 20.31 168.49 Hancock 4,181 9.00 464.56 18.00 232.28 27.00 154.85 Hardy 2,321 5.00 464.20 10.00 232.10 15.00 154.73 Harrison 10,913 11.00 992.09 41.50 262.96 52.50 207.87 Jackson 4,914 9.25 531.24 22.00 223.36 31.25 157.25 Jefferson 9,061 21.00 431.48 29.00 312.45 50.00 181.22 Kanawha 28,378 37.00 766.97 121.00 234.53 158.00 179.61 Lewis 2,624 7.00 374.86 10.00 262.40 17.00 154.35 Lincoln 3,691 8.00 461.38 16.00 230.69 24.00 153.79 Logan 6,271 14.00 447.93 36.00 174.19 50.00 125.42 Marion 8,036 8.00 1,004.50 33.00 243.52 41.00 196.00 Marshall 4,708 13.00 362.15 17.00 276.94 30.00 156.93 Mason 4,312 16.00 269.50 19.00 226.95 35.00 123.20 McDowell 3,437 10.50 327.33 13.00 264.38 23.50 146.26 Mercer 9,585 10.00 958.50 40.00 239.63 50.00 191.70 Mineral 4,187 11.50 364.09 19.00 220.37 30.50 137.28 Mingo 4,403 13.00 338.69 24.50 179.71 37.50 117.41 Monongalia 11,192 19.50 573.95 37.50 298.45 57.00 196.35 Monroe 1,820 7.25 251.03 5.00 364.00 12.25 148.57 Morgan 2,580 8.00 322.50 11.70 220.51 19.70 130.96 Nicholas 3,956 9.00 439.56 14.50 272.83 23.50 168.34 Ohio 5,428 9.00 603.11 20.00 271.40 29.00 187.17 Pendleton 1,001 5.00 200.20 4.60 217.61 9.60 104.27 Pleasants 1,232 5.00 246.40 8.00 154.00 13.00 94.77 Pocahontas 1,112 4.50 247.11 6.00 185.33 10.50 105.90 Preston 4,583 9.00 509.22 13.00 352.54 22.00 208.32 Putnam 9,907 20.00 495.35 30.50 324.82 50.50 196.18 Raleigh 12,568 23.00 546.43 46.00 273.22 69.00 182.14 Randolph 4,225 9.00 469.44 18.00 234.72 27.00 156.48 Ritchie 1,516 4.50 336.89 7.00 216.57 11.50 131.83 Roane 2,443 7.00 349.00 9.00 271.44 16.00 152.69 Summers 1,596 4.50 354.67 9.00 177.33 13.50 118.22 Taylor 2,423 7.00 346.14 9.00 269.22 16.00 151.44 Tucker 1,029 5.08 202.56 5.00 205.80 10.08 102.08 Tyler 1,348 6.50 207.38 5.00 269.60 11.50 117.22 Upshur 3,822 7.00 546.00 15.50 246.58 22.50 169.87 Wayne 7,446 16.50 451.27 25.50 292.00 42.00 177.29 Webster 1,446 4.70 307.66 6.00 241.00 10.70 135.14 Wetzel 2,757 8.00 344.63 12.00 229.75 20.00 137.85 Wirt 1,022 3.00 340.67 5.00 204.40 8.00 127.75 Wood 13,260 19.00 697.89 49.00 270.61 68.00 195.00 Wyoming 4,256 11.00 386.91 19.00 224.00 30.00 141.87
Total 281,013 609.44 461.10 1,113.51 252.37 1,722.95 163.10
OSF03/30/15Pupil Administrator Ratio 14
PUPIL TO ADMINISTRATOR RATIO
Note: Central office administrators include: superintendent, ass't supt, admin. ass't, director/mgr instructional prgms, director/coord. support services, and treasurer/CSBO; School administrators are principals and assistant principals.
Administrators
-125-
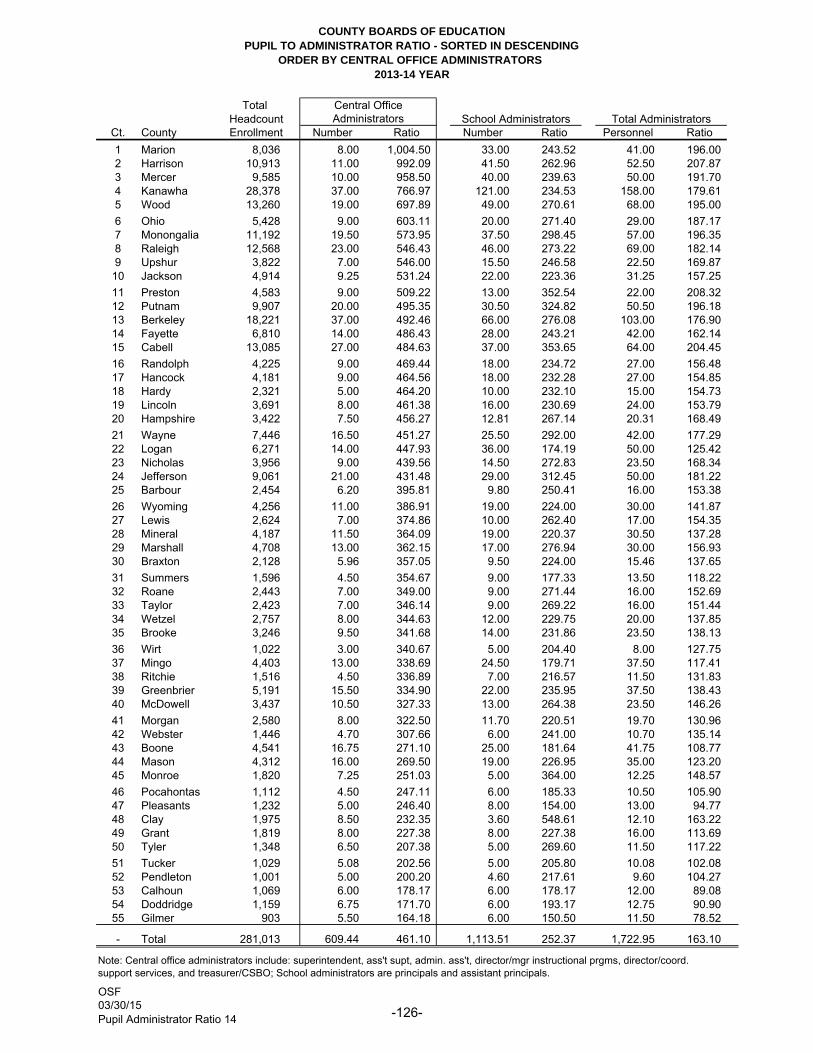
COUNTY BOARDS OF EDUCATIONPUPIL TO ADMINISTRATOR RATIO - SORTED IN DESCENDING
ORDER BY CENTRAL OFFICE ADMINISTRATORS 2013-14 YEAR
Total Central OfficeHeadcount School Administrators Total Administrators
Ct. County Enrollment Number Ratio Number Ratio Personnel Ratio1 Marion 8,036 8.00 1,004.50 33.00 243.52 41.00 196.00 2 Harrison 10,913 11.00 992.09 41.50 262.96 52.50 207.87 3 Mercer 9,585 10.00 958.50 40.00 239.63 50.00 191.70 4 Kanawha 28,378 37.00 766.97 121.00 234.53 158.00 179.61 5 Wood 13,260 19.00 697.89 49.00 270.61 68.00 195.00 6 Ohio 5,428 9.00 603.11 20.00 271.40 29.00 187.17 7 Monongalia 11,192 19.50 573.95 37.50 298.45 57.00 196.35 8 Raleigh 12,568 23.00 546.43 46.00 273.22 69.00 182.14 9 Upshur 3,822 7.00 546.00 15.50 246.58 22.50 169.87 10 Jackson 4,914 9.25 531.24 22.00 223.36 31.25 157.25 11 Preston 4,583 9.00 509.22 13.00 352.54 22.00 208.32 12 Putnam 9,907 20.00 495.35 30.50 324.82 50.50 196.18 13 Berkeley 18,221 37.00 492.46 66.00 276.08 103.00 176.90 14 Fayette 6,810 14.00 486.43 28.00 243.21 42.00 162.14 15 Cabell 13,085 27.00 484.63 37.00 353.65 64.00 204.45 16 Randolph 4,225 9.00 469.44 18.00 234.72 27.00 156.48 17 Hancock 4,181 9.00 464.56 18.00 232.28 27.00 154.85 18 Hardy 2,321 5.00 464.20 10.00 232.10 15.00 154.73 19 Lincoln 3,691 8.00 461.38 16.00 230.69 24.00 153.79 20 Hampshire 3,422 7.50 456.27 12.81 267.14 20.31 168.49 21 Wayne 7,446 16.50 451.27 25.50 292.00 42.00 177.29 22 Logan 6,271 14.00 447.93 36.00 174.19 50.00 125.42 23 Nicholas 3,956 9.00 439.56 14.50 272.83 23.50 168.34 24 Jefferson 9,061 21.00 431.48 29.00 312.45 50.00 181.22 25 Barbour 2,454 6.20 395.81 9.80 250.41 16.00 153.38 26 Wyoming 4,256 11.00 386.91 19.00 224.00 30.00 141.87 27 Lewis 2,624 7.00 374.86 10.00 262.40 17.00 154.35 28 Mineral 4,187 11.50 364.09 19.00 220.37 30.50 137.28 29 Marshall 4,708 13.00 362.15 17.00 276.94 30.00 156.93 30 Braxton 2,128 5.96 357.05 9.50 224.00 15.46 137.65 31 Summers 1,596 4.50 354.67 9.00 177.33 13.50 118.22 32 Roane 2,443 7.00 349.00 9.00 271.44 16.00 152.69 33 Taylor 2,423 7.00 346.14 9.00 269.22 16.00 151.44 34 Wetzel 2,757 8.00 344.63 12.00 229.75 20.00 137.85 35 Brooke 3,246 9.50 341.68 14.00 231.86 23.50 138.13 36 Wirt 1,022 3.00 340.67 5.00 204.40 8.00 127.75 37 Mingo 4,403 13.00 338.69 24.50 179.71 37.50 117.41 38 Ritchie 1,516 4.50 336.89 7.00 216.57 11.50 131.83 39 Greenbrier 5,191 15.50 334.90 22.00 235.95 37.50 138.43 40 McDowell 3,437 10.50 327.33 13.00 264.38 23.50 146.26 41 Morgan 2,580 8.00 322.50 11.70 220.51 19.70 130.96 42 Webster 1,446 4.70 307.66 6.00 241.00 10.70 135.14 43 Boone 4,541 16.75 271.10 25.00 181.64 41.75 108.77 44 Mason 4,312 16.00 269.50 19.00 226.95 35.00 123.20 45 Monroe 1,820 7.25 251.03 5.00 364.00 12.25 148.57 46 Pocahontas 1,112 4.50 247.11 6.00 185.33 10.50 105.90 47 Pleasants 1,232 5.00 246.40 8.00 154.00 13.00 94.77 48 Clay 1,975 8.50 232.35 3.60 548.61 12.10 163.22 49 Grant 1,819 8.00 227.38 8.00 227.38 16.00 113.69 50 Tyler 1,348 6.50 207.38 5.00 269.60 11.50 117.22 51 Tucker 1,029 5.08 202.56 5.00 205.80 10.08 102.08 52 Pendleton 1,001 5.00 200.20 4.60 217.61 9.60 104.27 53 Calhoun 1,069 6.00 178.17 6.00 178.17 12.00 89.08 54 Doddridge 1,159 6.75 171.70 6.00 193.17 12.75 90.90 55 Gilmer 903 5.50 164.18 6.00 150.50 11.50 78.52
- Total 281,013 609.44 461.10 1,113.51 252.37 1,722.95 163.10
OSF
Pupil Administrator Ratio 14
Administrators
03/30/15
Note: Central office administrators include: superintendent, ass't supt, admin. ass't, director/mgr instructional prgms, director/coord. support services, and treasurer/CSBO; School administrators are principals and assistant principals.
-126-

COUNTY BOARDS OF EDUCATION
PUPIL TO ADMINISTRATOR RATIO - SORTED IN DESCENDING
ORDER BY SCHOOL ADMINISTRATORS
2013-14 YEAR
Total Central Office
Headcount School Administrators Total Administrators
Ct. County Enrollment Number Ratio Number Ratio Personnel Ratio
1 Clay 1,975 8.50 232.35 3.60 548.61 12.10 163.22
2 Monroe 1,820 7.25 251.03 5.00 364.00 12.25 148.57
3 Cabell 13,085 27.00 484.63 37.00 353.65 64.00 204.45
4 Preston 4,583 9.00 509.22 13.00 352.54 22.00 208.32
5 Putnam 9,907 20.00 495.35 30.50 324.82 50.50 196.18
6 Jefferson 9,061 21.00 431.48 29.00 312.45 50.00 181.22
7 Monongalia 11,192 19.50 573.95 37.50 298.45 57.00 196.35
8 Wayne 7,446 16.50 451.27 25.50 292.00 42.00 177.29
9 Marshall 4,708 13.00 362.15 17.00 276.94 30.00 156.93
10 Berkeley 18,221 37.00 492.46 66.00 276.08 103.00 176.90
11 Raleigh 12,568 23.00 546.43 46.00 273.22 69.00 182.14
12 Nicholas 3,956 9.00 439.56 14.50 272.83 23.50 168.34
13 Roane 2,443 7.00 349.00 9.00 271.44 16.00 152.69
14 Ohio 5,428 9.00 603.11 20.00 271.40 29.00 187.17
15 Wood 13,260 19.00 697.89 49.00 270.61 68.00 195.00
16 Tyler 1,348 6.50 207.38 5.00 269.60 11.50 117.22
17 Taylor 2,423 7.00 346.14 9.00 269.22 16.00 151.44
18 Hampshire 3,422 7.50 456.27 12.81 267.14 20.31 168.49
19 McDowell 3,437 10.50 327.33 13.00 264.38 23.50 146.26
20 Harrison 10,913 11.00 992.09 41.50 262.96 52.50 207.87
21 Lewis 2,624 7.00 374.86 10.00 262.40 17.00 154.35
22 Barbour 2,454 6.20 395.81 9.80 250.41 16.00 153.38
23 Upshur 3,822 7.00 546.00 15.50 246.58 22.50 169.87
24 Marion 8,036 8.00 1,004.50 33.00 243.52 41.00 196.00
25 Fayette 6,810 14.00 486.43 28.00 243.21 42.00 162.14
26 Webster 1,446 4.70 307.66 6.00 241.00 10.70 135.14
27 Mercer 9,585 10.00 958.50 40.00 239.63 50.00 191.70
28 Greenbrier 5,191 15.50 334.90 22.00 235.95 37.50 138.43
29 Randolph 4,225 9.00 469.44 18.00 234.72 27.00 156.48
30 Kanawha 28,378 37.00 766.97 121.00 234.53 158.00 179.61
31 Hancock 4,181 9.00 464.56 18.00 232.28 27.00 154.85
32 Hardy 2,321 5.00 464.20 10.00 232.10 15.00 154.73
33 Brooke 3,246 9.50 341.68 14.00 231.86 23.50 138.13
34 Lincoln 3,691 8.00 461.38 16.00 230.69 24.00 153.79
35 Wetzel 2,757 8.00 344.63 12.00 229.75 20.00 137.85
36 Grant 1,819 8.00 227.38 8.00 227.38 16.00 113.69
37 Mason 4,312 16.00 269.50 19.00 226.95 35.00 123.20
38 Braxton 2,128 5.96 357.05 9.50 224.00 15.46 137.65
39 Wyoming 4,256 11.00 386.91 19.00 224.00 30.00 141.87
40 Jackson 4,914 9.25 531.24 22.00 223.36 31.25 157.25
41 Morgan 2,580 8.00 322.50 11.70 220.51 19.70 130.96
42 Mineral 4,187 11.50 364.09 19.00 220.37 30.50 137.28
43 Pendleton 1,001 5.00 200.20 4.60 217.61 9.60 104.27
44 Ritchie 1,516 4.50 336.89 7.00 216.57 11.50 131.83
45 Tucker 1,029 5.08 202.56 5.00 205.80 10.08 102.08
46 Wirt 1,022 3.00 340.67 5.00 204.40 8.00 127.75
47 Doddridge 1,159 6.75 171.70 6.00 193.17 12.75 90.90
48 Pocahontas 1,112 4.50 247.11 6.00 185.33 10.50 105.90
49 Boone 4,541 16.75 271.10 25.00 181.64 41.75 108.77
50 Mingo 4,403 13.00 338.69 24.50 179.71 37.50 117.41
51 Calhoun 1,069 6.00 178.17 6.00 178.17 12.00 89.08
52 Summers 1,596 4.50 354.67 9.00 177.33 13.50 118.22
53 Logan 6,271 14.00 447.93 36.00 174.19 50.00 125.42
54 Pleasants 1,232 5.00 246.40 8.00 154.00 13.00 94.77
55 Gilmer 903 5.50 164.18 6.00 150.50 11.50 78.52
- Total 281,013 609.44 461.10 1,113.51 252.37 1,722.95 163.10
OSF
Pupil Administrator Ratio 14
Administrators
03/30/15
Note: Central office administrators include: superintendent, ass't supt, admin. ass't, director/mgr instructional prgms, director/coord.
support services, and treasurer/CSBO; School administrators are principals and assistant principals.
-127-

COUNTY BOARDS OF EDUCATION
PUPIL TO ADMINISTRATOR RATIO - SORTED IN DESCENDING
ORDER BY TOTAL ADMINISTRATORS
2013-14 YEAR
Total Central Office
Headcount School Administrators Total Administrators
Ct. County Enrollment Number Ratio Number Ratio Personnel Ratio
1 Preston 4,583 9.00 509.22 13.00 352.54 22.00 208.32
2 Harrison 10,913 11.00 992.09 41.50 262.96 52.50 207.87
3 Cabell 13,085 27.00 484.63 37.00 353.65 64.00 204.45
4 Monongalia 11,192 19.50 573.95 37.50 298.45 57.00 196.35
5 Putnam 9,907 20.00 495.35 30.50 324.82 50.50 196.18
6 Marion 8,036 8.00 1,004.50 33.00 243.52 41.00 196.00
7 Wood 13,260 19.00 697.89 49.00 270.61 68.00 195.00
8 Mercer 9,585 10.00 958.50 40.00 239.63 50.00 191.70
9 Ohio 5,428 9.00 603.11 20.00 271.40 29.00 187.17
10 Raleigh 12,568 23.00 546.43 46.00 273.22 69.00 182.14
11 Jefferson 9,061 21.00 431.48 29.00 312.45 50.00 181.22
12 Kanawha 28,378 37.00 766.97 121.00 234.53 158.00 179.61
13 Wayne 7,446 16.50 451.27 25.50 292.00 42.00 177.29
14 Berkeley 18,221 37.00 492.46 66.00 276.08 103.00 176.90
15 Upshur 3,822 7.00 546.00 15.50 246.58 22.50 169.87
16 Hampshire 3,422 7.50 456.27 12.81 267.14 20.31 168.49
17 Nicholas 3,956 9.00 439.56 14.50 272.83 23.50 168.34
18 Clay 1,975 8.50 232.35 3.60 548.61 12.10 163.22
19 Fayette 6,810 14.00 486.43 28.00 243.21 42.00 162.14
20 Jackson 4,914 9.25 531.24 22.00 223.36 31.25 157.25
21 Marshall 4,708 13.00 362.15 17.00 276.94 30.00 156.93
22 Randolph 4,225 9.00 469.44 18.00 234.72 27.00 156.48
23 Hancock 4,181 9.00 464.56 18.00 232.28 27.00 154.85
24 Hardy 2,321 5.00 464.20 10.00 232.10 15.00 154.73
25 Lewis 2,624 7.00 374.86 10.00 262.40 17.00 154.35
26 Lincoln 3,691 8.00 461.38 16.00 230.69 24.00 153.79
27 Barbour 2,454 6.20 395.81 9.80 250.41 16.00 153.38
28 Roane 2,443 7.00 349.00 9.00 271.44 16.00 152.69
29 Taylor 2,423 7.00 346.14 9.00 269.22 16.00 151.44
30 Monroe 1,820 7.25 251.03 5.00 364.00 12.25 148.57
31 McDowell 3,437 10.50 327.33 13.00 264.38 23.50 146.26
32 Wyoming 4,256 11.00 386.91 19.00 224.00 30.00 141.87
33 Greenbrier 5,191 15.50 334.90 22.00 235.95 37.50 138.43
34 Brooke 3,246 9.50 341.68 14.00 231.86 23.50 138.13
35 Wetzel 2,757 8.00 344.63 12.00 229.75 20.00 137.85
36 Braxton 2,128 5.96 357.05 9.50 224.00 15.46 137.65
37 Mineral 4,187 11.50 364.09 19.00 220.37 30.50 137.28
38 Webster 1,446 4.70 307.66 6.00 241.00 10.70 135.14
39 Ritchie 1,516 4.50 336.89 7.00 216.57 11.50 131.83
40 Morgan 2,580 8.00 322.50 11.70 220.51 19.70 130.96
41 Wirt 1,022 3.00 340.67 5.00 204.40 8.00 127.75
42 Logan 6,271 14.00 447.93 36.00 174.19 50.00 125.42
43 Mason 4,312 16.00 269.50 19.00 226.95 35.00 123.20
44 Summers 1,596 4.50 354.67 9.00 177.33 13.50 118.22
45 Mingo 4,403 13.00 338.69 24.50 179.71 37.50 117.41
46 Tyler 1,348 6.50 207.38 5.00 269.60 11.50 117.22
47 Grant 1,819 8.00 227.38 8.00 227.38 16.00 113.69
48 Boone 4,541 16.75 271.10 25.00 181.64 41.75 108.77
49 Pocahontas 1,112 4.50 247.11 6.00 185.33 10.50 105.90
50 Pendleton 1,001 5.00 200.20 4.60 217.61 9.60 104.27
51 Tucker 1,029 5.08 202.56 5.00 205.80 10.08 102.08
52 Pleasants 1,232 5.00 246.40 8.00 154.00 13.00 94.77
53 Doddridge 1,159 6.75 171.70 6.00 193.17 12.75 90.90
54 Calhoun 1,069 6.00 178.17 6.00 178.17 12.00 89.08
55 Gilmer 903 5.50 164.18 6.00 150.50 11.50 78.52
- Total 281,013 609.44 461.10 1,113.51 252.37 1,722.95 163.10
OSF
Pupil Administrator Ratio 14
03/30/15
Administrators
Note: Central office administrators include: superintendent, ass't supt, admin. ass't, director/mgr instructional prgms, director/coord.
support services, and treasurer/CSBO; School administrators are principals and assistant principals.
-128-

SALARY
DATA


COUNTY BOARDS OF EDUCATION
NUMBER OF PERSONNEL EMPLOYED (FTE BASIS)
AND AVERAGE CONTRACTED SALARIES
(EXCLUDES RESA PERSONNEL)
ALL FUNDING SOURCES
2013-14 YEAR
Professional Personnel:
Administrators: Average
Contracted
Central Office Administrators: FTE Salaries
Superintendent (*) 55.00 113,858.03$
Deputy Associate, or Assistant Superintendent (*) 61.10 96,140.48
Administrative Assistant 16.00 85,656.60
Director/Manager (Instructional) (*) 198.01 78,557.58
Director/Manager Supportive Services 198.03 70,208.36
Chief School Business Official 54.50 80,236.19
Director of Child Nutrition 26.80 70,453.78
Total Central Office Administrators 609.44 80,773.27$
School Administrators:
Principals:
Elementary (*) 406.90 70,426.87$
Middle/Junior High (*) 131.50 74,344.06
High School (*) 131.50 79,918.07
Combined (*) 24.50 70,850.48
Total Principals 694.40 72,980.99$
Assistant Principals:
Elementary (*) 74.90 60,284.94$
Middle/Junior High (*) 120.86 61,885.14
High School (*) 207.85 65,665.70
Combined (*) 15.50 58,230.63
Total Assistant Principals 419.11 63,338.91$
Total School Administrators 1,113.51 69,351.85$
Total Administrators 1,722.95 73,391.82$
Classroom Teachers (K - 12):
Head Teacher (#) 19.50 55,111.70
Teacher Pre-K (#) 366.67 43,813.07
Kindergarten (#) 1,094.50 46,375.29
Elementary (#) 6,300.51 45,004.31
Middle/Junior High (#) 3,426.62 44,551.44
High School (#) 4,135.84 45,177.25
Special Education (#) 3,300.48 44,699.79
Homebound (#) 19.50 52,971.90
Vocational (K-12) (#) 904.00 46,450.94
JROTC Instructor (#) 65.00 59,779.29
Permanent Substitutes (#) 36.60 38,790.96
Total Classroom Teachers 19,669.21 45,086.43$
OSF
12/30/13
AllPer14 FTE
-129-

NUMBER OF PERSONNEL EMPLOYED (FTE BASIS)
AND AVERAGE CONTRACTED SALARIES
(EXCLUDES RESA PERSONNEL)
ALL FUNDING SOURCES
2013-14 YEAR
Average
Contracted
Professional Student Support Personnel: FTE Salaries
Counselor (@) 723.14 49,492.91$
School Nurse (AB) (@) 281.22 46,908.34
Total Professional Student Support Personnel 1,004.36 48,769.24$
Other Instructional Staff:
Curriculum Specialist (*) 136.89 66,467.99$
Librarian (#) 311.53 48,406.34
Psychologist (#) 122.00 55,013.10
Speech Language Pathologist (#) 443.80 52,350.86
Speech Assistant (#) 36.60 38,078.27
Remedial Specialist (#) 379.95 46,922.42
Academic Coach (#) 118.00 52,856.39
Activities Director (*) 9.50 63,620.30
Attendance Director (#) 72.98 61,045.76
Curriculum Enrichment Instructor 9.00 44,252.74
Technology Integration Specialist (#) 122.65 49,162.65
Total Other Instructional Staff 1,762.90 51,659.33$
Other Support Staff:
School Nurse (Below AB) 5.50 41,888.24
Registered Nurse 5.00 44,467.20
Attendance Officer (*) 12.50 48,620.12
Social Worker 43.32 47,974.01
Dental Hygienist 1.50 57,635.33
Professional Educational Interpreter 2.00 34,876.00
Physical Therapist 22.25 63,060.13
Occupational Therapist 39.50 54,527.26
Athletic Trainer 7.00 48,432.91
Audiologist 3.00 54,409.43
Psychometrist 2.00 66,241.95
Professional Accountant 41.00 53,320.39
Technology Systems Specialist 98.00 49,993.66
Total Other Support Staff 282.57 51,569.82$
Total Pre-K - 12 Grade Professional Personnel 24,441.99 47,782.08$
Adult Teachers:
Vocational (Post Secondary) 86.28 52,056.04$
Vocational (Adult) 67.05 53,023.45
Community Education 10.00 44,206.72
Total Adult Teachers 163.33 51,972.60$
Total Professional Educators - PK-12 23,867.59 47,427.98$
Total Professional Personnel 24,605.32 47,809.90$
OSF
12/30/13
AllPer14 FTE
-130-

COUNTY BOARDS OF EDUCATION
NUMBER OF PERSONNEL EMPLOYED (FTE BASIS)
AND AVERAGE CONTRACTED SALARIES
(EXCLUDES RESA PERSONNEL)
ALL FUNDING SOURCES
2013-14 YEAR
Average
Contracted
Service Personnel: FTE Salaries
Aides 2,632.090 24,868.30$
Licensed Practical Nurse 111.850 24,381.87
Paraprofessional 454.600 27,614.99
Educational Sign Language Interpreter 7.000 25,803.44
Sign Support Specialist 29.250 24,656.10
Autism Mentor 426.460 25,820.84
Director/Coordinator of Services 114.283 45,111.41
Accountant 139.773 32,459.10
Auditor 18.032 36,595.97
Buyer 7.840 39,475.59
Braille Specialist 36.250 24,767.11
Clerk 82.983 28,217.46
Secretary 1,460.768 30,573.51
Switchboard Operator 4.740 36,061.54
Computer Operator 33.753 29,661.35
Programmer 22.200 47,936.94
Draftsman 2.000 35,489.48
Graphic Artist 1.000 37,586.61
Inventory Supervisor 10.230 35,816.60
Printing Operator 0.340 41,407.65
Printing Supervisor - -
Accounts Payable Supervisor 21.033 37,654.37
Payroll Supervisor 19.003 37,481.51
Supervisor of Maintenance 32.600 45,585.21
Audiovisual Technician 1.000 38,881.20
Cabinet Maker 23.750 36,511.06
Carpenter 69.858 36,261.07
Chief Mechanic 35.950 36,821.17
Crew Leader 16.800 37,940.04
Electrician 101.445 34,890.53
Electronic Technician 35.433 34,794.89
Foreman 36.710 40,781.96
General Maintenance 44.868 34,418.91
Glazier 2.500 39,435.07
Handyman 5.690 35,317.20
Heating & Air Conditioning Mechanic 66.473 35,495.70
Locksmith 13.215 40,461.47
Lubrication Man 1.500 31,393.96
Machinist 1.000 21,715.80
Mason 27.705 35,860.48
Mechanic Assistant 4.200 29,725.74
Mechanic 200.400 33,072.53
Office Equipment Repairman 5.300 39,003.47
Painter 32.985 37,728.46
Plumber 87.087 35,226.74
Roofing Sheet Metal Mechanic 10.080 35,120.55
Welder 7.690 37,554.17
OSF
12/30/13
AllPer14 FTE
-131-

COUNTY BOARDS OF EDUCATION
NUMBER OF PERSONNEL EMPLOYED (FTE BASIS)
AND AVERAGE CONTRACTED SALARIES
(EXCLUDES RESA PERSONNEL)
ALL FUNDING SOURCES
2013-14 YEAR
Average
Contracted
Service Personnel (Continued): FTE Salaries
Supervisor of Transportation 34.000 46,117.05
School Bus Supervisor 11.750 37,638.59
Bus Operator 2,896.460 24,264.04
Heavy Equipment Operator 11.525 36,001.62
Truck Driver 51.135 35,028.34
Food Services Supervisor 3.200 37,485.41
Cafeteria Manager 423.440 25,133.63
Cooks 1,773.080 22,935.13
Custodian 2,210.479 27,405.37
Groundsman 4.950 26,094.50
Watchman 2.300 24,394.90
Sanitation Plant Operator 16.150 36,029.14
Total Service Personnel 13,938.19 26,802.81$
TOTAL ALL PERSONNEL 38,543.509 40,213.27$
Legend - Professional Personnel:
OSF
12/30/13
AllPer14 FTE
(*) Denotes positions defined in WVC §18-9A-2 as professional educators that are eligible for funding under the PSSP.
(#) Denotes positions defined as professional educators that are further considered professional instructional personnel.
(@) Denotes positions defined as professional educators that are further considered prof. student support personnel.
-132-

COUNTY BOARDS OF EDUCATION
AVERAGE CONTRACTED SALARIES - ALL PROFESSIONAL PERSONNEL
(EXCLUDING RESA PERSONNEL)
2013-14 YEAR
Average
County FTE Salary
Barbour 209.00 45,817.98$
Berkeley 1,600.73 48,818.51
Boone 455.00 49,147.84
Braxton 193.00 46,942.54
Brooke 306.50 48,123.46
Cabell 1,090.20 48,043.77
Calhoun 108.00 44,496.36
Clay 171.50 46,802.12
Doddridge 127.00 45,982.09
Fayette 598.00 46,951.36
Gilmer 92.50 45,845.34
Grant 161.50 45,345.16
Greenbrier 473.50 46,343.49
Hampshire 296.60 45,008.39
Hancock 374.00 48,337.33
Hardy 188.50 46,138.40
Harrison 954.87 47,921.15
Jackson 450.00 49,803.08
Jefferson 724.83 47,558.41
Kanawha 2,518.00 48,857.15
Lewis 225.00 48,654.20
Lincoln 329.00 45,875.44
Logan 544.50 45,755.11
Marion 682.10 46,573.12
Marshall 414.50 50,089.28
Mason 374.75 47,919.83
McDowell 333.50 46,441.62
Mercer 843.50 47,653.85
Mineral 366.00 49,545.24
Mingo 393.50 48,032.38
Monongalia 960.50 50,506.14
Monroe 157.75 43,975.01
Morgan 220.50 46,913.98
Nicholas 350.00 45,926.48
Ohio 476.50 48,862.39
Pendleton 105.70 45,773.98
Pleasants 125.00 50,418.28
Pocahontas 118.50 46,316.62
Preston 377.39 45,649.90
Putnam 822.50 51,367.21
Raleigh 1,065.80 47,989.07
Randolph 382.00 47,479.20
Ritchie 132.00 47,169.09
Roane 204.00 44,383.98
Summers 142.50 44,560.04
Taylor 200.00 46,429.34
Tucker 100.00 46,051.59
Tyler 132.00 47,352.97
Upshur 333.60 46,897.70
Wayne 621.50 45,094.77
Webster 128.00 47,189.19
Wetzel 258.00 47,951.75
Wirt 94.00 45,198.88
Wood 1,128.00 47,923.97
Wyoming 370.00 46,485.94
Total 24,605.32 47,809.90$
OSF12/23/13
Avg Contracted Salary PE- All positions 14
-133-

COUNTY BOARDS OF EDUCATION
AVERAGE CONTRACTED SALARIES - ALL PROFESSIONAL PERSONNEL
(EXCLUDING RESA PERSONNEL - ARRANGED IN
DESCENDING ORDER BY AVERAGE)
2013-14 YEAR
Average
Ct. County FTE Salary
1 Putnam 822.50 51,367.21$
2 Monongalia 960.50 50,506.14
3 Pleasants 125.00 50,418.28
4 Marshall 414.50 50,089.28
5 Jackson 450.00 49,803.08
6 Mineral 366.00 49,545.24
7 Boone 455.00 49,147.84
8 Ohio 476.50 48,862.39
9 Kanawha 2,518.00 48,857.15
10 Berkeley 1,600.73 48,818.51
11 Lewis 225.00 48,654.20
12 Hancock 374.00 48,337.33
13 Brooke 306.50 48,123.46
14 Cabell 1,090.20 48,043.77
15 Mingo 393.50 48,032.38
16 Raleigh 1,065.80 47,989.07
17 Wetzel 258.00 47,951.75
18 Wood 1,128.00 47,923.97
19 Harrison 954.87 47,921.15
20 Mason 374.75 47,919.83
21 Mercer 843.50 47,653.85
22 Jefferson 724.83 47,558.41
23 Randolph 382.00 47,479.20
24 Tyler 132.00 47,352.97
25 Webster 128.00 47,189.19
26 Ritchie 132.00 47,169.09
27 Fayette 598.00 46,951.36
28 Braxton 193.00 46,942.54
29 Morgan 220.50 46,913.98
30 Upshur 333.60 46,897.70
31 Clay 171.50 46,802.12
32 Marion 682.10 46,573.12
33 Wyoming 370.00 46,485.94
34 McDowell 333.50 46,441.62
35 Taylor 200.00 46,429.34
36 Greenbrier 473.50 46,343.49
37 Pocahontas 118.50 46,316.62
38 Hardy 188.50 46,138.40
39 Tucker 100.00 46,051.59
40 Doddridge 127.00 45,982.09
41 Nicholas 350.00 45,926.48
42 Lincoln 329.00 45,875.44
43 Gilmer 92.50 45,845.34
44 Barbour 209.00 45,817.98
45 Pendleton 105.70 45,773.98
46 Logan 544.50 45,755.11
47 Preston 377.39 45,649.90
48 Grant 161.50 45,345.16
49 Wirt 94.00 45,198.88
50 Wayne 621.50 45,094.77
51 Hampshire 296.60 45,008.39
52 Summers 142.50 44,560.04
53 Calhoun 108.00 44,496.36
54 Roane 204.00 44,383.98
55 Monroe 157.75 43,975.01
- Total 24,605.32 47,809.90$
OSF
Avg Contracted Salary PE- All positions 14
12/23/13
-134-
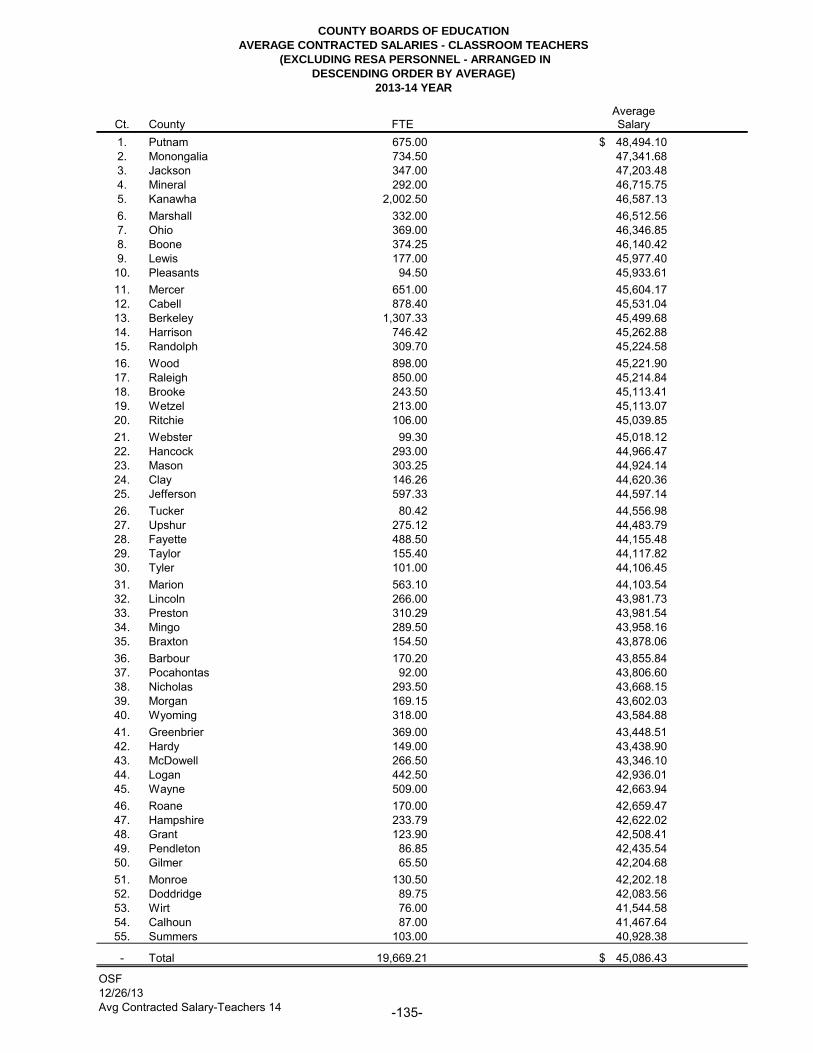
COUNTY BOARDS OF EDUCATION
AVERAGE CONTRACTED SALARIES - CLASSROOM TEACHERS
(EXCLUDING RESA PERSONNEL - ARRANGED IN
DESCENDING ORDER BY AVERAGE)
2013-14 YEAR
AverageCt. County FTE Salary
1. Putnam 675.00 48,494.10$
2. Monongalia 734.50 47,341.68
3. Jackson 347.00 47,203.48
4. Mineral 292.00 46,715.75
5. Kanawha 2,002.50 46,587.13
6. Marshall 332.00 46,512.56
7. Ohio 369.00 46,346.85
8. Boone 374.25 46,140.42
9. Lewis 177.00 45,977.40
10. Pleasants 94.50 45,933.61
11. Mercer 651.00 45,604.17
12. Cabell 878.40 45,531.04
13. Berkeley 1,307.33 45,499.68
14. Harrison 746.42 45,262.88
15. Randolph 309.70 45,224.58
16. Wood 898.00 45,221.90
17. Raleigh 850.00 45,214.84
18. Brooke 243.50 45,113.41
19. Wetzel 213.00 45,113.07
20. Ritchie 106.00 45,039.85
21. Webster 99.30 45,018.12
22. Hancock 293.00 44,966.47
23. Mason 303.25 44,924.14
24. Clay 146.26 44,620.36
25. Jefferson 597.33 44,597.14
26. Tucker 80.42 44,556.98
27. Upshur 275.12 44,483.79
28. Fayette 488.50 44,155.48
29. Taylor 155.40 44,117.82
30. Tyler 101.00 44,106.45
31. Marion 563.10 44,103.54
32. Lincoln 266.00 43,981.73
33. Preston 310.29 43,981.54
34. Mingo 289.50 43,958.16
35. Braxton 154.50 43,878.06
36. Barbour 170.20 43,855.84
37. Pocahontas 92.00 43,806.60
38. Nicholas 293.50 43,668.15
39. Morgan 169.15 43,602.03
40. Wyoming 318.00 43,584.88
41. Greenbrier 369.00 43,448.51
42. Hardy 149.00 43,438.90
43. McDowell 266.50 43,346.10
44. Logan 442.50 42,936.01
45. Wayne 509.00 42,663.94
46. Roane 170.00 42,659.47
47. Hampshire 233.79 42,622.02
48. Grant 123.90 42,508.41
49. Pendleton 86.85 42,435.54
50. Gilmer 65.50 42,204.68
51. Monroe 130.50 42,202.18
52. Doddridge 89.75 42,083.56
53. Wirt 76.00 41,544.58
54. Calhoun 87.00 41,467.64
55. Summers 103.00 40,928.38
- Total 19,669.21 45,086.43$
OSF
Avg Contracted Salary-Teachers 14
12/26/13
-135-
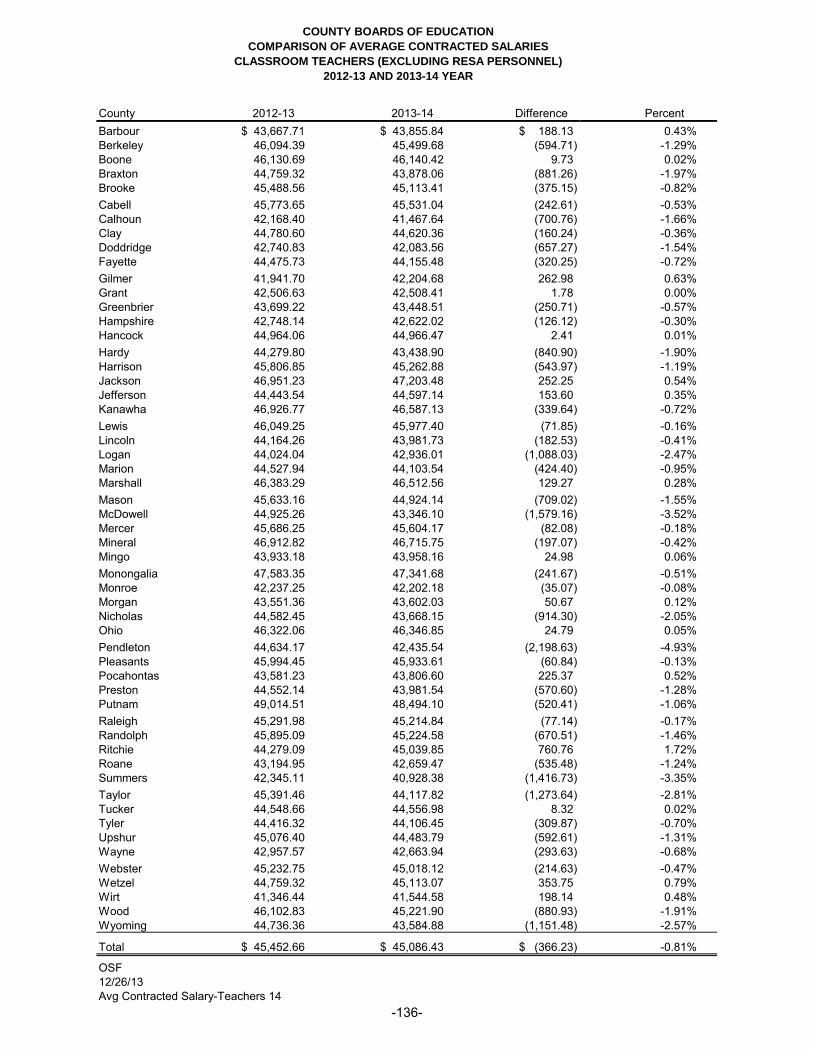
COUNTY BOARDS OF EDUCATION
COMPARISON OF AVERAGE CONTRACTED SALARIES
CLASSROOM TEACHERS (EXCLUDING RESA PERSONNEL)
2012-13 AND 2013-14 YEAR
County 2012-13 2013-14 Difference Percent
Barbour 43,667.71$ 43,855.84$ 188.13$ 0.43%
Berkeley 46,094.39 45,499.68 (594.71) -1.29%
Boone 46,130.69 46,140.42 9.73 0.02%
Braxton 44,759.32 43,878.06 (881.26) -1.97%
Brooke 45,488.56 45,113.41 (375.15) -0.82%
Cabell 45,773.65 45,531.04 (242.61) -0.53%
Calhoun 42,168.40 41,467.64 (700.76) -1.66%
Clay 44,780.60 44,620.36 (160.24) -0.36%
Doddridge 42,740.83 42,083.56 (657.27) -1.54%
Fayette 44,475.73 44,155.48 (320.25) -0.72%
Gilmer 41,941.70 42,204.68 262.98 0.63%
Grant 42,506.63 42,508.41 1.78 0.00%
Greenbrier 43,699.22 43,448.51 (250.71) -0.57%
Hampshire 42,748.14 42,622.02 (126.12) -0.30%
Hancock 44,964.06 44,966.47 2.41 0.01%
Hardy 44,279.80 43,438.90 (840.90) -1.90%
Harrison 45,806.85 45,262.88 (543.97) -1.19%
Jackson 46,951.23 47,203.48 252.25 0.54%
Jefferson 44,443.54 44,597.14 153.60 0.35%
Kanawha 46,926.77 46,587.13 (339.64) -0.72%
Lewis 46,049.25 45,977.40 (71.85) -0.16%
Lincoln 44,164.26 43,981.73 (182.53) -0.41%
Logan 44,024.04 42,936.01 (1,088.03) -2.47%
Marion 44,527.94 44,103.54 (424.40) -0.95%
Marshall 46,383.29 46,512.56 129.27 0.28%
Mason 45,633.16 44,924.14 (709.02) -1.55%
McDowell 44,925.26 43,346.10 (1,579.16) -3.52%
Mercer 45,686.25 45,604.17 (82.08) -0.18%
Mineral 46,912.82 46,715.75 (197.07) -0.42%
Mingo 43,933.18 43,958.16 24.98 0.06%
Monongalia 47,583.35 47,341.68 (241.67) -0.51%
Monroe 42,237.25 42,202.18 (35.07) -0.08%
Morgan 43,551.36 43,602.03 50.67 0.12%
Nicholas 44,582.45 43,668.15 (914.30) -2.05%
Ohio 46,322.06 46,346.85 24.79 0.05%
Pendleton 44,634.17 42,435.54 (2,198.63) -4.93%
Pleasants 45,994.45 45,933.61 (60.84) -0.13%
Pocahontas 43,581.23 43,806.60 225.37 0.52%
Preston 44,552.14 43,981.54 (570.60) -1.28%
Putnam 49,014.51 48,494.10 (520.41) -1.06%
Raleigh 45,291.98 45,214.84 (77.14) -0.17%
Randolph 45,895.09 45,224.58 (670.51) -1.46%
Ritchie 44,279.09 45,039.85 760.76 1.72%
Roane 43,194.95 42,659.47 (535.48) -1.24%
Summers 42,345.11 40,928.38 (1,416.73) -3.35%
Taylor 45,391.46 44,117.82 (1,273.64) -2.81%
Tucker 44,548.66 44,556.98 8.32 0.02%
Tyler 44,416.32 44,106.45 (309.87) -0.70%
Upshur 45,076.40 44,483.79 (592.61) -1.31%
Wayne 42,957.57 42,663.94 (293.63) -0.68%
Webster 45,232.75 45,018.12 (214.63) -0.47%
Wetzel 44,759.32 45,113.07 353.75 0.79%
Wirt 41,346.44 41,544.58 198.14 0.48%
Wood 46,102.83 45,221.90 (880.93) -1.91%
Wyoming 44,736.36 43,584.88 (1,151.48) -2.57%
Total 45,452.66$ 45,086.43$ (366.23)$ -0.81%
OSF
12/26/13
Avg Contracted Salary-Teachers 14
-136-

COUNTY BOARDS OF EDUCATION
AVERAGE CONTRACTED SALARIES - SERVICE PERSONNEL
(EXCLUDING RESA PERSONNEL)
2013-14 YEAR
Average
County FTE Salary
Barbour 117.500 23,977.55$
Berkeley 936.400 26,916.56
Boone 236.740 29,089.18
Braxton 105.500 25,586.74
Brooke 168.000 27,861.73
Cabell 572.500 28,076.93
Calhoun 61.000 27,651.31
Clay 102.500 24,517.16
Doddridge 75.000 25,145.57
Fayette 333.500 26,432.27
Gilmer 52.500 24,936.93
Grant 87.000 25,348.43
Greenbrier 307.500 25,121.70
Hampshire 182.000 24,370.23
Hancock 205.000 26,394.69
Hardy 111.500 25,068.03
Harrison 514.500 28,081.65
Jackson 241.500 29,175.07
Jefferson 453.039 26,333.30
Kanawha 1,344.500 27,591.62
Lewis 149.000 26,286.12
Lincoln 197.500 24,750.84
Logan 336.000 25,964.86
Marion 415.000 25,984.30
Marshall 279.000 26,907.55
Mason 231.000 26,762.59
McDowell 207.500 26,683.20
Mercer 457.000 26,447.11
Mineral 221.500 27,634.26
Mingo 227.000 26,742.04
Monongalia 508.500 29,326.70
Monroe 94.500 24,190.18
Morgan 123.000 27,014.02
Nicholas 209.500 24,535.16
Ohio 255.000 28,442.00
Pendleton 64.000 25,735.96
Pleasants 76.000 29,836.24
Pocahontas 71.500 25,788.82
Preston 210.000 24,511.84
Putnam 441.500 29,276.75
Raleigh 562.000 26,925.18
Randolph 202.000 24,709.53
Ritchie 81.500 25,758.89
Roane 125.000 24,708.88
Summers 78.500 24,643.73
Taylor 114.500 25,669.62
Tucker 59.000 25,409.46
Tyler 77.000 25,811.34
Upshur 191.500 24,834.55
Wayne 379.510 24,695.25
Webster 73.500 24,240.92
Wetzel 151.000 26,731.57
Wirt 54.000 24,665.19
Wood 593.000 28,893.20
Wyoming 214.500 24,577.65
Total 13,938.189 26,802.81$
OSF
12/23/13
Avg Contracted Salary SP - All positions 14
-137-

COUNTY BOARDS OF EDUCATION
AVERAGE CONTRACTED SALARIES - SERVICE PERSONNEL
(EXCLUDING RESA PERSONNEL - ARRANGED IN
DESCENDING ORDER BY AVERAGE)
2013-14 YEAR
Average
Ct. County FTE Salary
1 Pleasants 76.000 29,836.24$
2 Monongalia 508.500 29,326.70
3 Putnam 441.500 29,276.75
4 Jackson 241.500 29,175.07
5 Boone 236.740 29,089.18
6 Wood 593.000 28,893.20
7 Ohio 255.000 28,442.00
8 Harrison 514.500 28,081.65
9 Cabell 572.500 28,076.93
10 Brooke 168.000 27,861.73
11 Calhoun 61.000 27,651.31
12 Mineral 221.500 27,634.26
13 Kanawha 1,344.500 27,591.62
14 Morgan 123.000 27,014.02
15 Raleigh 562.000 26,925.18
16 Berkeley 936.400 26,916.56
17 Marshall 279.000 26,907.55
18 Mason 231.000 26,762.59
19 Mingo 227.000 26,742.04
20 Wetzel 151.000 26,731.57
21 McDowell 207.500 26,683.20
22 Mercer 457.000 26,447.11
23 Fayette 333.500 26,432.27
24 Hancock 205.000 26,394.69
25 Jefferson 453.039 26,333.30
26 Lewis 149.000 26,286.12
27 Marion 415.000 25,984.30
28 Logan 336.000 25,964.86
29 Tyler 77.000 25,811.34
30 Pocahontas 71.500 25,788.82
31 Ritchie 81.500 25,758.89
32 Pendleton 64.000 25,735.96
33 Taylor 114.500 25,669.62
34 Braxton 105.500 25,586.74
35 Tucker 59.000 25,409.46
36 Grant 87.000 25,348.43
37 Doddridge 75.000 25,145.57
38 Greenbrier 307.500 25,121.70
39 Hardy 111.500 25,068.03
40 Gilmer 52.500 24,936.93
41 Upshur 191.500 24,834.55
42 Lincoln 197.500 24,750.84
43 Randolph 202.000 24,709.53
44 Roane 125.000 24,708.88
45 Wayne 379.510 24,695.25
46 Wirt 54.000 24,665.19
47 Summers 78.500 24,643.73
48 Wyoming 214.500 24,577.65
49 Nicholas 209.500 24,535.16
50 Clay 102.500 24,517.16
51 Preston 210.000 24,511.84
52 Hampshire 182.000 24,370.23
53 Webster 73.500 24,240.92
54 Monroe 94.500 24,190.18
55 Barbour 117.500 23,977.55
- Total 13,938.189 26,802.81$
OSF
12/23/13
Avg Contracted Salary SP - All positions 14
-138-

COUNTY BOARDS OF EDUCATIONSTARTING SALARY FOR TEACHERS - BACHELOR'S
DEGREE WITH ZERO YEARS EXPERIENCEFOR THE 2013-14 YEAR
County Salary
Barbour 31,675$ Berkeley 34,488 Boone 35,765 Braxton 31,675 Brooke 32,701
Cabell 34,028 Calhoun 32,175 Clay 31,675 Doddridge 31,675 Fayette 32,875
Gilmer 31,675 Grant 31,675 Greenbrier 32,175 Hampshire 31,675 Hancock 33,273
Hardy 31,675 Harrison 33,165 Jackson 33,885 Jefferson 33,260 Kanawha 33,406
Lewis 32,725 Lincoln 32,425 Logan 32,675 Marion 31,715 Marshall 33,928
Mason 32,800 Mercer 33,425 Mineral 32,350 Mingo 32,675 Monongalia 35,400
Monroe 31,675 Morgan 33,831 McDowell 32,825 Nicholas 31,675 Ohio 32,875
Pendleton 31,675 Pleasants 34,367 Pocahontas 31,675 Preston 31,675 Putnam 35,302
Raleigh 33,725 Randolph 31,675 Ritchie 32,375 Roane 31,675 Summers 31,675
Taylor 31,925 Tucker 31,675 Tyler 31,675 Upshur 31,675 Wayne 31,675
Webster 31,675 Wetzel 31,675 Wirt 31,675 Wood 33,435 Wyoming 31,675
State Average 32,585$
OSF12/27/13Starting Salary Teachers 14
-139-
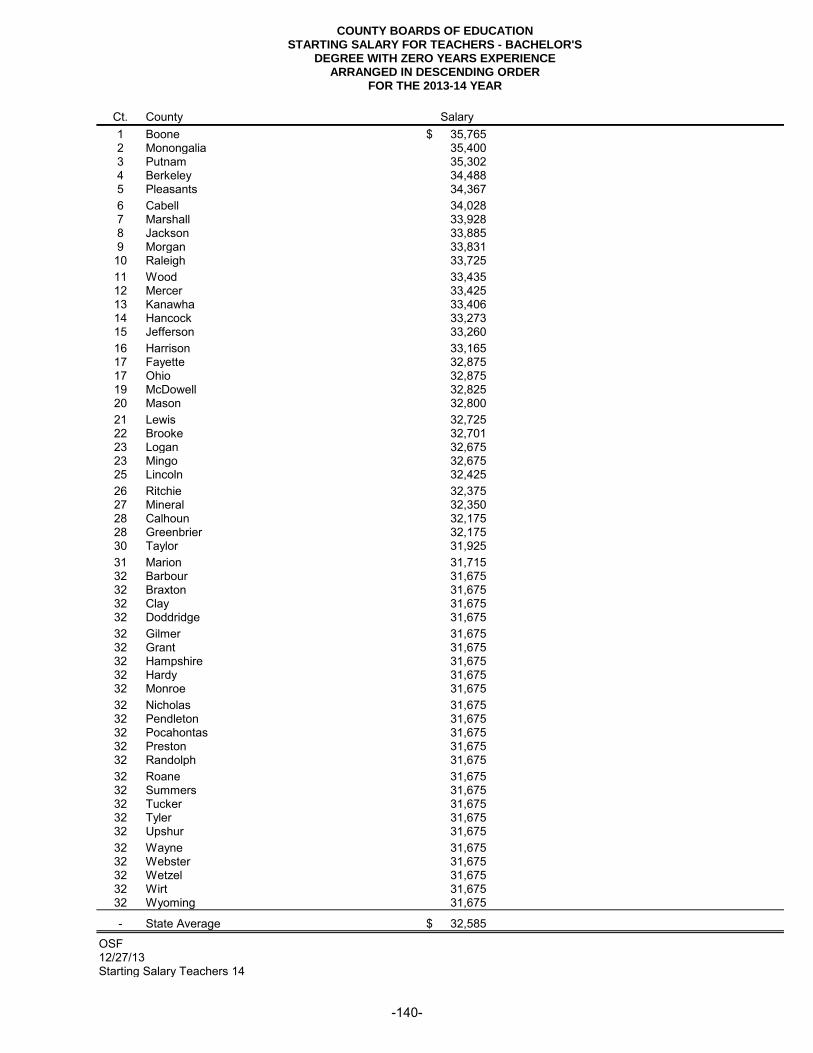
COUNTY BOARDS OF EDUCATIONSTARTING SALARY FOR TEACHERS - BACHELOR'S
DEGREE WITH ZERO YEARS EXPERIENCEARRANGED IN DESCENDING ORDER
FOR THE 2013-14 YEAR
Ct. County Salary
1 Boone 35,765$ 2 Monongalia 35,400 3 Putnam 35,302 4 Berkeley 34,488 5 Pleasants 34,367
6 Cabell 34,028 7 Marshall 33,928 8 Jackson 33,885 9 Morgan 33,831 10 Raleigh 33,725
11 Wood 33,435 12 Mercer 33,425 13 Kanawha 33,406 14 Hancock 33,273 15 Jefferson 33,260
16 Harrison 33,165 17 Fayette 32,875 17 Ohio 32,875 19 McDowell 32,825 20 Mason 32,800
21 Lewis 32,725 22 Brooke 32,701 23 Logan 32,675 23 Mingo 32,675 25 Lincoln 32,425
26 Ritchie 32,375 27 Mineral 32,350 28 Calhoun 32,175 28 Greenbrier 32,175 30 Taylor 31,925
31 Marion 31,715 32 Barbour 31,675 32 Braxton 31,675 32 Clay 31,675 32 Doddridge 31,675
32 Gilmer 31,675 32 Grant 31,675 32 Hampshire 31,675 32 Hardy 31,675 32 Monroe 31,675
32 Nicholas 31,675 32 Pendleton 31,675 32 Pocahontas 31,675 32 Preston 31,675 32 Randolph 31,675
32 Roane 31,675 32 Summers 31,675 32 Tucker 31,675 32 Tyler 31,675 32 Upshur 31,675
32 Wayne 31,675 32 Webster 31,675 32 Wetzel 31,675 32 Wirt 31,675 32 Wyoming 31,675
- State Average 32,585$
OSF
Starting Salary Teachers 1412/27/13
-140-

COUNTY BOARDS OF EDUCATION
AVERAGE OF PROFESSIONAL PERSONNEL SALARY SCHEDULES
FOR THE 2013-14 YEAR
Average
County Salary
Barbour 45,540.33
Berkeley 49,365.67
Boone 49,484.38
Braxton 45,540.33
Brooke 46,717.01
Cabell 48,192.16
Calhoun 46,040.33
Clay 45,540.33
Doddridge 45,540.33
Fayette 46,740.33
Gilmer 45,540.33
Grant 45,540.33
Greenbrier 46,040.33
Hampshire 45,540.33
Hancock 47,687.55
Hardy 45,540.33
Harrison 46,990.49
Jackson 47,740.37
Jefferson 48,001.86
Kanawha 47,864.73
Lewis 46,590.33
Lincoln 46,147.47
Logan 46,540.33
Marion 45,540.49
Marshall 49,266.00
Mason 46,808.19
McDowell 46,690.33
Mercer 47,290.33
Mineral 46,596.58
Mingo 47,140.33
Monongalia 49,316.92
Monroe 45,540.33
Morgan 48,073.77
Nicholas 45,540.33
Ohio 48,252.21
Pendleton 45,540.33
Pleasants 48,410.63
Pocahontas 45,540.33
Preston 45,540.33
Putnam 49,987.19
Raleigh 47,590.33
Randolph 45,540.33
Ritchie 46,240.33
Roane 45,540.33
Summers 45,540.33
Taylor 45,790.33
Tucker 45,540.33
Tyler 45,540.33
Upshur 45,540.33
Wayne 45,540.33
Webster 45,540.33
Wetzel 45,776.44
Wirt 45,540.33
Wood 47,405.67
Wyoming 45,540.33
State 46,613.58
OSF
4/30/13
Professional Salary Schedules by County 14
Notes: (1) All years of experience included in WVC 18A-4-2 were used in calculating the average of the salary schedules,
as prescribed by WVC 18A-4-5. (2) All county boards are within equity as defined in WVC 18A-4-5.
-141-

COUNTY BOARDS OF EDUCATION
AVERAGE OF PROFESSIONAL PERSONNEL SALARY SCHEDULES
ARRANGED IN DESCENDING ORDER
FOR THE 2013-14 YEAR
Percentage Average
Average Of Top Ten Salary
Ct. County Salary Average Salary Top Ten
1. Putnam 49,987.19 102.36%
2. Boone 49,484.38 101.33%
3. Berkeley 49,365.67 101.09%
4. Monongalia 49,316.92 100.99%
5. Marshall 49,266.00 100.88%
6. Pleasants 48,410.63 99.13%
7. Ohio 48,252.21 98.81%
8. Cabell 48,192.16 98.68%
9. Morgan 48,073.77 98.44%
10. Jefferson 48,001.86 98.29% 48,835.08$
11. Kanawha 47,864.73 98.01%
12. Jackson 47,740.37 97.76%
13. Hancock 47,687.55 97.65%
14. Raleigh 47,590.33 97.45%
15. Wood 47,405.67 97.07%
16. Mercer 47,290.33 96.84%
17. Mingo 47,140.33 96.53%
18. Harrison 46,990.49 96.22%
19. Mason 46,808.19 95.85%
20. Fayette 46,740.33 95.71%
21. Brooke 46,717.01 95.66%
22. McDowell 46,690.33 95.61%
23. Mineral 46,596.58 95.42%
24. Lewis 46,590.33 95.40%
25. Logan 46,540.33 95.30%
26. Ritchie 46,240.33 94.69%
27. Lincoln 46,147.47 94.50%
28. Calhoun 46,040.33 94.28%
28. Greenbrier 46,040.33 94.28%
30. Taylor 45,790.33 93.77%
31. Wetzel 45,776.44 93.74%
32. Marion 45,540.49 93.25%
33. Barbour 45,540.33 93.25%
33. Braxton 45,540.33 93.25%
33. Clay 45,540.33 93.25%
33. Doddridge 45,540.33 93.25%
33. Gilmer 45,540.33 93.25%
33. Grant 45,540.33 93.25%
33. Hampshire 45,540.33 93.25%
33. Hardy 45,540.33 93.25%
33. Monroe 45,540.33 93.25%
33. Nicholas 45,540.33 93.25%
33. Pendleton 45,540.33 93.25%
33. Pocahontas 45,540.33 93.25%
33. Preston 45,540.33 93.25%
33. Randolph 45,540.33 93.25%
33. Roane 45,540.33 93.25%
33. Summers 45,540.33 93.25%
33. Tucker 45,540.33 93.25%
33. Tyler 45,540.33 93.25%
33. Upshur 45,540.33 93.25%
33. Wayne 45,540.33 93.25%
33. Webster 45,540.33 93.25%
33. Wirt 45,540.33 93.25%
33. Wyoming 45,540.33 93.25%
State 46,613.58 - - (90% limit)
OSF
Professional Salary Schedules by County 14
Notes: (1) All years of experience included in WVC 18A-4-2 were used in calculating the average of the salary schedules,
as prescribed by WVC 18A-4-5. (2) All county boards are within equity as defined in WVC 18A-4-5.
04/30/13-142-

COUNTY BOARDS OF EDUCATION
AVERAGE OF SERVICE PERSONNEL SALARY SCHEDULES
FOR THE 2013-14 YEAR
Average
County Salary
Barbour 2,570.33
Berkeley 2,801.84
Boone 2,949.97
Braxton 2,570.33
Brooke 2,631.02
Cabell 2,793.33
Calhoun 2,620.33
Clay 2,570.33
Doddridge 2,570.33
Fayette 2,690.33
Gilmer 2,570.33
Grant 2,570.33
Greenbrier 2,607.83
Hampshire 2,570.33
Hancock 2,768.35
Hardy 2,570.33
Harrison 2,715.33
Jackson 2,790.33
Jefferson 2,736.75
Kanawha 2,727.02
Lewis 2,675.33
Lincoln 2,615.33
Logan 2,657.83
Marion 2,623.33
Marshall 2,960.50
Mason 2,682.83
McDowell 2,685.33
Mercer 2,740.33
Mineral 2,678.88
Mingo 2,740.33
Monongalia 2,941.13
Monroe 2,570.33
Morgan 2,708.63
Nicholas 2,570.33
Ohio 2,760.23
Pendleton 2,570.33
Pleasants 2,853.27
Pocahontas 2,570.33
Preston 2,570.33
Putnam 2,978.95
Raleigh 2,815.33
Randolph 2,570.33
Ritchie 2,620.33
Roane 2,570.33
Summers 2,570.33
Taylor 2,595.33
Tucker 2,570.33
Tyler 2,630.33
Upshur 2,570.33 Wayne 2,570.33
Webster 2,570.33
Wetzel 2,570.33
Wirt 2,570.33
Wood 2,746.33
Wyoming 2,570.33
State 2,666.54
OSF
10/30/2013
Serv Pers Salary Scheduled by County 14
Notes: (1) Several county boards use multiple level salary schedules; the above are the averages of level one only. (2) All
years of experience included in WVC 18A-4-2 were used in calculating the average of the salary schedules, as prescribed
by WVC 18A-4-5. (3) Twenty-three county boards are now out of equity, as defined in WVC 18A-4-5.
-143-

COUNTY BOARDS OF EDUCATION
AVERAGE OF SERVICE PERSONNEL SALARY SCHEDULES
ARRANGED IN DESCENDING ORDER
FOR THE 2013-14 YEAR
Percentage Average
Average Of Top Five Salary
Ct. County Salary Average Salary Top Ten
1. Putnam 2,978.95 103.97%
2. Marshall 2,960.50 103.32%
3. Boone 2,949.97 102.96%
4. Monongalia 2,941.13 102.65%
5. Pleasants 2,853.27 99.58%
6. Raleigh 2,815.33 98.26%
7. Berkeley 2,801.84 97.79%
8. Cabell 2,793.33 97.49%
9. Jackson 2,790.33 97.38%
10. Hancock 2,768.35 96.62% 2,865.30$
11. Ohio 2,760.23 96.33%
12. Wood 2,746.33 95.85%
13. Mercer 2,740.33 95.64%
14. Mingo 2,740.33 95.64%
15. Jefferson 2,736.75 95.51%
16. Kanawha 2,727.02 95.17%
17. Harrison 2,715.33 94.77%
18. Morgan 2,708.63 94.53%
19. Fayette 2,690.33 93.89%
20. McDowell 2,685.33 93.72%
21. Mason 2,682.83 93.63%
22. Mineral 2,678.88 93.49%
23. Lewis 2,675.33 93.37%
24. Logan 2,657.83 92.76%
25. Brooke 2,631.02 91.82%
26. Tyler 2,630.33 91.80%
27. Marion 2,623.33 91.56%
28. Calhoun 2,620.33 91.45%
28. Ritchie 2,620.33 91.45%
30. Lincoln 2,615.33 91.28%
31. Greenbrier 2,607.83 91.01%
32. Taylor 2,595.33 90.58%
33. Barbour 2,570.33 89.71%
33. Braxton 2,570.33 89.71%
33. Clay 2,570.33 89.71%
33. Doddridge 2,570.33 89.71%
33. Gilmer 2,570.33 89.71%
33. Grant 2,570.33 89.71%
33. Hampshire 2,570.33 89.71%
33. Hardy 2,570.33 89.71%
33. Monroe 2,570.33 89.71%
33. Nicholas 2,570.33 89.71%
33. Pendleton 2,570.33 89.71%
33. Pocahontas 2,570.33 89.71%
33. Preston 2,570.33 89.71%
33. Randolph 2,570.33 89.71%
33. Roane 2,570.33 89.71%
33. Summers 2,570.33 89.71%
33. Tucker 2,570.33 89.71%
33. Upshur 2,570.33 89.71%
33. Wayne 2,570.33 89.71%
33. Webster 2,570.33 89.71%
33. Wetzel 2,570.33 89.71%
33. Wirt 2,570.33 89.71%
33. Wyoming 2,570.33 89.71%
State 2,666.54 - -$ (90% limit)
OSF
Serv Pers Salary Scheduled by County 14
10/30/2013
Notes: (1) Several county boards use multiple level salary schedules; the above are the averages of level one only. (2) All
years of experience included in WVC 18A-4-2 were used in calculating the average of the salary schedules, as prescribed by
WVC 18A-4-5. (3) Twenty-three county boards are now out of equity, as defined in WVC 18A-4-5.
-144-

TEACHERS' STATE MINIMUM SALARY SCHEDULE TEACHERS' STATE MINIMUM SALARY SCHEDULESTATE BASIC SALARY WITHOUT EQUITY STATE EQUITY SUPPLEMENT SCHEDULE
FOR THE 2013-14 YEAR FOR THE 2013-14 YEAR
Years 4th 3rd 2nd A.B. M.A. M.A. M.A. Doc- Exp. Class Class Class A.B. +15 M.A. +15 +30 +45 torate
0 26,917 27,606 27,872 29,315 30,076 31,843 32,604 33,365 34,126 35,161
1 27,245 27,934 28,200 29,833 30,594 32,362 33,123 33,883 34,644 35,679
2 27,574 28,262 28,528 30,352 31,113 32,880 33,641 34,402 35,163 36,198
3 27,902 28,590 28,856 30,871 31,631 33,399 34,160 34,920 35,681 36,716
4 28,474 29,162 29,428 31,633 32,394 34,162 34,923 35,683 36,444 37,479
5 28,802 29,490 29,756 32,152 32,913 34,680 35,441 36,202 36,963 37,998
6 29,130 29,818 30,084 32,670 33,431 35,199 35,960 36,720 37,481 38,516
7 29,458 30,147 30,412 33,189 33,950 35,717 36,478 37,239 38,000 39,035
8 29,786 30,475 30,741 33,707 34,468 36,236 36,997 37,757 38,518 39,553
9 30,114 30,803 31,069 34,226 34,987 36,754 37,515 38,276 39,037 40,072
10 30,443 31,131 31,397 34,746 35,506 37,274 38,035 38,796 39,556 40,591
11 30,771 31,459 31,725 35,264 36,025 37,793 38,553 39,314 40,075 41,110
12 31,099 31,787 32,053 35,783 36,543 38,311 39,072 39,833 40,593 41,628
13 31,427 32,115 32,381 36,301 37,062 38,830 39,590 40,351 41,112 42,147
14 31,755 32,443 32,709 36,820 37,580 39,348 40,109 40,870 41,630 42,665
15 32,083 32,771 33,037 37,338 38,099 39,867 40,627 41,388 42,149 43,184
16 32,411 33,099 33,365 37,857 38,617 40,385 41,146 41,907 42,667 43,702
17 32,739 33,428 33,693 38,375 39,136 40,904 41,665 42,425 43,186 44,221
18 33,067 33,756 34,022 38,894 39,655 41,422 42,183 42,944 43,705 44,740
19 33,395 34,084 34,350 39,412 40,173 41,941 42,702 43,462 44,223 45,258
20 33,723 34,412 34,678 39,931 40,692 42,459 43,220 43,981 44,742 45,777
21 34,052 34,740 35,006 40,449 41,210 42,978 43,739 44,499 45,260 46,295
22 34,380 35,068 35,334 40,968 41,729 43,496 44,257 45,018 45,779 46,814
23 34,708 35,396 35,662 41,487 42,247 44,015 44,776 45,536 46,297 47,332
24 35,036 35,724 35,990 42,005 42,766 44,534 45,294 46,055 46,816 47,851
25 35,364 36,052 36,318 42,524 43,284 45,052 45,813 46,574 47,334 48,369
26 35,692 36,380 36,646 43,042 43,803 45,571 46,331 47,092 47,853 48,888
27 36,020 36,708 36,974 43,561 44,321 46,089 46,850 47,611 48,371 49,406
28 36,348 37,037 37,302 44,079 44,840 46,608 47,368 48,129 48,890 49,925
29 36,676 37,365 37,631 44,598 45,358 47,126 47,887 48,648 49,408 50,443
30 37,004 37,693 37,959 45,116 45,877 47,645 48,405 49,166 49,927 50,962
31 37,333 38,021 38,287 45,635 46,396 48,163 48,924 49,685 50,445 51,480
32 37,661 38,349 38,615 46,153 46,914 48,682 49,443 50,203 50,964 51,999
33 37,989 38,677 38,943 46,672 47,433 49,200 49,961 50,722 51,483 52,518
34 38,317 39,005 39,271 47,190 47,951 49,719 50,480 51,240 52,001 53,036
35 38,645 39,333 39,599 47,709 48,470 50,237 50,998 51,759 52,520 53,555
OSF
Note: This schedule does not include the $600 supplement for classroom teachers with at least 20 years of teaching
experience (WVC §18A-4-2), the $3,500 supplement for those with national certification from the National Board of
Professional Teaching Standards (NBPTS) (WVC §18A-4-2a), or the $2,500 supplement for speech-language pathologists,
audiologists, counselors, school psychologists, or school nurses with national certification (WVC §18A-4-4b).
04/30/13
State Salary Schedules 14
-145-

TEACHERS' STATE MINIMUM SALARY SCHEDULE TEACHERS' STATE MINIMUM SALARY SCHEDULESTATE EQUITY SUPPLEMENT SCHEDULE STATE TOTAL SALARY (BASIC PLUS EQUITY)
FOR THE 2013-14 YEAR FOR THE 2013-14 YEAR
Years 4th 3rd 2nd A.B. M.A. M.A. M.A. Doc- Exp. Class Class Class A.B. +15 M.A. +15 +30 +45 torate
0 1,781 1,796 1,877 2,360 2,452 2,644 2,740 2,836 2,836 2,927
1 1,819 1,863 1,946 2,429 2,521 2,713 2,809 2,905 2,905 2,996
2 1,857 1,930 2,015 2,498 2,590 2,782 2,878 2,974 2,974 3,065
3 1,895 1,997 2,084 2,567 2,659 2,851 2,947 3,043 3,043 3,134
4 1,933 2,064 2,153 2,636 2,728 2,920 3,016 3,112 3,112 3,203
5 1,971 2,131 2,222 2,705 2,797 2,989 3,085 3,181 3,181 3,272
6 2,009 2,198 2,291 2,774 2,866 3,058 3,154 3,250 3,250 3,341
7 2,047 2,265 2,360 2,843 2,935 3,127 3,223 3,319 3,319 3,410
8 2,085 2,332 2,429 2,912 3,004 3,196 3,292 3,388 3,388 3,479
9 2,123 2,399 2,498 2,981 3,073 3,265 3,361 3,457 3,457 3,548
10 2,161 2,466 2,567 3,050 3,142 3,334 3,430 3,526 3,526 3,617
11 2,199 2,533 2,636 3,119 3,211 3,403 3,499 3,595 3,595 3,686
12 2,237 2,600 2,705 3,188 3,280 3,472 3,568 3,664 3,664 3,755
13 2,275 2,667 2,774 3,257 3,349 3,541 3,637 3,733 3,733 3,824
14 2,313 2,734 2,843 3,326 3,418 3,610 3,706 3,802 3,802 3,893
15 2,351 2,801 2,912 3,395 3,487 3,679 3,775 3,871 3,871 3,962
16 2,389 2,868 2,981 3,464 3,556 3,748 3,844 3,940 3,940 4,031
17 2,427 2,935 3,050 3,533 3,625 3,817 3,913 4,009 4,009 4,100
18 2,465 3,002 3,119 3,602 3,694 3,886 3,982 4,078 4,078 4,169
19 2,503 3,069 3,188 3,671 3,763 3,955 4,051 4,147 4,147 4,238
20 2,541 3,136 3,257 3,740 3,832 4,024 4,120 4,216 4,216 4,307
21 2,579 3,203 3,326 3,809 3,901 4,093 4,189 4,285 4,285 4,376
22 2,617 3,270 3,395 3,878 3,970 4,162 4,258 4,354 4,354 4,445
23 2,655 3,337 3,464 3,947 4,039 4,231 4,327 4,423 4,423 4,514
24 2,693 3,404 3,533 4,016 4,108 4,300 4,396 4,492 4,492 4,583
25 2,731 3,471 3,602 4,085 4,177 4,369 4,465 4,561 4,561 4,652
26 2,769 3,538 3,671 4,154 4,246 4,438 4,534 4,630 4,630 4,721
27 2,807 3,605 3,740 4,223 4,315 4,507 4,603 4,699 4,699 4,790
28 2,845 3,672 3,809 4,292 4,384 4,576 4,672 4,768 4,768 4,859
29 2,883 3,739 3,878 4,361 4,453 4,645 4,741 4,837 4,837 4,928
30 2,921 3,806 3,947 4,430 4,522 4,714 4,810 4,906 4,906 4,997
31 2,959 3,873 4,016 4,499 4,591 4,783 4,879 4,975 4,975 5,066
32 2,997 3,940 4,085 4,568 4,660 4,852 4,948 5,044 5,044 5,135
33 3,035 4,007 4,154 4,637 4,729 4,921 5,017 5,113 5,113 5,204
34 3,073 4,074 4,223 4,706 4,798 4,990 5,086 5,182 5,182 5,273
35 3,111 4,141 4,292 4,775 4,867 5,059 5,155 5,251 5,251 5,342
OSF
04/30/13
Note: This schedule does not include the $600 supplement for classroom teachers with at least 20 years of teaching
experience (WVC §18A-4-2), the $3,500 supplement for those with national certification from the National Board of
Professional Teaching Standards (NBPTS) (WVC §18A-4-2a), or the $2,500 supplement for speech-language pathologists,
audiologists, counselors, school psychologists, or school nurses with national certification (WVC §18A-4-4b).
State Salary Schedules 14
-146-
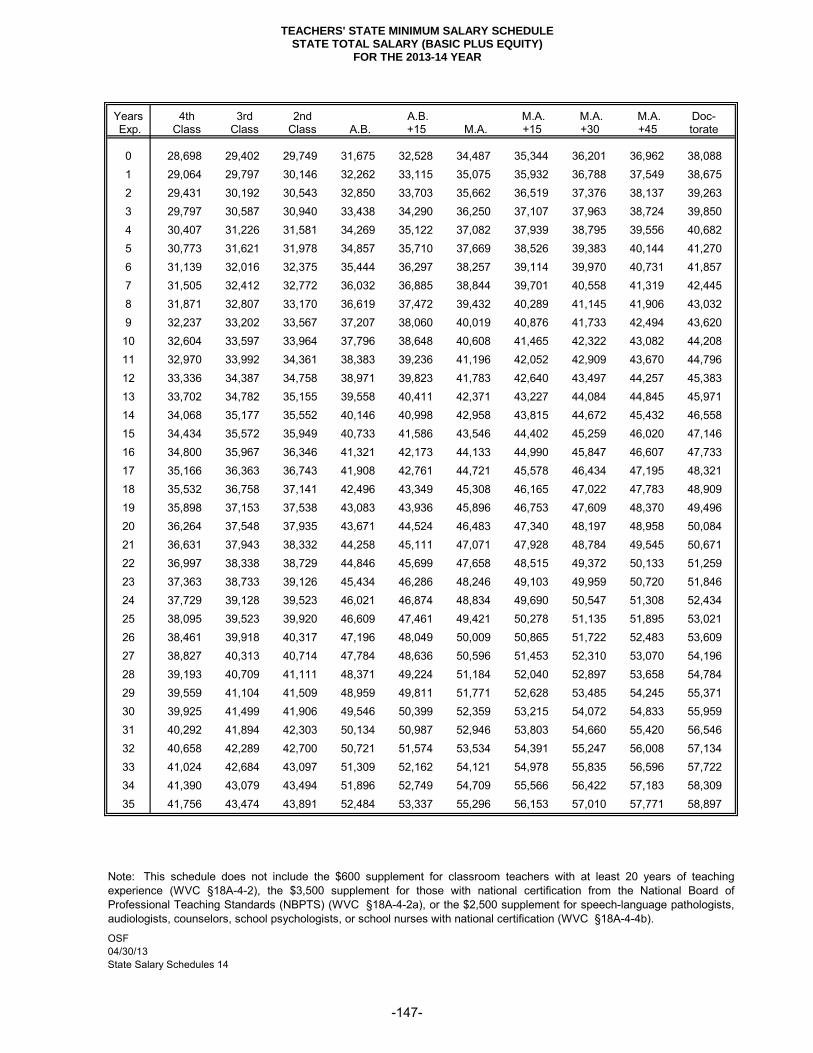
TEACHERS' STATE MINIMUM SALARY SCHEDULESTATE TOTAL SALARY (BASIC PLUS EQUITY)
FOR THE 2013-14 YEAR
Years 4th 3rd 2nd A.B. M.A. M.A. M.A. Doc- Exp. Class Class Class A.B. +15 M.A. +15 +30 +45 torate
0 28,698 29,402 29,749 31,675 32,528 34,487 35,344 36,201 36,962 38,088
1 29,064 29,797 30,146 32,262 33,115 35,075 35,932 36,788 37,549 38,675
2 29,431 30,192 30,543 32,850 33,703 35,662 36,519 37,376 38,137 39,263
3 29,797 30,587 30,940 33,438 34,290 36,250 37,107 37,963 38,724 39,850
4 30,407 31,226 31,581 34,269 35,122 37,082 37,939 38,795 39,556 40,682
5 30,773 31,621 31,978 34,857 35,710 37,669 38,526 39,383 40,144 41,270
6 31,139 32,016 32,375 35,444 36,297 38,257 39,114 39,970 40,731 41,857
7 31,505 32,412 32,772 36,032 36,885 38,844 39,701 40,558 41,319 42,445
8 31,871 32,807 33,170 36,619 37,472 39,432 40,289 41,145 41,906 43,032
9 32,237 33,202 33,567 37,207 38,060 40,019 40,876 41,733 42,494 43,620
10 32,604 33,597 33,964 37,796 38,648 40,608 41,465 42,322 43,082 44,208
11 32,970 33,992 34,361 38,383 39,236 41,196 42,052 42,909 43,670 44,796
12 33,336 34,387 34,758 38,971 39,823 41,783 42,640 43,497 44,257 45,383
13 33,702 34,782 35,155 39,558 40,411 42,371 43,227 44,084 44,845 45,971
14 34,068 35,177 35,552 40,146 40,998 42,958 43,815 44,672 45,432 46,558
15 34,434 35,572 35,949 40,733 41,586 43,546 44,402 45,259 46,020 47,146
16 34,800 35,967 36,346 41,321 42,173 44,133 44,990 45,847 46,607 47,733
17 35,166 36,363 36,743 41,908 42,761 44,721 45,578 46,434 47,195 48,321
18 35,532 36,758 37,141 42,496 43,349 45,308 46,165 47,022 47,783 48,909
19 35,898 37,153 37,538 43,083 43,936 45,896 46,753 47,609 48,370 49,496
20 36,264 37,548 37,935 43,671 44,524 46,483 47,340 48,197 48,958 50,084
21 36,631 37,943 38,332 44,258 45,111 47,071 47,928 48,784 49,545 50,671
22 36,997 38,338 38,729 44,846 45,699 47,658 48,515 49,372 50,133 51,259
23 37,363 38,733 39,126 45,434 46,286 48,246 49,103 49,959 50,720 51,846
24 37,729 39,128 39,523 46,021 46,874 48,834 49,690 50,547 51,308 52,434
25 38,095 39,523 39,920 46,609 47,461 49,421 50,278 51,135 51,895 53,021
26 38,461 39,918 40,317 47,196 48,049 50,009 50,865 51,722 52,483 53,609
27 38,827 40,313 40,714 47,784 48,636 50,596 51,453 52,310 53,070 54,196
28 39,193 40,709 41,111 48,371 49,224 51,184 52,040 52,897 53,658 54,784
29 39,559 41,104 41,509 48,959 49,811 51,771 52,628 53,485 54,245 55,371
30 39,925 41,499 41,906 49,546 50,399 52,359 53,215 54,072 54,833 55,959
31 40,292 41,894 42,303 50,134 50,987 52,946 53,803 54,660 55,420 56,546
32 40,658 42,289 42,700 50,721 51,574 53,534 54,391 55,247 56,008 57,134
33 41,024 42,684 43,097 51,309 52,162 54,121 54,978 55,835 56,596 57,722
34 41,390 43,079 43,494 51,896 52,749 54,709 55,566 56,422 57,183 58,309
35 41,756 43,474 43,891 52,484 53,337 55,296 56,153 57,010 57,771 58,897
OSF
04/30/13
Note: This schedule does not include the $600 supplement for classroom teachers with at least 20 years of teaching
experience (WVC §18A-4-2), the $3,500 supplement for those with national certification from the National Board of
Professional Teaching Standards (NBPTS) (WVC §18A-4-2a), or the $2,500 supplement for speech-language pathologists,
audiologists, counselors, school psychologists, or school nurses with national certification (WVC §18A-4-4b).
State Salary Schedules 14
-147-

SERVICE PERSONNEL STATE MINIMUM MONTHLY PAY SCALE SERVICE PERSONNEL STATE MINIMUM MONTHLY PAY SCALESTATE BASIC PAY SCALE WITHOUT EQUITY STATE EQUITY SUPPLEMENT PAY SCALE
FOR THE 2013-14 YEAR FOR THE 2013-14 YEAR
Years PAY GRADE Exp. A B C D E F G H
0 1,627 1,648 1,689 1,741 1,793 1,855 1,886 1,958
1 1,659 1,680 1,721 1,773 1,825 1,887 1,918 1,990
2 1,691 1,712 1,753 1,805 1,857 1,919 1,950 2,022
3 1,723 1,744 1,785 1,837 1,889 1,951 1,982 2,054
4 1,755 1,776 1,817 1,869 1,921 1,983 2,014 2,087
5 1,787 1,808 1,849 1,901 1,953 2,015 2,046 2,119
6 1,819 1,840 1,882 1,933 1,985 2,047 2,078 2,151
7 1,852 1,872 1,914 1,965 2,017 2,079 2,110 2,183
8 1,884 1,904 1,946 1,997 2,049 2,111 2,142 2,215
9 1,916 1,936 1,978 2,030 2,081 2,143 2,174 2,247
10 1,948 1,969 2,010 2,062 2,113 2,176 2,207 2,279
11 1,980 2,001 2,042 2,094 2,145 2,208 2,239 2,311
12 2,012 2,033 2,074 2,126 2,178 2,240 2,271 2,343
13 2,044 2,065 2,106 2,158 2,210 2,272 2,303 2,375
14 2,076 2,097 2,138 2,190 2,242 2,304 2,335 2,407
15 2,108 2,129 2,170 2,222 2,274 2,336 2,367 2,439
16 2,140 2,161 2,202 2,254 2,306 2,368 2,399 2,472
17 2,172 2,193 2,235 2,286 2,338 2,400 2,431 2,504
18 2,204 2,225 2,267 2,318 2,370 2,432 2,463 2,536
19 2,237 2,257 2,299 2,350 2,402 2,464 2,495 2,568
20 2,269 2,289 2,331 2,383 2,434 2,496 2,527 2,601
21 2,301 2,321 2,363 2,415 2,466 2,528 2,559 2,634
22 2,333 2,354 2,395 2,447 2,498 2,561 2,593 2,666
23 2,365 2,386 2,427 2,479 2,531 2,594 2,625 2,699
24 2,397 2,418 2,459 2,511 2,563 2,627 2,658 2,732
25 2,429 2,450 2,491 2,543 2,596 2,659 2,691 2,764
26 2,461 2,482 2,523 2,576 2,629 2,692 2,723 2,797
27 2,493 2,514 2,555 2,608 2,661 2,724 2,756 2,829
28 2,525 2,546 2,588 2,641 2,694 2,757 2,789 2,863
29 2,557 2,579 2,621 2,673 2,726 2,790 2,821 2,896
30 2,591 2,611 2,654 2,706 2,759 2,822 2,854 2,928
31 2,623 2,644 2,687 2,739 2,792 2,855 2,887 2,961
32 2,656 2,676 2,719 2,772 2,824 2,888 2,919 2,994
33 2,689 2,709 2,752 2,805 2,857 2,920 2,953 3,026
34 2,721 2,743 2,785 2,838 2,890 2,954 2,986 3,059
35 2,754 2,775 2,817 2,870 2,923 2,987 3,018 3,092
36 2,787 2,808 2,850 2,903 2,956 3,019 3,051 3,124
37 2,819 2,841 2,883 2,936 2,989 3,052 3,083 3,157
38 2,852 2,873 2,915 2,968 3,021 3,084 3,116 3,190
39 2,885 2,906 2,948 3,001 3,054 3,117 3,149 3,222
40 2,917 2,939 2,980 3,033 3,087 3,150 3,181 3,256
OSF
State Salary Schedules 14
Note: This schedule does not include the $12/month supplemental pay for having a high school diploma or GED; the
educational bonuses of: $11/month for each of the following levels of college credit or comparable training in a trade or
vocational school: 12, 24, 36, 48, 60, 72, 84, 96, 108, or 120 hours; $40/month for an associate, bachelor's, master's, or
doctorate degree; or $11/month for each of the following: BA+15, MA+15, MA+30, MA+45, or MA+60: or the $10/month
shift differential pay.
04/30/13
-148-
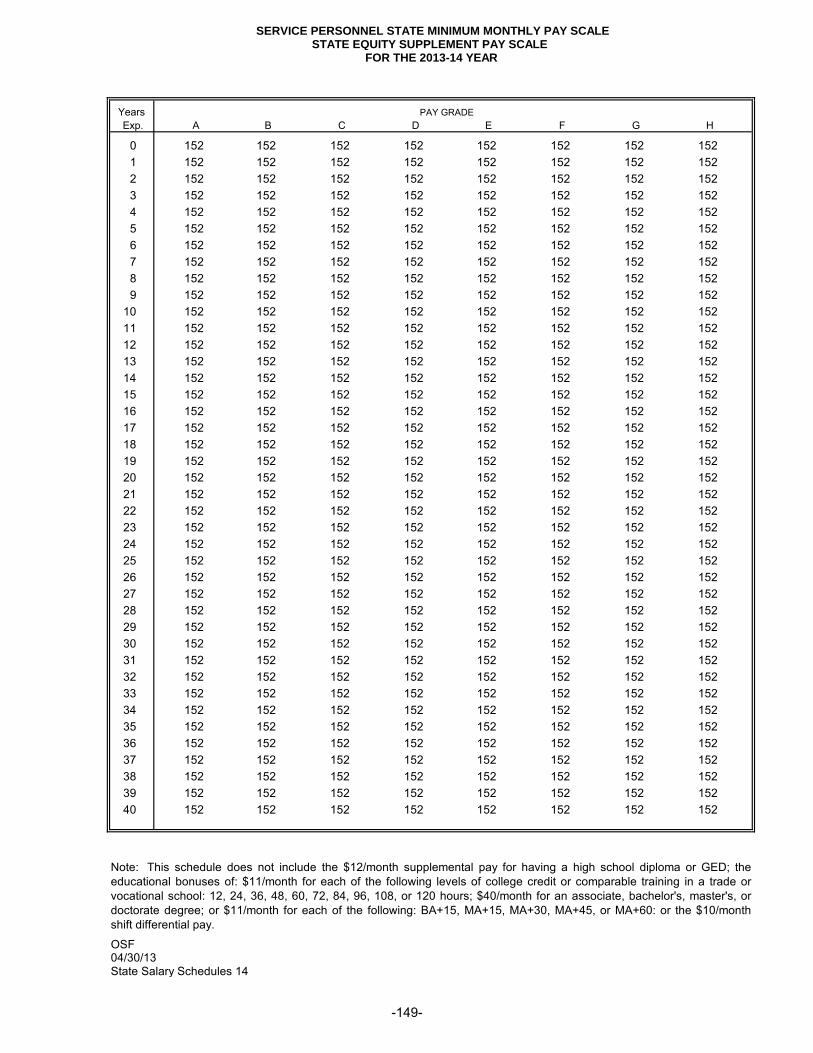
SERVICE PERSONNEL STATE MINIMUM MONTHLY PAY SCALE SERVICE PERSONNEL STATE MINIMUM MONTHLY PAY SCALESTATE EQUITY SUPPLEMENT PAY SCALE TOTAL MINIMUM REQUIRED PAY SCALE (BASIC PLUS EQUITY)
FOR THE 2013-14 YEAR FOR THE 2013-14 YEAR
Years PAY GRADE Exp. A B C D E F G H
0 152 152 152 152 152 152 152 152
1 152 152 152 152 152 152 152 152
2 152 152 152 152 152 152 152 152
3 152 152 152 152 152 152 152 152
4 152 152 152 152 152 152 152 152
5 152 152 152 152 152 152 152 152
6 152 152 152 152 152 152 152 152
7 152 152 152 152 152 152 152 152
8 152 152 152 152 152 152 152 152
9 152 152 152 152 152 152 152 152
10 152 152 152 152 152 152 152 152
11 152 152 152 152 152 152 152 152
12 152 152 152 152 152 152 152 152
13 152 152 152 152 152 152 152 152
14 152 152 152 152 152 152 152 152
15 152 152 152 152 152 152 152 152
16 152 152 152 152 152 152 152 152
17 152 152 152 152 152 152 152 152
18 152 152 152 152 152 152 152 152
19 152 152 152 152 152 152 152 152
20 152 152 152 152 152 152 152 152
21 152 152 152 152 152 152 152 152
22 152 152 152 152 152 152 152 152
23 152 152 152 152 152 152 152 152
24 152 152 152 152 152 152 152 152
25 152 152 152 152 152 152 152 152
26 152 152 152 152 152 152 152 152
27 152 152 152 152 152 152 152 152
28 152 152 152 152 152 152 152 152
29 152 152 152 152 152 152 152 152
30 152 152 152 152 152 152 152 152
31 152 152 152 152 152 152 152 152
32 152 152 152 152 152 152 152 152
33 152 152 152 152 152 152 152 152
34 152 152 152 152 152 152 152 152
35 152 152 152 152 152 152 152 152
36 152 152 152 152 152 152 152 152
37 152 152 152 152 152 152 152 152
38 152 152 152 152 152 152 152 152
39 152 152 152 152 152 152 152 152
40 152 152 152 152 152 152 152 152
OSF
State Salary Schedules 1404/30/13
Note: This schedule does not include the $12/month supplemental pay for having a high school diploma or GED; the
educational bonuses of: $11/month for each of the following levels of college credit or comparable training in a trade or
vocational school: 12, 24, 36, 48, 60, 72, 84, 96, 108, or 120 hours; $40/month for an associate, bachelor's, master's, or
doctorate degree; or $11/month for each of the following: BA+15, MA+15, MA+30, MA+45, or MA+60: or the $10/month
shift differential pay.
-149-

SERVICE PERSONNEL STATE MINIMUM MONTHLY PAY SCALETOTAL MINIMUM REQUIRED PAY SCALE (BASIC PLUS EQUITY)
FOR THE 2013-14 YEAR
Years PAY GRADE
Exp. A B C D E F G H
0 1,779 1,800 1,841 1,893 1,945 2,007 2,038 2,110
1 1,811 1,832 1,873 1,925 1,977 2,039 2,070 2,142
2 1,843 1,864 1,905 1,957 2,009 2,071 2,102 2,174
3 1,875 1,896 1,937 1,989 2,041 2,103 2,134 2,206
4 1,907 1,928 1,969 2,021 2,073 2,135 2,166 2,239
5 1,939 1,960 2,001 2,053 2,105 2,167 2,198 2,271
6 1,971 1,992 2,034 2,085 2,137 2,199 2,230 2,303
7 2,004 2,024 2,066 2,117 2,169 2,231 2,262 2,335
8 2,036 2,056 2,098 2,149 2,201 2,263 2,294 2,367
9 2,068 2,088 2,130 2,182 2,233 2,295 2,326 2,399
10 2,100 2,121 2,162 2,214 2,265 2,328 2,359 2,431
11 2,132 2,153 2,194 2,246 2,297 2,360 2,391 2,463
12 2,164 2,185 2,226 2,278 2,330 2,392 2,423 2,495
13 2,196 2,217 2,258 2,310 2,362 2,424 2,455 2,527
14 2,228 2,249 2,290 2,342 2,394 2,456 2,487 2,559
15 2,260 2,281 2,322 2,374 2,426 2,488 2,519 2,591
16 2,292 2,313 2,354 2,406 2,458 2,520 2,551 2,624
17 2,324 2,345 2,387 2,438 2,490 2,552 2,583 2,656
18 2,356 2,377 2,419 2,470 2,522 2,584 2,615 2,688
19 2,389 2,409 2,451 2,502 2,554 2,616 2,647 2,720
20 2,421 2,441 2,483 2,535 2,586 2,648 2,679 2,753
21 2,453 2,473 2,515 2,567 2,618 2,680 2,711 2,786
22 2,485 2,506 2,547 2,599 2,650 2,713 2,745 2,818
23 2,517 2,538 2,579 2,631 2,683 2,746 2,777 2,851
24 2,549 2,570 2,611 2,663 2,715 2,779 2,810 2,884
25 2,581 2,602 2,643 2,695 2,748 2,811 2,843 2,916
26 2,613 2,634 2,675 2,728 2,781 2,844 2,875 2,949
27 2,645 2,666 2,707 2,760 2,813 2,876 2,908 2,981
28 2,677 2,698 2,740 2,793 2,846 2,909 2,941 3,015
29 2,709 2,731 2,773 2,825 2,878 2,942 2,973 3,048
30 2,743 2,763 2,806 2,858 2,911 2,974 3,006 3,080
31 2,775 2,796 2,839 2,891 2,944 3,007 3,039 3,113
32 2,808 2,828 2,871 2,924 2,976 3,040 3,071 3,146
33 2,841 2,861 2,904 2,957 3,009 3,072 3,105 3,178
34 2,873 2,895 2,937 2,990 3,042 3,106 3,138 3,211
35 2,906 2,927 2,969 3,022 3,075 3,139 3,170 3,244
36 2,939 2,960 3,002 3,055 3,108 3,171 3,203 3,276
37 2,971 2,993 3,035 3,088 3,141 3,204 3,235 3,309
38 3,004 3,025 3,067 3,120 3,173 3,236 3,268 3,342
39 3,037 3,058 3,100 3,153 3,206 3,269 3,301 3,374
40 3,069 3,091 3,132 3,185 3,239 3,302 3,333 3,408
OSF
State Salary Schedules 1404/30/13
Note: This schedule does not include the $12/month supplemental pay for having a high school diploma or GED; the
educational bonuses of: $11/month for each of the following levels of college credit or comparable training in a trade or
vocational school: 12, 24, 36, 48, 60, 72, 84, 96, 108, or 120 hours; $40/month for an associate, bachelor's, master's, or
doctorate degree; or $11/month for each of the following: BA+15, MA+15, MA+30, MA+45, or MA+60: or the $10/month
shift differential pay.
-150-

PRINCIPALS AND ASSISTANT PRINCIPALSSTATE MINIMUM SALARY INCREMENT SCHEDULE
FOR THE 2013-14 YEAR
A.B. M.A. M.A. M.A. Doc- Degree Classification A.B. +15 M.A. +15 +30 +45 torate
State Basic Salary 29,315 30,076 31,843 32,604 33,365 34,126 35,161
PRINCIPALS SALARY INCREMENT SCHEDULE
Number Teachers A.B. M.A. M.A. M.A. Doc-
Supervised Rate A.B. +15 M.A. +15 +30 +45 torate
1 - 7 11.00% 3,225 3,308 3,503 3,586 3,670 3,754 3,868 8 - 14 11.50% 3,371 3,459 3,662 3,749 3,837 3,924 4,044 15 - 24 12.00% 3,518 3,609 3,821 3,912 4,004 4,095 4,219 25 - 38 12.50% 3,664 3,760 3,980 4,076 4,171 4,266 4,395 39 - 57 13.00% 3,811 3,910 4,140 4,239 4,337 4,436 4,571 58 - Up 13.50% 3,958 4,060 4,299 4,402 4,504 4,607 4,747
ASSISTANT PRINCIPALS SALARY INCREMENT SCHEDULE
Number Teachers A.B. M.A. M.A. M.A. Doc-
Supervised Rate A.B. +15 M.A. +15 +30 +45 torate
1 - 7 5.50% 1,612 1,654 1,751 1,793 1,835 1,877 1,934 8 - 14 5.75% 1,686 1,729 1,831 1,875 1,918 1,962 2,022 15 - 24 6.00% 1,759 1,805 1,911 1,956 2,002 2,048 2,110 25 - 38 6.25% 1,832 1,880 1,990 2,038 2,085 2,133 2,198 39 - 57 6.50% 1,905 1,955 2,070 2,119 2,169 2,218 2,285 58 - Up 6.75% 1,979 2,030 2,149 2,201 2,252 2,304 2,373
Notes: (1) Reference - West Virginia Code §18A-4-3.
OSF
State Salary Schedules 14
4/30/13
-151-

This Page Intentionally Left Blank
-152-

SUMMARY OF INCREASES TO TEACHERS
STATE BASIC SALARY SCHEDULE
1975-76 THROUGH 2013-14
A.B. M.A. M.A. M.A. Doc- Exp.
A.B. +15 M.A. +15 +30 +45(d) torate Incr.
Basic salary 1975-76 7,655 7,959 8,263 8,565 8,869 - 9,172 146
Basic salary increases:
1976-77 1,000 1,000 1,000 1,000 1,000 - 1,000 -
1977-78 - 86 172 260 346 - 433 59
1978-79 - 110 220 330 440 - 550 52
1979-80 150 250 350 450 550 - 650 64
1980-81 950 950 950 950 950 - 950 -
1981-82 1,900 1,900 1,900 1,900 1,900 - 1,900 -
1982-83 - - - - - - - -
1983-84 - - - - - - - -
1984-85 (a) 800 800 800 800 800 - 800 40
1985-86 (b) 200 300 400 500 600 - 700 20
1986-87 600 600 600 600 600 - 600 -
1987-88 - - - - - - - -
1988-89 - - - - - - - -
1989-90 (c) 663 698 733 768 803 - 838 19
1990-91 2,000 2,000 2,000 2,000 2,000 - 2,000 -
1991-92 1,000 1,000 1,000 1,000 1,000 - 1,000 -
1992-93 2,000 2,000 2,973 2,973 2,973 - 3,238 -
1993-94 - - - - - - - -
1994-95 (d) 500 500 500 500 500 24,066 1,235 40
1995-96 - - - - - - - -
1996-97 500 500 500 500 500 500 500 25
1997-98 - - - - - - - -
1998-99 756 756 756 756 756 756 756 -
1999-2000 756 756 756 756 756 756 756 -
2000-01 756 756 756 756 756 756 756 -
2001-02 (e) 1,000 1,000 1,000 1,000 1,000 1,000 1,000 -
2002-03 (f) 804 804 804 804 804 804 804 36
2003-04 - - - - - - - -
2004-05 - - - - - - - -
2005-06 (g) 1,350 1,350 1,350 1,350 1,350 1,350 1,350 -
2006-07 (g) - - - - - - - -
2007-08 (g)(h) 887 913 972 998 1,024 1,050 1,085 18
2008-09 (g) 1,600 1,600 1,600 1,600 1,600 1,600 1,600 -
2009-10 - - - - - - - -
2010-11 - - - - - - - -
2011-12 1,488 1,488 1,488 1,488 1,488 1,488 1,488 -
2012-13 - - - - - - - -
2013-14 - - - - - - - -
Total increase 21,660 22,117 23,580 24,039 24,496 34,126 25,989 373
Basic salary 2013-14 29,315 30,076 31,843 32,604 33,365 34,126 35,161 519
Annual experience increment:
Years 1 - 3 519 519 519 519 519 519 519 (h)
Year 4 763 763 763 763 763 763 763
Years 5 - 35 519 519 519 519 519 519 519
Max. years for increase 35 35 35 35 35 35 35
Max incremental increase 18,394 18,394 18,394 18,394 18,394 18,394 18,394
Basic salary with max exper-
ience increment 2013-14 47,709 48,470 50,237 50,998 51,759 52,520 53,555
Notes:
(a) Salary equity began in 1984-85 with experience increment increases of $69/yr; salaries shown do not include salary equity.
(b) Classroom teachers with 20 years of teaching experience provided an additional $600 annually.
(c) The 5% increase in basic salaries in 1989-90 was provided the second half of the year.
(d) MA+45 salary classification created beginning with the 1994-95 year.
(e)
(f)
(g)
(h)
(i) Basic salries increased by $1,488 for the 2011-12 year.
Salary History
In addition to the $1,000 increase in basic salaries, the $534 experience increment ($465 basic salaries plus $69 equity) was extended to
those with 31 - 35 years of experience; all increases were made effective the 2nd quarter.
In addition to the $804 increase in basic salaries, the experience increment was increased from $534 to $570 ($501 basic salaries plus $69
equity), and the $570 experience increment was extended to those with 29 and 30 years of experience.
In addition to the $1,350 increase in basic salary, effective the first day of the second quarter, the experience increment of $570 ($501 basic
salary plus $69 equity) was extended one year for the 2005-06 year, three years for the 2006-07 year, three additional years for the 2007-08
year, and the salary schedule was completely filled in from 1 - 35 years for the 2008-09 year.
In addition to the increases discussed in the preceding note, basic salaries increased by 3.5% for the 2007-08 year, which also increased the
experience increment by $17.54 per year, making the total experience increment $588 per year ($519 in basic salaries plus $69 equity),
except between the 3rd and 4th year where the total increase is $832 ($763 in basic salaries plus $69 equity).
-153-

SUMMARY OF INCREASES TO SERVICE PERSONNEL
MONTHLY STATE BASIC PAY SCALE
1975-76 THROUGH 2013-14
---------------------------------------------------- Pay Grade ------------------------------------------------- Exp.
A B C D E F G H Incr.
Basic salary - 1975-76 350 370 410 460 510 570 600 670 10
Basic salary increases:
1976-77 100 100 100 100 100 100 100 100 -
1977-78 (a) 25 25 25 25 25 25 25 25 -
1978-79 35 35 35 35 35 35 35 35 -
1979-80 28 28 28 28 28 28 28 28 3
1980-81 80 80 80 80 80 80 80 80 -
1981-82 (b) 56 56 56 56 56 56 56 56 5
1982-83 - - - - - - - - -
1983-84 - - - - - - - - -
1984-85 (c) 44 44 44 44 44 44 44 44 2
1985-86 (d) 44 44 44 44 44 44 44 44 -
1986-87 60 60 60 60 60 60 60 60 -
1987-88 - - - - - - - - -
1988-89 - - - - - - - - -
1989-90 (e) 27 27 27 27 27 27 27 27 2
1990-91 84 84 84 84 84 84 84 84 -
1991-92 17 17 17 17 17 17 17 17 -
1992-93 - - - - - - - - -
1993-94 - - - - - - - - -
1994-95 (f) 60 60 60 60 60 60 60 60 3
1995-96 -- -- -- -- -- -- -- -- -
1996-97 30 30 30 30 30 30 30 30 1
1997-98 - - - - - - - - -
1998-99 (g) 60 60 60 60 60 60 60 60 1
1999-2000 (h) 60 60 60 60 60 60 60 60 1
2000-01 (i) 60 60 60 60 60 60 60 60 1
2001-02 (j) 75 75 75 75 75 75 75 75 1
2002-03 (k) 71 71 71 71 71 71 71 71 1
2003-04 - - - - - - - - -
2004-05 - - - - - - - - -
2005-06 90 90 90 90 90 90 90 90 -
2006-07 - - - - - - - - -
2007-08 (m) 51 52 53 55 57 59 60 62 1
2008-09 70 70 70 70 70 70 70 70 -
2009-10 - - - - - - - - -
2010-11 - - - - - - - - -
2011-12 (n) 50 50 50 50 50 50 50 50 -
2012-13 - - - - - - - - -
2013-14 - - - - - - - - -
Total increases 1,277 1,278 1,279 1,281 1,283 1,285 1,286 1,288 22
Basic salary 2013-14 1,627 1,648 1,689 1,741 1,793 1,855 1,886 1,958 32
Annual experience increment:
Years 1 - 40 32.25 32.28 32.28 32.30 32.35 32.38 32.38 32.45 (m)
Maximum years for increase 40 40 40 40 40 40 40 40
Maximum incremental increase 1,287 1,291 1,291 1,292 1,294 1,295 1,295 1,298
Basic salary with maximum exper-ience increment 2013-14 2,917 2,939 2,980 3,033 3,087 3,150 3,181 3,256
Notes:
(a) Experience increment increase extended from 10 years to 13 years.
(b) Experience increment increase extended from 13 years to 16 years.(c) Salary equity began in 1984-85; salaries shown do not include salary equity. Exp. Incr. extended from 16 years to 20 years.
(d) Experience increment increase extended from 20 years to 25 years.
(e)
(f)
(g)
(h)
(i)
(j)
(k)
(l)
(m) Basic salaries increased by 3.5% for the 2007-08 year, which also increased the experience increment by $1.09 per month.
(n) Basic salaries increased by 2.0% or $500 minimum for the 2011-12 year.
(o) Basic salaries increased by 2.0% for the 2014-15 year.
Salary History
Increase in basic salary made effective the first day of second quarter.
In additional to the $71/month increase in basic salaries, educational bonuses were extended to include BA+15, MA+15, MA+30,
MA+45, MA+60, and associate and doctorate degrees; bonuses for a college degree were increased to $40/mo. for each degree level,
and remaining bonuses were increased to $11/mo.
Experience increment increase extended from 25 years to 30 years. Additional $10/month provided for a high school diploma or
equivalent; increas in salary was provided in second half of year.
Additional $10/month provided for 12 college hours or comparable training in a trade or vocational school and add'l $10/month provided
for working between 6pm and 5am, or which only $5/month is funded by the State.
Exp. increment increase extended from 36 to 40 years & add'l $10/mo. pay for college or comparable trn. extended to 60 and 72 hrs.
In addition to the $75/mo. increase in basic salaries, the experience increment was increased by $1/mo, HS bonus increased to $12/mo,
and the $10 educational bonuses were extended to 84, 96, 104, and 120 college hours or comparable training and to those with BA and
MA degrees; all increases were made effective the 2nd quarter.
Experience increment increase extended from 30 years to 36 years.
Additional $10/month pay for college or comparable training extended to 24, 36, and 48 hours.
-154-
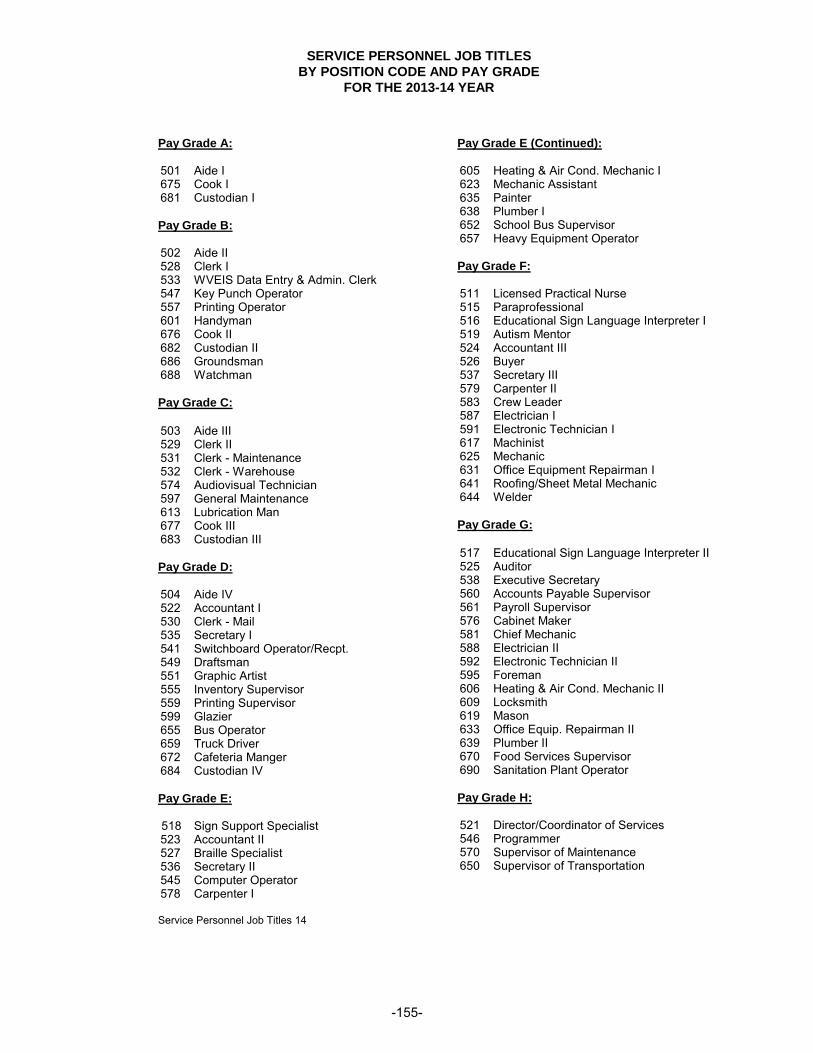
SERVICE PERSONNEL JOB TITLES
BY POSITION CODE AND PAY GRADE
FOR THE 2013-14 YEAR
Pay Grade A: 501 Aide I 675 Cook I 681 Custodian I
Pay Grade B:
502 Aide II 528 Clerk I 533 WVEIS Data Entry & Admin. Clerk 547 Key Punch Operator 557 Printing Operator 601 Handyman 676 Cook II 682 Custodian II 686 Groundsman 688 Watchman
Pay Grade C:
503 Aide III 529 Clerk II 531 Clerk - Maintenance 532 Clerk - Warehouse 574 Audiovisual Technician 597 General Maintenance 613 Lubrication Man 677 Cook III 683 Custodian III
Pay Grade D: 504 Aide IV 522 Accountant I 530 Clerk - Mail 535 Secretary I 541 Switchboard Operator/Recpt. 549 Draftsman 551 Graphic Artist 555 Inventory Supervisor 559 Printing Supervisor 599 Glazier 655 Bus Operator 659 Truck Driver 672 Cafeteria Manger 684 Custodian IV
Pay Grade E: 518 Sign Support Specialist 523 Accountant II 527 Braille Specialist 536 Secretary II 545 Computer Operator 578 Carpenter I Service Personnel Job Titles 14
Pay Grade E (Continued): 605 Heating & Air Cond. Mechanic I 623 Mechanic Assistant 635 Painter 638 Plumber I 652 School Bus Supervisor 657 Heavy Equipment Operator
Pay Grade F: 511 Licensed Practical Nurse 515 Paraprofessional 516 Educational Sign Language Interpreter I 519 Autism Mentor 524 Accountant III 526 Buyer 537 Secretary III 579 Carpenter II 583 Crew Leader 587 Electrician I 591 Electronic Technician I 617 Machinist 625 Mechanic 631 Office Equipment Repairman I 641 Roofing/Sheet Metal Mechanic 644 Welder
Pay Grade G:
517 Educational Sign Language Interpreter II 525 Auditor 538 Executive Secretary 560 Accounts Payable Supervisor 561 Payroll Supervisor 576 Cabinet Maker 581 Chief Mechanic 588 Electrician II 592 Electronic Technician II 595 Foreman 606 Heating & Air Cond. Mechanic II 609 Locksmith 619 Mason 633 Office Equip. Repairman II 639 Plumber II 670 Food Services Supervisor 690 Sanitation Plant Operator
Pay Grade H: 521 Director/Coordinator of Services 546 Programmer 570 Supervisor of Maintenance 650 Supervisor of Transportation
-155-

This Page Intentionally Left Blank
-156-

SCHOOL
DATA


COUNTY BOARDS OF EDUCATION
NUMBER OF PUBLIC SCHOOLS
2013-14 YEAR
County Elementary Middle High Vocational Alternative Total
Barbour 5 3 1 - - 9
Berkeley 21 5 4 1 (1) 1 32
Boone 10 2 3 1 - 16
Braxton 6 1 1 - - 8
Brooke 7 2 1 - - 10
Cabell 19 4 2 1 1 27
Calhoun 2 - 1 1 (1) - 4
Clay 4 1 1 - - 6
Doddridge 2 1 1 - - 4
Fayette 10 2 5 1 - 18
Gilmer 4 - 1 - - 5
Grant 2 - 2 1 (1) - 5
Greenbrier 9 2 2 1 - 14
Hampshire 6 2 1 1 - 10
Hancock 5 2 2 1 - 10
Hardy 2 2 2 - - 6
Harrison 13 5 5 1 (1) 2 26
Jackson 8 2 2 1 (1) - 13
Jefferson 11 4 2 - - 17
Kanawha 45 13 8 3 1 70
Lewis 4 1 1 - - 6
Lincoln 3 4 1 - - 8
Logan 11 3 3 1 - 18
Marion 9 7 3 1 1 21
Marshall 8 2 2 1 1 14
Mason 7 - 3 1 - 11
McDowell 6 2 2 1 - 11
Mercer 17 4 4 1 - 26
Mineral 8 2 2 1 1 14
Mingo 3 6 2 - - 11
Monongalia 10 4 3 1 1 19
Monroe 1 2 1 1 - 5
Morgan 5 1 2 - - 8
Nicholas 10 2 2 1 - 15
Ohio 8 4 1 - - 13
Pendleton 3 - 1 - - 4
Pleasants 2 1 1 1 (1) - 5
Pocahontas 2 2 1 - - 5
Preston 4 7 1 - - 12
Putnam 14 4 4 1 - 23
Raleigh 19 5 4 2 - 30
Randolph 9 1 4 1 1 16
Ritchie 4 1 1 - - 6
Roane 2 3 1 - - 6
Summers 3 1 1 - - 5
Taylor 3 1 1 1 - 6
Tucker 0 2 1 - - 3
Tyler 2 1 1 - - 4
Upshur 7 1 1 1 (1) - 10
Wayne 12 6 3 - - 21
Webster 1 4 1 - - 6
Wetzel 2 3 4 - - 9
Wirt 1 1 1 - - 3
Wood 19 5 3 2 - 29
Wyoming 3 8 2 1 - 14
Total 413 154 116 34 10 727
OSF
03/30/15
No. of Schools 14
Note: (1) The vocational schools indicated are the seven multi-county vocational centers (MVCVs) created by the State Board, but
are reported in the districts that serve as the MCVCs' fiscal agents.
-157-
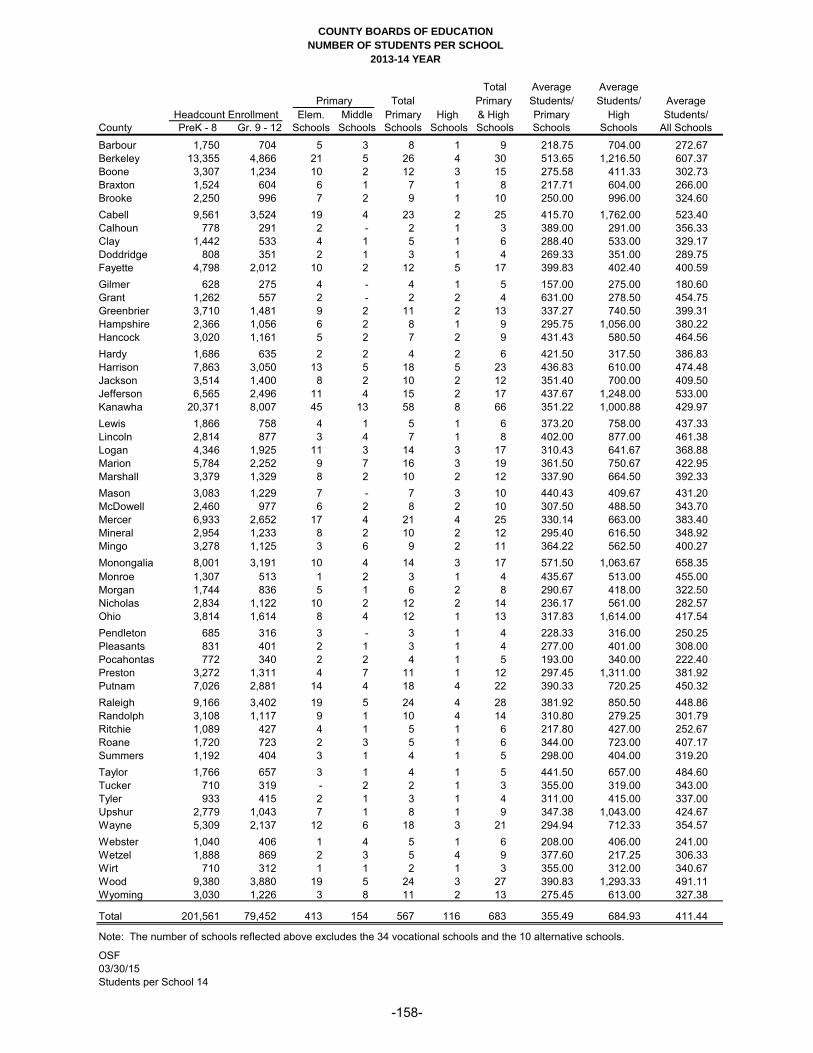
COUNTY BOARDS OF EDUCATION
NUMBER OF STUDENTS PER SCHOOL
2013-14 YEAR
Total Average Average
Primary Total Primary Students/ Students/ Average
Headcount Enrollment Elem. Middle Primary High & High Primary High Students/
County PreK - 8 Gr. 9 - 12 Schools Schools Schools Schools Schools Schools Schools All Schools
Barbour 1,750 704 5 3 8 1 9 218.75 704.00 272.67
Berkeley 13,355 4,866 21 5 26 4 30 513.65 1,216.50 607.37
Boone 3,307 1,234 10 2 12 3 15 275.58 411.33 302.73
Braxton 1,524 604 6 1 7 1 8 217.71 604.00 266.00
Brooke 2,250 996 7 2 9 1 10 250.00 996.00 324.60
Cabell 9,561 3,524 19 4 23 2 25 415.70 1,762.00 523.40
Calhoun 778 291 2 - 2 1 3 389.00 291.00 356.33
Clay 1,442 533 4 1 5 1 6 288.40 533.00 329.17
Doddridge 808 351 2 1 3 1 4 269.33 351.00 289.75
Fayette 4,798 2,012 10 2 12 5 17 399.83 402.40 400.59
Gilmer 628 275 4 - 4 1 5 157.00 275.00 180.60
Grant 1,262 557 2 - 2 2 4 631.00 278.50 454.75
Greenbrier 3,710 1,481 9 2 11 2 13 337.27 740.50 399.31
Hampshire 2,366 1,056 6 2 8 1 9 295.75 1,056.00 380.22
Hancock 3,020 1,161 5 2 7 2 9 431.43 580.50 464.56
Hardy 1,686 635 2 2 4 2 6 421.50 317.50 386.83
Harrison 7,863 3,050 13 5 18 5 23 436.83 610.00 474.48
Jackson 3,514 1,400 8 2 10 2 12 351.40 700.00 409.50
Jefferson 6,565 2,496 11 4 15 2 17 437.67 1,248.00 533.00
Kanawha 20,371 8,007 45 13 58 8 66 351.22 1,000.88 429.97
Lewis 1,866 758 4 1 5 1 6 373.20 758.00 437.33
Lincoln 2,814 877 3 4 7 1 8 402.00 877.00 461.38
Logan 4,346 1,925 11 3 14 3 17 310.43 641.67 368.88
Marion 5,784 2,252 9 7 16 3 19 361.50 750.67 422.95
Marshall 3,379 1,329 8 2 10 2 12 337.90 664.50 392.33
Mason 3,083 1,229 7 - 7 3 10 440.43 409.67 431.20
McDowell 2,460 977 6 2 8 2 10 307.50 488.50 343.70
Mercer 6,933 2,652 17 4 21 4 25 330.14 663.00 383.40
Mineral 2,954 1,233 8 2 10 2 12 295.40 616.50 348.92
Mingo 3,278 1,125 3 6 9 2 11 364.22 562.50 400.27
Monongalia 8,001 3,191 10 4 14 3 17 571.50 1,063.67 658.35
Monroe 1,307 513 1 2 3 1 4 435.67 513.00 455.00
Morgan 1,744 836 5 1 6 2 8 290.67 418.00 322.50
Nicholas 2,834 1,122 10 2 12 2 14 236.17 561.00 282.57
Ohio 3,814 1,614 8 4 12 1 13 317.83 1,614.00 417.54
Pendleton 685 316 3 - 3 1 4 228.33 316.00 250.25
Pleasants 831 401 2 1 3 1 4 277.00 401.00 308.00
Pocahontas 772 340 2 2 4 1 5 193.00 340.00 222.40
Preston 3,272 1,311 4 7 11 1 12 297.45 1,311.00 381.92
Putnam 7,026 2,881 14 4 18 4 22 390.33 720.25 450.32
Raleigh 9,166 3,402 19 5 24 4 28 381.92 850.50 448.86
Randolph 3,108 1,117 9 1 10 4 14 310.80 279.25 301.79
Ritchie 1,089 427 4 1 5 1 6 217.80 427.00 252.67
Roane 1,720 723 2 3 5 1 6 344.00 723.00 407.17
Summers 1,192 404 3 1 4 1 5 298.00 404.00 319.20
Taylor 1,766 657 3 1 4 1 5 441.50 657.00 484.60
Tucker 710 319 - 2 2 1 3 355.00 319.00 343.00
Tyler 933 415 2 1 3 1 4 311.00 415.00 337.00
Upshur 2,779 1,043 7 1 8 1 9 347.38 1,043.00 424.67
Wayne 5,309 2,137 12 6 18 3 21 294.94 712.33 354.57
Webster 1,040 406 1 4 5 1 6 208.00 406.00 241.00
Wetzel 1,888 869 2 3 5 4 9 377.60 217.25 306.33
Wirt 710 312 1 1 2 1 3 355.00 312.00 340.67
Wood 9,380 3,880 19 5 24 3 27 390.83 1,293.33 491.11
Wyoming 3,030 1,226 3 8 11 2 13 275.45 613.00 327.38
Total 201,561 79,452 413 154 567 116 683 355.49 684.93 411.44
Note: The number of schools reflected above excludes the 34 vocational schools and the 10 alternative schools.
OSF
03/30/15
Students per School 14
-158-

COUNTY BOARDS OF EDUCATION
NUMBER OF STUDENTS PER SCHOOL
SORTED BY STUDENTS/PRIMARY SCHOOL
2013-14 YEAR
Average Average
Primary Total Students/ Students/ Average
Headcount Enrollment Elem. Middle Primary High Total Primary High Students/
Ct. County Pre K - 8 Gr. 9 - 12 Schools Schools Schools Schools Schools Schools Schools All Schools
1 Grant 1,262 557 2 - 2 2 4 631.00 278.50 454.75
2 Monongalia 8,001 3,191 10 4 14 3 17 571.50 1,063.67 658.35
3 Berkeley 13,355 4,866 21 5 26 4 30 513.65 1,216.50 607.37
4 Taylor 1,766 657 3 1 4 1 5 441.50 657.00 484.60
5 Mason 3,083 1,229 7 - 7 3 10 440.43 409.67 431.20
6 Jefferson 6,565 2,496 11 4 15 2 17 437.67 1,248.00 533.00
7 Harrison 7,863 3,050 13 5 18 5 23 436.83 610.00 474.48
8 Monroe 1,307 513 1 2 3 1 4 435.67 513.00 455.00
9 Hancock 3,020 1,161 5 2 7 2 9 431.43 580.50 464.56
10 Hardy 1,686 635 2 2 4 2 6 421.50 317.50 386.83
11 Cabell 9,561 3,524 19 4 23 2 25 415.70 1,762.00 523.40
12 Lincoln 2,814 877 3 4 7 1 8 402.00 877.00 461.38
13 Fayette 4,798 2,012 10 2 12 5 17 399.83 402.40 400.59
14 Wood 9,380 3,880 19 5 24 3 27 390.83 1,293.33 491.11
15 Putnam 7,026 2,881 14 4 18 4 22 390.33 720.25 450.32
16 Calhoun 778 291 2 - 2 1 3 389.00 291.00 356.33
17 Raleigh 9,166 3,402 19 5 24 4 28 381.92 850.50 448.86
18 Wetzel 1,888 869 2 3 5 4 9 377.60 217.25 306.33
19 Lewis 1,866 758 4 1 5 1 6 373.20 758.00 437.33
20 Mingo 3,278 1,125 3 6 9 2 11 364.22 562.50 400.27
21 Marion 5,784 2,252 9 7 16 3 19 361.50 750.67 422.95
22 Tucker 710 319 - 2 2 1 3 355.00 319.00 343.00
23 Wirt 710 312 1 1 2 1 3 355.00 312.00 340.67
24 Jackson 3,514 1,400 8 2 10 2 12 351.40 700.00 409.50
25 Kanawha 20,371 8,007 45 13 58 8 66 351.22 1,000.88 429.97
26 Upshur 2,779 1,043 7 1 8 1 9 347.38 1,043.00 424.67
27 Roane 1,720 723 2 3 5 1 6 344.00 723.00 407.17
28 Marshall 3,379 1,329 8 2 10 2 12 337.90 664.50 392.33
29 Greenbrier 3,710 1,481 9 2 11 2 13 337.27 740.50 399.31
30 Mercer 6,933 2,652 17 4 21 4 25 330.14 663.00 383.40
31 Ohio 3,814 1,614 8 4 12 1 13 317.83 1,614.00 417.54
32 Tyler 933 415 2 1 3 1 4 311.00 415.00 337.00
33 Randolph 3,108 1,117 9 1 10 4 14 310.80 279.25 301.79
34 Logan 4,346 1,925 11 3 14 3 17 310.43 641.67 368.88
35 McDowell 2,460 977 6 2 8 2 10 307.50 488.50 343.70
36 Summers 1,192 404 3 1 4 1 5 298.00 404.00 319.20
37 Preston 3,272 1,311 4 7 11 1 12 297.45 1,311.00 381.92
38 Hampshire 2,366 1,056 6 2 8 1 9 295.75 1,056.00 380.22
39 Mineral 2,954 1,233 8 2 10 2 12 295.40 616.50 348.92
40 Wayne 5,309 2,137 12 6 18 3 21 294.94 712.33 354.57
41 Morgan 1,744 836 5 1 6 2 8 290.67 418.00 322.50
42 Clay 1,442 533 4 1 5 1 6 288.40 533.00 329.17
43 Pleasants 831 401 2 1 3 1 4 277.00 401.00 308.00
44 Boone 3,307 1,234 10 2 12 3 15 275.58 411.33 302.73
45 Wyoming 3,030 1,226 3 8 11 2 13 275.45 613.00 327.38
46 Doddridge 808 351 2 1 3 1 4 269.33 351.00 289.75
47 Brooke 2,250 996 7 2 9 1 10 250.00 996.00 324.60
48 Nicholas 2,834 1,122 10 2 12 2 14 236.17 561.00 282.57
49 Pendleton 685 316 3 - 3 1 4 228.33 316.00 250.25
50 Barbour 1,750 704 5 3 8 1 9 218.75 704.00 272.67
51 Ritchie 1,089 427 4 1 5 1 6 217.80 427.00 252.67
52 Braxton 1,524 604 6 1 7 1 8 217.71 604.00 266.00
53 Webster 1,040 406 1 4 5 1 6 208.00 406.00 241.00
54 Pocahontas 772 340 2 2 4 1 5 193.00 340.00 222.40
55 Gilmer 628 275 4 - 4 1 5 157.00 275.00 180.60
- Total 201,561 79,452 413 154 567 116 683 355.49 684.93 411.44
OSF
Students per School 14
03/30/15
-159-
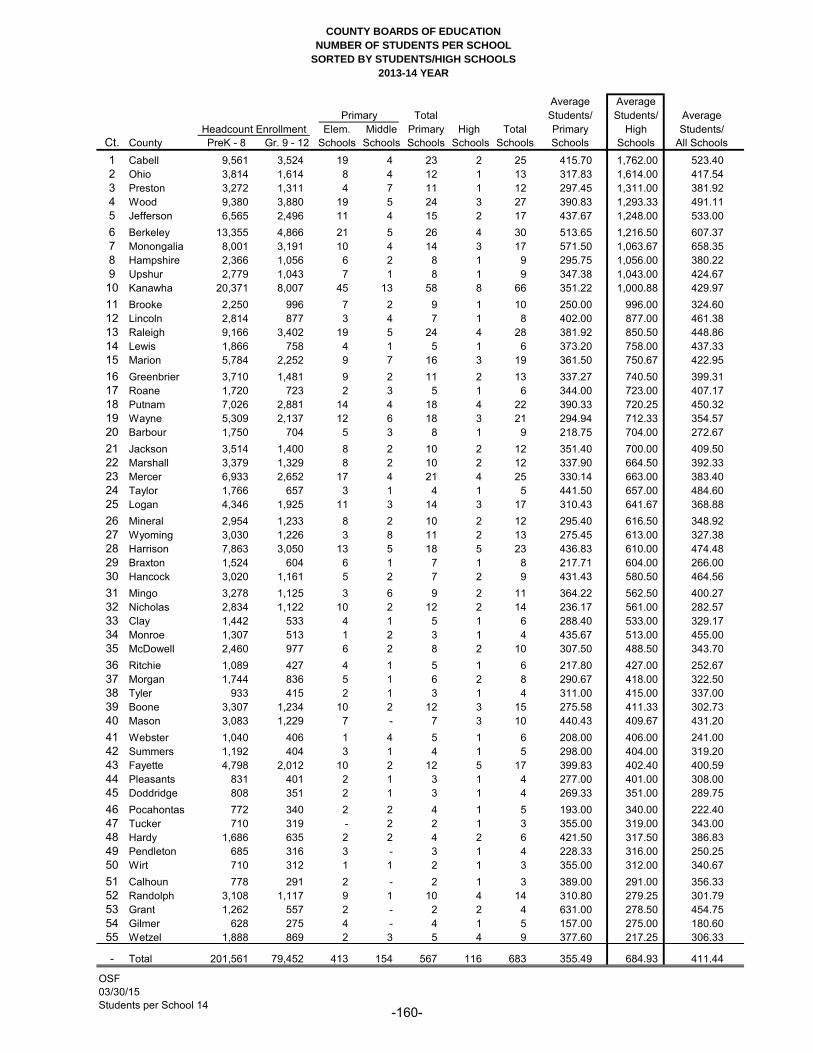
COUNTY BOARDS OF EDUCATION
NUMBER OF STUDENTS PER SCHOOL
SORTED BY STUDENTS/HIGH SCHOOLS
2013-14 YEAR
Average Average
Primary Total Students/ Students/ Average
Headcount Enrollment Elem. Middle Primary High Total Primary High Students/
Ct. County PreK - 8 Gr. 9 - 12 Schools Schools Schools Schools Schools Schools Schools All Schools
1 Cabell 9,561 3,524 19 4 23 2 25 415.70 1,762.00 523.40
2 Ohio 3,814 1,614 8 4 12 1 13 317.83 1,614.00 417.54
3 Preston 3,272 1,311 4 7 11 1 12 297.45 1,311.00 381.92
4 Wood 9,380 3,880 19 5 24 3 27 390.83 1,293.33 491.11
5 Jefferson 6,565 2,496 11 4 15 2 17 437.67 1,248.00 533.00
6 Berkeley 13,355 4,866 21 5 26 4 30 513.65 1,216.50 607.37
7 Monongalia 8,001 3,191 10 4 14 3 17 571.50 1,063.67 658.35
8 Hampshire 2,366 1,056 6 2 8 1 9 295.75 1,056.00 380.22
9 Upshur 2,779 1,043 7 1 8 1 9 347.38 1,043.00 424.67
10 Kanawha 20,371 8,007 45 13 58 8 66 351.22 1,000.88 429.97
11 Brooke 2,250 996 7 2 9 1 10 250.00 996.00 324.60
12 Lincoln 2,814 877 3 4 7 1 8 402.00 877.00 461.38
13 Raleigh 9,166 3,402 19 5 24 4 28 381.92 850.50 448.86
14 Lewis 1,866 758 4 1 5 1 6 373.20 758.00 437.33
15 Marion 5,784 2,252 9 7 16 3 19 361.50 750.67 422.95
16 Greenbrier 3,710 1,481 9 2 11 2 13 337.27 740.50 399.31
17 Roane 1,720 723 2 3 5 1 6 344.00 723.00 407.17
18 Putnam 7,026 2,881 14 4 18 4 22 390.33 720.25 450.32
19 Wayne 5,309 2,137 12 6 18 3 21 294.94 712.33 354.57
20 Barbour 1,750 704 5 3 8 1 9 218.75 704.00 272.67
21 Jackson 3,514 1,400 8 2 10 2 12 351.40 700.00 409.50
22 Marshall 3,379 1,329 8 2 10 2 12 337.90 664.50 392.33
23 Mercer 6,933 2,652 17 4 21 4 25 330.14 663.00 383.40
24 Taylor 1,766 657 3 1 4 1 5 441.50 657.00 484.60
25 Logan 4,346 1,925 11 3 14 3 17 310.43 641.67 368.88
26 Mineral 2,954 1,233 8 2 10 2 12 295.40 616.50 348.92
27 Wyoming 3,030 1,226 3 8 11 2 13 275.45 613.00 327.38
28 Harrison 7,863 3,050 13 5 18 5 23 436.83 610.00 474.48
29 Braxton 1,524 604 6 1 7 1 8 217.71 604.00 266.00
30 Hancock 3,020 1,161 5 2 7 2 9 431.43 580.50 464.56
31 Mingo 3,278 1,125 3 6 9 2 11 364.22 562.50 400.27
32 Nicholas 2,834 1,122 10 2 12 2 14 236.17 561.00 282.57
33 Clay 1,442 533 4 1 5 1 6 288.40 533.00 329.17
34 Monroe 1,307 513 1 2 3 1 4 435.67 513.00 455.00
35 McDowell 2,460 977 6 2 8 2 10 307.50 488.50 343.70
36 Ritchie 1,089 427 4 1 5 1 6 217.80 427.00 252.67
37 Morgan 1,744 836 5 1 6 2 8 290.67 418.00 322.50
38 Tyler 933 415 2 1 3 1 4 311.00 415.00 337.00
39 Boone 3,307 1,234 10 2 12 3 15 275.58 411.33 302.73
40 Mason 3,083 1,229 7 - 7 3 10 440.43 409.67 431.20
41 Webster 1,040 406 1 4 5 1 6 208.00 406.00 241.00
42 Summers 1,192 404 3 1 4 1 5 298.00 404.00 319.20
43 Fayette 4,798 2,012 10 2 12 5 17 399.83 402.40 400.59
44 Pleasants 831 401 2 1 3 1 4 277.00 401.00 308.00
45 Doddridge 808 351 2 1 3 1 4 269.33 351.00 289.75
46 Pocahontas 772 340 2 2 4 1 5 193.00 340.00 222.40
47 Tucker 710 319 - 2 2 1 3 355.00 319.00 343.00
48 Hardy 1,686 635 2 2 4 2 6 421.50 317.50 386.83
49 Pendleton 685 316 3 - 3 1 4 228.33 316.00 250.25
50 Wirt 710 312 1 1 2 1 3 355.00 312.00 340.67
51 Calhoun 778 291 2 - 2 1 3 389.00 291.00 356.33
52 Randolph 3,108 1,117 9 1 10 4 14 310.80 279.25 301.79
53 Grant 1,262 557 2 - 2 2 4 631.00 278.50 454.75
54 Gilmer 628 275 4 - 4 1 5 157.00 275.00 180.60
55 Wetzel 1,888 869 2 3 5 4 9 377.60 217.25 306.33
- Total 201,561 79,452 413 154 567 116 683 355.49 684.93 411.44
OSF
Students per School 14
03/30/15
-160-

COUNTY BOARDS OF EDUCATION
NUMBER OF STUDENTS PER SCHOOL
SORTED BY STUDENTS/ALL SCHOOLS
2013-14 YEAR
Average Average
Primary Total Students/ Students/ Average
Headcount Enrollment Elem. Middle Primary High Total Primary High Students/
Ct. County PreK - 8 Gr. 9 - 12 Schools Schools Schools Schools Schools Schools Schools All Schools
1 Monongalia 8,001 3,191 10 4 14 3 17 571.50 1,063.67 658.35
2 Berkeley 13,355 4,866 21 5 26 4 30 513.65 1,216.50 607.37
3 Jefferson 6,565 2,496 11 4 15 2 17 437.67 1,248.00 533.00
4 Cabell 9,561 3,524 19 4 23 2 25 415.70 1,762.00 523.40
5 Wood 9,380 3,880 19 5 24 3 27 390.83 1,293.33 491.11
6 Taylor 1,766 657 3 1 4 1 5 441.50 657.00 484.60
7 Harrison 7,863 3,050 13 5 18 5 23 436.83 610.00 474.48
8 Hancock 3,020 1,161 5 2 7 2 9 431.43 580.50 464.56
9 Lincoln 2,814 877 3 4 7 1 8 402.00 877.00 461.38
10 Monroe 1,307 513 1 2 3 1 4 435.67 513.00 455.00
11 Grant 1,262 557 2 - 2 2 4 631.00 278.50 454.75
12 Putnam 7,026 2,881 14 4 18 4 22 390.33 720.25 450.32
13 Raleigh 9,166 3,402 19 5 24 4 28 381.92 850.50 448.86
14 Lewis 1,866 758 4 1 5 1 6 373.20 758.00 437.33
15 Mason 3,083 1,229 7 - 7 3 10 440.43 409.67 431.20
16 Kanawha 20,371 8,007 45 13 58 8 66 351.22 1,000.88 429.97
17 Upshur 2,779 1,043 7 1 8 1 9 347.38 1,043.00 424.67
18 Marion 5,784 2,252 9 7 16 3 19 361.50 750.67 422.95
19 Ohio 3,814 1,614 8 4 12 1 13 317.83 1,614.00 417.54
20 Jackson 3,514 1,400 8 2 10 2 12 351.40 700.00 409.50
21 Roane 1,720 723 2 3 5 1 6 344.00 723.00 407.17
22 Fayette 4,798 2,012 10 2 12 5 17 399.83 402.40 400.59
23 Mingo 3,278 1,125 3 6 9 2 11 364.22 562.50 400.27
24 Greenbrier 3,710 1,481 9 2 11 2 13 337.27 740.50 399.31
25 Marshall 3,379 1,329 8 2 10 2 12 337.90 664.50 392.33
26 Hardy 1,686 635 2 2 4 2 6 421.50 317.50 386.83
27 Mercer 6,933 2,652 17 4 21 4 25 330.14 663.00 383.40
28 Preston 3,272 1,311 4 7 11 1 12 297.45 1,311.00 381.92
29 Hampshire 2,366 1,056 6 2 8 1 9 295.75 1,056.00 380.22
30 Logan 4,346 1,925 11 3 14 3 17 310.43 641.67 368.88
31 Calhoun 778 291 2 - 2 1 3 389.00 291.00 356.33
32 Wayne 5,309 2,137 12 6 18 3 21 294.94 712.33 354.57
33 Mineral 2,954 1,233 8 2 10 2 12 295.40 616.50 348.92
34 McDowell 2,460 977 6 2 8 2 10 307.50 488.50 343.70
35 Tucker 710 319 - 2 2 1 3 355.00 319.00 343.00
36 Wirt 710 312 1 1 2 1 3 355.00 312.00 340.67
37 Tyler 933 415 2 1 3 1 4 311.00 415.00 337.00
38 Clay 1,442 533 4 1 5 1 6 288.40 533.00 329.17
39 Wyoming 3,030 1,226 3 8 11 2 13 275.45 613.00 327.38
40 Brooke 2,250 996 7 2 9 1 10 250.00 996.00 324.60
41 Morgan 1,744 836 5 1 6 2 8 290.67 418.00 322.50
42 Summers 1,192 404 3 1 4 1 5 298.00 404.00 319.20
43 Pleasants 831 401 2 1 3 1 4 277.00 401.00 308.00
44 Wetzel 1,888 869 2 3 5 4 9 377.60 217.25 306.33
45 Boone 3,307 1,234 10 2 12 3 15 275.58 411.33 302.73
46 Randolph 3,108 1,117 9 1 10 4 14 310.80 279.25 301.79
47 Doddridge 808 351 2 1 3 1 4 269.33 351.00 289.75
48 Nicholas 2,834 1,122 10 2 12 2 14 236.17 561.00 282.57
49 Barbour 1,750 704 5 3 8 1 9 218.75 704.00 272.67
50 Braxton 1,524 604 6 1 7 1 8 217.71 604.00 266.00
51 Ritchie 1,089 427 4 1 5 1 6 217.80 427.00 252.67
52 Pendleton 685 316 3 - 3 1 4 228.33 316.00 250.25
53 Webster 1,040 406 1 4 5 1 6 208.00 406.00 241.00
54 Pocahontas 772 340 2 2 4 1 5 193.00 340.00 222.40
55 Gilmer 628 275 4 - 4 1 5 157.00 275.00 180.60
- Total 201,561 79,452 413 154 567 116 683 355.49 684.93 411.44
OSF
Students per School 14
03/30/15
-161-

This Page Intentionally Left Blank
-162-

STUDENT
TRANSPORTATION
DATA


COUNTY BOARDS OF EDUCATION
NUMBER OF PUPILS TRANSPORTED
2013-14 YEAR
No. of Pupils
TransportedCounty 2013-14
Barbour 1,735
Berkeley 16,226
Boone 4,158
Braxton 1,628
Brooke 2,272
Cabell 10,320
Calhoun 885
Clay 1,968
Doddridge 1,048
Fayette 5,248
Gilmer 819
Grant 1,743
Greenbrier 3,925
Hampshire 3,444
Hancock 4,172
Hardy 1,555
Harrison 7,085
Jackson 3,304
Jefferson 7,170
Kanawha 21,196
Lewis 2,076
Lincoln 2,854
Logan 4,385
Marion 7,848
Marshall 3,457
Mason 3,460
McDowell 3,406
Mercer 6,871
Mineral 3,635
Mingo 3,840
Monongalia 9,638
Monroe 1,509
Morgan 2,004
Nicholas 2,858
Ohio 3,531
Pendleton 886
Pleasants 1,058
Pocahontas 944
Preston 3,291
Putnam 7,683
Raleigh 9,104
Randolph 2,418
Ritchie 1,233
Roane 2,011
Summers 1,340
Taylor 1,715
Tucker 1,024
Tyler 1,274
Upshur 3,106
Wayne 5,399
Webster 1,179
Wetzel 1,797
Wirt 875
Wood 10,759
Wyoming 3,743
State 222,112
OSF
03/24/15
Students Transported 14
-163-

COUNTY BOARDS OF EDUCATIONNUMBER OF SCHOOL BUSES OPERATED AND
PERCENT OF SPARE BUSES TO REGULAR BUSESAS OF JUNE 30, 2014
Total Pct.Conven. Conven. Conven. Transit Transit Transit Active Total Total Spares To
County Regular Spare Spec Ed Regular Spare Spec Ed Buses Spares Buses RegularBarbour 24 6 5 2 - - 31 6 37 19.35%Berkeley 154 49 41 - - - 195 49 244 25.13%Boone 41 7 7 4 1 - 52 8 60 15.38%Braxton 17 8 2 5 1 - 24 9 33 37.50%Brooke 32 5 7 - - - 39 5 44 12.82%Cabell 54 23 18 35 11 - 107 34 141 31.78%Calhoun 16 6 2 - - - 18 6 24 33.33%Clay 34 7 3 - 1 1 38 8 46 21.05%Doddridge 15 8 5 - 1 - 20 9 29 45.00%Fayette 65 37 10 - - - 75 37 112 49.33%Gilmer 12 4 4 - - - 16 4 20 25.00%Grant 16 11 1 4 2 - 21 13 34 61.90%Greenbrier 67 20 5 - - - 72 20 92 27.78%Hampshire 29 9 5 19 5 - 53 14 67 26.42%Hancock 33 9 9 - 1 - 42 10 52 23.81%Hardy 25 8 3 3 1 - 31 9 40 29.03%Harrison 73 17 14 12 2 - 99 19 118 19.19%Jackson 50 17 7 - - - 57 17 74 29.82%Jefferson 83 8 18 12 2 - 113 10 123 8.85%Kanawha 137 7 44 - - - 181 7 188 3.87%Lewis 34 8 2 - - - 36 8 44 22.22%Lincoln 37 19 5 5 2 - 47 21 68 44.68%Logan 48 4 12 14 10 - 74 14 88 18.92%Marion 39 5 12 27 8 - 78 13 91 16.67%Marshall 61 19 12 - - - 73 19 92 26.03%Mason 49 13 7 - - - 56 13 69 23.21%McDowell 58 12 10 - - - 68 12 80 17.65%Mercer 64 26 15 8 1 - 87 27 114 31.03%Mineral 52 22 6 3 1 - 61 23 84 37.70%Mingo 47 5 8 8 - - 63 5 68 7.94%Monongalia 79 30 17 - - - 96 30 126 31.25%Monroe 29 7 2 - - - 31 7 38 22.58%Morgan 29 11 3 - - - 32 11 43 34.38%Nicholas 48 18 6 1 - - 55 18 73 32.73%Ohio 32 13 9 - - - 41 13 54 31.71%Pendleton 19 9 - 1 - - 20 9 29 45.00%Pleasants 15 7 2 - - - 17 7 24 41.18%Pocahontas 21 8 - - - - 21 8 29 38.10%Preston 68 1 5 4 - - 77 1 78 1.30%Putnam 59 21 11 12 9 4 86 30 116 34.88%Raleigh 83 34 25 18 4 - 126 38 164 30.16%Randolph 46 14 4 - - - 50 14 64 28.00%Ritchie 18 7 1 - - - 19 7 26 36.84%Roane 32 8 3 7 - - 42 8 50 19.05%Summers 23 2 5 - - - 28 2 30 7.14%Taylor 24 16 4 2 - - 30 16 46 53.33%Tucker 12 4 2 - - - 14 4 18 28.57%Tyler 22 11 3 1 - - 26 11 37 42.31%Upshur 36 11 6 5 2 - 47 13 60 27.66%Wayne 28 7 17 40 11 2 87 18 105 20.69%Webster 16 9 2 2 - - 20 9 29 45.00%Wetzel 24 11 2 2 1 - 28 12 40 42.86%Wirt 6 6 2 5 2 - 13 8 21 61.54%Wood 49 11 21 27 19 - 97 30 127 30.93%Wyoming 23 9 5 16 6 - 44 15 59 34.09%
State 2,307 684 456 304 104 7 3,074 788 3,862 25.63%
OSF12/13/14Bus Fleet Report 14
-164-

COUNTY BOARDS OF EDUCATION
SCHOOL BUS MILEAGE
2013-14 YEAR
County Regular Co-Curricular Extra-Curricular Vocational Other Total
Barbour 347,227 7,723 14,354 10,246 - 379,550
Berkeley 2,394,406 20,269 78,164 42,507 77,209 2,612,555
Boone 697,774 33,074 46,303 32,587 14,026 823,764
Braxton 284,505 16,979 7,505 - 421 309,410
Brooke 467,034 11,028 31,006 - - 509,068
Cabell 1,264,482 23,471 55,806 19,963 25,728 1,389,450
Calhoun 250,135 1,962 11,097 20,543 16,288 300,025
Clay 515,851 7,908 30,803 - - 554,562
Doddridge 250,761 8,422 23,034 16,636 1,765 300,618
Fayette 1,221,525 12,624 109,632 119,258 41,382 1,504,421
Gilmer 177,670 714 20,007 10,722 502 209,615
Grant 192,009 28,344 19,454 9,867 6,157 255,831
Greenbrier 759,062 34,111 68,902 - 4,005 866,080
Hampshire 502,276 39,167 43,980 - - 585,423
Hancock 563,122 7,603 52,290 23,857 527 647,399
Hardy 317,461 7,603 18,071 15,194 1,585 359,914
Harrison 907,538 82,593 96,622 38,942 12,962 1,138,657
Jackson 654,657 3,603 79,157 33,822 49 771,288
Jefferson 1,293,595 36,471 84,370 27,389 9,682 1,451,507
Kanawha 2,604,769 75,904 194,102 - - 2,874,775
Lewis 411,464 3,314 38,000 28,103 10,379 491,260
Lincoln 697,095 41,702 37,322 - 6,137 782,256
Logan 845,424 427 77,674 31,661 6,574 961,760
Marion 843,506 22,282 55,148 32,903 10,600 964,439
Marshall 655,705 37,968 75,669 - 49,885 819,227
Mason 576,997 17,213 48,827 8,253 12,131 663,421
McDowell 744,171 332 20,122 37,623 55,829 858,077
Mercer 1,150,577 24,251 121,282 41,723 40,983 1,378,816
Mineral 668,612 33,711 40,847 45,255 - 788,425
Mingo 978,301 13,589 69,082 16,887 26,063 1,103,922
Monongalia 1,691,273 27,754 70,927 30,090 1,202 1,821,246
Monroe 265,629 23,702 30,604 - 23,456 343,391
Morgan 386,841 6,629 45,394 50,399 347 489,610
Nicholas 514,281 47,902 64,646 24,958 35,132 686,919
Ohio 732,639 17,032 51,352 - - 801,023
Pendleton 285,798 6,107 7,157 16,341 5,296 320,699
Pleasants 177,762 10,194 21,197 6,640 1,646 217,439
Pocahontas 252,540 5,575 36,200 772 16,480 311,567
Preston 914,409 1,253 667 - - 916,329
Putnam 973,290 33,727 94,851 46,078 5,916 1,153,862
Raleigh 1,837,293 31,985 78,250 45,865 - 1,993,393
Randolph 507,913 17,393 28,164 19,598 3,545 576,613
Ritchie 248,357 552 27,747 10,850 11,152 298,658
Roane 459,800 9,642 22,980 23,645 8,103 524,170
Summers 261,526 7,836 4,009 - 5,878 279,249
Taylor 345,426 1,645 17,940 12,773 - 377,784
Tucker 182,841 - 16,177 - 3,002 202,020
Tyler 258,939 6,684 29,063 13,191 7,086 314,963
Upshur 470,817 16,826 49,555 11,402 12,039 560,639
Wayne 1,506,748 1,360 315 428 - 1,508,851
Webster 249,468 6,910 21,513 8,659 24,373 310,923
Wetzel 366,099 17,697 52,110 30,000 - 465,906
Wirt 143,067 - 25,806 - - 168,873
Wood 1,256,526 41,985 93,745 45,707 - 1,437,963
Wyoming 693,727 53,507 17,534 59,856 2,739 827,363
Total 38,220,720 1,048,259 2,576,535 1,121,193 598,261 43,564,968
OSF
12/11/14
School Bus Mileage 14 -165-

COUNTY BOARDS OF EDUCATION
SCHOOL TRANSPORTATION EXPENDITURES
ON A PER MILE AND PER PUPIL BASIS
FOR THE 2013-14 YEAR
Transportation Total Miles Cost Per Pupils Cost PerCounty Expenditures Traveled Mile Transported Pupil
Barbour 1,863,547$ 379,550 4.91$ 1,735 1,074.09$
Berkeley 17,816,798 2,612,555 6.82 16,226 1,098.04
Boone 4,289,427 823,764 5.21 4,158 1,031.61
Braxton 1,487,571 309,410 4.81 1,628 913.74
Brooke 2,683,883 509,068 5.27 2,272 1,181.29
Cabell 8,680,482 1,389,450 6.25 10,320 841.13
Calhoun 1,333,277 300,025 4.44 885 1,506.53
Clay 2,247,694 554,562 4.05 1,968 1,142.12
Doddridge 1,415,154 300,618 4.71 1,048 1,350.34
Fayette 6,240,284 1,504,421 4.15 5,248 1,189.08
Gilmer 919,810 209,615 4.39 819 1,123.09
Grant 1,491,483 255,831 5.83 1,743 855.70
Greenbrier 4,629,835 866,080 5.35 3,925 1,179.58
Hampshire 3,391,663 585,423 5.79 3,444 984.80
Hancock 3,589,562 647,399 5.54 4,172 860.39
Hardy 1,957,630 359,914 5.44 1,555 1,258.93
Harrison 8,536,239 1,138,657 7.50 7,085 1,204.83
Jackson 4,414,269 771,288 5.72 3,304 1,336.04
Jefferson 8,199,412 1,451,507 5.65 7,170 1,143.57
Kanawha 14,435,090 2,874,775 5.02 21,196 681.03
Lewis 2,751,959 491,260 5.60 2,076 1,325.61
Lincoln 3,949,134 782,256 5.05 2,854 1,383.72
Logan 6,191,805 961,760 6.44 4,385 1,412.04
Marion 6,075,756 964,439 6.30 7,848 774.18
Marshall 5,181,258 819,227 6.32 3,457 1,498.77
Mason 3,864,228 663,421 5.82 3,460 1,116.83
McDowell 4,003,497 858,077 4.67 3,406 1,175.42
Mercer 6,934,769 1,378,816 5.03 6,871 1,009.28
Mineral 4,392,430 788,425 5.57 3,635 1,208.37
Mingo 4,300,795 1,103,922 3.90 3,840 1,120.00
Monongalia 9,456,618 1,821,246 5.19 9,638 981.18
Monroe 1,580,753 343,391 4.60 1,509 1,047.55
Morgan 2,388,864 489,610 4.88 2,004 1,192.05
Nicholas 3,771,533 686,919 5.49 2,858 1,319.64
Ohio 3,649,947 801,023 4.56 3,531 1,033.69
Pendleton 1,492,936 320,699 4.66 886 1,685.03
Pleasants 1,422,298 217,439 6.54 1,058 1,344.33
Pocahontas 1,477,963 311,567 4.74 944 1,565.64
Preston 4,172,578 916,329 4.55 3,291 1,267.88
Putnam 7,105,983 1,153,862 6.16 7,683 924.90
Raleigh 13,152,367 1,993,393 6.60 9,104 1,444.68
Randolph 2,941,965 576,613 5.10 2,418 1,216.69
Ritchie 1,309,047 298,658 4.38 1,233 1,061.68
Roane 2,538,079 524,170 4.84 2,011 1,262.10
Summers 1,679,774 279,249 6.02 1,340 1,253.56
Taylor 2,172,506 377,784 5.75 1,715 1,266.77
Tucker 816,249 202,020 4.04 1,024 797.12
Tyler 2,159,174 314,963 6.86 1,274 1,694.80
Upshur 3,397,705 560,639 6.06 3,106 1,093.92
Wayne 6,654,617 1,508,851 4.41 5,399 1,232.56
Webster 1,529,153 310,923 4.92 1,179 1,296.99
Wetzel 3,189,348 465,906 6.85 1,797 1,774.82
Wirt 984,361 168,873 5.83 875 1,124.98
Wood 7,712,472 1,437,963 5.36 10,759 716.84
Wyoming 3,714,205 827,363 4.49 3,743 992.31
Total 237,739,234$ 43,564,968 5.46$ 222,112 1,070.36$
OSF
Trans Expenditures 14
03/30/15-166-
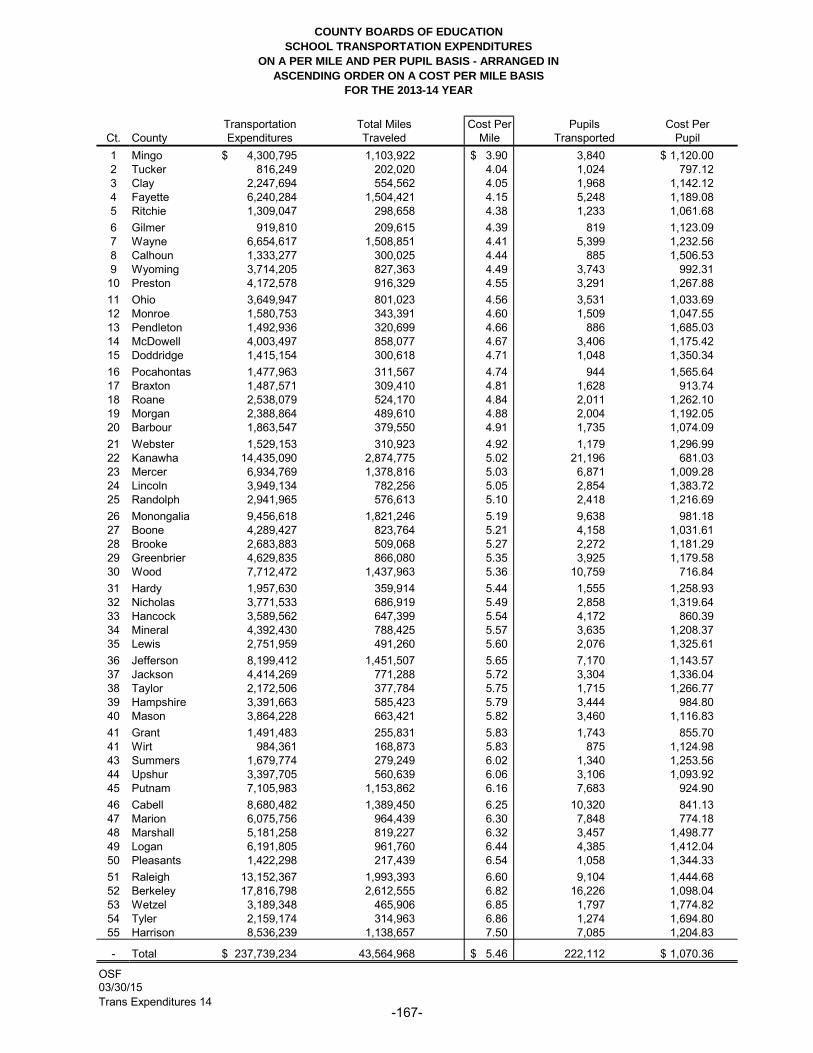
COUNTY BOARDS OF EDUCATION
SCHOOL TRANSPORTATION EXPENDITURES
ON A PER MILE AND PER PUPIL BASIS - ARRANGED IN
ASCENDING ORDER ON A COST PER MILE BASIS
FOR THE 2013-14 YEAR
Transportation Total Miles Cost Per Pupils Cost Per
Ct. County Expenditures Traveled Mile Transported Pupil
1 Mingo 4,300,795$ 1,103,922 3.90$ 3,840 1,120.00$
2 Tucker 816,249 202,020 4.04 1,024 797.12
3 Clay 2,247,694 554,562 4.05 1,968 1,142.12
4 Fayette 6,240,284 1,504,421 4.15 5,248 1,189.08
5 Ritchie 1,309,047 298,658 4.38 1,233 1,061.68
6 Gilmer 919,810 209,615 4.39 819 1,123.09
7 Wayne 6,654,617 1,508,851 4.41 5,399 1,232.56
8 Calhoun 1,333,277 300,025 4.44 885 1,506.53
9 Wyoming 3,714,205 827,363 4.49 3,743 992.31
10 Preston 4,172,578 916,329 4.55 3,291 1,267.88
11 Ohio 3,649,947 801,023 4.56 3,531 1,033.69
12 Monroe 1,580,753 343,391 4.60 1,509 1,047.55
13 Pendleton 1,492,936 320,699 4.66 886 1,685.03
14 McDowell 4,003,497 858,077 4.67 3,406 1,175.42
15 Doddridge 1,415,154 300,618 4.71 1,048 1,350.34
16 Pocahontas 1,477,963 311,567 4.74 944 1,565.64
17 Braxton 1,487,571 309,410 4.81 1,628 913.74
18 Roane 2,538,079 524,170 4.84 2,011 1,262.10
19 Morgan 2,388,864 489,610 4.88 2,004 1,192.05
20 Barbour 1,863,547 379,550 4.91 1,735 1,074.09
21 Webster 1,529,153 310,923 4.92 1,179 1,296.99
22 Kanawha 14,435,090 2,874,775 5.02 21,196 681.03
23 Mercer 6,934,769 1,378,816 5.03 6,871 1,009.28
24 Lincoln 3,949,134 782,256 5.05 2,854 1,383.72
25 Randolph 2,941,965 576,613 5.10 2,418 1,216.69
26 Monongalia 9,456,618 1,821,246 5.19 9,638 981.18
27 Boone 4,289,427 823,764 5.21 4,158 1,031.61
28 Brooke 2,683,883 509,068 5.27 2,272 1,181.29
29 Greenbrier 4,629,835 866,080 5.35 3,925 1,179.58
30 Wood 7,712,472 1,437,963 5.36 10,759 716.84
31 Hardy 1,957,630 359,914 5.44 1,555 1,258.93
32 Nicholas 3,771,533 686,919 5.49 2,858 1,319.64
33 Hancock 3,589,562 647,399 5.54 4,172 860.39
34 Mineral 4,392,430 788,425 5.57 3,635 1,208.37
35 Lewis 2,751,959 491,260 5.60 2,076 1,325.61
36 Jefferson 8,199,412 1,451,507 5.65 7,170 1,143.57
37 Jackson 4,414,269 771,288 5.72 3,304 1,336.04
38 Taylor 2,172,506 377,784 5.75 1,715 1,266.77
39 Hampshire 3,391,663 585,423 5.79 3,444 984.80
40 Mason 3,864,228 663,421 5.82 3,460 1,116.83
41 Grant 1,491,483 255,831 5.83 1,743 855.70
41 Wirt 984,361 168,873 5.83 875 1,124.98
43 Summers 1,679,774 279,249 6.02 1,340 1,253.56
44 Upshur 3,397,705 560,639 6.06 3,106 1,093.92
45 Putnam 7,105,983 1,153,862 6.16 7,683 924.90
46 Cabell 8,680,482 1,389,450 6.25 10,320 841.13
47 Marion 6,075,756 964,439 6.30 7,848 774.18
48 Marshall 5,181,258 819,227 6.32 3,457 1,498.77
49 Logan 6,191,805 961,760 6.44 4,385 1,412.04
50 Pleasants 1,422,298 217,439 6.54 1,058 1,344.33
51 Raleigh 13,152,367 1,993,393 6.60 9,104 1,444.68
52 Berkeley 17,816,798 2,612,555 6.82 16,226 1,098.04
53 Wetzel 3,189,348 465,906 6.85 1,797 1,774.82
54 Tyler 2,159,174 314,963 6.86 1,274 1,694.80
55 Harrison 8,536,239 1,138,657 7.50 7,085 1,204.83
- Total 237,739,234$ 43,564,968 5.46$ 222,112 1,070.36$
OSF
Trans Expenditures 14
03/30/15
-167-

COUNTY BOARDS OF EDUCATION
SCHOOL TRANSPORTATION EXPENDITURES
ON A PER MILE AND PER PUPIL BASIS - ARRANGED IN
ASCENDING ORDER ON A COST PER PUPIL BASIS
FOR THE 2013-14 YEAR
Transportation Total Miles Cost Per Pupils Cost Per
Ct. County Expenditures Traveled Mile Transported Pupil
1 Kanawha 14,435,090$ 2,874,775 5.02$ 21,196 681.03$
2 Wood 7,712,472 1,437,963 5.36 10,759 716.84
3 Marion 6,075,756 964,439 6.30 7,848 774.18
4 Tucker 816,249 202,020 4.04 1,024 797.12
5 Cabell 8,680,482 1,389,450 6.25 10,320 841.13
6 Grant 1,491,483 255,831 5.83 1,743 855.70
7 Hancock 3,589,562 647,399 5.54 4,172 860.39
8 Braxton 1,487,571 309,410 4.81 1,628 913.74
9 Putnam 7,105,983 1,153,862 6.16 7,683 924.90
10 Monongalia 9,456,618 1,821,246 5.19 9,638 981.18
11 Hampshire 3,391,663 585,423 5.79 3,444 984.80
12 Wyoming 3,714,205 827,363 4.49 3,743 992.31
13 Mercer 6,934,769 1,378,816 5.03 6,871 1,009.28
14 Boone 4,289,427 823,764 5.21 4,158 1,031.61
15 Ohio 3,649,947 801,023 4.56 3,531 1,033.69
16 Monroe 1,580,753 343,391 4.60 1,509 1,047.55
17 Ritchie 1,309,047 298,658 4.38 1,233 1,061.68
18 Barbour 1,863,547 379,550 4.91 1,735 1,074.09
19 Upshur 3,397,705 560,639 6.06 3,106 1,093.92
20 Berkeley 17,816,798 2,612,555 6.82 16,226 1,098.04
21 Mason 3,864,228 663,421 5.82 3,460 1,116.83
22 Mingo 4,300,795 1,103,922 3.90 3,840 1,120.00
23 Gilmer 919,810 209,615 4.39 819 1,123.09
24 Wirt 984,361 168,873 5.83 875 1,124.98
25 Clay 2,247,694 554,562 4.05 1,968 1,142.12
26 Jefferson 8,199,412 1,451,507 5.65 7,170 1,143.57
27 McDowell 4,003,497 858,077 4.67 3,406 1,175.42
28 Greenbrier 4,629,835 866,080 5.35 3,925 1,179.58
29 Brooke 2,683,883 509,068 5.27 2,272 1,181.29
30 Fayette 6,240,284 1,504,421 4.15 5,248 1,189.08
31 Morgan 2,388,864 489,610 4.88 2,004 1,192.05
32 Harrison 8,536,239 1,138,657 7.50 7,085 1,204.83
33 Mineral 4,392,430 788,425 5.57 3,635 1,208.37
34 Randolph 2,941,965 576,613 5.10 2,418 1,216.69
35 Wayne 6,654,617 1,508,851 4.41 5,399 1,232.56
36 Summers 1,679,774 279,249 6.02 1,340 1,253.56
37 Hardy 1,957,630 359,914 5.44 1,555 1,258.93
38 Roane 2,538,079 524,170 4.84 2,011 1,262.10
39 Taylor 2,172,506 377,784 5.75 1,715 1,266.77
40 Preston 4,172,578 916,329 4.55 3,291 1,267.88
41 Webster 1,529,153 310,923 4.92 1,179 1,296.99
42 Nicholas 3,771,533 686,919 5.49 2,858 1,319.64
43 Lewis 2,751,959 491,260 5.60 2,076 1,325.61
44 Jackson 4,414,269 771,288 5.72 3,304 1,336.04
45 Pleasants 1,422,298 217,439 6.54 1,058 1,344.33
46 Doddridge 1,415,154 300,618 4.71 1,048 1,350.34
47 Lincoln 3,949,134 782,256 5.05 2,854 1,383.72
48 Logan 6,191,805 961,760 6.44 4,385 1,412.04
49 Raleigh 13,152,367 1,993,393 6.60 9,104 1,444.68
50 Marshall 5,181,258 819,227 6.32 3,457 1,498.77
51 Calhoun 1,333,277 300,025 4.44 885 1,506.53
52 Pocahontas 1,477,963 311,567 4.74 944 1,565.64
53 Pendleton 1,492,936 320,699 4.66 886 1,685.03
54 Tyler 2,159,174 314,963 6.86 1,274 1,694.80
55 Wetzel 3,189,348 465,906 6.85 1,797 1,774.82
- Total 237,739,234$ 43,564,968 5.46$ 222,112 1,070.36$
OSF
Trans Expenditures 14
03/30/15
-168-

CHILD NUTRITION
DATA


COUNTY BOARDS OF EDUCATIONNUMBER OF MEALS SERVED
2013-14 SCHOOL YEAR
Number of Number ofBreakfasts Lunches
County Served Served
Barbour 193,276 279,596 Berkeley 960,675 1,977,790 Boone 459,245 430,202 Braxton 136,770 225,519 Brooke 183,092 304,571
Cabell 1,129,595 1,450,222 Calhoun 115,930 145,594 Clay 241,673 264,511 Doddridge 63,312 132,250 Fayette 528,627 751,857
Gilmer 117,894 127,213 Grant 171,072 244,581 Greenbrier 247,363 511,735 Hampshire 287,914 379,543 Hancock 163,308 329,837
Hardy 159,952 294,117 Harrison 688,853 1,220,626 Jackson 320,119 553,934 Jefferson 355,473 934,141 Kanawha 1,801,827 3,437,504
Lewis 218,002 303,966 Lincoln 494,795 448,694 Logan 611,778 666,775 Marion 404,541 893,368 Marshall 407,021 573,735
Mason 595,190 471,631 McDowell 357,949 452,966 Mercer 1,024,682 1,172,213 Mineral 204,897 494,813 Mingo 557,007 541,085
Monongalia 489,043 1,125,078 Monroe 160,308 185,622 Morgan 151,296 316,691 Nicholas 195,653 410,624 Ohio 340,923 532,966
Pendleton 69,950 124,312 Pleasants 85,573 162,318 Pocahontas 77,633 126,204 Preston 270,859 431,057 Putnam 500,537 1,023,873
Raleigh 746,434 1,266,582 Randolph 356,442 519,304 Ritchie 136,284 193,693 Roane 200,638 278,029 Summers 167,942 202,524
Taylor 135,609 249,656 Tucker 103,149 111,569 Tyler 100,328 187,125 Upshur 258,835 440,087 Wayne 523,566 729,262
Webster 124,661 168,405 Wetzel 183,053 295,223 Wirt 98,722 127,343 Wood 444,381 1,310,100 Wyoming 350,277 549,832
Total 19,473,928 31,082,068
DFA04/17/15Number of Meals Served 14
-169-
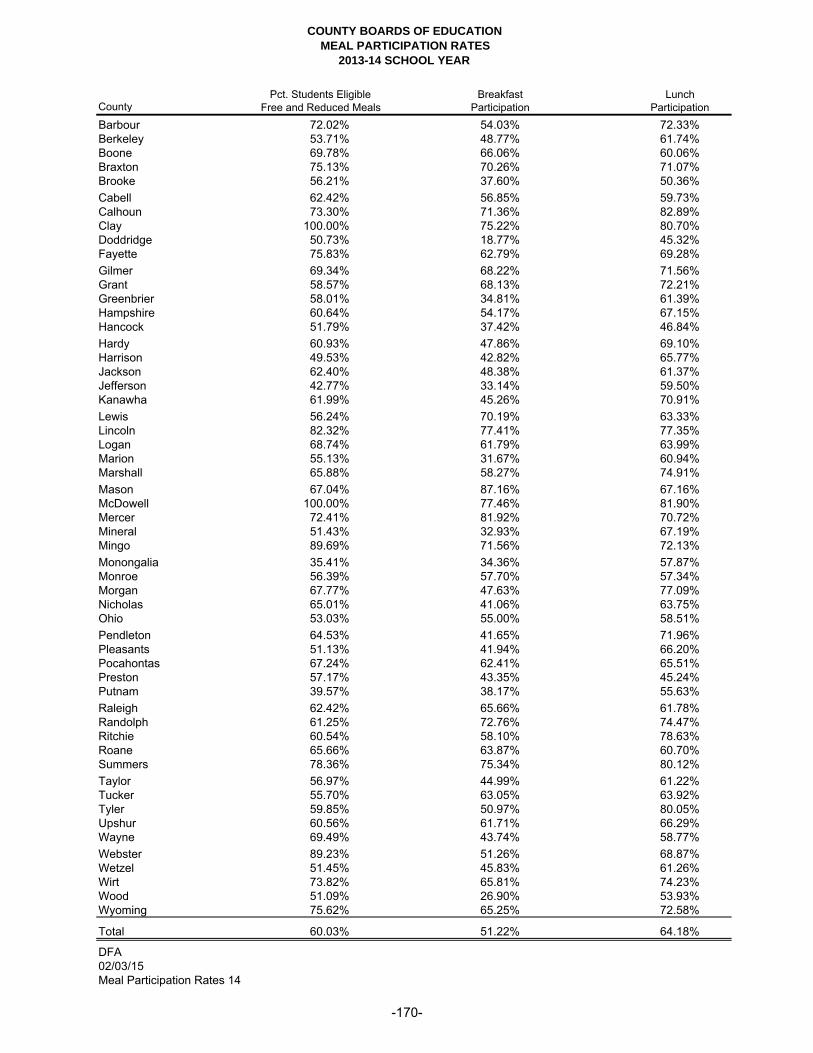
COUNTY BOARDS OF EDUCATIONMEAL PARTICIPATION RATES
2013-14 SCHOOL YEAR
Pct. Students Eligible Breakfast LunchCounty Free and Reduced Meals Participation ParticipationBarbour 72.02% 54.03% 72.33%Berkeley 53.71% 48.77% 61.74%Boone 69.78% 66.06% 60.06%Braxton 75.13% 70.26% 71.07%Brooke 56.21% 37.60% 50.36%Cabell 62.42% 56.85% 59.73%Calhoun 73.30% 71.36% 82.89%Clay 100.00% 75.22% 80.70%Doddridge 50.73% 18.77% 45.32%Fayette 75.83% 62.79% 69.28%Gilmer 69.34% 68.22% 71.56%Grant 58.57% 68.13% 72.21%Greenbrier 58.01% 34.81% 61.39%Hampshire 60.64% 54.17% 67.15%Hancock 51.79% 37.42% 46.84%Hardy 60.93% 47.86% 69.10%Harrison 49.53% 42.82% 65.77%Jackson 62.40% 48.38% 61.37%Jefferson 42.77% 33.14% 59.50%Kanawha 61.99% 45.26% 70.91%Lewis 56.24% 70.19% 63.33%Lincoln 82.32% 77.41% 77.35%Logan 68.74% 61.79% 63.99%Marion 55.13% 31.67% 60.94%Marshall 65.88% 58.27% 74.91%Mason 67.04% 87.16% 67.16%McDowell 100.00% 77.46% 81.90%Mercer 72.41% 81.92% 70.72%Mineral 51.43% 32.93% 67.19%Mingo 89.69% 71.56% 72.13%Monongalia 35.41% 34.36% 57.87%Monroe 56.39% 57.70% 57.34%Morgan 67.77% 47.63% 77.09%Nicholas 65.01% 41.06% 63.75%Ohio 53.03% 55.00% 58.51%Pendleton 64.53% 41.65% 71.96%Pleasants 51.13% 41.94% 66.20%Pocahontas 67.24% 62.41% 65.51%Preston 57.17% 43.35% 45.24%Putnam 39.57% 38.17% 55.63%Raleigh 62.42% 65.66% 61.78%Randolph 61.25% 72.76% 74.47%Ritchie 60.54% 58.10% 78.63%Roane 65.66% 63.87% 60.70%Summers 78.36% 75.34% 80.12%Taylor 56.97% 44.99% 61.22%Tucker 55.70% 63.05% 63.92%Tyler 59.85% 50.97% 80.05%Upshur 60.56% 61.71% 66.29%Wayne 69.49% 43.74% 58.77%Webster 89.23% 51.26% 68.87%Wetzel 51.45% 45.83% 61.26%Wirt 73.82% 65.81% 74.23%Wood 51.09% 26.90% 53.93%Wyoming 75.62% 65.25% 72.58%
Total 60.03% 51.22% 64.18%
DFA02/03/15Meal Participation Rates 14
-170-

COUNTY BOARDS OF EDUCATIONMEAL PARTICIPATION RATES - SORTEDBY BREAKFAST PARTICIPATION RATES
2013-14 SCHOOL YEAR
Pct. Students Eligible Breakfast LunchCt. County Free and Reduced Meals Participation Participation1 Mason 67.04% 87.16% 67.16%2 Mercer 72.41% 81.92% 70.72%3 McDowell 100.00% 77.46% 81.90%4 Lincoln 82.32% 77.41% 77.35%5 Summers 78.36% 75.34% 80.12%6 Clay 100.00% 75.22% 80.70%7 Randolph 61.25% 72.76% 74.47%8 Mingo 89.69% 71.56% 72.13%9 Calhoun 73.30% 71.36% 82.89%10 Braxton 75.13% 70.26% 71.07%11 Lewis 56.24% 70.19% 63.33%12 Gilmer 69.34% 68.22% 71.56%13 Grant 58.57% 68.13% 72.21%14 Boone 69.78% 66.06% 60.06%15 Wirt 73.82% 65.81% 74.23%16 Raleigh 62.42% 65.66% 61.78%17 Wyoming 75.62% 65.25% 72.58%18 Roane 65.66% 63.87% 60.70%19 Tucker 55.70% 63.05% 63.92%20 Fayette 75.83% 62.79% 69.28%21 Pocahontas 67.24% 62.41% 65.51%22 Logan 68.74% 61.79% 63.99%23 Upshur 60.56% 61.71% 66.29%24 Marshall 65.88% 58.27% 74.91%25 Ritchie 60.54% 58.10% 78.63%26 Monroe 56.39% 57.70% 57.34%27 Cabell 62.42% 56.85% 59.73%28 Ohio 53.03% 55.00% 58.51%29 Hampshire 60.64% 54.17% 67.15%30 Barbour 72.02% 54.03% 72.33%31 Webster 89.23% 51.26% 68.87%32 Tyler 59.85% 50.97% 80.05%33 Berkeley 53.71% 48.77% 61.74%34 Jackson 62.40% 48.38% 61.37%35 Hardy 60.93% 47.86% 69.10%36 Morgan 67.77% 47.63% 77.09%37 Wetzel 51.45% 45.83% 61.26%38 Kanawha 61.99% 45.26% 70.91%39 Taylor 56.97% 44.99% 61.22%40 Wayne 69.49% 43.74% 58.77%41 Preston 57.17% 43.35% 45.24%42 Harrison 49.53% 42.82% 65.77%43 Pleasants 51.13% 41.94% 66.20%44 Pendleton 64.53% 41.65% 71.96%45 Nicholas 65.01% 41.06% 63.75%46 Putnam 39.57% 38.17% 55.63%47 Brooke 56.21% 37.60% 50.36%48 Hancock 51.79% 37.42% 46.84%49 Greenbrier 58.01% 34.81% 61.39%50 Monongalia 35.41% 34.36% 57.87%51 Jefferson 42.77% 33.14% 59.50%52 Mineral 51.43% 32.93% 67.19%53 Marion 55.13% 31.67% 60.94%54 Wood 51.09% 26.90% 53.93%55 Doddridge 50.73% 18.77% 45.32%
- Total 60.03% 51.22% 64.18%
DFA02/03/15Meal Participation Rates 14
-171-

COUNTY BOARDS OF EDUCATIONMEAL PARTICIPATION RATES - SORTED
BY LUNCH PARTICIPATION RATES2013-14 SCHOOL YEAR
Pct. Students Eligible Breakfast LunchCt. County Free and Reduced Meals Participation Participation1 Calhoun 73.30% 71.36% 82.89%2 McDowell 100.00% 77.46% 81.90%3 Clay 100.00% 75.22% 80.70%4 Summers 78.36% 75.34% 80.12%5 Tyler 59.85% 50.97% 80.05%6 Ritchie 60.54% 58.10% 78.63%7 Lincoln 82.32% 77.41% 77.35%8 Morgan 67.77% 47.63% 77.09%9 Marshall 65.88% 58.27% 74.91%10 Randolph 61.25% 72.76% 74.47%11 Wirt 73.82% 65.81% 74.23%12 Wyoming 75.62% 65.25% 72.58%13 Barbour 72.02% 54.03% 72.33%14 Grant 58.57% 68.13% 72.21%15 Mingo 89.69% 71.56% 72.13%16 Pendleton 64.53% 41.65% 71.96%17 Gilmer 69.34% 68.22% 71.56%18 Braxton 75.13% 70.26% 71.07%19 Kanawha 61.99% 45.26% 70.91%20 Mercer 72.41% 81.92% 70.72%21 Fayette 75.83% 62.79% 69.28%22 Hardy 60.93% 47.86% 69.10%23 Webster 89.23% 51.26% 68.87%24 Mineral 51.43% 32.93% 67.19%25 Mason 67.04% 87.16% 67.16%26 Hampshire 60.64% 54.17% 67.15%27 Upshur 60.56% 61.71% 66.29%28 Pleasants 51.13% 41.94% 66.20%29 Harrison 49.53% 42.82% 65.77%30 Pocahontas 67.24% 62.41% 65.51%31 Logan 68.74% 61.79% 63.99%32 Tucker 55.70% 63.05% 63.92%33 Nicholas 65.01% 41.06% 63.75%34 Lewis 56.24% 70.19% 63.33%35 Raleigh 62.42% 65.66% 61.78%36 Berkeley 53.71% 48.77% 61.74%37 Greenbrier 58.01% 34.81% 61.39%38 Jackson 62.40% 48.38% 61.37%39 Wetzel 51.45% 45.83% 61.26%40 Taylor 56.97% 44.99% 61.22%41 Marion 55.13% 31.67% 60.94%42 Roane 65.66% 63.87% 60.70%43 Boone 69.78% 66.06% 60.06%44 Cabell 62.42% 56.85% 59.73%45 Jefferson 42.77% 33.14% 59.50%46 Wayne 69.49% 43.74% 58.77%47 Ohio 53.03% 55.00% 58.51%48 Monongalia 35.41% 34.36% 57.87%49 Monroe 56.39% 57.70% 57.34%50 Putnam 39.57% 38.17% 55.63%51 Wood 51.09% 26.90% 53.93%52 Brooke 56.21% 37.60% 50.36%53 Hancock 51.79% 37.42% 46.84%54 Doddridge 50.73% 18.77% 45.32%55 Preston 57.17% 43.35% 45.24%
- Total 60.03% 51.22% 64.18%
DFA02/03/15Meal Participation Rates 14
-172-
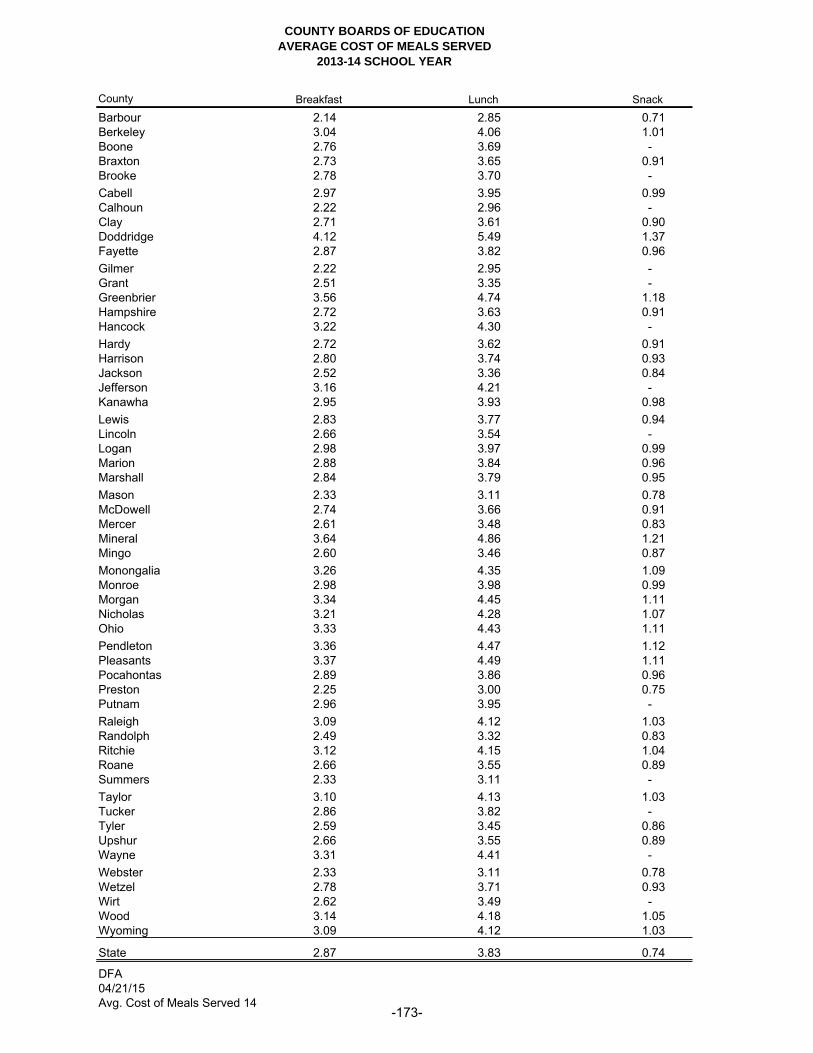
COUNTY BOARDS OF EDUCATIONAVERAGE COST OF MEALS SERVED
2013-14 SCHOOL YEAR
County Breakfast Lunch Snack
Barbour 2.14 2.85 0.71 Berkeley 3.04 4.06 1.01 Boone 2.76 3.69 - Braxton 2.73 3.65 0.91 Brooke 2.78 3.70 - Cabell 2.97 3.95 0.99 Calhoun 2.22 2.96 - Clay 2.71 3.61 0.90 Doddridge 4.12 5.49 1.37 Fayette 2.87 3.82 0.96 Gilmer 2.22 2.95 - Grant 2.51 3.35 - Greenbrier 3.56 4.74 1.18 Hampshire 2.72 3.63 0.91 Hancock 3.22 4.30 - Hardy 2.72 3.62 0.91 Harrison 2.80 3.74 0.93 Jackson 2.52 3.36 0.84 Jefferson 3.16 4.21 - Kanawha 2.95 3.93 0.98 Lewis 2.83 3.77 0.94 Lincoln 2.66 3.54 - Logan 2.98 3.97 0.99 Marion 2.88 3.84 0.96 Marshall 2.84 3.79 0.95 Mason 2.33 3.11 0.78 McDowell 2.74 3.66 0.91 Mercer 2.61 3.48 0.83 Mineral 3.64 4.86 1.21 Mingo 2.60 3.46 0.87 Monongalia 3.26 4.35 1.09 Monroe 2.98 3.98 0.99 Morgan 3.34 4.45 1.11 Nicholas 3.21 4.28 1.07 Ohio 3.33 4.43 1.11 Pendleton 3.36 4.47 1.12 Pleasants 3.37 4.49 1.11 Pocahontas 2.89 3.86 0.96 Preston 2.25 3.00 0.75 Putnam 2.96 3.95 - Raleigh 3.09 4.12 1.03 Randolph 2.49 3.32 0.83 Ritchie 3.12 4.15 1.04 Roane 2.66 3.55 0.89 Summers 2.33 3.11 - Taylor 3.10 4.13 1.03 Tucker 2.86 3.82 - Tyler 2.59 3.45 0.86 Upshur 2.66 3.55 0.89 Wayne 3.31 4.41 - Webster 2.33 3.11 0.78 Wetzel 2.78 3.71 0.93 Wirt 2.62 3.49 - Wood 3.14 4.18 1.05 Wyoming 3.09 4.12 1.03
State 2.87 3.83 0.74
DFA04/21/15Avg. Cost of Meals Served 14
-173-
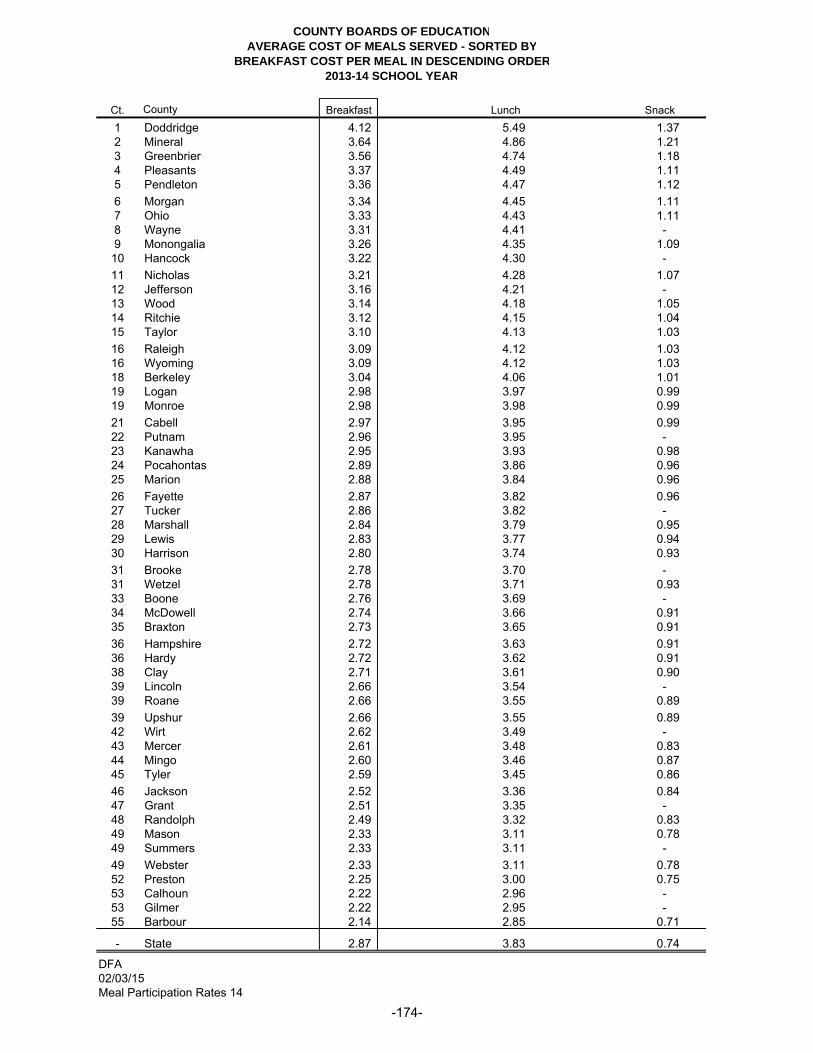
COUNTY BOARDS OF EDUCATIONAVERAGE COST OF MEALS SERVED - SORTED BY
BREAKFAST COST PER MEAL IN DESCENDING ORDER2013-14 SCHOOL YEAR
Ct. County Breakfast Lunch Snack1 Doddridge 4.12 5.49 1.37 2 Mineral 3.64 4.86 1.21 3 Greenbrier 3.56 4.74 1.18 4 Pleasants 3.37 4.49 1.11 5 Pendleton 3.36 4.47 1.12 6 Morgan 3.34 4.45 1.11 7 Ohio 3.33 4.43 1.11 8 Wayne 3.31 4.41 - 9 Monongalia 3.26 4.35 1.09 10 Hancock 3.22 4.30 - 11 Nicholas 3.21 4.28 1.07 12 Jefferson 3.16 4.21 - 13 Wood 3.14 4.18 1.05 14 Ritchie 3.12 4.15 1.04 15 Taylor 3.10 4.13 1.03 16 Raleigh 3.09 4.12 1.03 16 Wyoming 3.09 4.12 1.03 18 Berkeley 3.04 4.06 1.01 19 Logan 2.98 3.97 0.99 19 Monroe 2.98 3.98 0.99 21 Cabell 2.97 3.95 0.99 22 Putnam 2.96 3.95 - 23 Kanawha 2.95 3.93 0.98 24 Pocahontas 2.89 3.86 0.96 25 Marion 2.88 3.84 0.96 26 Fayette 2.87 3.82 0.96 27 Tucker 2.86 3.82 - 28 Marshall 2.84 3.79 0.95 29 Lewis 2.83 3.77 0.94 30 Harrison 2.80 3.74 0.93 31 Brooke 2.78 3.70 - 31 Wetzel 2.78 3.71 0.93 33 Boone 2.76 3.69 - 34 McDowell 2.74 3.66 0.91 35 Braxton 2.73 3.65 0.91 36 Hampshire 2.72 3.63 0.91 36 Hardy 2.72 3.62 0.91 38 Clay 2.71 3.61 0.90 39 Lincoln 2.66 3.54 - 39 Roane 2.66 3.55 0.89 39 Upshur 2.66 3.55 0.89 42 Wirt 2.62 3.49 - 43 Mercer 2.61 3.48 0.83 44 Mingo 2.60 3.46 0.87 45 Tyler 2.59 3.45 0.86 46 Jackson 2.52 3.36 0.84 47 Grant 2.51 3.35 - 48 Randolph 2.49 3.32 0.83 49 Mason 2.33 3.11 0.78 49 Summers 2.33 3.11 - 49 Webster 2.33 3.11 0.78 52 Preston 2.25 3.00 0.75 53 Calhoun 2.22 2.96 - 53 Gilmer 2.22 2.95 - 55 Barbour 2.14 2.85 0.71
- State 2.87 3.83 0.74
DFA02/03/15Meal Participation Rates 14
-174-

COUNTY BOARDS OF EDUCATIONAVERAGE COST OF MEALS SERVED - SORTED BY
LUNCH COST PER MEAL IN DESCENDING ORER2013-14 SCHOOL YEAR
Ct. County Breakfast Lunch Snack1 Doddridge 4.12 5.49 1.37 2 Mineral 3.64 4.86 1.21 3 Greenbrier 3.56 4.74 1.18 4 Pleasants 3.37 4.49 1.11 5 Pendleton 3.36 4.47 1.12 6 Morgan 3.34 4.45 1.11 7 Ohio 3.33 4.43 1.11 8 Wayne 3.31 4.41 - 9 Monongalia 3.26 4.35 1.09 10 Hancock 3.22 4.30 - 11 Nicholas 3.21 4.28 1.07 12 Jefferson 3.16 4.21 - 13 Wood 3.14 4.18 1.05 14 Ritchie 3.12 4.15 1.04 15 Taylor 3.10 4.13 1.03 16 Raleigh 3.09 4.12 1.03 16 Wyoming 3.09 4.12 1.03 18 Berkeley 3.04 4.06 1.01 19 Monroe 2.98 3.98 0.99 20 Logan 2.98 3.97 0.99 21 Cabell 2.97 3.95 0.99 21 Putnam 2.96 3.95 - 23 Kanawha 2.95 3.93 0.98 24 Pocahontas 2.89 3.86 0.96 25 Marion 2.88 3.84 0.96 26 Fayette 2.87 3.82 0.96 26 Tucker 2.86 3.82 - 28 Marshall 2.84 3.79 0.95 29 Lewis 2.83 3.77 0.94 30 Harrison 2.80 3.74 0.93 31 Wetzel 2.78 3.71 0.93 32 Brooke 2.78 3.70 - 33 Boone 2.76 3.69 - 34 McDowell 2.74 3.66 0.91 35 Braxton 2.73 3.65 0.91 36 Hampshire 2.72 3.63 0.91 37 Hardy 2.72 3.62 0.91 38 Clay 2.71 3.61 0.90 39 Roane 2.66 3.55 0.89 39 Upshur 2.66 3.55 0.89 41 Lincoln 2.66 3.54 - 42 Wirt 2.62 3.49 - 43 Mercer 2.61 3.48 0.83 44 Mingo 2.60 3.46 0.87 45 Tyler 2.59 3.45 0.86 46 Jackson 2.52 3.36 0.84 47 Grant 2.51 3.35 - 48 Randolph 2.49 3.32 0.83 49 Mason 2.33 3.11 0.78 49 Summers 2.33 3.11 - 49 Webster 2.33 3.11 0.78 52 Preston 2.25 3.00 0.75 53 Calhoun 2.22 2.96 - 54 Gilmer 2.22 2.95 - 55 Barbour 2.14 2.85 0.71
- State 2.87 3.83 0.74
DFA02/03/15Meal Participation Rates 14
-175-

COUNTY BOARDS OF EDUCATIONAVERAGE COST OF MEALS SERVED - SORTED BYSNACK COST PER MEAL IN DESCENDING ORDER
2013-14 SCHOOL YEAR
Ct. County Breakfast Lunch Snack1 Doddridge 4.12 5.49 1.37 2 Mineral 3.64 4.86 1.21 3 Greenbrier 3.56 4.74 1.18 4 Pendleton 3.36 4.47 1.12 5 Morgan 3.34 4.45 1.11 6 Ohio 3.33 4.43 1.11 7 Pleasants 3.37 4.49 1.11 8 Monongalia 3.26 4.35 1.09 9 Nicholas 3.21 4.28 1.07 10 Wood 3.14 4.18 1.05 11 Ritchie 3.12 4.15 1.04 12 Raleigh 3.09 4.12 1.03 13 Taylor 3.10 4.13 1.03 14 Wyoming 3.09 4.12 1.03 15 Berkeley 3.04 4.06 1.01 16 Cabell 2.97 3.95 0.99 17 Logan 2.98 3.97 0.99 18 Monroe 2.98 3.98 0.99 19 Kanawha 2.95 3.93 0.98 20 Fayette 2.87 3.82 0.96 21 Marion 2.88 3.84 0.96 22 Pocahontas 2.89 3.86 0.96 23 Marshall 2.84 3.79 0.95 24 Lewis 2.83 3.77 0.94 25 Harrison 2.80 3.74 0.93 26 Wetzel 2.78 3.71 0.93 27 Braxton 2.73 3.65 0.91 28 Hampshire 2.72 3.63 0.91 29 Hardy 2.72 3.62 0.91 30 McDowell 2.74 3.66 0.91 31 Clay 2.71 3.61 0.90 32 Roane 2.66 3.55 0.89 32 Upshur 2.66 3.55 0.89 34 Mingo 2.60 3.46 0.87 35 Tyler 2.59 3.45 0.86 36 Jackson 2.52 3.36 0.84 37 Mercer 2.61 3.48 0.83 38 Randolph 2.49 3.32 0.83 39 Mason 2.33 3.11 0.78 39 Webster 2.33 3.11 0.78 41 Preston 2.25 3.00 0.75 42 Barbour 2.14 2.85 0.71 43 Boone 2.76 3.69 - 44 Brooke 2.78 3.70 - 45 Calhoun 2.22 2.96 - 46 Gilmer 2.22 2.95 - 47 Grant 2.51 3.35 - 48 Hancock 3.22 4.30 - 49 Jefferson 3.16 4.21 - 50 Lincoln 2.66 3.54 - 51 Putnam 2.96 3.95 - 52 Summers 2.33 3.11 - 53 Tucker 2.86 3.82 - 54 Wayne 3.31 4.41 - 55 Wirt 2.62 3.49 -
- State 2.87 3.83 0.74
DFA02/03/15Meal Participation Rates 14
-176-
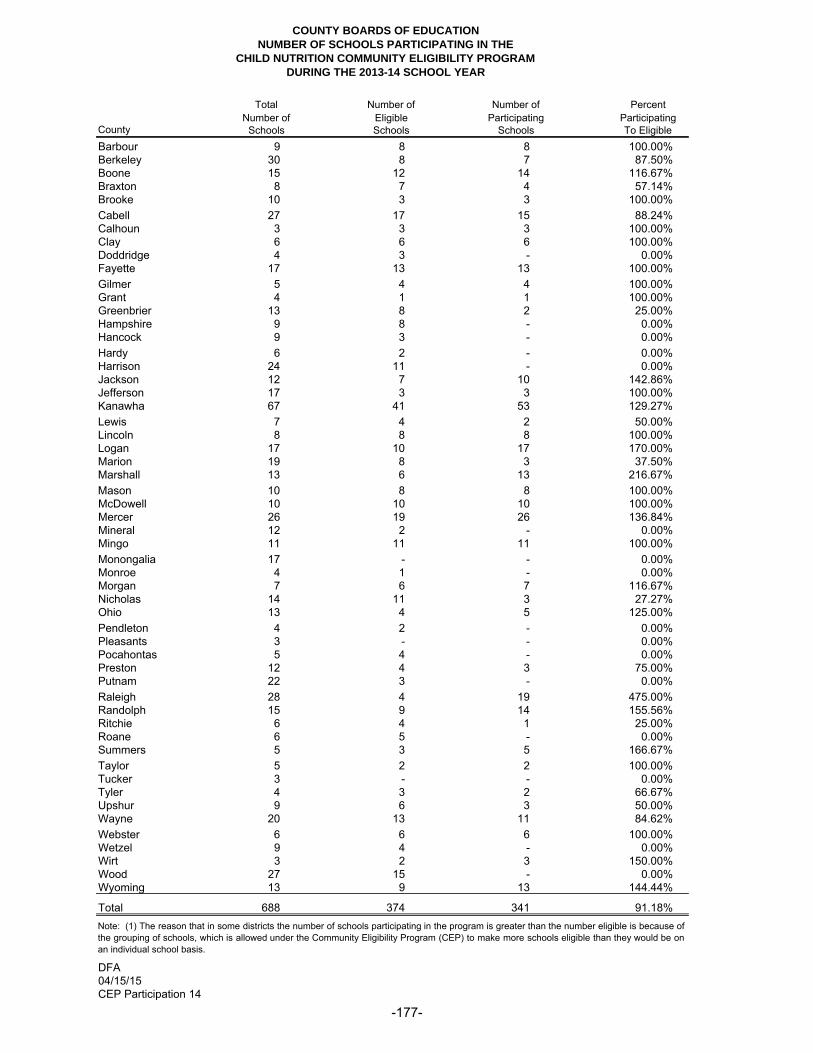
COUNTY BOARDS OF EDUCATIONNUMBER OF SCHOOLS PARTICIPATING IN THE
CHILD NUTRITION COMMUNITY ELIGIBILITY PROGRAMDURING THE 2013-14 SCHOOL YEAR
Total Number of Number of PercentNumber of Eligible Participating Participating
County Schools Schools Schools To EligibleBarbour 9 8 8 100.00%Berkeley 30 8 7 87.50%Boone 15 12 14 116.67%Braxton 8 7 4 57.14%Brooke 10 3 3 100.00%Cabell 27 17 15 88.24%Calhoun 3 3 3 100.00%Clay 6 6 6 100.00%Doddridge 4 3 - 0.00%Fayette 17 13 13 100.00%Gilmer 5 4 4 100.00%Grant 4 1 1 100.00%Greenbrier 13 8 2 25.00%Hampshire 9 8 - 0.00%Hancock 9 3 - 0.00%Hardy 6 2 - 0.00%Harrison 24 11 - 0.00%Jackson 12 7 10 142.86%Jefferson 17 3 3 100.00%Kanawha 67 41 53 129.27%Lewis 7 4 2 50.00%Lincoln 8 8 8 100.00%Logan 17 10 17 170.00%Marion 19 8 3 37.50%Marshall 13 6 13 216.67%Mason 10 8 8 100.00%McDowell 10 10 10 100.00%Mercer 26 19 26 136.84%Mineral 12 2 - 0.00%Mingo 11 11 11 100.00%Monongalia 17 - - 0.00%Monroe 4 1 - 0.00%Morgan 7 6 7 116.67%Nicholas 14 11 3 27.27%Ohio 13 4 5 125.00%Pendleton 4 2 - 0.00%Pleasants 3 - - 0.00%Pocahontas 5 4 - 0.00%Preston 12 4 3 75.00%Putnam 22 3 - 0.00%Raleigh 28 4 19 475.00%Randolph 15 9 14 155.56%Ritchie 6 4 1 25.00%Roane 6 5 - 0.00%Summers 5 3 5 166.67%Taylor 5 2 2 100.00%Tucker 3 - - 0.00%Tyler 4 3 2 66.67%Upshur 9 6 3 50.00%Wayne 20 13 11 84.62%Webster 6 6 6 100.00%Wetzel 9 4 - 0.00%Wirt 3 2 3 150.00%Wood 27 15 - 0.00%Wyoming 13 9 13 144.44%
Total 688 374 341 91.18%
DFA04/15/15CEP Participation 14
Note: (1) The reason that in some districts the number of schools participating in the program is greater than the number eligible is because ofthe grouping of schools, which is allowed under the Community Eligibility Program (CEP) to make more schools eligible than they would be onan individual school basis.
-177-

COUNTY BOARDS OF EDUCATIONNUMBER OF SCHOOLS PARTICIPATING IN THE
CHILD NUTRITION COMMUNITY ELIGIBILITY PROGRAMSORTED IN DESCENDING ORDER BY PERCENT PARTICIPATION
DURING THE 2013-14 SCHOOL YEAR
Total Number of Number of PercentNumber of Eligible Participating Participating
Ct. County Schools Schools Schools To Eligible1 Raleigh 28 4 19 475.00%2 Marshall 13 6 13 216.67%3 Logan 17 10 17 170.00%4 Summers 5 3 5 166.67%5 Randolph 15 9 14 155.56%6 Wirt 3 2 3 150.00%7 Wyoming 13 9 13 144.44%8 Jackson 12 7 10 142.86%9 Mercer 26 19 26 136.84%10 Kanawha 67 41 53 129.27%11 Ohio 13 4 5 125.00%12 Boone 15 12 14 116.67%12 Morgan 7 6 7 116.67%14 Barbour 9 8 8 100.00%14 Brooke 10 3 3 100.00%14 Calhoun 3 3 3 100.00%14 Clay 6 6 6 100.00%14 Fayette 17 13 13 100.00%14 Gilmer 5 4 4 100.00%14 Grant 4 1 1 100.00%14 Jefferson 17 3 3 100.00%14 Lincoln 8 8 8 100.00%14 Mason 10 8 8 100.00%14 McDowell 10 10 10 100.00%14 Mingo 11 11 11 100.00%14 Taylor 5 2 2 100.00%14 Webster 6 6 6 100.00%28 Cabell 27 17 15 88.24%29 Berkeley 30 8 7 87.50%30 Wayne 20 13 11 84.62%31 Preston 12 4 3 75.00%32 Tyler 4 3 2 66.67%33 Braxton 8 7 4 57.14%34 Lewis 7 4 2 50.00%34 Upshur 9 6 3 50.00%36 Marion 19 8 3 37.50%37 Nicholas 14 11 3 27.27%38 Greenbrier 13 8 2 25.00%38 Ritchie 6 4 1 25.00%40 Doddridge 4 3 - 0.00%40 Hampshire 9 8 - 0.00%40 Hancock 9 3 - 0.00%40 Hardy 6 2 - 0.00%40 Harrison 24 11 - 0.00%40 Mineral 12 2 - 0.00%40 Monongalia 17 - - 0.00%40 Monroe 4 1 - 0.00%40 Pendleton 4 2 - 0.00%40 Pleasants 3 - - 0.00%40 Pocahontas 5 4 - 0.00%40 Putnam 22 3 - 0.00%40 Roane 6 5 - 0.00%40 Tucker 3 - - 0.00%40 Wetzel 9 4 - 0.00%40 Wood 27 15 - 0.00%
- Total 688 374 341 91.18%
DFA04/15/15CEP Participation 14
Note: (1) The reason that in some districts the number of schools participating in the program is greater than the number eligible is because of thegrouping of schools, which is allowed under the Community Eligibility Program (CEP) to make more schools eligible than they would be on anindividual school basis.
-178-


Michael J. Martirano, Ed.D.State Superintendent of Schools