some visualization principles from edward tufteredmiles/inf143-sq08/week02/tufteprinciplesandari...2...
TRANSCRIPT

1
Some Visualization Principles
from Edward Tufte

2
Edward Tufte, Beautiful Evidence
See also http://www.edwardtufte.com/tufte/books_be

3
Some Principles
• Content
• Comparisons
• Causality / Structure / Explanation
• Multivariate Analysis
• Integration of Evidence
• Documentation

4
Napoleon’s March
From http://www.askdrmike.com/bestgrf.jpg

5
Ariadne – Dependencies in
Collaborative Software Engineering
See also http://awareness.ics.uci.edu/~ariadne/

6
Content – Problem Context
Photo out of context from http://jurmo.us/2007/03/04/work-20-the-empty-cubicle/
Creating awareness of isolated work.

7
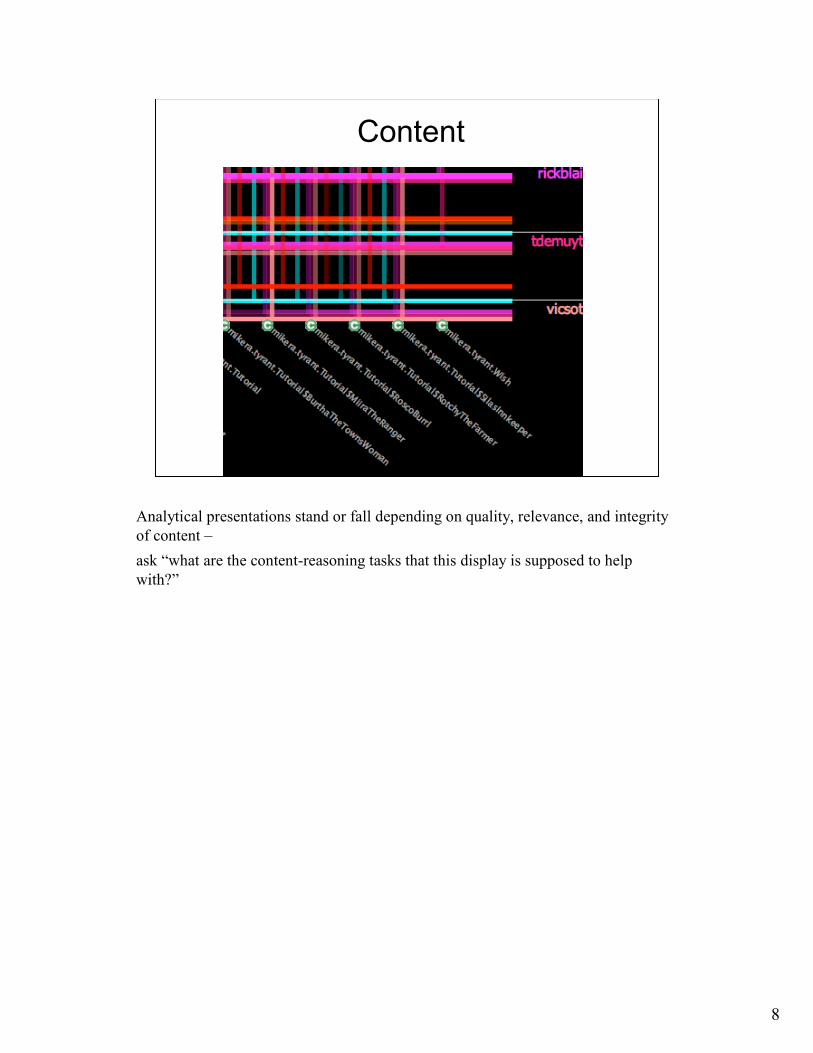
Content
Analytical presentations stand or fall depending on quality, relevance, and integrity
of content –
ask “what are the content-reasoning tasks that this display is supposed to help
with?”
8
Content
Analytical presentations stand or fall depending on quality, relevance, and integrity
of content –
ask “what are the content-reasoning tasks that this display is supposed to help
with?”
9
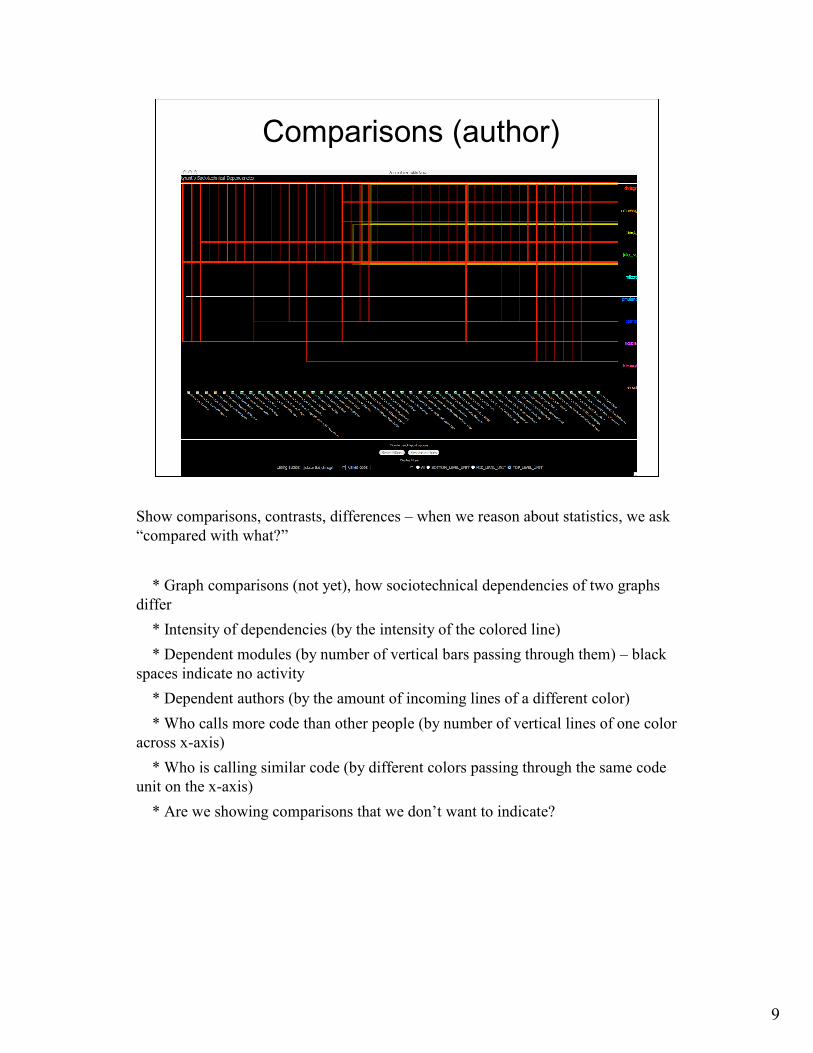
Comparisons (author)
Show comparisons, contrasts, differences – when we reason about statistics, we ask
“compared with what?”
* Graph comparisons (not yet), how sociotechnical dependencies of two graphs
differ
* Intensity of dependencies (by the intensity of the colored line)
* Dependent modules (by number of vertical bars passing through them) – black
spaces indicate no activity
* Dependent authors (by the amount of incoming lines of a different color)
* Who calls more code than other people (by number of vertical lines of one color
across x-axis)
* Who is calling similar code (by different colors passing through the same code
unit on the x-axis)
* Are we showing comparisons that we don’t want to indicate?

10
Comparisons (artifact)
Show comparisons, contrasts, differences – when we reason about statistics, we ask
“compared with what?”
* Graph comparisons (not yet), how sociotechnical dependencies of two graphs
differ
* Intensity of dependencies (by the intensity of the colored line)
* Dependent modules (by number of vertical bars passing through them) – black
spaces indicate no activity
* Dependent authors (by the amount of incoming lines of a different color)
* Who calls more code than other people (by number of vertical lines of one color
across x-axis)
* Who is calling similar code (by different colors passing through the same code
unit on the x-axis)
* Are we showing comparisons that we don’t want to indicate?

11
Causality
Need to do reasoning to make decisions, understand relationships
* Why authors need to coordinate their work - trace the vertical line through the
code and to the called author
* Why certain authors are central or more knowledgable – their colored lines
vertically intersect much of the code in the project so they use a lot of code
* Why project is slipping behind schedule – absence of dependency lines through
code that should be integrated, or weak intensity of dependency

12
Multivariate Analysis
Show many dimensions and variables
* Time (not yet)
* Intensity of dependency – by intensity of color
* Code called (along x –axis)
* Calling code (?)
* Authors, called and calling (on y-axis)
* Authors (who calls most, more dynamic)
* Number of colors – number of authors (distinct)
* Granularity
* Modularity (one author touching many modules or different packages in project
vs. a small cohesive set)
13
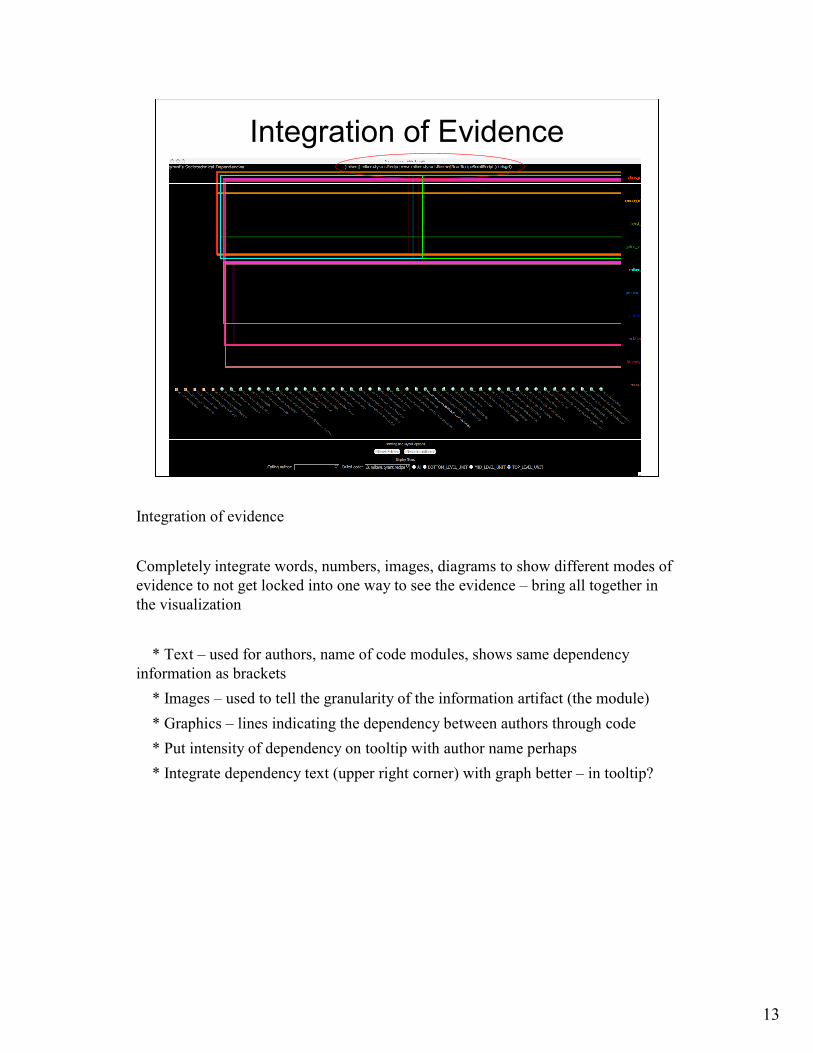
Integration of Evidence
Integration of evidence
Completely integrate words, numbers, images, diagrams to show different modes of
evidence to not get locked into one way to see the evidence – bring all together in
the visualization
* Text – used for authors, name of code modules, shows same dependency
information as brackets
* Images – used to tell the granularity of the information artifact (the module)
* Graphics – lines indicating the dependency between authors through code
* Put intensity of dependency on tooltip with author name perhaps
* Integrate dependency text (upper right corner) with graph better – in tooltip?

14
Documentation
Documentation
Credibility, quality control – authors named, sponsors revealed, interests and
agendas unveiled, sources described, measurement scales e.g. what is display about?
Who did work? Who is that? Where and when was work done? What are data
sources? What are assumptions?
* What is display about (Sociotechnical dependencies) – and for which project
(Tyrant)
* Who did work (UCI informatics)
* Who’s that – explanation of us
* When and where was work done (UCI and appropriate year)
* Data sources – extracted from cvs project @ this point in time
* Assumptions – granularity analyzed, just one point in time (doesn’t reflect
different releases or revisions), assume no gatekeeper controls check ins, only
showing calls to code, no other relationships, (what are sociotechnical
dependencies)? Be more specific in description