some synoptic aspects of hot weather in britain
TRANSCRIPT
SOME SYNOPTIC ASPECTS OF HOT WEATHER IN BRITAIN
By I. T. LYALL Newark, Not tinghamshire
HIS article sets out to consider some of the synoptic aspects associated with T hot weather in Britain. Owing to certain practical difficulties it was decided to concentrate on a relatively small sample of data relating to the last few years only. Many of the conclusions drawn will therefore relate only to that sample. On the other hand there is no prima facie reason to suppose that many of the findings would not be more generally applicable.
There is no hard and fast rule as to what constitutes ‘hot’ weather in Britain. For the purpose of this study, a station is regarded as having a ‘hot day’ when the maximum reached or exceeded 27°C (80.6”F). Data were collected from five stations run by members of the Directory of Amateur Observers (D.A.O.) for the four years 1970-73. The stations represent five regions of England:
South-east Effingham (Surrey) South-west Dorchester (Dorset) Midland Birmingham (Warwickshire) East Newark (Nottinghamshire) North Billington (Lancashire)
More generally, a ‘hot day’ was one when the criterion of 27°C had been fulfilled at one or more of these stations. On this basis, there were 37 hot days during the four years 197C73. Table 1 shows the numbers of hot days by area and year. All stations show at least 70 per cent of their hot days during the years 1970 and 1973, with as many as 83 per cent in the East. The South-east (Effingham) had the largest total in every year except 1970. The East and South-east stations were outstanding in the two better years, and overall attained six to seven hot days per annum. The South-east had 1 1 days when it alone was ‘hot’. In the poor summer of 1972 the South-west and Midlands failed to achieve even a single hot day and other areas had only one. It is interesting to note that the highest tem- perature that summer among the five stations was at. ,Billington (North) which reached 28~3°C on 20 July.
TABLE 1 . Total number of hot days in each area for each year, 1970-73
Year 1970 1971 1972 1973 Total
Area Southeast 10 6 1 12 29 South-wat 4 4 0 6 14 Midland 3 2 0 3 8 East 14 3 1 6 24 North 3 1 1 2 7
Total* 16 7 2 12 37 * i.e. indicating number of days which were hot at one or more stations
358
The combined distribution among the months of the year was evenly divided among the main summer montlls (1 1 days in June, 11 in July and 10 in August). Five hot days occurred in September. Longer term records show that 27°C has been reached or exceeded fairly widely in southern England on days in April, May and October. Table 2 shows that the seasonal distribution of hot days varied from one area to another. Hot days occurred most frequently in June in the East. July was the favoured month for South-west and North and an equal number of occurrences were noted in July and August in the Midlands. In the South-east the greatest frequency of hot days was in August. Newark (East) was unusual in recording only 54 per cent of its hot days in July and August. EfEngham (South-east) had 62 per cent of hot days in those months whilst other stations noted between 65 and 'IS per cent of their hot days in those same months. The inference would be that proximity to the Continent is more important in June. The underlying basis of this will be clearer when synoptic types are considered.
The percentage of Occurrences for each month again indicate the pre- eminence of the East and South-east. On 91 per cent of hot June days in England, Newark recorded one, whilst in July the corresponding figure was 64 per cent; Effingham noted a hot day on 73 per cent of July hot days and on all 10 hot days recorded in August. No hot days occurred at Birmingham (Midland) or Billington (North) during September.
HOT DAYS AND SYNOPTIC CLASSIFICATION
The synoptic aspects of hot days have been studied in relation to a classifica-
A3. A2. A1 . D1. D2. D3. The circulation over England was noted and classified for each hot day
reported by any of the D.A.O. stations during 1970-73. Table 3 lists the synoptic types in each year. Types D2 and D3 never occurred on any of the 37 occasions. This fact probably needs little elaboration as an actively cyclonic system is
tion described by Barry and Perry (1973). It has been modified to give six types: Closed anticyclonic circulation, central pressure at least 1025 mb. As A3, but central pressure 1019-1024 mb. Anticyclone periphery or ridge of high pressure. Depression periphery or trough of low pressure. Closed cyclonic circulation, central pressure 1001-1006 mb. As D2, but central pressure lo00 mb or lower.
TABLE 2. Total number of hot days in each area for each month
The figures represent the total of hot days for that station for the four years 1970-73 combined; the figures in parentheses are the percentage of hot days (at one or more stations) forthat month
359
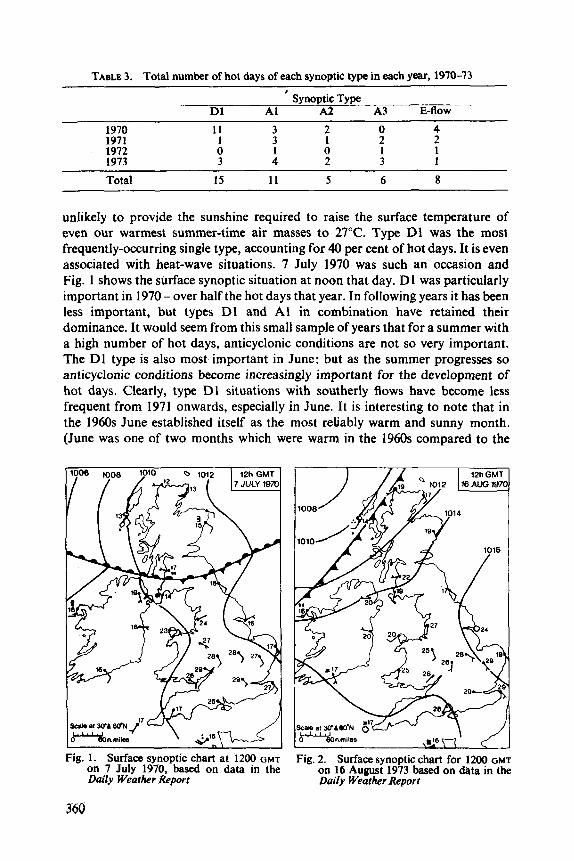
TABLE 3. Total number of hot days of each synoptic type in each year, 1970-73 i
Synoptic Type D1 A1 A2 A 3 E-ROW
Total 15 1 1 5 6 8
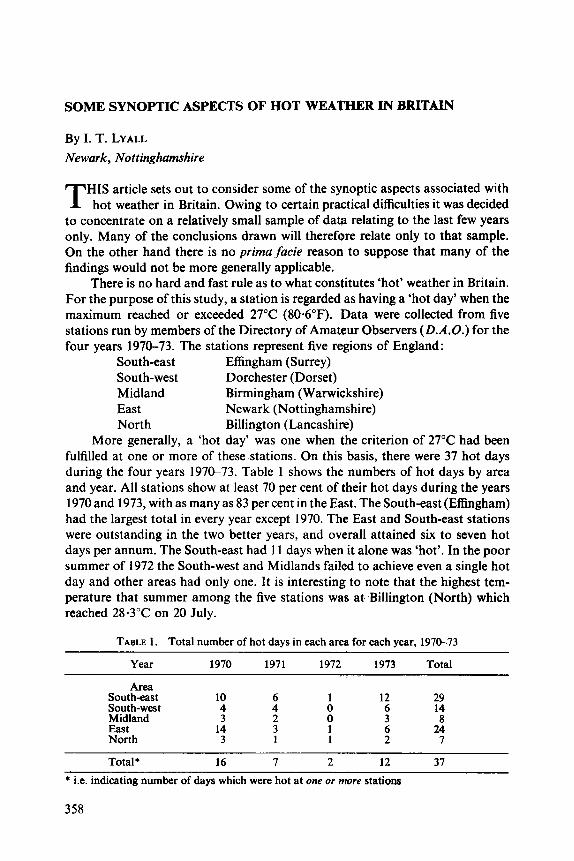
unlikely to provide the sunshine required to raise the surface temperature of even our warmest summer-time air masses to 27°C. Type D1 was the most frequently-occurring single type, accounting for 40 per cent of hot days. It is even associated with heat-wave situations. 7 July 1970 was such an occasion and Fig. 1 shows the surface synoptic situation at noon that day. D1 was particularly important in 1970 - over half the hot days that year. In following years it has been less important, but types D1 and Al in combination have retained their dominance. It would seem from this small sample of years that for a summer with a high number of hot days, anticyclonic conditions are not so very important. The D1 type is also most important in June: but as the summer progresses so anticyclonic conditions become increasingly important for the development of hot days. Clearly, type D1 situations with southerly flows have become less frequent from 1971 onwards, especially in June. It is interesting to note that in the 1960s June established itself as the most reliably warm and sunny month. (June was one of two months which were warm in the 1960s compared to the
Fig. 1 . Surface synoptic chart at 1200 GMT on 7 July 1970, based on data in the Daily Weather Report
360
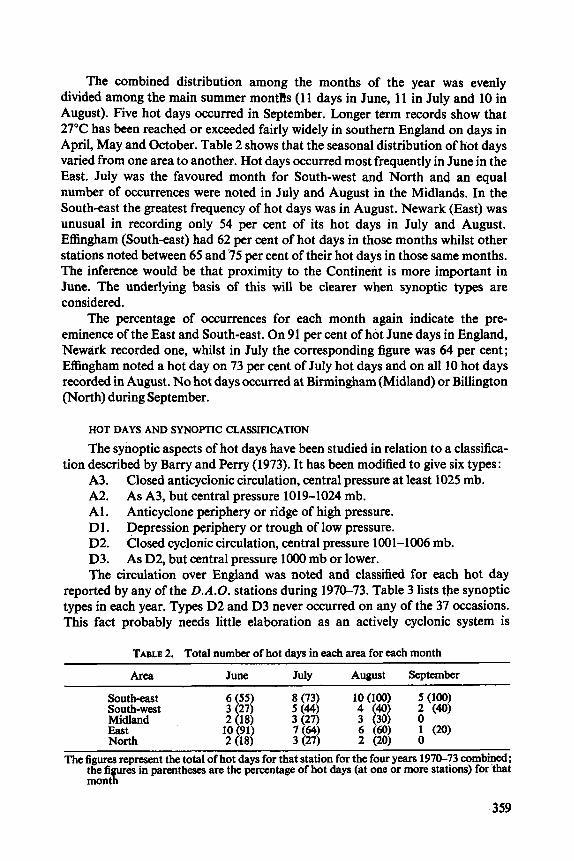
Fig. 2. Surface synoptic chart for 1200 GMT on 16 August 1973 based on data in the Daily Weather Report
Fig. 3. Positions of Anticyclonic Centres on Hot Days of the Synoptic Categories Al , A2 and A3; also on peak dates of heat-waves. x marks positions of anticyclones on ‘hot days’ of Al, A2 and A3 categories. 0 marks positions of anticyclones on peak days of heat-waves. - - - the boundary of most frequent occurrence of anticyclones in heat-waves (from Perry 1967)
1950s.) Since 1970, June has been noticeably cooler and duller and indeed was exceptionally cool in 1971 and 1972. The synoptic aspects of June 1972 have been discussed by Perry (1972).
Type A1 is almost equally important as D1 and accounted for 30 per cent of the hot days recorded. Such days would again be favoured by a long ‘fetch‘ and would be more likely to produce abundant sunshine. The heat-wave day of 16 August 1973 was categorised as A1 and Fig. 2 shows the mid-day surface synopsis. In both type D1 and Al, the southerly fetch of the airstream probably accounts for the high temperatures recorded. Types A2 and A3 were associated with the remaining 30 per cent of hot days. The relative rarity of these types among hot days seems a little odd, but probably reflects the relatively low frequency of strongly anticyclonic situations in summer. Dorchester was slightly anomalous in that of the five days when 29°C was reached, three were associated with synoptic types A2 and A3.
An attempt was also made to classify hot days in relation to the type of air- flow across the country - a characteristic closely related to the synoptic situations outlined above. On days when there was a fairly obvious flow, classification by the direction of the eight main compass points gave the following: easterly flow - eight days; southerly - four days; south-westerly - two days; westerly - one day; and north-westerly - one day.
Figure 3 shows the position of the appropriate anticyclone centre on days which were among the ‘A’ synoptic types. By far the most common position for the centres was a belt stretching from the southern North Sea across Denmark
361

to south Sweden. It is interesting to compare this grouping with that shown by Perry (1967) to be associated with heat-wave blocking situations. A distinct second group occurs around 50"N and 20"-3OoW.
REGIONAL DISTRIBUTION AND SYNOPTIC TYPE
The synoptic types associated with the hot days recorded in each region are shown in Table 4. Total number of days and percentage of occurrence for each station are both shown.
Type D1 is clearly of particular importance in the east and north of the country, Newark (East) having as many as 46 per cent of its hot days when this type was occurring. In the North, Type A1 was equally important. The association of hot days in the South-west with types A2 and A3 has already been mentioned. This amounted to 44 per cent of occasions compared to 30 per cent at other stations. The association of Type D1 with occurrences in the eastern side of the country is probably related to the fact that on such an occasion, with a long southerly or south-easterly 'fetch', the first part of the country to be more directly affected by advancing troughs and lower temperatures will be the West, and particularly the South-west.
In relation to days with an easterly flow it is not altogether surprising to note that nearly all 'hot easterly days' were hot in the South-east. On only one occasion did the association occur in the Midlands and North. Also, these areas had easterly flow on relatively few of their hot days, whilst East, South-east and South-west all had east winds on 21 to 23 per cent of their hot days, which compares with the figure of 22 per cent for all hot days.
HEAT SINGULARITIES
Listing the number of hot days (at one or more D.A.O. stations) in pentads between 6 June and 13 September (Table 5) shows peaks in the periods 6-20 June, 6-10 July and 31 Ju ly4 August. (None of these depended on just one hot spell.) It is interesting to observe that the first peak terminates at the date given by Lamb (1964) for the 'return of the westerlies'. The second peak falls during a critical period described by Finch (1973). Three years provided at least one 'hot' day during the 'critical' period when the occurrence of warm days (24°C) indicates a good number of warm days during July and August. Perhaps an odd warm spell is more relevant here than an odd hot day.
TABLE 4. Total number of hot days in each area of various synoptic types
_ _ ~ - Synoptic Type ~- Area D1 A1 A2 Alp- E-flow
~~~~~ ~ ~ ~ ~~~~~
Sou th-eas t 12(41) 8(27) 4(14) 5 (18) 7 (23) South-west 4 (28) 4(28) 3 (22) 3 (22) 3 (22) Midland 3 (37) Z(25) 2(25) l (13 ) l ( l 3 ) East 1 1 (46) 6(25) 3 (12) 4(17) 5(21) North 3 (42) 3 (42) l (14 ) 0 104) Total 15 (41) 1 1 (30) 5 (13) 6 (16) 8 (21)
Figures in parentheses are the percentage of hot daysfor that area
362

TABLE 5. Number of hot days (at one or more stations) in each pentad, 6 June-13 September
6-10 June 1 1-1 5 June 16-20 June 21-25 June 26-30 June
6-10 July 1- 5 July
4 11-15July 2 15-19August 3 1 16-20 July 2 20-24August 0 4 21-25 July 0 25-29Auwt 0 2 263OJuly 0 30August-3September 0 0 31 July-4August 5 4-8September 1 1 5- 9August 0 9-13September 4 6 10-14August 2
HEAT-WAVES
On 16 August 1973, five stations in the DaiZy Weather Report recorded a maximum temperature of 31 "C. This is well in excess of the limit set here for a hot day, and underlines the fact that sometimes substantially higher temperatures are observed. Such occurrences are much more rare and accompany what is popularly called the 'heat-wave'. The spell from 14-16 August 1973 would commonly be regarded as one such and it was doubtless this type of phenomenon which prompted Charles 11, three centuries ago, to his often quoted remark, 'Three hot days and a thunderstorm make the English summer'. If we accept the spell of 14-16 August 1973 as being a heat wave and take an arbitrary definition as three or more D. W.R. stations reaching 31"C, three other heat-waves can be recognised between 1968 and 1970, namely those culminating on 1 July 1968, 16 July 1969 and 7 July 1970. The daily maxima and sunshine totals at a number of stations in England for these days together with 16 August 1973 are listed in Table 6. It will be seen that the highest temperatures are exceptional only in the extreme south-west and north-west. Except on 1 July 1968, maxima over 25°C were invariably associated with over eight hours sunshine.
On 12 August 1973 a breakaway cell from the Azores anticyclone was already centred over the North Sea. The next day it had moved eastward to Denmark and there was then remarkably little change for three days. Tempera- tures reached 30°C locally on the 14th as a hot east to south-easterly flow became established across much of the country and during the next few days it became steadily hotter.
TABLE 6. Maximum temperatures and sunshine totals at selected Daily Weather Report Stations for days of highest temperature (temperature in "C; sunshine to nearest hour)
1 July 1968
Station temp. Sun
Gatwick 31 13 Hurn 29 - Chivenor 24 1 Ross-on-Wye 27 3 Elrndon 28 6 H o ni n gt o n Mildenhall } 32 Watnall 31 4 Ringway 22 1 Leeming 22 1 Carlisle 19 0
Max. 16 July 1968 Max. temp. SGn
7 July 1970 Max. temp. Sun
16 Aug 1973 Max. temp; Sun
29 13 27 12 19 2 27 13 30 12 32 14 31 13 27 12 28 ' 8 25 9
30 13 27 10 29 12 31 14 31 13 29 - 32 10 30 12 27 13 25 9
31 12 30 12 27 9 29 ii 29 10 31 12
29 9 27 9 28 9 27 8
363
C
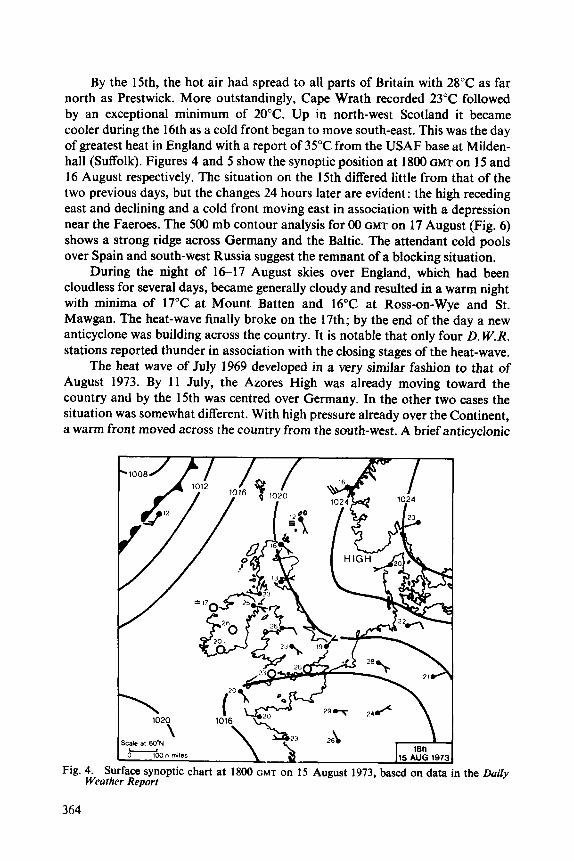
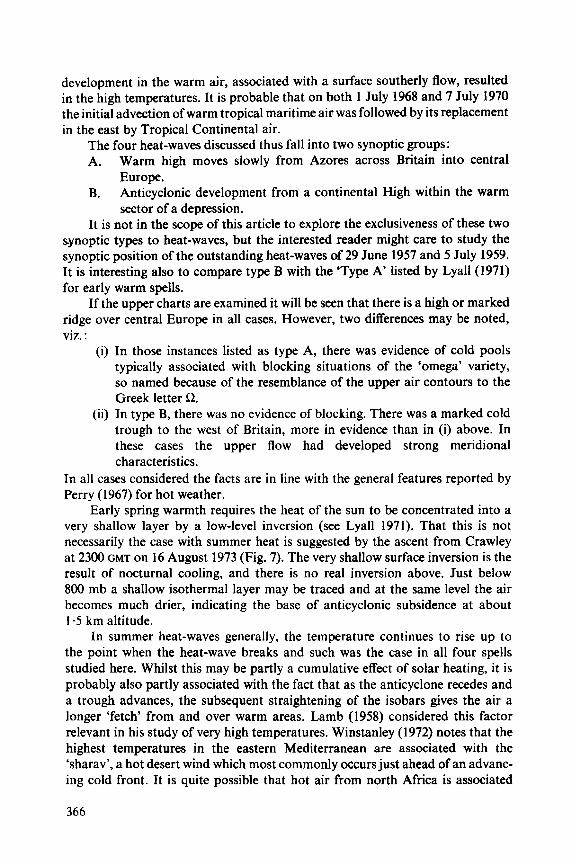
By the 15th, the hot air had spread to all parts of Britain with 28°C as far north as Prestwick. More outstandingly, Cape Wrath recorded 23°C followed by an exceptional minimum of 20°C. Up in north-west Scotland it became cooler during the 16th as a cold front began to move south-east. This was the day of greatest heat in England with a report of 35°C from the USAF base at Milden- hall (Suffolk). Figures 4 and 5 show the synoptic position at 1800 GMT on 15 and 16 August respectively. The situation on the 15th differed little from that of the two previous days, but the changes 24 hours later are evident: the high receding east and declining and a cold front moving east in association with a depression near the Faeroes. The 500 mb contour analysis for 00 GMT on 17 August (Fig. 6) shows a strong ridge across Germany and the Baltic. The attendant cold pools over Spain and south-west Russia suggest the remnant of a blocking situation.
During the night of 1617 August skies over England, which had been cloudless for several days, became generally cloudy and resulted in a warm night with minima of 17°C at Mount Batten and 16°C at Ross-on-Wye and St. Mawgan. The heat-wave finally broke on the 17th; by the end of the day a new anticyclone was building across the country. It is notable that only four D. W.R. stations reported thunder in association with the cbsing stages of the heat-wave.
The heat wave of July 1969 developed in a very similar fashion to that of August 1973. By 11 July, the Azores High was already moving toward the country and by the 15th was centred over Germany. In the other two cases the situation was somewhat different. With high pressure already over the Continent, a warm front moved across the country from the south-west. A brief anticyclonic
Fig.
364
4. Surface synoptic chart at 1800 GMT on 15 August 1973, based on data in Weather Report
the Daily

Fig. 5. Surface synoptic chart at 1800 o m on 16 August 1973, based on data in the Daily Weather Report
Fig. in Daily
365
development in the warm air, associated with a surface southerly flow, resulted in the high temperatures. It is probable that on both 1 July 1968 and 7 July 1970 the initial advection of warm tropical maritime air was followed by its replacement in the east by Tropical Continental air.
The four heat-waves discussed thus fall into two synoptic groups: A. Warm high moves slowly from Azores across Britain into central
Europe. B. Anticyclonic development from a continental High within the warm
sector of a depression. It is not in the scope of this article to explore the exclusiveness of these two
synoptic types to heat-waves, but the interested reader might care to study the synoptic position of the outstanding heat-waves of 29 June 1957 and 5 July 1959. It is interesting also to compare type B with the ‘Type A’ listed by Lyall(l971) for early warm spells.
If the upper charts are examined it will be seen that there is a high or marked ridge over central Europe in all cases. However, two differences may be noted, viz. :
(i) In those instances listed as type A, there was evidence of cold pools typically associated with blocking situations of the ‘omega’ variety, so named because of the resemblance of the upper air contours to the Greek letter a.
(ii) In type B, there was no evidence of blocking. There was a marked cold trough to the west of Britain, more in evidence than in (i) above. In these cases the upper flow had developed strong meridional characteristics.
In all cases considered the facts are in line with the general features reported by Perry (1967) for hot weather.
Early spring warmth requires the heat of the sun to be concentrated into a very shallow layer by a low-level inversion (see Lyall 1971). That this is not necessarily the case with summer heat is suggested by the ascent from Crawley at 2300 GMT on 16 August 1973 (Fig. 7). The very shallow surface inversion is the result of nocturnal cooling, and there is no real inversion above. Just below 800 mb a shallow isothermal layer may be traced and at the same level the air becomes much drier, indicating the base of anticyclonic subsidence at about 1.5 km altitude.
In summer heat-waves generally, the temperature continues to rise up to the point when the heat-wave breaks and such was the case in all four spells studied here. Whilst this may be partly a cumulative effect of solar heating, it is probably also partly associated with the fact that as the anticyclone recedes and a trough advances, the subsequent straightening of the isobars gives the air a longer ‘fetch’ from and over warm areas. Lamb (1958) considered this factor relevant in his study of very high temperatures. Winstanley (1972) notes that the highest temperatures in the eastern Mediterranean are associated with the ‘sharav’, a hot desert wind which most commonly occurs just ahead of an advanc- ing cold front. It is quite possible that hot air from north Africa is associated
366
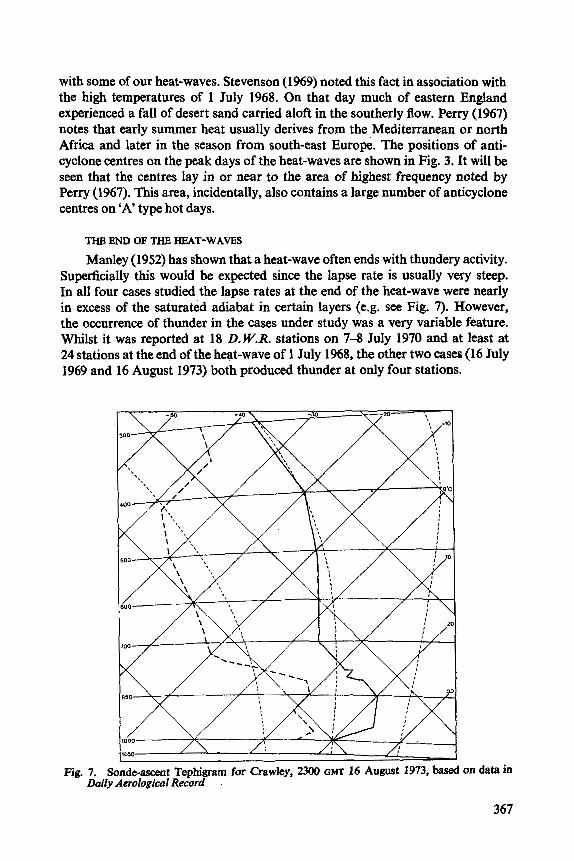
with some of our heat-waves. Stevenson (1969) noted this fact in association with the high temperatures of 1 July 1968. On that day much of eastern England experienced a fall of desert sand carried aloft in the southerly flow. Perry (1967) notes that early summer heat usually derives from the Mediterranean or north Africa and later in the season from south-east Europe. The positions of anti- cyclone centres on the peak days of the heat-waves are shown in Fig. 3. It will be seen that the centres lay in or near to the area of highest frequency noted by Perry (1967). This area, incidentally, also contains a large number of anticyclone centres on 'A' type hot days.
THE END OF THE HEAT-WAVES
Manley (1952) has shown that a heat-wave often ends with thundery activity. Superficially t h i s would be expected since the lapse rate is usually very steep. In all four cases studied the lapse rates at the end of the heat-wave were nearly in excess of the saturated adiabat in certain layers (e.g. see Fig. 7). However, the occurrence of thunder in the cases under study was a very variable feature. Whilst it was reported at 18 D. W.R. stations on 7-8 July 1970 and at least at 24 stations at the end of the heat-wave of 1 July 1968, the other two cases (16 July 1969 and 16 August 1973) both produced thunder at only four stations.
Fig. 7. Sonde-ascent Tephigrarn for Crawley, 2300 GMT 16 August 1973, based on data in Daily Aerological Record .
367
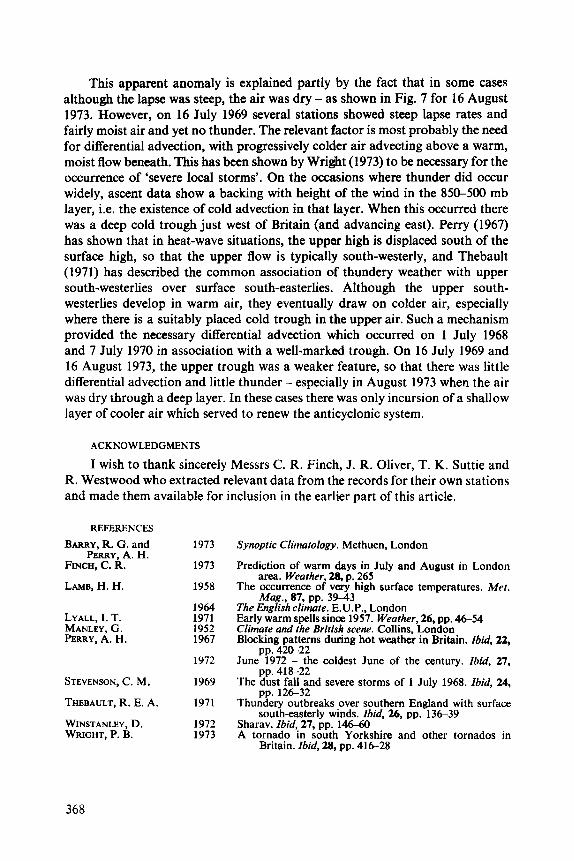
This apparent anomaly is explained partly by the fact that in some cases although the lapse was steep, the air was dry - as shown in Fig. 7 for 16 August 1973. However, on 16 July 1969 several stations showed steep lapse rates and fairly moist air and yet no thunder. The relevant factor is most probably the need for differential advection, with progressively colder air advecting above a warm, moist flow beneath. This has been shown by Wright (1973) to be necessary for the occurrence of ‘severe local storms’. On the occasions where thunder did occur widely, ascent data show a backing with height of the wind in the 850-500 mb layer, i.e. the existence of cold advection in that layer. When this occurred there was a deep cold trough just west of Britain (and advancing east). Perry (1967) has shown that in heat-wave situations, the upper high is displaced south of the surface high, so that the upper flow is typically south-westerly, and Thebault (1971) has described the common association of thundery weather with upper south-westerlies over surface south-easterlies. Although the upper south- westerlies develop in warm air, they eventually draw on colder air, especially where there is a suitably placed cold trough in the upper air. Such a mechanism provided the necessary differential advection which occurred on 1 July 1968 and 7 July 1970 in association with a well-marked trough. On 16 July 1969 and 16 August 1973, the upper trough was a weaker feature, so that there was little differential advection and little thunder - especially in August 1973 when the air was dry through a deep layer. In these cases there was only incursion of a shallow layer of cooler air which served to renew the anticyclonic system.
ACKNOWLEDGMENTS
I wish to thank sincerely Messrs C. R. Finch, J. R. Oliver, T. K. Suttie and R. Westwood who extracted relevant data from the records for their own stations and made them available for inclusion in the earlier part of this article.
REFERENCES
BARRY, R. G. and PERRY, A. H.
FINCH, C. R.
LAMB, H. H.
LYALL, I. T. MANLEY. G . PERRY, A. H.
STEVENSON, C. M.
THEBAULT, R. E. A.
WINSTANLEY, D. WRIGHT, P. B.
1973
1973
1958
1964 1971 1952 1967
1972
1969
1971
1972 1973
Synoptic Climatology. Methuen, London
Prediction of warm days in July and August in London
The Occurrence of very high surface temperatures. Met.
The English climate. E.U.P., London Early warm spells since 1957. Weather, 26, pp. 46-54 Climate and the British scene. Collins, London Blocking patterns during hot weather in Britain. Ibid, 22,
June 1972 - the coldest June of the century. Ibid, 27,
The dust fall and severe storms of 1 July 1968. Ibid, 24,
Thundery outbreaks over southern England with surface
Sharav. Ibid, 27, pp. 146-60 A tornado in south Yorkshire and other tornados in
area. Weuther, 20, p. 265
Mag., 87, pp. 3 9 4 3
pp. 420-22
pp. 418-22
pp. 12632
south-easterly winds. Ibid, 26, pp. 136-39
Britain. Ibid, 28, pp. 416-28
368