appendix a weather observation & analysis...
TRANSCRIPT

ENSC 201: Weather and Climate Winter 2018
A- 1
Appendix A
WEATHER OBSERVATION & ANALYSIS PROJECT
A.1 OBJECTIVE:
To use a case study model to observe, describe and explain Prince George’s weather for a
specified, continuous four-day period. This project is designed to give you experience:
observing and recording weather data using a variety of instruments and techniques
converting measurements into standard weather observations
reasonably dealing with data problems to make a useable data set (rationalizing data)
presenting, graphing, and analyzing data to interpret the weather pattern
integrating all the collected synoptic and local weather data into a concise, well written
report that describes, interprets and explains the weather that occurred over the
observation period.
METHOD: As a weather case study, you will monitor Prince George’s weather for a specified 4-day
period, and gather synoptic data from a variety of sources as indicated below. Monitoring will
involve a combination of group and individual work. Once the data are compiled, each student
will produce a concise, original, individually written report based on the collected data*. Your
report will interpret and explain the observed weather pattern in terms of the synoptic and local
conditions that occurred over the specified 4 days. The observation period and due dates for
each project component are given on the Course Schedule.
During the four-day weather observation period, once per day at an assigned time, you will
make a set of weather observations from an assigned Stevenson screen on the roof of the
Teaching Lab Building. Your observation time and data collection partner(s) will be
determined in the labs several weeks before the start of the observation period. Your team’s
observations will be combined with those from two other groups who measure at other times
each day; these observations form your Stevenson screen’s roof-top dataset. Additionally,
everyone will keep a personal weather diary; and collect electronic local and synoptic data from
publicly available websites. All this information is needed to characterize and explain the
weather that occurred. Here are the details:
1. Roof-top Data Collection: Between six and nine students are assigned to make
quantitative, local weather observations using instruments housed in one of several roof-
top Stevenson screens. Based on personal schedules, you will be grouped with one or two
other students and given a once-a-day, roof-top observation time. At that time, on each of the
4 days of the data collection period, you and your partner(s) will record the weather
observations for your Stevenson screen on a data collection sheet that is stored on the
Teaching Lab roof. Once the observation period is over, this sheet will be available to
everyone who observed from that Stevenson screen.
* As should be expected, submitting a copied report (full or partial) or other forms of plagiarism is academic misconduct and will result in an automatic failure and university sanctions.

ENSC 201: Weather and Climate Winter 2018
A- 2
During each week’s lab, prior to the data collection period, you will learn weather
observation techniques, how to use necessary meteorological equipment, and receive a
handout that details the technique. The lab manual table of contents lists the meteorological
techniques and equipment we use. A synopsis of the entire data collection process follows
under the subheading: Weather Observation Procedures.
2. Personal Weather Diary: You will record your own local qualitative weather and sky
condition observations for the four-day data collection period in the form of a personal
diary. Diary observations are best made when you notice weather changes, and not at the
same time as you make your roof-top observations. At minimum, you must have at least four
observations per day, spread over day and night. Each entry must note your current location
and can be made at personally convenient times. At the end of each day, use your
observations to summarize the day’s weather pattern in a few sentences. At the end of the
four days, write a summary paragraph representing the weather that occurred during the
entire observation period.
Your diary will help you better observe and understand the weather pattern, and note
conditions when you are not making measurements at your roof-top Stevenson screen. It
indicates your impressions of the weather as they happen, and provides qualitative data that
complements the quantitative observations made on the roof. Having evening observations
makes you notice weather changes that occur outside of our roof-top measurement times.
Realize it is not an alternate set of measurements or best guesses at measured values. Also,
each entry need not contain the same set of observations. However, over the course of the
day, it should include multiple observations that indicate the:
dominant weather condition /feature
relative warmth or cold
sky condition (main cloud type/visibility)
precipitation (rain or snow; and when they started or stopped if possible)
wind (strength, approximate direction) and
interpretive comments about the weather. This includes anything you found
interesting (fog, ground frost, lightning, etc.).
You must submit your original hand-written weather diary immediately following the data
collection period. In its original form, it will become your report’s Appendix 1; so plan how
you will record this information in advance, and maintain it as neatly as possible. It must be
possible to attach to your report, and be clear and easily readable.
3. Electronic Local and Synoptic Data: A wide range of local and synoptic weather
information is available from publically available sources. Throughout the course, you will
learn how to gather and interpret this information. You must collect and use some of these
in order to understand and explain the weather that Prince George experienced. The
following are required:
a. UNBC Weather Station (UNBC Wx Stn) Graph: Located on top of the Research Lab
roof, the UNBC Wx Stn is directly across from your roof-top observation site, and
provides 24-hour tracking of similar or complementary weather observations. It, your
Stevenson screen data, and your diary tell you the weather conditions that occurred.
ENSC 201: Weather and Climate Winter 2018
A- 3
The UNBC Wx Stn graph complements but does not replace your roof-top weather
observations. Collect it the end of the observation period so that all 4 days are graphed
on the same image; it is most useful when you can see the entire period at once. The
UNBC Wx Stn graph is available on the course website. Reviewing it as the weather
is happening can improve your understanding of the weather patterns as they occur.
b. Synoptic weather maps allow you to understand and explain the weather events and
their evolution at a regional scale. Synoptic maps provide information about the spatial
extent of weather systems; using a sequence of them shows you the evolution of storms
over time. For this report, the Surface and the 500 hPa analyses maps are the most
useful. You are required to collect all four Surface maps and the one of the 500
hPa map that are produced by Environment Canada each day.
Find Environment Canada weather maps at: http://weather.gc.ca, select Analyses &
Modelling; then under Analyses select Surface, then under Surface Analysis: Mean Sea
Level Pressure. Use the column Complete (Northern Hemispheric coverage) to collect
the maps that have been analyzed by meteorologists (they interpret the preliminary
computer generated pressure maps and draw fronts and other weather data on them so
they are more useful for your understanding). Collect all four maps each day in order to
follow the sequence of changes that occur over our time period.
Similarly the 500 hPa maps are found http://weather.gc.ca, select Analyses & Modelling;
then under Analyses select Upper Air Analyses. Use the Upper Air Analysis list to select
500 hPa: Geopotential height, 1000-500 hPa thickness.
These, and other ways to access the Environment Canada links (and other useful, but
optional information) will be shown in lectures and labs. You are encouraged to look
for other relevant websites but carefully evaluate the type and quality of information.
Remember, forecasts are not useful for this report. You are not predicting the
weather; rather you are documenting and explaining what actually happened.
Like literature references, any material that you don’t personally create must be
properly cited and referenced.
c. Satellite Images show the cloud pattern associated with storms. They complement
weather maps by showing the weather systems drawn on the maps. A sequence of
satellite images taken at about the same time as the Surface Analyses maps is required.
Because satellite images are produced at a much higher frequency than weather maps
collect your satellite images so they match the times of the weather maps and one in
between (i.e. 8 images per day with 4 images matching the Surface map times). Doing
this will allow you to better interpret the synoptic-scale evolution of storms. As with the
weather maps, this information requires proper citation and referencing; ensure you
include original sources if getting these images from websites that compile and post them
from other websites
Environment Canada posts satellite imagery at
http://www.weather.gc.ca/satellite/index_e.html; the GOES West links show our area
well.
ENSC 201: Weather and Climate Winter 2018
A- 4
[These and similar images are also repackaged and displayed on
http://weather.unbc.ca/wxv. Select SATELLITE and choose the IR links; useful are the
GOES-10, and Alaska links (which provide a good view of the weather approaching
northern BC), as well as any of the GOES-W links, which relay the Environment Canada
infrared satellite data. If you use images from this secondary source, be sure to cite and
reference the original source of the images as well]
Collecting and organizing weather maps and satellite images can be confusing.
Gathering these products in “real time” once-a-day but at the same time each day,
works best as Environment Canada overwrites their maps and images as newer ones
are produced. Create a file naming convention that easily organizes these electronic
resources by time and type works best. You should practice finding and organizing
your electronic weather resources before the observation period starts as you will be
busy during the data collection week. Part of the project evaluation is based on how
well you select and use your local and synoptic data in your report.
A.2 WEATHER OBSERVATION PROCEDURES:
Observation techniques and procedures will be learned during labs that precede the observation
period. A practice-run of the entire data collection process will occur before the data collection
week. As indicated, students work in groups to collect weather measurements from an assigned
Stevenson screen at a scheduled time; however everyone must write their own original,
independent, individual case study report.
During the 4-day data collection period, students will work in pairs (or groups of three). Each
group will record their roof-top weather observations at one of these set times: 8 am, noon, and 4
pm (plus or minus 30 minutes). For consistency, you make your observations at the same time
each day using the same set of instruments. Each pair/threesome is responsible for their time
slot’s data collection. Group members are expected to work together when taking measurements.
Exchange cell phone numbers, and make prior contingency plans so you can compensate for each
other if problems arise. There are significant mark deductions for groups/team members that miss
assigned observations.
To collect the complete 4-day data record (i.e. cover all the set times), three different pairs/threes
will form a larger team of six to nine students. The Senior Lab Instructor (SLI) will organize data
collection teams in the labs preceding data collection period to create a feasible observation
schedule. Priority is given to having all group members participate in all of their observation
times. Once the schedule is finalized, copies are posted on the website, at the door to the roof,
and beside the UNBC Weather Display.
Observations must be completed within 30 minutes of the set data collection times. As your group
becomes more efficient, 10 -15 minutes will be long enough to complete all the observations. All
Stevenson screen weather observations are recorded on assigned roof-top data collection sheets
that are attached to clipboards and kept in the Weather Observation room on the roof of the
Teaching Lab Building. Observations are recorded by time with earlier data preceding later
observations. These data collection sheets always remain on the roof. At the end of the data
collection period they go on reserve in the UNBC Library. Accurate instrument reading

ENSC 201: Weather and Climate Winter 2018
A- 5
techniques, care of equipment, observation punctuality, and neat, accurate, legible record keeping
are the keys to successful data collection. Having quality data to analyse will make report writing
much easier and more efficient for everyone.
Students should also keep a personal copy of their roof-top data. We recommend you review
and record the other observations for your Stevenson screen on a personal copy of the data
collection sheet after making your daily roof-top observations. To avoid data entry errors
always copy data from the roof-top sheet onto your personal copy, not the other way around.
Remember to leave space on your personal data sheet, you must write your Stevenson screen’s
observations in time-order (starting with the 8 am timeslot each day). As you copy, check for
observation consistency (e.g. maximum temperatures should be greater than minimum values
for a reading; wet-bulb temperatures are lower or equal to air temperatures; snow or rainfall
data makes sense according to what you recall occurred). If values seem questionable, try to
determine what the error is; ask an instructor to confirm the problem. If there is a problem with
someone else’s observations talk to one of the instructors on the roof to make sure your
understanding of the issue is correct. They may be able to alert the other observers to the
problem and try to correct it before it reoccurs. If you are correct about a data collection
problem, annotate your personal copy of the data collection sheet with comments. After the
data collection week is over, there will be lab time to review the quality of your team’s data
(called data rationalization), and these notes may be helpful. See the project data collection
table at the end of this section for an example of a completed data recording sheet.
To make any weather maps you’ve collected are comparable with your roof-top data you must
interpret chart symbols, and convert the map’s time from Z (zulu), UTC (Coordinated Universal
Time) or GMT (Greenwich Mean Time) – these all mean the same thing – to Pacific Standard
Time (PST). Information on how this is done is given in the labs before the project starts.
Observation Details:
The following summarizes key information for using each roof-top instrument and shows how
to efficiently sequence your observations. Demonstrations and summary handouts are provided
during labs preceding the data collection period (see the Lab Schedule). These handouts form
the later pages of this Appendix. They are also available on the roof, attached to the data
collection clipboards. Refer to these pages to recall specific details while making your weather
observations.
Start data collection by obtaining the Lab Building roof key from the Security Desk. They
know the Weather Project Observation Schedule and will sign out a key to you or your partner(s)
at your assigned time. Bring your student card or other photo identification. Only scheduled
students are allowed on the roof. You must return the key to the Security Desk within half an
hour of obtaining it.
Stop at the second floor on your way up to the roof; record the UNBC Weather Station
Display wind, and mercury barometer readings. Note the time you start taking readings.
Write these on a separate piece of paper and transfer them to your screen’s data collection sheet
when you get to the roof. [You will be most time efficient if you record this information on
your personal data collection sheet (already organized in time-sequence for the 4-day
observation period). However, to minimize transcription errors, ensure that your later
observations are recorded first on the roof-top data collection sheet.]

ENSC 201: Weather and Climate Winter 2018
A- 6
Wind Speed and Direction: These are observed using both visual and instrumented
methods.
Measured Wind – UNBC Weather Station: Measured wind data are displayed in table
form on the second floor UNBC Wx Stn display during the data collection week. These
measurements come from the anemometer located on the Research Building roof with
data displayed on http://weather.unbc.ca/wx/index.html. Record numerical wind speed,
(m/s) and azimuth direction (degrees from north) to the nearest 10 minutes of your
observation time. Try to make your visual wind observations on the roof within the same
10 minutes. Accurately transfer this data onto the roof-top data sheet for your screen.
Visual Wind Observations: When you get on the roof, use the aviation wind sock, and
other visual cues to report the Beaufort number (wind speed), and the anemometer
mounting arm or Library building orientation to report the wind direction as an 8-point
compass reading (N, NE, E, SE, S…etc.). Remember that wind is reported as the
direction it is coming from, and that the anemometer mounting arm and Library are
aligned north-south.
Atmospheric Pressure: Before leaving the second floor, read and record the mercury
barometer’s atmospheric pressure in millimeters (mm) of mercury. Also record the
barometer’s temperature. Ensure this information is accurately transferred onto your
screen’s roof-top data collection sheet. To minimize calculation errors, students will
individually convert all their barometer readings to corrected pressure values (in hPa) so do
not report a converted value on the roof-top data sheet. Information showing how to
convert these readings is presented with the pressure lab and accompanies the barometer.
Walk up to the roof and use the key to get onto the weather observation deck. Close the
door behind you. When making your roof-top observations, propping the door open affects the
thermometers in the nearest Stevenson screens. Open your Stevenson screen only when you are
making measurements. Ensure your Stevenson screen is closed when you are not actually
reading the instruments inside as leaving it open affects the thermometers.
Psychrometer temperature equilibration: To remain liquid, water for the psychrometers is
stored inside the weather equipment room. Psychrometers work by measuring the temperature
change due to evaporation using the difference between the wet and dry-bulb thermometers. Since
evaporation varies for frozen and unfrozen conditions, depending on the air’s temperature different
measuring procedures are used (see Relative Humidity Determination below). If you will use your
+50 to -5 oC psychrometer and it is warmer than the outside temperatures when you arrive,
properly wet its wet-bulb sock and put your psychrometer in your Stevenson screen (i.e. a shaded
place). This will give it time to adjust to outside temperatures before taking your readings. Make
your other observations while waiting for it to equilibrate. If you bring equipment (a water
bottle/sling psychrometer) outside, return them indoors before you leave to prevent them from
freezing solid and possibly cracking.
Air Temperature and Max/Min Temperature: Stevenson screens protect the
thermometers from direct sunlight striking them, as this would elevate their temperature
values. Air temperature is always defined as the temperature taken in the shade. Open your
Stevenson screen, leave the thermometers inside, and take the readings as quickly as
possible to avoid such problems. Read and record the present air temperature from the
mercury level on either the maximum or minimum side of the max/min thermometer (both

ENSC 201: Weather and Climate Winter 2018
A- 7
sides should be within a degree of each other). Record the present air temperature reading
in the correct column. Read the maximum and minimum temperatures at the bottom of
their respective pins and record their values in the correct columns. Properly reset both
pins. Close the Stevenson screen door.
[Tip: Once you have your humidity measurements, check the psychrometer’s dry-bulb
temperature is within 2 degrees of the present air temperature on the max/min thermometer.
They should be consistent with each other at each observation time, and discrepancies larger
than 2 oC should be reported to your instructor and possibly noted in the comments
column.]
Relative Humidity Determination, instructors will advise about which psychrometer to
use:
For non-frozen temperatures, use your screen’s sling psychrometer by wetting the wick,
letting the temperatures equilibrate outside, and then aspirating the psychrometer by
rotating it until temperatures are stabile (this may take 3-5 minutes). Read dry-bulb and
wet-bulb thermometers. Report these temperatures in their correct columns on the data
sheet. (Remember: The present air temperature from the dry-bulb thermometer should be
no more than 2 oC different than the current temperature from the max/min thermometer. If
they are not, check you are reading these correctly. Report problems to your instructor.)
For temperatures well below 0 oC, a cold-air sling psychrometer (reading to -30
oC) will be
used. Instructors will assist with making a wet-bulb ice film and reading this psychrometer
when it is required. There is only one of these instruments. As it is very delicate use it
carefully. With each use, the formation of a thin ice film over the wet-bulb thermometer
sock is required. Once this film is formed, it measures humidity in the same way as a non-
frozen psychrometer. If weather allows, we will demonstrate this procedure in advance of
the data collection week.
Each student must calculate their RH values and report these only on their personal data
collection sheet. As demonstrated in the Humidity Lab, use wet and dry-bulb thermometer
measurements to determine the relative humidity (%) using the psychrometric equation.
For non-freezing conditions use: λover water = 66 Pa oC
-1. For frozen conditions use: over ice =
58.2 Pa oC
-1. Only calculated %RH values are used in your project report. (Estimates of %
RH from psychrometric tables or equipment will not be used for our dataset.)
Precipitation Data: Observe and record any rainfall collected in your rain gauge as
millimeters of water. AFTER taking the measurement (and checking it!) your rain gauge
MUST be emptied. The scale on your rain gauge converts the collected volume (milliliters)
of rainfall into its depth (millimeters) of equivalent rainfall. In addition to measuring the
amount of rainfall, check that the rain gauge opening is not obstructed and that the gauge is
properly put into its holder. If rain freezes in the rain gauges during our observation period,
specific instructions will be given on how to melt it and take accurate measurements.
For snow, use the provided ruler to record the depth of new snowfall in millimeters (mm)
from your screen’s assigned section of the snow bench. Take 3 measurements and record
their average value as the depth of snowfall on your data sheet. Use an undisturbed, non-
wind affected area of your section of the snow. Remember to clear away the snow only
from your section of the snow bench, so you don’t affect someone else’s readings. Once

ENSC 201: Weather and Climate Winter 2018
A- 8
cleared, the next reading represents newly accumulated snow. Each student must convert
their average measured mm of snow depth (from using their ruler) to its precipitation value
or mm of equivalent water by dividing by 10 (as demonstrated in the lab).
Sky Condition and Cloud Observations: Record sky condition, then dominant cloud type
and amount in 8ths
for each layer (high, middle, and/or low). Use the provided information
sheets (in the booklet attached to your clipboard), posters, and/or cloud charts as reference
materials. Use standard abbreviations to report cloud types on the roof-top data sheet.
Record low, middle and high cloud amount as eighths of covered sky. Be consistent with
your sky condition observation. As demonstrated in the labs, imagine grouping the cloud as
a single mass for each height and then estimate the amounts by layer (divide the sky into
halves, then quarters, then eighths to get an estimate). As lower layers will obstruct your
view of what is above them, report only what you can see. Indicate n/a (not applicable) for
the layers you can’t see. When there are no clouds, report the amount as zero (0) eighths
for all layers and list the type as n/a. Our cloud amounts are reported in 8ths
to be consistent
with Environment Canada standards as this is what is reported on weather maps. If you are
using hourly data from airports notice that aviation observation report cloud amounts in
10ths
. Use 8ths
for our roof-top observations and don’t confuse these two forms of cloud
observation.
Comments, Weather and Special Observations: In the Comments column note current
weather phenomena that may aid in interpretation of the data (i.e. currently occurring
precipitation, special conditions such as fog, hoar frost, wind affected by roof-top structures,
etc.). Also note any instrument problems or instrument damage here. MAKE SURE TO ALSO REPORT DAMAGE OR PROBLEMS TO INSTRUCTORS IMMEDIATELY.
Leave the roof-top data collection sheet and clipboard on the roof and return the keys: After recording all your observations, ensure your screen’s data sheet is on the clipboard and
returned to the table in the roof-top weather equipment room. RETURN THE KEY TO SECURITY DESK AFTER YOU HAVE FINISHED YOUR OBSERVATIONS!! During the observation period
instructors will be available to assist with questions about procedures or data.
A.3 SECURITY & SAFETY CONSIDERATIONS:
Weather observations take place on the roof of the Teaching Lab Building. UNBC Security
must be contacted for a key to access the weather instruments on the roof. Security will have a
list of observing times and the students who are authorized to access the roof at those times.
Only ENSC 201 students who are completing their assigned observations are permitted on the
roof. You must return the key within 30 minutes of your observation time. The person signing
out the key remains responsible for it until Security receives it back again. Do not keep keys,
or be late returning them. Missing keys will result in mark deductions and billing of any related
lock replacement costs to those responsible.
STUDENTS ARE NOT PERMITTED BEYOND THE RAILINGS ON THE ROOF. All of the observing
equipment can be accessed and read from the area within the railings. People on the roof can
be observed. Anyone reported or observed acting in an unsafe manner while on the roof will
ENSC 201: Weather and Climate Winter 2018
A- 9
face severe consequences including removal from the project, failure of the project component,
and university sanctions.
Being on the building roof requires additional safety awareness especially regarding STRONG WINDS OR THUNDERSTORMS WHEN NO ONE SHOULD BE ON THE ROOF!! If either of these
events occur during your observing time, only when the wind has diminished, or the
thunderstorm has passed can you access the roof. So, if there is strong wind, thunder, or
lightning you CAN NOT conduct your observations. This may mean that you miss that
observation time. If such an extreme weather event were to occur, instructors will indicate
what to do. However, note it on your personal data recording sheet. This precaution is very
important, as on the roof you are one of the highest points around and you could attract a
lightning strike or be blown off the roof in extreme weather.
A.4 REPORT REQUIREMENTS:
Your report will be written as a case study that presents, describes, and explains the local and
synoptic weather conditions that occurred over our four-day observation period in up to 2000
words (~8 typed double-spaced pages using 12 point font text, and not including figures or
appendices). The report should relate observed conditions to their major controlling factors
such as storm systems, frontal activity, air mass type when relevant, regional air circulation,
and when relevant, local factors such as aspect, moisture, elevation, etc.. Under some weather
patterns, local weather factors can play a larger role than synoptic conditions. Remember,
weather forecast information is NOT relevant to your report.
The report must use your collected weather data to demonstrate your understanding of how the
local and synoptic situation affected the weather Prince George experienced over the 4-day
observation period. Use your analysis to substantiate your explanation, and refer to specific
data, patterns, or trends that support your interpretations. As with all report writing, all maps,
graphs, images, diagrams, and appendices must have captions and be referred to in the body of
your report. These should be used as evidence for your explanation and to clarify and condense
your report writing. Making best use of your resources usually involves generating your own
diagrams, graphs, or maps from the information that you collected so that you can show what
you want to explain. Do not hope that a reader will synthesize graphical information from
poorly organized pre-existing material, or lengthy word descriptions. All non-original
material must be properly cited (in the report body) and referenced (at the end) using the
CSE Name-Year system (ASC 2016). For long references, pages numbers must be
included in the in-text citation. Animations cannot be accepted in the report.
Your writing style must be professional. There is no requirement to follow a specific report
style but you must use headings and subheadings to organize the report. Report organization
must enhance report objectives and make the work easy to follow. Include a title page, table
of contents, introduction, body (which both presents and discusses the data), conclusion,
references, and the two required appendices. The required appendices provide information
that is cumbersome in the report body. Appendix 1 is your original weather diary. Appendix 2
is your original roof data collection sheet and your final, rationalized data set indicating
tracking of the needed data corrections and how you made them.

ENSC 201: Weather and Climate Winter 2018
A-
10
The final document must be corner-stapled with a title page (i.e. no binders, portfolio
covers, etc.). You are required to submit both a paper copy of your complete report and
an electronic version of your report text. Do not worry about scanning non-electronic
components (hand-produced graphs or appendices items) in the electronic submission. The
electronic copy must be uploaded to blackboard by the assignment deadline. Only the
paper copy of your work will be graded.
If you have questions or are unsure about report writing, discuss it with your instructors well in
advance of project deadlines.
Things to keep in mind: This is a case study: an original, concise, individually written description, interpretation,
and explanation of the observed weather in terms of the synoptic and local conditions for
the observation period.
It is based on your analysis of the data that is presented in accompanying graphs, charts,
maps, and images that display your data and enhance your explanation. Each figure must
have a caption, be numbered, and be referred to in the body of your report. Figures should
be embedded in the body of your report near the corresponding text. Part of your
evaluation is based on how you choose to present your material. Remember, figures are
there to make it easy for the reader to absorb your information, to see and provide
evidence for the relationships indicated by your data, or to demonstrate specific
phenomena. Be selective and careful to use only weather information that describes the
current weather patterns and how they are changing. This often means that you create,
annotate or redraw your own variations of original images that better express the idea you
are discussing; it usually also means that many of your collected images are not used. So,
do not include every collected map, image, or piece of data in your report. We want you
to analyze and interpret maps or data sets, extract relevant information, and report only
what assists your report. Use a map or image if you feel referring to it will enhance your
interpretation and discussion. A bunch of maps with little discussion or no relevant
interpretation detracts, rather than adds to the quality of your report. Note, that neat hand-
drawn diagrams are better than computer-generated graphics that do not show the points
you are trying to make. We prefer you focus on report content and not on manipulating
computer graphics for this report. Unless the figure is something you produced yourself,
you must cite the original source for the figure in the caption, and list this in the reference
section of your report.
Appendices:
Appendix 1: your original hand-written weather diary. But realize that you should use this
information in the report body by extracting relevant observations that support your
interpretation and put them in a summarizing table (or other creative form of data
presentation - graphs, diagrams, etc.).
Appendix 2: your raw data sheet showing the information that was collected in its original
form, and your final (rationalized) data sheet, neatly presented for easy reading
(conversions and corrections etc. done, problems and errors noted/corrected). Here you
must also clearly indicate the details of any quality control measures you may have had to
use in order to make sense of your data.

ENSC 201: Weather and Climate Winter 2018
A-
11
If there are other non-essential images / maps / graphics, etc. that you think may be of
interest to a reader but they are not necessary to explain your report points, you may include
them in appropriately labeled and captioned additional appendix/appendices. However,
think very carefully about whether to include additional items in appendices; often they are
better left out or included in the report body. Ensure you are not padding your report with
poorly related or unneeded information. We encourage you to ask an instructor for advice
if you are not sure how to use appendices.
A.5 REPORT EVALUATION:
The Weather Observation and Analysis Project is worth 30% of the course grade: Pre-
report data collection /analysis work is worth 10%; the written report is worth 20%. A
detailed mark breakdown will be given during the course.
The 10% pre-report mark is based on the quality of your:
Data collection during the observation period: Roof top observations (2%), personal weather
diary (2%), electronic data sources (1%), teamwork evaluation (1%). [ total 6%]
A ziplock bag (provided in the lab) containing your: Teamwork evaluation form, personal
weather diary, and electronic data sources organized on a USB key, are due in your drop box
the Monday following the observation week (details on the course schedule).
Data quality control /data rationalization: Review your data for errors, report them, rectify
them wherever possible and indicate how you resolved your data problem(s). This forms
Appendix 2 of your report and will be done in lab following the observation period. [1%]
Stacked time series graph, based on your final dataset (done in lab). [1%]
Report Outline Meeting: Meet with an instructor to verbally review your analysis and
explanation of the weather that occurred over the observation period and your report
organization. [2%]
The 20% report mark is based on the quality of your:
Analysis: Manipulating and displaying your data in a way that aids your explanation (e.g.
your time series graph, annotated synoptic maps /drawings /photos, data summarizes in
charts, tables, or graphs, etc.).
Explanation and interpretation of the weather that occurred. Use your data and analysis to
support your interpretation. Indicate your understanding of the weather that affected Prince
George over the four-day observation period and why it occured.
Presentation and organization of your report (e.g. having required report elements; using them
appropriately, organizing them so make the report easy to follow and meet the report’s
objectives, writing quality; grammar; spelling).
Referencing and citations (e.g. in-text citations in the report body, references cited list at the
end of the report, using the CSE Name-Year system, including page numbers for longer works).
Work: It is possible to earn up to 2% in bonus marks for excellence or originality in your
analysis, presentation, and/or explanation. Impress us!
ENSC 201: Weather and Climate Winter 2018
A-
12
A.6 SUGGESTIONS FOR REPORT WRITING:
Titles, a table of contents, headings, subheadings, and appendices help to organize a report and
make it more coherent. All non-original information must be cited using in-text citations and
an end-of-document reference list that follows the CSE Name-Year system as documented in
the UNBC Academic Success Centre handout (ASC 2016), and practiced in the lecture
assignment. If you are missing data, speak to an instructor as soon as possible to see what can
be done. As this is an individual report, copying another student’s data, figures, graphs, etc. in
your report is not allowed and will be considered cheating – an academic offense that will get
you into trouble. Plagiarism is another academic offense to be avoided. Electronic submission
is required to check for these issues.
You should use text, tables and figures (e.g. graphs, diagrams, maps, charts, and illustrations) to
describe and explain the observed weather pattern and relate it to the synoptic situation. Often
a well placed, annotated, and captioned figure describes or explains a concept much better than
a lot of text. Graphs also condense a lot of information and provide a pictorial representation of
data relationships. Remember, the report writer’s job is to provide information and explanation
for the reader in the most accessible way; use the most appropriate format(s) for your objective.
Review the following graph related concepts and questions, to help you decide how, when, and
where to use graphs in your project.
What are your reasons for graphing data?
What are the advantages and disadvantages of a particular style of graphing (i.e.
multiple graphs, multiple categories of data, time series, selecting only particular data,
etc.)? Does it aid your interpretation of the weather? How?
How do you choose axis dimensions, and their placement and orientation on the page?
How do you represent gaps in your data (i.e. when there are no data overnight?
Sometimes authors use dashed lines to represent interpolated data, or data gaps along an
axis.). Pay close attention to the time axis when representing gaps in time.
How should you distinguish different data points on your graph?
Should you place multiple graphs or images on a single page? Which ones go together?
What are the advantages and disadvantages?
How should figure labels, titles, captions, and citations be used to properly represent
your diagrams and graphs?
Make sure all figures, graphs, and tables are numbered and accompanied by captions with
sources cited and listed in the references section. All figures and tables must be referred to,
discussed, and/or explained within the body of the report; sometimes you can do this for a
group of related figures to streamline your writing. When using figures, graphs, and tables
rather than describe what the reader can see (this makes them redundant) highlight what you
want the reader to remember after viewing the image.
Data quality control is a required component in any data-driven report. When presenting
your data, you must consider sources of error that would affect your interpretation of the
weather that occurred. Major data reliability issues and human or instrument errors should
be discussed briefly in the report body. Otherwise, it is not necessary to discuss errors in

ENSC 201: Weather and Climate Winter 2018
A-
13
great detail in the report body because you must assess, resolve, and document in Appendix
2, the specific details of your error issues in a data rationalization (quality control) process.
The data rationalization process will be discussed and demonstrated in detail in the lab after
you have collected your data. This is a graded component of the project with the grades
specified in your course syllabus.
As developing writers, we encourage you to discuss your writing questions with your
instructors. To aid in this dialogue, you must briefly meet with a course instructor and verbally
outline your report - the story of the weather that occurred over the observation period; review
the supporting information you plan to use in your report; and discuss how you plan to organize
and write it. Lab time is made available for this; we have allowed about 15 minutes per person.
This meeting is a required element of the report writing process that is graded (see syllabus for
amount). Instructors have found that this discussion helps students organize and clarify/confirm
their thoughts early in the writing process, and helps students write their reports more
efficiently and correctly.
Finally, remember to leave time to edit and critically review your report before turning it in.
You want to ensure that you have met the report requirements, organized the material well,
expressed yourself in easily understood ways, and eliminated typographical and grammatical
errors. Use this document and the report marking sheet information* to check you are
meeting report requirements. Make sure to leave enough time to ask for instructor advice
should you have questions. Note that instructors will meet and discuss any aspect of the
project with you, including answering specific writing or content questions; but they will not
review or edit your report for you prior to turning it in.
A.7 REFERENCES & OTHER INFORMATION SOURCES:
In addition to the websites discussed here and handouts given in class, these resources are
useful:
Ahrens CD, Jackson PL, Jackson CEJ. 2016. Meteorology Today: An introduction to weather,
climate and the environment. 2nd
Canadian Edition. Toronto: Nelson Education.
(Appendices, Cloud Chart at the back of the text, Chapter 11, 12 and 15 – content on air
masses, fronts, storms, and weather forecasting. Use the index for other relevant pages).
[ASC] Academic Success Centre. 2016. CSE Style. [accessed 2018 January 25].
https://www.unbc.ca/sites/default/files/sections/academic-success-
centre/csestyle2016.pdf
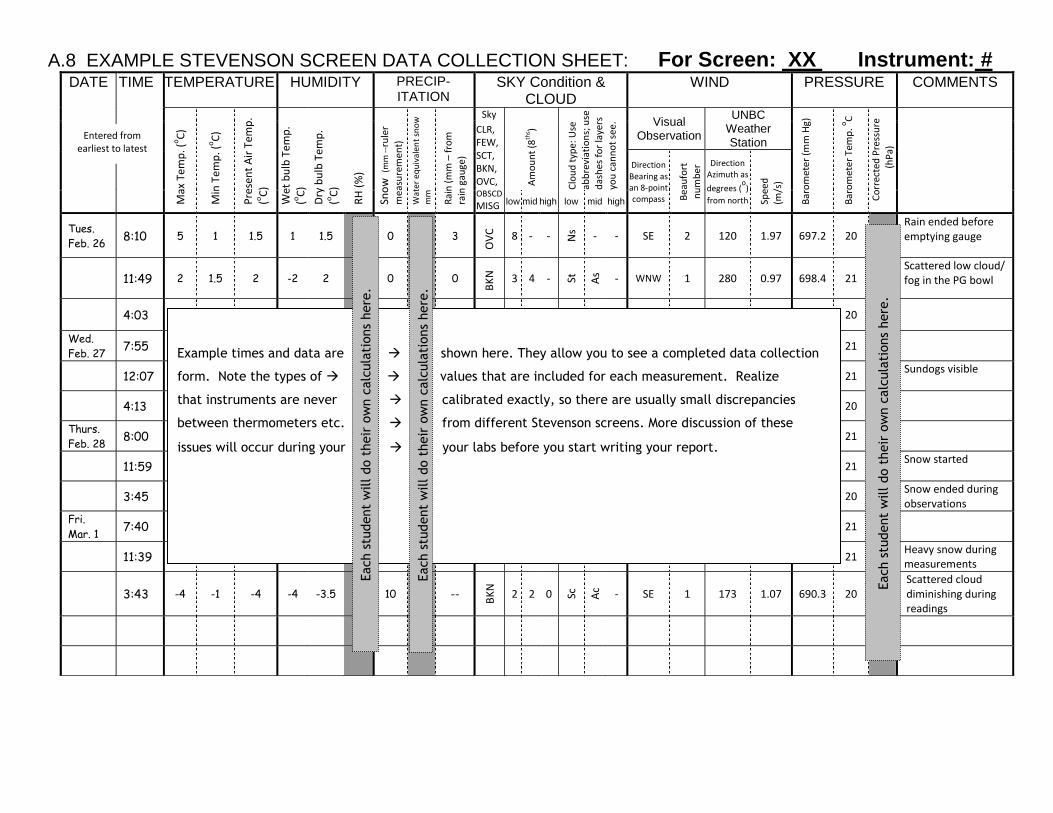
A.8 EXAMPLE STEVENSON SCREEN DATA COLLECTION SHEET: For Screen: XX Instrument: # Winter 2018 Screen Instrument
DATE TIME TEMPERATURE HUMIDITY PRECIP-ITATION
SKY Condition & CLOUD
WIND PRESSURE COMMENTS
Max
Tem
p. (
oC
)
Min
Tem
p. (
oC
)
Pre
sen
t A
ir T
emp
.
(oC
)
Wet
bu
lb T
emp
. (o
C)
Dry
bu
lb T
emp
.
(oC
)
RH
(%
)
Sno
w (
mm
--r
ule
r
mea
sure
men
t)
Wat
er e
qu
ival
ent
sno
w
mm
Rai
n (
mm
– f
rom
ra
in g
auge
)
Sky
Am
ou
nt
(8th
s )
Clo
ud
typ
e: U
se
abb
revi
atio
ns;
use
d
ash
es f
or
laye
rs
you
can
no
t se
e. Visual
Observation
UNBC Weather Station
Bar
om
eter
(m
m H
g)
Bar
om
eter
Tem
p. o
C
Co
rrec
ted
Pre
ssu
re
(h
Pa)
CLR, FEW, SCT, BKN, OVC, OBSCD MISG
Direction Bearing as an 8-point compass B
eau
fort
n
um
ber
Direction Azimuth as
degrees (o)
from north Spee
d
(m/s
)
low mid high low mid high
Tues.
Feb. 26 8:10 5 1 1.5 1 1.5
0
3
OV
C
8 - - Ns - - SE 2 120 1.97 697.2 20
Rain ended before emptying gauge
11:49 2 1.5 2 -2 2 0 0
BK
N
3 4 - St
As - WNW 1 280 0.97 698.4 21
Scattered low cloud/ fog in the PG bowl
4:03
20
Wed.
Feb. 27 7:55
21
12:07
21 Sundogs visible
4:13
20
Thurs.
Feb. 28 8:00
21
11:59
21 Snow started
3:45
20 Snow ended during
observations
Fri.
Mar. 1 7:40
21
11:39
21 Heavy snow during
measurements
3:43 -4 -1 -4 -4 -3.5 10 --
BK
N
2 2 0 Sc
Ac - SE 1 173 1.07 690.3 20
Scattered cloud diminishing during readings
Ea
ch
stu
de
nt
will
ca
lcula
te th
eir o
wn
va
lues f
rom
th
e r
eco
rded
obse
rva
tion
s.
Each s
tudent
will do t
heir
ow
n c
alc
ula
tions
here
.
Entered from earliest to latest
Example times and data are shown here. They allow you to see a completed data collection
form. Note the types of values that are included for each measurement. Realize
that instruments are never calibrated exactly, so there are usually small discrepancies
between thermometers etc. from different Stevenson screens. More discussion of these
issues will occur during your your labs before you start writing your report.
Each s
tudent
will do t
heir
ow
n c
alc
ula
tions
here
.
Each s
tudent
will do t
heir
ow
n c
alc
ula
tions
here
.