solar system for a long endurance electric uav
TRANSCRIPT
UNIVERSIDADE DA BEIRA INTERIOR Engenharia
Solar System for a Long Endurance Electric UAV
Joana Carlota Caires Sousa
Dissertação para obtenção do Grau de Mestre em
Engenharia Aeronáutica (Ciclo de estudos integrado)
Orientador: Professor Doutor Pedro Vieira Gamboa
Covilhã, outubro de 2015

ii
iii
Acknowledgments
I would like to thank my supervisor Doctor Pedro Gamboa for his technical guidance and
knowledge of aircraft design. A special acknowledgement to Pedro Santos and Pedro Alves for
their friendship and support throughtout my dissertation work.
Mário, for his endless patience.
Dad, you were there whenever I needed someone to talk, and you have been a great father and
friend to me. Finally, to my mother for having supported me during all these years, for her
patience, kindness and love.

iv
v
Resumo
Os combustíveis fosséis, carvão, petroléo e gás natural, constituem a maior parte das fontes de
energia primária a nível mundial. Sendo a energia essencial ao bem-estar da população e ao
desenvolvimento da sociedade, produzir e utilizar energia de forma sustentável é vital para a
humanidade. Porém, a dependência de combustíveis fosséis é demasiado elevada e sendo esta
uma fonte limitada na natureza, é necessário contrariar o seu uso nos diversos setores. Na
Indústria Aeroespacial a utilização de painéis solares é uma alternativa executável.
Esta Dissertação de Mestrado inclui um plano concetual de um sistema propulsivo elétrico,
destinado a um UAV com uma envergadura de 4,5 m e um peso de aproximadamente 52 N. A
construção deste sistema é particularmente diferente dos métodos convencionais de propulsão,
pelo que o seu projeto e dimensionamento dependem especialmente da energia disponível
armazenada na bateria, e da potência gerada pelos painéis solares.
Devido à variação da intensidade de radiação solar em diferentes zonas do país e do ano, foi
elaborado um plano de testes experimentais para verificar a viabilidade do sistema. Estes testes
demonstram que a potência disponível é especialmente influenciada pelo eixos vertical e
longitudinal, dados por arfagem e pranchamento. Embora seja uma aeronave de pequenas
dimensões, a asa para além da sua função aerodinâmica, possui uma zona adequada aquando a
colocação das células solares, deste modo, recorrendo uma diferenciação de segunda ordem é
demonstrado que esta colocação seria ideal a 1,5 cm do bordo de fuga.
Ainda, uma simulação da missão foi realizada no Túnel de Vento da Universidade da Beira
Interior atingindo o seu propósito com sucesso. Portanto, é estudado o posicionamento
apropriado dos módulos solares, desenvolvido um método de fixação à Estrutura Alar e
projetado o circuito elétrico de modo a realizar um voo sustentável.
Palavras-chave
UAV, Indústria Aeroespacial, Propulsão elétrica, Radiação Solar, Voo Sustentável

vi
vii
Abstract
Fossil fuels such as coal, oil and natural gas, are the worldwide primary energy resources.
Energy is essencial to the peoples’ well-being and society development, as it is known today
and expected in the future to produce and use energy in a sustainable way is vital to our
civilization. However, dependence on fossil fuel is awfully high and it is necessary to hinder
their use in several industries as it is a limited resource. In the Aeroespace Industry solar
energy has been gaining widespread development, becoming the solution to many negative
factors. This Master Thesis includes a conceptual design of an electric propulsion system for a UAV with
a wingspan of 4.5 m and a weight of approximately 52 N. The construction of this system is
different from conventional propulsion methods, so the design and sizing rely on the available
energy stored in the battery and the power generated by the solar panels. As solar radiation is
different throughout the year, a plan for experimental tests was drafted to verify the system
viability. Experiments show that exact azimuth orientation is not critical, vertical axis given by
pitch and roll, have a more important effect on performance. Although it is a small aircraft,
the wing beyond its aerodynamics function, has a proper zone where solar cells should be
placed. Appealing to a second order differentiation it is possible to determine that solar panels
should be placed at 1.5 cm from the trailing edge affecting as little as possible the airfoil. A mission simulation was done to understand the propulsion system feasibility. Although, the
eight hour sustainable-flight was not possible to replicate the motor still ran for 5 hours, being
the battery charged during cruise phase as pretended. Therefore, proper solar cells placement,
development of a mounting method and electrical circuit design are carried out in order to
allow the UAV to achieve a sustainable-flight.
Keywords
UAV, Aeroespace Industry, Electric propulsion, Solar Radiation, Sustainable-Flight.

viii

ix
Contents
Acknowledgments ............................................................................................. iii
Resumo .......................................................................................................... v
Abstract........................................................................................................ vii
Contents ........................................................................................................ ix
List of Figures ................................................................................................. xi
List of Tables ................................................................................................ xiii
Glossary ........................................................................................................ xv
Nomenclature ............................................................................................... xvii
Chapter 1 ........................................................................................................ 1
Introduction ..................................................................................................... 1
1.1 Motivation ............................................................................................... 1
1.2 Objectives ............................................................................................... 1
1.3 Structure of the Document........................................................................... 1
Chapter 2 ........................................................................................................ 3
State-of-art ..................................................................................................... 3
2.1 Unmanned Aerial Vehicle............................................................................. 3
2.2 Solar Energy ............................................................................................ 3
2.2.1 The Photovoltaic Effect ......................................................................... 3
2.2.3 Photovoltaics Industry .............................................................................. 5
2.2.3.1 Solar Cells Evolution .......................................................................... 5
2.4 NREL’s world wide best research in laboratory .................................................. 8
2.5 History of Unmanned Aerial Vehicles .............................................................. 9
Chapter 3 ...................................................................................................... 15
Aircraft Description and Mission........................................................................... 15
3.1 Solar UAV Mission .................................................................................... 15
3.2 Aircraft Specifications .............................................................................. 16
3.3 Electric Propulsion System with Solar Energy .................................................. 18
Chapter 4 ...................................................................................................... 21
Solar Module, Solar Panel and Solar Array Arrangement. ............................................ 21
4.1 Solar Panel ............................................................................................ 21
4.1.1 Efficiency ........................................................................................ 22
4.1.2 Current and Voltage Solar Cell .............................................................. 22
4.2 Solar Array ............................................................................................ 24
4.2.3 Solar Cells Flexiblity .............................................................................. 26
x
Chapter 5 ...................................................................................................... 29
Propulsion System Components, Electric Configuration and Installation on the Wing .......... 29
5.1 Propulsion System components.................................................................... 29
5.1.1 Solar Panel ...................................................................................... 30
5.1.2 Solar Charge Controller (SCC) ............................................................... 30
5.1.3 Battery ........................................................................................... 31
5.1.4 Electronic Speed Controller (ESC) .......................................................... 31
5.1.5 Electric Motor and Propeller ................................................................. 32
5.2 Electric Configuration .......................................................................... 32
5.2.1 Solar Panel- Charge Controller (Genasun GV-10) ......................................... 32
5.2.2 Charge Controller-Battery .................................................................... 33
5.2.3 Battery-Motor ................................................................................... 34
5.3 Installation of the Solar Arrays on the Wing .................................................... 34
Chapter 6 ...................................................................................................... 37
Solar Arrays Experiments ................................................................................... 37
6.1. Pyranometer ......................................................................................... 37
6.1.1 Operation and Measurement ................................................................. 37
6.2 Solar Power Measurements......................................................................... 38
6.2.1 Solar irradiance measurement ............................................................... 38
6.2.2 Typical I-V Efficiency Curve .................................................................. 39
6.2.3 MPPT working method ........................................................................ 40
6.3 Effect of transparent film Covering on Efficiency ............................................. 41
6.4 Effect of Temperature on Efficiency ............................................................. 42
6.5 Solar angles-of-incidence .......................................................................... 43
6.5.1 The Axes of Flight .............................................................................. 43
6.5.2 Azimuth Angle .................................................................................. 44
6.5.3 Solar experiments .............................................................................. 44
6.5.4 Loiter Pattern Simulation .................................................................... 50
Chapter 7 ...................................................................................................... 52
Mission Simulation ........................................................................................... 52
Chapter 8 ...................................................................................................... 58
8.1 Conclusion ............................................................................................. 58
8.2 Future Work .......................................................................................... 59
Annex .......................................................................................................... 62
Appendix A ................................................................................................. 62
xi
List of Figures
Figure 2.1- Photovoltaic Solar Panel Working Principle 4. .............................................. 4
Figure 2.2- Production process for typical crystalline silicon solar cells 6. .......................... 6
Figure 2.3- World Wide Best Research cell efficiencies over the last 40 years in laboratory 8. . 8
Figure 2.4- Sunrise II, 1975 11. ............................................................................... 9
Figure 2.5- Pathfinder in Flight over Hawaii 12. ........................................................ 10
Figure 2.6- Pahtfinder- Plus in flight over Hawaii13. ................................................... 10
Figure 2.7- Centurion, 1997-1999 14. ..................................................................... 11
Figure 2.8- Helios, 1999-2003 15. .......................................................................... 11
Figure 2.9- Zephyr 7, 2010 17. ............................................................................. 12
Figure 2.10 – Solar Impulse 2 in Abu Dhabi 19. .......................................................... 13
Figure 3.1 - 12% airfoil non-dimensional coordinates. ................................................ 17
Figure 3.2 - CAD drawing views of UAV 21. .............................................................. 19
Figure 3.3- CAD Rendering of UAV 21. .................................................................... 19
Figure 4.1- C60 Solar Cell and Bond Pad Dimensions 22. .............................................. 21
Figure 4.2- Example of an I-V curve characteristcs of PV module 23. .............................. 22
Figure 4.3-Sunpower C60 typical I-V Curve 22. .......................................................... 23
Figure 4.4- Effect of temperature on the I-V characteristics of a solar cell 24. .................. 23
Figure 4.5- Upper Wing Surface using non-dimensional coordinates. .............................. 26
Figure 4.6- Sixth degree polynomial approximation. .................................................. 26
Figure 4.7- Second order differentiation with non-dimensional coordinates. .................... 27
Figure 4.8- Solar panel placed on the central module of wing. ..................................... 28
Figure 4.9- Solar panel placed at 1.5 cm from the trailing edge. ................................... 28
Figure 5.1- Electric Propulsion Configuration Scheme. ............................................... 29
Figure 5.2- Sunpower C60 Photovoltaic Solar Cell 22. ................................................. 30
Figure 5.3- MPPT Solar charge controller Genasun GV-10 25. ........................................ 31
Figure 5.4- Solar Panel connect to the Charge controller 25. ........................................ 33
Figure 5.5- Charge controller connect with battery 25. ............................................... 33
Figure 5.6- Battery- Motor connection 26. ............................................................... 34
Figure 5.7- Solar modules integration view on the wing. ............................................. 35
Figure 5.8- Module (a) and (b) wired with a JST connecter. ......................................... 35
Figure 5.9- Module (b) wired with a bullet and a XT30 connecter. ................................. 35
Figure 5.10- Module (b) and (c) wired with a JST connecter. ....................................... 36
Figure 6.1- SP-215 Apogee pyranometer connected to a multimeter and a battery. ........... 38
Figure 6.2- Efficiency I-V Curve at different Irradiance values. ..................................... 39
Figure 6.3- Power Output Evolution. ..................................................................... 40
xii
Figure 6.4- Variation of the current to voltage curve of a solar array with Irradiance and
Temperature. ................................................................................................. 42
Figure 6.5- Two I-V curves at different temperatures. ............................................... 43
Figure 6.6- Aicraft Axes Flight illustration 28. .......................................................... 44
Figure 6.7- Influence of different azimuth angles on irradiance and power ouput. ............. 46
Figure 6.8- 0º and 45º azimuth with different combinations of pitch and roll. ................... 47
Figure 6.9- 90º and 135º azimuth with different combinations of pitch and roll. ................ 47
Figure 6.10- 180º and 225º azimuth with different combinations of pitch and roll. ............. 48
Figure 6.11- 270º and 315º azimuth with different combinations of pitch and roll. ............. 48
Figure 6.12- Pitch angle effect on power ouput. ...................................................... 49
Figure 6.13-Roll angle effect on power ouput .......................................................... 49
Figure 6.14- Loiter pattern simulation. .................................................................. 51
Figure 7.1 – University Beira Interior’s wind tunnel used during mission simulation. ........... 52
Figure 7.3- Power log placed between Battery and Charge Controller. .......................... 53
Figure 7.2- Mission simulation using wind tunnel. ..................................................... 53
Figure 7.4-Solar module attached to wing prototype for mission simulation. .................... 53
Figure 7.5 – Electric power required and supplied during mission simulation. ................... 54
Figure 7.6- Consumed energy and supplied energy during mission simulation. .................. 55
Figure 7.7- Irradiance values and power ouput according to day time. ........................... 55
xiii
List of Tables
Table 3.1 – Energy requirements for propulsion system. ............................................. 16 Tabela 3.2- Solar UAV specifications. .................................................................... 16
Table 3.3- Summarized UAV estimated performance data. .......................................... 18
Tabela 5.1- Electrical Characateristc of a Typical cell C60 at standard Test Conditions.22 .... 24
Table 5.2- Solar Panel characteristics. .................................................................. 24
Table 5.3 – PV module specification datasheet. ....................................................... 25
Table 7.1- Results of the film covering experiments. ................................................. 41
Table 7.2 – Simulated Azimuth Angles. .................................................................. 45

xiv
xv
Glossary
CPV Concentrating PV
CZ Czochralski
DOD Departament of Defense
ERAST Environmental Research Aircraft Sensor Technology
Group III Chemical elements of group 13 of the periodic table
Group V Chemical elements of group 15 of the periodic table
JST Japan Solderless Terminal
MJ Multijunction
MPPT Maximum Power Point Tracker
NREL National Renewable Energy Laboratory
OPV Organic PV
PV Photovoltaic
STC Standard Test Conditions
UAV Unmanned Aerial Vehicle

xvi
xvii
Nomenclature
𝐴 Solar cell area
𝑎– 𝑆𝑖 Amourphous Silicon
𝑎– 𝑆𝑖: 𝐻 Hydrogenated amourphous Silicon
𝑏 Wingspan
𝑐 Wing mean chord
𝐶𝑑𝑇𝑒 Cadium Telluride
𝐶𝐼𝐺𝑆 Cooper indium gallium selenide
𝐶– 𝑠𝑖 Crystalline Silicon
𝑑 Travelled distance
𝐷𝑠𝑡𝑎𝑔𝑒 Aircraft drag
𝐼𝑚𝑎𝑥 Maximum Solar Irradiance
𝐼𝑀𝑃𝑃 Nominal power Current
𝐼𝑆𝐶 Short-Circuit Current
𝐸𝑟𝑒𝑞 Propulsive energy required
𝑔 Gravitational constant
𝜂𝐵 Battery efficiency
𝜂𝐶 Cables efficiency
𝜂𝐸𝑆𝐶 Electronic speed controller efficiency
𝜂𝑃𝑠𝑡𝑎𝑔𝑒 Propeller efficiency
𝜂𝑀𝑠𝑡𝑎𝑔𝑒 Electric motor efficiency
𝜂𝑠𝑡𝑎𝑔𝑒 Total componentes efficiency
𝜂𝑃𝑉 Solar cell efficiency
𝑃 Power
𝑝 Perimeter of a circular turn
𝑃𝑚𝑎𝑥 Solar cell maximum power ouput
𝑃𝑀𝑃𝑃 Nominal Power
𝑃𝑟𝑒𝑞 Propulsive required power
𝑅𝑠ℎ Shunt resistance
𝑆𝑟𝑒𝑓 Wing area
𝑡 Duration of a full lap loiter pattern
xviii
𝑡𝑠𝑡𝑎𝑔𝑒 Duration of each stage
µ𝑐 − 𝑆𝑖: 𝐻 Microcrystalline Silicon
𝑣 Aircraft average cruise speed
𝑉𝑀𝑃𝑃 Nominal power Voltage
𝑉𝑂𝐶 Open-Circuit voltage
𝑣𝑠𝑡𝑎𝑔𝑒 Each stage aircraft speed
𝑊 Take-off weight
𝜑 Pitch angle
1
Chapter 1
Introduction
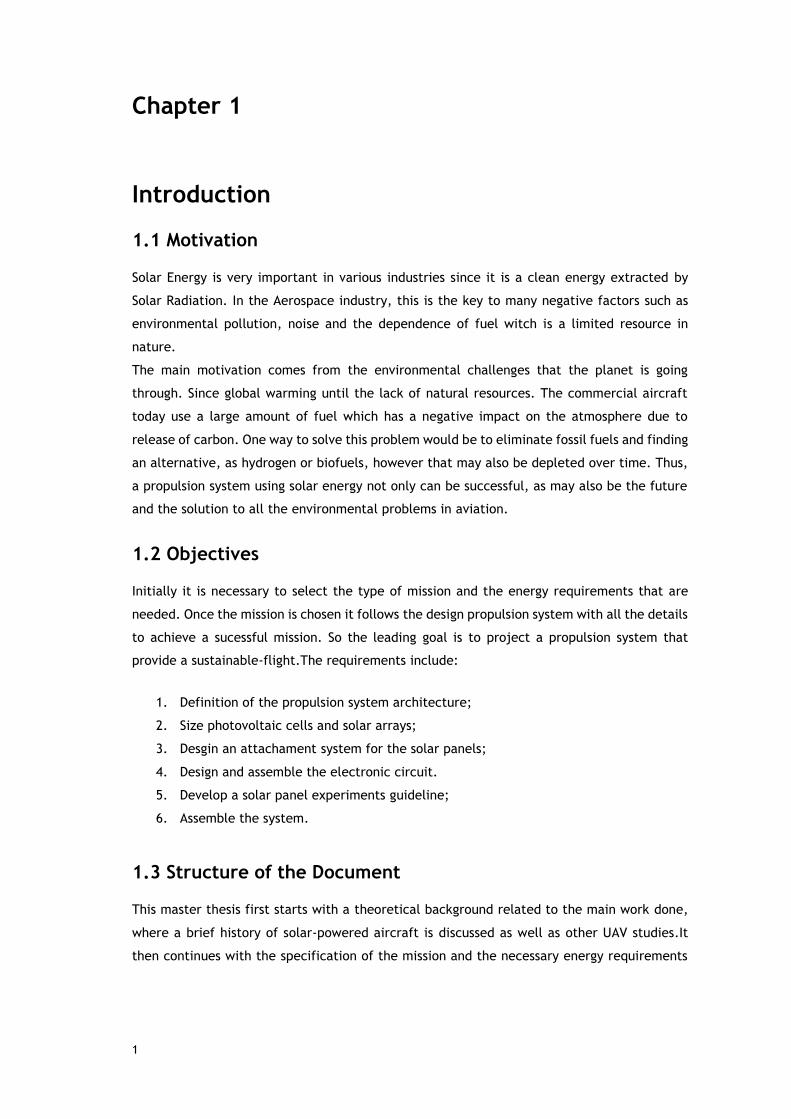
1.1 Motivation
Solar Energy is very important in various industries since it is a clean energy extracted by
Solar Radiation. In the Aerospace industry, this is the key to many negative factors such as
environmental pollution, noise and the dependence of fuel witch is a limited resource in
nature.
The main motivation comes from the environmental challenges that the planet is going
through. Since global warming until the lack of natural resources. The commercial aircraft
today use a large amount of fuel which has a negative impact on the atmosphere due to
release of carbon. One way to solve this problem would be to eliminate fossil fuels and finding
an alternative, as hydrogen or biofuels, however that may also be depleted over time. Thus,
a propulsion system using solar energy not only can be successful, as may also be the future
and the solution to all the environmental problems in aviation.
1.2 Objectives
Initially it is necessary to select the type of mission and the energy requirements that are
needed. Once the mission is chosen it follows the design propulsion system with all the details
to achieve a sucessful mission. So the leading goal is to project a propulsion system that
provide a sustainable-flight.The requirements include:
1. Definition of the propulsion system architecture;
2. Size photovoltaic cells and solar arrays;
3. Desgin an attachament system for the solar panels;
4. Design and assemble the electronic circuit.
5. Develop a solar panel experiments guideline;
6. Assemble the system.
1.3 Structure of the Document
This master thesis first starts with a theoretical background related to the main work done,
where a brief history of solar-powered aircraft is discussed as well as other UAV studies.It
then continues with the specification of the mission and the necessary energy requirements
2
to provide a sustainable-flight. Once the mission and the energy requirements are selected it
follows the Propulsion System Architecture, in which, each different component of the solar
powered system is described. On a following stage, it is studied the appropriate position of
the solar cells on the wing and a found a method to mount them.
As it is expected, solar radition is different throughout the year, for this reason some
experimental tests are conducted and reported. The results from the experiments are then
compared with solar cells values concebed in a laboratory environment. This chapter enable
to determine the solar cells efficiency and validate the propulsion system.
To finish, the conclusions will be stated at the end of this document as well as some
considerations about future work.

3
Chapter 2
State-of-art
The achievement of a solar powered aircraft capable of continuous flight was still a dream
some years ago, but this great challenge has become feasible today. In fact, significant
progresses have been realized recently in the domains of flexible solar cells and high energy
density batteries. In this section, a brief history of solar-powered aircraft will be discused, as
well as other UAV studies that have been done over the last 40 years.To understand the history
of solar- powered flight, a discussion of solar cells is also required.
2.1 Unmanned Aerial Vehicle
According to the Department of Defense of the United States of America1 an unmanned
aerial vehicle is defined “as powered, aerial vehicles that do not carry a human operator,
use aerodynamic forces to provide vehicle lift, can fly autonomously or be piloted remotely,
can be expendable or recoverable, and can carry a lethal or nonlethal payload. Ballistic or
semi-ballistic vehicles, cruise missiles, and artillery projectiles are not considered UAV by
the DOD definition. UAVs are either described as a single air vehicle (with associated
surveillance sensors), or a UAV system, which usually consists of three to six air vehicles, a
ground control station, and support equipment.”
2.2 Solar Energy
The most plenteous energy resource that exists in the world is Solar Energy. Surely, the fee
at which solar energy interceps the Earth is about 10,000 2 times greater than the speed at
which the humankind uses energy. Although not all countries are equally gifted with solar
energy, it is possible for nearly all, a meaningful contribution from a combination of energy
from direct solar radiation. The conversion of solar energy is a large family of different
technologies to please a range of needs for energy services. Solar technologies can provide
heating, cooling, natural lighting and electricity for a variety of applications.
2.2.1 The Photovoltaic Effect
On 1839 a french physicist first observed the physical phenomenon responsible for
converting light to electricity, his name was Edmund Becquerel. He noted that a voltage
acted when one of two indentical electrodes in a weak conducting solution was

4
illuminanetd. The PV effect was primarily studied in solids, such as selenium (1). Selenium
is capable to convert light in the visible part of the sun’s spectrum and for then quickly
adopeted by the then-emerging field of light- measuring devices. Selenium cells cost is
too high relative to the insignificant amount of power they produce so they have never
become pratical as energy converters. Meanwhile, work on the physics of PV effect has
expanded and a main step forward in solar-cell technology took place on 1940 when the
CZ (for more information go to Annex Appendix A) technique was developed for
producing highly pure crystalline silicon.
According to “Basic Photovoltaic Principles and Methods” 3, “the Photovoltaic effect is
the basic of conversion of light to electricity in photovoltaic or solar cells.Described
simply, the PV effect is as follows: Light, which is pure energy enters a PV cell and
imparts enough energy to some electrons (negatively charged atomic particles) to free
them. A built-in-potencial barrier in the cell acts on these electrons to produce a voltage
(the so-called photovoltage), which can be used to drive a current through a circuit” as
can be seen on Figure 2.1.
Figure 2.1- Photovoltaic Solar Panel Working Principle 4.
(1) Selenium – a nonmetallic element chemically resembling sulfur and tellurium, occurring in several allotropic forms,
as crystalline and amorphous, and having an electrical resistance that varies under the influence of light. Symbol:
Se; atomic weight: 78.96; atomic number: 34.
5
Charge carriers like electrons and holes are generated when sulingh raids a solar cell.
The holes are drawn into the positive, p-layer, and the electrons are drawn into the
negative,n-layer, both are separated by the internal fild produced by junction. When a
circuit is made, the free electrons have to get through the load to recombine with the
positive holes, thus producing current from the cells under illumination.
2.2.3 Photovoltaics Industry
The PV industry is rising, with rates of 30 % 5 per year over the last decade. This progresss
has been determined by the market development programs to accelerate the deployment
of sustainable energy options and rapidly increasing fossil fuel prices.This proves, if need
be, that solar photovoltaics is on the way to becoming a major part of the eletricity system,
delivering clean, safe and affordable energy to the greater number all around the globe.
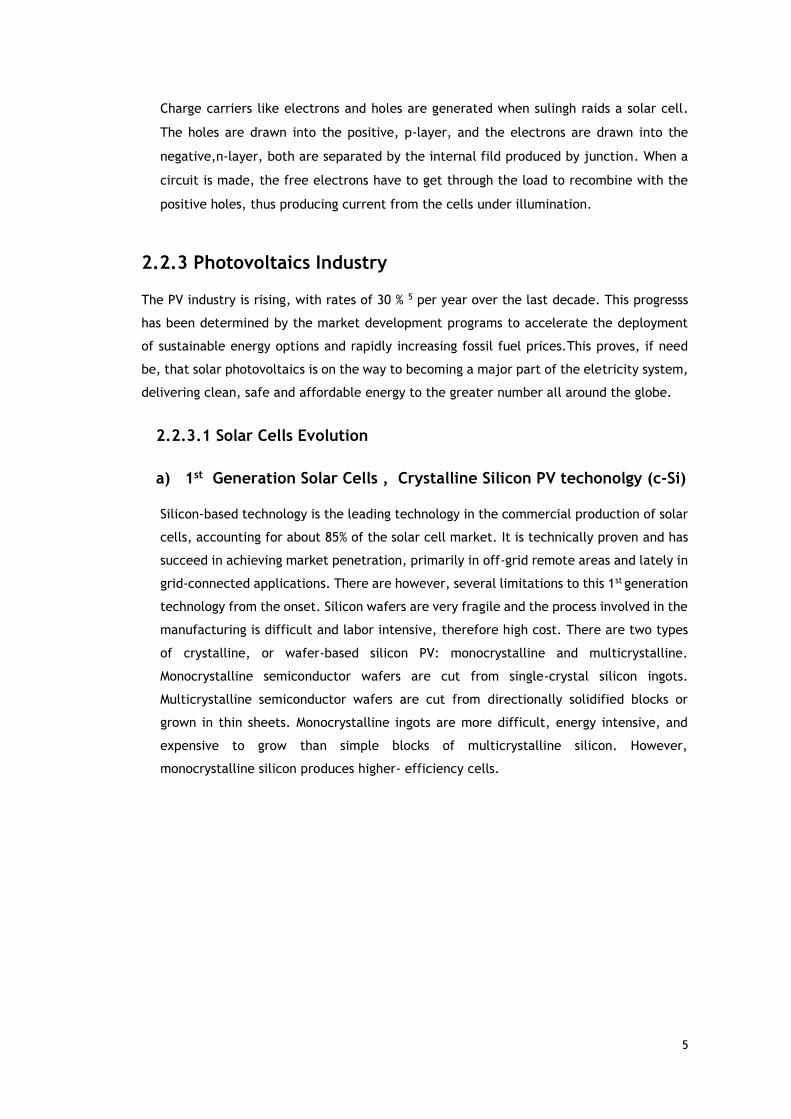
2.2.3.1 Solar Cells Evolution
a) 1st Generation Solar Cells , Crystalline Silicon PV techonolgy (c-Si)
Silicon-based technology is the leading technology in the commercial production of solar
cells, accounting for about 85% of the solar cell market. It is technically proven and has
succeed in achieving market penetration, primarily in off-grid remote areas and lately in
grid-connected applications. There are however, several limitations to this 1st generation
technology from the onset. Silicon wafers are very fragile and the process involved in the
manufacturing is difficult and labor intensive, therefore high cost. There are two types
of crystalline, or wafer-based silicon PV: monocrystalline and multicrystalline.
Monocrystalline semiconductor wafers are cut from single-crystal silicon ingots.
Multicrystalline semiconductor wafers are cut from directionally solidified blocks or
grown in thin sheets. Monocrystalline ingots are more difficult, energy intensive, and
expensive to grow than simple blocks of multicrystalline silicon. However,
monocrystalline silicon produces higher- efficiency cells.
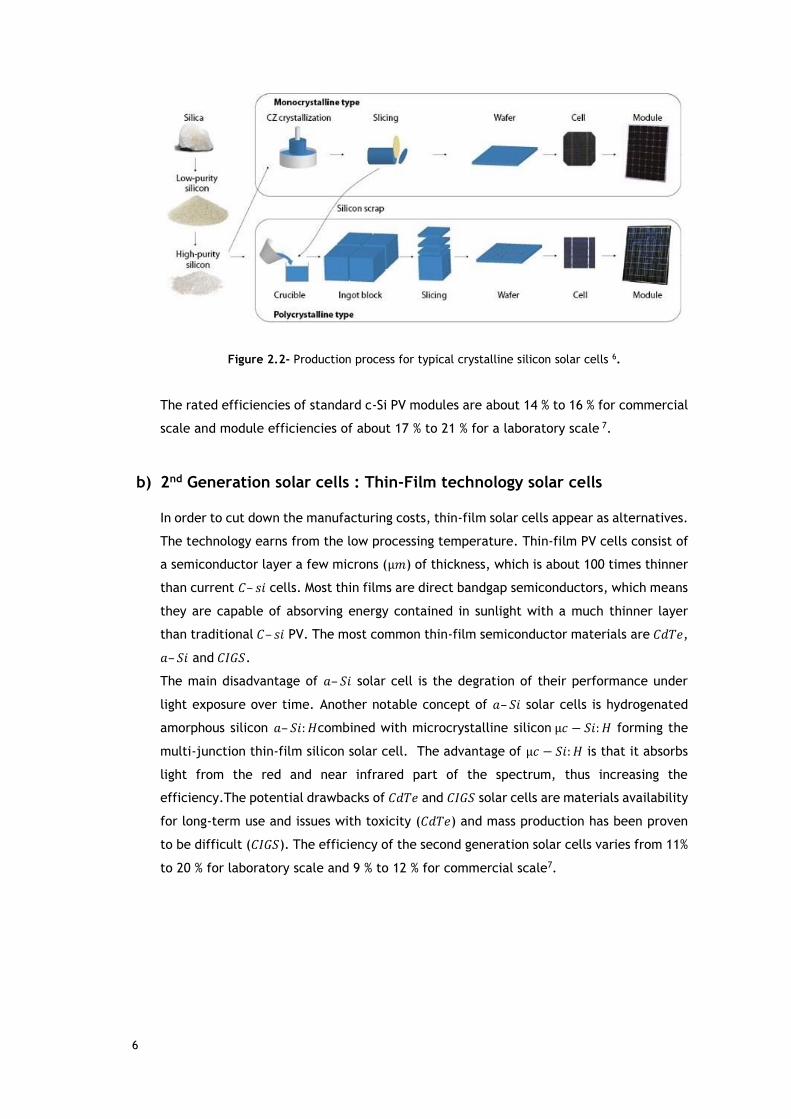
6
Figure 2.2- Production process for typical crystalline silicon solar cells 6.
The rated efficiencies of standard c-Si PV modules are about 14 % to 16 % for commercial
scale and module efficiencies of about 17 % to 21 % for a laboratory scale 7.
b) 2nd Generation solar cells : Thin-Film technology solar cells
In order to cut down the manufacturing costs, thin-film solar cells appear as alternatives.
The technology earns from the low processing temperature. Thin-film PV cells consist of
a semiconductor layer a few microns (µ𝑚) of thickness, which is about 100 times thinner
than current 𝐶– 𝑠𝑖 cells. Most thin films are direct bandgap semiconductors, which means
they are capable of absorving energy contained in sunlight with a much thinner layer
than traditional 𝐶– 𝑠𝑖 PV. The most common thin-film semiconductor materials are 𝐶𝑑𝑇𝑒,
𝑎– 𝑆𝑖 and 𝐶𝐼𝐺𝑆.
The main disadvantage of 𝑎– 𝑆𝑖 solar cell is the degration of their performance under
light exposure over time. Another notable concept of 𝑎– 𝑆𝑖 solar cells is hydrogenated
amorphous silicon 𝑎– 𝑆𝑖: 𝐻combined with microcrystalline silicon µ𝑐 − 𝑆𝑖: 𝐻 forming the
multi-junction thin-film silicon solar cell. The advantage of µ𝑐 − 𝑆𝑖: 𝐻 is that it absorbs
light from the red and near infrared part of the spectrum, thus increasing the
efficiency.The potential drawbacks of 𝐶𝑑𝑇𝑒 and 𝐶𝐼𝐺𝑆 solar cells are materials availability
for long-term use and issues with toxicity (𝐶𝑑𝑇𝑒) and mass production has been proven
to be difficult (𝐶𝐼𝐺𝑆). The efficiency of the second generation solar cells varies from 11%
to 20 % for laboratory scale and 9 % to 12 % for commercial scale7.
7
c) 3rd Generation solar cells
Research for improving solar cell performance by enhancing its efficiency has led to
the development of the third generation solar cells. Dye-sensitized solar cells use dye
molecules absorbed onto a nanostructured substrate and immersed in a liquid to
absorb solar radiation and have demonstrated laboratory efficiencies as high as
11.1 %. OPV solar cells, established on polymers or small molecules with
semiconductor properties, have demonstrated laboratory cell efficiencies above 8 %.
Organic modules have the potential for low-cost manufacturing using existing printing
and lamination technologies.
There are significant challenges to the commercialization of solution-processed
organic solar cells and dye-sensitized, due to the stability of the materials against
oxygen and water ingress. This limits the lifetime of these devices to anywhere from
a few hundred hours to 2 years. This issue is being addressed through efforts to
develop improved, yet cost-effective, encapsulants. In addition, organic and dye-
sensitized solar cells use dyes that have been shown to degrade when put in direct
sunlight for long periods of time, a significant issue to have in a solar cell7.
d) Concentrating PV
CPV uses mirros or lenses made out of low-priced materials such as glass, steel, and
plastic to focus sunlight onto a relatively small semiconductor area. This technique
have several significant advantages. First, it reduces the amount of active
semiconductor material needed to produce a given amount of electricity. On an area
basis, the active semiconductor material is the most complex and expensive
component of many PV modules; this is particularly true for MJ cells. MJ cells are
capable of much higher efficiencies than single junction silicon or thin-film cells.
This is because each junction of a MJ cell is designed to collect a different part of
the solar spectrum: MJ cells are typically a load of three different cells on top of one
another. This higher efficiency comes at an increase in manufacturing cost, and thus
MJ devices are too expensive to use in terrestrial applications without concentration.
The downside to CPV, especially for higher concentration levels, is that, in order to
maintain the concentration of sunlight on the cell, the module must accurately follow
the sun throughout the day. Tracing results in a more complex and expensive
installation. Recent improvements to MJ PV cells have produced cell efficiencies of
43.5 % in the laboratory7.
8
2.4 NREL’s world wide best research in laboratory
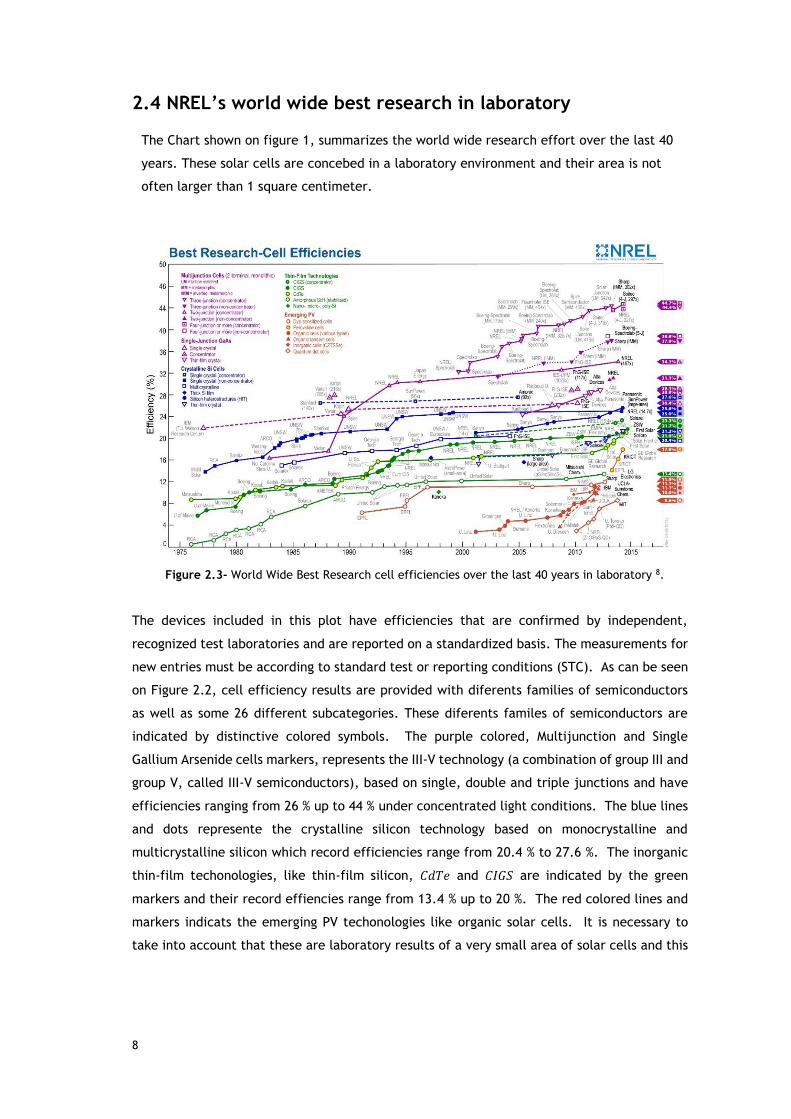
The Chart shown on figure 1, summarizes the world wide research effort over the last 40
years. These solar cells are concebed in a laboratory environment and their area is not
often larger than 1 square centimeter.
Figure 2.3- World Wide Best Research cell efficiencies over the last 40 years in laboratory 8.
The devices included in this plot have efficiencies that are confirmed by independent,
recognized test laboratories and are reported on a standardized basis. The measurements for
new entries must be according to standard test or reporting conditions (STC). As can be seen
on Figure 2.2, cell efficiency results are provided with diferents families of semiconductors
as well as some 26 different subcategories. These diferents familes of semiconductors are
indicated by distinctive colored symbols. The purple colored, Multijunction and Single
Gallium Arsenide cells markers, represents the III-V technology (a combination of group III and
group V, called III-V semiconductors), based on single, double and triple junctions and have
efficiencies ranging from 26 % up to 44 % under concentrated light conditions. The blue lines
and dots represente the crystalline silicon technology based on monocrystalline and
multicrystalline silicon which record efficiencies range from 20.4 % to 27.6 %. The inorganic
thin-film techonologies, like thin-film silicon, 𝐶𝑑𝑇𝑒 and 𝐶𝐼𝐺𝑆 are indicated by the green
markers and their record effiencies range from 13.4 % up to 20 %. The red colored lines and
markers indicats the emerging PV techonologies like organic solar cells. It is necessary to
take into account that these are laboratory results of a very small area of solar cells and this
9
chart does not tells us anything of the long term stability of some PV techonologies, certainly
not the one indicated in red9.
2.5 History of Unmanned Aerial Vehicles
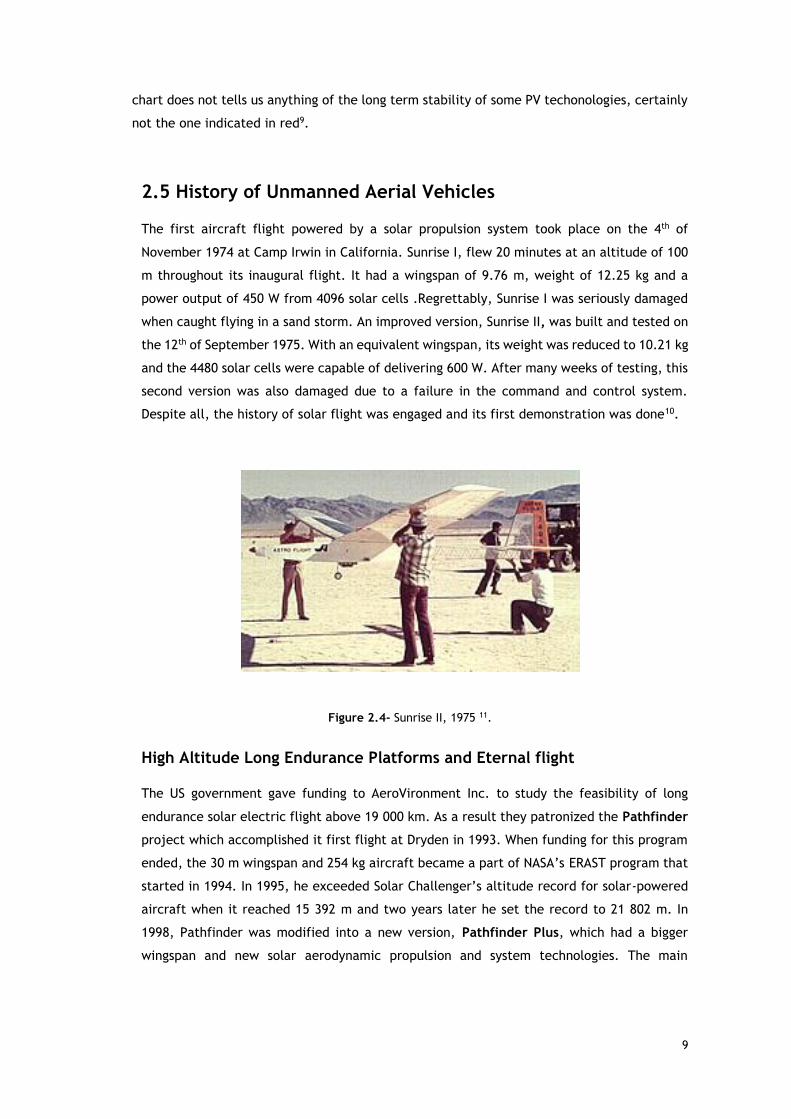
The first aircraft flight powered by a solar propulsion system took place on the 4th of
November 1974 at Camp Irwin in California. Sunrise I, flew 20 minutes at an altitude of 100
m throughout its inaugural flight. It had a wingspan of 9.76 m, weight of 12.25 kg and a
power output of 450 W from 4096 solar cells .Regrettably, Sunrise I was seriously damaged
when caught flying in a sand storm. An improved version, Sunrise II, was built and tested on
the 12th of September 1975. With an equivalent wingspan, its weight was reduced to 10.21 kg
and the 4480 solar cells were capable of delivering 600 W. After many weeks of testing, this
second version was also damaged due to a failure in the command and control system.
Despite all, the history of solar flight was engaged and its first demonstration was done10.
Figure 2.4- Sunrise II, 1975 11.
High Altitude Long Endurance Platforms and Eternal flight
The US government gave funding to AeroVironment Inc. to study the feasibility of long
endurance solar electric flight above 19 000 km. As a result they patronized the Pathfinder
project which accomplished it first flight at Dryden in 1993. When funding for this program
ended, the 30 m wingspan and 254 kg aircraft became a part of NASA’s ERAST program that
started in 1994. In 1995, he exceeded Solar Challenger’s altitude record for solar-powered
aircraft when it reached 15 392 m and two years later he set the record to 21 802 m. In
1998, Pathfinder was modified into a new version, Pathfinder Plus, which had a bigger
wingspan and new solar aerodynamic propulsion and system technologies. The main
10
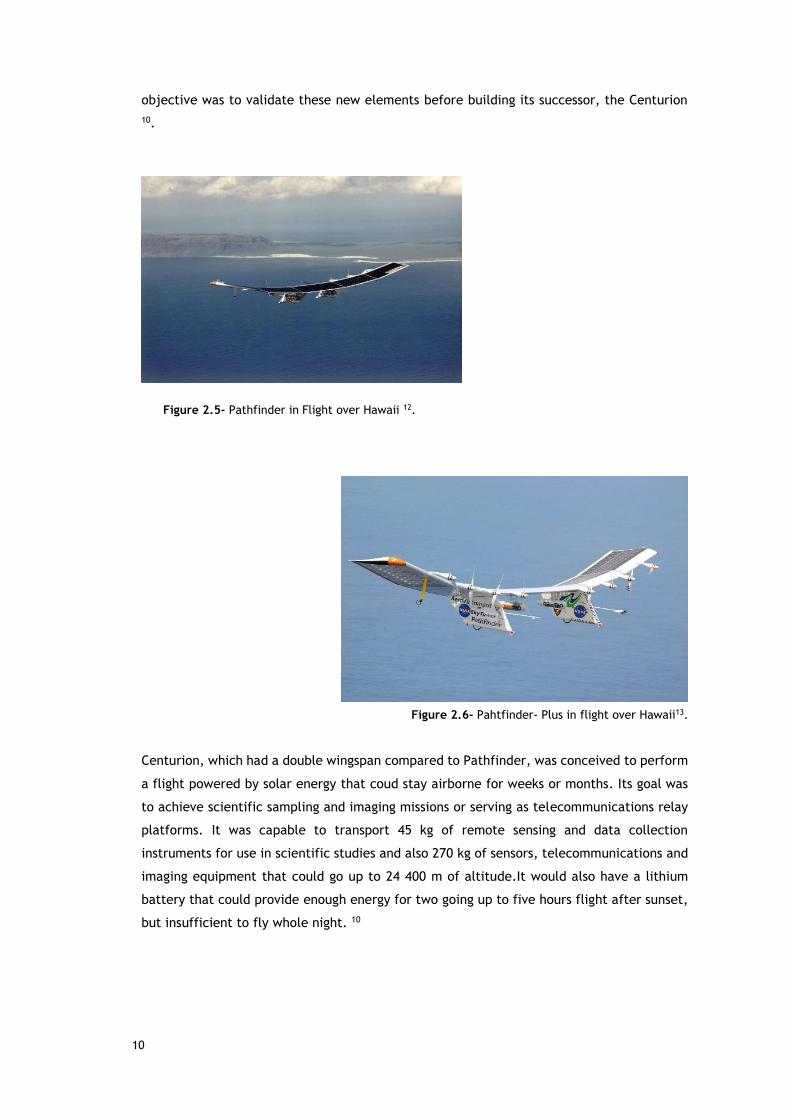
objective was to validate these new elements before building its successor, the Centurion
10.
Figure 2.5- Pathfinder in Flight over Hawaii 12.
Figure 2.6- Pahtfinder- Plus in flight over Hawaii13.
Centurion, which had a double wingspan compared to Pathfinder, was conceived to perform
a flight powered by solar energy that coud stay airborne for weeks or months. Its goal was
to achieve scientific sampling and imaging missions or serving as telecommunications relay
platforms. It was capable to transport 45 kg of remote sensing and data collection
instruments for use in scientific studies and also 270 kg of sensors, telecommunications and
imaging equipment that could go up to 24 400 m of altitude.It would also have a lithium
battery that could provide enough energy for two going up to five hours flight after sunset,
but insufficient to fly whole night. 10
11
Figure 2.7- Centurion, 1997-1999 14.
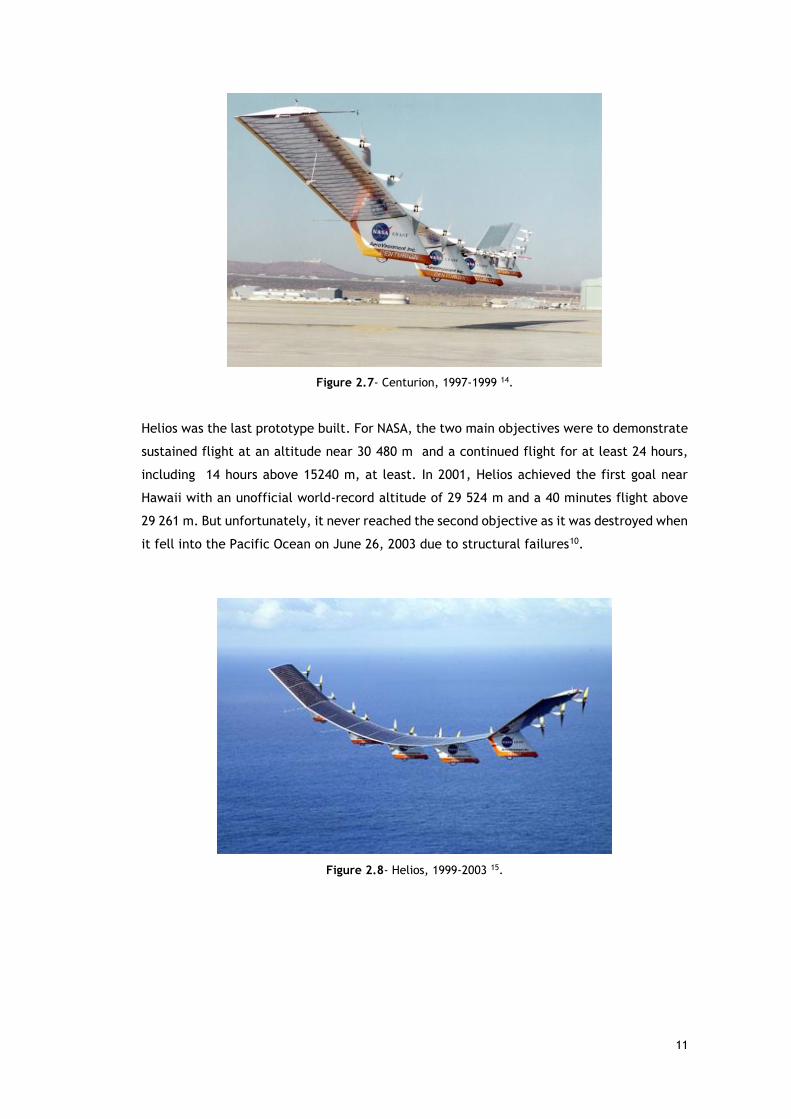
Helios was the last prototype built. For NASA, the two main objectives were to demonstrate
sustained flight at an altitude near 30 480 m and a continued flight for at least 24 hours,
including 14 hours above 15240 m, at least. In 2001, Helios achieved the first goal near
Hawaii with an unofficial world-record altitude of 29 524 m and a 40 minutes flight above
29 261 m. But unfortunately, it never reached the second objective as it was destroyed when
it fell into the Pacific Ocean on June 26, 2003 due to structural failures10.
Figure 2.8- Helios, 1999-2003 15.
12
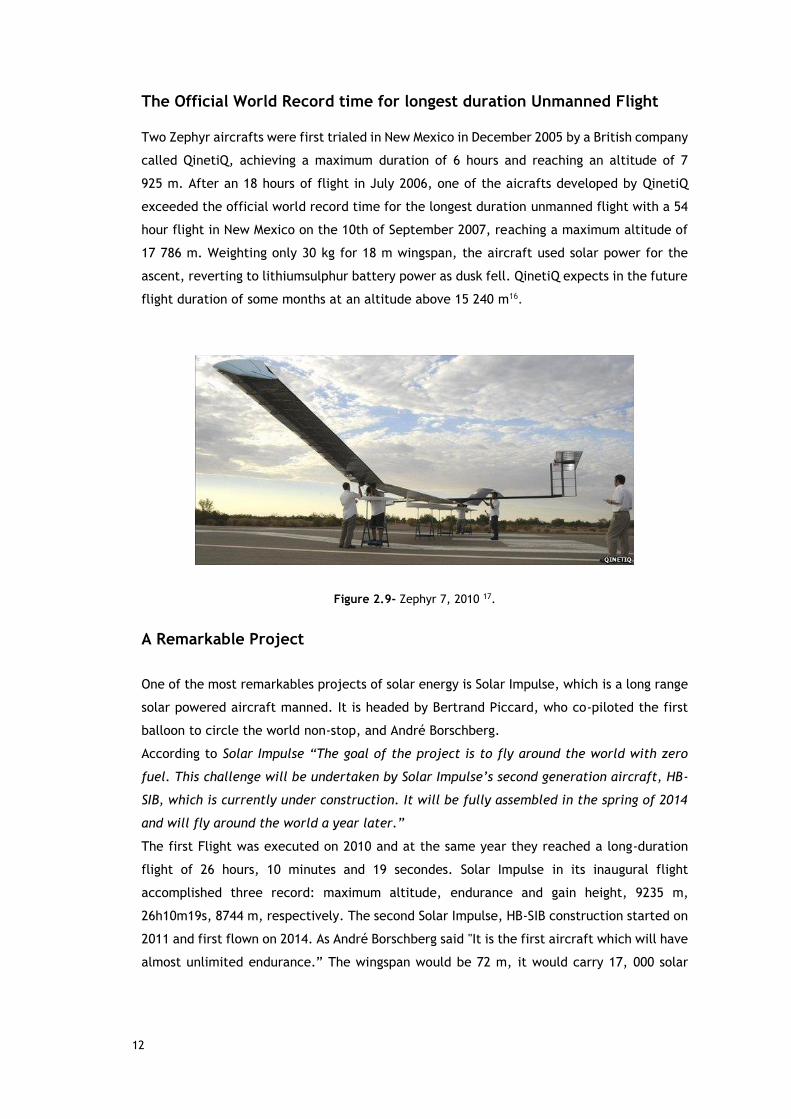
The Official World Record time for longest duration Unmanned Flight
Two Zephyr aircrafts were first trialed in New Mexico in December 2005 by a British company
called QinetiQ, achieving a maximum duration of 6 hours and reaching an altitude of 7
925 m. After an 18 hours of flight in July 2006, one of the aicrafts developed by QinetiQ
exceeded the official world record time for the longest duration unmanned flight with a 54
hour flight in New Mexico on the 10th of September 2007, reaching a maximum altitude of
17 786 m. Weighting only 30 kg for 18 m wingspan, the aircraft used solar power for the
ascent, reverting to lithiumsulphur battery power as dusk fell. QinetiQ expects in the future
flight duration of some months at an altitude above 15 240 m16.
Figure 2.9- Zephyr 7, 2010 17.
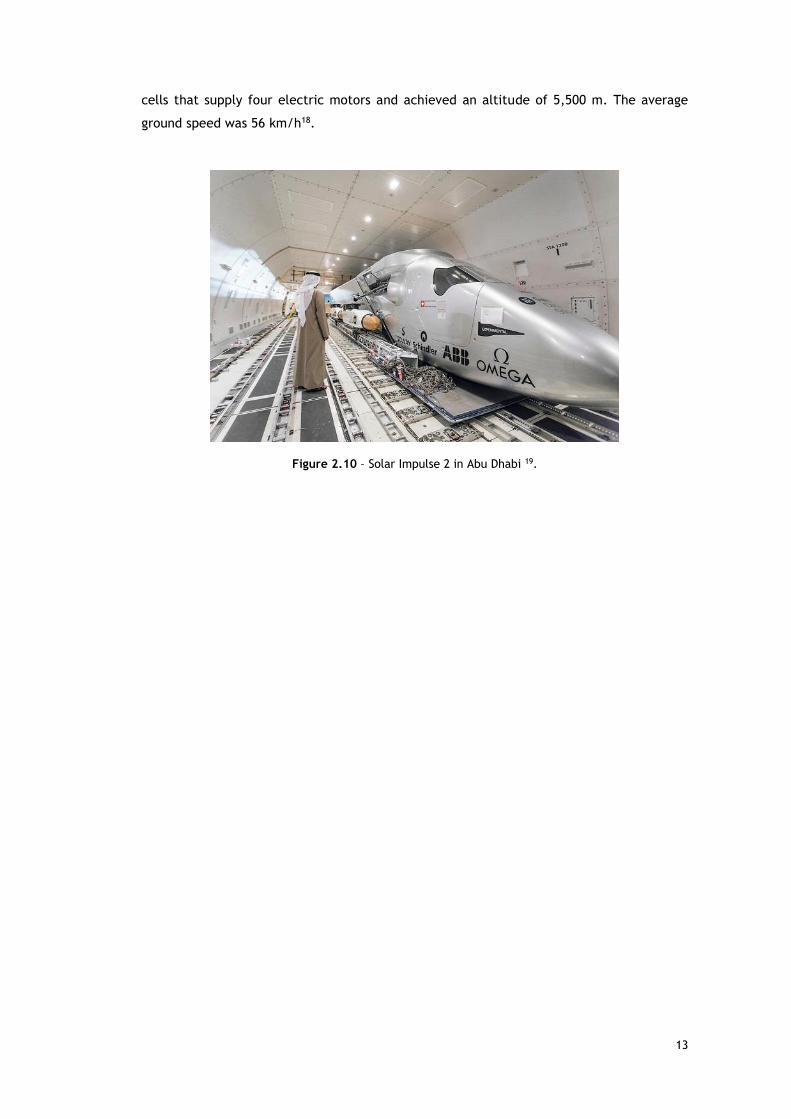
A Remarkable Project
One of the most remarkables projects of solar energy is Solar Impulse, which is a long range
solar powered aircraft manned. It is headed by Bertrand Piccard, who co-piloted the first
balloon to circle the world non-stop, and André Borschberg.
According to Solar Impulse “The goal of the project is to fly around the world with zero
fuel. This challenge will be undertaken by Solar Impulse’s second generation aircraft, HB-
SIB, which is currently under construction. It will be fully assembled in the spring of 2014
and will fly around the world a year later.”
The first Flight was executed on 2010 and at the same year they reached a long-duration
flight of 26 hours, 10 minutes and 19 secondes. Solar Impulse in its inaugural flight
accomplished three record: maximum altitude, endurance and gain height, 9235 m,
26h10m19s, 8744 m, respectively. The second Solar Impulse, HB-SIB construction started on
2011 and first flown on 2014. As André Borschberg said "It is the first aircraft which will have
almost unlimited endurance.” The wingspan would be 72 m, it would carry 17, 000 solar
13
cells that supply four electric motors and achieved an altitude of 5,500 m. The average
ground speed was 56 km/h18.
Figure 2.10 – Solar Impulse 2 in Abu Dhabi 19.

14

15
Chapter 3
Aircraft Description and Mission
This chapter first starts with the description of the aircraft mission and vehicle
characterization, ending with a brief introduction to the non-conventional propulsion system
powered by solar energy. The material presented here is part of a cooperative research
project involving tree research units that belong to the line of Aeronautics and Space of LAETA
(2), namely CCTAE (3), AEROG (4) and IDMEC (5).
3.1 Solar UAV Mission
The LEEUAV project aims to develop a Long Endurance Electric Unammaned Aerial Vehicle
powered by solar energy that must be as light as possible and be able to carry a payload of 1
kg. UAVs are slighty more cost effective to acquire and operate than conventional manned
aircraft, so the objective of this project is to create a reasonable cost platform that can be
handly installed in areas with small space. The aircraft has to be able to collect and store
energy for long endurance flight. The mission profile may be summarized as follows:
1. Take-off in a very short distance ( in 8 m) or Launched by hand (in 3 m);
2. Climb to 1000 m above ground level for a cruise altitude, in 10 minutes;
3. Sustainable-flight of 8 hours at equinox with a flight cruise speed of no less than 7 m/s;
4. Descend from cruise altitude during 29 minutes to ground level without power;
5. Landing in the field.
The energy requirements have been calculate based on the efficiency of each component of
the propulsion system in every stage of the mission. The efficiencies of battery, cables and
electronic speed controlller ESC, are fixed for the entire mission while the efficiencies of the
electric motor and propeller are different in each stage.The propulsive power required for
each stage of the mission can be estimated as:
𝑃𝑟𝑒𝑞 = 𝑣𝑠𝑡𝑎𝑔𝑒 × 𝐷𝑠𝑡𝑎𝑔𝑒 (3.1)
(2) LAETA. Associated Laboratory for Energy, Transports and Aeronautics. Portugal
(3) CCTAE. Center for Aerospace Science and Technology. Lisbon, Portugal.
(4) AEROG, Aeronautics and Astronautics Research Center, Covilhã, Portugal.
(5) IDMEC. Institute of Mechanical Engineering, Lisbon, Portugal
16
where 𝑣𝑠𝑡𝑎𝑔𝑒 is the corresponding aircraft speed and 𝐷𝑠𝑡𝑎𝑔𝑒 is the aircraft drag. Knowing the
duration of each stage, 𝑡𝑠𝑡𝑎𝑔𝑒, it is then possible to calculate the propulsive energy required
at each stage of the mission:
𝐸𝑟𝑒𝑞 = 𝑃𝑟𝑒𝑞 × 𝑡𝑠𝑡𝑎𝑔𝑒 (3.2)
The total efficiency of the components is estimated as:
𝜂𝑠𝑡𝑎𝑡𝑒 = 𝜂𝐵 × 𝜂𝐶 × 𝜂𝐸𝑆𝐶 × 𝜂𝑀𝑠𝑡𝑎𝑔𝑒 × 𝜂𝑃𝑠𝑡𝑎𝑔𝑒
(3.3)
where 𝜂𝐵 , 𝜂𝐶 and 𝜂𝐸𝑆𝐶 are the efficiency of battery, cable and electronic speed controller,
common for all stage, and 𝜂𝑀𝑠𝑡𝑎𝑔𝑒 and 𝜂𝑃𝑠𝑡𝑎𝑔𝑒 are the efficiency of electric motor and
propeller for the particular stage. Then the total required energy can be determined as:
𝐸𝑟𝑒𝑞 =𝑃𝑟𝑒𝑞
𝜂𝑠𝑡𝑎𝑔𝑒
× 𝑡𝑠𝑡𝑎𝑔𝑒 (3.4)
The best option to generate energy during cruise flight is to accommodate highly efficiency
solar cells on the upper wing surface. The total energy required and the maximum electrical
power required were used for sizing the propulsion system.Table 3.1 summarizes the values
of required electrical power and energy for each segment of the mission:
Table 3.1 – Energy requirements for propulsion system 20.
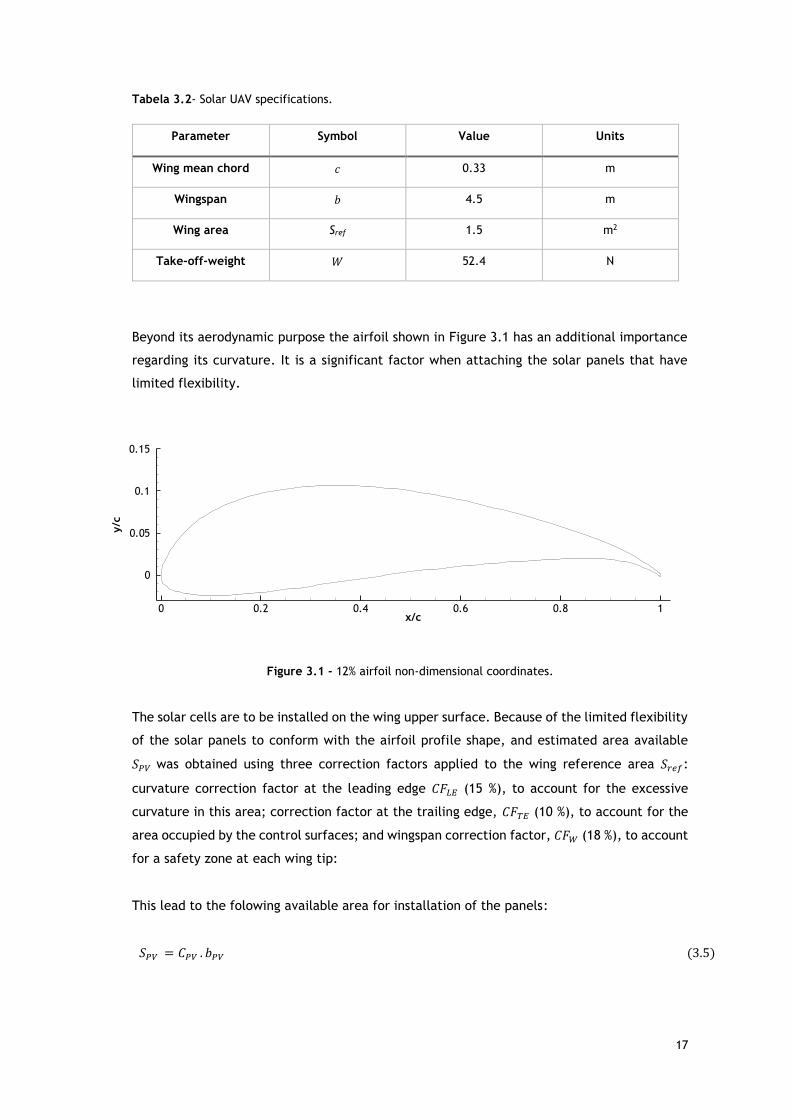
3.2 Aircraft Specifications
The aircraft dimension is important to produce a high performance design.It has to be large
enough to accommodate all electronic but has to be capable of depoyment from small landing-
fields.The conceptual design of the airframe has been concluded and some of the relevant
UAV specfications are summarized in table 3.2 20.
Segment stage 𝑷𝒓𝒆𝒒/stage (W) 𝑬𝒓𝒆𝒒 (kJ)
Take-off 15.9 451.2 0.4
Climb 22.4 444.7 266.9
Cruise 38.2 46.7 1370.9
Descent - 0 0
17
Tabela 3.2- Solar UAV specifications.
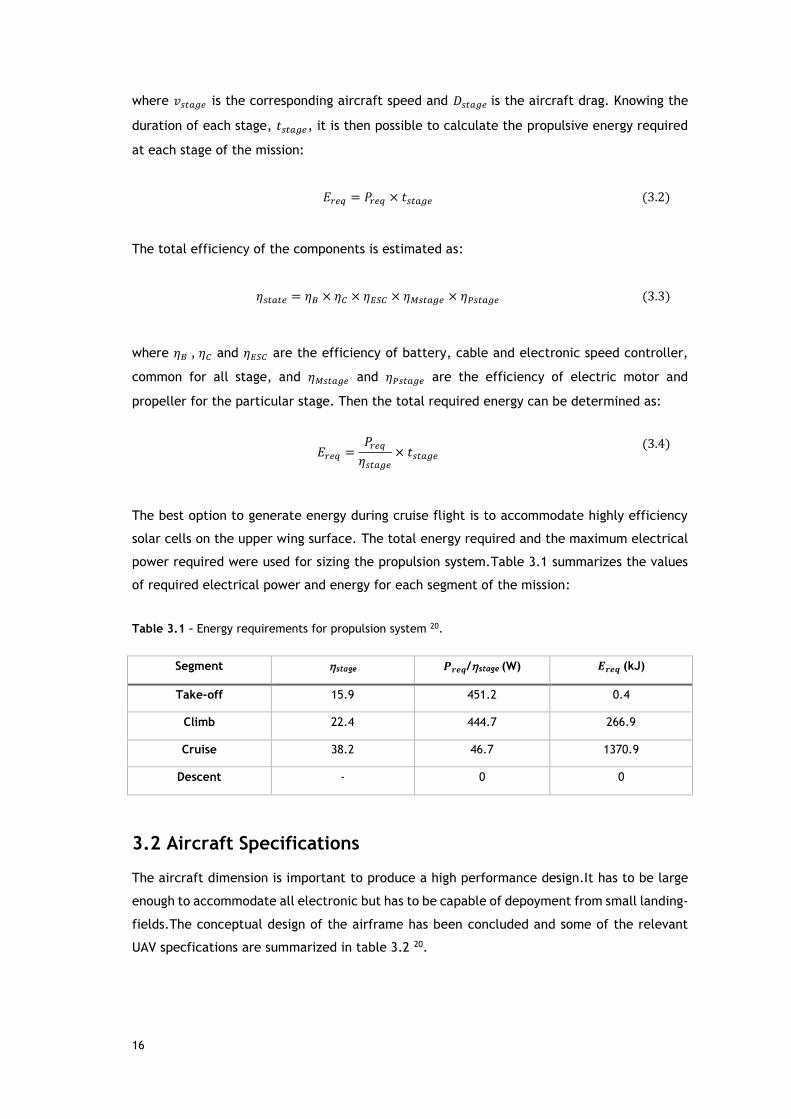
Beyond its aerodynamic purpose the airfoil shown in Figure 3.1 has an additional importance
regarding its curvature. It is a significant factor when attaching the solar panels that have
limited flexibility.
Figure 3.1 - 12% airfoil non-dimensional coordinates.
The solar cells are to be installed on the wing upper surface. Because of the limited flexibility
of the solar panels to conform with the airfoil profile shape, and estimated area available
𝑆𝑃𝑉 was obtained using three correction factors applied to the wing reference area 𝑆𝑟𝑒𝑓:
curvature correction factor at the leading edge 𝐶𝐹𝐿𝐸 (15 %), to account for the excessive
curvature in this area; correction factor at the trailing edge, 𝐶𝐹𝑇𝐸 (10 %), to account for the
area occupied by the control surfaces; and wingspan correction factor, 𝐶𝐹𝑊 (18 %), to account
for a safety zone at each wing tip:
This lead to the folowing available area for installation of the panels:
𝑆𝑃𝑉 = 𝐶𝑃𝑉 . 𝑏𝑃𝑉 (3.5)
x/c
y/c
0 0.2 0.4 0.6 0.8 1
0
0.05
0.1
0.15
Parameter Symbol Value Units
Wing mean chord 𝑐 0.33 m
Wingspan 𝑏 4.5 m
Wing area Sref 1.5 m2
Take-off-weight 𝑊 52.4 N
18
where the available chord and available span are, respectively,
resulting in an available area 𝑆𝑃𝑉 of 0.728 m2 21.
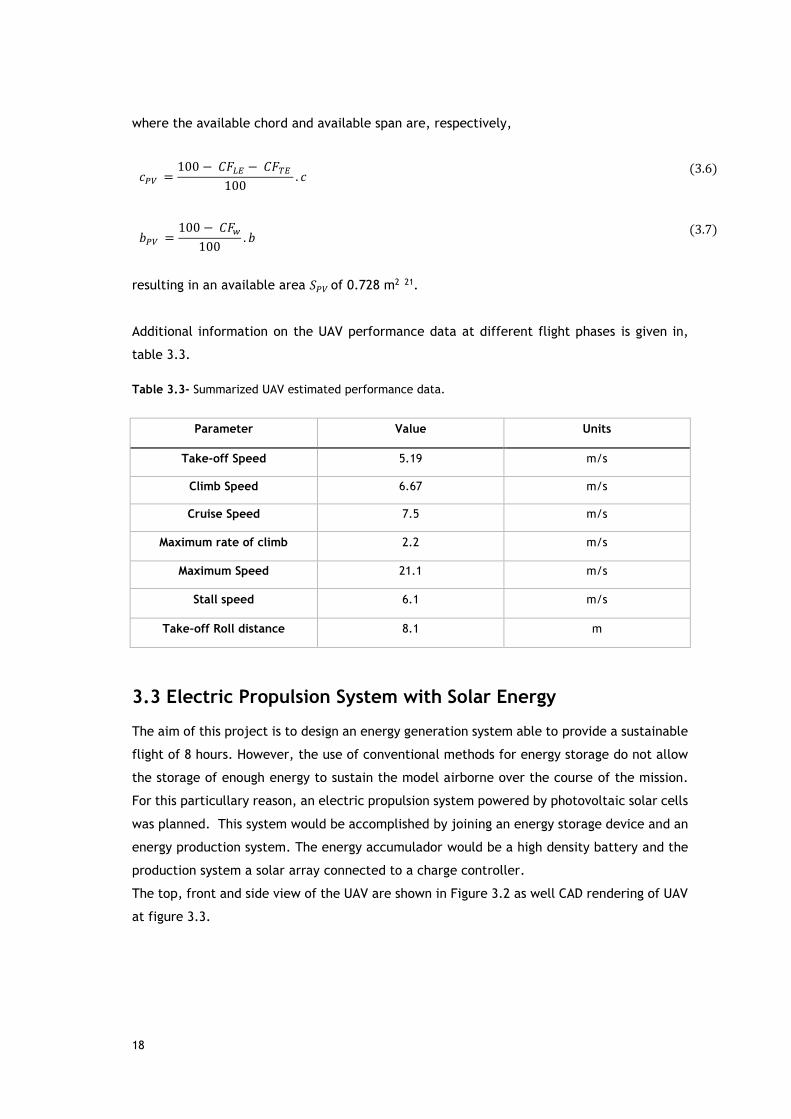
Additional information on the UAV performance data at different flight phases is given in,
table 3.3.
Table 3.3- Summarized UAV estimated performance data.
3.3 Electric Propulsion System with Solar Energy
The aim of this project is to design an energy generation system able to provide a sustainable
flight of 8 hours. However, the use of conventional methods for energy storage do not allow
the storage of enough energy to sustain the model airborne over the course of the mission.
For this particullary reason, an electric propulsion system powered by photovoltaic solar cells
was planned. This system would be accomplished by joining an energy storage device and an
energy production system. The energy accumulador would be a high density battery and the
production system a solar array connected to a charge controller.
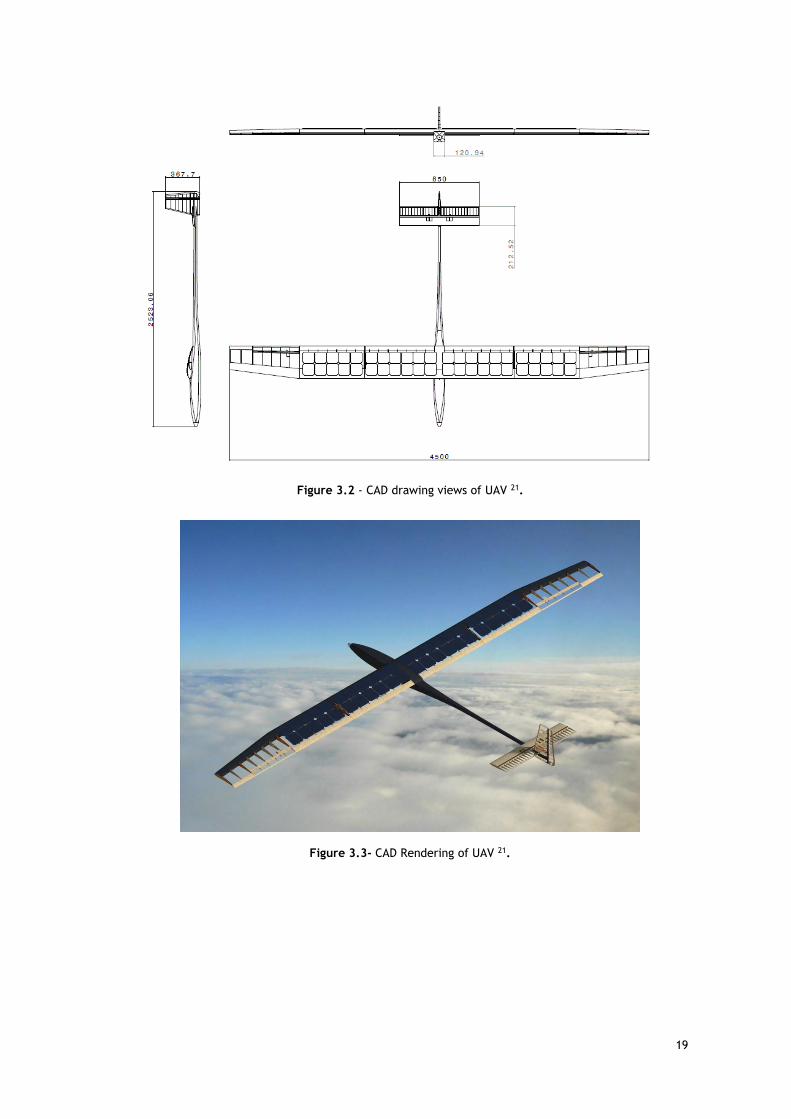
The top, front and side view of the UAV are shown in Figure 3.2 as well CAD rendering of UAV
at figure 3.3.
𝑐𝑃𝑉 =100 − 𝐶𝐹𝐿𝐸 − 𝐶𝐹𝑇𝐸
100. 𝑐
(3.6)
𝑏𝑃𝑉 =100 − 𝐶𝐹𝑤
100. 𝑏
(3.7)
Parameter Value Units
Take-off Speed 5.19 m/s
Climb Speed 6.67 m/s
Cruise Speed 7.5 m/s
Maximum rate of climb 2.2 m/s
Maximum Speed 21.1 m/s
Stall speed 6.1 m/s
Take-off Roll distance 8.1 m
19
Figure 3.2 - CAD drawing views of UAV 21.
Figure 3.3- CAD Rendering of UAV 21.

20
21
Chapter 4
Solar Module, Solar Panel and Solar Array
Arrangement.
In the outdoor environment the magnitude of the current ouput from a PV module directly
depends on the solar irradiance and can be increased by connecting solar cells in parallel.
The voltage of a solar cell depends primarily on the cell temperature. PV modules can be
designed to operate at different voltages by connecting solar cells in series. This chapter aims
to describe and justify each decision regarding the solar module arrangement.
4.1 Solar Panel
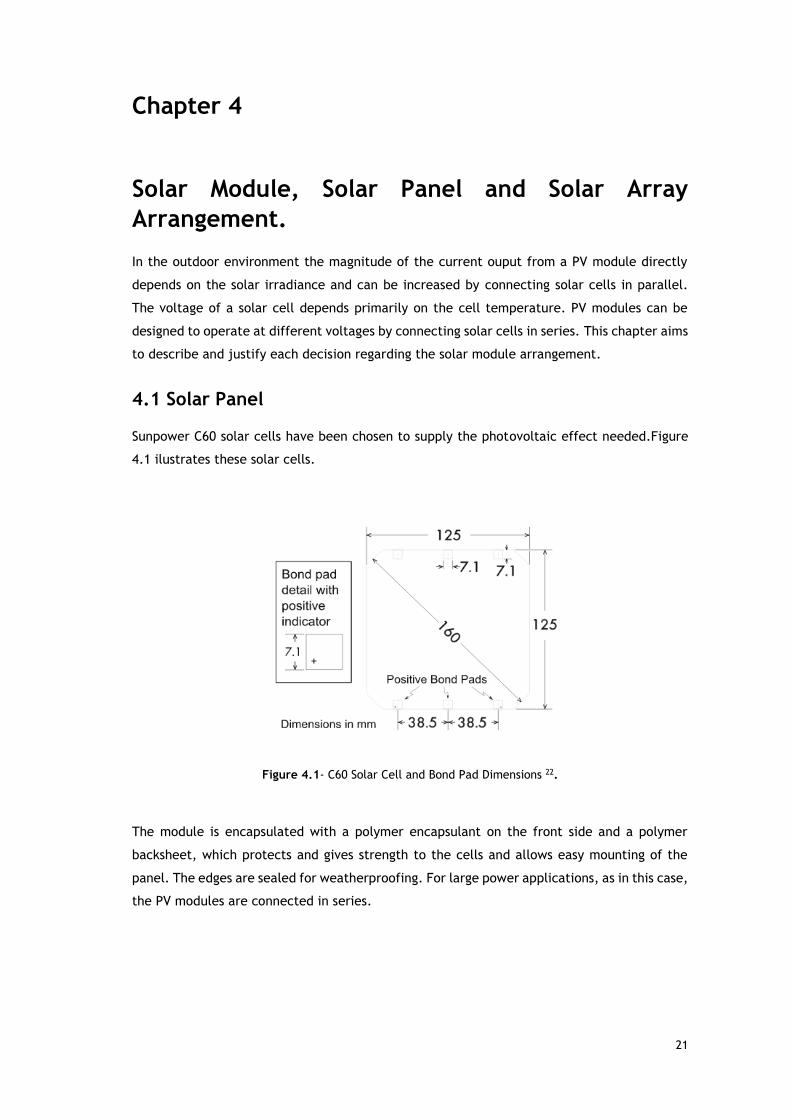
Sunpower C60 solar cells have been chosen to supply the photovoltaic effect needed.Figure
4.1 ilustrates these solar cells.
Figure 4.1- C60 Solar Cell and Bond Pad Dimensions 22.
The module is encapsulated with a polymer encapsulant on the front side and a polymer
backsheet, which protects and gives strength to the cells and allows easy mounting of the
panel. The edges are sealed for weatherproofing. For large power applications, as in this case,
the PV modules are connected in series.
22
4.1.1 Efficiency
The solar cell efficiency is defined as the ratio of energy output from the solar cell to
input energy from the sun. The energy conversion efficiency (𝜼𝑷𝑽) of a solar cell is the
percentage of the solar energy to which it is exposed that is converted into electrical
energy. This is calculated by dividing a cell’s power ouput (in watts) at its maximum
power point (𝑷𝒎𝒂𝒙) by the input light irradiance (W/m2), (𝑰𝒎𝒂𝒙) and the surface area
of the solar cell (𝑨). Expressed as:
𝜂𝑃𝑉 = 𝑃𝑚𝑎𝑥
𝐼𝑚𝑎𝑥 × 𝐴
(4.1)
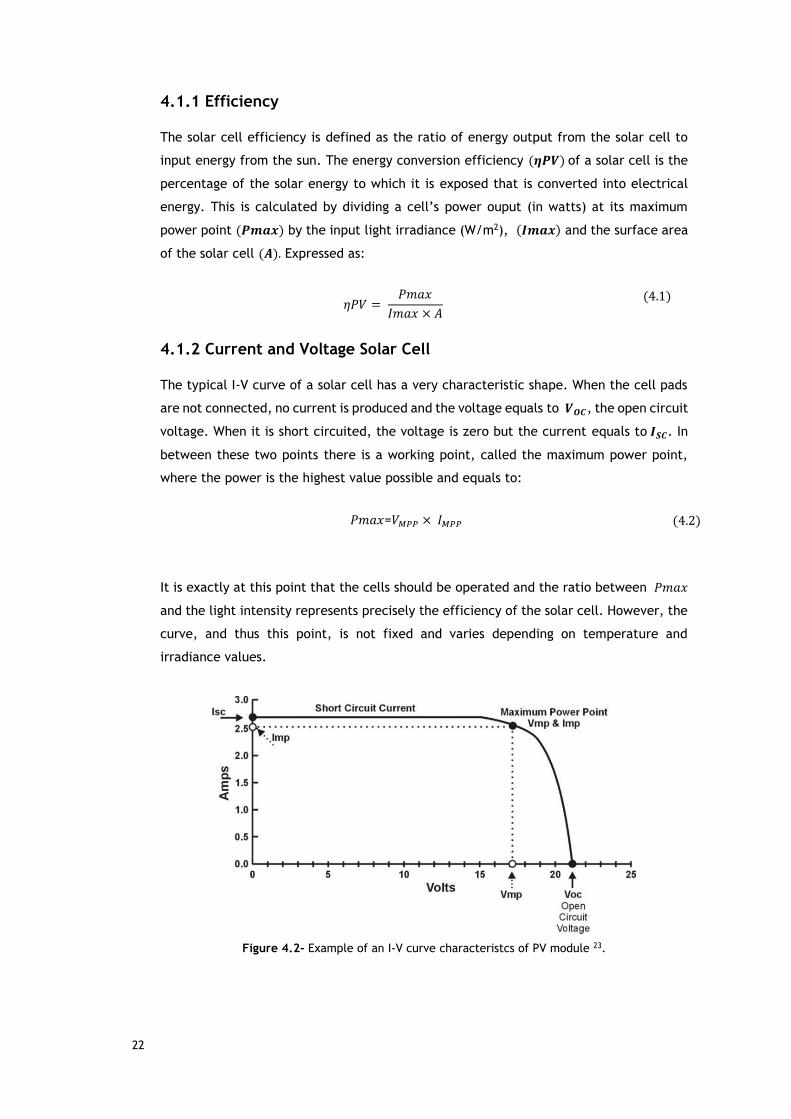
4.1.2 Current and Voltage Solar Cell
The typical I-V curve of a solar cell has a very characteristic shape. When the cell pads
are not connected, no current is produced and the voltage equals to 𝑽𝑶𝑪, the open circuit
voltage. When it is short circuited, the voltage is zero but the current equals to 𝑰𝑺𝑪. In
between these two points there is a working point, called the maximum power point,
where the power is the highest value possible and equals to:
𝑃𝑚𝑎𝑥=𝑉𝑀𝑃𝑃 × 𝐼𝑀𝑃𝑃
(4.2)
It is exactly at this point that the cells should be operated and the ratio between 𝑃𝑚𝑎𝑥
and the light intensity represents precisely the efficiency of the solar cell. However, the
curve, and thus this point, is not fixed and varies depending on temperature and
irradiance values.
Figure 4.2- Example of an I-V curve characteristcs of PV module 23.
23
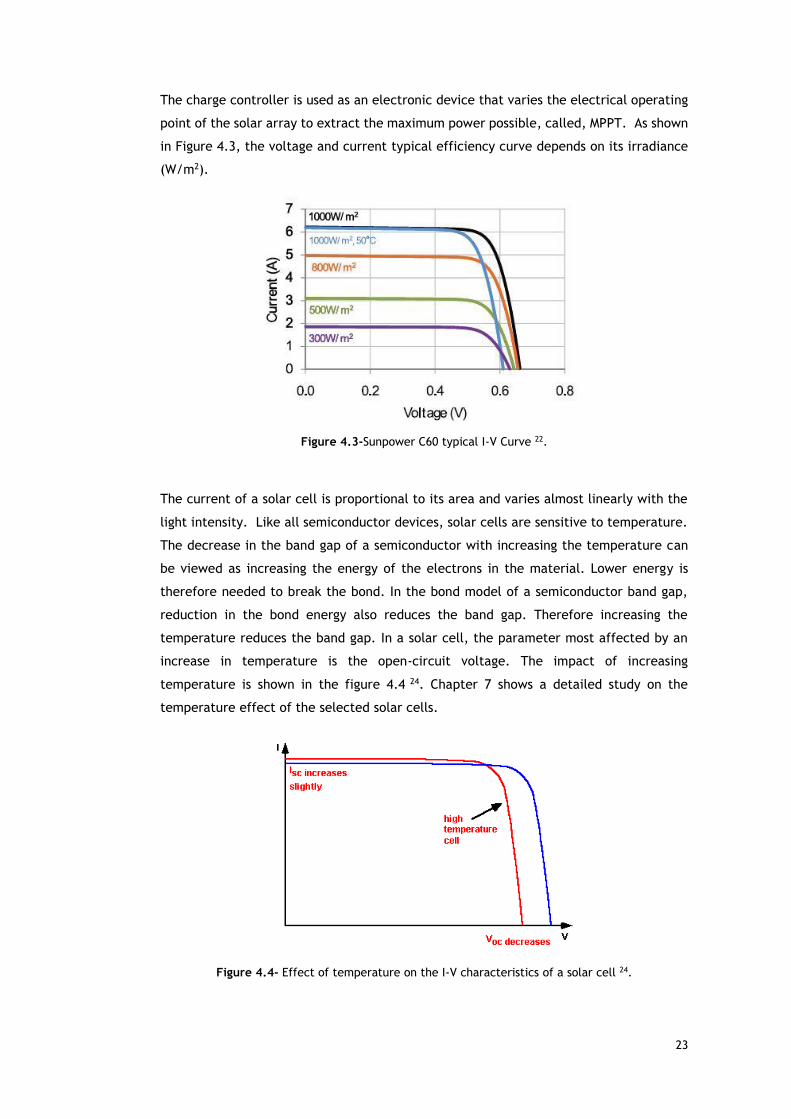
The charge controller is used as an electronic device that varies the electrical operating
point of the solar array to extract the maximum power possible, called, MPPT. As shown
in Figure 4.3, the voltage and current typical efficiency curve depends on its irradiance
(W/m2).
Figure 4.3-Sunpower C60 typical I-V Curve 22.
The current of a solar cell is proportional to its area and varies almost linearly with the
light intensity. Like all semiconductor devices, solar cells are sensitive to temperature.
The decrease in the band gap of a semiconductor with increasing the temperature can
be viewed as increasing the energy of the electrons in the material. Lower energy is
therefore needed to break the bond. In the bond model of a semiconductor band gap,
reduction in the bond energy also reduces the band gap. Therefore increasing the
temperature reduces the band gap. In a solar cell, the parameter most affected by an
increase in temperature is the open-circuit voltage. The impact of increasing
temperature is shown in the figure 4.4 24. Chapter 7 shows a detailed study on the
temperature effect of the selected solar cells.
Figure 4.4- Effect of temperature on the I-V characteristics of a solar cell 24.
24
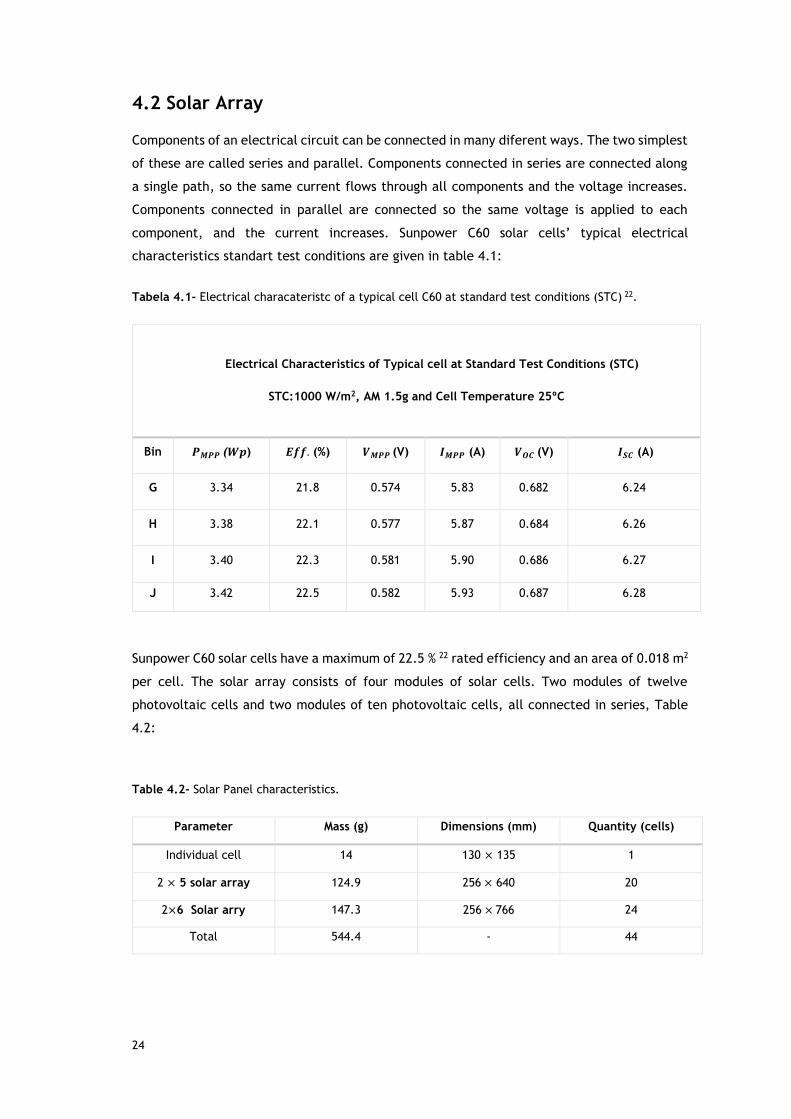
4.2 Solar Array
Components of an electrical circuit can be connected in many diferent ways. The two simplest
of these are called series and parallel. Components connected in series are connected along
a single path, so the same current flows through all components and the voltage increases.
Components connected in parallel are connected so the same voltage is applied to each
component, and the current increases. Sunpower C60 solar cells’ typical electrical
characteristics standart test conditions are given in table 4.1:
Tabela 4.1- Electrical characateristc of a typical cell C60 at standard test conditions (STC) 22.
Electrical Characteristics of Typical cell at Standard Test Conditions (STC)
STC:1000 W/m2, AM 1.5g and Cell Temperature 25ºC
Bin 𝑷𝑴𝑷𝑷 (𝑾𝒑) 𝑬𝒇𝒇. (%) 𝑽𝑴𝑷𝑷 (V) 𝑰𝑴𝑷𝑷 (A) 𝑽𝑶𝑪 (V) 𝑰𝑺𝑪 (A)
G 3.34 21.8 0.574 5.83 0.682 6.24
H 3.38 22.1 0.577 5.87 0.684 6.26
I 3.40 22.3 0.581 5.90 0.686 6.27
J 3.42 22.5 0.582 5.93 0.687 6.28
Sunpower C60 solar cells have a maximum of 22.5 % 22 rated efficiency and an area of 0.018 m2
per cell. The solar array consists of four modules of solar cells. Two modules of twelve
photovoltaic cells and two modules of ten photovoltaic cells, all connected in series, Table
4.2:
Table 4.2- Solar Panel characteristics.
Parameter Mass (g) Dimensions (mm) Quantity (cells)
Individual cell 14 130 × 135 1
2 × 5 solar array 124.9 256 × 640 20
2×6 Solar arry 147.3 256 × 766 24
Total 544.4 - 44
25
The total area amounts to 0.72 m2, which at the rated efficiency should ouput 151.8 W at
maximum irradiation ground level of 1000 W/m2 at 25º C. Since a single solar cell produces a
nominal voltage of 0.582 V, Table 4.1, and the propulsion system will work at 12 V, at least
22 solar cells connected in series, 𝑉𝑃𝑉 = 0.582 × 22 = 12.80 V, are required. Since the Rated
battery output current is 10.5 A and the recommended maximum 𝑉𝑂𝐶 at STC is 27 V it was
decided that the four modules could be connected in series and therefore facilitate the
wirring between the solar arrays. We first start by multipling the 0.582 V by 44 solar cells to
obtain the solar panel maximum nominal voltage:
𝑃𝑎𝑛𝑒𝑙 𝑉𝑂𝐶 = 0.582 × 44 = 25.6 𝑉
(4.3)
Since the solar charger has a maximum output of 27 𝑉 the connections are within the
maximum value. Following the same reasoning, the current of the solar panel connected in
series will be 5.93 A.Therefore, multipling the solar panel maximum voltage with the current
we obtain the maximum power ouput:
𝑃𝑚𝑎𝑥 = 25.6 × 5.93 = 151.8 𝑊 (4.4)
The battery module seleced in this system is a Lithium Polymer rechargeable battery with a
nominal voltage of 11.1 V. As the maximum recommended voltage at STC of the charge
controller is 27 V, the rated battery voltage is 12 V and the maximum power ouput from the
solar array is whithin the MPPT value and the system is compatible. Table 4.3 contains the
characterics of the complete solar array arrangement in series:
Table 4.3 – PV module specification datasheet.
Parameter Value Symbols Units
Module type Sunpower C60 − −
Solar cell type Mono C-Si − −
Rated power 151.8 𝑤𝑝 W
Rated Current 5.93 𝐼𝑀𝑃𝑃 A
Rated Voltage 25.6 𝑉𝑀𝑃𝑃 V
Short circuit Current 6.28 𝐼𝑆𝐶 A
Open Circuit Voltage 30.23 𝑉𝑂𝐶 V
Configuration 12 − V
Total number of cells 44 − −
Performance Warranty 25 − years
26
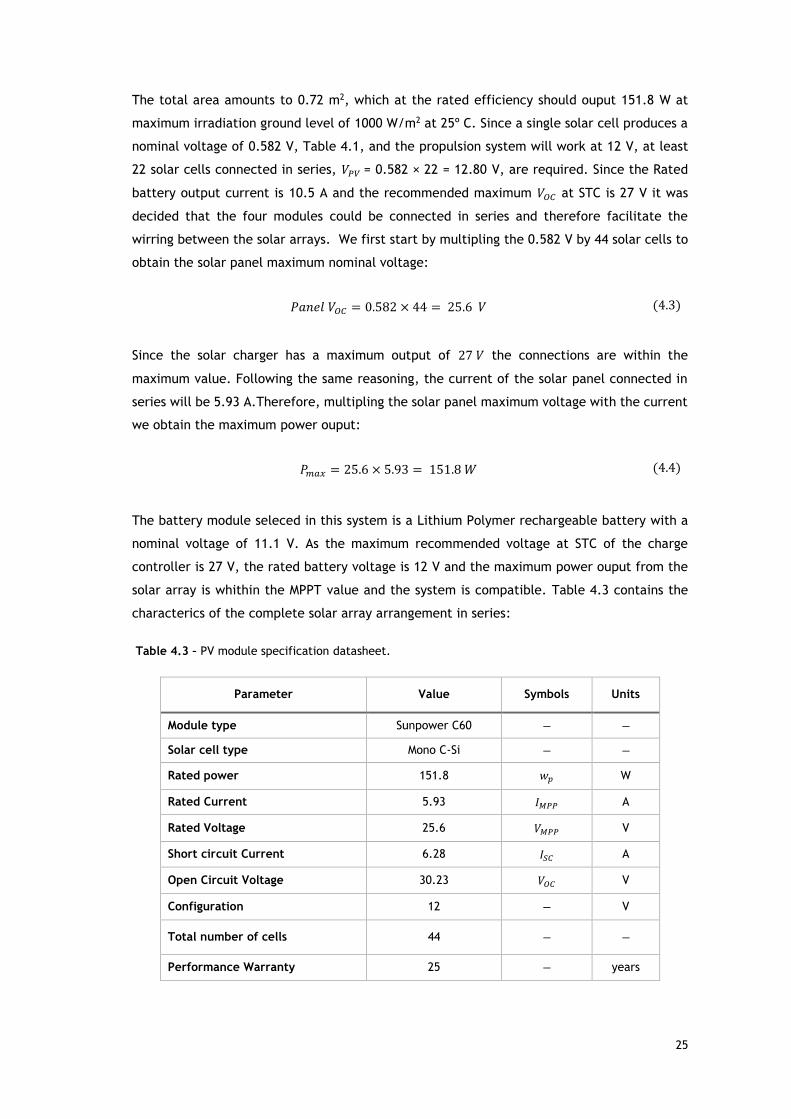
4.2.3 Solar Cells Flexiblity
The solar panel flexibility has a major importance when conforming the airfoil curvature so
its flexibitily is studied using a polynomial approximation and a second order differentiation.
Figure 4.5 shows the 12 % airfoil upper wing surface.
Figure 4.5- Upper Wing Surface using non-dimensional coordinates.
The second derivative of a function is the derivative of the derivative of that function which
represents the curvature. We write it as 𝑝′′(𝑥) or as 𝑑2𝑝
𝑑𝑥2 and it studies the rate of change of
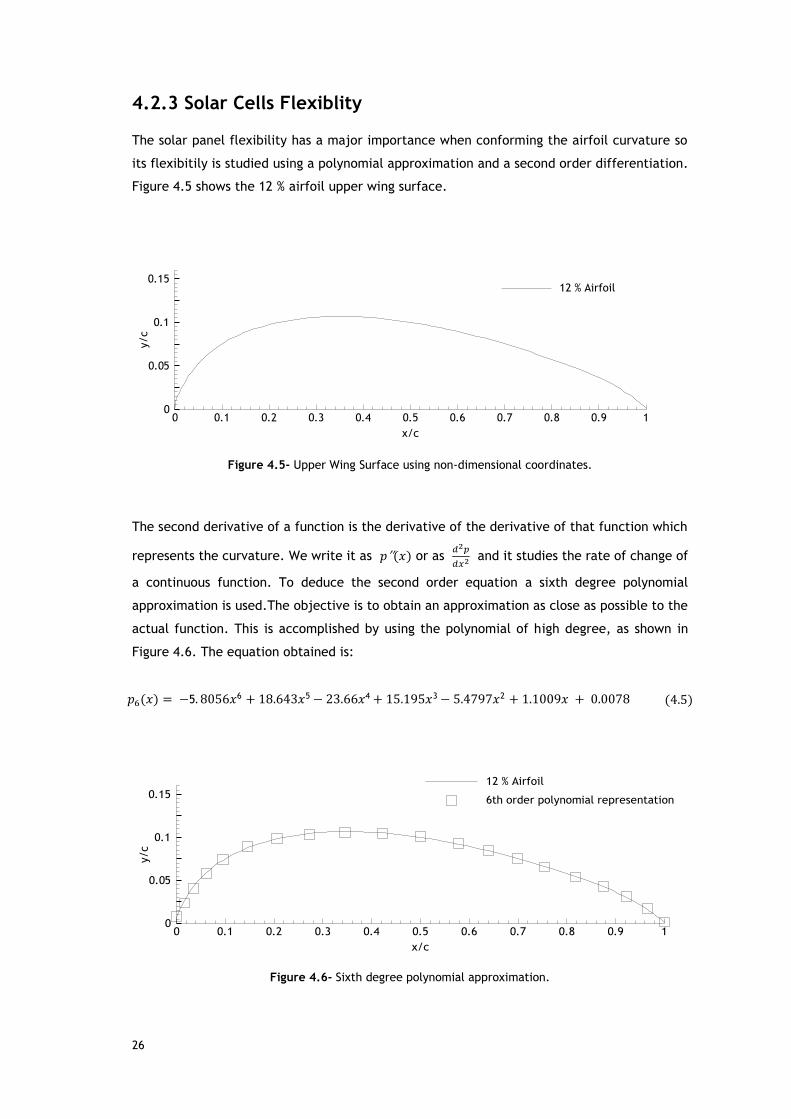
a continuous function. To deduce the second order equation a sixth degree polynomial
approximation is used.The objective is to obtain an approximation as close as possible to the
actual function. This is accomplished by using the polynomial of high degree, as shown in
Figure 4.6. The equation obtained is:
Figure 4.6- Sixth degree polynomial approximation.
x/c
y/c
0 0.1 0.2 0.3 0.4 0.5 0.6 0.7 0.8 0.9 10
0.05
0.1
0.1512 % Airfoil
x/c
y/c
0 0.1 0.2 0.3 0.4 0.5 0.6 0.7 0.8 0.9 10
0.05
0.1
0.15
12 % Airfoil
6th order polynomial representation
𝑝6(𝑥) = −5. 8056𝑥6 + 18.643𝑥5 − 23.66𝑥4 + 15.195𝑥3 − 5.4797𝑥2 + 1.1009𝑥 + 0.0078 (4.5)
27
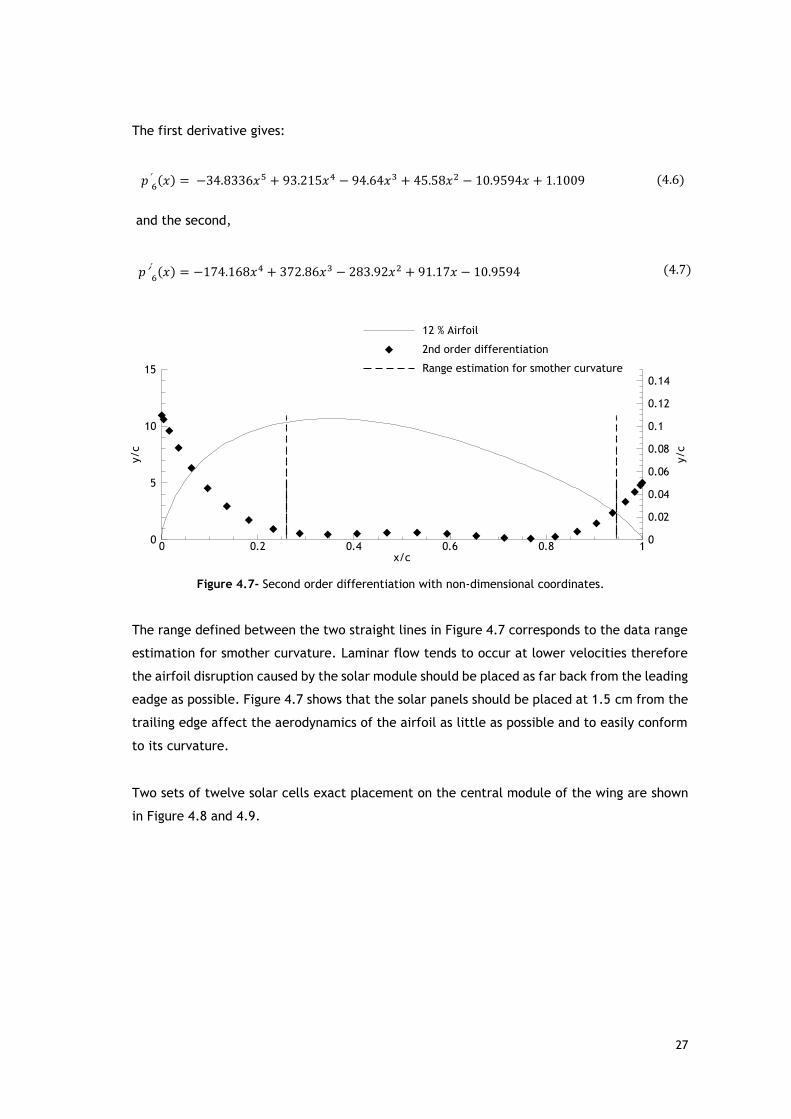
The first derivative gives:
and the second,
Figure 4.7- Second order differentiation with non-dimensional coordinates.
The range defined between the two straight lines in Figure 4.7 corresponds to the data range
estimation for smother curvature. Laminar flow tends to occur at lower velocities therefore
the airfoil disruption caused by the solar module should be placed as far back from the leading
eadge as possible. Figure 4.7 shows that the solar panels should be placed at 1.5 cm from the
trailing edge affect the aerodynamics of the airfoil as little as possible and to easily conform
to its curvature.
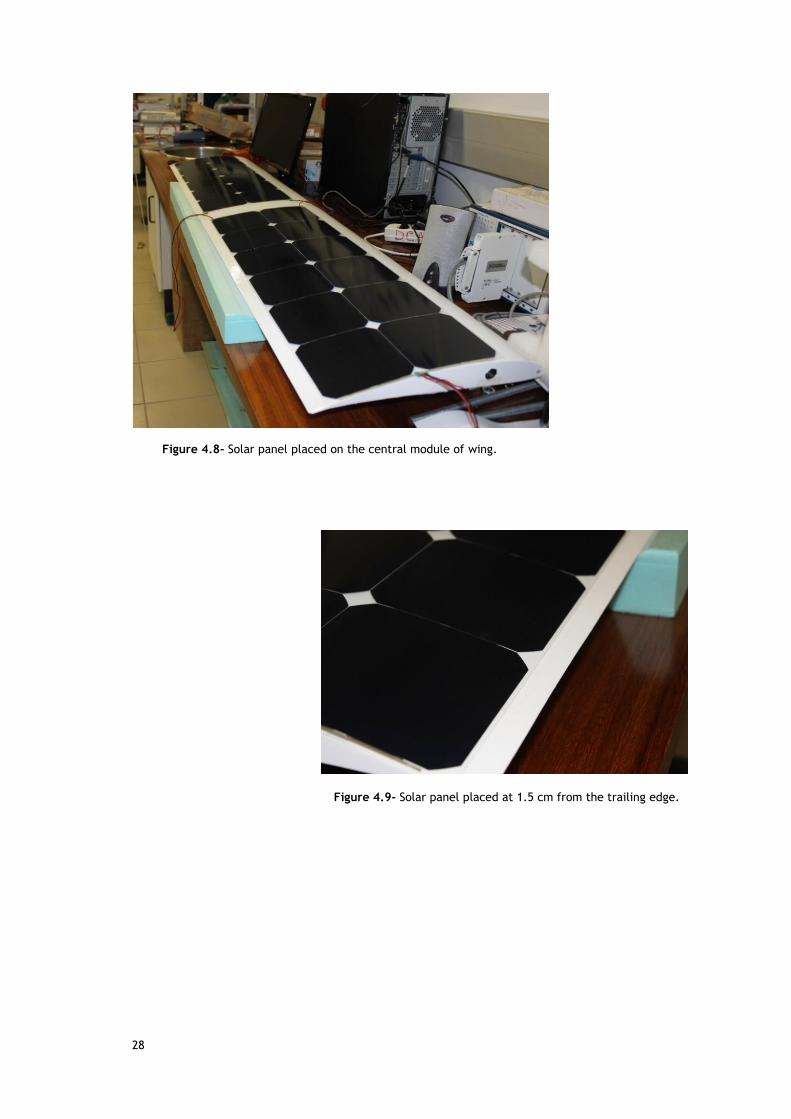
Two sets of twelve solar cells exact placement on the central module of the wing are shown
in Figure 4.8 and 4.9.
x/c
y/c
y/c
0 0.2 0.4 0.6 0.8 10
5
10
15
0
0.02
0.04
0.06
0.08
0.1
0.12
0.14
12 % Airfoil
2nd order differentiation
Range estimation for smother curvature
𝑝′6
(𝑥) = −34.8336𝑥5 + 93.215𝑥4 − 94.64𝑥3 + 45.58𝑥2 − 10.9594𝑥 + 1.1009 (4.6)
𝑝′′6
(𝑥) = −174.168𝑥4 + 372.86𝑥3 − 283.92𝑥2 + 91.17𝑥 − 10.9594 (4.7)
28
Figure 4.8- Solar panel placed on the central module of wing.
Figure 4.9- Solar panel placed at 1.5 cm from the trailing edge.
29
Chapter 5
Propulsion System Components, Electric
Configuration and Installation on the Wing
Unmanned aerial vechicles are ideally suited for long endurance flights, but to be able to
make full use of this feature, effective power sources need to be developed to ensure the
long endurance functionality of the propulsion system and onboard equipment. The objective
of this section is to describe each different component of the solar powered system and
present the complete electric propulsion design.
5.1 Propulsion System components
A solar energy system that is properly installed and adequately sized will not require
significant management. However, for those times of marginal sun or very large power
requirements it is important to understand the relationship between the battery charge level,
the amount of charge that they are receveing and the power being withdrawn from the
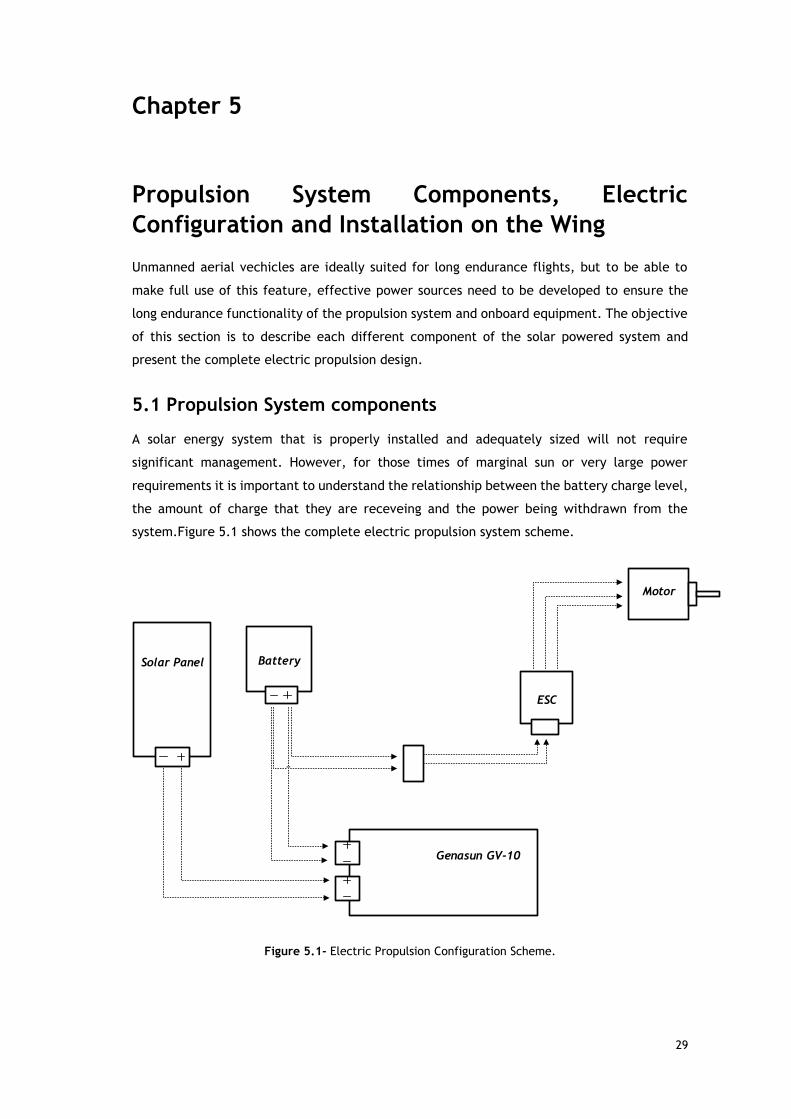
system.Figure 5.1 shows the complete electric propulsion system scheme.
Solar Panel Battery
ESC
Genasun GV-10
Motor
Figure 5.1- Electric Propulsion Configuration Scheme.
30
5.1.1 Solar Panel
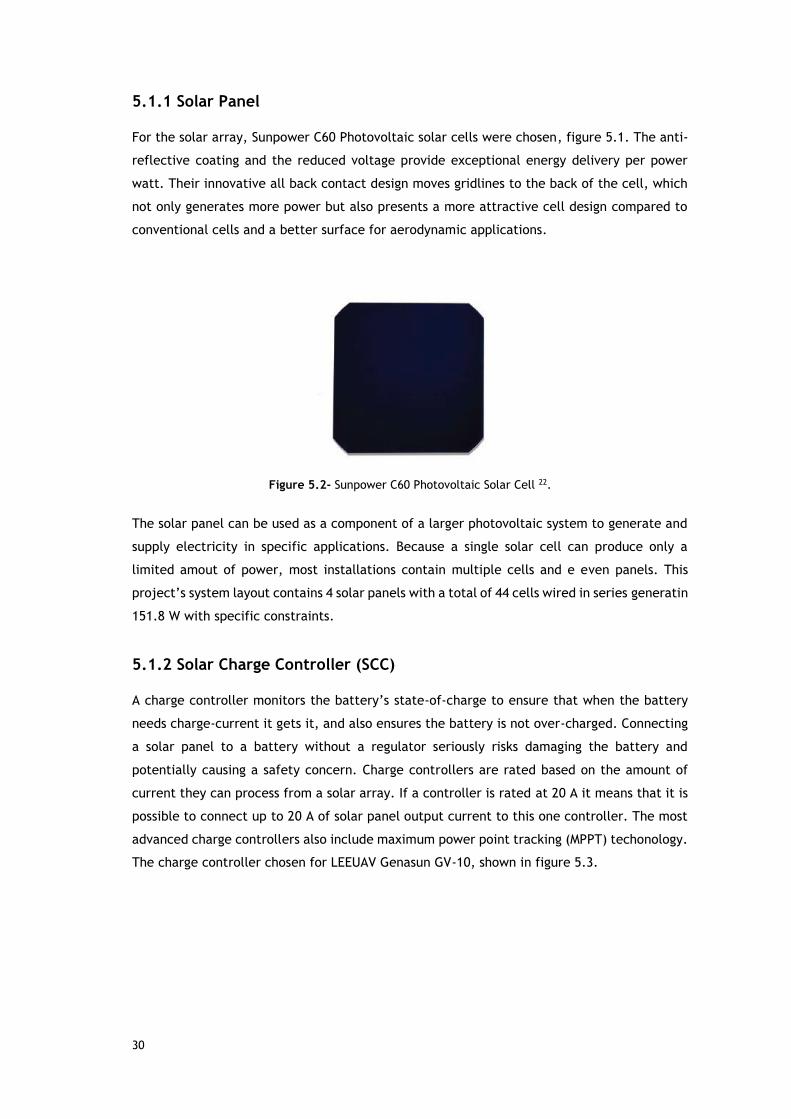
For the solar array, Sunpower C60 Photovoltaic solar cells were chosen, figure 5.1. The anti-
reflective coating and the reduced voltage provide exceptional energy delivery per power
watt. Their innovative all back contact design moves gridlines to the back of the cell, which
not only generates more power but also presents a more attractive cell design compared to
conventional cells and a better surface for aerodynamic applications.
Figure 5.2- Sunpower C60 Photovoltaic Solar Cell 22.
The solar panel can be used as a component of a larger photovoltaic system to generate and
supply electricity in specific applications. Because a single solar cell can produce only a
limited amout of power, most installations contain multiple cells and e even panels. This
project’s system layout contains 4 solar panels with a total of 44 cells wired in series generatin
151.8 W with specific constraints.
5.1.2 Solar Charge Controller (SCC)
A charge controller monitors the battery’s state-of-charge to ensure that when the battery
needs charge-current it gets it, and also ensures the battery is not over-charged. Connecting
a solar panel to a battery without a regulator seriously risks damaging the battery and
potentially causing a safety concern. Charge controllers are rated based on the amount of
current they can process from a solar array. If a controller is rated at 20 A it means that it is
possible to connect up to 20 A of solar panel output current to this one controller. The most
advanced charge controllers also include maximum power point tracking (MPPT) techonology.
The charge controller chosen for LEEUAV Genasun GV-10, shown in figure 5.3.
31
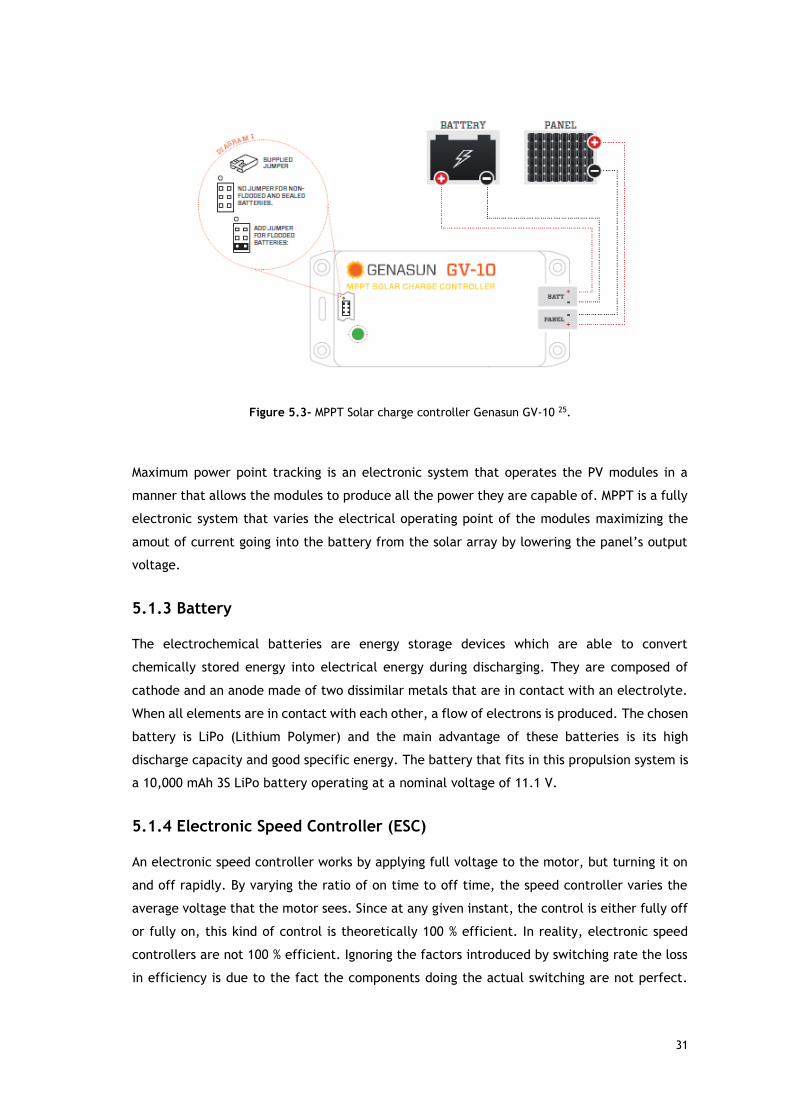
Figure 5.3- MPPT Solar charge controller Genasun GV-10 25.
Maximum power point tracking is an electronic system that operates the PV modules in a
manner that allows the modules to produce all the power they are capable of. MPPT is a fully
electronic system that varies the electrical operating point of the modules maximizing the
amout of current going into the battery from the solar array by lowering the panel’s output
voltage.
5.1.3 Battery
The electrochemical batteries are energy storage devices which are able to convert
chemically stored energy into electrical energy during discharging. They are composed of
cathode and an anode made of two dissimilar metals that are in contact with an electrolyte.
When all elements are in contact with each other, a flow of electrons is produced. The chosen
battery is LiPo (Lithium Polymer) and the main advantage of these batteries is its high
discharge capacity and good specific energy. The battery that fits in this propulsion system is
a 10,000 mAh 3S LiPo battery operating at a nominal voltage of 11.1 V.
5.1.4 Electronic Speed Controller (ESC)
An electronic speed controller works by applying full voltage to the motor, but turning it on
and off rapidly. By varying the ratio of on time to off time, the speed controller varies the
average voltage that the motor sees. Since at any given instant, the control is either fully off
or fully on, this kind of control is theoretically 100 % efficient. In reality, electronic speed
controllers are not 100 % efficient. Ignoring the factors introduced by switching rate the loss
in efficiency is due to the fact the components doing the actual switching are not perfect.
32
They are not mechanical switches, and therefore have significant resistance. Whenever there
is current flowing through a resistence, there is a power loss. When choosing the ESC it is
necessary taking into acount the carrying current capacity, which is at least 65 A already
established on the prelimany design of the LEEUAV. The selected ESC is Castle Creations
Phoenix Edge model lite 100 A, supporting a maximum current of 100 A.
5.1.5 Electric Motor and Propeller
An electric motor uses electrical energy to produce mechanical work. The selection of a
particular motor depends obviously on its application. Its choise has a major influence on the
aircraft performance. The most important factor to consider is the power required for all
mission phases and the energy consumption during the mission as a whole. Finding a
combination of electric motor and propeller that matches a particular airplane and its desired
performance is complex if done in an exact manner. The chosen motor is Hyperion ZS 3025-
10 with a 13”x8” propeller.
5.2 Electric Configuration
5.2.1 Solar Panel- Charge Controller (Genasun GV-10)
Since the brigther the sunlight, the more voltage the solar cells produce, the excessive
voltage could damage the batteries. A charge controller is used to maintain the proper
charging voltage on the batteries. An American wire gauge conductor (AGW) is used to
connect the components of the solar energy system, ensuring low loss of energy and
preventing overheating. The AWG is a standardized wire gauge system for the diameters of
round, solid, nonferrous, electrically conducting wire. The larger the AWG number or wire
gauge, the smaller the physical size of the wire. The smallest AWG size is 40 and the largest
is 0000. Since the maximum current ouput from the solar panel is 6A the AGW 20 was first
chosen but due to its overheating and power losses a second choice led to AGW 12 with a
length of 40 cm.
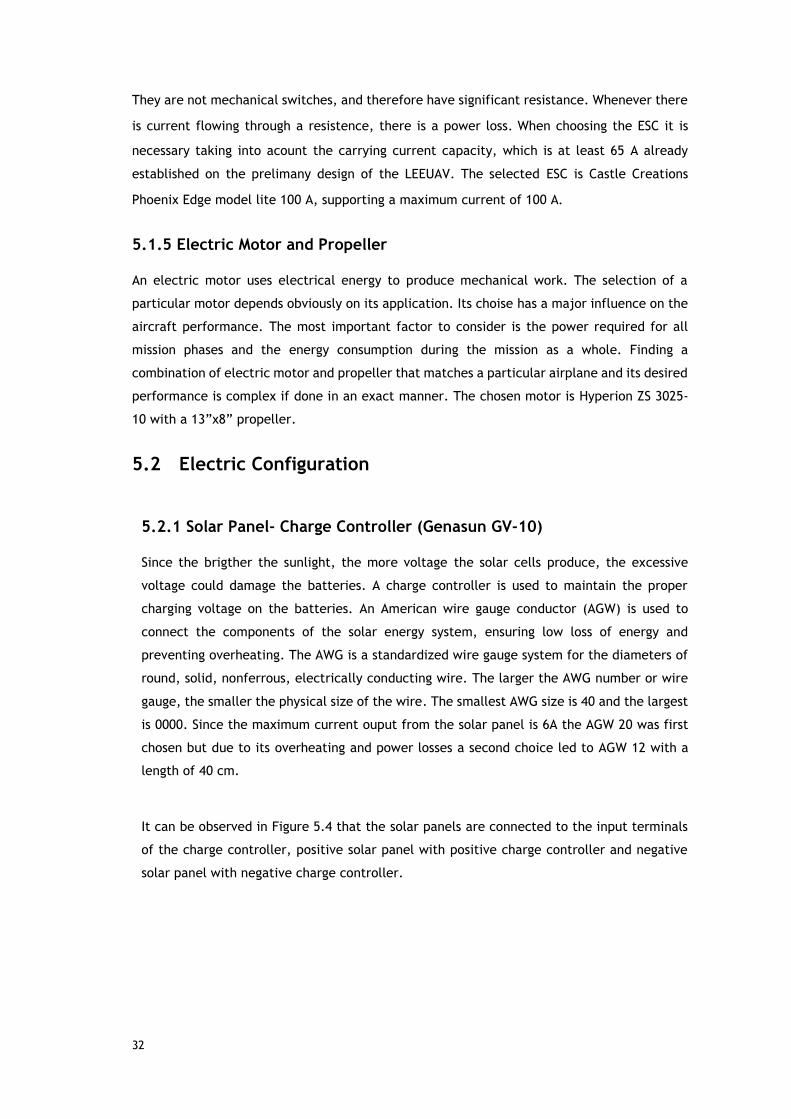
It can be observed in Figure 5.4 that the solar panels are connected to the input terminals
of the charge controller, positive solar panel with positive charge controller and negative
solar panel with negative charge controller.
33
Figure 5.4- Solar Panel connect to the Charge controller 25.
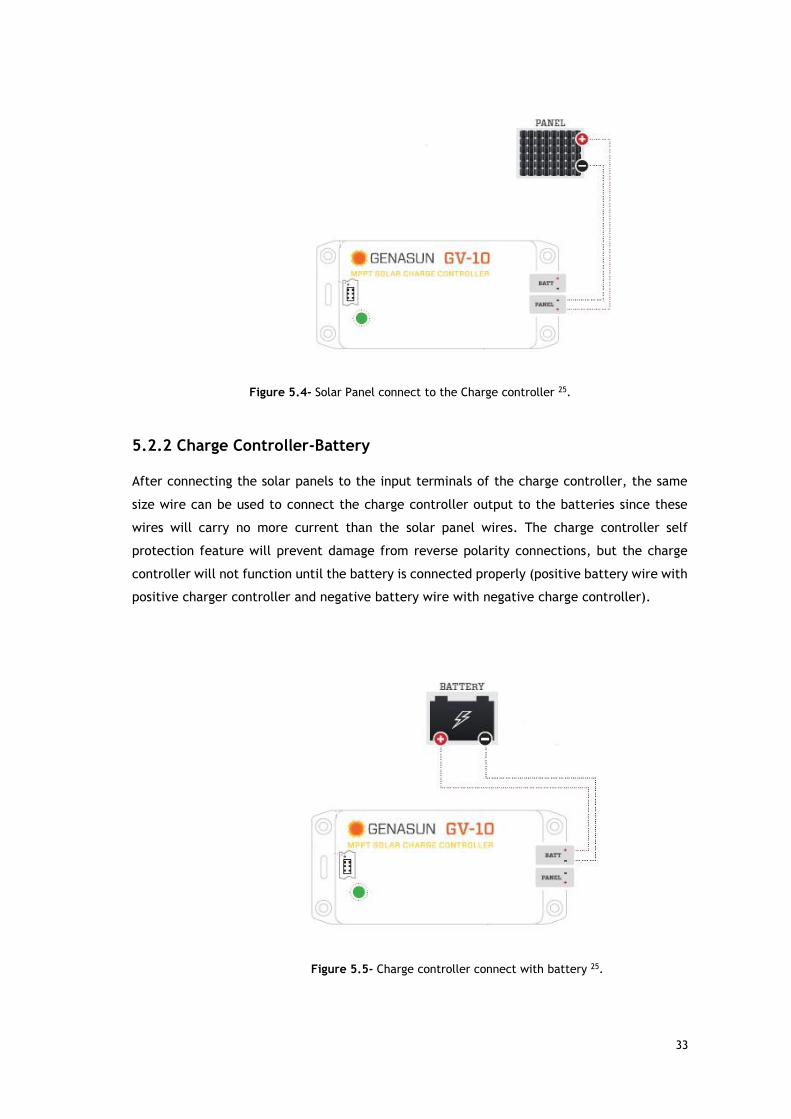
5.2.2 Charge Controller-Battery
After connecting the solar panels to the input terminals of the charge controller, the same
size wire can be used to connect the charge controller output to the batteries since these
wires will carry no more current than the solar panel wires. The charge controller self
protection feature will prevent damage from reverse polarity connections, but the charge
controller will not function until the battery is connected properly (positive battery wire with
positive charger controller and negative battery wire with negative charge controller).
Figure 5.5- Charge controller connect with battery 25.
34
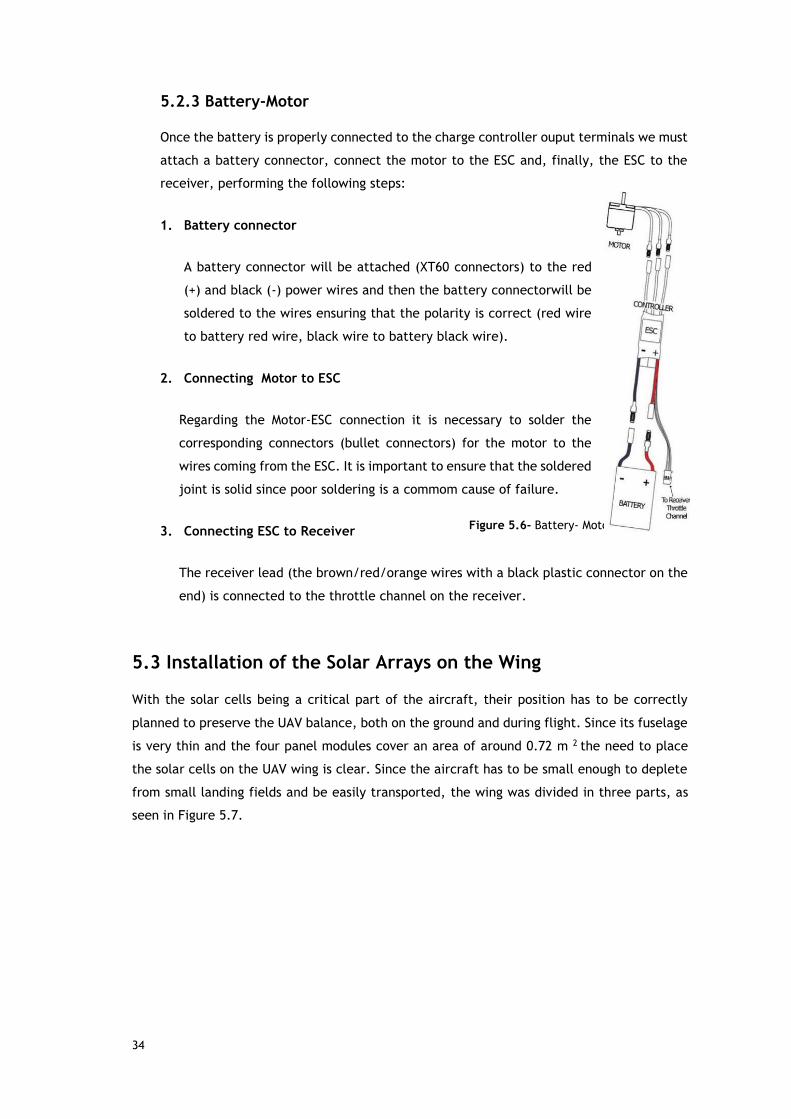
5.2.3 Battery-Motor
Once the battery is properly connected to the charge controller ouput terminals we must
attach a battery connector, connect the motor to the ESC and, finally, the ESC to the
receiver, performing the following steps:
1. Battery connector
A battery connector will be attached (XT60 connectors) to the red
(+) and black (-) power wires and then the battery connectorwill be
soldered to the wires ensuring that the polarity is correct (red wire
to battery red wire, black wire to battery black wire).
2. Connecting Motor to ESC
Regarding the Motor-ESC connection it is necessary to solder the
corresponding connectors (bullet connectors) for the motor to the
wires coming from the ESC. It is important to ensure that the soldered
joint is solid since poor soldering is a commom cause of failure.
3. Connecting ESC to Receiver
The receiver lead (the brown/red/orange wires with a black plastic connector on the
end) is connected to the throttle channel on the receiver.
5.3 Installation of the Solar Arrays on the Wing
With the solar cells being a critical part of the aircraft, their position has to be correctly
planned to preserve the UAV balance, both on the ground and during flight. Since its fuselage
is very thin and the four panel modules cover an area of around 0.72 m 2 the need to place
the solar cells on the UAV wing is clear. Since the aircraft has to be small enough to deplete
from small landing fields and be easily transported, the wing was divided in three parts, as
seen in Figure 5.7.
Figure 5.6- Battery- Motor connection 26.
35
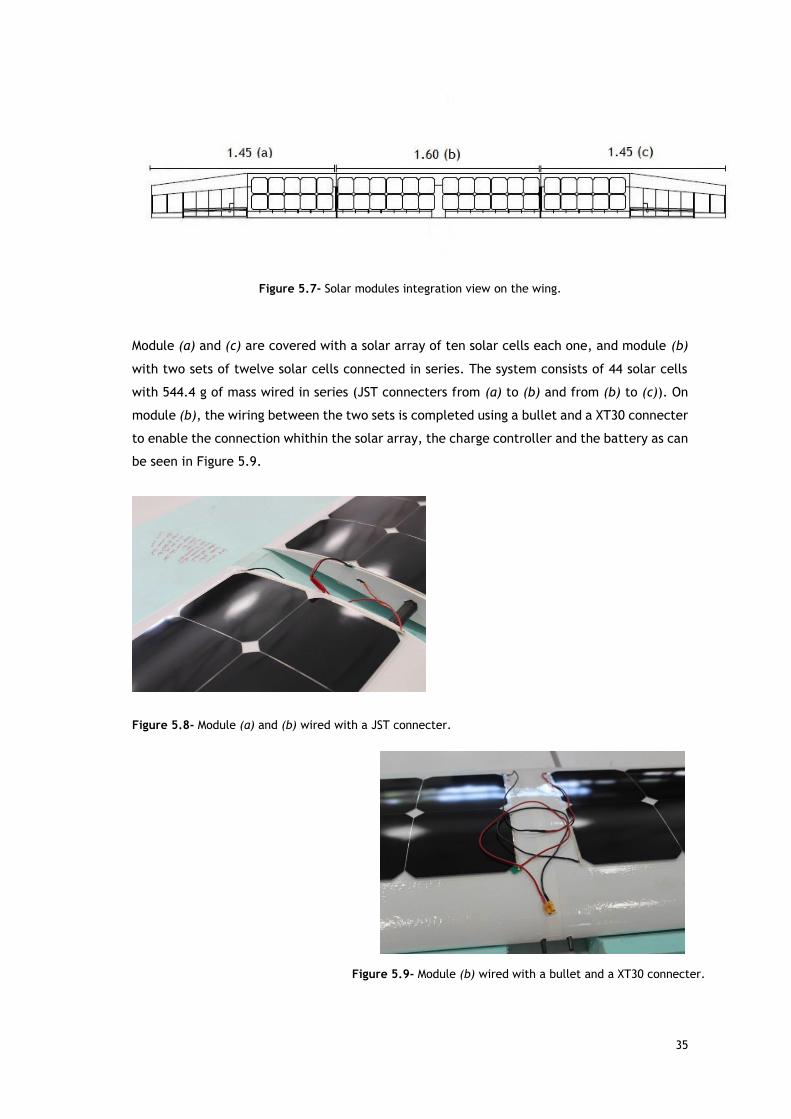
Figure 5.7- Solar modules integration view on the wing.
Module (a) and (c) are covered with a solar array of ten solar cells each one, and module (b)
with two sets of twelve solar cells connected in series. The system consists of 44 solar cells
with 544.4 g of mass wired in series (JST connecters from (a) to (b) and from (b) to (c)). On
module (b), the wiring between the two sets is completed using a bullet and a XT30 connecter
to enable the connection whithin the solar array, the charge controller and the battery as can
be seen in Figure 5.9.
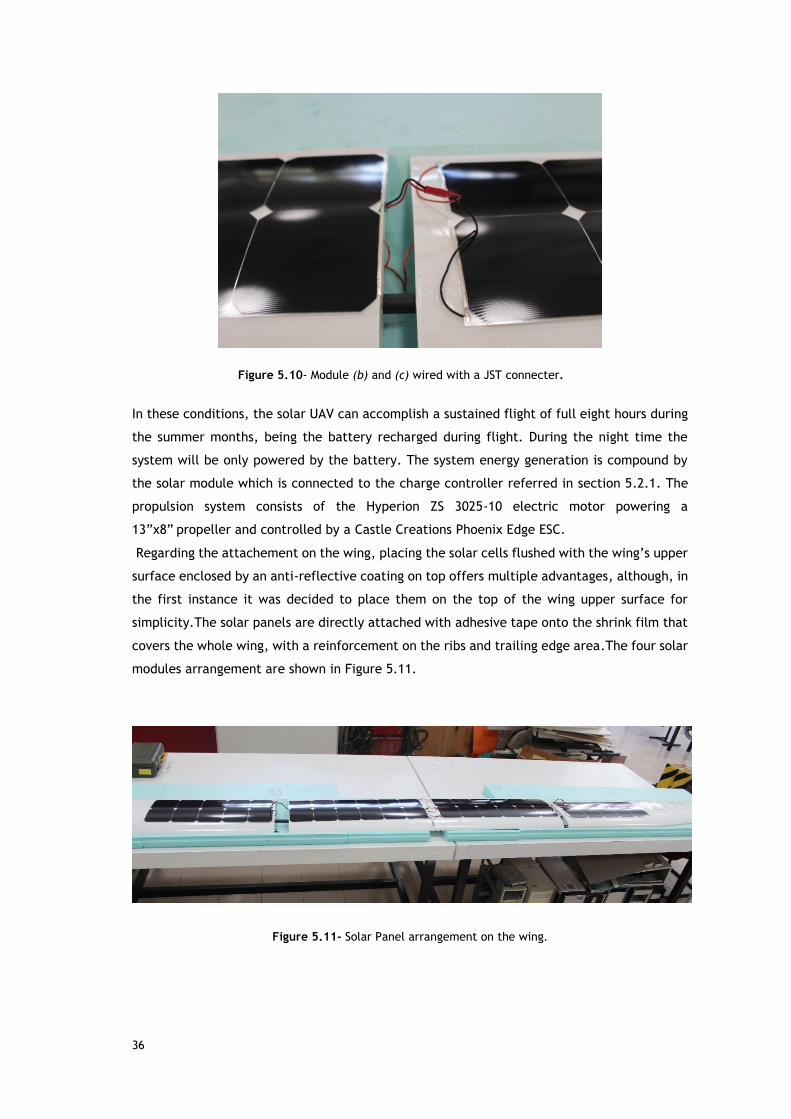
Figure 5.8- Module (a) and (b) wired with a JST connecter.
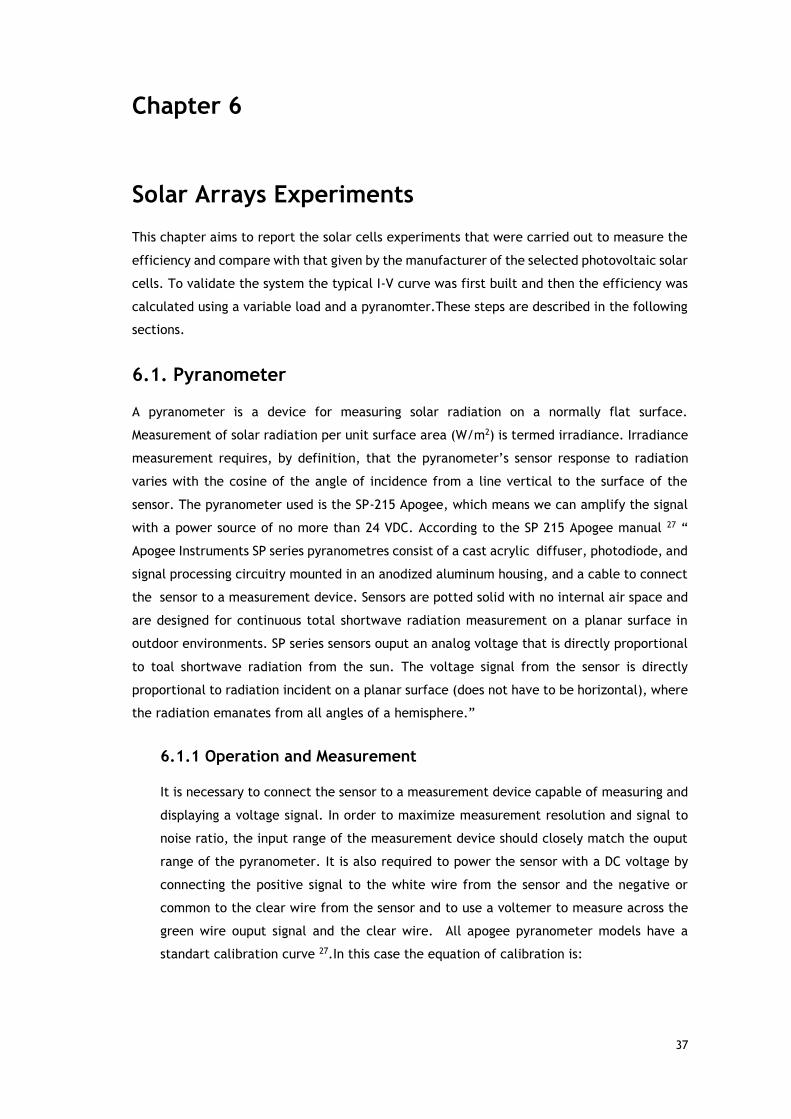
Figure 5.9- Module (b) wired with a bullet and a XT30 connecter.
36
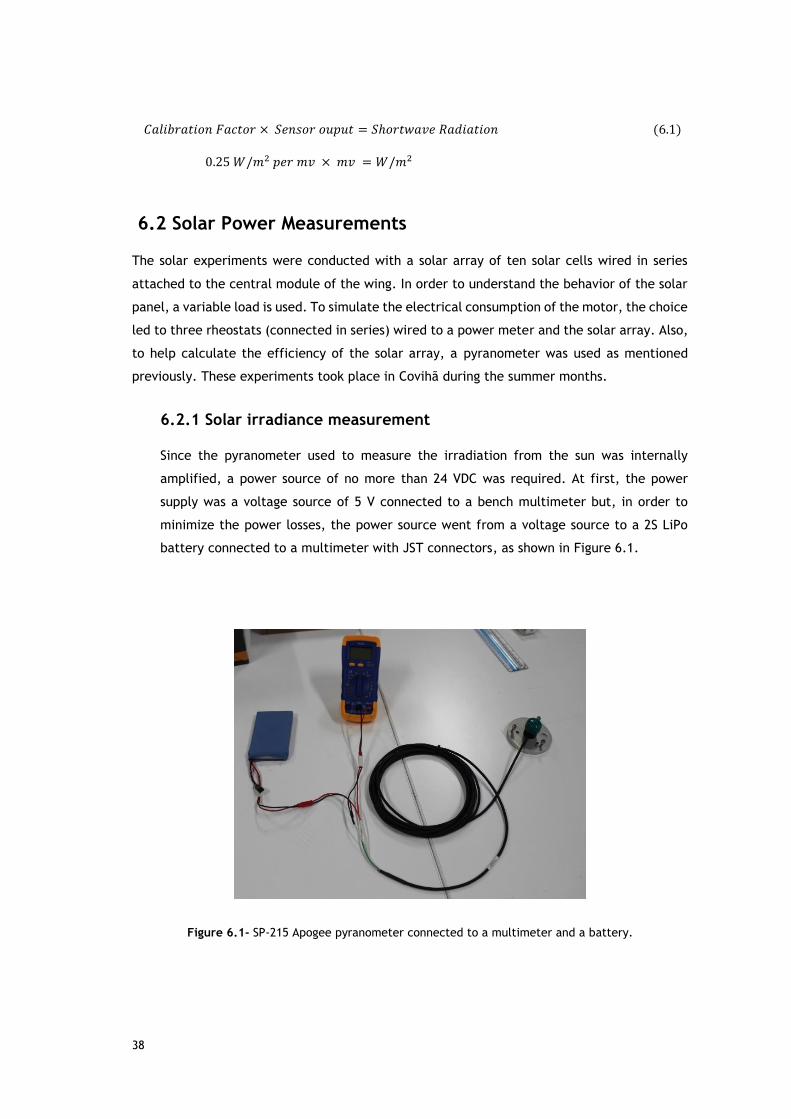
In these conditions, the solar UAV can accomplish a sustained flight of full eight hours during
the summer months, being the battery recharged during flight. During the night time the
system will be only powered by the battery. The system energy generation is compound by
the solar module which is connected to the charge controller referred in section 5.2.1. The
propulsion system consists of the Hyperion ZS 3025-10 electric motor powering a
13”x8” propeller and controlled by a Castle Creations Phoenix Edge ESC.
Regarding the attachement on the wing, placing the solar cells flushed with the wing’s upper
surface enclosed by an anti-reflective coating on top offers multiple advantages, although, in
the first instance it was decided to place them on the top of the wing upper surface for
simplicity.The solar panels are directly attached with adhesive tape onto the shrink film that
covers the whole wing, with a reinforcement on the ribs and trailing edge area.The four solar
modules arrangement are shown in Figure 5.11.
Figure 5.11- Solar Panel arrangement on the wing.
Figure 5.10- Module (b) and (c) wired with a JST connecter.
37
Chapter 6
Solar Arrays Experiments
This chapter aims to report the solar cells experiments that were carried out to measure the
efficiency and compare with that given by the manufacturer of the selected photovoltaic solar
cells. To validate the system the typical I-V curve was first built and then the efficiency was
calculated using a variable load and a pyranomter.These steps are described in the following
sections.
6.1. Pyranometer
A pyranometer is a device for measuring solar radiation on a normally flat surface.
Measurement of solar radiation per unit surface area (W/m2) is termed irradiance. Irradiance
measurement requires, by definition, that the pyranometer’s sensor response to radiation
varies with the cosine of the angle of incidence from a line vertical to the surface of the
sensor. The pyranometer used is the SP-215 Apogee, which means we can amplify the signal
with a power source of no more than 24 VDC. According to the SP 215 Apogee manual 27 “
Apogee Instruments SP series pyranometres consist of a cast acrylic diffuser, photodiode, and
signal processing circuitry mounted in an anodized aluminum housing, and a cable to connect
the sensor to a measurement device. Sensors are potted solid with no internal air space and
are designed for continuous total shortwave radiation measurement on a planar surface in
outdoor environments. SP series sensors ouput an analog voltage that is directly proportional
to toal shortwave radiation from the sun. The voltage signal from the sensor is directly
proportional to radiation incident on a planar surface (does not have to be horizontal), where
the radiation emanates from all angles of a hemisphere.”
6.1.1 Operation and Measurement
It is necessary to connect the sensor to a measurement device capable of measuring and
displaying a voltage signal. In order to maximize measurement resolution and signal to
noise ratio, the input range of the measurement device should closely match the ouput
range of the pyranometer. It is also required to power the sensor with a DC voltage by
connecting the positive signal to the white wire from the sensor and the negative or
common to the clear wire from the sensor and to use a voltemer to measure across the
green wire ouput signal and the clear wire. All apogee pyranometer models have a
standart calibration curve 27.In this case the equation of calibration is:
38
6.2 Solar Power Measurements
The solar experiments were conducted with a solar array of ten solar cells wired in series
attached to the central module of the wing. In order to understand the behavior of the solar
panel, a variable load is used. To simulate the electrical consumption of the motor, the choice
led to three rheostats (connected in series) wired to a power meter and the solar array. Also,
to help calculate the efficiency of the solar array, a pyranometer was used as mentioned
previously. These experiments took place in Covihã during the summer months.
6.2.1 Solar irradiance measurement
Since the pyranometer used to measure the irradiation from the sun was internally
amplified, a power source of no more than 24 VDC was required. At first, the power
supply was a voltage source of 5 V connected to a bench multimeter but, in order to
minimize the power losses, the power source went from a voltage source to a 2S LiPo
battery connected to a multimeter with JST connectors, as shown in Figure 6.1.
Figure 6.1- SP-215 Apogee pyranometer connected to a multimeter and a battery.
𝐶𝑎𝑙𝑖𝑏𝑟𝑎𝑡𝑖𝑜𝑛 𝐹𝑎𝑐𝑡𝑜𝑟 × 𝑆𝑒𝑛𝑠𝑜𝑟 𝑜𝑢𝑝𝑢𝑡 = 𝑆ℎ𝑜𝑟𝑡𝑤𝑎𝑣𝑒 𝑅𝑎𝑑𝑖𝑎𝑡𝑖𝑜𝑛
0.25 𝑊/𝑚2 𝑝𝑒𝑟 𝑚𝑣 × 𝑚𝑣 = 𝑊/𝑚2
(6.1)
39
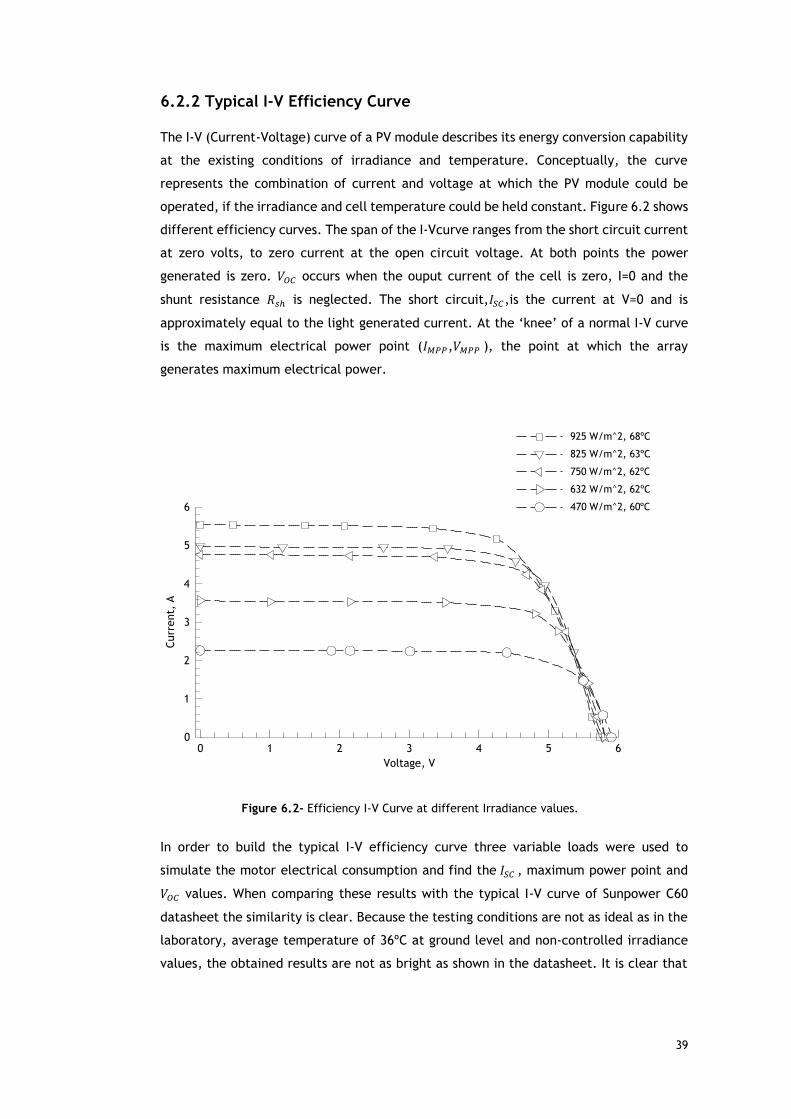
6.2.2 Typical I-V Efficiency Curve
The I-V (Current-Voltage) curve of a PV module describes its energy conversion capability
at the existing conditions of irradiance and temperature. Conceptually, the curve
represents the combination of current and voltage at which the PV module could be
operated, if the irradiance and cell temperature could be held constant. Figure 6.2 shows
different efficiency curves. The span of the I-Vcurve ranges from the short circuit current
at zero volts, to zero current at the open circuit voltage. At both points the power
generated is zero. 𝑉𝑂𝐶 occurs when the ouput current of the cell is zero, I=0 and the
shunt resistance 𝑅𝑠ℎ is neglected. The short circuit,𝐼𝑆𝐶,is the current at V=0 and is
approximately equal to the light generated current. At the ‘knee’ of a normal I-V curve
is the maximum electrical power point (𝐼𝑀𝑃𝑃,𝑉𝑀𝑃𝑃 ), the point at which the array
generates maximum electrical power.
Figure 6.2- Efficiency I-V Curve at different Irradiance values.
In order to build the typical I-V efficiency curve three variable loads were used to
simulate the motor electrical consumption and find the 𝐼𝑆𝐶 , maximum power point and
𝑉𝑂𝐶 values. When comparing these results with the typical I-V curve of Sunpower C60
datasheet the similarity is clear. Because the testing conditions are not as ideal as in the
laboratory, average temperature of 36ºC at ground level and non-controlled irradiance
values, the obtained results are not as bright as shown in the datasheet. It is clear that
Voltage, V
Current,
A
0 1 2 3 4 5 60
1
2
3
4
5
6
925 W/m^2, 68ºC
825 W/m^2, 63ºC
750 W/m^2, 62ºC
632 W/m^2, 62ºC
470 W/m^2, 60ºC
40
the irradiation is different throughout the day which means the irradiation at the
beginning of the test is different from the irradiation at the end. The other reason for
the difference between the curves is the fact that the manufacturer’s curves were
obtained at a controlled environment with STC conditions and these tests were
conducted with the cell being heated by the sun making the solar array less efficient
(detailed study in section 6.4).
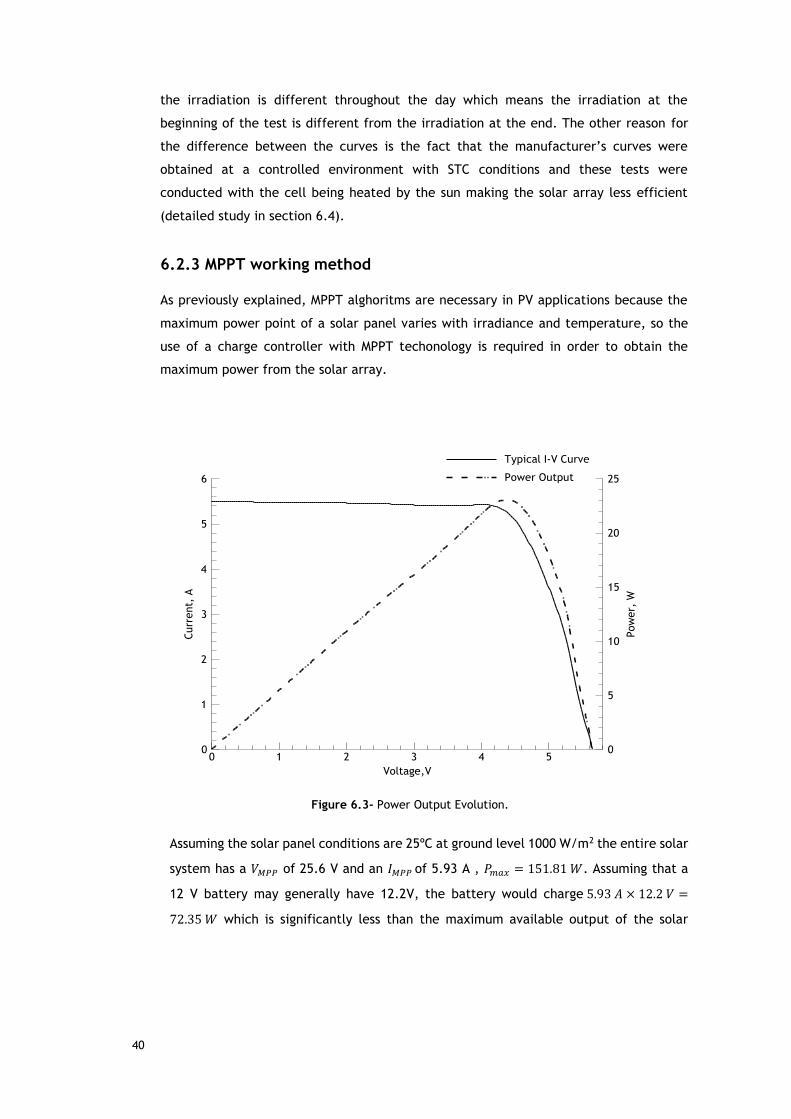
6.2.3 MPPT working method
As previously explained, MPPT alghoritms are necessary in PV applications because the
maximum power point of a solar panel varies with irradiance and temperature, so the
use of a charge controller with MPPT techonology is required in order to obtain the
maximum power from the solar array.
Figure 6.3- Power Output Evolution.
Assuming the solar panel conditions are 25ºC at ground level 1000 W/m2 the entire solar
system has a 𝑉𝑀𝑃𝑃 of 25.6 V and an 𝐼𝑀𝑃𝑃 of 5.93 A , 𝑃𝑚𝑎𝑥 = 151.81 𝑊. Assuming that a
12 V battery may generally have 12.2V, the battery would charge 5.93 𝐴 × 12.2 𝑉 =
72.35 𝑊 which is significantly less than the maximum available output of the solar
Voltage,V
Current,
A
Power,
W
0 1 2 3 4 50
1
2
3
4
5
6
0
5
10
15
20
25
Typical I-V Curve
Power Output
41
module (𝑃𝑚𝑎𝑥 = 151.81𝑊). The MPPT charge controller boosts(6) the voltage and the
current of the voltage and current of the system close to the I-V curve maximum power
point seen in Figure 6.3. Rather than simply connecting the module to the battery the
MPPT system charge controller calculates the voltage at which the module is able to
produce maximum power and forces the solar array to work always at the maximum
power point.
6.3 Effect of transparent film Covering on Efficiency
A film covering study was conducted in order to understand the influence of the transparent
film used to cover wings on the solar module efficiency. Solar array electrical parameters
were recorded with and without the solar film covering the panel. The experimental test
results are presented in Table 6.1.
Table 6.1- Results of the film covering experiments.
As it was expected, the solar cell covered with the film had their efficiency reduced but just
slightly. There is an ouput loss ofaround 1% when covering the solar cells with the transparent
(6) Boost- Amplify an electrical signal.
Azimuth 0º Irradiance (W/m2) Voltage (V) Current (A) Power (A) Efficiency (%)
Clean 882.5 4.39 5.12 22.5 15.9
Transparent Film 882.5 4.53 4.5 20.4 14.4
Azimuth 90º Irradiance (W/m2) Voltage (V) Current (A) Power (A) Efficiency (%)
Clean 907.5 4.52 5.04 22.8 15.7
Transparent Film 847.5 4.39 4.66 20.5 15.1
Azimuth 180º Irradiance (W/m2) Voltage (V) Current (A) Power (A) Efficiency (%)
Clean 862.5 4.52 4.66 21.1 15.3
Transparent Film 862.5 4.87 4.00 19.48 14.1
Azimuth 270º Irradiance (W/m2) Voltage (V) Current (A) Power (A) Efficiency (%)
Clean 820 4.33 4.15 18.0 13.7
Transparent Film 822.5 4.47 3.73 16.7 12.7
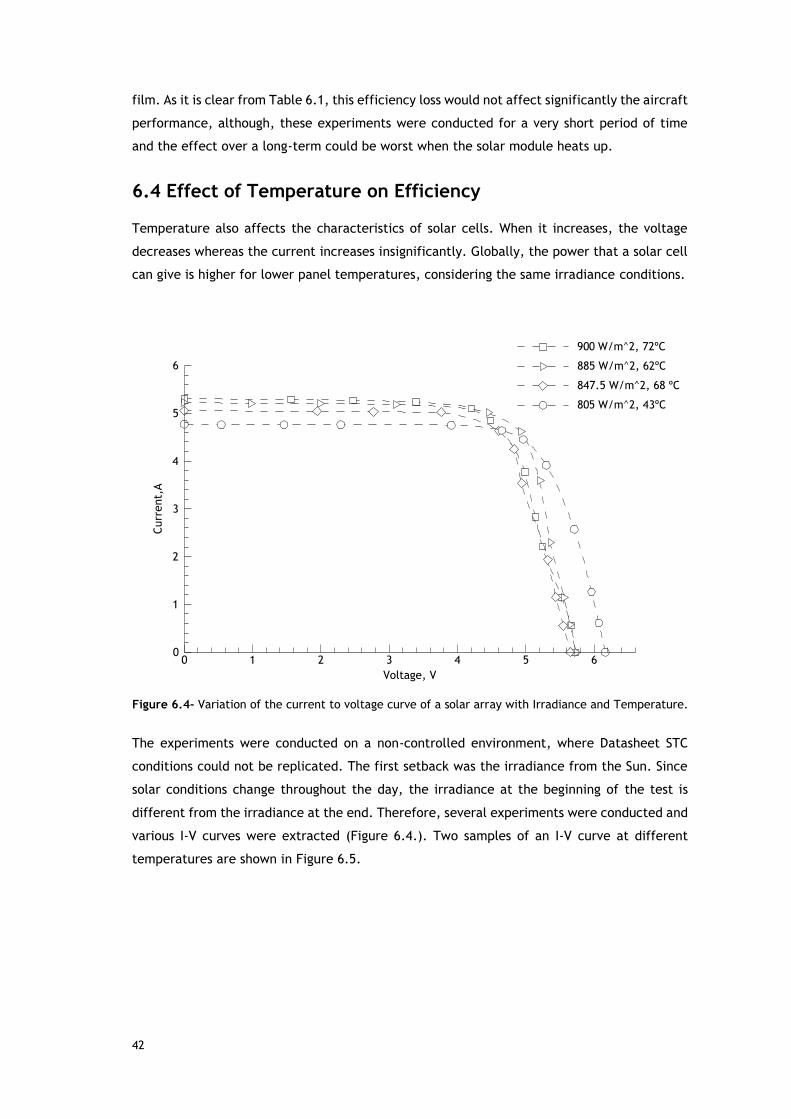
42
film. As it is clear from Table 6.1, this efficiency loss would not affect significantly the aircraft
performance, although, these experiments were conducted for a very short period of time
and the effect over a long-term could be worst when the solar module heats up.
6.4 Effect of Temperature on Efficiency
Temperature also affects the characteristics of solar cells. When it increases, the voltage
decreases whereas the current increases insignificantly. Globally, the power that a solar cell
can give is higher for lower panel temperatures, considering the same irradiance conditions.
Figure 6.4- Variation of the current to voltage curve of a solar array with Irradiance and Temperature.
The experiments were conducted on a non-controlled environment, where Datasheet STC
conditions could not be replicated. The first setback was the irradiance from the Sun. Since
solar conditions change throughout the day, the irradiance at the beginning of the test is
different from the irradiance at the end. Therefore, several experiments were conducted and
various I-V curves were extracted (Figure 6.4.). Two samples of an I-V curve at different
temperatures are shown in Figure 6.5.
Voltage, V
Current,A
0 1 2 3 4 5 60
1
2
3
4
5
6
900 W/m^2, 72ºC
885 W/m^2, 62ºC
847.5 W/m^2, 68 ºC
805 W/m^2, 43ºC

43
Figure 6.5- Two I-V curves at different temperatures.
To gather data for this chart, a PV panel was placed on the central module of the wing. The
first measurements were taken in ambient temperature conditions, and then they were taken
again after the panel was cooled with a fan. It can be concluded that the efficiency slightly
decreases from its reference amount while temperature of the cell increases. The array will
be heated up to 75ºC in a day average temperature of 36ºC when the cell is exposed directly
to the sun, which results in loss of efficiency. However, the air flowing over the wing without
a cover film decreases the temperature about 20ºC in less than 10 minutes at the speed of
2.8 m/s.Therefore, when the panel is at a higher temperature, a lower open circuit voltage
is produced and the short circuit current increases insignificantly. The I-V curve with an
irradiance value of 900 W/m2 has a maximum power ouput of 21.5 W and the I-V curve of
800 W/m2 an ouput of 22 W.
6.5 Solar angles-of-incidence
6.5.1 The Axes of Flight
Each axis of flight is an imaginary line around which an airplane can turn. Regardless of
the type of aicraft, there are three axes upon which it can move: Left and Right, Forwards
and Backwards, Up and Down. In aviation their technical names are lateral axis,
longitudinal axis and vertical axis.
Voltage, V
Current,A
0 1 2 3 4 5 60
1
2
3
4
5
6 900 W/m^2, 72ºC
805 W/m^2, 43ºC
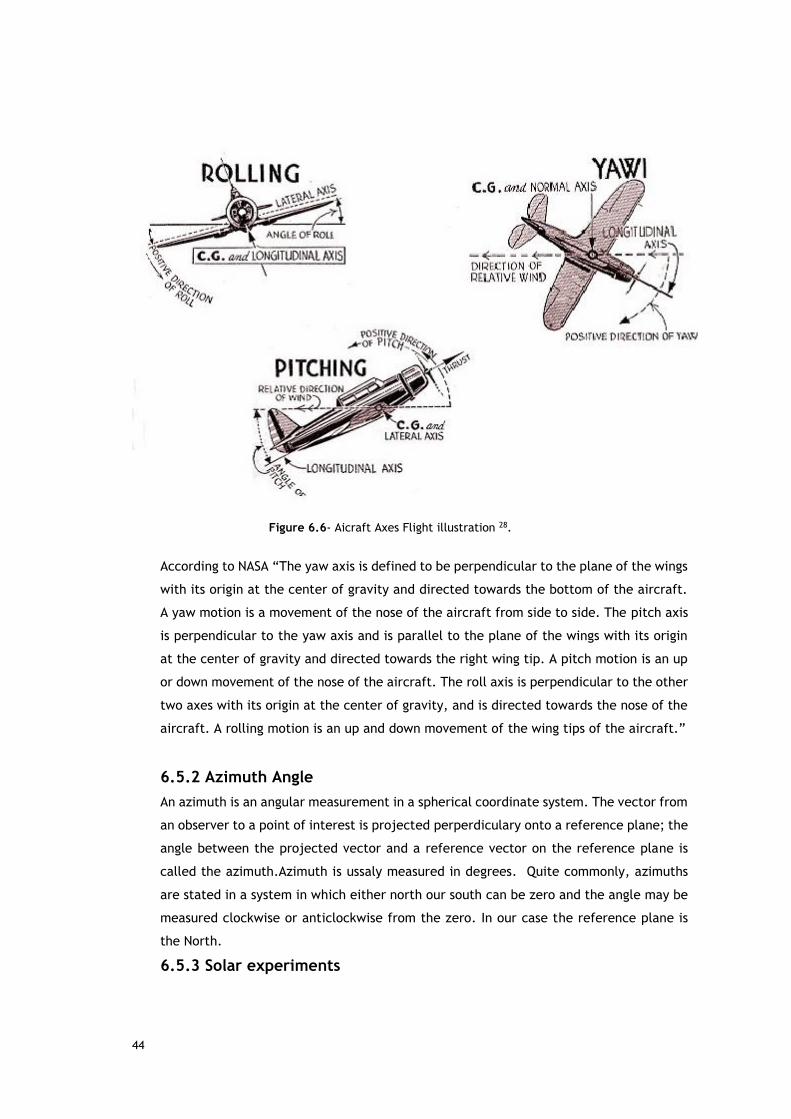
44
Figure 6.6- Aicraft Axes Flight illustration 28.
According to NASA “The yaw axis is defined to be perpendicular to the plane of the wings
with its origin at the center of gravity and directed towards the bottom of the aircraft.
A yaw motion is a movement of the nose of the aircraft from side to side. The pitch axis
is perpendicular to the yaw axis and is parallel to the plane of the wings with its origin
at the center of gravity and directed towards the right wing tip. A pitch motion is an up
or down movement of the nose of the aircraft. The roll axis is perpendicular to the other
two axes with its origin at the center of gravity, and is directed towards the nose of the
aircraft. A rolling motion is an up and down movement of the wing tips of the aircraft.”
6.5.2 Azimuth Angle
An azimuth is an angular measurement in a spherical coordinate system. The vector from
an observer to a point of interest is projected perperdiculary onto a reference plane; the
angle between the projected vector and a reference vector on the reference plane is
called the azimuth.Azimuth is ussaly measured in degrees. Quite commonly, azimuths
are stated in a system in which either north our south can be zero and the angle may be
measured clockwise or anticlockwise from the zero. In our case the reference plane is
the North.
6.5.3 Solar experiments
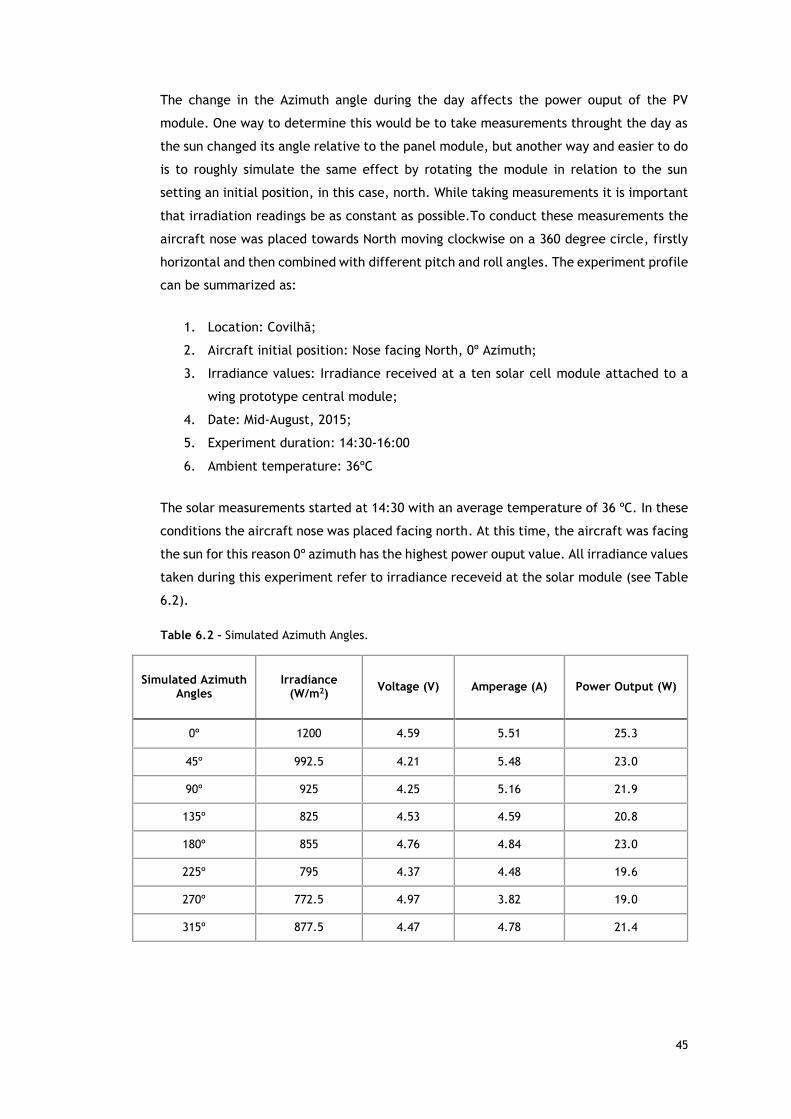
45
The change in the Azimuth angle during the day affects the power ouput of the PV
module. One way to determine this would be to take measurements throught the day as
the sun changed its angle relative to the panel module, but another way and easier to do
is to roughly simulate the same effect by rotating the module in relation to the sun
setting an initial position, in this case, north. While taking measurements it is important
that irradiation readings be as constant as possible.To conduct these measurements the
aircraft nose was placed towards North moving clockwise on a 360 degree circle, firstly
horizontal and then combined with different pitch and roll angles. The experiment profile
can be summarized as:
1. Location: Covilhã;
2. Aircraft initial position: Nose facing North, 0º Azimuth;
3. Irradiance values: Irradiance received at a ten solar cell module attached to a
wing prototype central module;
4. Date: Mid-August, 2015;
5. Experiment duration: 14:30-16:00
6. Ambient temperature: 36ºC
The solar measurements started at 14:30 with an average temperature of 36 ºC. In these
conditions the aircraft nose was placed facing north. At this time, the aircraft was facing
the sun for this reason 0º azimuth has the highest power ouput value. All irradiance values
taken during this experiment refer to irradiance receveid at the solar module (see Table
6.2).
Table 6.2 – Simulated Azimuth Angles.
Simulated Azimuth Angles
Irradiance (W/m2)
Voltage (V) Amperage (A) Power Output (W)
0º 1200 4.59 5.51 25.3
45º 992.5 4.21 5.48 23.0
90º 925 4.25 5.16 21.9
135º 825 4.53 4.59 20.8
180º 855 4.76 4.84 23.0
225º 795 4.37 4.48 19.6
270º 772.5 4.97 3.82 19.0
315º 877.5 4.47 4.78 21.4
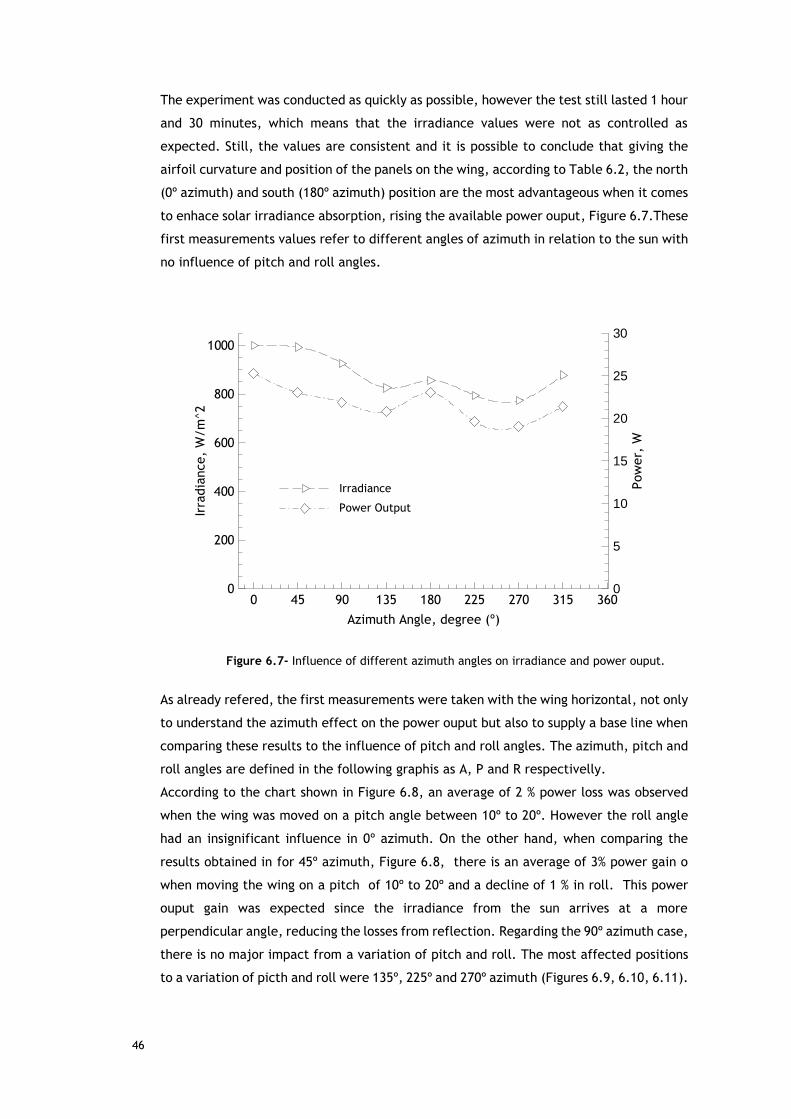
46
The experiment was conducted as quickly as possible, however the test still lasted 1 hour
and 30 minutes, which means that the irradiance values were not as controlled as
expected. Still, the values are consistent and it is possible to conclude that giving the
airfoil curvature and position of the panels on the wing, according to Table 6.2, the north
(0º azimuth) and south (180º azimuth) position are the most advantageous when it comes
to enhace solar irradiance absorption, rising the available power ouput, Figure 6.7.These
first measurements values refer to different angles of azimuth in relation to the sun with
no influence of pitch and roll angles.
Figure 6.7- Influence of different azimuth angles on irradiance and power ouput.
As already refered, the first measurements were taken with the wing horizontal, not only
to understand the azimuth effect on the power ouput but also to supply a base line when
comparing these results to the influence of pitch and roll angles. The azimuth, pitch and
roll angles are defined in the following graphis as A, P and R respectivelly.
According to the chart shown in Figure 6.8, an average of 2 % power loss was observed
when the wing was moved on a pitch angle between 10º to 20º. However the roll angle
had an insignificant influence in 0º azimuth. On the other hand, when comparing the
results obtained in for 45º azimuth, Figure 6.8, there is an average of 3% power gain o
when moving the wing on a pitch of 10º to 20º and a decline of 1 % in roll. This power
ouput gain was expected since the irradiance from the sun arrives at a more
perpendicular angle, reducing the losses from reflection. Regarding the 90º azimuth case,
there is no major impact from a variation of pitch and roll. The most affected positions
to a variation of picth and roll were 135º, 225º and 270º azimuth (Figures 6.9, 6.10, 6.11).
Azimuth Angle, degree (º)
Irradiance,W/m^2
Power,
W
0 45 90 135 180 225 270 315 3600
200
400
600
800
1000
0
5
10
15
20
25
30
Irradiance
Power Output
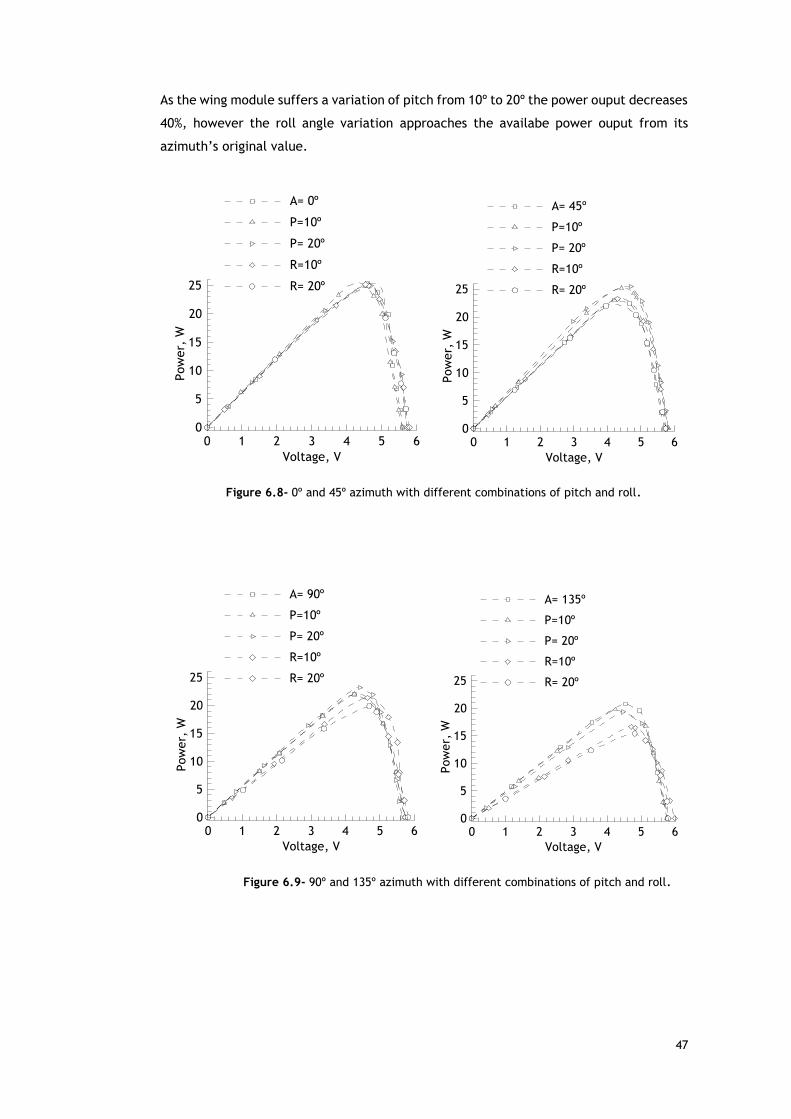
47
As the wing module suffers a variation of pitch from 10º to 20º the power ouput decreases
40%, however the roll angle variation approaches the availabe power ouput from its
azimuth’s original value.
Figure 6.8- 0º and 45º azimuth with different combinations of pitch and roll.
Figure 6.9- 90º and 135º azimuth with different combinations of pitch and roll.
Voltage, V
Power,
W
0 1 2 3 4 5 60
5
10
15
20
25
A= 0º
P=10º
P= 20º
R=10º
R= 20º
Voltage, VPower,
W0 1 2 3 4 5 6
0
5
10
15
20
25
A= 45º
P=10º
P= 20º
R=10º
R= 20º
Voltage, V
Power,
W
0 1 2 3 4 5 60
5
10
15
20
25
A= 90º
P=10º
P= 20º
R=10º
R= 20º
Voltage, V
Power,
W
0 1 2 3 4 5 60
5
10
15
20
25
A= 135º
P=10º
P= 20º
R=10º
R= 20º
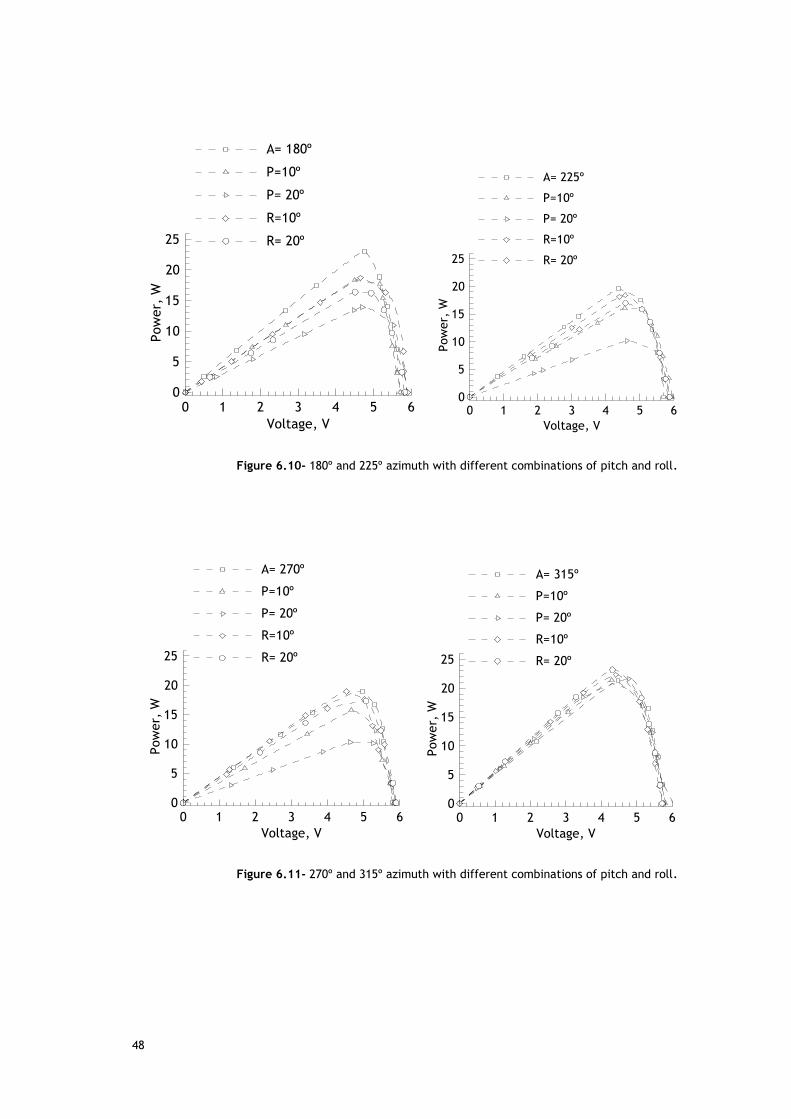
48
Figure 6.10- 180º and 225º azimuth with different combinations of pitch and roll.
Figure 6.11- 270º and 315º azimuth with different combinations of pitch and roll.
Voltage, V
Power,
W
0 1 2 3 4 5 60
5
10
15
20
25
A= 180º
P=10º
P= 20º
R=10º
R= 20º
Voltage, V
Power,
W
0 1 2 3 4 5 60
5
10
15
20
25
A= 225º
P=10º
P= 20º
R=10º
R= 20º
Voltage, V
Power,
W
0 1 2 3 4 5 60
5
10
15
20
25
A= 270º
P=10º
P= 20º
R=10º
R= 20º
Voltage, V
Power,
W
0 1 2 3 4 5 60
5
10
15
20
25
A= 315º
P=10º
P= 20º
R=10º
R= 20º
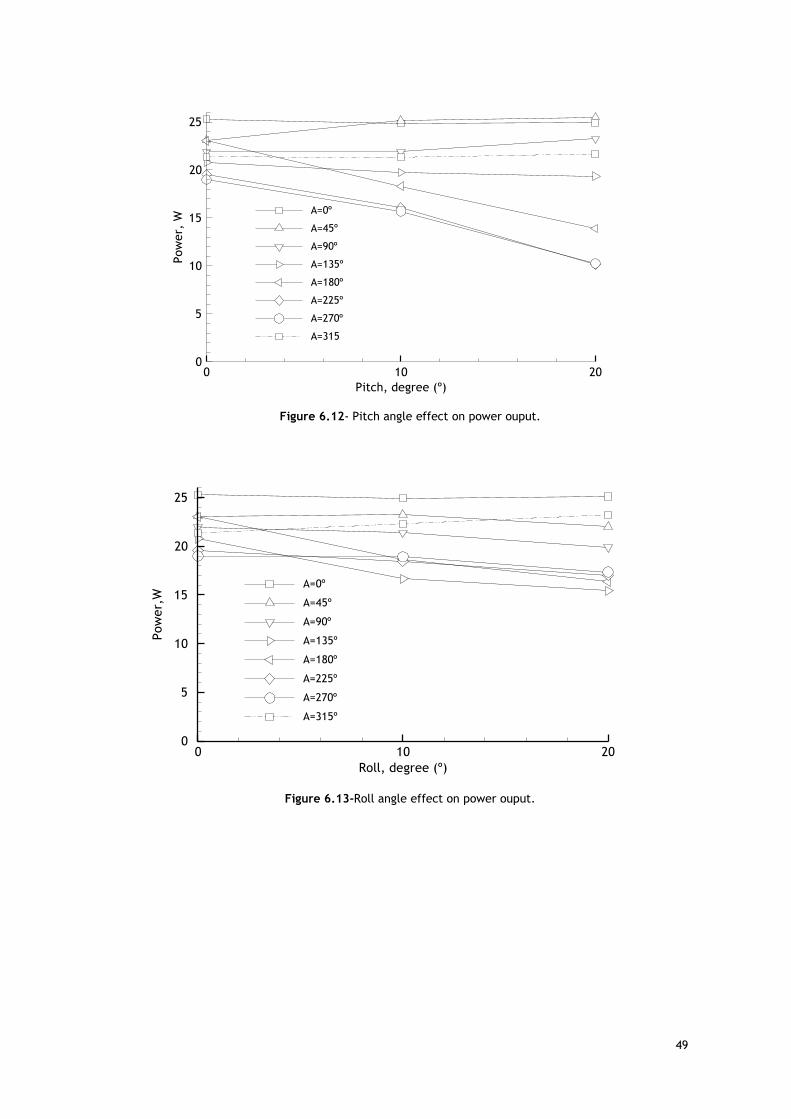
49
Figure 6.12- Pitch angle effect on power ouput.
Figure 6.13-Roll angle effect on power ouput.
Pitch, degree (º)
Power,
W
0 10 200
5
10
15
20
25
A=0º
A=45º
A=90º
A=135º
A=180º
A=225º
A=270º
A=315
Roll, degree (º)
Power,W
0 10 200
5
10
15
20
25
A=0º
A=45º
A=90º
A=135º
A=180º
A=225º
A=270º
A=315º
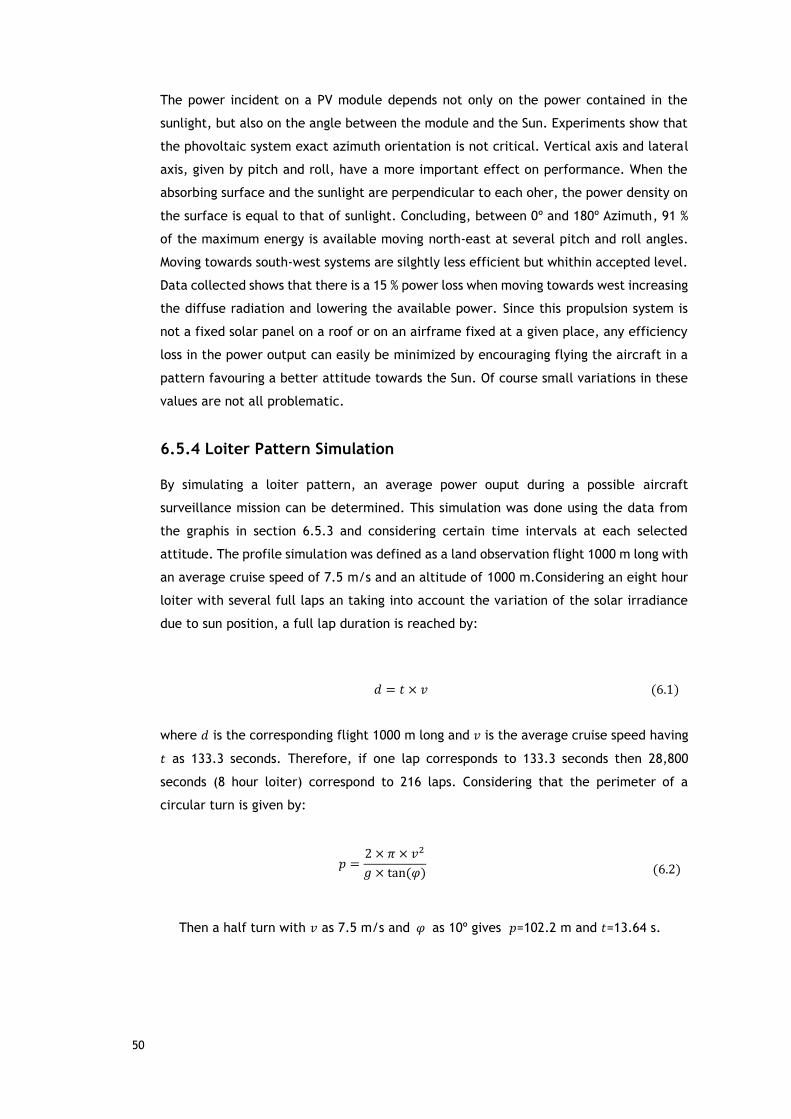
50
The power incident on a PV module depends not only on the power contained in the
sunlight, but also on the angle between the module and the Sun. Experiments show that
the phovoltaic system exact azimuth orientation is not critical. Vertical axis and lateral
axis, given by pitch and roll, have a more important effect on performance. When the
absorbing surface and the sunlight are perpendicular to each oher, the power density on
the surface is equal to that of sunlight. Concluding, between 0º and 180º Azimuth, 91 %
of the maximum energy is available moving north-east at several pitch and roll angles.
Moving towards south-west systems are silghtly less efficient but whithin accepted level.
Data collected shows that there is a 15 % power loss when moving towards west increasing
the diffuse radiation and lowering the available power. Since this propulsion system is
not a fixed solar panel on a roof or on an airframe fixed at a given place, any efficiency
loss in the power output can easily be minimized by encouraging flying the aircraft in a
pattern favouring a better attitude towards the Sun. Of course small variations in these
values are not all problematic.
6.5.4 Loiter Pattern Simulation
By simulating a loiter pattern, an average power ouput during a possible aircraft
surveillance mission can be determined. This simulation was done using the data from
the graphis in section 6.5.3 and considering certain time intervals at each selected
attitude. The profile simulation was defined as a land observation flight 1000 m long with
an average cruise speed of 7.5 m/s and an altitude of 1000 m.Considering an eight hour
loiter with several full laps an taking into account the variation of the solar irradiance
due to sun position, a full lap duration is reached by:
𝑑 = 𝑡 × 𝑣 (6.1)
where 𝑑 is the corresponding flight 1000 m long and 𝑣 is the average cruise speed having
𝑡 as 133.3 seconds. Therefore, if one lap corresponds to 133.3 seconds then 28,800
seconds (8 hour loiter) correspond to 216 laps. Considering that the perimeter of a
circular turn is given by:
𝑝 =2 × 𝜋 × 𝑣2
𝑔 × tan (𝜑)
(6.2)
Then a half turn with 𝑣 as 7.5 m/s and 𝜑 as 10º gives 𝑝=102.2 m and 𝑡=13.64 s.
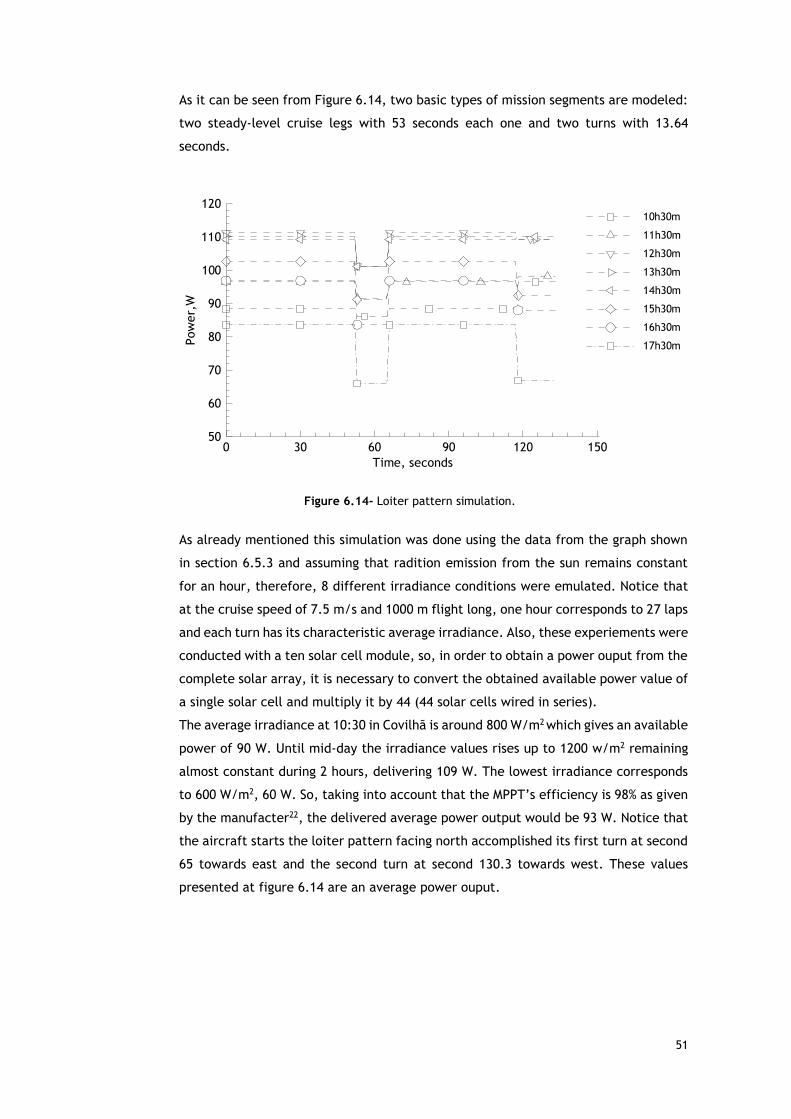
51
As it can be seen from Figure 6.14, two basic types of mission segments are modeled:
two steady-level cruise legs with 53 seconds each one and two turns with 13.64
seconds.
Figure 6.14- Loiter pattern simulation.
As already mentioned this simulation was done using the data from the graph shown
in section 6.5.3 and assuming that radition emission from the sun remains constant
for an hour, therefore, 8 different irradiance conditions were emulated. Notice that
at the cruise speed of 7.5 m/s and 1000 m flight long, one hour corresponds to 27 laps
and each turn has its characteristic average irradiance. Also, these experiements were
conducted with a ten solar cell module, so, in order to obtain a power ouput from the
complete solar array, it is necessary to convert the obtained available power value of
a single solar cell and multiply it by 44 (44 solar cells wired in series).
The average irradiance at 10:30 in Covilhã is around 800 W/m2 which gives an available
power of 90 W. Until mid-day the irradiance values rises up to 1200 w/m2 remaining
almost constant during 2 hours, delivering 109 W. The lowest irradiance corresponds
to 600 W/m2, 60 W. So, taking into account that the MPPT’s efficiency is 98% as given
by the manufacter22, the delivered average power output would be 93 W. Notice that
the aircraft starts the loiter pattern facing north accomplished its first turn at second
65 towards east and the second turn at second 130.3 towards west. These values
presented at figure 6.14 are an average power ouput.
Time, seconds
Power,W
0 30 60 90 120 15050
60
70
80
90
100
110
12010h30m
11h30m
12h30m
13h30m
14h30m
15h30m
16h30m
17h30m

52
Chapter 7
Mission Simulation
In order to validate the solar propulsion system a misson simulation was performed. The
complete propulsion and data acquisition system were transported to the University of Beira
Interior’s wind tunnel where the take-off and cruise stage conditions could be replicated.
Figure 7.1 ilustrates the wind tunnel used during the simulation.
Figure 7.1 – University Beira Interior’s wind tunnel used during mission simulation.
Firstly the Hyperion ZS 3020-10 motor and 13”x8” propeller were attached to a vertical
balance arm inside the wind tunnel, Figure 7.2. Once the motor and propeller were properly
attached, the ESC was connected to the battery and the battery to the charge controller
chosen, Genasun GV-10. Between the battery and charge controller a power log was placed
to read the ouput power from the solar panel. The misson conditions were controlled inside
a control room, where the thrust setting was adjusted according to each stage of the misson
as well as the aircraft speed.
As already mentioned, a power log was placed between Genasun GV-10 and the 10,000 mAh
LiPo battery to read the power output from the solar panel, as it is shown in Figure 7.3.
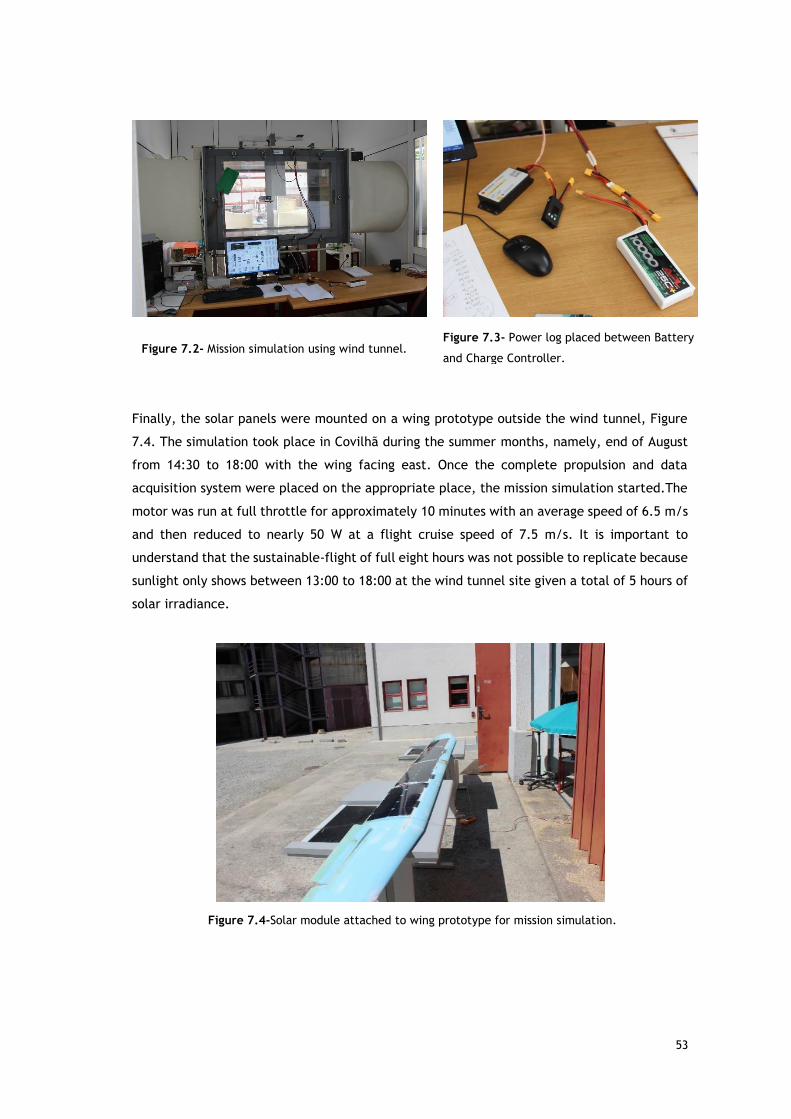
53
Finally, the solar panels were mounted on a wing prototype outside the wind tunnel, Figure
7.4. The simulation took place in Covilhã during the summer months, namely, end of August
from 14:30 to 18:00 with the wing facing east. Once the complete propulsion and data
acquisition system were placed on the appropriate place, the mission simulation started.The
motor was run at full throttle for approximately 10 minutes with an average speed of 6.5 m/s
and then reduced to nearly 50 W at a flight cruise speed of 7.5 m/s. It is important to
understand that the sustainable-flight of full eight hours was not possible to replicate because
sunlight only shows between 13:00 to 18:00 at the wind tunnel site given a total of 5 hours of
solar irradiance.
Figure 7.4-Solar module attached to wing prototype for mission simulation.
Figure 7.3- Power log placed between Battery
and Charge Controller. Figure 7.2- Mission simulation using wind tunnel.
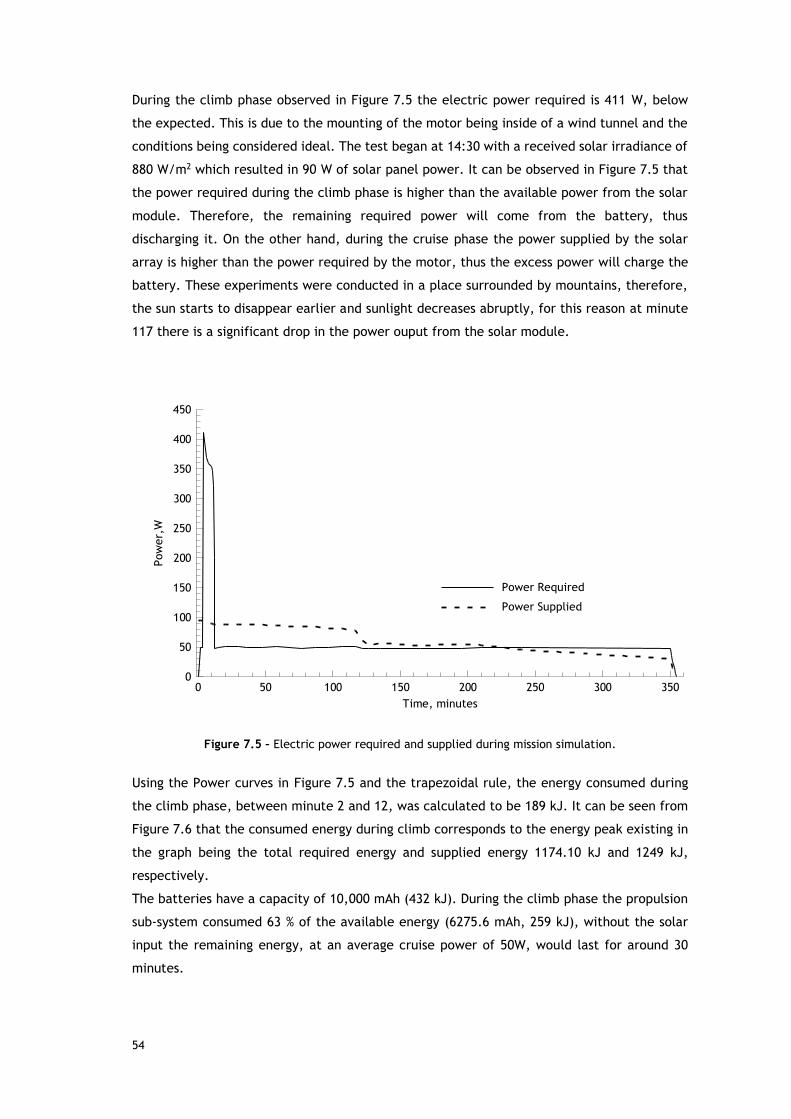
54
During the climb phase observed in Figure 7.5 the electric power required is 411 W, below
the expected. This is due to the mounting of the motor being inside of a wind tunnel and the
conditions being considered ideal. The test began at 14:30 with a received solar irradiance of
880 W/m2 which resulted in 90 W of solar panel power. It can be observed in Figure 7.5 that
the power required during the climb phase is higher than the available power from the solar
module. Therefore, the remaining required power will come from the battery, thus
discharging it. On the other hand, during the cruise phase the power supplied by the solar
array is higher than the power required by the motor, thus the excess power will charge the
battery. These experiments were conducted in a place surrounded by mountains, therefore,
the sun starts to disappear earlier and sunlight decreases abruptly, for this reason at minute
117 there is a significant drop in the power ouput from the solar module.
Figure 7.5 – Electric power required and supplied during mission simulation.
Using the Power curves in Figure 7.5 and the trapezoidal rule, the energy consumed during
the climb phase, between minute 2 and 12, was calculated to be 189 kJ. It can be seen from
Figure 7.6 that the consumed energy during climb corresponds to the energy peak existing in
the graph being the total required energy and supplied energy 1174.10 kJ and 1249 kJ,
respectively.
The batteries have a capacity of 10,000 mAh (432 kJ). During the climb phase the propulsion
sub-system consumed 63 % of the available energy (6275.6 mAh, 259 kJ), without the solar
input the remaining energy, at an average cruise power of 50W, would last for around 30
minutes.
Time, minutes
Power,W
0 50 100 150 200 250 300 3500
50
100
150
200
250
300
350
400
450
Power Required
Power Supplied
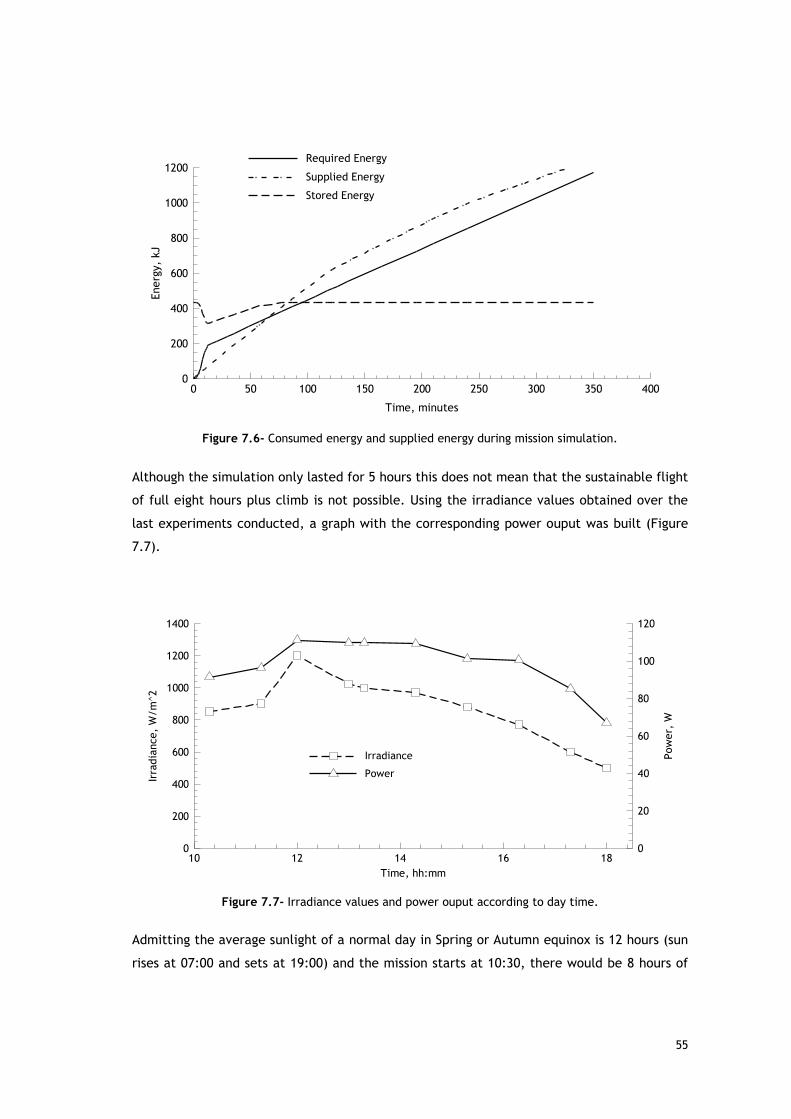
55
Figure 7.6- Consumed energy and supplied energy during mission simulation.
Although the simulation only lasted for 5 hours this does not mean that the sustainable flight
of full eight hours plus climb is not possible. Using the irradiance values obtained over the
last experiments conducted, a graph with the corresponding power ouput was built (Figure
7.7).
Figure 7.7- Irradiance values and power ouput according to day time.
Admitting the average sunlight of a normal day in Spring or Autumn equinox is 12 hours (sun
rises at 07:00 and sets at 19:00) and the mission starts at 10:30, there would be 8 hours of
Time, minutes
Energy,kJ
0 50 100 150 200 250 300 350 4000
200
400
600
800
1000
1200Required Energy
Supplied Energy
Stored Energy
Time, hh:mm
Irradiance,W/m^2
Power,
W
10 12 14 16 180
200
400
600
800
1000
1200
1400
0
20
40
60
80
100
120
Irradiance
Power
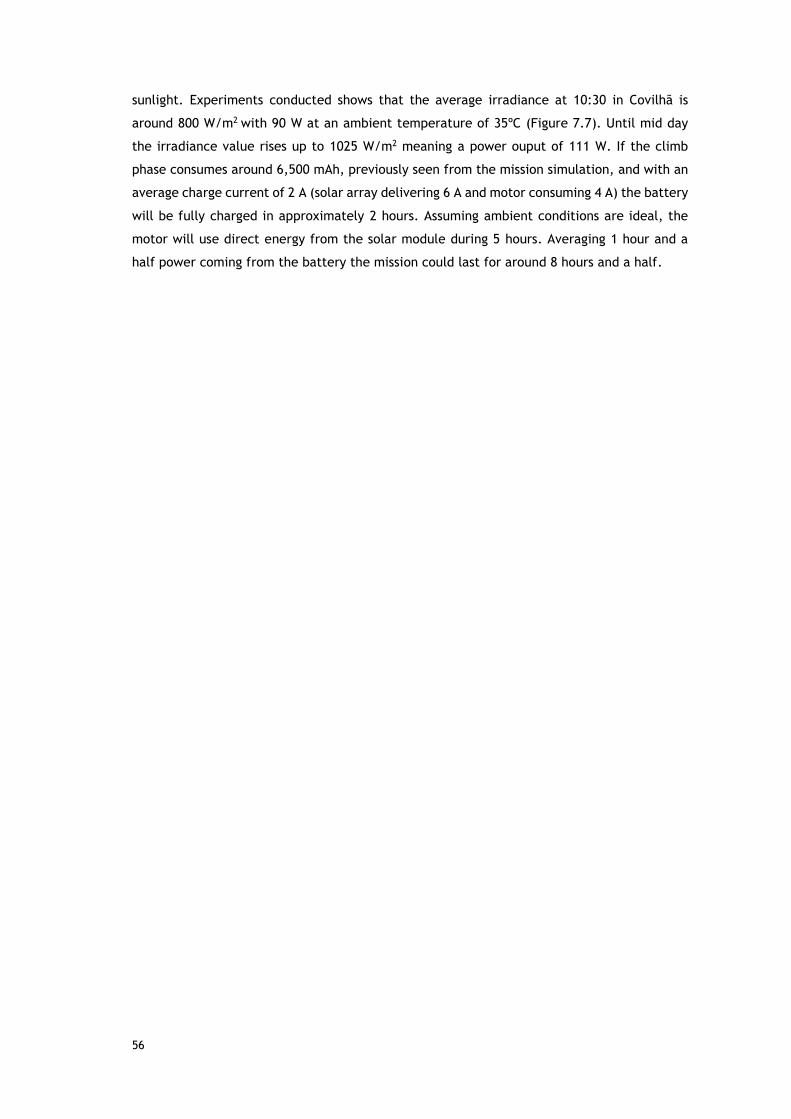
56
sunlight. Experiments conducted shows that the average irradiance at 10:30 in Covilhã is
around 800 W/m2 with 90 W at an ambient temperature of 35ºC (Figure 7.7). Until mid day
the irradiance value rises up to 1025 W/m2 meaning a power ouput of 111 W. If the climb
phase consumes around 6,500 mAh, previously seen from the mission simulation, and with an
average charge current of 2 A (solar array delivering 6 A and motor consuming 4 A) the battery
will be fully charged in approximately 2 hours. Assuming ambient conditions are ideal, the
motor will use direct energy from the solar module during 5 hours. Averaging 1 hour and a
half power coming from the battery the mission could last for around 8 hours and a half.

57
58
Chapter 8
8.1 Conclusion
The purpose of this master thesis was to design a solar propulsion system for a long endurance
electric UAV enabling a sustainable-flight of 8 hours during the Spring or Autumn equinox.
Through this dissertation the mission was described along with detailed information about the
energy requirements. Since this propulsion system is aimed at the use of green power
technologies, the best option was focused on the use of high efficiency solar cells attached
on the upper wing surface. The electric propulsion system is compound by the energy
generation and storage systems, the solar module connected to the charge controller and a
LiPo battery, respectivelly. The propulsion system consists on the Hyperion ZS 3025-10 electric
motor driving a 13”x8”propeller and controlled by Castle Creations Phoenix Edge ESC. To
verify the validity of this system, several tests were carried out.
To understand the power output from the solar module, the first step was to verify the
efficiency I-V curves given by the Sunpower C60 manufacturer. To accomplish that, three
variable loads and a pyranometer were used to measure the irradiance. Once the experiments
were conducted and reviewed, it could be seen that the results obtained were very similar to
the supplied manufacturer information. The only differences between these results were the
non controlled environment of these performed experiments. The next step was to test the
solar module efficiency loss due to solar cell temperature. As it was expect the solar power
ouput is higher when solar cells are in a colder environment. Air flow through the wing during
flight would decrease solar cell temperature resulting in a power ouput gain.
The power incident on a PV module depends not only on the power contained in the sunlight,
but also on the angle between the module and the Sun, for this reason, some experiments to
understand the contribution of azimuth, pitch and roll on power output were conducted.
Experiments show that the phovoltaic system exact azimuth orientation is not critical.
Vertical axis and lateral axis, given by pitch and roll, have a more important effect on
performance.
Once the solar module behavior was understood throught different temperatures and
irradiance values, a mission simulation was performed where the complete propulsion system
and acquistion data system were installed in a wind tunnel. There were limitations at first
since sunlight only strikes for 5 hours on the wind tunnel. However, the solar UAV
accomplished his purpose with success, exhibiting sustainable flight of 5 hours. Despite the
simulation only lasted for 5 hours this does not mean the full eigh hour sustainable flight can
not be accomplished. When the power required by the motor is higher than the power supplied
by the PV module the lacking power will come from the battery, thus discharging it. On the
59
other hand, during cruise the power supplied by the solar array is higher than the power
required by the motor and the excess will charge the battery.
Although some limitations were found, this master thesis objectives were successfully
achieved.
Concluding, important parameters which influence the ouput power and efficiency of PV cells
should be taken into consideration for achievieng the desired performance in a solar-powered
aircraft. Also, the type of covering and mounting of the cells affects the direct incident solar
radiation, the amount of heat transfer on the wings and the ouput power. Due to air flow,
temperature of the cells decreases during the flight and causes increased in efficiency. So
this would be a significant factor while designing the aircraft, selecting the cells and covering
the wings. Futhermore, this influences the weight, price and flight-endurance.
8.2 Future Work
In the future, a better and more accurate technique for placing the solar cells inside the wings
will be studied.
60
References
1. Bone E, Bolkcom C. Unmanned Aerial Vehicles: Background and Issues for Congress. Current. 2003.
2. Bhattacharya S, Kumar S. Direct Solar Energy. Energy Syst Direct Sol Energy,[Eds S]. 2004:333-400.
3. Hersch P, Zweibel K. Basic Photovoltac Principles and Methods. United States of America: Tecnhical Information Office
4. Photovoltaic Solar Panel Working Principle. http://www.solarbuildingtech.com/Solar_PV_Tech/Images/PhotoVoltaic-solar-panel-working_princple.gif. Accessed April 12, 2015.
5. Aberle AG. Thin-film solar cells. Thin Solid Films. 2009;517(17):4706-4710.
6. Saga T. Advances in crystalline silicon solar cell technology for industrial mass production. NPG Asia Mater, 2010
7. U.S.Department of Energy. Photovoltaics: Tecnhnolgies, Cost, and Performance. In: Sunshot Vision Study, 2012:69-96.
8. NREL Efficiency Chart. http://www.nrel.gov/ncpv/images/efficiency_chart.jpg. Accessed April 12, 2015.
9. NREL. Solar cell efficiency explanatory notes. 2013.
10. Boucher R. History of solar flight. AIAA Pap.; Autonomous Systems Lab, Swiss Federal Institute of Technology Zürich, 1-7 July, 1984
11. Sunrise II. http://ecoble.com/wp-content/uploads/2009/02/sunrise-ii-astro-flight.jpg. Accessed April 12, 2015.
12. Pathfinder Solar Aircraft Over Hawaii. http://upload.wikimedia.org/wikipedia/commons/1/1a/Pathfinder_solar_aircraft_over_Hawaii.jpg. Accessed April 12, 2015.
13. Pathfinder Plus Solar Aircraft over Hawaii. http://upload.wikimedia.org/wikipedia/commons/6/68/Pathfinder_Plus_solar_aircraft_over_Hawaii.jpg. Accessed April 12, 2015.
14. Centurion. http://www.thenewecologist.com/wp-content/uploads/2010/09/centurion.jpg. Accessed April 12, 2015.
15. Helios. http://cdn.globalaircraft.org/media/img/planes/lowres/helios_2.jpg. Accessed May 8, 2015.
16. QinetiQ. http://www.qinetiq.com/media/news/releases/pages/zephyr-14-days.aspx. Accessed January 9, 2015.
61
17. Zephyr, 2010 Launch. http://theatlasgroup.biz/wp-content/uploads/2014/09/zephyr2010launch2.jpg. Accessed April 12, 2015.
18. Borshberg A, Piccard B. SOLAR IMPULSE. http://info.solarimpulse.com/timeline/view/7267#.VQHHx-Hw-AR. Accessed March 12, 2015.
19. Solar Impulse 2. http://www.arabiangazette.com/wp-content/uploads/2015/01/Solar-Impulse-2-1.jpg. Accessed April 12, 2015.
20. Cândido L., Projeto de um UAV Solar de grande autonomia. MSC Thesis, Universidade da Beira Interior, 2014.
21. Marta AC, Gamboa P V., Long Endurance Eelectric UAV for Civilian Surveillance Missions. 29th Congress of the International Council of the Aeronautical Sciences, St. Petesburg, Russia, 7-12 September, 2014.
22. Sunpower Corporation.C60 Solar Cell Monocrystalline Silicon¸ November 2010.
23. Example of an I-V Curve. http://re.emsd.gov.hk/english/solar/solar_ph/images/redraw5.jpg. Accessed April 12, 2015.
24. Effect of Temperature | PVEducation. http://pveducation.org/pvcdrom/solar-cell-operation/effect-of-temperature. Accessed April 13, 2015.
25. Genasun,GV-10 Manual. Solar Charge Controllers with Maximum Power Point tracking, 2012.
26. Quality R/C Hyperion Products.http://www.allerc.com/motorwiring.htm. Accessed April 12, 2015
27. Apogee instruments,Inc.Owner's Manual Pyranometer Model Sp.212 and SP-215, 2013
28. Pitch, Roll and Yaw Axis. https://s-media-cache-ak0.pinimg.com/originals/34/21/16/342116988a06db33bfbffccb695badce.jpg. Accessed August 28, 2015.
62
Annex
Appendix A
Czochralski process – “is a technique for growing crystals in order to obtain solitary crystals
of semiconductors like silicon, metals like silver and gold as well as several salts. The process
is named after Jan Czochralski, who first demonstrated it in 1916. He was studying the rates
of crystallisation of different metals. The most significant application of the Czochralski
process is the growth of large ingots of single crystal silicon. Initially highly pure
semiconductor-grade silicon is subjected to high temperatures in a crucible made of quartz
until it melts. Quartz is used as the crucible’s material because of its inertness. At this stage,
doping can be initiated with impurity atoms such as boron or phosphorus being added to the
molten silicon. Fixed amounts of dopants can yield desired characteristics in the
semiconductor formed as a result of this procedure.”
Equinox- “The time or date (twice each year) at which the sun crosses the celestial equation,
when day and night have equal length (about 22 September and 20 March)”.