social circle city - archives.doe.k12.ga.usarchives.doe.k12.ga.us/_documents/gshs/social circle...
TRANSCRIPT

11
Social Circle City
Results of the Georgia Student Health Survey II
2007

Demographics 2Demographics 2
Grade
Grade Frequency
6 133
8 119
10 96
12 70
FrequencyCol Pct
Table of Gender by Grade
Gender(Gender)
Grade(Grade)
Total6 8 10 12
Female 6045.11
5243.70
4445.83
3651.43
192
Male 7354.89
6756.30
5254.17
3448.57
226
Total 133 119 96 70 418
FrequencyCol Pct
Table of Ethnicity by Grade
Ethnicity(Ethnicity)
Grade(Grade)
Total6 8 10 12
Black 3526.32
2823.53
2930.21
1825.71
110
Hispanic 00.00
54.20
22.08
11.43
8
White 9067.67
8168.07
6264.58
4462.86
277
Asian 21.50
21.68
11.04
22.86
7
Other 64.51
32.52
22.08
57.14
16
Total 133 119 96 70 418

Title IV, Part A, Schedule A 3
Goal 1: Ensure that all schools are drug-freeBaseline Data: Year 2007Prevalence of Drug Use
Title IV, Part A, Schedule A 3
Goal 1: Ensure that all schools are drug-freeBaseline Data: Year 2007Prevalence of Drug Use
FrequencyCol Pct
Table of AlcoholAlt by Grade
AlcoholAlt(Alcoholuse, past 30 days)
Grade(Grade)
Total6 8 10 12
Yes 96.77
1210.08
3132.29
2535.71
77
No 12493.23
10789.92
6567.71
4564.29
341
Total 133 119 96 70 418
FrequencyCol Pct
Table of TobaccoAny by Grade
TobaccoAny(Tobaccouse, past 30 days)
Grade(Grade)
Total6 8 10 12
Yes 64.51
97.56
2425.00
2231.43
61
No 12795.49
11092.44
7275.00
4868.57
357
Total 133 119 96 70 418
FrequencyCol Pct
Table of MarijuanaAlt by Grade
MarijuanaAlt(Marijuanause, past 30 days)
Grade(Grade)
Total6 8 10 12
Yes 21.50
43.36
1515.63
912.86
30
No 13198.50
11596.64
8184.38
6187.14
388
Total 133 119 96 70 418
FrequencyCol Pct
Table of OtherDrugAny by Grade
OtherDrugAny(Otherdrug use,
past 30 days)
Grade(Grade)
Total6 8 10 12
Yes 107.52
75.88
1010.42
68.57
33
No 12392.48
11294.12
8689.58
6491.43
385
Total 133 119 96 70 418

Average Age of Onset of Use 4
Results for "Average Age of Onset of Use" questions exclude students who said they did not use thatsubstance
Average Age of Onset of Use 4
Results for "Average Age of Onset of Use" questions exclude students who said they did not use thatsubstance
Variable Label Mean
Alcoholinit2Cigarettesinit2Smokelessinit2Marijuanainit2Cocaineinit2Inhalantsinit2Steroidsinit2Ecstasyinit2Methinit2Hallucinogensinit2Prescriptioninit2
I started using alcohol when I wasI started smoking tobacco when I wasI started chewing tobacco when I wasI started using marijuana when I wasI started using cocaine when I wasI started using inhalants when I wasI started using steroids when I wasI started using ecstasy when I wasI started using methamphetamines when I wasI started using hallucinogens when I wasI started using prescription drugs not prescribed to me when I was
13.1713.7813.4713.8412.6011.6411.0012.8311.2511.5012.66

Perception of Health Risk 5Perception of Health Risk 5
FrequencyCol Pct
Table of Alcoholharmdich by Grade
Alcoholharmdich(Ithink alcohol is
harmful)
Grade(Grade)
Total6 8 10 12
Yes 11989.47
9277.31
6466.67
5781.43
332
No 1410.53
2722.69
3233.33
1318.57
86
Total 133 119 96 70 418
FrequencyCol Pct
Table of Tobaccoharmdich by Grade
Tobaccoharmdich(Ithink tobacco is
harmful)
Grade(Grade)
Total6 8 10 12
Yes 11989.47
10789.92
8184.38
6897.14
375
No 1410.53
1210.08
1515.63
22.86
43
Total 133 119 96 70 418
FrequencyCol Pct
Table of Marijuanaharmdich by Grade
Marijuanaharmdich(Ithink marijuana is
harmful)
Grade(Grade)
Total6 8 10 12
Yes 11989.47
10487.39
6163.54
5680.00
340
No 1410.53
1512.61
3536.46
1420.00
78
Total 133 119 96 70 418
FrequencyCol Pct
Table of Otherdrugharmdich by Grade
Otherdrugharmdich(Ithink other drugs are
harmful)
Grade(Grade)
Total6 8 10 12
Yes 12291.73
10991.60
8487.50
6897.14
383
No 118.27
108.40
1212.50
22.86
35
Total 133 119 96 70 418

Title IV, Part A, Schedule A 6
Goal 2: To help ensure that all schools are safe and disciplinedBaseline Data: Year 2007
Student Involvement in Gang Activity
Title IV, Part A, Schedule A 6
Goal 2: To help ensure that all schools are safe and disciplinedBaseline Data: Year 2007
Student Involvement in Gang Activity
FrequencyCol Pct
Table of Gangself by Grade
Gangself(Ihave
participatedin illegal
gangactivities inthe past 30
days)
Grade(Grade)
Total6 8 10 12
Yes 43.01
75.88
88.33
34.29
22
No 12996.99
11294.12
8891.67
6795.71
396
Total 133 119 96 70 418

Student Perception of School Safety 7Student Perception of School Safety 7
FrequencyRow Pct
Table of Grade by Safeschool
Grade(Grade)
Safeschool(School is a place at which I feelsafe)
TotalStrongly
AgreeSomewhat
AgreeSomewhat
DisagreeStronglyDisagree
6 6145.86
5541.35
96.77
86.02
133
8 3126.05
6252.10
1714.29
97.56
119
10 2323.96
5052.08
1313.54
1010.42
96
12 1521.43
3955.71
912.86
710.00
70
Total 130 206 48 34 418

Students Who Have Been Bullied 8Students Who Have Been Bullied 8
FrequencyRow Pct
Table of Grade by Bullied
Grade(Grade)
Bullied(I have been bullied by otherstudents in the past 30 days)
Total0
Days
1 or2
days
3 to5
days
6 to9
days
10to19
days
20to29
days
All30
days
6 10679.70
75.26
64.51
43.01
32.26
21.50
53.76
133
8 10689.08
43.36
10.84
00.00
21.68
43.36
21.68
119
10 8285.42
33.13
44.17
11.04
22.08
11.04
33.13
96
12 6187.14
45.71
11.43
00.00
11.43
11.43
22.86
70
Total 355 18 12 5 8 8 12 418

School Climate 9School Climate 9
FrequencyCol Pct
Table of SchoolClimate1 by Grade
SchoolClimate1(Ilike school)
Grade(Grade)
Total6 8 10 12
Strongly Agree 3526.32
2521.01
1313.54
1318.57
86
Somewhat Agree 7858.65
6655.46
6062.50
4361.43
247
Somewhat Disagree 1612.03
2016.81
1616.67
1115.71
63
Strongly Disagree 43.01
86.72
77.29
34.29
22
Total 133 119 96 70 418
FrequencyCol Pct
Table of SchoolClimate2 by Grade
SchoolClimate2(Ifeel successful at
school)
Grade(Grade)
Total6 8 10 12
Strongly Agree 6851.13
3831.93
2526.04
1521.43
146
Somewhat Agree 5742.86
7260.50
5860.42
4361.43
230
Somewhat Disagree 32.26
75.88
1111.46
1014.29
31
Strongly Disagree 53.76
21.68
22.08
22.86
11
Total 133 119 96 70 418
FrequencyCol Pct
Table of SchoolClimate3 by Grade
SchoolClimate3(Myschool has highstandards forachievement)
Grade(Grade)
Total6 8 10 12
Strongly Agree 10075.19
6352.94
3435.42
2941.43
226
Somewhat Agree 2619.55
4134.45
5052.08
3245.71
149
Somewhat Disagree 43.01
1210.08
1111.46
710.00
34
Strongly Disagree 32.26
32.52
11.04
22.86
9
Total 133 119 96 70 418

School Climate 10
FrequencyCol Pct
Table of SchoolClimate4 by Grade
SchoolClimate4(Myschool sets clear
rules for behavior)
Grade(Grade)
Total6 8 10 12
Strongly Agree 10478.20
6352.94
4041.67
3448.57
241
Somewhat Agree 2518.80
4537.82
4041.67
2738.57
137
Somewhat Disagree 43.01
75.88
1313.54
811.43
32
Strongly Disagree 00.00
43.36
33.13
11.43
8
Total 133 119 96 70 418
FrequencyCol Pct
Table of SchoolClimate5 by Grade
SchoolClimate5(Iknow what to do in
an emergency atschool)
Grade(Grade)
Total6 8 10 12
Strongly Agree 10276.69
7764.71
5658.33
4361.43
278
Somewhat Agree 2921.80
3428.57
3233.33
2028.57
115
Somewhat Disagree 10.75
43.36
88.33
45.71
17
Strongly Disagree 10.75
43.36
00.00
34.29
8
Total 133 119 96 70 418
FrequencyCol Pct
Table of SchoolClimate6 by Grade
SchoolClimate6(Teacherstreat me with respect)
Grade(Grade)
Total6 8 10 12
Strongly Agree 8463.16
5042.02
2222.92
2738.57
183
Somewhat Agree 3324.81
5243.70
5254.17
3448.57
171
Somewhat Disagree 118.27
119.24
1717.71
68.57
45
Strongly Disagree 53.76
65.04
55.21
34.29
19
Total 133 119 96 70 418

School Climate 11
FrequencyCol Pct
Table of SchoolClimate7 by Grade
SchoolClimate7(Behaviorsin my class allow the
teacher to teach)
Grade(Grade)
Total6 8 10 12
Strongly Agree 5037.59
2521.01
1616.67
1318.57
104
Somewhat Agree 5642.11
6554.62
4951.04
3550.00
205
Somewhat Disagree 2015.04
2218.49
2627.08
1420.00
82
Strongly Disagree 75.26
75.88
55.21
811.43
27
Total 133 119 96 70 418
FrequencyCol Pct
Table of SchoolClimate8 by Grade
SchoolClimate8(Studentsare frequently
recognized for goodbehavior)
Grade(Grade)
Total6 8 10 12
Strongly Agree 5742.86
3630.25
1212.50
34.29
108
Somewhat Agree 5440.60
5445.38
4142.71
3854.29
187
Somewhat Disagree 1612.03
1714.29
2930.21
2130.00
83
Strongly Disagree 64.51
1210.08
1414.58
811.43
40
Total 133 119 96 70 418
FrequencyCol Pct
Table of SchoolClimate9 by Grade
SchoolClimate9(Schoolcounselor would behelpful if I needed
assistance)
Grade(Grade)
Total6 8 10 12
Strongly Agree 10578.95
9478.99
4850.00
4970.00
296
Somewhat Agree 2518.80
2218.49
3637.50
1622.86
99
Somewhat Disagree 21.50
32.52
77.29
34.29
15
Strongly Disagree 10.75
00.00
55.21
22.86
8
Total 133 119 96 70 418

Reasons for Dropping Out 12Reasons for Dropping Out 12
FrequencyCol Pct
Table of Dropoutreason by Grade
Dropoutreason(IfI dropped out the
reason wouldmost likely be...)
Grade(Grade)
Total6 8 10 12
Won't Drop out 8563.91
6857.14
5153.13
3448.57
238
Bored 1813.53
2319.33
1818.75
710.00
66
Family Reasons 86.02
75.88
66.25
811.43
29
Being Bullied 107.52
43.36
44.17
22.86
20
Other 129.02
1714.29
1717.71
1927.14
65
Total 133 119 96 70 418
FrequencyCol Pct
Table of Dropout by Grade
Dropout(Ihave
thoughtabout
droppingout of
school)
Grade(Grade)
Total6 8 10 12
Yes 2418.05
2521.01
3233.33
2941.43
110
No 10981.95
9478.99
6466.67
4158.57
308
Total 133 119 96 70 418

School Safety 13School Safety 13
FrequencyCol Pct
Table of Gangself by Grade
Gangself(Ihave
participatedin illegal
gangactivities inthe past 30
days)
Grade(Grade)
Total6 8 10 12
Yes 43.01
75.88
88.33
34.29
22
No 12996.99
11294.12
8891.67
6795.71
396
Total 133 119 96 70 418
FrequencyCol Pct
Table of Gangpeers by Grade
Gangpeers(Ihave friends
who haveparticipated
in illegalgang
activities inthe past 30
days)
Grade(Grade)
Total6 8 10 12
Yes 1612.03
2420.17
2930.21
912.86
78
No 11787.97
9579.83
6769.79
6187.14
340
Total 133 119 96 70 418
FrequencyCol Pct
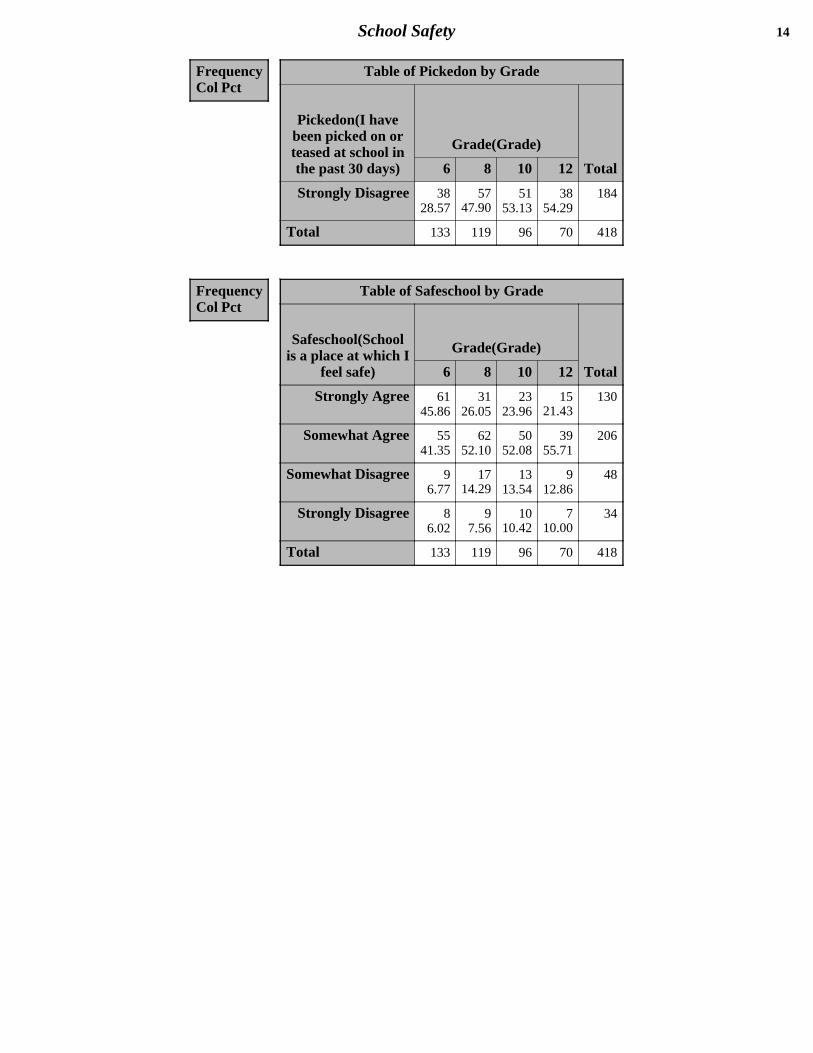
Table of Pickedon by Grade
Pickedon(I havebeen picked on orteased at school inthe past 30 days)
Grade(Grade)
Total6 8 10 12
Strongly Agree 4533.83
1613.45
1111.46
68.57
78
Somewhat Agree 3425.56
2621.85
1717.71
1217.14
89
Somewhat Disagree 1612.03
2016.81
1717.71
1420.00
67
School Safety 14
FrequencyCol Pct
Table of Pickedon by Grade
Pickedon(I havebeen picked on orteased at school inthe past 30 days)
Grade(Grade)
Total6 8 10 12
Strongly Disagree 3828.57
5747.90
5153.13
3854.29
184
Total 133 119 96 70 418
FrequencyCol Pct
Table of Safeschool by Grade
Safeschool(Schoolis a place at which I
feel safe)
Grade(Grade)
Total6 8 10 12
Strongly Agree 6145.86
3126.05
2323.96
1521.43
130
Somewhat Agree 5541.35
6252.10
5052.08
3955.71
206
Somewhat Disagree 96.77
1714.29
1313.54
912.86
48
Strongly Disagree 86.02
97.56
1010.42
710.00
34
Total 133 119 96 70 418

School Safety 15School Safety 15
FrequencyRow Pct
Table of Grade by Bullied
Grade(Grade)
Bullied(I have been bullied by otherstudents in the past 30 days)
Total0
Days
1 or2
days
3 to5
days
6 to9
days
10to19
days
20to29
days
All30
days
6 10679.70
75.26
64.51
43.01
32.26
21.50
53.76
133
8 10689.08
43.36
10.84
00.00
21.68
43.36
21.68
119
10 8285.42
33.13
44.17
11.04
22.08
11.04
33.13
96
12 6187.14
45.71
11.43
00.00
11.43
11.43
22.86
70
Total 355 18 12 5 8 8 12 418
FrequencyRow Pct
Table of Grade by Bulliedothers
Grade(Grade)
Bulliedothers(I bullied others in the past30 days)
Total0
Days
1 or2
days
3 to5
days
6 to9
days
10to19
days
20to29
days
All30
days
6 11586.47
32.26
86.02
32.26
21.50
00.00
21.50
133
8 11294.12
00.00
00.00
00.00
10.84
43.36
21.68
119
10 8083.33
55.21
22.08
22.08
11.04
22.08
44.17
96
12 6592.86
00.00
00.00
11.43
11.43
11.43
22.86
70
Total 372 8 10 6 5 7 10 418

School Safety 16
FrequencyRow Pct
Table of Grade by Weaponschool
Grade(Grade)
Weaponschool(I brought a weaponto school in the past 30 days)
Total0
Days
1 or2
days
3 to5
days
10to19
days
20to29
days
All30
days
6 13198.50
00.00
00.00
21.50
00.00
00.00
133
8 11899.16
00.00
00.00
00.00
00.00
10.84
119
10 9194.79
22.08
00.00
11.04
11.04
11.04
96
12 6694.29
11.43
11.43
00.00
11.43
11.43
70
Total 406 3 1 3 2 3 418
FrequencyRow Pct
Table of Grade by Absentunsafe
Grade(Grade)
Absentunsafe(I have missed schoolbecause I felt unsafe in the past 30
days)
Total0
Days
1 or2
days
3 to5
days
10to19
days
20to29
days
All30
days
6 12896.24
32.26
10.75
10.75
00.00
00.00
133
8 11697.48
10.84
00.00
00.00
10.84
10.84
119
10 9497.92
00.00
22.08
00.00
00.00
00.00
96
12 6795.71
11.43
00.00
00.00
11.43
11.43
70
Total 405 5 3 1 2 2 418

Drug Use During Last 30 Days 17Drug Use During Last 30 Days 17
FrequencyRow Pct
Table of Grade by Alcohol
Grade(Grade)
Alcohol(Alcohol use, past 30 days)
Total
Didnotuse
1-2days
3-5days
6-9days
10-19days
20-29days
Everyday
6 12493.23
32.26
10.75
00.00
10.75
10.75
32.26
133
8 10789.92
21.68
10.84
10.84
21.68
32.52
32.52
119
10 6567.71
66.25
77.29
44.17
88.33
44.17
22.08
96
12 4564.29
811.43
22.86
22.86
912.86
22.86
22.86
70
Total 341 19 11 7 20 10 10 418
FrequencyRow Pct
Table of Grade by Cigarettes
Grade(Grade)
Cigarettes(Smoking tobacco use, past 30 days)
Total
Didnotuse
1-2days
3-5days
6-9days
10-19days
20-29days
Everyday
6 12896.24
00.00
32.26
10.75
00.00
00.00
10.75
133
8 11394.96
10.84
10.84
00.00
10.84
10.84
21.68
119
10 7679.17
22.08
44.17
33.13
22.08
22.08
77.29
96
12 5172.86
811.43
22.86
11.43
34.29
11.43
45.71
70
Total 368 11 10 5 6 4 14 418
FrequencyRow Pct
Table of Grade by Smokeless
Grade(Grade)
Smokeless(Chewing tobacco use,past 30 days)
Total
Didnotuse
1-2days
3-5days
6-9days
10-19days
20-29days
Everyday
6 13097.74
00.00
00.00
00.00
10.75
00.00
21.50
133
8 11495.80
32.52
00.00
00.00
00.00
00.00
21.68
119
10 8790.63
11.04
11.04
22.08
33.13
00.00
22.08
96
12 6187.14
45.71
00.00
00.00
00.00
22.86
34.29
70
Total 392 8 1 2 4 2 9 418

Drug Use During Last 30 Days 18
FrequencyRow Pct
Table of Grade by Marijuana
Grade(Grade)
Marijuana(Marijuana use, past 30 days)
Total
Didnotuse
1-2days
3-5days
6-9days
10-19days
20-29days
Everyday
6 13198.50
00.00
00.00
00.00
10.75
00.00
10.75
133
8 11596.64
00.00
00.00
00.00
10.84
00.00
32.52
119
10 8184.38
44.17
22.08
22.08
33.13
22.08
22.08
96
12 6187.14
45.71
11.43
00.00
00.00
22.86
22.86
70
Total 388 8 3 2 5 4 8 418
FrequencyRow Pct
Table of Grade by Cocaine
Grade(Grade)
Cocaine(Cocaine use,past 30 days)
Total
Didnotuse
1-2days
3-5days
Everyday
6 13198.50
10.75
00.00
10.75
133
8 11899.16
00.00
00.00
10.84
119
10 9497.92
11.04
11.04
00.00
96
12 70100.00
00.00
00.00
00.00
70
Total 413 2 1 2 418
FrequencyRow Pct
Table of Grade by Inhalants
Grade(Grade)
Inhalants(Inhalant use, past 30 days)
Total
Didnotuse
1-2days
3-5days
6-9days
20-29days
Everyday
6 12996.99
21.50
00.00
00.00
10.75
10.75
133
8 11495.80
10.84
10.84
10.84
00.00
21.68
119
10 9396.88
00.00
22.08
11.04
00.00
00.00
96
12 6998.57
11.43
00.00
00.00
00.00
00.00
70
Total 405 4 3 2 1 3 418

Drug Use During Last 30 Days 19
FrequencyRow Pct
Table of Grade by Steroids
Grade(Grade)
Steroids(Steroid use,past 30 days)
Total
Didnotuse
3-5days
6-9days
20-29days
Everyday
6 12996.99
10.75
10.75
00.00
21.50
133
8 11899.16
00.00
00.00
00.00
10.84
119
10 9598.96
00.00
00.00
11.04
00.00
96
12 70100.00
00.00
00.00
00.00
00.00
70
Total 412 1 1 1 3 418
FrequencyRow Pct
Table of Grade by Ecstasy
Grade(Grade)
Ecstasy(Ecstasy use,past 30 days)
Total
Didnotuse
1-2days
3-5days
20-29days
Everyday
6 13198.50
00.00
10.75
00.00
10.75
133
8 11899.16
00.00
00.00
00.00
10.84
119
10 9396.88
11.04
00.00
22.08
00.00
96
12 6897.14
00.00
11.43
00.00
11.43
70
Total 410 1 2 2 3 418
FrequencyRow Pct
Table of Grade by Meth
Grade(Grade)
Meth(Methamphetamineuse, past 30 days)
TotalDid not
use10-19days
Everyday
6 13198.50
10.75
10.75
133
8 11899.16
00.00
10.84
119
10 9598.96
11.04
00.00
96
12 70100.00
00.00
00.00
70
Total 414 2 2 418

Drug Use During Last 30 Days 20
FrequencyRow Pct
Table of Grade by Hallucinogens
Grade(Grade)
Hallucinogens(Hallucinogen use,past 30 days)
Total
Didnotuse
3-5days
10-19days
20-29days
Everyday
6 13198.50
00.00
10.75
00.00
10.75
133
8 11899.16
00.00
00.00
00.00
10.84
119
10 9497.92
11.04
00.00
11.04
00.00
96
12 70100.00
00.00
00.00
00.00
00.00
70
Total 413 1 1 1 2 418
FrequencyRow Pct
Table of Grade by Prescription
Grade(Grade)
Prescription(Prescription drugsnot prescribed to me,
past 30 days)
Total
Didnotuse
1-2days
3-5days
10-19days
Everyday
6 12694.74
32.26
10.75
10.75
21.50
133
8 11697.48
00.00
21.68
00.00
10.84
119
10 8891.67
44.17
22.08
11.04
11.04
96
12 6694.29
22.86
00.00
11.43
11.43
70
Total 396 9 5 3 5 418

How Easy Is It to Get the Following 21How Easy Is It to Get the Following 21
FrequencyCol Pct
Table of Alcoholease by Grade
Alcoholease(It iseasy to get alcohol)
Grade(Grade)
Total6 8 10 12
Strongly Agree 2821.05
1411.76
3839.58
3854.29
118
Somewhat Agree 2115.79
4336.13
3233.33
2028.57
116
Somewhat Disagree 1813.53
2117.65
1111.46
45.71
54
Strongly Disagree 6649.62
4134.45
1515.63
811.43
130
Total 133 119 96 70 418
FrequencyCol Pct
Table of Cigarettesease by Grade
Cigarettesease(It iseasy to get smoking
tobacco)
Grade(Grade)
Total6 8 10 12
Strongly Agree 2518.80
2420.17
4041.67
5375.71
142
Somewhat Agree 2619.55
2823.53
2728.13
710.00
88
Somewhat Disagree 1612.03
2016.81
1111.46
34.29
50
Strongly Disagree 6649.62
4739.50
1818.75
710.00
138
Total 133 119 96 70 418
FrequencyCol Pct
Table of Smokelessease by Grade
Smokelessease(It iseasy to get chewing
tobacco)
Grade(Grade)
Total6 8 10 12
Strongly Agree 2418.05
1613.45
3839.58
4564.29
123
Somewhat Agree 2720.30
2722.69
2222.92
1420.00
90
Somewhat Disagree 2216.54
1512.61
1010.42
57.14
52
Strongly Disagree 6045.11
6151.26
2627.08
68.57
153
Total 133 119 96 70 418
How Easy Is It to Get the Following 22
FrequencyCol Pct
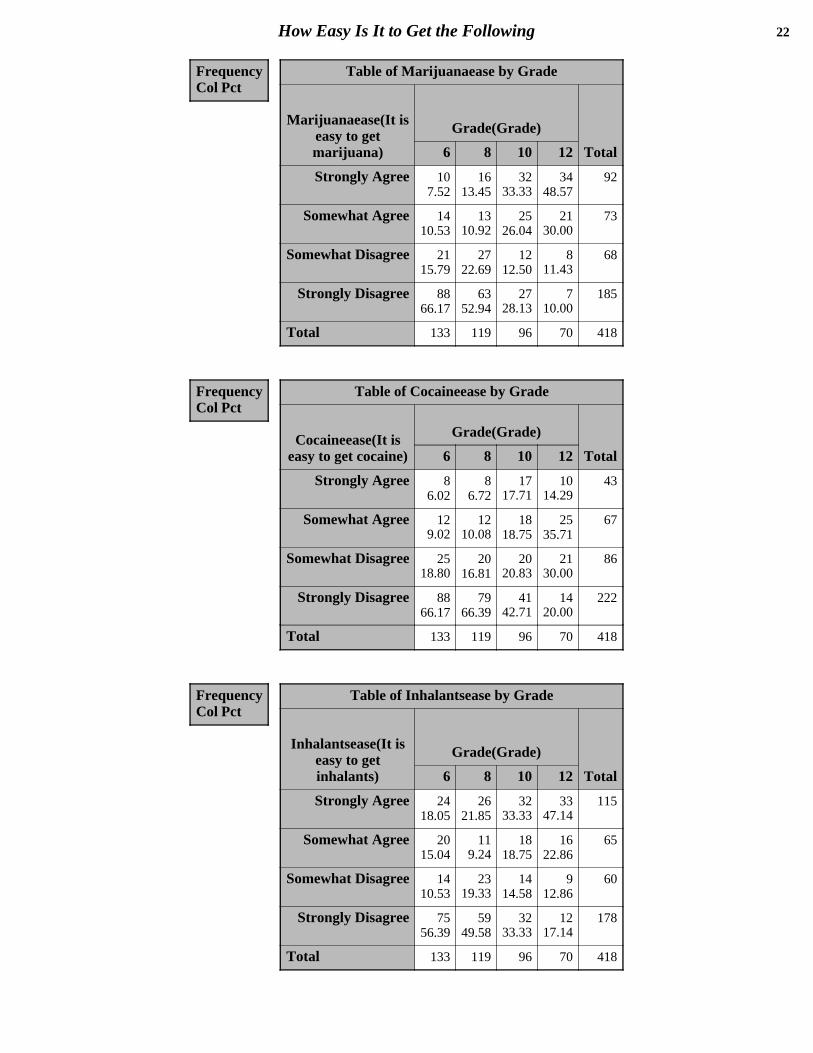
Table of Marijuanaease by Grade
Marijuanaease(It iseasy to getmarijuana)
Grade(Grade)
Total6 8 10 12
Strongly Agree 107.52
1613.45
3233.33
3448.57
92
Somewhat Agree 1410.53
1310.92
2526.04
2130.00
73
Somewhat Disagree 2115.79
2722.69
1212.50
811.43
68
Strongly Disagree 8866.17
6352.94
2728.13
710.00
185
Total 133 119 96 70 418
FrequencyCol Pct
Table of Cocaineease by Grade
Cocaineease(It iseasy to get cocaine)
Grade(Grade)
Total6 8 10 12
Strongly Agree 86.02
86.72
1717.71
1014.29
43
Somewhat Agree 129.02
1210.08
1818.75
2535.71
67
Somewhat Disagree 2518.80
2016.81
2020.83
2130.00
86
Strongly Disagree 8866.17
7966.39
4142.71
1420.00
222
Total 133 119 96 70 418
FrequencyCol Pct
Table of Inhalantsease by Grade
Inhalantsease(It iseasy to getinhalants)
Grade(Grade)
Total6 8 10 12
Strongly Agree 2418.05
2621.85
3233.33
3347.14
115
Somewhat Agree 2015.04
119.24
1818.75
1622.86
65
Somewhat Disagree 1410.53
2319.33
1414.58
912.86
60
Strongly Disagree 7556.39
5949.58
3233.33
1217.14
178
Total 133 119 96 70 418

How Easy Is It to Get the Following 23
FrequencyCol Pct
Table of Steroidsease by Grade
Steroidsease(It iseasy to get steroids)
Grade(Grade)
Total6 8 10 12
Strongly Agree 1511.28
43.36
1111.46
1115.71
41
Somewhat Agree 1410.53
1512.61
1818.75
2231.43
69
Somewhat Disagree 2418.05
2521.01
2323.96
2535.71
97
Strongly Disagree 8060.15
7563.03
4445.83
1217.14
211
Total 133 119 96 70 418
FrequencyCol Pct
Table of Ecstasyease by Grade
Ecstasyease(It iseasy to get ecstasy)
Grade(Grade)
Total6 8 10 12
Strongly Agree 118.27
75.88
1313.54
1115.71
42
Somewhat Agree 96.77
97.56
1717.71
2130.00
56
Somewhat Disagree 2720.30
2218.49
2222.92
2434.29
95
Strongly Disagree 8664.66
8168.07
4445.83
1420.00
225
Total 133 119 96 70 418
FrequencyCol Pct
Table of Methease by Grade
Methease(It is easyto get
methamphetamines)
Grade(Grade)
Total6 8 10 12
Strongly Agree 96.77
54.20
1212.50
1115.71
37
Somewhat Agree 1511.28
1411.76
2020.83
2231.43
71
Somewhat Disagree 2216.54
1815.13
1919.79
2434.29
83
Strongly Disagree 8765.41
8268.91
4546.88
1318.57
227
Total 133 119 96 70 418

How Easy Is It to Get the Following 24
FrequencyCol Pct
Table of Hallucinogensease by Grade
Hallucinogensease(Itis easy to get
hallucinogens)
Grade(Grade)
Total6 8 10 12
Strongly Agree 118.27
10.84
1313.54
912.86
34
Somewhat Agree 118.27
1411.76
1515.63
2028.57
60
Somewhat Disagree 2317.29
2621.85
2020.83
2637.14
95
Strongly Disagree 8866.17
7865.55
4850.00
1521.43
229
Total 133 119 96 70 418
FrequencyCol Pct
Table of Prescriptionease by Grade
Prescriptionease(Itis easy to get
prescription drugsnot prescribed to
me)
Grade(Grade)
Total6 8 10 12
Strongly Agree 2115.79
2521.01
3334.38
3854.29
117
Somewhat Agree 2619.55
2621.85
2425.00
1622.86
92
Somewhat Disagree 2115.79
2218.49
1414.58
710.00
64
Strongly Disagree 6548.87
4638.66
2526.04
912.86
145
Total 133 119 96 70 418

Age at Onset of Use 25
Results for "Age at Onset of Use" questions exclude students who said they did not use that substanceAge at Onset of Use 25
Results for "Age at Onset of Use" questions exclude students who said they did not use that substance
FrequencyRow Pct
Table of Grade by Alcoholinit
Grade(Grade)
Alcoholinit(I started using alcohol when I was)
Total8 or
younger 9 10 11 12 13 14 15 16 1718 orolder
6 116.67
00.00
116.67
233.33
116.67
00.00
00.00
116.67
00.00
00.00
00.00
6
8 314.29
314.29
29.52
00.00
29.52
1047.62
14.76
00.00
00.00
00.00
00.00
21
10 48.89
00.00
24.44
12.22
48.89
920.00
1635.56
920.00
00.00
00.00
00.00
45
12 24.88
00.00
12.44
12.44
37.32
49.76
614.63
717.07
1024.39
512.20
24.88
41
Total 10 3 6 4 10 23 23 17 10 5 2 113
Frequency Missing = 305
FrequencyRow Pct
Table of Grade by Cigarettesinit
Grade(Grade)
Cigarettesinit(I started smoking tobacco when I was)
Total8 or
younger 9 10 11 12 13 14 15 16 1718 orolder
6 00.00
00.00
240.00
120.00
120.00
00.00
00.00
00.00
00.00
00.00
120.00
5
8 18.33
18.33
00.00
18.33
18.33
758.33
00.00
00.00
00.00
00.00
18.33
12
10 26.90
00.00
26.90
00.00
00.00
517.24
724.14
1137.93
13.45
13.45
00.00
29
12 13.23
00.00
00.00
39.68
13.23
26.45
412.90
825.81
722.58
39.68
26.45
31
Total 4 1 4 5 3 14 11 19 8 4 4 77
Frequency Missing = 341
FrequencyRow Pct
Table of Grade by Smokelessinit
Grade(Grade)
Smokelessinit(I started chewing tobacco when I was)
Total8 or
younger 9 10 11 12 13 14 15 16 1718 orolder
6 00.00
00.00
00.00
266.67
133.33
00.00
00.00
00.00
00.00
00.00
00.00
3
8 00.00
00.00
00.00
00.00
00.00
583.33
00.00
00.00
00.00
00.00
116.67
6
10 00.00
325.00
18.33
00.00
00.00
216.67
325.00
216.67
00.00
18.33
00.00
12
12 17.69
00.00
00.00
17.69
17.69
00.00
17.69
430.77
215.38
215.38
17.69
13

Age at Onset of Use 26
Results for "Age at Onset of Use" questions exclude students who said they did not use that substance
FrequencyRow Pct
Table of Grade by Smokelessinit
Grade(Grade)
Smokelessinit(I started chewing tobacco when I was)
Total8 or
younger 9 10 11 12 13 14 15 16 1718 orolder
Total 1 3 1 3 2 7 4 6 2 3 2 34
Frequency Missing = 384
FrequencyRow Pct
Table of Grade by Marijuanainit
Grade(Grade)
Marijuanainit(I started using marijuana when I was)
Total8 or
younger 9 10 11 12 13 14 15 16 1718 orolder
6 00.00
00.00
00.00
00.00
1100.00
00.00
00.00
00.00
00.00
00.00
00.00
1
8 00.00
00.00
00.00
00.00
00.00
133.33
133.33
00.00
00.00
00.00
133.33
3
10 313.04
14.35
28.70
28.70
28.70
313.04
28.70
626.09
28.70
00.00
00.00
23
12 00.00
00.00
00.00
00.00
00.00
16.25
212.50
531.25
425.00
212.50
212.50
16
Total 3 1 2 2 3 5 5 11 6 2 3 43
Frequency Missing = 375
FrequencyRow Pct
Table of Grade by Cocaineinit
Grade(Grade)
Cocaineinit(I startedusing cocaine when I
was)
Total8 or
younger 13 16
6 0.
0.
0.
0
8 0.
0.
0.
0
10 120.00
360.00
120.00
5
12 0.
0.
0.
0
Total 1 3 1 5
Frequency Missing = 413

Age at Onset of Use 27
Results for "Age at Onset of Use" questions exclude students who said they did not use that substance
FrequencyRow Pct
Table of Grade by Inhalantsinit
Grade(Grade)
Inhalantsinit(I started using inhalants when Iwas)
Total8 or
younger 9 11 12 13 1518 orolder
6 00.00
133.33
133.33
00.00
133.33
00.00
00.00
3
8 150.00
00.00
00.00
150.00
00.00
00.00
00.00
2
10 240.00
00.00
00.00
00.00
240.00
120.00
00.00
5
12 00.00
00.00
00.00
00.00
00.00
00.00
1100.00
1
Total 3 1 1 1 3 1 1 11
Frequency Missing = 407
FrequencyRow Pct
Table of Grade by Steroidsinit
Grade(Grade)
Steroidsinit(I started using steroidswhen I was)
Total8 or
younger 10 11 12 13
6 00.00
00.00
2100.00
00.00
00.00
2
8 150.00
00.00
00.00
150.00
00.00
2
10 00.00
133.33
00.00
133.33
133.33
3
12 0.
0.
0.
0.
0.
0
Total 1 1 2 2 1 7
Frequency Missing = 411

Age at Onset of Use 28
Results for "Age at Onset of Use" questions exclude students who said they did not use that substance
FrequencyRow Pct
Table of Grade by Ecstasyinit
Grade(Grade)
Ecstasyinit(I started using ecstasywhen I was)
Total8 or
younger 11 13 14 17
6 0.
0.
0.
0.
0.
0
8 0.
0.
0.
0.
0.
0
10 120.00
120.00
120.00
240.00
00.00
5
12 00.00
00.00
00.00
00.00
1100.00
1
Total 1 1 1 2 1 6
Frequency Missing = 412
FrequencyRow Pct
Table of Grade by Methinit
Grade(Grade)
Methinit(I started usingmethamphetamines
when I was)
Total8 or
younger 13 16
6 0.
0.
0.
0
8 0.
0.
0.
0
10 250.00
125.00
125.00
4
12 0.
0.
0.
0
Total 2 1 1 4
Frequency Missing = 414

Age at Onset of Use 29
Results for "Age at Onset of Use" questions exclude students who said they did not use that substance
FrequencyRow Pct
Table of Grade by Hallucinogensinit
Grade(Grade)
Hallucinogensinit(I startedusing hallucinogens when I
was)
Total8 or
younger 11 13 14
6 0.
0.
0.
0.
0
8 0.
0.
0.
0.
0
10 125.00
125.00
125.00
125.00
4
12 0.
0.
0.
0.
0
Total 1 1 1 1 4
Frequency Missing = 414
FrequencyRow Pct
Table of Grade by Prescriptioninit
Grade(Grade)
Prescriptioninit(I started using prescription drugs not prescribed to mewhen I was)
Total8 or
younger 9 10 11 12 13 14 15 16 1718 orolder
6 116.67
116.67
233.33
116.67
116.67
00.00
00.00
00.00
00.00
00.00
00.00
6
8 00.00
00.00
00.00
125.00
125.00
125.00
125.00
00.00
00.00
00.00
00.00
4
10 430.77
00.00
00.00
00.00
17.69
17.69
430.77
17.69
215.38
00.00
00.00
13
12 00.00
00.00
00.00
00.00
00.00
00.00
00.00
233.33
233.33
116.67
116.67
6
Total 5 1 2 2 3 2 5 3 4 1 1 29
Frequency Missing = 389
Perception of Harmfulness 30Perception of Harmfulness 30
FrequencyCol Pct
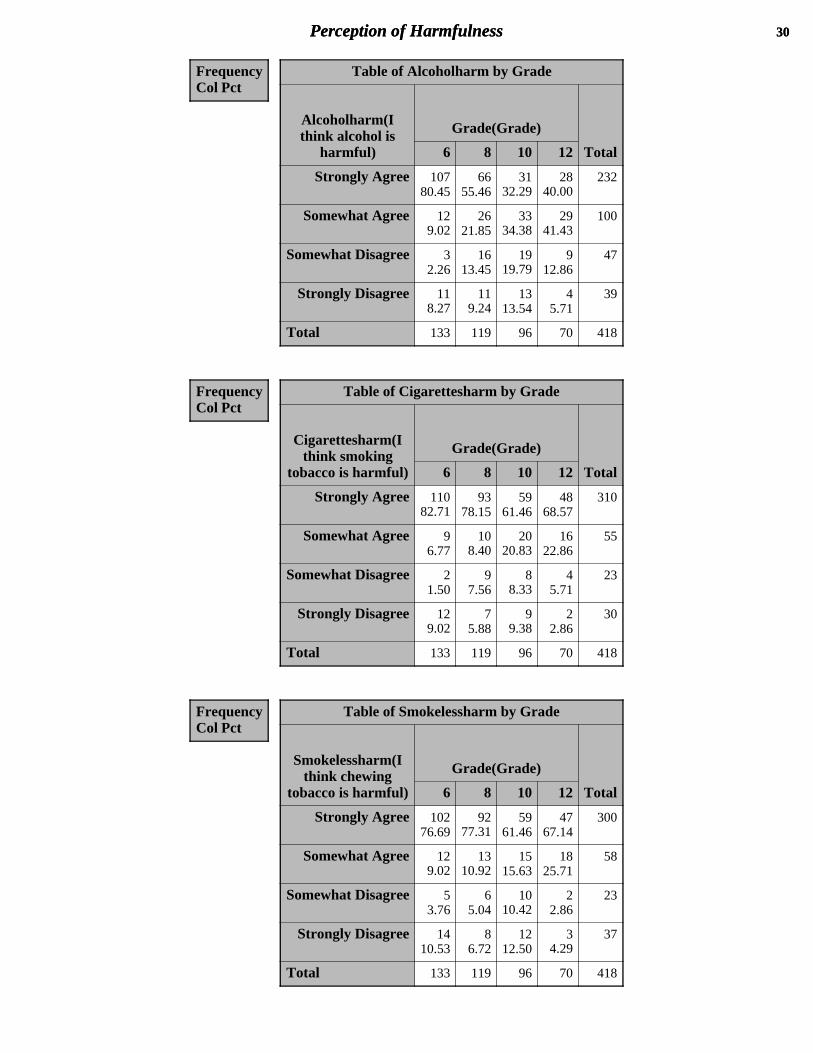
Table of Alcoholharm by Grade
Alcoholharm(Ithink alcohol is
harmful)
Grade(Grade)
Total6 8 10 12
Strongly Agree 10780.45
6655.46
3132.29
2840.00
232
Somewhat Agree 129.02
2621.85
3334.38
2941.43
100
Somewhat Disagree 32.26
1613.45
1919.79
912.86
47
Strongly Disagree 118.27
119.24
1313.54
45.71
39
Total 133 119 96 70 418
FrequencyCol Pct
Table of Cigarettesharm by Grade
Cigarettesharm(Ithink smoking
tobacco is harmful)
Grade(Grade)
Total6 8 10 12
Strongly Agree 11082.71
9378.15
5961.46
4868.57
310
Somewhat Agree 96.77
108.40
2020.83
1622.86
55
Somewhat Disagree 21.50
97.56
88.33
45.71
23
Strongly Disagree 129.02
75.88
99.38
22.86
30
Total 133 119 96 70 418
FrequencyCol Pct
Table of Smokelessharm by Grade
Smokelessharm(Ithink chewing
tobacco is harmful)
Grade(Grade)
Total6 8 10 12
Strongly Agree 10276.69
9277.31
5961.46
4767.14
300
Somewhat Agree 129.02
1310.92
1515.63
1825.71
58
Somewhat Disagree 53.76
65.04
1010.42
22.86
23
Strongly Disagree 1410.53
86.72
1212.50
34.29
37
Total 133 119 96 70 418

Perception of Harmfulness 31
FrequencyCol Pct
Table of Marijuanaharm by Grade
Marijuanaharm(Ithink marijuana is
harmful)
Grade(Grade)
Total6 8 10 12
Strongly Agree 11586.47
9680.67
4546.88
3550.00
291
Somewhat Agree 43.01
86.72
1616.67
2130.00
49
Somewhat Disagree 10.75
75.88
1515.63
710.00
30
Strongly Disagree 139.77
86.72
2020.83
710.00
48
Total 133 119 96 70 418
FrequencyCol Pct
Table of Cocaineharm by Grade
Cocaineharm(Ithink cocaine is
harmful)
Grade(Grade)
Total6 8 10 12
Strongly Agree 11586.47
10689.08
7275.00
6491.43
357
Somewhat Agree 43.01
10.84
88.33
22.86
15
Somewhat Disagree 10.75
32.52
66.25
34.29
13
Strongly Disagree 139.77
97.56
1010.42
11.43
33
Total 133 119 96 70 418
FrequencyCol Pct
Table of Inhalantsharm by Grade
Inhalantsharm(Ithink inhalants are
harmful)
Grade(Grade)
Total6 8 10 12
Strongly Agree 11082.71
9680.67
6870.83
6491.43
338
Somewhat Agree 86.02
86.72
1111.46
34.29
30
Somewhat Disagree 53.76
54.20
88.33
11.43
19
Strongly Disagree 107.52
108.40
99.38
22.86
31
Total 133 119 96 70 418

Perception of Harmfulness 32
FrequencyCol Pct
Table of Steroidsharm by Grade
Steroidsharm(Ithink steroids are
harmful)
Grade(Grade)
Total6 8 10 12
Strongly Agree 10175.94
9176.47
7072.92
5781.43
319
Somewhat Agree 1511.28
1411.76
1111.46
1014.29
50
Somewhat Disagree 64.51
75.88
44.17
22.86
19
Strongly Disagree 118.27
75.88
1111.46
11.43
30
Total 133 119 96 70 418
FrequencyCol Pct
Table of Ecstasyharm by Grade
Ecstasyharm(Ithink ecstasy is
harmful)
Grade(Grade)
Total6 8 10 12
Strongly Agree 11384.96
10084.03
7072.92
6085.71
343
Somewhat Agree 75.26
65.04
1010.42
710.00
30
Somewhat Disagree 10.75
65.04
55.21
11.43
13
Strongly Disagree 129.02
75.88
1111.46
22.86
32
Total 133 119 96 70 418
FrequencyCol Pct
Table of Methharm by Grade
Methharm(I thinkmethamphetamines
are harmful)
Grade(Grade)
Total6 8 10 12
Strongly Agree 11687.22
10689.08
7578.13
6592.86
362
Somewhat Agree 21.50
21.68
88.33
34.29
15
Somewhat Disagree 21.50
32.52
44.17
00.00
9
Strongly Disagree 139.77
86.72
99.38
22.86
32
Total 133 119 96 70 418

Perception of Harmfulness 33
FrequencyCol Pct
Table of Hallucinogensharm by Grade
Hallucinogensharm(Ithink hallucinogens
are harmful)
Grade(Grade)
Total6 8 10 12
Strongly Agree 11687.22
10386.55
6971.88
6491.43
352
Somewhat Agree 43.01
32.52
77.29
34.29
17
Somewhat Disagree 10.75
54.20
88.33
11.43
15
Strongly Disagree 129.02
86.72
1212.50
22.86
34
Total 133 119 96 70 418
FrequencyCol Pct
Table of Prescriptionharm by Grade
Prescriptionharm(Ithink prescription
drugs notprescribed to me
are harmful)
Grade(Grade)
Total6 8 10 12
Strongly Agree 9974.44
8168.07
5658.33
4970.00
285
Somewhat Agree 1712.78
1613.45
1414.58
1420.00
61
Somewhat Disagree 75.26
1210.08
1010.42
57.14
34
Strongly Disagree 107.52
108.40
1616.67
22.86
38
Total 133 119 96 70 418

Disapproval by Adults 34Disapproval by Adults 34
FrequencyCol Pct
Table of Alcoholadult by Grade
Alcoholadult(Adultswould disapprove if
I used alcohol)
Grade(Grade)
Total6 8 10 12
Strongly Agree 10377.44
8168.07
5153.13
3144.29
266
Somewhat Agree 118.27
2016.81
2020.83
1825.71
69
Somewhat Disagree 64.51
108.40
1919.79
1825.71
53
Strongly Disagree 139.77
86.72
66.25
34.29
30
Total 133 119 96 70 418
FrequencyCol Pct
Table of Tobaccoadult by Grade
Tobaccoadult(Adultswould disapprove if
I used tobacco)
Grade(Grade)
Total6 8 10 12
Strongly Agree 11183.46
9680.67
6163.54
3550.00
303
Somewhat Agree 53.76
97.56
1616.67
2535.71
55
Somewhat Disagree 43.01
75.88
1111.46
710.00
29
Strongly Disagree 139.77
75.88
88.33
34.29
31
Total 133 119 96 70 418
FrequencyCol Pct
Table of Marijuanaadult by Grade
Marijuanaadult(Adultswould disapprove if I
used marijuana)
Grade(Grade)
Total6 8 10 12
Strongly Agree 11787.97
10789.92
7173.96
5477.14
349
Somewhat Agree 00.00
21.68
1010.42
811.43
20
Somewhat Disagree 21.50
21.68
55.21
57.14
14
Strongly Disagree 1410.53
86.72
1010.42
34.29
35
Total 133 119 96 70 418

Disapproval by Adults 35
FrequencyCol Pct
Table of Otherdrugadult by Grade
Otherdrugadult(Adultswould disapprove if I
used other drugs)
Grade(Grade)
Total6 8 10 12
Strongly Agree 11787.97
10789.92
7881.25
6288.57
364
Somewhat Agree 10.75
21.68
77.29
34.29
13
Somewhat Disagree 10.75
10.84
11.04
22.86
5
Strongly Disagree 1410.53
97.56
1010.42
34.29
36
Total 133 119 96 70 418

Disapproval by Peers 36Disapproval by Peers 36
FrequencyCol Pct
Table of Alcoholpeer by Grade
Alcoholpeer(Myfriends would
disapprove if I usedalcohol)
Grade(Grade)
Total6 8 10 12
Strongly Agree 8966.92
4638.66
1212.50
1014.29
157
Somewhat Agree 1612.03
3126.05
1919.79
1217.14
78
Somewhat Disagree 118.27
2218.49
2728.13
1521.43
75
Strongly Disagree 1712.78
2016.81
3839.58
3347.14
108
Total 133 119 96 70 418
FrequencyCol Pct
Table of Tobaccopeer by Grade
Tobaccopeer(Myfriends would
disapprove if I usedtobacco)
Grade(Grade)
Total6 8 10 12
Strongly Agree 9873.68
6252.10
2627.08
1115.71
197
Somewhat Agree 129.02
2319.33
2020.83
1420.00
69
Somewhat Disagree 96.77
2016.81
1919.79
1521.43
63
Strongly Disagree 1410.53
1411.76
3132.29
3042.86
89
Total 133 119 96 70 418
FrequencyCol Pct
Table of Marijuanapeer by Grade
Marijuanapeer(Myfriends would
disapprove if I usedmarijuana)
Grade(Grade)
Total6 8 10 12
Strongly Agree 10478.20
7058.82
3233.33
2028.57
226
Somewhat Agree 75.26
1613.45
1717.71
1521.43
55
Somewhat Disagree 86.02
1613.45
1818.75
1420.00
56

Disapproval by Peers 37
FrequencyCol Pct
Table of Marijuanapeer by Grade
Marijuanapeer(Myfriends would
disapprove if I usedmarijuana)
Grade(Grade)
Total6 8 10 12
Strongly Disagree 1410.53
1714.29
2930.21
2130.00
81
Total 133 119 96 70 418
FrequencyCol Pct
Table of Otherdrugpeer by Grade
Otherdrugpeer(Myfriends would
disapprove if I usedother drugs)
Grade(Grade)
Total6 8 10 12
Strongly Agree 10578.95
7563.03
4243.75
3550.00
257
Somewhat Agree 75.26
1512.61
1717.71
1825.71
57
Somewhat Disagree 53.76
1815.13
1616.67
710.00
46
Strongly Disagree 1612.03
119.24
2121.88
1014.29
58
Total 133 119 96 70 418

Where do My Friends Use - Percentage of Students who selected the following responses.Studentscould select more than 1 response so the percentage for each substance will not add up to 100%.
38Where do My Friends Use - Percentage of Students who selected the following responses.Studentscould select more than 1 response so the percentage for each substance will not add up to 100%.
38
FrequencyCol Pct
Table of Alcohollocation1 by Grade
Alcohollocation1(PlacesFriends Use Alcohol)
Grade(Grade)
Total6 8 10 12
. 129.02
4537.82
6971.88
5781.43
183
Do Not Use 12190.98
7462.18
2728.13
1318.57
235
Total 133 119 96 70 418
FrequencyCol Pct
Table of Alcohollocation2 by Grade
Alcohollocation2(PlacesFriends Use Alcohol)
Grade(Grade)
Total6 8 10 12
. 12896.24
8773.11
4647.92
3448.57
295
Home 53.76
3226.89
5052.08
3651.43
123
Total 133 119 96 70 418
FrequencyCol Pct
Table of Alcohollocation3 by Grade
Alcohollocation3(PlacesFriends Use Alcohol)
Grade(Grade)
Total6 8 10 12
. 13299.25
11697.48
8992.71
6795.71
404
School 10.75
32.52
77.29
34.29
14
Total 133 119 96 70 418
FrequencyCol Pct
Table of Alcohollocation4 by Grade
Alcohollocation4(PlacesFriends Use Alcohol)
Grade(Grade)
Total6 8 10 12
. 13198.50
11596.64
7679.17
5882.86
380
Car 21.50
43.36
2020.83
1217.14
38
Total 133 119 96 70 418

Where do My Friends Use - Percentage of Students who selected the following responses.Studentscould select more than 1 response so the percentage for each substance will not add up to 100%.
39
FrequencyCol Pct
Table of Alcohollocation5 by Grade
Alcohollocation5(PlacesFriends Use Alcohol)
Grade(Grade)
Total6 8 10 12
. 12593.98
9176.47
4243.75
1622.86
274
Friend's House 86.02
2823.53
5456.25
5477.14
144
Total 133 119 96 70 418
FrequencyCol Pct
Table of Alcohollocation6 by Grade
Alcohollocation6(PlacesFriends Use Alcohol)
Grade(Grade)
Total6 8 10 12
. 12593.98
9781.51
5557.29
4260.00
319
Other 86.02
2218.49
4142.71
2840.00
99
Total 133 119 96 70 418
FrequencyCol Pct
Table of Tobaccolocation1 by Grade
Tobaccolocation1(PlacesFriends Use Tobacco)
Grade(Grade)
Total6 8 10 12
. 129.02
4134.45
5254.17
5477.14
159
Do Not Use 12190.98
7865.55
4445.83
1622.86
259
Total 133 119 96 70 418
FrequencyCol Pct
Table of Tobaccolocation2 by Grade
Tobaccolocation2(PlacesFriends Use Tobacco)
Grade(Grade)
Total6 8 10 12
. 12593.98
9277.31
5557.29
3448.57
306
Home 86.02
2722.69
4142.71
3651.43
112
Total 133 119 96 70 418

Where do My Friends Use - Percentage of Students who selected the following responses.Studentscould select more than 1 response so the percentage for each substance will not add up to 100%.
40
FrequencyCol Pct
Table of Tobaccolocation3 by Grade
Tobaccolocation3(PlacesFriends Use Tobacco)
Grade(Grade)
Total6 8 10 12
. 13097.74
11394.96
7477.08
5578.57
372
School 32.26
65.04
2222.92
1521.43
46
Total 133 119 96 70 418
FrequencyCol Pct
Table of Tobaccolocation4 by Grade
Tobaccolocation4(PlacesFriends Use Tobacco)
Grade(Grade)
Total6 8 10 12
. 12996.99
11092.44
6264.58
3448.57
335
Car 43.01
97.56
3435.42
3651.43
83
Total 133 119 96 70 418
FrequencyCol Pct
Table of Tobaccolocation5 by Grade
Tobaccolocation5(PlacesFriends Use Tobacco)
Grade(Grade)
Total6 8 10 12
. 12593.98
9983.19
5355.21
2535.71
302
Friend's House 86.02
2016.81
4344.79
4564.29
116
Total 133 119 96 70 418
FrequencyCol Pct
Table of Tobaccolocation6 by Grade
Tobaccolocation6(PlacesFriends Use Tobacco)
Grade(Grade)
Total6 8 10 12
. 12896.24
9579.83
6163.54
3550.00
319
Other 53.76
2420.17
3536.46
3550.00
99
Total 133 119 96 70 418

Where do My Friends Use - Percentage of Students who selected the following responses.Studentscould select more than 1 response so the percentage for each substance will not add up to 100%.
41
FrequencyCol Pct
Table of Marijuanalocation1 by Grade
Marijuanalocation1(PlacesFriends Use Marijuana)
Grade(Grade)
Total6 8 10 12
. 32.26
3025.21
4951.04
4057.14
122
Do Not Use 13097.74
8974.79
4748.96
3042.86
296
Total 133 119 96 70 418
FrequencyCol Pct
Table of Marijuanalocation2 by Grade
Marijuanalocation2(PlacesFriends Use Marijuana)
Grade(Grade)
Total6 8 10 12
. 13299.25
9882.35
6062.50
4462.86
334
Home 10.75
2117.65
3637.50
2637.14
84
Total 133 119 96 70 418
FrequencyCol Pct
Table of Marijuanalocation3 by Grade
Marijuanalocation3(PlacesFriends Use Marijuana)
Grade(Grade)
Total6 8 10 12
. 13198.50
11394.96
8689.58
6897.14
398
School 21.50
65.04
1010.42
22.86
20
Total 133 119 96 70 418
FrequencyCol Pct
Table of Marijuanalocation4 by Grade
Marijuanalocation4(PlacesFriends Use Marijuana)
Grade(Grade)
Total6 8 10 12
. 13198.50
11394.96
6971.88
5071.43
363
Car 21.50
65.04
2728.13
2028.57
55
Total 133 119 96 70 418

Where do My Friends Use - Percentage of Students who selected the following responses.Studentscould select more than 1 response so the percentage for each substance will not add up to 100%.
42
FrequencyCol Pct
Table of Marijuanalocation5 by Grade
Marijuanalocation5(PlacesFriends Use Marijuana)
Grade(Grade)
Total6 8 10 12
. 13299.25
10084.03
5153.13
3042.86
313
Friend's House 10.75
1915.97
4546.88
4057.14
105
Total 133 119 96 70 418
FrequencyCol Pct
Table of Marijuanalocation6 by Grade
Marijuanalocation6(PlacesFriends Use Marijuana)
Grade(Grade)
Total6 8 10 12
. 13198.50
10285.71
6466.67
4564.29
342
Other 21.50
1714.29
3233.33
2535.71
76
Total 133 119 96 70 418
FrequencyCol Pct
Table of Otherdruglocation1 by Grade
Otherdruglocation1(PlacesFriends Use Other Illegal
Drugs)
Grade(Grade)
Total6 8 10 12
. 75.26
2117.65
3233.33
2535.71
85
Do Not Use 12694.74
9882.35
6466.67
4564.29
333
Total 133 119 96 70 418
FrequencyCol Pct
Table of Otherdruglocation2 by Grade
Otherdruglocation2(PlacesFriends Use Other Illegal
Drugs)
Grade(Grade)
Total6 8 10 12
. 12896.24
10789.92
6971.88
5578.57
359
Home 53.76
1210.08
2728.13
1521.43
59
Total 133 119 96 70 418

Where do My Friends Use - Percentage of Students who selected the following responses.Studentscould select more than 1 response so the percentage for each substance will not add up to 100%.
43
FrequencyCol Pct
Table of Otherdruglocation3 by Grade
Otherdruglocation3(PlacesFriends Use Other Illegal
Drugs)
Grade(Grade)
Total6 8 10 12
. 13198.50
11495.80
8689.58
6592.86
396
School 21.50
54.20
1010.42
57.14
22
Total 133 119 96 70 418
FrequencyCol Pct
Table of Otherdruglocation4 by Grade
Otherdruglocation4(PlacesFriends Use Other Illegal
Drugs)
Grade(Grade)
Total6 8 10 12
. 12996.99
11495.80
8083.33
6187.14
384
Car 43.01
54.20
1616.67
912.86
34
Total 133 119 96 70 418
FrequencyCol Pct
Table of Otherdruglocation5 by Grade
Otherdruglocation5(PlacesFriends Use Other Illegal
Drugs)
Grade(Grade)
Total6 8 10 12
. 12896.24
11092.44
6769.79
4970.00
354
Friend's House 53.76
97.56
2930.21
2130.00
64
Total 133 119 96 70 418
FrequencyCol Pct
Table of Otherdruglocation6 by Grade
Otherdruglocation6(PlacesFriends Use Other Illegal
Drugs)
Grade(Grade)
Total6 8 10 12
. 13097.74
10588.24
7275.00
5680.00
363
Other 32.26
1411.76
2425.00
1420.00
55
Total 133 119 96 70 418

When do My Friends Use - Percentage of Students who selected the following responses.Studentscould select more than 1 response so the percentage for each substance will not add up to 100%.
44When do My Friends Use - Percentage of Students who selected the following responses.Studentscould select more than 1 response so the percentage for each substance will not add up to 100%.
44
FrequencyCol Pct
Table of Alcoholtime1 by Grade
Alcoholtime1(TimesFriends Use
Alcohol)
Grade(Grade)
Total6 8 10 12
. 107.52
4336.13
6769.79
5781.43
177
Do Not Use 12392.48
7663.87
2930.21
1318.57
241
Total 133 119 96 70 418
FrequencyCol Pct
Table of Alcoholtime2 by Grade
Alcoholtime2(TimesFriends Use
Alcohol)
Grade(Grade)
Total6 8 10 12
. 13299.25
11899.16
8790.63
6491.43
401
On Way to School 10.75
10.84
99.38
68.57
17
Total 133 119 96 70 418
FrequencyCol Pct
Table of Alcoholtime3 by Grade
Alcoholtime3(TimesFriends Use
Alcohol)
Grade(Grade)
Total6 8 10 12
. 13299.25
119100.00
8891.67
6795.71
406
During School 10.75
00.00
88.33
34.29
12
Total 133 119 96 70 418
FrequencyCol Pct
Table of Alcoholtime4 by Grade
Alcoholtime4(TimesFriends Use Alcohol)
Grade(Grade)
Total6 8 10 12
. 133100.00
11495.80
8285.42
6288.57
391
On Way Home From School 00.00
54.20
1414.58
811.43
27
Total 133 119 96 70 418
When do My Friends Use - Percentage of Students who selected the following responses.Studentscould select more than 1 response so the percentage for each substance will not add up to 100%.
45
FrequencyCol Pct
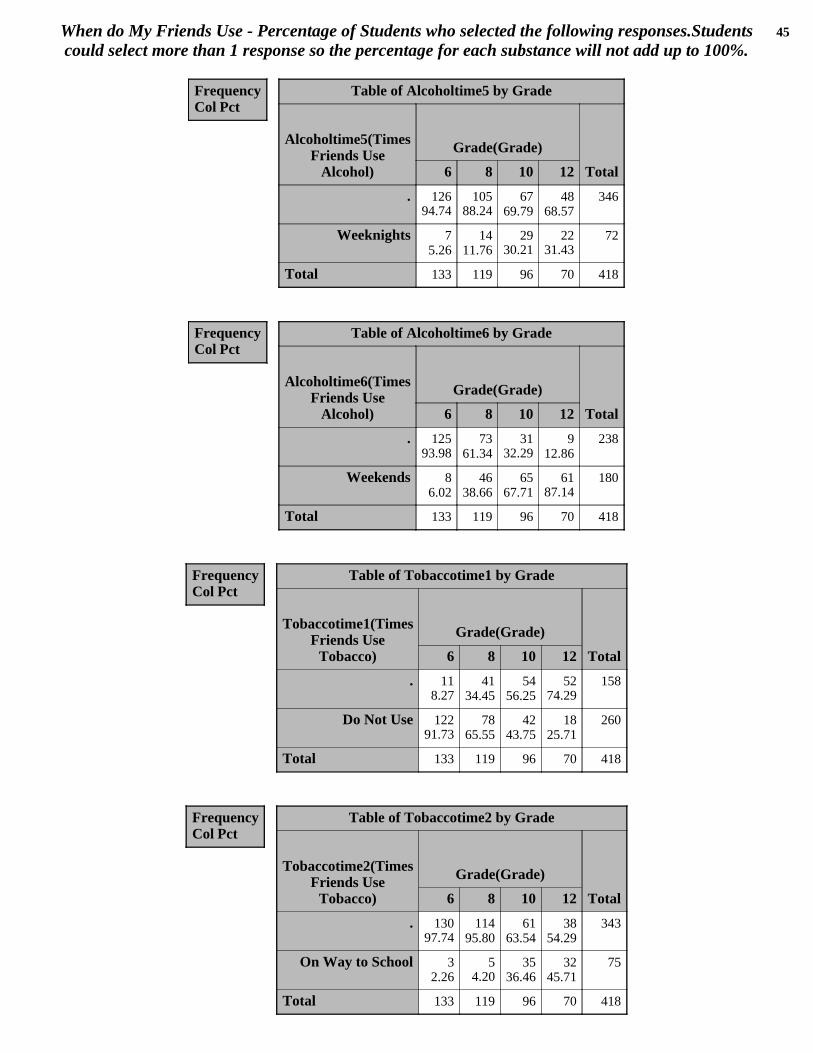
Table of Alcoholtime5 by Grade
Alcoholtime5(TimesFriends Use
Alcohol)
Grade(Grade)
Total6 8 10 12
. 12694.74
10588.24
6769.79
4868.57
346
Weeknights 75.26
1411.76
2930.21
2231.43
72
Total 133 119 96 70 418
FrequencyCol Pct
Table of Alcoholtime6 by Grade
Alcoholtime6(TimesFriends Use
Alcohol)
Grade(Grade)
Total6 8 10 12
. 12593.98
7361.34
3132.29
912.86
238
Weekends 86.02
4638.66
6567.71
6187.14
180
Total 133 119 96 70 418
FrequencyCol Pct
Table of Tobaccotime1 by Grade
Tobaccotime1(TimesFriends Use
Tobacco)
Grade(Grade)
Total6 8 10 12
. 118.27
4134.45
5456.25
5274.29
158
Do Not Use 12291.73
7865.55
4243.75
1825.71
260
Total 133 119 96 70 418
FrequencyCol Pct
Table of Tobaccotime2 by Grade
Tobaccotime2(TimesFriends Use
Tobacco)
Grade(Grade)
Total6 8 10 12
. 13097.74
11495.80
6163.54
3854.29
343
On Way to School 32.26
54.20
3536.46
3245.71
75
Total 133 119 96 70 418

When do My Friends Use - Percentage of Students who selected the following responses.Studentscould select more than 1 response so the percentage for each substance will not add up to 100%.
46
FrequencyCol Pct
Table of Tobaccotime3 by Grade
Tobaccotime3(TimesFriends Use
Tobacco)
Grade(Grade)
Total6 8 10 12
. 13198.50
11495.80
7679.17
6288.57
383
During School 21.50
54.20
2020.83
811.43
35
Total 133 119 96 70 418
FrequencyCol Pct
Table of Tobaccotime4 by Grade
Tobaccotime4(TimesFriends Use Tobacco)
Grade(Grade)
Total6 8 10 12
. 133100.00
11495.80
8285.42
6288.57
391
On Way Home From School 00.00
54.20
1414.58
811.43
27
Total 133 119 96 70 418
FrequencyCol Pct
Table of Tobaccotime5 by Grade
Tobaccotime5(TimesFriends Use
Tobacco)
Grade(Grade)
Total6 8 10 12
. 12795.49
9983.19
4850.00
2332.86
297
Weeknights 64.51
2016.81
4850.00
4767.14
121
Total 133 119 96 70 418
FrequencyCol Pct
Table of Tobaccotime6 by Grade
Tobaccotime6(TimesFriends Use
Tobacco)
Grade(Grade)
Total6 8 10 12
. 12493.23
8369.75
4445.83
1724.29
268
Weekends 96.77
3630.25
5254.17
5375.71
150
Total 133 119 96 70 418

When do My Friends Use - Percentage of Students who selected the following responses.Studentscould select more than 1 response so the percentage for each substance will not add up to 100%.
47
FrequencyCol Pct
Table of Marijuanatime1 by Grade
Marijuanatime1(TimesFriends UseMarijuana)
Grade(Grade)
Total6 8 10 12
. 10.75
3025.21
5355.21
3955.71
123
Do Not Use 13299.25
8974.79
4344.79
3144.29
295
Total 133 119 96 70 418
FrequencyCol Pct
Table of Marijuanatime2 by Grade
Marijuanatime2(TimesFriends UseMarijuana)
Grade(Grade)
Total6 8 10 12
. 13299.25
11697.48
7982.29
5882.86
385
On Way to School 10.75
32.52
1717.71
1217.14
33
Total 133 119 96 70 418
FrequencyCol Pct
Table of Marijuanatime3 by Grade
Marijuanatime3(TimesFriends UseMarijuana)
Grade(Grade)
Total6 8 10 12
. 13299.25
11697.48
8790.63
6897.14
403
During School 10.75
32.52
99.38
22.86
15
Total 133 119 96 70 418
FrequencyCol Pct
Table of Marijuanatime4 by Grade
Marijuanatime4(TimesFriends Use Marijuana)
Grade(Grade)
Total6 8 10 12
. 133100.00
11495.80
7275.00
5375.71
372
On Way Home From School 00.00
54.20
2425.00
1724.29
46
Total 133 119 96 70 418

When do My Friends Use - Percentage of Students who selected the following responses.Studentscould select more than 1 response so the percentage for each substance will not add up to 100%.
48
FrequencyCol Pct
Table of Marijuanatime5 by Grade
Marijuanatime5(TimesFriends UseMarijuana)
Grade(Grade)
Total6 8 10 12
. 13299.25
10789.92
5557.29
4057.14
334
Weeknights 10.75
1210.08
4142.71
3042.86
84
Total 133 119 96 70 418
FrequencyCol Pct
Table of Marijuanatime6 by Grade
Marijuanatime6(TimesFriends UseMarijuana)
Grade(Grade)
Total6 8 10 12
. 13198.50
8873.95
4647.92
2840.00
293
Weekends 21.50
3126.05
5052.08
4260.00
125
Total 133 119 96 70 418
FrequencyCol Pct
Table of Otherdrugtime1 by Grade
Otherdrugtime1(TimesFriends Use Other
Illegal Drugs)
Grade(Grade)
Total6 8 10 12
. 64.51
2218.49
2930.21
2231.43
79
Do Not Use 12795.49
9781.51
6769.79
4868.57
339
Total 133 119 96 70 418
FrequencyCol Pct
Table of Otherdrugtime2 by Grade
Otherdrugtime2(TimesFriends Use Other
Illegal Drugs)
Grade(Grade)
Total6 8 10 12
. 13198.50
11697.48
8184.38
6288.57
390
On Way to School 21.50
32.52
1515.63
811.43
28
Total 133 119 96 70 418

When do My Friends Use - Percentage of Students who selected the following responses.Studentscould select more than 1 response so the percentage for each substance will not add up to 100%.
49
FrequencyCol Pct
Table of Otherdrugtime3 by Grade
Otherdrugtime3(TimesFriends Use Other
Illegal Drugs)
Grade(Grade)
Total6 8 10 12
. 13198.50
11899.16
8588.54
6694.29
400
During School 21.50
10.84
1111.46
45.71
18
Total 133 119 96 70 418
FrequencyCol Pct
Table of Otherdrugtime4 by Grade
Otherdrugtime4(TimesFriends Use Other Illegal
Drugs)
Grade(Grade)
Total6 8 10 12
. 13198.50
11697.48
7982.29
6085.71
386
On Way Home From School 21.50
32.52
1717.71
1014.29
32
Total 133 119 96 70 418
FrequencyCol Pct
Table of Otherdrugtime5 by Grade
Otherdrugtime5(TimesFriends Use Other
Illegal Drugs)
Grade(Grade)
Total6 8 10 12
. 13097.74
11193.28
7275.00
5477.14
367
Weeknights 32.26
86.72
2425.00
1622.86
51
Total 133 119 96 70 418
FrequencyCol Pct
Table of Otherdrugtime6 by Grade
Otherdrugtime6(TimesFriends Use Other
Illegal Drugs)
Grade(Grade)
Total6 8 10 12
. 12896.24
10084.03
6466.67
4868.57
340
Weekends 53.76
1915.97
3233.33
2231.43
78
Total 133 119 96 70 418
Other Questions 50Other Questions 50
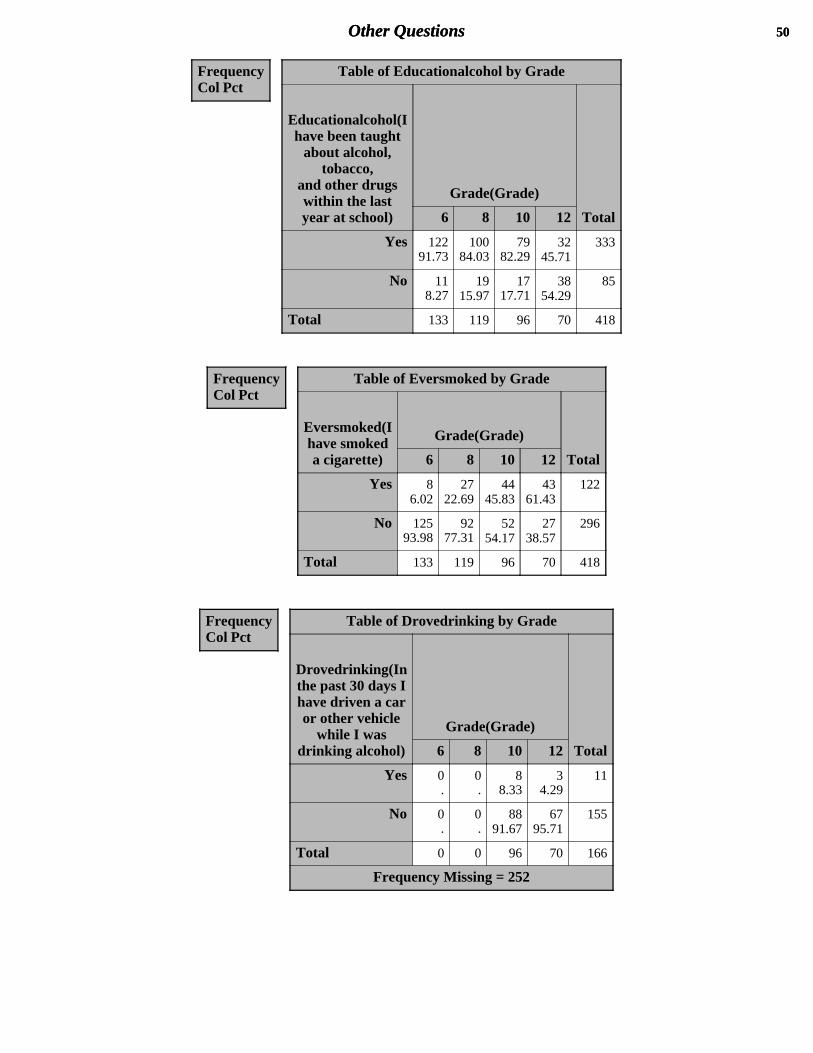
FrequencyCol Pct
Table of Educationalcohol by Grade
Educationalcohol(Ihave been taught
about alcohol,tobacco,
and other drugswithin the lastyear at school)
Grade(Grade)
Total6 8 10 12
Yes 12291.73
10084.03
7982.29
3245.71
333
No 118.27
1915.97
1717.71
3854.29
85
Total 133 119 96 70 418
FrequencyCol Pct
Table of Eversmoked by Grade
Eversmoked(Ihave smokeda cigarette)
Grade(Grade)
Total6 8 10 12
Yes 86.02
2722.69
4445.83
4361.43
122
No 12593.98
9277.31
5254.17
2738.57
296
Total 133 119 96 70 418
FrequencyCol Pct
Table of Drovedrinking by Grade
Drovedrinking(Inthe past 30 days Ihave driven a caror other vehicle
while I wasdrinking alcohol)
Grade(Grade)
Total6 8 10 12
Yes 0.
0.
88.33
34.29
11
No 0.
0.
8891.67
6795.71
155
Total 0 0 96 70 166
Frequency Missing = 252

Other Questions 51
FrequencyCol Pct
Table of Rodedrinking by Grade
Rodedrinking(Inthe past 30 daysI have ridden in
a car with adriver who hadbeen drinking
alcohol)
Grade(Grade)
Total6 8 10 12
Yes 129.02
108.40
1515.63
1521.43
52
No 12190.98
10991.60
8184.38
5578.57
366
Total 133 119 96 70 418
FrequencyCol Pct
Table of Drugsschool by Grade
Drugsschool(Duringthe past 12 months,I have been offered,
sold,or given illegaldrugs on school
property)
Grade(Grade)
Total6 8 10 12
Yes 43.01
1411.76
2728.13
1217.14
57
No 12996.99
10588.24
6971.88
5882.86
361
Total 133 119 96 70 418
FrequencyCol Pct
Table of Helpbullied by Grade
Helpbullied(Iwould help
someone who wasbeing bullied)
Grade(Grade)
Total6 8 10 12
Strongly Agree 8765.41
5747.90
3435.42
3347.14
211
Somewhat Agree 4030.08
5042.02
4243.75
3042.86
162
Somewhat Disagree 32.26
75.88
1111.46
34.29
24
Strongly Disagree 32.26
54.20
99.38
45.71
21
Total 133 119 96 70 418

Other Questions 52Other Questions 52
FrequencyRow Pct
Table of Grade by Bingedrinking
Grade(Grade)
Bingedrinking(I have drunk five or moredrinks of alcohol at one sitting during the
last 30 days)
Total0
Days
1 or2
days
3 to5
days
6 to9
days
10to19
days
20to29
days
All30
days
6 13299.25
00.00
00.00
00.00
10.75
00.00
00.00
133
8 11193.28
10.84
10.84
00.00
00.00
54.20
10.84
119
10 7679.17
44.17
66.25
33.13
44.17
11.04
22.08
96
12 5274.29
11.43
34.29
22.86
811.43
11.43
34.29
70
Total 371 6 10 5 13 7 6 418

Nutrition 53Nutrition 53
FrequencyRow Pct
Table of Grade by Dairy
Grade(Grade)
Dairy(I eat at least 3 servings of dairyproducts each day)
TotalStrongly
AgreeSomewhat
AgreeSomewhat
DisagreeStronglyDisagree
6 4836.09
6448.12
129.02
96.77
133
8 4436.97
4638.66
1714.29
1210.08
119
10 1919.79
4445.83
1818.75
1515.63
96
12 2130.00
2637.14
1014.29
1318.57
70
Total 132 180 57 49 418
FrequencyRow Pct
Table of Grade by Fruitveg
Grade(Grade)
Fruitveg(I eat at least 5 servings of fruitsand vegetables each day)
TotalStrongly
AgreeSomewhat
AgreeSomewhat
DisagreeStronglyDisagree
6 3627.07
5742.86
2921.80
118.27
133
8 1714.29
5042.02
3428.57
1815.13
119
10 1111.46
3334.38
2728.13
2526.04
96
12 811.43
2738.57
1927.14
1622.86
70
Total 72 167 109 70 418
FrequencyRow Pct
Table of Grade by Cafeteriahealthy
Grade(Grade)
Cafeteriahealthy(School meals in myschool cafeteria are healthy)
TotalStrongly
AgreeSomewhat
AgreeSomewhat
DisagreeStronglyDisagree
6 3224.06
7153.38
1914.29
118.27
133
8 97.56
4840.34
2823.53
3428.57
119
10 33.13
3031.25
2728.13
3637.50
96
12 68.57
3245.71
1622.86
1622.86
70
Total 50 181 90 97 418

Nutrition 54
FrequencyRow Pct
Table of Grade by Cafeterianutrition
Grade(Grade)
Cafeterianutrition(Facts about nutritionare available in my school cafeteria)
TotalStrongly
AgreeSomewhat
AgreeSomewhat
DisagreeStronglyDisagree
6 4836.09
4533.83
2317.29
1712.78
133
8 2218.49
4033.61
3831.93
1915.97
119
10 1313.54
3738.54
1717.71
2930.21
96
12 1014.29
3144.29
1724.29
1217.14
70
Total 93 153 95 77 418
FrequencyRow Pct
Table of Grade by Schoollunch
Grade(Grade)
Schoollunch(I eat school lunch three ormore times per week)
TotalStrongly
AgreeSomewhat
AgreeSomewhat
DisagreeStronglyDisagree
6 9168.42
139.77
96.77
2015.04
133
8 8470.59
1815.13
32.52
1411.76
119
10 3940.63
2728.13
1010.42
2020.83
96
12 2332.86
1521.43
811.43
2434.29
70
Total 237 73 30 78 418
FrequencyRow Pct
Table of Grade by Foodchoices
Grade(Grade)
Foodchoices(I make healthy food choices inmy school cafeteria)
TotalStrongly
AgreeSomewhat
AgreeSomewhat
DisagreeStronglyDisagree
6 6246.62
5037.59
129.02
96.77
133
8 2823.53
5142.86
2117.65
1915.97
119
10 1111.46
3334.38
2425.00
2829.17
96
12 1217.14
2332.86
1622.86
1927.14
70
Total 113 157 73 75 418

Nutrition 55
FrequencyRow Pct
Table of Grade by Wholewheat
Grade(Grade)
Wholewheat(There are whole wheat andmultigrain breads and cereals available in
my school cafeteria)
TotalStrongly
AgreeSomewhat
AgreeSomewhat
DisagreeStronglyDisagree
6 5642.11
4030.08
2418.05
139.77
133
8 2521.01
5647.06
2016.81
1815.13
119
10 2222.92
2829.17
1313.54
3334.38
96
12 912.86
2941.43
1927.14
1318.57
70
Total 112 153 76 77 418
FrequencyRow Pct
Table of Grade by Healthyvending
Grade(Grade)
Healthyvending(If only healthy snacks andbeverages were available in the vending
machines during the school day,I would buy them)
TotalStrongly
AgreeSomewhat
AgreeSomewhat
DisagreeStronglyDisagree
6 5138.35
5239.10
129.02
1813.53
133
8 4134.45
3630.25
1714.29
2521.01
119
10 1111.46
2930.21
2020.83
3637.50
96
12 1724.29
1927.14
1420.00
2028.57
70
Total 120 136 63 99 418

Nutrition 56
FrequencyRow Pct
Table of Grade by Schoolbreakfast
Grade(Grade)
Schoolbreakfast(If breakfast wereavailable at school,
but outside the cafeteria,I would eat breakfast at school more often)
TotalStrongly
AgreeSomewhat
AgreeSomewhat
DisagreeStronglyDisagree
6 3627.07
3526.32
2821.05
3425.56
133
8 3831.93
4840.34
1411.76
1915.97
119
10 2930.21
3233.33
1919.79
1616.67
96
12 2434.29
2738.57
1115.71
811.43
70
Total 127 142 72 77 418

Other Questions 57Other Questions 57
FrequencyCol Pct
Table of Educationaids by Grade
Educationaids(Ihave been
taught aboutHIV/AIDS atschool in the
past year)
Grade(Grade)
Total6 8 10 12
Yes 7153.38
9478.99
8386.46
3448.57
282
No 6246.62
2521.01
1313.54
3651.43
136
Total 133 119 96 70 418
FrequencyCol Pct
Table of Educationcharacter by Grade
Educationcharacter(Ihave been taughtabout character
education in the pastyear at school)
Grade(Grade)
Total6 8 10 12
Yes 12291.73
11596.64
7275.00
3955.71
348
No 118.27
43.36
2425.00
3144.29
70
Total 133 119 96 70 418
FrequencyCol Pct
Table of Gradcoach1 by Grade
Gradcoach1(Iknow who myGraduation
Coach is)
Grade(Grade)
Total6 8 10 12
Yes 3627.07
2621.85
4243.75
5578.57
159
No 9772.93
9378.15
5456.25
1521.43
259
Total 133 119 96 70 418

Other Questions 58
FrequencyCol Pct
Table of Gradcoach2 by Grade
Gradcoach2(Ihave
contacted myGraduation
Coach)
Grade(Grade)
Total6 8 10 12
Yes 129.02
97.56
2020.83
4462.86
85
No 12190.98
11092.44
7679.17
2637.14
333
Total 133 119 96 70 418
FrequencyCol Pct
Table of Gradcoach3 by Grade
Gradcoach3(Ihave received
assistancefrom my
GraduationCoach)
Grade(Grade)
Total6 8 10 12
Yes 129.02
86.72
1717.71
3955.71
76
No 5138.35
3831.93
1414.58
811.43
111
Don't know 7052.63
7361.34
6567.71
2332.86
231
Total 133 119 96 70 418
FrequencyCol Pct
Table of Selfharm by Grade
Selfharm(Duringthe past 12
months,I harmed myself
on purposeSuicideconsider During the past
12 months,I seriouslyconsidered
suicide)
Grade(Grade)
Total6 8 10 12
Yes 107.52
97.56
2121.88
68.57
46
No 12392.48
11092.44
7578.13
6491.43
372
Total 133 119 96 70 418

Other Questions 59
FrequencyCol Pct
Table of Suicideconsider by Grade
Suicideconsider
Grade(Grade)
Total6 8 10 12
Yes 64.51
75.88
1212.50
912.86
34
No 12795.49
11294.12
8487.50
6187.14
384
Total 133 119 96 70 418
FrequencyCol Pct
Table of Suicideattempt by Grade
Suicideattempt(Ihave attemptedsuicide in the
last year)
Grade(Grade)
Total6 8 10 12
Yes 43.01
43.36
77.29
34.29
18
No 12996.99
11596.64
8992.71
6795.71
400
Total 133 119 96 70 418
FrequencyCol Pct
Table of Instantmessaged by Grade
Instantmessaged(Ihave instant
messaged people Ido not even know)
Grade(Grade)
Total6 8 10 12
Yes 1410.53
2117.65
3940.63
2434.29
98
No 11989.47
9882.35
5759.38
4665.71
320
Total 133 119 96 70 418
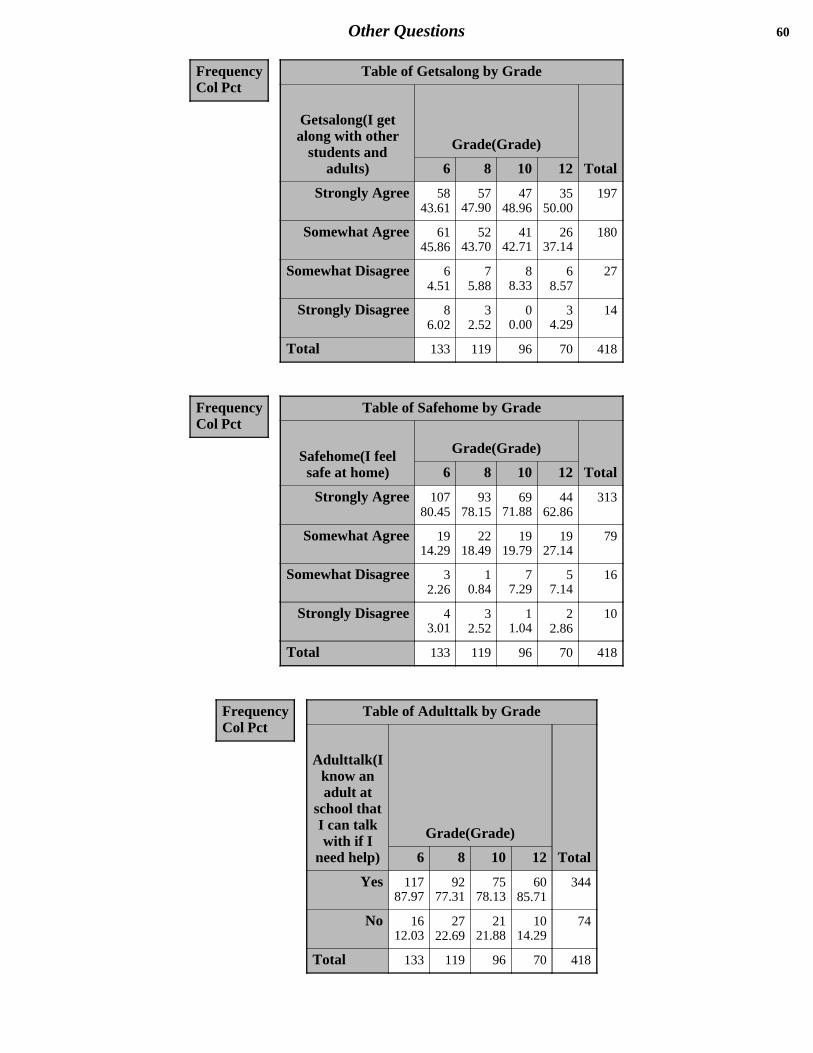
Other Questions 60
FrequencyCol Pct
Table of Getsalong by Grade
Getsalong(I getalong with other
students andadults)
Grade(Grade)
Total6 8 10 12
Strongly Agree 5843.61
5747.90
4748.96
3550.00
197
Somewhat Agree 6145.86
5243.70
4142.71
2637.14
180
Somewhat Disagree 64.51
75.88
88.33
68.57
27
Strongly Disagree 86.02
32.52
00.00
34.29
14
Total 133 119 96 70 418
FrequencyCol Pct
Table of Safehome by Grade
Safehome(I feelsafe at home)
Grade(Grade)
Total6 8 10 12
Strongly Agree 10780.45
9378.15
6971.88
4462.86
313
Somewhat Agree 1914.29
2218.49
1919.79
1927.14
79
Somewhat Disagree 32.26
10.84
77.29
57.14
16
Strongly Disagree 43.01
32.52
11.04
22.86
10
Total 133 119 96 70 418
FrequencyCol Pct
Table of Adulttalk by Grade
Adulttalk(Iknow anadult at
school thatI can talkwith if I
need help)
Grade(Grade)
Total6 8 10 12
Yes 11787.97
9277.31
7578.13
6085.71
344
No 1612.03
2722.69
2121.88
1014.29
74
Total 133 119 96 70 418

Other Questions 61Other Questions 61
FrequencyRow Pct
Table of Grade by Tvtime
Grade(Grade)
Tvtime(On an average school day,how much unsupervised time do I spend watching TV)
TotalNone
Less that1
hour/day1
hour/day2-3
hours/day4-5
hours/day6+
hours/day
6 2921.80
3526.32
1914.29
3224.06
75.26
118.27
133
8 1411.76
2621.85
1915.97
3630.25
1411.76
108.40
119
10 1414.58
2020.83
1616.67
3031.25
1010.42
66.25
96
12 811.43
1318.57
1014.29
2535.71
57.14
912.86
70
Total 65 94 64 123 36 36 418
FrequencyRow Pct
Table of Grade by Computertime
Grade(Grade)
Computertime(On an average school day,how much unsupervised time do I spend on the computer)
TotalNone
Less that1
hour/day1
hour/day2-3
hours/day4-5
hours/day6+
hours/day
6 4634.59
4130.83
2015.04
1612.03
53.76
53.76
133
8 2218.49
2621.85
2420.17
2420.17
1411.76
97.56
119
10 1818.75
2121.88
1616.67
2930.21
66.25
66.25
96
12 1724.29
1318.57
1318.57
1420.00
57.14
811.43
70
Total 103 101 73 83 30 28 418

Questions about Driving Laws 62
Driving Questions were asked only of high school students.Questions about Driving Laws 62
Driving Questions were asked only of high school students.
FrequencyRow Pct
Table of Grade by License1
Grade(Grade)
License1(During the first 6 months of drivingwith a provisional license,
the only passengers who can ride with thedriver are:)
TotalParent orGuardian
FamilyMembers Friends Anyone
Don'tKnow
6 0.
0.
0.
0.
0.
0
8 0.
0.
0.
0.
0.
0
10 1818.75
5759.38
44.17
99.38
88.33
96
12 1927.14
4158.57
45.71
22.86
45.71
70
Total 37 98 8 11 12 166
Frequency Missing = 252
FrequencyRow Pct
Table of Grade by License2
Grade(Grade)
License2(17 yr old drivers with aprovisional driver's license cannot
drive between the hours of:)
TotalMidnight
to 6am
1amto
5am
1amto
6am
Nocurfewfor 17
yearolds
Don'tKnow
6 0.
0.
0.
0.
0.
0
8 0.
0.
0.
0.
0.
0
10 6264.58
99.38
55.21
77.29
1313.54
96
12 5578.57
57.14
22.86
11.43
710.00
70
Total 117 14 7 8 20 166
Frequency Missing = 252

Questions about Driving Laws 63
Driving Questions were asked only of high school students.
FrequencyRow Pct
Table of Grade by License3
Grade(Grade)
License3(For drivers under the age of21,
what level of alcohol is consideredDUI?)
TotalAny
Amount 0.02 0.04 0.06 0.08Don'tknow
6 0.
0.
0.
0.
0.
0.
0
8 0.
0.
0.
0.
0.
0.
0
10 1414.58
3536.46
66.25
55.21
99.38
2728.13
96
12 2434.29
1724.29
68.57
34.29
57.14
1521.43
70
Total 38 52 12 8 14 42 166
Frequency Missing = 252
FrequencyRow Pct
Table of Grade by License4
Grade(Grade)
License4(A driver under 21 automaticallyloses his/her license if caught exceeding the
posted speet limit by:)
Total15+
mph25+
mph35+
mph
Dependson
judge
Can'tlose
licensefor
speedingDon'tknow
6 0.
0.
0.
0.
0.
0.
0
8 0.
0.
0.
0.
0.
0.
0
10 1717.71
1717.71
1818.75
99.38
66.25
2930.21
96
12 1724.29
1521.43
710.00
68.57
68.57
1927.14
70
Total 34 32 25 15 12 48 166
Frequency Missing = 252

Questions about Driving Laws 64
Driving Questions were asked only of high school students.
FrequencyRow Pct
Table of Grade by License5
Grade(Grade)
License5(AGeorgia teenager
with familyconnections or agood lawyer can
break a teendriving law and
keep their driver'slicense)
TotalYes NoDon'tknow
6 0.
0.
0.
0
8 0.
0.
0.
0
10 2829.17
3536.46
3334.38
96
12 1927.14
3651.43
1521.43
70
Total 47 71 48 166
Frequency Missing = 252
FrequencyRow Pct
Table of Grade by License6
Grade(Grade)
License6(I know afriend or classmatethat broke a teen
driving law,but was allowed to
keep his/herlicense)
TotalYes NoDon'tknow
6 0.
0.
0.
0
8 0.
0.
0.
0
10 2020.83
4546.88
3132.29
96
12 3448.57
2332.86
1318.57
70
Total 54 68 44 166
Frequency Missing = 252

Questions about Driving Laws 65
Driving Questions were asked only of high school students.
FrequencyRow Pct
Table of Grade by License7
Grade(Grade)
License7(A student under the age of 18 cam loserhis/her driving privileges if he or she:)
Total
Havemore than
10unexcused
absencesper school
yr
Drop outwithout
graduating
Bringalcohol/drugs/weapon
to school
All ofthe
above
6 0.
0.
0.
0.
0
8 0.
0.
0.
0.
0
10 66.25
1010.42
22.08
7881.25
96
12 00.00
1622.86
912.86
4564.29
70
Total 6 26 11 123 166
Frequency Missing = 252

Select Results by Gender 66Select Results by Gender 66
FrequencyCol Pct
Table of SchoolClimate2 by Gender
SchoolClimate2(Ifeel successful at
school)
Gender(Gender)
TotalFemale Male
Strongly Agree 6835.42
7834.51
146
Somewhat Agree 10856.25
12253.98
230
Somewhat Disagree 126.25
198.41
31
Strongly Disagree 42.08
73.10
11
Total 192 226 418
FrequencyCol Pct
Table of SchoolClimate6 by Gender
SchoolClimate6(Teacherstreat me with respect)
Gender(Gender)
TotalFemale Male
Strongly Agree 8644.79
9742.92
183
Somewhat Agree 8041.67
9140.27
171
Somewhat Disagree 168.33
2912.83
45
Strongly Disagree 105.21
93.98
19
Total 192 226 418
FrequencyCol Pct
Table of SchoolClimate8 by Gender
SchoolClimate8(Studentsare frequently
recognized for goodbehavior)
Gender(Gender)
TotalFemale Male
Strongly Agree 5327.60
5524.34
108
Somewhat Agree 8242.71
10546.46
187
Somewhat Disagree 4422.92
3917.26
83
Strongly Disagree 136.77
2711.95
40
Total 192 226 418
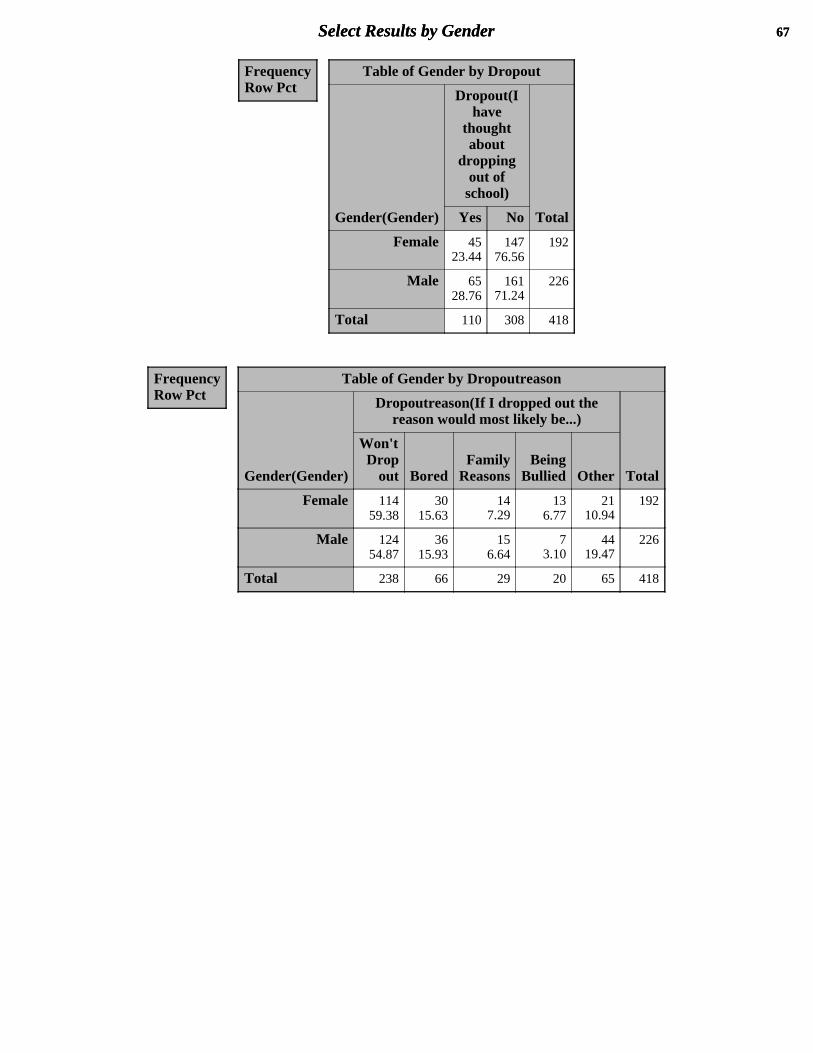
Select Results by Gender 67Select Results by Gender 67
FrequencyRow Pct
Table of Gender by Dropout
Gender(Gender)
Dropout(Ihave
thoughtabout
droppingout of
school)
TotalYes No
Female 4523.44
14776.56
192
Male 6528.76
16171.24
226
Total 110 308 418
FrequencyRow Pct
Table of Gender by Dropoutreason
Gender(Gender)
Dropoutreason(If I dropped out thereason would most likely be...)
Total
Won'tDrop
out BoredFamily
ReasonsBeing
Bullied Other
Female 11459.38
3015.63
147.29
136.77
2110.94
192
Male 12454.87
3615.93
156.64
73.10
4419.47
226
Total 238 66 29 20 65 418
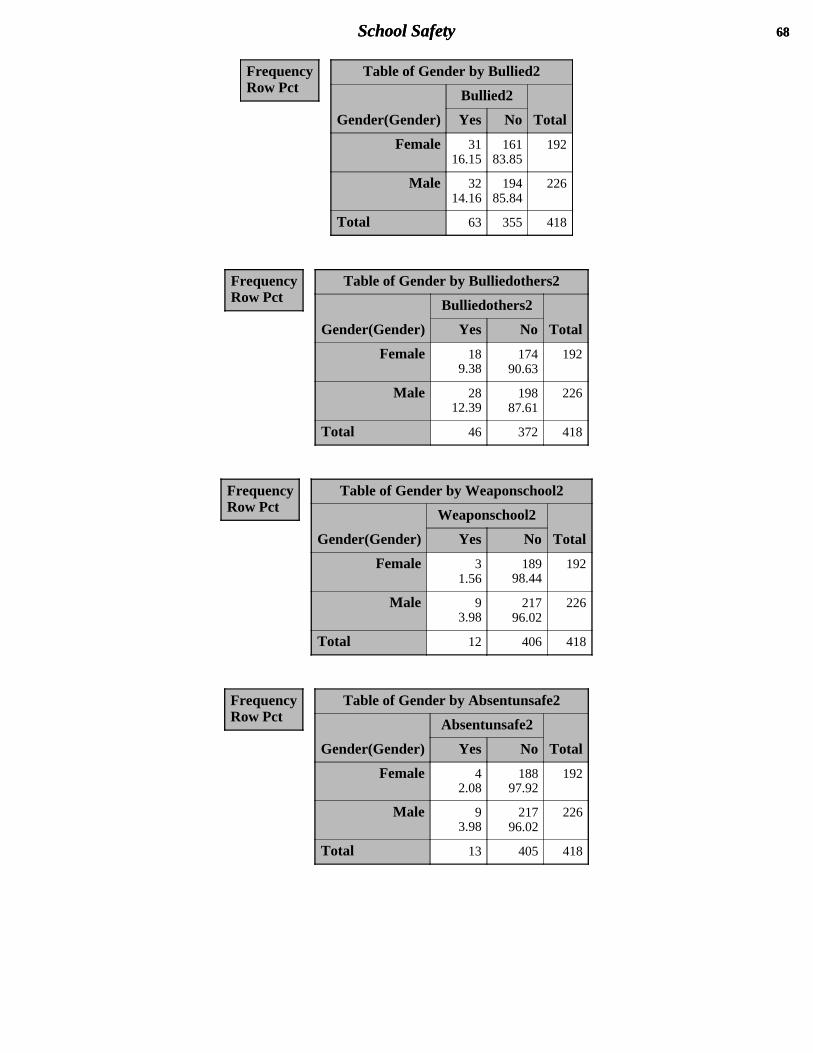
School Safety 68School Safety 68
FrequencyRow Pct
Table of Gender by Bullied2
Gender(Gender)
Bullied2
TotalYes No
Female 3116.15
16183.85
192
Male 3214.16
19485.84
226
Total 63 355 418
FrequencyRow Pct
Table of Gender by Bulliedothers2
Gender(Gender)
Bulliedothers2
TotalYes No
Female 189.38
17490.63
192
Male 2812.39
19887.61
226
Total 46 372 418
FrequencyRow Pct
Table of Gender by Weaponschool2
Gender(Gender)
Weaponschool2
TotalYes No
Female 31.56
18998.44
192
Male 93.98
21796.02
226
Total 12 406 418
FrequencyRow Pct
Table of Gender by Absentunsafe2
Gender(Gender)
Absentunsafe2
TotalYes No
Female 42.08
18897.92
192
Male 93.98
21796.02
226
Total 13 405 418

School Safety 69
FrequencyRow Pct
Table of Gender by Gangself
Gender(Gender)
Gangself(Ihave
participatedin illegal gang
activities inthe past 30
days)
TotalYes No
Female 42.08
18897.92
192
Male 187.96
20892.04
226
Total 22 396 418
FrequencyRow Pct
Table of Gender by Gangpeers
Gender(Gender)
Gangpeers(Ihave friends
who haveparticipated
in illegal gangactivities inthe past 30
days)
TotalYes No
Female 3015.63
16284.38
192
Male 4821.24
17878.76
226
Total 78 340 418
FrequencyRow Pct
Table of Gender by Pickedon2
Gender(Gender)
Pickedon2
TotalYes No
Female 8142.19
11157.81
192
Male 8638.05
14061.95
226
Total 167 251 418
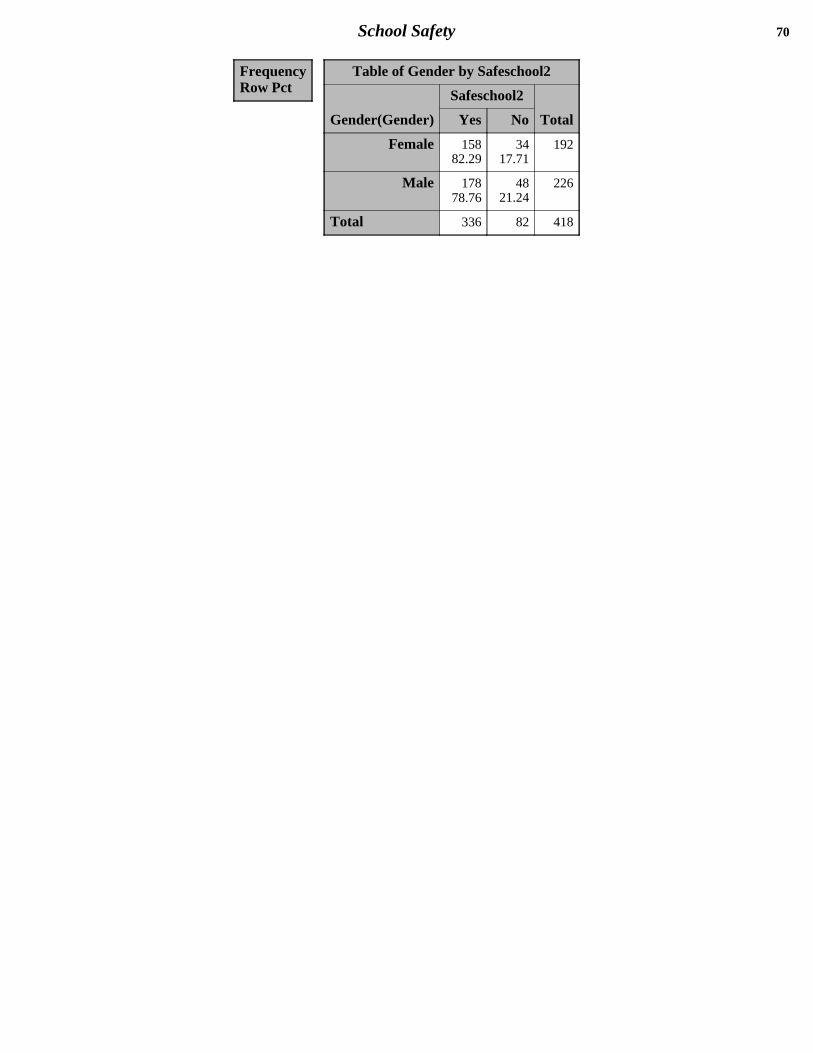
School Safety 70
FrequencyRow Pct
Table of Gender by Safeschool2
Gender(Gender)
Safeschool2
TotalYes No
Female 15882.29
3417.71
192
Male 17878.76
4821.24
226
Total 336 82 418

Incidence of Drug Use 71Incidence of Drug Use 71
FrequencyRow Pct
Table of Gender by AlcoholAlt
Gender(Gender)
AlcoholAlt(Alcoholuse, past 30 days)
TotalYes No
Female 2814.58
16485.42
192
Male 4921.68
17778.32
226
Total 77 341 418
FrequencyRow Pct
Table of Gender by TobaccoAny
Gender(Gender)
TobaccoAny(Tobaccouse, past 30 days)
TotalYes No
Female 147.29
17892.71
192
Male 4720.80
17979.20
226
Total 61 357 418
FrequencyRow Pct
Table of Gender by MarijuanaAlt
Gender(Gender)
MarijuanaAlt(Marijuanause, past 30 days)
TotalYes No
Female 73.65
18596.35
192
Male 2310.18
20389.82
226
Total 30 388 418
FrequencyRow Pct
Table of Gender by OtherDrugAny
Gender(Gender)
OtherDrugAny(Otherdrug use, past 30 days)
TotalYes No
Female 136.77
17993.23
192
Male 208.85
20691.15
226
Total 33 385 418

Average Age at Onset of Use 72
Results for "Average Age at Onset of Use" questions exclude students who said they did not use thatsubstance
Average Age at Onset of Use 72
Results for "Average Age at Onset of Use" questions exclude students who said they did not use thatsubstance
Gender=Female
Variable Label Mean
Alcoholinit2Cigarettesinit2Smokelessinit2Marijuanainit2Cocaineinit2Inhalantsinit2Steroidsinit2Ecstasyinit2Methinit2Hallucinogensinit2Prescriptioninit2
I started using alcohol when I wasI started smoking tobacco when I wasI started chewing tobacco when I wasI started using marijuana when I wasI started using cocaine when I wasI started using inhalants when I wasI started using steroids when I wasI started using ecstasy when I wasI started using methamphetamines when I wasI started using hallucinogens when I wasI started using prescription drugs not prescribed to me when I was
13.4814.2914.5015.20
.11.3311.0014.00
.
.12.10
Gender=Male
Variable Label Mean
Alcoholinit2Cigarettesinit2Smokelessinit2Marijuanainit2Cocaineinit2Inhalantsinit2Steroidsinit2Ecstasyinit2Methinit2Hallucinogensinit2Prescriptioninit2
I started using alcohol when I wasI started smoking tobacco when I wasI started chewing tobacco when I wasI started using marijuana when I wasI started using cocaine when I wasI started using inhalants when I wasI started using steroids when I wasI started using ecstasy when I wasI started using methamphetamines when I wasI started using hallucinogens when I wasI started using prescription drugs not prescribed to me when I was
12.9413.4913.3313.4212.6011.7511.0012.6011.2511.5012.95

I Think These Drugs are Harmful 73I Think These Drugs are Harmful 73
FrequencyRow Pct
Table of Gender by Alcoholharmdich
Gender(Gender)
Alcoholharmdich(Ithink alcohol is
harmful)
TotalYes No
Female 15882.29
3417.71
192
Male 17476.99
5223.01
226
Total 332 86 418
FrequencyRow Pct
Table of Gender by Tobaccoharmdich
Gender(Gender)
Tobaccoharmdich(Ithink tobacco is
harmful)
TotalYes No
Female 17792.19
157.81
192
Male 19887.61
2812.39
226
Total 375 43 418
FrequencyRow Pct
Table of Gender by Marijuanaharmdich
Gender(Gender)
Marijuanaharmdich(Ithink marijuana is
harmful)
TotalYes No
Female 16585.94
2714.06
192
Male 17577.43
5122.57
226
Total 340 78 418
FrequencyRow Pct
Table of Gender by Otherdrugharmdich
Gender(Gender)
Otherdrugharmdich(Ithink other drugs are
harmful)
TotalYes No
Female 17993.23
136.77
192
Male 20490.27
229.73
226
Total 383 35 418

Where do My Friends Use - Percentage of Students who selected the following responses.Studentscould select more than 1 response so the percentage for each substance will not add up to 100%.
74Where do My Friends Use - Percentage of Students who selected the following responses.Studentscould select more than 1 response so the percentage for each substance will not add up to 100%.
74
FrequencyRow Pct
Table of Gender by Alcohollocation1
Gender(Gender)
Alcohollocation1(PlacesFriends Use Alcohol)
Total. Do Not Use
Female 7438.54
11861.46
192
Male 10948.23
11751.77
226
Total 183 235 418
FrequencyRow Pct
Table of Gender by Alcohollocation2
Gender(Gender)
Alcohollocation2(PlacesFriends Use Alcohol)
Total. Home
Female 14475.00
4825.00
192
Male 15166.81
7533.19
226
Total 295 123 418
FrequencyRow Pct
Table of Gender by Alcohollocation3
Gender(Gender)
Alcohollocation3(PlacesFriends Use Alcohol)
Total. School
Female 18696.88
63.13
192
Male 21896.46
83.54
226
Total 404 14 418
FrequencyRow Pct
Table of Gender by Alcohollocation4
Gender(Gender)
Alcohollocation4(PlacesFriends Use Alcohol)
Total. Car
Female 17289.58
2010.42
192
Male 20892.04
187.96
226
Total 380 38 418

Where do My Friends Use - Percentage of Students who selected the following responses.Studentscould select more than 1 response so the percentage for each substance will not add up to 100%.
75
FrequencyRow Pct
Table of Gender by Alcohollocation5
Gender(Gender)
Alcohollocation5(PlacesFriends Use Alcohol)
Total.Friend's
House
Female 12163.02
7136.98
192
Male 15367.70
7332.30
226
Total 274 144 418
FrequencyRow Pct
Table of Gender by Alcohollocation6
Gender(Gender)
Alcohollocation6(PlacesFriends Use Alcohol)
Total. Other
Female 15078.13
4221.88
192
Male 16974.78
5725.22
226
Total 319 99 418
FrequencyRow Pct
Table of Gender by Tobaccolocation1
Gender(Gender)
Tobaccolocation1(PlacesFriends Use Tobacco)
Total. Do Not Use
Female 6131.77
13168.23
192
Male 9843.36
12856.64
226
Total 159 259 418
FrequencyRow Pct
Table of Gender by Tobaccolocation2
Gender(Gender)
Tobaccolocation2(PlacesFriends Use Tobacco)
Total. Home
Female 14475.00
4825.00
192
Male 16271.68
6428.32
226
Total 306 112 418

Where do My Friends Use - Percentage of Students who selected the following responses.Studentscould select more than 1 response so the percentage for each substance will not add up to 100%.
76
FrequencyRow Pct
Table of Gender by Tobaccolocation3
Gender(Gender)
Tobaccolocation3(PlacesFriends Use Tobacco)
Total. School
Female 16988.02
2311.98
192
Male 20389.82
2310.18
226
Total 372 46 418
FrequencyRow Pct
Table of Gender by Tobaccolocation4
Gender(Gender)
Tobaccolocation4(PlacesFriends Use Tobacco)
Total. Car
Female 15279.17
4020.83
192
Male 18380.97
4319.03
226
Total 335 83 418
FrequencyRow Pct
Table of Gender by Tobaccolocation5
Gender(Gender)
Tobaccolocation5(PlacesFriends Use Tobacco)
Total.Friend's
House
Female 13670.83
5629.17
192
Male 16673.45
6026.55
226
Total 302 116 418
FrequencyRow Pct
Table of Gender by Tobaccolocation6
Gender(Gender)
Tobaccolocation6(PlacesFriends Use Tobacco)
Total. Other
Female 15379.69
3920.31
192
Male 16673.45
6026.55
226
Total 319 99 418

Where do My Friends Use - Percentage of Students who selected the following responses.Studentscould select more than 1 response so the percentage for each substance will not add up to 100%.
77
FrequencyRow Pct
Table of Gender by Marijuanalocation1
Gender(Gender)
Marijuanalocation1(PlacesFriends Use Marijuana)
Total. Do Not Use
Female 4422.92
14877.08
192
Male 7834.51
14865.49
226
Total 122 296 418
FrequencyRow Pct
Table of Gender by Marijuanalocation2
Gender(Gender)
Marijuanalocation2(PlacesFriends Use Marijuana)
Total. Home
Female 16284.38
3015.63
192
Male 17276.11
5423.89
226
Total 334 84 418
FrequencyRow Pct
Table of Gender by Marijuanalocation3
Gender(Gender)
Marijuanalocation3(PlacesFriends Use Marijuana)
Total. School
Female 18194.27
115.73
192
Male 21796.02
93.98
226
Total 398 20 418
FrequencyRow Pct
Table of Gender by Marijuanalocation4
Gender(Gender)
Marijuanalocation4(PlacesFriends Use Marijuana)
Total. Car
Female 16786.98
2513.02
192
Male 19686.73
3013.27
226
Total 363 55 418

Where do My Friends Use - Percentage of Students who selected the following responses.Studentscould select more than 1 response so the percentage for each substance will not add up to 100%.
78
FrequencyRow Pct
Table of Gender by Marijuanalocation5
Gender(Gender)
Marijuanalocation5(PlacesFriends Use Marijuana)
Total.Friend's
House
Female 14374.48
4925.52
192
Male 17075.22
5624.78
226
Total 313 105 418
FrequencyRow Pct
Table of Gender by Marijuanalocation6
Gender(Gender)
Marijuanalocation6(PlacesFriends Use Marijuana)
Total. Other
Female 16083.33
3216.67
192
Male 18280.53
4419.47
226
Total 342 76 418
FrequencyRow Pct
Table of Gender by Otherdruglocation1
Gender(Gender)
Otherdruglocation1(PlacesFriends Use Other Illegal
Drugs)
Total. Do Not Use
Female 3618.75
15681.25
192
Male 4921.68
17778.32
226
Total 85 333 418
FrequencyRow Pct
Table of Gender by Otherdruglocation2
Gender(Gender)
Otherdruglocation2(PlacesFriends Use Other Illegal
Drugs)
Total. Home
Female 16988.02
2311.98
192
Male 19084.07
3615.93
226
Total 359 59 418

Where do My Friends Use - Percentage of Students who selected the following responses.Studentscould select more than 1 response so the percentage for each substance will not add up to 100%.
79
FrequencyRow Pct
Table of Gender by Otherdruglocation3
Gender(Gender)
Otherdruglocation3(PlacesFriends Use Other Illegal
Drugs)
Total. School
Female 18395.31
94.69
192
Male 21394.25
135.75
226
Total 396 22 418
FrequencyRow Pct
Table of Gender by Otherdruglocation4
Gender(Gender)
Otherdruglocation4(PlacesFriends Use Other Illegal
Drugs)
Total. Car
Female 17490.63
189.38
192
Male 21092.92
167.08
226
Total 384 34 418
FrequencyRow Pct
Table of Gender by Otherdruglocation5
Gender(Gender)
Otherdruglocation5(PlacesFriends Use Other Illegal
Drugs)
Total.Friend's
House
Female 15882.29
3417.71
192
Male 19686.73
3013.27
226
Total 354 64 418

Where do My Friends Use - Percentage of Students who selected the following responses.Studentscould select more than 1 response so the percentage for each substance will not add up to 100%.
80
FrequencyRow Pct
Table of Gender by Otherdruglocation6
Gender(Gender)
Otherdruglocation6(PlacesFriends Use Other Illegal
Drugs)
Total. Other
Female 16887.50
2412.50
192
Male 19586.28
3113.72
226
Total 363 55 418

When do My Friends Use - Percentage of Students who selected the following responses.Studentscould select more than 1 response so the percentage for each substance will not add up to 100%.
81When do My Friends Use - Percentage of Students who selected the following responses.Studentscould select more than 1 response so the percentage for each substance will not add up to 100%.
81
FrequencyRow Pct
Table of Gender by Alcoholtime1
Gender(Gender)
Alcoholtime1(TimesFriends Use Alcohol)
Total.Do Not
Use
Female 7338.02
11961.98
192
Male 10446.02
12253.98
226
Total 177 241 418
FrequencyRow Pct
Table of Gender by Alcoholtime2
Gender(Gender)
Alcoholtime2(TimesFriends Use Alcohol)
Total.On Way
to School
Female 18596.35
73.65
192
Male 21695.58
104.42
226
Total 401 17 418
FrequencyRow Pct
Table of Gender by Alcoholtime3
Gender(Gender)
Alcoholtime3(TimesFriends Use Alcohol)
Total.DuringSchool
Female 18897.92
42.08
192
Male 21896.46
83.54
226
Total 406 12 418

When do My Friends Use - Percentage of Students who selected the following responses.Studentscould select more than 1 response so the percentage for each substance will not add up to 100%.
82
FrequencyRow Pct
Table of Gender by Alcoholtime4
Gender(Gender)
Alcoholtime4(TimesFriends Use Alcohol)
Total.
On WayHomeFrom
School
Female 18093.75
126.25
192
Male 21193.36
156.64
226
Total 391 27 418
FrequencyRow Pct
Table of Gender by Alcoholtime5
Gender(Gender)
Alcoholtime5(TimesFriends Use Alcohol)
Total. Weeknights
Female 16183.85
3116.15
192
Male 18581.86
4118.14
226
Total 346 72 418
FrequencyRow Pct
Table of Gender by Alcoholtime6
Gender(Gender)
Alcoholtime6(TimesFriends Use Alcohol)
Total. Weekends
Female 11157.81
8142.19
192
Male 12756.19
9943.81
226
Total 238 180 418
FrequencyRow Pct
Table of Gender by Tobaccotime1
Gender(Gender)
Tobaccotime1(TimesFriends Use Tobacco)
Total.Do Not
Use
Female 6131.77
13168.23
192
Male 9742.92
12957.08
226
Total 158 260 418

When do My Friends Use - Percentage of Students who selected the following responses.Studentscould select more than 1 response so the percentage for each substance will not add up to 100%.
83
FrequencyRow Pct
Table of Gender by Tobaccotime2
Gender(Gender)
Tobaccotime2(TimesFriends Use Tobacco)
Total.On Way
to School
Female 15681.25
3618.75
192
Male 18782.74
3917.26
226
Total 343 75 418
FrequencyRow Pct
Table of Gender by Tobaccotime3
Gender(Gender)
Tobaccotime3(TimesFriends Use Tobacco)
Total.DuringSchool
Female 17792.19
157.81
192
Male 20691.15
208.85
226
Total 383 35 418
FrequencyRow Pct
Table of Gender by Tobaccotime4
Gender(Gender)
Tobaccotime4(TimesFriends Use Tobacco)
Total.
On WayHomeFrom
School
Female 18093.75
126.25
192
Male 21193.36
156.64
226
Total 391 27 418

When do My Friends Use - Percentage of Students who selected the following responses.Studentscould select more than 1 response so the percentage for each substance will not add up to 100%.
84
FrequencyRow Pct
Table of Gender by Tobaccotime5
Gender(Gender)
Tobaccotime5(TimesFriends Use Tobacco)
Total. Weeknights
Female 14273.96
5026.04
192
Male 15568.58
7131.42
226
Total 297 121 418
FrequencyRow Pct
Table of Gender by Tobaccotime6
Gender(Gender)
Tobaccotime6(TimesFriends Use Tobacco)
Total. Weekends
Female 12866.67
6433.33
192
Male 14061.95
8638.05
226
Total 268 150 418
FrequencyRow Pct
Table of Gender by Marijuanatime1
Gender(Gender)
Marijuanatime1(TimesFriends Use Marijuana)
Total. Do Not Use
Female 4623.96
14676.04
192
Male 7734.07
14965.93
226
Total 123 295 418
FrequencyRow Pct
Table of Gender by Marijuanatime2
Gender(Gender)
Marijuanatime2(TimesFriends Use Marijuana)
Total.On Way to
School
Female 17792.19
157.81
192
Male 20892.04
187.96
226
Total 385 33 418

When do My Friends Use - Percentage of Students who selected the following responses.Studentscould select more than 1 response so the percentage for each substance will not add up to 100%.
85
FrequencyRow Pct
Table of Gender by Marijuanatime3
Gender(Gender)
Marijuanatime3(TimesFriends Use Marijuana)
Total.DuringSchool
Female 18495.83
84.17
192
Male 21996.90
73.10
226
Total 403 15 418
FrequencyRow Pct
Table of Gender by Marijuanatime4
Gender(Gender)
Marijuanatime4(TimesFriends Use Marijuana)
Total.
On WayHomeFrom
School
Female 17088.54
2211.46
192
Male 20289.38
2410.62
226
Total 372 46 418
FrequencyRow Pct
Table of Gender by Marijuanatime5
Gender(Gender)
Marijuanatime5(TimesFriends Use Marijuana)
Total. Weeknights
Female 15781.77
3518.23
192
Male 17778.32
4921.68
226
Total 334 84 418
FrequencyRow Pct
Table of Gender by Marijuanatime6
Gender(Gender)
Marijuanatime6(TimesFriends Use Marijuana)
Total. Weekends
Female 13871.88
5428.13
192
Male 15568.58
7131.42
226
Total 293 125 418

When do My Friends Use - Percentage of Students who selected the following responses.Studentscould select more than 1 response so the percentage for each substance will not add up to 100%.
86
FrequencyRow Pct
Table of Gender by Otherdrugtime1
Gender(Gender)
Otherdrugtime1(TimesFriends Use Other
Illegal Drugs)
Total. Do Not Use
Female 3719.27
15580.73
192
Male 4218.58
18481.42
226
Total 79 339 418
FrequencyRow Pct
Table of Gender by Otherdrugtime2
Gender(Gender)
Otherdrugtime2(TimesFriends Use Other
Illegal Drugs)
Total.On Way to
School
Female 18093.75
126.25
192
Male 21092.92
167.08
226
Total 390 28 418
FrequencyRow Pct
Table of Gender by Otherdrugtime3
Gender(Gender)
Otherdrugtime3(TimesFriends Use Other
Illegal Drugs)
Total.DuringSchool
Female 18395.31
94.69
192
Male 21796.02
93.98
226
Total 400 18 418

When do My Friends Use - Percentage of Students who selected the following responses.Studentscould select more than 1 response so the percentage for each substance will not add up to 100%.
87
FrequencyRow Pct
Table of Gender by Otherdrugtime4
Gender(Gender)
Otherdrugtime4(TimesFriends Use Other
Illegal Drugs)
Total.
On WayHomeFrom
School
Female 17591.15
178.85
192
Male 21193.36
156.64
226
Total 386 32 418
FrequencyRow Pct
Table of Gender by Otherdrugtime5
Gender(Gender)
Otherdrugtime5(TimesFriends Use Other
Illegal Drugs)
Total. Weeknights
Female 16786.98
2513.02
192
Male 20088.50
2611.50
226
Total 367 51 418
FrequencyRow Pct
Table of Gender by Otherdrugtime6
Gender(Gender)
Otherdrugtime6(TimesFriends Use Other
Illegal Drugs)
Total. Weekends
Female 14977.60
4322.40
192
Male 19184.51
3515.49
226
Total 340 78 418

Other Questions 88Other Questions 88
FrequencyRow Pct
Table of Gender by Educationalcohol
Gender(Gender)
Educationalcohol(Ihave been taught
about alcohol,tobacco,
and other drugswithin the last year
at school)
TotalYes No
Female 16485.42
2814.58
192
Male 16974.78
5725.22
226
Total 333 85 418
FrequencyRow Pct
Table of Gender by Rodedrinking
Gender(Gender)
Rodedrinking(Inthe past 30 days Ihave ridden in acar with a driver
who had beendrinking alcohol)
TotalYes No
Female 2311.98
16988.02
192
Male 2912.83
19787.17
226
Total 52 366 418
FrequencyRow Pct
Table of Gender by Drugsschool
Gender(Gender)
Drugsschool(Duringthe past 12 months,I have been offered,
sold,or given illegal drugson school property)
TotalYes No
Female 2010.42
17289.58
192
Male 3716.37
18983.63
226
Total 57 361 418

Other Questions 89
FrequencyRow Pct
Table of Gender by Bingedrinking
Gender(Gender)
Bingedrinking(I have drunk five or moredrinks of alcohol at one sitting during the
last 30 days)
Total0
Days
1 or2
days
3 to5
days
6 to9
days
10to19
days
20to29
days
All30
days
Female 17993.23
00.00
31.56
42.08
42.08
00.00
21.04
192
Male 19284.96
62.65
73.10
10.44
93.98
73.10
41.77
226
Total 371 6 10 5 13 7 6 418
FrequencyRow Pct
Table of Gender by Educationaids
Gender(Gender)
Educationaids(Ihave been taughtabout HIV/AIDSat school in the
past year)
TotalYes No
Female 12766.15
6533.85
192
Male 15568.58
7131.42
226
Total 282 136 418
FrequencyRow Pct
Table of Gender by Suicideconsider
Gender(Gender)
Suicideconsider
TotalYes No
Female 178.85
17591.15
192
Male 177.52
20992.48
226
Total 34 384 418

Other Questions 90
FrequencyRow Pct
Table of Gender by Suicideattempt
Gender(Gender)
Suicideattempt(Ihave attempted
suicide in the lastyear)
TotalYes No
Female 73.65
18596.35
192
Male 114.87
21595.13
226
Total 18 400 418
FrequencyRow Pct
Table of Gender by Adulttalk
Gender(Gender)
Adulttalk(Iknow anadult at
school that Ican talk with
if I needhelp)
TotalYes No
Female 16284.38
3015.63
192
Male 18280.53
4419.47
226
Total 344 74 418