smud board finance & audit committee meeting info packet
TRANSCRIPT

Board Finance & Audit
Committee Meeting and
Special SMUD Board of
Directors Meeting
Date: Tuesday, May 14, 2019
Time: Immediately following the ERCS Committee
meeting scheduled to begin at 5:30 p.m.
Location: SMUD Customer Service Center, Rubicon Room
6301 S Street, Sacramento, CA
Powering forward. Together. - SMUD®

AGENDA BOARD FINANCE & AUDIT COMMITTEE MEETING
AND SPECIAL SMUD BOARD OF DIRECTORS MEETING
Tuesday, May 14, 2019 SMUD Customer Service Center, Rubicon Room
6301 S Street, Sacramento, California Immediately following the Energy Resources & Customer Services
Committee meeting scheduled to begin at 5:30 p.m.
This Committee meeting is noticed as a joint meeting with the Board of Directors for the purpose of compliance with the Brown Act. In order to preserve the function of the Committee as advisory to the Board, members of the Board may attend and participate in the discussions, but no Board action will be taken. The Finance and Audit Committee will review, discuss and provide the Committee's recommendation on the following :
DISCUSSION ITEM
1. Laurie Rodriguez Authorize the Chief Executive Officer and General Manager to award contracts to AppleOne, Marathon Staffing Solutions, DatamanUSA LLC, 22nd Century Technologies, Inc., SearchPros Staffing, AgreeYa Solutions, Inc. , ManpowerGroup, ldeaon, Collabera, Inc., and Superior Talent Resources, Inc. for temporary staffing services for a contract term of five years from June 1, 2019, to May 31 , 2024, with two optional one-year extensions, for a total not-toexceed aggregate amount of $10 million. Presentation: 10 minutes Discussion: 5 minutes
INFORMATIONAL ITEMS
2. Sandra Moorman Provide the Board with the financial results for the three-month period ended March 31 , 2019. Discussion: 1 minute
3. Jennifer Davidson Provide the Summary of SMUD's Power Supply Costs through March 31 , 2019. Presentation: 4 minutes Discussion: 1 minute
4. Public Comment
Board Finance & Audit Committee Meeting and Special SMUD Board of Directors Meeting May 14, 2019
5. Rosanna Herber Summary of Committee Direction. Discussion: 1 minute
Page2
Members of the public wishing to address the Committee should complete a sign-up form available at the table outside of the meeting room. Members of the public shall have up to three (3) minutes to provide public comment. The total time allotted to any individual speaker shall not exceed nine (9) minutes for the entire Committee meeting time.
Members of the public wishing to inspect public documents related to agenda items may call 916-732-7143 to arrange for inspection of the documents at the SMUD Customer Service Center, 6301 S Street, Sacramento, California.
NOTE: Accommodations are available for the disabled public. If you need a hearing assistance device or other aid, please call 916-732-7143 in advance of this Committee Meeting.

1

SSS No.19-177
BOARD AGENDA ITEM STAFFING SUMMARY SHEET
Committee Meeting & Date Finance & Audit, 5/14/ 19 Board Meeting Date May 16, 2019
TO TO
1. Thomas Dempsey 6. Gary King
2. Brian Daly 7. Stephen Clemons
3. Casey Fallon 8. Jennifer Davidson
4. Mysti Champion-Freyenberger 9. Legal
5. Laurie Rodriguez 10. CEO & General Manager
Consent Calendar I X j Yes I I No Ifno, _schedule a dry run
oresentat10n. Budgeted j X j Yes j
No (lfno, explain in Cost/Budgeted sec/ion.)
FROM (IPR) I DEPARTMENT
Andrew McDermott Human Resources, Diversity, & Inclusion MAILSTOP I EXT. I DATE SENT
EA404 5862 4/26/19 NARRATIVE: Req uested Action: Authorize the Chief Executive Officer and General Manager to award contracts to AppleOne, Marathon
Staffing Solutions, DatamanUSA LLC, 22nd Century Technologies, Inc. , SearchPros Staffing, Agree Ya Solutions, Inc ., ManpowerGroup, Ideaon, Collabera, Inc., and Superior Talent Resources, Inc. to provide Temporary Staffing Services for five years from June 1, 2019, to May 31, 2024, with two optional one-year extensions for a total not-to-exceed aggregate amount of$10,000,000.
Summary: RFP 180078.AM was issued in April 2018 to solicit qualified firms to provide Temporary Staffing Services. SMUD received 40 proposals which were evaluated based on the RFP criteria. Based on this evaluation, the recommendation is to award to the top I 0 proposers. This number of awardees is requested based on an optimum number of contractors to manage and a diversity of local and national firms.
Board Policy: BL-8; Delegation to the GM with respect to Procurement; Procurement (Number & Title)
Recom mendation: A ward to I 0 Highest Evaluated Responsive Proposers
Award to:
AooleOne Marathon Staffing Solutions DatamanUSA LLC 22nd Century Technologies, Inc. SearchPros Staffing AgreeYa Solutions, Inc. ManpowerGroup ldeaon Collabera, lnc. Superior Talent Resources, Inc.
Progosers Notified by Procurement: 20
Progosers Downloaded: 74
Pre-Progosal Conference Attendance: 45
Progosals Received: 40

Responsive to 60 Points 40 Total Overall Proposal SEED
Evaluated Proposed P/F Points Points Award AwardProposals Received
SEED Technical Pricing Score Rank Amount Credit Amount Amount
AppleOne Pass 10.00 49.50 20.94 80.44 I $175,794.00 $6,229.64 $169,564.36 Marathon Staffing
Solutions Pass 10.00 53 .00 15.80 78.80 2 $230,985 .00 $6 229.64 $224,755.36 DatamanUSA LLC Pass 10.00 46.67 17.89 74.55 3 $204 768.00 $6 229.64 $ 198,538.36 22nd Century
Technologies, Inc. Pass I0.00 32.33 30.00 72.33 4 $124 592.85 $6 229.64 $ 11 8,363 .2 1 Not To SearchPros Staffing Pass 10.00 40.83 21.19 72.02 5 $173 808.00 $6,229.64 $167 578.36 Exceed AgreeYa Solutions, Aggregate of
Inc. Pass 10.00 45 .83 13.32 69.15 6 $272,799.00 $6,229.64 $266 569.36 $ I 0,000,000 ManoowerGrouo Pass 10.00 45 .67 13.44 69.1 I 7 $270,387.00 $6,229.64 $264, 157.36 ldeaon Pass 10.00 39.00 19.80 68.80 8 $185,562.00 $6,229.64 $179,332.36 Collabera, Inc. Pass 10.00 47.50 10.34 67.84 9 $349,543.35 $6 229.64 $343,31 3.71 Superior Talent Resources Inc. Pass 5.00 46.33 15 .99 67.33 10 $223 132.50 $1 , 115 .66 $222 0 16.84 Systems America, Inc. Pass 10.00 40.83 15.31 66.15 II $238,104.00 $6,229.64 $231 874.36 Zolon Tech inc. Pass 10.00 35.67 19.38 65 .04 12 $ 189 481.68 $6 229.64 $183,252.04 Artizen Inc. dba -
Artizen Staffing Pass 10.00 42.83 12.05 64.88 13 $300,924 .00 $6,229.64 $294,694.36 Premier Staffing
Source, Inc. Pass I0.00 38.33 15.65 63 .99 14 $233,055 .00 $6 229.64 $226 825.36 System One dba Mountain LTD Pass I0.00 35.00 17.36 62.36 15 $2 10 825 .00 $6 229.64 $204,595.36 Diskriter In c. Pass 44.67 17.02 61.69 16 $208 638.00 $208 638.00 Agelix Consulting
LLC Pass 10.00 37.83 12.87 60.70 17 $282.159.99 $6,229.64 $275 930.35 US IT Solutions, Inc. Pass 10.00 36.67 12.99 59.65 18 $279,630.00 $6,229.64 $273 ,400.36 Infoiini , inc. Pass I0.00 34.33 15.20 59.53 19 $239,850.00 $6,229.64 $233 620.36 Accounting Principals,
Inc. dba Ajilon, in oartnershio with Modis Pass 38.17 19.93 58.09 20 $178,200.00 $178,200.00 Quality Placement Authority Pass 43 .67 12.76 56.43 21 $278,181.00 $278 181.00 HR Management Inc. Pass 37.17 17.15 54.31 22 $207,094.00 $207,094 .00 JL Staffing Pass 39.17 14.74 53.91 23 $240,831 .00 $240,83 1.00 Woll borg/M ichelson Personnel Service Inc. Pass 42.50 9.31 51.81 24 $381 375 .00 $381 375.00 Vidhwan Inc, dba E-
Solutions Inc. Pass 32.33 15.14 47.47 25 $234,603.00 $234 603 .00 AtWork Personnel
Services Pass 31 .00 16.42 47.42 26 $216 230.00 MJT Enterprises, Inc.
dba Blue Ribbon Personnel Services Pass 3 1.67 14.26 45 .93 27 $248,940.00 Silicon Valley
Technical Staffing, lnc. Pass 34.17 10.65 44.81 28 $333,549.00 Staff Today INC Pass 34.42 9.86 44.28 29 $360,018.00
Non-Responsive Proposals Received Proposal Amount
Cadworks Inc. Did not meet minimum score threshold CSW Funding, LLC Did not meet minimum score threshold Fluxtek Solutions, Inc. Did not meet minimum score threshold Global Consulting and Staffing, LLC Did not meet minimum score threshold Managed Staffing, Inc. Did not meet minimum score threshold Omega Solutions, lnc. Did not meet minimum score threshold Mv Next Career Path Staffing Did not meet minimum score threshold RADgov Inc. Did not meet minimum score threshold Avid Staffing Did not meet minimum score threshold Roth Staffing Companies , L.P. Non-responsive APR Consulting, Inc. Non-responsive
Comments: Type here
Supplier Diversity Program: All Proposers in recommended award have committed to SEED subcontracting.
Benefits: To provide temporary staffing services for various business units throughout SMUD on an as needed basis.
Cost/Budgeted:
Alternatives:
Affected Parties:
Coordination:
Presenter:
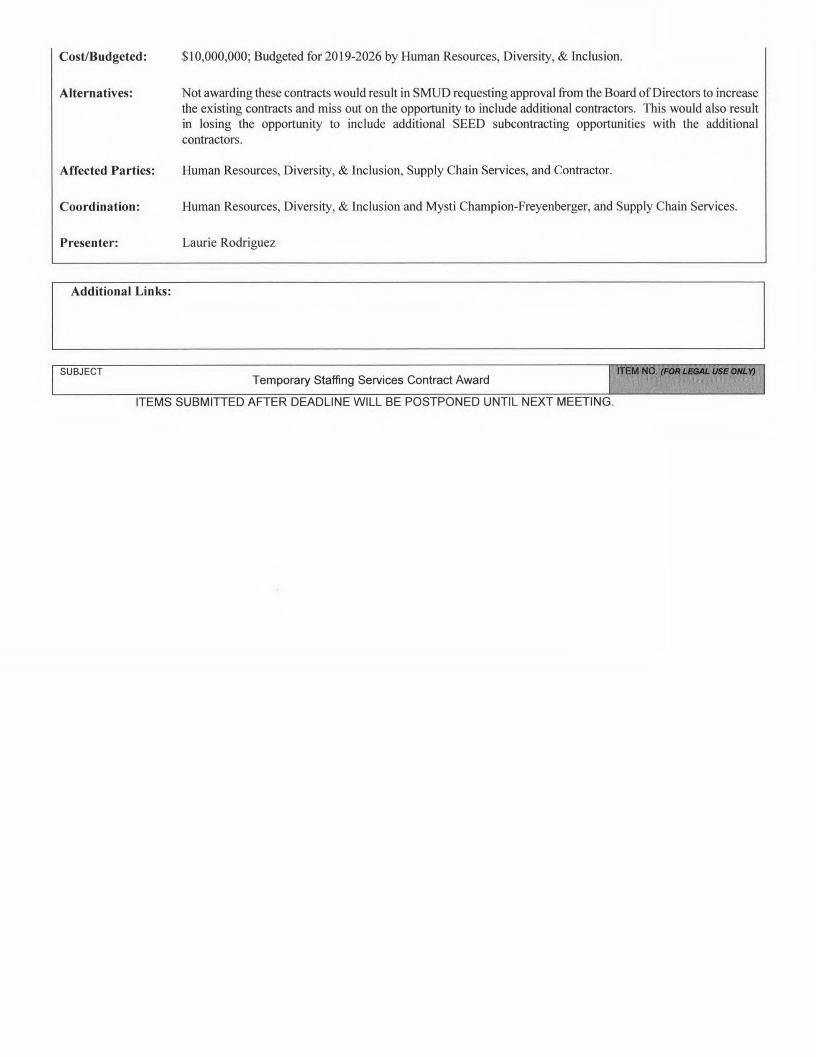
$10,000,000; Budgeted for 2019-2026 by Human Resources, Diversity, & Inclusion.
Not awarding these contracts would result in SMUD requesting approval from the Board ofDirectors to increase the existing contracts and miss out on the opportunity to include additional contractors. This would also result in losing the opportunity to include additional SEED subcontracting opportunities with the additional contractors.
Human Resources, Diversity, & Inclusion, Supply Chain Services, and Contractor.
Human Resources, Diversity, & Inclusion and Mysti Champion-Freyenberger, and Supply Chain Services.
Laurie Rodriguez
Additional Links:
SUBJECT ITEM NO. (FOR LBW. USE OM.Y}Temporary Staffing Services Contract Award
ITEMS SUBMITTED AFTER DEADLINE WILL BE POSTPONED UNTIL NEXT MEETING.

2

SSS No.
CFO 18-022
BOARD AGENDA ITEM STAFFING SUMMARY SHEET
Committee Meeting &Date
Finance & Audit, 2019
Board Meeting Date
n/a
TO TO
1. Jennifer Davidson 6.
2. Stephen Clemons 7.
3. Gary King 8.
4. 9. Legal
5. 10. CEO & General Manager
Consent Calendar I I Yes I I No Ifno, schedule a dry run presentation. Budgeted I I Yes I No (Ifno, explain in Cost/Budgeted section.)
FROM (IPR) DEPARTMENT MAIL STOP EXT. DATE SENT
Sandra Moorman Accounting KI09 6957 12/26/18
NARRATIVE:
Requested Action: Provide the Board ' s Finance and Audit Committee with SMUD' s financial results for the year-to-date period.
Summary: Staff will present the Board ' s Finance and Audit Committee with SMUD's financial results for the year-todate period.
Board Policy: GP-3 (Number & Title)
Benefits: Provide the Board Members with current information on SMUD' s financial condition.
Cost/Budgeted: n/a
Alternatives: None
Affected Parties: Accounting
Coordination: n/a
Presenter: Sandra Moorman
Additional Links:
SUBJECT Review of Current Financial Results
ITEMS SUBMITIED AFTER DEADLINE WILL BE POSTPONED UNTIL NEXT MEETING.
SMUD-15161/16 Forms Management PageO

SACRAMENTO MUNICIPAL UTILITY DISTRICT OFFICE MEMORANDUM
TO: Distribution DATE: April 30, 2019 ACC 19-005
FROM: Ruth Yee I Sandra Moorman
SUBJECT: MARCH 2019 CONSOLIDATED FINANCIAL RESULTS AND OPERATIONS DATA
We are attaching the consolidated financial and operating reports for the three months of 2019. They include sales and generation statistics and other selected data.
SMUD's year-to-date net position decreased $7.2 million compared to a $24.4 million decrease projected in the budget. We attribute the favorable variance ($17.2 million) to higher operating revenue, partially offset by higher operating expenses and lower non-operating revenues.
We prepared these statements on the accrual basis of accounting, and they conform to generally accepted accounting principles. The basis for the budget amounts are:
1) budgeted electric revenues are based on the Forecast of Revenues by the Rates Department, adjusted for unbilled revenues; and
2) budgeted operating expenses reflect the 2019 Budget approved by the Board of Directors on December 20, 2018.
Change in Net Position Year To Date $240 $220 $200 $180 $160 $140
~ $120 0=$100 i $80 .5 $60
$40 $20
$0 ($20) ($40) ($60)
~ - .......
l;""" r ,,
.i'
f :/
/ -~ .,,, I' ......___
~If' -,, ~·
,J 'f' - ,, I -n-- - -'r-tl I ...__ .. - J
I $12 .5 ($ l6.~ ,) ~ - I \-I' .... ~
Jan Feb Mar Apr May Jun Jul Aug Sep Oct Nov Dec
2019 Year-To-Date ~2019 Budget ..,._2018 Year-To-Date
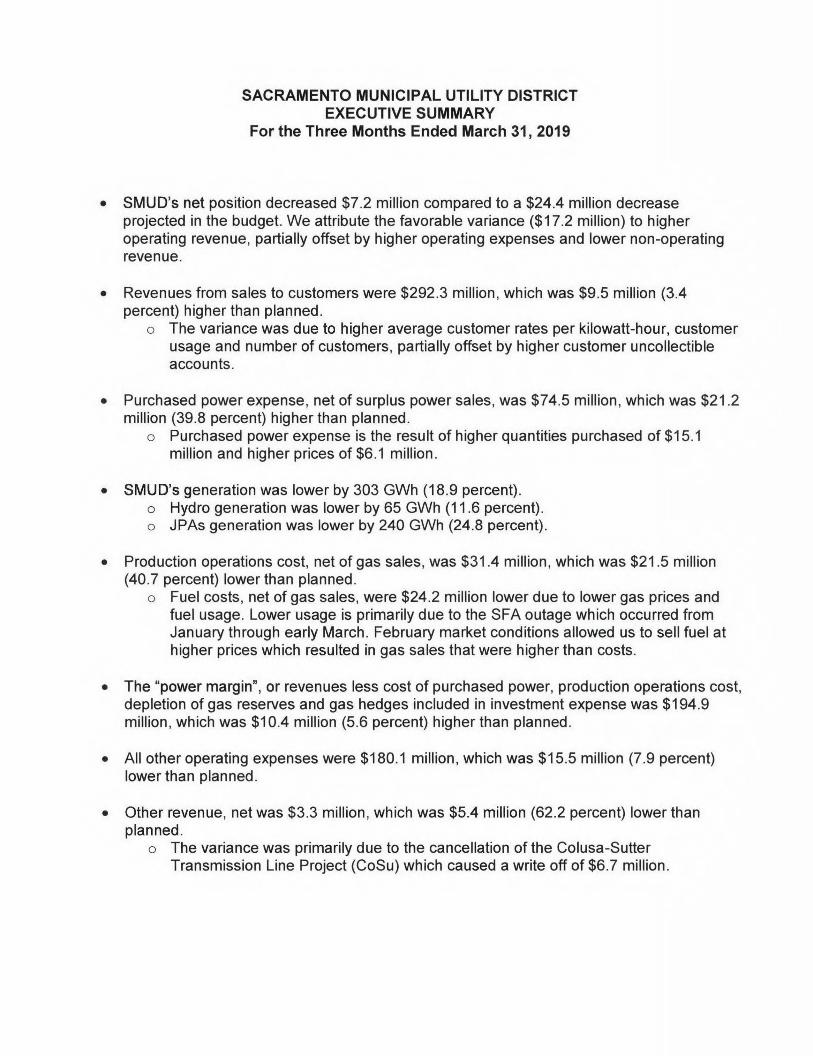
SACRAMENTO MUNICIPAL UTILITY DISTRICT EXECUTIVE SUMMARY
For the Three Months Ended March 31, 2019
• SMUD's net position decreased $7.2 million compared to a $24.4 million decrease projected in the budget. We attribute the favorable variance ($17.2 million) to higher operating revenue, partially offset by higher operating expenses and lower non-operating revenue.
• Revenues from sales to customers were $292 .3 million, which was $9.5 million (3.4 percent) higher than planned.
o The variance was due to higher average customer rates per kilowatt-hour, customer usage and number of customers, partially offset by higher customer uncollectible accounts .
• Purchased power expense, net of surplus power sales, was $74.5 million , which was $21 .2 million (39.8 percent) higher than planned.
o Purchased power expense is the result of higher quantities purchased of $15.1 million and higher prices of $6.1 million.
• SMUD's generation was lower by 303 GWh (18.9 percent). o Hydro generation was lower by 65 GWh (11 .6 percent) . o JPAs generation was lower by 240 GWh (24.8 percent).
• Production operations cost, net of gas sales, was $31.4 million, which was $21 .5 million (40.7 percent) lower than planned.
o Fuel costs, net of gas sales, were $24.2 million lower due to lower gas prices and fuel usage. Lower usage is primarily due to the SFA outage which occurred from January through early March. February market conditions allowed us to sell fuel at higher prices which resulted in gas sales that were higher than costs.
• The "power margin", or revenues less cost of purchased power, production operations cost, depletion of gas reserves and gas hedges included in investment expense was $194.9 million, which was $10.4 million (5.6 percent) higher than planned .
• All other operating expenses were $180.1 million, which was $15.5 million (7.9 percent) lower than planned.
• Other revenue, net was $3.3 million, which was $5.4 million (62.2 percent) lower than planned.
o The variance was primarily due to the cancellation of the Colusa-Sutter Transmission Line Project (CoSu) which caused a write off of $6.7 million .
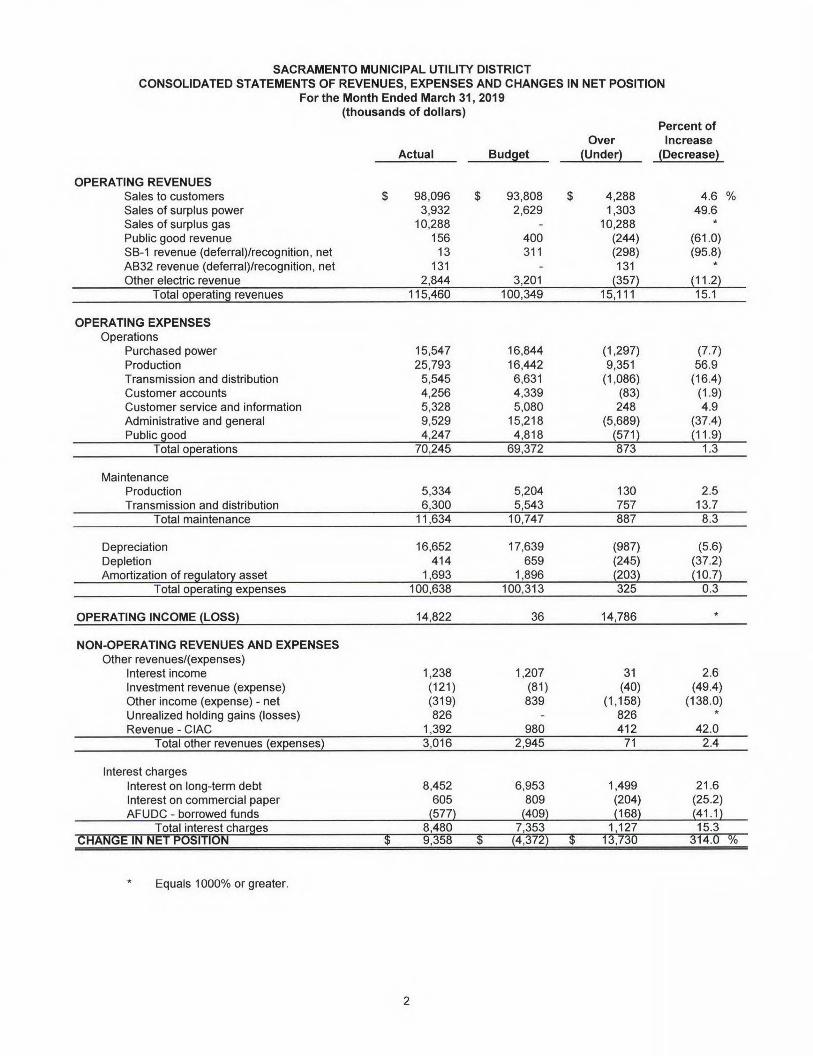
SACRAMENTO MUNICIPAL UTILITY DISTRICT CONSOLIDATED STATEMENTS OF REVENUES, EXPENSES AND CHANGES IN NET POSITION
For the Month Ended March 31, 2019 (thousands of dollars)
Percent of Over Increase
Actual Budget (Under! (Decrease!
OPERATING REVENUES Sales to customers $ 98,096 $ 93,808 $ 4,288 4.6 % Sales of surplus power 3,932 2,629 1,303 49.6 Sales of surplus gas 10,288 10,288 * Public good revenue 156 400 (244) (61 .0) SB-1 revenue (deferral)/recognition , net 13 311 (298) (95.8) AB32 revenue (deferral)/recognition, net 131 131 * Other electric revenue 2,844 3,201 {357} (11 .2}
Total operating revenues 115,460 100,349 15,111 15.1
OPERATING EXPENSES Operations
Purchased power 15,547 16,844 (1 ,297) (7.7) Production 25,793 16,442 9,351 56.9 Transmission and distribution 5,545 6,631 (1 ,086) (16.4) Customer accounts 4,256 4,339 (83) (1 .9) Customer service and information 5,328 5,080 248 4.9 Administrative and general 9,529 15,218 (5,689) (37.4) Public good 4,247 4,818 (571) {11 .9)
Total operations 70,245 69,372 873 1.3
Maintenance Production 5,334 5,204 130 2.5 Transmission and distribution 6,300 5,543 757 13.7
Total maintenance 11 ,634 10,747 887 8.3
Depreciation 16,652 17,639 (987) (5.6) Depletion 414 659 (245) (37.2) Amortization of regulato!}'. asset 1,693 1,896 {203} {10.7}
Total operating exeenses 100,638 100,313 325 0.3
OPERATING INCOME (LOSS) 14,822 36 14,786
NON-OPERATING REVENUES AND EXPENSES Other revenues/( expenses)
Interest income 1,238 1,207 31 2.6 Investment revenue (expense) (121) (81) (40) (49.4) Other income (expense) - net (319) 839 (1 ,158) (138.0) Unrealized holding gains (losses) 826 826 * Revenue - CIAC 1,392 980 412 42.0
Total other revenues {exeenses} 3,016 2,945 71 2.4
Interest charges Interest on long-term debt 8,452 6,953 1,499 21 .6 Interest on commercial paper 605 809 (204) (25.2) AFUDC - borrowed funds (577) (409) (168) (41 .1)
Total interest charges CRAN~E IN NET 150SITION $
8,480 9,358 $
7,353 (4,372) $
1,127 13,730
15.3 314.0 bJo
Equals 1000% or greater.
2

SACRAMENTO MUNICIPAL UTILITY DISTRICT CONSOLIDATED STATEMENTS OF REVENUES, EXPENSES AND CHANGES IN NET POSITION
For the Three Months Ended March 31, 2019 (thousands of dollars)
Percent of Over Increase
Actual Budget (Under) (Decrease)
OPERATING REVENUES Sales to customers $ 292,287 $ 282,756 $ 9,531 3.4 % Sales of surplus power 11 ,390 7,730 3,660 47.3 Sales of surplus gas 56,795 56,795 Public good revenue 520 1,000 (480) (48.0) SB-1 revenue (deferral)/recognition, net 202 837 (635) (759) AB32 revenue (deferral)/recognition, net 653 653 Other electric revenue 8,529 8,084 445 5.5
Total oeerating revenues 370,376 300,407 69,969 23.3
OPERATING EXPENSES Operations
Purchased power 85,900 61 ,018 24,882 40.8 Production 88, 158 52,847 35,311 66.8 Transmission and distribution 21 ,640 19,711 1,929 9.8 Customer accounts 13,496 13,565 (69) (0.5) Customer service and information 14,610 14,407 203 1.4 Administrative and general 28,988 45,087 (16,099) (35.7) Public good 11 ,547 16,077 (4,530) (28.2)
Total oeerations 264,339 222,712 41 ,627 18.7
Maintenance Production 14,054 14,297 (243) (1 .7) Transmission and distribution 20,245 15, 187 5,058 33.3
Total maintenance 34,299 29,484 4,815 16.3
Depreciation 50,056 51 ,568 (1,512) (2.9) Depletion 1,384 1,976 (592) (30.0) Amortization of regulate~ asset 5,457 5,734 (277) (4.8)
Total operating exeenses 355,535 311 ,474 44,061 14.1
OPERATING INCOME (LOSS) 14,841 (11 ,067) 25,908 234.1
NON-OPERA TING REVENUES AND EXPENSES Other revenues/( expenses)
Interest income 3,893 3,622 271 7.5 Investment revenue (expense) (294) (244) (50) (20.5) Other income (expense) - net (6, 167) 2,303 (8,470) (367.8) Unrealized holding gains (losses) 1,647 1,647 * Revenue - CIAC 4,175 2,932 1,243 42.4
Total other revenues (exeenses) 3,254 8,613 (5,359) (62.2)
Interest charges Interest on long-term debt Interest on commercial paper AFUDC - borrowed funds
Total interest charges CRAf'JGE lf\J f\JET 150SITIOf\J $
25,363 1,563
{1 ,626) 25,300 (7,205) $
20,859 2,423
{1,319) 21 ,963
(24,417) $
4,504 (860) {307)
3,337 17,212
21 .6 (35.5) {23.3) 15.2 70.5 bJo
Equals 1000% or greater.
3

SACRAMENTO MUNICIPAL UTILITY DISTRICT CONSOLIDATED SOURCES AND USES OF ENERGY -COMPARED TO BUDGET
For the Period Ended March 31, 2019
Increase Increase
Month (Decrease) Year-to-Date (Decrease)
Sources of Energy (GWh) Actual Budget Percentage Actual Budget Percentage Net Generated
H~ro 2~ 233 (0.4) % 494 559 (11 .6) % Carson Ice (CVFA) 24 10 140.0 93 105 (11.4) Procter & Gamble (SCA) 62 28 121.4 223 209 6.7 Campbell Soup Project (SPA) 41 34 20.6 232 258 (10.1) SMUD Financing Authority (SFA) 168 228 (26.3) 180 396 (54.5) Other 24 34 (30.7) 80-- 78 2.6
Total net generation 551 567 (2.9) 1,302 1,605 (18.9) Purchased Power less transmission losses:
Avangrid 5 7 (28.6) 13 16 (18.8) CalPine Sutter 34 * 366 * Feed in Tariff 16 18 (11 .1) 34 38 (10.5) Kiefer - Greenergy 9 10 (10.0) 27 28 (3.6) Patua 11 14 (21.4) 37 41 (9.8) Simpson 27 30 (10.0) 59 73 (19.2) WAPA 142 36 294.4 152 82 85.4 WSPP and other 82 174 (52.9) 618 710 (13.0) Other long term power 32 40 (19.5) 79-- 89 (11 .8)
Total net purchases Total sources of energy
358 909
329 896
8.9 1.4
1,385 2,687
1,077 2,682
28.6 0.2
Uses of energy: SMUD electric sales and usage 786 760 3.4 2,358 2,340 0.8 Surplus power sales 123 81 51 .9 252 195 29.2 System losses 55 (100.0) 77 147 (47.6) Total uses of energy 969 896 1.4 % 2,687 2,682 0.2 %
* Change equals 1000% or more.
Net Generation Net Purchased Power 600 ~------- 1000 ~-------
500 -+-~------- 800 +--------n
.c 400
.c 600 +--------~ 300 ~ l!J l!J 400 -'---------- • Actual
200 • Actual 200 4--- -------- • Budget 100 • Budget
0 ..µlllA..,,...m.111....r-J-.......-.........--.__, 0 4..11-.....---___.-...,....-11....-1--.
Net generation is lower than budget for the three-month period . • Hydro generation is lower than planned (11.6 percent) . Due to lower storage levels we held back on
generation for January and February. • JPA generation is lower than planned (24.8 percent). Due to SFA outage for major overhauls that
spanned from January through the beginning of March .
Purchase power, less surplus power sales, is higher than plan (28.4 percent) .
* Change equals 1000% or more.
4
2018
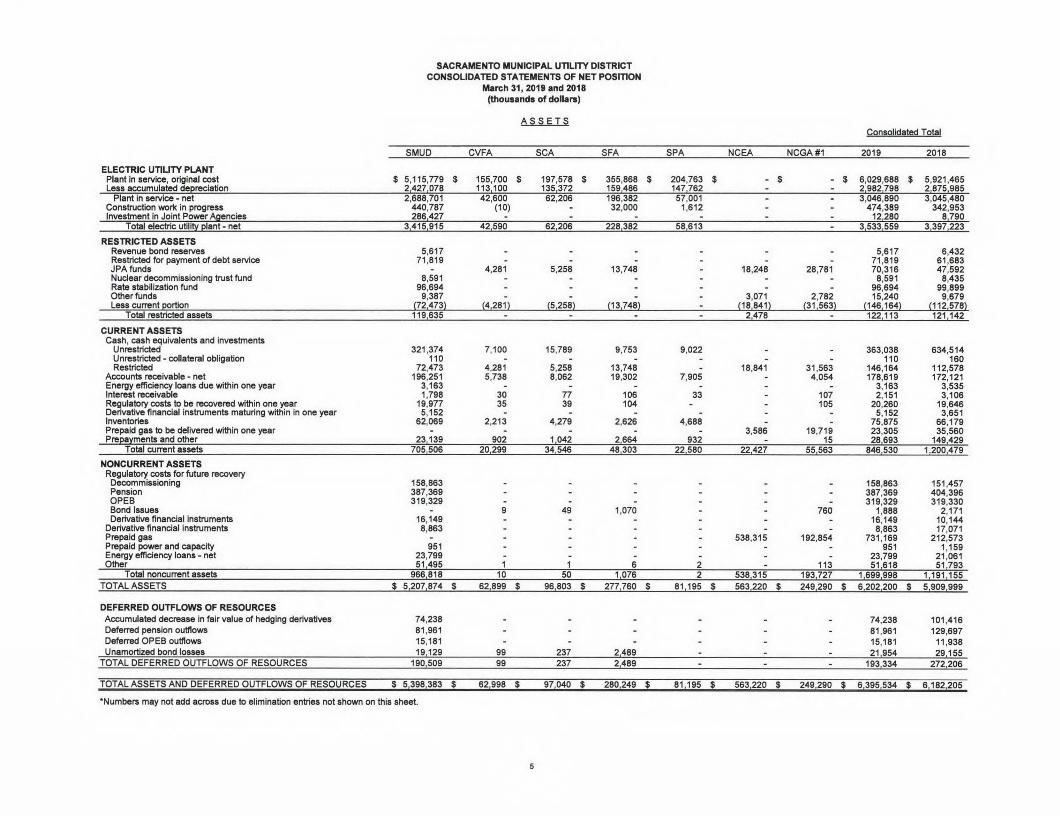
SACRAMENTO MUNICIPAL UTILITY DISTRICT CONSOLIDATED STATEMENTS OF NET POSITION
March 31, 2019 and 2018 (thousands of dollars)
A~~ETS Consolidated Total
SMUD CVFA SCA SFA SPA NCEA NCGA#1 2019
ELECTRIC UTILITY PLANT Plant in service, original cost Less accumulated de11reciation
$ 5,115,779 2,427,078
$ 155,700 113,100
$ 197,578 135,372
$ 355,868 159,486
$ 204,763 147,762
$ - $ - $ 6,029,688 2,982,798
$ 5,921,465 2,875,985
Plant in service - net Construction wor1< in progress Investment in Joint Power Agencies
2,688,701 440,787 286,427
42,600 (10)
62,206 196,382 32,000
57,001 1,612
3,046,890 474,389
12,280
3,045,480 342,953
8,790 Total electric util~ !!!ant - net 3,415,915 42,590 62,206 228,382 58,613 3,533,559 3,397,223
RESTRICTED ASSETS Revenue bond reserves 5,617 5,617 6,432 Restricted for payment of debt service 71 ,819 71 ,819 61 ,683 JPA funds 4,281 5,258 13,748 18,248 28,781 70,316 47,592 Nuclear decommissioning trust fund 8,591 8,591 8,435 Rate stabilization fund 96,694 96,694 99,899 Other funds 9,387 3,071 2,782 15,240 9,679 Less current (!Ortion Q'.2,473) (4,281) (5,258) (13,748) (18,841) (31,563) (146, 164) (112,578)
Total restricted assets 119 635 2 478 122113 121142
CURRENT ASSETS Cash, cash equivalents and investments
Unrestricted 321 ,374 7,100 15,789 9,753 9,022 363,038 634,514 Unrestricted - collateral obligation 110 110 160 Restricted 72,473 4,281 5,258 13,748 18,841 31 ,563 146,164 112,578
Accounts receivable - net 196,251 5,738 8,062 19,302 7,905 4,054 178,619 172,121 Energy efficiency loans due within one year 3,163 3,163 3,535 Interest receivable 1,798 30 77 106 33 107 2,151 3,106 Regulatory costs to be recovered within one year 19,977 35 39 104 105 20,260 19,646 Derivative financial instruments maturing within in one year 5,152 5,152 3,651 Inventories 62,069 2,213 4,279 2,626 4,688 75,875 66,179 Prepaid gas to be delivered within one year 3,586 19,719 23,305 35,560 Pre!!a:r:ments and other 23,139 902 1,042 2,664 932 15 28,693 149,429
Total current assets 705 506 20 299 34 546 48 303 22 580 22427 55 563 846 530 1 200 479
NONCURRENT ASSETS Regulatory costs for future recovery
Decommissioning Pension OPEB Bond Issues Derivative financial instruments
Derivative financial instruments Prepaid gas Prepaid power and capacity Energy efficiency loans - net Other
Total noncurrent assets
158,863 387,369 319,329
16,149 8,863
951 23,799 51 495
966 818
9
1 10
49
1 50
1,070
6 1 076
2 2
538,315
538 315
760
192,854
113 193 727
158,863 387,369 319,329
1,888 16,149 8,863
731 ,169 951
23,799 51 618
1 699 998
151 ,457 404,396 319,330
2,171 10,1 44 17,071
212,573 1,159
21 ,061 51 793
1 191 155 TOTAL ASSETS $ 5,207,874 $ 62,899 $ 96,803 $ 277,760 $ 81 ,1 95 $ 563,220 $ 249,290 $ 6,202,200 $ 5,909,999
DEFERRED OUTFLOWS OF RESOURCES Accumulated decrease in fair value of hedging derivatives Deferred pension outflows Deferred OPEB outflows Unamortized bond losses
74,238 81 ,961 15, 181 19 129 99 237 2489
74,238 81,961 15,181 21 954
101 ,416 129,697
11 ,938 29155
TOTAL DEFERRED OUTFLOWS OF RESOURCES 190 509 99 237 2489 193 334 272 206
TOTAL ASSETS AND DEFERRED OUTFLOWS OF RESOURCES $ 513981383 $ 62,998 $ 97,040 $ 280,249 $ 81,195 $ 563,220 $ 249,290 $ 6
1395
1534 $ 611821205
•Numbers may not add across due to elimination entries not shown on this sheet.
5

SACRAMENTO MUNICIPAL UTILITY DISTRICT CONSOLIDATED STATEMENTS OF NET POSITION
March 31, 2019 and 2018 (thousands of dollara)
Ll&BILITI!;;~ t,~Q ~f;;T t,~~!;T~
QQnsolidi!t!:Q Total
SMUD CVFA SCA SFA SPA NCEA NCGA#1 2019 2018
LONG-TERM DEBT- NET $ 1,710,966 $ 5,493 $ 13, 198 $ 137,324 $ - $ 565,620 $ 198,610 $ 2,631 ,211 $ 2,336,115
CURRENT LIABILITIES Commercial paper notes 288,750 288,750 200,000 Accounts payable 62,473 1,339 1,040 7,028 2,860 2,837 77,577 116,108 Purchased power payable 59,429 2,027 5,435 10,597 4,985 19,779 18,268 Credit support collateral obligation 110 2,780 2,890 2,800 Long-term debt due within one year 87,425 5,165 6,030 11,705 34,560 144,885 132,440 Accrued decommissioning 5,562 5,562 5,775 Interest payable 20,227 136 245 1,656 6,164 571 28,999 24,213 Accrued salaries and compensated absences 38,369 38,369 36,826 Derivative financial instruments maturing within one year 28,930 28,930 29,526 Customer deposits 23,489 23,489 22,940 Other 19 190 41 19 231 35 514
Total current liabilities 633 954 8 708 12 750 30 986 7 845 6164 40 748 678 461 624 410
NONCURRENT LIABILITIES Accrued decommissioning - net Derivative financial instruments Net pension liability Net OPEB liability Other
153,939 64,201
454,044 22,066 87 724
11,383 165,322 64,201
454,044 22,066 87724
156,490 84,388
565,800 100,867
81 970 Total noncurrent liabilities 781 974 11 383 793 357 989 515
TOTAL LIABILITIES 3 126 894 25 584 25 948 168 310 7 845 571 784 239 358 4 103 029 3 950 040
DEFERRED INFLOWS OF RESOURCES Accumulated increase in fair value of hedging derivatives 14,015 14,015 20,669 Deferred pension inflows 56,475 56,475 28,745 Deferred OPEB inflows 51 ,656 51,656 4,632 Regulatory credits 448,257 448,257 452,092 Unamortized bond gains - other 8,353 8,353 207,205
TOTAL DEFERRED INFLOWS OF RESOURCES 578 756 578 756 713 343
NET POSITION Balance at beginning of year 1,723,475 36,924 68,983 85,895 73,293 (4,599) 11,078 1,720,954 1,511,815 Net increase (decrease) for the year (30,742) 490 2,109 26,044 57 (3,995) (1 ,168) (7,205) 7,007 Member contributions (distributions) - net 30 22
TOTAL NET POSITION 1,692,733 37,414 71,092 111,939 73,350 (8,564) 9,932 1,713,749 1,518,822
TOTAL LIABILITIES, DEFERRED INFLOWS OF RESOURCES AND NET POSITION $ 513981383 $ 621998 $ 971040 $ 2801249 $ 811195 $ 5631220 $ 2491290 $ 613951534 $ 611821205
•Numbers may not add across due to elimination entries not shown on this sheet

Sacramento Municipal Utility District Management Financial Report - Income Statement
For the Three Months Ended March 31, 2019 dollars in millions
Revenue Residential revenue EAPR and MED discount Commercial, Industrial, Street Light & Other Other Electric Revenue RSF & other deferrals Uncollectible Electric Sales
Current Month Only
Actual Plan 48.7 45.1 (2.6) (2 .7) 52.8 51 .8 2.8 2.9 0.2 0.7
(0.8) (0.5)
Positive/ (Negative) Impact to
Plan Net Income
3.5 0.1 1.0
(0.1) (0 .5) (0 .3)
Actual 148.0
(7.6) 153.6
8.4 0.7
(1.7)
Year to Date
Plan 144.2
(8.1) 148.0
7.5 1.8
(1.4)
Positive/ (Negative) Impact to
Plan Net Income
3.8 0.5 5.6 0.9
(1 .1) (0 .3)
Total Revenue $ 101 .1 $ 97.4 $ 3.7 $ 301.4 $ 292.1 $ 9.3
Expenses Commodities 21 .8 27.8 6.0 96.6 98.9 2.3
Business Unit Costs
Energy Operations Energy Delivery Customer Internal (excluding Other Items) Technology Corporate Public Good (excluding EAPR & MED Discount)
5.9 14.4
8.1 0.8 1.8 4.5 3.7
5.2 12.9 7.2 0.8 2.7 4.0 4.1
(0.7) (1.5) (0.9) 0.0 0.9
(0.4) 0.3
14.4 40.8 21 .2
1.9 5.3
13.0 9.8
14.5 36.2 21.4
2.0 7.2
12.1 13.9
0.2 (4.7) 0.2 0.1 1.9
(0.9) 4.1
Surcharges allocated to Business Units 6.9 7.9 1.0 18.9 19.3 0.3
Other Business Unit Costs 3.7 7.8 4.0 15.6 28.7 13.1
Total Business Unit Costs $ 49.9 $ 52.6 $ 2.7 $ 140.8 $ 155.2 $ 14.4
Other Costs/ (Income) Other (Income) (including grant revenues) Interest Income Interest Expense Depreciation, Depletion and Amortization Other Non Cash Other
(0.8) (1 .2) 7.7
16.6 (2.5) 0.3
(0 .5) (1 .2) 6.4
17.8 (1 .8) 0.8
0.3 0.0
(1.3) 1.2 0.7 0.5
(2.6) (3.8) 22.7 50.2 (0.5) 5.2
(1.5) (3.6) 19.2 51 .9 (5 .6) 2.1
1.1 0.2
(3.5) 1.7
(5 .1) (3 .1)
Total Other Costs/ (Income) $ 20.1 $ 21 .4 $ 1.3 $ 71.1 $ 62.5 $ (8.7)
Change in net position - Net Income (Loss) $ 9.4 $ (4.4) $ 13.7 $ (7.2) $ (24.4) $ 17.2
This is a management report and is not FERG based. Totals may not add due to rounding. *OPES, Workers Comp Reserve, Bonus, Remediation moved to other line from Internal to allow visibility to BU expense

3

SSS No.
CFO 18-016
Committee Meeting &DateBOARD AGENDA ITEM Finance & Audit, 2019
STAFFING SUMMARY SHEET Board Meeting Date
n/a
TO TO
1. Jennifer Davidson 6.
2. Stephen Clemons 7.
3. Gary King 8.
4. 9. Legal
5. 10. CEO & General Manager
Consent Calendar I I Yes I xi No Ifno, schedule a dry run presentation. Budgeted I I Yes I No (lfno, explain in Cost/Budgeted section.)
FROM (IPR) DEPARTMENT
Jennifer Restivo Finance & Enterprise Planning
MAIL STOP EXT. DATE SENT
A312 6343
NARRATIVE:
Requested Action: Provide the Board's Finance and Audit Committee with SMUD' s Power Supply Costs for the year-to-date period for 2019.
Summary: Staff will present the Board ' s Finance and Audit Committee with SMUD's Power Supply Costs for the year-to-date period for 2019.
Board Policy: GP-3 (Number & Title)
Benefits: Provides the Board Members with current information on power supply costs for SMUD.
Cost/Budgeted: n/a
Alternatives: None
Affected Parties: Finance & Enterprise Planning
Coordination: n/a
Presenter: Jennifer Davidson
Additional Links:
SUBJECT Review of SMUD's Current Power Supply Costs
ITEMS SUBMITTED AFTER DEADLINE WILL BE POSTPONED UNTIL NEXT MEETING.
SMUD-15161/16 Forms Management PageO

4

5
SSS No.
LEG 2019-0003 BOARD AGENDA ITEM
STAFFING SUMMARY SHEET
Committee Meeting &Date
Finance and Audit 2019 Board Meeting Date
TOTO
6. 1. Jennifer Davidson
7. 2. Gary King
8. 3. Stephen Clemons
9. 4 . Legal
10. 5. CEO & General Manager No (Ifno, explain in Cost/Budgeted
Budgeted I I Yes IConsent Calendar I I Yes I xi No Ifno, schedule a dry run presentation. section.! DATE SENT FROM (IPR) I DEPARTMENT MAIL STOP EXT. I I
A311 6123Laura Lewis Lee:al Deoartment NARRATIVE:
Requested Action: Committee discussion and consensus on any directives provided to staff during the Committee meeting.
Summary: Wrap up period at the end of each committee meeting to summarize various Board member suggestions and requests that were made at the meeting in an effort to make clear the will of the Board. Finance and Audit Committee Chair, Rosanna Herber, will summarize Board member requests that come out of the committee presentations for this meeting.
Board Policy: GP-4, Agenda Planning states the Board will focus on the results the Board wants the organization to (Number & Title) achieve.
Benefits: Having an agendized opportunity to summarize the Board's requests and suggestions that arise during the committee meeting will help clarify the will of the Board.
Cost/Budgeted: NIA
Alternatives: Not summarize the Board 's requests at this meeting.
Affected Parties: Board of Directors and Executive Staff
Coordination: Donna Lofton, Special Assistant to the Board
Presenter: Rosanna Herber, Chair, Finance and Audit Committee
Additional Links:
SUBJECT ITEM NO. (FOR LEGAL USI! ONl.YJ Summary of Committee Direction
ITEMS SUBMITIED AFTER DEADLINE WILL BE POSTPONED UNTIL NEXT MEETING.
SMUD-15161 /1 6 Forms Management PageO