sketching with urban data - girardin.org · sketching with urban data ... how the city lives...
TRANSCRIPT
WWW.NEARFUTURELABORATORY.COM
SKETCHING WITH URBAN DATA
FABIEN GIRARDIN, 29.11.2011, BARCELONA
SMART CITY WORLD CONGRESS
Hello, thanks to the organizers for inviting me to this Smart City World Congress (http://www.smartcityexpo.com/). My name is Fabien Girardin. I am a researcher and engineer active in the domains of user experience and data science.
I practice my passion as a Partner at the Near Future Laboratory (ex Lift Lab) a think/make-tank strategically located in Geneva, Barcelona and Los Angeles. We combine insight and analysis with design and research with rapid prototyping to create potent provocative sometimes preposterous ideas into material form. We split our agenda between client projects and self-supported initiatives. Among many other lines of investigations, we are fascinated by the interplay between people, technology and the urban life.
In this short presentation I will describe you how we approach our work with our clients to materialize value form the data the *smart* city produces and consumes.
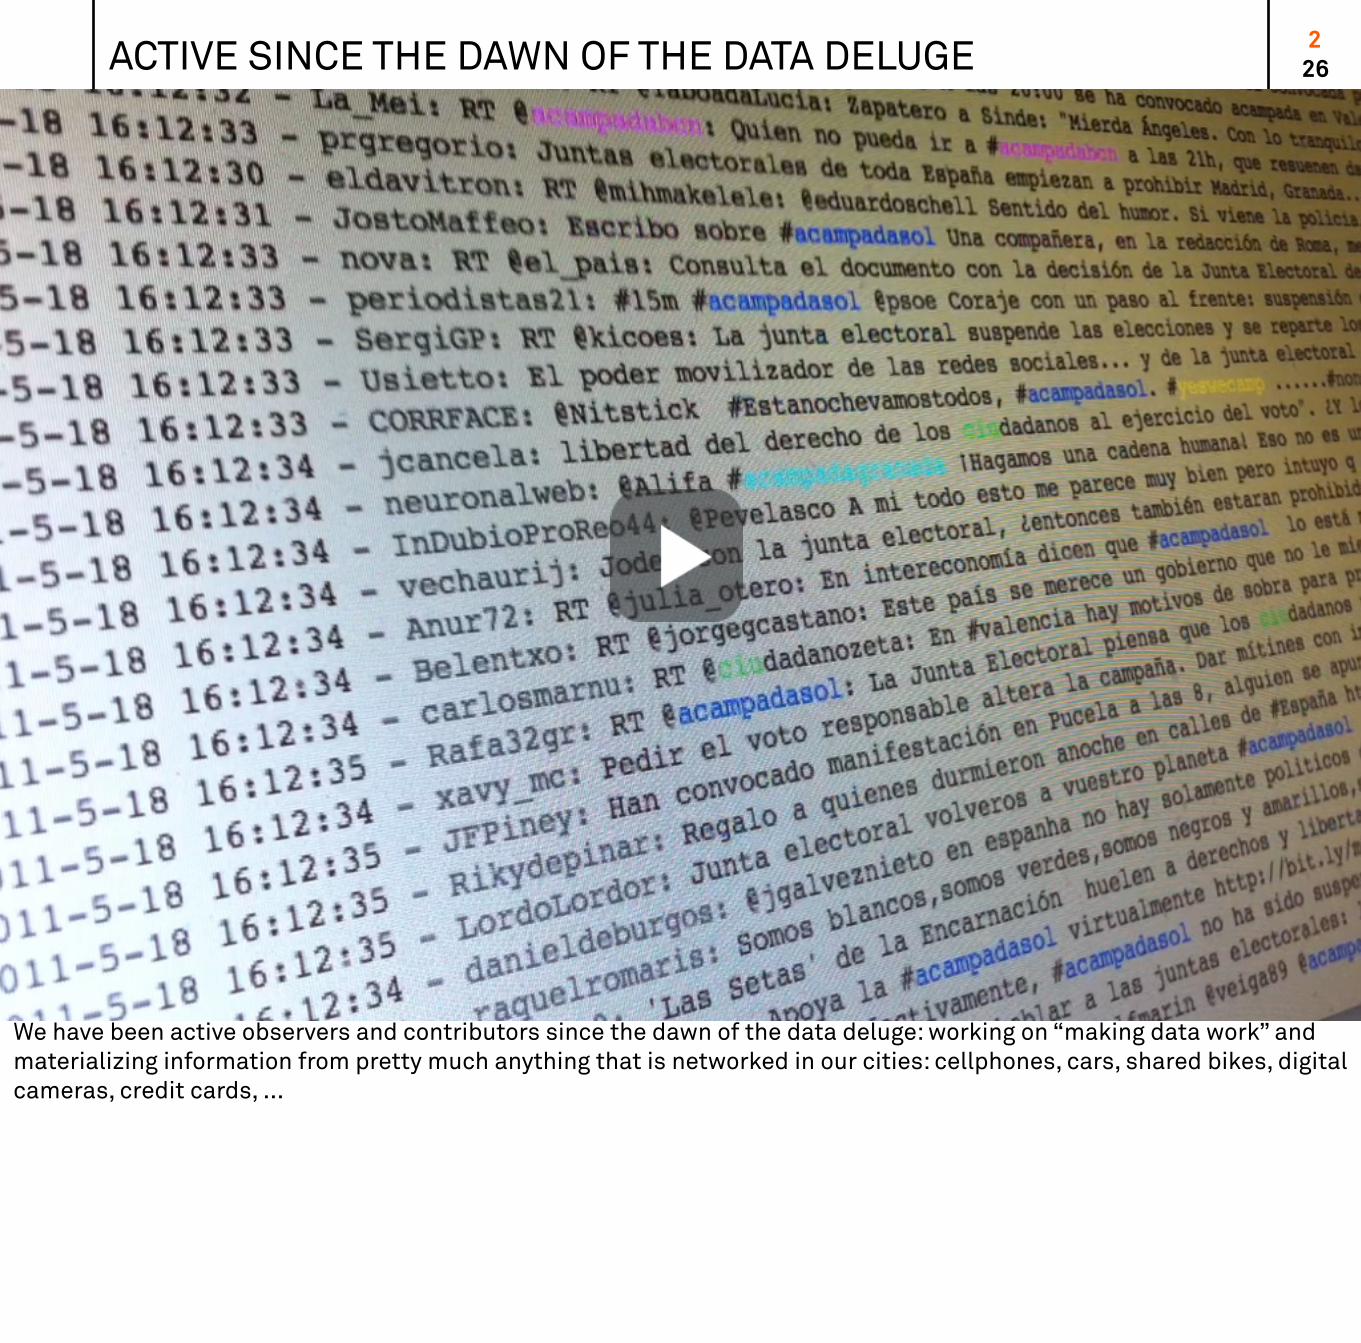
ACTIVE SINCE THE DAWN OF THE DATA DELUGE 262
We have been active observers and contributors since the dawn of the data deluge: working on “making data work” and materializing information from pretty much anything that is networked in our cities: cellphones, cars, shared bikes, digital cameras, credit cards, ...

DATA SPECTATORSHIP 263
This materialization took the form of public installations that reveals how the city lives through its data. Here the World’Eyes project exhibited at the Design Museum in Barcelona in 2008 (http://senseable.mit.edu/worldseyes/). In this piece produced with the MIT SENSEable City Lab, we collected a year of photos georeferenced in Spain and publicly shared on Flickr.
This piece reveals the evolutions of the presence and flows of photographers. As photos pill up to reflect the intensity of the tourist activity, they uncover where photographers are, where they come from and what they are interested in capturing and sharing from their visit.
DATA INVESTIGATION 264
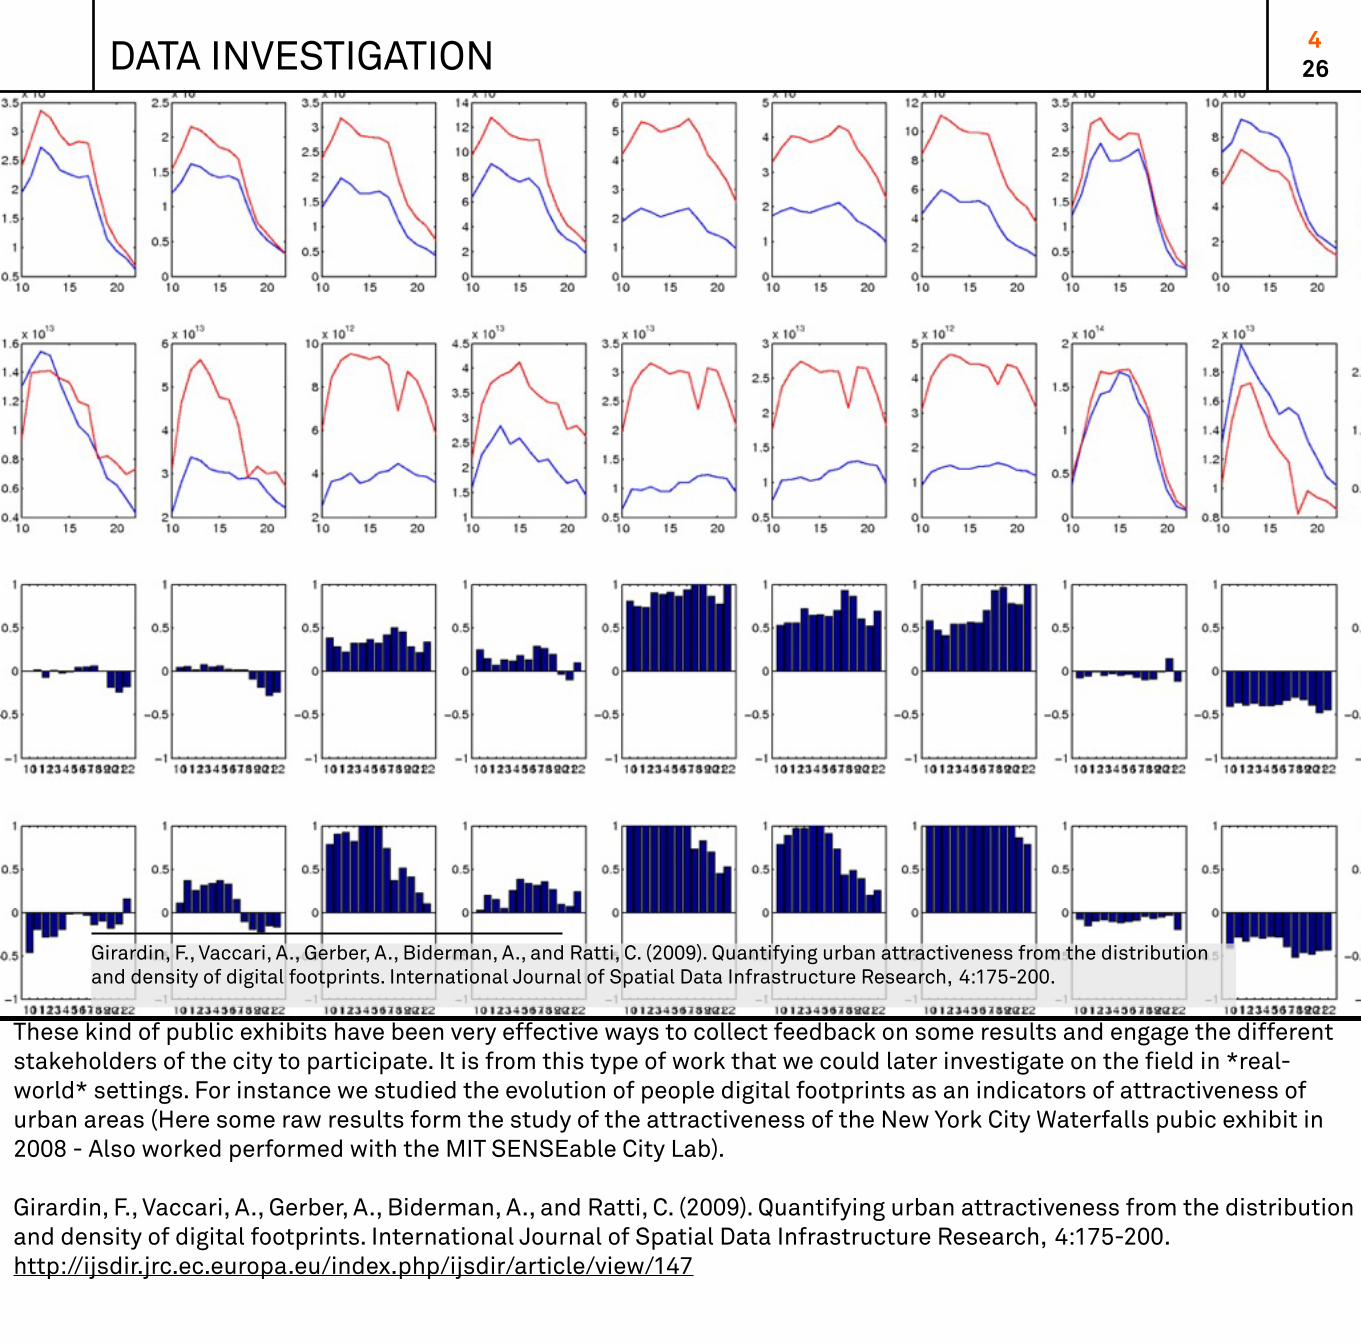
Girardin, F., Vaccari, A., Gerber, A., Biderman, A., and Ratti, C. (2009). Quantifying urban attractiveness from the distribution and density of digital footprints. International Journal of Spatial Data Infrastructure Research, 4:175-200.
These kind of public exhibits have been very effective ways to collect feedback on some results and engage the different stakeholders of the city to participate. It is from this type of work that we could later investigate on the field in *real-world* settings. For instance we studied the evolution of people digital footprints as an indicators of attractiveness of urban areas (Here some raw results form the study of the attractiveness of the New York City Waterfalls pubic exhibit in 2008 - Also worked performed with the MIT SENSEable City Lab).
Girardin, F., Vaccari, A., Gerber, A., Biderman, A., and Ratti, C. (2009). Quantifying urban attractiveness from the distribution and density of digital footprints. International Journal of Spatial Data Infrastructure Research, 4:175-200.http://ijsdir.jrc.ec.europa.eu/index.php/ijsdir/article/view/147
INNOVATE WITH URBAN DATA - ITERATIVE PROCESS 265
100 %
75 %
50 %
25 %
0 %Telecom, software engineers, information architects
Physicists Statisticans Designers Planners, analysts
IEEE 802.11 XML PostGIS ArcGIS Impure Video editing
GSM Java Hadoop Processing KeynoteREST
Python RMysqlJSON
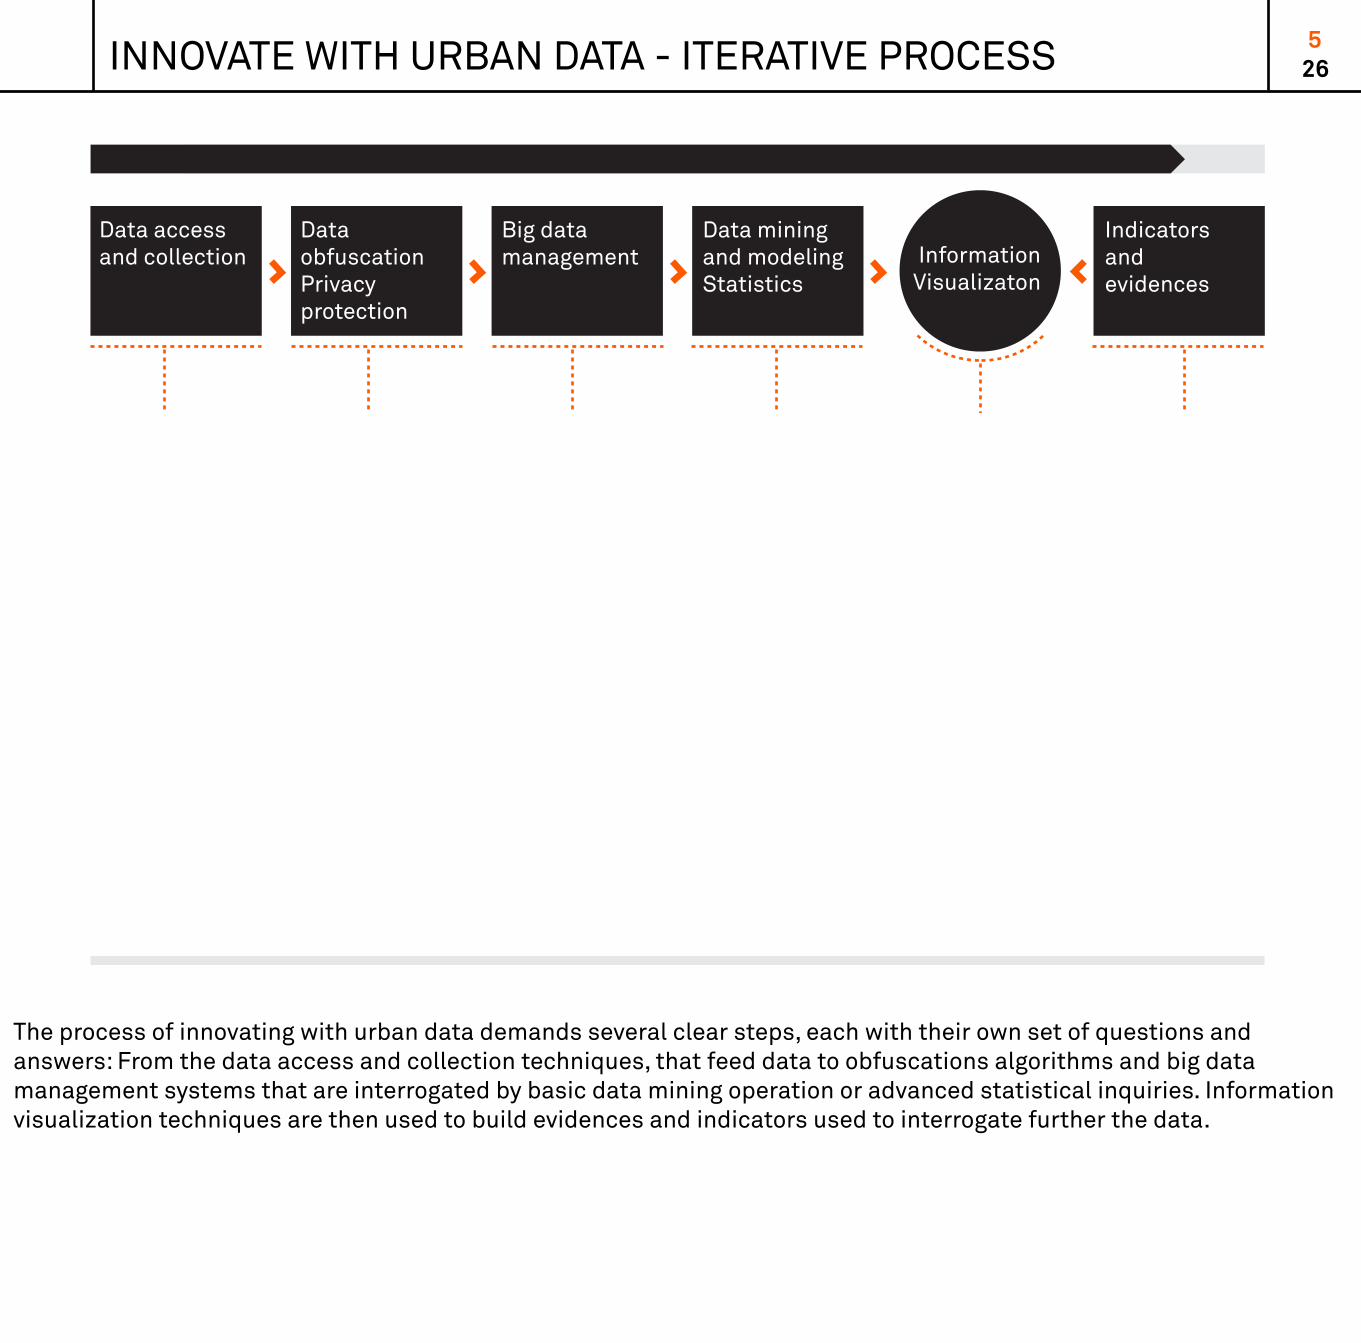
Data access and collection
Data obfuscationPrivacy protection
Big datamanagement
Data miningand modelingStatistics
InformationVisualizaton
Indicatorsandevidences
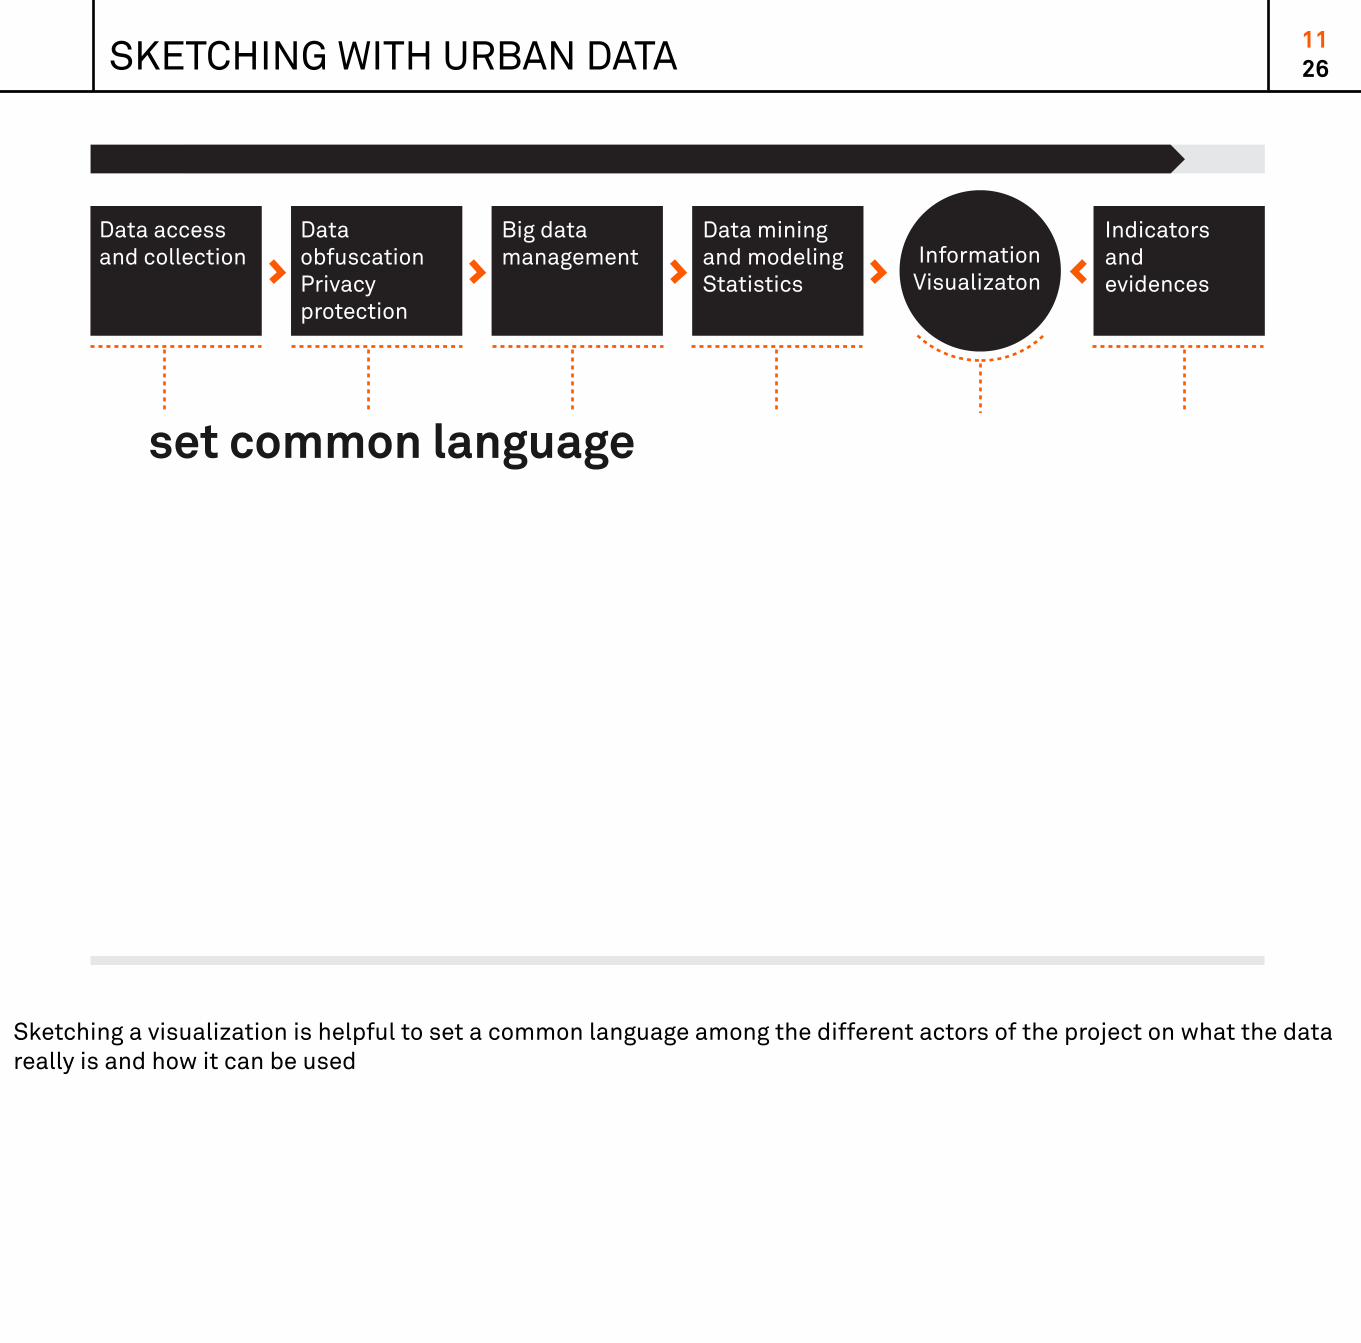
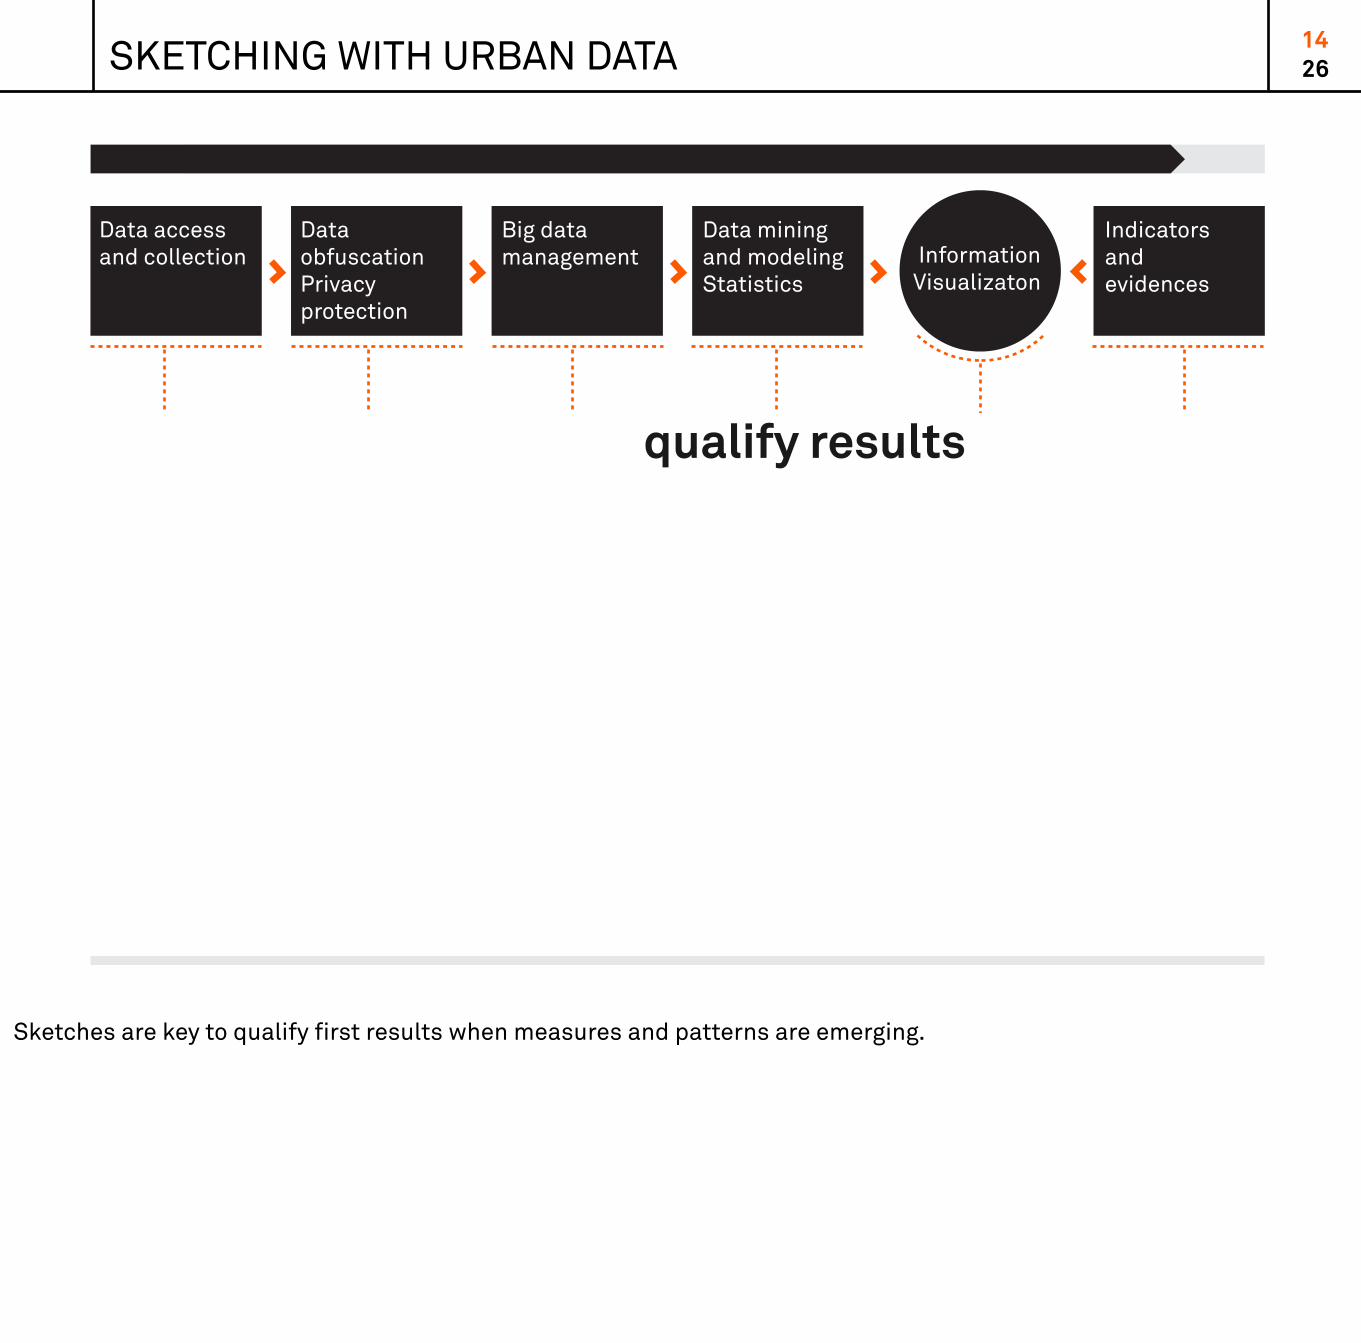
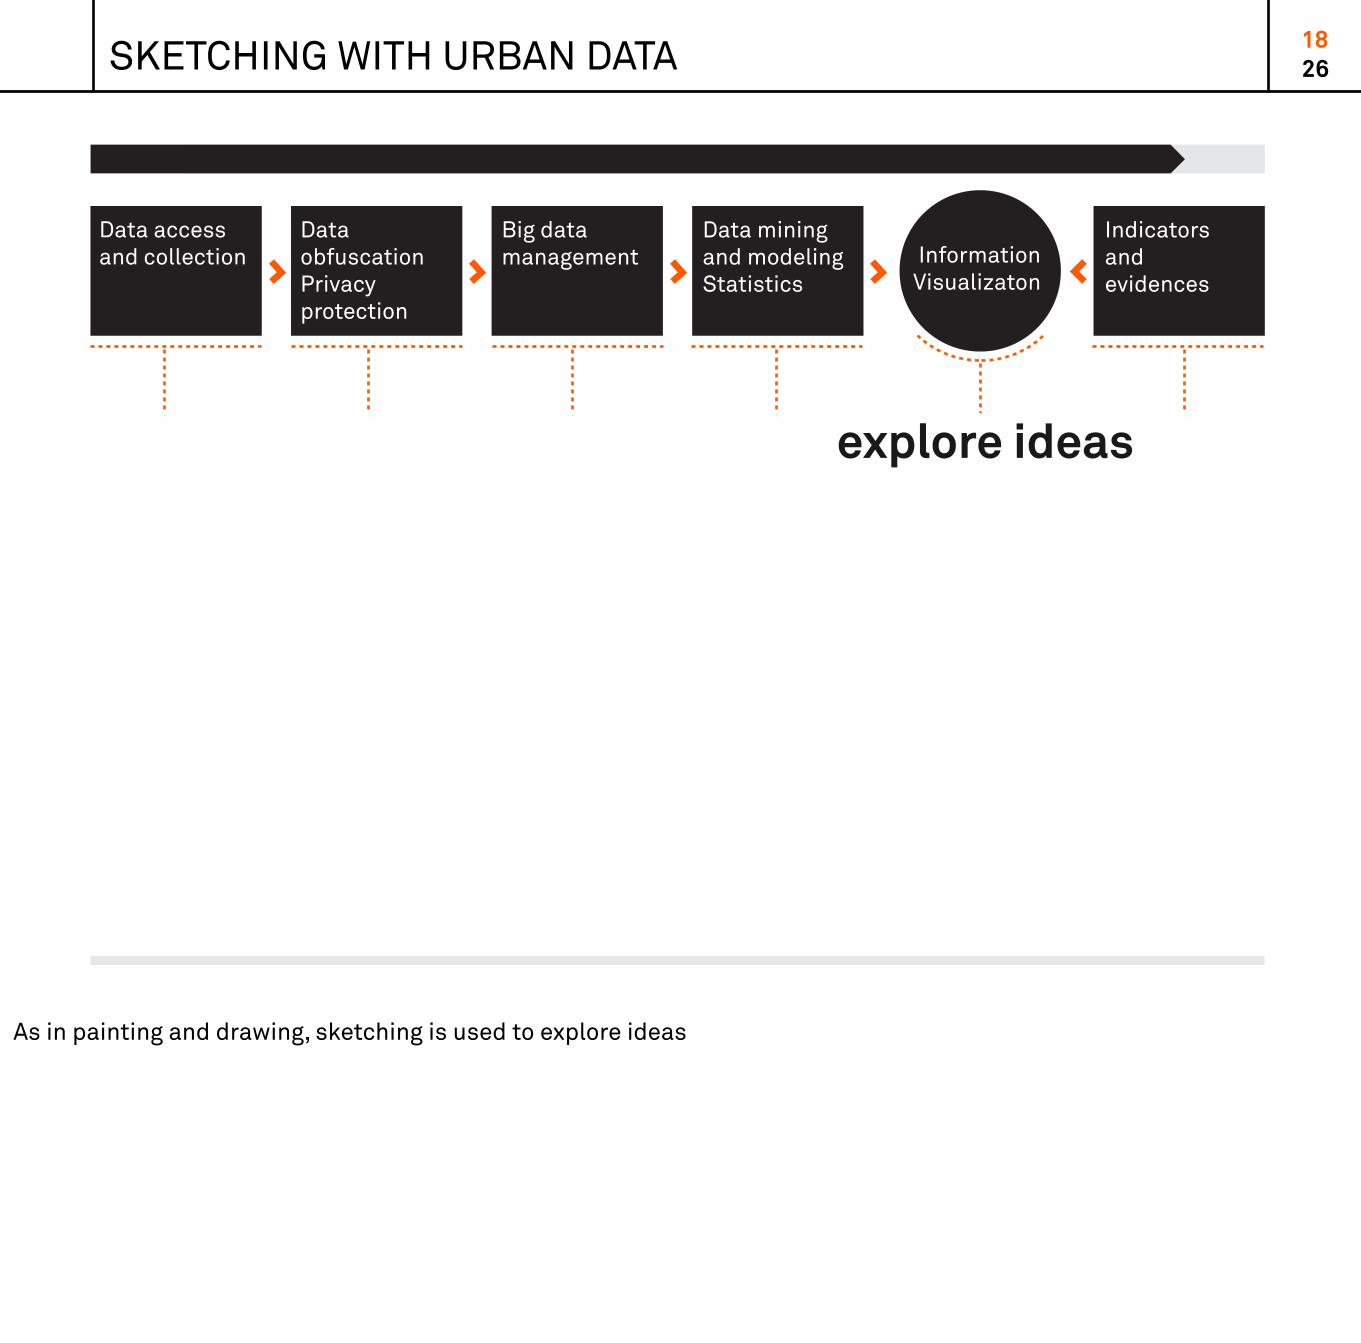
The process of innovating with urban data demands several clear steps, each with their own set of questions and answers: From the data access and collection techniques, that feed data to obfuscations algorithms and big data management systems that are interrogated by basic data mining operation or advanced statistical inquiries. Information visualization techniques are then used to build evidences and indicators used to interrogate further the data.
INNOVATE WITH URBAN DATA - MÉTIERS 266
100 %
75 %
50 %
25 %
0 %Telecom, software engineers, information architects
Physicists Statisticans Designers Planners, analysts
IEEE 802.11 XML PostGIS ArcGIS Impure Video editing
GSM Java Hadoop Processing KeynoteREST
Python RMysqlJSON
Data access and collection
Data obfuscationPrivacy protection
Big datamanagement
Data miningand modelingStatistics
InformationVisualizaton
Indicatorsandevidences
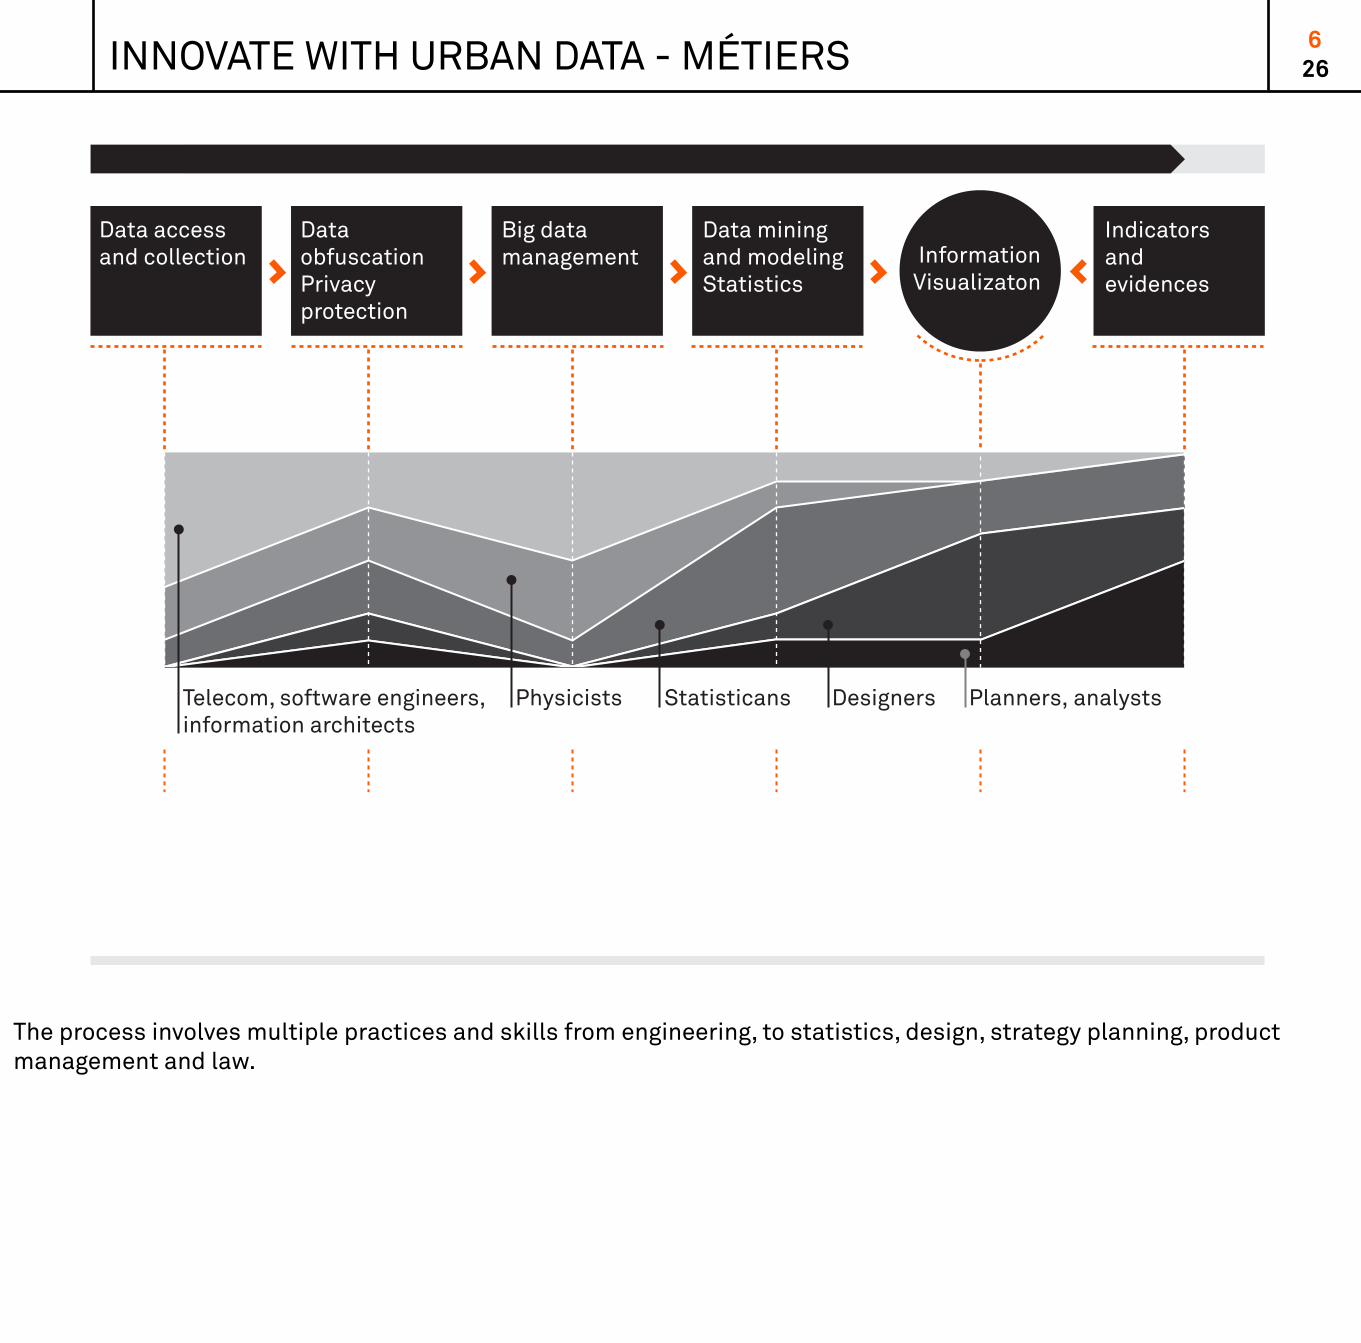
The process involves multiple practices and skills from engineering, to statistics, design, strategy planning, product management and law.

100 %
75 %
50 %
25 %
0 %Telecom, software engineers, information architects
Physicists Statisticans Designers Planners, analysts
IEEE 802.11 XML PostGIS ArcGIS Impure Video editing
GSM Java Hadoop Processing KeynoteREST
Python RMysqlJSON
Data access and collection
Data obfuscationPrivacy protection
Big datamanagement
Data miningand modelingStatistics
InformationVisualizaton
Indicatorsandevidences
INNOVATE WITH URBAN DATA - SKETCH 267
sketch sketch sketch sketch sketch sketch
We have accompanied clients (and ourselves) along that often uncertain innovation process. Our experience has led us to use sketches with the data at hand at each steps. We use this sketches to answered some questions that generate new interrogations for the next phase.
SKETCH |SKE CH | 268
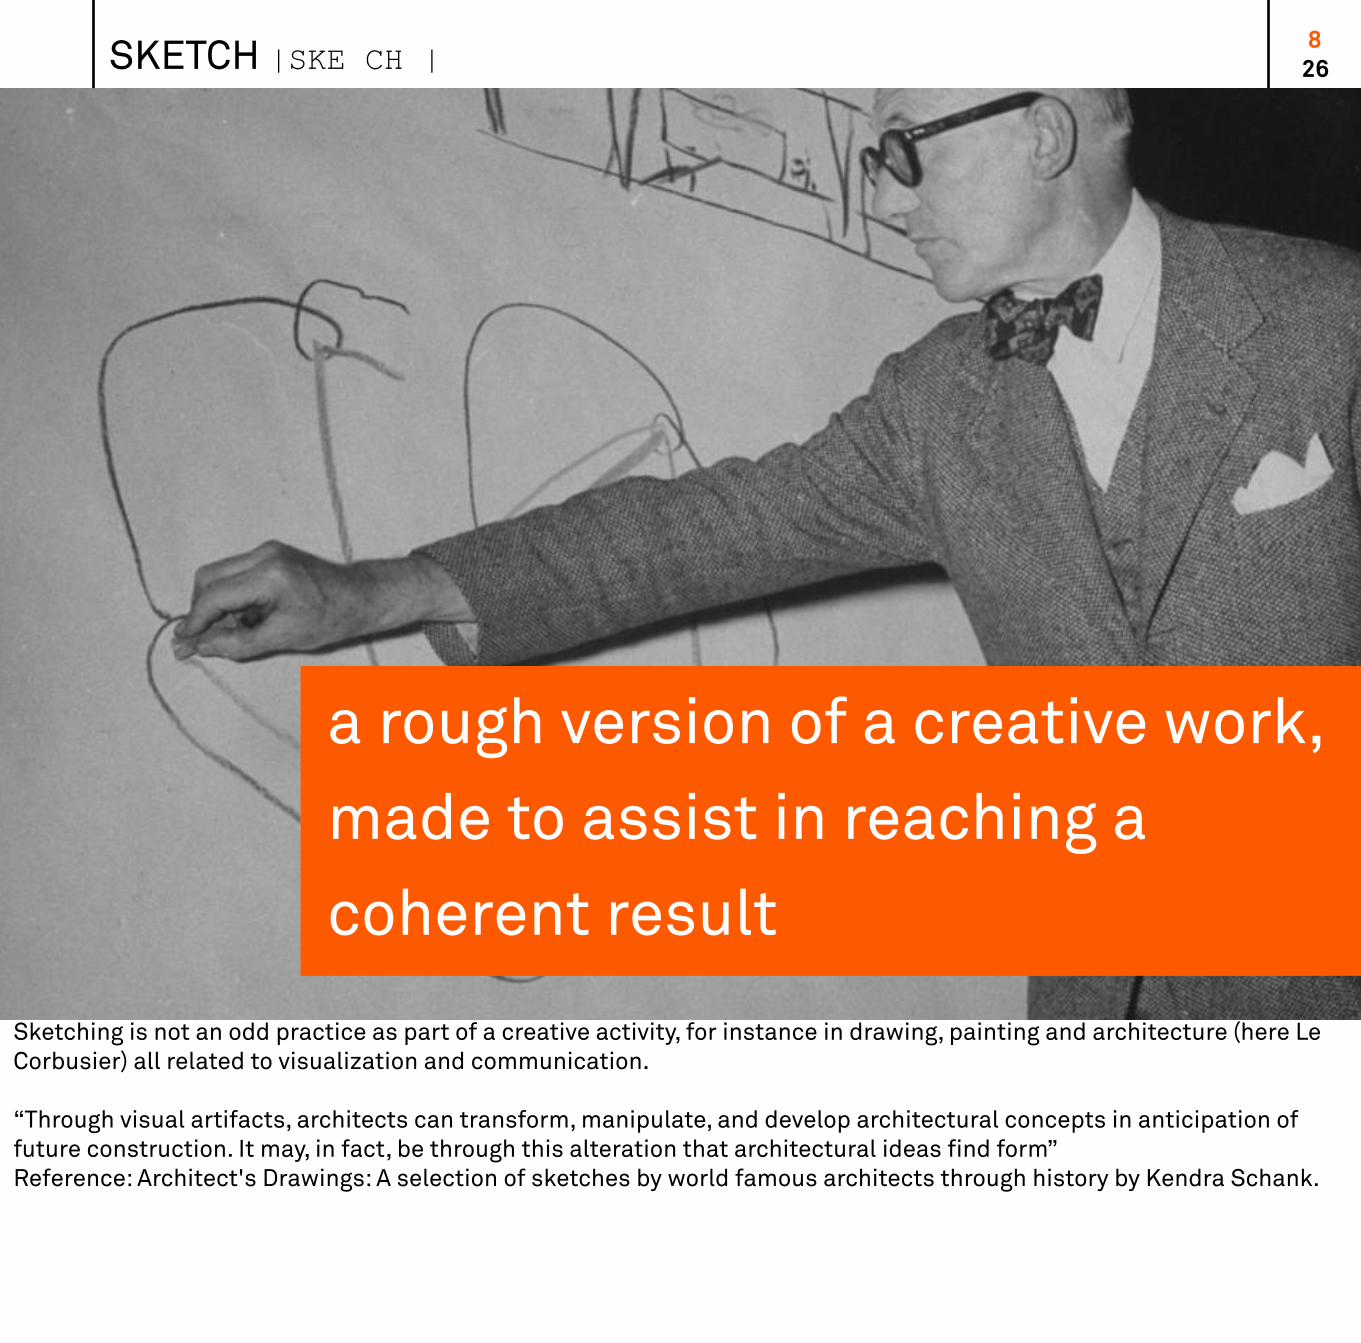
a rough version of a creative work, made to assist in reaching a coherent result
Sketching is not an odd practice as part of a creative activity, for instance in drawing, painting and architecture (here Le Corbusier) all related to visualization and communication.
“Through visual artifacts, architects can transform, manipulate, and develop architectural concepts in anticipation of future construction. It may, in fact, be through this alteration that architectural ideas find form”Reference: Architect's Drawings: A selection of sketches by world famous architects through history by Kendra Schank.
9
100 %
75 %
50 %
25 %
0 %Telecom, software engineers, information architects
Physicists Statisticans Designers Planners, analysts
IEEE 802.11 XML PostGIS ArcGIS Impure Video editing
GSM Java Hadoop Processing KeynoteREST
Python RMysqlJSON
Data access and collection
Data obfuscationPrivacy protection
Big datamanagement
Data miningand modelingStatistics
InformationVisualizaton
Indicatorsandevidences
clean
26SKETCHING WITH URBAN DATA
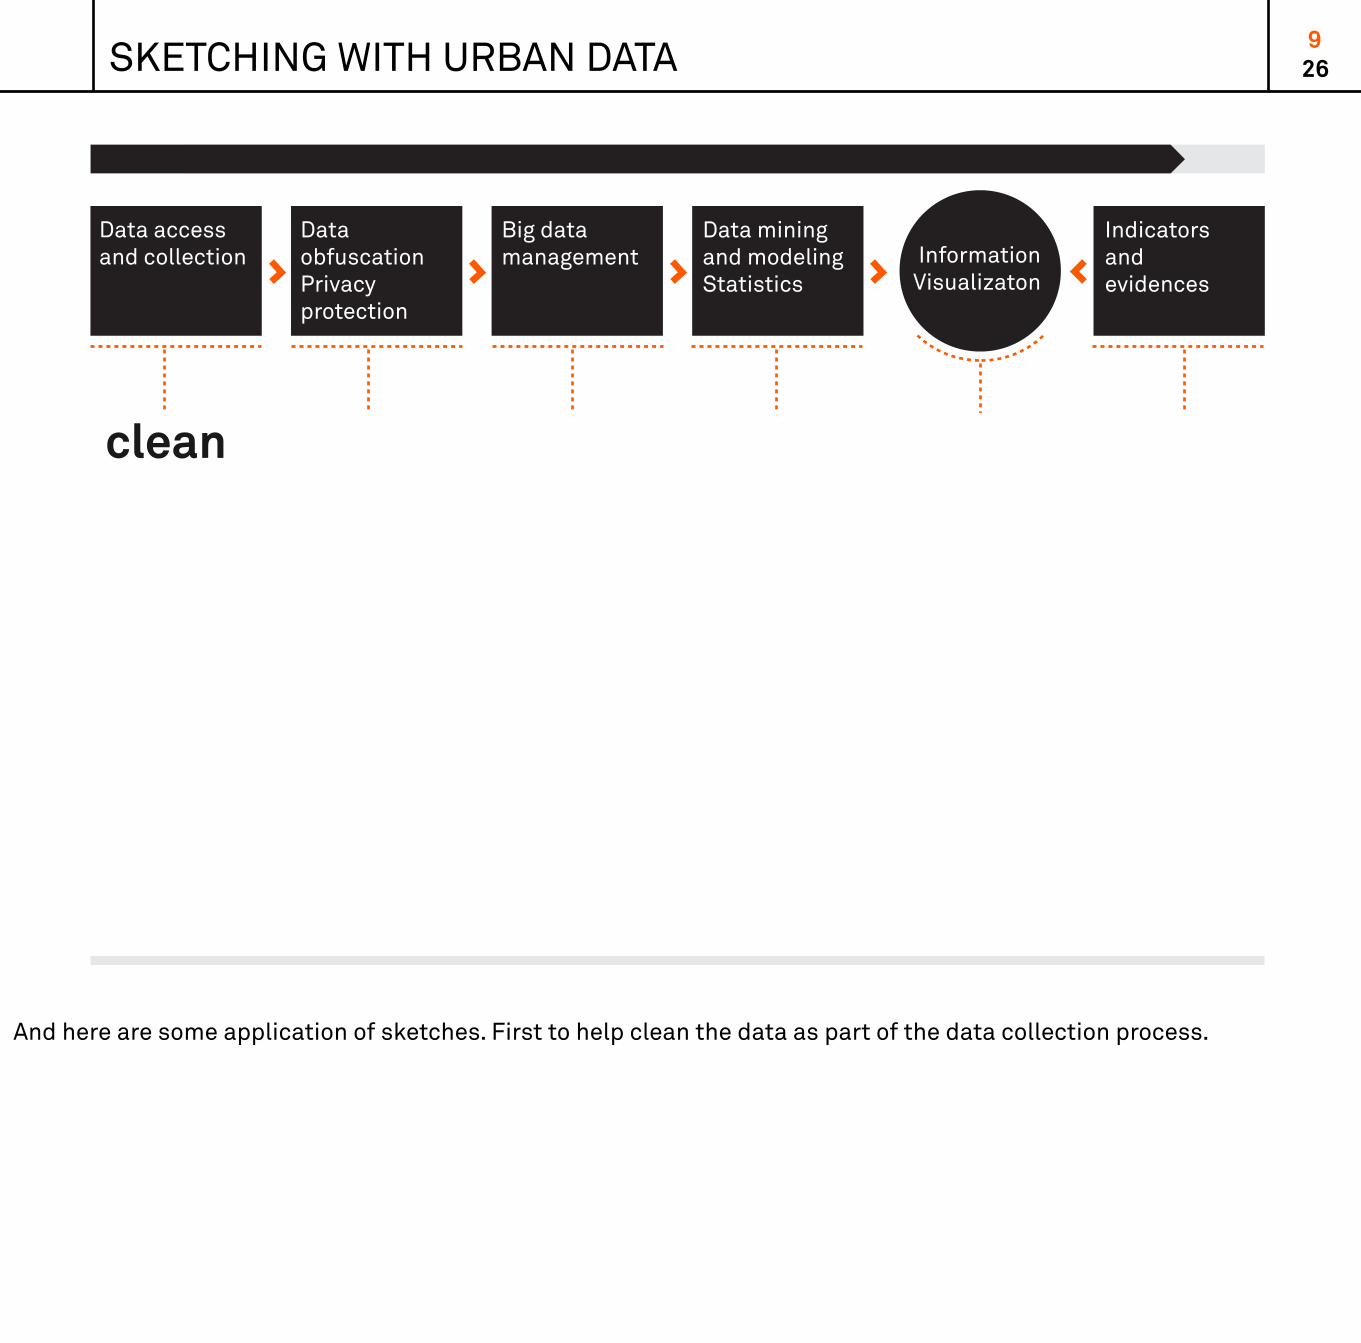
And here are some application of sketches. First to help clean the data as part of the data collection process.
Data scientists andamateurs
SKETCH TO CLEAN DATA 2610
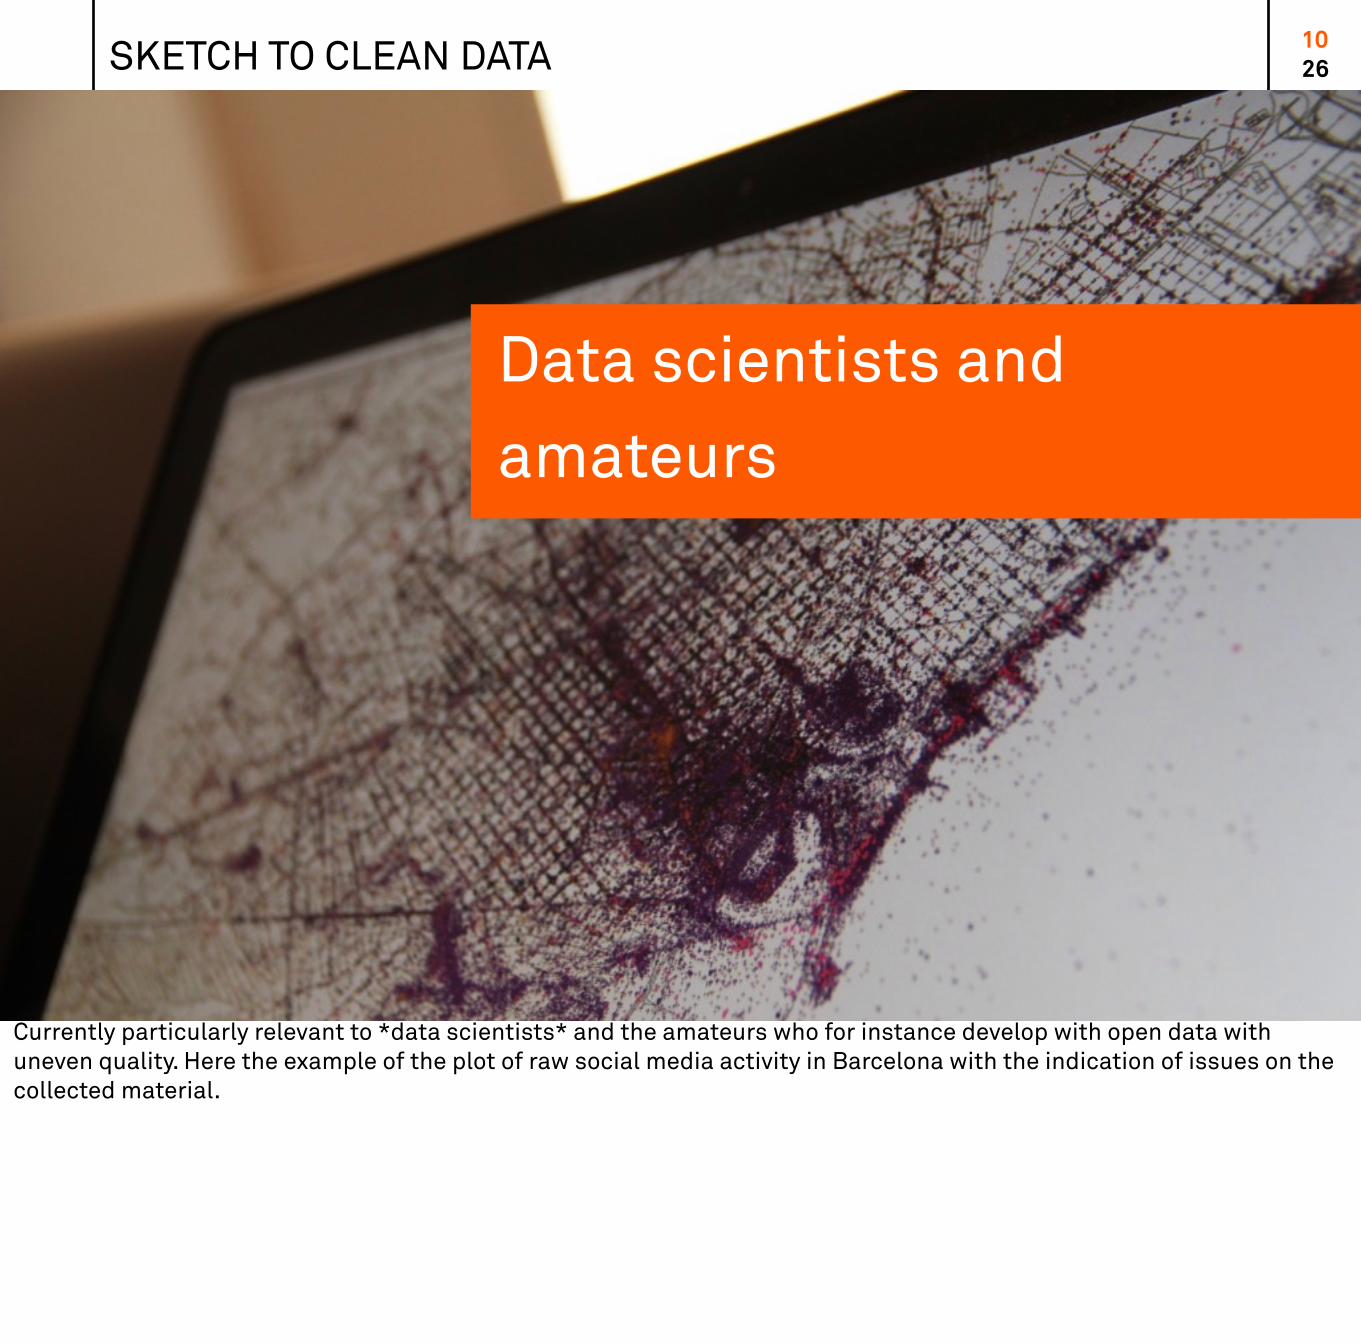
Currently particularly relevant to *data scientists* and the amateurs who for instance develop with open data with uneven quality. Here the example of the plot of raw social media activity in Barcelona with the indication of issues on the collected material.
SKETCHING WITH URBAN DATA 2611
100 %
75 %
50 %
25 %
0 %Telecom, software engineers, information architects
Physicists Statisticans Designers Planners, analysts
IEEE 802.11 XML PostGIS ArcGIS Impure Video editing
GSM Java Hadoop Processing KeynoteREST
Python RMysqlJSON
Data access and collection
Data obfuscationPrivacy protection
Big datamanagement
Data miningand modelingStatistics
InformationVisualizaton
Indicatorsandevidences
set common language
Sketching a visualization is helpful to set a common language among the different actors of the project on what the data really is and how it can be used
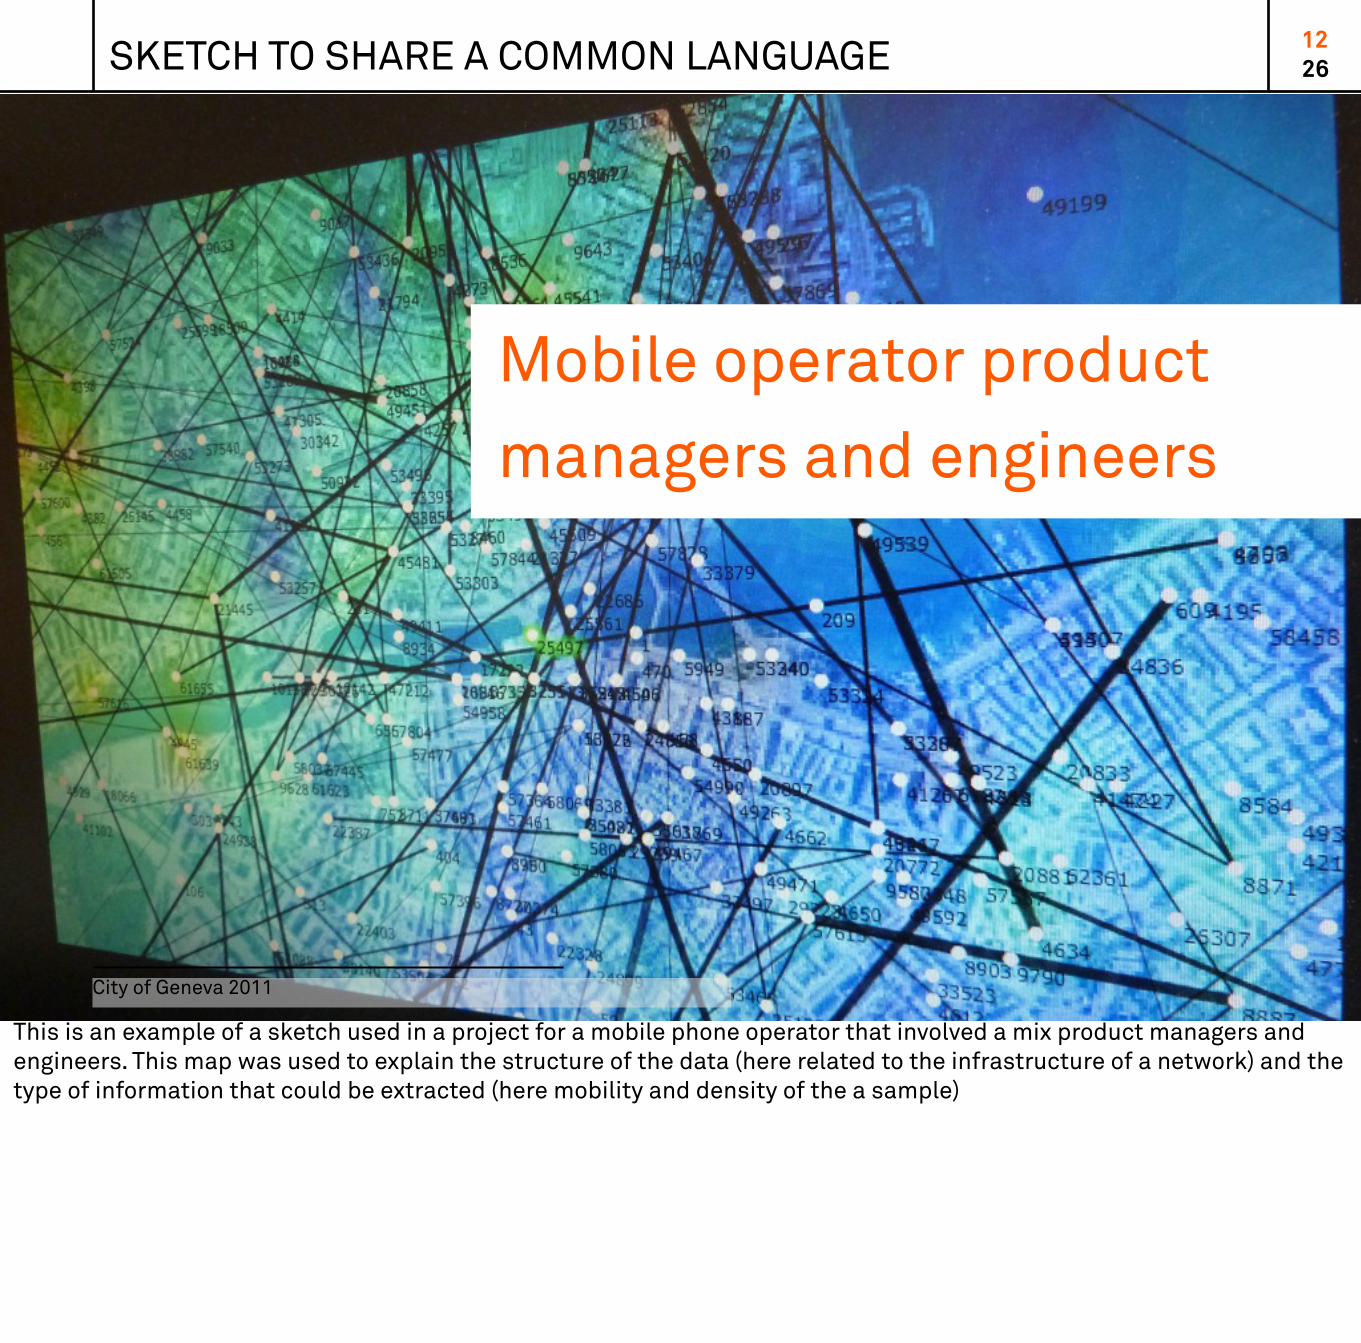
Mobile operator product managers and engineers
SKETCH TO SHARE A COMMON LANGUAGE 2612
City of Geneva 2011
This is an example of a sketch used in a project for a mobile phone operator that involved a mix product managers and engineers. This map was used to explain the structure of the data (here related to the infrastructure of a network) and the type of information that could be extracted (here mobility and density of the a sample)
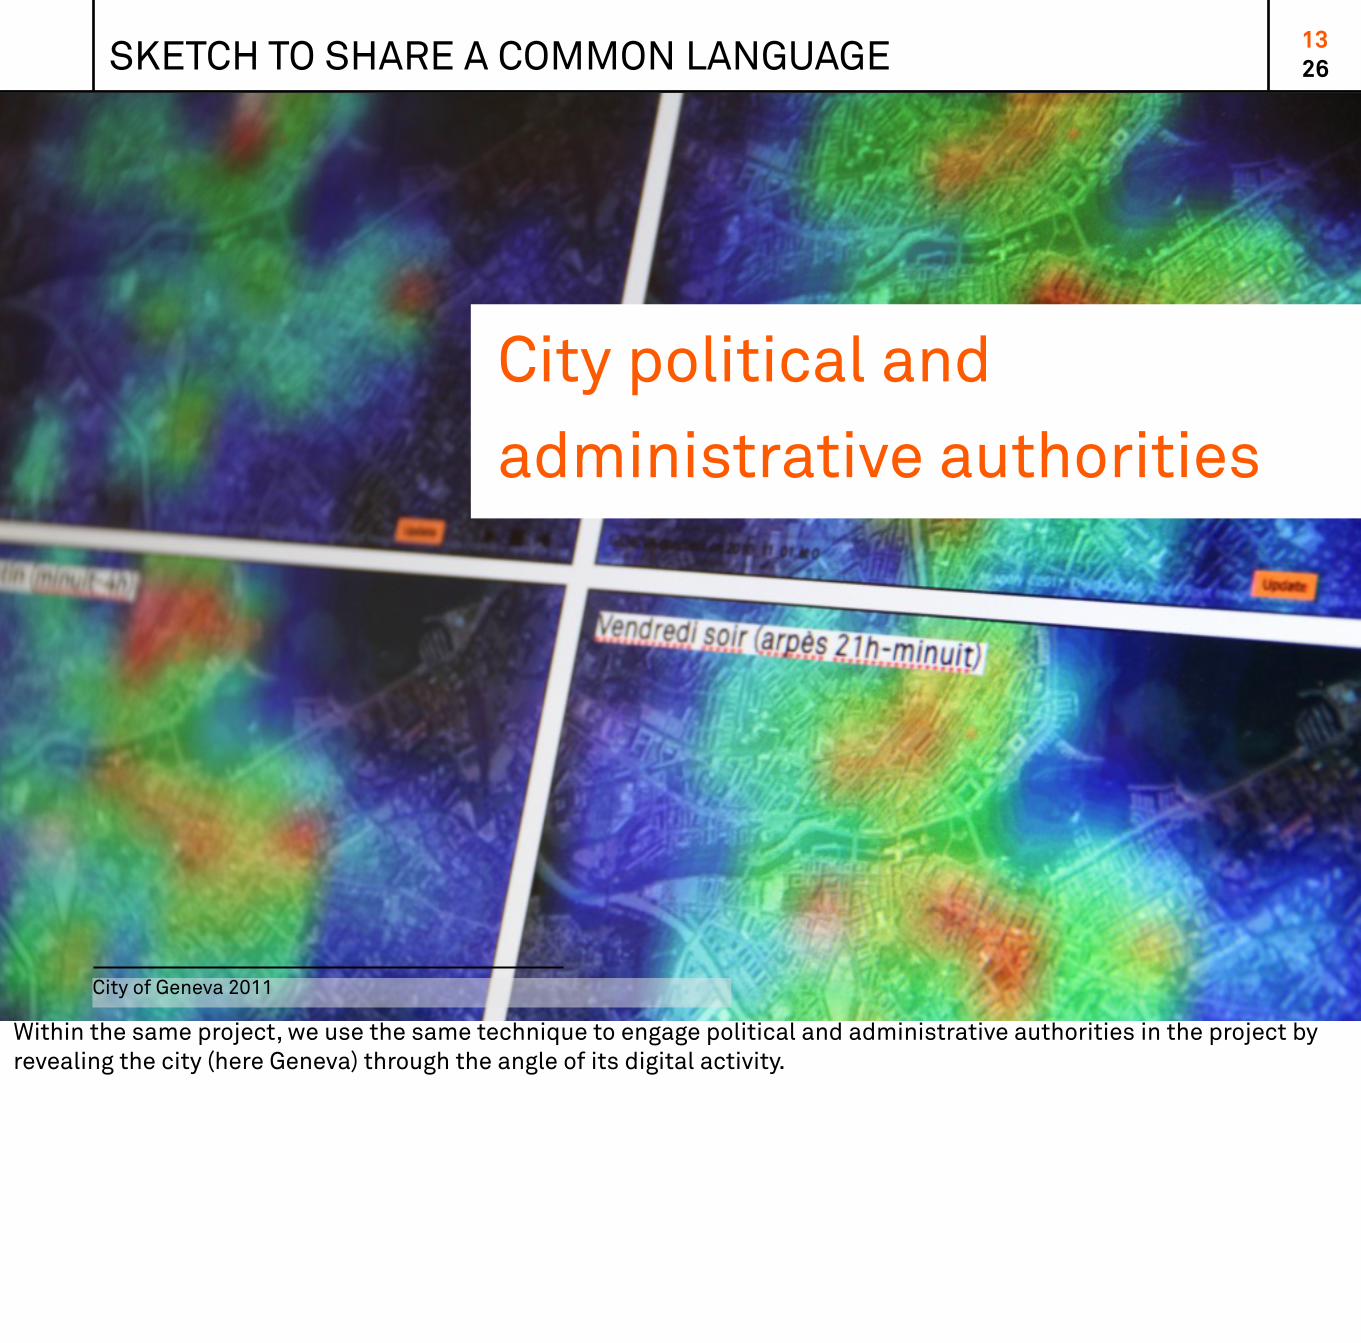
City political and administrative authorities
SKETCH TO SHARE A COMMON LANGUAGE 2613
City of Geneva 2011
Within the same project, we use the same technique to engage political and administrative authorities in the project by revealing the city (here Geneva) through the angle of its digital activity.
SKETCHING WITH URBAN DATA 2614
100 %
75 %
50 %
25 %
0 %Telecom, software engineers, information architects
Physicists Statisticans Designers Planners, analysts
IEEE 802.11 XML PostGIS ArcGIS Impure Video editing
GSM Java Hadoop Processing KeynoteREST
Python RMysqlJSON
Data access and collection
Data obfuscationPrivacy protection
Big datamanagement
Data miningand modelingStatistics
InformationVisualizaton
Indicatorsandevidences
qualify results
Sketches are key to qualify first results when measures and patterns are emerging.
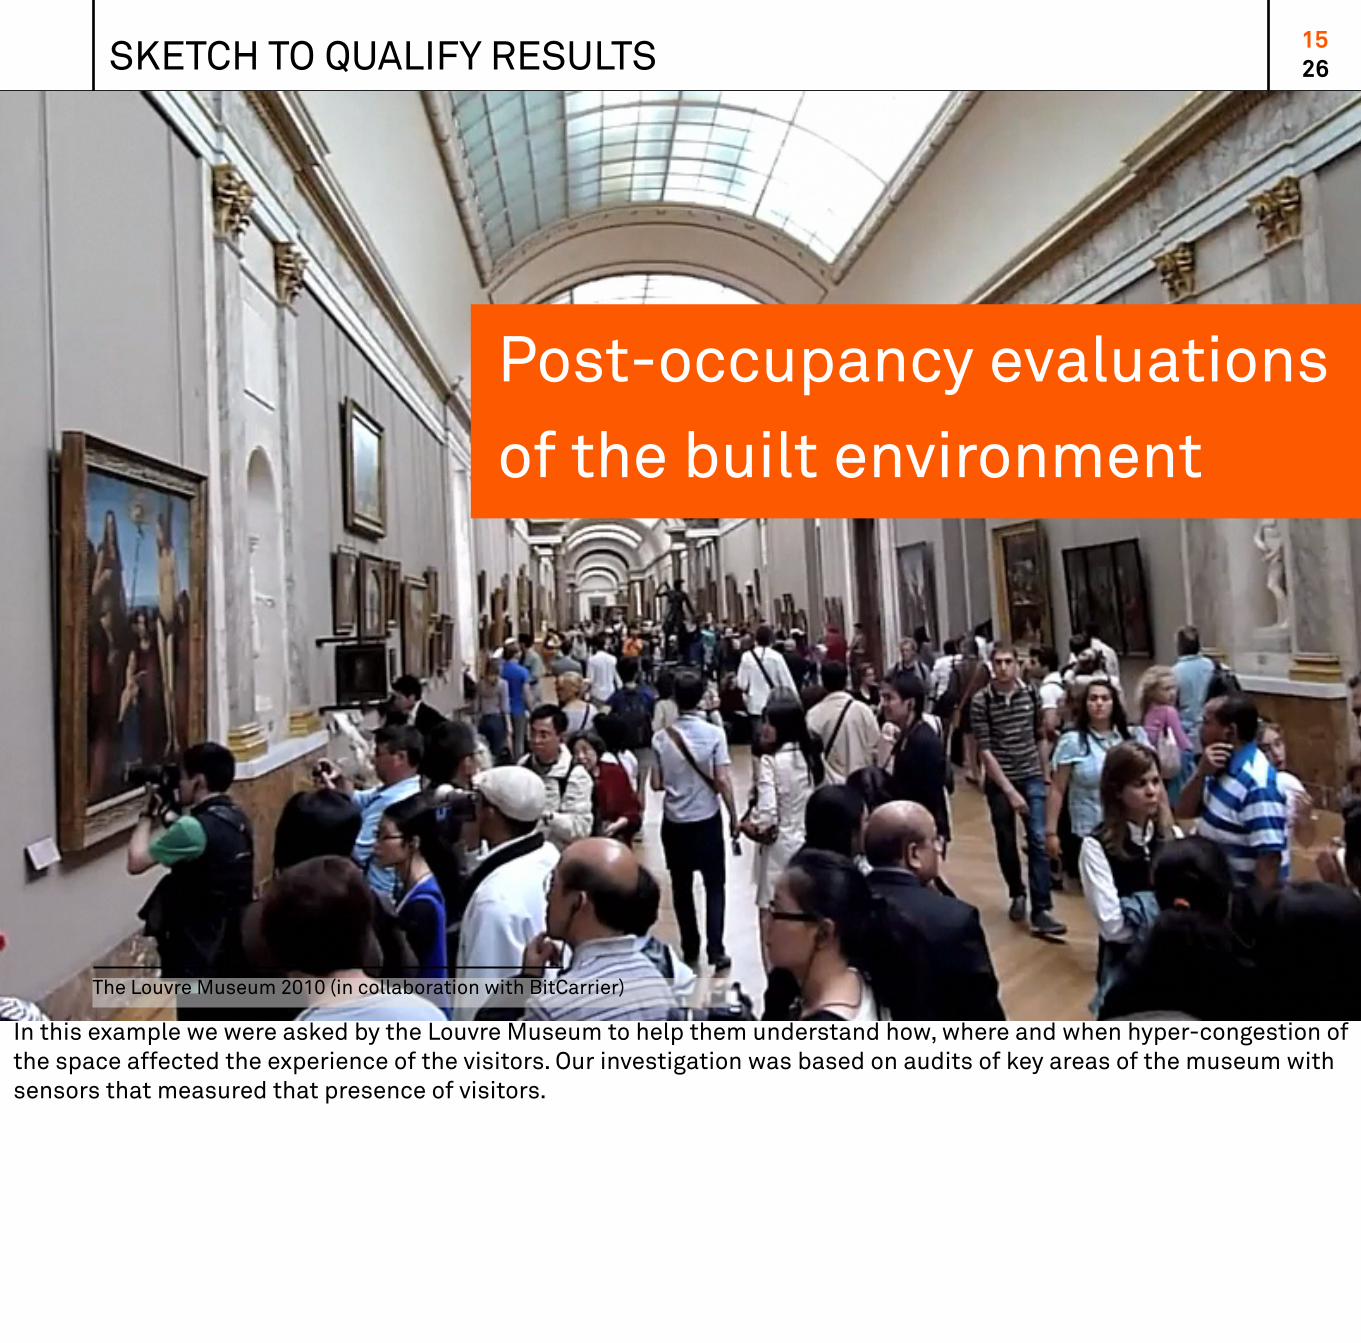
Post-occupancy evaluationsof the built environment
SKETCH TO QUALIFY RESULTS 2615
The Louvre Museum 2010 (in collaboration with BitCarrier)
In this example we were asked by the Louvre Museum to help them understand how, where and when hyper-congestion of the space affected the experience of the visitors. Our investigation was based on audits of key areas of the museum with sensors that measured that presence of visitors.
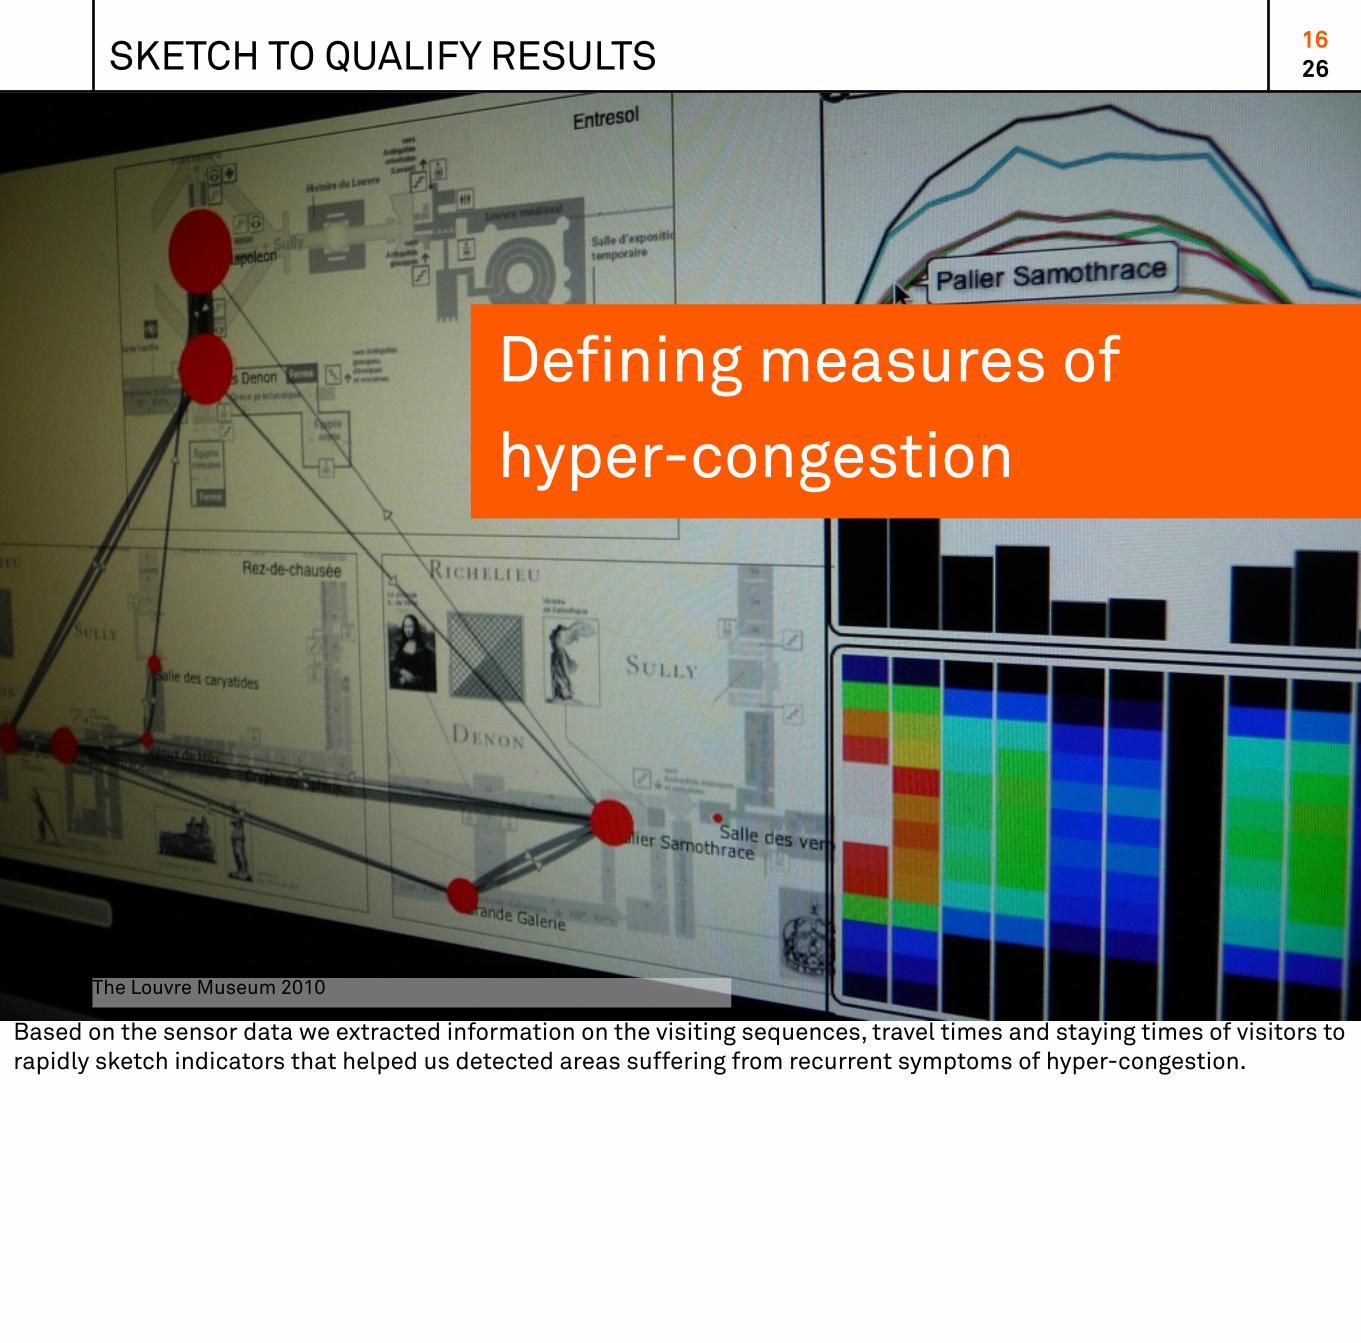
Defining measures ofhyper-congestion
SKETCH TO QUALIFY RESULTS 2616
The Louvre Museum 2010
Based on the sensor data we extracted information on the visiting sequences, travel times and staying times of visitors to rapidly sketch indicators that helped us detected areas suffering from recurrent symptoms of hyper-congestion.
SKETCH TO QUALIFY RESULTS 2617
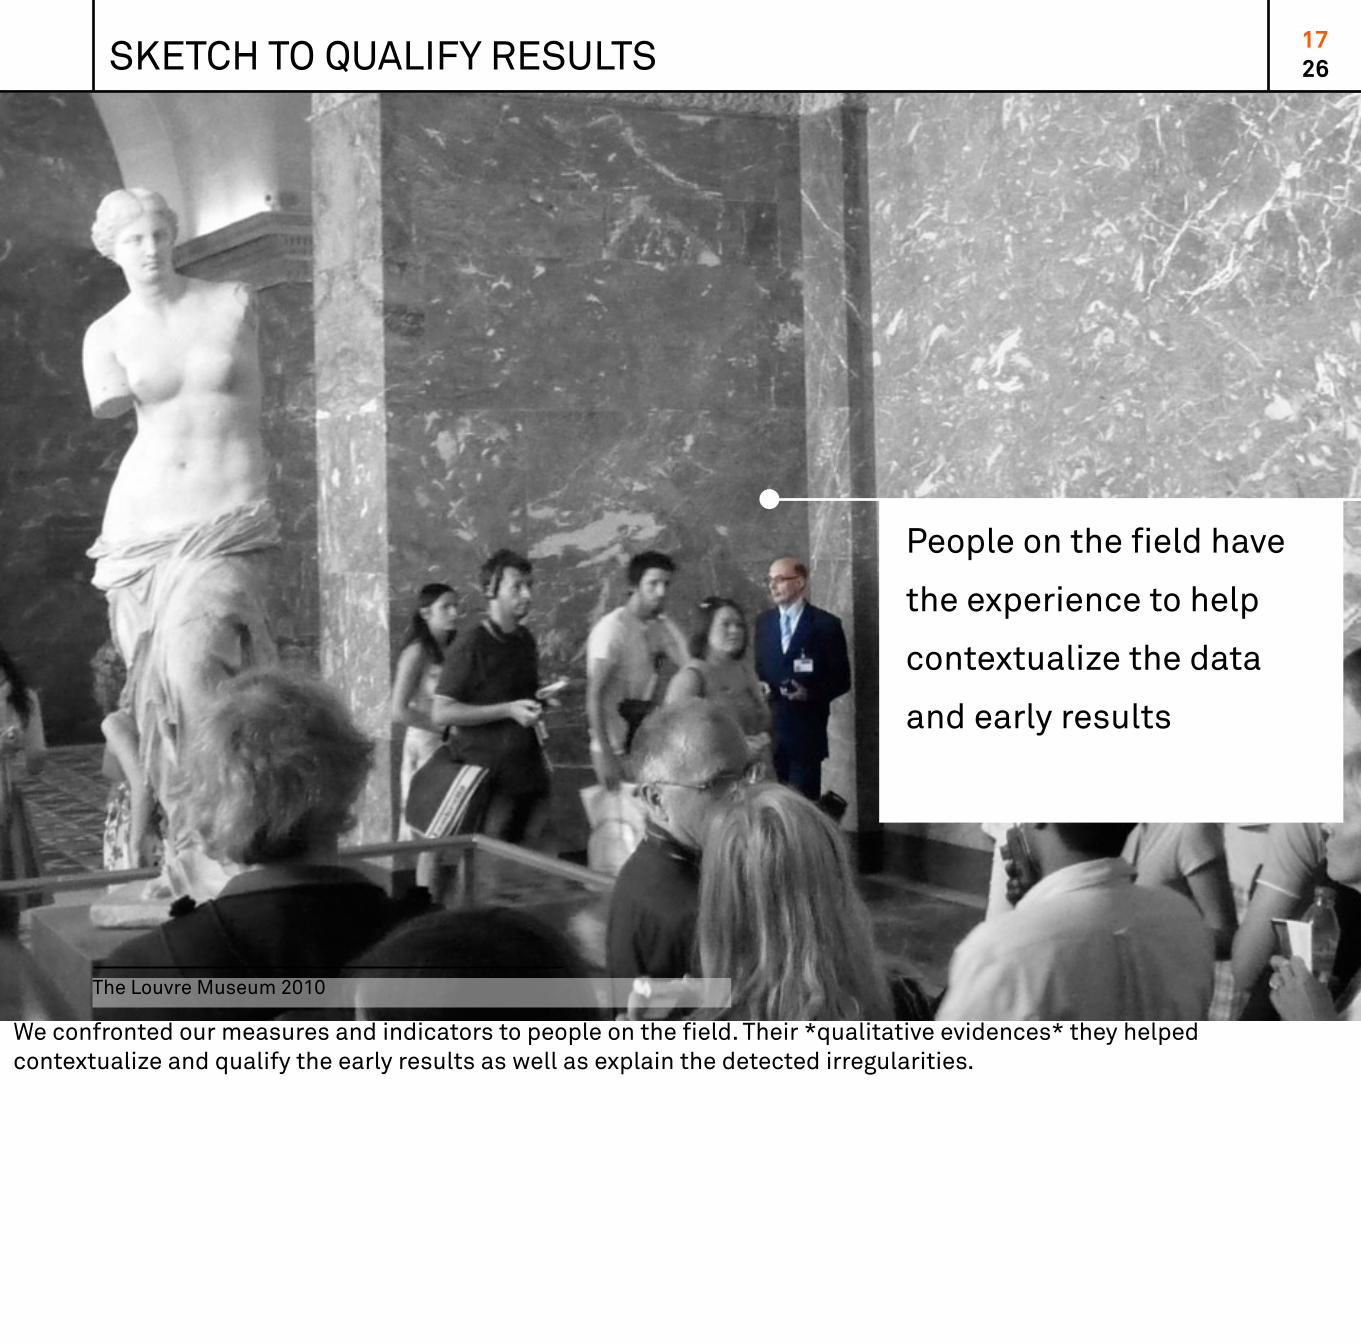
People on the field have
the experience to help
contextualize the data
and early results
The Louvre Museum 2010
We confronted our measures and indicators to people on the field. Their *qualitative evidences* they helped contextualize and qualify the early results as well as explain the detected irregularities.
SKETCHING WITH URBAN DATA 2618
100 %
75 %
50 %
25 %
0 %Telecom, software engineers, information architects
Physicists Statisticans Designers Planners, analysts
IEEE 802.11 XML PostGIS ArcGIS Impure Video editing
GSM Java Hadoop Processing KeynoteREST
Python RMysqlJSON
Data access and collection
Data obfuscationPrivacy protection
Big datamanagement
Data miningand modelingStatistics
InformationVisualizaton
Indicatorsandevidences
explore ideas
As in painting and drawing, sketching is used to explore ideas
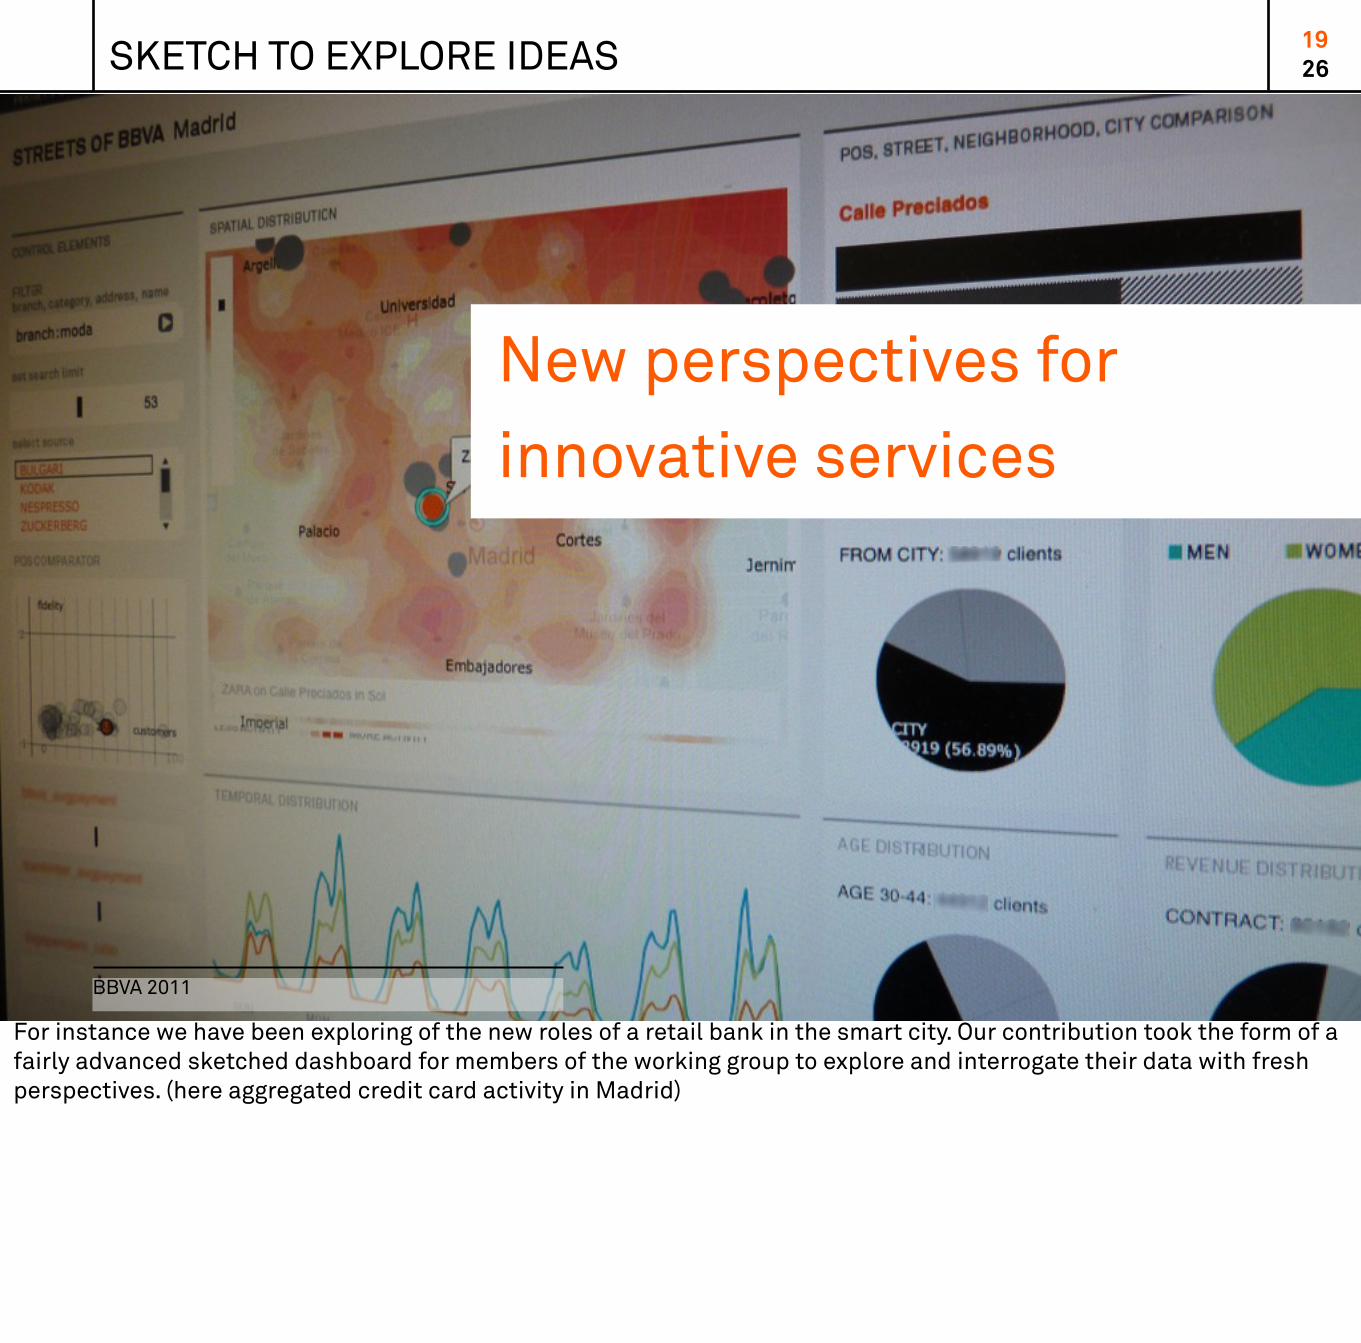
New perspectives forinnovative services
SKETCH TO EXPLORE IDEAS 2619
BBVA 2011
For instance we have been exploring of the new roles of a retail bank in the smart city. Our contribution took the form of a fairly advanced sketched dashboard for members of the working group to explore and interrogate their data with fresh perspectives. (here aggregated credit card activity in Madrid)
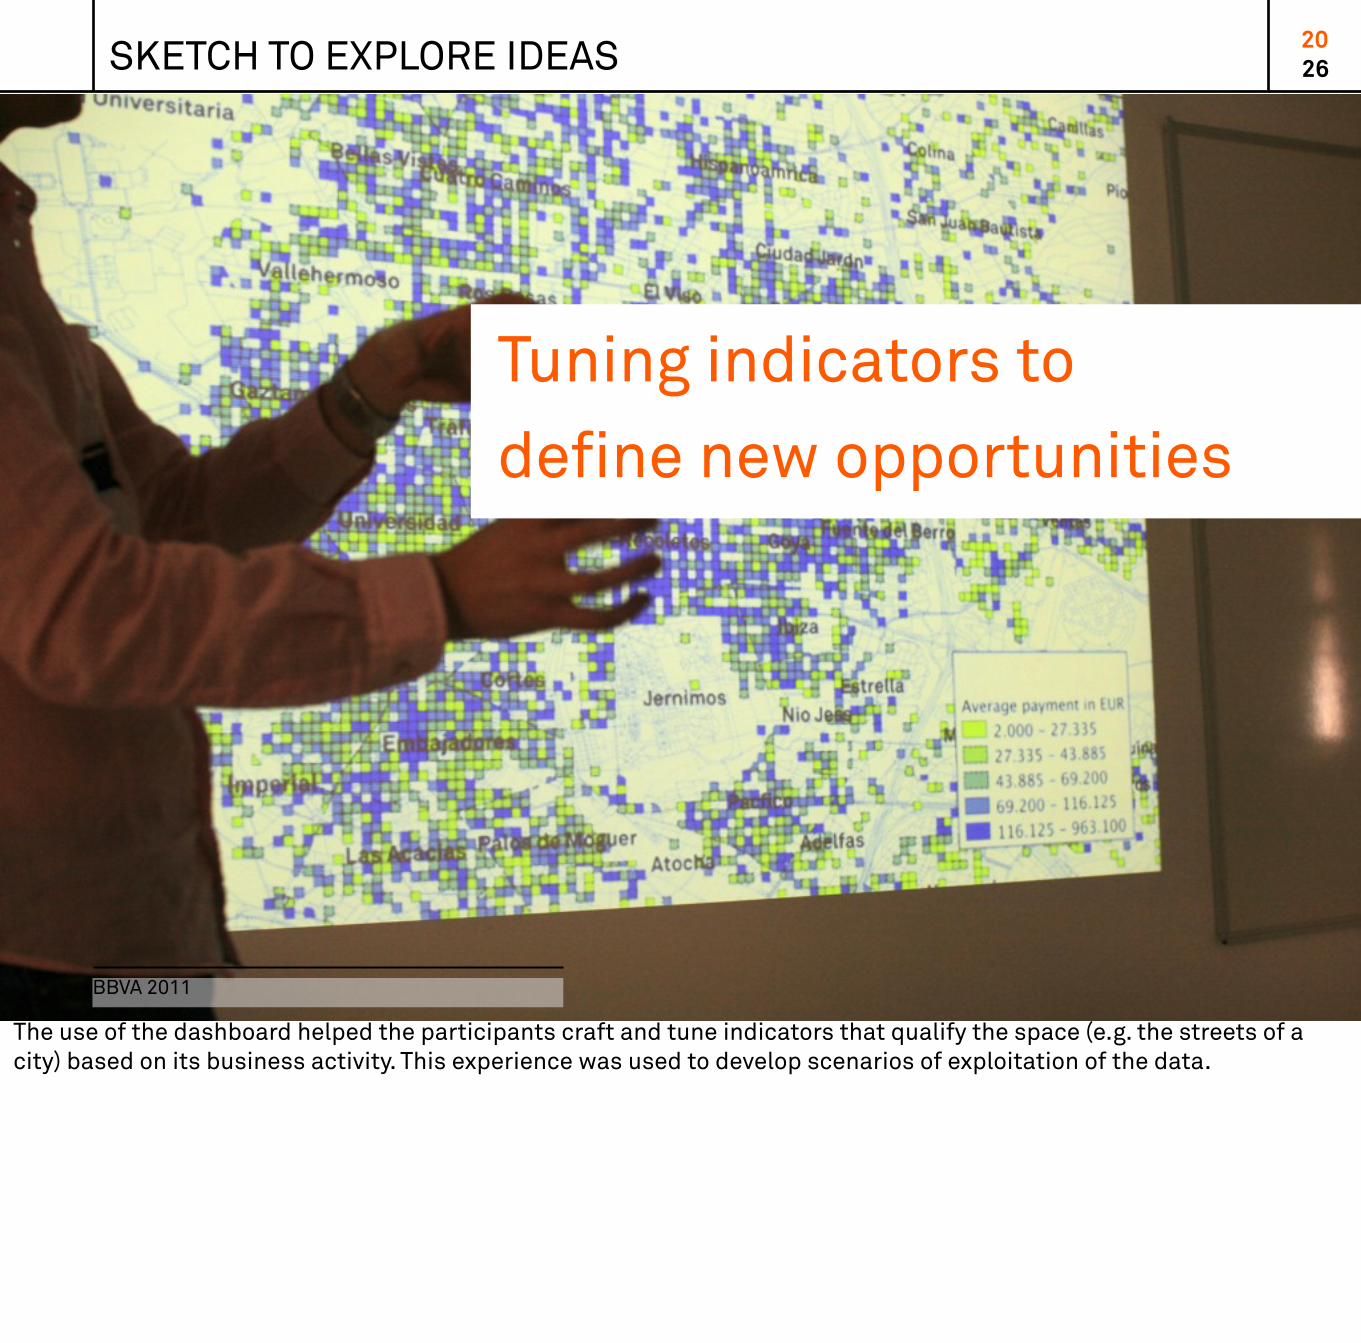
Tuning indicators todefine new opportunities
SKETCH TO EXPLORE IDEAS 2620
BBVA 2011
The use of the dashboard helped the participants craft and tune indicators that qualify the space (e.g. the streets of a city) based on its business activity. This experience was used to develop scenarios of exploitation of the data.

Tools built to find the questions that find the answers
TOOLS TO SKETCH WITH DATA 2621
The practice of sketching comes with a proper set of tools. The types of tools built to find the questions that find the answers. The types of tools with the same approach that led to the production of “Photo 51”, the 1953 X-ray diffraction photograph of a DNA molecule. This photo by researcher Rosalind Franklin, is the critical data which directly informed the first chemical model of DNA by James D. Watson and Francis Crick.
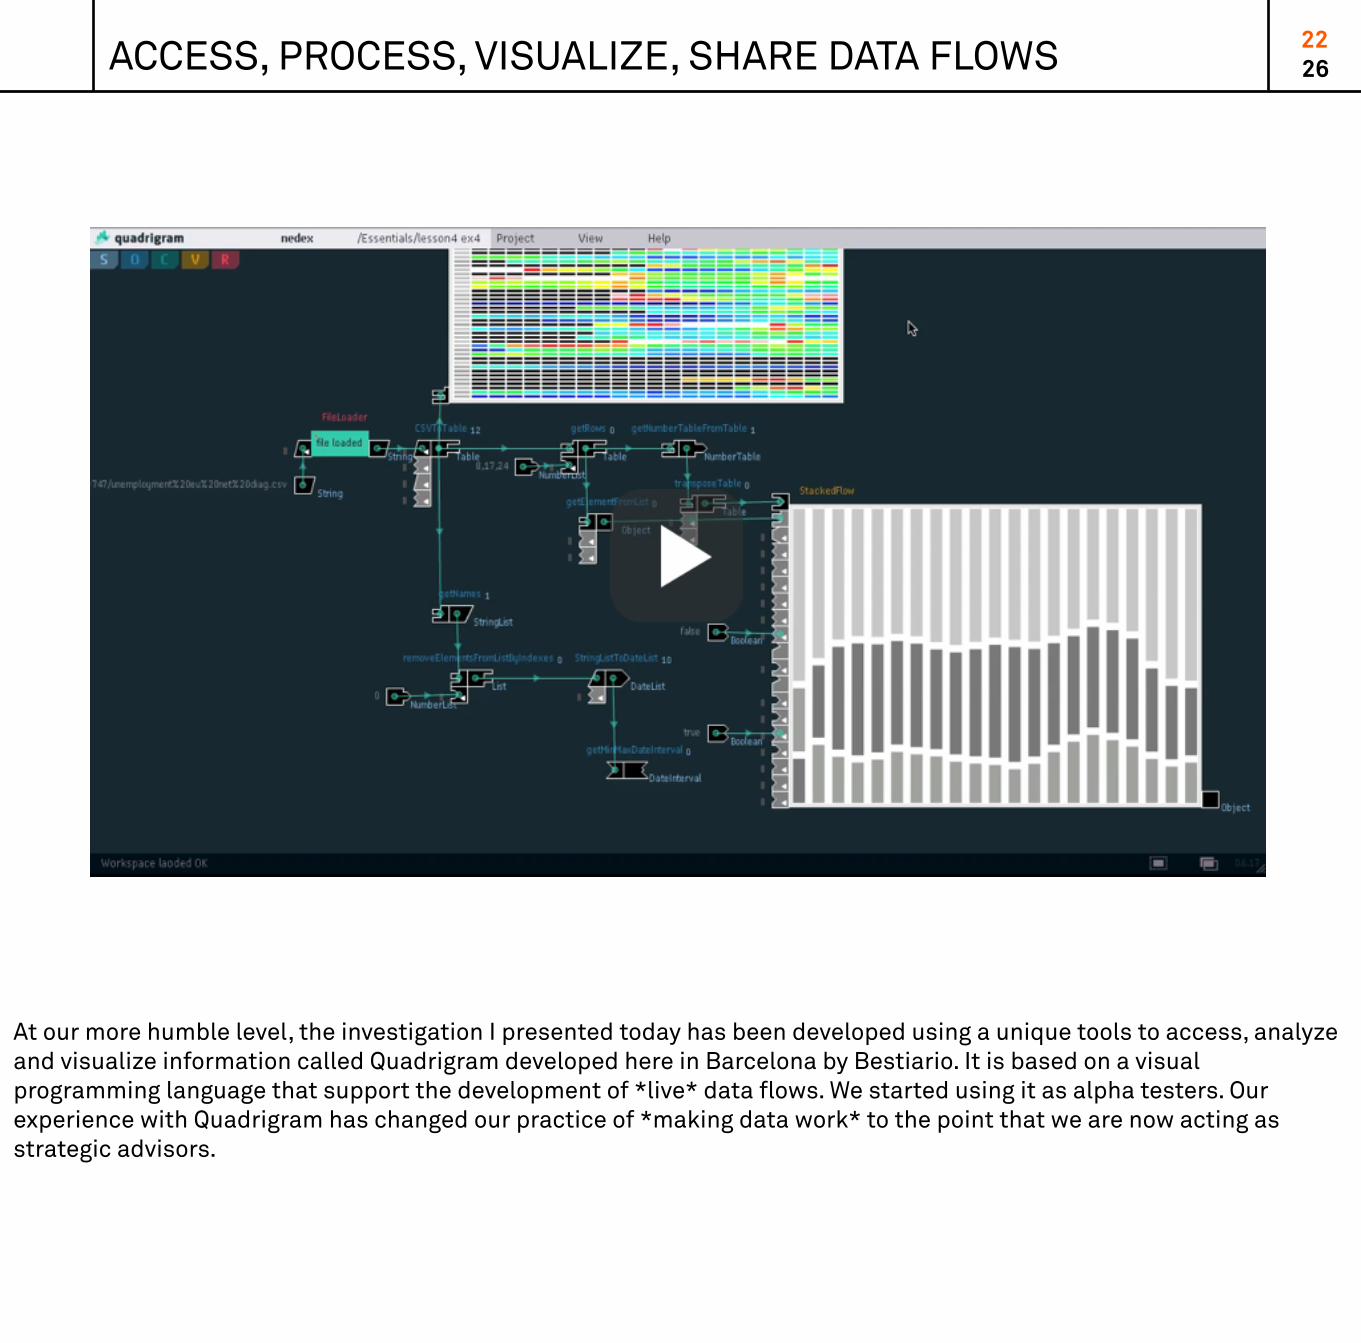
ACCESS, PROCESS, VISUALIZE, SHARE DATA FLOWS 2622
At our more humble level, the investigation I presented today has been developed using a unique tools to access, analyze and visualize information called Quadrigram developed here in Barcelona by Bestiario. It is based on a visual programming language that support the development of *live* data flows. We started using it as alpha testers. Our experience with Quadrigram has changed our practice of *making data work* to the point that we are now acting as strategic advisors.
QUADRIGRAM 2623
Quadrigram is currently in private beta but do not hesitate in contacting [email protected] is you have big data... that means big questions and big answers.
Cities are major sources and exploiters of big data.
We need better ideas of what this living material means.
Multiple actors and objectives along the innovation process.
New tools to embrace this evolution - try Quadrigram!
TAKE AWAYS 2624

FABIEN GIRARDIN
MERCI GRACIAS THANK YOU DANKE GRAZIE