six month report - hella
TRANSCRIPT

SIX MONTH REPORT FISCAL YEAR 2015/2016 1 JUNE – 30 NOVEMBER 2015

KEY PERFORMANCE INDICATORS
* Adjusted for non-recurring charges arising from the default of a supplier in China (€ 47 million) and the costs incurred in relation to voluntary partial and severance payment programme (€ 6 million). For further information on the adjusted non-recurring charges, please refer to the current and prior financial statements.
** Settlements for capital expenditure offset against cash proceeds from customer refunds.
Please note that where sums and percentages in the report have been rounded, differences may arise as a result of commercial rounding.
30 November 2015 30 November 2014
Net debt (in € million) 231 262
Net debt/EBITDA (last 12 months) 0.3 x 0.4 x
Equity ratio 38.4 % 36.0 %
Return on equity (last 12 months) 16.2 % 22.0 %
Employees 32,731 31,800
1st half-year 1 June to 30 November
2nd quarter1 September to 30 November
In € million 2015/2016 2014/2015 2015/2016 2014/2015
Sales 3,159 2,826 1,663 1,508Change compared to last year 12 % 6 % 10 % 7 %
Earnings before interest, taxes, depreciation and amortisation (EBITDA) 400 381 225 206Change compared to last year 5 % 18 % 9 % 12 %
Adjusted* earnings before interest, taxes, depreciation and amortisation (EBITDA)* 436 386 246 209Change compared to last year 13 % 14 % 17 % 9 %
Net operating profit/loss (EBIT) 203 221 134 127Change compared to last year – 8 % 29 % 6 % 16 %
Adjusted* net operating profit/loss (EBIT) 256 227 155 130Change compared to last year 13 % 21 % 19 % 10 %
Earnings for the period 131 151 88 88Change compared to last year – 13 % 39 % 1 % 22 %
Earnings per share (in €) 1.16 1.45 0.79 0.83Change compared to last year – 20 % 37 % – 5 % 19 %
Net cash flow from operating activities 301 180 110 1Change compared to last year 67 % – 13 % >100 % – 99 %
Net capital expenditure** 189 194 37 28Change compared to last year – 3 % 4 % 30 % – 45 %
Research and development (R&D) costs 291 269 152 152Change compared to last year 8 % 15 % 0 % 29 %
1st half-year 1 June to 30 November
2nd quarter1 September to 30 November
In € million 2015/2016 2014/2015 2015/2016 2014/2015
EBITDA margin 12.7 % 13.5 % 13.5 % 13.7 %
Adjusted* EBITDA margin 13.8 % 13.7 % 14.8 % 13.9 %
EBIT margin 6.4 % 7.8 % 8.1 % 8.4 %
Adjusted* EBIT margin 8.1 % 8.0 % 9.3 % 8.6 %
R&D expenses in relation to sales 9.2 % 9.5 % 9.1 % 10.1 %

HELLA Six Month Reportfor the fiscal year 2015/2016
2 HELLA ON THE CAPITAL MARKET
5 INTERIM GROUP STATUS REPORT
14 CONDENSED INTERIM CONSOLIDATED FINANCIAL STATEMENTS
14 Consolidated income statement 15 Consolidated statement of comprehensive income 16 Consolidated statement of financial position 17 Consolidated cash flow statement 18 Consolidated statement of changes in equity 20 Selected explanatory notes
30 REVIEW REPORT BY THE AUDITORS
31 DECLARATION
32 GLOSSARY

2 HELLA ON THE CAPITAL MARKET
HELLA ON THE CAPITAL MARKET
Volatile phase on the capital marketConcerns about future global economic development in the last few months, triggered by weaker Chinese economic data among other things, led to price declines on the capital markets in Sep-tember. It was also feared on the German capital market that the emissions affair in the automotive industry could significantly dampen the domestic economic climate. However, the negative effect of these economic indicators on market sentiment was short-lived, as the announcements made by the central banks (rate cut in China, Fed’s postponement of the anticipated inte-rest rate turnaround and the early signal from the ECB that it might extend the bond purchase programme in December) led to a strong countermovement from October onwards.
The leading German index DAX corrected to 9,325 points by the end of September and closed the period under review (Septem-ber to November) up approx. 11 % at 11,382 points. The MDAX consolidated to a lesser extent in percentage terms in Septem-ber and closed up 10 % in the quarter to 21,593 points as at 30 November.
HELLA share price performance falls short of market developmentThe HELLA share was subject to greater volatility during the period under review. It declined significantly on 18 September, triggered by the report about the default of a supplier in China and the resulting impact on earnings. This decline continued ini-tially in the days that followed on the back of the emissions affair and the negative implications for the sector, until the share
price bottomed out at around € 31. All in all, the share price fell by around 14 % in September, while the benchmark MDAX index only gave up around 2 % in this period.
The subsequent price recovery drove the HELLA share back to the price level seen at the start of the period under review. The share ended the period under review with a XETRA closing price of € 39.15 (as at 30 November 2015). This equates to an in -crease of around 4 % (6.3 % including dividend payments) during the period under review, while the MDAX as the relevant bench-mark index improved by almost 10 %.
The HELLA share was included in the MDAX, the key index of Deutsche Börse for medium-sized enterprises, as at 21 Sep-tember 2015. The share’s liquidity has recently increased further. The average daily XETRA trading volume in the period under review increased to around 185,000 shares (+ 40 % compared with Q1), whereby 18 September was defined by unusually high trading volume (approx. 2.1 million shares).
HELLA bonds suffer slight losses in declining marketsSector-specific news, especially within the scope of the emis-sions affair in September, also had repercussions for the German bond market, predominantly for issuers from the auto manu-facturing and automotive supplier sector. Market concerns that other companies could be affected led to lower bond prices in the entire automotive and automotive supplier sector and to spread widening. This development was tempered again (at least partially) by the end of the quarter, although the ripple

3HELLA ON THE CAPITAL MARKET
Initial stock market quotation 11 November 2014
Ticker symbol HLE
ISIN DE000A13SX22
SIN A13SX2
Share class No-par value ordinary bearer shares
Market segments Prime Standard (Frankfurt Stock Exchange) Regulated market (Luxembourg Stock Exchange)
Index MDAX
Nominal capital € 222,222,224
Number of shares issued 111,111,112 shares
Highest price in the second quarter € 39.15 per share
Lowest price in the second quarter € 31.13 per share
Average daily trading volume 185,000 shares
Average daily trading volume € 6.49 million
Closing price on 30 November 2015 € 39.15 per share
Market capitalisation on 30 November 2015 € 4,350.00 million
HELLA bonds – development of the Z-spreads
0
20
40
60
80
100
120
140
160
180
2.375 % UNTIL 2020 1.250 % UNTIL 2017 iBoxx EUR Non-Fin Corps BBB
1 Sep 2015 8 Sep 2015 15 Sep 2015 22 Sep 2015 29 Sep 2015 6 Oct 2015 13 Oct 2015 20 Oct 2015 27 Oct 2015 3 Nov 2015 10 Nov 2015 17 Nov 2015 24 Nov 2015 30 Nov 2015
The HELLA share – price development in the period under review compared to selected indices (indexed on 1 September 2015)120
115
110
105
100
95
90
85
80
75
HELLA MDAX SDAX
1 Sep 2015 8 Sep 2015 15 Sep 2015 22 Sep 2015 29 Sep 2015 6 Oct 2015 13 Oct 2015 20 Oct 2015 27 Oct 2015 3 Nov 2015 10 Nov 2015 17 Nov 2015 24 Nov 2015 30 Nov 2015
All trading information relates to XETRA.

4 HELLA ON THE CAPITAL MARKET
effects are still apparent on the market. As a consequence of these developments, the Z-spreads (measured in basis points over the euro mid-swap reference rate) of the two HELLA bonds rose by an average of around 50 basis points by the start of October. The spreads subsequently tightened again and, at 91 basis points for the 2.375 % bond and 68 basis points for the 1.250 % bond at the end of the quarter as at 30 November, were roughly 20 basis points above the level seen at the start of the quarter (1 September 2015).
Investor RelationsThe IR team continued to engage in continuous dialogue with investors, analysts and its private shareholders in the second quar-ter of the fiscal year 2015/2016. In September, the investor confe-rences “Fourth German Conference” held by Goldman Sachs/Behrenberg Bank in Munich and Deutsche Bank’s “db Access IAA Cars” within the scope of the IAA international motor show were used for holding investor discussions. Numerous investors and analysts also availed themselves of HELLA’s debut in the IAA’s “New Mobility World” to obtain information. The roadshow activi-ties in the second quarter focused on the US, where international investors were visited in New York and Boston.
Besides the planned events, investors and analysts were able to exchange views in the last quarter within the scope of numerous group appointments or individual discussions held at the Group
head office in Lippstadt, as well as in numerous telephone appointments with the IR team and management.
One week before the figures for the first quarter were published, an extraordinary investor teleconference was held on 18 Sep-tember against the background of the non-recurring charges arising from the loss of a Chinese supplier. All interested ana-lysts and investors were informed extensively about the circum-stances surrounding the event.
The first annual general meeting after the public listing was held at the factory premises in Lippstadt on 25 September 2015. More than 500 shareholders participated in the event.
The capital market remains very interested in HELLA as a com-pany. An up-to-date list of brokers and their recommendations for the share can be viewed in the Investor Relations section of the website at www.hella.de/ir.
Shareholder structure Following the placement in May 2015, the free float of the HELLA share remains unchanged at 27.7 %. The family shareholders are the largest shareholder group, accounting for around 72 % of HELLA shares. The rest of the shares are owned by institutional investors and also by private shareholders. In the period under review, none of these held reportable shareholdings.
Free floatFamily shareholders (not pool-bound) Family shareholders (pool-bound)*
Shareholder structure
12.3 %
60.0 %
27.7 %
* 60 percent of the shares are subject to a pool agreement until 2024.

5INTERIM GROUP STATUS REPORT
Economic report
General economic conditionsIn the first six months of HELLA’s fiscal year 2015/2016 (June 2015 to November 2015) the global economy continued its muted performance. According to the IMF, six years on from the economic and financial crisis global growth remains unstable and shows little momentum, with pronounced regional differen-ces. The industrialised nations reported stronger short-term growth in the second quarter of HELLA’s fiscal year and are, according to the IMF, on a recovery path. Moreover, growth rates in Japan turned positive for the first time. By contrast, growth rates in the emerging markets continued to decline, also as a result of the low commodity prices the world over. Growth in China, which plays an important role for the global economy, slowed down although the government has reaffirmed its growth target of 7 %. Lower prices for oil and commodities, which fell further in November following a temporary phase of stabilisation, helped support growth in the industrialised coun-tries, in particular. Then again, uncertainties and concerns about the growth policy in China weighed on the climate for invest-ment, resulting in the postponement of long-term investment projects and a declining propensity to invest. The expected turn-around in the interest rate policy of the US Federal Reserve (FED) and the resultant uncertainty about the trend of global financial flows constitute a further global growth risk which weighs particularly on the emerging markets via exchange rates and the flows of capital required.
Economic growth in the automotive sectorGlobal passenger car unit sales recorded an overall good per-formance in the first 11 months of 2015. The main growth dri-vers of this trend were the USA, Western Europe and China. By contrast, the negative development of the Russian and Brazilian vehicle markets continued.
In the USA, new registrations of light vehicles rose by 5 % to a total of 15.8 million units so far in the 2015 calendar year (Janu-ary to November). While demand for light trucks remained high with a rise of 12 %, demand for passenger cars declined slightly (– 2 %). The US recorded growth of around 10 % in the second quarter of the fiscal year compared to the prior year’s quarter.
New vehicle registrations in Western Europe recorded an increase of 8 % to 12.1 million vehicles between January and November. All in all, the Western European market grew by some 8 % to a good 3.4 million new vehicles in the second quarter of the fiscal year.
Following considerable fluctuations in growth since the beginning of the year, from January to November China recorded growth in the upper single-digit percentage range with 8 % and approxi-mately 17.7 million new registrations. In the second quarter of the fiscal year, the Chinese automotive market returned to double-digit percentage growth (15.1 %) for the first time in a while. This development is mainly due to government incentives such as tax concessions granted since the beginning of the fourth quarter of the year for new cars with an engine size of up to 1.6 litres.
INTERIM GROUP STATUS REPORTfor the first six months of the fiscal year 2015/2016

6 INTERIM GROUP STATUS REPORT
HELLA Group sales (in € million) for the first six months of 2015/2016
201 3/20142014/ 20152015/ 2016 3,159
2,6642,826
The Indian vehicle market has grown by a good 8 % to 2.5 mil-lion new registrations so far this year. By contrast, the decline of the Russian and Brazilian vehicle markets continued unabated. Both nations also experienced double-digit percentage drops in the light vehicle market. Thus Russia fell 35 % below the prior year’s level in the period from January to November and Brazil 24 % below.
Business development and situation of the GroupGrowth after six months of 11.8 %The growth course of the HELLA Group continued in the second quarter of the fiscal year 2015/2016. With an increase of 10.3 % over the prior year’s quarter, consolidated sales during the period from September to November came to € 1.7 billion. The pace of growth declined slightly when compared with the first quarter.
Compared to the prior year, sales in the first half of the fiscal year 2015/2016 increased by € 333 million to € 3.2 billion, equi-valent to an increase of 11.8 %. Changes in the exchange rates of the US dollar and the Chinese yuan, in particular, contributed 3.1 percentage points to this trend. At the end of the first quarter exchange-rate-related growth stood at 4 percentage points. The market outperformance of HELLA Group’s sales when com-pared with global new registrations and sales of both passenger vehicles and light vehicles was around 9 percentage points in the first six months of the fiscal year.
The Automotive segment remained a driver of growth by ser-ving automotive megatrends, such as energy efficiency (CO2 reduction), safety and styling (LED). Despite declining initial registrations on the Chinese automotive market in the first quarter of the fiscal year, the growth trend continued in the second quarter thanks to solid demand in Europe and America and increased demand in China. The Automotive business with third-party companies thus continued to report strong growth in the first half of the year. The Aftermarket segment made up sig-nificant ground on the very weak demand recorded in the prior half-year.
Results of operationsAdjusted earnings up 13 % in the first half of the yearNet operating profit/loss in the second quarter increased by € 7 million to € 134 million when compared with the prior year. This equates to a margin of 8.1 % compared to 8.4 % in the prior year. The result includes additional charges of € 18 million arising from the reported supplier default in China as well as restructuring expenses of € 3 million (prior year: € 3 million). Earnings adjusted for these charges were € 155 million in the second quarter and therefore € 25 million over the prior year’s quarter. The adjusted EBIT margin rose by 0.7 percentage points from 8.6 % to 9.3 %.
Earnings of the first half-year were significantly weighed down by additional expenses in connection with the supplier default in China. The resultant expense came to € 47 million in the first

7INTERIM GROUP STATUS REPORT
half of the year and has thus essentially been absorbed. The measures introduced have stabilised the supply chain. Further-more, around € 6 million were spent on restructuring measures in the period under review (prior year: € 5 million). Because of the aforementioned charges, net operating profit/loss (EBIT) in the first half-year fell by € 18 million to € 203 million when com-pared to the prior year. The EBIT margin therefore came to 6.4 %. Adjusted earnings without the one-time charges rose by 13 % from € 227 million in the prior year to € 256 million. The adjusted EBIT margin increased by 0.1 percentage points, from 8.0 % to 8.1 %.
Gross profit in the second quarter grew from € 423 million in the prior year’s quarter to € 459 million. In relation to sales a margin of 27.6 % was realised, compared to 28.0 % in the prior year.
As in the first quarter, the good result of the first half-year is essentially due to the positive performance of gross profit al -though the latter was adversely affected to a considerable extent
by an additional expense of € 27 million (0.9 % of sales) resulting from the default of a Chinese supplier. Nevertheless, growth of € 61 million to € 834 million along with a gross profit margin of 26.4 % (prior year: 27.3 %) was realised. This performance is based on volume effects and steady productivity growth in the Automotive segment. By contrast, the additional start-up costs of new products exerted a negative impact. Measures are being steadily taken in connection with active currency management to provide protection against exchange rate fluctuations. The expenses and income resulting from operational exchange rate hedging are included in the cost of sales.
Research and Development at HELLA remains the basis of technological competence and competitiveness, as it has been in the past. At € 152 million, the associated expenses were roughly in line with the prior year level. In relation to sales their share fell to 9.1 %, compared to 10.1 % in the prior year. The prior year’s costs were, however, substantially higher due to the effects of shifting between the first and the second quarter.
Earnings before interest and income taxes (EBIT; in € million) for the first six months of 2015/2016
201 3/20142014/ 20152015/ 2016 203
171221
Research and development
First half of2015/2016 +/–
First half of 2014/2015
R & D employees 6,181 5 % 5,897
EXPENSES IN € MILLION
Automotive 275 9 % 252
Aftermarket and Special Applications 16 – 5 % 17
Total 291 8 % 269in % of sales 9.2 9.5

8 INTERIM GROUP STATUS REPORT
On a cumulative basis, research and development costs in the first half of the fiscal year increased by 8.3 % to € 291 million (prior year: € 269 million). Their share of sales decreased from 9.5 % in the prior year to 9.2 %.
Distribution costs during the period from September to Novem-ber 2015 grew by € 10 million to € 125 million compared with the prior year. The distribution cost ratio declined by 0.1 percen-tage points to 7.5 % of sales.
So far this fiscal year, distribution costs of € 244 million have been incurred, equivalent to an increase of € 22 million or 9.7 %. Thanks to a disproportionately small rise in costs, distribution costs in relation to sales were reduced by 0.1 percentage points to 7.7 % compared to the prior year’s period. Distribution costs include the cost of the international sales organisation of the Automotive segment and of the network of dealers but also the outbound freight costs to supply our customers.
Administrative costs rose by € 3 million to € 51 million in the second quarter. In relation to sales the percentage decreased by 0.1 percentage points to 3.1 %.
Administrative costs rose from € 95 million to € 103 million in the first half of the year. Measured in terms of sales the ratio fell from 3.4 % to 3.3 %.
The result of other expenses and income fell by more than € 18 million in the second quarter, from € + 5 million to € – 14 million.
This figure includes additional expenses of € 14 million in con-nection with the default of a supplier in China.
In the first half of the year the balance of other expenses and income fell from € + 6 million in the prior year to € – 17 million. Of this figure, an additional expense of € 20 million resulted from the default of a Chinese supplier.
Income from the strategic network of joint ventures and other associates in the second quarter grew by € 2 million to € 17 million compared to the prior year’s quarter.
At € 25 million, income in the first half of the year was slightly down on the corresponding prior year’s figure of € 28 million, due to the sales trend in Korea in the first quarter and special items such as additional tax expense.
Compared to the second quarter of the prior year, net financial expense fell by € 3 million. This trend is also evident in a cumu-lative analysis. Thus net financial expense declined from € 24 million in the first half of the prior year to € 18 million this year. Financial expense was reduced on a sustained basis through the repayment of a high-interest financial liability in the first half of the prior fiscal year.
After taxes on income of € 37 million (prior year: € 27 million) the net surplus for the period was € 88 million, same as in the prior year. This equates to a return on sales of 5.3 % compared to 5.8 % in the prior year.
Regional market coverage by end consumers for the first six months of 2015/2016
28 % 14 %
20 % 38 %
Germany € 450 millionRest of Europe € 1,190 millionNorth and South America € 628 millionAsia/Pacific/RoW € 891 million
9INTERIM GROUP STATUS REPORT
In the first half of the current fiscal year HELLA generated a net profit of € 131 million after taxes on income of € 52 million, or € 46 million in the prior year. Compared with the first half of the prior fiscal year this corresponds to a decline of € 19 million. In relation to sales this corresponds to 4.2 %, down from 5.4 % in the prior year.
Results of operations of the segmentsGrowth trend of Automotive and Aftermarket continuesIn the second quarter the Automotive business recorded seg-ment sales growth of 3 % to € 1.3 million, primarily due to a reduction in inter-segment sales. Sales with third-party compa-nies rose by 10 % on the prior year’s quarter. As a result, an ope-rating result of € 109 million was generated along with an EBIT margin of 8.6 %.
In the first half of the year the broad regional footprint continued to have a positive effect. Because HELLA’s presence in countries such as India and Brazil is very limited and activities in the Auto-motive segment in Russia play only a minor role, the weakness of the general economic conditions in these regions has no materially negative impact on the segment’s business perfor-mance. Segment sales rose by € 145 million to € 2.4 billion. The modest rise can also be explained by the sharp decline in sales with other segments. Sales with third-party companies rose by 12.4 % compared with the prior year. The market outperfor-mance of sales in the Automotive segment when compared with global new registrations and sales of passenger vehicles and light vehicles, was more than 9 percentage points in the first half of the fiscal year.
An EBIT of € 157 million was generated in the Automotive seg-ment along with a margin of 6.5 %. This equates to a decline of 28 % compared to the prior year. The decrease is connected with the default of a Chinese supplier, which entailed a one-off charge amounting to € 47 million. Without this charge, the EBIT margin would have come to 8.5 %, after 8.2 % in the prior year. Despite additional expense for the start-up of production of complex products with LED technology in Eastern Europe and China, net operating profit/loss continued to rise.
The Aftermarket segment continued on its growth path in the second quarter relative to the prior year with a € 18 million or 6 % increase in segment sales to € 317 million. A net operating profit/loss of € 21 million was generated in the second quarter along with an EBIT margin of 6.5 %.
In the first half of the year the Aftermarket segment offset the substantial demand weakness of the same period in the prior year. Sales grew by 8 % to € 623 million. Net operating profit/loss increased by € 5 million to € 38 million. In relation to sales a margin of 6.0 % was realised, compared to 5.7 % in the prior year.
The Special Applications segment, which pools business activi-ties with producers of special vehicles and industrial lighting, recovered slightly from the recent weakness of demand in the agricultural sector.
Segment sales rose by 5.1 % in the second quarter compared to the prior year’s quarter. This also benefited net operating profit/loss with growth of 9.5 % to € 4 million, which is equivalent to an EBIT margin of 5.2 % and is thus at the prior year’s level.
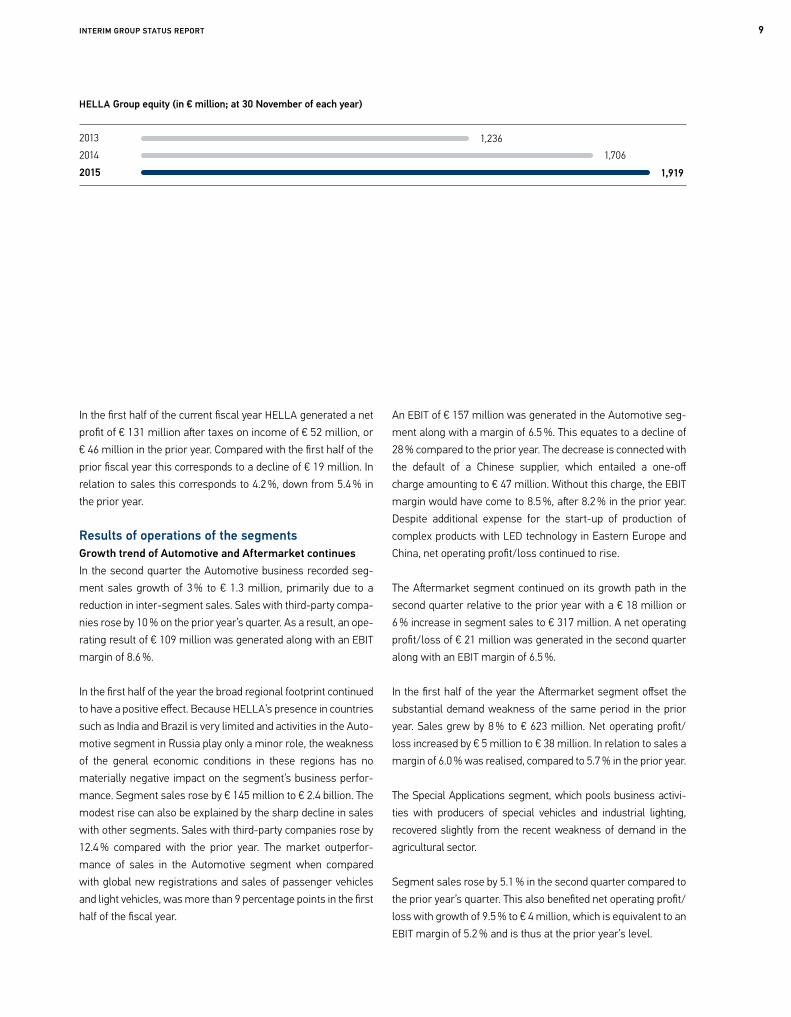
HELLA Group equity (in € million; at 30 November of each year)
201320142015
1,236
1,919 1,706

10 INTERIM GROUP STATUS REPORT
32,73131,800
29,690
Permanent employees in the HELLA Group (at 30 November of each year)
2013 20142015
In the first half of the year the performance in the second quar-ter was reflected in segment sales growth of 2 % to € 155 mil-lion. EBIT rose by 13 % on the prior year to € 10 million, with a margin of 6.3 %, up from 5.7 % in the prior year.
Capital structure Rise in operating cash flow of € 129 million in the first half-yearCash generated from operating activities rose by € 121 million to € 301 million in the first half of the year. This figure includes € 6 million (prior year: € 13 million) in payouts for the partial reti-rement and voluntary severance programme in Germany and € 27 million for payouts in connection with the default of a Chi-nese supplier. Net capital expenditures as the balance of the net payment flows for the acquisition or sale of non-current assets (€ 249 million; prior year: € 237 million) and the corresponding customer reimbursements (€ 60 million; prior year: € 43 mil-lion) came to € 189 million and fell € 5 million short of the prior year’s figure.
Cash generated from investing activities (excluding acquisi-tions) and operating activities correspondingly came to € 52 mil-lion, after resulting in a cash outflow of € 57 million in the prior year’s half-year period. In operational terms, before payouts on restructurings and the one-off expense in connection with the supplier default in China and the acquisition of investments, the cash flow amounted to € 85 million. This represents an increase of € 129 million over the prior year’s figure of € – 44 million.
The acquisition of the shares in the wholesale business in Den-mark and Poland, at 100 % each, accounted for a total of € 58 million.
The annual general meeting on 25 September 2015 decided on a dividend of € 0.77 per share, which came to a total € 86 million paid out to shareholders.
Continuing strong financial basis for growthCompared to the end of the prior fiscal year, cash and cash equiva-lents and current financial assets decreased by € 84 million to € 923 million. The total of current and non-current financial liabilities rose to € 1,155 million, equivalent to an increase of € 16 million.
Net debt as the balance of cash and cash equivalents and cur-rent financial assets together with current and non-current financial liabilities increased by € 100 million to € 231 million in the first half of the year. At the reporting date the ratio of net debt to EBITDA for the last twelve months was 0.3, compared to 0.4 at the end of November 2014. The ratio was 0.2 at the end of the prior fiscal year.
The corporate rating issued by Moody’s remains in the invest-ment grade segment at Baa2 with a stable outlook. Moody’s last updated its Credit Opinion in February 2015.

11INTERIM GROUP STATUS REPORT
Financial positionAt the reporting date the cash-relevant inflow as part of a factoring programme was € 90 million, € 10 million less compared with the end of the prior fiscal year. The factoring was final without right of recourse.
The high liquidity position of more than € 900 million still results in a substantial increase in total assets of € 86 million to € 5.0 billion in the first half of the year. The equity ratio remained unchanged at 38 % at the end of the second quarter.
The increase in total assets resulting from the high liquidity position influences the equity ratio significantly. The equity ratio in relation to total assets adjusted for liquidity comes to 47 %.
Human Resources At the reporting date on 30 November 2015 HELLA had 32,731 permanent staff worldwide. Against the prior year this corres-ponds to an increase of 2.9 % in the headcount, or 931 perma-nent employees. The most pronounced increase of 7.6 % was recorded in the region ‘Rest of Europe’. This was due mainly to the hiring of new employees in Eastern Europe in the wake of production start-ups and the strengthening of HELLA’s techno-logical competence. The regions Asia, Pacific, RoW and North and South America reported a slight 0.4 % increase in person-nel. In functional terms, around 19 % of the permanent staff are employed in Research and Development.
Opportunity and risk report
There were no significant changes in the opportunities and risks during the period under review. There were also no significant changes in the ongoing investigations into cartels, the outcome of which is still not foreseeable at present. No new findings emerged in the second quarter.
Possible market risks that could arise due to events that have come to light in connection with the emissions tests for diesel passenger cars are currently still not foreseeable.
Details of the significant opportunities and risks may be found in our statements in the 2014/2015 consolidated financial statements.
Forecast report
Overall economic and industry-specific outlookThe world economy will most likely report a moderately positive performance in the coming quarters, although there are both macroeconomic and political risks which may have a significant impact on the global economy. The average annual growth rate for 2016 is expected to lie between 3.5 and 4.0 %. The development prospects in the individual economic regions and countries are very disparate. While the industrialised nations are considered to be in an economic recovery phase, growth in the emerging and developing countries is initially likely to be weak. Growth of 1.9 %
Permanent employees in the HELLA Group by region (at 30 November)
38.7 %
Germany 9,653Rest of Europe 12,654North and South America 4,609Asia/Pacific/RoW 5,815
29.5 %
14.1 %
17.8 %

12 INTERIM GROUP STATUS REPORT
is forecast for the German economy next year. Despite the overall favourable outlook, the global economy continues to be exposed to economic risks, for example due to an abrupt tightening of US interest rates in tandem with an appreciation of the US dollar or a further slowdown in Chinese growth. Existing geopolitical ten-sions, such as in Syria and Russia, represent a further incalculable source of uncertainty for market players. Medium-term risks include a further downturn in global growth, which is already low.
According to the VDA, the global passenger car market is expec-ted to grow by around 2 % to 78.1 million units in 2016. Despite a very heterogeneous market development, the three largest automotive markets of the USA, China and Western Europe will remain the relevant growth drivers with growth rates in the low single-digit percentage range. But the future prospects for the three economic regions are dimmed by rising market uncer-tainty and increasing unknowns in respect of the global eco-nomy. Possible decisions on exhaust regulations and emissions, the extent and consequences of which cannot be foreseen at present, contribute to a heightened level of uncertainty. Assu-ming that these general conditions do not deteriorate, the VDA is projecting a 1 % growth rate for the US market to 17.4 million light vehicles in 2016. An increase of 2 % (19.5 million passenger cars) is expected for China. The growth rate of Western Europe has been put at one percent to just under 13.1 million units. By contrast, declines in the double-digit percentage range (– 20 % and – 35 %, respectively) are projected for Brazil and Russia. The Japanese market is also forecast to contract by around 9 % in 2016. New registrations on the German passenger car market are likely to rise slightly to 3.2 million in 2016.
Company-specific outlookBased on the above-mentioned general conditions and fore-casts and assuming that there will be no serious economic upheaval as a result of political crises, for instance in the Middle East or in China, we expect the business activities of the HELLA Group to continue their positive development in the fiscal year 2015/2016.
As reported in the first quarter of HELLA’s fiscal year (June 2015 to August 2015), net operating profit/loss (EBIT) has been weighed down significantly by the default of a Chinese supplier. The overall burden of non-recurring expenses and additional depreciation/amortisation is likely to reach up to a total of € 50 million for the full fiscal year 2015/2016.
Nevertheless HELLA still expects sales growth in the mid to high single-digit percentage range in the full fiscal year, even though EBIT will probably fall short of the prior year’s level due to the one-off charge. As a result, the EBIT margin will decrease relative to the prior year. As things stand today, excluding this one-off charge from the supplier default, EBIT would record an increase in the mid to high single-digit percentage range over the prior year, as originally expected.
The forward-looking statements in this report are based on cur-rent assessments by HELLA’s management. They are subject to risks and uncertainties which HELLA is not able to control or assess precisely, such as the future market environment and general economic conditions, actions by the other market players and government measures. If any of these or other uncertainties

13INTERIM GROUP STATUS REPORT
or vagaries should occur, or if the assumptions on which these statements are based turn out to be incorrect, the actual results may differ materially from the results explicitly specified or implicitly contained in these statements.
Other events in the fiscal half-year Changes in the HELLA Management Board
Carsten Albrecht, Managing Director of the Aftermarket, Special OE and Industries business division, left HELLA Geschäftsführungsgesellschaft mbH with effect from 31 October 2015 after seven years. Mr. Albrecht’s role will be fulfilled temporarily by CEO Dr. Rolf Breidenbach until a successor can be appointed.
With effect from 30 November 2015 Jörg Buchheim, President & CEO China since January 2014, left HELLA Geschäftsführungsgesellschaft mbH. To streamline the matrix leadership structure the management of the region ‘China’, like that of all other re gions, will in future be assumed via the global responsibility of the business divisions and corporate functions.
Expansion of wholesale business through acquisitionsIn November HELLA took over the outstanding 21 percent stake in Denmark’s FTZ, having already acquired 50 percent in Poland’s InterTeam in September. As a result, the former joint ventures
have now passed into full ownership by HELLA. Both companies had already been fully consolidated. With the acquisition of these stakes HELLA’s wholesale activities in Northern and Eastern Europe, pooled in the Nordic Forum, are being systematically strengthened.
Events after the balance sheet date
No events of special relevance other than those mentioned have taken place since the close of the first half of the fiscal year 2015/2016. Since the end of November 2015, the Group’s net assets, financial position and results of operations have continued to develop positively.

14 CONSOLIDATED INCOME STATEMENTCONDENSED INTERIM CONSOLIDATED FINANCIAL STATEMENTS
1st half-year 1 June to 30 November
2nd quarter1 September to 30 November
€ thousand 2015 /2016 2014 /2015 2015 /2016 2014 /2015
Sales 3,159,129 2,826,014 1,663,167 1,508,209
Cost of sales – 2,325,460 – 2,053,115 – 1,204,530 – 1,085,397
Gross profit 833,669 772,899 458,637 422,812
Research and development costs – 291,359 – 268,966 – 151,736 – 152,271
Distribution costs – 243,855 – 222,235 – 124,945 – 114,524
Administrative costs – 103,212 – 94,754 – 50,960 – 48,450
Other income and expenses – 17,132 6,322 – 13,754 4,667
Share of profit in investments accounted for using equity method 24,619 27,841 16,628 14,384
Other income from investments 25 20 25 0
Net operating profit/loss (EBIT) 202,755 221,127 133,895 126,618
Financial income 15,611 12,626 10,493 8,566
Financing costs – 34,021 – 36,924 – 19,257 – 20,483
Net financial result – 18,410 – 24,298 – 8,764 – 11,917
Earnings before income taxes (EBT) 184,345 196,829 125,131 114,701
Taxes on income – 52,981 – 45,627 – 36,726 – 27,079
Earnings for the period 131,364 151,202 88,405 87,622
of which attributable:
to the owners of the parent company 128,403 147,098 87,206 85,366
to non-controlling interests 2,961 4,104 1,199 2,256
Undiluted earnings per ordinary share in € 1.16 1.45 0.79 0.83
Diluted earnings per ordinary share in € 1.16 1.45 0.79 0.83
Consolidated income statementof HELLA KGaA Hueck & Co.
See Note 06 for explanations
CONDENSED INTERIM CONSOLIDATED FINANCIAL STATEMENTS

15CONSOLIDATED STATEMENT OF COMPREHENSIVE INCOMECONDENSED INTERIM CONSOLIDATED FINANCIAL STATEMENTS
Consolidated statement of comprehensive income(after-tax view)of HELLA KGaA Hueck & Co.
1st half-year 1 June to 30 November
2nd quarter1 September to 30 November
€ thousand 2015 /2016 2014 /2015 2015 /2016 2014 /2015
Earnings for the period 131,364 151,202 88,405 87,622
Currency translation differences – 2,703 42,727 55,214 18,394
Financial instruments for cash flow hedging 11,149 – 13,303 – 1,628 – 3,892
Changes realised in equity 10,301 – 13,105 3,311 – 5,775
Profits (–) or losses (+) recognised in profit and loss 848 – 198 – 4,939 1,883
Change in fair value of financial instruments available for sale – 1,227 2,578 5,044 2,742
Changes realised in equity – 1,334 2,403 5,531 2,057
Profits (–) or losses (+) recognised in profit and loss 107 175 – 487 685
Share of other comprehensive income attributable to associates and joint ventures 128 6,233 11,598 1,826
Items which were or can be transferred to profit or loss 7,219 32,002 58,630 17,244
Revaluation from defined benefit pension plans 14,694 – 32,120 – 4,511 – 5,461
Share of other comprehensive income attributable to associates and joint ventures 0 – 1 0 – 21
Items never transferred to profit or loss 14,694 – 32,120 – 4,511 – 5,461
Other comprehensive income for the period 21,913 – 118 54,119 11,783
Comprehensive income for the period 153,277 151,084 142,524 99,405
of which attributable:
to the owners of the parent company 150,435 146,792 140,997 97,263
to non-controlling interests 2,842 4,292 1,527 4,292
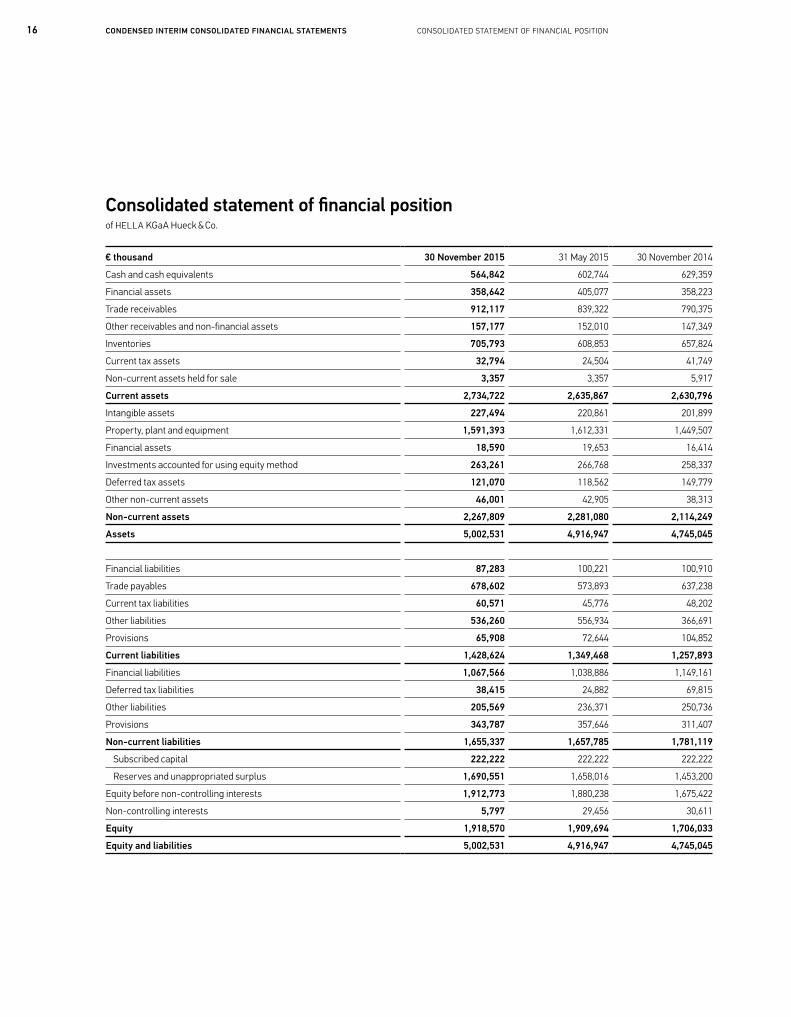
16 CONSOLIDATED STATEMENT OF FINANCIAL POSITIONCONDENSED INTERIM CONSOLIDATED FINANCIAL STATEMENTS
€ thousand 30 November 2015 31 May 2015 30 November 2014
Cash and cash equivalents 564,842 602,744 629,359
Financial assets 358,642 405,077 358,223
Trade receivables 912,117 839,322 790,375
Other receivables and non-financial assets 157,177 152,010 147,349
Inventories 705,793 608,853 657,824
Current tax assets 32,794 24,504 41,749
Non-current assets held for sale 3,357 3,357 5,917
Current assets 2,734,722 2,635,867 2,630,796 Intangible assets 227,494 220,861 201,899
Property, plant and equipment 1,591,393 1,612,331 1,449,507
Financial assets 18,590 19,653 16,414
Investments accounted for using equity method 263,261 266,768 258,337
Deferred tax assets 121,070 118,562 149,779
Other non-current assets 46,001 42,905 38,313
Non-current assets 2,267,809 2,281,080 2,114,249 Assets 5,002,531 4,916,947 4,745,045
Financial liabilities 87,283 100,221 100,910
Trade payables 678,602 573,893 637,238
Current tax liabilities 60,571 45,776 48,202
Other liabilities 536,260 556,934 366,691
Provisions 65,908 72,644 104,852
Current liabilities 1,428,624 1,349,468 1,257,893 Financial liabilities 1,067,566 1,038,886 1,149,161
Deferred tax liabilities 38,415 24,882 69,815
Other liabilities 205,569 236,371 250,736
Provisions 343,787 357,646 311,407
Non-current liabilities 1,655,337 1,657,785 1,781,119 Subscribed capital 222,222 222,222 222,222
Reserves and unappropriated surplus 1,690,551 1,658,016 1,453,200
Equity before non-controlling interests 1,912,773 1,880,238 1,675,422
Non-controlling interests 5,797 29,456 30,611
Equity 1,918,570 1,909,694 1,706,033 Equity and liabilities 5,002,531 4,916,947 4,745,045
Consolidated statement of financial positionof HELLA KGaA Hueck & Co.

17CONSOLIDATED CASH FLOW STATEMENTCONDENSED INTERIM CONSOLIDATED FINANCIAL STATEMENTS
€ thousand 2015 /2016 2014/2015
Profit before income taxes 184,345 196,829+ Depreciation and amortisation 197,251 159,691
+ / – Change in provisions 1,241 – 4,343
+ Payments received for series production 59,889 43,338
– Non-cash sales transacted in previous periods – 49,013 – 42,758
– Other non-cash income – 40,072 – 22,475
– Profits from the sale of non-current assets – 623 – 157
+ Net financial result 18,410 24,298
+ / – Change in trade receivables and other assets not attributable to investing or financing activities – 77,644 – 98,279
– Increase in inventories – 103,632 – 79,900
+ / – Change in trade payables and other liabilities not attributable to investing or financing activities 137,661 63,706+ Interest received 1,211 7,527 – Interest paid – 8,537 – 33,000+ Tax refunds received 3,099 2,818
– Taxes paid – 50,700 – 60,294
+ Dividends received 28,382 23,497
= Net cash flow from operating activities 301,268 180,499+ Cash proceeds from the sale of property, plant and equipment and intangible assets 5,078 4,472
– Payments for the purchase of property, plant and equipment and intangible assets – 254,015 – 241,832
+ Repayments of loans from associates or unconsolidated companies 650 0
+ Cash proceeds from the liquidation of a non-consolidated company 107 0– Payments for acquisition of subsidiaries, less cash received 0 – 405
– Settlement for capital contribution in associates 0 – 16,694
+ Cash proceeds from capital decrease in investments accounted for using equity method 2,766 13,200
= Net cash flow from investing activities – 245,414 – 241,259– Payments for the repayment of financial liabilities – 50,714 – 23,497
+ Cash proceeds from borrowing 53,844 59,993
- Payments made for acquiring shares of non-controlling interests – 57,789 0
+ Cash proceeds for the sale of securities (settlements in the prior year) 45,179 – 519– Dividend paid – 86,612 – 59,060– Repayment of bond issued in October 2009 0 – 200,002+ Net cash proceeds from shares issued 0 272,325
= Net cash flow from financing activities – 96,092 49,240= Net change in cash and cash equivalents – 40,238 – 11,519+ Cash and cash equivalents as at 1 June 602,744 637,226
+ / – Effect of exchange rate fluctuations on cash and cash equivalents 2,336 3,654
= Cash and cash equivalents as at 30 November 564,842 629,359
Consolidated cash flow statementof HELLA KGaA Hueck & Co. for the period from 1 June to 30 November

18 CONSOLIDATED STATEMENTS OF CHANGES IN EQUITYCONDENSED INTERIM CONSOLIDATED FINANCIAL STATEMENTS
Consolidated statements of changes in equityof HELLA KGaA Hueck & Co.
€ thousand
Subscribedcapital
Capitalreserve
Currency translation
reserve
Reserve for financial instrumentsfor cash flow hedging
Reserve for
financial instruments available for sale
Revaluation from defined benefit pension plans
Other retainedreserves/
profit carried forward
Equity before non-controlling
interestsNon-controlling
interests Total capital
As at 1 June 2014 200,000 0 – 33,397 – 63,838 4,447 – 48,276 1,253,246 1,312,182 29,879 1,342,061Earnings for the period 0 0 0 0 0 0 147,098 147,098 4,104 151,202Other comprehensive income for the period 0 0 42,535 – 13,299 2,578 – 32,120 0 – 306 188 – 118Comprehensive income for the period 0 0 42,535 – 13,299 2,578 – 32,120 147,098 146,792 4,292 151,084Issue of new capital against cash contributions 22,222 255,556 0 0 0 0 0 277,778 0 277,778Issuing costs 0 – 5,830 0 0 0 0 0 – 5,830 0 – 5,830Distributions to shareholders 0 0 0 0 0 0 – 55,500 – 55,500 – 3,560 – 59,060
Transactions with shareholders 22,222 249,726 0 0 0 0 – 55,500 216,448 – 3,560 212,888
As at 30 November 2014 222,222 249,726 9,138 – 77,137 7,025 – 80,396 1,344,844 1,675,422 30,611 1,706,033
As at 1 June 2015 222,222 250,234 81,505 – 89,092 10,469 – 70,904 1,475,804 1,880,238 29,456 1,909,694Earnings for the period 0 0 0 0 0 0 128,403 128,403 2,961 131,364Other comprehensive income for the period 0 0 – 2,584 11,149 – 1,227 14,694 0 22,032 – 119 21,913Comprehensive income for the period 0 0 – 2,584 11,149 – 1,227 14,694 128,403 150,435 2,842 153,277Distributions to shareholders 0 0 0 0 0 0 – 85,556 – 85,556 – 1,056 – 86,612
Changes in ownership interests in subsidiaries 0 0 – 159 0 0 0 – 32,185 – 32,344 – 25,445 – 57,789
Transactions with shareholders 0 0 – 159 0 0 0 – 117,741 – 117,900 – 26,501 – 144,401
As at 30 November 2015 222,222 250,234 78,762 – 77,943 9,242 – 56,210 1,486,466 1,912,773 5,797 1,918,570
See also Note 14 for information on equity

19CONSOLIDATED STATEMENTS OF CHANGES IN EQUITYCONDENSED INTERIM CONSOLIDATED FINANCIAL STATEMENTS
€ thousand
Subscribedcapital
Capitalreserve
Currency translation
reserve
Reserve for financial instrumentsfor cash flow hedging
Reserve for
financial instruments available for sale
Revaluation from defined benefit pension plans
Other retainedreserves/
profit carried forward
Equity before non-controlling
interestsNon-controlling
interests Total capital
As at 1 June 2014 200,000 0 – 33,397 – 63,838 4,447 – 48,276 1,253,246 1,312,182 29,879 1,342,061Earnings for the period 0 0 0 0 0 0 147,098 147,098 4,104 151,202Other comprehensive income for the period 0 0 42,535 – 13,299 2,578 – 32,120 0 – 306 188 – 118Comprehensive income for the period 0 0 42,535 – 13,299 2,578 – 32,120 147,098 146,792 4,292 151,084Issue of new capital against cash contributions 22,222 255,556 0 0 0 0 0 277,778 0 277,778Issuing costs 0 – 5,830 0 0 0 0 0 – 5,830 0 – 5,830Distributions to shareholders 0 0 0 0 0 0 – 55,500 – 55,500 – 3,560 – 59,060
Transactions with shareholders 22,222 249,726 0 0 0 0 – 55,500 216,448 – 3,560 212,888
As at 30 November 2014 222,222 249,726 9,138 – 77,137 7,025 – 80,396 1,344,844 1,675,422 30,611 1,706,033
As at 1 June 2015 222,222 250,234 81,505 – 89,092 10,469 – 70,904 1,475,804 1,880,238 29,456 1,909,694Earnings for the period 0 0 0 0 0 0 128,403 128,403 2,961 131,364Other comprehensive income for the period 0 0 – 2,584 11,149 – 1,227 14,694 0 22,032 – 119 21,913Comprehensive income for the period 0 0 – 2,584 11,149 – 1,227 14,694 128,403 150,435 2,842 153,277Distributions to shareholders 0 0 0 0 0 0 – 85,556 – 85,556 – 1,056 – 86,612
Changes in ownership interests in subsidiaries 0 0 – 159 0 0 0 – 32,185 – 32,344 – 25,445 – 57,789
Transactions with shareholders 0 0 – 159 0 0 0 – 117,741 – 117,900 – 26,501 – 144,401
As at 30 November 2015 222,222 250,234 78,762 – 77,943 9,242 – 56,210 1,486,466 1,912,773 5,797 1,918,570

20 SELECTED EXPLANATORY NOTESCONDENSED INTERIM CONSOLIDATED FINANCIAL STATEMENTS
01 Basic information
The interim financial statements are prepared in euros (€). Amounts are stated in thousands of euros (€ thousand). The interim financial statements are prepared using accounting and measurement methods that are applied consistently within the Group on the basis of amortised historical cost. This does not apply to assets that are available for sale and derivative financial instruments, which are measured at fair value. The consolidated income statement is prepared using the cost-of-sales method. The current/non-current distinction is observed in the consolida-ted statement of financial position. The amounts stated under current assets and liabilities are for the most part due for settle-ment within twelve months. Accordingly, non-current items are mainly due for settlement in more than twelve months. In order to enhance the clarity of the presentation, items of the consoli-dated statement of financial position and consolidated income statement have been grouped together where this is appropriate and possible. Please note that where sums and percentages in the report have been rounded, differences may arise as a result of commercial rounding.
HELLA KGaA Hueck & Co. (HELLA KGaA) and its subsidiaries (collectively referred to as the “Group”) develop and manufac-ture lighting technology and electronics components and sys-tems for the automotive industry. The Group also produces complete vehicle modules and air conditioning systems in joint venture undertakings. The Group’s production and manufactu-ring sites are located across the globe; its most significant mar-kets are in Europe, the USA and Asia, particularly Korea and China. In addition, HELLA has its own international sales network for vehicle accessories of all kinds.
The Company is a stock corporation, which was founded and is based in Lippstadt, Germany. The address of the Company’s registered office is Rixbecker Str. 75, Lippstadt.
This interim report has been prepared as a condensed interim report in accordance with the requirements of the International Financial Reporting Standards (IFRS) applicable as of 30 November 2015 and as adopted by the European Union. The interim report was created in accordance with IAS 34 Interim Financial Reporting. The interim financial statements are accompanied by an interim ma n-agement report. The comparative values of the prior fiscal year were determined in accordance with the same principles.
02 Scope of consolidation
In addition to HELLA KGaA Hueck & Co., all significant domestic and foreign subsidiaries that are directly or indirectly controlled by HELLA are consolidated. Material joint ventures are included in the consolidated financial statements in accordance with the equity method of accounting.
Number 30 Nov 2015 31 May 2015 30 Nov 2014
Fully consolidated companies 99 101 104
Companies accounted for using equity method 53 52 49
SELECTED EXPLANATORY NOTES

21SELECTED EXPLANATORY NOTESCONDENSED INTERIM CONSOLIDATED FINANCIAL STATEMENTS
The accounting and measurement methods used in the interim report are the same as those used in the consolidated financial statements of 31 May 2015. These methods are explained in detail in the consolidated financial statements of 31 May 2015.
03 Accounting and measurement methods
Exchange differences arising from the translation of earnings and items of the statement of financial position of all Group companies which have a functional currency deviating from the euro are reported within the reserves for currency translation differences.
The exchange rates used to translate the main currencies for HELLA were as follows:
04 Currency translation
Reporting date Average 1st half-year Reporting date 31 May 2015 31 May 2014 2015 / 2016 2014 / 2015 30 Nov 2015 30 Nov 2014
€ 1 = US dollar 1.0970 1.3607 1.1093 1.3082 1.0579 1.2483
€ 1 = Czech koruna 27.4010 27.471 27.1103 27.5926 27.0300 27.6520
€ 1 = Japanese yen 135.9500 138.36 135.5139 138.9042 130.2200 147.6900
€ 1 = Australian dollar 1.4338 1.4635 1.5191 1.4391 1.4671 1.4647
€ 1 = Chinese renminbi 6.7994 8.5025 6.9953 8.0641 6.7689 7.6673
€ 1 = South Korean won 1,220.3100 1,389.2200 1,279.6862 1,363.8692 1,224.2100 1,385.5800
€ 1 = Romanian leu 4.4425 4.4030 4.4365 4.4139 4.4503 4.4278

22 SELECTED EXPLANATORY NOTESCONDENSED INTERIM CONSOLIDATED FINANCIAL STATEMENTS
A Chinese supplier dropped out during the first quarter and unex-pectedly ended its contractual delivery obligations. The manufacture of the intermediate products affected was reorganised completely in order to protect the supply chain, resulting in a significant in crease in expenses, such as special freight costs and additional impair-ments. All in all, this resulted in an extraordinary charge against net operating profit/loss in the first half-year. The increase in expenses still outstanding leads to losses from existing trade receivables, for
Sales for the first six months of the fiscal year 2015/2016 amounted to € 3,159,129 thousand (prior year: € 2,826,014 thousand). Sales are attributable entirely to the sale of goods and services rendered.
The sales can be classified as follows:
05 Particular business transactions
06 Sales
€ thousand 2015/2016 2014/2015
Sales from the sale of goods 2,999,335 2,751,571
Sales arising from the rendering of services 159,794 74,443
Sales total 3,159,129 2,826,014
Undiluted earnings per share are calculated by dividing the share of earnings attributable to the shareholders of HELLA KGaA Hueck & Co. by the weighted average number of ordinary shares issued.
Number of shares 30 November 2015 30 November 2014
Weighted average number of shares in circulation during the period Ordinary shares, undiluted 111,111,112 101,457,195
Ordinary shares, diluted 111,111,112 101,457,195
€ thousand 2015/2016 2014 /2015
Share of profit attributable to shareholders of the parent company 128,403 147,098
€ 2015 /2016 2014 /2015
Earnings per share, undiluted 1.16 1.45Earnings per share, diluted 1.16 1.45
07 Earnings per share
An issue of new capital on 7 November 2014 increased the number of outstanding shares by 11,111,112 to 111,111,112.
Undiluted earnings per share amounted to €1.16 and are equiva-lent to diluted earnings per share.
which provisions will be reported In summary, cost of sales include € 27,070 thousand in additional charges. In addition, the goodwill of € 5,611 thousand reported for the Group entity was subject to an impairment analysis and fully impaired in the result, and reported together with other cross-functional costs of € 14,178 thousand under other income and expenses. The additional charge for the half-year totals is € 47,196 thousand.

23SELECTED EXPLANATORY NOTESCONDENSED INTERIM CONSOLIDATED FINANCIAL STATEMENTS
External segment reporting is based on internal reporting (so-called management approach). Segment reporting is based solely on financial information used by the company’s decision makers for the internal management of the company and to make decisions regarding the allocation of resources and mea-surement of profitability.
The Lighting and Electronics business divisions are reported together in the Automotive segment. Both business divisions serve a similar customer base worldwide. Both segments are therefore subject to broadly similar economic cycles and mar-ket developments. In addition, the individual products have comparable lifecycles. Original Equipment provides lighting and electronics components to automobile manufacturers and other tier-1 suppliers worldwide through an integrated distribu-tion network. The product portfolio of the Lighting business divi-sion includes headlamps, signal lamps, interior lamps, and light- ing electronics. The Electronics business division focuses on the product areas of body electronics, energy management, as
well as driver assistance systems and components (e. g. sen-sors and engine compartment actuators). The Automotive seg-ment develops, produces and sells vehicle-specific solutions, and develops and brings to market technological innovations. The margins attainable within the segment are mainly depen-dent on the respective technology used, and to a lesser extent on customers, regions, and products.
The Aftermarket business segment is responsible for the trade in automotive parts and accessories, and the wholesale busi-ness. The trade product portfolio includes service parts for the Lighting, Electrical, Electronics, and Thermal Management segments. In addition, the automotive parts and accessories businesses and garages receive sales support through a modern, rapid information and ordering system, as well as through competent technical service. The Aftermarket seg-ment makes only limited use of the Automotive segment’s resources, and largely produces the independently developed items in its own plants.
08 Segment reporting
The segment information for the first half of the fiscal years 2015/2016 and 2014/2015 is as follows:
Automotive Aftermarket Special Applications
€ thousand 2015 /2016 2014 /2015 2015 /2016 2014 /2015 2015 /2016 2014 /2015
Sales with third-party companies 2,392,286 2,127,614 596,595 547,440 154,222 150,961
Inter-segment sales 20,347 140,130 26,780 30,316 1,075 795
Cost of sales – 1,847,740 – 1,738,166 – 414,586 – 388,802 – 97,284 – 97,348
Gross profit 564,893 529,578 208,789 188,954 58,013 54,408
Research and development costs – 275,432 – 252,308 – 7,378 – 7,908 – 8,378 – 8,750
Distribution costs – 54,745 – 48,520 – 155,845 – 143,124 – 33,357 – 30,591
Administrative costs – 86,725 – 74,216 – 15,919 – 12,950 – 7,980 – 7,628
Other income and expenses – 12,438 5,795 5,020 4,749 1,463 1,170
Result of investments accounted for using equity method 21,811 24,797 2,808 3,044 0 0
Earnings before interest and income taxes 157,364 185,126 37,475 32,765 9,761 8,609
Additions to non-current assets 167,316 155,922 11,030 15,597 5,309 227

24 SELECTED EXPLANATORY NOTESCONDENSED INTERIM CONSOLIDATED FINANCIAL STATEMENTS
Sales for fiscal years 2015 / 2016 and 2014 / 2015 are as follows:
Reconciliation of the segment results with consolidated net profit / loss:
€ thousand 2015 /2016 2014 /2015
EBIT of the reporting segments 204,600 226,500
EBIT of other divisions 3,886 20
Unallocated income – 5,731 – 5,393
Consolidated EBIT 202,755 221,127
Net financial result – 18,410 – 24,298
Consolidated EBT 184,345 196,829
As at 31 May 2015, the cash funds comprise exclusively cash and cash equivalents. In accordance with IFRS 3.45, provisional figu-res on the acquisition of the additional stake in Hella Nussbaum Solutions were reported in the interim report as of November 2014, which were specified in the consolidated financial state-
09 Notes to the cash flow statement
€ thousand 2015 /2016 2014 /2015
Total sales of the reporting segments 3,191,305 2,997,256
Sales in other divisions 45,926 0
Elimination of intersegment sales – 78,102 – 171,242
Consolidated sales 3,159,129 2,826,014
The sales generated by the other divisions are attributable to the rendering of personnel services to the reported segments or third-party companies.
The voluntary partial retirement and severance payment programme that was initiated in June 2013 led to an expense of € 5,731 thousand (prior year: € 5,393 thousand), which is attributable to income and expenses outside the reported segments.
ments as of May 2015. This resulted in a reduction of € 245,000 in net cash flow from operating activities and a reverse correc-tion of net cash generated from investing activities. The figures for the first half of 2014/2015 were adopted in accordance with the figures in the consolidated financial statements of May 2015.

25SELECTED EXPLANATORY NOTESCONDENSED INTERIM CONSOLIDATED FINANCIAL STATEMENTS
General information on financial instrumentsThe carrying amounts and fair values of classes of financial in -struments and the carrying amounts in accordance with IAS 39
10 Other receivables and current non-financial assets
13 Disclosures on financial instruments
€ thousand 30 November 2015 31 May 2015
Other current assets 41,456 21,272
Insurance receivables 18,881 16,434
Positive market value of currency hedges 3,914 5,457
Subtotal other financial assets 64,251 43,163Advance payments 8,817 19,176
Prepaid expenses/deferred income 22,259 18,890
Receivables for partial retirement 995 2,323
Advance payments to employees 2,737 1,953
Other tax receivables 58,119 66,505
Total 157,177 152,010
12 Other liabilities
11 Other non-current assets
30 November 2015 31 May 2015
€ thousand Non-current Current Non-current Current
Derivatives 100,906 18,121 126,839 18,655
Other financial liabilities 1,166 155,403 941 190,254
Subtotal other financial liabilities 102,072 173,524 127,781 208,909Other taxes 0 63,577 0 40,167
Accrued personnel liabilities 0 144,821 0 169,631
Advance payments received 783 18,927 984 19,577
Deferred revenue 102,714 135,411 107,607 118,649Total 205,569 536,260 236,371 556,934
€ thousand 30 November 2015 31 May 2015
Receivables from finance leases 38,072 35,707
Other non-current assets 2,644 2,640
Subtotal other financial assets 40,716 38,347Advance payments 1,086 1,179
Prepaid expenses/deferred income 2,618 1,411
Plan assets 1,581 1,968
Total 46,001 42,905
measurement categories as at 30 November 2015 and as at 31 May 2015 are shown below.
26 SELECTED EXPLANATORY NOTESCONDENSED INTERIM CONSOLIDATED FINANCIAL STATEMENTS
€ thousand
Measurement category
under IAS 39
Carrying amount
30 Nov 2015
Fair value
30 Nov 2015
Carrying amount
31 May 2015
Fair value
31 May 2015
Fair value hierarchy
Cash and cash equivalents LaR 564,842 564,842 602,744 602,744
Trade receivables LaR 912,117 912,117 839,322 839,322
Loans LaR 331 331 204 204
Other financial assets
Derivatives used for hedging n.a. 2,355 2,355 2,276 2,276
Derivatives not used for hedging HfT 1,558 1,558 3,181 3,181
Available-for-sale financial assets
AfS 356,643 356,643 402,778 402,778
Level 1 Other receivables associated with financing activities LaR 62,005 62,005 39,802 39,802
Financial assets (current) 1,899,851 1,899,851 1,890,307 1,890,307
Trade receivables LaR 40,716 40,716 38,347 38,347 Level 2
Loans LaR 7,809 7,809 8,559 8,059 Level 2
Other financial assets
Available-for-sale financial assets AfS 10,756 10,756 11,074 11,074 Level 2
Other receivables associated with financing activities LaR 25 25 20 20 Level 2
Financial assets (non-current) 59,306 59,306 58,000 57,500 Financial assets 1,959,157 1,959,157 1,948,307 1,947,807
Financial liabilities FLAC 85,440 85,440 97,153 97,153
Trade payables FLAC 678,602 678,602 573,893 573,893
Other financial liabilities
Derivatives used for hedging n.a. 14,368 14,368 11,897 11,897 Level 2
Derivatives not used for hedging HfT 3,753 3,753 6,224 6,224 Level 2
Financial lease liabilities n.a. 1,844 1,844 3,068 3,068
Other financial liabilities FLAC 155,403 155,403 190,254 190,254
Financial liabilities (current) 939,410 939,410 882,489 882,489
Financial liabilities to banks FLAC 178,688 183,468 153,793 152,506 Level 2
Bonds FLAC 888,799 945,028 884,393 942,616 Level 1
Other financial liabilities
Derivatives used for hedging n.a. 100,090 100,090 118,625 118,625 Level 2
Derivatives not used for hedging HfT 816 816 8,214 8,214 Level 2
Financial lease liabilities n.a. 79 79 700 700
Other financial liabilities FLAC 1,166 1,166 941 941
Financial liabilities (non-current) 1,169,638 1,230,647 1,166,666 1,223,602 Financial liabilities 2,109,048 2,170,107 2,049,155 2,106,091
Of which aggregated under IAS 39 measurement categories:
Financial assets HfT 1,558 1,558 3,181 3,181
LaR 1,587,845 1,587,845 1,528,998 1,528,498
AfS 367,399 367,399 413,853 413,722
Financial liabilities HfT 4,569 4,569 14,438 14,438
FLAC 1,988,098 2,049,107 1,900,427 1,957,363
Financial assets, derivatives used for hedging 2,355 2,355 2,276 2,276
Financial liabilities, derivatives used for hedging 114,458 114,458 130,522 130,522
27SELECTED EXPLANATORY NOTESCONDENSED INTERIM CONSOLIDATED FINANCIAL STATEMENTS
Level 1: Measurement of market value based on listed, unad-justed prices on active markets.
Level 2: Measurement of market value based on criteria for assets and financial liabilities that can be either directly or indi-rectly derived from prices on active markets.
Level 3: Measurement of market value based on criteria that cannot be derived from active markets.
The Group reports possible transfers between different levels of the fair value hierarchy at the end of the reporting period in which the change occurred. As in the prior year, no transfers were made between different levels of the fair value hierarchy during the reporting period.
The carrying amounts of short-term financial instruments at the reporting date correspond to the market value owing to their short residual term and the fact that they are recognised at market value.
The carrying amounts of non-current financial liabilities also lar-gely correspond to the market values owing to the mostly vari-able interest rates. Long-term financial instruments on the assets side are mainly determined by the other investments and loans. The fair values of these equity components measured at acquisition costs could not be determined as no stock exchange or market prices were available.
On the equity and liabilities side, share capital is recognised at its nominal value under the “Subscribed capital” item. The share capital amounts to € 222,222 thousand. The no-par value shares are issued to the bearer. All issued shares are fully paid up. Each share confers a right to vote and a right to dividends if distributions are agreed.
Under “Other retained earnings/profit carried forward”, other retained earnings of the parent company and past earnings of consolidated companies are also included, unless they have been distributed. This item also includes the statutory reserve of the parent company. The statutory reserve is subject to the dis-tribution restrictions specified in the German Stock Corporation Act (Aktiengesetz).
Offsetting of differences in assets and liabilities arising from the capital consolidation of subsidiaries consolidated before 1 June 2006, and the adjustments recognised directly in equity for the first-time adoption of IFRS are also included in this item. Actua-rial gains and losses recognised directly in equity, the differen-ces arising from the currency translation of the annual financial statements of foreign subsidiaries not recognised in profit or loss, the impact arising from the measurement of derivative financial instruments acquired for hedging purposes and finan-cial assets not recognised in profit or loss, as well as financial assets from the available-for-sale category, are also recog-nised in this item.
Actuarial gains of € 14,952 thousand (prior year: a loss of € 32,120 thousand) were recognised in the item revaluation from defined benefit pension plans. The change in value of the defined benefit liabilities or of the assigned plan assets is attributable to calculation parameters and in particular the discount rate used here, which was 2.28 % at the end of November 2015 (May 2015: 1.92 %).
As at 25 September 2015, dividends totalling € 85,556 thousand (€ 0.77 per no-par value share) were distributed to owners of the parent company. Dividends in the amount of € 1,056 thousand were paid to non-controlling interests during the period.
As at 30 September 2015, further shares in the Polish company Inter-Team were acquired. The purchase price was € 33,296 thousand. This did not lead to any change in the accounting method, as Inter-Team was already fully consolidated. The company now holds a 100 % share in Inter-Team after the purchase. Specifically, the Group recognised:
a € 6,889 thousand reduction in non-controlling interests a €26,262 thousand reduction in other retained earnings a € 146 thousand reduction in the currency translation reserve.
14 Equity

28 SELECTED EXPLANATORY NOTESCONDENSED INTERIM CONSOLIDATED FINANCIAL STATEMENTS
The carrying amount of the net assets of Inter-Team in the inte-rim financial statements amounted to € 13,778 thousand at the time of acquisition. The following is a summary of the impact of changes in the Group’s investment in Inter-Team:
€ thousand Share of company as at 1 June 2015 6,291
Impact of increase in the investment 6,889
Share of comprehensive income 1,127
Share of company as at 30 November 2015 14,307
Furthermore, the remaining 21.01 % share in the Danish auto-motive parts wholesaler FTZ was also acquired during the period under review for a purchase price of € 24,493 thousand. FTZ is now wholly-owned by the company after the purchase. As FTZ was already fully consolidated, this did not lead to any change in the accounting method. Specifically, the Group recognised:
a € 18,556 thousand reduction in non-controlling interests a €5,923 thousand reduction in other retained earnings € 13 thousand reduction in the currency translation reserve.
The carrying amount of the net assets of FTZ in the interim financial statements amounted to € 88,326 thousand at the time of acquisition. The following is a summary of the impact of changes in the Group’s investment in FTZ:
€ thousand Share of company as at 1 June 2015 64,171
Impact of increase in the investment 18,556
Share of comprehensive income 7,788
Share of company as at 30 November 2015 90,515
A detailed overview of the composition and changes in the results recognised directly in equity is presented in the consoli-dated statement of changes in equity. The Group aims to main-tain a strong equity base. The Group strives to strike a balance between a higher return on equity, which would be possible through greater leverage, and the advantages and security of -fered by a solid equity position. The Group is aiming for a ratio of less than 1.0 for net debt to operating result before deprecia-tion /amortisation (EBITDA) in the long term. The ratio as at 30 November was 0.3.

29SELECTED EXPLANATORY NOTESCONDENSED INTERIM CONSOLIDATED FINANCIAL STATEMENTS
No events of developments occurred after the end of the fiscal half-year that could have led to a material change to the recog-nition or the carrying amount of individual assets or liabilities as at 30 November 2015 or would have had to be reported.
15 Events after the reporting date
Lippstadt, 18 December 2015
The personally liable managing partners of HELLA KGaA Hueck & Co.
Dr. Jürgen Behrend
HELLA Geschäftsführungsgesellschaft mbH
Dr. Rolf Breidenbach Markus Bannert (Chair)
Dr. Wolfgang Ollig Stefan Osterhage Dr. Matthias Schöllmann

30 REVIEW REPORT BY THE AUDITORS
Review report by the auditors to HELLA KGaA Hueck & Co.
We have carried out an audit review of the condensed interim con-solidated financial statements – consisting of the consolidated income statement, the consolidated statement of comprehensive income, the consolidated statement of financial position, the con-solidated cash flow statement, the consolidated statement of changes in equity and selected explanatory notes – and the inte-rim group status report of HELLA KGaA Hueck & Co. for the period from 1 June to 30 November 2015, which are integral parts of the interim financial report in accordance with Section 37w Wertpa-pierhandelsgesetz (WpHG German Securities Trading Act). The preparation of the condensed interim consolidated financial state-ments in accordance with the IFRS applicable to interim financial reporting as adopted by the EU and of the interim roup manage-ment report, in accordance with the regulations of the German Securities Trading Act applicable to interim group status reports, is the responsibility of the legal representative of the company. Our responsibility is to issue a review report on the condensed interim consolidated financial statements and on the interim group status report based on our review.
We have conducted a review report of the condensed interim consolidated financial statements and the interim group status report in accordance with the generally accepted German stan-dards for the audit of financial statements promulgated by the Institut der Wirtschaftsprüfer (IDW). These standards require that we plan and conduct the review so that we can through cri-tical evaluation, preclude, with a certain level of assurance, that the interim consolidated financial statements have not been prepared, in material aspects, in accordance with IFRS for Inte-rim Financial Reporting, as adopted by the EU, and that the inte-
rim group status report has not been prepared according to the applicable regulations of the WpHG. A review report is limited primarily to questioning company employees and to analytical evaluations, and therefore does not provide the level of certainty that is attainable from an audit of financial statements. As we did not perform an audit of financial statements, we cannot issue an audit report.
Based on the findings of our audit, we are not aware of any events that lead us to the conclusion that the condensed interim consolidated financial statements have not been prepared to the most part in accordance with the IFRS for interim financial statements and the interim management report has been pre-pared for the most part pursuant to the applicable reporting requirements of the WpHG for interim management reports as adopted by the EU or that the interim group status report has not been prepared mainly pursuant to the applicable reporting requirements of the WpHG for interim group status reports.
Bielefeld, 7 January 2016 KPMG AG Wirtschaftsprüfungsgesellschaft
Prof. Dr. Andrejewski Hunke Auditor Auditor

31DECLARATION
To the best of our knowledge, the interim consolidated financial statements give a true and fair view of the net assets, financial position and results of operations of the Group and the company in accordance with applicable accounting principles, and the interim group status report include a fair review of the develop-ment and performance of the business and the position of both
the Group and the company, together with a description of the principal opportunities and risks associated with the expected development of the Group.
Lippstadt, 18 December 2015
Declarationon the interim consolidated financial statements and interim group status report of HELLA KGaA Hueck & Co. as at 30 November 2015.
Dr. Jürgen Behrend(personally liable and managing partner of HELLA KGaA Hueck & Co.)
Markus Bannert (Managing Director ofHELLA Geschäftsführungsgesellschaft mbH)
Stefan Osterhage(Managing Director ofHELLA Geschäftsführungsgesellschaft mbH)
Dr. Rolf Breidenbach(CEO ofHELLA Geschäftsführungsgesellschaft mbH)
Dr. Wolfgang Ollig (Managing Director ofHELLA Geschäftsführungsgesellschaft mbH)
Dr. Matthias Schöllmann(Managing Director ofHELLA Geschäftsführungsgesellschaft mbH)

32 GLOSSARY
GLOSSARY
Adjusted EBITEarnings before interest and income taxes and the non-recurring charges arising from the loss of the supplier in China, as well as the costs incurred in conjunction with the voluntary partial retirement and severance payment programme.
Adjusted EBIT marginEarnings before interest and income taxes and the non-recurring charges arising from the loss of the supplier in China, as well as the costs incurred in conjunction with the voluntary partial retirement and severance payment programme relative to sales.
Adjusted EBITDA Earnings before depreciation and amortisation, interest and income taxes and the non-recurring charges arising from the loss of the supplier in China, as well as the costs incurred in conjunction with the voluntary partial retirement and sever -ance payment programme relative to sales.
Adjusted EBITDA marginEarnings before depreciation and amortisation, interest income taxes and the non-recurring charges arising from the loss of the supplier in China, as well as the costs incurred in conjunction with the voluntary partial retirement and severance payment programme relative to sales.
AFLACAcronym for “American Family Life Assurance Company”. Ameri-can insurance company specialised in health and life insurance.
Asia / Pacific / RoWThe Asia / Pacific region comprises the countries of Asia as well as Australia and New Zealand. “Rest of world” is the term used to cover all other countries outside of those regions mentioned specifically, such as the African states.
AssociatesAssociates are companies over which the Group exercises signi-ficant influence but no control.
At equityInclusion in the consolidated financial statements using the equity method with proportional equity.
ComplianceCompliance with regulations and social norms
DBO (defined benefit obligation)Value of obligations arising from the company pension scheme
EBIT (earnings before interest and taxes)Earnings before interest payments and income taxes
EBIT marginReturn on sales (ratio of EBIT to sales)
EBITDA (earnings before interest, taxes, depreciation and amortisation)Earnings before depreciation, amortisation, interest and income taxes
EBITDA marginRatio of EBITDA to sales
EBT (earnings before taxes)Profit before income taxes
EmployeesUnless defined otherwise, the employees are permanent staff.
IFRS (International Financial Reporting Standards)International accounting rules for company financial statements to guarantee international comparability of annual and consoli-dated financial statements

33GLOSSARY
Joint venturesJoint ventures are joint arrangements in which HELLA exercises joint control together with other partners and also has rights to the arrangement’s equity.
KGaA Acronym for “Kommanditgesellschaft auf Aktien”, a partnership limited by shares. The KGaA combines the elements of a stock corporation with those of a limited partnership.
NAFTA Acronym for “North American Free Trade Agreement”. The North American Free Trade Agreement is a trade association between Canada, the USA and Mexico, and forms a free trade zone in North America.
Net capital expenditures Payments for the acquisition of property, plant and equipment and intangible assets less cash proceeds from the sale of property, plant and equipment and intangible assets as well as payments received for series production.
Net debt Net debt as the balance of cash and cash equivalents and current financial assets and current and non-current financial liabilities.
North and South America This region comprises all countries of North and South America.
Operating cash flow Cash generated from operating activities after capital expenditure, excluding company acquisitions and restructuring measures
Rating In terms of financial accounting, the rating is a method for classifying creditworthiness. This rating is issued by indepen-dent rating agencies on the basis of a company analysis.
R&DResearch and development
Rest of Europe This region comprises all countries in Europe including Turkey and Russia but excluding Germany.
Return on equity The return on equity is a ratio calculated by dividing net income by shareholders’ equity.
Segment sales Sales with third-party companies and other business segments
Segment sales of the business divisionSales with third-party companies, other business segments and other business divisions of the same business segment
SOE, Special OE (Special Original Equipment)Designation of “Special Original Equipment” at HELLA. In this division HELLA systematically taps customer target groups outside the automotive original equipment market, such as manufacturers of caravans/motorhomes, agricultural machi-nery and construction machinery as well as municipalities.
Tier-1 supplier First-level supplier
Working capitalHoldings plus trade receivables minus trade receivables

34 CONSOLIDATED FINANCIAL STATEMENTS
HELLA KGaA Hueck & Co.Rixbecker Straße 7559552 Lippstadt /GermanyPhone + 49 2941 38-0Fax + 49 2941 [email protected]
© HELLA KGaA Hueck & Co., Lippstadt/Germany9Z2 999 137-635 Printed in Germany