six-month financial report - carrefour group six-month... · · 2014-07-31came to the...
TRANSCRIPT
SIX-MONTHFINANCIAL REPORTFINANCIAL REPORTJUNE 30, 2014
SIX-MONTH FINANCIAL REPORT – JUNE 30, 2014
Contents
Certification by the person responsible page 2
Management’s discussion and analysis Six-month period ended June 30, 2014 page 3
Condensed Consolidated Financial Statements Six- month period ended June 30, 2014 Condensed Consolidated Financial Statements page 14
Notes to the Condensed Consolidated Financial Statements page 20
Statutory Auditors’ review report on the first half-year financial information page 37
SIX-MONTH FINANCIAL REPORT – 30 JUNE 2014
2
Certification by the person responsible
I hereby certify that, to the best of my knowledge, the condensed consolidated financial statements ended June
30, 2014 were prepared in accordance with applicable accounting standards and give a true and fair view of the
assets and liabilities, financial situation and income of the Company and of all the consolidated companies, and
that the attached six-month financial report gives a true and fair view of the significant events having occurred
during the first six months of the financial year, of their impact on the financial statements, of the main related
party transactions, as well as a description of the main risks and uncertainties for the remaining six months of the
financial year.
Georges Plassat
Chairman and Chief Executive Officer
SIX-MONTH FINANCIAL REPORT – 30 JUNE 2014
3
MANAGEMENT’S DISCUSSION AND ANALYSIS
Six-month period ended June 30, 2014
Contents 1. Sales and earnings performance 1.1 Main earnings indicators 1.2 Analysis of the main income statement items 2. Financial position 2.1 Shareholders’ equity 2.2 Net debt 2.3 Statement of cash flows 2.4 Financing and liquid resources 2.5 Restrictions on the use of capital resources 2.6 Expected sources of funding 3. Outlook for 2014 4. Other information 4.1 Accounting principles 4.2 Significant events of the period 4.3 Main related party transactions 4.4 Subsequent events
This is a free translation in English of the Carrefour group’s Management’s Discussion and Analysis for the six-month period ended June 30, 2014, issued in the French language, provided solely for the convenience of English speaking users.
SIX-MONTH FINANCIAL REPORT – 30 JUNE 2014
4
1. Sales and earnings performance
1.1 Main earnings indicators
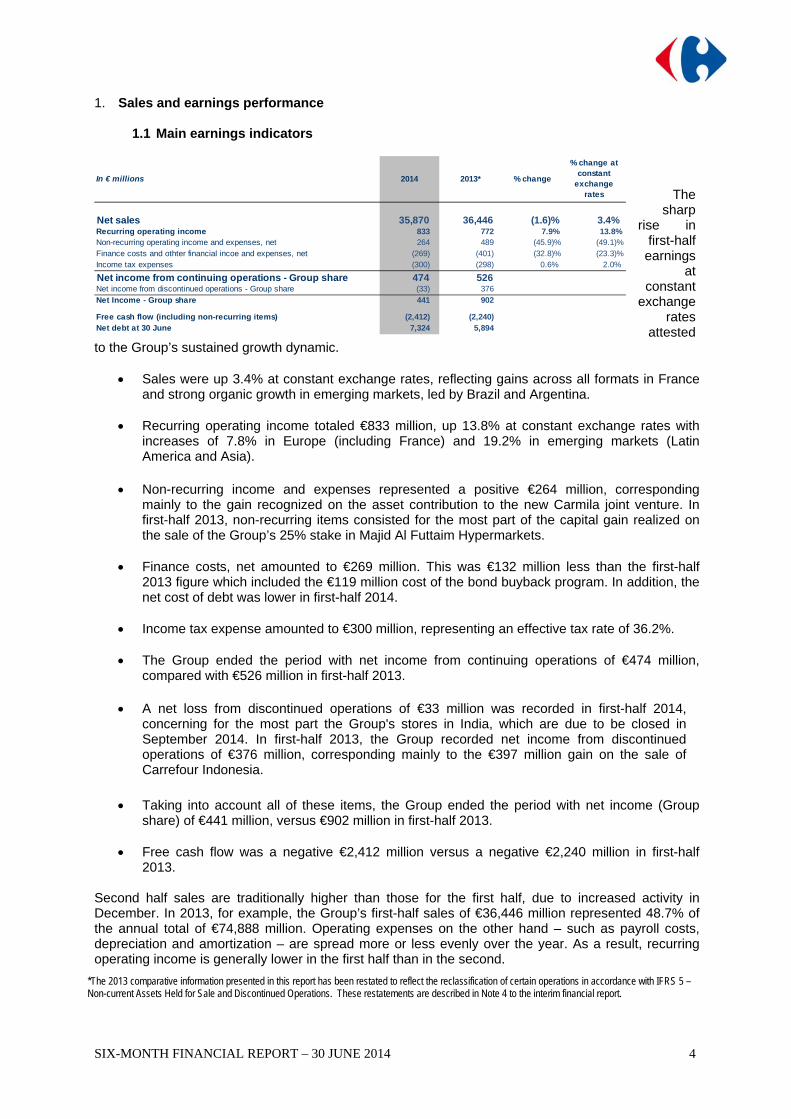
The sharp
rise in first-half
earnings at
constant exchange
rates attested
to the Group’s sustained growth dynamic.
Sales were up 3.4% at constant exchange rates, reflecting gains across all formats in France and strong organic growth in emerging markets, led by Brazil and Argentina.
Recurring operating income totaled €833 million, up 13.8% at constant exchange rates with increases of 7.8% in Europe (including France) and 19.2% in emerging markets (Latin America and Asia).
Non-recurring income and expenses represented a positive €264 million, corresponding mainly to the gain recognized on the asset contribution to the new Carmila joint venture. In first-half 2013, non-recurring items consisted for the most part of the capital gain realized on the sale of the Group’s 25% stake in Majid Al Futtaim Hypermarkets.
Finance costs, net amounted to €269 million. This was €132 million less than the first-half
2013 figure which included the €119 million cost of the bond buyback program. In addition, the net cost of debt was lower in first-half 2014.
Income tax expense amounted to €300 million, representing an effective tax rate of 36.2%.
The Group ended the period with net income from continuing operations of €474 million,
compared with €526 million in first-half 2013.
A net loss from discontinued operations of €33 million was recorded in first-half 2014, concerning for the most part the Group's stores in India, which are due to be closed in September 2014. In first-half 2013, the Group recorded net income from discontinued operations of €376 million, corresponding mainly to the €397 million gain on the sale of Carrefour Indonesia.
Taking into account all of these items, the Group ended the period with net income (Group
share) of €441 million, versus €902 million in first-half 2013.
Free cash flow was a negative €2,412 million versus a negative €2,240 million in first-half 2013.
Second half sales are traditionally higher than those for the first half, due to increased activity in December. In 2013, for example, the Group’s first-half sales of €36,446 million represented 48.7% of the annual total of €74,888 million. Operating expenses on the other hand – such as payroll costs, depreciation and amortization – are spread more or less evenly over the year. As a result, recurring operating income is generally lower in the first half than in the second.
*The 2013 comparative information presented in this report has been restated to reflect the reclassification of certain operations in accordance with IFRS 5 – Non-current Assets Held for Sale and Discontinued Operations. These restatements are described in Note 4 to the interim financial report.
In € millions 2014 2013* % change
% change at constant
exchange rates
Net sales 35,870 36,446 (1.6)% 3.4% Recurring operating income 833 772 7.9% 13.8% Non-recurring operating income and expenses, net 264 489 (45.9)% (49.1)%Finance costs and othter financial incoe and expenses, net (269) (401) (32.8)% (23.3)%Income tax expenses (300) (298) 0.6% 2.0%
Net income from continuing operations - Group share 474 526Net income from discontinued operations - Group share (33) 376
Net Income - Group share 441 902
Free cash flow (including non-recurring items) (2,412) (2,240)Net debt at 30 June 7,324 5,894
SIX-MONTH FINANCIAL REPORT – 30 JUNE 2014
5
Cash flows generated by the Group are also strongly influenced by seasonal trends, with working capital becoming sharply negative in the first half as a result of the large volume of supplier payments due at the beginning of the year for the purchases made ahead of the previous year’s peak selling period in December.
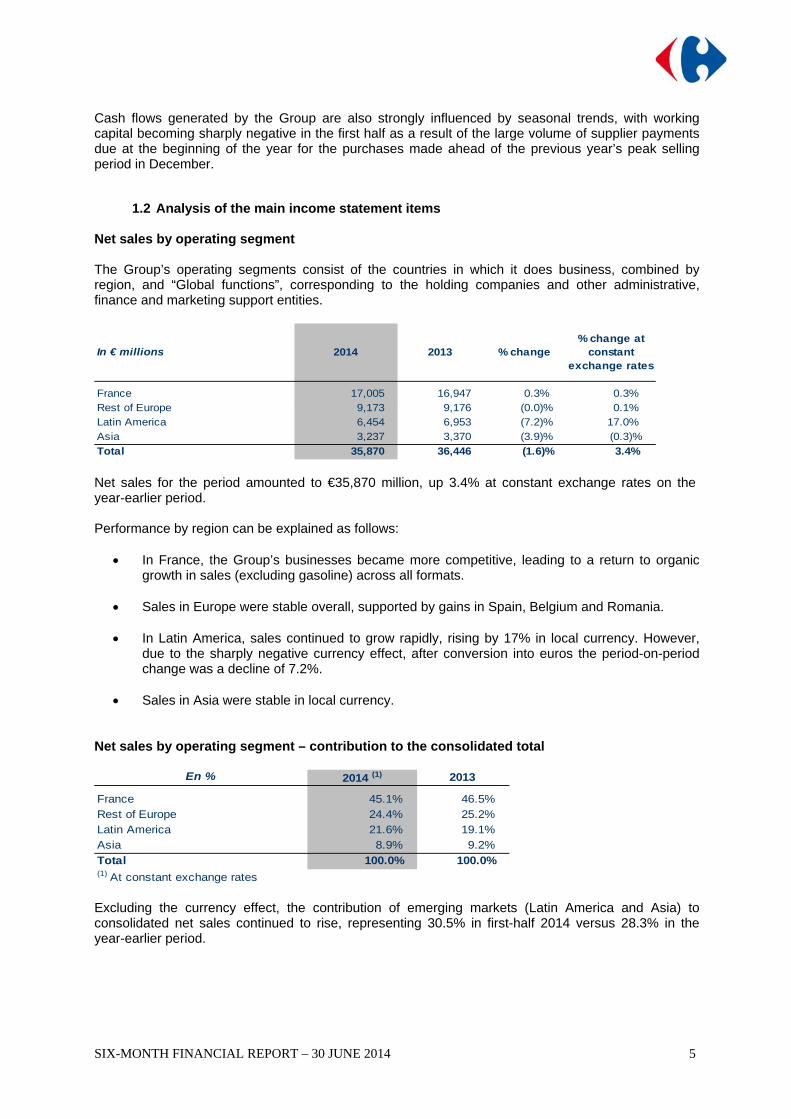
1.2 Analysis of the main income statement items Net sales by operating segment The Group’s operating segments consist of the countries in which it does business, combined by region, and “Global functions”, corresponding to the holding companies and other administrative, finance and marketing support entities.
In € millions 2014 2013 % change % change at
constant exchange rates
France 17,005 16,947 0.3% 0.3% Rest of Europe 9,173 9,176 (0.0)% 0.1% Latin America 6,454 6,953 (7.2)% 17.0% Asia 3,237 3,370 (3.9)% (0.3)%
Total 35,870 36,446 (1.6)% 3.4% Net sales for the period amounted to €35,870 million, up 3.4% at constant exchange rates on the year-earlier period. Performance by region can be explained as follows:
In France, the Group’s businesses became more competitive, leading to a return to organic growth in sales (excluding gasoline) across all formats.
Sales in Europe were stable overall, supported by gains in Spain, Belgium and Romania.
In Latin America, sales continued to grow rapidly, rising by 17% in local currency. However, due to the sharply negative currency effect, after conversion into euros the period-on-period change was a decline of 7.2%.
Sales in Asia were stable in local currency.
Net sales by operating segment – contribution to the consolidated total
2014 (1) 2013
France 45.1% 46.5%Rest of Europe 24.4% 25.2%Latin America 21.6% 19.1%Asia 8.9% 9.2%
Total 100.0% 100.0%(1) At constant exchange rates
En %
Excluding the currency effect, the contribution of emerging markets (Latin America and Asia) to consolidated net sales continued to rise, representing 30.5% in first-half 2014 versus 28.3% in the year-earlier period.
SIX-MONTH FINANCIAL REPORT – 30 JUNE 2014
6
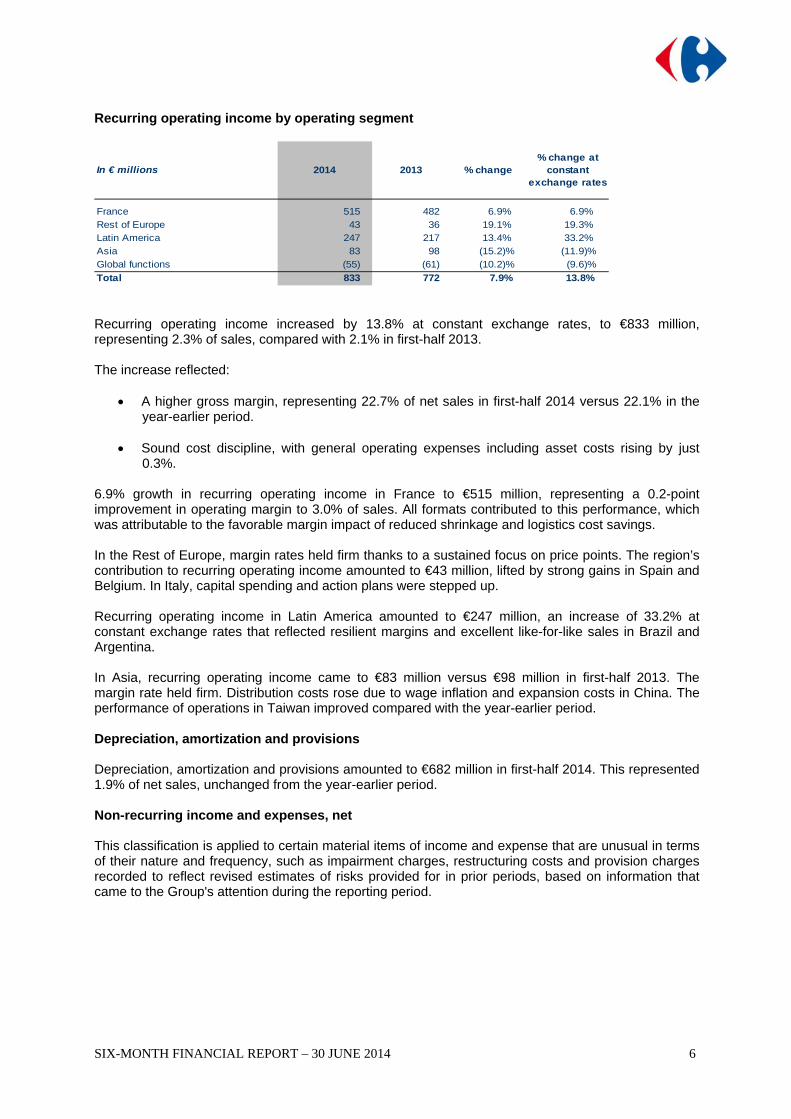
Recurring operating income by operating segment
In € millions 2014 2013 % change % change at
constant exchange rates
France 515 482 6.9% 6.9% Rest of Europe 43 36 19.1% 19.3% Latin America 247 217 13.4% 33.2% Asia 83 98 (15.2)% (11.9)%Global functions (55) (61) (10.2)% (9.6)%
Total 833 772 7.9% 13.8% Recurring operating income increased by 13.8% at constant exchange rates, to €833 million, representing 2.3% of sales, compared with 2.1% in first-half 2013. The increase reflected:
A higher gross margin, representing 22.7% of net sales in first-half 2014 versus 22.1% in the year-earlier period.
Sound cost discipline, with general operating expenses including asset costs rising by just
0.3%. 6.9% growth in recurring operating income in France to €515 million, representing a 0.2-point improvement in operating margin to 3.0% of sales. All formats contributed to this performance, which was attributable to the favorable margin impact of reduced shrinkage and logistics cost savings. In the Rest of Europe, margin rates held firm thanks to a sustained focus on price points. The region’s contribution to recurring operating income amounted to €43 million, lifted by strong gains in Spain and Belgium. In Italy, capital spending and action plans were stepped up. Recurring operating income in Latin America amounted to €247 million, an increase of 33.2% at constant exchange rates that reflected resilient margins and excellent like-for-like sales in Brazil and Argentina. In Asia, recurring operating income came to €83 million versus €98 million in first-half 2013. The margin rate held firm. Distribution costs rose due to wage inflation and expansion costs in China. The performance of operations in Taiwan improved compared with the year-earlier period. Depreciation, amortization and provisions Depreciation, amortization and provisions amounted to €682 million in first-half 2014. This represented 1.9% of net sales, unchanged from the year-earlier period. Non-recurring income and expenses, net This classification is applied to certain material items of income and expense that are unusual in terms of their nature and frequency, such as impairment charges, restructuring costs and provision charges recorded to reflect revised estimates of risks provided for in prior periods, based on information that came to the Group's attention during the reporting period.
SIX-MONTH FINANCIAL REPORT – 30 JUNE 2014
7
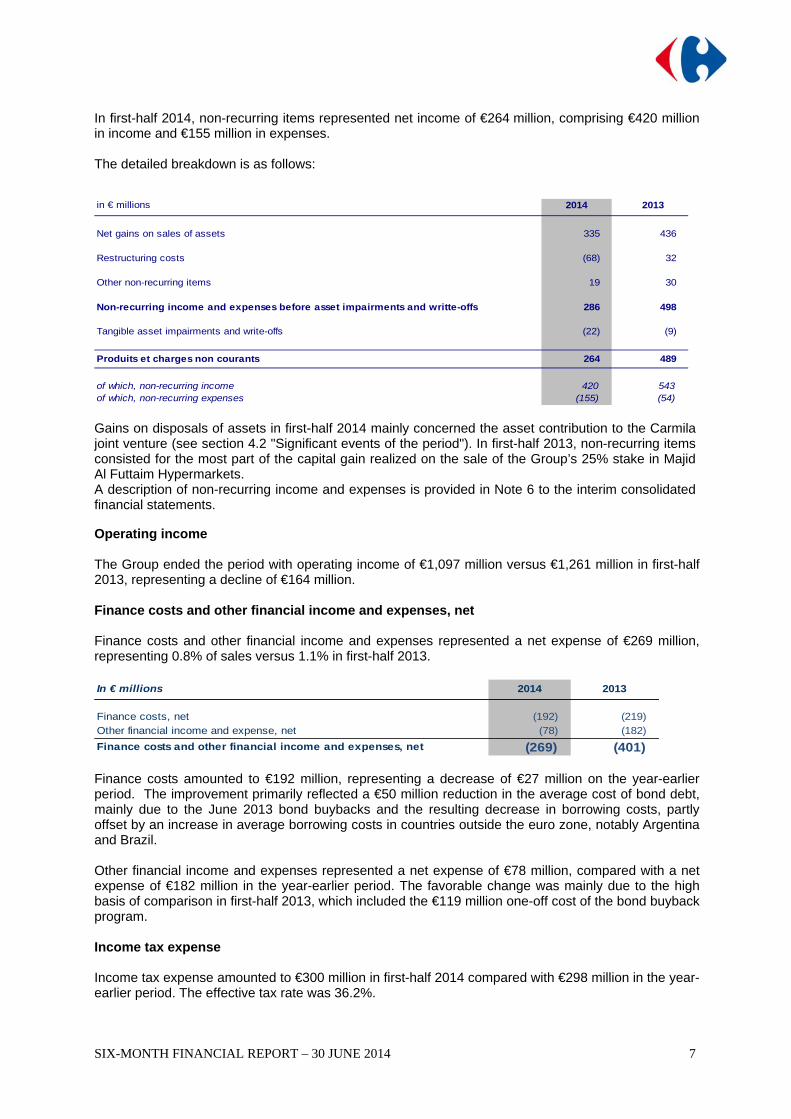
In first-half 2014, non-recurring items represented net income of €264 million, comprising €420 million in income and €155 million in expenses. The detailed breakdown is as follows:
in € millions 2014 2013
Net gains on sales of assets 335 436
Restructuring costs (68) 32
Other non-recurring items 19 30
Non-recurring income and expenses before asset impairments and writte-offs 286 498
Tangible asset impairments and write-offs (22) (9)
Produits et charges non courants 264 489
of which, non-recurring income 420 543of which, non-recurring expenses (155) (54) Gains on disposals of assets in first-half 2014 mainly concerned the asset contribution to the Carmila joint venture (see section 4.2 "Significant events of the period"). In first-half 2013, non-recurring items consisted for the most part of the capital gain realized on the sale of the Group’s 25% stake in Majid Al Futtaim Hypermarkets. A description of non-recurring income and expenses is provided in Note 6 to the interim consolidated financial statements.
Operating income The Group ended the period with operating income of €1,097 million versus €1,261 million in first-half 2013, representing a decline of €164 million. Finance costs and other financial income and expenses, net Finance costs and other financial income and expenses represented a net expense of €269 million, representing 0.8% of sales versus 1.1% in first-half 2013. In € millions 2014 2013
Finance costs, net (192) (219)Other financial income and expense, net (78) (182)
Finance costs and other financial income and expenses, net (269) (401) Finance costs amounted to €192 million, representing a decrease of €27 million on the year-earlier period. The improvement primarily reflected a €50 million reduction in the average cost of bond debt, mainly due to the June 2013 bond buybacks and the resulting decrease in borrowing costs, partly offset by an increase in average borrowing costs in countries outside the euro zone, notably Argentina and Brazil. Other financial income and expenses represented a net expense of €78 million, compared with a net expense of €182 million in the year-earlier period. The favorable change was mainly due to the high basis of comparison in first-half 2013, which included the €119 million one-off cost of the bond buyback program. Income tax expense Income tax expense amounted to €300 million in first-half 2014 compared with €298 million in the year-earlier period. The effective tax rate was 36.2%.
SIX-MONTH FINANCIAL REPORT – 30 JUNE 2014
8
Net income from companies accounted for by the equity method Net income from companies accounted for by the equity method amounted to €9 million versus €25 million in first-half 2013. The decrease was mainly due to the sale of the Group’s interest in Majid Al Futtaim Hypermarkets, which was previously accounted for by the equity method. Net income attributable to non-controlling interests Net income attributable to non-controlling interests came to €63 million in first-half 2014 versus €53 million in the year-earlier period. Net income from continuing operations – Group share The Group reported net income from continuing operations of €474 million in first-half 2014, compared with €526 million in first-half 2013. Net income/(loss) from discontinued operations – Group share In first-half 2014, a net loss from discontinued operations – Group share of €33 million was recorded, concerning for the most part the Group's stores in India, which are due to be closed in September 2014. In first-half 2013, this item represented net income of €376 million and consisted mainly of the gain on the sale of Carrefour Indonesia, and of the Group’s share of results for the period in Turkey, along with the costs incurred for the reorganization of the local partnership with Sabanci. 2. Financial position
2.1 Shareholders’ equity
At June 30, 2014, shareholders’ equity stood at €8,940 million, compared with €8,597 million at December 31, 2013. The €343 million increase reflected:
Income for the period of €504 million. Exchange differences on translating foreign operations for €92 million. Dividend payments of €484 million, of which €434 million paid to Carrefour shareholders
(including €285 million paid in stock) and €50 million to minority shareholders of subsidiaries. Net actuarial losses recognized in the period for €53 million.
2.2 Net debt
Net debt increased by €3,207 million over the period to €7,324 million at June 30, 2014 from €4,117 million at December 31, 2013. Year-end net debt is systematically lower due to the high volume of business in the month of December. At June 30, 2013, net debt was €5,894 million.
SIX-MONTH FINANCIAL REPORT – 30 JUNE 2014
9
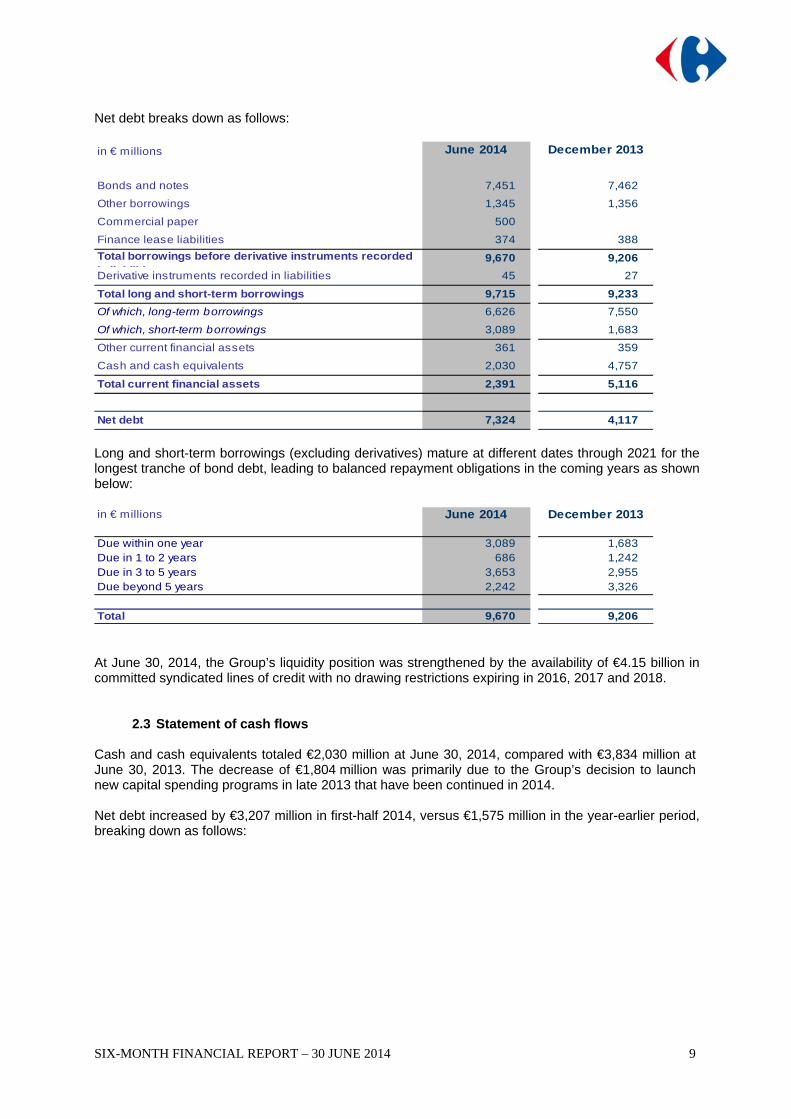
Net debt breaks down as follows: in € millions June 2014 December 2013
Bonds and notes 7,451 7,462
Other borrowings 1,345 1,356
Commercial paper 500
Finance lease liabilities 374 388
Total borrowings before derivative instruments recorded i li biliti
9,670 9,206
Derivative instruments recorded in liabilities 45 27
Total long and short-term borrowings 9,715 9,233
Of which, long-term borrowings 6,626 7,550
Of which, short-term borrowings 3,089 1,683
Other current financial assets 361 359
Cash and cash equivalents 2,030 4,757
Total current financial assets 2,391 5,116
Net debt 7,324 4,117 Long and short-term borrowings (excluding derivatives) mature at different dates through 2021 for the longest tranche of bond debt, leading to balanced repayment obligations in the coming years as shown below: in € millions June 2014 December 2013
Due within one year 3,089 1,683Due in 1 to 2 years 686 1,242Due in 3 to 5 years 3,653 2,955Due beyond 5 years 2,242 3,326
Total 9,670 9,206 At June 30, 2014, the Group’s liquidity position was strengthened by the availability of €4.15 billion in committed syndicated lines of credit with no drawing restrictions expiring in 2016, 2017 and 2018.
2.3 Statement of cash flows Cash and cash equivalents totaled €2,030 million at June 30, 2014, compared with €3,834 million at June 30, 2013. The decrease of €1,804 million was primarily due to the Group’s decision to launch new capital spending programs in late 2013 that have been continued in 2014. Net debt increased by €3,207 million in first-half 2014, versus €1,575 million in the year-earlier period, breaking down as follows:
SIX-MONTH FINANCIAL REPORT – 30 JUNE 2014
10
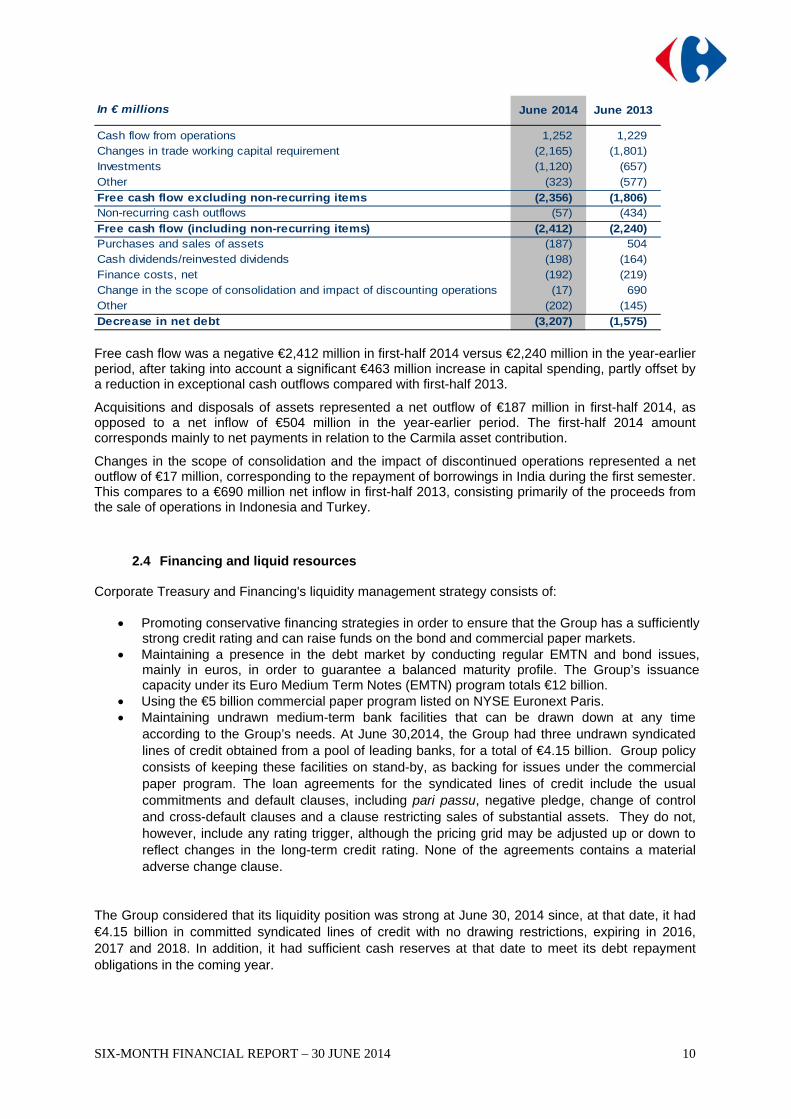
June 2014 June 2013
Cash flow from operations 1,252 1,229Changes in trade working capital requirement (2,165) (1,801)Investments (1,120) (657)Other (323) (577)
Free cash flow excluding non-recurring items (2,356) (1,806)Non-recurring cash outflows (57) (434)
Free cash flow (including non-recurring items) (2,412) (2,240)Purchases and sales of assets (187) 504Cash dividends/reinvested dividends (198) (164)Finance costs, net (192) (219)Change in the scope of consolidation and impact of discounting operations (17) 690Other (202) (145)
Decrease in net debt (3,207) (1,575)
In € millions
Free cash flow was a negative €2,412 million in first-half 2014 versus €2,240 million in the year-earlier period, after taking into account a significant €463 million increase in capital spending, partly offset by a reduction in exceptional cash outflows compared with first-half 2013.
Acquisitions and disposals of assets represented a net outflow of €187 million in first-half 2014, as opposed to a net inflow of €504 million in the year-earlier period. The first-half 2014 amount corresponds mainly to net payments in relation to the Carmila asset contribution.
Changes in the scope of consolidation and the impact of discontinued operations represented a net outflow of €17 million, corresponding to the repayment of borrowings in India during the first semester. This compares to a €690 million net inflow in first-half 2013, consisting primarily of the proceeds from the sale of operations in Indonesia and Turkey.
2.4 Financing and liquid resources
Corporate Treasury and Financing's liquidity management strategy consists of:
Promoting conservative financing strategies in order to ensure that the Group has a sufficiently strong credit rating and can raise funds on the bond and commercial paper markets.
Maintaining a presence in the debt market by conducting regular EMTN and bond issues, mainly in euros, in order to guarantee a balanced maturity profile. The Group’s issuance capacity under its Euro Medium Term Notes (EMTN) program totals €12 billion.
Using the €5 billion commercial paper program listed on NYSE Euronext Paris. Maintaining undrawn medium-term bank facilities that can be drawn down at any time
according to the Group’s needs. At June 30,2014, the Group had three undrawn syndicated lines of credit obtained from a pool of leading banks, for a total of €4.15 billion. Group policy consists of keeping these facilities on stand-by, as backing for issues under the commercial paper program. The loan agreements for the syndicated lines of credit include the usual commitments and default clauses, including pari passu, negative pledge, change of control and cross-default clauses and a clause restricting sales of substantial assets. They do not, however, include any rating trigger, although the pricing grid may be adjusted up or down to reflect changes in the long-term credit rating. None of the agreements contains a material adverse change clause.
The Group considered that its liquidity position was strong at June 30, 2014 since, at that date, it had €4.15 billion in committed syndicated lines of credit with no drawing restrictions, expiring in 2016, 2017 and 2018. In addition, it had sufficient cash reserves at that date to meet its debt repayment obligations in the coming year.
SIX-MONTH FINANCIAL REPORT – 30 JUNE 2014
11
The Group’s debt profile is balanced, with no peak in refinancing needs across the remaining life of bond debt, which averages 3.7 years. On July 15, 2014, the Group issued €1,000 million worth of 8-year 1.75% bonds due July 2022 and retired two existing issues representing an aggregate nominal amount of €318 million (see section 4.4 “Subsequent events”). At June 30, 2014, Carrefour was rated BBB+/A-2 outlook stable by S&P. Similarly, Carrefour Banque’s S&P rating at that date was BBB+/A-2, outlook stable.
2.5 Restrictions on the use of capital resources
At June 30, 2014, there were no restrictions that could materially affect the availability of the cash and cash equivalent balances of foreign subsidiaries.
2.6 Expected sources of funding To meet its commitments, Carrefour can use its free cash flow and raise debt capital using its EMTN and commercial paper programs, as well as its credit lines.
3. Outlook for 2014 The priorities for this year, as announced during the 2013 results presentation last March, are confirmed:
Continue action plans in all countries aiming at continuous improvement of its offer and price image to enhance the shopping experience, notably in its three largest markets, France, Brazil and Spain
Accelerate multi-channel roll-out o Revamp and convergence of our websites in France, gradual broadening of our offer o Continued development of click & collect
Implement new structural projects including:
o Revamp of the supply chain in France o IT rationalization
Enhance the attractiveness of our sites in France, Spain and Italy by capitalizing on the
creation of a shopping mall company
Accelerate store remodelings and relaunch multi-format expansion o Investments of between €2.4bn and €2.5bn in 2014 o Intensification of the remodeling plan o Continued long-term growth in emerging markets, particularly in China and Brazil
Maintain strict financial discipline
4. Other information
4.1 Accounting principles The condensed interim consolidated financial statements for the six-month period ended June 30, 2014 have been prepared in accordance with IAS 34 – Interim Financial Reporting.
SIX-MONTH FINANCIAL REPORT – 30 JUNE 2014
12
The accounting and calculation methods used to prepare the consolidated financial statements for the six-month period ended June 30, 2014 are the same as those used for the 2013 consolidated financial statements, except for the adoption of the following standards whose application did not have any material impact on the consolidated financial statements: - IFRS 10 – Consolidated Financial Statements - IFRS 11 – Joint Arrangements - IFRS 12 – Disclosure of Interests in Other Entities - IAS 28 (revised) – Investments in Associates and Joint Ventures The other new or amended standards and interpretations applicable in the European Union as of January 1, 2014 do not have a material impact on the consolidated financial statements or do not concern the Group. Details of the new and amended standards and interpretations, including those not yet adopted for use in the European Union, are provided in Note 1.2 “IFRSs and interpretations applied by the Group”.
4.2 Significant events of the period Creation of a company for shopping centers adjacent to the Group’s hypermarkets in Europe On December 16, 2013, Carrefour announced that it had signed a memorandum of understanding with Klépierre for the purchase of 127 shopping centers. Following signature of the final agreement between the partners on January 24, 2014, consultation of employee representative bodies and the approval of the relevant regulatory authorities, on April 16, 2014, the Group and its co-investment partners announced the creation of Carmila, a company dedicated to enhancing the value of the shopping centers adjacent to Carrefour hypermarkets in France, Spain and Italy. Carmila owns a portfolio of 171 shopping centers comprising:
- On the one hand, 126 sites in France, Spain and Italy acquired on April 16, 2014 from Klépierre for a market value of €2.0 billion;
- On the other hand, 45 sites in France contributed by Carrefour with a market value of €0.7 billion.
Initial funding consists of €1.8 billion in equity, contributed by the co-investors for €1.0 billion and by Carrefour for €0.8 billion (of which €0.7 billion through the transfer of assets at market value and €0.1 million in cash), and €0.9 billion in bank credit lines obtained by Carmila. At December 31, 2013, the properties at the 45 sites concerned were reclassified as held for sale, in accordance with IFRS 5 – Non-current Assets Held for Sale and Discontinued Operations. In the 2014 interim consolidated financial statements, in application of the consolidation standards applicable as from 2014 (IFRS 10, IFRS 11 and IAS 28R), the new company has been accounted for by the equity method as it is jointly controlled by Carrefour and its co-investors, which own 42% and 58% of the capital respectively. The carrying amount in the consolidated balance sheet at June 30, 2014 is €784 million. The transaction led to the recognition in non-recurring income of a €333 million capital gain, in line with the accounting treatment specified in IFRS 10 in the case of a loss of control as defined in IFRS 3. 2013 dividend reinvestment option At the Annual General Meeting held on April 15, 2014, shareholders decided to set the 2013 dividend at €0.62 per share with a dividend reinvestment option. The issue price of the shares to be issued in exchange for reinvested dividends was set at €26.10 per share, representing 95% of the average of the opening prices quoted on NYSE Euronext Paris during the 20 trading days preceding the date of the Annual General Meeting, less the net amount of the dividend of €0.62 per share and rounded up to the nearest euro cent.
SIX-MONTH FINANCIAL REPORT – 30 JUNE 2014
13
The option period was open from April 24 to May 15, 2014. At the end of this period, shareholders owning 64.55% of Carrefour's shares had elected to reinvest their 2013 dividends. May 28, 2014 was set as the date for: Settlement/delivery of the 10,929,717 new shares corresponding to reinvested dividends,
leading to a total capital increase of €285 million. Payment of the cash dividend to shareholders who chose not to reinvest their dividends,
representing a total payout of €149 million. Proposed acquisition of Dia’s operations in France On June 20, 2014, the Carrefour Group announced that, following exclusive negotiations with Dia, it had agreed to acquire Dia France based on an enterprise value of €600 million. Completion of the transaction is subject to the signature of final agreements following consultations with DIA France’s employee representative bodies and to the approval of the relevant antitrust authorities. Planned acquisition in Italy On June 30, 2014, Carrefour announced that it had entered into an agreement with the Rewe Group to acquire 53 Billa supermarkets located in northern Italy. The supermarkets represent a total retail surface area of 58,000 sq.m. and generated revenue of some €300 million excluding VAT in 2013. The transaction is subject to the necessary regulatory approvals and completion by Billa of the employee consultation process.
4.3 Main related party transactions The main related party transactions are disclosed in Note 19 to the condensed consolidated financial statements.
4.4 Subsequent events
On July 7, Carrefour announced that it intended to close its five cash & carry stores in India, the
first of which was opened in 2010. The closure plan will be completed by September 2014. On July 15, the Group issued €1,000 million worth of 8-year 1.75% bonds due July 2022.
At the same time, two outstanding issues representing an aggregate €318 million were retired, as follows: €97 million outstanding from a €763 million 4.375% issue due November 2016 €221 million outstanding from a €500 million 5.25% issue due October 2018. The transaction consolidated the Group’s long-term financing at the very attractive interest rates currently available in the market. It led to: A €682 million increase in the face value of the Group's bond debt Optimized future borrowing costs due to an issue at a historically low interest rate An extension of the average maturity of bond debt, from 3.7 years to 4.2 years as from
July 15, 2014.
SIX-MONTH FINANCIAL REPORT – 30 JUNE 2014
14
CONDENSED CONSOLIDATED FINANCIAL STATEMENTS
Six-month period ended June 30, 2014
Contents Consolidated Income Statement Consolidated Statement of Comprehensive Income Consolidated Statement of Financial Position Consolidated Statement of Cash Flows Consolidated Statement of Changes in Shareholders’ Equity Notes to the Consolidated Financial Statements
Note 1: Basis of preparation of the consolidated financial statements Note 2: Summary of significant accounting policies and seasonable fluctuations in business Note 3: Significant events of the period Note 4: Restatement of comparative information Note 5: Segment information Notes 6 to 9: Notes to the consolidated income statement Note 10: Earnings per share (Group share) Note 11: Other comprehensive income Notes 12 to 17: Notes to the consolidated statement of financial position Note 18: Change in working capital requirement Note 19: Related parties Note 20: Off-balance sheet commitments Note 21: Subsequent events Note 22: Scope of consolidation
This is a free translation in English of the Carrefour group’s condensed consolidated financial statements for the six-month period ended June 30,2014 issued in the French language, provided solely for the convenience of English speaking users.
SIX-MONTH FINANCIAL REPORT – 30 JUNE 2014
15
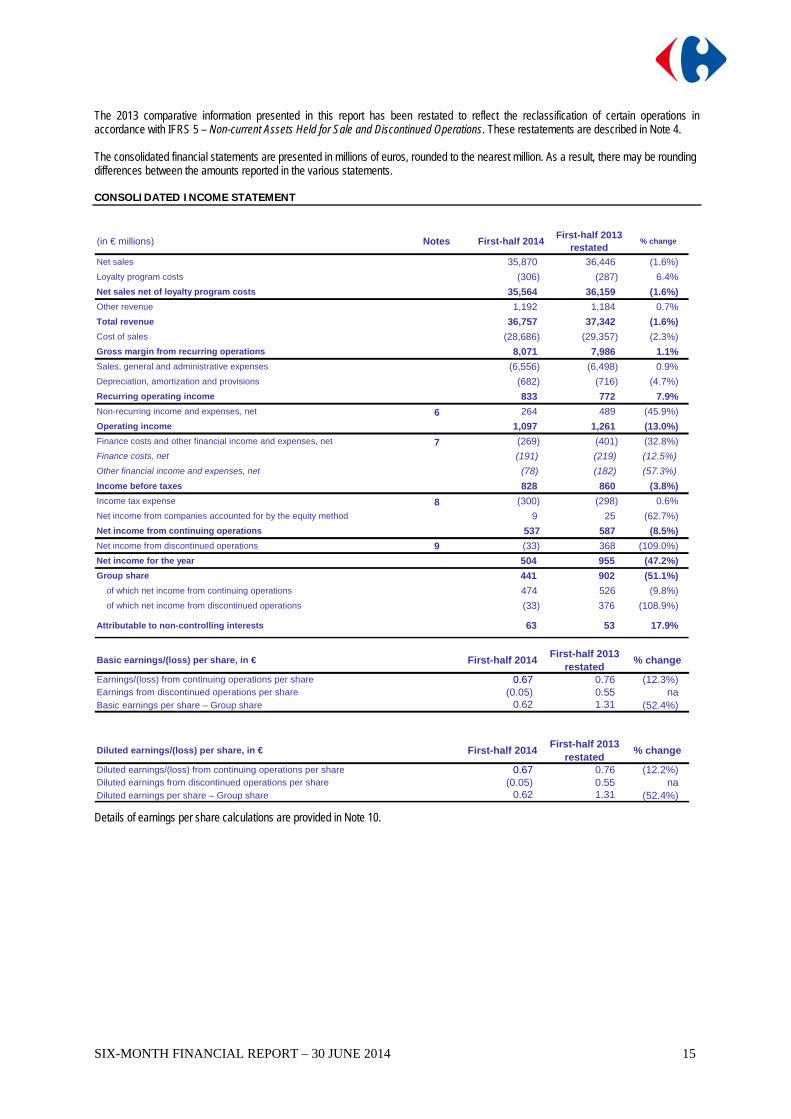
The 2013 comparative information presented in this report has been restated to reflect the reclassification of certain operations in accordance with IFRS 5 – Non-current Assets Held for Sale and Discontinued Operations. These restatements are described in Note 4. The consolidated financial statements are presented in millions of euros, rounded to the nearest million. As a result, there may be rounding differences between the amounts reported in the various statements. CONSOLIDATED INCOME STATEMENT
(in € millions) Notes First-half 2014First-half 2013
restated% change
Net sales 35,870 36,446 (1.6%)
Loyalty program costs (306) (287) 6.4%
Net sales net of loyalty program costs 35,564 36,159 (1.6%)
Other revenue 1,192 1,184 0.7%
Total revenue 36,757 37,342 (1.6%)
Cost of sales (28,686) (29,357) (2.3%)
Gross margin from recurring operations 8,071 7,986 1.1%
Sales, general and administrative expenses (6,556) (6,498) 0.9%
Depreciation, amortization and provisions (682) (716) (4.7%)
Recurring operating income 833 772 7.9%
Non-recurring income and expenses, net 6 264 489 (45.9%)
Operating income 1,097 1,261 (13.0%)
Finance costs and other financial income and expenses, net 7 (269) (401) (32.8%)
Finance costs, net (191) (219) (12.5%)
Other financial income and expenses, net (78) (182) (57.3%)
Income before taxes 828 860 (3.8%)
Income tax expense 8 (300) (298) 0.6%
Net income from companies accounted for by the equity method 9 25 (62.7%)
Net income from continuing operations 537 587 (8.5%)
Net income from discontinued operations 9 (33) 368 (109.0%)
Net income for the year 504 955 (47.2%)
Group share 441 902 (51.1%)
of which net income from continuing operations 474 526 (9.8%)
of which net income from discontinued operations (33) 376 (108.9%)
Attributable to non-controlling interests 63 53 17.9%
Basic earnings/(loss) per share, in € First-half 2014First-half 2013
restated% change
Earnings/(loss) from continuing operations per share 0.67 0.76 (12.3%)Earnings from discontinued operations per share (0.05) 0.55 naBasic earnings per share – Group share 0.62 1.31 (52.4%)
Diluted earnings/(loss) per share, in € First-half 2014First-half 2013
restated% change
Diluted earnings/(loss) from continuing operations per share 0.67 0.76 (12.2%)Diluted earnings from discontinued operations per share (0.05) 0.55 naDiluted earnings per share – Group share 0.62 1.31 (52.4%)
Details of earnings per share calculations are provided in Note 10.
SIX-MONTH FINANCIAL REPORT – 30 JUNE 2014
16
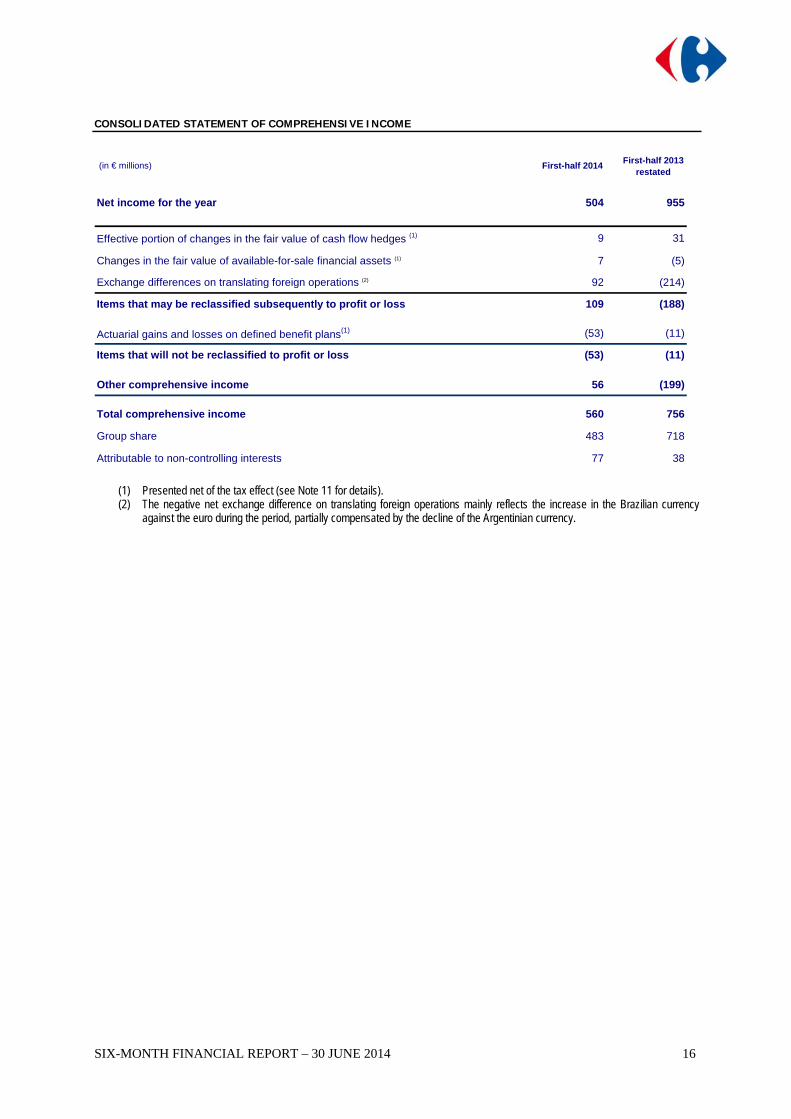
CONSOLIDATED STATEMENT OF COMPREHENSIVE INCOME
(in € millions) First-half 2014First-half 2013
restated
Net income for the year 504 955
Effective portion of changes in the fair value of cash flow hedges (1) 9 31
Changes in the fair value of available-for-sale financial assets (1) 7 (5)
Exchange differences on translating foreign operations (2) 92 (214)
Items that may be reclassified subsequently to profit or loss 109 (188)
Actuarial gains and losses on defined benefit plans(1) (53) (11)
Items that will not be reclassified to profit or loss (53) (11)
Other comprehensive income 56 (199)
Total comprehensive income 560 756
Group share 483 718
Attributable to non-controlling interests 77 38
(1) Presented net of the tax effect (see Note 11 for details). (2) The negative net exchange difference on translating foreign operations mainly reflects the increase in the Brazilian currency
against the euro during the period, partially compensated by the decline of the Argentinian currency.
SIX-MONTH FINANCIAL REPORT – 30 JUNE 2014
17
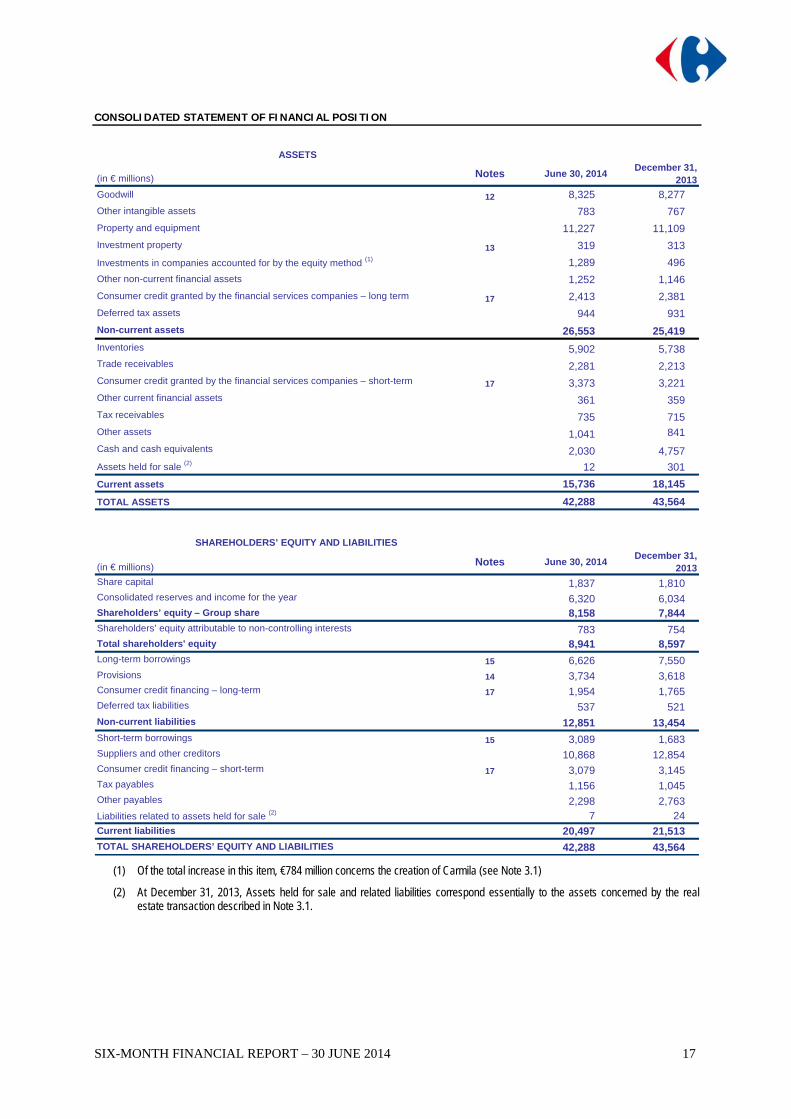
CONSOLIDATED STATEMENT OF FINANCIAL POSITION
ASSETS
(in € millions) Notes June 30, 2014December 31,
2013
Goodwill 12 8,325 8,277
783 767
11,227 11,109
13 319 313
1,289 496
1,252 1,146
17 2,413 2,381
944 931
26,553 25,419
Inventories 5,902 5,738
2,281 2,213
17 3,373 3,221
361 359
735 715
1,041 841
2,030 4,757
12 301
Current assets 15,736 18,145
TOTAL ASSETS 42,288 43,564
SHAREHOLDERS’ EQUITY AND LIABILITIES
(in € millions) Notes June 30, 2014December 31,
2013
1,837 1,810
6,320 6,034 8,158 7,844
783 754 8,941 8,597
15 6,626 7,550 Provisions 14 3,734 3,618
17 1,954 1,765
537 521
12,851 13,454
15 3,089 1,683
10,868 12,854
17 3,079 3,145
1,156 1,045
2,298 2,763 7 24
20,497 21,513
42,288 43,564
Other intangible assets
Property and equipment
Investment property
Investments in companies accounted for by the equity method (1)
Other non-current financial assets
Consumer credit granted by the financial services companies – long term
Shareholders’ equity – Group share
Deferred tax assets
Non-current assets
Trade receivables
Consumer credit granted by the financial services companies – short-term
Other current financial assets
Tax receivables
Total shareholders' equity
Long-term borrowings
Consumer credit financing – long-term
Deferred tax liabilities
Non-current liabilities
Other assets
Cash and cash equivalents
Assets held for sale (2)
Share capital
Consolidated reserves and income for the year
Current liabilities
TOTAL SHAREHOLDERS’ EQUITY AND LIABILITIES
Short-term borrowings
Suppliers and other creditors
Consumer credit financing – short-term
Tax payables
Other payables
Liabilities related to assets held for sale (2)
Shareholders’ equity attributable to non-controlling interests
(1) Of the total increase in this item, €784 million concerns the creation of Carmila (see Note 3.1)
(2) At December 31, 2013, Assets held for sale and related liabilities correspond essentially to the assets concerned by the real estate transaction described in Note 3.1.
SIX-MONTH FINANCIAL REPORT – 30 JUNE 2014
18
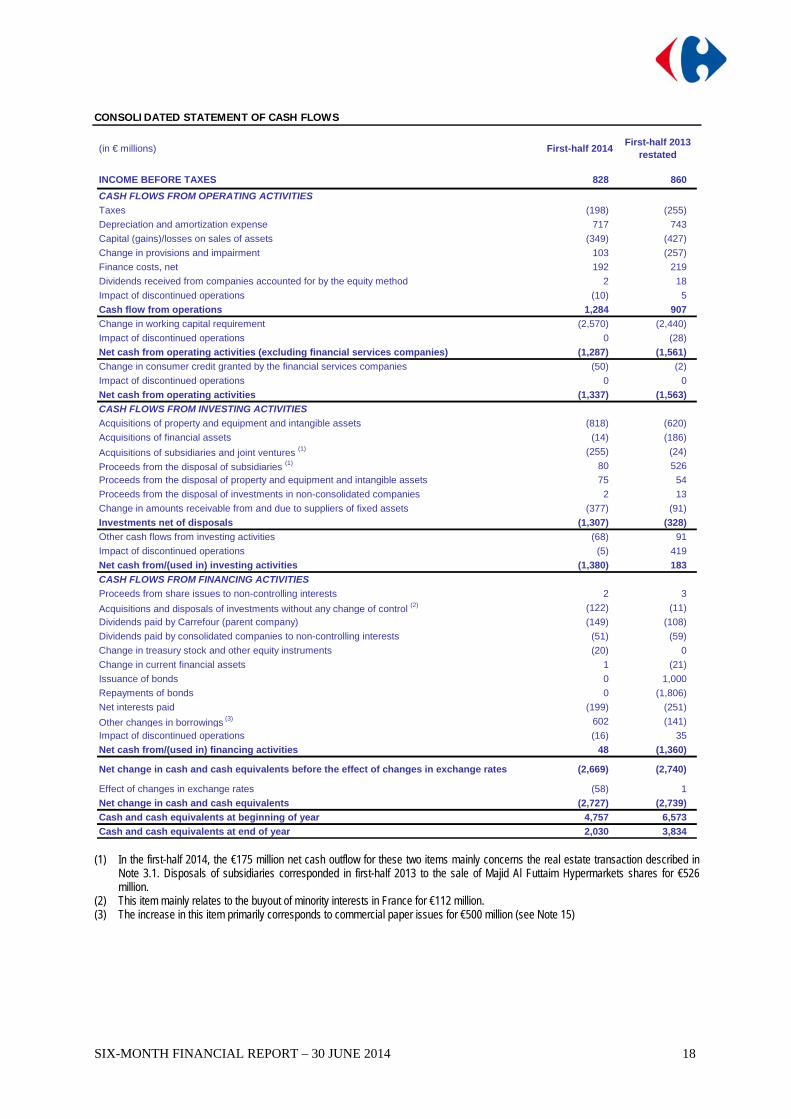
CONSOLIDATED STATEMENT OF CASH FLOWS
(in € millions) First-half 2014First-half 2013
restated
INCOME BEFORE TAXES 828 860
CASH FLOWS FROM OPERATING ACTIVITIES
Taxes (198) (255)
Depreciation and amortization expense 717 743
Capital (gains)/losses on sales of assets (349) (427)
Change in provisions and impairment 103 (257)
Finance costs, net 192 219
Dividends received from companies accounted for by the equity method 2 18
Impact of discontinued operations (10) 5
Cash flow from operations 1,284 907
Change in working capital requirement (2,570) (2,440)
Impact of discontinued operations 0 (28)
Net cash from operating activities (excluding financial services companies) (1,287) (1,561)
Change in consumer credit granted by the financial services companies (50) (2)
Impact of discontinued operations 0 0
Net cash from operating activities (1,337) (1,563)
CASH FLOWS FROM INVESTING ACTIVITIES
Acquisitions of property and equipment and intangible assets (818) (620)
Acquisitions of financial assets (14) (186)
Acquisitions of subsidiaries and joint ventures (1) (255) (24)
Proceeds from the disposal of subsidiaries (1) 80 526
Proceeds from the disposal of property and equipment and intangible assets 75 54
Proceeds from the disposal of investments in non-consolidated companies 2 13
Change in amounts receivable from and due to suppliers of fixed assets (377) (91)
Investments net of disposals (1,307) (328)
Other cash flows from investing activities (68) 91
Impact of discontinued operations (5) 419
Net cash from/(used in) investing activities (1,380) 183
CASH FLOWS FROM FINANCING ACTIVITIES
Proceeds from share issues to non-controlling interests 2 3
Acquisitions and disposals of investments without any change of control (2) (122) (11)
Dividends paid by Carrefour (parent company) (149) (108)
Dividends paid by consolidated companies to non-controlling interests (51) (59)
Change in treasury stock and other equity instruments (20) 0
Change in current financial assets 1 (21)
Issuance of bonds 0 1,000
Repayments of bonds 0 (1,806)
Net interests paid (199) (251)
Other changes in borrowings (3) 602 (141)
Impact of discontinued operations (16) 35
Net cash from/(used in) financing activities 48 (1,360)
Net change in cash and cash equivalents before the effect of changes in exchange rates (2,669) (2,740)
Effect of changes in exchange rates (58) 1
Net change in cash and cash equivalents (2,727) (2,739)
Cash and cash equivalents at beginning of year 4,757 6,573
Cash and cash equivalents at end of year 2,030 3,834 (1) In the first-half 2014, the €175 million net cash outflow for these two items mainly concerns the real estate transaction described in
Note 3.1. Disposals of subsidiaries corresponded in first-half 2013 to the sale of Majid Al Futtaim Hypermarkets shares for €526 million.
(2) This item mainly relates to the buyout of minority interests in France for €112 million. (3) The increase in this item primarily corresponds to commercial paper issues for €500 million (see Note 15)
SIX-MONTH FINANCIAL REPORT – 30 JUNE 2014
19
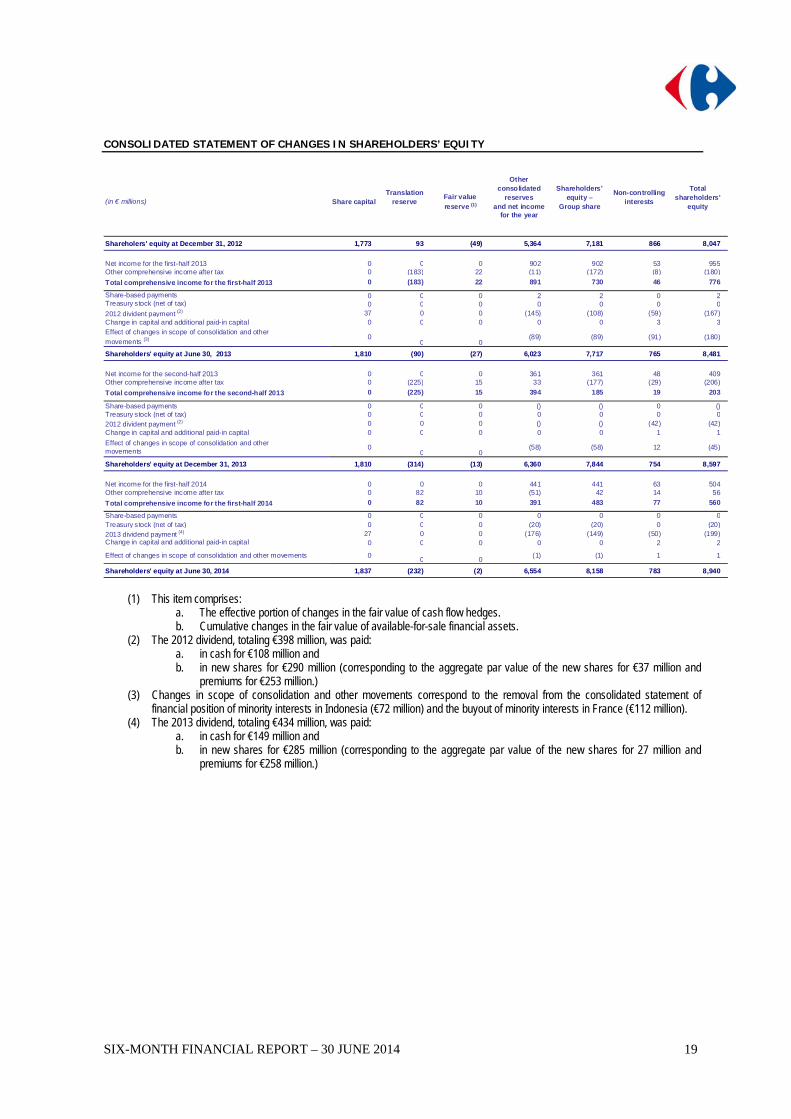
CONSOLIDATED STATEMENT OF CHANGES IN SHAREHOLDERS’ EQUITY
(in € millions) Share capitalTranslation
reserveFair value
reserve (1)
Other consolidated
reserves and net income
for the year
Shareholders’ equity –
Group share
Non-controlling interests
Total shareholders’
equity
Shareholers' equity at December 31, 2012 1,773 93 (49) 5,364 7,181 866 8,047
Net income for the first-half 2013 0 0 0 902 902 53 955Other comprehensive income after tax 0 (183) 22 (11) (172) (8) (180)
Total comprehensive income for the first-half 2013 0 (183) 22 891 730 46 776
Share-based payments 0 0 0 2 2 0 2Treasury stock (net of tax) 0 0 0 0 0 0 02012 divident payment (2) 37 0 0 (145) (108) (59) (167)Change in capital and additional paid-in capital 0 0 0 0 0 3 3Effect of changes in scope of consolidation and other
movements (3) 00 0
(89) (89) (91) (180)
Shareholders' equity at June 30, 2013 1,810 (90) (27) 6,023 7,717 765 8,481
Net income for the second-half 2013 0 0 0 361 361 48 409Other comprehensive income after tax 0 (225) 15 33 (177) (29) (206)
Total comprehensive income for the second-half 2013 0 (225) 15 394 185 19 203
Share-based payments 0 0 0 () () 0 ()Treasury stock (net of tax) 0 0 0 0 0 0 02012 divident payment (2) 0 0 0 () () (42) (42)Change in capital and additional paid-in capital 0 0 0 0 0 1 1
Effect of changes in scope of consolidation and other movements
00 0
(58) (58) 12 (45)
Shareholders' equity at December 31, 2013 1,810 (314) (13) 6,360 7,844 754 8,597
Net income for the first-half 2014 0 0 0 441 441 63 504Other comprehensive income after tax 0 82 10 (51) 42 14 56
Total comprehensive income for the first-half 2014 0 82 10 391 483 77 560
Share-based payments 0 0 0 0 0 0 0Treasury stock (net of tax) 0 0 0 (20) (20) 0 (20)2013 dividend payment (4) 27 0 0 (176) (149) (50) (199)Change in capital and additional paid-in capital 0 0 0 0 0 2 2
Effect of changes in scope of consolidation and other movements 00 0
(1) (1) 1 1
Shareholders' equity at June 30, 2014 1,837 (232) (2) 6,554 8,158 783 8,940
(1) This item comprises:
a. The effective portion of changes in the fair value of cash flow hedges. b. Cumulative changes in the fair value of available-for-sale financial assets.
(2) The 2012 dividend, totaling €398 million, was paid: a. in cash for €108 million and b. in new shares for €290 million (corresponding to the aggregate par value of the new shares for €37 million and
premiums for €253 million.) (3) Changes in scope of consolidation and other movements correspond to the removal from the consolidated statement of
financial position of minority interests in Indonesia (€72 million) and the buyout of minority interests in France (€112 million). (4) The 2013 dividend, totaling €434 million, was paid:
a. in cash for €149 million and b. in new shares for €285 million (corresponding to the aggregate par value of the new shares for 27 million and
premiums for €258 million.)
SIX-MONTH FINANCIAL REPORT – 30 JUNE 2014
20
Notes to the Consolidated Financial Statements NOTE 1: BASIS OF PREPARATION OF THE CONSOLIDATED FINANCIAL STATEMENTS 1.1 Accounting principles and statement of compliance The condensed interim consolidated financial statements for the six months ended June 30, 2014 were approved for publication by the Board of Directors on July 30, 2014. Carrefour (the “Company”) is domiciled in France. The consolidated financial statements for the six months ended June 30, 2014 comprise the financial statements of the Company and its subsidiaries (together the “Group”) and the Group’s share of the profits and losses, assets and liabilities of associated and jointly controlled companies. The presentation currency of the consolidated financial statements is the euro, which is the Company’s functional currency. In accordance with European Regulation (EC) 1606/2002 dated July 19, 2002, the consolidated financial statements for the six-month period ended June 30, 2014 have been prepared in compliance with the international accounting standards adopted for use in the European Union as of June 30, 2014 and applicable at that date, with comparative information for the same period of 2013 and at December 31, 2013 prepared using the same standards. International accounting standards comprise International Financial Reporting Standards (IFRSs), International Accounting Standards (IASs), International Financial Reporting Standards Interpretation Committee (IFRIC) Interpretations and Standing Interpretations Committee (SIC) Interpretations. All of the standards and interpretations adopted for use in the European Union are available on the European Commission’s website, http://ec.europa.eu/internal_market/accounting/ias/index_en.htm. 1.2 IFRSs and interpretations applied by the Group The accounting and calculation methods used to prepare the consolidated financial statements for the six-month period ended June 30, 2014 are the same as those used for the 2013 consolidated financial statements, except as explained below:
IFRS 10 – Consolidated Financial Statements. This standard replaces the sections of IAS 27 – Consolidated and Separate Financial Statements that dealt with consolidated financial statements, and SIC 12 – Consolidation – Special Purpose Entities. IFRS 10 redefines control. In line with the new definition, the Carrefour Group’s consolidated financial statements include the financial statements of all entities that the Group controls directly or indirectly, whatever its percentage interest in their equity. The Group controls an entity when it is exposed, or has rights, to variable returns from its involvement with the entity and has the ability to affect those returns through its power over the entity. Adoption of IFRS 10 had no material impact on the Group’s scope of consolidation.
IFRS 11 – Joint Arrangements. This standard replaces IAS 31 – Interests in Joint Ventures, and SIC 13 – Jointly Controlled Entities: Non-Monetary Contributions by Venturers. IFRS 11 outlines the accounting treatment by entities that jointly control an arrangement. Joint control involves the contractually agreed sharing of control and arrangements subject to joint control are classified as either a joint venture (representing a share of net assets and equity accounted) or a joint operation (representing rights to assets and obligations for liabilities, accounted for accordingly). Carrefour jointly controls an arrangement when decisions about the relevant activities require the unanimous consent of the parties sharing control. The proportionate consolidation method is not recognized under IFRS 11. The Group did not use this method in prior periods. Adoption of IFRS 11 had no material impact on the Group’s scope of consolidation.
IFRS 12 – Disclosure of Interests in Other Entities. This standard lists all the disclosures required when an entity has interests in subsidiaries, joint arrangements, associates or unconsolidated structured entities, whatever the level of control or influence exercised by the entity. IFRS 12 does not apply to interim financial information, unless any material events have occurred during the interim period. The disclosures to be made in the notes to the consolidated financial statements in application of this standard are currently being analyzed.
IAS 28 – Investments in Associates and Joint Ventures, as revised to take into account the changes resulting from the publication of IFRS 10, 11 and 12.
The other new or amended standards and interpretations applicable in the European Union as of January 1, 2014 do not have a material impact on the consolidated financial statements or do not concern the Group.
SIX-MONTH FINANCIAL REPORT – 30 JUNE 2014
21
IFRIC 21 – Levies, that was adopted for use in the European Union on June 13, 2014 and is applicable for annual periods beginning on or after June 17, 2014, has not been early adopted by the Group. This interpretation defines the obligating event that gives rise to the recognition of a liability to pay a levy. At this stage of its analysis, the Group believes that adoption of this interpretation would lead to the recognition in first-half 2014 profit of additional recurring operating expenses of approximately €115 million in respect of levies that are currently recognized over the year. Application of the interpretation will not have any material impact on the Group's annual consolidated financial statements for 2014.
The main standards not yet adopted for use in the European Union are listed below:
IFRS 9 – Financial Instruments ; IFRS 15 – Revenues from contracts with customers (applicable according to the IASB in accounting periods beginning on or
after January 1, 2017) The possible impact on the consolidated financial statements of applying the other new and amended standards is currently being assessed. 1.3 Use of estimates Preparation of consolidated interim financial statements involves the use of management estimates and assumptions that may affect the reported amounts of certain assets, liabilities, income and expenses, as well as the disclosures contained in the notes. These estimates and assumptions are reviewed at regular intervals to ensure that they are reasonable in light of past experience and the current economic situation. Actual results may differ from current estimates. The main management estimates used in the preparation of the consolidated financial statements concern the useful lives of operating assets, the recoverable amount of goodwill and other intangible assets, and property and equipment, the amount of provisions for contingencies and other business-related provisions. The main assumptions concern pension and other post-employment benefit obligations and recognized deferred taxes. NOTE 2: SUMMARY OF SIGNIFICANT ACCOUNTING POLICIES AND SEASONAL FLUCTUATIONS IN BUSINESS 2.1 Accounting methods applied for the interim financial statements The condensed interim consolidated financial statements for the six-month period ended June 30, 2014 have been prepared in accordance with IAS 34 – Interim Financial Reporting. Condensed interim consolidated financial statements do not contain all of the disclosures that would be required in a complete set of annual financial statements. Consequently, these interim financial statements should be read jointly with the Group's consolidated financial statements for the year ended December 31, 2013, as included in the Registration Document filed with the AMF. In particular, the condensed interim consolidated financial statements do not include a detailed description of the accounting policies applied for their preparation. 2.2 Seasonal fluctuations in business Like those of other retailers, Carrefour’s sales are subject to significant seasonal fluctuations, with the result that comparisons between the consolidated financial statements for the first and second halves of the year are not particularly meaningful. This is particularly the case for recurring operating income and cash flow generation between the two periods. Second half sales are traditionally higher than those for the first half, due to increased activity in December. In 2013, for example, the Group’s restated first-half sales amounted to €36,446 million, representing 48.7% of the annual total of €74,888 million. Operating expenses on the other hand – such as payroll costs, depreciation and amortization – are spread more or less evenly over the year. As a result, recurring operating income is generally lower in the first half than in the second. This was the case in 2013, when restated recurring operating income for the first half amounted to €772 million or 34,5% of the €2,238 million total for the year. Cash flows generated by the Group are also strongly influenced by seasonal trends, with working capital requirement rising sharply in the first half as a result of the large volume of supplier payments due at the beginning of the year for the purchases made ahead of the previous year’s peak selling period in December.
SIX-MONTH FINANCIAL REPORT – 30 JUNE 2014
22
NOTE 3: SIGNIFICANT EVENTS OF THE PERIOD 3.1 Creation of a company for shopping centers adjoining the Group’s hypermarkets in Europe On December 16, 2013, Carrefour announced that it had signed a memorandum of understanding with Klépierre for the purchase of 127 shopping centers. Following signature of the final agreement between the partners on January 24, 2014, consultation of employee representative bodies and the approval of the relevant regulatory authorities, on April 16, 2014, the Group and its co-investment partners announced the creation of Carmila, a company dedicated to enhancing the value of the shopping centers adjacent to Carrefour hypermarkets in France, Spain and Italy. Carmila owns a portfolio of 171 shopping centers comprising:
- on the one hand, 126 sites in France, Spain and Italy acquired on April 16, 2014 from Klépierre for a market value of €2.0 billion;
- on the other hand, 45 sites in France contributed by Carrefour with a market value of €0.7 billion. Initial funding consists of €1.8 billion in equity, contributed by the co-investors for €1.0 billion and by Carrefour for €0.8 billion (of which €0.7 billion through the transfer of assets at market value and €0.1 million in cash), and €0.9 billion in bank credit lines obtained by Carmila. As a reminder, at December 31, 2013, the properties at the 45 sites concerned were reclassified as held for sale, in accordance with IFRS 5 – Non-current Assets Held for Sale and Discontinued Operations. In the 2014 interim consolidated financial statements, in application of the consolidation standards applicable as from 2014 (IFRS 10, IFRS 11 and IAS 28R), the new company has been accounted for by the equity method as it is jointly controlled by Carrefour and its co-investors, which own 42% and 58% of the capital respectively. The carrying amount in the consolidated balance sheet at June 30, 2014 is €784 million. The transaction led to the recognition in non-recurring income of a €333 million capital gain, in line with the accounting treatment specified in IFRS 10 in the case of a loss of control of a business as defined in IFRS 3. 3.2 2013 dividend reinvestment option At the Annual General Meeting held on April 15, 2014, shareholders decided to set the 2013 dividend at €0.62 per share with a dividend reinvestment option. The issue price of the shares to be issued in exchange for reinvested dividends was set at €26.10 per share, representing 95% of the average of the opening prices quoted on NYSE Euronext Paris during the 20 trading days preceding the date of the Annual General Meeting, less the net amount of the dividend of €0.62 per share and rounded up to the nearest euro cent. The option period was open from April 24 to May 15, 2014. At the end of this period, shareholders owning 64.55% of Carrefour's shares had elected to reinvest their 2013 dividends. May 28, 2014 was set as the date for: Settlement/delivery of the 10,929,717 new shares corresponding to reinvested dividends, leading to a total capital increase of
€285 million. Payment of the cash dividend to shareholders who chose not to reinvest their dividends, representing a total payout of €149
million. 3.3 Proposed acquisition of Dia’s operations in France On June 20, 2014, the Carrefour Group announced that, following exclusive negotiations with Dia, it had agreed to acquire Dia France based on an enterprise value of €600 million. Completion of the transaction is subject to the signature of final agreements following consultations with DIA France’s employee representative bodies and to the approval of the relevant antitrust authorities. 3.4 Planned acquisition in Italy On June 30, 2014, Carrefour announced that it had entered into an agreement with the Rewe Group to acquire 53 Billa supermarkets located in northern Italy. The supermarkets represent a total retail surface area of 58,000 sq.m. and generated net sales of some €300 million excluding VAT in 2013. The transaction is subject to the necessary regulatory approvals and completion by Billa of the employee consultation process.
SIX-MONTH FINANCIAL REPORT – 30 JUNE 2014
23
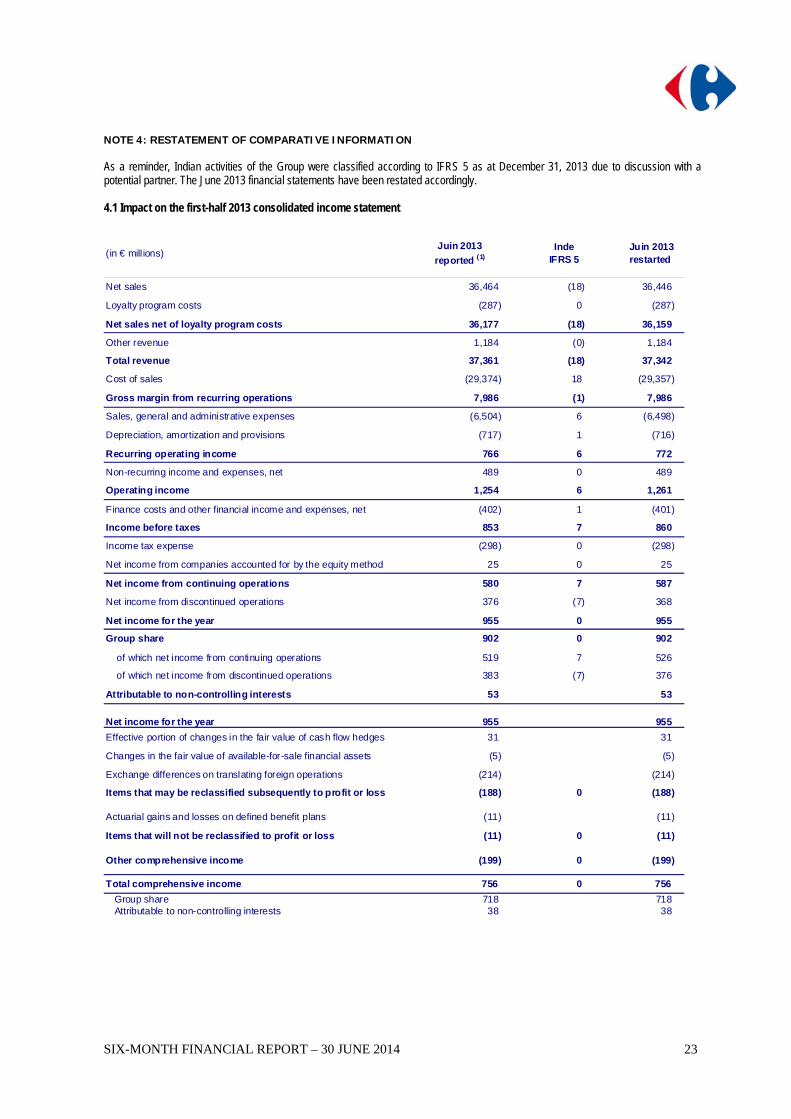
NOTE 4: RESTATEMENT OF COMPARATIVE INFORMATION As a reminder, Indian activities of the Group were classified according to IFRS 5 as at December 31, 2013 due to discussion with a potential partner. The June 2013 financial statements have been restated accordingly. 4.1 Impact on the first-half 2013 consolidated income statement
(in € mill ions)Juin 2013
reported (1)Inde
IFRS 5 Juin 2013restarted
Net sales 36,464 (18) 36,446
Loyalty program costs (287) 0 (287)
Net sales net of loyalty program costs 36,177 (18) 36,159
Other revenue 1,184 (0) 1,184
Total revenue 37,361 (18) 37,342
Cost of sales (29,374) 18 (29,357)
Gross margin from recurring operations 7,986 (1) 7,986
Sales, general and administrative expenses (6,504) 6 (6,498)
Depreciation, amortization and provisions (717) 1 (716)
Recurring operating income 766 6 772
Non-recurring income and expenses, net 489 0 489
Operating income 1,254 6 1,261
Finance costs and other financial income and expenses, net (402) 1 (401)
Income before taxes 853 7 860
Income tax expense (298) 0 (298)
Net income from companies accounted for by the equity method 25 0 25
Net income from continuing operations 580 7 587
Net income from discontinued operations 376 (7) 368
Net income for the year 955 0 955
Group share 902 0 902
of which net income from continuing operations 519 7 526
of which net income from discontinued operations 383 (7) 376
Attributable to non-controlling interests 53 53
Net income for the year 955 955
Effective portion of changes in the fair value of cash flow hedges 31 31
Changes in the fair value of available-for-sale financial assets (5) (5)
Exchange differences on translating foreign operations (214) (214)
Items that may be reclassified subsequently to profit or loss (188) 0 (188)
Actuarial gains and losses on defined benefit plans (11) (11)
Items that will not be reclassified to profit or loss (11) 0 (11)
Other comprehensive income (199) 0 (199)
Total comprehensive income 756 0 756
Group share 718 718 Attributable to non-controlling interests 38 38
SIX-MONTH FINANCIAL REPORT – 30 JUNE 2014
24
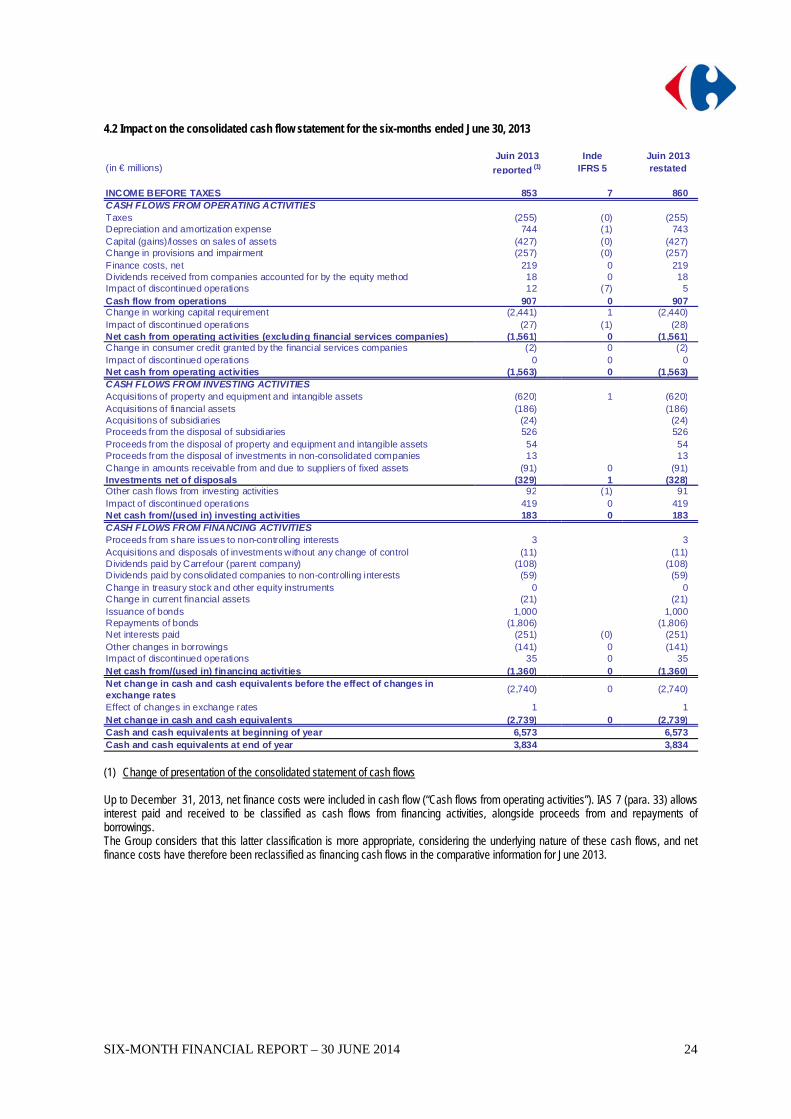
4.2 Impact on the consolidated cash flow statement for the six-months ended June 30, 2013
Juin 2013 Inde Juin 2013(in € mill ions) reported (1) IFRS 5 restated
INCOME BEFORE TAXES 853 7 860CASH FLOWS FROM OPERATING ACTIVITIESTaxes (255) (0) (255)Depreciation and amortization expense 744 (1) 743Capital (gains)/losses on sales of assets (427) (0) (427)Change in provisions and impairment (257) (0) (257)Finance costs, net 219 0 219Dividends received from companies accounted for by the equity method 18 0 18Impact of discontinued operations 12 (7) 5Cash flow from operations 907 0 907Change in working capital requirement (2,441) 1 (2,440)Impact of discontinued operations (27) (1) (28)Net cash from operating activities (excluding financial services companies) (1,561) 0 (1,561)Change in consumer credit granted by the financial services companies (2) 0 (2)Impact of discontinued operations 0 0 0Net cash from operating activities (1,563) 0 (1,563)CASH FLOWS FROM INVESTING ACTIVITIESAcquisitions of property and equipment and intangible assets (620) 1 (620)Acquisitions of financial assets (186) (186)Acquisitions of subsidiaries (24) (24)Proceeds from the disposal of subsidiaries 526 526Proceeds from the disposal of property and equipment and intangible assets 54 54Proceeds from the disposal of investments in non-consolidated companies 13 13Change in amounts receivable from and due to suppliers of fixed assets (91) 0 (91)Investments net of disposals (329) 1 (328)Other cash flows from investing activities 92 (1) 91Impact of discontinued operations 419 0 419Net cash from/(used in) investing activities 183 0 183CASH FLOWS FROM FINANCING ACTIVITIESProceeds from share issues to non-controll ing interests 3 3Acquisitions and disposals of investments without any change of control (11) (11)Dividends paid by Carrefour (parent company) (108) (108)Dividends paid by consolidated companies to non-controlling interests (59) (59)Change in treasury stock and other equity instruments 0 0Change in current financial assets (21) (21)Issuance of bonds 1,000 1,000Repayments of bonds (1,806) (1,806)Net interests paid (251) (0) (251)Other changes in borrowings (141) 0 (141)Impact of discontinued operations 35 0 35Net cash from/(used in) financing activities (1,360) 0 (1,360)Net change in cash and cash equivalents before the effect of changes in exchange rates
(2,740) 0 (2,740)
Effect of changes in exchange rates 1 1Net change in cash and cash equivalents (2,739) 0 (2,739)Cash and cash equivalents at beginning of year 6,573 6,573Cash and cash equivalents at end of year 3,834 3,834
(1) Change of presentation of the consolidated statement of cash flows Up to December 31, 2013, net finance costs were included in cash flow (“Cash flows from operating activities”). IAS 7 (para. 33) allows interest paid and received to be classified as cash flows from financing activities, alongside proceeds from and repayments of borrowings. The Group considers that this latter classification is more appropriate, considering the underlying nature of these cash flows, and net finance costs have therefore been reclassified as financing cash flows in the comparative information for June 2013.
SIX-MONTH FINANCIAL REPORT – 30 JUNE 2014
25
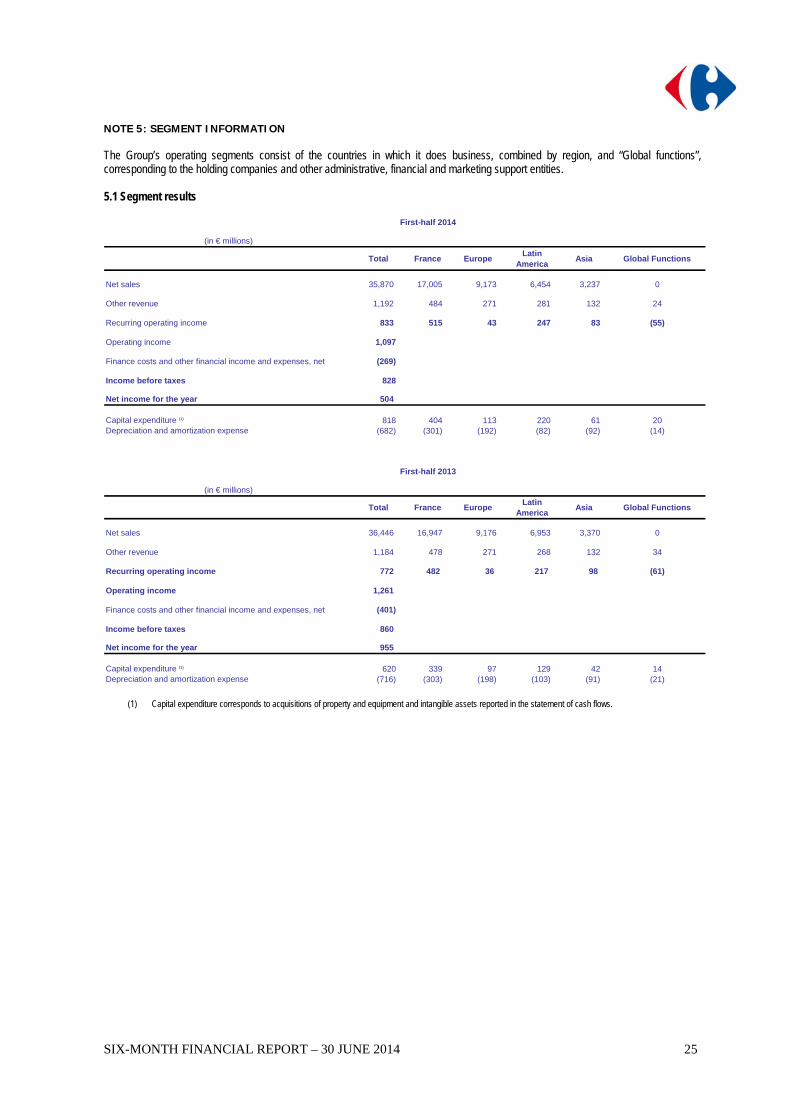
NOTE 5: SEGMENT INFORMATION The Group’s operating segments consist of the countries in which it does business, combined by region, and “Global functions”, corresponding to the holding companies and other administrative, financial and marketing support entities. 5.1 Segment results
First-half 2014
(in € millions)
Total France EuropeLatin
AmericaAsia Global Functions
Net sales 35,870 17,005 9,173 6,454 3,237 0
Other revenue 1,192 484 271 281 132 24
Recurring operating income 833 515 43 247 83 (55)
Operating income 1,097
Finance costs and other financial income and expenses, net (269)
Income before taxes 828
Net income for the year 504
Capital expenditure (1) 818 404 113 220 61 20Depreciation and amortization expense (682) (301) (192) (82) (92) (14)
First-half 2013
(in € millions)
Total France EuropeLatin
AmericaAsia Global Functions
Net sales 36,446 16,947 9,176 6,953 3,370 0
Other revenue 1,184 478 271 268 132 34
Recurring operating income 772 482 36 217 98 (61)
Operating income 1,261
Finance costs and other financial income and expenses, net (401)
Income before taxes 860
Net income for the year 955
Capital expenditure (1) 620 339 97 129 42 14Depreciation and amortization expense (716) (303) (198) (103) (91) (21)
(1) Capital expenditure corresponds to acquisitions of property and equipment and intangible assets reported in the statement of cash flows.
SIX-MONTH FINANCIAL REPORT – 30 JUNE 2014
26
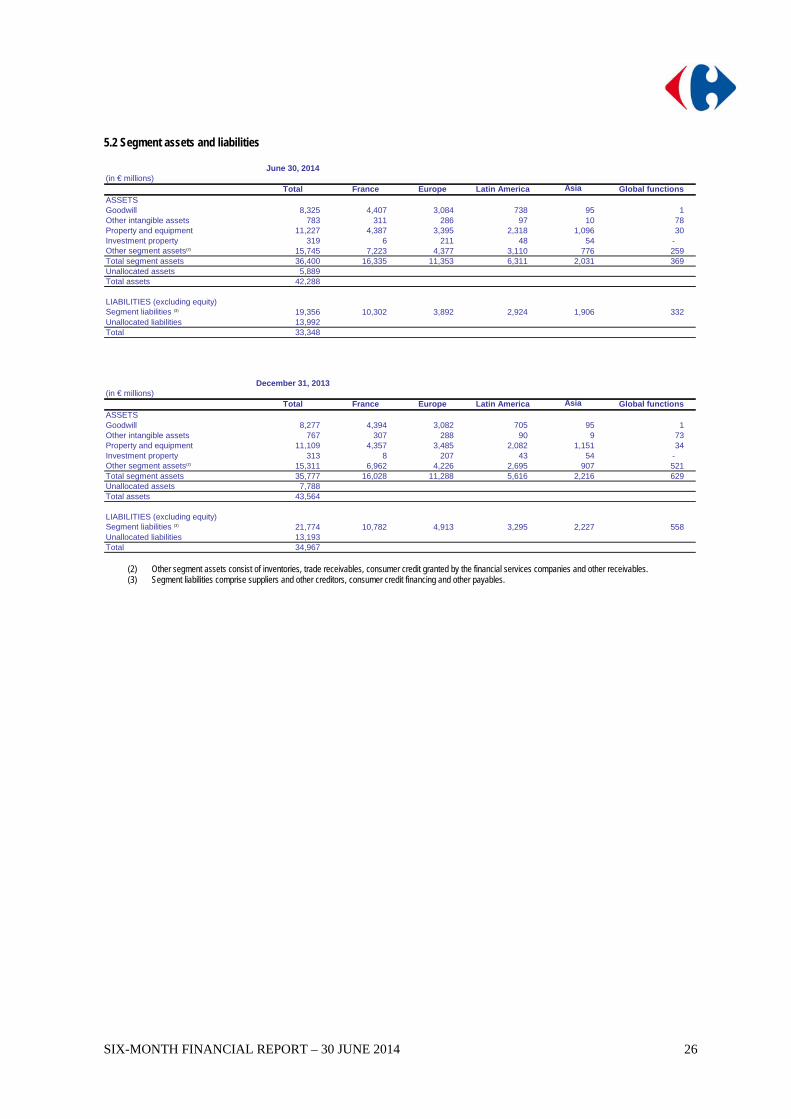
5.2 Segment assets and liabilities
June 30, 2014(in € millions)
Total France Europe Latin America Asia Global functionsASSETSGoodwill 8,325 4,407 3,084 738 95 1 Other intangible assets 783 311 286 97 10 78 Property and equipment 11,227 4,387 3,395 2,318 1,096 30 Investment property 319 6 211 48 54 - Other segment assets(2) 15,745 7,223 4,377 3,110 776 259 Total segment assets 36,400 16,335 11,353 6,311 2,031 369 Unallocated assets 5,889 Total assets 42,288
LIABILITIES (excluding equity)Segment liabilities (3) 19,356 10,302 3,892 2,924 1,906 332 Unallocated liabilities 13,992 Total 33,348
December 31, 2013(in € millions)
Total France Europe Latin America Asia Global functionsASSETSGoodwill 8,277 4,394 3,082 705 95 1 Other intangible assets 767 307 288 90 9 73 Property and equipment 11,109 4,357 3,485 2,082 1,151 34 Investment property 313 8 207 43 54 - Other segment assets(2) 15,311 6,962 4,226 2,695 907 521 Total segment assets 35,777 16,028 11,288 5,616 2,216 629 Unallocated assets 7,788 Total assets 43,564
LIABILITIES (excluding equity)Segment liabilities (3) 21,774 10,782 4,913 3,295 2,227 558 Unallocated liabilities 13,193 Total 34,967
(2) Other segment assets consist of inventories, trade receivables, consumer credit granted by the financial services companies and other receivables. (3) Segment liabilities comprise suppliers and other creditors, consumer credit financing and other payables.
SIX-MONTH FINANCIAL REPORT – 30 JUNE 2014
27
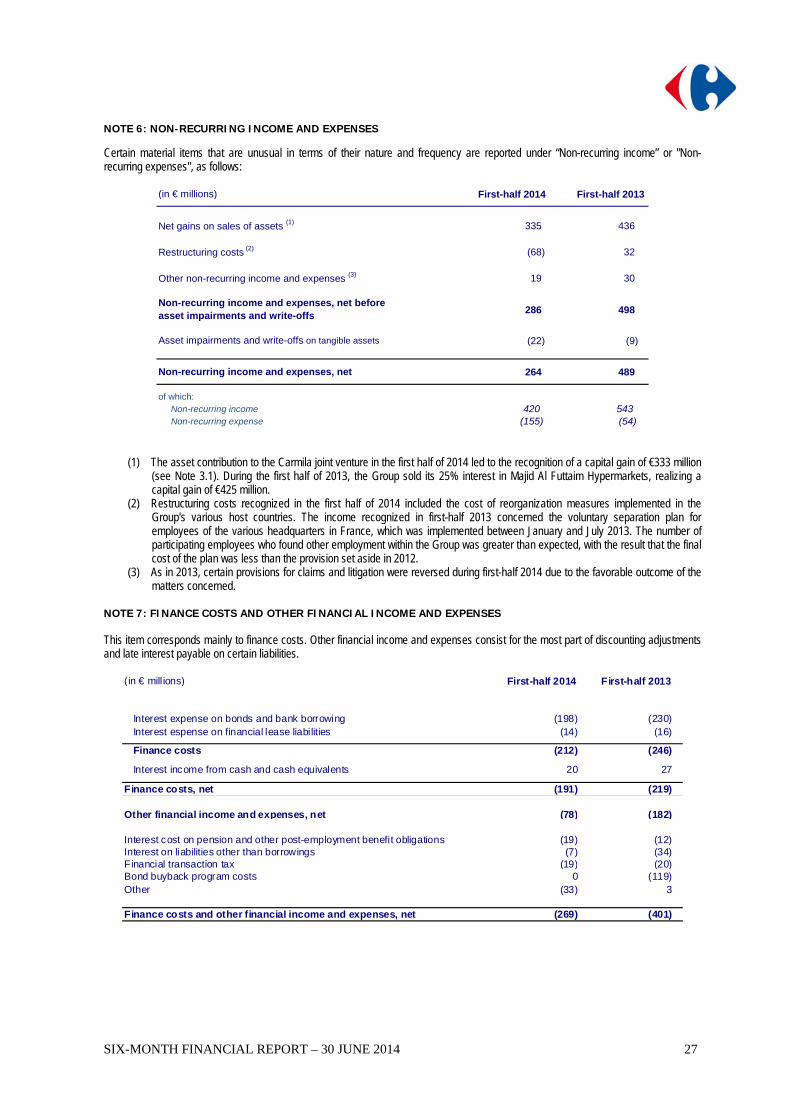
NOTE 6: NON-RECURRING INCOME AND EXPENSES Certain material items that are unusual in terms of their nature and frequency are reported under “Non-recurring income” or "Non-recurring expenses", as follows:
(in € millions) First-half 2014 First-half 2013
Net gains on sales of assets (1) 335 436
Restructuring costs (2) (68) 32
Other non-recurring income and expenses (3) 19 30
Non-recurring income and expenses, net before asset impairments and write-offs
286 498
Asset impairments and write-offs on tangible assets (22) (9)
Non-recurring income and expenses, net 264 489
of which: Non-recurring income 420 543 Non-recurring expense (155) (54)
(1) The asset contribution to the Carmila joint venture in the first half of 2014 led to the recognition of a capital gain of €333 million (see Note 3.1). During the first half of 2013, the Group sold its 25% interest in Majid Al Futtaim Hypermarkets, realizing a capital gain of €425 million.
(2) Restructuring costs recognized in the first half of 2014 included the cost of reorganization measures implemented in the Group's various host countries. The income recognized in first-half 2013 concerned the voluntary separation plan for employees of the various headquarters in France, which was implemented between January and July 2013. The number of participating employees who found other employment within the Group was greater than expected, with the result that the final cost of the plan was less than the provision set aside in 2012.
(3) As in 2013, certain provisions for claims and litigation were reversed during first-half 2014 due to the favorable outcome of the matters concerned.
NOTE 7: FINANCE COSTS AND OTHER FINANCIAL INCOME AND EXPENSES This item corresponds mainly to finance costs. Other financial income and expenses consist for the most part of discounting adjustments and late interest payable on certain liabilities.
(in € mill ions) First-half 2014 First-half 2013
Interest expense on bonds and bank borrowing (198) (230)Interest espense on financial lease liabilities (14) (16)
Finance costs (212) (246)
Interest income from cash and cash equivalents 20 27
Finance costs, net (191) (219)
Other financial income and expenses, net (78) (182)
Interest cost on pension and other post-employment benefit obligations (19) (12)Interest on liabilities other than borrowings (7) (34)Financial transaction tax (19) (20)Bond buyback program costs 0 (119)Other (33) 3
Finance costs and other financial income and expenses, net (269) (401)
SIX-MONTH FINANCIAL REPORT – 30 JUNE 2014
28
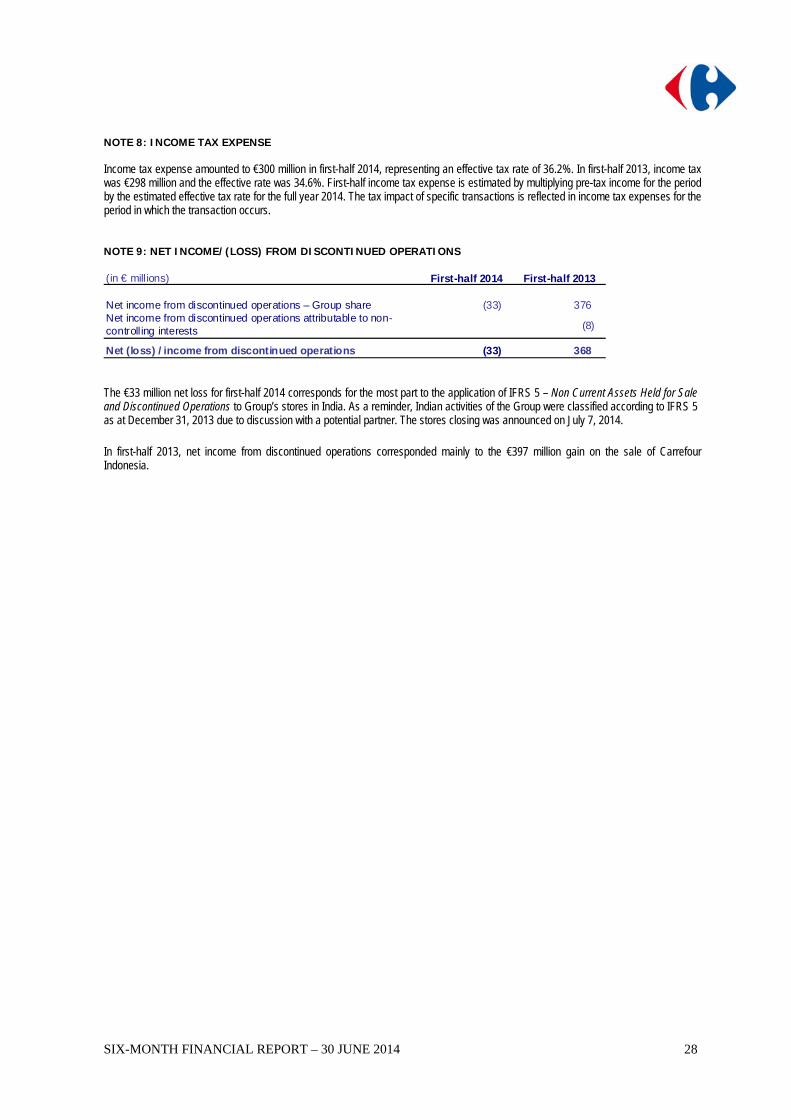
NOTE 8: INCOME TAX EXPENSE Income tax expense amounted to €300 million in first-half 2014, representing an effective tax rate of 36.2%. In first-half 2013, income tax was €298 million and the effective rate was 34.6%. First-half income tax expense is estimated by multiplying pre-tax income for the period by the estimated effective tax rate for the full year 2014. The tax impact of specific transactions is reflected in income tax expenses for the period in which the transaction occurs. NOTE 9: NET INCOME/(LOSS) FROM DISCONTINUED OPERATIONS (in € mill ions) First-half 2014 First-half 2013
Net income from discontinued operations – Group share (33) 376 Net income from discontinued operations attributable to non-controlling interests (8)
Net (loss) / income from discontinued operations (33) 368 The €33 million net loss for first-half 2014 corresponds for the most part to the application of IFRS 5 – Non Current Assets Held for Sale and Discontinued Operations to Group’s stores in India. As a reminder, Indian activities of the Group were classified according to IFRS 5 as at December 31, 2013 due to discussion with a potential partner. The stores closing was announced on July 7, 2014.
In first-half 2013, net income from discontinued operations corresponded mainly to the €397 million gain on the sale of Carrefour Indonesia.
SIX-MONTH FINANCIAL REPORT – 30 JUNE 2014
29
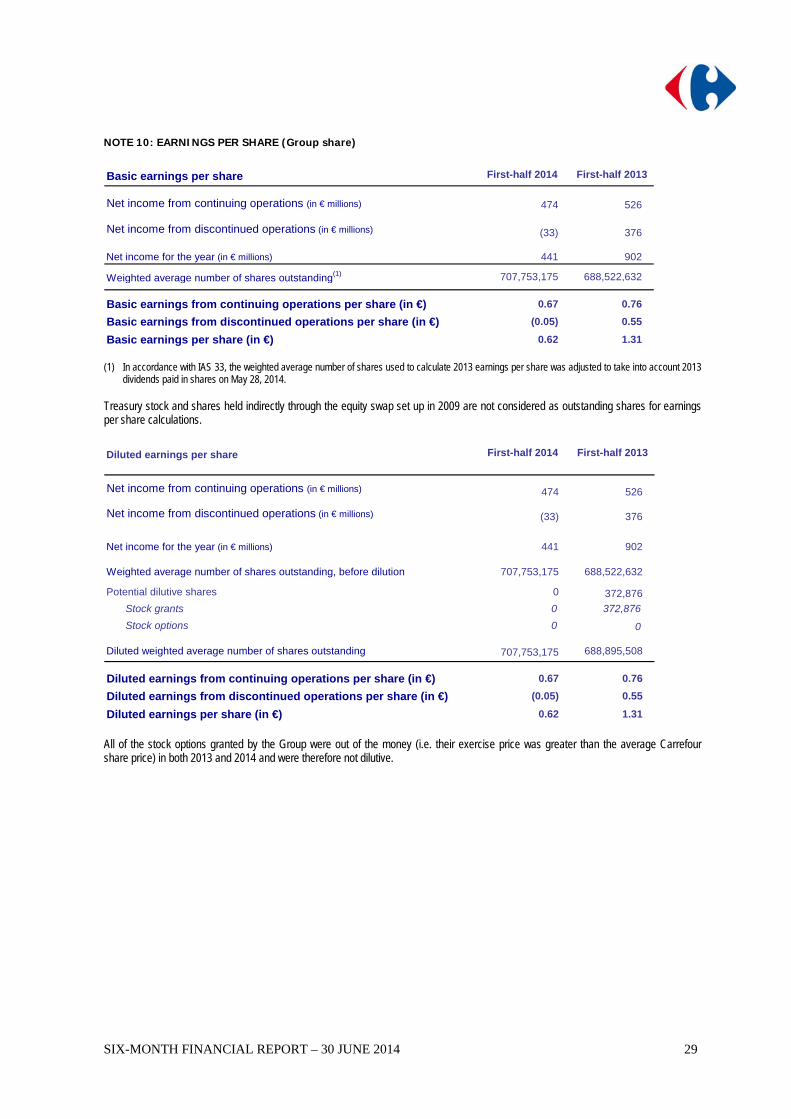
NOTE 10: EARNINGS PER SHARE (Group share)
Basic earnings per share First-half 2014 First-half 2013
Net income from continuing operations (in € millions) 474 526
Net income from discontinued operations (in € millions) (33) 376
Net income for the year (in € millions) 441 902
Weighted average number of shares outstanding(1) 707,753,175 688,522,632
Basic earnings from continuing operations per share (in €) 0.67 0.76
Basic earnings from discontinued operations per share (in €) (0.05) 0.55
Basic earnings per share (in €) 0.62 1.31 (1) In accordance with IAS 33, the weighted average number of shares used to calculate 2013 earnings per share was adjusted to take into account 2013
dividends paid in shares on May 28, 2014. Treasury stock and shares held indirectly through the equity swap set up in 2009 are not considered as outstanding shares for earnings per share calculations.
Diluted earnings per share First-half 2014 First-half 2013
Net income from continuing operations (in € millions) 474 526
Net income from discontinued operations (in € millions) (33) 376
Net income for the year (in € millions) 441 902
Weighted average number of shares outstanding, before dilution 707,753,175 688,522,632
Potential dilutive shares 0 372,876
Stock grants 0 372,876
Stock options 0 0
Diluted weighted average number of shares outstanding 707,753,175 688,895,508
Diluted earnings from continuing operations per share (in €) 0.67 0.76
Diluted earnings from discontinued operations per share (in €) (0.05) 0.55
Diluted earnings per share (in €) 0.62 1.31 All of the stock options granted by the Group were out of the money (i.e. their exercise price was greater than the average Carrefour share price) in both 2013 and 2014 and were therefore not dilutive.
SIX-MONTH FINANCIAL REPORT – 30 JUNE 2014
30
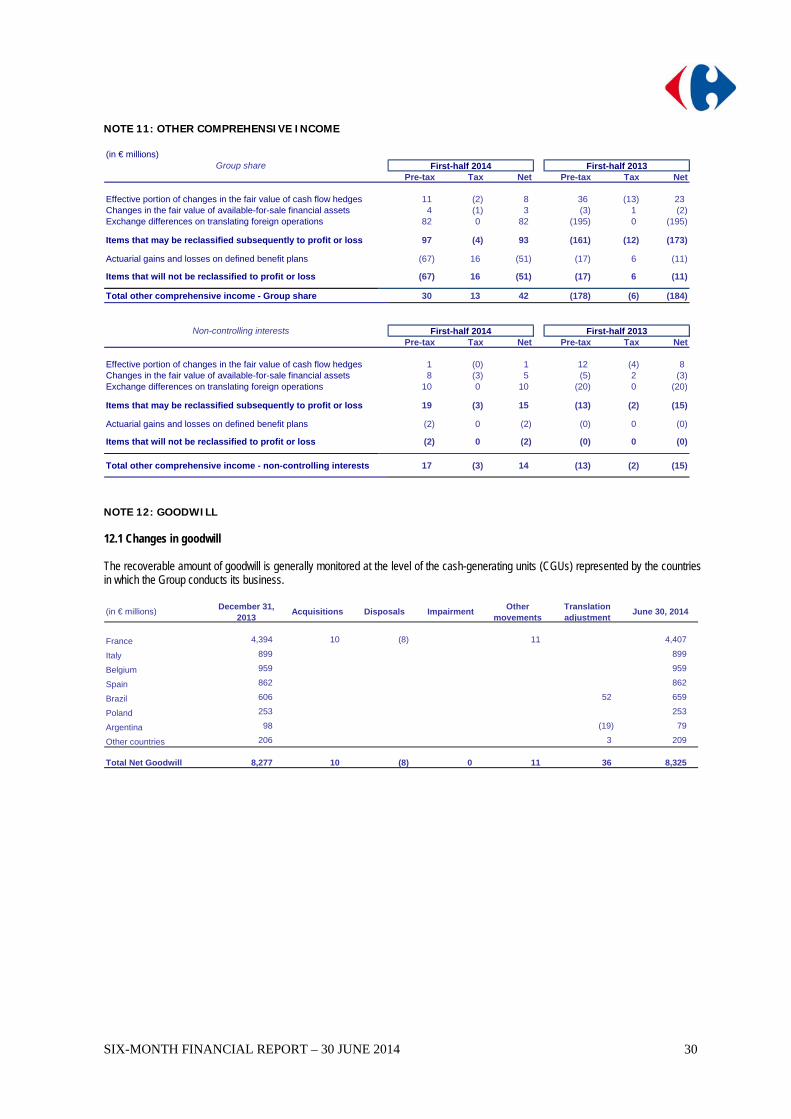
NOTE 11: OTHER COMPREHENSIVE INCOME (in € millions)
Group sharePre-tax Tax Net Pre-tax Tax Net
Effective portion of changes in the fair value of cash flow hedges 11 (2) 8 36 (13) 23Changes in the fair value of available-for-sale financial assets 4 (1) 3 (3) 1 (2)Exchange differences on translating foreign operations 82 0 82 (195) 0 (195)
Items that may be reclassified subsequently to profit or loss 97 (4) 93 (161) (12) (173)
Actuarial gains and losses on defined benefit plans (67) 16 (51) (17) 6 (11)
Items that will not be reclassified to profit or loss (67) 16 (51) (17) 6 (11)
Total other comprehensive income - Group share 30 13 42 (178) (6) (184)
Non-controlling interestsPre-tax Tax Net Pre-tax Tax Net
Effective portion of changes in the fair value of cash flow hedges 1 (0) 1 12 (4) 8Changes in the fair value of available-for-sale financial assets 8 (3) 5 (5) 2 (3)Exchange differences on translating foreign operations 10 0 10 (20) 0 (20)
Items that may be reclassified subsequently to profit or loss 19 (3) 15 (13) (2) (15)
Actuarial gains and losses on defined benefit plans (2) 0 (2) (0) 0 (0)
Items that will not be reclassified to profit or loss (2) 0 (2) (0) 0 (0)
Total other comprehensive income - non-controlling interests 17 (3) 14 (13) (2) (15)
First-half 2014 First-half 2013
First-half 2014 First-half 2013
NOTE 12: GOODWILL 12.1 Changes in goodwill The recoverable amount of goodwill is generally monitored at the level of the cash-generating units (CGUs) represented by the countries in which the Group conducts its business. (in € millions)
December 31, 2013
Acquisitions Disposals Impairment Other
movementsTranslation adjustment
June 30, 2014
France 4,394 10 (8) 11 4,407
Italy 899 899
Belgium 959 959
Spain 862 862
Brazil 606 52 659
Poland 253 253
Argentina 98 (19) 79
Other countries 206 3 209
Total Net Goodwill 8,277 10 (8) 0 11 36 8,325
SIX-MONTH FINANCIAL REPORT – 30 JUNE 2014
31
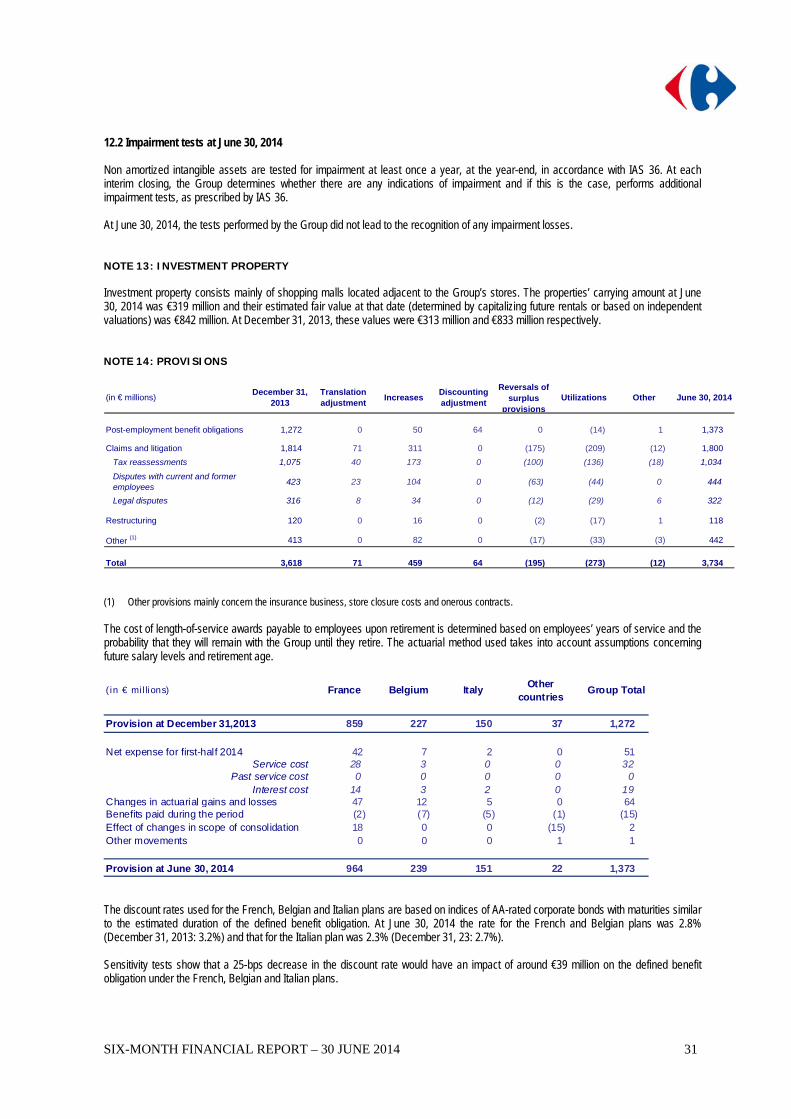
12.2 Impairment tests at June 30, 2014 Non amortized intangible assets are tested for impairment at least once a year, at the year-end, in accordance with IAS 36. At each interim closing, the Group determines whether there are any indications of impairment and if this is the case, performs additional impairment tests, as prescribed by IAS 36. At June 30, 2014, the tests performed by the Group did not lead to the recognition of any impairment losses. NOTE 13: INVESTMENT PROPERTY Investment property consists mainly of shopping malls located adjacent to the Group’s stores. The properties’ carrying amount at June 30, 2014 was €319 million and their estimated fair value at that date (determined by capitalizing future rentals or based on independent valuations) was €842 million. At December 31, 2013, these values were €313 million and €833 million respectively. NOTE 14: PROVISIONS
(in € millions)December 31,
2013Translation adjustment
IncreasesDiscounting adjustment
Reversals of surplus
provisionsUtilizations Other June 30, 2014
Post-employment benefit obligations 1,272 0 50 64 0 (14) 1 1,373
Claims and litigation 1,814 71 311 0 (175) (209) (12) 1,800
Tax reassessments 1,075 40 173 0 (100) (136) (18) 1,034
Disputes with current and former employees
423 23 104 0 (63) (44) 0 444
Legal disputes 316 8 34 0 (12) (29) 6 322
Restructuring 120 0 16 0 (2) (17) 1 118
Other (1) 413 0 82 0 (17) (33) (3) 442
Total 3,618 71 459 64 (195) (273) (12) 3,734
(1) Other provisions mainly concern the insurance business, store closure costs and onerous contracts. The cost of length-of-service awards payable to employees upon retirement is determined based on employees’ years of service and the probability that they will remain with the Group until they retire. The actuarial method used takes into account assumptions concerning future salary levels and retirement age.
(in € millions) France Belgium ItalyOther
countriesGroup Total
Provision at December 31,2013 859 227 150 37 1,272
Net expense for first-half 2014 42 7 2 0 51 Service cost 28 3 0 0 32
Past service cost 0 0 0 0 0 Interest cost 14 3 2 0 19
Changes in actuarial gains and losses 47 12 5 0 64 Benefits paid during the period (2) (7) (5) (1) (15)Effect of changes in scope of consolidation 18 0 0 (15) 2 Other movements 0 0 0 1 1
Provision at June 30, 2014 964 239 151 22 1,373
The discount rates used for the French, Belgian and Italian plans are based on indices of AA-rated corporate bonds with maturities similar to the estimated duration of the defined benefit obligation. At June 30, 2014 the rate for the French and Belgian plans was 2.8% (December 31, 2013: 3.2%) and that for the Italian plan was 2.3% (December 31, 23: 2.7%). Sensitivity tests show that a 25-bps decrease in the discount rate would have an impact of around €39 million on the defined benefit obligation under the French, Belgian and Italian plans.
SIX-MONTH FINANCIAL REPORT – 30 JUNE 2014
32
NOTE 15: LONG AND SHORT-TERM BORROWINGS 15.1 Net debt
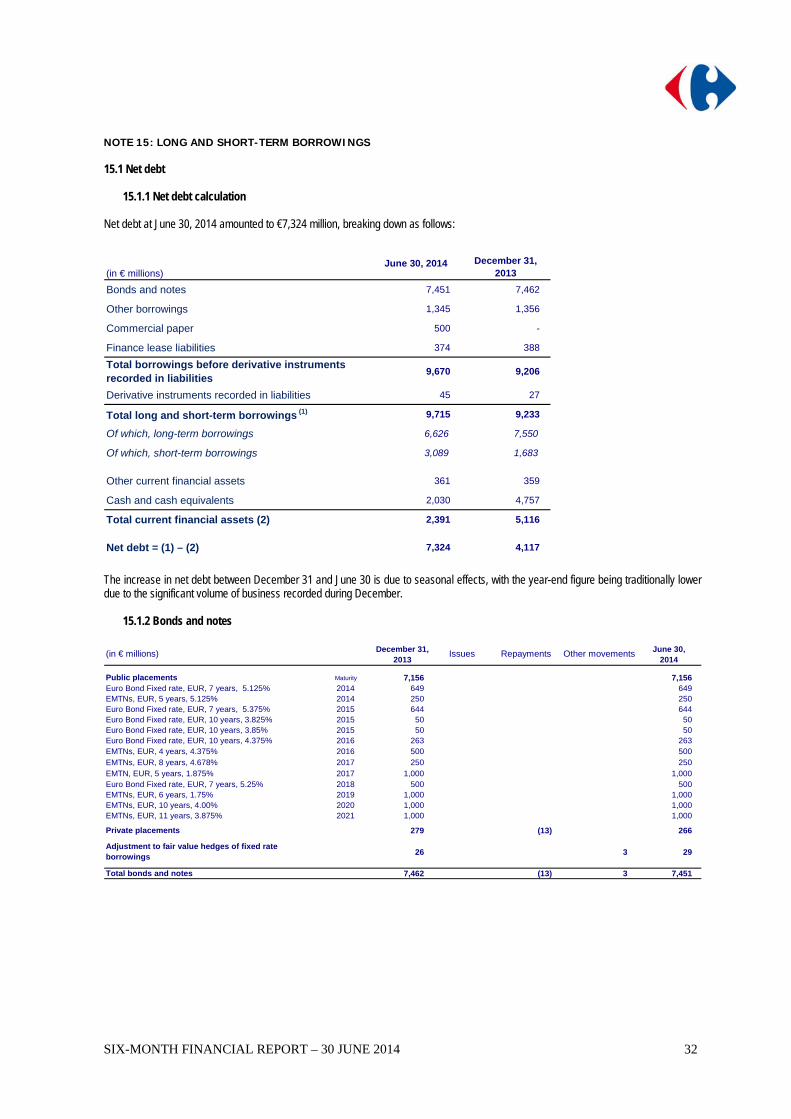
15.1.1 Net debt calculation Net debt at June 30, 2014 amounted to €7,324 million, breaking down as follows:
(in € millions)June 30, 2014 December 31,
2013
Bonds and notes 7,451 7,462
Other borrowings 1,345 1,356
Commercial paper 500 -
Finance lease liabilities 374 388
Total borrowings before derivative instruments recorded in liabilities
9,670 9,206
Derivative instruments recorded in liabilities 45 27
Total long and short-term borrowings (1) 9,715 9,233
Of which, long-term borrowings 6,626 7,550
Of which, short-term borrowings 3,089 1,683
Other current financial assets 361 359
Cash and cash equivalents 2,030 4,757
Total current financial assets (2) 2,391 5,116
Net debt = (1) – (2) 7,324 4,117 The increase in net debt between December 31 and June 30 is due to seasonal effects, with the year-end figure being traditionally lower due to the significant volume of business recorded during December.
15.1.2 Bonds and notes
(in € millions) December 31, 2013
Issues Repayments Other movements June 30, 2014
Public placements Maturity 7,156 7,156Euro Bond Fixed rate, EUR, 7 years, 5.125% 2014 649 649EMTNs, EUR, 5 years, 5.125% 2014 250 250Euro Bond Fixed rate, EUR, 7 years, 5.375% 2015 644 644Euro Bond Fixed rate, EUR, 10 years, 3.825% 2015 50 50Euro Bond Fixed rate, EUR, 10 years, 3.85% 2015 50 50Euro Bond Fixed rate, EUR, 10 years, 4.375% 2016 263 263EMTNs, EUR, 4 years, 4.375% 2016 500 500EMTNs, EUR, 8 years, 4.678% 2017 250 250EMTN, EUR, 5 years, 1.875% 2017 1,000 1,000Euro Bond Fixed rate, EUR, 7 years, 5.25% 2018 500 500EMTNs, EUR, 6 years, 1.75% 2019 1,000 1,000EMTNs, EUR, 10 years, 4.00% 2020 1,000 1,000EMTNs, EUR, 11 years, 3.875% 2021 1,000 1,000
Private placements 279 (13) 266
Adjustment to fair value hedges of fixed rate borrowings
26 3 29
Total bonds and notes 7,462 (13) 3 7,451
SIX-MONTH FINANCIAL REPORT – 30 JUNE 2014
33
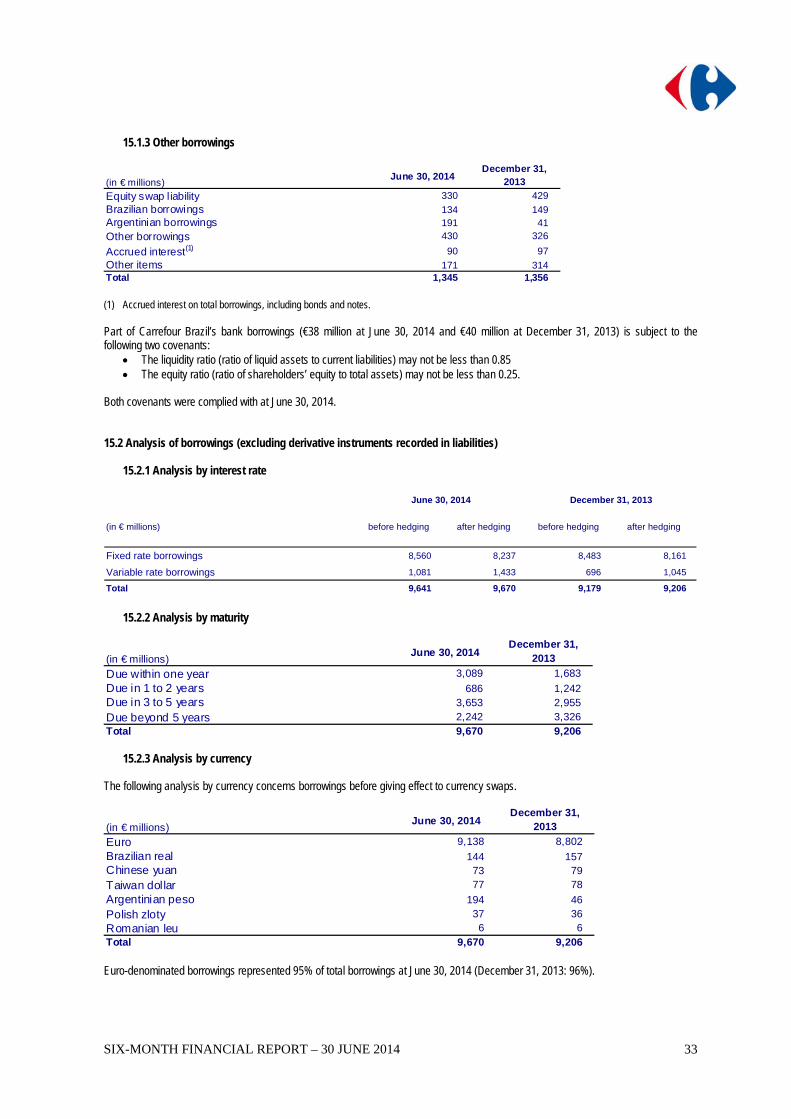
15.1.3 Other borrowings
(in € millions)June 30, 2014
December 31, 2013
Equity swap liability 330 429
Brazilian borrowings 134 149Argentinian borrowings 191 41
Other borrowings 430 326
Accrued interest(1) 90 97
Other items 171 314Total 1,345 1,356 (1) Accrued interest on total borrowings, including bonds and notes. Part of Carrefour Brazil’s bank borrowings (€38 million at June 30, 2014 and €40 million at December 31, 2013) is subject to the following two covenants:
The liquidity ratio (ratio of liquid assets to current liabilities) may not be less than 0.85 The equity ratio (ratio of shareholders’ equity to total assets) may not be less than 0.25.
Both covenants were complied with at June 30, 2014. 15.2 Analysis of borrowings (excluding derivative instruments recorded in liabilities)
15.2.1 Analysis by interest rate
(in € millions) before hedging after hedging before hedging after hedging
Fixed rate borrowings 8,560 8,237 8,483 8,161
Variable rate borrowings 1,081 1,433 696 1,045
Total 9,641 9,670 9,179 9,206
June 30, 2014 December 31, 2013
15.2.2 Analysis by maturity
(in € millions)June 30, 2014
December 31, 2013
Due within one year 3,089 1,683
Due in 1 to 2 years 686 1,242Due in 3 to 5 years 3,653 2,955
Due beyond 5 years 2,242 3,326Total 9,670 9,206
15.2.3 Analysis by currency
The following analysis by currency concerns borrowings before giving effect to currency swaps.
(in € millions)June 30, 2014
December 31, 2013
Euro 9,138 8,802
Brazilian real 144 157Chinese yuan 73 79
Taiwan dollar 77 78
Argentinian peso 194 46
Polish zloty 37 36
Romanian leu 6 6Total 9,670 9,206 Euro-denominated borrowings represented 95% of total borrowings at June 30, 2014 (December 31, 2013: 96%).
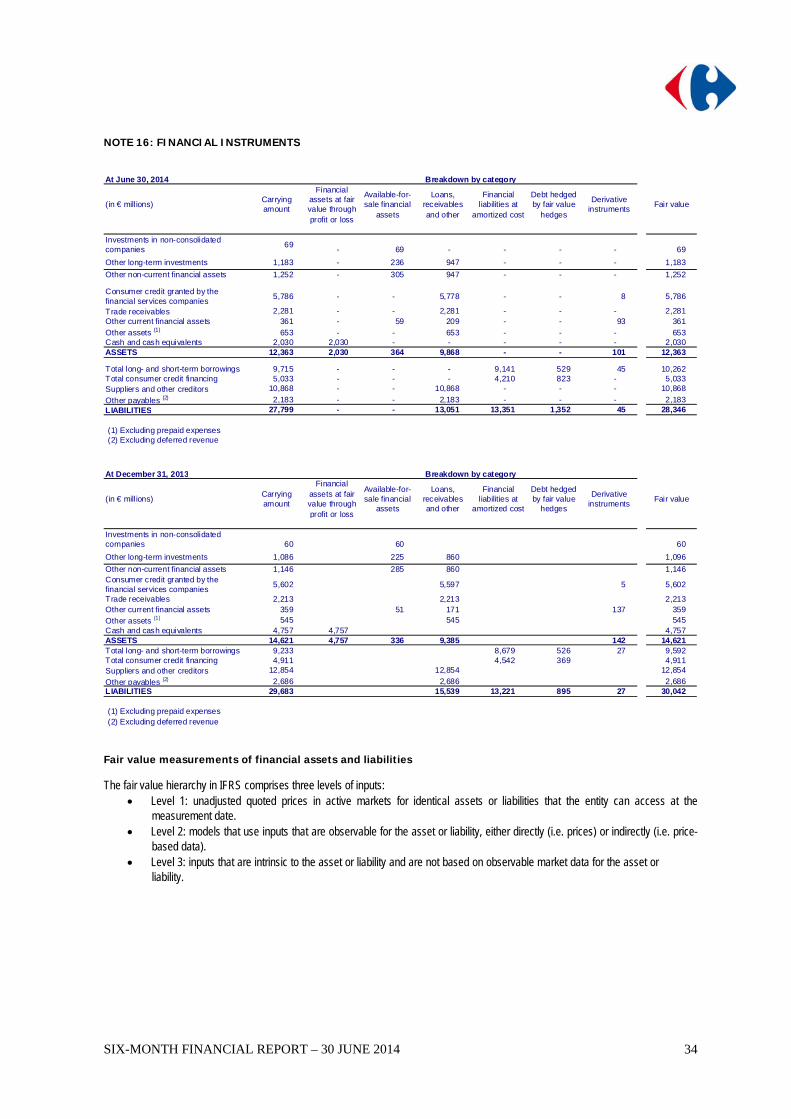
SIX-MONTH FINANCIAL REPORT – 30 JUNE 2014
34
NOTE 16: FINANCIAL INSTRUMENTS At June 30, 2014 Breakdown by category
(in € mill ions)Carrying amount
Financial assets at fair value through profit or loss
Available-for-sale financial
assets
Loans, receivables and other
Financial l iabilities at
amortized cost
Debt hedged by fair value
hedges
Derivative instruments
Fair value
Investments in non-consolidated companies
69 - 69 - - - - 69
Other long-term investments 1,183 - 236 947 - - - 1,183
Other non-current financial assets 1,252 - 305 947 - - - 1,252
Consumer credit granted by the financial services companies
5,786 - - 5,778 - - 8 5,786
Trade receivables 2,281 - - 2,281 - - - 2,281 Other current financial assets 361 - 59 209 - - 93 361
Other assets (1) 653 - - 653 - - - 653 Cash and cash equivalents 2,030 2,030 - - - - - 2,030 ASSETS 12,363 2,030 364 9,868 - - 101 12,363
Total long- and short-term borrowings 9,715 - - - 9,141 529 45 10,262 Total consumer credit financing 5,033 - - - 4,210 823 - 5,033 Suppliers and other creditors 10,868 - - 10,868 - - - 10,868
Other payables (2) 2,183 - - 2,183 - - - 2,183 LIABILITIES 27,799 - - 13,051 13,351 1,352 45 28,346
(1) Excluding prepaid expenses (2) Excluding deferred revenue
At December 31, 2013 Breakdown by category
(in € mill ions)Carrying amount
Financial assets at fair value through profit or loss
Available-for-sale financial
assets
Loans, receivables and other
Financial l iabilities at
amortized cost
Debt hedged by fair value
hedges
Derivative instruments
Fair value
Investments in non-consolidated companies 60 60 60
Other long-term investments 1,086 225 860 1,096
Other non-current financial assets 1,146 285 860 1,146 Consumer credit granted by the financial services companies
5,602 5,597 5 5,602
Trade receivables 2,213 2,213 2,213 Other current financial assets 359 51 171 137 359 Other assets (1) 545 545 545 Cash and cash equivalents 4,757 4,757 4,757 ASSETS 14,621 4,757 336 9,385 142 14,621 Total long- and short-term borrowings 9,233 8,679 526 27 9,592 Total consumer credit financing 4,911 4,542 369 4,911 Suppliers and other creditors 12,854 12,854 12,854
Other payables (2) 2,686 2,686 2,686 LIABILITIES 29,683 15,539 13,221 895 27 30,042
(1) Excluding prepaid expenses (2) Excluding deferred revenue
Fair value measurements of financial assets and liabilities The fair value hierarchy in IFRS comprises three levels of inputs:
Level 1: unadjusted quoted prices in active markets for identical assets or liabilities that the entity can access at the measurement date.
Level 2: models that use inputs that are observable for the asset or liability, either directly (i.e. prices) or indirectly (i.e. price-based data).
Level 3: inputs that are intrinsic to the asset or liability and are not based on observable market data for the asset or liability.
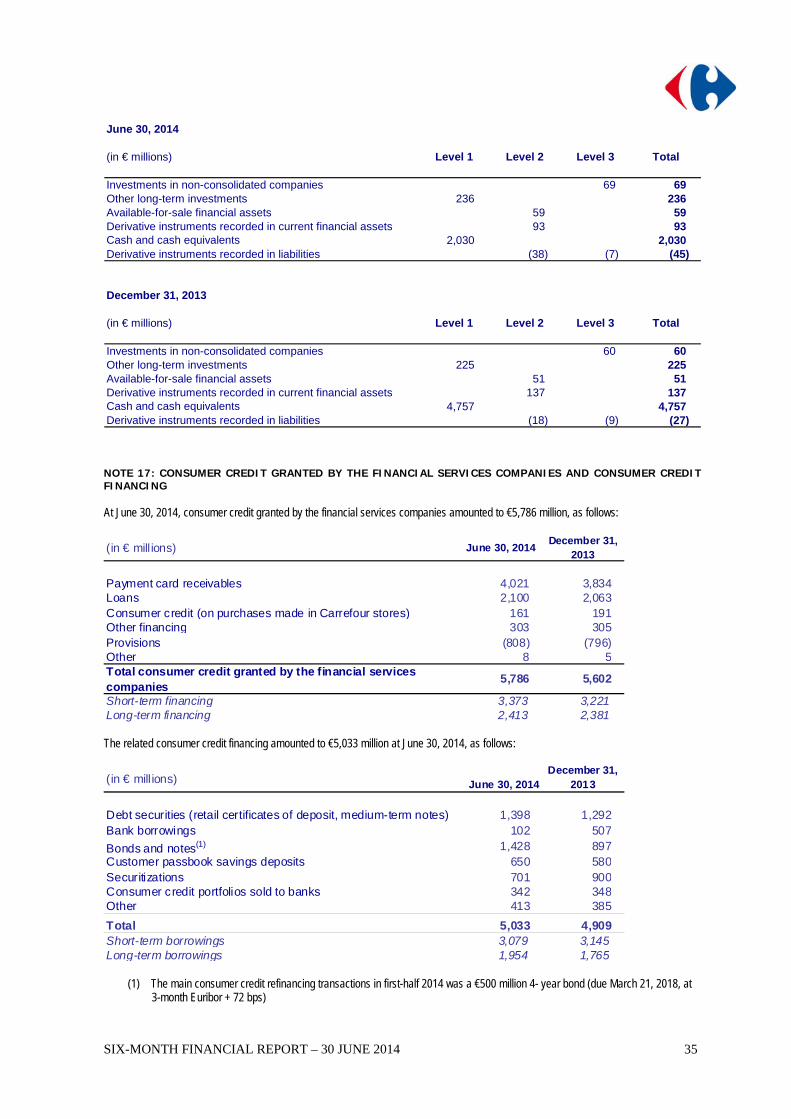
SIX-MONTH FINANCIAL REPORT – 30 JUNE 2014
35
June 30, 2014
(in € millions) Level 1 Level 2 Level 3 Total
Investments in non-consolidated companies 69 69 Other long-term investments 236 236 Available-for-sale financial assets 59 59 Derivative instruments recorded in current financial assets 93 93 Cash and cash equivalents 2,030 2,030 Derivative instruments recorded in liabilities (38) (7) (45)
December 31, 2013
(in € millions) Level 1 Level 2 Level 3 Total
Investments in non-consolidated companies 60 60 Other long-term investments 225 225 Available-for-sale financial assets 51 51 Derivative instruments recorded in current financial assets 137 137 Cash and cash equivalents 4,757 4,757 Derivative instruments recorded in liabilities (18) (9) (27) NOTE 17: CONSUMER CREDIT GRANTED BY THE FINANCIAL SERVICES COMPANIES AND CONSUMER CREDIT FINANCING At June 30, 2014, consumer credit granted by the financial services companies amounted to €5,786 million, as follows:
(in € mill ions) June 30, 2014December 31,
2013
Payment card receivables 4,021 3,834Loans 2,100 2,063Consumer credit (on purchases made in Carrefour stores) 161 191Other financing 303 305Provisions (808) (796)Other 8 5Total consumer credit granted by the financial services companies
5,786 5,602
Short-term financing 3,373 3,221Long-term financing 2,413 2,381 The related consumer credit financing amounted to €5,033 million at June 30, 2014, as follows:
(in € mill ions) June 30, 2014December 31,
2013
Debt securities (retail certificates of deposit, medium-term notes) 1,398 1,292Bank borrowings 102 507
Bonds and notes(1) 1,428 897Customer passbook savings deposits 650 580Securitizations 701 900Consumer credit portfolios sold to banks 342 348Other 413 385
Total 5,033 4,909Short-term borrowings 3,079 3,145Long-term borrowings 1,954 1,765
(1) The main consumer credit refinancing transactions in first-half 2014 was a €500 million 4- year bond (due March 21, 2018, at 3-month Euribor + 72 bps)
SIX-MONTH FINANCIAL REPORT – 30 JUNE 2014
36
NOTE 18: CHANGE IN WORKING CAPITAL REQUIREMENT
(in € millions) June 30, 2014 June 30, 2013 Change
Change in inventory (154) (9) (144) Change in trade receivables (37) (27) (10) Change in trade payables (1,913) (1,771) (142) Change in loyalty program liabilities and other (61) 6 (66)
Change in trade working capital requirement (2,165) (1,801) (364)
Change in other receivables and payables (405) (638) 233
Change in working capital requirement (2,570) (2,440) (131) NOTE 19: RELATED PARTIES 19.1 Related party transactions During the first half of 2014, except the creation of Carmila described in Note 3.1, there were no major changes in related party transactions with companies over which the Group exercises significant influence or joint control. 19.2 Other related party transactions During the first half of 2014, there were no major changes in related party transactions with other related parties. NOTE 20: OFF-BALANCE SHEET COMMITMENTS Commitments given and received by the Group that are not recognized in the statement of financial position correspond to contractual obligations whose performance depends on the occurrence of conditions or transactions after the period-end. There are three types of off-balance sheet commitments, related to (i) cash management, (ii) retailing operations and (iii) acquisitions of securities. The Group is also party to leases that give rise to future commitments such as for the payment of rent on retail units leased by the Group from owners (commitments given), and the payment of rent on retail units in shopping malls owned by the Group and leased to other parties (commitments received). During the first half of 2014, there were no major changes in off-balance sheet commitments, except the proposed acquisition of Dia’s operations in France (cf. significant events 3.3). NOTE 21: SUBSEQUENT EVENTS On July 7, 2014, Carrefour announced that it intended to close its five cash & carry stores in India, the first of which was opened in
2010. The closure plan will be completed by September 2014. On July 15, 2014, the Group issued €1,000 million worth of 8-year 1.75% bonds due July 2022
At the same time, two other outstanding issues representing an aggregate €318 million were retired, as follows: €97 million outstanding from a 763 million 4.375% issue due November 2016 €221 million outstanding from a €500 million 5.25% issue due October 2018.
The transaction consolidated the Group’s long-term financing at the very attractive interest rates currently available in the market. It led to:
A €682 million increase in the face value of the Group's bond debt Optimized future borrowing costs due to an issue at a historically low interest rate An extension of the average maturity of bond debt, from 3.7 years to 4.2 years (an increase of 0.5 years) as from July
15, 2014. NOTE 22: SCOPE OF CONSOLIDATION Carmila, whose creation is discussed in Note 3.1, is controlled jointly by the Group and its co-investors and is therefore accounted for by the equity method. There were no other material changes in the scope of consolidation during the first half of 2014.
SIX-MONTH FINANCIAL REPORT – 30 JUNE 2014
37
Carrefour Société Anonyme
33, avenue Emile Zola 92100 Boulogne-Billancourt
Statutory auditors’ review report on the first half-year financial information
Period from January 1 to June 30, 2014
This is a free translation into English of the statutory auditors’ review report issued in French and is provided solely for the convenience of English speaking readers. This report should be read in conjunction with, and construed in accordance with, French law and professional auditing standards applicable in France. To the Shareholders, In compliance with the assignment entrusted to us by your Shareholders’ meetings and in accordance with the requirements of article L.451-1-2 III of the French Monetary and Financial Code (“Code monétaire et financier”), we hereby report to you on:
the review of the accompanying condensed half-yearly consolidated financial statements of Carrefour, for the period from January 1 to June 30, 2014, and
the verification of information contained in the half-yearly management report. These condensed half-yearly consolidated financial statements have been prepared under the responsibility of the Board of Directors. Our role is to express a conclusion on these financial statements based on our review.
1. Conclusion on the financial statements
We conducted our review in accordance with professional standards applicable in France. A review of interim financial information mainly consists in making inquiries, primarily of persons responsible for financial and accounting matters, and applying analytical and other review procedures. A review is substantially less in scope than an audit conducted in accordance with professional standards applicable in France and consequently does not enable us to obtain assurance that we would become aware of all significant matters that might be identified in an audit. Accordingly, we do not express an audit opinion. Based on our review, nothing has come to our attention that causes us to believe that the accompanying condensed half-yearly consolidated financial statements are not prepared in all material respects in accordance with IAS 34 – the standard of the IFRS as adopted by the European Union applicable to interim financial information.
Without qualifying the conclusion expressed above, we draw your attention to note 1.2 to the condensed half-yearly consolidated financial statements which exposes the first application as of 1st January 2014 of the IFRS 10, IFRS 11, IFRS 12 and IAS 28 revised.
SIX-MONTH FINANCIAL REPORT – 30 JUNE 2014
38
2. Specific verification
We have also verified the information provided in the half-yearly management report commenting the condensed half-yearly consolidated financial statements that were subject to our review. We have no matters to report as to its fair presentation and consistency with the condensed half-yearly consolidated financial statements. French original signed at Courbevoie, Paris-La-Défense and Neuilly-sur-Seine on July 30, 2014, by
The Statutory Auditors
M A Z A R S PATRICK DE CAMBOURG
PIERRE SARDET
K P M G A u d i t Département de KPMG S.A.
ERIC ROPERT
PATRICK-HUBERT PETIT
D E L O I T T E &
A S S O C I E S ARNAUD DE PLANTA
FRANCISCO SANCHEZ

www.carrefour.comSocieté anonyme with capital of €1,837,284,772.50Head office: 33 avenue Emile Zola – 92100 Boulogne-Billancourt - France652 014 051 RCS Nanterre