site condition monitoring of bottlenose dolphins within ... · i . site condition monitoring of...
TRANSCRIPT

Scottish Natural Heritage Research Report No. 1021
Site Condition Monitoring of bottlenose dolphins within the Moray Firth Special Area of Conservation: 2014-2016

R E S E A R C H R E P O R T
Research Report No. 1021
Site Condition Monitoring of bottlenose dolphins within the Moray Firth Special Area
of Conservation: 2014-2016
For further information on this report please contact:
Morven Carruthers Scottish Natural Heritage Great Glen House INVERNESS IV3 8NW Telephone: 01463 725000 E-mail: [email protected]
This report should be quoted as:
Cheney, B., Graham, I.M., Barton, T.R., Hammond, P.S. and Thompson, P.M. 2018. Site Condition Monitoring of bottlenose dolphins within the Moray Firth Special Area of Conservation: 2014-2016. Scottish Natural Heritage Research Report No. 1021
This report, or any part of it, should not be reproduced without the permission of Scottish Natural Heritage. This permission will not be withheld unreasonably. The views expressed by the author(s) of this report should not be taken as the views and policies of Scottish Natural Heritage.
© Scottish Natural Heritage 2018.

i
Site Condition Monitoring of bottlenose dolphins within the Moray Firth Special Area
of Conservation: 2014-2016
Research Report No.: 1021 Project no: 13420 Contractor: University of Aberdeen Lighthouse Field Station Year of publication: 2018 Keywords Abundance; Bayesian; Bottlenose dolphin; Mark-recapture; Photo-identification; Special Area of Conservation. Background The Moray Firth Special Area of Conservation (SAC) was designated in 2005 under the European Habitats Directive (92/43/EEC) for bottlenose dolphins (Tursiops truncatus). This SAC extends from the inner firths to Helmsdale on the north coast and Lossiemouth on the south coast, and includes areas that are regularly used by the population of bottlenose dolphins occurring along the east coast of Scotland. As a result of this designation, Scottish Natural Heritage (SNH) has a responsibility to report on the condition of bottlenose dolphins within the Moray Firth SAC every six years. Since 1989, this population of bottlenose dolphins has been the focus of an intensive research programme, carried out by the University of Aberdeen in collaboration with the Sea Mammal Research Unit at the University of St Andrews. In 2004, SNH entered into a Memorandum of Agreement with the University of Aberdeen to support these photo-identification studies and use the data to report on the condition of the site. This report presents the results from the fifth round of SNH funded surveys, together with the results of similar surveys that were carried out with support from Beatrice Offshore Wind Ltd. (BOWL), Moray Offshore Renewables Ltd. (MORL), Marine Scotland, The Crown Estate and Highlands and Islands Enterprise. Data are incorporated into a revised assessment of the condition of this bottlenose dolphin population for this full site condition monitoring report.
RESEARCH REPORT
Summary

ii
Main findings
− Mark-recapture analysis of photographs collected during photo-identification surveys indicated that the estimated number of individual dolphins using the SAC during the summer of 2016 was 103 (95% confidence interval: 93-115).
− Despite inter-annual variability, the number of dolphins using the SAC between 2001 and 2016 appears to be stable.
− A Bayesian capture-recapture assessment of the total abundance of the east coast bottlenose dolphin population indicates that this population is increasing.
− During the period 2001-2015, >50% of the population used the SAC in most years. − Passive acoustic monitoring from 2011 to 2016 highlighted that there was inter-annual
and seasonal variation in the amount of time and number of days dolphins spent at three long-term monitoring sites within the SAC. Results suggest this variation is site specific. Although, there was a summer peak in occurrence at all sites, dolphins were frequently present during most winter months.
− The quality of data available for completing the Site Attribute Table is high for attributes 1.1.1, 1.1.2 and 1.1.3.
The following conclusions were reached:
− Despite inter-annual variability, the number of dolphins using the SAC has remained stable.
− Additional data suggest that the population of dolphins on the east coast of Scotland is increasing, and the SAC is used by >50% of the population annually.
− The proportion of the east coast of Scotland bottlenose dolphin population that use the SAC has declined, most probably due to an overall increase in population size.
− Dolphins’ occurrence at long-term monitoring sites shows site-specific inter-annual and seasonal variation. This pattern of use was broadly similar to those reported in previous site condition monitoring reports.
− Passive acoustic monitoring continues to suggest that dolphins may use certain areas of the SAC outside the summer months more than previously thought.
− The east coast of Scotland bottlenose dolphin population remains small and potentially vulnerable. Nevertheless, as a result of these data, we recommend that no change is made to the condition status (Favourable (recovered)).
For further information on this project contact:
Morven Carruthers Tel: 01463 725000 or email: [email protected]
For further information on the SNH Research & Technical Support Programme contact: Knowledge & Information Unit, Scottish Natural Heritage, Great Glen House, Inverness, IV3 8NW.
Tel: 01463 725000 or [email protected]

iii
Table of Contents Page
1. INTRODUCTION 1
2. METHODS 3 2.1 Survey protocols 3 2.2 Photographic analysis 3 2.3 Mark-recapture analysis 6 2.4 Dolphin population trends 7 2.4.1 Estimating total population size 7 2.4.2 Births and mortality 7 2.5 Usage of the SAC 7 2.5.1 Proportion of the total population 7 2.5.2 Encounter probability in the Sutors area 8 2.5.3 Passive acoustic monitoring 8
3. RESULTS 9 3.1 Survey details 9 3.2 Estimate of the number of dolphins using the SAC 13 3.3 Trends in the number of dolphins using the SAC 13 3.4 Dolphin population trends 14 3.4.1 Estimating total population size 14 3.4.2 Births and mortality 14 3.5 Usage of the SAC 16 3.5.1 Proportion of the total population 16 3.5.2 Encounter probability in the Sutors area 17 3.5.3 Passive acoustic monitoring 18
4. DISCUSSION 23
5. CONCLUSIONS 25
6. REFERENCES 26
ANNEX 1: EXAMPLE RAW DATA TABLES 28
ANNEX 2: PHOTO-IDENTIFICATION CATALOGUE 31
ANNEX 3: GIS PROJECT 32
ANNEX 4: SITE ATTRIBUTE TABLE 33

iv
Acknowledgements We would like to thank all the colleagues who have helped collect and analyse data during this period. We would especially like to thank Charlie Phillips and the Whale and Dolphin Conservation Wildlife Centre in Spey Bay for their photographic contributions. Thank you to Andrew Brownlow and his team at Scotland’s Rural College (SRUC) Scottish Marine Animal Stranding Scheme for providing a summary of their data. Surveys and analysis of data from 2016 were funded by Scottish Natural Heritage. We would also like to thank Beatrice Offshore Wind Ltd. (BOWL), Moray Offshore Renewables Ltd. (MORL), Marine Scotland, The Crown Estate, Highlands and Islands Enterprise, BES, ASAB, Greenpeace Environmental Trust, Scottish Government, Whale and Dolphin Conservation, Talisman Energy (UK) Ltd., Department of Energy and Climate Change, Chevron, Natural Environment Research Council and the Universities of Aberdeen and St Andrews whose support has allowed us to continue these studies on an annual basis. The St Andrews Bay efforts were funded by a Royal Society University Research Fellowship, a fellowship of the Wissenschaftskolleg zu Berlin and studentships from NERC and the Mexican National Council for Science and Technology (CONACYT), and contributions from Scottish Natural Heritage. All survey work was conducted under Scottish Natural Heritage Animal Scientific Licences.

1
1. INTRODUCTION
The Moray Firth Special Area of Conservation (SAC) was designated in 2005 under the European Habitats Directive (92/43/EEC) for bottlenose dolphins (Tursiops truncatus). The SAC extends from the inner firths to Helmsdale on the north coast and Lossiemouth on the south coast (Figure 1), and includes areas that are regularly used by the population of bottlenose dolphins occurring along the east coast of Scotland. Since 1989, this population of bottlenose dolphins has been the focus of an intensive research programme, carried out by the University of Aberdeen in collaboration with the Sea Mammal Research Unit at the University of St Andrews. Research has been conducted throughout the known range of this population, but the core programme has consisted of boat-based photo-identification studies within the Moray Firth SAC. As a result, these studies have provided information on abundance, distribution and behaviour patterns that have supported the development and management of the SAC. Scottish Natural Heritage (SNH) has a responsibility to provide information to enable reporting on the condition of bottlenose dolphins within the Moray Firth SAC every six years. In 2003, SNH contracted the Universities of Aberdeen and St Andrews to review existing information on the distribution and abundance of this population of bottlenose dolphins, and to explore the different options for monitoring bottlenose dolphins within the SAC (Thompson et al., 2004). Subsequently, SNH entered into a Memorandum of Agreement with the University of Aberdeen to support these photo-identification studies and use these data to fulfil SNH’s requirement to report on the condition of the site. During the period 1990-2000 there appeared to have been a decline in the extent to which this population was using the SAC, and an apparent range expansion (Wilson et al., 2004). Data from the first reporting cycle (2002-2004) (Thompson et al., 2006) confirmed that a high proportion (75-80%) of the east coast of Scotland population still used the SAC during summer, and suggested that there may have been a slight increase in summer abundance within the SAC post-2000. On the basis of these findings, the condition status in 2006 was considered to be “Unfavourable (recovering)”. An internal report covering 2005 to 2007 identified significant inter-annual variation in the indicators being monitored, and acknowledged that it remained unclear to what extent this resulted from sampling variation or genuine biologically significant changes. In light of this uncertainty and the limited amount of data collected since the previous report, no change was made to the condition status (Thompson et al., 2009). The 2008 to 2010 report analysed data from 1990 to 2010 and concluded that despite inter-annual variability the number of dolphins using the SAC had remained stable. Additional data suggested that there was no evidence of a decline in the population of dolphins on the east coast of Scotland, and there was an over 99% probability that this population is stable or increasing. However, the proportion of the east coast of Scotland bottlenose dolphin population that uses the SAC had declined, most probably due to an overall increase in population size (Cheney et al., 2012). Yet >50% of the population used the SAC at some point in any one year (Cheney et al., 2014a) and intensive surveys in 2006 and 2007 over the entire east coast showed that >80% of well-marked dolphins in this population have been photographed in the SAC (Cheney et al., 2013). On this basis, the condition status in 2012 was considered to be “Favourable (recovered)”. The last report (2011 to 2013) again found that, despite inter-annual variability, the number of dolphins using the SAC between 1990 and 2013 appeared stable. Passive acoustic monitoring from 2011 to 2013 highlighted some inter-annual and seasonal variation in the amount of time dolphins spent at sampling sites within the SAC, although at two of the sites

2
dolphins were present on almost all days during the summer (Cheney et al., 2014b). As a result of the interim nature of this report and the limited numbers of years of data collected since the last full assessment (Cheney et al., 2012) it was recommended that no change was made to the condition status.
This report presents the results from the fifth round of SNH funded surveys, together with the results of similar surveys made in 2014 and 2015 that were carried out with support from BOWL, MORL, Marine Scotland, The Crown Estate and Highlands and Islands Enterprise. We also present data from additional studies outside the SAC and passive acoustic monitoring data to support efforts to monitor the level of use that dolphins make of the SAC. These data are incorporated into a revised assessment of the condition of this bottlenose dolphin population for this full site condition monitoring report.
Figure 1. A map showing the location of the Moray Firth and the boundaries of the Moray Firth SAC (grey), core study area (dark grey) and locations of POD deployments at three monitoring sites (pins). © Crown copyright [and database rights] 2017 OS 100017908

3
2. METHODS
Detailed discussion of the different options for monitoring bottlenose dolphins in the Moray Firth SAC can be found in Thompson et al. (2004). Following this work, it was decided that the main requirement was to estimate the number of dolphins using the SAC. Given this, it was recommended that mark-recapture analysis of photo-identification data was the most appropriate method for estimating the abundance of this well-marked population of coastal dolphins. However, there still remained a number of different sampling options that could provide estimates of this kind. In particular, given the large size of the SAC, it was recommended that sampling be restricted to a core study area that can be used as a proxy for the SAC. Furthermore, because of the need for good weather conditions for boat-based photo-identification work, it was recommended that surveys be restricted to the summer period, when earlier year-round studies had also indicated that abundance within the Moray Firth SAC was highest (Wilson et al., 1997). The resulting survey strategy was therefore based on Option A in Thompson et al. (2004), and further details of the protocols are given below.
2.1 Survey protocols
Surveys focused on the core study area (dark grey area in Figure 1). All surveys were made from an MCA certified 5.8 m Rigid Inflatable Boat, working from Cromarty Harbour. Survey effort was spread through the period May to September, but restricted to days with low sea state (≤ Beaufort 3), to maximise sighting probability, and good light conditions to maximise photographic quality. Survey routes were chosen to maximise sighting probability whilst also providing reasonably wide coverage of the core study area. Occasional surveys also covered other areas within the SAC and outside the SAC along the south coast of the Moray Firth. However, here we only present data from surveys and encounters with dolphins within the SAC. Surveys were made with a minimum crew of two, including an appropriately qualified skipper and at least one of the personnel named on the Animal Scientific Licence (Licence #13292 from 2012 to 2016) granted to the University of Aberdeen by SNH.
Throughout the survey, the survey route was recorded automatically from the boat’s GPS, and later downloaded to a GIS. Whenever a group of dolphins was encountered, the position and time was noted, a waypoint entered on the GPS log, and an estimate made of the size of the group (Wilson et al., 1997). The boat was then carefully manoeuvred at slow speed around the dolphins to allow dorsal fin photographs to be taken with a Canon 7D and a 70-200 mm lens. In doing so, every effort was made to minimise disturbance to the group, and to obtain pictures that were of sufficient quality for subsequent mark-recapture analyses. In particular, it was important to ensure that: dorsal fins were parallel to the camera; the whole fin was in the picture; the height of the fin image was >10% of the field of view; and that pictures were taken such that there was an equal probability of photographing different members of the group. The encounter was ended either when all dolphins had been photographed or when the survey vessel lost contact with the group. At this point, the end time and location were noted and another GPS waypoint taken.
2.2 Photographic analysis
Following the survey, the survey and each encounter within it were allocated unique “Trip” and “Encounter” numbers. Photographs were downloaded to a PC, and the pictures from each encounter were stored in individual folders. All pictures were then backed up to DVD before renaming the original image files with a name that included the trip number (see Annex 1).
All the pictures taken on each encounter were then graded for photographic quality according to the criteria in Figure 2, adapted from Wilson et al. (1999). Subsequent analyses were restricted to the subset of high quality (Grade 3.1, 3.2 & 3.3) pictures to avoid biasing

4
mark-recapture estimates of abundance (see Wilson et al., 1999). Analyses were also restricted to the subset of animals bearing distinctive marks, i.e. those with nicks in their dorsal fin. Each of these dorsal fin pictures was initially matched against the existing catalogue (see Annex 2) by one experienced project team member. At the end of the season, each of these matches was then confirmed by a second experienced person.
Confirmed sightings of the different dolphins were then recorded in an Access database, linking that sighting with information on which side of the dolphin had been photographed, and the trip and encounter information (see Annex 1). Estimates of group size were recorded as the larger of the field estimate of the number of animals seen in each encounter and the number of animals subsequently identified from grade 3 pictures. In addition, we used all grade 3 pictures to estimate θ, the proportion of animals that were well-marked. For each trip, we recorded the number of photographed individuals that were well-marked (i.e. animals with dorsal fin nicks that could be identified from either the left or right side), and the number of individuals not well-marked (i.e. no dorsal fin nicks), and recorded this information in a separate database table (see Annex 1).

5
Figure 2. Schematic showing the criteria used to quality grade the photographs taken during photo-identification surveys. Only sightings confirmed from pictures of grade 3.1, 3.2 or 3.3 were used in mark-recapture analyses to estimate abundance.

6
2.3 Mark-recapture analysis
Previously, inspection of our time series of data suggested that much of the variation, particularly in early estimates of annual abundance, appeared to be linked to sampling variation related to our estimate of the proportion of well-marked dolphins (θ) (Cheney et al., 2012, 2014a). Revised protocols and sampling regime including a change to opportunistic surveys and digital photography in 2001 and 2002 improved precision of our θ and annual abundance estimates. Therefore, in this report we have focused on abundance from 2001 to 2016, providing estimates from before the designation of the SAC in 2005 to the end of the current reporting period.
Annual abundance estimates were based on well-marked individuals with nicked dorsal fins that could be identified from both sides. Therefore, a single capture history was produced combining left and right sides for each year (Cheney et al., 2012, 2014a, 2014b) (see Annex 1 for an example). Based on comparisons in Wilson et al. (1999) and Cheney et al. (2014a), we used the Chao et al. (1992) Mth model, implemented in the program CAPTURE (Rexstad & Burnham, 1991), to estimate the number of well-marked individuals for each year.
In previous reports, the proportion of well-marked dolphins (θ) has either been estimated annually (Thompson et al., 2009) or modelled to account for sampling variation (Cheney et al., 2012, 2014b). In this report, we estimated θ annually as data are presented from a period where our sampling regime and protocols were consistent. In addition, longer term changes in θ could result from gradual changes in population age or sex structure which are important to include. For each trip, we estimated the proportion of well-marked animals seen on the left and right sides separately (as dolphins with no nicks may not be identified from both sides), and an average value was calculated for each year’s set of surveys (Thompson et al.,2006, Wilson et al., 1999). This annual estimate of θ was used to inflate the annual mark-recapture estimates of well-marked animals (𝑁𝑁𝑡𝑡�) for each year t 2001 to 2016 to estimate total annual abundance within the SAC (Nt total = 𝑁𝑁�𝑡𝑡 𝜃𝜃⁄ ). Assuming Nt total is log normally distributed, the upper and lower 95% confidence intervals were estimated, by dividing and multiplying Nt total, respectively, by:
𝑒𝑒1.96�ln (1 + 𝐶𝐶𝐶𝐶𝑁𝑁𝑡𝑡 𝑡𝑡𝑡𝑡𝑡𝑡𝑡𝑡𝑡𝑡
2 )
where: 𝐶𝐶𝐶𝐶𝑁𝑁𝑡𝑡 𝑡𝑡𝑡𝑡𝑡𝑡𝑡𝑡𝑡𝑡2 = 𝑣𝑣𝑣𝑣𝑣𝑣(𝑁𝑁�𝑡𝑡)
𝑁𝑁�𝑡𝑡2+ 𝑣𝑣𝑣𝑣𝑣𝑣(𝜃𝜃)
𝜃𝜃2
A linear regression was used to determine whether there was a trend in abundance within the SAC.

7
2.4 Dolphin population trends
2.4.1 Estimating total population size
As data for the population from outside the SAC are sparser, we used a Bayesian mark-recapture model with a state-space approach developed by Corkrey et al. (2008) to estimate abundance and trends for the total population. This Bayesian model uses the same underlying data used in the annual mark-recapture estimates for the SAC, but only uses information on whether or not a well-marked animal was seen in each year (for full model details see Cheney et al., 2014a, Corkrey et al., 2008).
To estimate the annual total abundance for the east coast bottlenose dolphin population, this model was updated to include data from surveys made across the known range of this population between 2001 and 2015 (data from outside the SAC for 2016 are not yet available). This included University of Aberdeen data from the inner Moray Firth, outer Moray Firth, Grampian and Tayside and Fife, and University of St Andrews Sea Mammal Research Unit (SMRU) data from around Tayside (for survey details see Arso Civil, 2014, Islas-Villanueva, 2010, Quick & Janik, 2008, Quick et al., 2008). Additional data from the Moray Firth were also available from Whale and Dolphin Conservation (WDC) surveys that were made from land-based observation points in the inner Moray Firth and from a commercial dolphin watching vessel along the southern coast of the Moray Firth. All photographs from collaborators were graded (Figure 2) and matches were confirmed by at least two experienced researchers (see also Thompson et al., 2011).
Following Corkrey et al. (2008) and Cheney et al. (2014a) this model was run in R (R Core Team, 2016) for 1,000,000 iterations with a 50% burn in. The average proportion of well-marked animals was calculated as previously for each trip using data from the University of Aberdeen, and SMRU where available, and incorporated in the model. This produced yearly estimates of the total number of bottlenose dolphins using the east coast of Scotland with 95% highest posterior density intervals (HPDI). A simple Bayesian linear regression model (Cheney et al. 2014a) was used to determine whether there was a trend in total population abundance.
2.4.2 Births and mortality
Available data sources were used to attempt to determine if there were any changes in crude birth rates or observed mortality within the population. The numbers of known calf births each year within the SAC and on the east coast from 2001 to 2016 were reviewed. The number of known strandings over the same time period on the east coast of Scotland were obtained from the Marine Animal Stranding database created by the Scottish Marine Animal Stranding Scheme (SRUC, 2017).
2.5 Usage of the SAC
Three methods were employed to estimate the use of the SAC by the east coast of Scotland bottlenose dolphin population. The first involved relating the numbers of animals recorded in the SAC to total population size and the others used different approaches to quantify the amount of time dolphins spent within the SAC.
2.5.1 Proportion of the total population
Following Cheney et al. (2014a), trends in the proportion of the total population using the SAC from 2001 to 2015 were investigated using a parametric bootstrap procedure to account for the uncertainty around the abundance estimates. For each year, estimates of

8
abundance for the SAC and total population were drawn from lognormal distributions of the mean and variance of the SAC and total population abundance estimates. The annual proportion of the total population using the SAC was then calculated. A GLM with quasi-binomial error distribution to account for overdispersion in the data and logit link was fitted to these annual proportions to estimate the slope. This bootstrapping procedure was repeated 1000 times. 2.5.2 Encounter probability in the Sutors area
Although survey routes varied, all surveys passed through the Sutors of Cromarty (the headlands at the mouth of the Cromarty Firth). Therefore, as in previous condition monitoring reports, we used a simple index of usage of the SAC based on the probability of encountering dolphins each time the survey boat passed through the Sutors area during the period May to September (Thompson et al., 2006). 2.5.3 Passive acoustic monitoring
Passive acoustic monitoring was used to provide a more detailed assessment of usage of the SAC. CPODs were used to record changes in the presence or absence of dolphins at sample sites within the SAC. These devices incorporate a hydrophone, processor and digital timing system. The CPOD continuously detects from 20-160 kHz, logging time, centre frequency, sound pressure level and bandwidth of each cetacean echolocation click and can log detections for periods of up to 4 months. The manufacturer’s software program was used to post-process the recovered data, detect characteristic click trains, and remove noises from other sources such as boat sonar (see www.chelonia.co.uk for details). Resulting data on the number of click trains recorded in each minute can be used to determine the presence or absence of target species in different time periods, or to identify the timing and duration of encounters with target species. CPODs were used to detect dolphin echolocation click trains, and processed all data using the manufacturer’s software (www.chelonia.co.uk). Trends in the use of sample sites within the SAC were evaluated using all available acoustic data from a series of different studies that have been conducted by the University of Aberdeen (Graham et al., 2016, Thompson et al., 2013). Sample sites and coverage varied between years, but data were available for this reporting period from 2011 to 2016 for three sample sites within the SAC (Sutors, Chanonry and Lossiemouth) (Figure 1). Data are included only for those months in which data are available for 10 or more days. Early failure of equipment thus meant that coverage was not available in all months (see results).

9
3. RESULTS
3.1 Survey details
In 2016, 21 photo-identification surveys were carried out within the SAC under contract from SNH. These surveys resulted in a total of 165 encounters with dolphin groups. Information on these surveys, and those made in 2014 and 2015 are presented in Table 1 and the survey routes for these three years are shown in Figure 3 (see Annex 3 for details of the GIS project).
Table 1. Summary data on the number of photo-identification surveys conducted during the 2014 to 2016 reporting period.
Year No. of surveys
Mean survey duration (hours)
No. of encounters % of survey time with dolphins
2014 21 6.5 135 39 2015 20 6.2 122 39 2016 21 6.8 165 34

10
Figure 3. Maps showing the areas covered by surveys in a) 2014, b) 2015 and c) 2016. © Crown copyright [and database rights] 2017 OS 100017908
a) 2014
b) 2015
c) 2016

11
Although median group sizes were similar in 2014, 2015 and 2016 (5, 6 and 5 respectively), maximum group sizes were bigger in 2015 (Figure 4). However, this difference was not significant (Kruskall-Wallis, χ2 = 1.9461, df = 2, p=0.3779).
Figure 4. Frequency distribution of different estimated dolphin group sizes encountered during photo-identification surveys in 2014, 2015 and 2016.
The locations of encounters with dolphins in each year, based on the position of the survey boat at the start of each encounter, are given in Figures 5 (see Annex 3 for details of the GIS project). See Cheney et al. (2014b) for full information on survey effort, group sizes and encounters with dolphins from 2011 to 2013.

12
Figure 5. Maps showing the location of encounters with groups of dolphins during surveys conducted in a) 2014, b) 2015 and c) 2016. © Crown copyright [and database rights] 2017 OS 100017908
a) 2014
b) 2015
c) 2016

13
3.2 Estimate of the number of dolphins using the SAC
High quality pictures were obtained from at least 46 well-marked individuals during the 2016 surveys. The mark-recapture estimate of the total number of well-marked individuals was 47 (95% confidence interval (CI): 47-52). This estimate was inflated by the annual proportion of well-marked individuals, θ. The resulting estimate of the number of dolphins using the SAC in the summer of 2016 was 103 (95% CI: 93-115). Equivalent estimates for 2011 to 2015 are presented in Table 2.
Table 2. Dolphin population data from the mark-recapture analysis using the Mth model including the number of well-marked individuals identified in grade 3 pictures (minimum number), the estimated number of well-marked individuals from CAPTURE (N-hat), the total number of dolphins estimated in the SAC (Total abundance) with 95% confidence intervals and the annual proportion of well-marked individuals (θ).
Year
Minimum Number
^ N
95% CI
θ
Total abundance
95% CI
2011 52 57 54-68 0.5259 108 95-124 2012 59 63 61-73 0.4955 127 109-148 2013 51 52 52-56 0.5632 92 86-100 2014 41 44 42-52 0.5151 85 75-97 2015 53 55 54-61 0.5275 104 95-115 2016 46 47 47-52 0.4549 103 93-115
3.3 Trends in the number of dolphins using the SAC
Annual estimates from 2001 to 2016 of the number of dolphins using the SAC in summer show variability from year to year (Figure 6). However, there is no significant linear trend in these annual estimates (F1,14 = 0.8904, p = 0.3614).
Figure 6. Annual estimates of the number of dolphins using the Moray Firth SAC from 2001 to 2016 with 95% confidence intervals.

14
The estimates in Figure 6 represent variation in the abundance of dolphins within the Moray Firth SAC. As such, this may represent changes either in the overall population size, and/or the proportion of the population that entered the Moray Firth SAC each year during the survey period. 3.4 Dolphin population trends
3.4.1 Estimating total population size
Data were available until 2015 to update the annual estimates of the east coast bottlenose dolphin population. Using the Bayesian model, estimates varied from 129 (95% HPDI 104-155) in 2001 to 189 (95% HPDI 155-216) in 2015. A Bayesian linear regression suggests that the bottlenose dolphin population on the east coast of Scotland is increasing (100% probability that the slope is greater than zero) (Figure 7).
Figure 7. Total east coast bottlenose dolphin population estimates showing posterior means and 95% HPDI based on annual estimates using Corkrey et al. (2008) Bayesian state-space capture-recapture approach. 3.4.2 Births and mortality
Bottlenose dolphin calves can be identified in their first, second or third year of life using foetal folds (vertical creases down the sides of calves from their position in the womb, which fade over time). However, only calves seen in echelon position (where the calf is seen consistently surfacing alongside the mother’s dorsal fin) with known females were included to avoid possible duplication. This resulted in a total of 169 calves identified on the east coast of Scotland between 2001 and 2016 (Figure 8). The number of newborn calves ranged from 3 to 20 in each year (mean = 11; se = 1.5). Effort outside the SAC varied in each year and data are not yet available for 2016, which complicates interpretation of these trends. In addition, calves are not always detected in their year of birth and therefore data from 2016 are preliminary. Further analyses of temporal variation in fecundity, based on sightings of individually recognisable females, is ongoing.

15
Figure 8. The number and estimated year of birth of calves observed with known females on the east coast of Scotland, including calves first identified in the SAC (grey bars) and outside the SAC (white bars) (Note: Data are not yet available from outside the SAC for 2016 and calves are included in the area they were first identified, some will have been observed in both areas). The Scottish Marine Animal Stranding Scheme (SRUC, 2017) recorded 31 stranded bottlenose dolphins on the east coast of Scotland between 2001 and 2016 (Figure 9). The number of stranded individuals ranges from zero to seven each year with an average of two (se = 0.39). The observed variability could be a result of changes in mortality, search effort or simple stochasticity due to the small number of animals. Also, it is unknown if all of these stranded animals belong to the east coast of Scotland population. Many of these strandings are of young animals and/or in an advanced state of decomposition. As a result, only three animals stranded since 2001 were matched to the University of Aberdeen east coast of Scotland bottlenose dolphin catalogue.

16
Figure 9. The number of stranded bottlenose dolphins found on the east coast of Scotland (Duncansby Head to the border with England) between 2001 and 2016 from the Scottish Marine Animal Stranding Scheme.
3.5 Usage of the SAC
3.5.1 Proportion of the total population
The proportion of the total bottlenose dolphin population that used the SAC was investigated using annual estimates of abundance in the SAC and the Bayesian modelled estimates of total population size. The parametric bootstrap took uncertainty around these estimates into account and provided evidence that the proportion of the population using the SAC has declined, with all bootstrap replicate GLMs showing negative slope coefficients (mean = −0.0682, SE = 0.0007). However, 84% of bootstrap replicates showed that >50% of the population used the SAC in any year during this time-series (Figure 10).

17
Figure 10. The estimated average percentage of the east coast of Scotland bottlenose dolphin population using the SAC from 2001 to 2015 from the bootstrap replicates, with 5th and 95th percentile error bars. 3.5.2 Encounter probability in the Sutors area
Effort in different parts of the SAC varied among surveys and years. However, the Sutors area was visited during every survey, and the probability of encountering groups of dolphins within this area averaged 0.79 from 2011 to 2016 (Table 3), identical to that reported for 2008 to 2010 (Cheney et al., 2012).
Table 3. Estimates of the usage of the SAC based on the probability of encountering groups of dolphins within the Sutors area.
Year Total number of trips Proportion of trips encountering dolphins in the Sutors area
2011 21 0.81 2012 19 0.89 2013 22 0.68 2014 21 0.81 2015 20 0.75 2016 21 0.81 Total 124 0.79

18
3.5.3 Passive acoustic monitoring
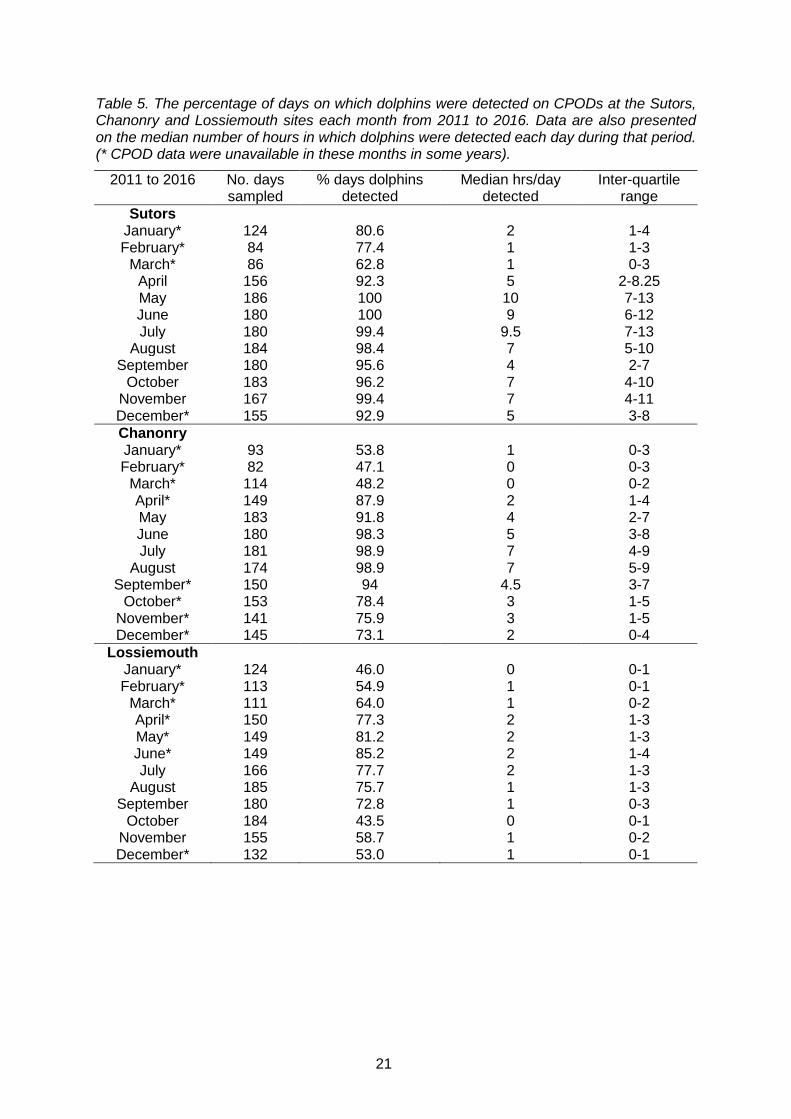
To investigate annual changes in the detection of dolphins by CPODs moored in the Sutors, Chanonry and Lossiemouth sites, data from May to September were used for consistency with the summer photo-identification data. Table 4 shows the full number of days sampled each summer for the period 2011 to 2016. There was annual variation in the median number of hours per day dolphins spent at each of these sites, which also differed for each site (Table 4 and Figure 11). At the Sutors there was a significant difference (Kruskal-Wallis Test, c2= 45.548, df = 5, p<0.0001) in the median number of hours dolphins were detected, with a decrease in 2015 and 2016; however, dolphins were still detected on >99% of days for a median of 6-7 hours per day. At Chanonry, there was a significant difference (χ2= 88.768, df = 5, p<0.0001) in the number of hours dolphins were detected in each year, with an increase in 2013 and 2014. Again, dolphins were detected on most days during the summer. Finally, at Lossiemouth the median number of hours dolphins were detected was slightly higher from 2013 to 2016 than previously (χ2= 41.697, df = 5, p<0.0001). However, the median number of hours and number of days dolphins were detected here were lower than in the Sutors or Chanonry (Table 4 and Figure 11). Data on seasonal changes in the detection of dolphins by CPODs moored at sample sites in the Sutors, Chanonry and Lossiemouth areas from 2011 to 2016 are presented in Table 5 and Figure 12. Table 5 shows the full number of days sampled each month. These data indicate that, similar to previous years, there was a peak in dolphin occurrence during the summer photo-identification survey period. Nevertheless, dolphins were also present in these areas for a significant number of days, and amount of time per day, at other times of the year (Table 5 and Figure 12). For example, at the Sutors, dolphins were detected on average between 5 and 7 hours per day during April and between October and December (inter-quartile ranges = 2 to 11), similar to summer medians of 4 to 10 hours per day (inter-quartile ranges = 2 to 13). In addition, in the same “non-summer” months, dolphins were detected on >90% of days the CPODs were deployed (Figure 12a and Table 5).

19
Table 4. Annual figures for the percentage of days on which dolphins were detected on CPODs at the Sutors, Chanonry and Lossiemouth sites during the summer (May to September). Data are also presented on the median number of hours in which dolphins were detected each day during that period. (* CPOD data were unavailable in some months in some years, see Table 5 for details)
Year No. days sampled
% days dolphins detected
Median hrs/day detected
Inter-quartile range
Sutors 2011 152 96.1 8 5-12 2012 152 100 9 6-13 2013 151 98.7 9 5-13 2014 151 98.7 9 6-12 2015 152 99.3 6 4-9 2016 152 99.3 7 4-10
Chanonry 2011* 109 99.1 5 3-7 2012 152 94.7 5 3-7 2013 152 97.4 8 5-10 2014 152 98.7 7 4.75-9 2015 152 94.7 4 3-6.25 2016 151 94.7 5 3-8
Lossiemouth 2011 152 72.4 1 0-2.25 2012 152 68.4 1 0-2 2013 152 78.3 2 1-3 2014 152 87.5 2 1-3.25 2015 152 86.8 2 1-4 2016* 74 73.0 2 0-3

20
Figure 11. Annual variation in the median number of hours per day (+/- inter-quartile ranges) that dolphins were detected on CPODs moored at the Sutors, Chanonry and Lossiemouth sites during the summers (May to September) of 2011 to 2016.
a) Sutors
b) Chanonry
c) Lossiemouth
21
Table 5. The percentage of days on which dolphins were detected on CPODs at the Sutors, Chanonry and Lossiemouth sites each month from 2011 to 2016. Data are also presented on the median number of hours in which dolphins were detected each day during that period. (* CPOD data were unavailable in these months in some years).
2011 to 2016 No. days sampled
% days dolphins detected
Median hrs/day detected
Inter-quartile range
Sutors January* 124 80.6 2 1-4 February* 84 77.4 1 1-3
March* 86 62.8 1 0-3 April 156 92.3 5 2-8.25 May 186 100 10 7-13 June 180 100 9 6-12 July 180 99.4 9.5 7-13
August 184 98.4 7 5-10 September 180 95.6 4 2-7
October 183 96.2 7 4-10 November 167 99.4 7 4-11 December* 155 92.9 5 3-8 Chanonry January* 93 53.8 1 0-3 February* 82 47.1 0 0-3
March* 114 48.2 0 0-2 April* 149 87.9 2 1-4 May 183 91.8 4 2-7 June 180 98.3 5 3-8 July 181 98.9 7 4-9
August 174 98.9 7 5-9 September* 150 94 4.5 3-7
October* 153 78.4 3 1-5 November* 141 75.9 3 1-5 December* 145 73.1 2 0-4
Lossiemouth January* 124 46.0 0 0-1 February* 113 54.9 1 0-1
March* 111 64.0 1 0-2 April* 150 77.3 2 1-3 May* 149 81.2 2 1-3 June* 149 85.2 2 1-4 July 166 77.7 2 1-3
August 185 75.7 1 1-3 September 180 72.8 1 0-3
October 184 43.5 0 0-1 November 155 58.7 1 0-2 December* 132 53.0 1 0-1

22
Figure 12. Seasonal variation in the median number of hours per day (+/- inter-quartile ranges) that dolphins were detected on CPODs moored in the Sutors, Chanonry and Lossiemouth sample sites from 2011 to 2016.
a) Sutors
c) Lossiemouth
b) Chanonry

23
4. DISCUSSION
Currently, there are three attributes and associated targets for the bottlenose dolphin feature of the Moray Firth SAC, as outlined in the Site Attribute Table (Annex 4). The existing photo-identification monitoring programme focuses on providing data to monitor the first and second of these attributes (the number of individual dolphins using the SAC and frequency of occurrence of dolphins within the SAC). Additional photo-identification data from ongoing studies outside the SAC across the known home range of this population, including from collaborative projects, can be used to monitor the third site attribute (dolphin population trends). Data on the proportion of the population using the SAC, variation in sightings rates in the Sutors area, and data from passive acoustic monitoring studies provide extra information to assess the second attribute. Due to the large size of the SAC, efforts to monitor changes in the number of dolphins using the SAC (Attribute 1.1.1) have been based on photo-identification surveys within a core study area in the inner Moray Firth. This has the advantage that sighting probability is higher in this intensively used area, and abundance estimates are therefore more precise. Furthermore, data collected during this monitoring programme can be more clearly related to the existing time series of data from this core study area (Thompson et al., 2004). It remains possible that other individuals use other parts of the SAC, but are never recorded within the core study area in the inner Moray Firth. However, three lines of evidence still support our assumption that this core study area provides a good proxy for use of the whole SAC. First, during extensive visual and acoustic surveys conducted across the whole of the SAC in the summers of 2004 and 2005, 84% of dolphin encounters were within the core study area (Bailey & Thompson, 2009). Second, most remaining sightings were along the southern Moray Firth coast, and related photo-identification studies have shown that animals using these areas also use the core study area (Durban et al., 2005, Wilson et al.,1999). Thirdly, work completed as part of a Scottish Government and Scottish Natural Heritage funded project identified that in 2006 and 2007 over 80% of the well-marked dolphins seen on the southern coast of the outer Moray Firth were also identified within the SAC in those years. Only 11 well-marked individuals seen in this area in 2006 or 2007 were not seen in the SAC over this period, and only one has never been seen in the SAC (Thompson et al., 2011). Previous reports have estimated abundance and trends within the SAC from 1990 onwards. However, inspection of our time series of data suggested that much of the variation, particularly in early estimates of annual abundance, appeared to be linked to sampling variation (Cheney et al., 2014a). Our protocols and sampling regime were revised in 2001 and 2002 which improved precision in the annual abundance estimates. Therefore, to assess the first site attribute (Attribute 1.1.1, the number of individual dolphins using the SAC) we have focused on abundance from 2001 to 2016, providing estimates from before the designation of the SAC in 2005 to the end of the current reporting period. Using data collected in the 2016 surveys, we estimated that 103 (95% CI: 93-115) different bottlenose dolphins used the SAC during the period May to September. Using 16 years of data, results indicated that there is inter-annual variability in the number of dolphins in the SAC, but no significant trend in abundance. The second site attribute is the frequency of occurrence of dolphins within the SAC (Attribute 1.1.2). For this assessment we updated the estimate of overall abundance for the east coast of Scotland bottlenose dolphin population, and compared this to estimates of the number of individuals using the SAC. Results suggest that between 2001 and 2016 there was a slight decrease in the proportion of the total population using the SAC (mean slope = −0.0682), but this seems to be driven by an increase in overall population size (Figure 7) rather than a reduction in the number of dolphins using the SAC (Figure 6). Despite this reduction, results suggest that the SAC is still used by the majority of this bottlenose dolphin population, but that it is marginally less important to the population as a whole in 2016 than it was in 2001.

24
Our most comprehensive photo-identification dataset from 2006 and 2007 showed that 46% of the well-marked animals seen in those years were only identified outside the SAC. Of these, 30% were seen in the SAC within the last five years but 38% have never been seen in the SAC (Thompson et al., 2011). This adds weight to Wilson et al.’s (2004) research identifying that this population has expanded its range and also suggests that a small number of individuals may never visit the SAC. In addition, similar to previous assessments, we used a simple estimator that provided information on variation in the probability of sighting dolphins in the Sutors area (an area visited on every survey). Data from 2011 to 2016 confirm that dolphins continue to be encountered within this area at a high rate (on an average of 79% of visits to the area) which was identical to that reported for 2008 to 2010 (Cheney et al., 2012). The passive acoustic monitoring data from three sample sites within the SAC between 2011 and 2016 showed dolphins were detected in all months at all sites. However, inter-annual and seasonal patterns of occurrence varied between sites. There was a slight decrease in the amount of time dolphins were detected in each day around the Sutors in 2015 and 2016, although dolphins were still detected on >99% of days in these years. At Chanonry, dolphins were detected for slightly longer each day in 2013 and 2014 compared to the other years, although again they were detected on most days every year. Overall, dolphins were detected for fewer hours per day and on fewer days at Lossiemouth compared to the Sutors and Chanonry. Although there remains a peak in dolphin detections during the summer months, these passive acoustic monitoring data continue to suggest that dolphins may use certain areas of the SAC outside the summer months more than previously thought (Wilson et al., 1997). For example, at the Sutors, dolphins were detected on almost all days between April and December, with dolphins detected for more hours outside the summer months than in September. The third site attribute relates to overall trends in the east coast of Scotland dolphin population (Attribute 1.1.3). Monitoring to address this attribute requires photo-identification data to be collected from both within and outside the SAC. Data from areas outside the SAC are not available for all years. To estimate total population abundance we used the Bayesian method developed by Corkrey et al. (2008) and updated the results in Cheney et al. (2012) using additional data from the outer Moray Firth between 2011 and 2013 and from the Grampian, Tayside and Fife area between 2011 and 2015. Results indicate the population is increasing. No unusual observations in terms of the number of calves born or frequency of strandings within the population have been recorded. In May 2005, the original condition monitoring assessment concluded that the current condition of the population was “Unfavourable (no change)”. Subsequent analysis of monitoring data from 2003 and 2004 indicated that there was a higher probability that targets 1.1.1 and 1.1.2 were being met, and this was reflected in a revision of the condition status to “Unfavourable (recovering)” (Thompson et al., 2006). The internal report for 2005 to 2007 highlighted that there was significant inter-annual variation in the indicators being monitored, and it remained unclear to what extent this resulted from sampling variation or genuine biologically significant changes and therefore the condition status was not changed (Thompson et al., 2009). The 2008 to 2010 report suggested that despite inter-annual variability, the number of dolphins using the SAC between 1990 and 2010 had remained stable; that there was a ≥99% probability that the east coast of Scotland dolphin population was stable or increasing; and although the proportion of the dolphin population that use the SAC has declined, this was likely due to an overall increase in population size (Cheney et al., 2012). All attributes for the bottlenose dolphin feature of the Moray Firth SAC were met, and the condition status was revised to “Favourable (recovered)”. The last report for 2011 to 2013 also suggested the number of dolphins using the SAC was stable. In addition, passive acoustic monitoring demonstrated inter-annual and seasonal variation in the amount of time dolphins spent at sample sites within the SAC, although they were detected on almost all

25
days during the summer (Cheney et al., 2014b). In light of the lack of available data to update attribute 1.1.3 and the limited years of data collected since the previous assessment, no change was made to the condition status at that time. In summary, and building on the results of the previous assessments, for this report the quality of data available for completing the Site Attribute Table is high for attribute 1.1.1, 1.1.2 and 1.1.3. As a result of the findings of this report, we recommend that no change is made to the condition status of the Moray Firth SAC (Favourable (recovered)). 5. CONCLUSIONS
Estimates of abundance within the Moray Firth SAC have shown inter-annual variability over the last two decades, but the number of dolphins using the SAC between 2001 and 2016 appears to be stable. In addition, the east coast bottlenose dolphin population appears to be increasing. As a result, the actual proportion of the population using the SAC has declined slightly, but >50% of the population typically use the SAC in any one year. Passive acoustic monitoring shows there is inter-annual and seasonal variation in the amount of time dolphins spend at sample sites within the SAC. In addition, this appears to vary between sites, and the data also suggest that dolphins use certain areas of the SAC outside the summer months more than previously thought. As a result of this report we recommend that no change is made to the condition status of the Moray Firth SAC (Favourable (recovered)).
26
6. REFERENCES
Arso Civil, M. 2014. Population Ecology of Bottlenose Dolphins (Tursiops truncatus) off the East Coast of Scotland. PhD thesis, University of St Andrews. Bailey, H. & Thompson, P.M. 2009. Using marine mammal habitat modelling to identify priority conservation zones within a marine protected area. Marine Ecology-Progress Series, 378, 279-287. Chao, A., Lee, S.M. & Jeng, S.L. 1992. Estimating population size for capture-recapture data when capture probabilities vary by time and individual animal. Biometrics, 48, 201-216. Cheney, B., Corkrey, R., Durban, J.W., Grellier, K., Hammond, P.S., Islas-Villanueva, V., Janik, V.M., Lusseau, S.M., Parsons, K.M., Quick, N.J., Wilson, B. & Thompson, P.M. 2014a. Long-term trends in the use of a protected area by small cetaceans in relation to changes in population status. Global Ecology and Conservation, 2, 118-128. Cheney, B., Corkrey, R., Quick, N.J., Janik, V.M., Islas-Villanueva, V., Hammond, P.S. & Thompson, P.M. 2012. Site Condition Monitoring of bottlenose dolphins within the Moray Firth Special Area of Conservation: 2008-2010. Scottish Natural Heritage Commissioned Report No. 512. Cheney, B., Graham, I.M., Barton, T.R., Hammond, P.S. & Thompson, P.M. 2014b. Site Condition Monitoring of bottlenose dolphins within the Moray Firth Special Area of Conservation: 2011-2013. Scottish Natural Heritage Commissioned Report No. 797. Cheney, B., Thompson, P.M., Ingram, S.N., Hammond, P.S., Stevick, P.T., Durban, J.W., Culloch, R.M., Elwen, S.H., Mandleberg, L., Janik, V.M., Quick, N.J., Islas-Villanueva, V., Robinson, K.P., Costa, M., Eisfeld, S.M., Walters, A., Phillips, C., Weir, C.R., Evans, P.G.H., Anderwald, P., Reid, R.J., Reid, J.B. & Wilson, B. 2013. Integrating multiple data sources to assess the distribution and abundance of bottlenose dolphins Tursiops truncatus in Scottish waters. Mammal Review, 43, 71-88. Corkrey, R., Brooks, S., Lusseau, D., Parsons, K., Durban, J.W., Hammond, P.S. & Thompson, P.M. 2008. A Bayesian capture-recapture population model with simultaneous estimation of heterogeneity. Journal of the American Statistical Association, 103, 948-960. Durban, J.W., Elston, D.A., Ellifrit, D.K., Dickson, E., Hammond, P.S. & Thompson, P.M. 2005. Multisite mark-recapture for cetaceans: Population estimates with Bayesian model averaging. Marine Mammal Science, 21, 80-92. Graham, I.M., Cheney, B., Hewitt, R.C., Cordes, L.S., Hastie, G.D., Russell, D.J.F., Arso Civil, M., Hammond, P.S. & Thompson, P.M. 2016. Strategic Regional Pre-Construction Marine Mammal Monitoring Programme Annual Report. Islas-Villanueva, V. 2010. Genetic characterisation and social structure of the East Scotland population of bottlenose dolphins (Tursiops truncatus). PhD thesis, University of St. Andrews. Quick, N.J. & Janik, V.M. 2008. Whistle rates of wild bottlenose dolphins (Tursiops truncatus): Influences of group size and behavior. Journal of Comparative Psychology, 122, 305-311. Quick, N.J., Rendell, L.E. & Janik, V.M. 2008. A mobile acoustic localization system for the study of free-ranging dolphins during focal follows. Marine Mammal Science, 24, 979-989.

27
R Core Team. 2016. R: A language and environment for statistical computing. Vienna, Austria: R Foundation for Statistical Computing. Rexstad, E. & Burnham, K.P. 1991. User's Guide for Interactive Program CAPTURE, Fort Collins, Colorado, USA, Colorado Cooperative Fish and Wildlife Reseach Unit, Colorado State University. SRUC. 2017. Scottish Marine Animal Stranding Scheme Marine Mammal Stranding Database. http://www.strandings.org/ [Online]. Available: http://www.strandings.org/ [Accessed 19 July 2017]. Thompson, P.M., Brookes, K., Cordes, L., Barton, T.R., Cheney, B. & Graham, I. 2013. Assessing the potential impact of oil and gas exploration operations on cetaceans in the Moray Firth. Final Report to DECC, Scottish Government, COWRIE and Oil & Gas UK. Thompson, P.M., Cheney, B., Candido, A.T. & Hammond, P.S. 2009. Site Condition Monitoring of bottlenose dolphins within the Moray Firth Special Area of Conservation: Interim report 2005-2007. Scottish Natural Heritage Internal Report. Thompson, P.M., Cheney, B., Ingram, S., Stevick, P., Wilson, B. & Hammond, P.S. 2011. Distribution, abundance and population structure of bottlenose dolphins in Scottish waters. Scottish Natural Heritage Commissioned Report No. 354. Thompson, P.M., Corkrey, R., Lusseau, D., Lusseau, S.M., Quick, N.J., Durban, J.W., Parsons, K.M. & Hammond, P.S. 2006. An assessment of the current condition of the Moray Firth bottlenose dolphin population. Scottish Natural Heritage Commissioned Report No. 175 (ROAME No. F02AC409). Thompson, P.M., Lusseau, D., Corkrey, R. & Hammond, P.S. 2004. Moray Firth bottlenose dolphin monitoring strategy options. Scottish Natural Heritage Commissioned Report No. 079 (ROAME No. F02AA409). Wilson, B., Hammond, P.S. & Thompson, P.M. 1999. Estimating size and assessing trends in a coastal bottlenose dolphin population. Ecological Applications, 9, 288-300. Wilson, B., Reid, R.J., Grellier, K., Thompson, P.M. & Hammond, P.S. 2004. Considering the temporal when managing the spatial: a population range expansion impacts protected areas-based management for bottlenose dolphins. Animal Conservation, 7, 331-338. Wilson, B., Thompson, P.M. & Hammond, P.S. 1997. Habitat use by bottlenose dolphins: seasonal distribution and stratified movement patterns in the Moray Firth, Scotland. Journal of Applied Ecology, 34, 1365-1374.

28
ANNEX 1: EXAMPLE RAW DATA TABLES
This Appendix contains five tables of the raw data used in this project to produce estimates of the number of dolphins using the Moray Firth SAC. Full tables are provided in electronic format. Only the first few rows of each table are displayed to illustrate the format of each file. In all cases, “-99” is an identifier for no data.
1. Surveys – containing basic information on the date and timing of surveys, with a unique “trip number” that links these data to those from any encounters with groups of dolphins during that survey.
2. Encounters – containing information on the location of the start of the encounter, estimates of group size, and a unique “encounter number” that links these data with any photographs and sightings of individually recognisable dolphins.
TRIP_NO DATE TIMESTART TIMEEND NO. OF ENCOUNTERS NO. OF PICTURES NO. OF Q3 PICTURES1539 02-May-14 07:31 12:13 5 440 1111540 08-May-14 08:08 14:16 7 299 841542 14-May-14 08:12 14:06 7 651 1401543 30-May-14 07:30 13:48 7 1264 2881544 06-Jun-14 07:15 14:23 6 652 2191545 13-Jun-14 08:20 13:45 7 258 721546 16-Jun-14 08:24 14:33 8 818 2001549 30-Jun-14 07:01 13:15 8 284 611550 08-Jul-14 07:21 15:52 4 680 1431551 11-Jul-14 08:41 16:48 7 2100 2441552 14-Jul-14 09:41 15:25 5 668 721554 21-Jul-14 07:55 15:11 6 363 691556 28-Jul-14 08:52 17:36 5 572 781557 05-Aug-14 07:18 15:01 10 675 1651559 15-Aug-14 10:18 17:48 6 504 52
TRIP_NO ENCOUNTER # GROUP SIZE START_LAT START_LONG YEAR1539 3277 2 57.69463 -3.96099 20141539 3278 4 57.69035 -3.98420 20141539 3279 12 57.65480 -4.00962 20141539 3280 5 57.57941 -4.08229 20141539 3281 1 57.58456 -4.08632 20141540 3282 1 57.68794 -4.03207 20141540 3283 1 57.68818 -4.00601 20141540 3284 4 57.70120 -3.95247 20141540 3285 3 57.56969 -4.06659 20141540 3286 1 57.64121 -4.01442 20141540 3287 2 57.69162 -3.97763 20141540 3288 6 57.68964 -4.00255 20141542 3290 8 57.68641 -4.02290 20141542 3291 2 57.67995 -3.95877 20141542 3292 2 57.66120 -4.00192 2014

29
3. Pictures – containing information on all Grade 3 pictures and the confirmed ID numbers of any dolphins in that picture.
4. Inflation factor – containing the number of well-marked and unmarked dolphins photographed on each trip, and the resulting estimate of θ.
Year Trip L_Marked L_total θ R_Marked R_total θ 2014 1539 6 14 0.42857 6 13 0.46154 2014 1540 5 8 0.625 5 10 0.5 2014 1542 8 15 0.53333 11 17 0.64706 2014 1543 15 28 0.53571 18 31 0.58065 2014 1544 14 22 0.63636 11 18 0.61111 2014 1545 4 11 0.36364 4 12 0.33333 2014 1546 14 25 0.56 14 24 0.58333 2014 1549 6 10 0.6 8 13 0.61538 2014 1550 17 38 0.44737 13 24 0.54167 2014 1551 19 33 0.57576 22 39 0.5641 2014 1552 11 15 0.73333 11 20 0.55 2014 1554 12 22 0.54545 7 16 0.4375 2014 1556 16 33 0.48485 13 24 0.54167 2014 1557 17 34 0.5 15 28 0.53571 2014 1559 10 18 0.55556 2 8 0.25
ENCOUNTER FRAME SIDE Conf_ID3277 AU14-1539-001 R 9913277 AU14-1539-009 L 9913277 AU14-1539-010 L 9913277 AU14-1539-017 R 11603277 AU14-1539-019 R 9913278 AU14-1539-043 L 11303278 AU14-1539-049 L 5783278 AU14-1539-056 L 5783279 AU14-1539-063 L 11263279 AU14-1539-064 L 11263279 AU14-1539-070 L 10683279 AU14-1539-074 R 11263279 AU14-1539-075 R 11263279 AU14-1539-084 L 2403279 AU14-1539-085 L 240

30
5. Capture Histories – containing the mark-recapture input matrices for program
CAPTURE that were used to provide estimates of abundance in each of the three reporting years. Each row represents one well-marked dolphin (with the ID number in the first column). Subsequent columns represent each survey in the year, with a 0 or 1 representing whether or not there was a confirmed sighting from a grade 3 picture for that individual, e.g. section from 2016.
0011 000000000000001010000 0023 100001001010100000000 0030 010000100011000000000 0031 000001010011110000000 0052 000000000000001000000 0105 000000101000101001000 0430 000000000001000010000 0573 110001001001010000000 0578 110101010010100000000 0580 000001010010100000001 0744 101010001000111000111 0745 000000000000000110000 0748 000000101000110001000 0800 000000000000000010000 0809 000000000000001010000

31
ANNEX 2: PHOTO-IDENTIFICATION CATALOGUE
Example page of the electronic version of the photo-identification catalogue of all well-marked dolphins recorded in the SAC during the reporting period.
32
ANNEX 3: GIS PROJECT
The GIS Project “snh 2016.mpk” contains GPS derived tracks of all surveys conducted by the University of Aberdeen as well as locations of all encounters with bottlenose dolphins during these surveys in the SAC between May and September in 2014, 2015 and 2016. The ArcMap Project includes a map of Great Britain with the UKSACs. There are three layers, each containing all the individual survey trip trails conducted in 2014, 2015 and 2016 (e.g. 2016_Trips) and another three with the combined survey tracks for all the trips per year as lines (e.g. 2016 Trip Trail Lines). There are also three other layers, each containing all the bottlenose dolphin encounters in 2014, 2015 and 2016 (e.g. 2016_Encounters). The survey tracks from each trip are found separately in the layers for each year (e.g. 1598_trail is a trip trail from 2016 within the 2016 layer). Each survey track is also provided as a .dbf and shapefile labelled with trip number and the date of the trip is included in the attribute table. Encounters are grouped by year and provided as an excel spreadsheet and shapefile for each year and in the attribute table there is information on each individual encounter. This information includes the encounter number, latitude and longitude of the start of each encounter, date, trip number and the number of dolphins in the encounter.

33
ANNEX 4: SITE ATTRIBUTE TABLE
Site Reporting Category
Interest Feature
Interest level
Attribute Target Prescription Result of Monitoring Target met? (Y/N)
Moray Firth
1 Mammals 1.1 Bottlenose dolphin (Tursiops truncatus)
SAC 1.1.1 Number of individual dolphins using the SAC
1.1.1 A stable or increasing number of dolphins using the SAC.
Apply photo-identification and mark-recapture extrapolation techniques to annual observations.
Between 2001 and 2016, annual estimates of the number of dolphins using the SAC ranged between 70 and 127. Although there is inter-annual variability in the number of dolphins using the SAC in these years there is no evidence of any linear trend.
Y
1.1.2 Frequency of occurrence of dolphins within the SAC
1.1.2 Maintain or increase the level of use of the SAC.
Determine the probability of occurrence of dolphin groups at sample sites within the SAC.
Although the proportion of the population using the SAC has declined slightly, this is likely a result of the increase in the size of the east coast population, with over 50% of the population using the SAC.
Visual and passive acoustic monitoring data indicate site specific inter-annual and seasonal variation in the amount of time dolphins spend at sample sites within the SAC. However, the data show broadly similar patterns of use over the reporting period, with relatively higher use of the Sutors and Chanonry sample sites compared with the stretch of coast at Lossiemouth. Dolphins occur at sites within the SAC on most days between May to September, although also use some sites outside the summer months more than previously thought.
Y
1.1.3 Dolphin population trends
1.1.3 Maintain a stable or increasing bottlenose dolphin population.
Evaluate trends in population size by updating Bayesian capture-recapture modelling using all available data. Evaluate other anecdotal data sources which may suggest changes in birth or mortality rates within the population.
A Bayesian capture-recapture model of photo-identification data collected across the known range of the population suggests that the bottlenose dolphin population on the east coast of Scotland is increasing.
No unusual observations in terms of the number of calves born or frequency of strandings within the population have been recorded.
Y

www.nature.scot© Scottish Natural Heritage 2018ISBN: 978-1-78391-509-5
Policy and Advice Directorate, Great Glen House, Leachkin Road, Inverness IV3 8NWT: 01463 725000
You can download a copy of this publication from the SNH website.