social structure of bottlenose dolphins (tursiops truncatus) in … · 2017-02-21 · abstract...
TRANSCRIPT

Social structure of bottlenose dolphins (Tursiops truncatus) in Cardigan Bay, Wales
Cally Barnes
Marine Biology and Oceanography – Stage 4 (2011)
Advisor: Simon Ingram
1

Social structure of bottlenose dolphins (Tursiops truncatus) in Cardigan Bay, Wales
Cally Barnes
Advisor: Simon Ingram
2

Abstract
Social behaviour studies on bottlenose dolphins in the Northeast Atlantic are limited. This
paper presents the analysis of a five year data set to determine the social structure of the
semi resident population of bottlenose dolphins, (Tursiops truncatus) inhabiting Cardigan
Bay, Wales. Photo-identification of uniquely marked dolphins encountered during non
standardised boat surveys provided a data set where association of individuals could be
analysed, in relation to school membership. Two non consecutive years, 2006 and 2008
were used as independent data sets, and compared with the full five years, to see if any
long lasting associations were evident. Between May 2005 and October 2009 there were a
total of 784 recorded dolphin encounters, with 61 dolphins during 2006 and 42 in 2008. The
mean association index between pairs was low for 2006, 2008 and the long term (0.07,
0.08 and 0.04), respectively. The mean maximum association value for all dolphins seen
during the five year period was 0.42. The association matrix for dolphins seen during 2008
differed significantly from a random structure, using an iterative permutation test.
Hierarchical cluster analysis and principle co-ordinate analysis were used to identify three
loosely aggregated groups. These groups were examined to see if they were gender based,
or if different home ranges were occupied. However all groups were mixed, and home
range overlapped. As a result of this study, the population of bottlenose dolphins using
Cardigan Bay were found to exhibit fission-fusion behaviour; consisting of loosely
associated individuals.
Key words: Social structure, photo-identification, fission fusion, Cardigan Bay, Tursiops truncatus
3

Introduction
Biology of Tursiops sp.
The bottlenose dolphin is one of the most widespread and studied cetaceans (Lusseau et
al, 2003), Figure 1. They are found throughout the temperate and tropical oceans of the
world, (Leatherwood and Reeves, 1983) living in a range of habitats, from coastal waters to
oceanic areas, (Thompson and Wilson, 1994). Their lifestyles mean they are relatively
easily accessed by researchers, making them one of the most frequently studied marine
mammals (Leatherwood and Reeves, 1990).
Currently, there are two recognised species of genus Tursiops, the ‘common bottlenose
dolphin’ T.truncatus and the ‘Indian Ocean bottlenose dolphin’, T.aduncus, (Wells and
Scott, 2002). Nearshore and offshore forms (differentiated in size, skull morphology, food
habits and parasite burden), have been documented along the Atlantic coast of the United
States, (Mead and Potter, 1995), Bahamas (Rogers et al, 2004), and Australia (Corkeron
and Martin, 2004). A medium sized delphinid, the bottlenose dolphin ranges in size from
220-230 cm in Shark Bay, Australia, to 350-410cm in the north-eastern Atlantic. Their
colouration ranges from slate grey to charcoal, but they have a noticeable lighter ventral
pigmentation, Plate 1, (Wells et al, 1987). After approximately a 12-month gestation period,
calves are born a pale grey, darkening with age. The average life span of known animals is
30-50 years, (Evans, 1994).
Bottlenose dolphins are ‘K’ selected, (Votier, personal communication), characterised by
‘slow’ life histories, including late age of sexual maturity, long interval births and long
maximum life spans (Goodall, 1986; Wells et al, 1987). Coupled with this and their
widespread distribution, bottlenose dolphins exhibit a variety of different behaviours related
to their environment, such as crater feeding in the Bahamas, (Rossbach and Herzing,
4

1997), stranding fish schools on mud banks in Florida (Lewis and Schroeder, 2003) and
cooperation with fishermen in Brazil, (Pryor and Lindbergh, 1990). Their complex social
behaviour is comparable to that of the great apes, the only other mammalian group, in
which relative brain size is as large as it is in some delphinids, including Tursiops, (Marino,
1998).
Figure 1. Global distribution of bottlenose dolphins (Vallarta Adventures, 2010)
Plate 1. Bottlenose dolphins have a noticeably lighter ventral pigmentation (BBC, 2011)
Social Behaviour
Social structure exhibited in some species can influence gene flow, spatial pattern, scale,
as well as the effects of predation and exploitation by humans, (Wilson, 1975).
Social relationships emerge from patterns of social interactions between individuals within a
group, over time (Hinde, 1976). Social structure is formed from a network of relationships
between individuals of a population. Social bonds are social relationships that include a
5

consistent affiliative component. ‘Bonding strategy’ has been favoured by Conner (2000),
as he thinks bonds are social tools by which individuals attempt to increase their
reproductive success, and could vary with ecological conditions, such as sex, age, and
social position.
Bottlenose dolphins exhibit fission fusion behaviour with interactions between individuals
lasting from seconds to years, (e.g. Smolker at al, 1992; Wells et al, 1987).This is also
prevalent in a variety of other taxa, including spotted hyenas (Frank 1986), African
elephants (Moss and Poole, 1983) and primates (Barton, 1996). Bairds beaked whale
exhibit strong male biased ratios in the absence of females (Conner et al 1998), and
individuals from some matrilineal related killer whale (Orcinus orca) pods, prefer to form
new groups when they leave rather than join others, (Bigg, 1982). Primates that exhibit
male alliances (Conner et al, 1992) and matrilineal bands found in lion prides are both
similar to behaviour exhibited by some bottlenose dolphins, (Wells et al, 1987).
A sudden interest in evolutionary theory, comparative psychology and the significance of
social and reproductive behaviour arose during the 1970/80’s. (Before then it was thought a
species social system was a fixed attribute). This sparked behavioural research on
terrestrial mammals, with a specific interest in animals as individuals, e.g. spotted hyenas
(Frank 1986), bats (Bradbury and Vehrencamp 1977), African elephants, (Moss and Poole
1983), and marine mammals on land, e.g. elephant seals (Cox and LaBoeuf 1977).
Development of photo-identification techniques then sparked a rapid development in
cetacean research, (Würsing and Würsing 1977; Wells et al, 1980). Scars, nicks and overall
shape of a dorsal fin determine the recognition of an individual bottlenose dolphin, and
these are seen every time an individual surfaces to breathe. If collected together, the
6

photos can also provide a model of social structure for the population. Bottlenose dolphin
schools often split and join, making school membership highly versatile, (Wilson et al,
1999). Generally, procedure is to define and calculate association indices between pairs of
identified individuals in a school, making up an association matrix. The matrix is then
displayed using methods such as network analysis techniques, cluster analysis, or
sociograms (Whitehead and Dufault, 1999; Whitehead et al, 2000; Lusseau et al, 2006).
This method, developed by Hinde (1976) is also applied to other vertebrates, such as other
cetaceans, primates and ungulates (Whitehead and Dufault, 1999); however the
association value depends upon the taxa. For example in studies of rodents it is
determined by home range overlap with other individuals, (Karlsson, 1988), which is often
used for smaller animals. However, in sperm whale societies, association value is
determined by the time interval between individuals surfacing from a dive (Whitehead et al,
1991). Primates and ungulates social structure is often calculated as a mean rate of
observation (Whitehead and Dufault, 1999). Temporal stability of a relationship is also an
important factor to consider, as it estimates the probability that two individuals interacting
will still be interacting in a future time period.
Social behaviour of Tursiops sp.
Long term studies of bottlenose dolphins began in the early 1970’s, (Irvine and Wells, 1972;
Wilson, 1975; Würsing and Würsing, 1977), enabling a wide representative of bottlenose
dolphin populations. The two longest studies are in Sarasota Bay, Florida (Irvine and Wells,
1972) and Shark Bay, Australia (Conner and Smolker, 1985), covering topics from
population social structure, to life history and vocal communication.
Bottlenose dolphins are an extremely diverse mammal, showing social plasticity in their
wide distribution. They show affiliation by proximity, physical contact and synchronous
7

movements, (Conner, 2000). Vulnerability of newborn marine mammals in a threatened
marine habitat could be one of the reasons they have such complex social structures. This
includes the risk of predation; two common predators of bottlenose dolphins are sharks and
killer whales (Shane et al, 1986). Cooperative feeding can favour the formation of groups,
such as trapping fish between groups or the shore, but the size of prey schools or individual
prey can restrict the size of these groups (Würsing, 1986). Group living also has its costs,
as constant close contact with conspecifics can increase the risk of socially transmitted
parasites, and competition for limited resources. Therefore, the benefits of group formation
must exceed those costs, for animals to seek another’s company (Conner, 2000).
Some male bottlenose dolphins cooperate in pairs or triplets to sequester females, forming
alliances, (Connor et al, 1992). Strong and long term male alliances are prevalent in
Sarasota Bay, Florida (Wells et al, 1980; 1987, Wells, 1991) and Shark Bay, Australia,
(Conner et al, 1992, Conner, 2007). Two different patterns are recognised: solitary males in
Sarasota Bay may range in smaller areas used by particular females, and other pairs range
in larger areas, so do not stay with a particular female (Wells et al, 1987). In Shark Bay,
however, males in pairs and trios form consortships with single females, lasting anything up
to a month, (Conner et al, 1999). Interactions between males and females therefore usually
depend upon a females reproductive status, (Wells et al, 1987) other than this; males do
not usually associate strongly with females. However, mixed sex groups have been found in
Doubtful Sound, New Zealand. Geographically isolated, the population shows long lasting
associations within and between sexes, community structure is temporally stable and all
members are closely related (Lusseau et al, 2003).
Female bottlenose dolphin alliances are weaker and more varied; their associates are
mostly dependent upon their reproductive status (Connor et al, 2000). Females that give
birth tend to join other females with calves, (e.g. Bahamas, Rogers et al, 2004; Sanibel
8

Island, Florida Shane, 1990; Port Stephens Australia, Möller et al, 2006). These bonds may
help in protection of their young from predators, and cooperative defence of resources.
In the northeast Atlantic little social stability or group fidelity is apparent. There is no
evidence of strong adult associations such as male alliances or female cohorts (Moray
Firth, Scotland, Lusseau et al, 2006; Shannon Bay, Ireland, Foley et al, 2010). However,
mother-calf relationships are still prevalent as the strongest bonds. In bottlenose dolphins a
calf exhibits prolonged dependence on their mother. This is thought to be due to foraging
skills that develop slowly, taking several months for a calf practising before it actually
catches a fish, and years before it can forage independently (Mann and Seargent, 2003).
However social behaviour develops rapidly during the first 6 months. Immature dolphins
spend time in large groups possibly practicing social skills through activities such as
continuous chasing, sexual behaviour and displays (Conner et al, 2000). Both males and
females spend up to ten years in post weaning/ pre-reproductive stages, but this period
remains poorly explored. This prolonged stage may enable a selective advantage,
reinforcing this life history strategy through learning social and foraging skills (Pagel and
Harvey, 1993).
Aims of this study
Therefore, it is vital that different bottlenose dolphin populations are considered separately,
when taking into account other studies of their social structure, due to the global variation in
their behaviour. Owing to a lack of studies on social behaviour of bottlenose dolphins in the
north east Atlantic, the aims of this study was to determine the social structure of the semi
resident bottlenose dolphins, T. truncatus in Cardigan Bay, Wales, United Kingdom. Other
UK studies have shown fission fusion societies with lack of adult alliances, (e.g. Moray
Firth, Lusseau et al, 2006 ; Shannon Estuary, Ireland, Ingram and Rogan, 2002) and an
9

unpublished five year dataset proved an opportunity to see if this trend is also evident in
Cardigan Bay. Data was available from ecotourism non standardised surveys, conducted
through May 2005 to October 2009. Two non consecutive years 2006, and 2008 were
compared as independent data sets. The long term data of the full five years from 2005-
2009 was then used to determine if there were any long term affiliations between
permanently marked animals. School membership is used as a measure of interaction as
has been done in previous studies, (e.g. Ingram and Rogan, 2002; Lusseau et al, 2006),
and associations between individuals in those schools were analysed using SOCPROG,
(Whitehead, 2009).
Methods
Study Area – Cardigan Bay
Cardigan Bay is one of the largest bays in Britain, bound on three sides by the Welsh coast,
and open to Irish Sea on its western boundary, Figure 2. Its southern most point is St.
Davids head, and its northern most point is the Lyn Peninsula. It extends over 100km,
(Roberts et al, 1998) and has an area of approximately 5500km2, (Gregory and Rowden,
2001). Water depth does not exceed 50m, becoming increasingly shallow from west to
east, with an average depth of 40m (Evans, 1995). Composition of the seabed is
heterogeneous, with fine sand ranging to gravel, shingle and muddy sand (Evans, 1995).
The tides in Cardigan Bay are semi-diurnal and tidal range is uniform, (ca. 2m at neaps and
4m at springs, Gregory and Rowden, 2001).
In Cardigan Bay, sightings of dolphins have been recorded since the 1920’s, and are seen
regularly in the inshore waters from Aberystwyth to the Teifi estuary, Yns Lochtyn,
Aberporth, Mwnt and close to New Quay, (Grellier et al, 1995). Numbers of individuals
increase over the summer months, from April to October (Evans,1996). Cardigan Bay has
10

one of the two resident populations of bottlenose dolphins in UK waters, the other is in
Moray Firth, Scotland (Lusseau et al, 2006).
Figure 2. Map of Cardigan Bay (Maps Worldwide.com, 2011)
Conservation and Management
Bottlenose dolphins were listed as a species requiring the designation of Special Areas of
Conservation, in the European Union Habitats Directive 1992. In 1996 the southern part of
Cardigan Bay was designated as a candidate Special Area of Conservation (cSAC) by the
UK government to the European commission, for its population of bottlenose dolphins
(Tursiops truncatus, Ceredigion county council, 2001). The full status of SAC was then
given in November 2004. The SAC site is sited off south Ceredigion and north
Pembrokeshire, in the southern part of Cardigan Bay. It extends 12 miles offshore (Figure
4, Ceredigion County Council, 2001). There are also 2 other bottlenose dolphin SAC’s in
the UK, see Figure 3. In addition, in the northern part of Cardigan Bay, the Pen Llyn a’r
11

Sarnau cSAC added bottlenose dolphins to its list of features. The local community is well
encouraged in the conservation status of Cardigan Bay, especially for the bottlenose
dolphin population, as they are affected by human activities from disturbance, noise and
pollution, prey depletion and habitat change. Therefore the importance of Cardigan Bay as
an SAC area is not only important for the conservation of the bottlenose dolphins, but also
the other wildlife of Cardigan Bay, and ultimately tourism and money for the area.
Figure 3. The three UK bottlenose dolphin SAC’s (Ceredigion County Council, 2001)
Figure 4. Cardigan Bay SAC (Ceredigion County Council, 2001)
12

Data Collection
All data was collected in the Cardigan Bay SAC area, during boat based surveys, aboard
the vessel MV ‘Sulaire’; a 10m charter vessel with semi displacement hull and 380hp turbo
diesel engine, (Plate 2). The vessel was equipped with a Global Positioning System, (GPS)
shipmate RS 5700. The observation height was 3m above sea level with an angle view of
360°, but observers mainly concentrate on 180°, to the sides and ahead of the boat.
Surveys were conducted on non standardised ecotourism trips, and used as a platform of
opportunity to perform photo identification of bottlenose dolphin groups. Trips were
conducted at sea state Beaufort 3 or less during good light conditions. If sea state
decreased, or weather conditions affected visibility, the survey trip was aborted because of
unreliable sightings for the paying public, and also reduced chances of taking photographs
suitable for photo-identification (Agler, 1992). Sightings were recorded with a reference
number, time, species, group size and number of adults, juveniles, calves and newborns,
and their behaviour (e.g. feeding, travel).
Plate 2. ‘Sulaire’ the research boat used for conducting photo ID. Seat above the cabin
where forms were filled in, during unsuitable weather these are conducted in the cabin.
13

Photo ID
When sighted, dolphins were slowly approached in order to perform photo identification
(Wursing and Jefferson, 1990). A photo id form was filled in, including the behaviour (slow
or normal travel, feeding, bow riding, resting/milling, socializing and reaction to the boat),
direction of travel, and approximate guess of well identified animals. Time spent
photographing a dolphin was an encounter. Photographs were taken of the back of animals
and their dorsal fins, at a perpendicular angle. Attempts were made to photograph all
animals, irrespective of group size. Individually marked animals were identified from
photographs by comparing marks and nicks on their dorsal fins with a photograph ID
catalogue. Sightings of dolphins were entered onto a database, and unmatched,
unidentified dolphins were given a new unique catalogue number. Group size was
determined by number of individuals moving in the same direction or engaged in the same
activity, within 100m of one another, (Wells et al 1987). Some of the Photo identification
images used in the Cardigan Bay Marine Wildlife Centre Photo-identification Catalogue
were obtain under licence issued by the Countryside Council for Wales. (Licence to disturb
wild animals for scientific and educational purposes).
Data Analysis
Animals were categorised as belonging to one of three categories, adult, juvenile or calf.
‘Calves’ include neonatal calves in their first days or weeks of life with a yellow/green tinge
to their skin, and younger animals with pale skin and visible foetal folds on their flank.
‘Juveniles’ had pale skin and are approximately two thirds of the length of adults, and
‘adults’ were fully grown dolphins with the darker skin colour.
The close proximity of a calf with an adult was used to predict a ‘probable female’, and if a
dolphin was seen more than 2 times with a calf, she was designated as a definite female.
14

Males have previously been shown to have a higher degree of scarring, through
intraspecific interactions (Tolley et al, 1995), so these were determined as ‘probable males’.
If the genital area of a dolphin was seen, a definite distinction could be made for either sex.
In this study dolphins were considered to be associated with all other individuals identified
in the same school, a definition commonly used in studies of dolphin structure and other
cetaceans (Whitehead and Dufault, 1999).
The use of the half weight index is commonly used as an estimator in bottlenose dolphin
studies (Whitehead and Dufault, 1999), because it accounts best for the observer bias
during photo identification surveys, where identifications of an entire group could be difficult
to attain (Cairns and Schwager, 1987):
X
Half Weight Index: X + YAB + ½ (YA+YB)
Where X is the number of sightings, and A and B together in the same school. YA is the
number of time dolphin A was indentified in schools from which dolphin B was absent, and
YB is the number of times dolphin B was identified from in schools from which dolphin A
was absent and YAB is the number of times dolphin A and B were identified in the same
school. The half weight index introduces a bias to correct for missing identifications, by
averaging the number of times each member of a pair were recorded together (Cairns and
Schwager, 1987). This bias is not a quantified adjustment, but is an arbitrary value, and in
the absence of a maximum likelihood estimator, the use of the simple ratio index is
recommended, (Ginsberg and Young, 1992).
HWI quantifies associations on a scale from 1(two individuals always seen together) to 0
(two individuals never seen together). The HWI cut off technique was used to define
15

preferred companionships in order to filter associations that could happen by chance
(Lusseau et al, 2006). All pairs with HWI greater than HWInull, (the average association
index if individual associates at random in the population, Whitehad, 1995) were included in
the social network. The HWInull was calculated:
HWInull = n/(N-1)
n = average group size in which an individual is found N = population size
The calculations of HWI were performed using SOCPROG version 2.4 (for MATLAB 7.7)
(Whitehead, 2009)
The association matrix was then tested to see if it differed significantly from a random
distribution of associations, using a permutation procedure suggested by Bejder et al,
(1998) and applied to the data sat using SOCPROG (Whitehead, 2009), This permutation
test randomises the data set without changing the marginal tools, keeping the number of
times an individual was seen and the number of animals in each school. The distribution of
the standard deviations of the association indices was then compared with the real data.
Long term data of sightings contributing to association analyses is vital. To examine the
permanency of these associations, the time between dyad re-sightings should be
considered. To measure the temporal stability of associations between individuals sighted
in Cardigan Bay, the probability of two animals remaining associated after various time lags
was calculated using SOCPROG (Whitehead, 2009), and rate of decay of those
associations compared with a number of mathematical models describing different rates of
exponential decay.
16

Determining Data
The number of times an individual is sighted affects the results of social structure analysis.
The more frequently an animal is sighted, the more accurately its behaviour will be
described. Therefore, the amount of data will be reduced if animals that are sighted
infrequently are excluded.
In previous studies, bottlenose dolphins have been included in social structure analysis if
they were seen at least seven times (Wilson, 1995). The available data is reduced with
exclusion of dolphins sighted infrequently, and also decreasing the proportion of age and
sex classes.
Long term data for the years 2005-09 was used, as well as looking at years 2006 and 2008
within that period. For the long term data, if individuals were well marked, (Plate 3.), and
seen for 3 or more non-consecutive years, they were included in the analysis. For the 2006
and 2008 data, if animals were seen more than 3 times they were included, (Figure 5. and
Figure 6.).
ID number 005
Plate 3. Examples of dolphins well marked enough to be included in the long term data set,
determined by e.g.: nicks (005), scarring (009), and overall shape of dorsal fin, (117,
Cardigan Bay photo identification catalogue, 2007)
17

ID number 009
ID number 117
Plate 2. Continued
Figure 5. Number of individuals seen to determine restriction on data used for 2006
18

Figure 6. Number of individuals seen to determine restriction on data used for 2008.
Association matrices showing a non random distribution of associations were subjected to
average linkage cluster analysis to identify patterns of association between assemblages of
individuals within the population. The number of assemblages resulting from the cluster
analysis depends on the arbitrary threshold of separation, and to define the assemblages,
the rate of agglomeration of groups within the hierarchical clustering was examined.
Principle coordinate analysis enhances the results of cluster analysis by quantifying,
graphically, the levels of association between individuals, and the amount of data can be
assessed by calculating the proportion of the total eigenvalues of all dimensions expressed
by the plotted axes.
Results
Between May 2005 and October 2009 there were a total of 784 recorded encounters. The
number of animals photo identified from each school ranged from 1-18, with a median of 2,
(Figure 7.) In total there were 286 uniquely identified dolphins, including well marked
19

animals (animals with no nicks – animals with five nicks or more) and lesser marked
animals (usually determined by discolouration, and small scars).Of those individuals, 25
were definite females, 17 were probable females, 5 were definite males, 62 were probable
males, and 174 were of unknown sex.
The median number of re-sightings per dolphin was 4, (mean= 8.6, Figure 8.). The
maximum number of re-sightings for any individual was #467, who was photo identified 110
times. 86 dolphins were seen only once. The association values for both the short term data
2006 and 2008, and the long term, are heavily skewed to the left, (Figure 9.). Therefore
looking at the maximum association values against number of sightings (Figure 10.), and
against number of dolphins (Figure 11.) gives a clearer idea of the number of association
values.
Figure 7. The frequency distribution of number of dolphins identified in each school during
the photo identification surveys in Cardigan Bay from 2005-09. Group sizes are derived
from the number of photo identifications made.
20
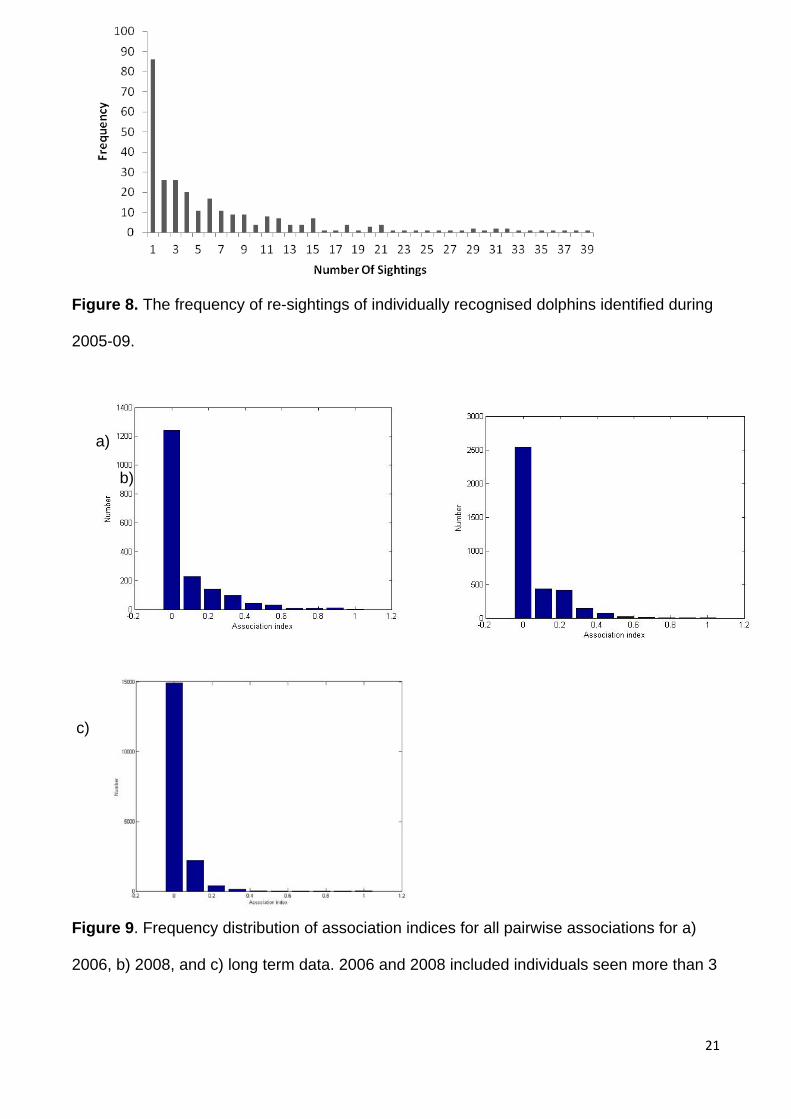
Figure 8. The frequency of re-sightings of individually recognised dolphins identified during
2005-09.
a)
b)
c)
Figure 9. Frequency distribution of association indices for all pairwise associations for a)
2006, b) 2008, and c) long term data. 2006 and 2008 included individuals seen more than 3
21

times and long term data was determined by individuals seen for more than 3 years during
the study period.
Figure 10. The maximum association value for all individuals seen during 2005-09, against
their number of sightings, bars indicate the standard deviation.
Figure 11. Mean maximum association values for all dolphins seen during 2005-09, bars
indicate the standard deviation.
22

Number of associates per dolphin
The mean maximum association value generally increased with increased sightings,
(Figure 13). However, there was a small mean maximum association value for dolphins
seen 41 to 50 times (0.26, SD=0.01). There was also a fairly low value of 0.23 for dolphins
seen 101-110 times, but as there was only one dolphin seen in this category, and only two
seen 41-50 times, this could explain these values. The mean maximum for all dolphins
sighted during the long term data set was 0.42, Figure 10. Number of dolphins with a mean
maximum association value ranged from 0.2 to 0.9, with the majority of dolphins having a
mean maximum value of 0.3 (SD=0.03) and 0.4 (SD=0.03), see Figure 11. Only 2 dolphins
had a mean maximum association value of 0.8, (SD=0) and 0.9 (SD=0).
Results of permutation tests
Permutation test for dolphins seen three or more times during 2006, did not differ
significantly from the distribution of standard deviations of associations (p>0.05), produced
from 1000 randomisations of the data set. This was also true of the long term data.
However, dolphins seen three or more times during 2008 differed significantly from the
distribution of standard deviations of associations (p=0.001) produced from 1000
randomisations of the actual data set, so further analysis including hierarchical cluster
analysis and PCoA was used.
Association Indices
The mean non-zero association index of all possible pairings for 2006 was 0.07 (SD =
0.03), with a maximum association of 1.00 between unknown sex adult # 650 and female
23

adult #518. The mean non-zero association index for all possible pairings for 2008 was 0.08
(SD=0.05) with a maximum association of 1.00 between unknown #537 and probable male
# 551. For long term the mean was 0.04 (SD=0.02), with a maximum association of 0.91
between female #478 and her calf (unknown) #479.
Of a possible 19 dyads with an association index of 0.5 or higher for 2006 data, 13 were
reciprocated with their partner sharing the same association indices. For 2008 there were a
possible 16 dyads and 12 shared their association indices. For the long term there were 18
dyads and 15 of those were between individuals sharing the same association indices..
Probable males and definite males were sampled together as there was insufficient data for
definite males, and females were sampled in the same manner. None of the maximum
associated dyads were between individuals of a definite sex. Relationships are shown
Table 1. Mean association values and number of associations are shown in Table 2, the
highest was for males in 2006, with a mean association value of 0.1, (SD=0.05).
Relationship 2006 2008 Long term
Mother/calf 4 5 6
Probable male/probable male 2 1 1
Female/probable male 2
Female/unknown 3 2 2
Probable female/unknown 1
Probable male/unknown 1 3
Probable male/probable
female
1 1
Unknown/unknown 1 2
24

Table 1. Gender of relationships with an association index of 0.5 or higher, for all three data
sets, 2006, 2008 and long term.
2006 2008 Long term
Males Females Males Females Males Females
Mean
association
value
0.1
(SD=0.05)
0.06
(SD=0.03)
0.06
(SD=0.04)
0.09
(SD=0.06)
0.04
(SD=0.02)
0.03
(SD=0.02)
Mean sum
of
associates
3.64
(SD=1.39)
1.93
(SD=0.5)
1.57
(SD=0.38)
2.19
(SD=0.85
2.99
(SD=1.08)
1.73
(SD=0.39)
Table 2. Mean association values and average number of associates for males and
females, for all three data sets.
Maximum association value for males and probable males during 2006 was for individuals
#484 and #494 of 0.67, (both classified as probable males) and there was also an
association index of 0.57 between #471 and #505, (definite male and probable male). For
2008 the maximum association value above 0.5 was 0.57 between #600 and #484, both
probable males. For the long term data, associations above 0.5 were 0.55 between #511
and #527, and #514 had a 0.53 association with that pair. These three dolphins were
classified as probable males.
Maximum association values between females and probable females during 2006 were
between #475 and #473, with a value of 0.89, but this was between a mother and calf. For
2008, there was another maximum association of 0.71 for #473 and #475 (mother and calf),
and 0.75 for #499 and #607, a definite and probable female. For long term maximum
25

association values above 0.5 for the long term data, was mother and calf #473 and #475
with an association index of 0.73.
Temporal stability of associations
Lagged association rates (Figure 12.) show a rapid decrease in dyads sighted together
again after a few days. 2008 data shows a much steadier decline compared with 2006 and
long term data. Abrupt peaks and troughs suggest increased and decreased survey effort
respectively, and this seasonal effort is clear in the long term data. This decline closely
matched a time lag expected from a social structure with casual acquaintances with rapid
dissociation.
a)
b)
c)
26

Figure 12. Lagged association rates for dolphin pairs associated within groups, for a) 2006,
b) 2008, and c) long term. The plot shows the probability of associations persisting after
increased time lags. The dashed line represents a model for associations (a2 x exp (-a1 x
td)) representing rapid dissociation and casual acquaintances.
Identification of dolphin assemblages for 2008
Hierarchical cluster analysis (average group linkage) was used to determine assemblages
for 2008 data, which was found to differ significantly from the distribution of standard
deviations produced from permutation test. The agglomeration plot of hierarchical clustering
showed a linear increase in the number of clusters with decreasing association values.
There was a slight increase in the rate of agglomeration occurring at an association index of
0.9, showing three loose assemblages, (Figure 13.). The number of possible dyads
observed among dolphins belonging to all clustered groups showed a high degree of mixing
within these groups and very little mixing between groups. However, principle coordinates
analysis accounted for only 11.88% of the variance for 2008 (Figure 14.) The quite distinct
clusters for 2008 were analysed to see if they were sex biased, (Table 3.) The only
conclusive evidence was that group B had no males or probable males present. However
as there were 4 dolphins of unknown gender, these could potentially be male. The
coordinates of dolphins were plotted to see if different home ranges could explain the
defined clusters, however the same home ranges were apparent (Figure 15).
27

Figure 13. Dolphin assemblages produced from hierarchical group average cluster analysis
of associations between dolphins 3 or more times during 2008. The dashed line shows the
association 0.12 index used to define clusters.
28

Figure 14. Metric scaling using principle coordinates analysis shows distance between
individuals proportional to their association index for individuals seen three times or more
during 2008.
Group Females Probable
Females
Unknown Males Probable
Males
A 5 2 10 2 2
B 3 0 4 0 0
C 4 0 2 0 3
Table 3. Sex ID of dolphins found in three clusters from 2008 cluster analysis.
Figure 15. Home range overlap of A (red squares), B (green triangles) and C (blue
diamonds) from 2008 cluster analysis.
Discussion
Population Structure
29

Between May 2005 and October 2009 there were a total of 784 recorded dolphin
encounters. The ratio of definite females, probable females, definite males, probable males
and unknown individuals was 9%, 6%, 2%, 22% and 61% respectively. This sex ratio may
be biased, especially in the case of males, as highly scarred animals and absence of a calf
more than six years were used to determine probable male gender, if genital area had not
been seen. This could result in an underestimation of the population structure in terms of
gender. 61 dolphins were seen during 2006 and 42 in 2008. Only 33% of dolphins seen in
2006 were sighted again in 2008. These independent data sets are two years apart, and
due to the nature of the sampling relying on well marked animals, lesser marked dolphins
could be re-identified in following years. Difference in the permanency of marks such as
individuals that are slightly marked, have marks that heal, or acquire new marks, can
potentially cause a dolphin to be newly identified.
Choice of association index
Individuals were characterised as associated if they were identified from the same school, a
definition used in many studies of dolphin social behaviour (e.g. Rogers et al, 2004;
Lusseau et al 2006). Research on social behaviour of wild cetaceans is usually restricted to
group membership as definition of association, due to difficulty in observing cetacean
behaviour between individuals. To enhance the comparability within studies (e.g. Conner et
al, 2001; Foley et al, 2010) and minimise bias (Cairns and Schwager, 1987), the half weight
index was used to quantify the frequency of association among individuals in schools.
Associations between individuals
30

Bottlenose dolphins inhabiting Cardigan Bay show fission fusion behaviour typical of the
species, with little social or group fidelity, (Lusseau et al, 2006; Foley et al, 2010). The
mean association index between pairs was low for 2006, 2008 and long term (0.07, 0.08
and 0.04, respectively. Mean association value for gender ranged from 0.03 (SD=0.02) for
females seen during the five year study period, to 0.1 (SD=0.05) for males seen during
2006, (Table 2). The mean maximum association for the whole five year data set was 0.42,
Figure 11. This low level of association is characteristic of bottlenose dolphins, with mean
association indices between dyads typically less than 0.4, (Rossbach and Herzing, 1999;
Lusseau et al, 2003; Wiszniewski et al, 2009). The highest association value found between
any pair of dolphins seen during 2006 was 1.00 between unknown adult #650 and female
adult # 518. In 2008 the highest was 1.00 between unknown # 537 and probable male
#537, and for the long term highest association was between mother #478 and her calf
#479. These associations (excluding mother and calf relationships) were analysed to see if
they were prevalent throughout the long term data set, and were not found.
26% of associations above 0.5 for 2006, 2008 and the long term period were between
mother and calf, (Table 2). Mother and calf bonds are extremely important in bottlenose
dolphin populations, and other studies have reported highest associations between mother
and calf (Quintana-Rizzo and Wells 2001; Rogers et al, 2004). Calves are reported to stay
with their mothers for anything up to eight years after birth (Grellier et al, 2003). However,
due to the nature of the study, which depends upon existence of well marked individuals,
calves that change over time, acquiring new marks, and insufficiently marked mothers
would have lowered the re-identification rate.
Assemblages of individuals in 2008
31

The P value for 2008 data set was <0.05, (0.01), and hierarchical cluster analysis found
three loosely assembled groups associated at an index of 0.12 (Figure 13). The possibility
that these groups were sex biased was looked into, however all groups were of mixed
gender except group B had no probable or definite males present, Table 3. The possibility
that these three dolphin groups had different home ranges was then explored, Figure 18,
however, this proved inconclusive as home range overlapped for all three groups. The
individuals that appeared in the same groups in 2008 did not appear the in same groups in
2006, excluding three mother and calf relationships. PCoA analysis showed weak
groupings of dolphins for 2008, with the plotted axis accounting only for 11.88% of the total
variance, (Figure 14.).
Temporal stability of associations
Temporal stability of relationships was weak, with a rapid decrease in dyads seen together
after only a few days, (Figure 12). The lagged association rate was equivalent to that
expected from a model based on a social structure consisting of casual acquaintances.
The function and size of dolphin schools
The median number of dolphins identified in each school of 2 suggests that dolphins are
either mostly in pairs or solitary, (Figure 7.) This was probably due to the nature of the
sampling, with the majority of times only 2 dolphins being identified from each school. The
median number of dolphins re-sighted for the whole five year study period was only 4. This
could also be due to the sampling procedure, as dolphins may be missed when photo
identifying a school, and lesser marked individuals could be re-identified in different years.
However, the range of 1-18 dolphins being photo identified in each school resembles
similar school size to that found in other coastal populations (Wells et al, 1987; Roger et al,
32

2004). In understanding the social structure of an animal population, the selective
pressures affecting their population structure needs to be considered. The activity of the
dolphins could be determining the size and membership of their schools. It has been shown
that school size is related to activity in UK populations of Cardigan Bay, (Bristow and Rees,
2001), and the Shannon Estuary, Ireland, (Ingram and Rogan, 2002). Co-operation within
dolphin schools can benefit individuals through social integration, foraging and
reproduction, (Norris and Dohl, 1980).
Social integration, learning and communication
Social learning among odontocetes may be due to their relatively large brain size, (Connor
et al, 1998), and through their fission fusion societies, information can be exchanged rapidly
throughout the whole society. This is evident in bottlenose dolphins that display different
behaviour in different populations. For example the use of marine sponges as tools for
foraging in Shark Bay,(Mann et al, 2008), crater feeding in the Bahamas, (Rossbach and
Herzing, 1997), stranding fish on mud banks in Florida, (Lewis and Schroeder, 2003), and
cooperation with fishermen in Brazil, (Pryor and Lindbergh, 1990). These foraging
strategies are generally unique to the different populations, meaning that they may depend
upon social learning and tradition or culture.
Foraging
Coastal communities of bottlenose dolphins such as the semi-resident population of
Cardigan Bay feed primarily on shoaling fish, (Wells et al, 1980), and co-operative foraging
could improve individual fitness. Bottlenose dolphins of Cardigan Bay have been found to
show site preference for New Quay during the summer months, and found in larger groups
compared with Ynys Lochtyn. This could be due to feeding on different prey items, for
example benthic fish such as Limanda limanda, characteristic of the gravel and sandy
33

substrate found in Cardigan Bay. Therefore, foraging tactics could require more dolphins to
search for such inconspicuous prey, (Gregory and Rowden, 2001), and could ultimately
influence the social interactions between individuals, and therefore, social structure.
Reproduction
During the summer months, high numbers of dolphins with calves suggest that Cardigan
Bay is favoured as a nursery area, (Bristow and Rees, 2001). This correlates with breeding
season for the population, (Ingram and Rogan, 2002), and switching of prey preference
during the summer months, (Gregory and Rowden, 2001). Mammal mating systems tend to
be diverse as mating strategies at an individual level will structure a species mating system,
(Emlen and Oring, 1977).
Sexual selection and competition for access to a mate drives the evolution of mating
strategies, (Emlen and Oring, 1977). This is evident in the strong male alliances prevalent
in Shark Bay, Australia, cooperating to isolate single receptive females (Conner and
Smolker, 1992).
In Cardigan Bay, no evidence of strong adult associations including female cohorts and
male alliances were found. Maximum associations between females and probable females
were mostly between mother and calf for all three data sets, except for a maximum
association value of 0.67 for a definite and probable female during 2008. For male
relationships, the highest maximum association value of 0.67 was between two probable
males during 2006. All other associations above 0.5 were between probable males, apart
from an association value of 0.57 between a definite and probable male during 2006. The
mean association value for males and females in all three data sets was never higher than
0.1, (Table 2), suggesting males and females did not prefer to associate with the same sex.
34

Defence from predators
Social behaviour of bottlenose dolphins is also considered to be influenced by predation
pressure, (Wells et al, 1980). Sharks are regarded as the most significant predators of
bottlenose dolphins worldwide, (Würsing and Würsing, 1979). Another potential predator is
the killer whale (Orcinus orca), and although a visitor to UK waters from June to September,
(Evans, 1976), there were no recorded attacks from either sharks or killer whales during
this study.
Conclusion
The semi resident population of Cardigan Bay appears to be a loosely aggregated
community. Seasonal changes in the abundance of individuals inhabiting the bay are
related to prey items, nursing of calves and possibly temperature. Not all members of the
community will be present at any one time in the SAC, meaning that the associations of
individuals may depend upon availability of patterns, and availability of resources. In
addition to this, the community of bottlenose dolphins do not inhabit Cardigan Bay at all
times, and this factor needs to be considered in management of the SAC.
Restrictions of the study
As data was collected during ecotourism non-standardised surveys, there were limitations
with the sampling method. The size and distribution of the population sampled varied due to
this method. Sampling period was seasonal, (May to October) due to environmental
conditions, such as rough sea state during the winter months, meaning boat trips were not
carried out. Boat trips also depended upon whether there were sufficient numbers of paying
tourists, meaning some days the two hour surveys conducted would not be regular.
35

Not all individuals were identified due to lack of reliable markings, therefore school size
could be a lot higher than thought, and therefore structure of schools. HWI cut off index
was used to test for preferred companionships because it relies directly on the association
indices, however, it is only a proportion, so will give an indication of the association
strength, based on the number of times two individuals were seen together. Due to this,
data was restricted to animals seen three or more times during 2006 and 2008, and for
three or more non-consecutive years during the full data set.
Acknowledgments
First and foremost, I would like to thank everyone at Cardigan Bay Marine Wildlife Centre
for their help and support during my project, and of course, for the use of their five year
database which they kindly let me use for my study. I thoroughly enjoyed working there
during my summer, so to analyse the social structure of the dolphins I used to see nearly
every day was a real honour. I would also like to thank my project supervisor Simon Ingram
for helping me, not only with the analysis of the data, but also for giving me advice and
constructive criticism that has enabled me to produce my project. I would also like to thank
Fabio G. Duara-Jorge, who, even whilst working on his PhD with the bottlenose dolphins of
Brazil, managed to teach me how to use SOCPROG. Finally, I would like to thank Hal
Whitehead, for giving me an insight into how important social behaviour studies are,
through his talk at University of Plymouth during Peninsula Arts Whale Festival week.
36

References
Agler, B.A., (1992). Testing the reliability of photographic identification of individual fin whales. Report for the international Whaling Commission, 42: 731-737
Barton, R.A., (1996). Neocortex size and behavioural ecology in primates. Proceedings of the Royal Society of London, 263: 173-177
BBC, (2011) Wales, Nature & Outdoors, Available at: http://www.bbc.co.uk/wales/nature/sites/places/mid/newquay.shtml (Last accessed: 25th February 2011)
Bejder, L, Fletcher, D., and Bräger, S., (1998). A method for testing association patterns of social animals. Animal Behaviour, 56: 719-725
Bigg, M.A., (1982). An assessment of killer whale (Orcinus orca) stocks off Vancouver Island, British Columbia. Reports of the International Whaling Commission, 32: 655-66
Bradbury, J.W., and Vehrencamp, S.L., (1977) Social organisation and foraging in emballonurid bats. II. Mating Systems. Behavioural Ecological Sociobiology 2: 1-17
Bristow, T., and Rees, E.I.S., (2001). Site fidelity and behaviour of bottlenose dolphins (Tursiops truncatus) in Cardigan Bay, Wales. Aquatic Mammals, 27: 1-10
Cairns, S.J., and Schwager, S.J., (1987). A comparison of associated indices. Animal Behaviour, 35: 1454-1469
Ceredigion County Council; the Countryside Council for Wales; Environmental Agency Wales; North Western and North Wales Sea Fisheries Committee; Pembrokeshire Coast National Park Authority; Pembrokeshire County Council; D’r Cymru Welsh Water (2001). Cardigan Bay Special Area of Conservation and Management Plan, 190p
Conner, R.C., and Smolker, R.A., (1985). Habituated dolphins (Tursiops sp) in Western Australia. Journal of Mammalogy. 66: 398-400
Conner, R.C., Smolker, R.A., Richards, A.F., (1992) Two levels of alliance formation among male bottlenose dolphins (Tursiops sp) Proceedings of the National Academy of Sciences of the United States of America, 89: 987-990
37

Conner, R.C., Mann, J., Tyack, P.L., Whitehead, H., (1998). Social evolution in toothed whales. Trends in Ecology and Evolution, 13: 228-232.
Conner, R.C., Heithaus, M.R., Barre, L.M., (1999). Superalliance of bottlenose dolphins. Nature, 397: 571-572
Conner, R.C., Wells, R.S., Mann, J., Read, A.J., (2000). The bottlenose dolphin: social relationships in a fission fusion society. In: Mann, J., Conner, R., Tyack, P., and Whitehead, H., (Eds) Cetacean societies: field studies of whales and dolphins (pp. 91-126.) Chicago: University of Chicago Press.
Conner, R.C., (2000). Group living in whales and dolphins. In: Mann, J., Conner, R.C., Tyack, P.L., Whitehead, H., (Eds). Cetacean societies. Field study of dolphins and whales. (pp199-211) University of Chicago Press. Chicago and London.
Connor, R.C., Heithaus, M.R., Barre, L.M., (2001). Complex social structure, alliance stability and mating access in a bottlenose dolphin ‘super alliance’. Proceedings of the Royal Society, 268: 263-267.
Conner, R.C., (2007), Dolphin social intelligence: complex alliance relationships in bottlenose dolphins and a consideration of selective environments for extreme brain size evolution in mammals Proceedings of the Royal Society of London, 362: 587-602
Corkeron, P.J., and Martin, A.R., (2004). Ranging and diving behaviour of two ‘offshore’ bottlenose dolphins, Tursiops sp., off eastern Australia. Journal of Marine Biology Association, UK, 84: 465-468.
Cox, C.R., and LeBoeuf, B.J., (1977) Female incitation of male competition: A mechanism of mate selection. American Naturalist, 111: 317-35
Emlen, S.T., and Oring, L.W., (1977). Ecology, sexual selection and the evolution of mating systems. Science, 197: 215-223. Evans, P. G. H. (1976). An analysis of sightings of cetacea in British waters. Mammal Review, 6: 5-14.
Evans, P.G.H., (1994) Dolphins. Whittet Books, London.
Evans, C.D.R., (1995). Offshore environment. In: Barne, J.H., Robson, C.F., Kaznowska, S.S., Doody, J.P., (Eds). Coasts and Seas of the United Kingdom. (239 pp.) Region 12 Wales: Margam to Little Orme. Joint Nature Conservation Committee, Peterborough.
Evans, P.G.H., (1996). CCW Regional Coastal Directory. Evans, P.G.H. (1995). Whales dolphins and porpoises. In: Barne, J.H., Robson, C.F., Kaznowska, S.S., Doody, J.P., (Eds) Coasts and Seas of the United Kingdom. Region 12 Wales: Margam to Little Orme. (pp 137-140). Joint Nature Conservation Committee, Peterborough.
38

Foley, A., McGrath, D., Berrow, S., Gerritsen, H., (2010). Social structure within the bottlenose dolphin (Tursiops truncatus ) population in the Shannon Estuary, Ireland. Aquatic Mammals,36: 372-381.
Frank, L.G., (1986) social organisation of the spotted hyaena (Crocuta crocuta) II. Dominance and reproduction. Animal Behaviour, 34: 1510-27
Ginsberg, J.R., and Young, T.P., (1992). Measuring associations between individuals or groups in behavioural studies. Animal Behaviour, 44: 377-379
Goodall, J., (1986). The chimpanzees of Gombe: Patterns of behaviour, Harvard University Press, Cambridge.
Gregory, P.R., and Rowden, A.A., (2001). Behaviour patterns of bottlenose dolphins (Tursiops truncates) relative to tidal state, time of day, and boat traffic in Cardigan Bay, West Wales. Aquatic Mammals, 27.2: 105-113
Grellier, K., Arnold, H., Thompson, P., Wilson, B., Curran, S., (1995). Management recommendations for the Cardigan Bay bottlenose dolphin population. CCW Contract Science Report 134.
Grellier, K., Hammond, P.S., Wilson, B., Sanders-Reed, C.A., Thompson, P.M., (2003). Use of photo-identification data to quantify mother-calf association patterns in bottlenose dolphins. Canadian Journal of Zoology, 81: 1421-1427
Hinde, R.A., (1976) Interactions, relationships and social structure. Man, 11: 1-17
Ingram, S.N., and Rogan, E., (2002). Identifying critical areas and habitat preferences of bottlenose dolphins Tursiops truncates. Marine Ecology Press Series, 244: 247-255
Irvine A.B., Wells, R.S., (1972). Results of attempts to tag Atlantic bottlenose dolphins, Tursiops truncates. Cetology, 13: 1-5
Karlsson, A.F., (1988) Social organisation of a low density spring population of the bank vole, Clethrionomys glareolus Oikos, 52:19-26
Leatherwood, S., and Reeves, R.R., (1983). The Sierra Club handbook of Whales and dolphins. San Francisco: Sierra Club Books.
Leatherwood, S., and Reeves, R.R., (1990). The Bottlenose dolphin. San Diego, Academic Press.
Lewis, J., and Schroeder, W., (2003) Mud plume feeding, a unique foraging behaviour of the Bottlenose dolphin in the Florida Keys. Gulf Mexico Science, 21: 92-97
Lusseau, D., Scheider, K., Boisseau, O.J., Haase, P., Slooten, E., Dawson, S.M., (2003). The bottlenose dolphin community of Doubtful Sound features a large proportion of long lasting associations. Can geographic isolation explain this unique trait? Behaviour Ecology & Sociobiology, 54: 396 – 405.
39

Lusseau, D., Wilson, B., Hammond, P.S., Grellier, K., Durban, J.W., Parsons, K.W., Barton, T.R., Thompson P.M., (2006). Quantifying the influence of sociality on a population structure in bottlenose dolphins. Journal of Animal Ecology, 75: 14-24 Mann, J., and Sargeant, B.L., (2003) Like mother, like calf. In: Fragaszy D, Perry S, (Eds) The Biology of traditions. (pp. 236–266) Cambridge, MA: Cambridge University Press. Mann, J., Sargeant, B.L., Watson-Capps, J.J., Gibson, Q.A., Heithaus, M.R., Connor, R.C., Patterson, E., (2008). Why do dolphins carry sponges? PLoS one, 3: 1-7 Maps Worldwide.com (2011). Chart C51: Cardigan Bay. Available at: http://www.mapsworldwide.com/sku_9546.htm (Last accessed: 20th February, 2011) Marino, L., (1998). A comparison of encephalization between odontocete cetaceans and anthropoid primates. Brain, Behaviour and Evolution, 51: 230-238 Mead, J.G., and Potter, C.W., (1995). Recognising two populations of the bottlenose dolphin (Tursiops truncates) off the Atlantic coast of North America morphological and ecological considerations. IBI reports, No.5
Möller, L.M., Behergaray, L.B., Allen, S.J., Harcourt, R.G., (2006). Association patterns and kinship in female Indo-Pacific bottlenose dolphins (Tursiops aduncus) of southeastern Australia. Behavioural Ecology and Sociobiology 61: 109-117
Moss, C.J., and Poole, J.H., (1983) Relationships and social structure of African elephants. In: Hinde, R.A., Sunderland, M.A., (Eds) Primate social relationships: An integrated approach, Sinauer Associates
Norris, K.S. & Dohl,T.P. (1980). The structure and function of cetacean schools. In: Herman, L.M (Ed) Cetacean Behaviour: mechanisms and functions. John Wiley & Sons, New York, Chichester, Brisbane and Toronto
Pagel, M., and Harvey, P.H., (1993). Evolution of the juvenile period in mammals. In: Periera, M., Fairbanks, L, (Eds) pp 28-37. Juvenile primates: life history, development, and behaviour. Oxford: Oxford University Press.
Pryor, K., Lindbergh, J., (1990). A dolphin-human fishing cooperative in Brazil. Marine Mammal Science, 6: 77-82.
Quintana-Rizzo, E., Wells, R.S., (2001). Resighting and association patterns of bottlenose dolphins (Tursiops truncatus) in the Cedar Keys, Florida: Insights into organization. Canadian Journal of Zoology, 79: 447-456.
Roberts, M.A., Barber, P.C., Meakins, N., (1998). North Cardigan bay shoreline management plan, Stage 1, Consultation Document 1.
40

Rogers, C.A., Brunnick, B.J., Herzing, D.L., Baldwin, J.D., (2004). The social structure of bottlenose dolphins, Tursiops truncates, In the Bahamas. Marine Mammal Science, 20: 688-708
Rossbach, K.A., and Herzing, D.L., (1997) Underwater observations of benthic feeding bottlenose dolphins (Tursiops truncates) near Grand Bahama Island, Bahamas. Marine Mammal Science, 13: 498-504
Rossbach, K.A., and Herzing, D.L., (1999). Inshore and offshore bottlenose dolphin (Tursiops truncatus) communities distinguished by association patterns near Grand Bahama Island, Bahamas. Canadian Journal of Zoology, 77: 581-592
Shane, S.H., Wells R.S., Wursing, B., (1986). Ecology, behaviour and social organisation of the bottlenose dolphin: a review. Marine Mammal Science, 2: 34-63
Shane, S., (1990). Behaviour and ecology of the bottlenose dolphin at Sanibel Island, Florida. In: Leatherwood, S., Reeves, R.R., (Eds) The bottlenose dolphin, Academic Press. New York, p245-265
Smolker, R.A., Richards, A.F., Conner, R.C., Pepper, J.W., (1992). Sex differences in patterns of association among Indian Ocean bottlenose dolphins. Behaviour, 123: 38-69.
Thompson, P., and Wilson, B., (1994). Bottlenose dolphins. Voyageur Press, Stillwater.
Tolley, K.A., Read, A.J., Wells, R.S., Urian, K.W., Scott, M.D., Irvine, A.B., Hohn, A.A., (1995). Sexual dimorphism in wild bottlenose dolphins (Tursiops truncates) from Sarasota, Florida, Journal of Mammalogy, 76: 1190-1198
Vallarta Adventures, (2010). Available at: http://www.vallarta-adventures.com/tours/signature-dolphin-swim/dolphin-fact (Last accessed 25th February 2011)
Votier, S., (2010) Personal communication. University of Plymouth, UK
Wells, R.S., Irvine, A.B., and Scott, M.D., (1980) The social ecology of inshore odontocetes. In: Herman, L.M., (Ed) Cetacean Behaviour: Mechanisms and functions, New York: John Wiley and Sons.
Wells, R.S., Scott, M.D., Irvine, A.B., (1987). The social structure of free ranging bottlenose dolphins. Current mammology, 1: 247 – 305.
Wells, R.S., (1991) The role of long term study in understanding the social structure of a bottlenose dolphin community. In: Pryor, K., Norris, K.S., (Eds) Dolphin Societies: Discoveries and Puzzles, (pp199-225) Berkeley: University of California Press
Wells, R.S., and Scott, M.D., (2002). Bottlenose dolphins, Tursiops truncates and T. Aduncus. In Perrin, W.F., Wursing, B., Thewissen, J.G.M., (eds) Encyclopedia of Marine Mammals pp.122 – 128. Academic Press, San Diego.
41

Whitehead, H., Waters, S., Lyrholm, T., (1991). Social organisation in female sperm whales and their offspring: Constant companions and casual acquaintances. Behavioural Ecological and Sociobiology. 29: 385-389
Whitehead, H., and Dufault, S., (1999), Techniques for analysing vertebrate social structure using identified individuals : Review and recommendations. Advances in the study of Behaviour, 28: 33-74
Whitehead, H., Cristal, J., Tyack, P.L., (2000). Studying cetacean social structure in space and time: In: Mann, J., Conner, R.C., Tyack, P.L., and Whitehead, H., (Eds) Field studies of dolphins and whales. Cetacean Societies (pp 65-87). The University of Chicago Press. Chicago and London.
Whitehead, H., (2009). SOCPROG programs: analysing animal social structures. Behavioural Ecology and Sociobiology, 63: 756-778
Wilson, A.C., Bush, G.L., Case, S.M., King, M.C., (1975). Social structuring of mammalian populations and rate of chromosomal evolution. Proceedings of Naturalist Academic Science USA. 72: 5061-5065
Wilson, D.R.B., (1995). The ecology of bottlenose dolphins in the Moray Firth, Scotland: a population at the northern extreme of the species range. PhD thesis, Aberdeen University, Aberdeen, Scotland.
Wilson, B., Hammond, P.S., Thompson, P.M., (1999). Estimating size and assessing trends in a coastal bottlenose dolphin population. Ecological Applications, 9: 288-300
Wiszniewski, J., Allen, S.J., Moller, L.M., (2009). Social cohesion in a hierarchically structured embayment population of Indo-Pacific bottlenose dolphins. Animal Behaviour, xxx: 1-9
Würsing, B., and Würsing, M., (1977) The photographic determination of group size, composition and stability of coastal porpoises (Tursiops truncatus) Science 198: 755-56
Würsing, B., and Würsing, M., (1979). Behaviour and ecology of the bottlenose dolphin, Tursiops truncatus, in the South Atlantic. Fishery Bulletin. 77: 399-412 Würsing, B., (1986). Delphinid foraging strategies. In Schusterman, R.J., Thomas, J.A., Woods, F.G. (Eds). Dolphin cognition and behaviour: A Comparative Approach, (pp 347-359). Hillsdale, NJ: LawrenceErlbaum.
Wursing, B., and Jefferson, T.A., (1990). Methods of photo identification for small cetaceans In: Hammond, P.S., Mizroch, S.A., Donovan, G.P., (eds). Individual Recognition of Cetaceans: Use of photo identification and other Techniques to Estimate Population Parameters. Report of the International Whaling Commission. Special Issue, 12: 43-52
42

Appendix
Forms filled in during non standardised eco-tourism boat surveys
43

Figure 16.1 Effort/environmental form, (filled in during all surveys)
44

Figure 16.2 Sightings form (filled in whenever anything was sighted on a survey)
45

Fig 5. Sightings Form
Figure 16.3 Encounter photo ID form, (filled in when photo identification takes place)
46

Figure 17. Access database of all dolphins and their individual catalogue ID’s, including their encounters, sex ID and marks. (Courtesy of Cardigan Bay, Marine Wildlife Centre, Wales, United Kingdom)
47