silvercorp metals inc. · the unaudited interim consolidated financial statements of silvercorp...
TRANSCRIPT

SILVERCORP METALS INC. CONSOLIDATED FINANCIAL STATEMENTS September 30, 2009 Unaudited Interim Consolidated Financial Statements (Expressed in thousands of U.S. dollars, unless otherwise stated)

Notice to Readers of the Unaudited Interim Consolidated Financial Statements For the three and six months ended September 30, 2009
The unaudited interim consolidated financial statements of Silvercorp Metals Inc. (the “Company”) for the three and six months ended September 30, 2009 (“Financial Statements”) have been prepared by management. The Financial Statements should be read in conjunction with the Company’s audited consolidated financial statements for the year ended March 31, 2009 which are available at the SEDAR website at www.sedar.com. The Financial Statements are stated in terms of thousands of U.S. dollars, unless otherwise indicated, and are prepared in accordance with Canadian generally accepted accounting principles.

SILVERCORP METALS INC. Unaudited Consolidated Balance Sheets (Expressed in thousands of U.S. dollars)
See accompanying notes to unaudited interim consolidated financial statements
Notes September 30, 2009 March 31, 2009ASSETS
Current Assets Cash and cash equivalents 49,816$ 41,470$ Short term investments 4(b)(iii) 29,203 23,962 Restricted cash - 732 Accounts receivable, prepaids and deposits 2,434 2,933 Inventories 3 3,952 1,529 Current portion of future income tax assets - 143 Amounts due from related parties 10 362 249
85,767 71,018
Long term prepaids 2,091 1,058 Long term investments 4 14,334 12,186 Restricted cash - 293 Property, plant and equipment 5 28,256 29,072 Mineral rights and properties 6 107,144 89,413 Future income tax assets 2,109 2,162
239,701$ 205,202$
LIABILITIES
Current Liabilities Accounts payable and accrued liabilities 8,740$ 8,533$ Deposits received 3,054 1,290 Bank loan and notes payable 7 2,929 658 Dividends payable 3,020 2,564 Income tax payable 910 3,041 Amounts due to related parties 10 4,014 7,353
22,667 23,439
Future income tax liabilities 19,720 19,678 Asset retirement obligations 2,092 2,029
44,479 45,146
Non-controlling interests 8 13,998 7,610
SHAREHOLDERS' EQUITY
Share capital 9 135,718 135,604 Contributed surplus 4,606 3,764 Reserves 31,893 31,893 Accumulated other comprehensive income (loss) 7,065 (10,167)Retained earnings (Deficits) 1,942 (8,648)
181,224 152,446
239,701$ 205,202$ Commitments 14 -
Approved on behalf of the Board:
(Signed) Robert GaytonDirector
(Signed) Rui FengDirector

SILVERCORP METALS INC. Unaudited Consolidated Statements of Operations (Expressed in thousands of U.S. dollars, except for share and per share figures)
See accompanying notes to unaudited interim consolidated financial statements
Notes 2009 2008 2009 2008
Sales 25,085$ 20,103$ 47,657$ 50,962$
Cost of sales 5,173 7,668 10,145 15,607 Amortization and depletion 824 2,201 1,753 3,769
5,997 9,869 11,898 19,376
Gross profit 19,088 10,234 35,759 31,586
ExpensesAccretion of asset retirement obligations 31 42 62 61 AmortizationForeign exchGeneral eImpairmentInvestor relaGeneral and aProfessiona
Other incomEquity loss Loss on diLoss on heInterest incoOther incom
Income befo
Income tax exCurrentFuture
Income befo
Non-controll
Net income
Basic earninDiluted earniWeighted AverWeighted Aver
Three months ended September 30, Six months ended September 30,
168 147 370 441 ange loss (gain) 82 (3,150) (1,434) (3,031)
xploration and property investigation expenses 959 1,150 3,266 1,630 charges and bad debt (recovery) (79) - 698 - tions 110 259 181 354
dministrative 1,807 2,299 4,532 5,247 l fees 663 884 1,238 1,174
3,741 1,631 8,913 5,876 15,347 8,603 26,846 25,710
e and expensesin investment 4(a) (136) (1,240) (218) (1,444)
sposal of property, plant and equipment (871) - (1,127) (10) ld for trading securities 4(b)(iii) (11) - (11) -
me 160 243 398 1,020 e 53 87 213 116
(805) (910) (745) (318)
re income taxes and non-controlling interests 14,542 7,693 26,101 25,392
pense (recovery)1,940 1,365 3,518 3,404
412 (235) 226 (388) 2,352 1,130 3,744 3,016
re non-controlling interests 12,190 6,563 22,357 22,376
ing interests 8 (3,297) (1,706) (5,977) (5,918)
8,893$ 4,857$ 16,380$ 16,458$
gs per share 0.06$ 0.03$ 0.10$ 0.11$ ngs per share 0.05$ 0.03$ 0.10$ 0.11$
age Number of Shares Outstanding - Basic 161,590,262 152,954,124 161,588,640 151,796,726age Number of Shares Outstanding - Diluted 163,359,824 154,451,515 162,923,835 153,305,544

ents of Comprehensive Income (Expressed in thousands of U.S. dollars)
See accompanying notes to unaudited interim consolidated financial statements
2009 2008 2009 2008
Net income 8,893$ 4,857$ 16,380$ 16,458$ Other comprehensive income (loss), net of taxes:
Unrealized gain (loss) on available for sale securities 34 5 34 (64) Reclassification adjustment for losses included in income (net of tax) - - 195 -Unrealized exchange gain (loss) on translation of self-sustaining foreign operations (3,457) (1,277) (10,607) 549 Unrealized exchange gain (loss) on translation of functional currency to reporting currency 12,692 (7,949) 27,610 (6,291)
Other comprehensive income (loss) 9,269 (9,221) 17,232 (5,806) Comprehensive income (loss) 18,162$ (4,364)$ 33,612$ 10,652$
Three months ended September 30, Six months ended September 30,
SILVERCORP METALS INC. Unaudited Consolidated Statem

SILVERCORP METALS INC. Unaudited Consolidated Statements of Cash Flows (Expressed in thousands of U.S. dollars)
See accompanying notes to unaudited interim consolidated financial statements
2009 2008 2009 2008Cash provided by (used for)Operating activities
Net income for the period 8,893$ 4,857$ 16,380$ 16,458$ Add (deduct) items not affecting cash :
Accretion of asset retirement obligations 31 42 62 61 Amortization 992 2,348 2,123 4,210 Equity Investment loss 136 1,240 218 1,444 Future income tax expenses (recovery) 412 (235) 226 (388) Impairment charges and bad debt (79) - 698 - Loss on held for trading securities 11 - 11 - Loss on disposal of property, plant, and equipment 871 - 1,127 9 InventorNon-coStock-baUnreali
Net changeAccounInventorRestrictedAccounIncomeDeposi
Cash prov
Investing actAcquisitionAcquisitionPurchase ofDecrease (iDecrease (iProceeds frCash used
Financing acRepaymentBank loanRepayment oDistributionCash divideShare subsRepurchaCash used
Effect of excha
Increased (d
Cash and ca
Cash and caSupplementa
Interest paidIncome tax
Non-cash inCommon sh
Three months ended September 30, Six months ended September 30,
y write-down - 368 - 368 ntrolling interests 3,297 1,706 5,977 5,918
sed compensation 509 701 899 1,268 zed foreign exchange loss (gain) 498 - (1,018) -
15,571 11,027 26,703 29,348 in non-cash working capitalts receivable and prepaids (22) 5,669 111 13 y (1,359) (394) (2,308) (2,419)
cash - - 732 - ts payable and accrued liabilities 1,039 (3,603) 1,425 1,521 tax payable 210 (355) (2,126) (714) ts received 477 (627) 1,763 (869) ided by operating activities 15,916 11,717 26,300 26,880
ivities, exploration and development expenditures (5,568) (14,128) (7,740) (35,406) of property, plant, and equipment (419) (4,937) (808) (8,610) long term investments (1,323) - (1,323) - ncrease) of short term investments (4,772) 19,791 (720) 24,854 ncrease) in long term prepaids (1,579) (2,381) (1,999) 576 om disposal of property, plant, and equipment 119 - 120 - in investing activities (13,542) (1,655) (12,470) (18,586)
tivities from (advance to) related parties (84) 1,161 (104) 1,269
- - 2,927 - f bankers acceptance - - (658) -
to non-controlling interest shareholder (3,293) (11,180) (3,293) (11,180) nds distributed (2,762) - (5,532) -
criptions for cash, net of commission and expenses 57 - 57 21 se of shares to treasury for cancellation - (4,397) - (9,052)
in financing activities (6,082) (14,416) (6,603) (18,942)
nge rate changes on cash and cash equivalents (220) (1,744) 1,119 49
ecrease) in cash and cash equivalents (3,928) (6,098) 8,346 (10,599)
sh equivalents, beginning of period 53,744 42,592 41,470 47,093
sh equivalents, end of period 49,816$ 36,494$ 49,816$ 36,494$ l information:
137$ 30$ 139$ 30$ paid 1,681$ 2,109$ 5,659$ 4,149$
vesting activities:ares issued for mineral rights and properties -$ -$ -$ 36,485$

ents of Shareholders’ Equity (Expressed in thousands of U.S. dollars, except for numbers of shares figures)
See accompanying notes to unaudited interim consolidated financial statements
Share capital
Number ofshares Amount
Contributedsurplus Reserves
Accumulatedother
comprehensiveincome (loss)
Retainedearnings(deficit)
Totalshareholders'
equityBalance, March 31, 2008 149,416,476 78,334$ 1,722$ 2,078$ 14,122$ 52,736$ 148,992$ Options exercised 4,482 35 (13) - - - 22 Shares issued for property 4,532,543 36,485 - - - - 36,485 Financing 10,000,000 24,205 - - - - 24,205 Net of share issuance costs - (1,570) - - - - (1,570) Cancellation of shares under normal course issuer bid (2,366,500) (1,885) (47) - - (7,542) (9,474) Stock-based compensation - - 2,102 - - - 2,102 Unrealized loss on available for sale securities - - - - (155) - (155) Appropriation to reserves - - - 29,815 - (29,815) - Cash dividends declared and distributed - - - - - (8,030) (8,030) Loss of the period - - - - - (15,997) (15,997) Unrealized gain on translation of self-sustaining operation - - - - 11,270 - 11,270 Unrealized loss on translation functional currency to reporting currency - - - - (35,404) - (35,404) Balance, March 31, 2009 161,587,001 135,604 3,764 31,893 (10,167) (8,648) 152,446 Options exercised 300,000 114 (57) - - - 57 Stock-based compensation - - 899 - - - 899 Unrealized gain on available for sale securities - - - - 34 - 34 Reclassification adjustment for losses included in income (net of tax) - - - - 195 - 195 Cash dividends declared and distributed - - - - - (5,790) (5,790) Income of the period - - - - - 16,380 16,380 Unrealized loss on translation of self-sustaining operation - - - - (10,607) - (10,607) Unrealized gain on translation functional currency to reporting currency - - - - 27,610 - 27,610 Balance, September 30, 2009 161,887,001 135,718$ 4,606$ 31,893$ 7,065$ 1,942$ 181,224$
SILVERCORP METALS INC. Unaudited Consolidated Statem

SILVERCORP METALS INC. Notes to Unaudited Interim Consolidated Financial Statements September 30, 2009 (Expressed in thousands of U.S. dollars)
Page 1
1. NATURE OF OPERATIONS
Silvercorp Metals Inc., along with its subsidiary companies (collectively the “Company”), is engaged in the acquisition, exploration, development and mining of precious and base metal mineral properties in the People’s Republic of China (“China”).
2. SUMMARY OF SIGNIFICANT ACCOUNTING POLICIES
(a) Basis of Presentation and Principles of Consolidation
The accompanying unaudited consolidated financial statements have been prepared in accordance with Canadian generally accepted accounting principles for interim financial information and follow the same accounting polices and methods set out in Note 2 to the audited consolidated financial statements for the year ended March 31, 2009, except as described in Note 2(b). Accordingly, they do not include all the information and footnotes required by accounting principles generally accepted in Canada for complete financial statements. The unaudited interim consolidated financial statements should be read in conjunction with the audited consolidated financial statements for the year ended March 31, 2009. In the opinion of management, all adjustments considered necessary for a fair presentation of the financial position, results of operations and cash flows have been included. Operating results for the six-month period ended September 30, 2009 are not necessarily indicative of the results that may be expected for the year ending March 31, 2010. These unaudited consolidated financial statements include the accounts of Silvercorp Metals Inc. and its wholly owned subsidiaries: Silvercorp Metals China Inc., Fortune Mining Limited, Fortune Copper Limited, Fortress Mining Inc., Fortune Gold Mining Limited, Victor Resources Ltd., Victor Mining Ltd., Yangtze Mining Ltd., Yangtze Mining (H.K.) Ltd., 82% owned subsidiary, Qinghai Found Mining Company Ltd. (“Qinghai Found”), 70% owned subsidiary, Henan Huawei Mining Co. Ltd. (“Henan Huawei”), 77.5% owned subsidiary, Henan Found Mining Co. Ltd. (“Henan Found”), 95% owned subsidiary, Anhui Yangtze Mining Co. Ltd. and 95% owned subsidiary, Guangdong Found Mining Co. Ltd. (“Guangdong Found”). All significant inter-company transactions and accounts have been eliminated upon consolidation. In the notes to these unaudited consolidated financial statements, “joint venture” is used in the context of “the Law of the People’s Republic of China on Sino-Foreign Equity Joint Ventures”, which governs business conducted by foreigners in China. None of the Company’s investments are subject to joint control as defined by CICA Section 3055, “Interests in Joint Ventures”.
SILVERCORP METALS INC. Notes to Unaudited Interim Consolidated Financial Statements September 30, 2009 (Expressed in thousands of U.S. dollars)
Page 2
(b) Adoption of New Accounting Standards (i) Goodwill and Intangible Assets In February 2008, the Canadian Institute of Chartered Accountants (“CICA”) issued Section 3064, “Goodwill and Intangible Assets”, which replaces Section 3062, “Goodwill and Other Intangible Assets” and Section 3450, “Research and Development Costs”. This new standard provides guidance on the recognition, measurement, presentation and disclosure of goodwill and intangible assets. Concurrent with the adoption of this standard, CICA Emerging Issues Committee Abstract 27 “Revenues and Expenditures in the Pre-operating Period” (“EIC-27”) was withdrawn. The standard is effective for the Company’s fiscal year beginning April 1, 2009. Adoption of this standard did not have a significant effect on the unaudited consolidated financial statements. (ii) Financial Instruments – Recognition and Measurement On June 17, 2009, the Accounting Standards Board of Canada (“AcSB”) released Embedded Derivatives on Reclassification of Financial Assets, amending Section 3855, Financial Instruments – Recognition and Measurement. The amendment indicates that contracts with embedded derivatives cannot be reclassified out of the held for trading category if the embedded derivative cannot be fair valued. The standard is effective for reclassifications made on or after July 1, 2009. The adoption of this standard did not have a significant effect on the unaudited consolidated financial statements.
(c) New Canadian Accounting Pronouncements (i) Convergence with IFRS In February 2008, the Canadian Accounting Standards Board confirmed that publicly accountable enterprises will be required to adopt International Financial Reporting Standards (“IFRS”) for fiscal years beginning on or after January 1, 2011, with earlier adoption permitted. Accordingly, the Company plans to adopt IFRS for fiscal years beginning April 1, 2011. The conversion to IFRS will impact the Company’s accounting policies, information technology and data systems, internal control over financial reporting, and disclosure controls and procedures. A diagnostic assessment of the Company’s current accounting policies, systems and processes to identify the differences between current Canadian GAAP and IFRS is in progress and the impact on our consolidated financial position and results of operations has not yet been determined. The Company intends to update the critical accounting policies and procedures to incorporate the changes required by the conversion to IFRS and the impact of these changes on its financial disclosures.
SILVERCORP METALS INC. Notes to Unaudited Interim Consolidated Financial Statements September 30, 2009 (Expressed in thousands of U.S. dollars)
Page 3
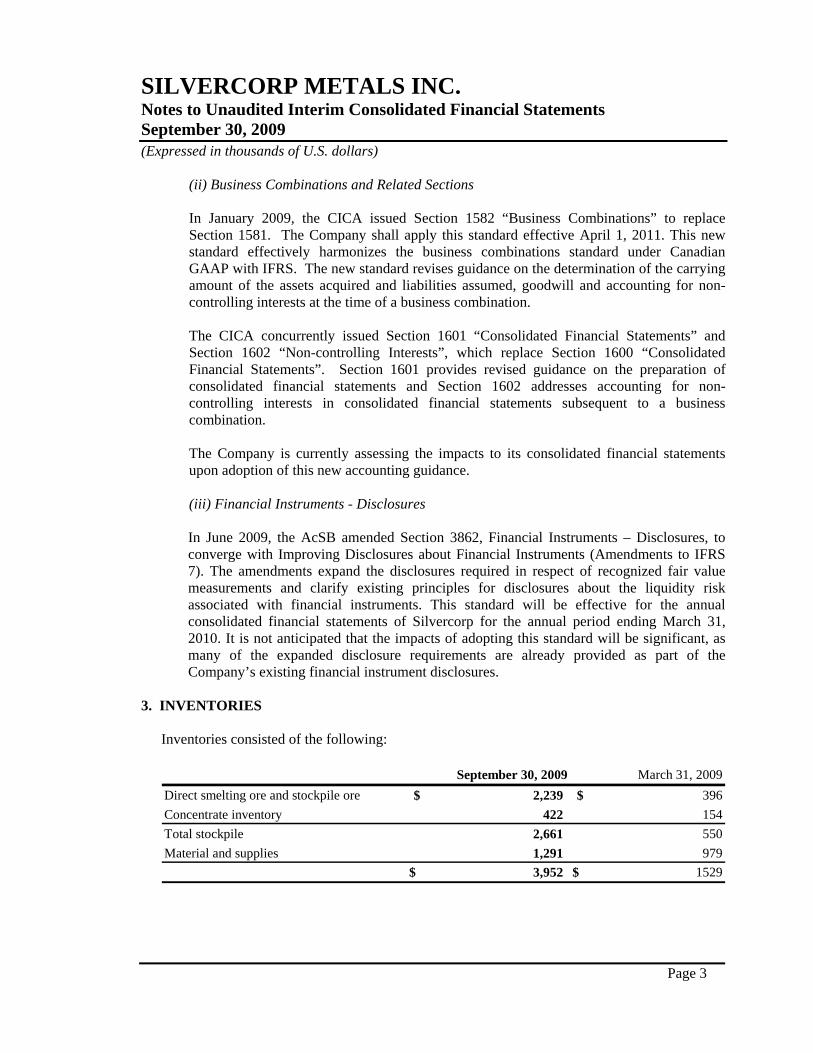
(ii) Business Combinations and Related Sections In January 2009, the CICA issued Section 1582 “Business Combinations” to replace Section 1581. The Company shall apply this standard effective April 1, 2011. This new standard effectively harmonizes the business combinations standard under Canadian GAAP with IFRS. The new standard revises guidance on the determination of the carrying amount of the assets acquired and liabilities assumed, goodwill and accounting for non-controlling interests at the time of a business combination. The CICA concurrently issued Section 1601 “Consolidated Financial Statements” and Section 1602 “Non-controlling Interests”, which replace Section 1600 “Consolidated Financial Statements”. Section 1601 provides revised guidance on the preparation of consolidated financial statements and Section 1602 addresses accounting for non-controlling interests in consolidated financial statements subsequent to a business combination. The Company is currently assessing the impacts to its consolidated financial statements upon adoption of this new accounting guidance. (iii) Financial Instruments - Disclosures In June 2009, the AcSB amended Section 3862, Financial Instruments – Disclosures, to converge with Improving Disclosures about Financial Instruments (Amendments to IFRS 7). The amendments expand the disclosures required in respect of recognized fair value measurements and clarify existing principles for disclosures about the liquidity risk associated with financial instruments. This standard will be effective for the annual consolidated financial statements of Silvercorp for the annual period ending March 31, 2010. It is not anticipated that the impacts of adopting this standard will be significant, as many of the expanded disclosure requirements are already provided as part of the Company’s existing financial instrument disclosures.
3. INVENTORIES
Inventories consisted of the following:
September 30, 2009 March 31, 2009Direct smelting ore and stockpile ore $ 2,239 $ 396Concentrate inventory 422 154Total stockpile 2,661 550Material and supplies 1,291 979
$ 3,952 $ 1529

SILVERCORP METALS INC. Notes to Unaudited Interim Consolidated Financial Statements September 30, 2009 (Expressed in thousands of U.S. dollars)
Page 4
4. LONG TERM INVESTMENTS
September 30, 2009 March 31, 2009Investment in companies subject to significant influence New Pacific Metals Inc. (a) $ 5,981 $ 5,285 Luoyang Yongning Smelting Co. Ltd (b)(i) - 6,877
Investments "available for sale" Dajin Resources Corp. (b)(ii) 93 24 Luoyang Yongning Smelting Co. Ltd (b)(i) 6,882 - Other investments (b)(iii) 1,378 -
$ 14,334 $ 12,186
(a) Investment in companies subject to significant influence New Pacific Metals Inc. (“NUX”) The following is the summary of the investment in NUX and its market value:
Number of shares Amount
Value of NUX'scommon shares perquoted market price
Balance, March 31, 2008 7,400,000 11,252$ 14,758$ Equity in loss of investee company (1,455) Impairment charge (2,707) Impact of foreign currency translation (1,805) Balance, March 31, 2009 7,400,000 5,285 5,285 Equity in loss of investee company (218) Impact of foreign currency translation 914 Balance, September 30, 2009 7,400,000 5,981$ 5,866$ (b) Available for sale investments
Unrealized Gain (loss) Unrealized Gain (loss)Change in
marketvalue
Foreignexchange
Fairvalue
Change inmarket
valueForeign
exchange Fair
valueLuoyang Yongning Smelting Co. Ltd. 6,557$ -$ 325$ 6,882$ -$ -$ -$ -$ Dajin Resources Corp. 217 (134) 10 93 217 (200) 7 24 Other investments 1,397 (19) - 1,378 - - - -
September 30, 2009 March 31, 2009
Costbasis
Costbasis

SILVERCORP METALS INC. Notes to Unaudited Interim Consolidated Financial Statements September 30, 2009 (Expressed in thousands of U.S. dollars)
Page 5
(i) Luoyang Yongning Smelting Co. Ltd. (“Yongning”)
Henan Found entered into an agreement in April 2007, subsequently amended in September 2007, with two 3rd party partners, to custom built a 150,000 tonne per year lead-silver-gold smelter in Luoning County, Luoyang City, Henan Province, China. During fiscal year 2008, Yongning was incorporated, with a registered capital requirement of $21.4 million (RMB¥150 million) for this project. Henan Found earned its 30% equity interest in Yongning through contributing $6.6 million (RMB¥45 million).
During the fiscal year 2009, the controlling shareholders of Yongning proposed to increase the registered capital to $58.6 million (RMB¥400 million) from $21.4 million (RMB¥150 million). Henan Found did not participate in the proportionate capital contribution, except for paying an additional $0.3 million (RMB¥2 million) to Yongning. As at March 31, 2009, a total of $37.6 million (RMB¥257 million) was invested by the joint venture partners, of which $6.9 million (RMB¥47 million) was by Henan Found. In June 2009, at a meeting of the shareholders of Yongning, it was resolved to increase the registered capital to $58.6 million (RMB¥400 million). Following the capital contributions of the other joint venture partners, Henan Found’s equity interest in Yongning was diluted to 11.75%. The shareholders of Yongning further resolved to change the composition of its Board of Directors, such that the representatives appointed by Henan Found were reduced from two directors to one. Management has determined that as a result of these changes, effective June 6, 2009, Henan Found no longer exercises significant influence over Yongning. As such, the investment was reclassified as an available for sale financial asset.
(ii) Dajin Resources Corp. (“Dajin”)
During the quarter ended June 30, 2009, a total of $195 (quarter ended June 30, 2008 - $nil) of unrealized loss on the investment in Dajin was transferred out of accumulated other comprehensive income and recognized as impairment charges on the consolidated statement of operation, as the decline of value is considered to be an other than temporary impairment. During the quarter ended September 30, 2009, a total of $53 (quarter ended September 30, 2008 - $5) of unrealized gain on the investment in Dajin was recorded as other comprehensive income.
(iii) Other investments During the quarter ended September 30, 2009, the Company participated in a private placement of a publicly traded company and subscribed for 5,000,000 units of its securities for a total consideration of $1.17 million (CAD$1.25 million). Each unit consists of one common share and one-half of one non-transferable common share purchase warrant at the

SILVERCORP METALS INC. Notes to Unaudited Interim Consolidated Financial Statements September 30, 2009 (Expressed in thousands of U.S. dollars)
Page 6
price of CAD$0.35 per warrant exercisable in two years. Consideration paid was allocated to the shares and the warrants based on their relative fair value. The fair value of the warrants was calculated using the Black-Scholes Pricing model with assumptions of 111.8% volatility, 1.41% risk free interest rate, and zero dividend yields. The fair value of the warrants was estimated as $228 and a total of $942 was assigned to the common shares at the closing date of the private placement. The warrant was classified as held for trading security and was recorded as short term investment. As at September 30, 2009, the fair value of the warrant was $217 and a loss of $11 was recorded on the consolidated statements of operations. The Company also acquired a total of 2,010,000 shares of the same company at open market for a cost of $380 and a total of 128,000 shares of another public company at open market for a cost of $75. As at September 30, 2009, the fair value of these investments was $1,378 and a total of $19 unrealized loss on these investments was recorded as other comprehensive income.
5. PROPERTY, PLANT AND EQUIPMENT
Property, plant and equipment consisted of:
September 30, 2009
Cost
AccumulatedDepreciation,
Disposition andImpairment Charges
Net BookValue Cost
AccumulatedDepreciation,
Disposition andImpairment Charges
Net BookValue
Building 19,039$ (1,074)$ 17,965$ 13,912$ (835)$ 13,077$ Office equipment and furniture 1,242 (507) 735 1,203 (414) 789 Machinery 8,109 (1,013) 7,096 7,804 (760) 7,044 Motor vehicle 1,895 (708) 1,187 1,272 (444) 828 Land use right 510 (15) 495 822 (10) 812 Leasehold improvement 291 (77) 214 236 (39) 197 Construction in process 564 - 564 6,325 - 6,325
31,650$ (3,394)$ 28,256$ 31,574$ (2,502)$ 29,072$
March 31, 2009
During the six months ended September 30, 2009, the construction of a new mill was substantially completed. As a result, the carrying value of the new mill was reclassified to building from construction in process.

SILVERCORP METALS INC. Notes to Unaudited Interim Consolidated Financial Statements September 30, 2009 (Expressed in thousands of U.S. dollars)
Page 7
6. MINERAL RIGHTS AND PROPERTIES Mineral rights and properties are comprised of the following:
Ying HPG NZ Nabao TLP LM GC & SMT TotalBalance, March 31, 2008 18,303$ 9,733$ 2,047$ 1,058$ 20,015$ 9,749$ -$ 60,905$
Acquisition - - - - - - 80,044 80,044 Capitalized expenditure 6,914 1,835 - 1,141 2,533 1,808 1,251 15,482 Disposal - - (1,819) - - - - (1,819) Depletion (2,336) (1,352) - - (311) (1,247) - (5,246) Impairment charge - (10,337) - (2,005) (22,796) (10,556) - (45,694) Impact of foreign currency translation 576 121 (228) (194) 559 246 (15,339) (14,259)
Balance, March 31, 2009 23,457 - - - - - 65,956 89,413 Capitalized expenditure 3,792 267 - - 2,590 255 803 7,707 Depletion (1,369) - - - (1) - - (1,370) Impact of foreign currency translation (172) - - - - - 11,566 11,394
Balance, September 30, 2009 25,708$ 267$ -$ -$ 2,589$ 255$ 78,325$ 107,144$
Although the Company has taken steps to verify title to the mineral properties in which it, through its subsidiaries, has an interest, in accordance with industry standards for the stage of exploration of such properties, those procedures do not guarantee the Company’s title. Property title may be subject to unregistered prior agreements and non-compliance with regulatory requirements.
During the six months ended September 30, 2009, the Company entered into a contract to sell the Nabao Project for $732 (RMB¥5.0 million), and a total deposit of $146 (RMB¥1.0 million) was received and included in deposits received on the balance sheet. The transaction is subject to the Chinese government’s approval.
7. BANK LOAN AND NOTES PAYABLE
As at September 30, 2009, bank loan and notes payable balances consisted of the following:
Amount Maturity Bank Loan 2,929$ June 16, 2010 As at March 31, 2009, bank loan and notes payable balances consisted of the following:
Amount Maturity
Bankers acceptance 658$ June 30, 2009 On June 16, 2009, the Company, through its 70% owned subsidiary Henan Huawei, obtained an unsecured line of credit of $2.9 million (RMB¥20 million). The Company’s subsidiary, Henan Found and Henan Huawei’s non-controlling interest holder have guaranteed the debt. On June 16, 2009, $2.9 million (RMB¥20 million) was drawn, with an annual interest rate of 5.841%, payable monthly.

SILVERCORP METALS INC. Notes to Unaudited Interim Consolidated Financial Statements September 30, 2009 (Expressed in thousands of U.S. dollars)
Page 8
8. NON-CONTROLLING INTERESTS The continuity of non-controlling interests is summarized as follows:
Henan Found HuaweiGuangdong
Found TotalBalance, March 31, 2008 $ 8,998 $ 2,267 $ - $ 11,265Addition upon acquisition - - 172 172Profit (loss) sharing for the year 3,975 (2,432) (12) 1,531Dividend declared (7,145) - - (7,145)Non-controlling interest shareholder’s contribution - - 219 219Foreign exchange impact 1,397 165 6 1,568
Balance, March 31, 2009 7,225 - 385 7,610Profit sharing for the period 5,936 - 41 5,977
Foreign exchange impact (69) - 480 411Balance, September 30, 2009 $ 13,092 $ - $ 906 $ 13,998
As at September 30, 2009, non-controlling interest in Henan Found, Henan Huawei and Guangdong Found were 22.5%, 30% and 5%, respectively. The Company has not recorded non-controlling interest in Qinghai Found, as its ownership percentage represents only the profit sharing and working interests and the minority shareholder is not responsible for any of the associated costs (also see note 6).
9. SHARE CAPITAL
(a) Authorized
Unlimited number of common shares without par value.

SILVERCORP METALS INC. Notes to Unaudited Interim Consolidated Financial Statements September 30, 2009 (Expressed in thousands of U.S. dollars)
Page 9
(b) Stock Options
The Company has a stock option plan (the “Plan”), which was approved by the shareholders on November 14, 2002 and subsequently amended on August 12, 2009. The plan is administrated by the directors and Compensation Committee of the Company. The plan currently provides that the aggregate number of shares issuable shall not exceed a rolling 10% of the issued and outstanding common shares.
A summary of stock option activities during fiscal 2009 and through September 30, 2009 is as follows:
Number of shares
Weighted averageexercise price per
share CAD$Balance, March 31, 2008 3,234,685 3.42$ Options granted 745,000 5.46 Options exercised (4,482) 4.81 Options expired (31,875) 0.75 Options forfeited (418,625) 5.31 Balance, March 31, 2009 3,524,703 3.65 Options granted 1,081,000 2.65 Options exercised (300,000) 0.22 Options forfeited (108,000) 6.93 Balance, September 30, 2009 4,197,703 3.56$ During the six months ended September 30, 2009, a total of 1,081,000 options were granted to directors, officers, employees and consultants at exercise price of CAD$2.65 per share subject to a vesting schedule over a three year term with 8.333% options vesting every three months.
The following is the summary of assumptions used to estimate the fair value of each option granted using the Black-Scholes option pricing model.
Six months ended September 30, 2009 2008Risk free interest rate 1.18% to 1.86% 3.37% to 3.45%Expected life of option in years 2 to 5 years 2 to 5 yearsExpected volatility 73% to 84% 57% to 92%Expected dividend yield 3% 1%
The weighted average grant date fair value of options granted during the six months ended September 30, 2009 was CAD$1.23 (six months ended September 30, 2008 - CAD$3.85). During the three and six months ended September 30, 2009, a total of $509 and $899 respectively (three and six months ended September 30, 2008 - $701 and $1,268

SILVERCORP METALS INC. Notes to Unaudited Interim Consolidated Financial Statements September 30, 2009 (Expressed in thousands of U.S. dollars)
Page 10
respectively) stock-based compensation expenses were recorded and included in the general and administrative expenses on the consolidated statements of operations. The following table summarizes information related to stock options outstanding at September 30, 2009:
Exerciseprice inCAD$
Number of optionsoutstanding at
September 30, 2009
Weighted averageremaining contractual
life (YRS)
Weightedaverage exercise
price in CAD$
Number of optionsexercisable at
September 30, 2009
Weighted averageexercise price in
CAD$0.22$ 500,000 0.07 0.22$ 500,000 0.22$ 0.22 190,000 0.32 0.22 190,000 0.220.63 450,000 0.41 0.63 450,000 0.635.99 10,000 0.75 5.99 - - 4.32 405,399 1.81 4.32 405,399 4.324.43 42,000 1.91 4.43 42,000 4.436.74 669,204 2.53 6.74 450,304 6.746.95 90,000 3.00 6.95 60,000 6.959.05 105,100 3.30 9.05 52,550 9.057.54 50,000 3.62 7.54 20,833 7.545.99 455,000 3.75 5.99 152,083 5.993.05 150,000 4.00 3.05 37,500 3.052.65 1,081,000 4.55 2.65 90,082 2.65
$ 0.22-9.05 4,197,703 2.58 3.56$ 2,450,751 3.15$ Subsequent to September 30, 2009, a total of 506,251 options were exercised for proceeds of $122.
(c) Cash Dividends Declared and Distributed
During the three months ended September 30, 2009, a quarterly cash dividend of CAD$0.02 per share, totaling $2.9 million (CAD$3.22 million) was paid and another quarterly cash dividend of CAD$0.02 per share, totaling $2.9 million (CAD$3.22 million) was declared, which was paid in October 2009.
All dividends declared were eligible dividends for Canadian tax purposes.

SILVERCORP METALS INC. Notes to Unaudited Interim Consolidated Financial Statements September 30, 2009 (Expressed in thousands of U.S. dollars)
Page 11
10. RELATED PARTY TRANSACTIONS Related party transactions not disclosed elsewhere in the financial statements are as follows:
Amount due from related parties September 30, 2009 March 31, 2009New Pacific Metals Corp. (a) 142$ 30$ Weigemingda Mining Co. Ltd.(f) 220 219
362$ 249$
Amount due to related parties September 30, 2009 March 31, 2009Henan Non-ferrous Geology Bureau (b) 3,897$ 7,187$ Quanfa Exploration Consulting Services Ltd. (c) 117 117 R. Feng Consulting Ltd. (e ) - 49
4,014$ 7,353$
Transactions with related parties 2009 2008 2009 2008New Pacific Metals Corp. (a) 53$ 497$ 88$ 873$ Henan Non-ferrous Geology Bureau (b) 3,292 10,146 3,292 10,146 Qinghai Non-ferrous Geology Bureau (g) - - - 17 Quanfa Exploration Consulting Services Ltd. (c) - 270 88 270 Gao Consulting Ltd.(d) - 52 - 114 McBrighton consulting Ltd.(d) 48 - 92 - R. Feng Consulting Ltd. (e) 81 97 163 183
3,474$ 11,062$ 3,723$ 11,603$
Three months ended September 30, Six months ended September 30,
(a) New Pacific Metals Corp. is a publicly traded company with a director and officer in
common with the Company. Further to a services and cost reallocation agreement between the Company and NUX, the Company will recover costs for services rendered to NUX and expenses incurred on behalf of NUX. During the three and six months ended September 30, 2009, the Company recovered $53 (three months ended September 30, 2008 - $54) and $88 respectively (six months ended September 30, 2008 - $121) from NUX for services rendered and expenses incurred on behalf of NUX. The costs recovered from NUX were recorded as a direct reduction of general and administrative expenses on the consolidated statements of operations.
(b) Henan Non-ferrous Geology Bureau (“Henan Geology Bureau”) is a 22.5% equity interest
holder of Henan Found. The balance of $3,897 (March 31, 2009 - $7,187) owed to Henan Geology Bureau as at September 30, 2009 represented the dividend declared by Henan Found during the year ended March 31, 2009. During the three and six months ended September 30, 2009, Henan Found distributed $3,292 (three and six months ended September 30, 2008 - $10,146) to Henan Geology Bureau.
SILVERCORP METALS INC. Notes to Unaudited Interim Consolidated Financial Statements September 30, 2009 (Expressed in thousands of U.S. dollars)
Page 12
(c) Quanfa Exploration Consulting Services Ltd. (“Quanfa”) is a private company with majority shareholders and management from the senior management of Henan Found and Henan Huawei. During the three and six months ended September 30, 2009, the Company paid $nil and $88 (three and six months ended September 30, 2008 - $270 and $270, respectively) to Quanfa for its consulting services.
(d) During the three and six months ended September 30, 2009, the Company paid $nil (three
and six months ended September 30, 2008 - $52 and $114, respectively) to Gao Consulting Ltd., a private company controlled by a director of the Company for consulting services.
During the three and six months ended September 30, 2009, the Company paid $48 and $92, respectively (three and six months ended September 30, 2008 - $nil) to McBrighton Consulting Ltd., a private company controlled by the same director of the Company for consulting services.
(e) During the three and six months ended September 30, 2009, the Company paid $81 and
$163 (three and six months ended September 30, 2008 - $97 and $183) respectively to R. Feng Consulting Ltd., a private company controlled by a director of the Company for consulting services.
(f) During the fiscal year 2009, the Company advanced $220 to Weigemingda Mining Co.
Ltd., a non-controlling interest holder of Guangdong Found.
(g) During the three and six ended September 30, 2009, the Company paid $nil (three and six months ended September 30, 2008 - $nil and $17) to Qinghai Non-ferrous Geology Bureau, the minority shareholder of Qinghai Found.
The transactions with related parties are measured at the exchange amount, which is the amount of consideration established and agreed by the parties. The balances with related parties are unsecured, non-interest bearing, and due on demand.
11. CAPITAL DISCLOSURES
The Company’s objectives of capital management are intended to safeguard the entity’s ability to support the Company’s normal operating requirement on an ongoing basis, continue the development and exploration of its mineral properties, and support any expansionary plans. The capital of the Company consists of the items included in shareholders’ equity. There are no externally imposed capital requirements. Risk and capital management are primarily the responsibility of the Company’s corporate finance function and is monitored by the Board of Directors. The Company manages the capital structure and makes adjustments depending on economic conditions. Funds have been primarily secured through issuances equity capital. There can be no assurances that the Company will be able to continue to raising equity capital in this manner. The Company invests all capital that is surplus to its immediate needs in short-term, liquid and highly rated financial instruments, such as cash and other short-term deposits,

SILVERCORP METALS INC. Notes to Unaudited Interim Consolidated Financial Statements September 30, 2009 (Expressed in thousands of U.S. dollars)
Page 13
all held with major financial institutions. Significant risks are monitored and actions are taken, when necessary, according to the Company’s approved policies.
12. FINANCIAL INSTRUMENTS
The Company manages its exposure to financial risks, including liquidity risk, foreign exchange rate risk, interest rate risk, credit risk, equity price risk in accordance with its risk management framework. The Company’s Board of Directors has overall responsibility for the establishment and oversight of the Company’s risk management framework and reviews the Company’s policies on an ongoing basis. (a) Fair value
The fair values of financial instruments at September 30, 2009 and March 31, 2009 are summarized as follows:
Carrying amount Fair value Carrying amount Fair valueFinancial AssetsHeld for trading
Cash and cash equivalents 49,816$ 49,816$ 41,470$ 41,470$ Short term investments 29,203 29,203 23,962 23,962 Restricted cash - - 1,025 1,025
Loans and receivablesAccounts receivables 1,235 1,235 2,213 2,213 Amounts due from related parties 362 362 249 249
Available for sale Long term investments
Dajin Resources Corp. 93 93 24 24 Luoyang Yongning Smelting Co. Ltd. 6,882 6,882 - - Other investments 1,378 1,378 - -
Financial LiabilitiesOther financial liabilities
Accounts payable and accrued liabilities 8,740$ 8,740$ 8,533$ 8,533$ Deposits received 3,054 3,054 1,290 1,290 Dividends payable 3,020 3,020 2,564 2,564 Amounts due to related parties 4,014 4,014 7,353 7,353 Bank loan and notes payable 2,929 2,929 658 658
September 30, 2009 March 31, 2009
The fair value of financial instruments represents the amounts that would have been received from or paid to counterparties to settle these instruments. The carrying amount of all financial instruments classified as current approximates their fair value because of the short maturities and normal trade term of these instruments. The fair values of investment in publicly traded companies are based on the quoted market prices. The fair value of the investment in Luoyang Yongning Smelting Co. Ltd. represents the amount the Company invested in Yongning as the smelter is still in construction stage.

SILVERCORP METALS INC. Notes to Unaudited Interim Consolidated Financial Statements September 30, 2009 (Expressed in thousands of U.S. dollars)
Page 14
(b) Liquidity risk
The Company has in place a planning process to help determine the funds required to support the Company’s normal operating requirements on an ongoing basis and its expansion plans. The Company ensures that there are sufficient funds to meet its short-term business requirements, taking into account its anticipated cash flows from operations and its holdings of cash and cash equivalents and short term investments. In the normal course of business, the Company enters into contracts that give rise to commitments for future minimum payments. The following summarizes the remaining contractual maturities of the Company’s financial liabilities.
September 30, 2009 March 31, 2009Within a year
Accounts payable and accrued liabilities 8,740$ 8,533$ Deposits received 3,054 1,290 Dividends payable 3,020 2,564 Amounts due to related parties 4,014 7,353 Bank loan and notes payable 2,929 658
21,757$ 20,398$
(c) Foreign exchange risk
The Company undertakes transactions in various foreign currencies, and reports its results of its operations in US dollars while the Canadian dollar is considered its functional currency, and is therefore exposed to foreign exchange risk arising from transactions denominated in a foreign currency and the translation of functional currency to reporting currency. The Company conducts its mining operations in China and thereby the majority of the Company’s assets, liabilities, revenues and expenses are denominated in RMB, which was tied to the US dollar until July 2005, and is now tied to a basket of currencies of China’s largest trading partners. The RMB is not a freely convertible currency.
SILVERCORP METALS INC. Notes to Unaudited Interim Consolidated Financial Statements September 30, 2009 (Expressed in thousands of U.S. dollars)
Page 15
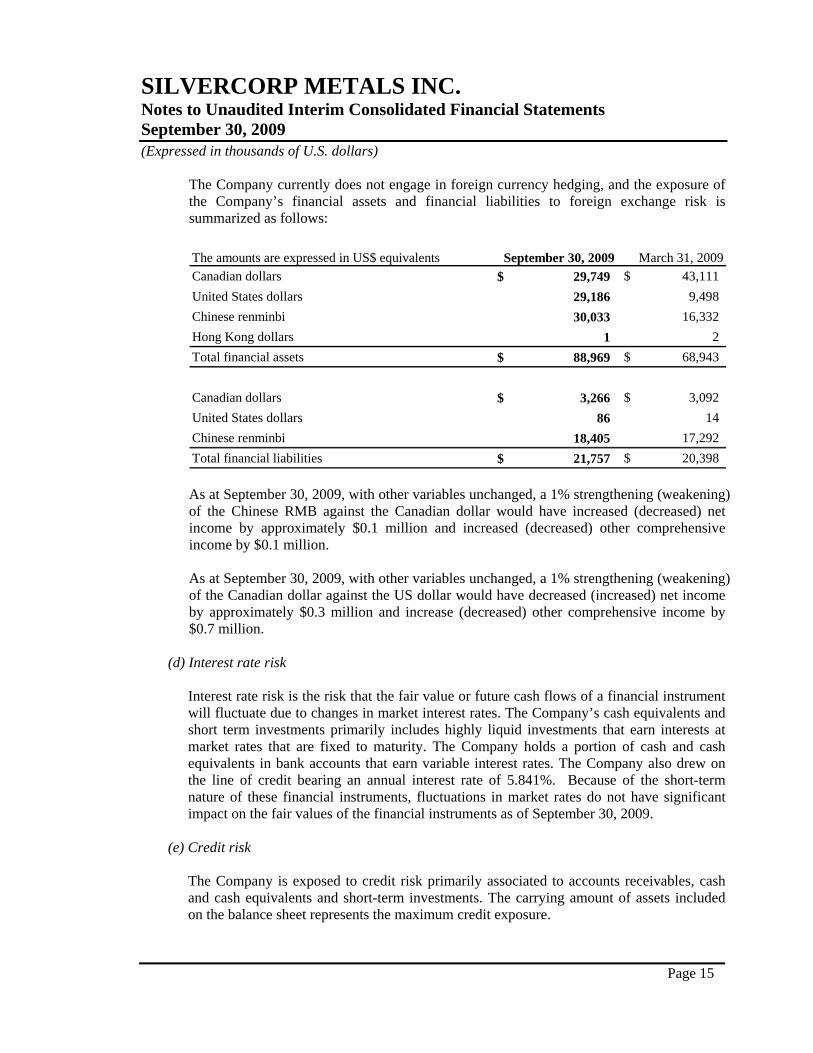
The Company currently does not engage in foreign currency hedging, and the exposure of the Company’s financial assets and financial liabilities to foreign exchange risk is summarized as follows: The amounts are expressed in US$ equivalents September 30, 2009 March 31, 2009Canadian dollars 29,749$ 43,111$ United States dollars 29,186 9,498 Chinese renminbi 30,033 16,332 Hong Kong dollars 1 2 Total financial assets 88,969$ 68,943$
Canadian dollars 3,266$ 3,092$ United States dollars 86 14 Chinese renminbi 18,405 17,292 Total financial liabilities 21,757$ 20,398$ As at September 30, 2009, with other variables unchanged, a 1% strengthening (weakening) of the Chinese RMB against the Canadian dollar would have increased (decreased) net income by approximately $0.1 million and increased (decreased) other comprehensive income by $0.1 million. As at September 30, 2009, with other variables unchanged, a 1% strengthening (weakening) of the Canadian dollar against the US dollar would have decreased (increased) net income by approximately $0.3 million and increase (decreased) other comprehensive income by $0.7 million.
(d) Interest rate risk
Interest rate risk is the risk that the fair value or future cash flows of a financial instrument will fluctuate due to changes in market interest rates. The Company’s cash equivalents and short term investments primarily includes highly liquid investments that earn interests at market rates that are fixed to maturity. The Company holds a portion of cash and cash equivalents in bank accounts that earn variable interest rates. The Company also drew on the line of credit bearing an annual interest rate of 5.841%. Because of the short-term nature of these financial instruments, fluctuations in market rates do not have significant impact on the fair values of the financial instruments as of September 30, 2009.
(e) Credit risk
The Company is exposed to credit risk primarily associated to accounts receivables, cash and cash equivalents and short-term investments. The carrying amount of assets included on the balance sheet represents the maximum credit exposure.

SILVERCORP METALS INC. Notes to Unaudited Interim Consolidated Financial Statements September 30, 2009 (Expressed in thousands of U.S. dollars)
Page 16
The Company undertakes credit evaluations on customers as necessary and has monitoring processes intended to mitigate credit risks. The Company has accounts receivables from clients primarily in China engaged in the mining and milling of base and polymetallic metals industry. The historical level of customer defaults is zero and aging of accounts receivable are less than 30 days. Occasionally, the Company disposes of exploration permits of abandoned projects. The Company undertakes credit evaluations at each time of disposition. As at September 30, 2009, $nil (March 31, 2009 - $790 (also see note 6)) represented such receivables. The aging was within 1 year. As at September 30, 2009, the Company did not hold any asset-backed commercial paper.
(f) Price risk
The Company holds certain marketable securities that will fluctuate in value as a result of trading on Canadian financial markets. Furthermore, as the Company’s marketable securities are also in mining companies, market values will fluctuate as commodity prices change. Based upon the Company’s portfolio at September 30, 2009, a 10% fluctuation in the market price of the securities held, ignoring any foreign currency risk would have resulted in an increase (or decrease) to net income of approximately $0.7 million.
13. SEGMENTED INFORMATION
(a) Industry information
The Company operates in one reportable operating segment, being the acquisition, exploration, development and operation of mineral properties.
(b) Geographic information
(i) The following is the summary of certain long-term assets of each geographic segment:
ChinaBalance sheet items: Ying HPG TLP LM GC & SMT Other
Mineral rights and properties -$ 25,708$ 267$ 2,589$ 255$ 78,325$ -$ -$ 107,144$ Property, plant and equipment 466 23,188 1,065 992 307 363 1,875 - 28,256 Long term investments 6,074 6,882 - - - - - 1,378 14,334
ChinaBalance sheet items: Ying HPG TLP LM GC & SMT Other
Mineral rights and properties -$ 23,457$ -$ -$ -$ 65,956$ -$ -$ 89,413$ Property, plant and equipment 414 21,404 1,132 3,863 273 320 1,666 - 29,072 Long term investments 5,309 6,877 - - - - - - 12,186
BVICanada Total
Total
September 30, 2009
March 31, 2009
Canada BVI

SILVERCORP METALS INC. Notes to Unaudited Interim Consolidated Financial Statements September 30, 2009 (Expressed in thousands of U.S. dollars)
Page 17
(ii) The following is a summary of operations for each geographic segment:
Three months ended September 30, 2009China
Ying HPG TLP LM GC & SMT Other TotalSales -$ 23,746$ 1,110$ 155$ 74$ -$ -$ -$ 25,085$ Cost of sales - (4,664) (391) (46) (72) - - - (5,173) Amortization and depletion - (805) (15) (2) (2) - - - (824) Gross Profit - 18,277 704 107 - - - - 19,088
Expenses (including foreign exchanges) (3,946) (597) (331) (53) (170) 1,236 (149) 189 (3,820)
Interest & other income 144 111 139 - - - (202) 21 213 Impairment charges - - - - - - - 79 79 Loss and other expenses (136) (892) 9 1 - - 25 (25) (1,018) Non-controlling interest - (3,320) - (20) - 43 - - (3,297) Income tax recovery (expenses) - (2,397) 14 31 - - - - (2,352) Net income (loss) (3,938)$ 11,182$ 535$ 66$ (170)$ 1,279$ (326)$ 264$ 8,893$
Canada BVI
Three months ended September 30, 2008China
Ying HPG TLP LM GC & SMT Other TotalSales -$ 15,286$ 1,795$ 1,700$ 1,322$ -$ -$ -$ 20,103$ Cost of sales - (4,597) (648) (1,835) (588) - - - (7,668) Amortization and depletion - (1,058) (259) (492) (392) - - - (2,201) Gross Profit - 9,631 888 (627) 342 - - - 10,234
Expenses (including foreign exchanges) (2,755) (524) (568) (156) (118) (779) (228) 3,497 (1,631)
Interest & other income 130 85 1 - - 1 43 70 330 Loss and other expenses (1,240) - - - - - - - (1,240) Non-controlling interest - (1,726) (142) 160 (2) 4 - - (1,706) Income tax recovery (expenses) - (1,325) (276) 274 197 - - - (1,130) Net income (loss) (3,865)$ 6,141$ (97)$ (349)$ 419$ (774)$ (185)$ 3,567$ 4,857$
Canada BVI

SILVERCORP METALS INC. Notes to Unaudited Interim Consolidated Financial Statements September 30, 2009 (Expressed in thousands of U.S. dollars)
Page 18
Six months ended September 30, 2009China
Ying HPG TLP LM GC & SMT Other TotalSales -$ 45,173$ 2,055$ 276$ 153$ -$ -$ -$ 47,657$ Cost of sales - (9,192) (779) (63) (111) - - - (10,145) Amortization and depletion - (1,719) (27) (4) (3) - - - (1,753) Gross Profit - 34,262 1,249 209 39 - - - 35,759
Expenses (including foreign exchanges) (5,974) (2,819) (848) (879) (384) 2,502 (209) 396 (8,215)
Interest & other income 309 247 225 - - - (201) 31 611 Impairment charges (195) - - - - - - (503) (698) Loss and other expenses (218) (1,138) - - - - 25 (25) (1,356) Non-controlling interest - (6,059) - 123 - (41) - - (5,977) Income tax recovery (expenses) - (3,866) - 122 - - - - (3,744) Net income (loss) (6,078)$ 20,627$ 626$ (425)$ (345)$ 2,461$ (385)$ (101)$ 16,380$
BVICanada
Six months ended September 30, 2008China
Ying HPG TLP LM GC & SMT Other TotalSales -$ 39,980$ 4,995$ 3,466$ 2,521$ -$ -$ -$ 50,962$ Cost of sales - (10,286) (1,709) (2,245) (1,367) - - - (15,607) Amortization and depletion - (1,688) (829) (638) (614) - - - (3,769) Gross Profit - 28,006 2,457 583 540 - - - 31,586
Expenses (including foreign exchanges) (4,944) (1,556) (965) (444) (296) (950) (216) 3,495 (5,876)
Interest & other income 348 668 4 - - 1 45 70 1,136 Impairment charges - - - - - - - - - Loss and other expenses (1,444) - - - - - (10) - (1,454) Non-controlling interest - (5,282) (563) (62) (15) 4 - - (5,918) Income tax recovery (expenses) - (3,242) (46) 137 135 - - - (3,016) Net income (loss) (6,040)$ 18,594$ 887$ 214$ 364$ (945)$ (181)$ 3,565$ 16,458$
Canada BVI
(c) Sales by metal
The sales generated for the three and six months ended September 30, 2009 and 2008 comprised of:
2009 2008 2009 2008Silver (Ag) 12,635$ 10,184$ 24,259$ 25,590$ Gold (Au) 188 278 362 625 Lead (Pb) 10,259 8,682 19,307 21,507 Zinc (Zn) 2,003 959 3,729 3,240
25,085$ 20,103$ 47,657$ 50,962$
Three Months ended September 30, Six Months ended September 30,

SILVERCORP METALS INC. Notes to Unaudited Interim Consolidated Financial Statements September 30, 2009 (Expressed in thousands of U.S. dollars)
Page 19
(d) Major customers
For the three months ended September 30, 2008, four (three months ended September 30, 2008 - four) major customers accounted for 12% to 28% (three months ended September 30, 2008 - 9% to 25%) and collectively 72% (three months ended September 30, 2008 - 71%) of the total sales of the Company. During the six months ended September 30, 2009, there were four (six months ended September 30, 2008 - four) major customers which individually accounted for 11% to 26% (six months ended September 30, 2008 - 10% to 33%) and collectively, 71% (six months ended September 30, 2008 - 78%) of the total sales of the Company.
14. COMMITMENTS
Commitments, not disclosed elsewhere in these financial statements, are as follows: The Company entered into two office rental agreements (the “Rental Agreements”), with total rental expense of $1,327 over the next five years as the follows: for the period ending 2010: $141; 2011: $285; 2012: $308; 2013: $342; and 2014: $251. In connection with one of these Rental Agreements, the Company signed a sublease agreement commencing April 15, 2009 and expiring September 29, 2013, with annual rental income of $62.