silvercorp metals inc. · pdf file · 2018-02-26silvercorp metals inc. ... (non...
TRANSCRIPT
SILVERCORP METALS INC.
MANAGEMENT’S DISCUSSION AND ANALYSIS
For the Three and Six Months Ended September 30, 2014
(Expressed in thousands of US dollars, unless otherwise stated)

Table of Contents
1. Core Business and Strategy ........................................................................................... 2
2. Second Quarter of Fiscal Year 2015 Highlights ............................................................... 2
3. Operating Performance ................................................................................................. 2
4. Second Quarter Fiscal Year 2015 Financial Results ....................................................... 10
5. Liquidity and Capital Resources ................................................................................... 13
6. Financial Instruments and Related Risks ...................................................................... 14
7. Off‐Balance Sheet Arrangements ................................................................................ 17
8. Transactions with Related Parties ............................................................................... 17
9. Alternative Performance (Non‐IFRS) Measures ........................................................... 18
10. Critical Accounting Policies and Estimates ................................................................... 24
11. Changes in Accounting Standards ................................................................................ 25
12. Other MD&A Requirements ........................................................................................ 25
13. Outstanding Share Data .............................................................................................. 25
14. Risks and Uncertainties ............................................................................................... 26
15. Disclosure Controls and Procedures ............................................................................ 27
16. Changes in Internal Control over Financial Reporting .................................................. 27
17. Directors and Officers ................................................................................................. 27
Forward Looking Statements .............................................................................................. 28

SILVERCORP METALS INC. Management’s Discussion and Analysis For the Three and Six Months Ended September 30, 2014 (Expressed in thousands of U.S. dollars, unless otherwise stated)
Management’s Discussion and Analysis Page 2
Management’s Discussion and Analysis (“MD&A”) is intended to help the reader understand the significant factors that have affected Silvercorp Metals Inc. and its subsidiaries’ (“Silvercorp” or the “Company”) performance and such factors that may affect its future performance. This MD&A should be read in conjunction with the Company’s unaudited consolidated financial statements for the three and six months ended September 30, 2014 and the related notes contained therein. In addition, the following should be read in conjunction with the audited consolidated financial statements of the Company for the year ended March 31, 2014, the related MD&A, the Annual Information Form (available on SEDAR at www.sedar.com), and the annual report on Form 40‐F. The Company reports its financial position, results of operations and cash flow in accordance with International Financial Reporting Standards as issued by the International Accounting Standards Board (“IFRS”). Silvercorp’s significant accounting policies are set out in Note 2 of the unaudited condensed consolidated financial statements for the three and six months ended September 30, 2014, as well as Note 2 to the audited consolidated financial statements for the year ended March 31, 2014. This MD&A refers to various non‐IFRS measures, such as total and cash cost per ounce of silver, net of by‐product credits, cash flow from operations per share and production costs per tonne. Non‐IFRS measures do not have standardized meanings under IFRS. Accordingly, non‐IFRS measures should not be considered in isolation or as a substitute for measures of performance prepared in accordance with IFRS. To facilitate a better understanding of these measures as calculated by the Company, we have provided detailed descriptions and reconciliations, in section 9 of this MD&A. This MD&A is prepared as of November 12, 2014.
1. Core Business and Strategy
Silvercorp Metals Inc. is engaged in the acquisition, exploration, development and mining of high‐grade silver‐related mineral properties in China. Silvercorp is the largest primary silver producer in China through the operation of the four silver‐lead‐zinc mines at the Ying Mining District in Henan Province, China. The Company also commenced commercial production at its GC silver‐lead‐zinc project in Guangdong Province in the current year. The Company’s shares are traded on the New York Stock Exchange and the Toronto Stock Exchange.
2. Second Quarter of Fiscal Year 2015 Highlights
Silver production of 1.348 million ounces, up 32% from the prior year period;
Lead production of 14.1 million pounds and zinc production of 5.2 million pounds, up 48% and 137%, respectively, compared to the prior year period;
Sales of $37.3 million, up 31% from the prior year period;
Gross margin of 49% compared to 48% in the prior year period;
Cash flow from operations of $20.1 million, or $0.12 per share, compared to $5.7 million or $0.03 per share in the prior year period;
Net income of $7.2 million, or $0.04 per share, compared to net loss of $43.2 million, or $0.25 per share in the prior year period;
Cash cost per ounce of silver, net of by‐product credits, of negative $0.98;
All‐in sustaining cost per ounce of silver, net of by‐product credits, of $9.64;
Cash mining cost decreased by 10% to $39.21 per tonne, and G&A costs decreased by 14% to $6.1 million in Q2 Fiscal 2015;
Combined with more efficient capital spending, Silvercorp ended the quarter with cash and cash equivalents and short‐term investments of $85.6 million and no long term debt; and
GC mine commenced commercial production, producing 70,898 tonnes of ore with metal sales of 97,000 ounces of silver, 1.4 million pounds of lead, and 3.3 million pounds of zinc.

SILVERCORP METALS INC. Management’s Discussion and Analysis For the Three and Six Months Ended September 30, 2014 (Expressed in thousands of U.S. dollars, unless otherwise stated)
Management’s Discussion and Analysis Page 3
3. Operating Performance
The following table summarizes consolidated and each mining district’s operational information for the three months ended September 30, 2014:
Ying Mining
District1
BYP GC Total
Production Data
Mine Data
Ore Mined (tonne) 197,135 10,344 70,898 278,377
Run of Mine Ore (tonne) 190,831 18,296 69,144 278,271
+ Mining cost per tonne of ore mined ($) 55.41 29.93 51.69 53.52
Cash mining cost per tonne of ore mined ($) 43.62 23.38 29.25 39.21
Non cash mining cost per tonne of ore mined ($) 11.79 6.55 22.44 14.31
+ Unit shipping costs($) 4.38 ‐ ‐ 3.10
+ Milling cost per tonne of ore milled ($) 14.85 11.73 22.81 16.62
Cash milling cost per tonne of ore milled ($) 12.77 10.56 17.59 13.82
Non cash milling cost per tonne of ore milled ($) 2.08 1.17 5.22 2.80
+ Average Production Cost
Silver ($ per ounce) 7.43 ‐ 12.79 8.16
Gold ($ per ounce) 383 227 ‐ 441
Lead ($ per pound) 0.36 ‐ 0.58 0.39
Zinc ($ per pound) 0.32 ‐ 0.61 0.38
Sulphur ($ per pound) ‐ ‐ 0.01 0.01
+ Total production cost per ounce of Silver ($) 2.35 4.39 2.50
+ Total cash cost per ounce of Silver ($) (0.16) (11.59) (0.98)
+ Total production cost per ounce of Gold ($) 229 229
+ Total cash cost per ounce of Gold ($) 386 386
+ All‐in sustaining cost per ounce of Silver ($)2
7.35 198.50 (2.46) 9.64
+ All‐in cost per ounce of Silver ($)2
23.15 223.50 8.39 25.02
Total Recovery of the Run of Mine Ore
Silver (%) 3
94.4 79.4 90.4
Gold (%) 89.1 89.1
Lead (%) 95.2 88.1 93.3
Zinc (%) 56.7 81.0 63.2
Sulphur (%) 39.1 39.1
Head Grades of Run of Mine Ore
Silver (gram/tonne) 223 107 192
Gold (gram/tonne) 2.3 2.3
Lead (%) 3.3 1.4 2.8
Zinc (%) 0.7 2.8 1.2
Sulphur (%) 6.5 6.5
Sales Data
Metal Sales
Silver (in thousands of ounce) 1,251 ‐ 97 1,348
Gold (in thousands of ounce) 0.8 0.1 ‐ 0.9
Lead (in thousands of pound) 12,665 ‐ 1,428 14,093
Zinc (in thousands of pound) 1,944 ‐ 3,259 5,203
Sulphur (in thousands of pound) ‐ ‐ 11,343 11,343
Metal Sales
Silver (in thousands of $) 20,148 ‐ 1,583 21,731
Gold (in thousands of $) 655 94 ‐ 749
Lead (in thousands of $) 9,759 ‐ 1,060 10,819
Zinc (in thousands of $) 1,364 ‐ 2,538 3,902
Sulphur (in thousands of $) ‐ ‐ 130 130
31,926 94 5,311 37,331
Average Selling Price, Net of Value Added Tax and Smelter Charges
Silver ($ per ounce) 16.11 ‐ 16.35 16.12
Gold ($ per ounce) 831 1,313 ‐ 871
Lead ($ per pound) 0.77 ‐ 0.74 0.77
Zinc ($ per pound) 0.70 ‐ 0.78 0.75
Sulphur ($ per pound) ‐ ‐ 0.01 0.01
1 Ying Mining District includes mines: SGX, TLP, HPG&LM.
2 BYP gold ounces converted to silver equivalent using a ratio of 50:1.
3 GC silver recovery rate consist of 55.8% from lead concentrate and 23.6% from zinc concentrate.
+ Non‐IFRS measures, see section 9 for reconciliation.
Three months ended September 30, 2014

SILVERCORP METALS INC. Management’s Discussion and Analysis For the Three and Six Months Ended September 30, 2014 (Expressed in thousands of U.S. dollars, unless otherwise stated)
Management’s Discussion and Analysis Page 4
The following table summarizes consolidated and each mining district’s operational information for the three months ended September 30, 2013:
Ying Mining
District1
BYP Total
Production Data
Mine Data
Ore Mined (tonne) 153,102 17,654 170,756
Run of Mine Ore (tonne) 157,293 20,073 177,366
+ Mining cost per tonne of ore mined ($) 56.08 60.72 56.56
Cash mining cost per tonne of ore mined ($) 45.22 28.21 43.46
Non cash mining cost per tonne of ore mined ($) 10.86 32.51 13.10
+ Unit shipping costs($) 5.12 ‐ 4.59
+ Milling cost per tonne of ore milled ($) 17.29 17.25 17.28
Cash milling cost per tonne of ore milled ($) 14.89 15.75 14.98
Non cash milling cost per tonne of ore milled ($) 2.40 1.50 2.30
+ Average Production Cost
Silver ($ per ounce) 8.11 ‐ 8.50
Gold ($ per ounce) 465 853 535
Lead ($ per pound) 0.38 ‐ 0.40
Zinc ($ per pound) 0.30 ‐ 0.32
Sulphur ($ per pound) ‐ ‐ ‐
+ Total production cost per ounce of Silver ($) 3.41 3.41
+ Total cash cost per ounce of Silver ($) 0.49 0.49
+ Total production cost per ounce of Gold ($) 853 853
+ Total cash cost per ounce of Gold ($) 486 486
+ All‐in sustaining cost per ounce of Silver ($)2
12.47 16.95 16.50
+ All‐in cost per ounce of Silver ($)2
15.27 18.30 25.02
Total Recovery of the Run of Mine Ore
Silver (%) 92.7 92.7
Gold (%) 93.0 93.0
Lead (%) 94.8 94.8
Zinc (%) 68.5 68.5
Sulphur (%)
Head Grades of Run of Mine Ore
Silver (gram/tonne) 217 217
Gold (gram/tonne) 2.8 2.8
Lead (%) 2.9 2.9
Zinc (%) 1.0 1.0
Sulphur (%)
Sales Data
Metal Sales
Silver (in thousands of ounces) 1,021 ‐ 1,021
Gold (in thousands of ounces) 0.9 2.1 3.0
Lead (in thousands of pounds) 9,519 ‐ 9,519
Zinc (in thousands of pounds) 2,199 ‐ 2,199
Sulphur (in thousands of pound) ‐ ‐ ‐
Metal Sales
Silver (in thousands of $) 16,669 ‐ 16,669
Gold (in thousands of $) 818 2,277 3,095
Lead (in thousands of $) 7,349 ‐ 7,349
Zinc (in thousands of $) 1,347 ‐ 1,347
Sulphur (in thousands of $) ‐ ‐ ‐
26,183 2,277 28,460
Average Selling Price, Net of Value Added Tax and Smelter Charges
Silver ($ per ounce) 16.33 ‐ 16.33
Gold ($ per ounce) 937 1,064 1,027
Lead ($ per pound) 0.77 ‐ 0.77
Zinc ($ per pound) 0.61 ‐ 0.61
Sulphur ($ per pound) ‐ ‐ ‐
1 Ying Mining District includes mines: SGX, TLP, HPG&LM.
2 BYP gold ounces converted to silver equivalent using a ratio of 50:1.
+ Non‐IFRS measures, see section 9 for reconcil iation.
Three months ended September 30, 2013

SILVERCORP METALS INC. Management’s Discussion and Analysis For the Three and Six Months Ended September 30, 2014 (Expressed in thousands of U.S. dollars, unless otherwise stated)
Management’s Discussion and Analysis Page 5
The following table summarizes consolidated and each mining district’s operational information for the six months ended September 30, 2014:
Ying Mining
District1
BYP GC Total
Production Data
Mine Data
Ore Mined (tonne) 370,619 46,547 70,898 488,064
Run of Mine Ore (tonne) 360,311 48,844 69,144 478,299
+ Mining cost per tonne of ore mined ($) 56.79 30.46 51.69 53.53
Cash mining cost per tonne of ore mined ($) 45.18 22.85 29.25 40.74
Non cash mining cost per tonne of ore mined ($) 11.61 7.61 22.44 12.80
+ Unit shipping costs($) 4.56 ‐ ‐ 3.46
+ Milling cost per tonne of ore milled ($) 14.69 13.36 22.81 15.72
Cash milling cost per tonne of ore milled ($) 12.49 12.27 17.59 13.20
Non cash milling cost per tonne of ore milled ($) 2.20 1.09 5.22 2.52
+ Average Production Cost
Silver ($ per ounce) 7.51 ‐ 12.79 7.96
Gold ($ per ounce) 408 564 ‐ 481
Lead ($ per pound) 0.36 ‐ 0.58 0.38
Zinc ($ per pound) 0.32 ‐ 0.61 0.36
Sulphur ($ per pound) ‐ ‐ 0.01 0.01
+ Total production cost per ounce of Silver ($) 2.62 4.39 2.69
+ Total cash cost per ounce of Silver ($) 0.14 (11.59) (0.32)
+ Total production cost per ounce of Gold ($) 565 565
+ Total cash cost per ounce of Gold ($) 454 454
+ All‐in sustaining cost per ounce of Silver ($)2
8.06 20.46 (2.46) 10.59
+ All‐in cost per ounce of Silver ($)2
17.41 22.16 13.05 19.98
Total Recovery of the Run of Mine Ore
Silver (%) 3
94.0 79.4 91.6
Gold (%) 89.5 89.5
Lead (%) 95.5 88.1 94.3
Zinc (%) 56.7 81.0 60.6
Sulphur (%) 39.1 39.1
Head Grades of Run of Mine Ore
Silver (gram/tonne) 225 107 206
Gold (gram/tonne) 2.6 2.6
Lead (%) 3.3 1.4 3.0
Zinc (%) 0.7 2.8 1.0
Sulphur (%) 6.5 6.5
Sales Data
Metal Sales
Silver (in thousands of ounce) 2,377 ‐ 97 2,474
Gold (in thousands of ounce) 1.6 2.7 ‐ 4.3
Lead (in thousands of pound) 24,194 ‐ 1,428 25,622
Zinc (in thousands of pound) 3,155 ‐ 3,259 6,414
Sulphur (in thousands of pound) ‐ ‐ 11,343 11,343
Metal Sales
Silver (in thousands of $) 37,926 ‐ 1,583 39,509
Gold (in thousands of $) 1,396 2,775 ‐ 4,171
Lead (in thousands of $) 18,412 ‐ 1,060 19,472
Zinc (in thousands of $) 2,126 ‐ 2,538 4,664
Sulphur (in thousands of $) ‐ ‐ 130 130
59,860 2,775 5,311 67,946
Average Selling Price, Net of Value Added Tax and Smelter Charges
Silver ($ per ounce) 15.96 ‐ 16.35 15.97
Gold ($ per ounce) 867 1,024 ‐ 965
Lead ($ per pound) 0.76 ‐ 0.74 0.76
Zinc ($ per pound) 0.67 ‐ 0.78 0.73
Sulphur ($ per pound) ‐ ‐ 0.01 0.01
1 Ying Mining District includes mines: SGX, TLP, HPG&LM.
2 BYP gold ounces converted to silver equivalent using a ratio of 50:1.
3 GC silver recovery rate consist of 55.8% from lead concentrate and 23.6% from zinc concentrate.
+ Non‐IFRS measures, see section 9 for reconcil iation.
Six months ended September 30, 2014

SILVERCORP METALS INC. Management’s Discussion and Analysis For the Three and Six Months Ended September 30, 2014 (Expressed in thousands of U.S. dollars, unless otherwise stated)
Management’s Discussion and Analysis Page 6
The following table summarizes consolidated and each mining district’s operational information for the six months ended September 30, 2013:
Ying Mining
District1
BYP Total
Production Data
Mine Data
Ore Mined (tonne) 386,359 ‐ 46,729 433,088
Run of Mine Ore (tonne) 393,466 6,929 * 50,048 450,443
+ Mining cost per tonne of ore mined ($) 61.62 ‐ 54.86 60.89
Cash mining cost per tonne of ore mined ($) 51.18 ‐ 23.78 48.23
Non cash mining cost per tonne of ore mined ($) 10.44 ‐ 31.08 12.67
+ Unit shipping costs($) 4.44 ‐ ‐ 3.96
+ Milling cost per tonne of ore milled ($) 15.11 ‐ 15.36 15.14
Cash milling cost per tonne of ore milled ($) 13.21 ‐ 14.16 13.31
Non cash milling cost per tonne of ore milled ($) 1.90 ‐ 1.20 1.82
+ Average Production Cost
Silver ($ per ounce) 8.97 ‐ ‐ 9.33
Gold ($ per ounce) 512 ‐ 891 580
Lead ($ per pound) 0.40 ‐ ‐ 0.42
Zinc ($ per pound) 0.32 ‐ 0.44 0.33
Sulphur ($ per pound) ‐ ‐ ‐ ‐
+ Total production cost per ounce of Silver ($) 4.51 ‐ 4.51
+ Total cash cost per ounce of Silver ($) 2.06 ‐ 2.06
+ Total production cost per ounce of Gold ($) 884 884
+ Total cash cost per ounce of Gold ($) 466 466
+ All‐in sustaining cost per ounce of Silver ($)3
11.83 ‐ 22.17 15.95
+ All‐in cost per ounce of Silver ($)3
15.12 ‐ 23.70 25.42
Total Recovery of the Run of Mine Ore
Silver (%) 92.5 ‐ 92.5
Gold (%) 92.6 92.6
Lead (%) 94.7 ‐ 94.7
Zinc (%) 68.4 ‐ 68.4
Sulphur (%)
Head Grades of Run of Mine Ore
Silver (gram/tonne) 207 ‐ 207
Gold (gram/tonne) 2.9 2.9
Lead (%) 2.8 ‐ 2.8
Zinc (%) 0.9 ‐ 0.9
Sulphur (%)
Sales Data
Metal Sales
Silver (in thousands of ounces) 2,385 10 * ‐ 2,395
Gold (in thousands of ounces) 2.2 0.2 * 4.5 6.9
Lead (in thousands of pounds) 22,582 405 * ‐ 22,987
Zinc (in thousands of pounds) 5,125 484 * 282 5,891
Sulphur (in thousands of pound) ‐ ‐ ‐ ‐
Metal Sales
Silver (in thousands of $) 40,760 ‐ ‐ 40,760
Gold (in thousands of $) 2,101 ‐ 4,946 7,047
Lead (in thousands of $) 17,182 ‐ ‐ 17,182
Zinc (in thousands of $) 3,153 ‐ 153 3,306
Sulphur (in thousands of $) ‐ ‐ ‐ ‐
63,196 ‐ 5,099 68,295
Average Selling Price, Net of Value Added Tax and Smelter Charges
Silver ($ per ounce) 17.09 ‐ ‐ 17.09
Gold ($ per ounce) 975 ‐ 1,105 1,063
Lead ($ per pound) 0.76 ‐ ‐ 0.76
Zinc ($ per pound) 0.62 ‐ 0.54 0.61
Sulphur ($ per pound) ‐ ‐ ‐ ‐
1 Ying Mining District includes mines: SGX, TLP, HPG&LM.
2 X Mines includes the XBG project and XHP project.
3 BYP gold ounces converted to silver equivalent using a ratio of 50:1.
* Represents development tunnelling ore at the X mines.
+ Non‐IFRS measures, see section 9 for reconciliation.
Six months ended September 30, 2013
X Mines2

SILVERCORP METALS INC. Management’s Discussion and Analysis For the Three and Six Months Ended September 30, 2014 (Expressed in thousands of U.S. dollars, unless otherwise stated)
Management’s Discussion and Analysis Page 7
(a) Mine and Milling Production
For the three months ended September 30, 2014 (“Q2 Fiscal 2015”), on a consolidated basis, the Company mined 278,377 tonnes of ore, a 63% increase compared to 170,756 tonnes in the three months ended September 30, 2013 (“Q2 Fiscal 2014”). The increase in ore mined was due to a 29% increase in ore mined at the Ying Mining District along with the commencement of commercial production at the GC mine adding 70,898 tonnes of ore. Correspondingly, ore milled increased 57% to 278,271 tonnes of ore compared to 177,366 tonnes in Q2 Fiscal 2014. For the six months ended September 30, 2014, on a consolidated basis, the Company mined 488,064 tonnes of ore, a 13% increase compared to 433,088 tonnes in the same prior year period. In the same comparative periods, ore milled increased 6% to 478,299 tonnes of ore compared to 450,443 tonnes.
(b) Mining and Milling Costs
In Q2 Fiscal 2015, the consolidated total mining cost and cash mining cost were $53.52 and $39.21 per tonne, a decrease of 5% and 10% as compared to $56.56 and $43.46 per tonne, respectively, in Q2 Fiscal 2014. The overall decrease in cash mining cost is attributed to the ongoing focus on production efficiencies and cost control initiatives at the Ying Mining District, which resulted in a 4% decrease compared to the prior year quarter. The impact of the GC mine commencing production at a cash mining cost of $29.25 per tonne of ore, also contributed to the overall decrease.
The consolidated total milling cost and cash milling cost in Q2 Fiscal 2015 were $16.62 and $13.82 per tonne compared to $17.28 and $14.98 per tonne, respectively, in Q2 Fiscal 2014.
For the six months ended September 30, 2014, the consolidated total mining cost and cash mining cost were $53.53 and $40.74 per tonne, a decrease of 12% and 16% compared to $60.89 and $48.23 per tonne, respectively, in the same prior year period. In the same comparative periods, consolidated total milling and cash milling cost were $15.72 and $13.20 per tonne compared to $15.14 and $13.31 per tonne.
(c) Metal Production
In Q2 Fiscal 2015, the Company produced 1.3 million ounces of silver, 860 ounces of gold, 14.1 million pounds of lead, and 5.2 million pounds of zinc, compared to 1.0 million ounces of silver, 3,012 ounces of gold, 9.5 million pounds of lead, and 2.2 million pounds of zinc, respectively, in Q2 Fiscal 2014. Metal production in this quarter continues to be positively impacted by improved dilution control, which resulted in a 3% and 14% increase in silver and lead head grades, along with a 29% increase in ore mined at the Ying Mining District. In addition, the commencement of commercial production at the GC mine contributed to higher metal production.
For the six months ended September 30, 2014, the Company produced 2.5 million ounces of silver, 4,321 ounces of gold, 25.6 million pounds of lead, and 6.4 million pounds of zinc, compared to 2.4 million ounces of silver, 6,789 ounces of gold, 23.0 million pounds of lead, and 5.9 million pounds of zinc, respectively, in the same prior year period.
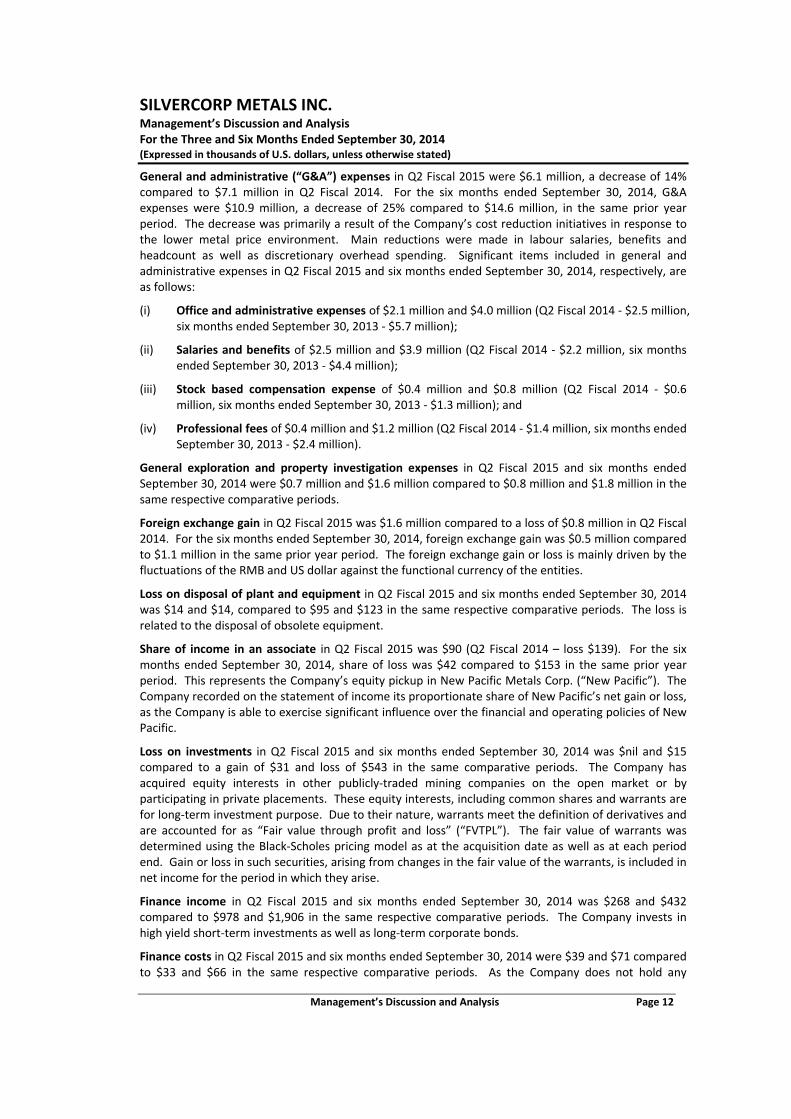
(d) Total and Cash Cost per Ounce of Silver, Net of By‐Product Credits1
In Q2 Fiscal 2015, the consolidated total production cost and cash cost per ounce of silver, net of by‐product credits, were $2.50 and negative $0.98 compared to $3.41 and $0.49, respectively, in Q2 Fiscal 2014. The overall decrease in cash cost per ounce of silver, net of by‐product credits, is mainly due to the effectiveness of ongoing production efficiencies and cost control initiatives along with significant increases in by‐product revenue due to 48% higher lead and 137% higher zinc production compared to the prior year quarter.
1 Non‐IFRS measure, see section 9 for reconciliation

SILVERCORP METALS INC. Management’s Discussion and Analysis For the Three and Six Months Ended September 30, 2014 (Expressed in thousands of U.S. dollars, unless otherwise stated)
Management’s Discussion and Analysis Page 8
For the six months ended September 30, 2014, the consolidated total production cost and cash cost per ounce of silver, net of by‐product credits, were $2.69 and negative $0.32 compared to $4.51 and $2.06, respectively, in the same prior year periods.
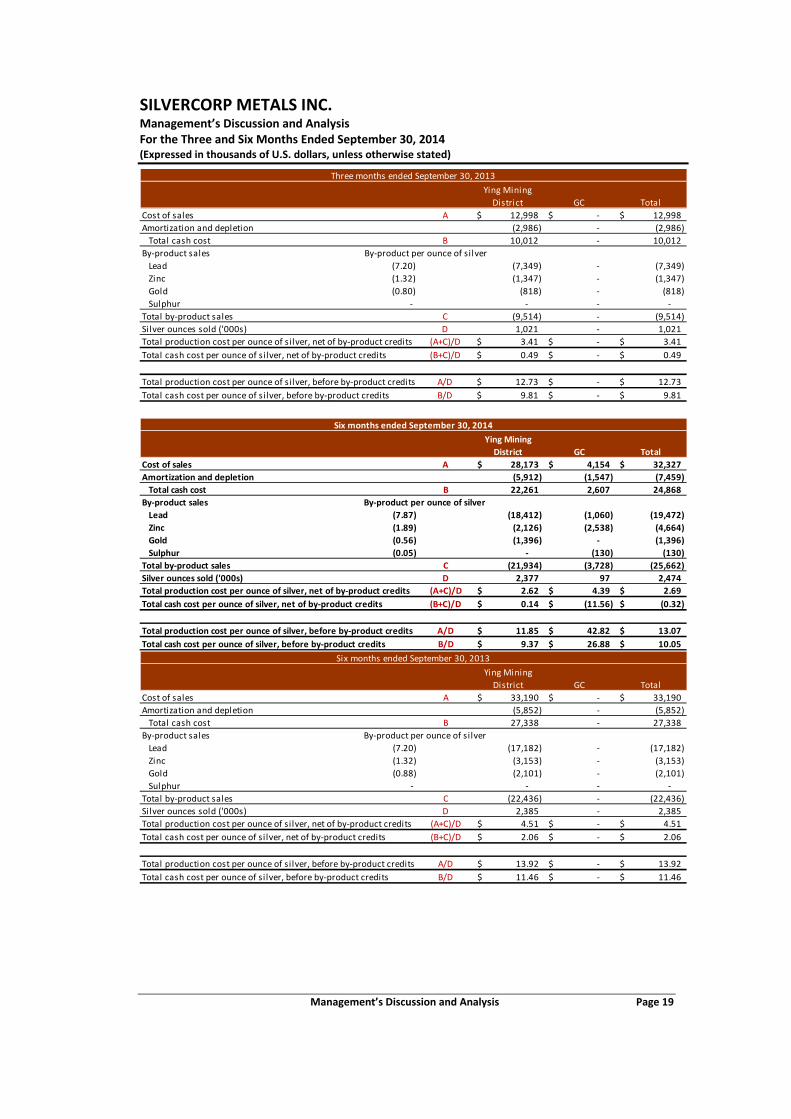
(e) All‐in Sustaining Cost per Ounce of Silver, Net of By‐Product Credits2
In Q2 Fiscal 2015, the consolidated all‐in sustaining cost per ounce of silver, net of by‐product credits is $9.64 compared to $16.50 in Q2 Fiscal 2014. The decrease compared to the prior year quarter is driven by production cost efficiencies, lower sustaining capital expenditures, less corporate overhead expenditures and higher by‐product credits. The cost control initiatives yielded positive results as per tonne cash mining costs decreased by 10% along with decreases of 14% and 19% in overhead general and administrative expense and sustaining capital expenditures, respectively, compared to Q2 Fiscal 2014.
For the six months ended September 30, 2014, the consolidated all‐in sustaining cost per ounce of silver, net of by‐product credits is $10.59 compared to $15.95 in the same prior year periods.
(f) Operation Review
(i) Ying Mining District
The Ying Mining District consists of four mines (SGX, HPG, TLP, and LM) and is the Company’s primary source of production.
In the prior fiscal year, the Company completed a comprehensive review at the Ying Mining District and enacted a series of improvements covering all aspects of operations including cost control, mine planning and strategy, contractor compensation contracts, dilution control, and performance‐based compensation package for mine management. As a result of the initiatives, operational results in this quarter continued to yield improved head grades, better dilution control, lower production costs, reduced labour head count and compensation, lower discretionary overhead costs and more efficient capital expenditures.
In Q2 Fiscal 2015, the total ore mined at the Ying Mining District was 197,135 tonnes compared to total ore production of 153,102 tonnes in Q2 Fiscal 2014. In the prior year quarter, ore production was impacted a miner shortage during the Company’s transition to a new compensation method for miners. In the current quarter, as a result of improved dilution control, silver and lead head grades at the Ying Mining District improved 3% and 14%, respectively, to 223 grams per tonne (“g/t”) for silver and 3.3% for lead from 217 g/t for silver and 2.9% for lead, respectively, in Q2 Fiscal 2014.
In Q2 Fiscal 2015, the Ying Mining District produced 1.3 million ounces of silver, 788 ounces of gold, 12.7 million pounds of lead, and 1.9 million pounds of zinc, compared to 1.0 million ounces of silver, 873 ounces of gold, 9.5 million pounds of lead, and 2.2 million pounds of zinc in Q2 Fiscal 2014. The increase in metals produced is mainly due to the higher ore output and improved head grades experienced in the quarter.
The cost control initiatives at the Ying Mining District continue to yield positive results in Q2 Fiscal 2015 where total and cash mining costs per tonne were $55.41 and $43.62, a 1% and 4% decrease, respectively, compared to $56.08 and $45.22, in Q2 Fiscal 2014. The all‐in sustaining cost per ounce of silver, net of by‐product credits, in this quarter, improved to $7.35 compared from $12.47 in the prior year quarter as a result of production cost efficiencies, lower overhead administrative costs, and higher by‐product sales.
In Q2 Fiscal 2015, total ore milled was 190,831 tonnes, an increase of 21% compared to 157,293 tonnes in Q2 Fiscal 2014. Per tonne cash milling costs were $12.77 compared to $14.89 in Q2 Fiscal 2014. The decrease in per tonne cash milling costs is due to the higher tonnage processed in this quarter.
2 Non‐IFRS measure, see section 9 for reconciliation

SILVERCORP METALS INC. Management’s Discussion and Analysis For the Three and Six Months Ended September 30, 2014 (Expressed in thousands of U.S. dollars, unless otherwise stated)
Management’s Discussion and Analysis Page 9
For the six months ended September 30, 2014, the total ore mined at the Ying Mining District was 370,619 tonnes compared to 386,359 tonnes in the same prior year period. Correspondingly, total ore milled was 360,311 tonnes compared to 393,466 tonnes. Head grades were 225 g/t for silver and 3.3% for lead compared to 207 g/t for silver and 2.8% for lead, respectively.
During the same time periods, the Ying Mining District produced 2.4 million ounces of silver, 1,610 ounces of gold, 24.2 million pounds of lead, and 3.2 million pounds of zinc, compared to 2.4 million ounces of silver, 2,155 ounces of gold, 22.6 million pounds of lead, and 5.1 million pounds of zinc in the prior year.
For the six months ended September 30, 2014, total and cash mining costs per tonne were $56.79 and $45.18, a decrease of 8% and 12%, respectively, compared to $61.62 and $51.18 in the same prior year period. The overall decrease in cash mining costs per tonne was mainly due to reductions in (i) mining preparation expenditures; (ii) labour and material costs due to improved dilution control; and (iii) mine administration costs. On a per tonne basis, labour costs decreased 38%, mine administration costs decreased 43% and mining preparation expenditures decreased 20%, offset by increases of 23% in raw materials cost and 5% in mining contractor’s cost, respectively, as compared to the six months ended September 30, 2013. During the same time periods, the all‐in sustaining cost per ounce of silver, net of by‐product credits, improved to $8.06 compared from $11.83 in the prior year.
In Q2 Fiscal 2015, the Company renewed the mining permit for its Ying (SGX) mine. The new mining permit for the Ying (SGX) mine is valid until September 2024. As part of the renewal requirement, a mine right fee in the amount of $17.4 million (RMB ¥107.04 million) will be paid in five annual installments to the Chinese government. The full amount of the mine right fee was capitalized in mineral rights and properties in this quarter with a corresponding liability for the amounts payable.
During the quarter, the Company completed approximately 18,000 metres (“m”) of horizontal tunnels, raises and declines. Excluding the capitalized mine right fee, total exploration and development expenditures for the Ying Mining District were $9.0 million compared to $8.5 million in Q2 Fiscal 2014. For the six months ended September 30, 2014, exploration and development expenditures were $17.1 million compared to $18.2 million in the same prior year period.
(ii) GC Mine
During the quarter, the GC mine commenced commercial production as operational results including output levesl (approximately 800 tonne per day), grades and recovery rates significantly and consistently achieved planned levels. The Company has completed all requirements for the Safety Production Permit and only the final documentation process is pending. The Company expects the permit issuance prior to the expiry of the temporary permit, which is now extended to the end of December 2014.
In Q2 Fiscal 2015, the total ore mined at the GC mine was 70,898 tonnes and total ore milled was 69,144 tonnes. The head grades at GC mine were 107 g/t for silver, 1.4% for lead, and 2.8% for zinc. In the quarter, the GC mine sold 97,000 ounces of silver, 1.4 million pounds of lead, 3.3 million pounds of zinc, and 11.3 million pounds of sulphur. As of September 30, 2014, the GC mine has approximately 530 tonnes of lead concentrate and 240 tonnes of zinc concentrate in inventory unsold.
In the quarter, total and cash mining cost per tonne were $51.69 and $29.25 respectively, while total and cash milling cost per tonne were $22.81 and $17.59.
In Q2 Fiscal 2015, $1.9 million (Q2 Fiscal 2014 ‐ $3.1 million) of exploration and development expenditures were incurred at the GC mine. For the six months ended September 30, 2014, $2.3 million (six months ended September 30, 2013 ‐ $9.3 million) of exploration and development expenditures were incurred.

SILVERCORP METALS INC. Management’s Discussion and Analysis For the Three and Six Months Ended September 30, 2014 (Expressed in thousands of U.S. dollars, unless otherwise stated)
Management’s Discussion and Analysis Page 10
(iii) BYP Mine
Certain capital upgrades are necessary at the BYP mine in order to sustain ongoing production, however, in consideration of the required expenditures and the current market environment, the Company has decided to defer such capital investments until a later time. As such, in August 2014, the Company put the BYP mine into care and maintenance and suspended mining activities. As the BYP mine is not viewed as a core asset, the Company is considering various strategic alternatives for this project.
In Q2 Fiscal 2015, the BYP mine processed 18,296 tonnes of ore compared to 20,073 tonnes in Q2 Fiscal 2014. Gold head grade for Q2 Fiscal 2015 was 2.3 g/t compared to 2.8 g/t in Q2 Fiscal 2014. The Company had negligible sales in the quarter and had inventory of approximately 1,300 tonnes of gold concentrate as of September 30, 2014. In Q2 Fiscal 2014, the BYP mine sold 2,140 ounces of gold.
For six months ended September 30, 2014, the BYP mine processed 48,844 tonnes of ore compared to 50,048 tonnes in the same prior year period. During the same time periods, the Company sold 2,711 ounces of gold compared to 4,478 ounces of gold in the prior year. Gold head grade were was 2.6 g/t compared to 2.9 g/t in prior year.
(iv) XHP Project
Since the prior fiscal year, activities at the XHP project have been suspended as part the Company’s cost saving measures.
4. Second Quarter Fiscal Year 2015 Financial Results
The tables below set out selected quarterly results for the past eight quarters: Sept 30, 2014 Jun 30, 2014 Mar 31, 2014 Dec 31, 2013
Sales $ 37,333 $ 30,616 $ 16,135 $ 23,970
Gross profit 18,894 15,653 6,945 10,469
Expenses and foreign exchange (5,901) (7,474) (3,717) (5,733)
Other items 1,196 141 (6,305) 708
Net income (loss) 9,614 4,635 (4,677) 3,144 Net income (loss), attributable to the shareholders of the Company 7,228 2,744 (4,541) 2,163
Basic earnings (loss) per share 0.04 0.02 (0.03) 0.01
Diluted earnings (loss) per share 0.04 0.02 (0.03) 0.01
Cash dividend declared 763 800 773 4,017 Cash dividend declared per share (CAD) 0.005 0.005 0.005 0.025
Sept 30, 2013 Jun 30, 2013 Mar 31, 2013 Dec 31, 2012
Sales $ 28,460 $ 39,835 $ 33,147 $ 58,717
Gross profit 13,637 17,353 17,087 37,476
Expenses and foreign exchange (9,188) (7,263) (6,396) (7,947)
Other items (65,790) 394 1,430 (8,631)
Net income (53,307) 6,484 8,391 10,631Net income, attributable to the shareholders of the Company (43,201) 4,562 6,361 5,236
Basic earnings per share (0.25) 0.03 0.04 0.03
Diluted earnings per share (0.25) 0.03 0.04 0.03
Cash dividend declared 4,152 4,173 4,204 4,291Cash dividend declared per share (CAD) 0.025 0.025 0.025 0.025

SILVERCORP METALS INC. Management’s Discussion and Analysis For the Three and Six Months Ended September 30, 2014 (Expressed in thousands of U.S. dollars, unless otherwise stated)
Management’s Discussion and Analysis Page 11
Financial results including sales, gross profit, net income, basic earnings per share, and diluted earnings per share are heavily influenced by changes in commodity prices, particularly, the silver price.
Net income attributable to the shareholders of the Company in Q2 Fiscal 2015 was $7.2 million, or $0.04 per share compared to a net loss of $43.2 million, or $0.25 per share in Q2 Fiscal 2014. For the six months ended September 30, 2014, net income was $10.0 million, or $0.06 per share compared to net loss of $38.6 million, or $0.23 per share in the same prior year period.
Net loss in Q2 Fiscal 2014 included impairment charges of $42.8 million, net of tax, attributable to the equity holders of the Company, which reduced the carrying value of the BYP mine, as well as the XBG and Silvertip projects, both of which were sold in the prior year.
Adjusted net loss3 for Q2 Fiscal 2014 was $0.4 million, or $0.00 per share. Adjusted net income4 for the six months ended September 30, 2013 was $4.2 million, or $0.02 per share. Adjusted net income or loss excludes non‐recurring or unusual non‐operational items, such as impairment of the Company’s mineral properties, and acts as a supplemental financial measure that provides a more complete assessment of the Company’s operations for the period.
In the current quarter, the Company’s financial results were mainly impacted by the following: (i) higher metals produced as silver, lead, and zinc production increased 32%, 48%, and 137% compared to the prior year quarter, which resulted in (ii) increased metal sales of $8.9 million or 31% compared to prior year quarter, of which $5.3 million was added from the commercial production at the GC mine, and (iii) overhead general and administrative spending was 14% less than the prior year quarter, offset by (iv) lower gold production and sales, as the BYP mine was put into care and maintenance in this quarter.
Sales in Q2 Fiscal 2015 increased by 31% to $37.3 million compared to $28.5 million in Q2 Fiscal 2014. Silver and gold sales represented $21.7 million and $0.7 million, respectively, while base metals represented $14.9 million of total sales in this quarter. This compares to silver, gold and base metals of $16.7 million, $3.1 million, and $8.7 million, respectively, in Q2 Fiscal 2014.
For the six months ended September 30, 2014, sales were $67.9 million compared to $68.3 million in the same prior year period.
Fluctuations in sales revenue are mainly dependent on metal production and realized metal prices. The net realized selling price is calculated using Shanghai Metal Exchange (“SME”) prices, less smelter charges and recovery, and a value added tax (“VAT”) at a rate of 17% (VAT is not applied to gold sales). The following table is a reconciliation of the Company’s net realized selling prices in Q2 Fiscal 2015, including a comparison with London Metal Exchange (“LME”) prices:
Cost of sales in Q2 Fiscal 2015 was $18.9 million compared to $14.8 million in Q2 Fiscal 2014. The cost of sales included cash costs of $14.2 million compared to $10.7 million in Q2 Fiscal 2014. The increase in cost of sales is mainly due to a 63% increase in ore production in the quarter, offset by a 7% decrease in per tonne production cost.
For the six months ended September 30, 2014, cost of sales was $33.9 million (cash costs ‐ $26.1 million) compared to $37.3 million (cash costs ‐ $29.6 million) in the same prior year period.
Gross profit in Q2 Fiscal 2015 was 49% compared to 48% in Q2 Fiscal 2014. For the six months ended September 30, 2014, gross profit was 50% compared to 45% in the same prior year period.
3 Non‐IFRS measure, see section 9 for reconciliation.
Q2 2015 Q2 2014 Q2 2015 Q2 2014 Q2 2015 Q2 2014 Q2 2015 Q2 2014
Net realized selling prices $ 16.12 $ 16.33 $ 871 $ 1,027 $ 0.77 $ 0.77 $ 0.75 $ 0.61
Add back: Value added taxes 2.74 2.78 ‐ ‐ 0.13 0.13 0.13 0.10
Add back: Smelter charges and recovery 2.42 2.51 417 320 0.14 0.15 0.34 0.38 SME $ 21.28 $ 21.62 $ 1,288 $ 1,347 $ 1.04 $ 1.05 $ 1.22 $ 1.09
LME $ 19.76 $ 21.32 $ 1,282 $ 1,327 $ 0.99 $ 0.95 $ 1.05 $ 0.84
Silver (in US$/ounce) Gold (in US$/ounce) Lead (in US$/pound) Zinc (in US$/pound)
SILVERCORP METALS INC. Management’s Discussion and Analysis For the Three and Six Months Ended September 30, 2014 (Expressed in thousands of U.S. dollars, unless otherwise stated)
Management’s Discussion and Analysis Page 12
General and administrative (“G&A”) expenses in Q2 Fiscal 2015 were $6.1 million, a decrease of 14% compared to $7.1 million in Q2 Fiscal 2014. For the six months ended September 30, 2014, G&A expenses were $10.9 million, a decrease of 25% compared to $14.6 million, in the same prior year period. The decrease was primarily a result of the Company’s cost reduction initiatives in response to the lower metal price environment. Main reductions were made in labour salaries, benefits and headcount as well as discretionary overhead spending. Significant items included in general and administrative expenses in Q2 Fiscal 2015 and six months ended September 30, 2014, respectively, are as follows:
(i) Office and administrative expenses of $2.1 million and $4.0 million (Q2 Fiscal 2014 ‐ $2.5 million, six months ended September 30, 2013 ‐ $5.7 million);
(ii) Salaries and benefits of $2.5 million and $3.9 million (Q2 Fiscal 2014 ‐ $2.2 million, six months ended September 30, 2013 ‐ $4.4 million);
(iii) Stock based compensation expense of $0.4 million and $0.8 million (Q2 Fiscal 2014 ‐ $0.6 million, six months ended September 30, 2013 ‐ $1.3 million); and
(iv) Professional fees of $0.4 million and $1.2 million (Q2 Fiscal 2014 ‐ $1.4 million, six months ended September 30, 2013 ‐ $2.4 million).
General exploration and property investigation expenses in Q2 Fiscal 2015 and six months ended September 30, 2014 were $0.7 million and $1.6 million compared to $0.8 million and $1.8 million in the same respective comparative periods.
Foreign exchange gain in Q2 Fiscal 2015 was $1.6 million compared to a loss of $0.8 million in Q2 Fiscal 2014. For the six months ended September 30, 2014, foreign exchange gain was $0.5 million compared to $1.1 million in the same prior year period. The foreign exchange gain or loss is mainly driven by the fluctuations of the RMB and US dollar against the functional currency of the entities.
Loss on disposal of plant and equipment in Q2 Fiscal 2015 and six months ended September 30, 2014 was $14 and $14, compared to $95 and $123 in the same respective comparative periods. The loss is related to the disposal of obsolete equipment.
Share of income in an associate in Q2 Fiscal 2015 was $90 (Q2 Fiscal 2014 – loss $139). For the six months ended September 30, 2014, share of loss was $42 compared to $153 in the same prior year period. This represents the Company’s equity pickup in New Pacific Metals Corp. (“New Pacific”). The Company recorded on the statement of income its proportionate share of New Pacific’s net gain or loss, as the Company is able to exercise significant influence over the financial and operating policies of New Pacific.
Loss on investments in Q2 Fiscal 2015 and six months ended September 30, 2014 was $nil and $15 compared to a gain of $31 and loss of $543 in the same comparative periods. The Company has acquired equity interests in other publicly‐traded mining companies on the open market or by participating in private placements. These equity interests, including common shares and warrants are for long‐term investment purpose. Due to their nature, warrants meet the definition of derivatives and are accounted for as “Fair value through profit and loss” (“FVTPL”). The fair value of warrants was determined using the Black‐Scholes pricing model as at the acquisition date as well as at each period end. Gain or loss in such securities, arising from changes in the fair value of the warrants, is included in net income for the period in which they arise.
Finance income in Q2 Fiscal 2015 and six months ended September 30, 2014 was $268 and $432 compared to $978 and $1,906 in the same respective comparative periods. The Company invests in high yield short‐term investments as well as long‐term corporate bonds.
Finance costs in Q2 Fiscal 2015 and six months ended September 30, 2014 were $39 and $71 compared to $33 and $66 in the same respective comparative periods. As the Company does not hold any

SILVERCORP METALS INC. Management’s Discussion and Analysis For the Three and Six Months Ended September 30, 2014 (Expressed in thousands of U.S. dollars, unless otherwise stated)
Management’s Discussion and Analysis Page 13
interest bearing debt, the finance cost in the current period relates to the unwinding of discount of environmental rehabilitation provision.
Income tax expense in Q2 Fiscal 2015 was $4.1 million compared to tax recovery of $8.0 million in Q2 Fiscal 2014. The income tax expense recorded in Q2 Fiscal 2015 included current income tax expense of $3.1 million (Q2 Fiscal 2014 – $2.6 million) and deferred income tax expense of $1.0 million (Q2 Fiscal 2014 – recovery $10.6 million). Current income tax expense increased due to higher taxable income. For the six months ended September 30, 2014, income tax expense was $7.8 million compared to tax recovery of $4.0 million in the same prior year period. The income tax expense recorded in the six months ended September 30, 2014, included current income tax expense of $6.0 million (six months ended September 30, 2013 – $4.6 million) and deferred income tax expense of $1.8 million (six months ended September 30, 2013 ‐ $8.7 million recovery). Income tax recovery in the prior year period includes a recovery from impairment of mineral rights and properties of $12.0 million.
5. Liquidity and Capital Resources
Cash and cash equivalents and short‐term investments as at September 30, 2014 were $85.6 million.
Working capital as at September 30, 2014 was $53.3 million.
Cash flows provided by operating activities were $20.1 million or $0.12 per share in Q2 Fiscal 2015 compared to $5.7 million or $0.03 per share in Q2 Fiscal 2014. For the six months ended September 30, 2014, cash flows provided by operating activities were $33.9 million or $0.20 per share compared to $23.4 million or $0.14 per share in the same prior year period. The increase in cash flows from operations is mainly due to higher operating earnings and movement in non‐cash operating working capital.
Cash flows used in investing activities were $11.8 million in Q2 Fiscal 2015, comprising mainly of cash used in capital expenditures of $10.0 million offset and net purchases of short‐term investments of $1.9 million. In Q2 Fiscal 2014, cash flows used in investing activities were $17.9 million comprising mainly of cash used in capital expenditures of $18.8 million and net purchases of short‐term investments of $2.4 million offset by proceeds from the sale of a subsidiary of $3.3 million.
For the six months ended September 30, 2014, cash flows used in investing activities were $18.0 million, comprising mainly of cash used in capital expenditures of $17.9 million. In the same prior year period, cash flows used in investing activities were $10.5 million comprising mainly of cash used in capital expenditures of $38.0 million offset by net redemptions of short‐term investments of $22.6 million and proceeds from the sale of a subsidiary of $4.9 million.
Cash flows used in financing activities were $3.4 million in Q2 Fiscal 2015, comprising mainly of distributions to non‐controlling interests of $2.6 million and cash dividends paid of $0.8 million. In Q2 Fiscal 2014, cash flows used in financing activities were $4.0 million, comprising mainly of cash dividends paid of $4.1 million.
For the six months ended September 30, 2014, cash flows used in financing activities were $4.1 million, comprising mainly of distributions to non‐controlling interests of $2.6 million and cash dividends paid of $1.6 million. In the same prior year period, cash flows used in financing activities were $9.4 million, comprising mainly of cash dividends paid of $8.3 million and payments made to related parties of $1.2 million.
Contractual commitments and contingencies not disclosed elsewhere in this Management’s Discussion and Analysis are as follows:
Total Less than 1 year 1‐5 years After 5 years
Operating leases 6,196$ 428$ 3,673$ 2,095$
Commitments 6,418$ ‐$ ‐$ 6,418$

SILVERCORP METALS INC. Management’s Discussion and Analysis For the Three and Six Months Ended September 30, 2014 (Expressed in thousands of U.S. dollars, unless otherwise stated)
Management’s Discussion and Analysis Page 14
As of September 30, 2014, the Company has two office rental agreements totaling $6.2 million for the next nine years and commitments of $6.4 million related to the GC mine.
Due to the size, complexity and nature of the Company’s operations, various legal and tax matters arise in the ordinary course of business. The Company accrues for such items when a liability is both probable and the amount can be reasonably estimated. As at September 30, 2014 and 2013, no contingent liabilities were accrued.
On January 24, 2013, the Company issued a news release announcing its awareness of a class action lawsuit against the Company and certain senior officers commenced on December 24, 2012, in New York by shareholders of the Company and lead class plaintiffs Charles A. Burns and Dale Hachiya, relating to alleged violations of the Securities Exchange Act of 1934 for an unspecified amount of damages (the “U.S. Class Action”). The Company was not successful in a motion to dismiss the lawsuit on July 16, 2013. Silvercorp has denied, and continues to deny, that they have violated the federal securities laws or any other laws or have otherwise misled investors as alleged in the U.S. Class Action and continues to deny specifically each and all of the claims alleged. In addition, Silvercorp maintains that they have meritorious defenses to all claims alleged. Nonetheless, taking into account the risks and costs inherent in any litigation, especially in complex cases such as this U.S. Class Action, Silvercorp, has concluded that further challenge of the U.S. Class Action could be protracted, burdensome, expensive, and distracting. Silvercorp has therefore determined that it is desirable and beneficial that the U.S. Action be settled. As a result of a mediation process, Silvercorp has agreed to pay US$14 million to fully resolve the case on behalf of all defendants. The Company expects that the insurance coverage will be sufficient to cover the settlement in the U.S. Class Action. Approval of the settlement is still subject to final approval by the court following notice to the proposed class.
Available sources of funding
The Company does not have unlimited resources and its future capital requirements will depend on many factors, including, among others, cash flow from operations. To the extent that its existing resources and the funds generated by future income are insufficient to fund the Company’s operations, the Company may need to raise additional funds through public or private debt or equity financing. If additional funds are raised through the issuance of equity securities, the percentage ownership of current shareholders will be reduced and such equity securities may have rights, preferences or privileges senior to those of the holders of the Company’s common stock. No assurance can be given that additional financing will be available or that, if available, can be obtained on terms favourable to the Company and its shareholders. If adequate funds are not available, the Company may be required to delay, limit or eliminate some or all of its proposed operations. The Company believes it has sufficient capital to meet its cash needs for the next 12 months, including the costs of compliance with continuing reporting requirements.
6. Financial Instruments and Related Risks
The Company manages its exposure to financial risks, including liquidity risk, foreign exchange risk, interest rate risk, credit risk and equity price risk in accordance with its risk management framework. The Company’s Board of Directors has overall responsibility for the establishment and oversight of the Company’s risk management framework and reviews the Company’s policies on an ongoing basis.
(a) Fair value
The Company classifies its fair value measurements within a fair value hierarchy, which reflects the significance of the inputs used in making the measurements as defined in IFRS 7, Financial Instruments: Disclosures (“IFRS 7”).
Level 1 – Unadjusted quoted prices at the measurement date for identical assets or liabilities in active markets.
Level 2 – Observable inputs other than quoted prices included in Level 1, such as quoted prices for

SILVERCORP METALS INC. Management’s Discussion and Analysis For the Three and Six Months Ended September 30, 2014 (Expressed in thousands of U.S. dollars, unless otherwise stated)
Management’s Discussion and Analysis Page 15
similar assets and liabilities in active markets; quoted prices for identical or similar assets and liabilities in markets that are not active; or other inputs that are observable or can be corroborated by observable market data.
Level 3 – Unobservable inputs which are supported by little or no market activity.
The following table sets forth the Company’s financial assets that are measured at fair value on a recurring basis by level within the fair value hierarchy at September 30, 2014 that are not otherwise disclosed. As required by IFRS 7, assets and liabilities are classified in their entirety based on the lowest level of input that is significant to the fair value measurement. As of September 30, 2014 and March 31, 2014, the Company did not have financial liabilities measured at fair value on a recurring basis.
Fair value of the other financial instruments excluded from the table above approximates their carrying amount as of September 30, 2014 and March 31, 2014, respectively.
Reconciliation of level 3 fair value measurement of financial assets is as follows:
(b) Liquidity risk
Liquidity risk is the risk that the Company will not be able to meet its short term business requirements. The Company has in place a planning and budgeting process to help determine the funds required to support the Company’s normal operating requirements on an ongoing basis and its expansion plans.
In the normal course of business, the Company enters into contracts that give rise to commitments for future minimum payments. The following summarizes the remaining contractual maturities of the Company’s financial liabilities.
(c) Foreign exchange risk
The Company undertakes transactions denominated in foreign currencies and is exposed to foreign exchange risk arising from such transactions.
The Company conducts its mining operations in China and thereby the majority of the Company’s assets, liabilities, revenues and expenses are denominated in RMB, which is tied to a basket of currencies of
Level 1 Level 2 Level 3 Total
Financial assets
Cash and cash equivalents 72,674$ ‐$ ‐$ 72,674$
Common shares of publicly traded companies 1,381 ‐ ‐ 1,381
Yongning Smelting Co. Ltd.(1) ‐ ‐ ‐ ‐
Jinduicheng Xise (Canada) Co. Ltd.(1) ‐ ‐ ‐ ‐
Warrants ‐ ‐ ‐ ‐
Financial liabilities
Mine right fee payable ‐$ 17,439$ ‐$ 17,439$ (1) Level 3 financia l ins trument
Yongning Smelting Jinduicheng Total
Balance at April 1, 2013 9,653$ ‐$ 9,653$
Other comprehensive loss arising on revaluation (9,651) ‐ (9,651)
Foreign exchange impact (2) ‐ (2)
Balance at March 31, 2014 ‐$ ‐$ ‐$
Balance at September 30, 2014 ‐$ ‐$ ‐$
Fair value through other comprehensive income
March 31, 2014
Within a year 2‐3 years 4‐5 years Total Total
Mine right fee payable 3,584$ 8,146$ 5,709$ 17,439$ ‐$
Accounts payable and accrued l iabil ities 30,174 ‐ ‐ 30,174 23,802
Dividends payable 762 ‐ ‐ 762 773
34,520$ 8,146$ 5,709$ 48,375$ 24,575$
September 30, 2014

SILVERCORP METALS INC. Management’s Discussion and Analysis For the Three and Six Months Ended September 30, 2014 (Expressed in thousands of U.S. dollars, unless otherwise stated)
Management’s Discussion and Analysis Page 16
China’s largest trading partners.
The Company currently does not engage in foreign currency hedging and the exposure of the Company’s financial assets and financial liabilities to foreign exchange risk is summarized as follows:
As at September 30, 2014, with other variables unchanged, a 1% strengthening (weakening) of the RMB against the USD would have increased (decreased) net income by approximately $0.5 million.
As at September 30, 2014, with other variables unchanged, a 1% strengthening (weakening) of the CAD against the USD would have decreased (increased) net income by approximately $0.1 million.
(d) Interest rate risk
The Company is exposed to interest rate risk on its cash equivalents, short term investments, and outstanding mine right fee payable. As at September 30, 2014, all of its interest‐bearing cash equivalents and short term investments earn interest at market rates that are fixed to maturity or at variable interest rate with terms of less than one year. The Company monitors its exposure to changes in interest rates on cash equivalents and short term investments. Due to the short term nature of the financial instruments, fluctuations in interest rates would not have a significant impact on the Company’s after‐tax net income. The outstanding mine right fee payable is subject to a floating interest rate based on the prevailing commercial bank loan interest rate in China. The Company monitors its exposure to interest rates. Chinese central bank has maintained stable interest rates to ensure economic stability, with less than 1% fluctuation in base interest rate in the last five years. Interest incurred by the Company on the mine right fee payable will be capitalized as it relates to renewal of mining permits. No interest has been capitalized as of September 30, 2014.
(e) Credit risk
Credit risk is the risk that one party to a financial instrument will fail to discharge an obligation and cause the other party to incur a financial loss. The Company is exposed to credit risk primarily associated to accounts receivable, due from related parties, cash and cash equivalents and short term investments. The carrying amount of assets included on the balance sheet represents the maximum credit exposure. The Company undertakes credit evaluations on counterparties as necessary and has monitoring processes intended to mitigate credit risks. The Company has trade receivables from its major customers primarily in China engaged in the mining and milling of base and polymetallic metals. The historical level of customer default is zero and aging of trade receivables are no more than 180 days, and, as a result, the credit risk associated with trade receivables from customers as at September 30, 2014 is considered to be immaterial. There were no amounts in receivables which were past due at September 30, 2014 (at March 31, 2014 ‐ $nil) for which no provision is recognized.
(f) Equity price risk
The Company holds certain marketable securities that will fluctuate in value as a result of trading on Canadian financial markets. As the Company’s marketable securities holding are mainly in mining companies, the value will also fluctuate based on commodity prices. Based upon the Company’s portfolio at September 30, 2014, a 10% increase (decrease) in the market price of the securities held, ignoring any foreign currency effects would have resulted in an increase (decrease) to comprehensive income of approximately $0.2 million.
September 30, 2014 March 31, 2014
Financial assets denominated in U.S. Dollars 18,044$ 979$
Financial assets denominated in Chinese RMB 58,240$ 57,358$

SILVERCORP METALS INC. Management’s Discussion and Analysis For the Three and Six Months Ended September 30, 2014 (Expressed in thousands of U.S. dollars, unless otherwise stated)
Management’s Discussion and Analysis Page 17
7. Off‐Balance Sheet Arrangements
The Company does not have any off‐balance sheet arrangements.
8. Transactions with Related Parties
Related party transactions not disclosed elsewhere in this MD&A are as follows:
(a) According to a services and administrative costs reallocation agreement between the Company and
NUX, the Company recovers costs for services rendered to NUX and expenses incurred on behalf of NUX. During the three and six months ended September 30, 2014, the Company recovered $81 and $138, respectively (for three and six months ended September 30, 2013 ‐ $158 and $269, respectively) from NUX for services rendered and expenses incurred on behalf of NUX. The costs recovered from NUX were recorded as a direct reduction of general and administrative expenses on the consolidated statements of income.
(b) Henan Non‐ferrous Geology Bureau (“Henan Geology Bureau”) is a 22.5% equity interest holder of Henan Found.
(c) For the three and six months ended September 30, 2014, the Company paid $nil and $nil, respectively (for three and six months ended September 30, 2013 ‐ $102 and $204, respectively) consulting fees to McBrighton Consulting Ltd., a private consulting services company controlled by a director of the Company.
(d) For the three and six months ended September 30, 2014, the Company paid $91 and $217, respectively (for three and six months ended September 30, 2013 ‐ $nil) consulting fees to Greensea Management Ltd., a private consulting services company controlled by a director of the Company.
(e) For the three and six months ended September 30, 2014, the Company paid $nil (for three and six months ended September 30, 2013 ‐ $nil and $102, respectively) consulting fees to R. Feng Consulting Ltd., a private consulting services company controlled by a director of the Company.
(f) For the three and six months ended September 30, 2014, the Company paid and accrued $140 and $327, respectively (for three and six months ended September 30, 2013 ‐ $148 and $206, respectively) consulting fees to Parkside Management Limited, a private consulting services company controlled by a director of the Company.
(g) The Company rents a Beijing office from a relative of a director and officer of the Company for $12 (RMB 74,712) per month. For the three and six months ended September 30, 2014, total rents were $36 and $72, respectively (for three and six months ended September 30, 2013 ‐ $36 and $72, respectively).
(h) Henan Xinhui Mining Co., Ltd. (“Henan Xinhui”) is a 20% equity interest holder of Henan Huawei.
(i) GRT Mining Investment (Beijing) Co., Ltd. (“GRT”), a private company controlled by a relative of a director and officer, is a 5% equity interest holder of Guangdong Found.
Transactions with related parties are made on normal commercial terms and are considered to be at
Due from related parties September 30, 2014 March 31, 2014
NUX (a) 90$ 48$
Henan Non‐ferrous Geology Bureau (b) 25 20
115$ 68$
Due to related parties September 30, 2014 March 31, 2014
Parkside Management Ltd. (f) 273$ 281$

SILVERCORP METALS INC. Management’s Discussion and Analysis For the Three and Six Months Ended September 30, 2014 (Expressed in thousands of U.S. dollars, unless otherwise stated)
Management’s Discussion and Analysis Page 18
arm’s length. The balances with related parties are unsecured, non‐interest bearing, and due on demand.
9. Alternative Performance (Non‐IFRS) Measures
The following alternative performance measures are used by the Company to manage and evaluate operating performance of the Company’s mines and are widely reported in the silver mining industry as benchmarks for performance, but do not have standardized meaning. Accordingly, it is intended to provide additional information and should not be considered in isolation or as a substitute for measures of performance prepared in accordance with IFRS. To facilitate a better understanding of these measures, the following tables provides the reconciliation of these measures to the financial statements for the three and six months ended September 30, 2014 and 2013:
(a) Cash and Total Cost per Ounce of Silver The Company assesses this measure in a manner that isolates the impacts of silver production volumes, the by‐product credits, and operating costs fluctuations. The Company believes these measures provide investors and analysts with useful information about the Company’s underlying cash costs of operations and the impact of by‐product credits on the Company’s cost structure, operating profitability and ability to generate cash flows. The Company includes by‐product credits from lead, zinc and gold, as the Company considers these metals is incidental to the silver production process and as a result, the cost to produce the silver is reduced. Cash and total costs on a by‐product basis are calculated by deducting by‐product lead, zinc and gold sales revenues from the Company’s cash and total cost of sales, respectively. The following table provides a reconciliation of cash and total cost per ounce of silver, net of by‐product credits for the three and six months ended September 30, 2014 and 2013:
Ying Mining
District GC Total
Cost of sales A 14,723$ 4,154$ 18,877$
Amortization and depletion (3,141) (1,547) (4,688)
Total cash cost B 11,582 2,607 14,189
By‐product sales By‐product per ounce of silver
Lead (8.03) (9,759) (1,060) (10,819)
Zinc (2.89) (1,364) (2,538) (3,902)
Gold (0.49) (655) ‐ (655)
Sulphur (0.10) ‐ (130) (130)
Total by‐product sales C (11,778) (3,728) (15,506)
Silver ounces sold ('000s) D 1,251 97 1,348
Total production cost per ounce of silver, net of by‐product credits (A+C)/D 2.35$ 4.39$ 2.50$
Total cash cost per ounce of silver, net of by‐product credits (B+C)/D (0.16)$ (11.56)$ (0.98)$
Total production cost per ounce of silver, before by‐product credits A/D 11.77$ 42.82$ 14.00$
Total cash cost per ounce of silver, before by‐product credits B/D 9.26$ 26.88$ 10.53$
Three months ended September 30, 2014
SILVERCORP METALS INC. Management’s Discussion and Analysis For the Three and Six Months Ended September 30, 2014 (Expressed in thousands of U.S. dollars, unless otherwise stated)
Management’s Discussion and Analysis Page 19
Ying Mining
District GC Total
Cost of sales A 12,998$ ‐$ 12,998$
Amortization and depletion (2,986) ‐ (2,986)
Total cash cost B 10,012 ‐ 10,012
By‐product sales By‐product per ounce of silver
Lead (7.20) (7,349) ‐ (7,349)
Zinc (1.32) (1,347) ‐ (1,347)
Gold (0.80) (818) ‐ (818)
Sulphur ‐ ‐ ‐ ‐
Total by‐product sales C (9,514) ‐ (9,514)
Silver ounces sold ('000s) D 1,021 ‐ 1,021
Total production cost per ounce of silver, net of by‐product credits (A+C)/D 3.41$ ‐$ 3.41$
Total cash cost per ounce of silver, net of by‐product credits (B+C)/D 0.49$ ‐$ 0.49$
Total production cost per ounce of silver, before by‐product credits A/D 12.73$ ‐$ 12.73$
Total cash cost per ounce of silver, before by‐product credits B/D 9.81$ ‐$ 9.81$
Three months ended September 30, 2013
Ying Mining
District GC Total
Cost of sales A 28,173$ 4,154$ 32,327$
Amortization and depletion (5,912) (1,547) (7,459)
Total cash cost B 22,261 2,607 24,868
By‐product sales By‐product per ounce of silver
Lead (7.87) (18,412) (1,060) (19,472)
Zinc (1.89) (2,126) (2,538) (4,664)
Gold (0.56) (1,396) ‐ (1,396)
Sulphur (0.05) ‐ (130) (130)
Total by‐product sales C (21,934) (3,728) (25,662)
Silver ounces sold ('000s) D 2,377 97 2,474
Total production cost per ounce of silver, net of by‐product credits (A+C)/D 2.62$ 4.39$ 2.69$
Total cash cost per ounce of silver, net of by‐product credits (B+C)/D 0.14$ (11.56)$ (0.32)$
Total production cost per ounce of silver, before by‐product credits A/D 11.85$ 42.82$ 13.07$
Total cash cost per ounce of silver, before by‐product credits B/D 9.37$ 26.88$ 10.05$
Six months ended September 30, 2014
Ying Mining
District GC Total
Cost of sales A 33,190$ ‐$ 33,190$
Amortization and depletion (5,852) ‐ (5,852)
Total cash cost B 27,338 ‐ 27,338
By‐product sales By‐product per ounce of silver
Lead (7.20) (17,182) ‐ (17,182)
Zinc (1.32) (3,153) ‐ (3,153)
Gold (0.88) (2,101) ‐ (2,101)
Sulphur ‐ ‐ ‐ ‐
Total by‐product sales C (22,436) ‐ (22,436)
Silver ounces sold ('000s) D 2,385 ‐ 2,385
Total production cost per ounce of silver, net of by‐product credits (A+C)/D 4.51$ ‐$ 4.51$
Total cash cost per ounce of silver, net of by‐product credits (B+C)/D 2.06$ ‐$ 2.06$
Total production cost per ounce of silver, before by‐product credits A/D 13.92$ ‐$ 13.92$
Total cash cost per ounce of silver, before by‐product credits B/D 11.46$ ‐$ 11.46$
Six months ended September 30, 2013

SILVERCORP METALS INC. Management’s Discussion and Analysis For the Three and Six Months Ended September 30, 2014 (Expressed in thousands of U.S. dollars, unless otherwise stated)
Management’s Discussion and Analysis Page 20
(b) Cash and Total Cost per Ounce of Gold (BYP Mine)
(c) All‐in & All‐in Sustaining Cost per Ounce of Silver All‐in sustaining cost (“AISC”) per ounce and all‐in cost (“AIC”) per ounce of silver are non‐IFRS measures calculated based on guidance developed by the World Gold Council in an effort to provide a comparable standard within the precious metal industry. The measures do not have standardized meaning and should not be considered in isolation or as a substitute for measures of performance prepared in accordance to IFRS. These measures are used by the Company to manage and evaluate operating performance at each of the Company’s mining units and consolidated group, and are widely reported in the silver mining industry as a benchmark for performance. AISC is an extension of the “cash cost” metric and provides a comprehensive measure of the Company’s operating performance and ability to generate cash flows. AISC is based on the Company’s cash production costs, net of by‐product sales, and further include corporate general and administrative expense, general exploration expense, reclamation cost accretion, and sustaining capital expenditures. The Company believes that this measure represents the total sustainable costs of producing silver from current operations. AIC further extends the AISC metric by including investment capital expenditures, which are deemed expansionary in nature that result in an increase in asset life, expanded mineral resources and reserves,
Three months
ended September
30, 2014
Six months ended
September 30,
2014
Cost of sales A 16$ 1,530$
Amortization and depletion 11 (300)
Total cash cost B 27 1,230
By‐product sales
Zinc ‐ ‐
Total by‐product sales C ‐ ‐
Gold ounces sold ('000s) D 0.1 2.7
Total production cost per ounce of gold, net of by‐product credits (A+C)/D 229$ 565$
Total cash cost per ounce of gold, net of by‐product credits (B+C)/D 386$ 454$
Total production cost per ounce of gold, before by‐product credits A/D 229$ 565$
Total cash cost per ounce of gold, before by‐product credits B/D 386$ 454$
BYP Mine
Three months
ended September
30, 2013
Six months ended
September 30,
2013
Cost of sales A 1,825$ 4,115$
Amortization and depletion (784) (1,873)
Total cash cost B 1,041 2,242
By‐product sales
Zinc ‐ (153)
Total by‐product sales C ‐ (153)
Gold ounces sold ('000s) D 2.1 4.5
Total production cost per ounce of gold, net of by‐product credits (A+C)/D 853$ 884$
Total cash cost per ounce of gold, net of by‐product credits (B+C)/D 486$ 466$
Total production cost per ounce of gold, before by‐product credits A/D 853$ 919$
Total cash cost per ounce of gold, before by‐product credits B/D 486$ 500$
BYP Mine

SILVERCORP METALS INC. Management’s Discussion and Analysis For the Three and Six Months Ended September 30, 2014 (Expressed in thousands of U.S. dollars, unless otherwise stated)
Management’s Discussion and Analysis Page 21
or higher capacity and productivity. All capital expenditures at the Company’s pre‐production developing projects – GC mine and XHP project – are considered to be investment capital by nature. The following tables provide a detailed reconciliation of these measures for the three and six months ended September 30, 2014 and 2013:
Three months ended September 30, 2014
Ying Mining
District BYP GC
Developing
Projects Corporate Total
Total cash cost, net of by‐product credits (196)$ 28$ (1,122)$ ‐$ ‐$ (1,290)$
General & administrative 1,384 734 876 108 2,997 6,099
General exploration 726 2 1 11 ‐ 740
Reclamation accretion 25 6 6 2 ‐ 39
Sustaining capital 7,251 24 ‐ ‐ 163 7,438
All‐in sustaining cost, net of by‐product credits A 9,190$ 794$ (239)$ 121$ 3,160$ 13,026$
Investment capital 19,773 100 1,053 (153) ‐ 20,773
All‐in cost, net of by‐product credits B 28,963$ 894$ 814$ (32)$ 3,160$ 33,799$
Ounces of si lver sold1
C 1,251 4 97 ‐ ‐ 1,352
All‐in sustaining cost per ounce of silver, net of by‐
product credits A/C 7.35$ 198.50$ (2.46)$ ‐$ ‐$ 9.64$
All‐in cost per ounce of silver, net of by‐product
credits B/C 23.15$ 223.50$ 8.39$ ‐$ ‐$ 25.02$ 1 BYP gold ounces converted to silver equivalent using a ratio of 50:1.
Three months ended September 30, 2013
Ying Mining
District BYP
Developing
Projects Corporate Total
Total cash cost, net of by‐product credits 499$ 1,040$ ‐$ ‐$ 1,539$
General & administrative 2,475 491 323 3,766 7,055
General exploration 762 3 ‐ ‐ 765
Reclamation accretion 25 6 3 ‐ 34
Sustaining capital 8,970 274 ‐ (17) 9,227
All‐in sustaining cost, net of by‐product credits A 12,731$ 1,814$ 326$ 3,749$ 18,620$
Investment capital 2,857 144 6,607 ‐ 9,608
All‐in cost, net of by‐product credits B 15,588$ 1,958$ 6,933$ 3,749$ 28,228$
Ounces of silver sold1
C 1,021 107 ‐ ‐ 1,128
All‐in sustaining cost per ounce of silver, net of by‐
product credits A/C 12.47$ 16.95$ ‐$ ‐$ 16.50$
All‐in cost per ounce of silver, net of by‐product
credits B/C 15.27$ 18.30$ ‐$ ‐$ 25.02$ 1 BYP gold ounces converted to silver equivalent using a ratio of 50:1.
Six months ended September 30, 2014
Ying Mining
District BYP GC
Developing
Projects Corporate Total
Total cash cost, net of by‐product credits 326$ 1,230$ (1,122)$ ‐$ ‐$ 434$
General & administrative 3,219 1,005 876 209 5,557 10,866
General exploration 1,606 31 1 11 ‐ 1,649
Reclamation accretion 49 12 6 4 ‐ 71
Sustaining capital 13,952 504 ‐ ‐ 164 14,620
All‐in sustaining cost, net of by‐product credits A 19,152$ 2,782$ (239)$ 224$ 5,721$ 27,640$
Investment capital 22,230 232 1,505 525 ‐ 24,492
All‐in cost, net of by‐product credits B 41,382$ 3,014$ 1,266$ 749$ 5,721$ 52,132$
Ounces of si lver sold1
C 2,377 136 97 ‐ ‐ 2,610
All‐in sustaining cost per ounce of silver, net of by‐
product credits A/C 8.06$ 20.46$ (2.46)$ ‐$ ‐$ 10.59$
All‐in cost per ounce of silver, net of by‐product
credits B/C 17.41$ 22.16$ 13.05$ ‐$ ‐$ 19.98$ 1 BYP gold ounces converted to silver equivalent using a ratio of 50:1.
SILVERCORP METALS INC. Management’s Discussion and Analysis For the Three and Six Months Ended September 30, 2014 (Expressed in thousands of U.S. dollars, unless otherwise stated)
Management’s Discussion and Analysis Page 22
(d) Average Production Cost
The Company assesses average production cost as the total production cost on a co‐product basis. This is calculated by allocating the Company’s total cost of sales to each co‐product based on the ratio of actual sales volumes multiplied by realized sales prices. The following table provides a reconciliation of average production cost for the three and six months ended September 30, 2014 and 2013:
Six months ended September 30, 2014
Ying Mining
District BYP
Developing
Projects Corporate Total
Total cash cost, net of by‐product credits 4,902$ 2,088$ ‐$ ‐$ 6,990$
General & administrative 5,203 932 814 7,607 14,556
General exploration 1,780 32 ‐ ‐ 1,812
Reclamation accretion 49 12 5 ‐ 66
Sustaining capital 16,290 1,901 ‐ 150 18,341
All‐in sustaining cost, net of by‐product credits A 28,224$ 4,965$ 819$ 7,757$ 41,765$
Investment capital 7,838 343 16,638 ‐ 24,819
All‐in cost, net of by‐product credits B 36,062$ 5,308$ 17,457$ 7,757$ 66,584$
Ounces of silver sold1
C 2,385 224 10 ‐ 2,619
All‐in sustaining cost per ounce of silver, net of by‐
product credits A/C 11.83$ 22.17$ 81.90$ ‐$ 15.95$
All‐in cost per ounce of silver, net of by‐product
credits B/C 15.12$ 23.70$ 1,745.70$ ‐$ 25.42$ 1 BYP gold ounces converted to silver equivalent using a ratio of 50:1.
Average Production Cost (in 000's)
Direct mining and milling cost 14,217
Depreciation, amortization and depletion 4,677
Cost of sales 18,894
Silver Gold Lead Zinc Sulphur Total
Metals revenue 21,731 749 10,819 3,902 130 37,331
Ratio of metals sold 58% 2% 30% 10% 0% 100%
Cost of sales allocated to metals 10,999 379 5,668 1,975 66 18,894
Metals produced ('000s) 1,348 0.9 14,093 5,203 11,343
Average production cost ($/unit) 8.16$ 421$ 0.39$ 0.38$ 0.01$
Three months ended September 30, 2014
Average Production Cost (in 000's)
Direct mining and milling cost 10,675
Depreciation, amortization and depletion 4,148
Cost of sales 14,823
Silver Gold Lead Zinc Sulphur Total
Metals revenue 16,669 3,095 7,349 1,347 ‐ 28,460
Ratio of metals sold 59% 11% 25% 5% 0% 100%
Cost of sales allocated to metals 8,682 1,612 3,706 702 ‐ 14,823
Metals produced ('000s) 1,021 3.0 9,519 2,199 ‐
Average production cost ($/unit) 8.50$ 535$ 0.40$ 0.32$ ‐$
Three months ended September 30, 2013
Average Production Cost (in 000's)
Direct mining and milling cost 26,098
Depreciation, amortization and depletion 7,759
Cost of sales 33,857
Silver Gold Lead Zinc Sulphur Total
Metals revenue 39,509 4,171 19,472 4,664 130 67,946
Ratio of metals sold 58% 6% 29% 7% 0% 100%
Cost of sales allocated to metals 19,687 2,078 9,703 2,324 65 33,857
Metals produced ('000s) 2,474 4.3 25,622 6,414 11,343
Average production cost ($/unit) 7.96$ 481$ 0.38$ 0.36$ 0.01$
Six months ended September 30, 2014

SILVERCORP METALS INC. Management’s Discussion and Analysis For the Three and Six Months Ended September 30, 2014 (Expressed in thousands of U.S. dollars, unless otherwise stated)
Management’s Discussion and Analysis Page 23
(e) Production Costs per Tonne
Average Production Cost (in 000's)
Direct mining and milling cost 29,579
Depreciation, amortization and depletion 7,726
Cost of sales 37,305
Silver Gold Lead Zinc Sulphur Total
Metals revenue 40,760 7,047 17,182 3,306 ‐ 68,295
Ratio of metals sold 60% 10% 25% 5% 0% 100%
Cost of sales allocated to metals 22,264 3,849 9,385 1,806 ‐ 37,305
Metals produced1 ('000s) 2,385 6.7 22,582 5,407 ‐
Average production cost ($/unit) 9.33$ 580$ 0.42$ 0.33$ ‐$ 1 Does not include metals produced from development tunnelling ore at the X mines.
Six months ended September 30, 2013
Three months ended September 30, 2014 Total costs Tonnage of ore Per tonne costs
('000 US$) (tonne) (USD/tonne)
Cash mining costs 10,914$ 278,377 39.21$
Non‐cash mining costs 3,983 278,377 14.31
Shipping costs 863 278,377 3.10
Cash mill ing costs 3,847 278,271 13.82
Non‐cash mill ing costs 780 278,271 2.80
Total 20,387$ 73.24$
Add: stockpile and concentrate inventory ‐ Beginning 1,503
Less: stockpile and concentrate inventory ‐ Ending (2,524)
Adjustment for foreign exchange movement (472)
Cost of sales 18,894$
Three months ended September 30, 2013 Total costs Tonnage of ore Per tonne costs
('000 US$) (tonne) (USD/tonne)
Cash mining costs 7,421$ 170,756 43.46$
Non‐cash mining costs 2,236 170,756 13.09
Shipping costs 784 170,756 4.59
Cash mill ing costs 2,658 177,366 14.99
Non‐cash mill ing costs 408 177,366 2.30
Total 13,507$ 78.43$
Add: stockpile and concentrate inventory ‐ Beginning 2,154
Less: stockpile and concentrate inventory ‐ Ending (1,148)
Adjustment for foreign exchange movement 310
Cost of sales 14,823$
SIx months ended September 30, 2014 Total costs Tonnage of ore Per tonne costs
('000 US$) (tonne) (USD/tonne)
Cash mining costs 19,882$ 488,064 40.74$
Non‐cash mining costs 6,246 488,064 12.80
Shipping costs 1,691 488,064 3.46
Cash mill ing costs 6,314 478,299 13.20
Non‐cash mill ing costs 1,206 478,299 2.52
Total 35,339$ 72.72$
Add: stockpile and concentrate inventory ‐ Beginning 1,109
Less: stockpile and concentrate inventory ‐ Ending (2,524)
Adjustment for foreign exchange movement (67)
Cost of sales 33,857$

SILVERCORP METALS INC. Management’s Discussion and Analysis For the Three and Six Months Ended September 30, 2014 (Expressed in thousands of U.S. dollars, unless otherwise stated)
Management’s Discussion and Analysis Page 24
10. Critical Accounting Policies and Estimates
The preparation of financial statements in conformity with IFRS requires management to make estimates and assumptions that affect the amounts reported on the consolidated financial statements. These critical accounting estimates represent management estimates that are uncertain and any changes in these estimates could materially impact the Company’s financial statements. Management continuously reviews its estimates and assumptions using the most current information available. The Company’s critical accounting policies and estimates are described in Note 2 of the unaudited condensed consolidated interim financial statements as of and ended September 30, 2014, as well as the audited consolidated financial statements as of and ended March 31, 2014.
(i) Ore reserve and mineral resource estimates Ore reserves are estimates of the amount of ore that can be economically and legally extracted from the Company’s mining properties. The Company estimates its ore reserves and mineral resources based on information compiled by appropriately qualified persons relating to the geological and technical data on the size, depth, shape and grade of the ore body and suitable production techniques and recovery rates. Such an analysis requires complex geological judgements to interpret the data. The estimation of recoverable reserves is based upon factors such as estimates of foreign exchange rates, commodity prices, future capital requirements, and production costs along with geological assumptions and judgements made in estimating the size and grade of the ore body.
The Company estimates ore reserves in accordance with National Instrument 43‐101, “Standards of Disclosure for Mineral Projects”, issued by the Canadian Securities Administrators. There are numerous assumptions including:
- Future production estimates – which include proved and probable reserves, resource estimates and committed expansions;
- Expected future commodity prices, based on current market price, forward prices and the Company’s assessment of the long‐term average price; and
- Future cash costs of production, capital expenditure and rehabilitation obligations.
As the economic assumptions used may change and as additional geological information is produced during the operation of a mine, estimates of reserves may change. Such changes may impact the Company’s reported financial position and results which include:
- The carrying value of mineral rights and properties and plant and equipment may be affected due to changes in estimated future cash flows;
- Depreciation and depletion charges in net income may change where such charges are determined using the units of production method, or where the useful life of the related assets change; and
- The recognition and carrying value of deferred income tax assets may change due to changes in the judgements regarding the existence of such assets and in estimates of the likely recovery of such assets.
Six months ended September 30, 2013 Total costs Tonnage of ore1
Per tonne costs
('000 US$) (tonne) (USD/tonne)
Cash mining costs 20,886$ 262,332 79.62$
Non‐cash mining costs 5,486 262,332 20.91
Shipping costs 1,715 262,332 6.54
Cash mill ing costs 5,905 266,148 22.19
Non‐cash mill ing costs 807 266,148 3.03
Total 34,799$ 132.29$
Add: stockpile and concentrate inventory ‐ Beginning 3,416
Less: stockpile and concentrate inventory ‐ Ending (1,148)
Adjustment for foreign exchange movement 238
Cost of sales 37,305$ 1Excluding development tunnelling ore at the X Mines.

SILVERCORP METALS INC. Management’s Discussion and Analysis For the Three and Six Months Ended September 30, 2014 (Expressed in thousands of U.S. dollars, unless otherwise stated)
Management’s Discussion and Analysis Page 25
(ii) Impairment of assets Where an indicator of impairment exists, a formal estimate of the recoverable amount is made, which is considered to be the higher of the fair value less costs to sell and value in use. These assessments require the use of estimates and assumptions such as long‐term commodity prices (considering current and historical prices, price trends and related factors), discount rates, operating costs, future capital requirements, closure and rehabilitation costs, exploration potential, reserves and operating performance (which includes production and sales volumes). These estimates and assumptions are subject to risk and uncertainty. Therefore, there is a possibility that changes in circumstances will impact these projections, which may impact the recoverable amount of assets and/or cash generating units. Fair value is determined as the amount that would be obtained from the sale of the asset in an arm’s length transaction between knowledgeable and willing parties. Fair value for mineral assets is generally determined as the present value of estimated future cash flows arising from the continued use of the asset, which includes estimates such as the cost of future expansion plans and eventual disposal, using assumptions that an independent market participant may take into account. Cash flows are discounted to their present value using a discount rate that reflects current market assessments of the time value of money and the risks specific to the asset.
11. Changes in Accounting Standards
IFRIC 21 – Levies, an interpretation of IAS 37 was issued by the IASB in May 2013 and provides interpretation on when to recognize a liability for a levi imposed by a government and clarifies the criteria for the recognition of a liability. IFRIC 21 is effective for annual periods commencing on or after January 1, 2014. Effective April 1, 2014, the Company has adopted the standard. The adoption did not have a material impact on the condensed consolidated interim financial statements. IFRS 15 – Revenue from contracts with customers, the final standard on revenue from contacts with customers was issued on May 28, 2014 and is effective for annual reporting periods beginning after December 15, 2016 for public entities with early adoption not permitted. Entities have the option of using either a full retrospective or a modified retrospective approach to adopt the guidance. The Company is assessing impact of this standard.
12. Other MD&A Requirements
Additional information relating to the Company:
(a) may be found on SEDAR at www.sedar.com;
(b) may be found at the Company’s web‐site www.silvercorpmetals.com;
(c) may be found in the Company’s Annual Information Form; and,
(d) is also provided in the Company’s annual audited consolidated financial statements as of March 31, 2014.
13. Outstanding Share Data
As at the date of this MD&A, the following securities were outstanding:
(a) Share Capital
Authorized ‐ unlimited number of common shares without par value
Issued and outstanding – 170,883,808 common shares with a recorded value of $233.5 million
Shares subject to escrow or pooling agreements ‐ $nil.
(b) Options
As at the date of this report, the outstanding options comprise the following:
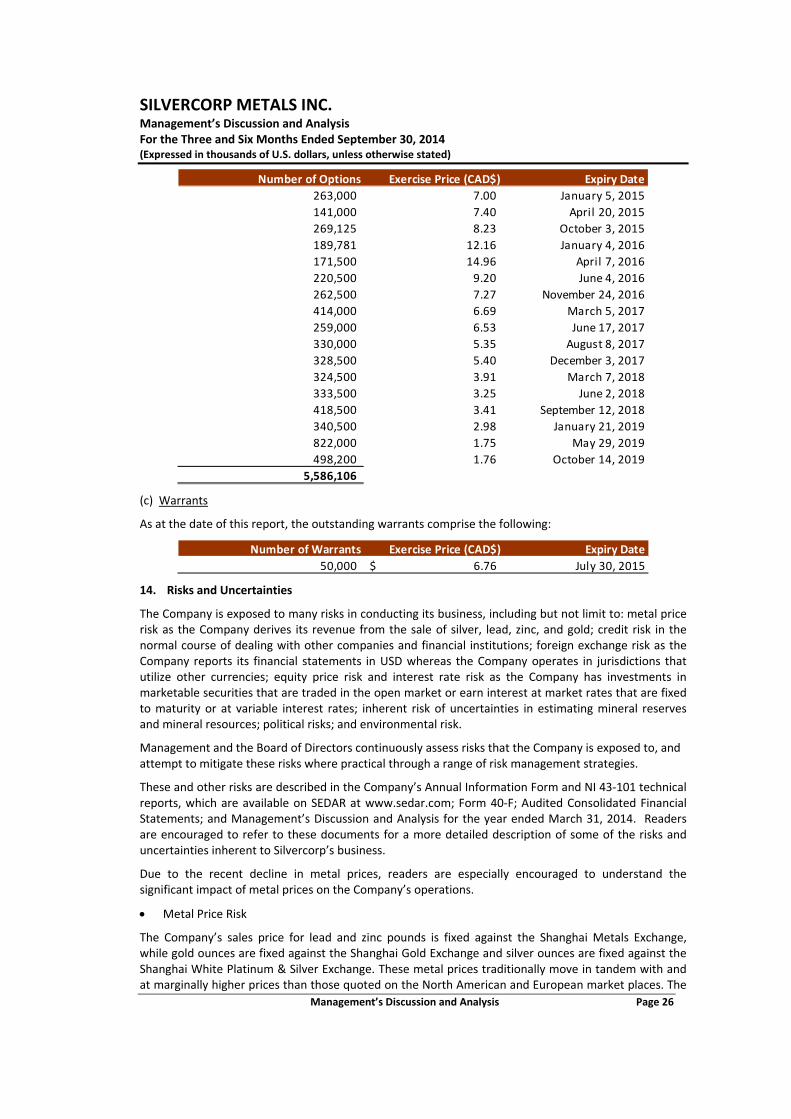
SILVERCORP METALS INC. Management’s Discussion and Analysis For the Three and Six Months Ended September 30, 2014 (Expressed in thousands of U.S. dollars, unless otherwise stated)
Management’s Discussion and Analysis Page 26
(c) Warrants
As at the date of this report, the outstanding warrants comprise the following:
14. Risks and Uncertainties
The Company is exposed to many risks in conducting its business, including but not limit to: metal price risk as the Company derives its revenue from the sale of silver, lead, zinc, and gold; credit risk in the normal course of dealing with other companies and financial institutions; foreign exchange risk as the Company reports its financial statements in USD whereas the Company operates in jurisdictions that utilize other currencies; equity price risk and interest rate risk as the Company has investments in marketable securities that are traded in the open market or earn interest at market rates that are fixed to maturity or at variable interest rates; inherent risk of uncertainties in estimating mineral reserves and mineral resources; political risks; and environmental risk.
Management and the Board of Directors continuously assess risks that the Company is exposed to, and attempt to mitigate these risks where practical through a range of risk management strategies.
These and other risks are described in the Company’s Annual Information Form and NI 43‐101 technical reports, which are available on SEDAR at www.sedar.com; Form 40‐F; Audited Consolidated Financial Statements; and Management’s Discussion and Analysis for the year ended March 31, 2014. Readers are encouraged to refer to these documents for a more detailed description of some of the risks and uncertainties inherent to Silvercorp’s business.
Due to the recent decline in metal prices, readers are especially encouraged to understand the significant impact of metal prices on the Company’s operations.
Metal Price Risk
The Company’s sales price for lead and zinc pounds is fixed against the Shanghai Metals Exchange, while gold ounces are fixed against the Shanghai Gold Exchange and silver ounces are fixed against the Shanghai White Platinum & Silver Exchange. These metal prices traditionally move in tandem with and at marginally higher prices than those quoted on the North American and European market places. The
Number of Options Exercise Price (CAD$) Expiry Date
263,000 7.00 January 5, 2015
141,000 7.40 April 20, 2015
269,125 8.23 October 3, 2015
189,781 12.16 January 4, 2016
171,500 14.96 April 7, 2016
220,500 9.20 June 4, 2016
262,500 7.27 November 24, 2016
414,000 6.69 March 5, 2017
259,000 6.53 June 17, 2017
330,000 5.35 August 8, 2017
328,500 5.40 December 3, 2017
324,500 3.91 March 7, 2018
333,500 3.25 June 2, 2018
418,500 3.41 September 12, 2018
340,500 2.98 January 21, 2019
822,000 1.75 May 29, 2019
498,200 1.76 October 14, 2019
5,586,106
Number of Warrants Exercise Price (CAD$) Expiry Date
50,000 6.76$ July 30, 2015
SILVERCORP METALS INC. Management’s Discussion and Analysis For the Three and Six Months Ended September 30, 2014 (Expressed in thousands of U.S. dollars, unless otherwise stated)
Management’s Discussion and Analysis Page 27
Company’s revenues are expected to be in large part derived from the mining and sale of silver, lead, zinc, and gold contained in metal concentrates. The prices of those commodities has fluctuated widely, particularly in recent years, and are affected by numerous factors beyond the Company’s control including international and regional economic and political conditions, expectations of inflation; currency exchange fluctuations; interest rates; global or regional supply and demand for jewellery and industrial products containing silver and other metals; sale of silver and other metals by central banks and other holders, speculators and producers of silver and other metals; availability and costs of metal substitutes; and increased production due to new mine developments and improved mining and production methods. The price of base and precious metals may have a significant influence on the market price of the Company’s shares and the value of the properties. The effect of these factors on the price of base and precious metals, and therefore the viability of the Company’s exploration projects, cannot be accurately predicted.
If silver and other metals prices were to decline significantly or for an extended period of time, the Company may be unable to continue operations, develop the properties or fulfil obligations under agreements with the Company’s joint venture partners or under its permits or licenses.
15. Disclosure Controls and Procedures
Disclosure controls and procedures are designed to provide reasonable assurance that material information is gathered and reported to senior management, including the Chief Executive Officer (“CEO”) and the Chief Financial Officer (“CFO”), as appropriate to allow for timely decision about public disclosure.
Management, including the CEO and CFO, has evaluated the effectiveness of the design and operation of the Company’s disclosure controls and procedures as at September 30, 2014, as defined in the rules of the U.S. Securities and Exchange Commission and Canadian Securities Administration. The evaluation included documentation review, enquiries and other procedures considered by management to be appropriate in the circumstances. Based on this evaluation, management concluded that the disclosure controls and procedures (as defined in Rule 13a‐15(e) under Securities Exchange Act of 1934) are effective in providing reasonable assurance that the information required to be disclosed in annual filings, interim filings, and other reports we filed or submitted under United States and Canadian securities legislation was recorded, processed, summarized and reported within the time periods specified in those rules.
16. Changes in Internal Control over Financial Reporting
There was no change in the Company’s internal control over financial reporting that occurred during the quarter that has materially affected or is reasonably likely to materially affect, its internal control over financial reporting.
17. Directors and Officers
As at the date of this report, the Company’s Directors and Officers are as follows:
Directors Officers
Rui Feng, Director, Chairman Myles J. Gao, Director, President & CEO
Myles J. Gao, Director, President & CEO Maria Tang, Chief Financial Officer
Yikang Liu, Director Lorne Waldman, Senior Vice President
Earl Drake, Director Peter Torn, Corporate Secretary & General Counsel
Paul Simpson, Director
David Kong, Director
Malcolm Swallow, Director

SILVERCORP METALS INC. Management’s Discussion and Analysis For the Three and Six Months Ended September 30, 2014 (Expressed in thousands of U.S. dollars, unless otherwise stated)
Management’s Discussion and Analysis Page 28
Myles J. Gao, P.Geo., President & CEO of Silvercorp, is a Qualified Person for Silvercorp under NI 43‐101 and has reviewed and given consent to the technical information contained in this MD&A.
Forward Looking Statements
Certain of the statements and information in this MD&A constitute “forward‐looking statements” within the meaning of the United States Private Securities Litigation Reform Act of 1995 and “forward‐looking information” within the meaning of applicable Canadian provincial securities laws. Any statements or information that express or involve discussions with respect to predictions, expectations, beliefs, plans, projections, objectives, assumptions or future events or performance (often, but not always, using words or phrases such as “expects”, “is expected”, “anticipates”, “believes”, “plans”, “projects”, “estimates”, “assumes”, “intends”, “strategies”, “targets”, “goals”, “forecasts”, “objectives”, “budgets”, “schedules”, “potential” or variations thereof or stating that certain actions, events or results “may”, “could”, “would”, “might” or “will” be taken, occur or be achieved, or the negative of any of these terms and similar expressions) are not statements of historical fact and may be forward‐looking statements or information. Forward‐looking statements or information relate to, among other things:
• the price of silver and other metals;
• estimates of the Company’s revenues and capital expenditures;
• estimated ore production and grades from the Company’s mines in the Ying Mining District; and;
• timing of receipt of permits and regulatory approvals.
Forward‐looking statements or information are subject to a variety of known and unknown risks, uncertainties and other factors that could cause actual events or results to differ from those reflected in the forward‐looking statements or information, including, without limitation, risks relating to,
• fluctuating commodity prices;
• fluctuating currency exchange rates;
• increasing labour costs;
• exploration and development programs;
• feasibility and engineering reports;
• permits and licenses;
• operations and political conditions;
• regulatory environment in China and Canada;
• environmental risks; and
• risks and hazards of mining operations.
This list is not exhaustive of the factors that may affect any of the Company’s forward‐looking statements or information. Forward‐looking statements or information are statements about the future and are inherently uncertain, and actual achievements of the Company or other future events or conditions may differ materially from those reflected in the forward‐looking statements or information due to a variety of risks, uncertainties and other factors, including, without limitation, those referred to in this MD&A under the heading “Risks and Uncertainties” and elsewhere. Although the Company has attempted to identify important factors that could cause actual results to differ materially, there may be other factors that cause results not to be as anticipated, estimated, described or intended. Accordingly, readers should not place undue reliance on forward‐looking statements or information.
The Company’s forward‐looking statements and information are based on the assumptions, beliefs, expectations and opinions of management as of the date of this MD&A, and other than as required by applicable securities laws, the Company does not assume any obligation to update forward‐looking statements and information if circumstances or management’s assumptions, beliefs, expectations or opinions should change, or changes in any other events affecting such statements or information. For the reasons set forth above, investors should not place undue reliance on forward‐looking statements and information.