si la annual management report - core.ac.uk · — mr adriano graziosi, secretary-general of the...
TRANSCRIPT

si la ANNUAL
MANAGEMENT REPORT 199;
OFFICE FOR OFFICIAL PUBLICATION: OF THE EUROPEAN COMMUNITIE:


• * • "k EUR Ά·
• op • * * *
OFFICE FOR OFFICIAL PUBLICATIONS OF THE EUROPEAN COMMUNITIES
THIRTIETH ANNUAL MANAGEMENT REPORT
1998

A great deal of additional information on the European Union is available on the Internet. It can be accessed through the Europa server (http://europa.eu.int).
Cataloguing data can be found at the end of this publication.
Luxembourg: Office for Official Publications of the European Communities, 1999
ISBN 92-828-4272-X
© European Communities, 1999
Reproduction is authorised provided the source is acknowledged.
Printed in Luxembourg
PRINTED ON WHITE CHLORINE-FREE PAPER

Contents
Page
Introduction 7
1998 —Main trends 10
Main indicators of Publications Office activity, 1993-98 12
1. Publications and other Publications Office products . . . . 13 1.1. Official Journal 15
1.1.1. General 15 1.1.2. Production 15
1.1.2.1. Official Journal 15 1.1.2.2. Budget documents 16 1.1.2.3. Decentralised bodies 16
1.1.3. OJ L and C CD-ROM 17 1.1.4. EUR-Lex CD-ROM 17 1.1.5. OJ S CD-ROM 17 1.1.6. Other CD-ROMs 17
1.2. Other publications 21 1.2.1. General 21 1.2.2. Production 21 1.2.3. Analysis of output 22 1.2.4. Official documents 23
1.3. Databases and CELEX 23 1.3.1. CELEX 23
1.3.1.1. CELEX + 24 1.3.2. IDEA 24 1.3.3. EUDOR 24 1.3.4. Documentary publications 25
1.3.4.1. Tables, Directory and catalogues 25 1.3.4.2. Minicatalogue 25 1.3.4.3. Eurovoc Thesaurus 25 1.3.4.4. Electronic Archive (ARCEL) 26
1.3.5. Consolidation of Community legislation 26 1.4. Electronic publishing and Internet dissemination 26
1.4.1. Introduction 26 1.4.2. Highlights of 1998 26 1.4.3. Operation of the 'Electronic publishing and Internet
dissemination'Unit (OP/5) 27 1.4.4. Detailed activity report 27
1.4.4.1. Producing multimedia publications 27 1.4.4.2. Management of Internet services 29 1.4.4.3. Organising subcontracting 31 1.4.4.4. Quality management 31 1.4.4.5. Interinstitutional cooperation 32 1.4.4.6. Technology watch 32

2. Sales policy and results 33
2.1. General organisation 35 2.1.1. Sales networks 35
2.1.1.1. Conventional and electronic publications. . 35 2.1.1.2. Document delivery 36
2.1.2. Invoicing 36 2.1.3. Stock management, orders 36 2.1.4. Free distribution 37
2.1.4.1. Distribution to relay centres 37 2.1.4.2. Orders from officials of the institutions . . . 37
2.2. Sales promotion 38 2.2.1. Fairs and exhibitions 38
2.2.1.1. Direct participation by the Office 38 2.2.1.2. Representation by a third party 38
2.2.2. Promotional activities 38 2.2.3. Marketing operations 40 2.2.4. EUR-OPNews 40
2.2.4.1. Distribution 40 2.2.4.2. Publications Office on the Internet 40
2.3. Information campaigns 40 2.3.1. Visits and presentations 40 2.3.2. Info-Points Europe, Luxembourg 41
2.4. Customer support 41 2.4.1. Training courses and help-desk 41
2.5. Sales results 42 2.5.1. Publications 42
2.5.1.1. Periodicals 42 2.5.1.2. New titles and best-sellers 46 2.5.1.3. Off-line products 48
2.5.2. Databases 50 2.5.2.1. Developments and customer trends . . . . 50 2.5.2.2. Invoicing of on-line products 52
2.6. Review and prospects 54
3. Coédition and copyright 57
3.1. Introduction 59
3.2. Coédition . . 59
3.3. Copyright 59
3.4. Fixed payments and royalties 59
3.5. European Publishers' Forum 59 3.5.1. Members 59 3.5.2. Meetings 59 3.5.3. Catalogue 60 3.5.4. Newsletter and website 60 3.5.5. Results 60

4. Activities of the accounts off ice 61 4.1. Budget accounting 63 4.2. Commercial accounting 77
4.2.1. Operating results 77 4.2.1.1. Balance sheet at 31 December 1998. . . . 77 4.2.1.2. Profit-and-loss account at 31 December 1998 77
4.2.2. Breakdown of sales revenue 80 4.2.3. Breakdown by type of publications 80
5. Activities of the technical departments 81
5.1. General services 83 5.1.1. Buildings 83 5.1.2. Canteen 83 5.1.3. Switchboard 83 5.1.4. Mail room/messengers/drivers 83 5.1.5. Physical inventory of property 83
5.2. Workshops 84 5.2.1. Printshop 84
5.2.1.1. Pre-press 84 5.2.1.2. Printing 84 5.2.1.3. Post-printing (finishing, stitching) 84
5.2.2. LOD (industrial photocopiers) 85 5.3. Stock management and distribution 88
5.3.1. Service contracts 88 5.3.2. Equipment 88 5.3.3. File management 88 5.3.4. Basic distribution 88 5.3.5. Execution of orders 90 5.3.6. Stock management 92 5.3.7. Summary 92 5.3.8. Micrography 93 5.3.9. Video 93
5.4. Computer applications 93 5.4.1. Operations 94 5.4.2. Project management 94 5.4.3. User support 95 5.4.4. Quality control and security 95
6. The award and management of contracts concluded by the Office on its own behalf and on behalf of the institutions 97 6.1. Introduction 99 6.2. Activities by sector 99
6.2.1. Official Journal and related products 99 6.2.2. Publications other than the Official Journal 106
6.3. Contracts for services and supplies chargeable to the Publications Office budget 107

7. Publications Office staff and personnel matters 109 7.1. Officials 111 7.2. Temporary staff 113 7.3. Auxiliary staff 113 7.4. Back-up and freelance proof-readers 114 7.5. Training 115
7.5.1. Training plan 115 7.5.2. Attendance at training courses in 1998 115
7.6. Consultations with staff representatives 116 7.7. Consultations with trade unions and professional bodies. . 117
8. Application of the current provisions relating to long-and medium-term translations 119
Annex I — CELEX (the interinstitutional computerised documentation system for Community law) 123
Annex II — Balance sheet and prof it-and-loss accounts . . . . 139

Introduction
The Publications Office is an interinstitutional body governed by a Management Committee consisting of the Secretaries-General of the institutions, the Registrar of the Court of Justice and the Director-General for Personnel and Administration of the Commission. It is responsible for all the editorial work required to enable the institutions and other bodies of the European Union to meet their publishing obligations.
This Management Report, drawn up by the Management Committee pursuant to Article 4 of the Decision establishing the Office for Official Publications of the European Communities, provides the institutions with an account of the Office's activities during the year under review.
The members of the Management Committee in 1998 were:
— Mr Julian Priestley, Secretary-General of the European Parliament;
— Mr Jürgen Trumpf, Secretary-General of the Council;
— Mr Carlo Trojan, Secretary-General of the Commission and Chairman of the Management Committee;
— Mr Steffen Smidt, Director-General for Personnel and Administration of the Commission;
— Mr Roger Grass, Registrar of the Court of Justice;
— Mr Edouard Ruppert, Secretary-General of the Court of Auditors;
— Mr Adriano Graziosi, Secretary-General of the Economic and Social Committee (until 30 September 1998); as from 1 October 1998: Mr Patrick Venturini, Secretary-General of the Economic and Social Committee;
— Mr Dietrich Pause, Secretary-General of the Committee of the Regions.
The Management Committee met on 26 June (full members) and on 10 February, 17 March, 9 June (ad hoc meeting) and 13 October (substitute members). In addition, 20 written procedures were submitted to the Management Committee in 1998.
The Management Committee devoted particular attention to reformulating the basic texts establishing the Office, following observations made by the Court of Auditors. These texts, which have been brought into line with technological developments and made compatible with the transparency called for by the institutions, have been carefully studied by the legal services and the adoption procedure is still being examined.
The preliminary draft budget for 1998 that the Management Committee submitted to the budgetary authority was slightly up on the previous year (+ 2.3 %). This in fact represented zero growth, given the increase in the cost of living. The Management Committee repeated its previous request for a strengthening of the management structures, and the conversion of a number of posts to higher categories to bring conceptual and management capacities more into line with the requirements resulting from the qualitative and quantitative developments in the role of the Office.
One of the Office's main concerns was how to publish the Official Journal given the technological upheavals in electronic publishing, which were changing users' habits. After authorising the publication of the S Supplement in electronic form only as from 1 July 1998, the Management

Committee kept a close eye on the development of EUR-Lex — a system for free daily distribution of the L and C Series of the Official Journal to the public via the Internet. Similarly, the Management Committee asked the Office to set up an integrated system for access by staff of the institutions to Community legislation in force (CELEX+), with the twin aims of improving accessibility and saving money, since the potential of this system is such that the free distribution of the paper copies of the Official Journal within the institutions can be gradually reduced or totally phased out. At the request of the Management Committee, this initiative, which may be extended to external users, was taken a step further with the introduction of a quarterly CD-ROM edition of the Official Journal, incorporating the advantages of CELEX, and a monthly CD-ROM extending the EUR-Lex service. This CD-ROM is primarily intended to replace the microfiche edition, which is to be discontinued in 2000.
Along the same lines, with a view to rationalising and making savings and in response to a request by the European Parliament in its capacity as budgetary authority the Management Committee instructed the Office to identify, in collaboration with the institutions, types of C Series text that could be published or made accessible in electronic form only. These initiatives called for thorough examination, by the interinstitutional working group on the content and structure of the Official Journal, the present and future legal value of electronic publishing and its links with publishing in paper form. One of the aspects considered was the difficulty of managing two parallel dissemination systems — one free, the other not — and defining their respective scope.
With a view to making the Office's electronic publishing service forthe institutions more efficient, the Management Committee authorised an invitation to tender to establish new contractual arrangements for multimedia publications and Internet publishing.
The Management Committee also kept a very close eye on the invitation to tender to establish new contractual arrangements forthe production of the Official Journal on all the currently available media.
The system for consolidating Community law was revised. Following the approval of a report submitted by the Commission to the European Parliament around the middle of the year, proposing among other things that the Office take charge of all the consolidation work, the Management Committee decided to set up an interinstitutional group to coordinate the work and instructed the Office to launch an invitation to tender for legal experts to check the consistency of the consolidated texts.
The Management Committee endeavoured to push forward the interinstitutional Eurolook project and authorised the Office to play an active role in the Greffe 2000 project for developing a single electronic exchange format for all publications involved in the legislative process, and establishing a system for the structured collection of information for the publication of legal texts.
The Management Committee also kept track of interinstitutional cooperation on Internet publishing and consolidated the Office's coordinating function.
The Management Committee decided in principle that a new consolidated edition of the Treaties should be published immediately after the final ratification of the Treaty of Amsterdam.
Relations with the staff of the Office were also the subject of particular attention during the course of the year. The Chairman held a meeting for

dialogue with representatives of the unions and professional organisations, and at the beginning of the year the Management Committee met staff representatives, particularly with a view to considering the budget for the next year.

1998 — Main trends
In 1998 the publishing strategy of the institutions was chiefly geared to transparency, getting closer to the general public, and making information more accessible. A marked increase in free distribution was a side-effect of this.
These new ideas, resulting from the increased impact of the Internet and multimedia on the world of publishing (the number of files available to the public was 107 % up on 1997), have led the Office to give considerable thought to its fundamental activities and to ways of adapting its structure and procedures to deal with them most effectively.
Making information available on electronic media or in 'dematerialised' form (EUR-Lex, CELEX, CD-ROM etc.) has found its place alongside traditional publishing on paper, and use of these new media is steadily increasing.
In 1978, the Management Committee decided to introduce a Supplement to the Official Journal. Twenty years later, in July 1998, the paper edition of this series was abandoned in favour of the CD-ROM launched in 1997, and the on-line edition (Tenders Electronic Daily—TED). The changeover from paper to CD-ROM and the renegotiation of the terms of contract with the firm responsible for processing notices of invitation to tender have permitted savings of more than ECU 10 million, or 11.48 % compared with 1997.
At the instigation of the Management Committee, the Office continued its efforts to achieve optimum efficiency in the production of the various forms of its main publication, the Official journal of the European Communities. The new contractual arrangements forthe production of the Official Journal cover the various types of production and permit substantial savings on production costs. The same principles (striving for savings and efficiency) have been applied in the development of new contractual arrangements for multimedia publications, which are a boom area.
Disregarding the Supplement to the Official Journal, the numberof pages of which are no longer significant in an all-electronic context, the number of pages produced for all the other publications increased slightly. The search for increased transparency concerning the activities of the European Union was reflected in practice by an increase in legal and obligatory publications (+ 5.62 % for the L Series of the OJ and +10.78 % for the C Series) at the expense of other types (-1.7 %). In most cases, the electronic editions are still a supplement rather than an alternative to the paper editions, and there is an increasing trend towards publishing both editions together.
The Office took part in redefining the principles of the Commission's publication programme. This resulted, among other things, in a considerable increase in publishing on demand, which is a source of substantial savings given that it involves expenditure only if there are prospects of revenue, and there are no storage and physical handling costs.
The sectors most affected by the institutions' change of strategy have been sales and distribution. The growing trend towards free Community information, particularly where on-line products are concerned (EUR-Lex, ECLAS), has been reflected in a drop in the number of paid subscriptions (-13.22 %) and has called into question the role and viability of the Office's
10

network of intermediaries. This decline will become more pronounced, especially when TED, hitherto a major source of revenue, becomes available free of charge as from 1 January 1999.
As every year, the Office endeavoured to make maximum use of the budgetary resources allocated to it, with the out-turn of the budget reaching 99.68 % of the available appropriations. The high rate of occupation of posts also underlines the need for optimum utilisation of human resources.
The year ended with a large-scale operation in the form of Official Journal L 359, which contains the Council regulation fixing conversion rates between the euro and the national currencies of the 11 Member States that have adopted it. It was published simultaneously on paper and on the Internet (EUR-Lex) on 31 December less than one hour after its adoption by the Council.
On the evening of 31 December, the President of the Commission formally presented this historic Official Journal at the Publications Office in the presence of numerous personalities including Luxembourg's honorary Prime Minister, Pierre Werner — one of the fathers of the euro — and the current Luxembourg Prime Minister, Jean-Claude Juncker.
The success of this operation is the result of extremely painstaking organisation by the Commission, the Council and the Publications Office.
11

ro Main indicators of Publications Office activity, 1993-98
Publication Number of pages produced Number of pages in the OJ S Number of notices published in the OJ S Number of publications produced Services invoiced (ecus) (1) (*) Multimedia — Number of files opened
Sales/distribution Number of paying subscribers Invoiced sales (ecus) (') Number of orders processed Number of copies sent
Operation Budgetary expenditure (ecus) (') (3) Staff
1993
857 525 291 336 67 192
5 127 106 584 968
61 758 15 700 943
35 770 44 736 221
42 279 005 463
1994
1 002 413 437 000
96 340 5 633
117 517 566
67 370 19 829 781
39 179 56 870 522
43 905 400 465
1995
1 028 830 749 802 127 770
6 566 127 710 666
67 458 20 559 426
37 477 49 314 033
52 446 281 525
1996
1 213413 703 395 140 576
8 028 151 395 557
60 987 22 891 125
36 948 63 717 149
53 044 454 525
1997
1 274 284 748 704 155 186
9 544 139 043 264
71
58 134 (6) 22 217 383
40 588 87 086 781
54 086 680 525
1998
1 386 061 381 964 (<) 163 395
8 739 (5) 123 082 802
147
50 452 21 852 498
41 826 65 447 116
53 863 229 525
Change 1997-98
(%)
8.77 - 48.98
5.29 -8.43
-11.48 107.04
-13.21 -1.64
3.05 - 24.85
-0.41 0.00
Growth 1993-98
(%)
61.64 31.11
143.18 70.45 15.48
-18.31 39.18 16.93 46.30
27.40 13.39
(1) The amounts In ecus are nominal values with no adjustment for inflation and/or exchange rate changes. (2) Sen/ices invoiced concern expenditure on publications handled on behalf of the Institutions. (3) The budgetary expenditure represents the out-turn of the Publication Office's own budget. (") The paper version no longer produced as from 1 July 1998. (5) Including 123 editions of the supplement to the Official Journal on paper (from 1 January to 30 June 1998). (e) 55 391 without counting subscriptions to the OJ S CD-ROM (cf. 1997 Annual Report).

1. Publications and other Publications Office products
1.1. Official Journal
1.2. Other publications
1.3. Databases and CELEX
1.4. Electronic publishing and Internet dissemination


1.1. Official Journal
1.1.1. General (a) Interinstitutional coordination
— In accordance with the instructions given by the Management Committee, Unit OP/2, Official Journal, acted as the secretariat for the interinstitutional working group on the content and structure of the Official Journal and chaired the working group on interinstitutional Eurolook.
The interinstitutional working group on the content and structure of the Official Journal endeavoured to establish a consensus on methods of electronic publishing, collecting the opinions of the institutions on the choice of texts eligible for this kind of distribution.
The Eurolook group is concerned with the electronic communication of official documents — particularly legislative texts — between institutions. It made efforts to maintain contact between users (particularly as regards problems with document identification) and technicians (compatibility of exchange formats, etc.).
— Particularly noteworthy was the publication by exclusively electronic means of the first series of five COM documents produced using Greffe 2000, the Commission's system for producing certified electronic documents. General introduction of these electronic processes will permit considerable savings and at the same time provide increased transparency in the legislative process.
(b) Specific developments and new products
— The Official Journal Unit devoted a great deal of effort to drawing up the specifications for the invitations for tender for renewing the OJ contracts. This has permitted the conclusion of new multimedia publishing contracts. These are improvements over the previous ones in financial terms in that they make full use of the technological developments of the last five years.
These contracts also provide for the use of a new generation of FORMEX (FORMEX.V.3) for structuring texts published in the Official Journal. This has meant substantial improvements in the possibilities for production, archiving and retrieval.
— In cooperation with the Commission's Directorate-General XV, Unit B/5, the Office completed the recasting of the information system for public procurement, SIMAP, which will make it possible to receive and process electronic notices transmitted by awarding authorities. The Office also continues to extend agreements with the national official gazettes which centralise these notices.
1.1.2. Production 1.1.2.1. Official Journal
(a) OJ L and C: output was up by 8.3 %.
(b) OJ S: the number of pages produced is no longer significant as the paper edition has been discontinued as from 1 July 1998.
The increase in the number of notices processed eased off substantially, however, from 10 % in 1997 to 5.3 % in 1998. The United States and Japan were responsible for most of the reduction (-1.1 %), while the increase stabilised at 6.8 %, for the other countries. However, since the Commission has decided to stop publishing notices from the United States and Japan as from July 1999, the number of notices processed should decrease.
15
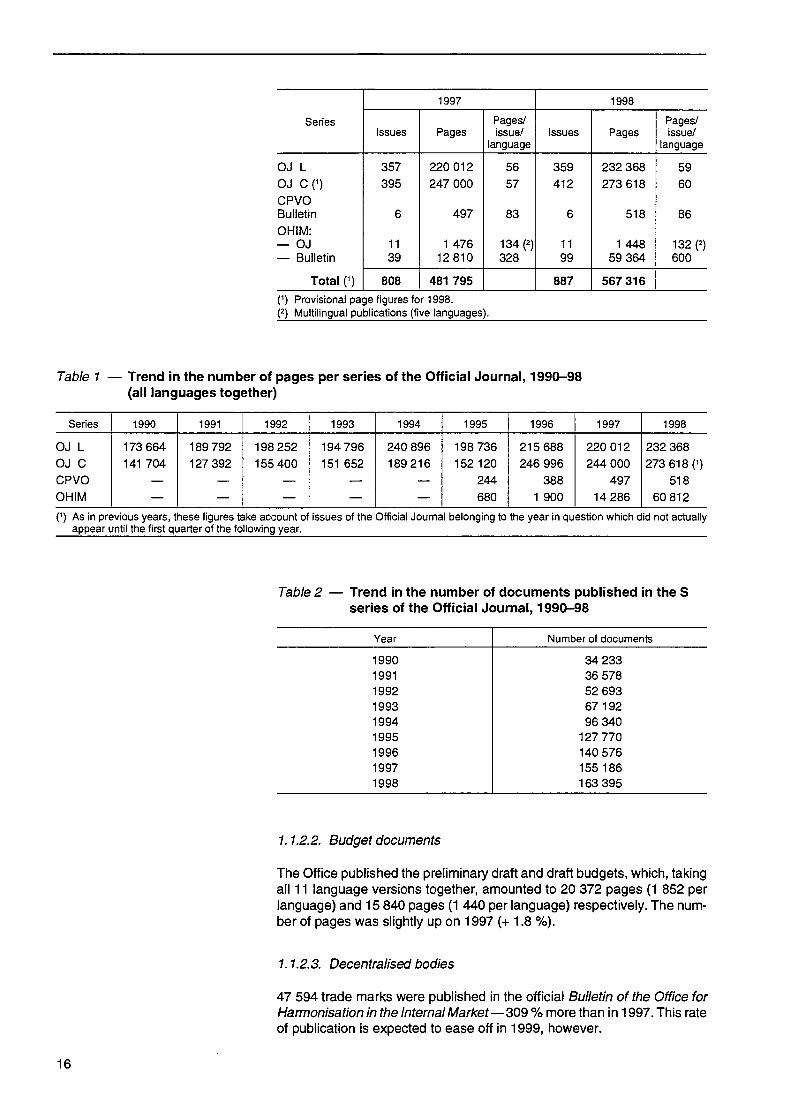
Series
OJ L OJ C o CPVO Bulletin OHIM: — OJ — Bulletin
Total (1)
1997
Issues
357 395
6
11 39
808
Pages
220 012 247 000
497
1 476 12810
481 795
Pages/ issue/
language
56 57
83
134(2) 328
1998
Issues
359 412
6
11 99
887
Pages
232 368 273 618
518
1 448 59 364
567 316
Pages/ issue/
language
59 60
86
132 (2) 600
(1) Provisional page figures for 1998. (2) Multilingual publications (five languages).
Table 1 — Trend in the number of pages per series of the Official Journal, 1990-98 (all languages together)
Series
OJ L OJ C CPVO OHIM
1990
173 664 141 704
— —
1991
189 792 127 392
— —
1992
198 252 155 400
— —
1993
194 796 151 652
— —
1994
240 896 189 216
— —
1995
198 736 152 120
244 680
1996
215 688 246 996
388 1 900
1997
220 012 244 000
497 14 286
1998
232 368 273 618 0
518 60 812
Π As in previous years, these figures take account of issues of the Official Journal belonging to the year in question which did not actually appear until the first quarter of the following year.
Table 2 — Trend in the number of documents published in the S series of the Official Journal, 1990-98
Year
1990 1991 1992 1993 1994 1995 1996 1997 1998
Number of documents
34 233 36 578 52 693 67 192 96 340
127 770 140 576 155 186 163 395
1.1.2.2. Budget documents
The Office published the preliminary draft and draft budgets, which, taking all 11 language versions together, amounted to 20 372 pages (1 852 per language) and 15 840 pages (1 440 per language) respectively. The number of pages was slightly up on 1997 (+ 1.8 %).
1.1.2.3. Decentralised bodies
47 594 trade marks were published in the official Bulletin of the Office for Harmonisation in the Internal Market—309 % more than in 1997. This rate of publication is expected to ease off in 1999, however.
16

1.1.3. OJ L and C CD-ROM Following the Management Committee's decision of 27 June 1997 (document CD(97)61) and invitation to tender No 1582, the Office produced a CD-ROM edition of the L and C Series of the Official Journal. This CD-ROM is intended for archiving purposes, replacing microfiches as from 2000.
This is intended as a supplementary product; the content is taken from ARCEL, CELEX and EUDOR.
The fact that the product is intended for archiving purposes means that standard formats must be used for storing information. The formats used are SGML (FORMEX) and TIFF. The first is used forthe sections in character mode and the second for images.
In 1998, two CD-ROMs were produced covering the first six months of the year. This is less than had originally been planned, particularly because of a series of unforeseen technical problems.
These problems are currently being solved and deliveries should be completed in the course of the first quarter of 1999.
With the entry into force of the new contractual arrangements for the OJ, production of the CD-ROM should become routine.
1.1.4. EUR-Lex CD-ROM A monthly, cumulative, monolingual CD-ROM of the OJ L and C Series derived from the EUR-Lex site has also been developed. Production should get under way at the beginning of 1999 (see 1.4.4.2, EUR-Lex).
1.1.5. O J S CD-ROM The CD-ROM edition of the S Series of the Official Journal was launched in 1997. On 1 July 1998 it became the official publication, as the paper edition was discontinued. There are around 10 200 subscribers.
The Office is preparing a new edition of this CD-ROM, which will be linked to a new edition of the TED (Tenders Electronic Daily) database on the Internet. The same user-interface will be used for both media. The CD-ROM will be linked to the database to provide access to the latest updates, thus making use of the latest technology.
1.1.6. Other CD-ROMs The Community Trade Marks Bulletin and the Official Journal containing the Combined Nomenclature are also published on CD-ROM as well as on paper.
17
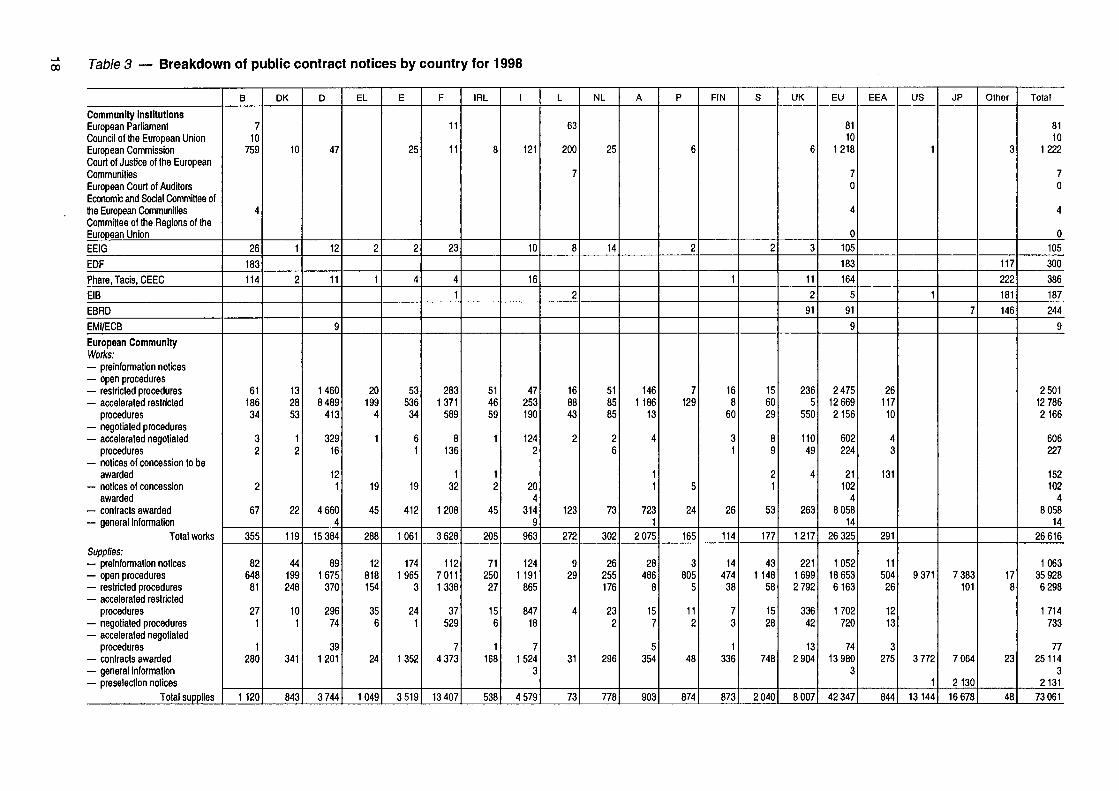
00 Table 3 — Breakdown of public contract notices by country for 1998
Community institutions European Parliament Council of the European Union European Commission Court of Justice of the European Communities European Court of Auditors Economic and Social Committee of the European Communities Committee of the Regions of the European Union EEIG
EDF
Phare, Tacis, CEEC EIB
EBRD
EMI/ECB European Community Works: — preinformation notices — open procedures — restricted procedures — accelerated restricted
procedures — negotiated procedures — accelerated negotiated
procedures — notices of concession to be
awarded — notices of concession
awarded — contracts awarded — general information
Total works Supplies: — preinformation notices — open procedures — restricted procedures — accelerated restricted
procedures — negotiated procedures — accelerated negotiated
procedures — contracts awarded — general information — preselection notices
Total supplies
Β
7 10
759
4
26
183 114
61 186 34
3 2
2
67
355
82 648 81
27 1
1 280
1120
DK
10
1
2
13 28 53
1 2
22
119
44 199 248
10 1
341
843
D
47
12
11
9
1460 8489
413
329 16
12 1
4660 4
15 384
89 1675
370
296 74
39 1201
3 744
EL
2
1
20 199
4
1
19
45
288
12 818 154
35 6
24
1049
E
25
2
4
53 536 34
6 1
19
412
1061
174 1965
3
24 1
1352
3 519
F
11
11
23
4 1
283 1371
589
8 136
1 32
1208
3 628
112 7011 1338
37 529
7 4 373
13 407
IRL
8
51 46 59
1
1 2
45
205
71 250 27
15 6
1 168
538
I
121
10
16
47 253 190
124 2
20 4
314 9
963
124 1191
865
847 18
7 1524
3
4 579
L
63
200
7
8
2
16 88 43
2
123
272
9 29
4
31
73
NL
25
14
51 85 85
2 6
73
302
26 255 176
23 2
296
778
A
146 1186
13
4
1 1
723 1
2 075
28 486
8
15 7
5 354
903
Ρ
6
2
7 129
5
24
165
3 805
5
11 2
48
874
FIN
1
16 8
60
3 1
26
114
14 474 38
7 3
1 336
873
S
2
15 60 29
8 9
2 1
53
177
43 1 148
58
15 28
748
2 040
UK
6
3
11
2
91
236 5
550
110 49
4
263
1217
221 1699 2 792
336 42
13 2 904
8 007
EU
81 10
1218
7 0
4
0 105
183 164
5
91
9
2475 12 669 2156
602 224
21 102
4 8 058
14 26 325
1052 18 653 6163
1702 720
74 13 980
3
42347
EEA
26 117 10
4 3
131
291
11 504 26
12 13
3 275
844
US
1
1
9 371
3 772
1 13144
JP
7
7 383 101
7 064
2130 16 678
Other
3
117 222
181
146
17 8
23
48
Total
81 10
1222
7 0
4
0 105
300
386 187
244
9
2 501 12786 2166
606 227
152 102
4 8 058
14 26 616
1063 35 928 6 298
1714 733
77 25114
3 2131
73 061

Table 3 (cont.) — Breakdown of public contract notices by country for 1998
Services: — competition notices — competition results — preformation notices — open procedures — restricted procedures — accelerated restricted
procedures — negotiated procedures — accelerated negotiated
procedures — contracts awarded — general information
Total services
Water, energy, transport and telecommunications: — qualification system — competition notices — competition results — periodic notices — open procedures — restricted procedures — negotiated procedures — contracts awarded — general information
Total WETT
Information and various notices
Additional information and corrigenda
Total 1998 Total 1997
Increase 1998/1997 (%)
Β
19 5
114 583 100
33 59
11 354
1278
41
133 108 51
193 214
740
3
331 4 930 3 733 32.07
DK
19 4
39 127 327
11 16
3 313
1 860
53 1
83 28 39
213 220
637
121 2593 2 606
-0.50
D
85 33
147 660 225
88 536
284 787
7 2 852
223 4
446 714 259
1479 1811
4936
8
856 27859 27363
1.81
EL
6 5 7
195 26
14 2
33 1
289
3
3 185 16 5
15 3
230
354 2 213 2 037 8.64
E
9 4
85 1321
40
12 13
6 896
2 2 388
10
6 198
5 5
91
315
283 7597 7343 3.46
F
617 153 170
3 972 2 066
43 1044
16 2 680
10 761
74 11 3
469 386 390 662
1716 1
3 712
2
1430 32 990 25 740 28.17
IRL
3 2
76 72 49
12 67
1 69
351
23
52 20 21
135 100
351
48 1501 1404 6.91
I
32 19 70
1 190 1024
1067 24
37 1607
45 5115
240 1
241 204 502 363
1433 3
2987
679 14470 15 288 -5.35
L
3
1 3 1
7
17
32
3
22 2 2 8
11
48
7 712 670 6.27
NL
3
39 206 263
12 48
4 497
1072
41 1 1
18 38 80 87
110 14
390
209 2790 2 670 4.49
A
23 8
49 210
8
6 88
10 181
583
63 1
89 138
9 265 373
1 939
189 4 689 4129 13.56
Ρ
42 9
250 5
6 3
2 22
1 340
20
52 1 3
19
95
192 1674 1612 3.85
FIN
4
18 117 36
6 14
1 78
274
6 35 29 69 73
212
14 1488 1498
-0.67
S
5 1
42 721 100
10 57
9 864
1809
35
27 86 8
226 152
534
187 4 749 4 397
8.01
UK
14 8
776 445
2971
335 670
53 2463
7 7 742
219
243 27
235 740 864
1 2 329
3
713 20124 21018 -4.25
EU
884 251
1633 10072 7241
1655 2 648
437 10861
64 35746
1048 19 4
1838 2 221 1647 4453 7202
23 18 455
16
5613 130 379 121 508
7.30
EEA
34 4
20 208 68
7 42
7 108
498
26 1 1
19 50 10
161 510
778
1
49 2 461 2 536 -2.96
US
6
13152 11492 14.44
JP
0 16 685 18 688
-10.72
Other
1
0 718 962
-25.36
Total
918 255
1653 10 280 7309
1662 2 690
444 10 969
64 36244
1047 20 5
1857 2271 1657 4 614 7 712
23 19 233
24
5 662 163 395 155186
5.29
<D

ro o
- ï O
Ό Φ JZ W 2 3 α « Φ ο
'Æ ο c
α> £1
Ε 3 Ζ 20 000
Evolution of Official Journal production (1998 data for OJ L and C not final)
900 ooo
800 000
700 000
600 000
500 000
400 000
300 000
200 000
CO o D) re η
-3
O
o Φ XI
Ε 3 Ζ
100 000
1986 1987 1988 1989 1990 1991 1992 1993 1994 1995 1996 1997 1998
Ε ΠΙ Number of notices "-"jèr™ OJ L Pages OJ C Pages OJ S Pages

1.2. Other publications
1.2.1. General Thanks to the internal development of special software and computerised procedures for cleaning up and correcting copy, the use of computers has become firmly established in all the proof-reading teams and the Unit has organised training in the use of semi-automatic correction tools. A technical support group has been established to provide permanent assistance for proof-readers. Electronic manuscripts proof-read using these means accounted for more than 80 % of documents entering the proof-reading section in the last quarter of 1998.
In this way, the Office has been able to save considerable time in producing publications and there has been a substantial improvement in the quality of the finished product, as well as considerable savings at the author's corrections stage.
With a view to optimising the various stages of production, automated procedures forthe transfer of electronic files to and from the various operators in the graphics chain have been developed and are currently being tested.
Computer developments have been used to modernise the production procedures forthe Bulletin of the European Union, i.e. preparation of electronic manuscripts migrated from Interleaf to Word under NT and the transmission of SGML files to the printers has been fully automated, with electronic notification of receipt. These adaptations have made it possible to reduce the time required for composing files at the Office and to achieve a higher level of security in transmission.
The new edition of the Interinstitutional Style Guide was finalised and distributed in all the languages. The document was so well received that the French and English versions had to be reprinted — forthe second time in the case of the French version. All the language versions are currently being posted on the Intranet. With a view to optimising the dissemination of information, a series of meetings for presenting the guide has been planned with the main authors and, in particular, the translation services.
In accordance with the Management Committee's decision, the Interinstitutional Directory appeared only once in 1998, in the 11 languages. The on-line edition, on the other hand, the IDEA database, has been regularly updated (twice a month — see 1.3.2), although the input mechanisms need to be reviewed and improved.
1.2.2. Production The previous two years had been marked by 'lightning operations' {Treaty of Amsterdam, Citizens First, Euro) with record production rates. Things settled down again in 1998, with the number of proof-read pages falling back to the 1995 level (258 000).
The steady rise in non-proof-read pages has resulted partly from the production and wide distribution of the style guide. The acceptance of this document — the fruit of interinstitutional collaboration — by authors has resulted in copy being better prepared at source, and hence in an increase of camera-ready manuscripts.
21

The figures are as follows:
Output
Number of publications Number of proof-read pages Number of non-proof-read pages
1997
8 483 324 037 401 249
1998
7 290 257 680 455 230
% change 1997-98
- 1 4 - 2 0 + 13
Publications which called for particular efforts (deadlines, quality) included:
— Euro 1999 — Convergence report (volumes I and II), — Annual Reports for various agencies, — DG I Information Packages: EU-Japan/EU-USA, — 'Routemaps' (follow-up to Citizens First), — Style Guide — in 10 languages.
The graphic design office was very busy — particularly in the following projects:
— EUPi-OP homepage, — EUR-OP, a publishing house for Europe, — The common fisheries policy, — European Union-Japan (folders and sheets), — Collection of catalogues 'European Foundation forthe Improvement of
Living and Working Conditions', Dublin, — Catalogue and newsletter 'European Publishers' Forum ', — Collection of new EUR-OP catalogues, — Euro 1999 — Convergence report, — Kaleidoscope 1996-1998.
1.2.3. Analysis of output Table 4 — Output per institution
Institution/Agency
European Parliament
Council
Commission (1)
Court of Justice
Court of Auditors
Economic and Social Committee/ Committee of the Regions
EIB
Decentralised Agencies
Cedefop
Total
Proof-read pages
1997
1 686
9 452
149 486
152 565
7 052
1 769
143
1 213
671
324 037
1998
2 539
3 808
115 178
129 251
1 545
1 907
68
2 550
834
257 680
% change
+ 50
- 5 9
- 2 3
- 1 5
- 7 8
+ 8
- 5 2
+ 110
+ 24
- 2 0
Non-proof-read pages
1997
30 682
12 247
299 580
50 968
708
88
253
4 137
2 586
401 249
1998
48 267
14 563
318619
51 515
280
12
2 498
6 183
13 293
455 230
% change
+ 57
+ 19
+ 6
+ 1
- 6 0
- 8 6
+ 887
+ 49
+ 414
+ 13
0) These figures include 1 716 proof-read pages and 7 544 non-proof-read pages for the European Foundation in Dublin, and 478 proof-read pages and 128 non-proof-read pages for the European University Institute in Florence.
22

Table 5 — Number of proof-read pages per language
Language version ES DA DE EL EN FR GA IT NL PT Fl SV
Total (1)
1997 26 552 29 095 34 360 27 970 43 698 30 447
556 26 955 30 761 25 911 22 311 24 595 324 037
1998 20 586 18 983 28 348 20 992 33 942 27 195
64 19 494 23 091 20 321 20 846 22 622
257 680
% change -22 -34 -17 -25 -22 -11 —
-27 -24 -21 -6.5 -8 -20
O Including 826 pages in 1997 and 1 196 pages in 1998 for languages other than the 11 official languages.
1.2.4. Official documents The publication of official documents (COM-final, opinions of the ESC, opinions of the Committee of the Regions) means that preparatory documents forthe drafting of legislation are available to the public.
The number of official documents published per language was slightly up in 1998 with 1 040 compared with 980 in 1997, excluding the EP reports, which are no longer produced on microfiche as from 1998.
1.3. Databases and CELEX
1.3.1. CELEX A detailed annex on CELEX can be found at the end of this report.
Efforts to improve coverage, quality and access continued throughout 1998.
This was reflected in a significant increase in the number of consultations and documents viewed. A total of 14 million documents were viewed in 1998; a figure which is 75 % of the 1997 figure (8 million) and 180 % of the 1996 (5 million).
Coverage of CELEX sectors 1-4 (legislation in force since 1 January 1995) is 98.3 % on average for the nine pre-accession languages.
Coverage of the Finnish and Swedish versions is 74.7 % compared with 44 % in 1997. Since some texts that were in force when these countries acceded have not been translated, coverage for these two languages can increase only when these translations become available. The institutions concerned have been informed of this situation.
23

1.3.1.1. CELEX +
At its meeting of 26 June 1998, the Management Committee (full members)
asked the Office to submit a proposal foran integrated system foraccess by
staff of the institutions to legal documents.·■
At the meeting of 13 October (substitute members), the Office proposed
that this service should be built around CELEX and called CELEX+.
This service, which will provide a single channel for access to the various
databases and repositories of legal documents will be set up stepbystep
as from the beginning of 1999. It is planned to make it available to the public
in the second half of 1999.
1.3.2. IDEA Input to the online edition of the Interinstitutional Directory — I DEA — con
tinued in 10 language versions. The Greek version will be introduced as
soon as the new generation of browsers is operational for all users under
Windows NT. At the request of interinstitutional users, a new edition of
IDEA on the Internet is in preparation. This should take account of the most
recent technological developments on the Web as well as the new require
ments for information on interinstitutional structures.
1.3.3. EUDOR Input of documents dating back as far as 1952 continued overthe course of
the year. The L Series of the OJ is available as from 1980 and the C Series
as from 1990.
A new series aimed at providing transparency on the work of the Council
has been added to the number of EUDOR collections. This permits access
to statements recorded in the minutes and the results of the votes when the
Council is acting in a legislative capacity.
The situation at the end of 1998 was as follows:
OJ L
OJ C
OJ Ρ (1)
ECSC
COM Documents
Secondary legislation
CONSLEG
MTF
Eurostat
EP docs (A4)
Council addenda
Council summaries
Total
Number of orders
Number of pages delivered
Number of pages loaded
Cumulative as at 31 December 1998
3 800 260
2 503 635
139 877
9 660
1 612 333
160 355
88 247
5211
148 621
406 135
9 627
1 795
8 885 756
1997
1 096 962
608 111
138 051
9 660
263 570
72 830
17 930
2 550
60 338
267 865
0
0
2 537 867
19 633
358 295
1998
945 658
892 477
0
0
258 717
150
31 386
1 382
48 555
146 032
9 627
1 762
2 335 746
23 032
511 226
(1) OJ published between 24 April 1958 and 31 December 1967.
24

1.3.4. Documentary publications
1.3.4.1. Tables, Directory and catalogues
Publication of the alphabetical indexes and methodological tables continued at the same rate as in the previous year, with 11 monthly issues and one annual.
In 1998, the 30th and 31 st editions of the Directory of Community legislation in force were produced in 11 languages.
A cumulative catalogue of publications was published in 11 languages.
The catalogue of documents appeared in the form of 11 monthly lists and one annual edition (July 1997 — June 1998).
The catalogues and tables are produced from the records stored in the Crenot database.
Contents of the Crenot database:
OJ notices (CREJO) Publication notices (Crepub) Notices for other documents (Credoc)
Cumulative as at 31 December 1998
809 081 61 865
165 596
Notices processed in 1998
142 057 5 765
12 729
Volume published (pages):
Alphabetical indexes — monthly (November to October) — annual Methodological tables — monthly — annual Directory — 28th and 29th editions — 30th and 31st editions Catalogue of publications — cumulative Catalogue of documents — monthly lists — annual edition
Total
1997
9 351 5 621
4 780 3 266
29 360
3 329
1 331 2 786
59 824
1998
10 368 6 034
5 000 3 358
33 704
4 930
1 584 2 685
67 663
The catalogue of consolidated texts was published 11 times.
1.3.4.2. Minicatalogue
In 1998, the Minicatalogue was published in 10 language versions with an average of 192 pages per language).
1.3.4.3. Eurovoc Thesaurus
The electronic edition of the Eurovoc thesaurus is available on CD-ROM in nine languages. Translation into Finnish and Swedish is under way.
25
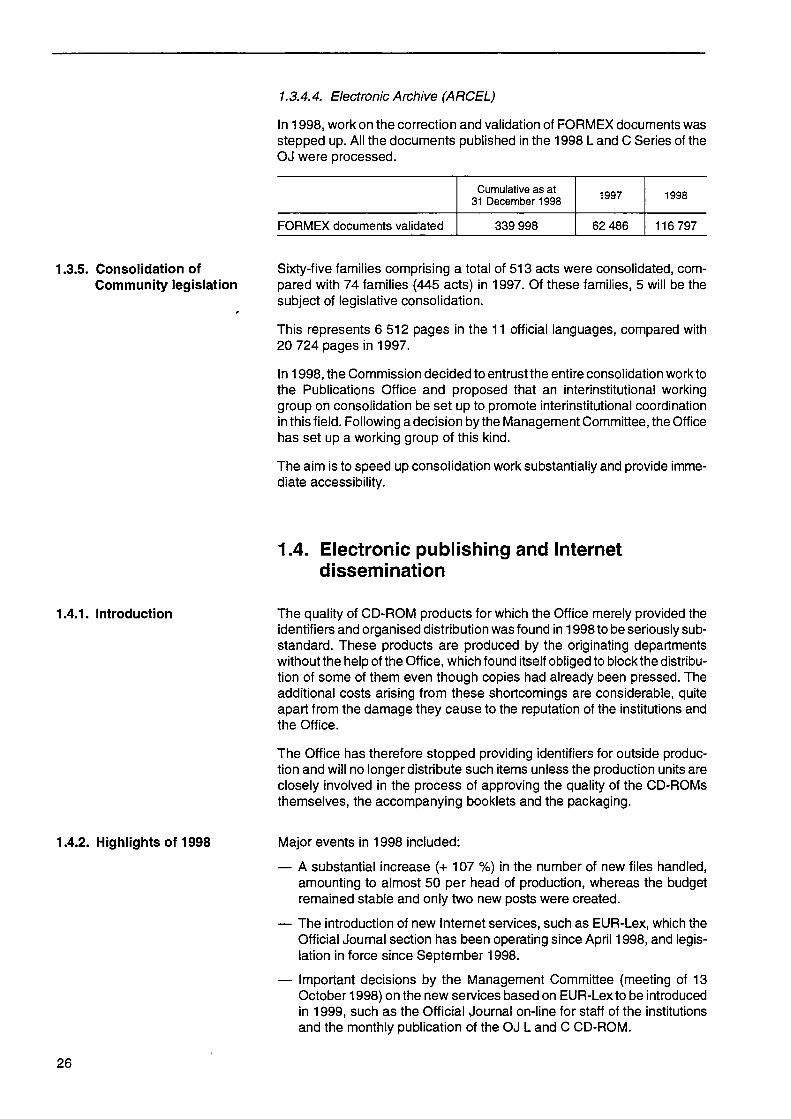
1.3.4.4. Electronic Archive (ARCEL)
In 1998, work on the correction and validation of FORMEX documents was stepped up. All the documents published in the 1998 L and C Series of the OJ were processed.
Cumulative as at 31 December 1998 1997 1998
FORMEX documents validated 339 998 62 486 116 797
1.3.5. Consolidation of Community legislation
Sixty-five families comprising a total of 513 acts were consolidated, compared with 74 families (445 acts) in 1997. Of these families, 5 will be the subject of legislative consolidation.
This represents 6 512 pages in the 11 official languages, compared with 20 724 pages in 1997.
In 1998, the Commission decided to entrust the entire consolidation work to the Publications Office and proposed that an interinstitutional working group on consolidation be set up to promote interinstitutional coordination in this field. Following a decision by the Management Committee, the Office has set up a working group of this kind.
The aim is to speed up consolidation work substantially and provide immediate accessibility.
1.4. Electronic publishing and Internet dissemination
1.4.1. Introduction The quality of CD-ROM products for which the Office merely provided the identifiers and organised distribution was found in 1998 to be seriously substandard. These products are produced by the originating departments without the help of the Office, which found itself obliged to block the distribution of some of them even though copies had already been pressed. The additional costs arising from these shortcomings are considerable, quite apart from the damage they cause to the reputation of the institutions and the Office.
The Office has therefore stopped providing identifiers for outside production and will no longer distribute such items unless the production units are closely involved in the process of approving the quality of the CD-ROMs themselves, the accompanying booklets and the packaging.
1.4.2. Highlights of 1998 Major events in 1998 included:
— A substantial increase (+ 107 %) in the number of new files handled, amounting to almost 50 per head of production, whereas the budget remained stable and only two new posts were created.
— The introduction of new Internet services, such as EUR-Lex, which the Official Journal section has been operating since April 1998, and legislation in force since September 1998.
— Important decisions by the Management Committee (meeting of 13 October 1998) on the new services based on EUR-Lex to be introduced in 1999, such as the Official Journal on-line for staff of the institutions and the monthly publication of the OJ L and C CD-ROM.
26

— The start of work on reorganising the Office's Internet site on Europa and the creation of the EUR-OP site on EuropaTeam, particularly forthe Official Journal on-line, the Interinstitutional Style Guide and the EUR-OP Guide.
— The establishment of interinstitutional coordination structures such as the Interinstitutional EUR-Lex Steering Committee and the Interinstitutional Committee on multimedia publications (tools and methods), for which the Office provides both the chairmanship and the secretariat.
1.4.3. Operation of the 'Electronic The establishment of Unit OP/5 continued in 1998 with the recruitment of publishing and Internet new staff — mainly two heads of production. The workforce is still small, dissemination' Unit (OP/5) however, in view of the level of activity, the workload and the place now
occupied by multimedia and the Internet technologies in the field of publishing.
More than 196 new files were being processed in 1998 (49 from 1997 plus 147 from 1998), or almost 50 per head of production.
1.4.4. Detailed activity report In the field of electronic publishing, the Office is responsible for the following:
(1) producing multimedia publications,
(2) managing Internet services,
(3) organising subcontracting for (1) and (2),
(4) quality management,
(5) interinstitutional cooperation,
(6) technology watch.
1.4.4.1. Producing multimedia publications
General
The year 1998 saw a major increase (+ 107 %) in the number of files processed for the production of multimedia publications (interactive terminals, CD-ROMs and Internet sites). There were 147 new files, plus 49 from 1997 that had not yet been finalised. The number of orders placed was up in 1998, with a total of 171, while the amount committed was down (-14 %). These savings were possible thanks to the significant increase in preliminary studies and the growing involvement of the Office in the production of the technical annexes ('lean' estimates) and the number of small projects benefiting from studies or similar activities.
As mentioned in the 1997 report, the production cycle for multimedia publications is sometimes very long, partly because of the technical complexity and the time taken forthe originating departments to supply all the necessary components. In 1998 it proved possible to finalise a large number of files (35) dating from 1997.
As can be seen from the table below, the rate of finalisation was up on the previous year (from 31 % to 35 %).
27

In 1998, the Office introduced the principle of preliminary studies to help the originating departments to cope with the complexity of their multimedia publications and the production deadlines. These studies take a mere three to four weeks and enable the originating departments and the Office to work out the various production scenarios for a multimedia publication, to identify requirements and to propose realistic production schedules.
Number of publication requests received Files terminated within the year Files terminated in year + 1 Files in progress in year + 2
1997 Number
71 22 35 14
% Total
100 31 49 20
1998 Number
147 52 95
0
% Total
100 35 65
0
This has led to:
— a substantial reduction in costs,
— the abandonment of premature projects,
— a general improvement in the quality of the service,
— improved compliance with deadlines.
The Office's advisory work for the originating departments accounts for a large part—an estimated 30 % orso — of the utilisation of resources by the unit responsible. Even if this advisory work does not always lead to a request for publication, almost all the institutions and agencies have called on the expertise of the Office in connection with their multimedia publication projects.
The originating departments should pay more attention to the quality of the drafting and the information value of their multimedia publications, as there has been too much emphasis on merely technical aspects.
Breakdown of files by type
The Office's work in 1998 covered:
— 3 studies,
— 8 graphic productions,
— 2 videos,
— 78 CD-ROMs (including 8 periodical),
— 67 Internet sites.
Difficulty of files
The level of difficulty of a multimedia publication file depends on its duration, volume and technical complexity.
It quite often becomes apparent that multimedia publications are regarded as something that can be easily modified at any time and at no cost, whereas they do not in fact differ from traditional publications inasmuch as work must be done as specified on the order forms. The originating departments must plan the updating of multimedia publications and the maintenance of technical solutions, and submit corresponding requests for publication.
28

Breakdown of products by customer institution
See Table 6 for further details.
Twenty-six departments called on the services of the Office in 1998.
A number of departments that had previously produced CD-ROMs or Internet sites using their own procedures called on the services of the Office.
1.4.4.2. Management of Internet services
EUR-Lex
The Office is responsible for developing the production system and the operational management of the EUR-Lex service. Progress and coordination were discussed in the EUR-Lex Interinstitutional Steering Committee. Progress reports are regularly submitted to the Management Committee.
Table 6 — Breakdown of products by customer institution
Institution
European Parliament Council Commission EEA Cedefop EFD OEDT OHIM
Total
Number of
files
10 2
125 1 5 1 2 1
147
Number of items for supply
10 3
134 2 5 1 2 1
158
Type of item to be supplied
Studies
3
3
Graphic activities
1 6 1
8
Video
2
2
CD-ROM
1 1
67 1 5 1 2
78
Internet
9 1
56
1
67
Table 7 — Number of files per customer institution
Institution
European Parliament Council Commission Court of Justice EEA Cedefop EFD OEDT OHIM
Total
Number of files
1997
3 8
56 1 0 0 1 1 1
71
1998
10 2
125 0 1 5 1 2 1
147
Change (in number
of files)
+ 7 - 6
+ 69 - 1 + 1 + 5
+ 1
+ 76
Change (%)
+ 233.3 - 7 5
+ 123.2 - 1 0 0 + 100 + 500
+ 100
+ 107.0
29

Since its launch in November 1997, the main events in the EUR-Lex project have been as follows:
— April 1998 — official opening of the EUR-Lex site — phase 1 — Official Journal, European Union Treaties, consolidated texts of Community legislation, recent judgments by the Court of Justice.
— September 1998 — official opening of the EUR-Lex site — phase 2 — legislation in force, Directory of Community legislation in force and texts.
— October 1998 — decision by the Management Committee to introduce new services derived from EUR-Lex, such as the Official Journal on-line for the staff of the institutions (collection as from 1 January 1998) and the monthly publication of a cumulative multilingual CD-ROM edition of the L and C Series of the OJ. The period for which the Official Journal will be retained in EUR-Lex will be increased from 20 to 45 days as from 1 January 1999.
A demonstration of the monthly CD-ROM edition of the L and C Series was produced in 1998 for the Official Journal resubscription campaign with a view to regular production in 1999.
The number of visitors to the EUR-Lex site is steadily rising, for example:
Number of users connecting per day
Number of OJ results pages consulted per day
Number of OJ articles downloaded per day
OJ/Legislation in force utilisation ratio
between 5 000 and 7 000
between 40 000 and 60 000
between 10 000 and 20 000
60/40
EUR-Lex is one of the 10 most frequently consulted sites of the European institutions. Many Internet sites belonging to public administrations, universities, specialist legal services and search engines referto EUR-Lex.
Almost 100 % of the Official Journals are available. They are loaded daily around 2 p.m. on the day of publication.
EUR-OP Internet sites
Major restructuring and harmonisation of the EUR-OP pages at the various sites (Europa, EuropaTeam and EuropaPlus) was carried out in 1998.
The EUR-OP site accessible via the Internet is now genuinely multilingual and the graphics have been brought into line with Europa. The site contains the electronic edition of EUR-OP News. Integration with the other Internet services managed by the Office has been improved (TED, EUDOR, CELEX, EUR-Lex, IDEA etc.) but has yet to be finalised.
The EUR-OP site accessible to all the institutions on EuropaTeam has been configured in such a way as to contain in particular the Official Journal on line, the EUR-OP Guide, the Interinstitutional Style Guide and the new electronic services to be developed by the Office to establish closer contacts with the originating departments (for example, on-line publication requests, monitoring of publication files, delivery of manuscripts, checking proofs etc.).
30

CIRCA
The Office is involved, together with Eurostat, the Informatics Directorate and DG III, in the management of the CIRCA project (Communication and Information Resource Centre Administrator) launched by Eurostat as part of the IDA programme (Interchange of Data between Administrations). It offers generic services based on Internet technologies forthe exchange, sharing and distribution of information between groups of users. Coordination structures have been established (steering committee, technical committee). The Informatics Directorate houses and manages the CIRCA infrastructure and various Directorates-General and agencies have installed CIRCA in their own computer infrastructures.
The Office uses CIRCA in the following projects:
— European Publishers Forum,
— EUR-Lex Interinstitutional Steering Committee,
— Interinstitutional Committee — multimedia publications (tools and methods).
At least three multimedia projects of the institutions are based on CIRCA, and others are at the evaluation stage.
1.4.4.3. Organising subcontracting
Relations with contractors
Coordination with contractors has been improved. Monthly supervisory meetings (planning, general organisation of work, quality assurance, invoicing) and meetings of a more technical nature are held, and attended by the originating departments if necessary.
Multimedia invitations to tender
In view of the rapid technological developments and requests by originating departments for services not covered by the existing framework contracts, the Office has started to prepare an invitation to tender with 18 lots for the production of multimedia publications (studies, design, implementation, start-up help, promotion, editing etc.). The terms of reference have been validated with representatives of the institutions.
The invitation to tender should be published in the first quarter of 1999, and the contracts should be available in the autumn.
1.4.4.4. Quality management
Quality assurance for multimedia publications
A check list has been produced for each type of publication (interactive interface, video, CD-ROM, booklet, Internet site). It is used by the heads of production in the quality acceptance phase.
Multimedia publication vade-mecum
No progress has been made on producing the multimedia publication vade-mecum. The institutions have reiterated the importance of having a manual of this kind in addition to the documents already available such as
31

the Interinstitutional Style Guide, the Guide for information suppliers or codes of conduct for authors. Drawing up the vade-mecum has been included on the work programme for 1999.
1.4.4.5. Interinstitutional cooperation
Involvement in the distribution policy coordination structures.
The Office regularly takes part in the following coordination structures:
— Interinstitutional Internet Editorial Committee (NEC),
— Europa Editorial Committee,
— EuropaPius Editorial Committee,
— Internet Technical Committee,
— Europa Forum,
— CIRCA Steering Committee and Technical Committee,
— EUR-Lex Interinstitutional Steering Committee
1.4.4.6. Technology watch (1)
There has been little progress in active technology watch in what is a constantly developing field.
Various priority areas have been identified and proposals for action have been submitted to the representatives of the institutions. These areas have been the subject of a 'passive' technology watch.
C) The technology watch consists of following the development of technologies (software, protocol, standard, format, etc.) and services concerned with multimedia publications. This technology watch implies the following activities: — participating in conferences, seminars, presentations and demonstrations — following up academic and industrial research work — evaluating products and services — establishing prototypes — writing summary and policy reports.
32

2. Sales policy and results
2.1. General organisation
2.2. Sales promotion
2.3. Information activities
2.4. Customer support
2.5. Results
2.6. Review and prospects


2.1. General organisation
2.1.1. Sales networks 2.1.1.1. Conventional and electronic publications
The necessary contractual changes have been introduced to enable our partners in the various sales networks to sell all the forms of subscription to the information contained in the Official Journal, regardless of the medium used. The terms of all the contracts with the general sales offices have been broadened to enable them to sell all the off-line products and this creates a core of agents able to offer the entire range of products for sale on all the various media on which information is distributed.
The year 1998 saw the establishment of sales offices in Canada and Sri Lanka, while those in South Africa and South Korea closed.
On 31 December 1998, the network comprised:
— 48 official general agents worldwide (35 in Europe, including 19 in the European Union);
— 60 Euro-booksellers on Community territory;
— 17 gateways;
— 20 agents specialising in off-line products, in addition to the basic agents;
— 4 agents specialising in document delivery;
— 14 Eurostat Datashops.
The annual meeting of the general sales offices in the European Union was held in Vienna on 18 and 19 June 1998. The main points discussed were:
— sales trends;
— the Supplement to the Official Journal and the TED database;
— new approaches to the distribution of Community legislation;
— new directions in the Commission's publications programme;
— new forms of sales;
— the Publishers' Forum;
— discounts on subscriptions;
— renewal procedure for subscriptions;
— the euro and its impact on invoicing and payment;
— bad payers.
The trend towards databases being made available free of charge continued, with free access to ECLAS as from 1 January 1998, the opening of the 'legislation in force' section of EUR-Lex and the announcement that TED would be free as from 1 January 1999. Only CELEX, EUDOR, APC, OIL and Sesame were still available only for a fee, but the last three would probably be made available free of charge in the near future. In other words,
35
turnover is ceasing to be sufficient for continued viability of the gateways network. The Swiss gateway stopped operating at the end of the year and the activities of the Belgian gateway have been taken over by another body.
On the occasion of the On-line fair held in London on 10 December 1998, the Office organised a meeting with the gateways to discuss the implications of making TED, their main source of revenue, available free of charge.
This has also had an impact on licensing contracts and the revenue they generated (see 2.5.2.1).
2.1.1.2. Document delivery
Activities in 1998 were concentrated on the consolidation of a new section for document delivery and the tools at its disposal, and on the launch of a call for applications for new agents in January 1999. The section also took charge of invoicing for similar work on behalf of the originating departments (BACH, BCSR and Eurostat Datashops).
The Office dealt directly with complex requests from the institutions. These involved the delivery of large volumes of 'made-to-measure' information on various media. This new service provided by the Office has been vigorously promoted among the various customers in the institutions, and in particular the Information Officers. The section has also met similar requests from external organisations. A total of almost 1 800 requests from Luxembourg and Brussels was processed.
2.1.2. Invoicing A total of 19 755 invoices was sent out in 1998 (36 % up on 1997), for a total of ECU 21 852 498 (1.6 % down on 1997). Electronic products continued to account for a rapidly increasing proportion of the total invoicing, mainly because of the introduction of the CD-ROM to replace the paper edition of the S Series of the OJ. The fact that some information is now available free of charge together with the reduction in the price of electronic products will have a substantial impact on invoicing in 1999.
2.1.3. Stock management, orders The interest of originating departments in reproduction on demand was confirmed. This mechanism, which involves reproducing publications at short notice from a master, permits production levels that are appropriate to actual distribution during the lifetime of a publication and enables considerable savings to be made on storage costs. The potential of this type of production was taken into account in drawing up the publication programmes for the various departments. In 1997, 1 505 products were placed in this category, to which a further 548 new publications were added in 1998. This arrangement, together with document delivery, will be central to the Commission's publications programme for 1999.
In 1998,32 716 articles, taking all languages and media together, were produced (including 11 294 Official Journal articles). This represented an increase of 6 % overthe 30 980 articles produced in 1997 (including 12 408 Official Journal articles).
36

2.1.4. Free distribution 2.1.4.1. Distribution to relay centres
At the end of 1998, the numbers of relay centres served by the Office were as follows (the figures in brackets showthe change compared with 1997):
1. Relay centres receiving publications on a daily basis:
— full documentation centres: 293 (+ 8)
— specialised documentation centres: 191 (=)
— Info-Points Europe: 93 (+ 31)
— depository libraries: 92 (=)
— reduced depository libraries: 13 (-1)
— European reference centres: 172 (-6)
— rural development forums: 105 (+ 12)
— Euro Info Centres: 247 (+ 16)
2. Relay centres receiving only a selection of publications:
— centres for local urban initiatives (CLUI): 19 (+ 1)
— European Parliament Epicor network: 155 (+ 78)
— public libraries in four countries of the European Union:
• United Kingdom: 194 (+ 20) • Spain: 39 (=) • Sweden: 276 (-6) • Denmark: 25 (=)
The number of publications distributed to the relay centres increased by some 20 % in 1998, despite the 75 % reduction in Eurostat titles, which will in future be sent to the European documentation centres once a year only on CD-ROM.
2.1.4.2. Orders from officials of the institutions
As from 15 October 1998, the Office officially took on the task of supplying the officials of the institutions with the Official Journal and Commission publications. An average of 50 orders are met per day.
The Office intends to improve the ordering channels for publications with the help of the Information Officers in the various Commission DGs (see 2.1.1.2).
Improved awareness on the part of the institutions of the electronic products available will make it possible to optimise the use of the resources that are at present devoted to internal information.
37

2.2. Sales promotion
2.2.1. Fairs and exhibitions The Office was represented at the following 31 events:
2.2.1.1. Direct participation by the Office
Event
Information New Technologies Forum Online Konferentie Salon du livre London International Book Fair Salon du livre Leipziger Buchmesse International Children's Book Fair Online Information Scandinavia Foire du printemps IDT Frankfurter Buchmesse Foire d'automne EIC Conference Foire de l'enfance Online Information f )
Venue
Brussels Rotterdam Brussels London Paris Leipzig Bologna Stockholm Luxembourg Paris Frankfurt Luxembourg Edinburgh Luxembourg London
Date
18-20 February 3-4 March 3-8 March 22-24 March 20-25 March 26-29 March 2-5 April 12-14 May 16-24 May 9-11 June 7-12 October 10-18 October 23-24 October 24-31 October 8-10 December
(') Several European Commission departments took part in this event.
2.2.1.2. Representation by a third party
Event
Tokyo International Book Fair Expolangues
Tallinn Book Fair International Istanbul Book Fair International Book Festival Salon du livre et de la presse Infobase Business Information Show National Book Fair Finex
Documat Days of Slovene Lawyers Frankfurt after Frankfurt Slovene Book Fair EDV User Meeting
Venue
Tokyo Paris
Tallinn
Istanbul Budapest
Geneva Frankfurt
London Warsaw Banská Bystrica Valencia Ljubljana Ljubljana Ljubljana Vienna
Date
22-25 January 28 January-1 February 19-21 February
20-29 March 20-29 March
29 April-3 May 5-7 May
10-12 June 17-20 September 21-24 September
29-31 October 15-17 October 4-11 November 25-29 November 5 November
Represented by
PSI-Japan Official Journal
Euro Info Centre
Dünya Infotel. AS Euro Info Service
OSEC Outlaw
Abacus Data Serv. Ars Polona SCSTI
Mundi Prensa Gospodarski Vest. Gospodarski Vest. Gospodarski Vest. EDV
2.2.2. Promotional activities The Office distributed several types of catalogue:
— publications: 402 902 copies, including the cumulative catalogue (53 000 copies), the Minicatalogue (235 500 copies), the Eurostat catalogue (3 402 copies) and the list of publications of Cedefop in Thessaloniki (85 000 copies);
38

— documents: 9 300 copies per month;
— other catalogues, i.e. the catalogue of consolidated texts (3 400 copies per month), the video catalogue (1 300 copies) and the database directory (12 000 copies).
Work started in 1998 on a fundamental examination of the production of catalogues, in the light of the requirements of the specialised groups that use Publications Office information in a professional context, such as libraries. This work will be continued in 1999.
In 1998, 27 advertising leaflets were produced and distributed to an average of 95 000 recipients.
Distribution of catalogues
Publication
Publications catalogue The European Union as a Publisher (Extract from the publications catalogues) Documents catalogue Catalogue of consolidated texts Database directory Eurostat catalogue Cedefop Video catalogue
Total
1997
53 300
197 000 10 000 3 900 1 600 7 500
37 000 7 9800
319 000
1998
53 000
235 500 9 300 3 400
12 000 3 402
85 000 1 300
402 902
Notes
Every six months, but annual for 1998 Annual (including 35 000 copies for the Lisbon Exhibition) Monthly +1 cumulative Monthly Annual Sent on request
Irregular
Advertising leaflets produced in 1998
Title
Key data on education in the EU The single market and tomorrow's Europe EU activity report 1997 Europroms European Foundation forthe Improvement of Living and Working Conditions Panorama of industry 97 The single market and tomorrow's Europe Panorama of Europe Agriculture Social Affairs Enterprises in Europe Education Environment Monetary Union Tourism Community Law Research and development Single Market Review Eurostat Directory Community Trade Marks Bulletin Guide to Community finance for industry Who's who in the EU European Employment and Industrial Relations Glossary The rules governing medicinal products in the EU European System of National and Regional Accounts — ESA 95 RISC EUR 17655 Society, the endless frontier
Language versions
DE, EN, FR DE, FR, IT, NL, Fl, SV 11 DE, EN, FR ES DE, EN, FR PT 11 11 11 11 11 11 11 11 11 11 EN IT ES, DE, EN, FR, IT 11 11 EL EN 11 DE, EN, FR DE, EN, FR
39
2.2.3. Marketing operations In the second quarter, subscribers to the paper edition of the S Series of the OJ were surveyed by means of a circular on the new forms of subscription with a view to discontinuing the paper edition on 30 June 1998 (CD-ROM, on-line access, etc.). The results of this survey have made it possible to forecast CD-ROM production runs and to estimate the relative importance of the various alternatives offered to those currently buying the paper edition.
2.2.4. EUR-OP News 2.2.4.1. Distribution
In 1998, the print run for EUR-OP News stabilised at 300 000 copies per issue for all 11 language versions.
The three large-scale distribution channels for EUR-OP News continued to be subscriptions, bulk consignments to the sales offices and distribution at book fairs or other events at which the Office was represented.
By the end of 1998, the number of copies sent out had reached 271 897 compared with 269 872 in the previous year. This increase was due to a larger number of individual subscriptions (188 503 in 1998 compared with 177 873 in 1997).
Since October 1998, EUR-OP News has been available in 11 languages at the Office's Web site.
EUR-OP News is a popular source of information on publications. However, finance is a recurrent problem.
2.2.4.2. Publications Office on the Internet
The information made available by the Office on the Internet continued to be a great success. By the end of the year, the number of HTML pages called up had reached 6 500 per day.
2.3. Information campaigns
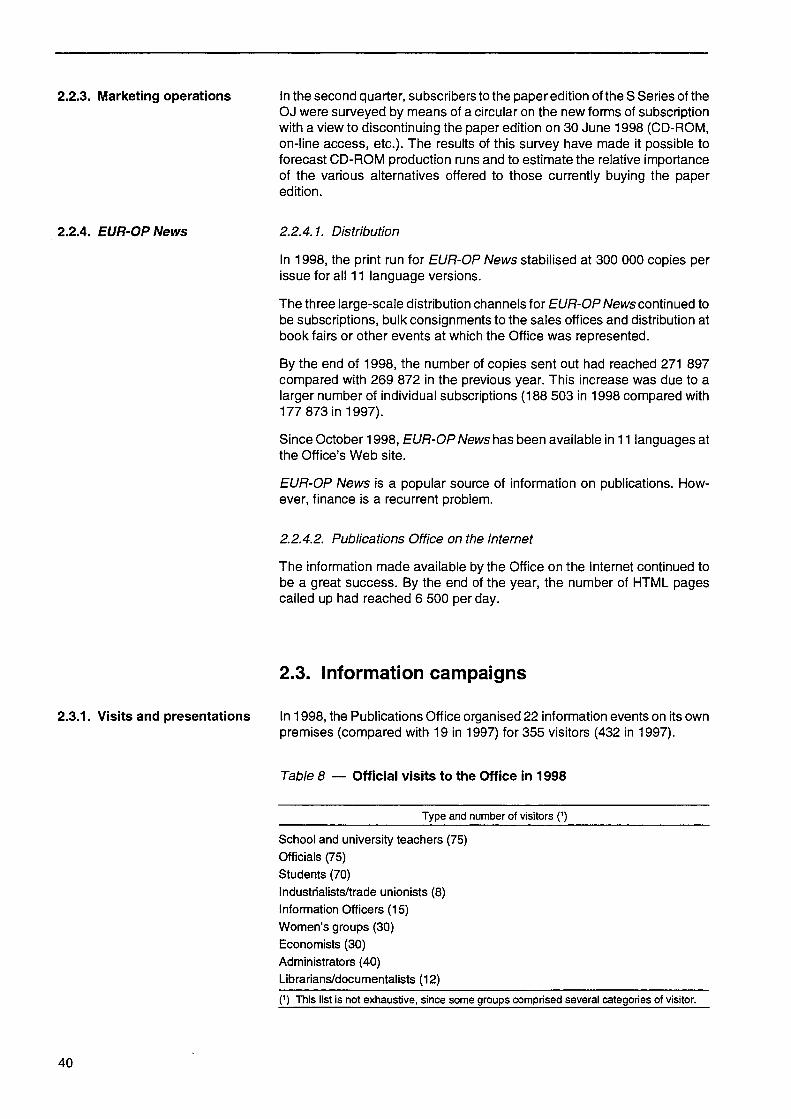
2.3.1. Visits and presentations In 1998, the Publications Office organised 22 information events on its own premises (compared with 19 in 1997) for 355 visitors (432 in 1997).
Table 8 Official visits to the Office in 1998
Type and number of visitors f )
School and university teachers (75) Officials (75) Students (70) Industrialists/trade unionists (8) Information Officers (15) Women's groups (30) Economists (30) Administrators (40) Librarians/documentalists (12)
(') This list is not exhaustive, since some groups comprised several categories of visitor.
40

2.3.2. Info-Points Europe, Luxembourg
The Office organised or took part in 73 external training events and seminars.
Table 9 — External presentations in 1998
Audience and number of presentation
Librarians/documentalists (2)
Sales agents (3)
Database users (2)
Information specialists (12)
Interest groups (2)
Public administrators (4)
Students, teachers, local officials (6)
National civil servants (16)
EU officials (2)
Lawyers (4)
Representatives of applicant countries (2)
Translators (1 )
Journalists (1)
Other (5)
Number of requests dealt with — personal visits and telephone calls: — Place d'Armes 3 030
— rue Mercier 4 390
Total 7 420
2.4. Customer support
2.4.1. Training courses and help-desk
The table below shows the turnover and invoicing on training courses for database users ('Access to European Law' only in 1998).
Training in the use of databases (other than TED)
Access to European Law
— EN
— FR
Number of courses
1997
4
2
1998
9
1
Number of participants
1997
16
12
1998
40
2
Invoicing (ECU)
1997
2 640
1 980
1998
6 600
330
41

Total 10 28 42 4 620 6 930
The numbers of help-desk calls were as follows in 1998:
2.5.1. Publications
On-line Off-line
Total
1997
1 825 1 647
3 472
1998
5 055 2 566
7 621
There was a total increase of 87 % — as a result of the increase in the number of products supported (EUR-Lex, EUDOR-in-a-Box), the number of customers for electronic media (especially the CD-ROM edition of the S Series of the OJ) and the growing complexity/variety of the computer systems on which the Office's products are called on to operate.
2.5. Sales results
2.5.1.1. Periodicals
Table 10 shows the general trend in subscriptions to the Official Journal, other periodicals and documents.
Table 10 — Trend in subscriptions
Publication
Official Journal: — L + C Series (paper) — L + C Series (microfiches) — L + C Series (CD-ROM) — C Series (competitions) — S Series (paper) — S Series (CD-ROM)
Publications other than the OJ Documents
Total
1997
14 524 1 216
6 274 9 467 2 743
(12 210)
21 104 2 806 (4)
58134
1998
13 420 1 078
769 6 281 6 496 (2) 8 573
(8 573)
19 452 879
50 452
Change (%)
- 7 . 6 0 - 1 1 . 3 5
- 3 . 0 1 C) + 0.11
- 3 1 . 3 8 + 212.81
- 29.79 (3)
- 7 . 8 3 - 68.67
- 1 3 . 2 1 (') Comparison of total subscriptions to physical media (paper and microfiches in 1997;
paper, microfiches and CD-ROM in 1998). Publication of the quarterly CD-ROM was delayed; no issues of this subscription quarterly were published in 1998.
(2) When the paper edition was discontinued on 30 June 1998. (3) Trend in the number of subscribers to existing media (paper and CD-ROM) in 1997;
CD-ROM only (2x and 5x per week) in 1998. (4) Down as a result of the discontinuation of the thematic subscriptions to COM documents
and the more systematic provision of access to the most important documents on the Europa website.
42

(a) Official Journal
Table 11 shows the trend in subscriptions to the various series of the Official Journal by language version.
Table 11 — Trend in subscriptions to the Official Journal L + C Series: paper, microfiche, CD-ROM S Series: paper, CD-ROM
Language
ES
DA
DE
EL
EN
FR
IT
NL
PT
Fl
SV
Total
L + C Series Paper
1997
1 894
457
2 140
288
2 633
. 2 759
2 305
974
598
237
239
14 524
1998
1 710
398
2 021
239
2 369
2 613
2 240
865
544
211
210
13 420
L + C Series Microfiches
1997
166
43
198
2
276
336
92
87
12
2
2
1 216
1998
142
36
193
2
243
287
73
87
11
1
3
1 078
L + C Series CD-ROM
1998 Π
74
36
91
11
168
124
151
51
46
4
13
769
S Series Paper
1997
233
348
2 316
31
3 062
1 712
888
746
71
9
51
9 467
1998 (2)
184
122
1 923
11
1 984
1 214
603
371
43
5
36
6 496
S Series CD-ROM
1997 1998 1998
(Multilingual products language of registration)
2x
43
243
651
21
925
437
140
225
31
2
25
2 743
2x
142
447
2 228
33
1 779
1 324
421
560
59
10
61
7 064
5 χ (3)
31
78
82
0
417
285
401
213
0
0
2
1 509
C) New product in 1998. (2) As at 30 June 1998. (3) Daily CD-ROM introduced on 1 July 1998 to replace the paper edition.
The downward trend in subscriptions accelerated in 1998, forthe same reasons as in 1997: preference for 'value added' alternatives, reduced budgets for the acquisition of publications, availability of the same information free of charge on the Internet and substantial reductions in the prices of alternative electronic products.
As from 30 June 1998, the paper edition of the S Series of the OJ was replaced by the CD-ROM edition. This abrupt withdrawal of the paper edition led to a significant loss of subscribers to Office products on all media in 1998 (-27.32 %, if the 301 flat-rate subscribers to TED are included). Only some of these subscribers appear to have chosen other alternatives.
43

(b) Other publications
Table 12 shows the trend in subscriptions to periodicals other than the Official Journal.
Table 12 — Trend in subscriptions to periodicals other than the Official Journal
Title
European Parliament
Debates (paper edition) Debates (microfiche edition) (discontinued retroactively from the end of 1996) List of Members (1)
Total
Commission
(a) General publications: — Bulletin of the EU and supplements — Agricultural markets: prices — Recent publications on the European Communities received
by the library (2) — Energy in Europe (2) — European Economy and supplements A, B and C — Euro abstracts (2) — SCAD Bulletin — Social Europe and supplements — Results of the business survey — Euroscientia Forum (discontinued retroactively for 1997 and 1998) — Terminology and translation (>)
Total, general publications
(b) Eurostat publications: — Rapid reports (3) — ECU-EMS information — Eurostatistics — Consumer price index
(discontinued retroactively for 1997 and 1998) — ESA quarterly national accounts — Money and finance: quarterly data — Iron and steel: monthly statistics — Sen/ices — External trade: monthly statistics — Agricultural prices: selected series from the Cronos databank — Energy: monthly statistics — Agricultural production — Unemployment (monthly bulletin) — Panorama of industry — Ecustat — Balance of payments — Economic data pocket book — EU indicator (2) — Key figures — Asylum seekers (2) — Research in Official Statistics (1)
Total, Eurostat publications
Total, Commission publications
1997
255
48 —
303
3 505 114
66 832
2511 350
60 1 104
153 105 —
8 800
442 301 960
334 135 208 199 69
324 197 365 465 297 188 47 64
149 8
36 14 —
4 802
13 602
1998
223
— 27
250
3 246 108
— —
2 359 — 52
1 455 133 102 39
7 494
571 287 918
— 137 200 179 67
311 198 348 458 295 226
56 68
185 — 49
7 16
4 576
12 070
Change (%)
-12.55
— —
-17.49
-7.39 -5.26
— —
-6.05 —
-13.33 + 31.79 -13.07 -2.86
— -14.84
+ 29.19 -4.65 -4.38
— + 1.48 -3.85
-10.05 -2.90 -4.01 + 0.51 -4.66 -1.51 -0.67
- +20.21 + 19.15 + 6.25
+ 24.16 —
+ 36.11 - 50.00
— -4.71
-11.26
44
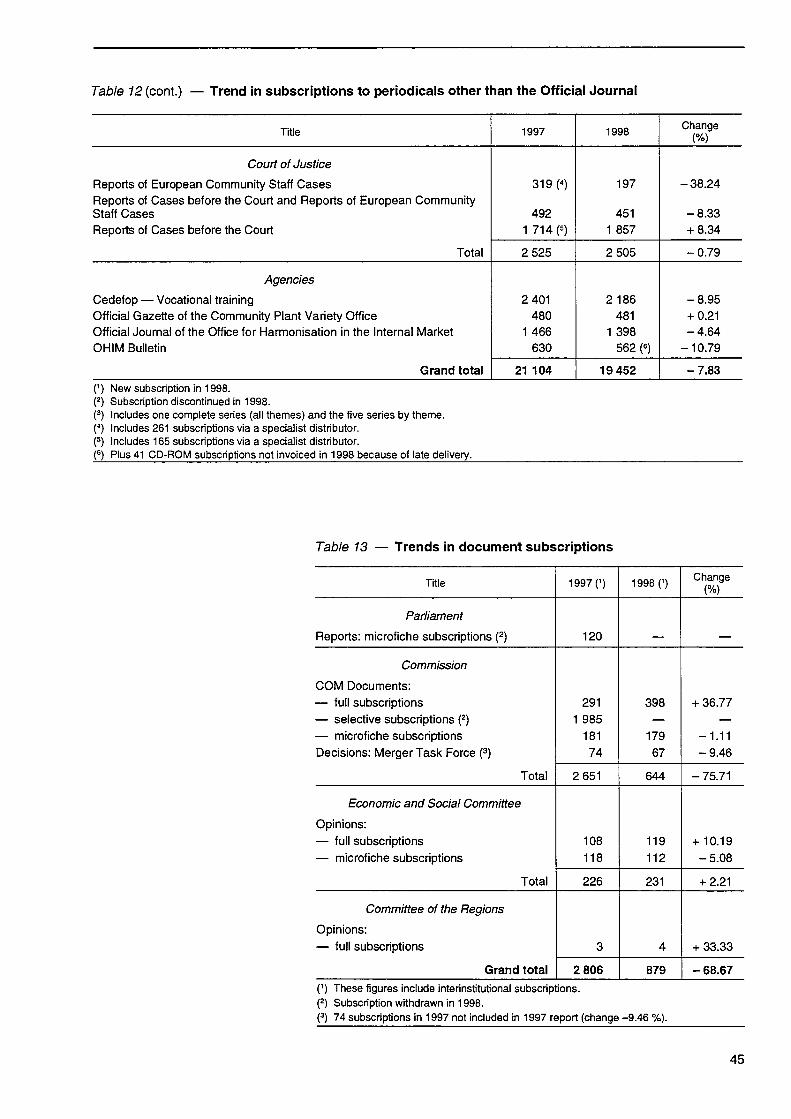
Table 12 (cont.) — Trend in subscriptions to periodicals other than the Official Journal
Title
Court of Justice
Reports of European Community Staff Cases Reports of Cases before the Court and Reports of European Community Staff Cases Reports of Cases before the Court
Total
Agencies
Cedefop — Vocational training Official Gazette of the Community Plant Variety Office Official Journal of the Office for Harmonisation in the Internal Market OHIM Bulletin
Grand total
1997
319 (<)
492 1 714 (5)
2 525
2 401 480
1 466 630
21 104
1998
197
451 1 857
2 505
2 186 481
1 398 562 (6)
19 452
Change (%)
-38.24
-8.33 + 8.34
-0.79
-8.95 + 0.21 -4.64
-10.79
-7.83 0) New subscription in 1998. (2) Subscription discontinued in 1998. (3) Includes one complete series (all themes) and the five series by theme. (4) Includes 261 subscriptions via a specialist distributor. (5) Includes 165 subscriptions via a specialist distributor. (6) Plus 41 CD-ROM subscriptions not invoiced in 1998 because of late delivery.
Table 13 — Trends in document subscriptions
Title
Parliament
Reports: microfiche subscriptions (2)
Commission
COM Documents: — full subscriptions — selective subscriptions (2) — microfiche subscriptions Decisions: Merger Task Force (3)
Total
Economic and Social Committee
Opinions: — full subscriptions — microfiche subscriptions
Total
Committee of the Regions
Opinions: — full subscriptions
Grand total
1997 0)
120
291 1 985
181 74
2 651
108 118
226
3
2 806
1998 0)
—
398 —
179 67
644
119 112
231
4
879
Change (%)
—
+ 36.77 —
-1.11 -9.46
- 75.71
+ 10.19 -5.08
+ 2.21
+ 33.33
- 68.67 0) These figures include interinstitutional subscriptions. (2) Subscription withdrawn In 1998. (3) 74 subscriptions in 1997 not included in 1997 report (change -9.46 %).
45
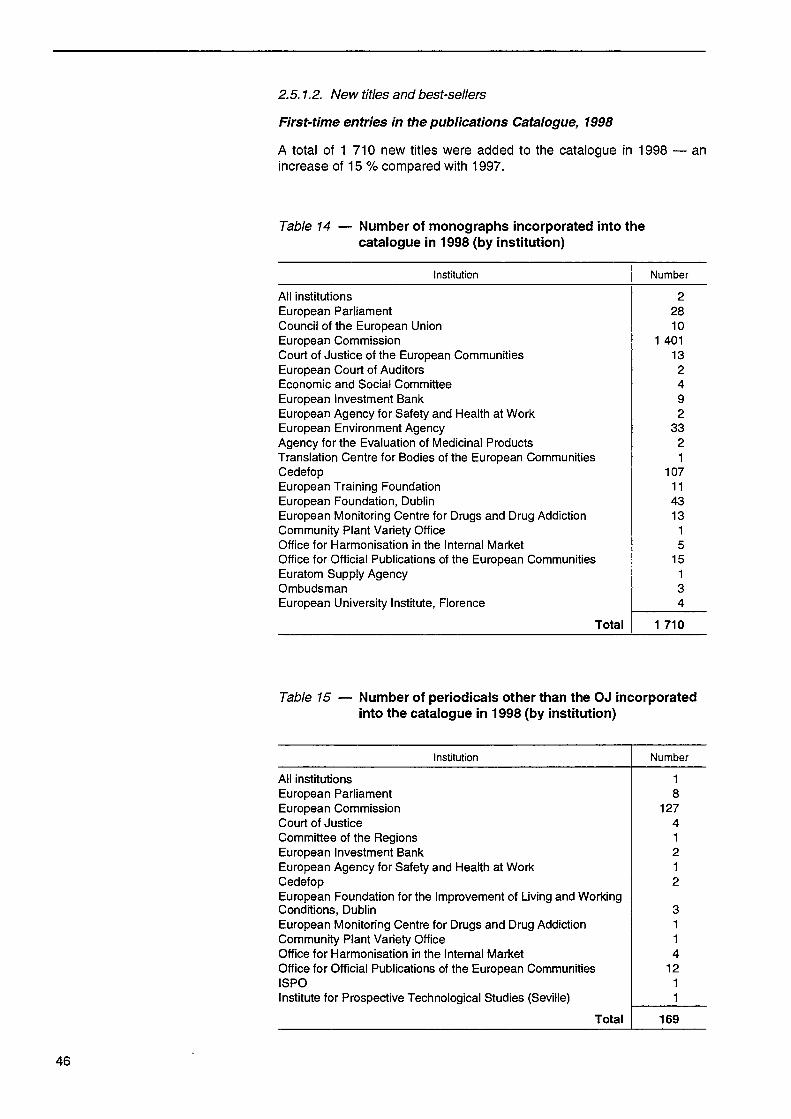
2.5.1.2. New titles and best-sellers
First-time entries in the publications Catalogue, 1998
A total of 1 710 new titles were added to the catalogue in 1998 increase of 15 % compared with 1997.
— an
Table 14 — Number of monographs incorporated into the catalogue in 1998 (by institution)
Institution
All institutions European Parliament Council of the European Union European Commission Court of Justice of the European Communities European Court of Auditors Economic and Social Committee European Investment Bank European Agency for Safety and Health at Work European Environment Agency Agency forthe Evaluation of Medicinal Products Translation Centre for Bodies of the European Communities Cedefop European Training Foundation European Foundation, Dublin European Monitoring Centre for Drugs and Drug Addiction Community Plant Variety Office Office for Harmonisation in the Internal Market Office for Official Publications of the European Communities Euratom Supply Agency Ombudsman European University Institute, Florence
Total
Number
2 28 10
1 401 13 2 4 9 2
33 2 1
107 11 43 13 1 5
15 1 3 4
1 710
Table 15 — Number of periodicals other than the OJ incorporated into the catalogue in 1998 (by institution)
Institution
All institutions European Parliament European Commission Court of Justice Committee of the Regions European Investment Bank European Agency for Safety and Health at Work Cedefop European Foundation for the Improvement of Living and Working Conditions, Dublin European Monitoring Centre for Drugs and Drug Addiction Community Plant Variety Office Office for Harmonisation in the Internal Market Office for Official Publications of the European Communities ISPO Institute for Prospective Technological Studies (Seville)
Total
Number
1 8
127 4 1 2 1 2
3 1 1 4
12 1 1
169
46
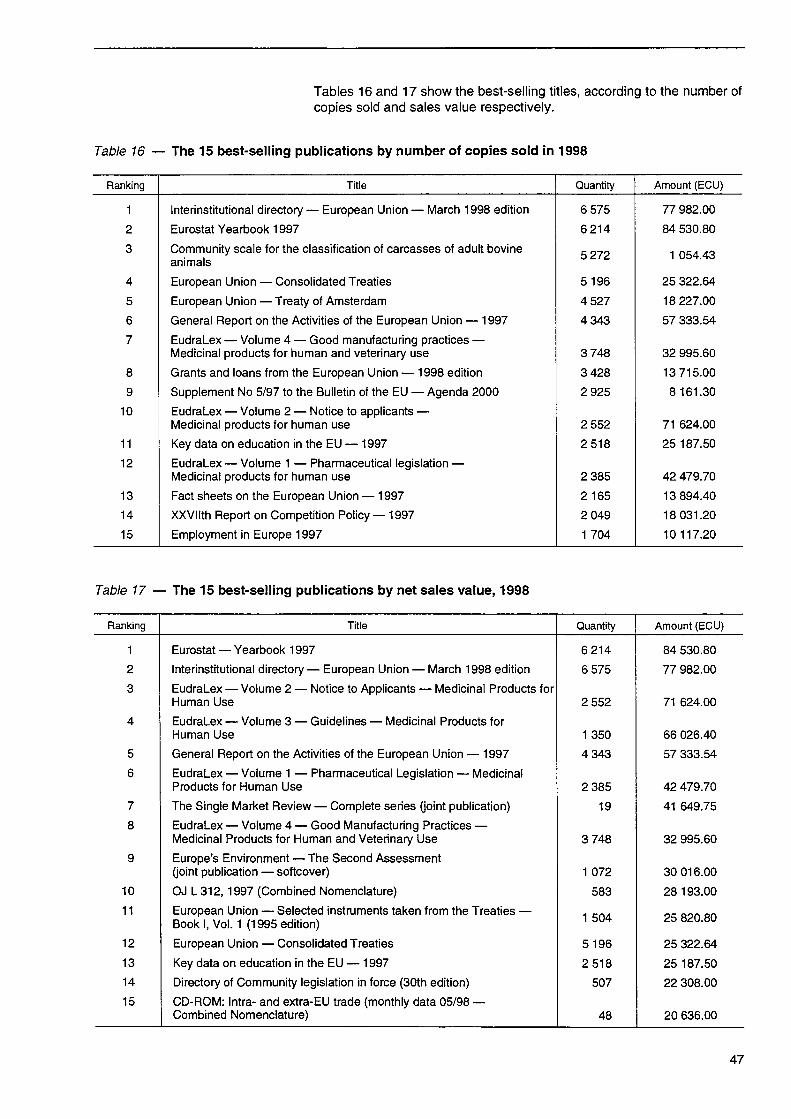
Tables 16 and 17 show the best-selling titles, according to the number of copies sold and sales value respectively.
Table 16 — The 15 best-selling publications by number of copies sold in 1998
Ranking
1 2 3
4 5 6 7
8 9
10
11 12
13 14 15
Title
Interinstitutional directory — European Union — March 1998 edition Eurostat Yearbook 1997 Community scale for the classification of carcasses of adult bovine animals European Union — Consolidated Treaties European Union — Treaty of Amsterdam General Report on the Activities of the European Union — 1997 EudraLex — Volume 4 — Good manufacturing practices — Medicinal products for human and veterinary use Grants and loans from the European Union — 1998 edition Supplement No 5/97 to the Bulletin of the EU — Agenda 2000 EudraLex — Volume 2 — Notice to applicants — Medicinal products for human use Key data on education in the EU — 1997 EudraLex — Volume 1 — Pharmaceutical legislation — Medicinal products for human use Fact sheets on the European Union — 1997 XXVIIth Report on Competition Policy— 1997 Employment in Europe 1997
Quantity
6 575 6214
5 272
5196 4 527 4 343
3 748 3 428 2 925
2 552 2518
2 385 2 165 2 049 1 704
Amount (ECU)
77 982.00 84 530.80
1 054.43
25 322.64 18 227.00 57 333.54
32 995.60 13 715.00 8 161.30
71 624.00 25 187.50
42 479.70 13 894.40 18 031.20 10 117.20
Table 17 — The 15 best-selling publications by net sales value, 1998
Ranking
1 2 3
4
5 6
7 8
9
10 11
12 13 14 15
Title
Eurostat — Yearbook 1997 Interinstitutional directory — European Union — March 1998 edition EudraLex — Volume 2 — Notice to Applicants — Medicinal Products for Human Use EudraLex — Volume 3 — Guidelines — Medicinal Products for Human Use General Report on the Activities of the European Union — 1997 EudraLex — Volume 1 — Pharmaceutical Legislation — Medicinal Products for Human Use The Single Market Review — Complete series (joint publication) EudraLex — Volume 4 — Good Manufacturing Practices — Medicinal Products for Human and Veterinary Use Europe's Environment — The Second Assessment (joint publication — softcover) OJ L312,1997 (Combined Nomenclature) European Union — Selected instruments taken from the Treaties — Book I, Vol. 1 (1995 edition) European Union — Consolidated Treaties Key data on education in the EU — 1997 Directory of Community legislation in force (30th edition) CD-ROM: Intra- and extra-EU trade (monthly data 05/98 — Combined Nomenclature)
Quantity
6214 6 575
2 552
1 350 4343
2 385 19
3 748
1 072 583
1 504
5196 2518
507
48
Amount (ECU)
84 530.80 77 982.00
71 624.00
66 026.40 57 333.54
42 479.70 41 649.75
32 995.60
30 016.00 28 193.00
25 820.80
25 322.64 25 187.50 22 308.00
20 636.00
47
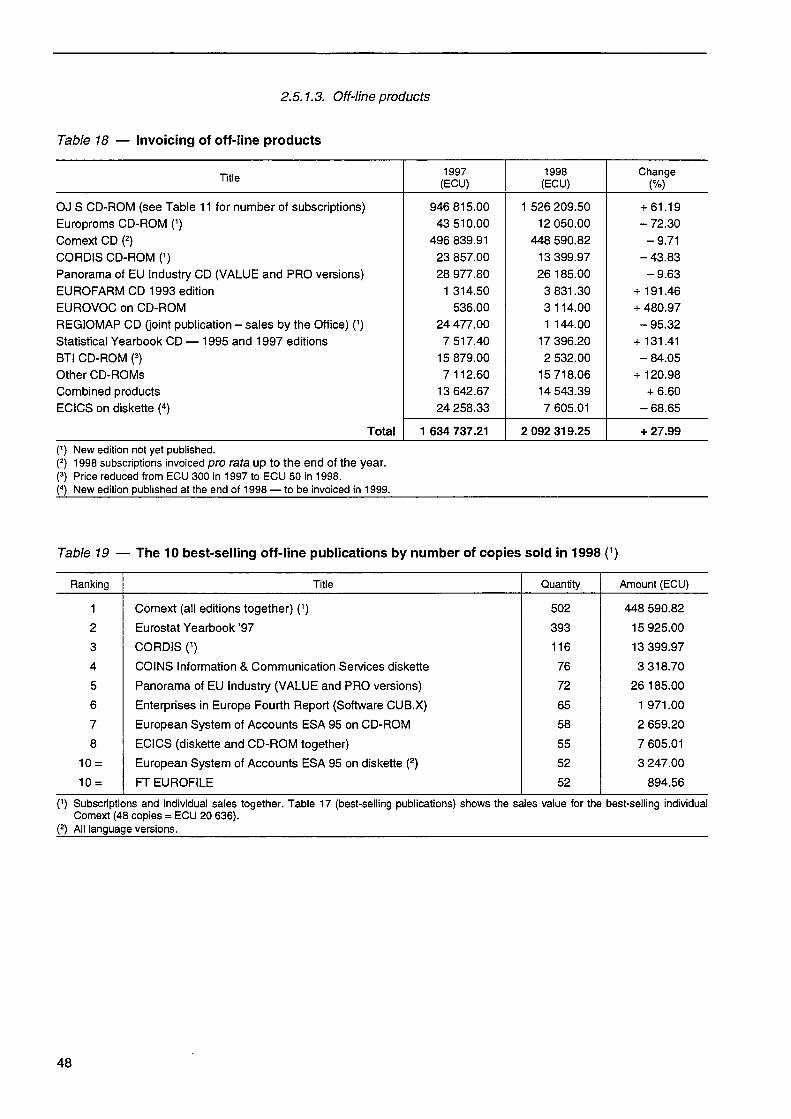
2.5.1.3. Off-line products
Table 18 — Invoicing of off-line products
Title
OJ S CD-ROM (see Table 11 for number of subscriptions) Europroms CD-ROM (') Comext CD (2) CORDIS CD-ROM (1) Panorama of EU Industry CD (VALUE and PRO versions) EUROFARM CD 1993 edition EUROVOC on CD-ROM REGIOMAP CD (joint publication - sales by the Office) (1) Statistical Yearbook CD — 1995 and 1997 editions BTI CD-ROM (3) Other CD-ROMs Combined products ECICS on diskette («)
Total
1997 (ECU)
946 815.00 43 510.00
496 839.91 23 857.00 28 977.80
1 314.50 536.00
24 477.00 7 517.40
15 879.00 7 112.60
13 642.67 24 258.33
1 634 737.21
1998 (ECU)
1 526 209.50 12 050.00
448 590.82 13 399.97 26 185.00
3 831.30 3 114.00 1 144.00
17 396.20 2 532.00
15 718.06 14 543.39 7 605.01
2 092 319.25
Change (%)
+ 61.19 - 72.30
- 9 . 7 1 - 4 3 . 8 3
- 9 . 6 3 + 191.46 + 480.97
- 95.32 + 131.41
- 8 4 . 0 5 + 120.98
+ 6.60 - 68.65
+ 27.99 0) New edition not yet published. (2) 1998 subscriptions invoiced pro rata up to the end of the year. (3) Price reduced from ECU 300 in 1997 to ECU 50 in 1998. C) New edition published at the end of 1998 — to be invoiced in 1999.
Table 19 — The 10 best-selling off-line publications by number of copies sold in 1998 (1)
Ranking
1 2 3 4 5 6 7 8
10 =
10 =
Title
Comext (all editions together) (1)
Eurostat Yearbook '97
CORDIS (1)
COINS Information & Communication Services diskette
Panorama of EU Industry (VALUE and PRO versions)
Enterprises in Europe Fourth Report (Software CUB.X)
European System of Accounts ESA 95 on CD-ROM
ECICS (diskette and CD-ROM together)
European System of Accounts ESA 95 on diskette (2)
FT EUROFILE
Quantity
502 393 116 76 72 65 58 55 52 52
Amount (ECU)
448 590.82
15 925.00
13 399.97
3 318.70
26 185.00
1 971.00
2 659.20
7 605.01
3 247.00
894.56
0) Subscriptions and individual sales together. Table 17 (best-selling publications) shows the sales value for the best-selling individual Comext (48 copies = ECU 20 636).
(2) All language versions.
48

Table 20 — The 10 best-selling off-line publications by net sales value, 1998
Ranking
1 2 3 4 5 6 7 8 9
10
Title
Comext (all editions together) (1) Panorama of EU Industry (VALUE and PRO editions) Eurostat Yearbook (1997 edition) CORDIS (1) Europroms ECICS EUROFARM COINS European System of Accounts ESA 95 on diskette (2) EUROVOC
Quantity
502 72
393 116
12 55 11 76 52 24
Amount (ECU)
448 590.82 26 185.00 15 925.00 13 399.97 12 050.00 7 605.01 3 831.30 3 318.70 3 247.00 3114.00
0) Subscriptions and individual sales together. Table 17 (best-selling publications) shows the sales value for the best-selling individual Comext (48 copies = ECU 20 636).
(2) All language versions.
49

2.5.2. Databases 2.5.2.1. Developments and customer trends
On 31 December 1998, the commercial database situation was as follows:
a) Number of databases distributed: 5 — CELEX — EUDOR — APC — OIL — Sesame
b) Number of databases which became free of charge or were merged with others: 2
— ECLAS (1.1.1998) — TED (1.1.1999, announced in the course of the year)
The trend towards databases being made available free of charge was confirmed in 1998 — particularly in the case of TED, the most attractive in commercial terms.
On 1 October 1998, the Office provisionally took over responsibility for the TED serverfrom DG XIII at very short notice, pending the launch of the new product, on another server, scheduled for April 1999.
1. Direct customers
Table 21 shows the trends in the number of contracts managed directly by the Office.
Table 21 — Trends in the number of contracts
Customers
ECHO Standard customers EICs Flat-rate TED Gateways
Total
EUROBASES Standard customers Universities Translators Rural information forums Data suppliers ECD EICs BC-NET/BRE Permanent representations Urban Information Forums Info-Points Europe Gateways Other Flat-rate CELEX
Total
Grand total
1997
372 184 — 18
574
55 59 41 65 4
314 183
19 11 17 39 18 19 —
844
1 485
1998
373 181 283
18 0)
855
94 63
133 82 2
369 179
12 12 17 54 18 51 71
1 157
2 012
Change (number)
+ 1 - 3
+ 283
+ 281
+ 39 + 4
+ 92 + 17 - 2
+ 55 - 4 - 7 + 1
0 + 15
0 + 32 + 71
+ 313
+ 594 (1) Two gateways terminated their contracts on 31 December 1998.
50

2. Licences
Table 22 — Invoicing of licences for databases
1. CELEX 2. SCAD(1) 3. INFO 92 4. Sesame 5. TED(2) 6. OJ(3)
Subtotal EUR-OP 7. REGIO 8. New Cronos 9. Comext
10. Royalties 11. Various publications
Subtotal Eurostat
12. RTC (DG XXI) 13. Business & Consumer Survey
(DG II)
Total
1997 (ECU)
321 234.70 26 070.50 - 771.00 4 125.00
920 178.30 54 556.50
1 325 394.00 860.00
45 128.00 46 100.00 33 827.97
— 125 915.97
3 000.00
— 1 454 309.97
1998 (ECU)
377 886.30 - 1 6 977.00
— 2 062.50
778 475.20 22 415.50
1 163 862.50 4 725.00
106 725.00 53 600.00
— 3 500.00
168 550.00
750.00
6 200.00
1 339 362.50
Change (%)
+ 17.6 — —
-50.0 -15.4 -58.9
-12.2 + 449.4 + 136.5
+ 16.3 — —
+ 33.9
-75.0
— -7 .9
0) SCAD: negative figure because of reimbursement following free distribution of the on-line edition.
(2) In spite of the increase in the number of TED licences and the fact that the price of the licence remained unchanged, sales value decreased because, for the majority of licences in force in 1998, only part of the fee was invoiced pending free distribution of the on-line edition, announced for 1 January 1999 and introduced on schedule.
(3) Regular provision of OJ data (L+C Series) in FORMEX V.2 to two licence-holders and two subscribers.
Licensing contracts in force as at 31 December 1998 (1997 figures in CELEX SCAD INFO 92 SESAME TED OJ REGIO New Cronos Comext RTC
parentheses)
Eurostat publications Business & Consumer Survey
24 (22) 3 (5)
- (1) 1 (D
41 (35) 2 (2) 2 (2) 7 (4) 3 (1) 1 (D 1 ( - ) 1 ( - )
Total 86 (74)
Notes
As in 1997, CELEX and TED continued to be the flagship licensing products, accounting for 64 of the 86 licences in force, or 74 % of the total number and 86 % of the total amount invoiced.
The increase in the number of licences for statistical databases and in invoicing for Eurostat can mainly be explained by the development of the New Cronos database.
51

2.5.2.2. Invoicing of on-line products
Table 23 gives details, for all the commercial databases, of direct invoicing of customers by the Office and the invoicing of gateways by the Office for their customers' consumption.
It should be noted that:
— Gateway-invoicing includes a 'commission' component of between 25 % and 40 % depending on the turnover. This component — which obviously did not exist with a direct invoicing system — results in a reduction in the net amount. Furthermore, since gateway-invoicing takes place at the end of the contractual period, it does not necessarily reflect consumption per calendar year.
— The downward trend in on-line consultation of CELEX continued, but was less steep than in the previous year, which means that this database has a hard core of very faithful users, who make professional use of the extra benefits it provides in spite of the alternatives available free of charge.
— The reduction in total turnover may seem slight, but this is a short-term phenomenon resulting from the flat-rate subscriptions to the TED database taken out when the paper edition of the OJ S Series was discontinued, which will mean a correspondingly greater loss of revenue for 1999 as a result of the fact that TED is now available free of charge.
The downward trend in sales revenue from databases is very marked and must be taken into account in future budget estimates.
Table 23 — Invoicing of on-line electronic products
Database
CELEX — direct — gateway — flat rate
SCAD — direct — gateway
Sesame — direct — gateway
ECLAS — direct — gateway
Eurocron — direct — gateway
INFO 92 — direct — gateway
Total
Total
Total
Total
Total
Total
1997 (ECU)
40 160.71 189 000.49
229 161.20
781.56 5 102.70
5 884.26
66.58 1 134.57
1 201.15
439.90 1 775.85
2 215.75
22.27 344.70
366.97
238.38 1 645.58
1 883.96
1998 (ECU)
35 036.34 89 723.35 71 150.00
195 909.69
142.10
142.10
4.33 439.63
443.96
6.10 566.15
572.25
—
—
—
—
% change
- 12.76 - 52.53
-14.51
- 97.21
- 97.21
- 93.49 -61.25
-63.04
- 98.61 -68.11
-74.17
52

Table 23 (cont.) — Invoicing of on-line electronic products
Database
OIL — direct — gateway
RAPID — direct — gateway
ABEL — direct — gateway
ABEL — document delivery — direct — gateway
APC — direct — gateway
EUDOR — document delivery MTF — direct — gateway
EUDOR — document delivery OJ — direct — gateway
EUDOR — document delivery COM doc. — direct — gateway
EUDOR — document delivery Consleg — direct — gateway
TED MIN — direct — gateway
TED DOC — format 'ALL' (for documents — direct — gateway
TED DOC — format 'EXTRA' (for docume — direct — gateway — flatfee
Total
Total
Total
Total
Total
Total
Total
Total
Total
Total retrieved)
Total >nts retrieved)
Total
Total direct
Total gateway
Grand total
1997 (ECU)
114.73 460.77
575.50
1 091.72 23 566.06
24 657.78
308.12 5 985.20
6 293.32
13.37 1 209.06
1 222.43
240.44 4 149.55
4 389.99
—
—
7 338.36 1 104.37
8 442.73
—
—
—
—
70 992.15 138 308.23
209 300.38
117 179.20 238 994.08
356 173.28
28 956.10 47 061.33
76 017.43
267105.81
658 614.95
925 720.76
1998 (ECU)
16.69 619.76
636.45
—
—
—
—
—
—
2 224.65 1 425.30
3 649.95
3.75 274.43
278.18
5 432.62 4 544.52
9 977.14
961.98 2 148.04 3 110.02
231.21 205.14
436.35
15 077.85 77 979.82
93 057.67
132 627.90 258 838.78
391 466.68
30 048.17 28 351.51
115 846.90
174 246.58
221 671.59
652 255.43
873 927.02
% change
- 85.45 34.50
10.59
825.24 - 65.65
-16.86
- 25.97 311.50
18.17
- 78.76 -43.62
- 55.54
13.18 8.30
9.91
3.77 - 39.75
129.21
-17.01
-0.96
-5.59
53

In 1998, a flat-rate subscription was introduced for CELEX and TED (see Table 21 ), with a simple invoicing system that is attractive to subscribers. It produced considerable revenue (see Table 23).
2.6. Review and prospects
The quest for legitimacy in the eyes of citizens and the will of the authors to make their work as widely known as possible have led the institutions to favour free distribution, which may be perceived as being contradictory to their attempts to economise and obtain further budgetary resources.
These two approaches on the part of the institutions occur at a time when the publishing world is undergoing the after-effects of technological and social changes. Nevertheless, it should be noted that in this area as in others, behaviour changes progressively over a period of years without necessarily resulting in the disappearance of more traditional media forms.
Most of the Publications Office's clients use its products professionally and have specific expectations and requirements. In most cases they are private or public sector organisations with budgets for obtaining information. They have computer systems which are sometimes very difficult to administer and develop. Some are particularly reticent with regard to technological innovation. Most have seen their budgets for purchasing publications severely cut back in the past few years.
Clients wish to obtain from the Publications Office a range of products which take their needs into account. They demand that the Publication Office's services be regular and reliable and the information up to date. Although it is true that access to information free of charge is attractive to clients, they are still very demanding as regards quality of service. Some prefer to pay for information, which imposes an obligation on the publisher to produce results.
The Publications Office has no sales staff in the field and will continue to use the services of local agents where geographical constraints demand this.
For some years, income from the sale of Official Journal subscriptions has paid for a large share of the activities for promoting the Publication Office's products. The sharp decline in this income will necessitate a revision of some of the support activities organised by its partners.
Furthermore, a shrewd sales policy must be able to rely on good publishing discipline in both the administration of publishing programmes and the establishment of schedules for launching new products.
Sales activity will persist, of course, but will undergo changes: it will develop or decline depending on the priorities and targets set. It is, however, likely to continue to occupy a privileged position with regard to the professional and actively interested public.
The Publications Office will have to seek to redefine the objectives of its sales policy on the basis of a balance between these approaches, which seem to be contradictory.
For this purpose, the Office must bear in mind the following elements in particular:
54

A. The co-existence, in its supply programme, of products provided free of charge and products distributed against payment. The effect of the first on the second can be measured only in the light of several years' experience. However, some interinstitutional decisions regarding legislative documents are likely to provide some clear pointers, e.g.
— information creating obligations for the citizen must be free of charge;
— although the information in itself is free of charge, the medium for making it accessible, if other than the Internet (magnetic tape, cartridge, etc) is subject to a charge;
— any value added to the basic information gives rise to payment.
B. The distribution of the same material on different media (paper, on-line databank, CD-ROM, Internet). Here, too, only experience will allow us to gauge the market's reaction to different media.
Nevertheless, an interinstitutional consensus based on the following considerations is becoming apparent:
— forthe time being, any information with legal effect must be available on paper, since electronic media can serve only as a supplementary medium;
— paperless publication (only electronic publication) may provide an alternative for some types of official information without legal effect, especially if the associated search functions facilitate consultation.
C. The development of electronic trade. We must base our considerations on the idea that most orders will soon be received by the Publications Office by electronic means via the Internet. New links must be set up with intermediaries, whose role will be substantially changed.
D. A certain degree of centralisation of the message-handling function. This movement is no doubt inescapable since:
— the introduction of the euro has neutralised the problem of payment in national currency;
— the need to have stocks in the Member States, in geographical proximity to clients, is no longer as self-evident as it was as a result of more electronic circulation of information. The proportion transferred via tangible media benefits from the improved functioning of postal services in the wake of their liberalisation;
— clients are becoming more and more accustomed to a rapid '24-hour service' which can be run in an optimum fashion only by a single centralised structure.
55


3. Coédition and copyright
3.1. Introduction
3.2. Coédition
3.3. Copyright
3.4. Fixed payments and royalties
3.5. European Publishers' Forum


3.1. Introduction While the number of joint publications was down on 1997, the number of publication and translation licences (full and partial) continued to grow. The fixed payments and royalties invoiced were substantially higher.
The Office intends to intensify its partnership with private publishers through the Publishers' Forum and to improve the results.
3.2. Coédition
Fourteen joint publications appeared in 1998, compared with 51 in 1997. This reduction was mainly due to the fact that 1997 saw the appearance of 39 studies in the series 'The Single Market Review'. Six joint-publication contracts were signed (17 in 1997) and ten were being negotiated as at 31 December (seven in 1997).
3.3. Copyright
As in 1997, the number of requests involving various aspects of copyright for Community publications increased in 1998 compared with the previous year—from 574 to 647 (+12.7 %). These included in particular 91 requests for reproduction, for non-personal use, of documents distributed by EUR-Lex, most of which the Office received by e-mail and which concerned the Official Journal section of EUR-Lex. Reproduction was authorised in 19 cases, mostly for non-commercial purposes.
Sixty licences were issued, 37 of which were for translation (31 in 1997). The increase in the number of translation licences can be explained by the need for the central and eastern European countries to prepare, at both administrative and private level, for accession to the European Union.
3.4. Fixed payments and royalties
In 1998, fixed payments and royalties were invoiced for a total of ECU 218 166.05 (ECU 120 825 in 1997) — an increase of 80.6 %.
3.5.1. Members
3.5.2. Meetings
3.5. European Publishers' Forum
As at 31 December 1998, and following the results of a validation survey of the parties concerned, the Forum comprised:
— 193 full members (publishing houses), and
— 189 guest members (European organisations, various representatives of publishing houses, representatives of European institutions etc.).
Two meetings of the Forum were held in 1998.
The fifth meeting was held in Luxembourg on 27 April 1998. It was attended by more than 80 members, including publishers and representatives of the Commission and other European organisations. In addition to the
59

contributions by the representatives of the European Publishers' Federation and the Office, mention should be made of contributions by the following bodies:
— European Administration Institute, Maastricht;
— the Coordination of Regulatory Activities Unit of the Commission's DG III (Industry).
The sixth meeting was held in Frankfurt on 8 October 1998. It was attended by around 60 members as well as several guests, who presented their publication programmes and submitted a number of documents to the members of the Forum:
— European Monitoring Centre for Drugs and Drug Addiction (Lisbon);
— Eurydice — Education information network in the European Community;
— Commission DG II (Economic and Financial Affairs);
— Eurostat.
3.5.3. Catalogue Each year, on the occasion of the Frankfurt Book Fair, the Office produces a catalogue containing a selection of publications on European subjects produced by the members of the Forum. The 1998 edition contained around 200 titles in English, French and German, from 41 Austrian, Belgian, British, Danish, Dutch, French, German, Irish and Italian publishers.
3.5.4. Newsletter and website Two newsletters were published in 1998, with new content and a new lay-out. They mainly provided information on the activities of the Forum — meetings, catalogue, etc. — and on manuscripts offered for licensing.
Work on constructing an Internet site began in 1998, and a prototype was presented in Frankfurt. The finishing touches should be made in 1999.
3.5.5. Results The Forum is now fully operational. Its failure so farto produce the results hoped for has largely been due to a lack of material likely to interest private publishers. However, the Office has stepped up its means of making the various departments of the institutions aware of this new approach to publishing, which is in line with the policy of subsidiarity and partnership.
60
4. Activities of the accounts office
4.1. Budget accounting
4.2. Commercial accounting


4.1. Budget accounting
Total budget expenditure in 1998 was ECU 53 863 229.17, amounting to 99.68 %, of the available appropriations (ECU 54 036 000). Expenditure was broken down as follows:
— 93.73 % (ECU 50 650 540.59) in payment appropriations;
— 5.95 % (ECU 3 212 688.58) in appropriations carried forward from 1998 to 1999.
The rate of utilisation of appropriations varies from one title to another, as shown in the Table below:
Title 1 Title 2 Title 3
Total
Appropriations available
32 539 000 20 057 000
1 440 000
54 036 000
1998 expenditure
Expenditure as at 31.12.1998
32 085 675.55 17 508 696.66
1 056 168.38
50 650 540.59
%
98.61 87.29 73.35
93.73
Appropriations carried forward
347 892.61 2 481 981.62
382 814.35
3 212 688.58
%
1.07 12.37 26.58
5.95
Total
32 433 568.16 19 990 678.28
1 438 982.73
53 863 229.17
%
99.68 99.67 99.93
99.68
With only 5.95 % of appropriations carried forward to cover expenditure contracted in 1998 but not yet cleared for payment by the end of the accounting year, the Office remained very close to the theoretical limit of its budget, having spent 99.68 % of the available funds.
The 0.85 % reduction in the rate of exchange of the ecu against the Luxembourg franc made it difficult (forthe last time) to keep track of staff costs and obliged the Office to make a large number of minor technical adjustments, particularly to items relating to staff costs.
Seven appropriation transfers were made in connection with the 1998 budget. Exceptionally, one of these was from Title 2 to Title 3 to boost the CELEX budget and offset the loss of revenue resulting from the launching of the EUR-Lex site.
The Office continued to have cash-flow problems with the amounts advanced to the institutions in connection with free distribution. However, by the end of the year, a new system had been established with the Commission (which spends by farthe largest amounts in this area), and it is to be hoped that this problem is now a thing of the past.
Table 24 recapitulates the Office's expenditure for 1997 and gives details of the utilisation of the 1998 budget.
Table 25 shows the breakdown of the Office's expenditure in 1998 by department.
Table 26 shows the amounts invoiced pro forma for services rendered to the institutions by the various departments of the Publications Office.
63

CD •f* Table 24 — Budget out-turn in 1998
(ECU)
Item
1100
1101
1102
1103
1110
1120
1130
1131
1132
1140
1141
1147
1150
1174
1175
1181
1182
1183
1184
Heading
Basic salaries
Family allowances
Expatriation allowances etc.
Secretariat allowances
Total Article 110
Auxiliary staff
Further training for staff
Sickness insurance
Accident insurance
Unemployment insurance
Total Article 113
Birth/death grants
Annual leave travel expenses
Shift work standby allowances
Total Article 114
Overtime
Total Article 115
Freelance proof-readers
Other work sent out
Total Article 117
Travel expenses
Installation allowances
Removal allowances
Temporary subsistence allowance
Total Article 118
1998 appropriations Initial
appropriations
22 209 000
2 350 000
2 985 000
192 000
27 736 000
304 000
90 000
757 000
175 000
7 000
939 000
500
407 000
35 000
442 500
53 000
53 000
1 267 000
72 000
1 339 000
35 000
60 000
72 000
150 000
317 000
Transfers
- 362 000
134 500
17 200
4 600
- 205 700
464 500
17 000
3 500
- 2 400
- 7 0 0
400
1 000
40 000
12 400
53 400
- 3 700
- 3 700
- 40 000
32 000
- 8 000
- 30 500
23 100
14 000
- 1 1 4 000
- 1 0 7 400
Final appropriations
21 847 000
2 484 500
3 002 200
196 600
27 530 300
768 500
107 000
760 500
172 600
6 300
939 400
1 500
447 000
47 400
495 900
49 300
49 300
1 227 000
104 000
1 331 000
4 500
83 100
86 000
36 000
209 600
1998 expenditure Expenditure
at 31.12.1998
21 838 402.86
2 482 384.81
3 000 908.08
196 197.67
27 517 893.42
763 476.01
71 807.30
759 448.93
171 987.33
6 250.31
937 686.57
785.66
444 715.83
47 009.21
492 510.70
49 051.51
49 051.51
1 174 328.28
79 508.00
1 253 836.28
4 151.40
82 618.16
68 169.05
35 536.67
190 475.28
Appropriations carried forward
0.00
0.00
0.00
0.00
0.00
0.00
29 181.18
0.00
0.00
0.00
0.00
0.00
0.00
0.00
0.00
0.00
0.00
52 671.72
24 492.00
77 163.72
348.60
481.84
17 830.95
463.33
19 124.72
Total expenditure
21 838 402.86
2 482 384.81
3 000 908.08
196 197.67
27 517 893.42
763 476.01
100 988.48
759 448.93
171 987.33
6 250.31
937 686.57
785.66
444 715.83
47 009.21
492 510.70
49 051.51
49 051.51
1 227 000.00
104 000.00
1 331 000.00
4 500.00
83 100.00
86 000.00
36 000.00
209 600.00
1997 expenditure
21 296 014.96
2 307 543.17
2 893 595.95
185 194.16
26 682 348.24
480 320.17
94 000.00
732 575.82
165 975.31
6 612.18
905 163.31
0.00
403 344.32
58 947.26
462 291.58
51 732.22
51 732.22
1 750 000.00
168 000.00
1 918 000.00
27 000.00
175 000.00
114 000.00
188 000.00
504 000.00
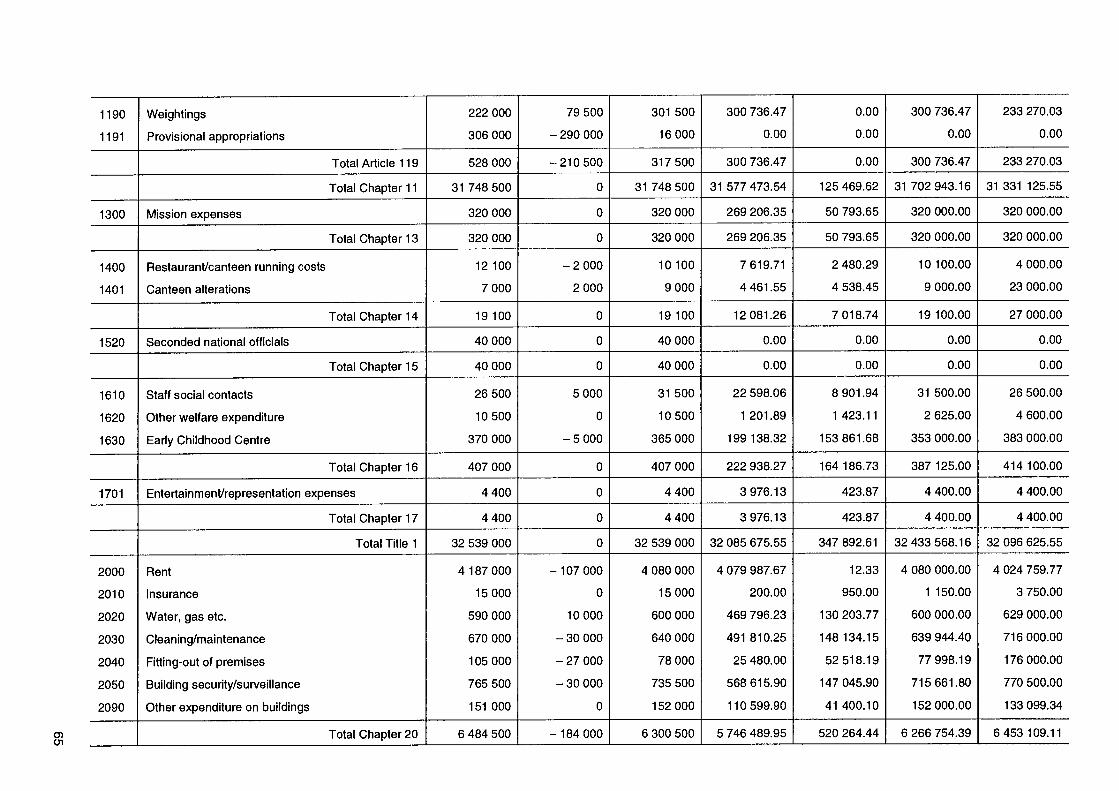
CT) en
1190
1191
1300
1400
1401
1520
1610
1620
1630
1701
2000
2010
2020
2030
2040
2050
2090
Weightings
Provisional appropriations
Total Article 119
Total Chapter 11
Mission expenses
Total Chapter 13
Restaurant/canteen running costs
Canteen alterations
Total Chapter 14
Seconded national officials
Total Chapter 15
Staff social contacts
Other welfare expenditure
Early Childhood Centre
Total Chapter 16
Entertainment/representation expenses
Total Chapter 17
Total Title 1
Rent
Insurance
Water, gas etc.
Cleaning/maintenance
Fitting-out of premises
Building security/surveillance
Other expenditure on buildings
Total Chapter 20
222 000
306 000
528 000
31 748 500
320 000
320 000
12 100
7 000
19 100
40 000
40 000
26 500
10 500
370 000
407 000
4 400
4 400
32 539 000
4 187 000
15 000
590 000
670 000
105 000
765 500
151 000
6 484 500
79 500
- 290 000
- 2 1 0 5 0 0
0
0
0
- 2 000
2 000
0
0
0
5 000
0
- 5 000
0
0
0
0
- 1 0 7 000
0
10 000
- 30 000
- 27 000
- 30 000
0
-184 000
301 500
16 000
317 500
31 748 500
320 000
320 000
10 100
9 000
19 100
40 000
40 000
31 500
10 500
365 000
407 000
4 400
4 400
32 539 000
4 080 000
15 000
600 000
640 000
78 000
735 500
152 000
6 300 500
300 736.47
0.00
300 736.47
31 577 473.54
269 206.35
269 206.35
7 619.71
4 461.55
12 081.26
0.00
0.00
22 598.06
1 201.89
199138.32
222 938.27
3 976.13
3 976.13
32 085 675.55
4 079 987.67
200.00
469 796.23
491 810.25
25 480.00
568 615.90
110 599.90
5 746 489.95
0.00
0.00
0.00
125 469.62
50 793.65
50 793.65
2 480.29
4 538.45
7 018.74
0.00
0.00
8 901.94
1 423.11
153 861.68
164 186.73
423.87
423.87
347 892.61
12.33
950.00
130 203.77
148 134.15
52 518.19
147 045.90
41 400.10
520 264.44
300 736.47
0.00
300 736.47
31 702 943.16
320 000.00
320 000.00
10 100.00
9 000.00
19 100.00
0.00
0.00
31 500.00
2 625.00
353 000.00
387 125.00
4 400.00
4 400.00
32 433 568.16
4 080 000.00
1 150.00
600 000.00
639 944.40
77 998.19
715 661.80
152 000.00
6 266 754.39
233 270.03
0.00
233 270.03
31 331 125.55
320 000.00
320 000.00
4 000.00
23 000.00
27 000.00
0.00
0.00
26 500.00
4 600.00
383 000.00
414 100.00
4 400.00
4 400.00
32 096 625.55
4 024 759.77
3 750.00
629 000.00
716 000.00
176 000.00
770 500.00
133 099.34
6 453 109.11

CT) CD Table 24 (cont.) — Budget out-turn in 1998
(ECU)
Item
2100
2120
2200
2202
2203
2204
2210
2213
2230
2232
2233
2250
2251
2252
2253
2254
Heading
Computer centre operations
Staff costs computer operation
Total Chapter 21
New purchases of technical equipment
Hire of technical installations
Maintenance of installations
Office consumables
Total Article 220
New purchases of furniture
Maintenance/repair of furniture
Total Article 221
New purchases of vehicles
Hire of vehicles
Maintenance of vehicles
Total Article 223
Library/books
Library/documentation equipment
Subscriptions to newspapers/periodicals
News agency subscriptions
Binding/upkeep of books
Total Article 225
Total Chapter 22
1998 appropriations
Initial appropriations
1 755 000
2 595 000
4 350 000
195 000
725 000
311 000
3 000
1 234 000
69 000
2 000
71 000
28 500
37 000
27 000
92 500
9 000
1 500
4 600
1 500
8 000
24 600
1 422 100
Transfers
0
85 000
85 000
127 000
- 1 1 5 000
- 37 000
0
- 25 000
16 500
- 1 500
15 000
- 1 5 000
0
0
- 1 5 000
0
0
0
0
0
0
- 25 000
Fiai appropriations
1 755 000
2 680 000
4 435 000
322 000
610 000
274 000
3 000
1 209 000
85 500
500
86 000
13 500
37 000
27 000
77 500
9 000
1 500
4 600
1 500
8 000
24 600
1 397 100
1998 expenditure
Expenditure at 31.12.1998
1 514 099.50
1 833 268.38
3 347 367.88
77 223.47
479 285.27
188 688.39
1 674.07
746 871.20
38 109.61
0.00
38 109.61
0.00
29 043.09
18 256.31
47 299.40
5 417.76
0
4 280.53
1 227.04
0.00
10 925.33
843 205.54
Appropriations carried forward
240 459.34
846 450.22
1 086 909.56
244 585.88
126 243.21
84 682.84
1 325.93
456 837.86
47 344.52
500.00
47 844.52
12 626.00
7 956.91
8 743.69
29 326.60
3 582.24
1 500.00
319.47
272.96
8 000.00
13 674.67
547 683.65
Total expenditure
1 754 558.84
2 679 718.60
4 434 277.44
321 809.35
605 528.48
273 371.23
3 000.00
1 203 709.06
85 454.13
500.00
85 954.13
12 626.00
37 000.00
27 000.00
76 626.00
9 000.00
1 500.00
4 600.00
1 500.00
8 000.00
24 600.00
1 390 889.19
1997 expenditure
2 064 999.59
2 284 999.18
4 349 998.77
338 000.00
567 000.00
244 928.90
2 500.00
1 152 428.90
84 000.00
500.00
84 500.00
16 560.00
34 706.20
23 000.00
74 266.20
9 200.00
1 900.00
4 600.00
1 325.00
6 492.50
23 517.50
1 334 712.60

05 ~ N |
2300
2330
2350
2351
2352
2353
2359
2400
2410
2500
3410
3412
3430
3431
3432
3433
Stationery/Office supplies
Legal fees
Insurance
Uniforms/working clothes
Expenditure internal meetings
Removals/handling
Other operating expenditure
Total Article 235
Total Chapter 23
Postage etc.
Telephone etc.
Total Chapter 24
Meetings in general
Total Chapter 25
Total Title 2
General publications
Publicity/promotion
Total Article 341
Database dissemination
CELEX
Database production
Consolidation of Community law
Total Article 343
Total Chapter 34
Total Title 3
Grand total
900 000
1 000
500
20 000
3 400
17 000
500
41 400
942 400
6 550 000
400 000
6 950 000
58 000
58 000
20 207 000
10 000
220 000
230 000
10 000
900 000
100 000
50 000
1 060 000
1 290 000
1 290 000
54 036 000
46 000
0
0
-300
300
4 000
0
4 000
50 000
0
- 76 000
- 76 000
0
0
-150 000
0
0
0
0
150 000
0
0
150 000
150 000
150 000
0
946 000
1 000
500
19 700
3 700
21 000
500
45 400
992 400
6 550 000
324 000
6 874 000
58 000
58 000
20 057 000
10 000
220 000
230 000
10 000
1 050 000
100 000
50 000
1 210 000
1 440 000
1 440 000
54 036 000
779 987.98
0.00
0.00
11 515.35
3 413.97
14 824.47
0.00
29 753.79
809 741.77
6 460 650.58
266 790.86
6 727 441.44
34 450.08
34 450.08
17 508 696.66
6 216.23
177 178.70
183 394.93
5 173.37
734 031.59
99 605.99
33 962.50
872 773.45
1 056 168.38
1 056 168.38
50 650 540.59
165 996.62
0.00
0.00
7 814.21
286.03
6 162.58
500.00
14 762.82
180 759.44
89 349.42
57 013.94
146 363.36
1.17
1.17
2 481 981.62
3 781.00
42 821.30
46 602.30
4 593.43
315 856.11
0.01
15 762.50
336 212.05
382 814.35
382 814.35
3 212 688.58
945 984.60
0.00
0.00
19 329.56
3 700.00
20 987.05
500.00
44 516.61
990 501.21
6 550 000.00
323 804.80
6 873 804.80
34 451.25
34 451.25
19 990 678.28
9 997.23
220 000.00
229 997.23
9 766.80
1 049 887.70
99 606.00
49 725.00
1 208 985.50
1 438 982.73
1 438 982.73
53 863 229.17
912 999.99
0.00
0.00
16 500.00
3 900.00
50 000.00
500.00
70 900.00
983 899.99
7 072 000.00
400 000.00
7 472 000.00
56 766.17
56 766.17
20 650 486.64
9 998.17
219 999.28
229 997.45
9 999.22
999 965.39
99 606.00
99 606.00
1 109 570.61
1 339 568.06
1 339 568.06
54 086 680.25

Table 25 — Analytical accounting — Expenditure of the Publications Office in 1998 (ECU)
Item
1100
1101
1102
1103
1110
1120
1130
1131
1132
1140
1141
1144
1147
1150
1174
1175
1181
1182
1183
1184
1190
1300
1400
1401
1402
1520
1610
1620
1630
1701
2000
2010
2020
2030
2040
2050
2090
Heading
Basic salaries
Family allowances
Expatriation allowances etc.
Secretariat allowances
Total Article 110
Auxiliary staff
Total Article 111
Further training for staff
Total Article 112
Sickness insurance
Accident insurances
Unemployment insurance
Total Article 113
Birth/death grants
Annual leave travel expenses
Fixed travel allowances
Shift work standby allowances
Total Article 114
Overtime
Total Article 115
Freelance proof-readers
Other work sent out
Total Article 117
Travel expenses
Installation allowances
Removal allowances
Temporary subsistence allowance
Total Article 118
Weightings
Total Article 119
Total Chapter 11
Mission expenses
Total Chapter 13
Restaurant/canteen running costs
Canteen alterations
Exceptional renovation costs
Total Chapter 14
Seconded national/international officials
Total Chapter 15
Staff social contacts
Other welfare expenditure
Early Childhood Centre
Total Chapter 16
Entertainment/representation expenses
Total Chapter 17
Total Title 1
Rent
Insurance
Water, gas etc.
Cleaning/maintenance
Fitting-out ol premises
Building security/surveillance
Other expenditure on buildings
Total Chapter 20
Management/ Secretariat
615 843
70 003
84 626
5 552
776 024
6231
6231
21416
4 850
26267
22
12 541
12 563
5 512
5 512
127
2 343
2425
1015
5911
8481
8481
840988
25 376
25 376
274
244
519
855
71
9 585
10511
3243
3243
880637
110780
31
16291
17376
2118
19432
4127
170155
OP/1
Staff
620211
70500
85 226
2197
778134
1020
1020
21568
4 884
26453
22
12 630
12652
128
2360
2 442
1022
5 953
8 541
8 541
832752
14 400
14400
267
238
505
833
69
9 337
10240
857897
107920
30
15 871
16927
2063
18930
4021
165 761
Contract management
1 122494
127595
154247
18364
1422699
41457
41457
1586
1586
39036
8 840
595
48471
40
22 858
22 899
4 430
4430
231
4 271
4420
1850
10773
15458
15458
1567 773
11072
11072
498
444
942
1553
129
17402
19084
1 598 870
201131
57
29578
31547
3845
35 280
7493
308931
Planning
294 818
33512
40512
5 042
373 885
283
283
10253
2322
12 574
11
6004
6 014
728
728
61
1122
1 161
486
2830
4 060
4060
400374
288
288
126
113
239
394
33
4416
4843
405744
51041
14
7506
8006
976
8953
1902
78397
General Services
1238 237
140751
170 151
8 927
1 558 067
2 978
2 978
1767
1767
43061
9752
52 812
45
25215
29 080
54 340
35 852
35 852
25 678
25 678
255
4 712
4 876
2 041
11884
17052
17052
1760430
14 336
14 336
560
499
1058
1746
145
19561
21452
1797276
226089
64
33248
35462
4322
39 658
8423
347266
OP/2
Staff
257 693
29 292
35411
2197
324 593
707
707
8 961
2 029
10991
9
5 248
5 257
53
981
1015
425
2473
3 549
3 549
347 570
6208
6208
112
99
211
348
29
3 899
4276
358265
45 068
13
6628
7069
862
7905
1679
69223
Manufacture
1463173
166 320
201061
5 552
1836106
171400
171400
9604
9604
50 883
11523
62 406
53
29796
29 849
58160
23109
81269
302
5 568
5 762
2 412
14 043
20149
20149
2224 826
4 640
4 640
703
627
1330
2193
183
24 573
26 948
2257 744
284014
80
41767
44 547
5430
49 818
10581
436237
Proofreading
2153267
244763
295 890
1099
2695 018
99252
99252
13 058
13 058
74 882
16 958
2084
93 923
77
43 849
43 926
388 468
388468
444
8194
8 480
3 550
20 667
29 653
29 653
3 383 965
7264
7264
1069
953
2022
3 335
278
37 378
40991
3434242
432 013
122
63 531
67761
8259
75 778
16095
663558
Development and
Methods
82986
9433
11403
2786
106 608
7 029
7029
2 886
654
3 539
3
1690
1693
17
316
327
137
796
1 143
1 143
120 809
768
768
38
34
73
120
10
1340
1470
123119
15488
4
2278
2429
296
2 717
577
23789
68

(ECU
Item
2100
2120
2130
2140
2200
2201
2202
2203
2204
2210
2213
2230
2232
2233
2250
2251
2252
2253
2254
2300
2351
2352
2353
2359
2400
2410
2500
3410
3412
3430
3431
3432
3433
Heading
Computer centre operations
Stati costs computer operation
Computer operation work
Analytical and programming work
Total Chapter 21
New purchases of technical equipment
Renewable Technical Installations
Hire of equipment/installations
Maintenance/repairs to installations
Office consumables
Total Article 220
New purchases of furniture
Maintenance/repairs of furniture
Total Article 221
New purchases of vehicles
Hire of vehicles
Maintenance of vehicles
Total Article 223
Library/books
Library/documentation equipment
Subscriptions to newspapers/periodicals
News agency subscriptions
Binding/upkeep of books
Total Article 225
Total Chapter 22
Stationery/Office supplies
Total Article 230
Uniforms/working dothes
Expenditure on internal meetings
Removals/handling
Other operating expenditure
Total Article 235
Total Chapter 23
Postage etc.
Telephone etc.
Total Chapter 24
Meetings in general
Total Chapter 25
Total Title 2
General publications
Publicity/promotion
Total Article 341
Database dissemination
CELEX
Database production
Consolidation of Community law
Total Article 343
Total Chapter 34
Total Title 3
Grand total
Management/ Secretariat
8 738
16441
7423
81
32 683
2 320
14
2334
618
103
316
103
1 140
36157
4162
4162
3700
3700
7 862
6411
6411
220 586
1101233
OP/1
Staff
8 512
16 017
7231
79
31839
2 260
13
2 274
34
6
17
6
63
34176
5 392
5 392
5 392
8322
8322
213651
1071548
Contract management
15 864
29851
13476
148
59 339
4213
25
4 237
63 576
11 163
11 163
11 163
17 291
17 291
400 961
1999 831
Planning
4 026
7575
3420
38
15 058
1069
6
1075
16134
2 838
2 838
2 838
4 469
4469
101 837
507581
General Services
17 833
33555
15149
166
66 702
4 735
28
4 763
12 626
27 000
39 626
111091
15 420
15 420
13 933
16 918
500
31350
46770
23 670
23 670
528 798
2326074
OP/2
Staff
3 555
6 689
3 020
33
13 296
944
6
949
774
129
396
129
1428
15 673
2 081
2 081
2 081
3206
3206
90184
448449
Manufacture
22 402
42152
19030
209
83792
5 949
35
5 983
89775
13149
13149
13149
20 464
20464
559 626
2817370
Proofreading
34075
64117
28 946
318
127455
9 048
53
9101
136 557
18 541
18 541
18 541
28 786
28 786
847 442
4281684
Developmen and
Methods
1222
2299
1038
11
4569
324
2
326
4896
851
851
851
1295
1295
30831
153950
69

Table 25 (cont.) — Analytical accounting — Expenditure of the Publications Office in 1998 (ECU)
Item
1100
1101
1102
1103
1110
1120
1130
1131
1132
1140
1141
1144
1147
1150
1174
1175
1181
1182
1183
1184
1190
1300
1400
1401
1402
1520
1610
1620
1630
1701
2000
2010
2020
2030
2040
2050
2090
Heading
Basic salaries
Family allowances
Expatriation allowances etc.
Secretariat allowances
Total Article 110
Auxiliary staff
Total Article 111
Further training for staff
Total Article 112
Sickness insurance
Accident insurances
Unemployment insurance
Total Article 113
Birth/death grants
Annual leave travel expenses
Fixed travel allowances
Shift work standby allowances
Total Article 114
Overtime
Total Article 115
Freelance proof-ieaders
Other work sent out
Total Article 117
Travel expenses
Installation allowances
Removal allowances
Temporary subsistence allowance
Total Article 118
Weightings
Total Article 119
Total Chapter 11
Mission expenses
Total Chapter 13
Restaurant/canteen running costs
Canteen alterations
Exceptional renovation costs
Total Chapter 14
Seconded national/international officials
Total Chapter 15
Staff social contacts
Other welfare expenditure
Early Childhood Centre
Total Chapter 16
Entertainment/representation expenses
Total Chapter 17
Total Title 1
Rent
Insurance
Water, gas etc.
Cleaning/maintenance
Fitting-out of premises
Building security/surveillance
Other expenditure on buildings
Total Chapter 20
OP/3
Staff
384 356
43 690
52 816
5 552
486414
323
323
13 366
3027
16 393
14
7 827
7 841
79
1463
1514
634
3 689
5 293
5 293
519 953
2 496
2496
165
147
312
514
43
5 758
6 315
529076
66555
19
9788
10439
1272
11674
2480
102227
Manufacture
1485 011
168 802
204 062
7 828
1 865 704
26264
26264
7 059
7 059
51643
11695
63338
53
30241
30294
86 381
13780
100161
306
5 651
5848
2 448
14 253
20450
20450
2127522
17 504
17504
676
603
1279
2110
176
23 642
25 928
2172233
273257
77
40185
42 860
5 224
47 931
10180
419715
Proofreading
1 956 721
222422
268 881
2 448 024
135 899
135 899
4 666
4666
68 047
15410
2 381
85 838
70
39847
39 917
623 930
623 930
403
7 446
7 706
3226
18 780
26 946
26 946
3 383 999
62 912
62 912
1087
969
2 056
3390
283
37991
41664
3490631
439106
124
64574
68 873
8394
77022
16359
674453
Development and
Methods
214 016
24 327
29409
1687
269440
77 646
77 646
6 029
6 029
7443
1685
9128
8
4 358
4 366
22 577
2954
25 530
44
814
843
353
2054
2 947
2 947
397140
6 336
6 336
127
113
241
397
33
4447
4 877
408 594
51399
14
7559
8062
983
9016
1915
78 948
OP/4
Staff
325 392
36 988
44 714
2 786
409 879
242
242
11316
2 563
13 878
12
6626
6 638
67
1238
1281
536
3123
4481
4 481
438 242
17 280
17280
144
128
272
449
37
5032
5 518
462329
58159
16
8553
9122
1112
10202
2167
89330
Sales
709748
80 678
97 530
22 916
910 871
24279
24279
757
757
24682
5 590
30272
26
14453
14479
146
2 701
2795
1 170
6812
9774
9774
997243
5 056
5056
316
282
598
986
82
11047
12115
1015 012
127684
36
18777
20027
2441
22 397
4757
196119
Info/Promo
465158
52 875
63919
8 927
590879
9543
9 543
475
475
16176
3663
19840
17
9472
9489
96
1770
1832
767
4464
6406
6406
641096
19 072
19 072
208
186
394
649
54
7276
7 980
668 542
84100
24
12 368
13191
1608
14 752
3133
129174
Joint publishing licences
438 952
49896
60318
4473
553 639
3512
3512
525
525
15265
3 457
18 722
16
8 939
8 955
6739
6 739
90
1670
1729
724
4 213
6045
6 045
602 350
14 752
14752
195
173
368
607
51
6 802
7459
624 929
78 613
22
11561
12330
1503
13789
2 929
120 748
Logistics
379 988
43193
52216
7240
482 637
34 204
34 204
1040
1040
13214
2 993
16207
14
7738
7752
15215
15215
78
1446
1496
626
3647
5 233
5 233
565 934
8000
8000
181
161
342
564
47
6326
6937
581214
73114
21
10752
11468
1398
12 825
2 724
112 301
Document Delivery
288 267
32 767
39 612
3 375
364 021
242
242
10 025
2270
12295
10
5 870
5 881
59
1097
1135
475
2767
3970
3970
389175
10080
10080
126
112
238
393
33
4 401
4 826
404319
50862
14
7480
7978
972
8921
1895
78122
70
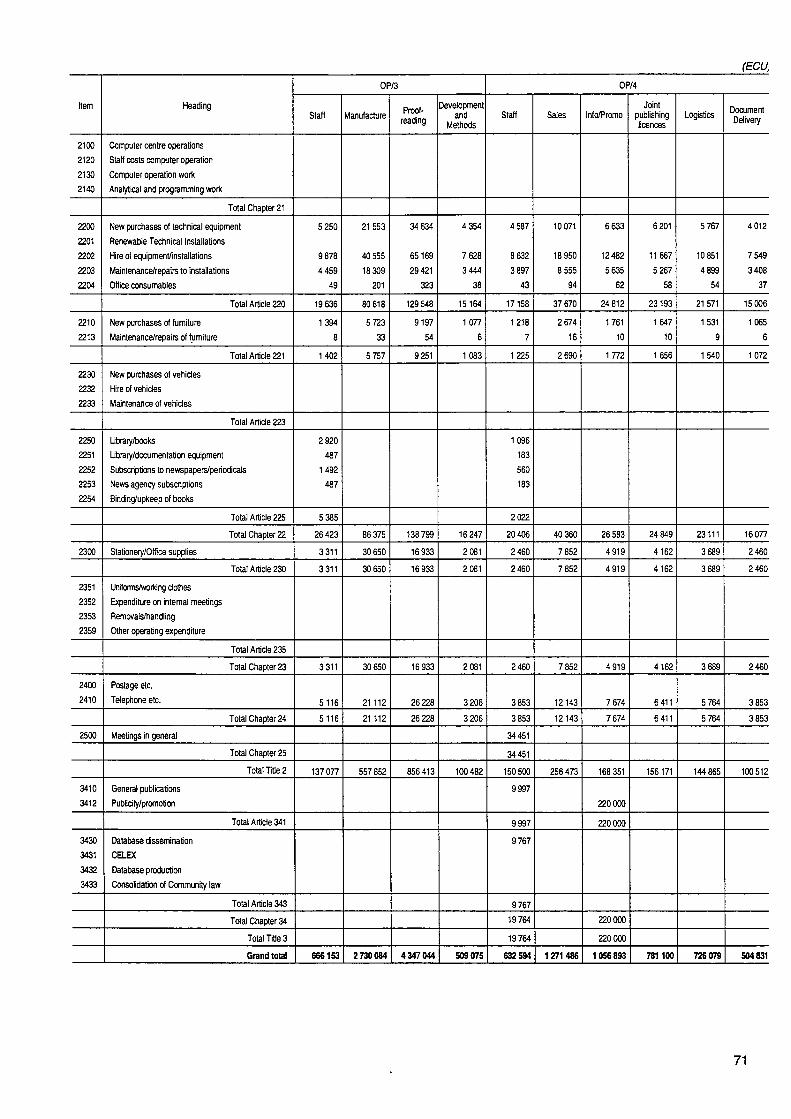
(ECU,
Item
2100
2120
2130
2140
2200
2201
2202
2203
2204
2210
2213
2230
2232
2233
2250
2251
2252
2253
2254
2300
2351
2352
2353
2359
2400
2410
2500
3410
3412
3430
3431
3432
3433
Heading
Computer centre operations
Staff costs computer operation
Computer operation work
Analytical and programming work
Total Chapter 21
New purchases of technical equipment
Renewable Technical Installations
Hire of equipment/installations
Maintenance/repairs to installations
Office consumables
Total Article 220
New purchases of furniture
Maintenance/repairs of furniture
Total Article 221
New purchases of vehicles
Hire of vehicles
Maintenance of vehicles
Total Article 223
Library/books
Library/documentation equipment
Subscriptions to newspapers/periodicals
News agency subscriptions
Binding/upkeep of books
Total Article 225
Total Chapter 22
Stationery/Office supplies
Total Article 230
Uniforms/working clothes
Expenditure on internal meetings
Removals/handling
Other operating expenditure
Total Article 235
Total Chapter 23
Postage etc.
Telephone etc.
Total Chapter 24
Meetings in general
Total Chapter 25
Total Title 2
General publications
Publicity/promotion
Total Article 341
Database dissemination
CELEX
Database production
Consolidation of Community law
Total Article 343
Total Chapter 34
Total Title 3
Grand total
OP/3
Staff
5 250
9 878
4459
49
19 636
1394
8
1402
2 920
487
1492
487
5 385
26423
3 311
3311
3311
5116
5116
137077
666153
Manufacture
21553
40555
18 309
201
80 618
5 723
33
5 757
86375
30650
30 650
30650
21 112
21 112
557 852
2730084
Proofreading
34634
65169
29421
323
129 548
9197
54
9251
138 799
16933
16 933
16933
26228
26228
856413
4347044
Development and
Methods
4354
7 628
3444
38
15164
1077
6
1083
16 247
2 081
2 081
2 081
3206
3206
100482
509075
OP/4
Staff
4 587
8 632
3897
43
17158
1218
7
1225
1096
183
560
183
2022
20406
2 460
2460
2460
3 853
3 853
34451
34451
150500
9997
9997
9767
9767
19764
19764
632594
Sales
10 071
18 950
8 555
94
37 670
2 674
16
2 690
40 360
7 852
7 852
7 852
12143
12143
256473
1271486
Info/Promo
6633
12482
5 635
62
24 812
1761
10
1772
26583
4919
4 919
4919
7674
7674
168 351
220000
220000
220000
220000
1056893
Joint publishing licences
6201
11667
5267
58
23193
1647
10
1656
24 849
4162
4162
4162
6411
6411
156 171
781100
Logistics
5 767
10851
4 899
54
21571
1531
9
1540
23111
3 689
3 689
3 689
5 764
5 764
144 865
726079
Document Delivery
4012
7549
3408
37
15006
1065
6
1072
16077
2460
2460
2460
3853
3853
100512
504831
71

Table 25 (cont.) — Analytical accounting — Expenditure of the Publications Office in 1998 (ECU)
Item
1100
1101
1102
1103
1110
1120
1130
1131
1132
1140
1141
1144
1147
1150
1174
1175
1181
1182
1183
1184
1190
1300
1400
1401
1402
1520
1610
1620
1630
1701
2000
2010
2020
2030
2040
2050
2090
Heading
Basic salaries
Family allowances
Expatriation allowances etc.
Secretariat allowances
Total Article 110
Auxiliary staff
Total Article 111
Further training lor staff
Total Article 112
Sickness insurance
Accident insurances
Unemployment insurance
Total Article 113
Birth/death grants
Annual leave travel expenses
Fixed travel allowances
Shift work standby allowances
Total Article 114
Overtime
Total Article 115
Freelance proof-readers
Other work sent out
Total Article 117
Travel expenses
Installation allowances
Removal allowances
Temporary subsistence allowance
Total Article 118
Weightings
Total Article 119
Total Chapter 11
Mission expenses
Total Chapter 13
Restaurant/canteen running costs
Canteen alterations
Exceptional renovation costs
Total Chapter 14
Seconded national/international officials
Total Chapter 15
Staff social contacts
Other welfare expenditure
Early Childhood Centre
Total Chapter 16
Entertainment/representation expenses
Total Chapter 17
Total Title 1
Rent
Insurance
Water, gas eta
Cleaning/maintenance
Fitting-out of premises
Building security/surveillance
Other expenditure on buildings
Total Chapter 20
OP/5
Electronic publishing
and Internet
distribution
377 804
42 945
51916
1687
474 353
14735
14 735
2202
2202
13138
2 975
16114
14
7 694
7707
32 270
3 765
36 035
78
1438
1488
623
3626
5 203
5 203
559974
12 608
12608
181
161
341
563
47
6311
6921
579844
72942
21
10727
11441
1394
12795
2717
112 036
OP/6
Staff
550 328
62 556
75 623
17 854
706 361
1787
1787
19138
4334
23472
20
11207
11227
113
2 094
2167
907
5 282
7 579
7 579
755708
1 184
1 184
239
213
451
744
62
8 342
9149
766492
96421
27
14180
15124
1843
16 913
3 592
148100
Distribution
1334326
151 674
183 355
8338
1677 694
37 945
37 945
1636
1636
46402
10 508
56 911
48
27172
27 220
5 052
5 052
3526
3 526
275
5 077
5 255
2200
12 807
18 375
18 375
1841 165
1344
1344
581
518
1099
1812
151
20 308
22 271
1 865 879
234719
66
34518
36 816
4 487
41171
8744
360 522
Printing
1 181 458
134 297
162 349
7 828
1485 932
5 312
5 312
41086
9 305
298
50688
43
24 059
24102
7 662
7 662
243
4 496
4 653
1948
11339
16270
16270
1601305
5664
5664
507
452
958
1581
132
17712
19424
1627351
204714
58
30105
32109
3914
35908
7627
314 434
OP/7
Staff
406194
46172
55 817
3 885
512 068
283
283
14126
3199
17 325
15
8 272
8 286
2 933
2 933
84
1546
1600
670
3899
5 594
5 594
550387
14 240
14 240
178
159
337
5558
46
6223
6825
571 789
71928
20
10 578
11282
1375
12 617
2 680
110480
Databases
447 687
50 889
61519
5 042
565137
404
404
15 569
3 526
19094
16
9117
9133
92
1704
1763
738
4 297
6165
6165
604230
1 184
1 184
191
170
361
595
50
6673
7 318
613093
77124
22
11342
12 097
1474
13528
2 873
118 461
Derived products
340679
38 725
46814
1099
427317
14 735
14 735
3121
3121
11847
2 683
595
15125
12
6938
6 950
70
1296
1342
562
3270
4 691
4 691
475209
2112
2112
151
134
285
469
39
5261
5770
483375
60807
17
8942
9537
1 162
10666
2265
93397
Celex
288267
32 767
39 612
360 646
32219
32219
1687
1687
10025
2 270
12295
10
5 870
5 881
59
1097
1 135
475
2767
3 970
3970
419464
4 480
4 480
134
119
253
417
35
4 673
5124
429321
54 007
15
7942
8471
1032
9473
2012
82 953
72

(ECU)
Item
2100
2120
2130
2140
2200
2201
2202
2203
2204
2210
2213
2230
2232
2233
2250
2251
2252
2253
2254
2300
2351
2352
2353
2359
2400
2410
2500
3410
3412
3430
3431
3432
3433
Heading
Computer centre operations
Staff costs computer operation
Computer operation work
Analytical and programming work
Total Chapter 21
New purchases of technical equipment
Renewable Technical Installations
Hire of equipment/installations
Maintenance/repairs to installations
Office consumables
Total Article 220
New purchases ol furniture
Maintenance/repairs of furniture
Total Article 221
New purchases of vehicles
Hire ot vehicles
Maintenance of vehicles
Total Article 223
Library/books
Library/documentation equipment
Subscriptions to newspapers/periodicals
News agency subscriptions
Binding/upkeep of books
Total Article 225
Total Chapter 22
Stationery/Office supplies
Total Article 230
Uniforms/working clothes
Expenditure on internal meetings
Removals/handling
Other operating expenditure
Total Article 235
Total Chapter 23
Postage etc.
Telephone etc.
Total Chapter 24
Meetings in general
Total Chapter 25
Total Title 2
General publications
Publicity/promotion
Total Article 341
Database dissemination
CELEX
Database production
Consolidation of Community law
Total Article 343
Total Chapter 34
Total Title 3
Grand total
OP/5
Electronic publishing
and Internet
distribution
5 753
10 826
4 887
54
21520
1528
9
1537
97
16
50
16
179
23 236
2 838
2 838
2 838
4469
4469
142 579
722423
OP/6
Staff
7 605
14310
6460
71
28 447
2020
12
2 031
37000
37000
81
14
41
14
149
67628
5 392
5392
4 069
4069
9462
8322
8322
233511
1000003
Distribution
18 513
34 836
15 727
173
69248
4916
29
4 945
74193
16933
16 933
16933
6550000
26228
6576228
7027876
8893755
Printing
16147
30382
13716
151
60396
4288
25
4 313
8 000
8000
72 709
734 557
734 557
5 397
5 397
739 954
22 407
22407
1 149504
2776 855
OP/7
Staff
5 673
10675
4819
53
21221
1507
9
1515
22 736
2 838
2 838
2 838
4469
4 469
140523
712311
Databases
6 083
11446
5168
57
22 754
1615
9
1625
24 379
4162
4162
4162
6411
6411
153413
99606
49725
149 331
149 331
149331
915837
Derived products
4796
9025
4 074
45
17940
1274
7
1281
19221
2838
2 838
2838
4469
4469
119924
603299
Celex
4260
8 015
3619
40
15 933
1131
7
1138
17 071
2 081
2 081
2081
3206
3206
105311
1049888
1049 888
1049 888
1049888
1584519
73

Table 25 (cont.) — Analytical accounting — Expenditure of the Publications Office in 1998 (ECU)
Item
1100
1101
1102
1103
1110
1120
1130
1131
1132
1140
1141
1144
1147
1150
1174
1175
1181
1182
1183
1184
1190
1300
1400
1401
1402
1520
1610
1620
1630
1701
2000
2010
2020
2030
2040
2050
2090
Heading
Basic salaries
Family allowances
Expatriation allowances etc.
Secretariat allowances
Total Article 110
Auxiliary staff
Total Article 111
Further training for staff
Total Article 112
Sickness insurance
Accident insurances
Unemployment insurance
Total Article 113
Birth/death grants
Annual leave travel expenses
Fixed travel allowances
Shift work standby allowances
Total Article 114
Overtime
Total Article 115
Freelance proof-readers
Other work sent out
Total Article 117
Travel expenses
Installation allowances
Removal allowances
Temporary subsistence allowance
Total Article 118
Weightings
Total Article 119
Total Chapter 11
Mission expenses
Total Chapter 13
Restaurant/canteen lunning costs
Canteen alterations
Exceptional renovation costs
Total Chapter 14
Seconded national/international officials
Total Chapter 15
Staff social contacts
Other welfare expenditure
Early Childhood Centre
Total Chapter 16
Entertainment/representation expenses
Total Chapter 17
Total Title 1
Rent
Insurance
Water, gas etc.
Cleaning/maintenance
Fitting-out of premises
Building security/surveillance
Other expenditure on buildings
Total Chapter 20
OP/8
Staff
351598
39966
48 315
1099
440978
4 090
4090
12227
2769
14996
13
7160
7173
4139
4139
72
1338
1385
580
3375
4 842
4842
479592
4128
4128
153
136
289
476
40
5333
5 849
140
140
489998
61640
17
9065
9668
1178
10812
2296
94676
Project management
399 643
45428
54 917
1099
501086
32 066
32 066
3 888
3 888
13 898
3147
17 045
14
8138
8153
82
1521
1574
659
3 836
5 503
5 503
571577
10 816
10816
184
164
347
573
48
6419
7040
589780
74192
21
10911
11637
1418
13 014
2 764
113 956
User support
393091
44683
54016
8 927
500718
1 151
1 151
13670
3096
16 766
14
8 005
8 019
81
1496
1548
648
3 773
5 413
5 413
535 840
1632
1632
169
151
321
529
44
5 924
6497
544 289
68469
19
10069
10 739
1309
12 010
2 551
105166
Operations
375 621
42 697
51616
6141
476074
11977
11977
13063
2 958
298
16 318
14
7649
17929
25 592
77
1429
1479
619
3 605
5173
5173
538 739
4320
4320
171
153
324
534
45
5986
6564
549947
69181
19
10174
10851
1323
12135
2 577
106260
OP/9
Staff
176 891
20107
24 307
1099
222404
121
121
6152
1393
7 545
6
3 602
3609
6 708
6708
36
673
697
292
1698
2436
2436
244 521
2784
2784
78
69
147
243
20
2 726
2 989
250441
31504
9
4633
4 941
602
5 526
1 174
48 390
Budget &
accounting
438 952
49 896
60 318
10 614
559 780
434
434
15 265
3457
18 722
16
8 939
8 955
486
486
90
1670
1729
724
4 213
6 045
6 045
598 634
1888
1888
189
169
358
591
49
6619
7259
608139
76501
22
11250
11999
1462
13419
2850
117 504
Personnel management
279 532
31775
38 412
4 983
354 701
5344
5344
252
252
9 721
2201
11922
10
5 692
5 702
58
1064
1 101
461
2 683
3 849
3 849
384455
3776
3776
122
109
232
382
32
4279
4 693
393155
49457
14
7273
7757
945
8 675
1843
75 965
Out-turn Γ)
21838 403
2482 385
3000908
196198
27 517893
763476
763476
100988
100 988
759449
171 987
6250
937687
786
444 716
47 009
492 511
49052
49052
1227000
104 000
1331000
4500
83100
86 000
36 000
209600
300736
300 736
31 702 943
320 000
320 000
10100
9000
19100
31500
2 625
353000
387125
4400
4400
32433568
4080000
1 150
600000
639944
77998
715 662
152 000
6266754
74
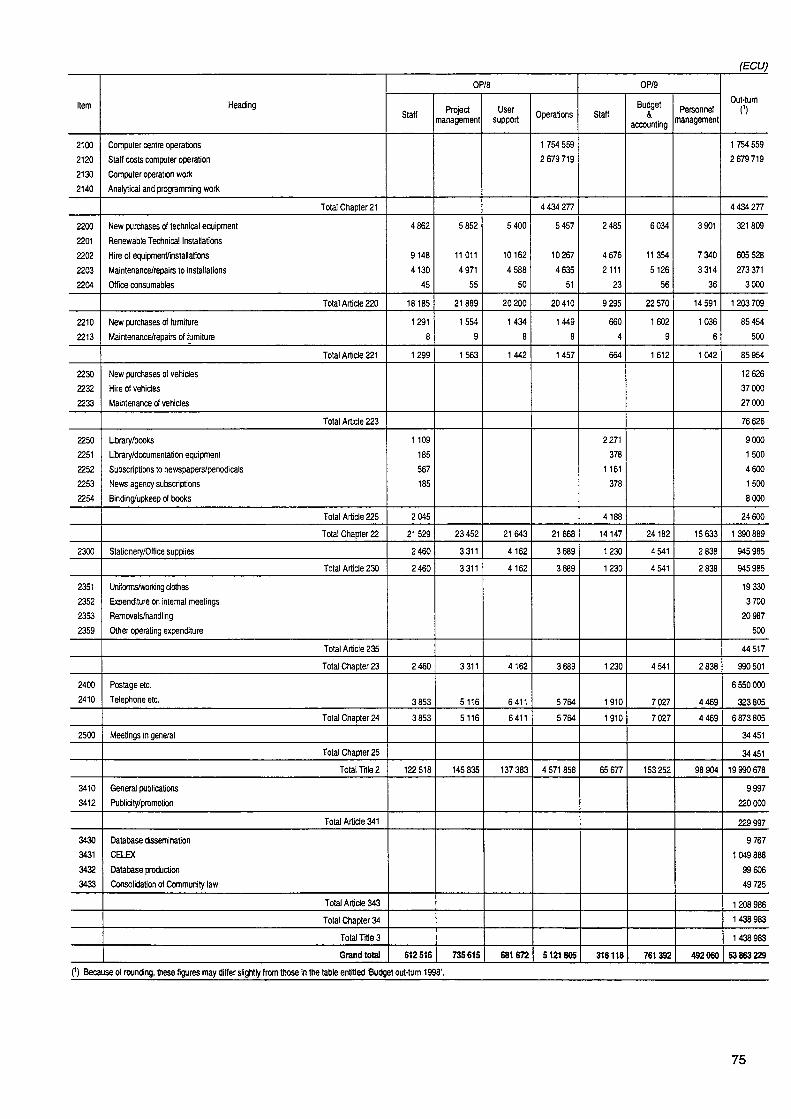
(ECU)
Item
2100
2120
2130
2140
2200
2201
2202
2203
2204
2210
2213
2230
2232
2233
2250
2251
2252
2253
2254
2300
2351
2352
2353
2359
2400
2410
2500
3410
3412
3430
3431
3432
3433
Heading
Computer centre operations
Staff costs computer operation
Computer operation work
Analytical and programming work
Total Chapter 21
New purchases of technical equipment
Renewable Technical Installations
Hire of equipment/installations
Maintenance/repairs to installations
Office consumables
Total Article 220
New purchases of furniture
Maintenance/repairs of furniture
Total Article 221
New purchases of vehicles
Hire of vehicles
Maintenance of vehicles
Total Article 223
Library/books
Library/documentation equipment
Subscriptions to newspapeis/periodicals
News agency subscriptions
Binding/upkeep of books
Total Article 225
Total Chapter 22
Stationery/Office supplies
Total Article 230
Uniforms/working clothes
Expenditure on internal meetings
Removals/handling
Other operating expenditure
Total Article 235
Total Chapter 23
Postage etc.
Telephone etc.
Total Chapter 24
Meetings in general
Total Chapter 25
Total Tille 2
General publications
Publicity/promotion
Total Article 341
Database desemination
CELEX
Database production
Consolidation of Community law
Total Article 343
Total Chapter 34
Total Title 3
Grand total
OP/8
Staff
4 862
9148
4130
45
18185
1291
8
1299
1 109
185
567
185
2 045
21529
2460
2460
2460
3853
3853
122 518
612516
Project management
5 852
11011
4971
55
21889
1554
9
1563
23452
3311
3 311
3311
5116
5116
145 835
735615
User support
5400
10162
4 588
50
20 200
1434
8
1442
21643
4162
4162
4162
6411
6411
137383
681672
Operations
1 754 559
2 679 719
4434277
5457
10267
4 635
51
20410
1449
8
1457
21868
3 689
3689
3689
5 764
5764
4 571 858
5121805
OP/9
Staff
2485
4676
2111
23
9295
660
4
664
2271
378
1161
378
4188
14147
1230
1230
1230
1910
1910
65 677
316118
Budget &
accounting
6034
11354
5126
56
22 570
1602
9
1612
24182
4 541
4 541
4 541
7027
7 027
153 252
761392
Personnel management
3901
7340
3 314
36
14 591
1036
6
1042
15 633
2 838
2 838
2 838
4469
4469
98 904
492060
Out-turn I1)
1 754 559
2 679719
4434277
321809
605528
273371
3000
1203709
85454
500
85954
12626
37000
27 000
76626
9000
1500
4600
1500
8000
24 600
1390889
945 985
945985
19 330
3700
20987
500
44 517
990501
6550000
323805
6873805
34451
34451
19 990678
9997
220000
229997
9767
1049888
99606
49725
1 208 986
1438983
1438983
53863229
(') Because of rounding, these figures may differ slightly from those in the table entitled 'Budget out-turn 1998'.
75

-J. CD Table 26 — Pro forma invoicing 1998 (global breakdown of Publications Office costs by institution)
Institutions
European Parliament
Council
Commission
Court of Justice
Economic and Social Committee
Court of Auditors
Committee of the Regions
Other
Total
OP/2 — Official Journal
Pages produced
Number
100 595
77 298
1 074 344
7811
10 494
10 648
3 014
3 725
1287929
Cost
1402 777
1 077 905
14 981511
108 923
146 337
148 484
42 030
51944
17 959 911
OP/3 — Publications
Pages produced
Proof-read
2 539
3 808
115178
129 251
1900
1545
7
3 452
257 680
Manufactured
50806
18 371
433 797
180766
1900
1825
19
25 426
712910
Cost
1 151 895
478 918
11854184
6 694 291
82 055
72 769
561
623 571
20 958 244
OP/5 — Electronic edition and Internet
dissemination Files
(weighted activities)
(%) 11.44
2.29
79.54
0.00
0.00
0.00
0.00
6.73
100.00
Cost
173 565
34 743
1 206 760
0
0
0
0
102 106
1517174
OP/6 — Printing
Printshops Hours (%)
0.00
0.11
86.18
6.81
0.00
0.46
0.00
6.44
100.00
Materials Cost (%)
0.00
0.06
95.61
3.98
0.00
0.21
0.00
0.14
100.00
Cost
0
6 462
5 501 961
402 430
0
26 651
0
347 787
6 285 290
OP/7 —Tools
Databases Cost
403 970
120 913
1053731
138 357
28 940
9118
5 550
221 609
1982187
CELEX Cost
1214 452
203 952
1 683 063
125 878
34 736
33 579
12 571
0
3 308 231
Derived products
Cost
0
0
1852192
0
0
0
0
0
1 852192
Out-turn Cost
4 346 658
1 922 894
38133 401
7 469 878
292 068
290 601
60 712
1347017
53 863 229
%
8.06981
3.56996
70.79672
13.86823
0.54224
0.53952
0.11272
2.50081
100.00
Out-turn 1998 — Global breakdown of Publications Office costs by institution
Committee of the Regions (0.11 %) Economic and Social Committee (0.54 %)
Others (2.50 %)
Court of Auditors (0.54 %) Parliament (8.07 %)
Council (3.57 %)
Court of Justice (13.87%)
Commission (70.80 %)

4.2. Commercial accounting
4.2.1. Operating results 4.2.1.1. Balance sheet at 31 December 1998 (Table 27)
(a) Assets
The assets in bank accounts at 31 December 1998 amounted to ECU 5 616 497.86 (1997: ECU 7 890 230.45), including ECU 833 272.85 in national-currency accounts (1997: ECU 2 313 564.17) and ECU 4 783 225.01 in ecu accounts (1997: ECU 5 576 666.28). The centralisation of sales revenue in a single account made it possible to speed up the process of repayment to the institutions and to reduce the amount of money held by the Office.
The amount of accounts receivable was ECU 7 368 846.36 (1997: ECU 5 355 412.35). This represented 33.60 % of the nettotal invoiced in 1998 as against 24.10 % in 1997, since, on the one hand, technical constraints meant that some of the turnover was not realised until the end of 1998 and, on the other, the amount of part payments received (not broken down) was higher than in 1997. In 1998, the Office received ECU 19 997 473 in net sales revenue (including around ECU 2 359 000 by cheque and ECU 149 000 by credit card), as against ECU 21 881 972.02 In 1997 (-8.61 %). Receipts represented 91.19 % of net turnover (98.49 % in 1997).
(b) Liabilities
Prepayments held in suspense accounts amounted to ECU 89 046.78 (1997: ECU 48 021.56). Part payments from our sales network came to ECU 1 339 249.62 (1997: ECU 424 342.63).
At the end of 1998, the amount of sales revenue received and payable to the Institutions was ECU 4 186 239.88 (1997: 7 400 845.89), thanks to faster repayment.
4.2.1.2. Profit-and-loss account at 31 December 1998 (Table 28)
In 1998, gross turnover amounted to ECU 31 445 073.41 compared with ECU 32 674 794.19 in 1997—a drop of 3.76%. The net figure fell by 1.30% to ECU 21 928 454.26 (1997: ECU 22 217 383.33).
The expenditure side of this account includes trade discounts totalling ECU 9 503 556.97, or 30.22 % of gross turnover in 1998 (32.18 % in 1997 and 33% in 1996).
An operation conducted jointly with the Commission's Financial Controller made it possible to clear a total of ECU 3 047.43 for 1998 under the heading 'Insolvent debtors'.
77

-J 00 Table 27 Balance sheet at 31 December 1998
(ECU)
Assets
Heading
Liquid assets — Trade accounts receivable — Other accounts receivable — Doubtful debts
Sight deposits — in ecus — in other currencies
Total
1997
4 638 494.21 508 686.68 208 231.46
5 355 412.35
5 576 666.28 2 313 564.17
7 890 230.45
13 245 642.80
1998
6 696 591.27 478 454.66 193 800.43
7 368 846.36
4 783 225.01 833 272.86
5 616 497.86
12 985 344.22
Liabilities
Heading
Short-term liabilities — advanced and part payment to client
accounts — Suspense accounts — Unidentified disbursements
Accounts receivable on behalf of the institutions at 31 December
Sales proceeds payable to the institutions
Total
1997
424 342.63 48 021.56 17 020.37
489 384.56
5 355 412.35
7 400 845.89
13 245 642.80
1998
1 339 249.62 89 046.78
1 961.58
1 430 257.98
7 368 846.36
4186 239.88
12 985 344.22
Table 28 — Prof it-and-loss account at 31 December 1998 (ECU)
Expenditure
Heading
Invoiced rebates Insolvent debtors Exchange losses Adjustments to bank accounts Bank charges
Reimbursed costs and advances Amounts receivable on behalf of the institutions at 31 December 1998 1998 sales proceeds payable to the institutions
Total
1997
10 516 492.99 91 230.31 37 668.59
144 160.58 16 502.44
5 355 412.35 21 826 786.90
37 988 254.16
1998
9 503 556.97 3 047.43
313 862.80 103 750.28
12 637.75
96 309.97
7 368 846.36 19 997 473.00
37 399 484.56
Income
Heading
Gross sales revenue Miscellaneous revenue Exchange gains Adjustments to bank accounts Interests on assets Invoiced interests Invoiced costs and advances
Amounts receivable on behalf of the institutions at 1 January 1998
Total
1997
32 674 794.19 17 827.70
219 379.42
276 510.36 788.41
58 293.72
4 740 660.36
37 988 254.16
1998
31 445 073.41 5 418.60
262 854.89 14 640.60
232 836.92 7 292.04
75 955.75
5 355 412.35
37 399 484.56
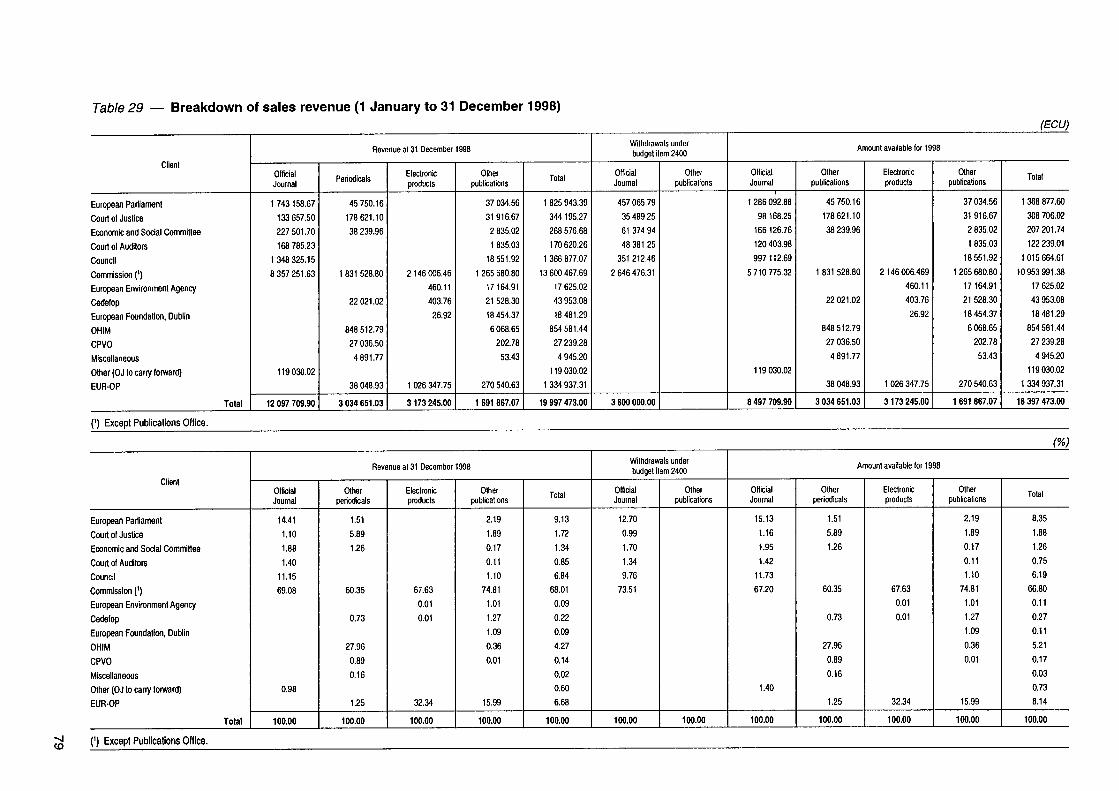
Table 29 — Breakdown of sales revenue (1 January to 31 December 1998)
(') Except Publications Office.
(ECU)
Client
European Parliament
Court of Justice
Economic and Social Commitlee
Court ol Auditors
Council
Commission (')
European Environment Agency
Cedelop
European Foundation, Dublin
OHIM
CPVO
Miscellaneous
Other (OJ to carry forward)
EUR-OP
Total
Revenue at 31 December 1998
Official Journal
1 743 158.67
133657.50
227501.70
168 785.23
1348 325.15
8 357 251.63
119030.02
12097709.90
Periodicals
45 750.16
178 621.10
38 239.96
1 831 528.80
22 021.02
848 512.79
27036.50
4 891.77
38048.93
3 034651.03
Electronic products
2 146 006.46
460.11
403.76
26.92
1026347.75
3173 245.00
Olhei publications
37 034.56
31 916.67
2 835.02
1 835.03
18 551.92
1 265 680.80
17 164.91
21 528.30
18 454.37
6068.65
202.78
53.43
270540.63
1 691 867.07
Total
1 825 943.39
344 195.27
268 576.68
170 620.26
1 366 877.07
13 600 467.69
17 625.02
43 953.08
18 481.29
854 581.44
27 239.28
4 945.20
119 030.02
1 334 937.31
19 997473.00
Withdrawals under budget ¡lem 2400
Official Journal
457 065.79
35 489.25
61 374.94
48 381.25
351 212.46
2 646 476.31
3 600 000.00
Other publications
Amount available for 1998
Official Journal
1286092.88
98 168.25
166126.76
120403.98
997112.69
5 710775.32
119 030.02
8497709.90
Other publications
45 750.16
178 621.10
38 239.96
1 831 528.80
22 021.02
848 512.79
27 036.50
4 891.77
38 048.93
3 034 651.03
Electronic producís
2146006.469
460.11
403.76
26.92
1026347.75
3173 245.00
Other publications
37 034.56
31 916.67
2 835.02
1 835.03
18 551.92
1 265 680.80
17164.91
21 528.30
18 454.37
6 068.65
202.78
53.43
270 540.63
1 691 867.07
Total
1 368 877.60
308 706.02
207201.74
122 239.01
1015 664.61
10953991.38
17 625.02
43 953.08
18 481.29
854 581.44
27 239.28
4 945.20
119030.02
1 334 937.31
16 397473.00
(%)
Client
European Pariiament
Court of Justice
Economic and Sodai Committee
Court of Auditors
Council
Commission (')
European Environment Agency
Cedelop
European Foundation, Dublin
OHIM
CPVO
Miscellaneous
Other (OJ to carry lorward)
EUR-OP
Total
Revenue al 31 December 1998
Official Journal
14.41
1.10
1.88
1.40
11.15
69.08
0.98
100.00
Other periodicals
1.51
5.89
1.26
60.35
0.73
27.96
0.89
0.16
1.25
100.00
Electronic products
67.63
0.01
0.01
32.34
100.00
Other publications
2.19
1.89
0.17
0.11
1.10
74.81
1.01
1.27
1.09
0.36
0.01
15.99
100.00
Total
9.13
1.72
1.34
0.85
6.84
68.01
0.09
0.22
0.09
4.27
0.14
0.02
0.60
6.68
100.00
Withdrawals under budgel ¡lem 2400
Official Journal
12.70
0.99
1.70
1.34
9.76
73.51
100.00
Other publications
100.00
Amount available lor 1998
Official Journal
15.13
1.16
1.95
1.42
11.73
67.20
1.40
100.00
Other periodicals
1.51
5.89
1.26
60.35
0.73
27.96
0.89
0.16
1.25
100.00
Electronic products
67.63
0.01
0.01
32.34
100.00
Other publications
2.19
1.89
0.17
0.11
1.10
74.81
1.01
1.27
1.09
0.36
0.01
15.99
100.00
Tolat
8.35
1.88
1.26
0.75
6.19
66.80
0.11
0.27
0.11
5.21
0.17
0.03
0.73
8.14
100.00
~ N | CO (') Except Publications Office.

4.2.2. Breakdown of sales revenue
Net sales revenue forthe institutions in 1998 totalled ECU 19 997 473, broken down as follows:
Table 30 — Breakdown of sales revenue (ECU)
Net amount invoiced in 1998
Net amount receivable: — at 1 January 1998 — at 31 December 1998
Total sales revenue received at 31 December 1998
Insolvent debtors 1998 Expenses Revenue
Total net sales revenue in 1998
Total disposable revenue for the 1998 accounting year
21 928 454.26
5 355 412.35 7 368 846.36
19 915 020.25
3 047.43 152 755.34 238 255.52
19 997 473.00
19 997 473.00
4.2.3. Breakdown by type of publications
Net amount of invoices drawn up in 1996,1997 and 1998
Individual publications Official Journal L, C, S Other periodicals Electronic products Miscellaneous
Total
1996
ECU
1 487 370.97 15 074 119.65 2 884 737.06 3 399 274.88
45 623.31
22 891 125.87
%
6.50 65.85 12.60 14.85 0.20
100.00
1997
ECU
1 597 871.43 14 309 668.99 3 220 497.21 3 030 263.57
59 0852.13
22 217 383.33
%
7.19 64.41 14.50 13.64 0.27
100.00
1998
ECU
1 789 102.05 14 127 724.87 3 280 142.96 2 731 484.38
21 928 454.26
%
8.16 64.43 14.96 12.46
100.00
Total net sales revenue in 1996,1997 and 1998
Individual publications Official Journal L, C , S Other periodicals Electronic products Miscellaneous
Total
1996
ECU
1 725 397.18 15 903 476.94 2 811 761.23 3 268 708.89
28 832.58
23 738176.82
%
7.27 67.00 11.84 13.77 0.12
100.00
1997
ECU
1 644 663.93 14 648 418.49 2 280 294.86 3 308 594.74
21 881 972.02
%
7.52 66.94 10.42 15.12
100.00
1998
ECU
1 691 867.07 12 097 709.90 3 034 651.03 3173 245.00
19 997 473.00
%
8.46 60.50 15.18 15.87
100.00
80
5. Activities of the technical departments
5.1. General services
5.2. Workshops
5.3. Stock management and distribution
5.4. Computer applications


5.1. General services
5.1.1. Buildings In 1998, the General Services department was heavily involved in the negotiation and conclusion of the new lease for the main premises, the Mercier Building, incorporating a total-guarantee maintenance contract for the technical installations and providing in particular for major renovation of the old part of the building occupied by the Office since 1972. Also in 1998, all the passenger and goods lifts in the old part of the building were replaced to bring the premises into line with safety regulations.
Finally, contacts were established with a number of specialist companies to study and introduce a visual-display system for management of the premises.
5.1.2. Canteen In 1998, visits to the canteen totalled 79 761, or 332 per day.
An average of 286 meals per day were served, or a total 68 500 over the year. This figure is 5 % up on the previous year.
5.1.3. Switchboard In 1998, the number of manually-connected outgoing telephone calls from the Office was around 24 000 (excluding those to the Commission).
The Office has been connected to the Commission's telephone management system (GESTEL) so that it is now possible to update the telephone directory within about 24 hours.
5.1.4. Mail room/messengers/ drivers
The number of letters dispatched and recorded by serial number fell by 16.27 % (from 16 484 to 13 802 originals and from 49 451 to 41 406 copies). The number of letters received and machine-recorded by time and date also fell, by 2.35 % (from 106 566 to 104 061). The number of envelopes stamped and posted fell by 16.96 % (from 36 237 to 30 092).
This reduction is due to the fact that increasing use is being made of e-mail.
In addition to the incoming and outgoing mail, the messengers are responsible for an unquantifiable volume of internal messages, dossiers etc.
In 1998, the Office's team of drivers covered a total of 207 773 km, or an average of 865 km per day, with a total of 283 missions — mostly to Brussels (273).
A total of 350 consignments was carried, plus six trips per day to Gasperich, the Jean Monnet Building and the Post Office.
5.1.5. Physical inventory of property
The new system forthe physical inventory has been tested and is operating entirely satisfactorily.
In 1998, a computerised system was introduced for monitoring the consumption of office supplies. This will enable consumption to be analysed by product and by unit.
83

5.2. Workshops
The modernisation work carried out in 1997 on the basis of the 1995 investment plan for the workshops and the application in 1998 of a set of measures aimed at optimising the use of the equipment by introducing operating procedures and developing tools for monitoring the workload made it possible to increase the level of production substantially compared with 1997.
An analysis of the statistics on one full year's operation of the modernised equipment gives a favourable picture, with a substantial increase of 43 % over 1997.
In 1998, the various sections of the printshop were closely involved in the preparations for the euro, printing the 11 language versions of the Convergence Report and the associated recommendation for moving to the third stage of economic and monetary union, together with several posters which attracted considerable attention.
The Commission continues to be the main user of the services of the workshops.
An initial reorganisation of work to take account of an increasingly automated and computerised industrial environment has permitted generally satisfactory operation.
5.2.1. Printshop The various sections of the printshop complement each other and together make up a production line. However, the significant increase in output in the pre-press and printing sections was not matched in the making-up section.
5.2.1.1. Pre-press
Work was reorganised in line with the new functions now provided by the equipment—particularly in the pre-press section, which, now that it has an electronic imposing machine, has taken over many photographic and make-up activities.
5.2.1.2. Printing
The increase in productivity was largely due to the much greater volume of four-colour production, which made the investment in the recently arrived five-part printing press worthwhile; the volume of four-colour printing was around twice that of black-and-white production. The situation was similar in the pre-press section.
Air-conditioning was installed in the workshops in order to improve working conditions and to ensure trouble-free operation.
5.2.1.3. Post-printing (finishing, stitching)
The drop in productivity, which is due to external factors, reflects the types of product in which the workshops deal: less making-up is required forthe production of multicolour posters.
84

These sections, and particularly the stitching shop, have not been modernised to the same extent as the pre-printing and printing sections, with the result that making-up is now a bottleneck in the production process.
5.2.2. LOD (industrial photocopiers)
Despite the apparent drop in production due to the fact that the statistics cover reproduction only (number of photocopies), there has been a substantial increase in requests for reproduction of publications on demand. Production of this kind involves a number of phases: scanning, reproduction, making-up.
Table 31 — Workshop productivity, 1998
Sections
Photocomposition (Pages photoset/hour) Offset (A4 pages/hour) Binding (16-page A1 signatures folded/hour) LOD (photocopies/hour)
1997
9.02
22 649
2 539
5 899
1998
10.99
32 419
2 286
5 302
Change (%)
21.84
43.14
-9.96
-10.12
85
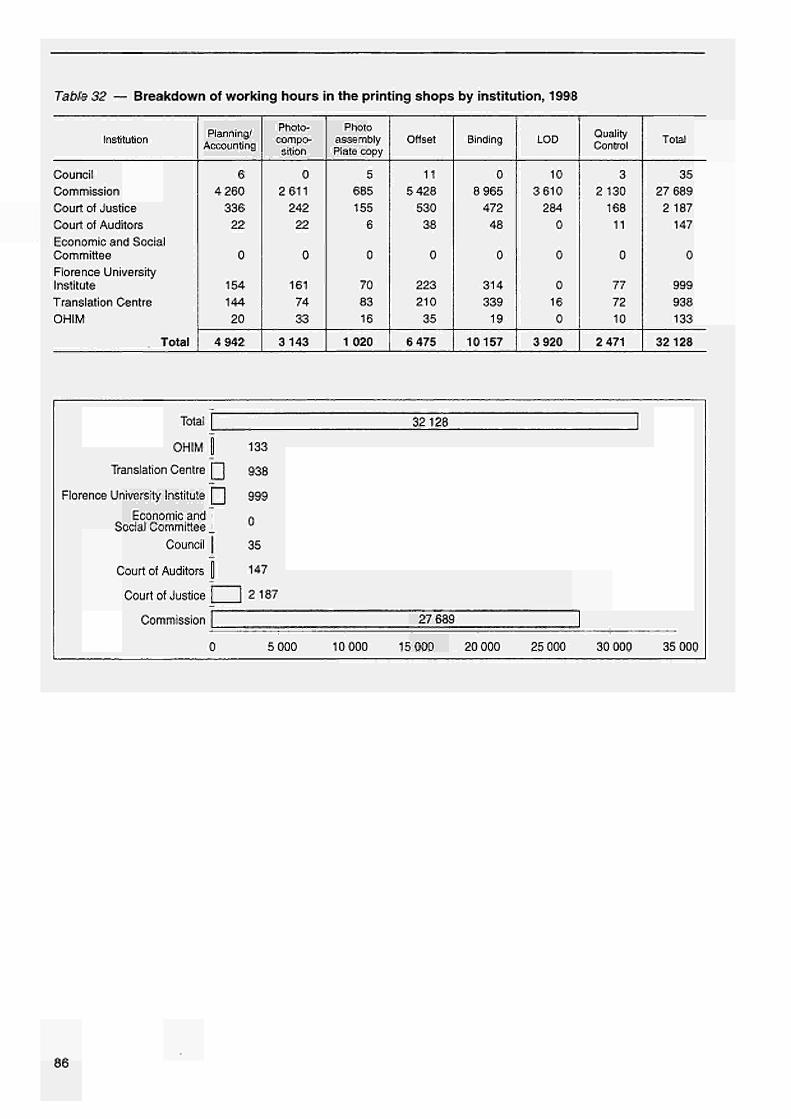
Table 32 — Breakdown of working hours in the printing shops by institution, 1998
Institution
Council Commission Court of Justice Court of Auditors Economic and Social Committee Florence University Institute Translation Centre OHIM
Total
Planning/ Accounting
6 4 260
336 22
0
154 144 20
4 942
Photocomposition
0 2 611
242 22
0
161 74 33
3 143
Photo assembly Plate copy
5 685 155
6
0
70 83 16
1 020
Offset
11 5 428
530 38
0
223 210
35
6 475
Binding
0 8 965
472 48
0
314 339
19
10157
LOD
10 3610
284 0
0
0 16 0
3 920
Quality Control
3 2 130
168 11
0
77 72 10
2 471
Total
35 27 689
2 187 147
0
999 938 133
32 128
_ Total
OHIM f
Translation Centre Q
Florence University Institute Q
Economic and ¡ Social Committee ¿
Council |
Court of Auditors |
Court of Justice | —
Commission |
0
133
938
999
0
35
147
| 2 187
5 000 10 000
32128
27 689
15 000 20 000 25 000 30 000 35 000
86

Table 33 — Comparison of print output for any year
Year
1989 1990 1991 1992 1993 1994 1995 1996 1997 1998
Format
A1
10 181 387 11 367 752 14 561 288 13 985 662 14 414 700 13 633 800 15 812 300 18 537 050 15 024 795 14711 151
A2
2 023 450 1 495 400 1 188 594 1 073 681 1 066 170 1 675 100 2 509 050 4 044 510
12 148 760 23 225 260
A3
425 175 22 113
4 751 9 349 100 6 791 550 6 176 800 9 707 050
13 860 115 4 988 500
0
A4
22163 673 920
96 789 11 800
0 0 0 0 0 0
Total converted to A4 format
90 417 409 97 641 762
121 350 971 134 890 020 133165 380 128 124 400 155 948 700 192 194 670 178 770 400 209 914 472
SO 000 0 0 0 -
Comparison of print output
150 000 000-
100000000- ¿2.
/~a
4 3
1989 1990 1991 1992 1993 1994 1995 1996 1997 1998
87

5.3. Stock management and distribution
5.3.1. Service contracts Following an initial invitation to tender, the outcome of which was disappointing in terms of the quality of services offered and the practical arrangements, a new invitation to tender enabled the Office to renew its contracts for storage on the premises of an external contractor.
This new invitation to tender included a specific lot forthe Reports of Cases before the Court, which consist of cumulative collections. The conclusion of a specific contract permits totally transparent reinvoicing to the Court of the storage costs incurred by the Office.
The Office also issued an invitation to tender for the renewal of a contract forthe transport of goods and persons between the premises of the various institutions in Luxembourg. The results will be known at the beginning of 1999.
5.3.2. Equipment The Office continued modernising its handling equipment with the purchase of two reach trucks, permitting work at great heights.
5.3.3. File management (Table 34)
The Office has nowtaken overaddress-file managementforthe Committee of the Regions, the European Monitoring Centre for Drugs and Drug Addiction and the European Training Foundation.
Various surveys were conducted in the course of the year with a view to updating the files of various authorising departments (DGs II, V and X, Commission Secretariat-General, EP Press Division, Cedefop).
Following these operations, the files contained over 100 000 more addresses.
Table 34 — Trends in the volume of operations in the file management sector
Number of files Number of addresses Number of subscriptions
1997
843 881 714
1 375 117
1998
821 988 073
1 437 605
Change (%)
-2.61 12.06 4.54
5.3.4. Basic distribution (Tables 35 and 36)
The major highlight in this area was the replacement of the paper edition of the S Series of the OJ by the CD-ROM edition on 1 July 1998.
Since that date, the CD-ROM has been published on a daily basis, whereas it had previously appeared twice a week. Since this medium incorporates all the language versions, a single article now represents the equivalent of 11 articles previously distributed separately.
This only partly, however, explains the reduction in items accepted and distributed, in terms of both numbers of titles and numbers of copies since in spite of the growth of the electronic sector, CD-ROMs so far represent only 0.3 % of the publications distributed by the Office.
88

The real reason is a reduction in publishing by the authorising departments, particularly in the absence of major information campaigns such as Citizens First or Euro.
The figures were nevertheless around the average for 1994.
The downturn in absolute terms made it possible to reduce delivery times. In 1998, 5 408 deliveries were made within 72 hours, compared with 4154 in 1997.
Another way of assessing the volume of administrative work is to create distribution lists. A distribution file is produced for each title to be distributed. This must contain as many distribution lists as there are authorising departments. 64 314 lists were created in 1998, compared with 64 939 in 1997 and 53 049 in 1996. This shows that the administrative workload has remained fairly constant irrespective of the number of copies dispatched.
Mention should also be made of the efforts to tighten up the service as regards the creation of distribution lists. This has involved considerable administrative work but has produced very positive results in terms of efficiency.
Table 35 — Trend in the volume of operations in the distribution sector
By number of titles
OJ paper
CD-ROM OJ S 0
Other paper publications
Other CD-ROM (') publications
Doc. COM, ESC + COR (2)
Total
Number of titles received
1997
12 550
n.d.
14 236
n.d.
8 847
35 633
1998
10 746
192
9 011
144
9 652
29 745
% Change
- 1 4 . 3 7
- 36.70
9.10
- 1 6 . 5 2
Number of titles distributed
1997
12 550
n.d.
12 837
n.d.
8 847
34 234
1998
10 746
192
7 556
140
9 652
28 286
% Change
- 1 4 . 3 7
- 4 1 . 1 4
9.10
- 1 7 . 3 7
By number of copies
OJ paper
CD-ROM OJ S C)
Other paper publications
Other CD-ROM (<) publications
Doc. COM, ESC + COR (2)
Total
Number of copies received
1997
23 824 539
n.d.
82 213 666
n.d.
1 635 336
107 673 541
1998
20 498 663
1 023 448
51 260 586
121 277
1 595 378
74 499 352
% Change
- 1 3 . 9 6
- 37.65
- 2 . 4 4
- 30.81
Number of copies distributed
1997
19 773 657
n.d.
60 000 791
n.d.
1 557 463
81 331 911
1998
17 096 558
924 298
37 060 821
65 597
1 450 344
56 597 618
% Change
- 1 3 . 5 4
- 38.23
- 6 . 8 8
- 30.41
(,1) It was considered interesting to make a distinction between traditional and CD-ROM publications in view of the growing trend in this medium. These data are available for the first time.
(2) Traditional ESC and COM documents now also include documents from the Committee of Regions.
89

Table 36 — Summary of distribution times in 1997 and 1998
Number of working days
D
D + 1
D + 2
D + 3
D + 4
D + 5
over 7
Total
Number of operations
1997
1 094
1 877
1 183
852
548
484
2 633
8 671
1998
1 249
2443
1 716
941
488
292
739
7 868
0) o. o
cu
Sì
E 3
Ζ
3 000
2 500
2 000
1 500
1 000
500
O 1997
M
. ■
F l " ÌT-Λ
*'■ I
rn IH ■ . H
I rl·?-. ■ ' ■ ι ■ H r— r ι ■ - ■ -
U ■ ' ■ I
D + 1 D + 2 D + 3 D + 4
Number of days
D + 5 over 7
5.3.5. Execution of orders
(Tables 37 and 38)
While basic distribution was down on the previous year (see 5.3.4), individ
ual orders were up by more than 63 %.
Handling periods nevertheless remained good, with more than 50 000
orders executed within 72 hours, compared with 43 000 in 1997 — an
improvement of 16 %. The cases in which orders could not be met within six
days, for example because items were out of stock or there was an error in
the order, were down 25 %.
Bearing in mind that execution of orders is a largely manual operation that
cannot benefit from the automation introduced for mass distribution, it can
be concluded that the overall workload of the distribution centre remained
the same as in 1997.
90

Table 37 — Trends in the volume of operations in the stock management sector
0 J (1)
Other publications
COM, ESC and
COR documents
Total
Processing of orders
Number of orders
1997
14 527
25 814
247
40 588
1998
15 907
25 576
343
41 826
Change
(%)
9.50
0 . 9 2
38.87
3.05
Number of order lines
1997
135 746
126 906
650
263 302
1998
277 355
138 220
881
416 456
Change (%)
104.32
8.92
35.54
58.17
Number of copies dispatched
1997
290 960
5 1 1 2 333
1 577
5 404 870
1998
434 414
8 413 868
1 216
8 849 498
Change
(%)
49.30
64.58
22.89
63.73
(1) The 1997 figures should be supplemented with the backdated OJ collections sent to new subscribers which amount to some 350 000 extra
copies. In 1998 a change in the subscription system limited the preparation of OJ collections to monthly collections.
Table 38 — Summary of response times for orders in 1997 and
1998
Number of working days
D
D + 1
D + 2
D + 3
D + 4
D + 5
D + 6
over 7
Total
Number of orders
1997
30 866
9 436
3 408
887
305
91
41
489
45 523
1998
40 892
7 931
2 147
390
95
110
44
355
51 964
50 000
40 000
03 Number of orders in 1997
I Number of orders in 1998
..■■v ..:.*.:■:"' '■·'■■■·■' " ■ ■ . ■ ' : ' ' . : . '
• - · · ; '
'•*ií':'.'
J-'"?~¿f '■<" '"^'{■"'"-'■¿"Γΐν:ί"·'^''·>;;' *ϊ
-■■-■ - : ■■■■■':.^'i>*Cì?.- >:' , ' V . ; '-'■■ ·■■ ■
; , , , . ■ • . • ■ • > v ■:_ ■
D D + 1 D + 2 D + 3 D + 4 D + 5 D + 6 over 7
Number of days
91

5.3.6. Stock management (Table 39)
The volume of publications in stock fell from 32 million to fewer than 30 million copies.
Despite the withdrawal of a large volume of outdated material in 1998, the level of stocks remains high, and the authorising departments need to be reminded of the importance of specifying the print runs required as accurately at possible.
Table 39 — Trends in the volume of operations in the stock management sector
OJ
Other publications
Total
Stock
Number of titles in stock
1997
15 494
24 435
39 929
1998
10 446
24 176
34 622
% Change
- 32.58
- 1 . 1 0
- 1 3 . 2 9
Number of copies in stock (1)
1997
2 667 969
29 344 849
32 012 818
1998
1 924 390
27 836 249
29 760 639
% Change
- 2 7 . 8 7
- 5 . 1 4
- 7 . 0 4
(1) These figures serve only as a guide and are not absolute. They should be supplemented with the monthly collections of the OJ and the European Court Reports, each of which comprises a varying number of copies which are counted as one article in the accounts.
5.3.7. Summary Long-term trends in distribution are set out in Table 40.
Table 40 — Long-term trends in distribution and stocks (millions of copies)
Basic distribution
Orders
Stocks
1990
32.5
1.9
n.a.
1991
38.9
1.7
n.a.
1992
55
2.3
12.2
1993
42.7
1.9
12.2
1994
54.4
2.4
13.6
1995
46.8
2.1 (')
14.9
1996
60
3-3 0)
22.2
1997
81.3
5.4 (')
32
1998
56.6
8.8 (ï)
30
(1) There are also a variable number of OJs in collections which are recorded as single copies.
92

5.3.8. Micrography (Table 41)
The micrography section continues its gradual decline (-10 %) because of the increasing popularity of other, more up-to-date, archiving media (CD-ROM, optical archives). There was nevertheless a slight increase in orders in 1998.
Table 41 — Trend in the volume of operations of the micrography sector
Number of microfiches produced internally and externally — OJ (internal production) — OJ (external production) (*) — ESC documents — COM documents — EP reports (1) — EP debates (2>
Total
Number of microfiches screened (new articles delivered)
Number of pages microfilmed Number of microfiches distributed — OJ — Other publications
Total
Number of microfiches dispatched on the basis of orders
1997
1 115 2 365 835
32 472 580 352 520 111
38 159
3 538 044
23 093
1 655 825
1 659 773 905 452
2 565 225
864 576
1998
2 198 2 355 259
53 404 633 855 124 723
7919
3 176 994
19 094
1 540 230
1 603 416 615 150
2 218 566
1 005 712
Change (%)
97.13 -0.45 63.34
9.22 - 76.02 - 79.25
-10.20
-17.32
-6.98
-3.40 - 32.06
-13.51
16.32 O Including reprints. (1) The production of EP reports on microfiches ended with the distribution of batch 12/97. (2) The production of EP debates on microfiches ended with the distribution of batch 12/96 (1996/97 session).
5.3.9. Video (Table 42) This section continues to be small, despite an increase in the number of copies dispatched in 1998.
Table 42 — Volume of operations in the video sector
Number of copies received Number of copies executed Number of copies dispatched
1997
663 239 715
1998
315 234
1 288
Change (%)
- 52.49 -2.09 80.14
5.4. Computer applications
In 1998, the Informatics Unit (OP/8) continued to invest in technical infrastructure on account of the continuing computerisation of the majority of the Publications Office's activities. Computer development activities were also stepped up in terms of modernising existing information systems and setting up new management applications or production systems.
The highlights of the year are described below for each of the three operational sections — Operations, Project Management and User Support — and for Quality Control and Security.
93
5.4.1. Operations
5.4.2. Project management
The Operations section is responsible for managing the basic computer infrastructure and the telephone system, and for the day-to-day operation of non-local computer equipment (mainframes and servers).
Particularly worthy of mention is the introduction of 3100 Mb/s switch hubs on the internal network to handle the constantly increasing demand for pass-bands from around 20 servers and some 800 local workstations. For outside links, the Office has joined the SDH network with a view to the introduction of ATM connections.
A new server (SUN Enterprise 10 000) came into operation at the end of the year to meet the needs of production systems, such as SEI-BUD, SEI-AMD and SEI-JOS, and for backing up the EUDOR repository.
The central and departmental storage capacity has increased substantially to almost 3 TB. The Office therefore needs to review its back-up mechanisms. It has acquired a robot with DLT-cassette readers that makes it possible to effectively cover all the storage locations each day.
As for services, applications on mainframe are currently backed up by the machine of the Commission's Informatics Directorate or via infrastructures at facilities management sites. The Office has in turn been asked to provide back-up for applications primarily running at the Informatics Directorate's Computer Centre.
The Project Management section is responsible for development projects and methodology. Projects in 1998 included:
— Development of a new version of SEI-BUD — a prime example of cooperation between the various European institutions, which handles the preparation of practically the entire contents of the budgetary publications. The Office also embarked on an analysis of a complementary system known as 'SEI-AMD', which will permit straightforward and efficient management of amendments for certain institutions, in particular the European Parliament.
— Work on Gescom is approaching completion and part of this application is already in use in connection with the commercial management of the Office.
— A prototype SEI-JOS has been developed. It demonstrates the feasibility of the technical and organisational solutions adopted for this production system which should, in the second half of 1999, play a part in the preparation and monitoring of the production of public procurement notices. This new system will permit automatic retrieval of the notices the Office receives via SIMAP/Notification, which came into operation in the last quarter of 1998, enabling awarding authorities subject to the European Directives on public procurement to notify the Office of work and services contracts for publication in the Supplement to the Official Journal by electronic means.
— GdC, a tool for helping with award decisions by producing estimates, is the precursor module for the new SDP system, which will handle the administrative monitoring of publication files.
— Under the name 'Catdiff', the Office completed the development of the first electronic catalogue of publications distributed by the Office. It will enable customers to select and order products using electronic means of payment.
— The feasibility and desirability of using a 'Datawarehouse' application — a repository of data used for reporting and information analysis — was
94

5.4.3. User support
5.4.4. Quality control and security
demonstrated with the introduction of a system dealing with commercial distribution and operating on a particularly rich database. This technology has proved to be a great help in decision-making.
— The architecture of the APA-OJ system was defined and the technical choices made. The purpose of this system is to automate as far as possible the preparation and publication of periodic agricultural instruments. It should come into production in the course of 1999.
The year 1998 was particularly active for this section, and a major proportion of its resources were used in connection with the migration to the new operating system, Windows NT. This particularly important development will provide users with working environments that are more suited to their needs and the Informatics Directorate with better tools for fulfilling its obligations in terms of quality of service. SMS is fundamental to this new generation of technical solutions that will enable the Office to improve its management of the various computer resources and the diagnosis of any problems arising.
The use of computers has continued to grow, not only in the form of management applications or production systems but also in the form of office automation, word-processing, spreadsheets, e-mail etc.
NT is not the only operating system used on the local workstations, but it is the most common (670 workstations); there are also SUN/Solaris (120) and Macintosh (10) workstations.
This was also a decisive year for the Intranet, which will very probably become a prime channel of communication for the distribution of information within the Office and its units, with the introduction of a provisional system which is to be expanded and consolidated in the near future. For applications of the 'infocentre' variety, available via the Intranet, the User Support section has a team that has helped a large number of units with the introduction of technologies of this kind.
Generalised access to the Internet has increased the risks to the security of the Office's computer systems. These risks become inevitable when networks are opened and interconnected and we have therefore had to find adequate protection mechanisms.
A number of filters have been installed and these appear to be working satisfactorily. In addition there are a number of procedures that must be respected in the event of a security incident.
The other aspect of this section's work is monitoring the quality of the services provided by the Informatics Unit in general and more particularly in connection with certain computer projects.
The Quality Control and Security section has also conducted a number of infrastructure projects such as EUDOR Back-up or the new generation of tools for the management/administration of computer resources.
95


6. The award and management of contracts concluded by the Office on its own behalf and on behalf of the institutions
6.1. Introduction
6.2. Activities by sector
6.3. Contracts for services and supplies chargeable to the Publications Office budget

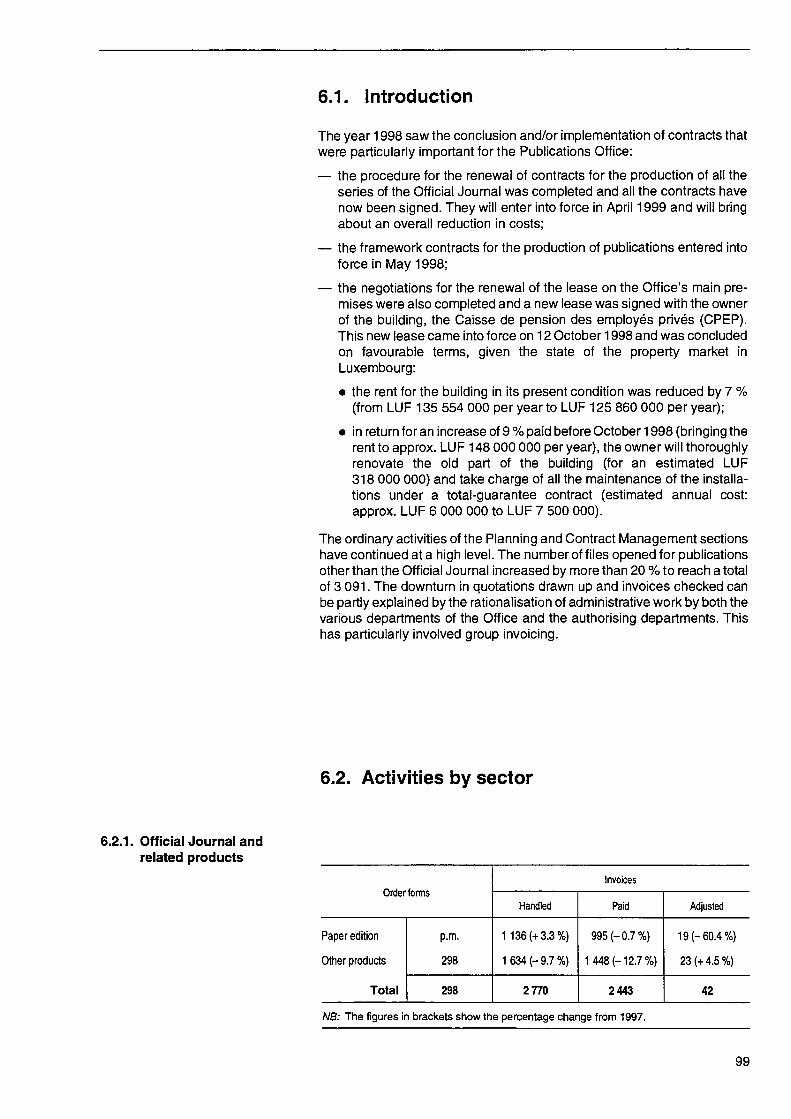
6.2.1. Official Journal and
related products
6.1. Introduction
The year 1998 saw the conclusion and/or implementation of contracts that
were particularly important for the Publications Office:
— the procedure for the renewal of contracts for the production of all the
series of the Official Journal was completed and all the contracts have
now been signed. They will enter into force in April 1999 and will bring
about an overall reduction in costs;
— the framework contracts for the production of publications entered into
force in May 1998;
— the negotiations for the renewal of the lease on the Office's main pre
mises were also completed and a new lease was signed with the owner
of the building, the Caisse de pension des employés privés (CPEP).
This new lease came into force on 12 October 1998 and was concluded
on favourable terms, given the state of the property market in
Luxembourg:
• the rent for the building in its present condition was reduced by 7 %
(from LUF 135 554 000 per year to LUF 125 860 000 per year);
• in return for an increase of 9 % paid before October 1998 (bringing the
rent to approx. LUF 148 000 000 per year), the owner will thoroughly
renovate the old part of the building (for an estimated LUF
318 000 000) and take charge of all the maintenance of the installa
tions under a totalguarantee contract (estimated annual cost:
approx. LUF 6 000 000 to LUF 7 500 000).
The ordinary activities of the Planning and Contract Management sections
have continued at a high level. The number of files opened for publications
other than the Official Journal increased by more than 20 % to reach a total
of 3 091. The downturn in quotations drawn up and invoices checked can
be partly explained by the rationalisation of administrative work by both the
various departments of the Office and the authorising departments. This
has particularly involved group invoicing.
6.2. Activities by sector
Order ranns
Paper edition
Other products
Total
p.m.
298
298
Invoices
Handled
1136 (+3.3%)
1634 (9.7%)
2770
Paid
995 (0.7%)
1448 (12.7%)
2443
Adjusted
19 (60.4%)
23 (+4.5%)
42
Λ/β: The figures in brackets show the percentage change from 1997.
99

o o Table 43 — Official Journal 1998 — Invoiced services
(ECU)
Paper version L Series C Series S Series
Subtotal (1) (of which carried forward)
Electronic version OJ S and CD-ROM S
Miscellaneous products Proof-reading/reprinting Transport/packaging/
dispatch Magnetic media Tables MCAs Budget documents Microfilming Nimexe CELEX Eurovoc Indexing system SEI Treaties Directory Formex Consolidation PAIs Various IT products Syspub Arcdon Secondary legislation EUDOR CD-ROM EUR-Lex
Subtotal (2) (of which carried forward))
Grand total 1997 apropriations
1998 appropriations
European Parliament
1 956 573.05 1 768 331.32
0.00
3 724 904.37 484 478.75
0.00
146 886.31 29 614.80 31 626.35
0.00 42 015.67 73 002.82
0.00 0.00
137.20 11 893.04
185 825.59 42 894.42
0.00 456 361.98
3 582.00 0.00
2 392 548.37 0.00 0.00 0.00
857 837.93 16 900.32 94 266.54
4 385 393.34 2 172 851.56 8110 297.71 2 657 330.31 5 452 967.40
Council
4 764 312.31 1 149 387.75
0.00 5 913 700.06 1 363 586.09
0.00
63 431.74 26 336.87
158 103.25 0.00
1 194 825.15 65 017.61
0.00 0.00
2 450.00 35 187.32 68 797.92
0.00 192 892.32 91 434.81 42 175.25
0.00 432 998.16
0.00 0.00
14 296.81 697 769.31
14 103.33 59 438.77
3 159 258.62 252 916.55
9 072 958.68 1 616 502.64 7 456 456.04
Commission
A-3400
15 582 447.76 11 052 281.64
0.00
26 634 729.40 3 667 462.71
0.00
347 739.62 85 080.32
863 701.79 0.00
1 616 419.85 209 782.57
0.00 236 811.48
13 465.20 191 109.04 937 304.81
0.00 450 082.07 521 393.21
1 026 456.43 13 120.00
1 451 924.99 2 801 791.05
0.00 7 041.72
2 261 323.51 65 859.16
183 898.96 13 284 305.78
1 599 889.37 39 919 035.18
5 267 352.08 34 651 683.10
B-5304
0.00 0.00
10 307 303.53 10 307 303.53
1 654 450.44
20 588 818.23
0.00
475 120.21 0.00 0.00 0.00 0.00 0.00 0.00 0.00 0.00 0.00
2 823 299.03 0.00 0.00 0.00 0.00 0.00
252 096.50 0.00 0.00 0.00 0.00 0.00 0.00
24 139 333.97 4 412 676.65
34 446 637.50 6 067 127.09
28 379 510.41
Court of Justice
1 680.69 572 115.64
0.00 573 796.33
66 681.11
0.00
5 742.76 2 414.64
226 083.97 0.00 0.00
5 963.02 0.00 0.00
3 547.60 49 709.60
6 293.51 12 188.81
0.00 8 429.42
0.00 0.00
39 944.83 0.00 0.00 0.00
64 209.83 1 273.25 5 514.35
431 315.59 116 552.62
1 005 111.92 183 233.73 821 878.19
Economic and Social Committee
1 657.48 630 733.25
0.00 632 390.73
60 762.48
0.00
12 571.84 3 261.29 1 520.20
0.00 0.00
8 050.58 0.00 0.00 0.00
662.38 8 522.08 7 967.32
0.00 11 312.56
0.00 0.00
53 566.23 0.00 0.00 0.00
86 354.40 1 750.52 7 346.71
202 886.11 22 149.93
835 276.84 82 912.41
752 364.43
Court of Auditors
' 0.00 667 036.67
0.00
667 036.67 457 495.70
86 968.63
9 686.76 3 051.14
538.59 0.00 0.00
7.540.45 0.00 0.00 0.00
234.67 7 914.72 5 860.82
0.00 10 775.52
0.00 0.00
51 132.62 0.00 0.00 0.00
81 767.41 1 555.86 7 141.38
274 168.57 18 660.43
941 205.24 476 156.13 465 049.11
Committee of the Regions
0.00 187 308.55
0.00
187 308.55 3 361.27
0.00
0.00 0.00 0.00 0.00 0.00 0.00 0.00 0.00 0.00 0.00 0.00
16 733.07 0.00 0.00 0.00 0.00 0.00 0.00 0.00 0.00 0.00 0.00 0.00
16 733.07 0.00
204 041.62 3 361.27
200 680.35
Other
124 837.19 257 425.34
0.00
382 262.53 34118.04
0.00
0.00 0.00 0.00 0.00
587.84 0.00 0.00 0.00 0.00 0.00 0.00 0.00 0.00 0.00 0.00 0.00 0.00 0.00 0.00 0.00 0.00 0.00 0.00
587.84 0.00
382 850.37 34 118.04
348 732.33
Total
22 431 508.48 16 284 620.16 10 307 303.53
49 023 432.17 7 792 396.59
49 023 432.17
86 968.63
1 061 179.24 149 759.06
1 281 574.15 0.00
2 853 848.51 369 357.05
0.00 236 811.48
19 600.00 288 796.05
4 037 957.66 85 644.44
642 974.39 1 099 707.50 1 072 213.68
13 120.00 4 674 211.70 2 801 791.05
0.00 21 338.53
4 049 262.39 2 097 216.41
357 606.71 45 893 982.89
8 595 697.11 94 917 415.06 16 388 093.70 78 529 321.36

Table 43 (cont.) — Official Journal 1998 — Invoiced services (ECU)
Pages invoiced L Series C Series S Series Notices
Total
European Parliament
21 638 78 957
0 0
100 595
Council
58 913 18 385
0 0
77 298
Commission
A-3400
124 629 138 146
0 0
262 775
B-5304
0 0
811 778 (162 488)
811 778
Court of Justice
11 7 800
0 0
7811
Economic and Social Committee
11 10 483
0 0
10 494
Court of Auditors
, 0 10 648
0 0
10 648
Committee of the Regions
0 3 014
0 0
3 014
Other
1 408 2 284
0 0
3 692
Total
206 610 269 717 811 778
(162 488)
1 288105
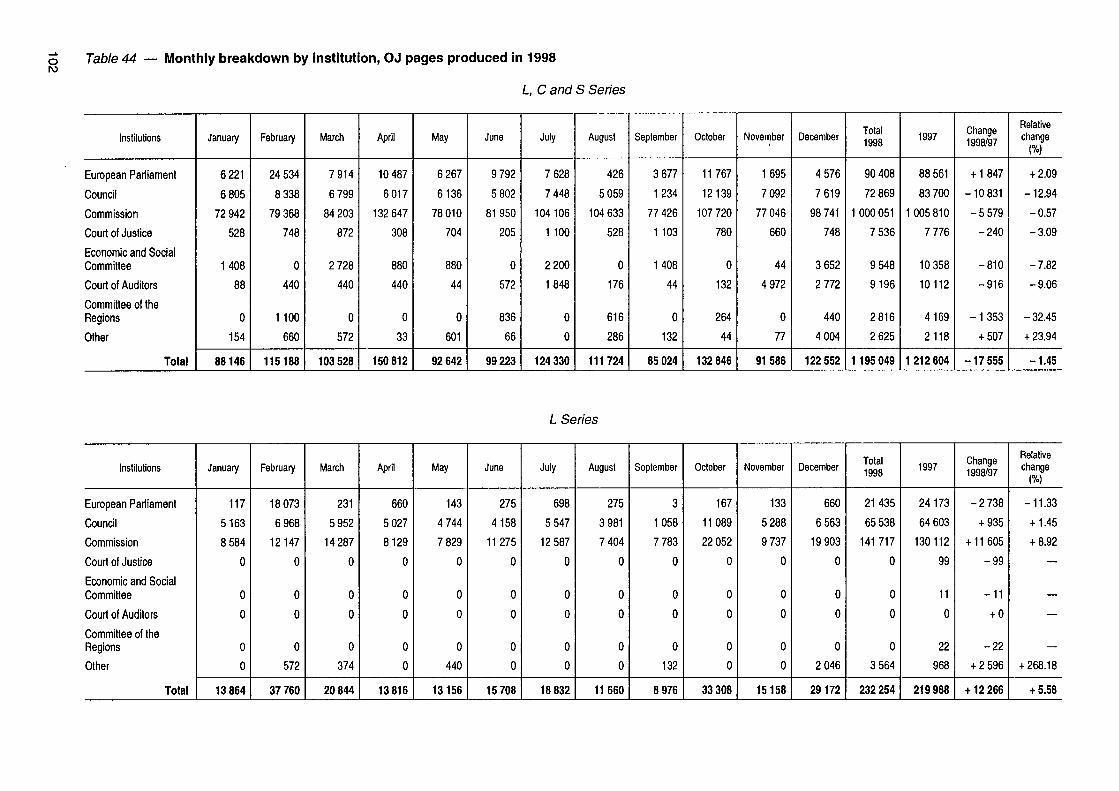
o ro Table 44 — Monthly breakdown by institution, O J pages produced in 1998
L, C and S Series
Institutions
European Parliament
Council
Commission
Court of Justice
Economic and Social Committee
Court of Auditors
Committee of the Regions
Other
Total
January
6 221
6 805
72 942
528
1408
88
0
154
88146
February
24 534
8 338
79 368
748
0
440
1 100
660
115188
March
7 914
6 799
84 203
872
2 728
440
0
572
103 528
April
10 487
6017
132 647
308
880
440
0
33
150 812
May
6 267
6136
78 010
704
880
44
0
601
92 642
June
9 792
5 802
81950
205
0
572
836
66
99223
July
7 628
7 448
104 106
1 100
2 200
1848
0
0
124 330
August
426
5 059
104 633
528
0
176
616
286
111 724
September
3 677
1234
77 426
1 103
1408
44
0
132
85 024
October
11767
12139
107 720
780
0
132
264
44
132 846
November
1695
7 092
77 046
660
44
4 972
0
77
91586
December
4 576
7 619
98 741
748
3 652
2 772
440
4 004
122 552
Total 1998
90408
72 869
1 000 051
7 536
9 548
9196
2816
2 625
1195 049
1997
88 561
83 700
1005 810
7 776
10 358
10112
4169
2118
1212604
Change 1998/97
+ 1847
-10 831
- 5 579
-240
-810
-916
-1353
+ 507
-17555
Relative change
(%)
+ 2.09
-12.94
-0.57
-3.09
-7.82
-9.06
-32.45
+ 23.94
-1.45
L Series
Institutions
European Parliament
Council
Commission
Court of Justice
Economic and Social Committee
Court of Auditors
Committee of the Regions
Other
Total
January
117
5163
8 584
0
0
0
0
0
13 864
February
18 073
6 968
12147
0
0
0
0
572
37760
March
231
5 952
14 287
0
0
0
0
374
20 844
April
660
5 027
8129
0
0
0
0
0
13 816
May
143
4 744
7 829
0
0
0
0
440
13156
June
275
4158
11275
0
0
0
0
0
15708
July
698
5 547
12 587
0
0
0
0
0
18 832
August
275
3 981
7 404
0
0
0
0
0
11660
September
3
1058
7 783
0
0
0
0
132
8 976
October
167
11089
22 052
0
0
0
0
0
33 308
November
133
5 288
9 737
0
0
0
0
0
15158
December
660
6 563
19 903
0
0
0
0
2 046
29172
Total 1998
21435
65 538
141 717
0
0
0
0
3 564
232 254
1997
24173
64 603
130112
99
11
0
22
968
219 988
Change 1998/97
- 2 738
+ 935
+ 11605
-99
-11
+ 0
-22
+ 2 596
+12 266
Relative change
(%)
-11.33
+ 1.45
+ 8.92
—
—
— + 268.18
+ 5.58

Table 44 (cont.) — Monthly breakdown by institution, O J pages produced in 1998
C Series
Institutions
European Parliament
Council
Commission
Court of Justice
Economic and Social Committee
Court of Auditors
Committee of the Regions
Other
Total
January
6104
1642
5 530
528
1408
88
0
154
15 454
February
6 461
1370
4 213
748
0
440
1 100
88
14 420
March
7 683
847
5 214
872
2 728
440
0
198
17982
April
9 827
990
54 668
308
880
440
0
33
67146
May
6124
1392
7 855
704
880
44
0
161
17160
June
9 517
1644
9 735
205
0
572
836
66
22575
July
6 930
1901
9 635
1 100
2 200
1848
0
0
23 614
August
151
1078
21 153
528
0
176
616
286
23 988
September
3 674
176
8 087
1 103
1408
44
0
0
14 492
October
11600
1050
4 444
780
0
132
264
44
18 314
November
1562
1804
7161
660
44
4 972
0
77
16 280
December
3 916
1056
7 702
748
3 652
2 772
440
1958
22244
Total 1998
73 549
14 950
145397
8 284
13 200
11968
3 256
3 065
273 669
1997
64 388
19 097
126 994
7 677
10 347
10112
4147
1150
243 912
Change 1998/97
+ 9161
-4147
+ 18 403
+ 607
+ 2 853
+ 1856
-891
+ 1915
+ 29757
Relative change
(%)
+14.23
-21.72
+14.49
+ 7.91
+ 27.57
+ 18.35
-21.49
—
+ 12.20
S Series
o ω
Institutions
European Parliament
Council
Commission
Court of Justice
Economic and Social Committee
Court of Auditors
Total
Number of notices
January
0
0
58 828
0
0
0
58 828
12 880
February
0
0
63 008
0
0
0
63 008
12 972
March
0
0
64 702
0
0
0
64702
12 924
April
0
0
69 850
0
0
0
69 850
14 239
May
0
0
62 326
0
0
0
62 326
12126
June
0
0
60 940
0
0
0
60 940
12 375
July
0
0
81884
0
0
0
81884
16 245
August
0
0
76076
0
0
0
76 076
14 046
September
0
0
61556
0
0
0
61556
13 484
October
0
0
81224
0
0
0
81224
15 406
November
0
0
60148
0
0
0
60148
12 575
December
0
0
71 136
0
0
0
71136
14123
Total 1998
0
0
379 654
0
0
0
811 678
163 395
1997
0
0
748 704
0
0
0
748 704
155186
Change 1998/97
0
0
-369 050
0
0
0
+ 62 974
+ 8 209
Relative change
(%)
- 49.29
+ 8.41
+ 5.29

o Table 45 — Official Journal — Pages invoiced 1998 accounting year —1997 production carried forward and 1998 production, by institution
L, C and S Series
Institutions
European Parliament
Council
Commission
Court of Justice
Economic and Social Committee
Court of Auditors
Committee of the Regions
Other
Total
January
0
0
0
0
0
0
0
0
0
February
9 099
19 598
212 305
1463
1408
6 556
22
814
251 265
March
0
3 300
8 003
748
11
88
0
0
12150
April
3 461
4 968
90392
36
0
440
0
1100
100397
May
33 697
10 957
142 956
836
0
4400
0
121
189 007
June
10 593
5 318
72 646
572
2 728
220
1892
73
94042
July
4 862
2189
31766
0
880
0
0
451
40148
August
12 464
9133
63 596
645
880
264
836
165
87 983
September
4 969
11300
96 441
484
2 200
1936
0
902
118 232
October
3 201
4 037
194 346
1202
0
660
0
33
203 479
November
14 958
1879
105 959
1385
2 387
44
0
44
126 656
December
3 291
4 619
55 934
440
0
0
264
22
64 570
Total 1998
100 595
77 298
1 074 344
7811
10 494
10 648
3 014
3 725
1 287 929
1997
94 983
80155
1014 989
8080
9 387
9 518
4 790
831
1222733
Change 1998/97
+ 5 612
- 2 857
+ 59 355
-269
+ 1107
+ 1130
-1776
+ 2 894
+ 65196
Relative change
(%)
+ 5.91
-3.56
+ 5.85
-3.33
+ 11.79
+ 11.87
-37.08
+ 348.26
+ 5.33
L Series
Institutions
European Parliament
Council
Commission
Court of Justice
Economic and Social Committee
Court of Auditors
Committee of the Regions
Other
Total
January
0
0
0
0
0
0
0
0
0
February
975
12 977
30 731
11
0
0
0
0
44694
March
0
2 860
737
0
11
0
0
0
3 608
April
517
3 293
5 522
0
0
0
0
924
10 256
May
17 754
9 394
8 580
0
0
0
0
0
35 728
June
121
5 084
17 293
0
0
0
0
22
22 520
July
484
1276
1452
0
0
0
0
440
3 652
August
352
6 248
2 816
0
0
0
0
0
9 416
September
968
9 650
28 850
0
0
0
0
0
39 468
October
220
2 860
1540
0
0
0
0
0
4 620
November
124
1455
9 597
0
0
0
0
0
11176
December
123
3 816
17511
0
0
0
0
22
21472
Total 1998
21638
58 913
124 629
11
11
0
0
1408
206 610
1997
25163
66 559
144 331
88
0
0
0
528
236 669
Change 1998/97
- 3 525
- 7 646
-19 702
-77
+ 11
+ 0
+ 0
+ 880
-30 059
Relative change
(%)
-14.01
-11.49
-13.65
-87.50
— —
— +166.67
-12.70
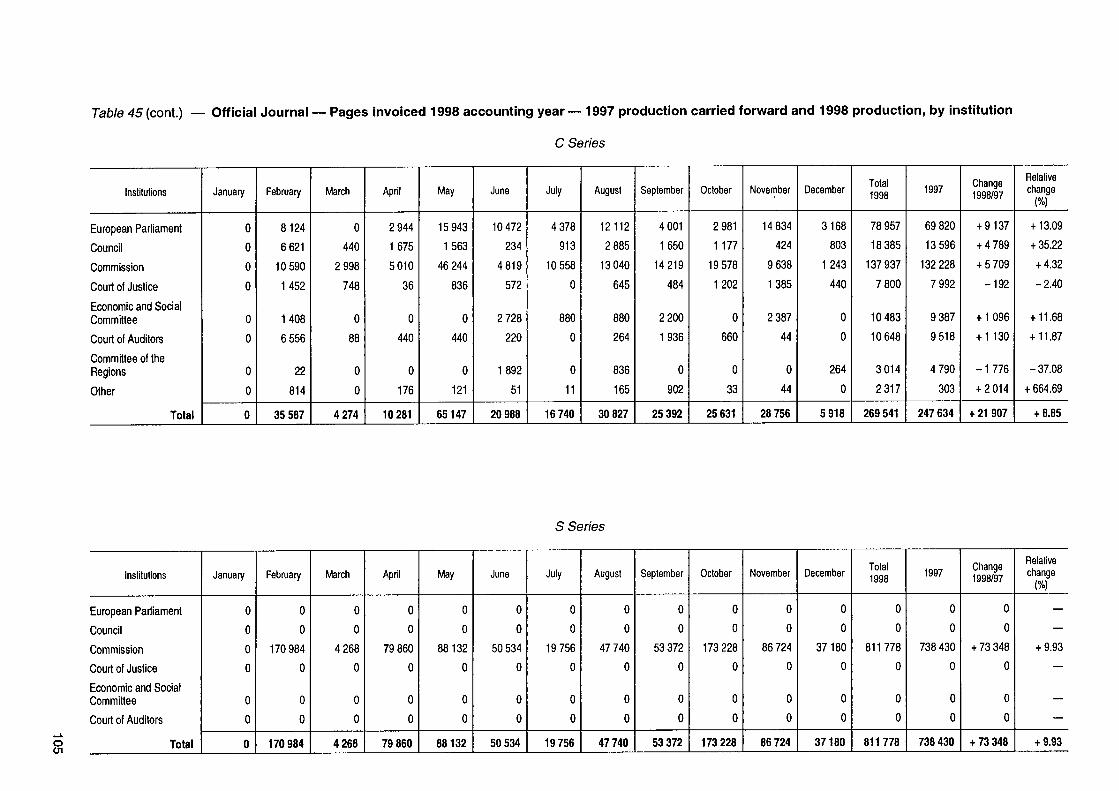
Table 45 (cont.) — Official Journal — Pages invoiced 1998 accounting year — 1997 production carried forward and 1998 production, by institution
C Series
Institutions
European Parliament
Council
Commission
Court of Justice
Economic and Social Committee
Court of Auditors
Committee of the Regions
Other
Total
January
0
0
0
0
0
0
0
0
0
February
8124
6 621
10 590
1452
1408
6 556
22
814
35 587
March
0
440
2 998
748
0
88
0
0
4274
April
2 944
1675
5 010
36
0
440
0
176
10 281
May
15 943
1563
46 244
836
0
440
0
121
65147
June
10 472
234
4819
572
2 728
220
1892
51
20 988
July
4 378
913
10 558
0
880
0
0
11
16740
August
12112
2 885
13 040
645
880
264
836
165
30 827
September
4 001
1650
14219
484
2 200
1936
0
902
25 392
October
2 981
1 177
19 578
1202
0
660
0
33
25 631
November
14 834
424
9 638
1385
2 387
44
0
44
28 756
December
3168
803
1243
440
0
0
264
0
5 918
Total 1998
78 957
18 385
137 937
7 800
10 483
10 648
3 014
2 317
269 541
1997
69 820
13 596
132 228
7 992
9 387
9 518
4 790
303
247 634
Change 1998/97
+ 9137
+ 4 789
+ 5 709
-192
+ 1096
+ 1 130
-1776
+ 2 014
+ 21 907
Relative change
<%)
+13.09
+ 35.22
+ 4.32
-2.40
+ 11.68
+ 11.87
-37.08
+ 664.69
+ 8.85
S Series
o Ol
Institutions
European Parliament
Council
Commission
Court of Justice
Economic and Social Committee
Court of Auditors
Total
January
0
0
0
0
0
0
0
February
0
0
170 984
0
0
0
170 984
March
0
0
4 268
0
0
0
4268
April
0
0
79 860
0
0
0
79 860
May
0
0
88132
0
0
0
88132
June
0
0
50 534
0
0
0
50 534
July
0
0
19 756
0
0
0
19756
August
0
0
47 740
0
0
0
47 740
September
0
0
53 372
0
0
0
53 372
October
0
0
173 228
0
0
0
173 228
November
0
0
86 724
0
0
0
86 724
December
0
0
37 180
0
0
0
37180
Total 1998
0
0
811778
0
0
0
811778
1997
0
0
738 430
0
0
0
738 430
Change 1998/97
0
0
+ 73 348
0
0
0
+ 73 348
Relative change
(%)
+ 9.93
+ 9.93

6.2.2. Publications other than the Official Journal
Publications of this kind are handled by the Planning Office. The trend in the number of files opened was as follows:
Type
Periodicals Minor jobs Individual publications (including published documents and COM documents)
Total number of files
1997
136 4S
2 384
2 568
1998
157 45
2 384
3 091
The administrative and financial management of these publications can be summarised as follows:
Nature of work
Invitations to tender — notices published in the OJ S Series — firms invited to tender — bids examined New contracts (including OJ contracts) CCPC reports/opinions Quotations/estimates Order forms Invoices Credit notes Price revision
1997
30 29
1 317 477
87 32
3 127 3 028 4 192
97 3
1998
21 21
907 278
73 21
2 650 2 956 2 924
62 4
The 2 924 invoices checked represent a total of ECU 28165 387.29, broken down as follows among the institutions:
Institution
Commission European Parliament Council Court of Justice Court of Auditors Economic and Social Committee Cedefop Publications Office Other
Total
Amount (ECU)
22 949 272.05 1 733 931.02
616 611.77 1 879 531.99
39 622.48 31 276.40
319 691.92 321 317.46 274 132.20
28 165 387.29
%
81.48 6.16 2.19 6.67 0.14 0.11 1.14 1.14 0.97
100.00
The 62 credit notes obtained totalled ECU 427 442.55.
The total value of all the invoices checked was 30.2 % lowerthan in 1997.
106

6.3. Contracts for services and supplies chargeable to the Publications Office budget
The Table below summarises the work done in connection with services and supplies chargeable to the Publications Office budget.
Nature of work
Procurement requests Invitations to tender — notices published in the OJ S Series — firms invited to tender — bids examined New contracts and special arrangements CCPC reports Quotations/estimates Commitments Order forms Invoices/credit notes Price revisions Recovery orders VAT exemption certificates
1997
546 33 10
577 204
99 13
770 1 216 1 305 5 277
27 250
1 095
1998
451 10 6
85 27 410) 5
787 1 135 1 119 4 406
320 320
1 328 (') Plus 109 amendments.
107


7. Publications Office staff and personnel matters
7.1. Officials
7.2. Temporary staff
7.3. Auxiliary staff
7.4. Backup and freelance proof-readers
7.5. Training
7.6. Consultations with staff representatives
7.7. Consultations with trade unions and professional bodies


7.1. Officials
The number of posts in the Office establishment plan remained the same as in 1997.
Table 46 — 1998 establishment plan
Category and grade
A1
A 2
A 3
A 4
A5
A 6
A 7
A 8
B1
B2
B3
B4
B5
C1
C2
C3
C4
C5
D1
D2
D3
D4
Total
Total
Total
Total
Grand total
Number of permanent posts
—
10) 2
5
10
10
12
—
40
32
59 0)
75 0)
58
29
253
33
34
32
38
23
160
31
23
18
—
72
525 0)
0) The Director of the Publications Office is an official in grade A1 ad personam. 0) Including two technical and secretarial assistants. 0) Half-time occupation may be compensated for by engaging other staff up to trie equivalent
of the number of posts thus liberated in each category.
In 1998, 21 officials joined the Office by recruitment, internal transfer and individual transfer. The details of these changes and of other administrative procedures (departures, promotions etc.) are given in Table 47 below.
111
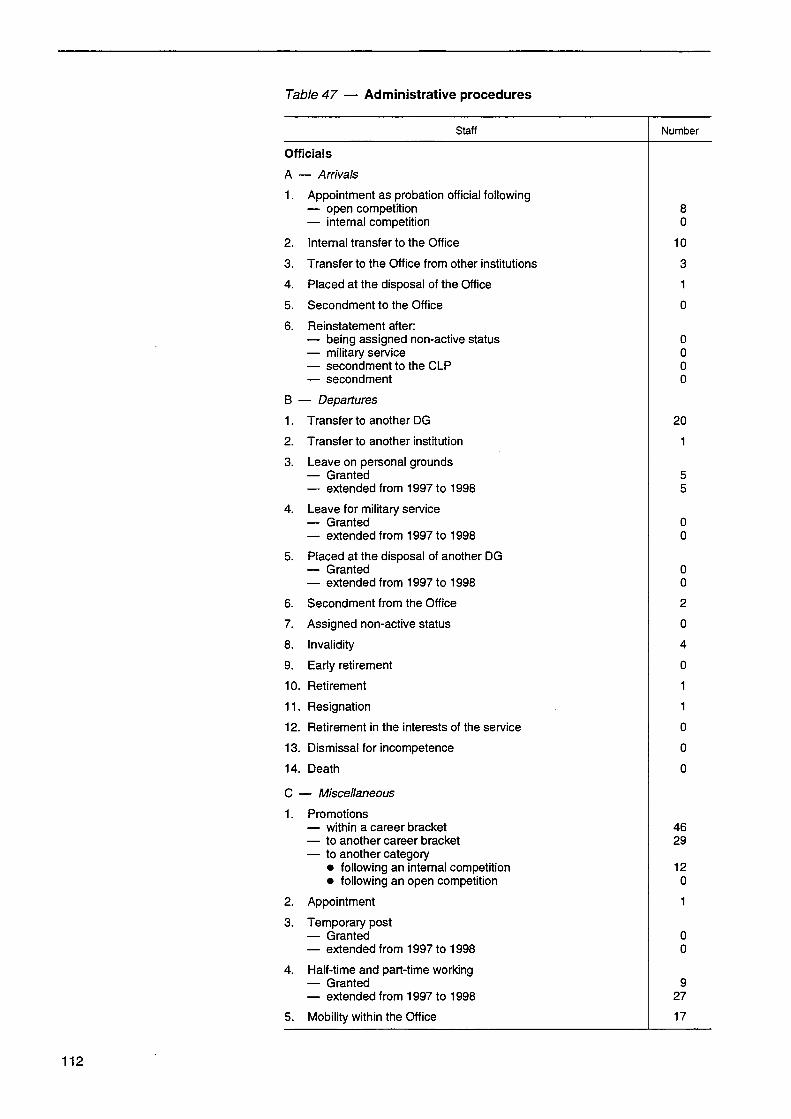
Table 47 — Administrative procedures
Staff
Officials
A
1.
2.
3.
4.
5.
6.
Β ·
1.
2.
3.
4.
5.
6.
7.
8.
9.
10.
11.
12.
13.
14.
C
1.
2.
3.
4.
5.
— Arrivals
Appointment as probation official following — open competition — internal competition
Internal transfer to the Office
Transfer to the Office from other institutions
Placed at the disposal of the Office
Secondment to the Office
Reinstatement after: — being assigned non-active status — military service — secondment to the CLP — secondment
— Departures
Transfer to another DG
Transfer to another institution
Leave on personal grounds — Granted — extended from 1997 to 1998
Leave for military service — Granted — extended from 1997 to 1998
Placed at the disposal of another DG — Granted — extended from 1997 to 1998
Secondment from the Office
Assigned non-active status
Invalidity
Early retirement
Retirement
Resignation
Retirement in the interests of the service
Dismissal for incompetence
Death
— Miscellaneous
Promotions — within a career bracket — to another career bracket — to another category
• following an internal competition • following an open competition
Appointment
Temporary post — Granted — extended from 1997 to 1998
Half-time and part-time working — Granted — extended from 1997 to 1998
Mobility within the Office
Number
8 0
10
3
1
0
0 0 0 0
20
1
5 5
0 0
0 0
2
0
4
0
1
1
0
0
0
46 29
12 0
1
0 0
9 27
17
112

Staff
Temporary staff A — Arrivals
1. Appointment for a fixed period — new appointment — Renewal
2. Open-ended appointment — new appointment — Renewal
Β — Departures
1. End of contract
2. Establishment after competition
3. Resignation
4. Death
Auxiliary staff
A — Arrivals
1. Appointment for a fixed period — new appointment — Renewal
2. Open-ended appointment — new appointment — Renewal
Β — Departures
1. End of contract
2. Establishment after competition
3. Resignation
4. Death
Number
13 4
0 0
10
1
3
0
35 0
0 0
24
0
0
0
7.2. Temporary staff
In order to cover certain languages for which the reserve lists had proved insufficient, 13 contracts for temporary staff were concluded or renewed during the year. An interinstitutional competition for Finnish and Swedish proof-readers was announced by the Court of Justice in cooperation with the Commission and, in particular, the Publications Office. It should be completed in mid-1999.
7.3. Auxiliary staff
In order to cover ad hoc proof-reading requirements and medium-term absences of clerical and secretarial staff (e.g. on maternity leave), the Office awarded a total of 21 new contracts to auxiliary staff during the year.
By the end of the year, there were still 21 auxiliary members of staff-category B, 3 in category C and 2 in category D.
•16in
113
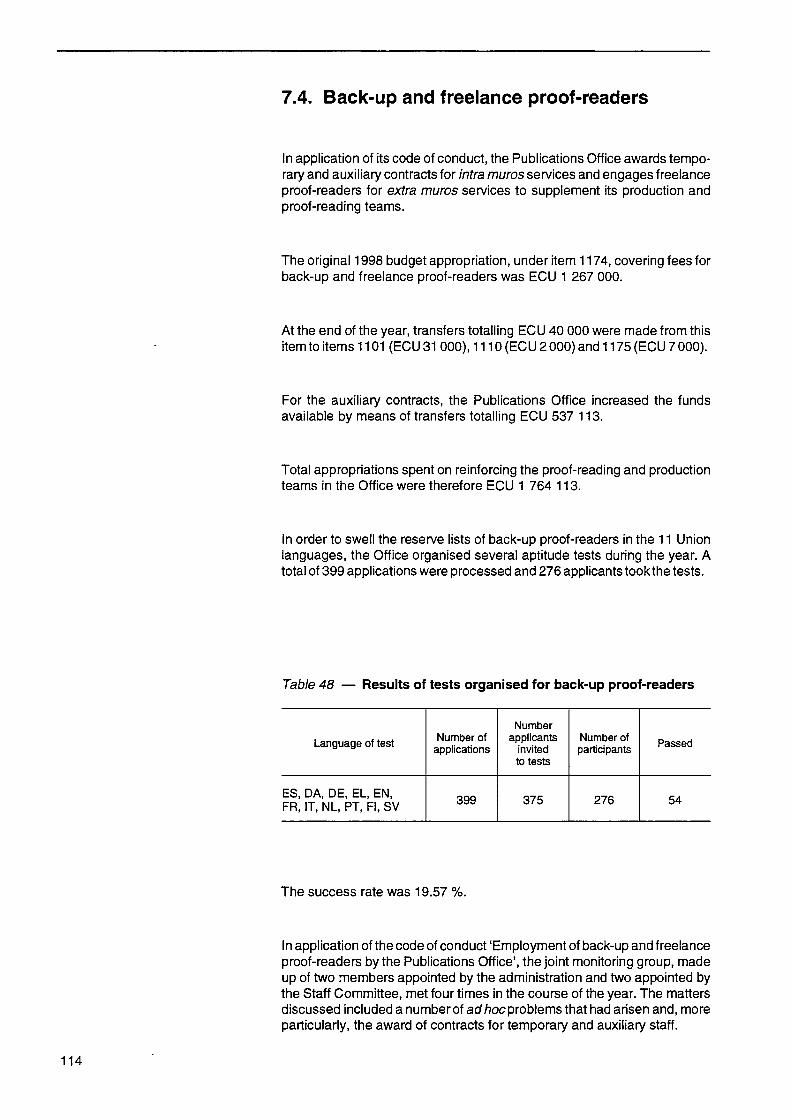
7.4. Back-up and freelance proof-readers
In application of its code of conduct, the Publications Office awards temporary and auxiliary contracts for intra muros services and engages freelance proof-readers for extra muros services to supplement its production and proof-reading teams.
The original 1998 budget appropriation, under item 1174, covering fees for back-up and freelance proof-readers was ECU 1 267 000.
At the end of the year, transfers totalling ECU 40 000 were made from this item to items 1101 (ECU 31 000), 1110 (ECU 2 000) and 1175 (ECU 7 000).
For the auxiliary contracts, the Publications Office increased the funds available by means of transfers totalling ECU 537 113.
Total appropriations spent on reinforcing the proof-reading and production teams in the Office were therefore ECU 1 764 113.
In order to swell the reserve lists of back-up proof-readers in the 11 Union languages, the Office organised several aptitude tests during the year. A total of 399 applications were processed and 276 applicants tookthe tests.
Table 48 — Results of tests organised for back-up proof-readers
Language of test
ES, DA, DE, EL, EN, FR, IT, NL, PT, Fl, SV
Number of applications
399
Number applicants
invited to tests
375
Number of participants
276
Passed
54
The success rate was 19.57 %.
In application of the code of conduct 'Employment of back-up and freelance proof-readers by the Publications Office', the joint monitoring group, made up of two members appointed by the administration and two appointed by the Staff Committee, met four times in the course of the year. The matters discussed included a number of ad hoc problems that had arisen and, more particularly, the award of contracts for temporary and auxiliary staff.
114

In 1998, the Office used a total of 399.5 person-months (temporary and auxiliary staff), broken down as follows:
OP
— OP/2 (Official Journal): • ES • DA • DE • EL • EN • FR • IT • NL • PT • Fl • SV
— OP/2 (Production): — OP/3 (Production): — OP/3 (Methods and development): — OP/3 (Proof-reading):
• ES • DA • DE • EL • EN • FR • IT • NL • PT • Fl • SV
— OP/4: — OP/5:
Staff employed (person-months)
— 16 5.5
12 4
13 10 12 18 18 10 77 33.5 23
8.5 11.5 20.5
1 21.5 31.5
5 0.5 9 7.5
13 6
12
Over the same period, work for the Court of Justice required 93 person-months, taking all languages together, in addition to proof-reading 'by the page'.
7.5. Training
7.5.1. Training plan The implementation of the training plan for 1997-98 involved the issuing of three invitations to tender for the design of training courses tailored to Office requirements.
Participation in drawing up the new training plan for 1999-2000 was high, with 80 % of officials filling in an individual sheet.
7.5.2. Attendance at training courses in 1998
In 1998, 434 officials attended 1 599 training courses, which means that 83 % of staff attended at least one course. This can be explained by the fact that following the migration to Windows NT, specific training was offered for the entire staff.
115

The courses involving the greatest numbers were in the use of computers (868); followed by induction courses, involving in particular several 'Presentation of the Office' sessions, which appear to meet a genuine need (259), and finally, training in drafting (152) and languages (151).
The Office organised 101 training courses, tailored specifically to its needs, out of its own budget. These were attended by 495 persons and included courses in:
— Windows NT (69 sessions)
— SGML levels 2 and 3
— DTP (desk-top publishing)
— Production
— Web design
— Catel (electronic catalogue)
— HTML/Javascript
The Office committed ECU 98 000 for these activities.
7.6. Consultations with staff representatives
In 1998, three meetings were held between the representatives of the Local Staff Committee (CLP) and the Office's Management Committee.
These meetings provide an excellent forum for the exchange of information, at which the Office can inform its staff of projects underway and important decisions and the staff can inform it in turn of any matters of concern or problems.
The question of asbestos in the building was thus discussed in a totally transparent fashion, the results of the study being made available to the whole staff.
The Management Committee (substitute members) invited the representatives of the Staff Committee to state their views at the meeting of 17 March 1998.
Training, use of external staff and the increase in free distribution were among the questions raised.
The meetings with the representatives of the CLP were not the only channels of communication between the Office Management and its staff. Another important channel was EUR-OP Infos—the Publications Office's newsletter.
Seven issues appeared in 1998, containing various types of information, including new approaches following decisions or recommendations by the Management Committee, changes in staff (arrivals, departures, internal movements), new products and services on offer (EUR-Lex, OJ S Series on CD-ROM, Combined Nomenclature on CD-ROM, Interinstitutional Style Guide, etc.) or projects under way (for example, the migration to NT).
The main preoccupations on the part of staff in 1998 included the planned renovation of the old part of the Mercier Building and, in particular, the problems of prostitution in the vicinity of the Office premises, which was the
116

subject of correspondence between Mr Emringer and Mr Oreja, Member of the Commission, and between President Santer and the Luxembourg Prime Minister, Mr Juncker. The entire staff was kept informed via EUR-OP Infos.
7.7. Consultations with trade unions and professional bodies
On 12 October 1998, the Secretary-General of the Commission, in his capacity as Chairman of the Management Committee, resumed the practice of holding annual policy meetings with the trade unions and professional bodies (OSPs), the last one having been held on 18 April 1994.
The Secretary-General had first been alerted by the OSPs to the problem of security around the Mercier Building, which is increasing from yearto year. He undertook to referthe matter to the President of the Commission and the Luxembourg authorities.
The OSPs were also concerned at the increase in the workload while the number of staff remained unchanged against a background of budgetary austerity. A side-effect of this could be excessive use of non-established staff.
The Chairman of the Management Committee explained that, in the current climate of austerity, the Office was mainly concerned with correcting the imbalances in the establishment plan by applying for conversion of posts. Thus the conversion of 7 D posts into 7 C posts, as accepted by the budget authority, is in line with the Office's policy of upgrading the work of D grade officials, who are now involved in supervisory and management work rather than exclusively manual activities. As for the use of outside staff, the Office realises the importance of retaining its pool of competence. Its subcontracting policy is to use its officials for supervisory and management work and to use the private sector, if necessary, for implementation.
117


8. Application of the current provisions relating to long-and medium-term translations


In 1998, Group G of the Translation Service translated 17 996 pages for the Office.
As in previous years, EUR-OP News accounted for much of this workload. As from 1997, this quarterly publication has been translated into all the Community languages.
The Translation Service was also regularly asked to translate invitations to tender and did a certain amount of work under the contract for rendering services in connection with the CELEX database.
In close collaboration with the Office, Unit AGL/1, Language Coordination, organised the translation of the headings of the establishment plan forthe IDEA database. It was also actively involved in drawing up the Interinstitutional Style Guide and distributing it within the Commission.
Lastly, mention should be made of the collaboration between the Office, the Translation Service and other Directorates-General of the Commission in setting up systems for managing and exchanging computerised textual data. This will substantially reduce the time required for publishing the Commission's major documents, such as the Bulletin of the European Union, the budget and Community agreements.
The Office was also actively involved in the work of the TAIEX (Technical Assistance Information Exchange Office) Task Forces, which are responsible for preparing forthe accession of new Member States in such matters as translating the existing body of Community legislation into the languages of the applicant countries and publishing secondary legislation in these languages.
121


Annex i — CELEX
(The interinstitutional computerised documentation system for Community law)


General overview 127 What is CELEX? 127 Activities during 1998 127 Strategy paper 128
1. Production 129 1.1. Loading of documentary units 129 1.2. Loading of texts 130 1.3. Extending coverage 131 1.4. Production tools 131
2. Dissemination 132 2.1. Total direct use of the reference databases 132 2.2. Access by external users 133 2.3. Access to derived versions of CELEX 135 2.4. Publishing the Directory of Community legislation in force 135
3. Major development projects 136 3.1. Graphical interface 136 3.2. Eurovoc indexation 136 3.3. Finnish and Swedish databases 136 3.4. Preparations for the migration 136
4. Resources 137 4.1. 1998 financial year 137 4.2. 1999 financial year 138
125

General overview
What is CELEX? CELEX (Communitatis Europeae Lex) is the official interinstitutional legal database of the European Union.
CELEX came into operation in the early 1970s for internal use by the Commission; in the course of that decade it became interinstitutional, and at the beginning of the 1980s it was converted to a multilingual system accessible to the general public.
CELEX covers:
• Community legislation, including preparatory documents and references to national implementing measures,
• case law of the Court of Justice and the Court of First Instance,
• parliamentary questions.
CELEX is distributed to users external to the European institutions via three main channels:
• direct distribution by the Publications Office to privileged users such as the Commission's network of European Documentation Centres (EDCs) and Euro Info Centres (EICs);
• ordinary customers can subscribe to CELEX through a network of 19 official gateways, which provide access on line to the database, housed in the Commission's Computing Centre;
• in addition, 24 licence holders are disseminating derived versions of CELEX on line or on CD-ROM, which enables them to create information products incorporating CELEX data presented together with other relevant information.
Activities during 1998 In 1998 the Publications Office continued its efforts to improve the coverage and quality as well as the accessibility of the database.
The textual coverage of the Finnish and Swedish versions of the database was improved considerably. By the end of the year, almost all texts available in those two languages were loaded. The reason why there is still a considerable discrepancy between Finnish and Swedish and the other language versions is that not all acts in force on the date of accession were translated.
A general review of the contents of some sectors of the database was also undertaken.
The new internet service introduced in 1997 was further improved by the launch of a new version of the WWW-interface. This new service has led to an important increase of the number of consultations of the database. The number of documents visualised was 14 million in 1998 compared with 8 million in 1997 and 5 million in 1996. CELEX has become the European Commission's most widely used intranet service.
The CELEX Interinstitutional Group (GIC) and the Council Working Party on Legal Data Processing (GIJC) assisted in the management and dissemination of CELEX.
The Council Working Party held two meetings (on 15 and 16 June and 3 and 4 December). The GIC met four times (on 12 February, 8 June, 12 October and 24 November).
127
Strategy paper At the meeting in February the GIC approved the 1998 working plan forthe CELEX database. At its meeting on 12 Octoberthe GIC adopted a Strategy Paper for the future development of CELEX which was submitted to the Publications Office Management Committee. The strategy paper was also submitted to the GIJC, thus giving the Member States the opportunity to express their views. The Strategy Paper envisages improvements in access to legal information on the European Union in four major areas:
1. Extension of CELEX coverage. With a few exceptions, such as the COM documents and the Court Reports, only documents published in the Official Journal are loaded in CELEX. Even though CELEX coverage should continue in future to be restricted to official documents, it could be extended to include documents considered by the institution issuing them to be public even if they have not been published in the Official Journal.
2. Better tracking of the law-making procedures. CELEX is the most important public database to provide information and links to the various stages of the lives of the documents, such as proposals, amendments, annulments etc. There are, however, still some weaknesses that must be dealt with. Certain events in the life of an instrument are not covered by the database, such as the introduction of an action for annulment before the Court of Justice, the existence of a joint text adopted by a Conciliation Committee and stages in the ratification of an international convention by the other signatories.
3. Review of the dissemination policy: the cost of the analysis and work involved in the production of CELEX is one of the reasons why CELEX is a fee-based service. This may conflict with the legitimate demand by citizens for free access to the law applicable to them. A review of the dissemination policy with a view to finding a balance between the differing interests has therefore been suggested.
4. Greater synergy between the institutions' various information services: the various information services that are being built by the institutions should be better integrated to provide citizens with a better overview of the different sources available. CELEX should continue to be the natural environment for collating and storing legal documents from which links to other sources could be created.
128

1.1. Loading of documentary units
1. Production A CELEX document consists of two basic parts:
— the analytical part, containing the title, date, various descriptors and links to other documents, which is created for each language version by a program on the basis of the same coded version of the document. Because of this parallelism between all the language versions the term 'documentary unit' is used below to refer to a given document;
— the textual part, containing the text and annexes to the document (except for sector 7 where the documents do not contain text, and sectors 5 and 9, which are partly loaded see 1.3.); these texts were in the past loaded as they became available, which explains the differences in text coverage.
These two parts are loaded on a weekly basis.
Table 1 — Number of documentary units ('analytical part') loaded in 1997 and 1998
Sector
Treaties Secondary legislation Complementary legislation International agreements Commission preparatory documents Council preparatory documents Parliament preparatory documents Economic and Social Committee Committee of the Regions Court of Justice Court of Auditors National implementing measures Parliamentary questions Corrigenda etc.
Total
1997
0 7 305
72 536 979
56 670 169 58
596 2
88 4 980
742
16 253
1998
309 4 246
79 223 947
78 644 202
64 801
44 104
6 240 619
14 561
129

1.2. Loading of texts The work of loading full texts is summarised in the following tables.
(a) Legislative texts
Table 2 — Text coverage of CELEX sectors 1 to 4 (documents in force on 1 January 1995 and later) (1)
Language
ES
DA
DE
EL
EN
FR
IT
NL
PT
F i f l SV (2)
Total
Situation at 1
Documents with text
22 615
22 509
22 627
22 571
22 639
22 656 21 994
22 501
22 202
11 406
10 124
223 844
January 1998
Coverage (%)
98.0
97.6
98.1
97.9
98.1
98.2
95.4
97.6
96.3
49.4
43.9
88.2
Situation at 1
Documents with text
24 715
24 737
24 785
24 502
24 758
24 802
24 705
24 762
24 595
18 692
18 649
259 702
January 1999
Coverage (%)
98.9
99.0
99.1
98.0
99.0
99.2
98.8
99.1
98.4
74.8
74.6
94.4
(') Except food-aid documents, which it is not planned to load in full at present. (2) The reason why there is still a considerable discrepancy between the Finnish, Swedish and the other language versions is that a large
number of acts in force on the date of accession were never translated into these two languages (see point 3.3 below).
(b) Case law texts
Table 3 — Coverage on 18 January 1999: Case law (sector 6): Judgments and other documents (excluding opinions of the Advocates-General)
Language version
ES
DA
DE
EL
EN
FR
IT
NL
PT
Fl
SV
Total
Number of documentary units present
6 4 1 9
6 4 1 9
6 419
6 4 1 9
6 419
6 419
6 419
6 419
6 419
6 419
6 419
—
Target full-text coverage (')
4 046
5 864
6 419
5 002
5 864
6 419
6 4 1 9
6 419
4 046
1 609
1 609
53 716
Number of texts loaded
2 736
4 702
5 764
3 1 6 9
5 221
5 876
5 806
5 742
2 594
756
802
43 164
Coverage rate on 18 January 1999
(%)
68
80
90
63
89
92
90
89
64
47
50
80
Coverage rate on 15 January 1998
(%) (for comparison)
67
82
92
64
91
93
93
91
64
39
41
74
(') For DE, FR, IT and NL, documents published from the outset; for EN and DA documents published since 1 January 1973; for EL, documents published since 1 January 1981 ; for ES and PT, documents published since 1 January 1986 and for Fl and SV, documents published since 1 January 1995.
130

Table 4 — Coverage on 18 January 1999: Case law (sector 6): Opinions of the Advocates-General
Language version
ES DA DE EL EN FR IT NL PT Fl SV
Total
Number of documentary units present
4 525 4 525 4 525 4 525 4 525 4 525 4 525 4 525 4 525 4 525 4 525
—
Target full-text coverage (')
2 361 2 361 2 361 2 361 2 361 2 361 2 361 2 361 2 361
821 821
22 891
Number of texts loaded
1 517 1 568 1 886 1 491 1 723 2 049 1 921 1 788 1 482
588 729
16 742
Coverage rate on 18 January 1999
(%)
64 66 80 63 73 87 81 76 63 72 89
73
Coverage rate on 15 January 1998
(%) (for comparison)
60 64 80 60 73 86 81 72 61 45 47
66 (1) Opinions published since 1 January 1987. For Fl and SV, opinions published since 1 January 1995.
1.3. Extending coverage 1.3.1. Parliamentary questions in Fl and SV
Written questions were first published in Finnish and Swedish in OJ C 60 on 25 February 1998. Since then, the texts of these questions are available in all 11 languages.
7.3.2. COM documents not published in the OJ C series
As part of the Greffe 2000 project COM documents will be made available in an electronic version by the Secretariat-General of the Commission. During a test period that started in October 1998 it has been possible to load the texts of a number of COM documents not published in the OJ C series. The Greffe 2000 system will be fully operational as of February 1999, thus making it possible to include in CELEX the full texts of all COM documents, including those not published in the OJ C.
1.4. Production tools The adaptation of the production system continued throughout 1998 as a preparation for the migration to a new production and dissemination platform during 1999.
131

2. Dissemination
This chapter provides statistics on the dissemination of the CELEX refer
ence databases and the derived versions. The increased use of the CELEX
reference databases has continued throughout 1998 as a result of the intro
duction of the new userfriendly interface using the Web technology. The
statistics below show the development of the direct dissemination of
CELEX to the institutions as well as to external users (2.1 ), the commercial
aspects of the direct dissemination of CELEX to external users (2.2) and
the dissemination of derived versions (2.3).
2.1. Total direct use of the
reference bases
Table 5.a — Trend in number of documents viewed by direct
consultation
14 000 000η
12 000 000-
10 000 000-
8 000 000-
6 000 000-
4 000 000-
2 COO 000-
0-
7 856 822
3 299 231
1994
4 200 597
199S
5 153136
1996 1997
13 980 997
1998
Table 5.b — Breakdown of the number of documents viewed by
type of consultation
14000 000-,
12000000-
10000 000-
8000 000-
6 000 000-
4000 000-
2000 000-
^
1994 1995 1996
BO BO DO
1997 1998
;
!
— I
!
(') Consultation in Mistral mode.
Í2) Consultation in menu assisted mode (available to the institutions since 1 January 1995
and to outside users since 1 September 1995).
0 Consultation via the graphic Web interface (available to the institutions since 15 October 1996 and to outside users since 1 August 1997).
132

Table 6.a — Trend in number of direct consultation sessions
1200 000-,
1000 000-
800000-
600 000-
400000-
200000-
0-
,./T
1994
357 931 386 817
1995 1996
574 093
1997
1180 326
1998
Table 6.b — Breakdown of the number of sessions by type of consultation
1200 000-,
1000 000-
800 000-
600 000-
400 000-
200 000-
0-
>-' \
1994 1995 1996
BO BO DO 199·
*=p
1998
(') Consultation in Mistral mode. (2) Consultation in menu assisted mode (available to the institutions since 1 January 1995
and to outside users since 1 September 1995). (3) Consultation via the graphic Web Interface (available to the institutions since 15 October
1996 and to outside users since 1 August 1997).
2.2. Access by external users On-line dissemination of the reference databases is managed by the Publications Office (OP/4-A). The computer infrastructure is provided by the Commission's Computing Centre. There are two types of on-line distribution:
— direct distribution: users (mainly privileged users, i.e. European Documentation Centres, Euro Info Centres, etc.) who have concluded an access contract with the Publications Office;
— indirect distribution: users who have concluded a contract with an official gateway agent.
133

Table 7 — External on-line dissemination of the CELEX reference databases in 1998: direct and indirect distribution
Use
Direct (3) Indirect (")
Total
1997
Documents (')
80 741 41 991
122 732
%
65.79 34.21
100.00
Hours (2)
4 611 2 542
7 1 5 3
%
64.46 35.54
100.00
1998
Documents (')
438 620 293 797
732 417
%
59.89 40.11
100.00
Hours (2)
1 283 631
1 914
%
67.02 32.98
100.00 C) Consultation by the Web interface (from 1 August 1997). (2) Consultation by Mistral or the menu-driven interface. (3) Publications Office customers. (4) Gateway agent customers.
Table 8 — External on-line dissemination of CELEX reference databases in 1998: number of direct use contracts (Publications Office) by country and connection time for direct and gateway customers.
Country
Belgium Denmark Germany Greece Spain France Ireland Italy Luxembourg Netherlands Austria Portugal Finland Sweden United Kingdom Norway Switzerland Other
Total
Publications Office contracts (at 31 December 1998)
1998
Number
88 59
107 22
107 88 28
166 26 47 32 32 31 37
101 6
14 144
1 135
%
7.75 5.2 9.43 1.94 9.43 7.75 2.47
14.62 2.29 4.14 2.82 2.82 2.73 3.26
8.9 0.53 1.23
12.69
100.00
Change 1997/98
Number
- 7 5 + 10 + 20
+ 8 + 32 + 20
+ 6 + 76 + 22
+ 8 + 4 + 6 + 2
+ 16 + 6 + 2 + 6
+ 38
+ 209
Connection time [direct (') and indirect (2)
use together f ) ]
1998
Hours
277 100 176
55 655
61 0
144 19 32 55
112 13 14 98 20 11 56
1 920
%
14.45 5.23 9.16 2.89
34.10 3.16 0.01 7.51 0.99 2.72 2.87 5.83 0.69 0.74 5.13 1.02 0.57 2.93
100.00
Individual documents (*)
1998
Number
109 903 63 421 54 698 14448 91 807 45 301
2 585 49 753
9 602 51 840 30 246 14 500 51 925 49 773 34 911
3 836 29 402 27 019
734 970
%
14.95 8.63 7.44 1.96
12.49 6.16 0.35 6.77 1.31 7.06 4.12 1.98 7.06 6.77 4.75 0.52 4 3.68
100.00
(') Publications Office customers. (2) Gateway agent customers. (3) Consultation by Mistral or the menu-driven interface. C) Consultation by the Web interface (from 1 August 1997).
With regard to CELEX access terms, the contracts for direct use can be classified as follows:
— standard, full-price: all users, in the private or public sectors, in the countries not covered by a gateway distributor, with the exception of the categories below;
134
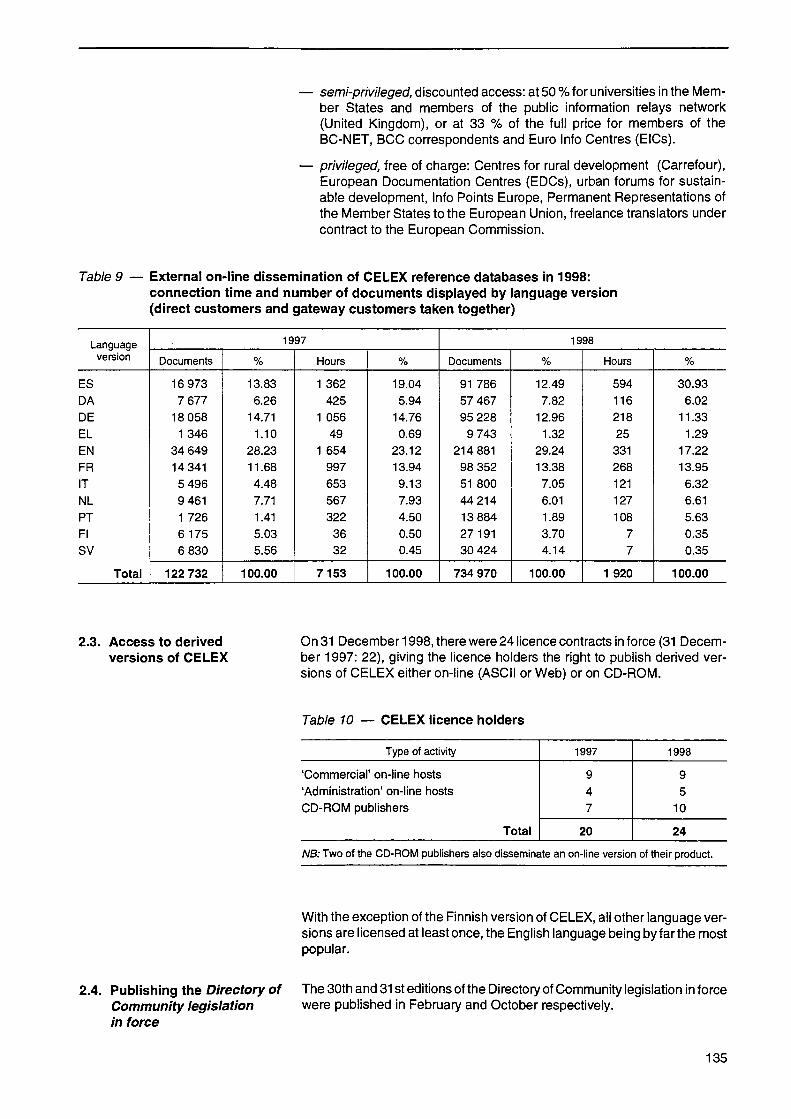
Table 9
semi-privileged, discounted access: at 50 % for universities in the Member States and members of the public information relays network (United Kingdom), or at 33 % of the full price for members of the BC-NET, BCC correspondents and Euro Info Centres (EICs).
privileged, free of charge: Centres for rural development (Carrefour), European Documentation Centres (EDCs), urban forums for sustainable development, Info Points Europe, Permanent Representations of the Member States to the European Union, freelance translators under contract to the European Commission.
Externai on-line dissemination of CELEX reference databases in 1998: connection time and number of documents displayed by language version (direct customers and gateway customers taken together)
Language version
ES DA DE EL EN FR IT NL PT Fl SV
Total
1997
Documents
16 973 7 677
18 058 1 346
34 649 14 341
5 496 9 461 1 726 6 175 6 830
122 732
%
13.83 6.26
14.71 1.10
28.23 11.68 4.48 7.71 1.41 5.03 5.56
100.00
Hours
1 362 425
1 056 49
1 654 997 653 567 322
36 32
7 153
% 19.04 5.94
14.76 0.69
23.12 13.94
9.13 7.93 4.50 0.50 0.45
100.00
1998
Documents
91 786 57 467 95 228
9 743 214 881
98 352 51 800 44 214 13 884 27 191 30 424
734 970
% 12.49 7.82
12.96 1.32
29.24 13.38 7.05 6.01 1.89 3.70 4.14
100.00
Hours
594 116 218 25
331 268 121 127 108
7 7
1 920
%
30.93 6.02
11.33 1.29
17.22 13.95
6.32 6.61 5.63 0.35 0.35
100.00
2.3. Access to derived versions of CELEX
On 31 December 1998, there were 24 licence contracts in force (31 December 1997: 22), giving the licence holders the right to publish derived versions of CELEX either on-line (ASCII or Web) or on CD-ROM.
Table 10 — CELEX licence holders
Type of activity
'Commercial' on-line hosts 'Administration' on-line hosts CD-ROM publishers
Total
1997
9 4 7
20
1998
9 5
10
24
NB: Two of the CD-ROM publishers also disseminate an on-line version of their product.
With the exception of the Finnish version of CELEX, all other language versions are licensed at least once, the English language being by farthe most popular.
2.4. Publishing the Directory of Community legislation in force
The 30th and 31 st editions of the Directory of Community legislation in force were published in February and October respectively.
135

3. Major development projects
3.1. Graphical interface A new version of the WWW-interface was introduced in October 1998. New features included the 'double visualisation', where two language versions of any text can be displayed in parallel, and the option of displaying the search history which allows the user to go back one or more steps in a search sequence. This new interface was made available in all 11 official languages. An internal test version of the 'expert search interface', which is destined to replace the Mistral native search mode, was launched in December 1998. After a period of testing, the expert search interface will be opened to the public in 1999.
3.2. Eurovoc indexation The coverage of indexing by means of Eurovoc descriptors was substantially extended. By the end of 1998, the average coverage for documents still in force in CELEX sectors 2, 3 and 4 had reached the level of 97.5 %. This means that it will become possible to search on Eurovoc descriptors in the course of 1999.
3.3. Finnish and Swedish databases
The Finnish and Swedish language versions of CELEX were made available to external users on 1 May 1997. They contain all analytical CELEX data as well as titles in Finnish and Swedish of documents published in the Special Editions and in the Official Journal since 1 January 1995. For all other documents, the titles are in English or, where English is not available, in French.
The rate of textual coverage has improved considerably. From an average of 46.6 % by the end of 1997, the coverage rate grew to 74.8 % by the end of 1998. Nearly all texts available in those two languages were thus loaded. The reason why there is still a considerable discrepancy between Finnish and Swedish and the other language versions is that not all acts in force on the date of accession were translated.
At its meeting on 3 and 4 December 1998, the Council Working Party on Legal Data Processing (GIJC) took note of the significant lack of official translations. In its report to Coreper, the GIJC stated that this situation was unacceptable and that the problem should be solved as soon as possible.
3.4. Preparations for the migration
In 1999 the CELEX database will migrate to a new production and dissemination platform. In order to facilitate migration, extensive preparatory work was done during 1998. Unfortunately, certain development projects, such as the introduction of new types of documents in CELEX, had to be postponed while awaiting the new production system.
136

4.1. 1998 financial year
4. Resources
The Publications Office spent ECU 1 215153 on CELEX in 1998 (excluding re-use of revenues from 1997), broken down as follows:
— item 3431 'production': ECU 576 543
— item 3431 'dissemination': ECU 383 675
— item 3431 'major projects': ECU 254 935
Table 12 gives the breakdown of these amounts.
In 1998, the Publications Office's CELEX team comprised 8 posts: 6 A posts, 1 Β post and 1 C post.
The human resources allocated to dissemination within OP/4 are estimated at 3 person-years.
The work done by the Translation Service (translation of the web screens, language-checking, etc.) amounted to approximately 3 person-years.
The human resources allocated by the other institutions to CELEX input in 1998 were as follows:
— European Parliament: 1.5 person-years
— Court of Justice: 1.5 person-years
— Council: 1 person-year
— Economic and Social Committee: 0.5 person-year
— Committee of the Regions: 0.5 person-year
CELEX revenue is summarised in the table below.
Table 11 — CELEX revenue (ECU)
Royalties and licences Consultation Training
Total
Amounts invoiced
1 January to 31 December 1997
321 234.70 229 161.20
0.00
550 395.90
1 January to 31 December 1998
377 886.30 195 909.69
0.00
573 795.99
The decrease in prices following the introduction of the Web interface has affected the income from CELEX. The launch of the free of charge EUR-Lex site in April 1998, which includes inter alia 'Legislation in force' taken from CELEX, is also likely to have had some impact on CELEX revenues. It is, however, too early to judge the real impact of the EUR-Lex service.
137

4.2. 1999 financial year The 1999 draft CELEX budget gives the following estimates: — item 3431 'production': EUR 720 000 — item 3431 'dissemination': EUR 260 000 — item 3431 'major projects': EUR 470 000
The total budget is EUR 1 450 000 (including reuse of revenues). This is the same amount as for 1998.
Table 12 — 1998 expenditure and 1999 forecasts (ECU/EUR)
Item 3431 CELEX
I — Production
Subtotal
II — Dissemination
1. Documentation 2. User interface 3. Eurovoc 4. EULEX
Subtotal
III — Major projects
1. Qualitative upgrade 2. Loading of consolidated texts 3. Modernisation of methods
Subtotal
Total
Financing
Credits Estimated reuse Real reuse
Total
Summary of CELEX as at 31 December 1998
1998
Planned expenditures
720 000.00
720 000.00
110 000.00 150 000.00
0.00 0.00
260 000.00
120 000.00 50 000.00
300 000.00
470 000.00
1 450 000.00
900 000.00 550 000.00
0.00
1 450 000.00
Real expenditures (')
576 542.70
576 542.70
27 680.00 328 795.00
19 500.00 7 700.00
383 675.00
158 925.00 0.00
96 010.00
254 935.00
1 215 152.70
1 050 000.00 (2) 0.00
165 152.70 (3)
1 215 152.70
1999
Forecasts
720 000.00
720 000.00
110 000.00 150 000.00
0.00
260 000.00
120 000.00 50 000.00
300 000.00
470 000.00
1 450 000.00
1 150 000.00 300 000.00
0.00
1 450 000.00 C) Expenditures in 1998 financed by reuse of revenues from 1997 do not appear in this table. (2) To compensate for the reduction in reuse the Office supplemented the credits by a transfer of ECU 150 000 in 1998. (3) On 31 December the re-use committed in 1998 was ECU 199 777.37, out of which ECU 34 624.67 was still available. More revenues from
1998 will be available during 1999. The credits under this post are available during the whole of 1999.
138

Annex II — Balance sheet and profit-and-loss accounts


Revenue and expenditure account of the Publications Office's own budget for 1998
(ECU)
Revenue
1997 appropriations carried over 1998 initial appropriations Revenue for reuse carried over from 1997 (appropriations comitted but not paid out and uncommitted appropriations) Revenue for reuse collected in 1997 (situation at 31 December 1998) — of which recovered costs and re-invoiced services — of which Publications Office quota of sales revenue
Total
10 625 200.21 1 292 725.90
4 363 982.45 54 036 000.00
6 833 151.41 11 917 926.11
+ 77151 059.97 Expenditure
Chapter 1 — Staff costs — 1997 appropriations carried over — 1998 new appropriations — Revenue for reuse carried over from 1997 — Revenue for reuse collected in 1998 Chapter 2 — Administrative expenditure — 1997 appropriations carried over — 1998 new appropriations — Revenue for reuse carried over from 1997 — Revenue for reuse collected in 1998 Chapter 3 — Operating expenditure — 1997 appropriations carried over — 1998 new appropriations — Revenue for reuse carried over from 1997 — Revenue for reuse collected in 1998
Balance before cancellations Cancellation of 1997 appropriations carried over Cancellation of 1997 amounts for reuse carried over Cancellation of 1998 appropriations Balance for the year to be carried over — carry-over of 1998 appropriations — carry-over of 1998 revenue for reuse (1)
428 741.52 32 085 675.55
212 750.33 0.00
3 170 846.01 17 508 696.66 5 318 424.47 7 060 801.49
381 729.31 1 056 168.38 1 272 977.74
269 530.48
Total
32 727 167.40
33 058 768.63
2 980 405.91
- 6 8 766 341.94 8 384 718.03 - 382 665.61
- 28 998.87 -172 770.83 7 800 282.72
3 212 688.58 4 587 594.14
(') Of which committed but not paid out: 4 190 413.76; of which uncommitted: 397 180.38.
141

Accompanying note The balance sheet for the Publications Office shows the results of its commercial management, i.e. the sale on behalf of the other institutions of the Official Journal, other publications and databases, the out-turn on transactions connected with the printing of the Official Journal, for which the Office has a floating capital consisting of contributions from the institutions, and the value of the stocks to be used for its commercial and administrative activities.
Assets (ECU)
138 936.00 I. INTANGIBLE FIXED ASSETS
The amount shown in the balance sheet represents the cost of purchasing software packages (mainly graphics)
II. TANGIBLE FIXED ASSETS
B. Fixtures and fittings, machinery and tools
Telecommunications equipment Publications Office budget OJ budget
C. Furniture and transport equipment Furniture Transport
D. Computer equipment Publications Office budget OJ budget
12 473 242.06
117 339.76 129 357.00 246 696.76
5 468 130.78 154 215.72
5 622 346.49
3 832 056.80 1 957 701.00 5 789 757.80
246 696.76
5 622 346.49
5 789 757.80
E. Financial leasing and similar entitlements
The amount corresponds to the capital value of leased printing equipment.
814 441.00
VI. STOCKS
A. Office supplies and publications Office supplies Computer parts Workshop Paper, board, boxes etc.
6 705 863.36
16 036.89 27 089.00 493 580.26 337 173.28 873 879.43
C. Publications Office stock Publications held by the Publications Office for institutions (sales stocks) (including 184 432.36 forthe Publications Office) 5 831 983.93
6 705 863.36
VII. SHORT-TERM ASSETS
ß. Current receivables
3. Amounts receivable from Community institutions and organisations 17 249 857.64
24 618 704.00
24 618 704.00
142

This heading shows:
— amounts due to the Office from the Institutions for operations connected with the printing of the Official Journal: • Parliament: 2 113 929.37 • Council: 697 328.11 • Commission: 10 295 977.21 • Court of Justice: 175 327.09 • Economic and Social Committee: 186 191.96 • Court of Auditors: 26 872.41 • European Monetary Institute: 6 053.41 • Dublin Foundation: 33 171.45 • Committee of the Regions: 19 131.80 • European Environment Agency: 5 468.54 • European Central Bank: 15.73
13 559 467.08
— invoices for products related to the Official Journal which the Office has not yet broken down: 3 690 390.56
17 249 857.64
4. Sundry receivables 7 368 846.36
This heading concerns only commercial accounting and corresponds to the balance of the invoices still to be collected by the Office on behalf of the institutions. Direct customers 571151.04 Sales offices, gateways etc. 6 797 695.32
7 368 846.36
IX. DISPOSABLE ASSETS 14 419 038.76
This heading shows the balances of the current bank accounts used for transactions linked to the Official Journal and for sales of publications: Official Journal: 8 802 540.90 Sales of the OJ and other publications: — current account in ecus: 4 783 225.01 — current account in other currencies: 833 272.85
5 616 497.86 14 419 038.76
X. ACCRUALS 657.01
The figure shown in the balance sheet concerns only the OJ and represents the bank interest receivable.
143

LIABILITIES (ECU)
I. CAPITAL 11 555 671.48
A. Net capital resulting from economic adjustments to the balance sheet
This heading shows the assets acquired by the Office on its own behalf: — intangible fixed assets (software): 138 936.00 — tangible fixed assets:
• leasing annuity paid: 362 350.69 • property in the inventory (independent cost centre): 9 571 743.06
— stocks: • consumables: 873 879.43 • stocks of publications at the Office: 184 432.36
— balance of sales revenue of which the Office is the beneficiary institution: 424 329.94
11 555 671.48
III. LONG-TERM LIABILITIES 271 531.17
B. Other debts
The amount shown under this heading corresponds to the balance on leasing annuities payable over more than one year.
IV. SHORT-TERM DEBTS 46 268 208.70
A. Debts on borrowings over more than one year falling due during the year 180 559.14
The amount concerned is the leasing annuity payable in 1999.
C. Current liabilities 46 087 649.56
2. Institutions and organisations This heading on the liabilities side comprises: — Official Journal floating capital: 25 800 000.00 — advance on production payment (OJ): 19 899.71 — OJ computer equipment: 2 087 058.00 — stocks of publications generating revenue held by the
Office on behalf of the Institutions: 5 647 551.57 — borrowing interest on the OJ account to be repaid
to the Institutions: 228 631.60 — balance on sales proceeds received in 1998 and
to be repaid to the Institutions during 1999: 3 929 734.28 — sales proceeds receivable on behalf of the institutions
at 31 December 1998: 6 944 516.42 44 657 391.58
3. Sundry creditors This heading shows part payments, unknown payments and payments not yet booked, received from commercial customers:
1 430 257.98
D. Other debts: 4 524.24 This is an amount incorrectly transferred to the OJ account by the bank.
V. ADJUSTMENT ACCOUNTS 256 505.60 The amount entered under this heading corresponds to the balance of sales for which proceeds were received on 31 December 1998 and the beneficiary of which was the Publications Office.
144

Consolidated balance sheet

Consolidated balance sheet (Publications Office + OJ)
ASSETS (ECU)
1
II
III
A Β C D E F G
IV
A
B
V
A B
VI
A B C
VII
A
B
C
VIII
IX
X
Installation costs
Intangible fixed assets
Tangible fixed assets
Land and buildings Fixtures and fittings, machinery and tools Furniture and transport equipment Computer equipment Financial leasing and similar entitlements Other tangible fixed assets Assets under construction and payments on account
Financial assets
Investments in linked organisations 1. Participations 2. Receivables Other financial assets 1. Participations 2. Receivables 3. Guarantees and advances granted 4. Other
Long-term assets
Loans on budget appropriations Loans on borrowed funds
Stocks
Office supplies and other consumables Scientific equipment Publication Office stocks
Short-term assets
Short-term financial assets 1. Loans on budget appropriations 2. loans on borrowed funds Current claims 1. Advances to Member States 2. Amounts owed by Member States
(a) EAGGF (b) VAT owed by Member States (c) Amounts other than VAT owed by Member States
3. Amounts receivable from the Community Institutions and organisations
4. Sundry receivables Sundry claims 1. Amounts owed by staff 2. Other
Cash investments
Disposable assets
Accruals
Total
31 December 1997
0.00
30 230.00
11 162 269.39
0.00 85 465.17
5 475 220.44 4 787 142.77
814 441.00 0.00 0.00
0.00
0.00 0.00 0.00 0.00 0.00 0.00 0.00 0.00
0.00
0.00 0.00
9 786 281.06
1 015 646.98 0.00
8 770 634.08
24 548 616.60
0.00 0.00 0.00
24 548 616.60 0.00 0.00 0.00 0.00 0.00
19193 204.25 5 355 412.35
0.00 0.00 0.00
0.00
14 900 428.62
3 337.59
60 431 163.26
31 December 1998
0.00
138 936.00
12 473 242.06
0.00 246 696.76
5 622 346.49 5 789 757.80
814441.00 0.00 0.00
0.00
0.00 0.00 0.00 0.00 0.00 0.00 0.00 0.00
0.00
0.00 0.00
6 705 863.36
873 879.43 0.00
5 831 983.93
24 618 704.00
0.00 0.00 0.00
24 618 704.00 0.00 0.00 0.00 0.00 0.00
17 249 857.64 7 368 846.36
0.00 0.00 0.00
0.00
14 419 038.76
657.01
58 356 441.19
146

Consolidated balance sheet (Publications Office + OJ)
LIABILITIES (ECU)
1
A
Β C
II
A Β
III
A Β
IV
A Β C
D
ν
Capital
Net capital resulting from economic adjustments to the balance sheets Operating profit Profits carried over from borrowing and lending operations
Provisions for liabilities and charges
Provisions for major repairs and maintenance Other provisions for liabilities and charges
Long-term liabilities
Financial liabilities Other long-term liabilities
Short-term liabilities
Debts on borrowings Other short-term financial liabilities Current liabilities 1. Amounts owed by Member States and EFTA countries 2. Community institutions and organisations 3. Loans to be carried forward 4. Sundry creditors Other liabilities
Accruals
Total
31 December 1997
10 908 058.91
10 908 058.91 0.00 0.00
0.00
0.00 0.00
452 090.31
0.00 452 090.31
48 235 752.16
180 559.14 0.00
48 055 193.02 0.00
47 565 808.46 0.00
489 384.56 0.00
835 261.88
60 431 163.26
31 December 1998
11 555 671.48
11 555 671.48 0.00 0.00
0.00
0.00 0.00
271 531.17
0.00 271 531.17
46 272 732.94
180 559.14 0.00
46 087 649.56 0.00
44 657 391.58 0.00
1 430 257.98 4 524.24
256 505.60
58 356 441.19
147
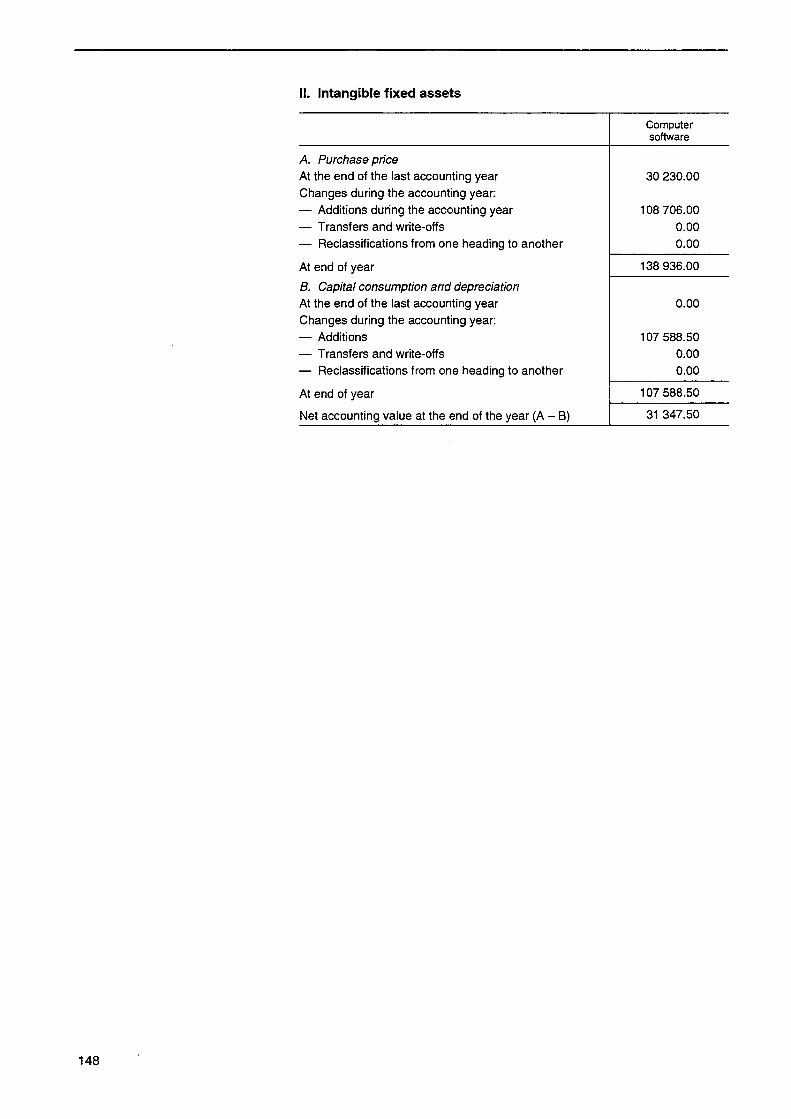
II. Intangible fixed assets
A. Purchase price At the end of the last accounting year Changes during the accounting year: — Additions during the accounting year — Transfers and write-offs — Reclassifications from one heading to another
At end of year B. Capital consumption and depreciation At the end of the last accounting year Changes during the accounting year: — Additions — Transfers and write-offs — Reclassifications from one heading to another
At end of year
Net accounting value at the end of the year (A - B)
Computer software
30 230.00
108 706.00 0.00 0.00
138 936.00
0.00
107 588.50 0.00 0.00
107 588.50
31 347.50
148

III. Tangible fixed assets
A. Purchase price At the end of the last accounting year + Adjustments Changes during the accounting year — Additions — Transfers and write-offs — Changes due to threshold alterations — Reclassification from one heading to another
At end of year
B. Appreciation At the end of the last accounting year Changes during the accounting year — Additions — Cancelled following transfer — Reclassification from one heading to another
At end of year
Gross value
C. Depreciation and value adjustments At the end of the last accounting year Adjustments Changes during the accounting year — Additions — Cancelled following transfer — Reclassification from one heading to another Extraordinary depreciation
At the end of year
Net accounting value (A + Β - C)
Land and buildings
0.00
0.00
0.00
0.00
0.00
Installations, machinery and tools
85 465.17
30 834.00 72 829.41
203 227.00
246 696.76
0.00
246 696.76
69 930.09
14 647.04 580.41
14 400.00
98 396.72
148 300.04
Furniture and rolling stock
5 475 220.44 369 785.43
251 438.10 389 422.33
1 027.80 85 702.95
5 622 346.49
0.00
5 622 346.49
3 989 575.13
301 861.39 250 803.16
47 602.85
3 993 030.51
1 629 315.98
Computer equipment
4 787 142.77 15 000.00
1 282 070.76 120 527.43
173 928.30
5 789 757.80
0.00
5 789 757.80
2 516 549.59
2 485 197.47 115 368.93 14 400.00
4 871 978.13
917 779.66
Financial leasing and similar
entitlements (1)
814 441.00
814 441.00
0.00
814 441.00
203 610.26
203 610.26
610 830.74
Other tangible fixed assets
0.00
0.00
0.00
0.00
0.00
Assets under construction and
payments on account
0.00
0.00
0.00
0.00 (') The amounts shown in this column are broken down in the following table, which shows financial leasing.
co
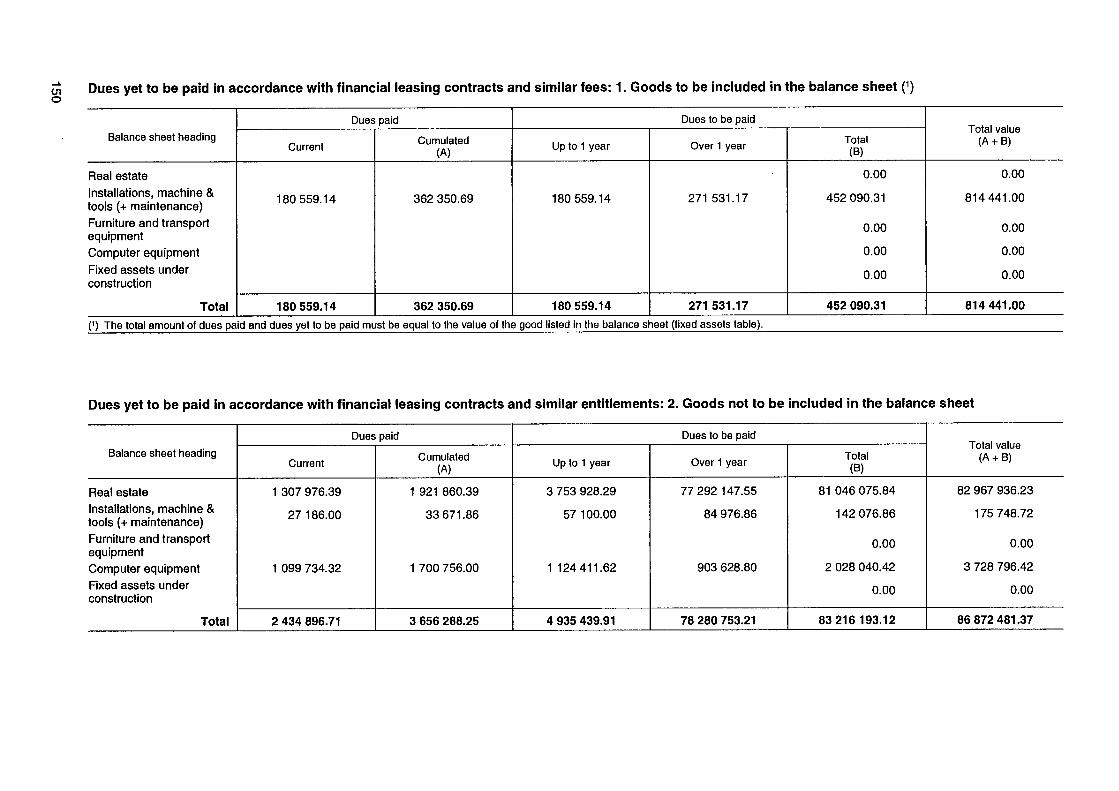
on Dues yet to be paid in accordance with financial leasing contracts and similar fees: 1. Goods to be included in the balance sheet (1)
Balance sheet heading
Real estate Installations, machine & tools (+ maintenance) Furniture and transport equipment Computer equipment Fixed assets under construction
Total
Dues paid
Current
180 559.14
180 559.14
Cumulated (A)
362 350.69
362 350.69
Dues to be paid
Up to 1 year
180 559.14
180 559.14
Over 1 year
271 531.17
271 531.17
Total (B)
0.00
452 090.31
0.00
0.00
0.00
452 090.31
Total value (A + B)
0.00
814 441.00
0.00
0.00
0.00
814 441.00 (') The total amount of dues paid and dues yet to be paid must be equal to the value of the good listed in the balance sheet (fixed assets table).
Dues yet to be paid in accordance with financial leasing contracts and similar entitlements: 2. Goods not to be included in the balance sheet
Balance sheet heading
Real estate Installations, machine & tools (+ maintenance) Furniture and transport equipment Computer equipment Fixed assets under construction
Total
Dues paid
Current
1 307 976.39
27 186.00
1 099 734.32
2 434 896.71
Cumulated (A)
1 921 860.39
33 671.86
1 700 756.00
3 656 288.25
Dues to be paid
Up to 1 year
3 753 928.29
57 100.00
1 124 411.62
4 935 439.91
Over 1 year
77 292 147.55
84 976.86
903 628.80
78 280 753.21
Total (B)
81 046 075.84
142 076.86
0.00
2 028 040.42
0.00
83 216 193.12
Total value (A + B)
82 967 936.23
175 748.72
0.00
3 728 796.42
0.00
86 872 481.37

111.1. Details of fixed assets under leasing contracts and other similar entitlements
A. Purchase price At the end of the last accounting year Changes during the accounting year — Additions — Transfers and write-offs — Changes due to threshold alterations — Reclassifications from one heading to another
At end of year
B. Appreciation At the end of the last accounting year Changes during the accounting year — Additions — Cancelled following transfer — Reclassifications from one heading to another
At end of year
C. Depreciation and value adjustments At the end of the last accounting year Changes during the accounting year
At end of year
Net accounting value (A + Β - C)
Land& constructions
0.00
0.00
0.00
0.00
Installations, machines & tools
814 441.00
814 441.00
0.00
101 805.13 101 805.13
203 610.26
610 830.74
Furniture & transport equipment
0.00
0.00
0.00
0.00
Computer equipment
0.00
0.00
0.00
0.00
Fixed assets under construction & payments
on account
0.00
0.00
0.00
Total
814 441.00
814 441.00
0.00
101 805.13 101 805.13
203 610.26
610 830.74 (1)
(') This total amount should be equal to the total amount of the column 'Financial leasing and other similar entitlements' of Table I
01
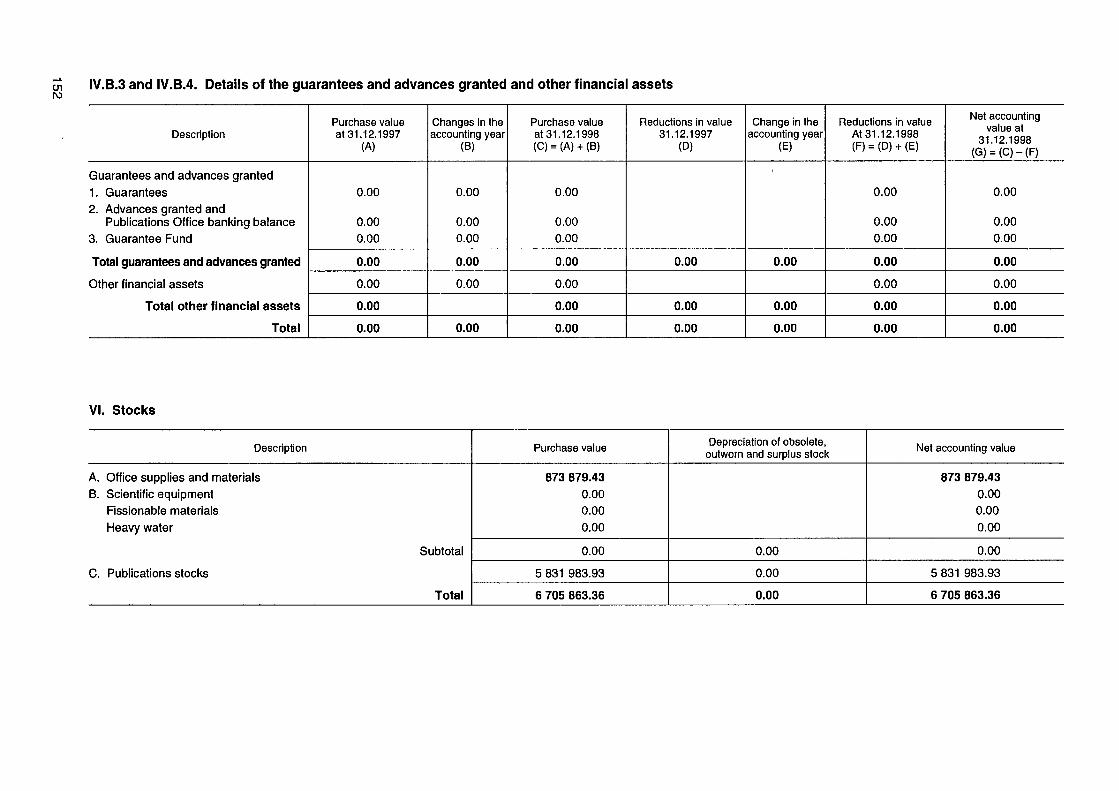
Ol ro
IV.B.3 and IV.B.4. Details of the guarantees and advances granted and other financial assets
Description
Guarantees and advances granted 1. Guarantees 2. Advances granted and
Publications Office banking balance 3. Guarantee Fund
Total guarantees and advances granted
Other financial assets
Total other financial assets
Total
Purchase value at 31.12.1997
(A)
0.00
0.00 0.00
0.00
0.00
0.00
0.00
Changes in the accounting year
(B)
0.00
0.00 0.00
0.00
0.00
0.00
Purchase value at 31.12.1998 (C) = (A) + (B)
0.00
0.00 0.00
0.00
0.00
0.00
0.00
Reductions in value 31.12.1997
(D)
0.00
0.00
0.00
Change in the accounting year
(E)
0.00
0.00
0.00
Reductions in value At 31.12.1998 (F) = (D) + (E)
0.00
0.00 0.00
0.00
0.00
0.00
0.00
Net accounting value at
31.12.1998 (Q) - (C ) - (F )
0.00
0.00 0.00
0.00
0.00
0.00
0.00
VI. Stocks
Description
A. Office supplies and materials B. Scientific equipment
Fissionable materials Heavy water
Subtotal
C. Publications stocks
Total
Purchase value
873 879.43 0.00 0.00 0.00
0.00
5 831 983.93
6 705 863.36
Depreciation of obsolete, outworn and surplus stock
0.00
0.00
0.00
Net accounting value
873 879.43 0.00 0.00 0.00
0.00
5 831 983.93
6 705 863.36

VIII. Investments
Description
1. 2. 3.
Shares Fixed-interest securities Fixed-term deposits — maturity < 1 month — maturity > 1 month and < 1 year — maturity > 1 year
Total
31 December 1998
0.00 0.00
0.00
IX. Disposable assets
Description
A. B. C. D. E. F. G.
Accounts with treasuries Accounts with central banks Accounts for borrowing and lending operations Current accounts Imprests Cash in hand Transfers of funds
Total
31 December 1997
0.00 0.00 0.00
14 900 428.62 0.00 0.00 0.00
14 900 428.62
31 December 1998
0.00 0.00 0.00
14 419 038.76 0.00 0.00 0.00
14 419 038.76
X. Suspense accounts on the assets side
Description
Interest receivable Appropriations carried over and not yet booked Expenditure to be settled between institutions Prepaid expenses Other expenses to be carried over and accrued income
Total
31 December 1997
3 337.59 0.00
0.00
3 337.59
31 December 1998
657.01 0.00
0.00
657.01
153

XI. Capital
A . 1 . Net capital resulting from economie adjustments a. Installation costs b. Intangible fixed assets c. Tangible fixed assets d. Financial assets (not including guarantees) e. Loans from budget appropriations f. Stocks g. Claims to be recovered
Total net value
A.2. Value adjustments in respect of assets other than those under A
A.3. Value adjustments in respect of assets under A A.4. Allocation for risks and costs
Net capital resulting from adjustments to the balance sheet
Balance at 31.12.1997
30 230.00 9 220 511.29
1 103 288.84 554 028.78
10 908 058.91
10 908 058.91
Change in the accounting year
0.00 108 706.00 713 582.46
0.00 0.00
- 44 977.05 - 1 2 9 698.84
647 612.57
0.00 0.00 0.00
647 612.57
Balance at 31.12.1998
0.00 138 936.00
9 934 093.75 0.00 0.00
1 058 311.79 424 329.94
11 555 671.48
0.00 0.00 0.00
11 555 671.48
XII. Risk and cost provisions
II.B. Detail of provisions included in the balance sheet
Description
A. Major repairs B. Other risks and costs Guarantee fund Loans/borrowings: — NCI — Euratom — Balance of payments
Total provisions for risks and costs
Provision at 31.12.1997
0.00
Changes within the yeatr
0.00 0.00 0.00
0.00 0.00 0.00
0.00
Provision at 31.12.1998
0.00 0.00 0.00
0.00 0.00 0.00
0.00
154

XIII. Long-term debts
III. Details of long-term debts: changes in the accounting year (III liabilities)
Description
1. Borrowings NCI Euratom Balance of payments Financial assistance Food aid
2. Other long-term debts Staff fund Guarantee and indemnity NCI Leasing Other
Subtotal
Subtotal
Total
31 December 1997
0.00 0.00 0.00 0.00 0.00
0.00
0.00 0.00 0.00
452 090.31 0.00
452 090.31
452 090.31
Changes in the accounting year
0.00 0.00 0.00 0.00 0.00
0.00
0.00 0.00 0.00
- 1 8 0 559.14 0.00
- 1 8 0 559.14
- 1 8 0 559.14
31 December 1998
0.00 0.00 0.00 0.00 0.00
0.00
0.00 0.00 0.00
271 531.17 0.00
271 531.17
271 531.17
Description
1. Borrowings MTA FMA BOP NCI Euratom
Total
Balance on 31.12.1997
0.00 0.00 0.00 0.00 0.00
0.00
New borrowings
0.00
0.00
Reimbursements
0.00 0.00 0.00 0.00 0.00
0.00
Changes in the rate
0.00 0.00 0.00 0.00
0.00
Balance on 31.12.1998
0.00 0.00 0.00 0.00 0.00
0.00
XIII.2. Table summarising long-term and short-term financial debts
Description
1. Borrowings MTA BOP Euratom NCI
Subtotal
2. Other
Total
Amount > 1 year
0.00 0.00 0.00 0.00
0.00
0.00
0.00
Amount < 1 year
0.00 0.00 0.00 0.00
0.00
0.00
0.00
Balance in ecus
0.00 0.00 0.00 0.00
0.00
0.00
0.00
155

XIV.1. Details of short-term financial debts
Description
Other financial debts — Accounts held with public treasuries — Accounts with central banks — Current accounts — Imprest accounts — Transfers pending
Total
31 December 1997
0.00 0.00 0.00 0.00 0.00
0.00
31 December 1998
0.00 0.00 0.00 0.00 0.00
0.00
XV. Transitional liability accounts
Description
Interest Income to be appropriated Income to be appropriated by other institutions Income which may lead to reuse Other costs to be paid and income to be carried forward
Total
31 December 1997
0.00 0.00 0.00
835 261.88 0.00
835 261.88
31 December 1998
0.00 0.00 0.00
256 505.60 0.00
256 505.60
156

European Commission
Thirtieth annual management report —1998
Luxembourg: Office for Official Publications of the European Communities
1999 — 156 pp. — 21 χ 29.7 cm
ISBN 92-828-4272-X


ro o ι
CO cp -ίι CJ) cp m o
• * * OFFICE FOR OFFICIAL PUBLICATIONS • _EUR_ • 0 F T H E EUROPEAN COMMUNITIES • Of> * • = = 5 = *
ISBN ΊΞ-Ο2η-Μ27Ξ-Χ
L-2985 Luxembourg