shrinking the carbon and water footprint of school food: a ... · if every california k-12 school...
TRANSCRIPT
Shrinking the Carbon and Water Footprint of School Food:
A RECIPE FOR COMBATING
CLIMATE CHANGEA pilot analysis of Oakland Unified School District’s Food Programs
FEBRUARY 2017
BY KARI HAMERSCHLAG AND JULIAN KRAUS-POLK

Friends of the Earth
ContentsExecutive Summary ............................................................................................................................................................................... 3
Introduction ..............................................................................................................................................................................................6
Overconsumption of animal foods is unhealthy for us and unsustainable for our planet ............................... 6
The climate community must recognize meat and dairy reduction as a key climate mitigation strategy ..............................................................................................................................................6
Food service leaders need tools to quantify their success .......................................................................................... 7
I. Animal Food Reductions Yield Important Environmental Benefits .......................................................................... 8
Oakland’s Overall Reductions; the multi-benefits of meat reduction at OUSD ..................................................8
Figure 1. OUSD’s Food Carbon Footprint Declined 14 Percent Over 2 Years .................................................. 8
Understanding the Shifting Carbon Footprint ..................................................................................................................9
Figure 2. Shifts in Animal Products Purchased by OUSD .......................................................................................9
Figure 3. Carbon Footprint by Food Group (2012-13) ............................................................................................ 10
Figure 4. Beef, Pork And Cheese Have Largest GHG Emissions ........................................................................ 10
Figure 5. Carbon Footprint of Different Menu Options ...........................................................................................11
Understanding the Shifting Water Footprint.....................................................................................................................11
Figure 6. Water Footprint of Select Foods ..................................................................................................................12
II. The Cost Effectiveness of Shifting Menus: Saving Money, While Saving the Planet ......................................... 13
Oakland’s cost reduction ..........................................................................................................................................................13
Key examples of saving money with plant-forward menus ........................................................................................13
III. How was Oakland successful? ................................................................................................................................................. 14
California Thursday’s, Lean and Green Wednesday’s, Mindful Meats .....................................................................14
Less and Better Meat and Sustainable Agriculture Practices ....................................................................................14
IV. Low-carbon intensive foods: A Cost Effective Climate Mitigation Strategy ....................................................... 15
Table comparing cost-effectiveness of climate mitigation strategies ....................................................................15
V. Expanding Plant Forward Menus in School Food ........................................................................................................... 16
Creating Healthy Climate Conscious Menus – links to resources .............................................................................16
VI. Conclusion ....................................................................................................................................................................................... 17
VII. Appendix .......................................................................................................................................................................................... 18
Methods ..........................................................................................................................................................................................18
AcknowledgmentsFriends of the Earth would like to thank Alexandra Emmott, Farm to School Coordinator at Oakland Unified School District, and the rest of OUSD Nutrition Services staff for their help on this project and their important work everyday to provide food that nourishes the students of Oakland Unified School District. We thank Alexa Delwiche and Colleen McKinney of the Center for Good Food Purchasing for assisting with (acquiring) the procurement data and for providing insightful comments about the analysis. We also thank Kristie Middleton of the Humane Society of the U.S. and Martin Tull of Impact Group for their helpful review and guidance on the project. We thank Kendra Klein and Chris Cook for their useful edits. And for the beautiful design work, we thank Cheri Johnson and Keiko Okisada. The findings, conclusions and recommendations in this report, however, are solely the responsibility of Friends of the Earth.
©Copyright February 2017 by Friends of the Earth U.S..

Friends of the Earth 3
Executive SummaryAs schools across the nation grapple with how to feed kids healthier, more sustainable food on tight budgets, an inspiring story from Oakland Unified School District provides a roadmap for change. The following case study shows how the district was able to significantly reduce its carbon and water footprint by replacing a share of its meat, poultry and cheese purchases with plant-based proteins. These actions also saved the district money and improved students’ access to healthful food. If institutions across the country made similar menu shifts, we could achieve dramatic reductions in carbon emissions and water use with no additional cost to schools. This is a rare silver bullet solution that can address many challenges simultaneously.
Overconsumption of animal foods is unhealthy for us and unsustainable for our planet. Animal products are the most resource-intensive foods in our diet, requiring massive water and energy inputs. Studies show that we cannot avert the worst impacts of climate change or protect future water supplies unless we make food production more sustainable, waste less food, and reduce meat and dairy consumption in favor of plant-forward meals.1 Eating fewer animal products and more plant-based foods is also better for our health and has the potential to save billions of dollars on healthcare costs by reducing the risk
of diet related diseases such as heart disease, cancer, and diabetes.2,3
The adoption of plant-forward menus by a growing numbers of school districts, hospitals, business campuses, restaurants and universities generates clear climate benefits. However these benefits have rarely been quantified or recognized by food service distributors, sustainability managers, climate change advocates or policy makers. This case study addresses that gap. Friends of the Earth (FOE) partnered with Oakland Unified School District (OUSD) to assess the full carbon and water footprint of its food procurement over a two-year period (comparing the baseline 2012-2013 school year to 2014-2015). The study tracked reductions in carbon and water footprints that occurred as a result of shifts toward less and better meat, and more vegetables and legumes. The findings confirm the importance of adding institutional meat and cheese reduction strategies to the arsenal of public policy and private sector initiatives aimed at affordably reducing GHG emissions.
More Plant-based Foods: Better for Health, the Environment and School BudgetsThe 2016 Menus of Change report from the Culinary Institute and Harvard’s School of Public Health posits that “greater emphasis on healthy plant-based foods—including plant-
KEY FINDINGS: Low-carbon Meals: A Cost-effective Climate Mitigation StrategyOur analysis found that over a two-year period Oakland Unified School District:
♦♦ Reduced its purchases of animal products by nearly 30 percent while increasing purchases of better meat from Mindful Meats, a company that sources meat from spent dairy cows raised organically and humanely in Northern California.4
♦♦ Reduced the carbon footprint (kg CO2-eq) of its entire food service by 14 percent from (0.70 to 0.61kg CO2-eq per meal served). This translates into roughly 600,000 Kg of C02 saved per year—the equivalent of driving 1.5 million miles less per year or covering all of OUSD’s roofs with solar panels with NO additional cost.5
♦♦ Reduced embedded water use by nearly 6 percent—saving a total of 7 gallons per meal or a total of 42 million gallons of water per year—a substantial reduction that is equivalent to filling 840,000 bathtubs or taking 2.3 million fewer showers.6,7
♦♦ Saved $42,000 by decreasing the amount spent per meal by 1 percent.
♦♦ Increased purchases of fruits, vegetables and legumes by approximately 10 percent.
♦♦ Increased student satisfaction with local, regional, fresh and tasty meals.8
♦♦ Served reduced meat or plant-based meals that met or exceeded USDA meal pattern requirements.

Friends of the Earth 4
based proteins—is the single most important contribution the foodservice industry can make toward environmental sustainability.”9 It is also better for our health. On average, Americans eat 50 percent more meat than is recommended by U.S. Dietary Guidelines for Americans and only 20 percent get the suggested amounts of fruits and vegetables.10,11
Furthermore, evidence is mounting that meat reduction can save institutional food service money. A pilot analysis of Health Care Without Harm’s ‘Balanced Menus: Less Meat Better Meat’ program found that four San Francisco Bay Area hospitals generated an estimated food service savings of $400,000 per year.12
The Maricopa County Jail saved an estimated $817,000 in one year by switching from meat to all plant-based foods.13
Resources for Healthy Climate Conscious MenusFood service directors face complex demands and requirements, and serving kids tasty and nutritious food is and must remain their number one priority. The OUSD case study shows that plant-forward menu planning is feasible and can support the mandate for healthier and more delicious food, particularly when cafeteria facilities allow for cooking from scratch. There are a range of resources and organizations ready to assist school districts in shifting to climate conscious menus, including kitchen staff training
and recipe development. Given that climate-friendly food must taste good, Meatless Mondays and the Humane Society have developed many scalable recipes to help school chefs prepare delicious plant-based meals that meet USDA nutrition requirements.14
Resources for Creating Climate-Conscious Menus Options
♦♦ Meatless Mondays K-12 toolkit and school food recipe book
♦♦ Bring Food Forward
♦♦ Menus of Change
♦♦ Lean and Green Kids
♦♦ Coalition for Healthy School Food
LB
CO
2-E
Q P
ER
10
0 S
ER
VIN
GS
Carbon Footprint of Different Menu Options38
0
50
100
150
200
Beef Hot Dog
Pepperoni Pizza
Asian ChickenFish
Sticks
Veggie Tostada
(Vegetarian)
Tofu-Veggie Stir-Fry (Vegan)
Source: Friends of the Earth recipe analysis using Heller, M. C. and Keoleian, G. A. (2014)
The 2016 Menus of Change report from the Culinary Institute and
Harvard’s School of Public Health posits that “greater emphasis on
healthy plant-based foods—including plant-based proteins—is the single most important contribution the
foodservice industry can make toward environmental sustainability.”9

Friends of the Earth 5
USDA and Food Service Companies Should Increase Plant-based Food Offerings In order to make low-carbon foods more affordable and accessible for public schools, large distributors and food service companies must develop more protein-rich, plant-based products, as well as those that contain less meat overall (like blended mushroom-beef burgers and beef-bean chili). In addition, the US Department of Agriculture should offer more of these foods, expand its successful Department of Defense Fresh Program and allow high protein grains, such as quinoa and amaranth, to count toward the protein requirement.15
The Climate Community Must Recognize Meat and Dairy Reduction as a Climate Mitigation StrategyIn the US, cities and states are leading the way on climate mitigation. Yet shifting institutional food purchasing has rarely been tapped as a climate mitigation strategy. We hope this report inspires more public institutions to serve less and better meat and more plant-based foods as a cost-effective way to achieve environmental and public health goals. Unlike costly and complex mitigation methods—like building renewable energy capacity—reducing demand for resource-intensive animal foods is a relatively simple, cost-neutral or cost-saving strategy. Furthermore, conventional climate mitigation measures will ultimately be ineffective if we don’t dramatically reduce meat and dairy consumption.
Growing Momentum Oakland Unified School District’s success lends momentum to a growing movement among schools and colleges across the US. Hundreds of school districts nationwide have adopted Meatless Mondays, and a growing number of sustainable food procurement standards like the Good Food Purchasing Program are emphasizing the importance of reducing animal foods.16 Furthermore, OUSD’s participation in the California Thursdays® program has shown how serving local and regional plant-based foods and less and better meat can be both cost-effective and environmentally beneficial.17
We hope this powerful story of Oakland Unified School District inspires more school districts and other institutions across California and the nation to follow suit. Through the food it serves, schools have the unique ability to shape healthy and sustainable diets for the benefit of current and future generations. When it is possible to reduce environmental harm, improve consumption of healthy food and save money, all while increasing student satisfaction and meeting federal school meal requirements, what are we waiting for?
$42,000
COST SAVINGS
87SOLAR SYSTEMS INSTALLED ON THE SCHOOL DISTRICTS’ ROOVES
1.5 millionFEWER MILES DRIVEN
15,000
TREES PLANTED
14% REDUCTIONIN THE
CARBON FOOTPRINTOF ITS ENTIRE FOOD PURCHASES
OLYMPIC SIZED SWIMMING POOL
63
SAVED 42millionGALLONS OF
WATER
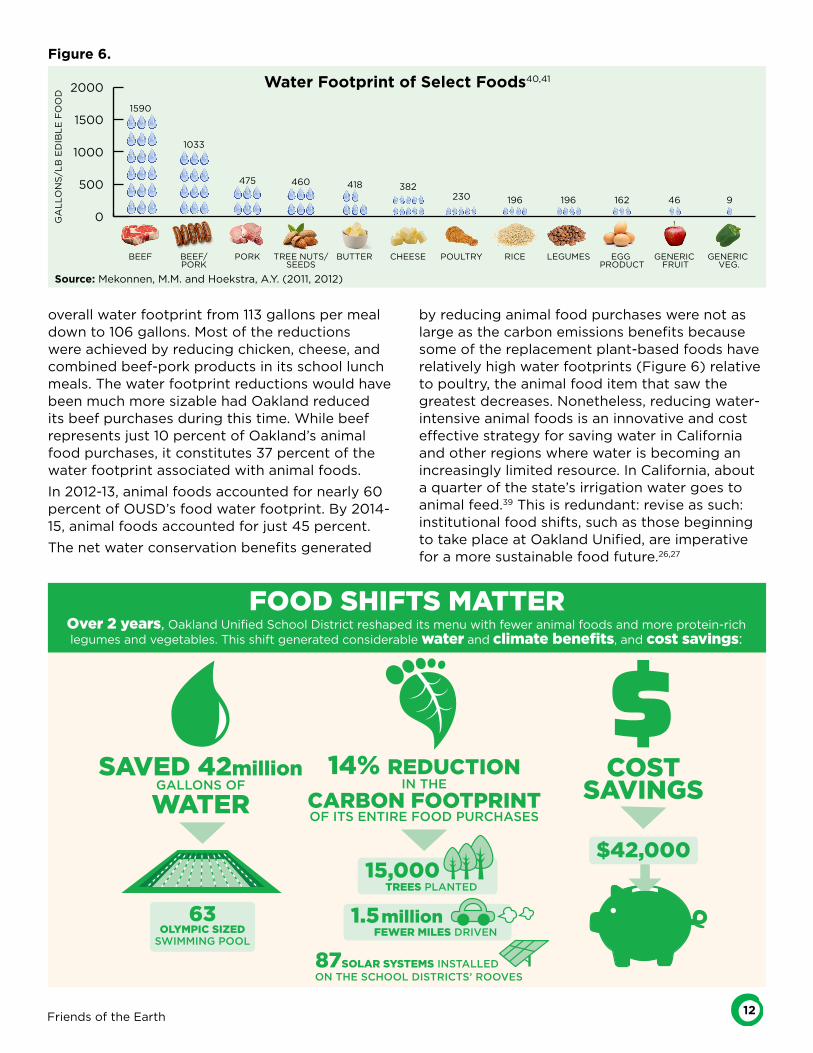
Over 2 years, Oakland Unified School District reshaped its menu with fewer animal foods and more protein-rich legumes and vegetables.This shift generated considerable water and climate benefits, and cost savings:
FOOD SHIFTS MATTER
If every California K-12 school food service accomplished a carbon footprint reduction similar to that of Oakland Unified School District, it would amount to reducing roughly 80 million kg of CO2 emissions, equivalent to eliminating the emissions from 17,000 cars that drive almost 200 million miles per year. If every school district in the nation took similar action, the GHG reductions would be akin to driving nearly 1.6 billion fewer miles or taking 150,000 cars off the road every year.

Friends of the Earth 6
IntroductionAs schools across California and the nation grapple with how to feed kids healthier, more environmentally sustainable food on tight budgets, new efforts to shift school lunches toward more plant-based meals provide an inspiring roadmap for change. With its massive purchasing power and ability to teach kids lifelong eating habits, school food service can play a vital role in shaping healthier diets that are better for people and the planet.
With over seven billion meals served annually nationwide (800 million meals in California), this case study of Oakland Unified School District (OUSD) shows how modest reductions in purchases of animal foods implemented on the scale of school food service could translate into significant climate change mitigation and water conservation benefits for California and the nation—while saving money and providing kids with increased access to healthy plant-based foods.
Friends of the Earth (FOE) partnered with Oakland Unified School District (OUSD) to assess the carbon and water footprint reductions associated with OUSD’s food purchasing shifts over a two-year period. Our analysis shows that by replacing a share of its meat and cheese purchases with plant-based proteins and more sustainable meat options, OUSD significantly reduced its carbon and water footprint while saving the district money, improving student satisfaction and increasing access to healthful food.
Overconsumption of animal foods is unhealthy for us and unsustainable for our planet. Animal products are the most resource-intensive foods in our diet, requiring massive water and energy inputs. The food and agriculture sector generates one-fourth of all global greenhouse gas (GHG) emissions and accounts for roughly 70 percent of fresh water use globally.18 Animal agriculture that supplies our meat and dairy generates over half of those emissions and at least a third of the world’s water usage.19,20 Studies show that we cannot avert the worst effects of climate change or protect water for future generations if we do not make our food supply more sustainable, waste less and shift diets away from meat and dairy towards more plant-forward meals.21
Eating fewer animal products and more plant-based foods is also better for our health and our pocket books. High consumption of red and processed meat is associated with increased risks of diet-related diseases (heart disease22
diabetes,23 and cancer24) that cost our nation hundreds of billions of dollars a year. On average, Americans eat 50 percent more meat than is recommended by USDA Dietary guidelines and only twenty percent eat the suggested amounts of fruits and vegetables.25
“Consistent evidence indicates that, in general, a dietary pattern that is higher in plant-based foods, such as vegetables, fruits, whole grains,
legumes, nuts, and seeds, and lower in animal-based foods is more health
promoting and is associated with lesser environmental impact (GHG emissions and energy, land, and water use) than
is the current average U.S. diet.” 2015 Dietary Guidelines Advisory Committee26
The climate community must recognize meat and dairy reduction as a climate mitigation strategyIn the US, cities and states are leading the way on climate mitigation. And schools and other institutions are curbing their climate emissions by putting solar panels on their roofs or reducing onsite energy use. But what about the food they serve? For the most part, shifting institutional food purchasing has been untapped as a climate mitigation strategy. We hope this report inspires more public institutions to serve less and better meat and more plant-based foods as a cost effective way to achieve environmental and public health goals. Unlike costly and complex climate mitigation methods—like building renewable energy capacity—reducing demand for resource-intensive animal foods in food service has the potential to be a relatively simple, cost-neutral or cost-saving strategy.
Friends of the Earth 7
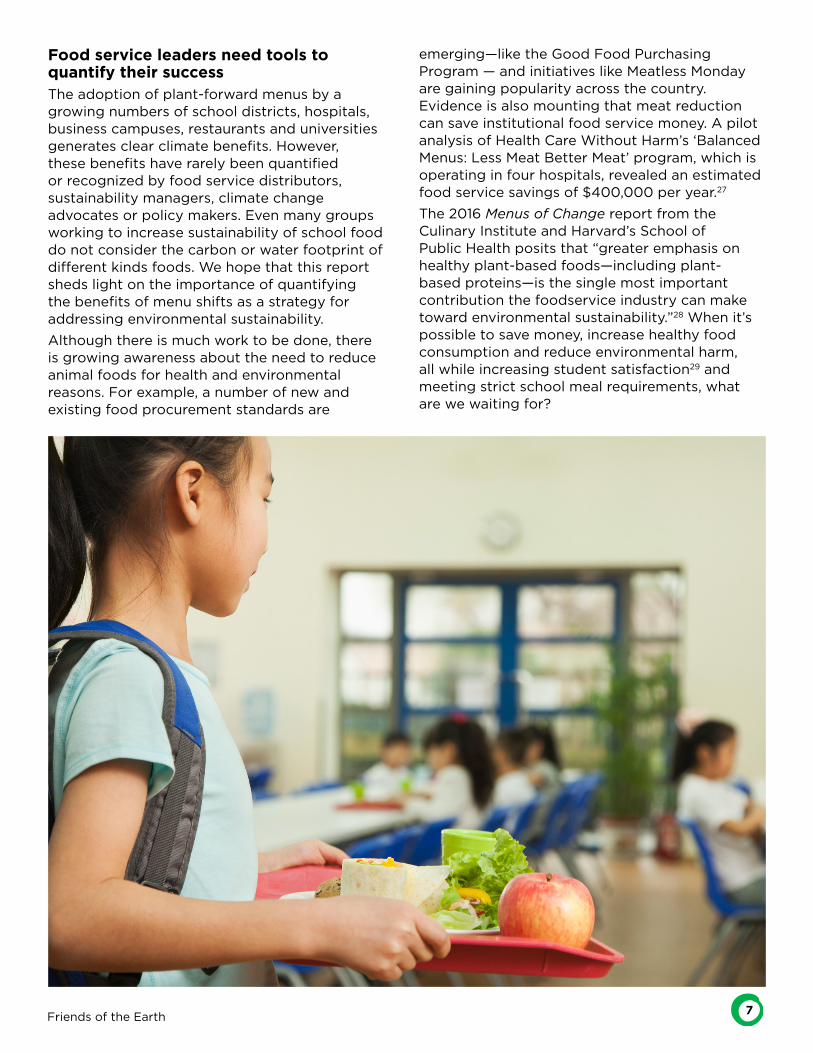
Food service leaders need tools to quantify their successThe adoption of plant-forward menus by a growing numbers of school districts, hospitals, business campuses, restaurants and universities generates clear climate benefits. However, these benefits have rarely been quantified or recognized by food service distributors, sustainability managers, climate change advocates or policy makers. Even many groups working to increase sustainability of school food do not consider the carbon or water footprint of different kinds foods. We hope that this report sheds light on the importance of quantifying the benefits of menu shifts as a strategy for addressing environmental sustainability.
Although there is much work to be done, there is growing awareness about the need to reduce animal foods for health and environmental reasons. For example, a number of new and existing food procurement standards are
emerging—like the Good Food Purchasing Program — and initiatives like Meatless Monday are gaining popularity across the country. Evidence is also mounting that meat reduction can save institutional food service money. A pilot analysis of Health Care Without Harm’s ‘Balanced Menus: Less Meat Better Meat’ program, which is operating in four hospitals, revealed an estimated food service savings of $400,000 per year.27
The 2016 Menus of Change report from the Culinary Institute and Harvard’s School of Public Health posits that “greater emphasis on healthy plant-based foods—including plant- based proteins—is the single most important contribution the foodservice industry can make toward environmental sustainability.”28 When it’s possible to save money, increase healthy food consumption and reduce environmental harm, all while increasing student satisfaction29 and meeting strict school meal requirements, what are we waiting for?
Friends of the Earth 8
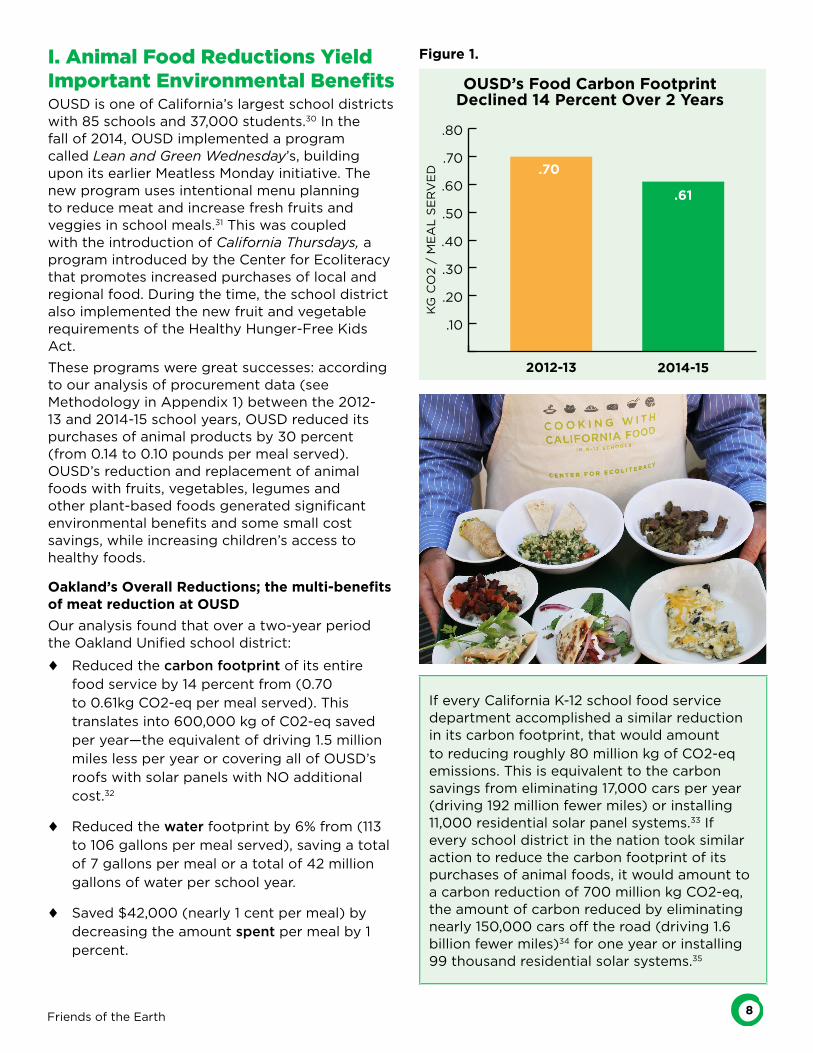
I. Animal Food Reductions Yield Important Environmental BenefitsOUSD is one of California’s largest school districts with 85 schools and 37,000 students.30 In the fall of 2014, OUSD implemented a program called Lean and Green Wednesday’s, building upon its earlier Meatless Monday initiative. The new program uses intentional menu planning to reduce meat and increase fresh fruits and veggies in school meals.31 This was coupled with the introduction of California Thursdays, a program introduced by the Center for Ecoliteracy that promotes increased purchases of local and regional food. During the time, the school district also implemented the new fruit and vegetable requirements of the Healthy Hunger-Free Kids Act.
These programs were great successes: according to our analysis of procurement data (see Methodology in Appendix 1) between the 2012-13 and 2014-15 school years, OUSD reduced its purchases of animal products by 30 percent (from 0.14 to 0.10 pounds per meal served). OUSD’s reduction and replacement of animal foods with fruits, vegetables, legumes and other plant-based foods generated significant environmental benefits and some small cost savings, while increasing children’s access to healthy foods.
Oakland’s Overall Reductions; the multi-benefits of meat reduction at OUSD
Our analysis found that over a two-year period the Oakland Unified school district:
♦♦ Reduced the carbon footprint of its entire food service by 14 percent from (0.70 to 0.61kg CO2-eq per meal served). This translates into 600,000 kg of C02-eq saved per year—the equivalent of driving 1.5 million miles less per year or covering all of OUSD’s roofs with solar panels with NO additional cost.32
♦♦ Reduced the water footprint by 6% from (113 to 106 gallons per meal served), saving a total of 7 gallons per meal or a total of 42 million gallons of water per school year.
♦♦ Saved $42,000 (nearly 1 cent per meal) by decreasing the amount spent per meal by 1 percent.
If every California K-12 school food service department accomplished a similar reduction in its carbon footprint, that would amount to reducing roughly 80 million kg of CO2-eq emissions. This is equivalent to the carbon savings from eliminating 17,000 cars per year (driving 192 million fewer miles) or installing 11,000 residential solar panel systems.33 If every school district in the nation took similar action to reduce the carbon footprint of its purchases of animal foods, it would amount to a carbon reduction of 700 million kg CO2-eq, the amount of carbon reduced by eliminating nearly 150,000 cars off the road (driving 1.6 billion fewer miles)34 for one year or installing 99 thousand residential solar systems.35
.10
.20
.30
.40
.50
.60
.70
.80
2014-152012-13
.70
.61
OUSD’s Food Carbon Footprint Declined 14 Percent Over 2 Years
KG
CO
2 /
ME
AL
SE
RV
ED
Figure 1.

Friends of the Earth 9
Understanding the Shifting Carbon Footprint of Oakland Unified’s Food Procurement
Over a two year period, OUSD reduced its GHG emissions associated with animal products by 20 percent (a significant 10 percent decrease per year). When considering the purchases of replacement foods, Oakland achieved a 14 percent net reduction in its carbon footprint (a 7 percent per year reduction). To accomplish this, the district increased purchases of plant-based, protein rich foods (i.e. legumes, grains, vegetables, etc.) by 10 percent and decreased:
♦♦ chicken purchases by approximately 120,000 lbs (0.02/lbs per meal served)
♦♦ beef/pork blended foods by 21,000 lbs (0.02/lbs per meal served)
♦♦ cheese by 67,000 lbs (0.02/lbs per meal served)
While emissions from all animal products, except stand alone beef and pork products, decreased significantly, emissions from all other food categories increased marginally. During this time, Oakland purchased more legumes, fruits and vegetables, partly due to new requirements of
the Healthy Hunger Free Kids Act. Since these replacement plant-based foods generate far fewer emissions overall (see Figure 4), Oakland Unified was able to achieve a significant 14 percent net reduction in the GHG emissions associated with all of its food purchases.
Our calculations show that Oakland Unified could achieve an additional 5 percent net reduction in its carbon footprint by reducing the volume of its beef purchases by 20 percent, a reasonable two year goal for OUSD, given its steady 10% reduction in animal products each year. It could also generate significant reductions by further reducing its cheese purchases, which currently account for 24% of all animal foods (by weight). Cheese has a relatively high carbon footprint (see Figure 4)
OUSD’s animal products accounted for 76 percent of food related GHG emissions.
These large net emissions reductions are possible because animal products (meat, poultry, eggs and
0
.01
.02
.03
.04
.05
.06
2014-15
2012-13
BeefPorkFishBeef/PorkCheesePoultry
PO
UN
DS
CO
2 /
ME
AL
SE
RV
ED
Shifts in Animal Products Purchased by Oakland Unified School District
Figure 2.

Friends of the Earth 10
dairy products) dominate the carbon footprint of most institutional food purchasing. OUSD’s animal products accounted for 76 percent of food related GHG emissions but only 21 percent of the total poundage of food purchased in 2012-13 (Figure 3). The carbon footprint for animal products at OUSD was three times higher than all of the other food categories combined. As seen in figure 4, animal products, especially beef, pork and cheese, generate far higher GHG emissions than other food groups, especially vegetables and plant-based proteins (see figure 2).36 While beef accounted for just 10 percent of OUSD’s total animal food purchases, it generated 31 percent of the carbon footprint associated with animal foods. Cheese accounted for 24 percent of animal foods and 27 percent of the overall carbon footprint.
After retooling their menus with more plant-based foods, by 2014-15, OUSD’s animal foods accounted for 70 percent of all GHG emissions (a 6 percent decrease in just two years). The district accomplished these significant carbon reductions by serving meals with smaller amounts of meat and by offering more plant-based entrée items—all while maintaining the protein required to meet
Carbon Footprint by Food Group (2012-13)
Animal Products Fruit Vegetables
Legumes Other Foods
76%
8%7%
7%
2%
Figure 3.
0
5
10
15
20
25
30
Generic Fruit
Generic Veg.
Grain Products
LegumesRiceTree Nuts/Seeds
Egg Product
FishPoultryPorkCheeseBeef
LB
CO
2-E
Q/L
B E
DIB
LE
WE
IGH
T
Beef, Pork And Cheese Have Largest Greenhouse Gas Emissions
Source: Heller, M. C. and Keoleian, G. A. (2014)
Figure 4.

Friends of the Earth 11
or exceed federal school meal regulations. We describe this strategy in greater detail in Section III.
Figure 5 shows the vast differences in carbon footprint across different menu items.37 The beef hot dog recipe, for instance, has a carbon footprint seven times higher than that of the tofu & veggie rice stir-fry, a vegan dish with Indian flavors. These differences would become especially significant if lower-carbon meals weret served throughout an entire school district, and even more so if served in all districts across the state or country. On average OUSD’s meals generated 61 kg CO2-eq per 100 servings.
The beef hot dog recipe, for instance, has a carbon footprint
seven times higher than that of the tofu-veggie stir-fry.
Understanding the Shifting Water Footprint
Between the 2012-13 and 2014-15 school years, OUSD reduced the water footprint of its animal food purchases by 10 gallons per meal, or 17 percent. When taking into account the plant-based replacement foods, this amounted to a net 7 gallon per meal reduction (6 percent) in OUSD’s
LB
CO
2-E
Q P
ER
10
0 S
ER
VIN
GS
Carbon Footprint of Different Menu Options38
0
50
100
150
200
Beef Hot Dog
Pepperoni Pizza
Asian ChickenFish
Sticks
Veggie Tostada
(Vegetarian)
Tofu-Veggie Stir-Fry (Vegan)
Source: Friends of the Earth recipe analysis using Heller, M. C. and Keoleian, G. A. (2014)
Figure 5.
Friends of the Earth 12
$42,000
COST SAVINGS
87SOLAR SYSTEMS INSTALLED ON THE SCHOOL DISTRICTS’ ROOVES
1.5 millionFEWER MILES DRIVEN
15,000
TREES PLANTED
14% REDUCTIONIN THE
CARBON FOOTPRINTOF ITS ENTIRE FOOD PURCHASES
OLYMPIC SIZED SWIMMING POOL
63
SAVED 42millionGALLONS OF
WATER
Over 2 years, Oakland Unified School District reshaped its menu with fewer animal foods and more protein-rich legumes and vegetables. This shift generated considerable water and climate benefits, and cost savings:
FOOD SHIFTS MATTER
overall water footprint from 113 gallons per meal down to 106 gallons. Most of the reductions were achieved by reducing chicken, cheese, and combined beef-pork products in its school lunch meals. The water footprint reductions would have been much more sizable had Oakland reduced its beef purchases during this time. While beef represents just 10 percent of Oakland’s animal food purchases, it constitutes 37 percent of the water footprint associated with animal foods.
In 2012-13, animal foods accounted for nearly 60 percent of OUSD’s food water footprint. By 2014-15, animal foods accounted for just 45 percent.
The net water conservation benefits generated
by reducing animal food purchases were not as large as the carbon emissions benefits because some of the replacement plant-based foods have relatively high water footprints (Figure 6) relative to poultry, the animal food item that saw the greatest decreases. Nonetheless, reducing water-intensive animal foods is an innovative and cost effective strategy for saving water in California and other regions where water is becoming an increasingly limited resource. In California, about a quarter of the state’s irrigation water goes to animal feed.39 This is redundant: revise as such: institutional food shifts, such as those beginning to take place at Oakland Unified, are imperative for a more sustainable food future.26,27
GA
LLO
NS
/LB
ED
IBL
E F
OO
D
Water Footprint of Select Foods40,41
0
500
1000
1500
2000
GENERIC VEG.
GENERIC FRUIT
EGG PRODUCT
LEGUMESRICEPOULTRYCHEESEBUTTERTREE NUTS/SEEDS
PORKBEEF/PORK
BEEF
1590
1033
475 460 418 382230 196 196 162 46 9
Source: Mekonnen, M.M. and Hoekstra, A.Y. (2011, 2012)
Figure 6.
Friends of the Earth 13
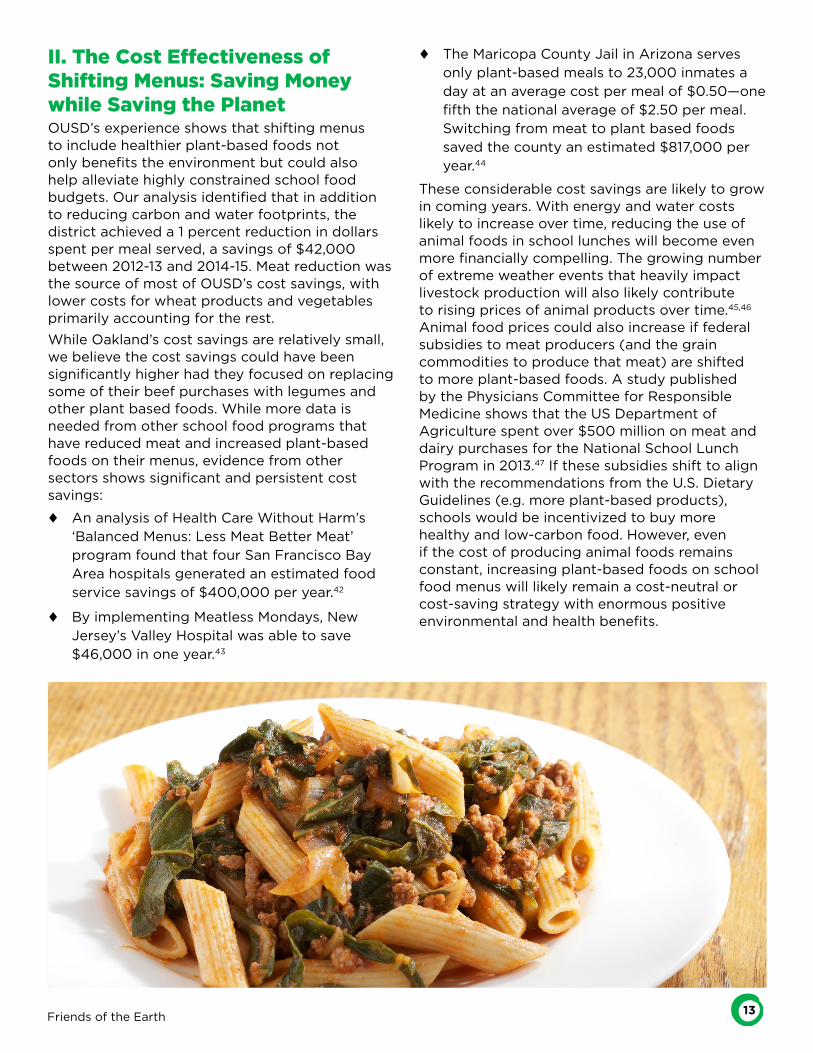
II. The Cost Effectiveness of Shifting Menus: Saving Money while Saving the PlanetOUSD’s experience shows that shifting menus to include healthier plant-based foods not only benefits the environment but could also help alleviate highly constrained school food budgets. Our analysis identified that in addition to reducing carbon and water footprints, the district achieved a 1 percent reduction in dollars spent per meal served, a savings of $42,000 between 2012-13 and 2014-15. Meat reduction was the source of most of OUSD’s cost savings, with lower costs for wheat products and vegetables primarily accounting for the rest.
While Oakland’s cost savings are relatively small, we believe the cost savings could have been significantly higher had they focused on replacing some of their beef purchases with legumes and other plant based foods. While more data is needed from other school food programs that have reduced meat and increased plant-based foods on their menus, evidence from other sectors shows significant and persistent cost savings:
♦♦ An analysis of Health Care Without Harm’s ‘Balanced Menus: Less Meat Better Meat’ program found that four San Francisco Bay Area hospitals generated an estimated food service savings of $400,000 per year.42
♦♦ By implementing Meatless Mondays, New Jersey’s Valley Hospital was able to save $46,000 in one year.43
♦♦ The Maricopa County Jail in Arizona serves only plant-based meals to 23,000 inmates a day at an average cost per meal of $0.50—one fifth the national average of $2.50 per meal. Switching from meat to plant based foods saved the county an estimated $817,000 per year.44
These considerable cost savings are likely to grow in coming years. With energy and water costs likely to increase over time, reducing the use of animal foods in school lunches will become even more financially compelling. The growing number of extreme weather events that heavily impact livestock production will also likely contribute to rising prices of animal products over time.45,46 Animal food prices could also increase if federal subsidies to meat producers (and the grain commodities to produce that meat) are shifted to more plant-based foods. A study published by the Physicians Committee for Responsible Medicine shows that the US Department of Agriculture spent over $500 million on meat and dairy purchases for the National School Lunch Program in 2013.47 If these subsidies shift to align with the recommendations from the U.S. Dietary Guidelines (e.g. more plant-based products), schools would be incentivized to buy more healthy and low-carbon food. However, even if the cost of producing animal foods remains constant, increasing plant-based foods on school food menus will likely remain a cost-neutral or cost-saving strategy with enormous positive environmental and health benefits.

Friends of the Earth 14
III. How was Oakland successful?Oakland’s success can be attributed to its smart and strategic food service team, which is committed to finding creative ways to improve quality while reducing the environmental impact of the food served. OUSD was able to achieve substantial reductions of animal products by implementing several innovative programs described below. During this time, it also implemented the Healthy Hunger Free Kids Act (HHFKA) which required increases in the amounts of fruits and vegetables in school lunch programs. Oakland’s capacity to make meals from scratch in its central kitchen coupled with good staff training are key factors that allowed for the creation of healthy, delicious lower-meat meals.48
Oakland initiated its Lean and Green Wednesday program (mostly as a name change from Meatless Mondays) in order to allow scratch-cooked food on Wednesdays (Mondays didn’t allow for prepping food, as the kitchens are closed over the weekend). On Wednesdays, Oakland served one meatless lunch every week at all the elementary schools, introducing delicious dishes such as Vegetarian Chili, Vegetarian Nachos and Tostadas
The California Thursdays® program was initiated by the Center for Ecoliteracy to promote the use of California-grown products in school food service with a focus on sourcing from local and regional farms.50
As part of this program, OUSD introduced no-meat and reduced-meat recipes, such as the Vegetarian Tostada with avocado and the Bean and Beef Chili (replacing 50 percent of the beef with legumes, such as beans and lentils, which also count toward the 2 oz protein quota51).
Reducing the portion size of the meat made it possible for OUSD to source better quality beef from Mindful Meats, a company that sources meat from retired dairy cows raised organically and more humanely in Northern California.52 The
smaller portion of beef allowed the district to compensate for the higher price while including more healthful vegetables, which Oakland’s kids need to consume in larger quantities.
Mindful Meats, a Northern California distributor of beef products, sources beef for Oakland Unified School District from certified organic cows that are raised both for dairy and for beef. Meat that comes from retired dairy cows has far lower water and GHG emissions than meat from beef cows because the footprint is spread across both dairy and meat products. A Mindful Meat cow “provides an average of over 80,000 pounds of food during her lifetime, including milk, cream, butter, cheese, ice cream and beef, as opposed to the beef cow or steer that provides only about 600 pounds of meat.”49
Across California, increasing numbers of schools are serving kids healthier grassfed burgers from well managed ranches, with support from The Center for Ecoliteracy, as part of the California Thursdays® program. It’s important to note that while organic, pastured-raised beef has significant health53 and environmental advantages over industrial beef, they still require more resources and carry a significantly higher carbon and water footprint than plant-based proteins.54
These vegetarian and reduced meat recipes were key to Oakland’s success and offer an excellent (and easily replicable) approach to provide K-12 students with healthy, sustainable and local food at affordable prices.55 Another reduced meat item that could help reduce the overall carbon footprint is a blended burger that is currently available to K-12 schools that are served by Sodexo. That burger, which has won student taste test comparisons, replaces the overall beef content by 30 percent by replacing it with mushrooms. And one more added benefit: the meat used for these blended burgers is produced without the use of routine antibiotics or growth hormones.56
Less and Better Meat and Sustainable Agriculture Practices If done right, agriculture can provide important environmental benefits. Large food buyers can reduce their environmental impact by sourcing a portion of their food purchases from farms that use sustainable agricultural practices—like cover cropping, mulching, composting, rotational grazing and biological control of insects. These regenerative, ecological practices—often associated with mixed crop-livestock systems and organic farming—improve soil fertility, protect biodiversity (e.g. bees and butterflies) and manage insects without the need for toxic chemicals. These proven practices also reduce energy use and GHG emissions and make farms more resilient to climate change, a critical gain for California and other states hit hard by chronic drought and other seasonal disruptions. These practices don’t just pull carbon out of the atmosphere, which helps combat climate change—they also protect and help store water, which is critical in times of both drought and floods.57

Friends of the Earth 15
VS VS VS
VS VS VSURBAN TREESPLANTED
RESIDENTIALSOLAR SYSTEMS
CLIMATE CONSIOUS MENUS
SHIFTS
17 Million TREES
at a cost of
$1.7 BILLION
2 Million TREES
at a cost of
$2.1 MILLION
15,000 TREES
at a cost of
$1.7 MILLION
99,OOO PANELSat a cost of
$2.8 BILLION
11,OOO PANELSat a cost of
$280 MILLION$2.1 MILLION
87PANELSat a cost of
$0 EXTRACOST
OAKLAND UNIFIED’S menu shifts over
just 2 years reduced its carbon footprint by
600,000 kgs at
$0 EXTRACOST$0 EXTRACOST
If all CALIFORNIA public districts adopted similar menu shifts, they
could reduce their carbon footprint by 80 million kgs at
$0 EXTRACOST
If all U.S. public schooldistricts adopted similar
menu shifts, they could reduce their carbon footprint by
700 million kgs at
Source: FOE calculations based on OUSD procurement data, EPA data and the Google Solar Project.
THE COST EFFECTIVENESS OF CLIMATE CONSCIOUS MENU SHIFTS COMPARED TO OTHER CLIMATE MITIGATION STRATEGIES
IV. Low-carbon Foods: A Cost-effective Climate Mitigation Strategy Reducing energy- and water-intensive animal foods on institutional menus is an important way to curb a potent source of GHGs that has long been ignored by policy makers and the climate community. Unlike many costly and complex climate mitigation methods, meat reduction in food service has the potential to be a cost-neutral or even cost-saving strategy for reducing carbon emissions.
The vital role of meat reduction in mitigating climate change is well documented in numerous peer-reviewed articles and two recent studies by the World Resources Institute and Chatham House.58,59 A 2014 climate mitigation report by the UN Intergovernmental Panel on Climate Change (IPCC) found that “the potential to reduce GHG emissions through reduction in consumption of meat... (is) substantially higher than that of (any other agricultural) technical mitigation
measures.”60 The 2015 Dietary Guidelines Scientific Report reiterated the environmental benefits of less meat consumption.61
Table 1 shows how expensive other carbon reduction initiatives are relative to shifting to low-carbon food procurement at the institutional level. Animal food reduction strategies should thus be considered as an important cost-effective complement to other important climate mitigation strategies, such as energy conservation measures, building greater renewable energy capacity, planting trees or increasing fuel-economy in the transportation sector.
Unlike many costly and complex climate mitigation methods, meat reduction in food service has the potential to be a cost-neutral or
even cost-saving strategy for reducing carbon emissions.
Table 1.
Friends of the Earth 16
V. Expanding Plant Forward Menus in School Food ProgramsWith facilities and staff in place to cook from scratch, Oakland Unified School District’s experience shows that it is both feasible and cost-effective to implement healthy and climate conscious menu shifts in K-12 school food service. We know that food service directors face complex and demanding requirements and that serving kids healthy and nutritious food is their number one priority. To this end, there is already innovative work underway to serve healthier foods, including more whole grains, fruits and vegetables and less fat, sodium and sugar. Climate-conscious, plant-forward menu planning can easily complement and support this mandate for healthier food while combating one of the biggest threats to our planet and reducing harm to animals. These are goals widely embraced by today’s younger generations, and these practices can only deepen their future commitment to these important principles.
There are a range of resources and partners ready to assist school districts in developing and implementing menus with more plant based options. Given that healthy, climate-friendly food must also taste good to kids, Meatless Mondays and the Humane Society of the United States have developed many scalable recipes to help school chefs prepare delicious plant-based meals that kids love and that meet the USDA meal pattern requirements. The Humane Society’s Food Forward program provides apps, meatless recipes, menu plans, messaging, free customized chef training and team building to support more plant-forward menu planning. Friends
of the Earth has teamed up with the Humane Society and other organizations to create this BringFoodFoward website offering tools, case studies and recipes.
Resources for Creating Healthy, Climate Conscious Menus
♦♦ Meatless Mondays K-12 toolkit and school food recipe book
♦♦ Bring Food Forward
♦♦ Menus of Change
♦♦ Lean and Green Kids
♦♦ Coalition for Healthy School Food
In order to make plant-based protein foods more affordable and accessible, broadline distributors and food service companies must develop more vegetable protein products or lower meat blended products (like the blended burger62) tailored for public schools. In addition, the USDA School Food program should offer more of these foods, expand its highly successful DOD Fresh Program, and allow high protein grains, like quinoa, to count toward the protein requirement (currently not the case).
By incorporating reduced meat recipes in addition to plant-based meals, more schools could afford to buy healthier, grassfed meat that comes from producers that are managing the land in a way that protects biodiversity, creates healthier, carbon-rich soils, and enhances the welfare of animals. These purchases could carry the added benefit of supporting local and regional farmers and rural economies.

Friends of the Earth 17
Growing Momentum for Plant Forward Menus and Less and Better Meat
Across the country, schools and institutions are learning from one another, inspiring new recipes and lesson plans and engaging the next generation in a vital conversation about the impacts of our food choices. Hundreds of school districts nationwide have adopted Meatless Mondays for health and environmental reasons,63 and three leading school districts, including Oakland Unified, have adopted the Good Food Purchasing standards. The Center for Good Food Purchasing is a non-profit organization that works with public institutions to shift their food purchases to align with five core values: local economies, valued workforce, environmental sustainability, animal welfare and nutrition. Meat reduction is a key component of its sustainability standard.64
Standards such as the Association for the Advancement of Sustainability in Higher Education (AASHE) STARS have also embraced this strategy, providing sustainability points to colleges and universities that meet their guidelines for meat reduction, including implementation of Meatless Mondays programs and meals built around complete plant-proteins.65 The Sustainable Purchasing Leadership Council standards also highlight the importance of meat reduction as a key sustainability practice.66 Health Care without Harm has worked with hospitals for many years to support meat reduction strategies for health and environmental reasons through their Balanced Menus: Less Meat, Better Meat program. The Culinary Institute of America and the Harvard School of Public Health have also been important leaders through their innovative Menus of Change program, which works with chefs, universities, restaurants and food service companies to promote healthy, sustainable and plant-forward menus.67,68
VI. Conclusion Institutions can protect future water supplies and curb a potent source of GHGs with menus that reduce demand for resource intensive animal foods. This strategy has long been ignored by policy makers and the climate community. It represents action we can take now, and even small shifts at the institutional scale can have significant positive impacts for people and the environment.
Oakland Unified School District’s experience shows how menus with more plant-based foods can significantly reduce the school district’s carbon and water footprints while reducing money spent per meal. The district’s menu design strategies show the huge potential for shifting school food towards less and better meat choices while adding plant-based protein-rich foods that kids enjoy. This the cost-neutral strategy can significantly reduce carbon emissions and water-intensity of menus while maintaining or increasing the nutritional quality of school food programs. We hope that the powerful story of Oakland Unified School District will inspire more school districts across California and the nation to follow suit.
School lunch is an important place to implement climate conscious menus since we can address critical environmental issues at no additional cost, while fostering healthy eating habits that will last a lifetime. This is a rare opportunity for a single solution to address many challenges simultaneously. With over seven billion meals served annually across the nation (800 million meals in California),69 school food’s vast purchasing power has the ability to help shift agriculture production away from resource-intensive foods towards healthier, less energy-intensive plant-based foods. And by combining these menu shifts with educational food programs on health and sustainability, schools have the unique ability to help shape the next generation of healthier, climate conscious consumers.70
These smart menu planning strategies should not be limited to school food. Across California and the nation, all public institutions or publicly leased facilities should strive to serve less and better meat and more plant-based foods as a key strategy for improving health, curbing climate change and saving money and precious water resources.

Friends of the Earth 18
VII. Appendix I. Methodology: Using life-cycle analysis carbon emissions data based on peer reviewed data, Friends of the Earth assessed the carbon and water footprints associated with Oakland Unified School District food procurement from two distinct years, 2012-13 (before implementation of Lean and Green Wednesdays, California Thursdays and Healthy Hunger-Free Kids Act) and 2014-15 (after implementation). FOE then measured the changes in carbon and water footprint, and money spent per meal served (including snacks), before and after implementation.
Carbon Emissions Data
The carbon emissions data associated with food products was based on a supporting document of a 2014 peer reviewed report authored by Heller & Keoleian.71 The Heller & Keoleian (2014) data is based on a large meta-analysis they conducted which generated global averages of life cycle assessments of the carbon dioxide equivalent emitted per kilogram of various food products from the farm to the retail level (kg CO2-eq).
Water Footprint Data
We used data generated by the Water Footprint Network to calculate the green and blue water footprint of food.72,73 The footprint data is based on life-cycle assessment (LCA), which calculates water use at various stages of productions, from farm-to-retail, accounting for all the embedded water used in the production process. (The blue water footprint represents the irrigated water for crops or animals; green water is a measure of rainfall taken-up in food production)
Data Limitations
It is important to note that the data used is imperfect, as it does not account for significant shifts in production practice or micro-climate. However, given that the data set is based on global averages in each category, we are confident that this data set represents some of the best available peer reviewed data. Due to imperfect data, the results should be understood as approximations, which portray the general trends of embedded carbon emissions and water use.
While we lacked location specific data on the carbon footprint of Mindful Meats beef, we relied on carbon footprint data from a Dutch study that estimated emissions from beef derived from dairy cows at about a third of typical emissions
from beef cows.74 Beef derived from dairy cows have lower emissions because the emission values are spread across both dairy and meat products. In any case, since Mindful Meats only represents about 1 percent of Oakland’s total meat purchases, the impact on the overall carbon calculations are limited.
Analysis of Food Procurement Invoices
The Center for Good Food Purchasing (CGFP) assisted us in the acquisition of the procurement data for Oakland Unified School District. Oakland Unified School District provided us with official invoices from Sysco and Fresh Point for the school year 2013-14 and Sysco and Pacific Rim Produce for 2014-15.
These invoices were cleaned up and organized before the calculation process. For each year, the methodology was identical. The process consisted of, first, adding up the weight (pounds) and dollar value of all food types. The poundage for multi-ingredient foods products was split and allocated to the main ingredients (products were split into no more than 5 ingredients). Second, matching each food category with the carbon equivalent and water use conversion factors
SO
UR
CE
:

Friends of the Earth 19
and third, the data was divided by the number of meals served in each year. The meals served number (including snacks, which accounted for approximately 18 percent of “meals”), enables comparisons between years as well as extrapolation calculations to the meals served data in the state and nationwide. Once the carbon, water footprint and cost were calculated for each food type, the data was organized into broader food categories (Total Animal Products, Total Vegetable, Total Fruit, Legumes and Other Foods). This organization makes the data more clear and easier to represent.
Comparing carbon footprint reductions of institutional food purchases to conventional carbon reduction methods
In order to generate the state-wide and national projections for emission reductions from solar panel installations, we used sun-roof data applicable in Oakland, California. Using Google’s Sun Roof Project, we assumed 9600 kilowatt
hours/year as the average for Oakland and then calculated the CO2-eq emissions by multiplying (0.073) kg CO2 per kwh (EPA, 2012).75,76 A similar process was used to calculate the equivalent reduction in terms of trees planted (39.0 kg CO2-eq*year-1) and automobile emissions (4700 kg CO2-eq*car-1*year-1); for both of these, we used EPA data.77,78
While carbon footprint data reflects an indirect form of carbon emission reduction––and therefore may not be as exact as these forms of carbon emission reductions––over time, reduced demand for animal foods will lead to reduced production—and thus reduced emissions. While there will inevitably be lag time in the market, USDA Economic Research Data data shows that reduced demand and supply correlate very closely. For example from 2008-2015, beef consumption declined by 9% from 27.3 to 24.8 billion pounds, while US beef production decreased 10 percent from 26.56 to 23.7 billion pounds.79
Friends of the Earth 20
Endnotes1 Kim, B, Neff, R, Santo R, Vogorito J, The Importance of Reducing Animal Product Consumption and Wasted Food in Mitigating
Catastrophic Climate Change, Johns Hopkins Center for Livable Future, December 2015
2 Micha, R., Wallace, S. K., & Mozaffarian, D. (2010). Red and processed meat consumption and risk of incident coronary heart disease, stroke, and diabetes: A systematic review and meta-analysis. Circulation, 121(21), 2271–2283. http://doi.org/10.1161/CIRCULATIONAHA.109.924977
3 Tuso P, Ismail M, Ha B, and Brolotto C. 2013. Nutritional Update for Physicians: Plant-Based Diets. Perm J. Spring; 17(2): 61–66. http://www.ncbi.nlm.nih.gov/pmc/articles/PMC3662288/
4 Meet The Cows. (n.d.). Retrieved December 23, 2016, from http://www.mindfulmeats.com/thecows
5 See solar energy conversions in appendix of full document
6 EPA. (2011). Shower Better Learning Resource. Retrieved from https://www3.epa.gov/watersense/docs/ws_shower_better_learning_resource_508.pdf
7 Gleick, P. H., & Haasz, D. (2003, November). Waste Not, Want Not: The Potential for Urban Water Conservation in California. Retrieved from http://www.pacinst.org/app/uploads/2013/02/waste_not_want_not_full_report3.pdf
8 USDA, survey of meal satisfaction as a result of California Thursday, key findings: increased meal satisfaction, increased perception of fruits and vegetables
9 Menus of Change. (n.d.) Retrieved December 23, 2016, from http://www.menusofchange.org/about/
10 Moore, L. (2015, July 10). Adults Meeting Fruit and Vegetable Intake Recommendations — United States, 2013. Retrieved September 14, 2015, from http://www.cdc.gov/mmwr/preview/mmwrhtml/mm6426a1.htm
11 “Chapter 2 Shifts Needed To Align With Healthy Eating Patterns.” (2015) A Closer Look at Current Intakes and Recommended Shifts - 2015-2020 Dietary Guidelines. Health.gov, Dec. 2015. Web. 23 Dec. 2016.
12 LaGasse, Lisa and Roni Neff (2010). Balanced Menus: A pilot evaluation in Four San Francisco Bay Area Hospitals. Prepared for San Francisco Physicians for Social Responsibility and Health Care Without Harm. http://www.jhsph.edu/research/centers-and-institutes/johns-hopkins-center-for-a-livable-future/research/clf_publications/pub_rep_desc/balanced_menu.html
13 Peter M. Pilat, Food Service Commander, Maricopa County Sheriff’s Office in an email to Josephine Morris at HSUS. December 19, 2016.
14 U. (2015). Menu Planning: How to Serve a Reimbursable Meal. Retrieved from http://www.fns.usda.gov/sites/default/files/sfsp/SMT-ReimbursableMeal.pdf
15 DoD Fresh Food Program. (2016, June 07). Retrieved January 09, 2017, from https://www.fns.usda.gov/fdd/dod-fresh-fruit-and-vegetable-program
16 Meatless Monday K-12. (n.d.). Retrieved January 03, 2017, from http://www.meatlessmonday.com/meatless-monday-k-12/
17 California Thursdays is a collaboration between the Center for Ecoliteracy and a network of 71 public school districts to serve healthy, freshly prepared school meals made with California-grown food. The Network collectively serves over 309 million meals annually (33% of the state total).
18 Searchinger, Tim (2013). “Creating a Sustainable Food Future.” World Resource Institute, Web https://www.wri.org/sites/default/files/wri13_report_4c_wrr_online.pdf (page 4)
19 “Key Facts and Findings.” FAO - News Article: Key Facts and Findings. Food & Agriculture Organization of the UN, n.d. Web. 20 Dec. 2016. http://www.fao.org/news/story/en/item/197623/icode/
20 Steinfeld, Henning. “Livestock’s Long Shadow: Environmental Issues and Options.”Livestock’s Long Shadow: Environmental Issues and Options. Food & Agriculture Organization of the UN, n.d. Web. 20 Dec. 2016. http://www.fao.org/docrep/010/a0701e/a0701e00.HTM (page 133)
Friends of the Earth 21
21 Kim, B, Neff, R, Santo R, Vogorito J, The Importance of Reducing Animal Product Consumption and Wasted Food in Mitigating Catastrophic Climate Change, Johns Hopkins Center for Livable Future, December 2015
22 Micha, R., Wallace, S. K., & Mozaffarian, D. (2010). Red and processed meat consumption and risk of incident coronary heart disease, stroke, and diabetes: A systematic review and meta-analysis. Circulation, 121(21), 2271–2283. http://doi.org/10.1161/CIRCULATIONAHA.109.924977
23 Micha, R., Wallace, S. K., & Mozaffarian, D. (2010). Red and processed meat consumption and risk of incident coronary heart disease, stroke, and diabetes: A systematic review and meta-analysis. Circulation, 121(21), 2271–2283. http://doi.org/10.1161/CIRCULATIONAHA.109.924977
24 Cross AJ, Leitzmann MF, Gail MH, Hollenbeck AR, Schatzkin A, Sinha R (2007) A Prospective Study of Red and Processed Meat Intake in Relation to Cancer Risk. PLoS Med 4(12): e325. doi:10.1371/journal.pmed.0040325
25 “Chapter 2 Shifts Needed To Align With Healthy Eating Patterns.” (2015) A Closer Look at Current Intakes and Recommended Shifts - 2015-2020 Dietary Guidelines. Health.gov, Dec. 2015. Web. 23 Dec. 2016. https://health.gov/dietaryguidelines/2015/guidelines/chapter-2/a-closer-look-at-current-intakes-and-recommended-shifts/
26 “Chapter 2 Shifts Needed To Align With Healthy Eating Patterns.” (2015) A Closer Look at Current Intakes and Recommended Shifts - 2015-2020 Dietary Guidelines. Health.gov, Dec. 2015. Web. 23 Dec. 2016. https://health.gov/dietaryguidelines/2015/guidelines/chapter-2/a-closer-look-at-current-intakes-and-recommended-shifts/
27 LaGasse, Lisa and Roni Neff (2010). Balanced Menus: A pilot evaluation in Four San Francisco Bay Area Hospitals. Prepared for San Francisco Physicians for Social Responsibility and Health Care Without Harm. http://www.jhsph.edu/research/centers-and-institutes/johns-hopkins-center-for-a-livable-future/research/clf_publications/pub_rep_desc/balanced_menu.html
28 Menus of Change. (n.d.) Retrieved December 23, 2016, from http://www.menusofchange.org/about/
29 USDA, survey of meal satisfaction as a result of California Thursday, key findings: increased meal satisfaction, increased perception of fruits and vegetables
30 Oakland Unified Fact Sheet. (2015). Retrieved December 23, 2016, from http://www.ousd.org/cms/lib07/CA01001176/Centricity/Domain/1/OUSD%20District%20Docs/OUSD%20Fast%20Facts%202014-15.pdf
31 Lean and Green Wednesday’s is an iteration of the more widely known, Meatless Mondays. Oakland chose to do Wednesday because it is easier to prepare fresh food from scratch during the middle of the week.
32 See solar energy conversions in appendix of full document
33 See carbon to solar conversions in appendix
34 See carbon to automobile conversion in appendix
35 See carbon to solar conversion in appendix
36 Heller, M. C. and Keoleian, G. A. (2015), Greenhouse Gas Emission Estimates of U.S. Dietary Choices and Food Loss. Journal of Industrial Ecology, 19: 391–401. doi: 10.1111/jiec.12174
37 GHG emissions of different recipes are based Friends of the Earth analysis using data from Heller, M. C. and Keoleian, G. A. (2015), Greenhouse Gas Emission Estimates of U.S. Dietary Choices and Food Loss. Journal of Industrial Ecology, 19: 391–401. doi: 10.1111/jiec.12174
38 All GHG emissions were calculated from recipes provided by OUSD, except for the Vegetable Biryani, which comes from the Center for Ecoliteracy’s California Thursday’s cookbook.
39 Fultion, J., & Gleick, P. H. (2012, December). California’s Water Footprint. Retrieved from http://pacinst.org/app/uploads/2013/02/ca_ftprint_full_report3.pdf
40 Mekonnen, M.M. and Hoekstra, A.Y. (2012) A global assessment of the water footprint of farm animal products, Ecosystems, 15(3): 401–415.
41 Mekonnen, M.M. and Hoekstra, A.Y. (2011) The green, blue and grey water footprint of crops and derived crop products, Hydrology and Earth System Sciences, 15(5): 1577-1600.
42 Largasse, L., MHS, & Neff, R., PhD. (2010). Balanced Menu. Johns Hopkins School of Public Health, Center for a Livable Future. Retrieved December 23, 2016, from http://www.jhsph.edu/research/centers-and-institutes/johns-hopkins-center-for-a-livable-future/_pdf/research/clf_reports/BMCReportFinal.pdf
43 Webinar for humane society (2016) on results of Healthy Hospital Initiative on New Jersey’s Valley Hospital
44 Peter M. Pilat, Food Service Commander, Maricopa County Sheriff’s Office in an email to Josephine Morris at HSUS. December 19, 2016.
45 This source shows the steady increase of the price of beef in the last 10 years: USDA. (2016, October). Statistics & Information. Retrieved December 23, 2016, from https://www.ers.usda.gov/topics/animal-products/cattle-beef/statistics-information/
46 FAO. (2011, June). Price Volatility in Food and Agricultural Markets: Policy Responses . Retrieved from http://www.fao.org/fileadmin/templates/est/Volatility/Interagency_Report_to_the_G20_on_Food_Price_Volatility.pdfOne
47 Who’s Making Money from Overweight Kids? (2015). Retrieved January 3, 2017, from http://www.pcrm.org/sites/default/files/pdfs/Who’s-Making-Money-from-Overweight-Kids.pdf
48 email communication with Alexandra Emmot, Oakland School District Farm to School Supervisor, January 3, 2017

Friends of the Earth 22
49 Meet The Cows. (n.d.). Retrieved December 23, 2016, from http://www.mindfulmeats.com/thecows
50 California Thursdays. (2016). Retrieved December 23, 2016, from http://www.californiathursdays.org/
51 U. (2015). Menu Planning: How to Serve a Reimbursable Meal. Retrieved from http://www.fns.usda.gov/sites/default/files/sfsp/SMT-ReimbursableMeal.pdf
52 Meet The Cows. (n.d.). Retrieved December 23, 2016, from http://www.mindfulmeats.com/thecows
53 Siscovick, D. S., T. E. Raghunathan, et al. (1995). “Dietary Intake and Cell Membrane Levels of Long-Chain n-3 Polyunsaturated Fatty Acids and the Risk of Primary Cardiac Arrest.” JAMA 274(17): 1363-1367.
54 Cook, C. D., Hamerschlag, K., & Klein, K., PHD. (2016). Farming for the Future: Organic and Agroecological Solutions to Feed the World. Friends of the Earth . Retrieved from http://webiva-downton.s3.amazonaws.com/877/05/5/8492/2/FOE_Farming_for_the_Future_Final.pdf
55 Ibid.
56 need to fill in article link
57 Meet The Cows. (n.d.). Retrieved December 23, 2016, from http://www.mindfulmeats.com/thecows
58 Steinfeld, Henning. “Livestock’s Long Shadow: Environmental Issues and Options.”Livestock’s Long Shadow: Environmental Issues and Options. Food & Agriculture Organization of the UN, n.d. Web. 20 Dec. 2016.
59 Wellesley, L., Froggatt, A., & Happer, C. (2015, November). Changing Climate, Changing Diets: Pathways to Lower Meat Consumption. Retrieved December 23, 2016, from https://www.chathamhouse.org/publication/changing-climate-changing-diets
60 insert UN report
61 “Chapter 2 Shifts Needed To Align With Healthy Eating Patterns.” (2015) A Closer Look at Current Intakes and Recommended Shifts - 2015-2020 Dietary Guidelines. Health.gov, Dec. 2015. Web. 23 Dec. 2016. https://health.gov/dietaryguidelines/2015/guidelines/chapter-2/a-closer-look-at-current-intakes-and-recommended-shifts/
62 Blended burger info
63 Meatless Monday K-12. (n.d.). Retrieved January 03, 2017, from http://www.meatlessmonday.com/meatless-monday-k-12/
64 Good Food Purchasing Program Standards. (n.d.). Retrieved January 04, 2017, from http://goodfoodpurchasing.org/program-overview/#_standards. The latest CGFP standards are forthcoming.
65 Stars Technical Manual. (2016, May). Retrieved December 23, 2016, from http://www.aashe.org/files/documents/STARS/stars_2.1_technical_manual_-_administrative_update_one.pdf
66 Sustainable Purchasing Leadership Council, Guidance for Leadership in Sustainable Purchasing Version 1.0 https://www.sustainablepurchasing.org/guidance/
67 Menus of Change University Research Collaborative. (n.d.). Retrieved December 23, 2016, from http://www.moccollaborative.org/about/
68 Menus of Change. (n.d.) Retrieved December 23, 2016, from http://www.menusofchange.org/about/
69 Food Programs. (2016, June). Retrieved December 23, 2016, from http://www.cde.ca.gov/ds/sh/sn/#annual
70 This report illustrates the effect of school food programs on creating a generation of conscious consumers: Atkins, R. C., Dr., & Atkins, V. (2010, September). An Evaluation of the School Lunch Initiative . Retrieved December 23, 2016, from http://www.schoollunchinitiative.org/pdfs/sli_eval_full_report_2010.pdf
71 Heller, M. C. and Keoleian, G. A. (2014), Greenhouse Gas Emission Estimates of U.S. Dietary Choices and Food Loss. Journal of Industrial Ecology, 19: 391–401. doi:10.1111/jiec.12174
72 Mekonnen, M.M. and Hoekstra, A.Y. (2011) The green, blue and grey water footprint of crops and derived crop products, Hydrology and Earth System Sciences,
73 Mekonnen, M.M. and Hoekstra, A.Y. (2012) A global assessment of the water footprint of farm animal products, Ecosystems, 15(3): 401–415.
74 Blonk, H. (2008, November). Greenhouse Gas Emissions of Meat. Retrieved January 11, 2017, from http://www.blonkconsultants.nl/wp-content/uploads/2016/06/GHG-Emissions-of-meat-1.pdf
75 GHG Equivalencies Calculator - Calculations and References. (2012). Retrieved December 23, 2016, from https://www.epa.gov/energy/ghg-equivalencies-calculator-calculations-and-references
76 Project Sunroof - Data Explorer | Oakland. (2016, October). Retrieved December 23, 2016, from https://www.google.com/get/sunroof/data-explorer/place/ChIJA-2qKIt9hYARZ5N1NdUVtHE/#methodology
77 GHG Equivalencies Calculator - Calculations and References. (2012). Retrieved December 23, 2016, from https://www.epa.gov/energy/ghg-equivalencies-calculator-calculations-and-references
78 EPA. (2014, May). Greenhouse Gas Emissions from a Typical Passenger Vehicle. Retrieved January 11, 2017, from https://www.epa.gov/sites/production/files/2016-02/documents/420f14040a.pdf
79 USDA ERS Statistics & Information. (2016, October 6). Retrieved February 04, 2017, from https://www.ers.usda.gov/topics/animal-products/cattle-beef/statistics-information/