final report the water and carbon footprint of household...
TRANSCRIPT

Final report
The water and carbon footprint of
household food and drink waste
in the UK
A report containing quantification and analysis of the water and carbon footprint of different types of household food and drink waste in the UK. In addition to raising awareness, the information can be used in developing national and regional policies targeting a reduction in the impacts of our carbon and water footprint related to our food system. It can also be used by the food industry to understand and minimise water-related business risk associated with food supplies to the UK.
Project code: ISBN: 1-84405-444-6
Research date: 2010-2011 Date: March 2011

WRAP‟s vision is a world without waste, where resources are used sustainably. We work with businesses and individuals to help them reap the benefits of reducing waste, develop sustainable products and use resources in an efficient way. Find out more at wrap.org.uk
WWF is the leading independent authority on protecting the natural world. We‟re here to create solutions for the most important environmental challenges facing the planet, helping people and nature to thrive. To make things happen, we work with business, communities and government in over 100 countries – protecting wild places, tackling climate change and enabling people to live more sustainably. Find out more at wwf.org.uk
Written by: Dr. Ashok Chapagain (WWF-UK) and Keith James (WRAP)
Front cover photography: Watering Seedling (Graham Flack)
WRAP and WWF-UK believe the content of this report to be correct as at the date of writing. However, factors such as prices, levels of recycled content and
regulatory requirements are subject to change and users of the report should check with their suppliers to confirm the current situation. In addition, care should
be taken in using any of the cost information provided as it is based upon numerous project-specific assumptions (such as scale, location, tender context, etc.).
The report does not claim to be exhaustive, nor does it claim to cover all relevant products and specifications available on the market. While steps have been
taken to ensure accuracy, WRAP cannot accept responsibility or be held liable to any person for any loss or damage arising out of or in connection with this
information being inaccurate, incomplete or misleading. It is the responsibility of the potential user of a material or product to consult with the supplier or
manufacturer and ascertain whether a particular product will satisfy their specific requirements. The listing or featuring of a particular product or company does
not constitute an endorsement by WRAP and WRAP cannot guarantee the performance of individual products or materials. This material is copyrighted. It may be
reproduced free of charge subject to the material being accurate and not used in a misleading context. The source of the material must be identified and the
copyright status acknowledged. This material must not be used to endorse or used to suggest WRAP‟s and WWF-UK‟s endorsement of a commercial product or
service. For more detail, please refer to Terms & Conditions on their web sites: wrap.org.uk and wwf.org.uk.

WRAP and WWF working together for a world without waste 1
Executive summary
In 2009, WRAP (Waste & Resources Action Programme) identified that UK households dispose of 8.3 million
tonnes of food and drink waste every year, most of which could have been eaten. This avoidable food waste has
a value of at least £12 billion. However, financial cost is not the only impact. By wasting food, we also waste the
water and energy that was used to grow and process those foods, create greenhouse gas emissions, and have a
range of other environmental impacts.
The purpose of this report is to further raise awareness and to highlight the consequences on the UK and global
environments of the large amount of food wasted in the UK. One of the main objectives of this report is to
quantify the water and carbon footprints of household food waste in the UK, and to present the results in the
context of impacts across the supply chain. The report builds on work published by WWF-UK (Chapagain & Orr
2008) that quantified the water footprint of the UK. WRAP and WWF-UK have worked together to produce this
report which, for the first time, provides an estimate of the amount of water used within the UK and abroad in
food and drink which is subsequently wasted in the UK. In addition, it also analyses this information in the
context of water scarcity at production regions.
The water footprint of the UK calculates the amount of water used to produce goods and services consumed in
the UK, as the sum of direct (e.g. household water use) and indirect (water used along the supply chains of
goods and services) water. Previous research by WWF-UK (Chapagain & Orr 2008) has found this to be 102,000
million cubic metres of water per year. Our research has found that the water footprint of avoidable food waste is
6,200 million cubic metres per year representing nearly 6% of all our water requirements. In per capita terms,
this is 243 litres per person per day, approximately one and a half times the daily average household water use in
the UK. A quarter of this water footprint represents water used to grow and process food here in the UK, i.e.
water from the UK‟s rivers, lakes and aquifers.
It is estimated that avoidable food waste is responsible for greenhouse gas emissions of 20 million tonnes CO2
equivalent per year, accounting for the whole life cycle. Avoidable food waste represents approximately 3% of
the UK‟s domestic greenhouse gas emissions, with further emissions from overseas components of the supply
chain. In contrast to the water footprint, approximately two thirds of emissions associated with food waste occur
within the UK. These emissions are equivalent to those produced by over 7 million cars per year. The most
significant contributors to avoidable carbon emissions are milk waste, coffee waste and wheat products (bread,
cake etc.). The research also suggests that for some food and drink items, indirect emissions associated with
Land Use Change caused by levels of demand for those items are greater than direct emissions.
The impact of greenhouse gas emissions is global; in terms of climate change, it does not matter where they are
emitted. For water, knowing the location of the point of water use, and the relative scarcity of water resources in
that location, is essential to understanding the social and ecological impacts of our footprint. This report identifies
where in the world water is used to produce the part of the food being wasted in the UK and relates this to water
scarcity in these production regions, with case studies for two countries. Case studies are also presented for
foods for which waste has a high water footprint, and which are associated with supply chains reliant on areas
where water is scarce.
The study is limited to carbon and water footprints only and doesn‟t include other environmental impacts
associated with food production, consumption and waste. Nor does this report address issues relating to social
and economic costs and benefits with water use and carbon emissions.
The findings of this research highlight that actions to reduce food waste can have a significant impact on the
amount of water we use and the amount of greenhouse gases we emit. They reinforce the messages from WRAP
and WWF-UK on the importance of preventing food waste at all stages of the supply chain. By reducing food
waste, householders can save money and also make a significant contribution to addressing current
environmental concerns in the UK and abroad. Reducing food waste will not, by itself, solve all the problems of
climate change and poor water management, but it can make a positive contribution.

WRAP and WWF working together for a world without waste 2
Contents
1 Introduction ................................................................................................................................ 5 2 One Planet Food programme at WWF-UK .................................................................................. 6 3 WRAP and food waste ................................................................................................................ 6 4 Scope and objective .................................................................................................................... 7 5 Concept ....................................................................................................................................... 7
5.1 Association between food and drink waste and environmental impacts ..................................... 7 5.2 Water footprint ................................................................................................................... 8 5.3 Carbon footprint .................................................................................................................. 9 5.4 Land Use Change .............................................................................................................. 10
6 Data ........................................................................................................................................... 10 7 Results of water footprint accounting ..................................................................................... 10
7.1 Water footprint of food consumption in the UK .................................................................... 10 7.2 Water footprint of household food waste in the UK ............................................................... 11 7.3 External water footprint of household food waste in the UK .................................................. 14 7.4 Impacts of the UK‟s water footprint from household food waste ............................................ 16
8 Results of carbon footprint accounting.................................................................................... 18 8.1 Total carbon footprint of household food consumption in the UK ........................................... 18 8.2 Total carbon footprint of household food waste in the UK ..................................................... 18 8.3 Carbon footprint of the UK household food waste by source .................................................. 19
9 Case studies .............................................................................................................................. 20 9.1 Wheat .............................................................................................................................. 20 9.2 Tomato ............................................................................................................................ 22 9.3 Beef ................................................................................................................................. 23 9.4 Spain ............................................................................................................................... 24 9.5 Brazil ............................................................................................................................... 25
10 Discussion ................................................................................................................................. 26 11 Conclusion ................................................................................................................................. 28 Appendix 1: Household food waste in the UK ...................................................................................... 29 Appendix 2: Water footprint of household food waste by products ................................................... 33 Appendix 3: External water footprint of household food waste ......................................................... 35 Appendix 4: Carbon footprint of the UK’s household food waste ....................................................... 37 Appendix 5: Background on carbon footprint accounting ................................................................... 39 Appendix 6: Background on water footprint accounting ..................................................................... 42 References ............................................................................................................................................. 46

WRAP and WWF working together for a world without waste 3
Figures
FIGURE 1: SIMPLIFIED LIFE CYCLE DIAGRAM FOR FOOD......................................................................................................... 7 FIGURE 2: INTERNAL AND EXTERNAL WATER FOOTPRINT OF HOUSEHOLD FOOD WASTE OF CROP AND LIVESTOCK PRODUCTS ............ 12 FIGURE 3: TOTAL WATER FOOTPRINT OF HOUSEHOLD FOOD WASTE IN THE UK FOR MAJOR FOOD CATEGORIES. ............................ 13 FIGURE 4: THE UK’S EXTERNAL WATER FOOTPRINT OF HOUSEHOLD FOOD WASTE. .................................................................. 15 FIGURE 5: HOT-SPOTTING IMPACT LOCATIONS BASED ON HYDROLOGICAL ATTRIBUTES. ............................................................ 16 FIGURE 6: THE UK’S EXTERNAL WATER FOOTPRINT OF HOUSEHOLD FOOD WASTE VERSUS WATER STRESS. ................................... 17 FIGURE 7: CONTRIBUTION TO THE AVERAGE CARBON FOOTPRINT OF HOUSEHOLD FOOD AND DRINK WASTE USING TOP DOWN
APPROACH (TONNES CO2 EQ PER TONNE). ............................................................................................................... 18 FIGURE 8: TOTAL CARBON FOOTPRINT OF HOUSEHOLD FOOD WASTE IN THE UK FOR MAJOR FOOD CATEGORIES ............................ 19 FIGURE 9: CARBON FOOTPRINT OF AVOIDABLE AND POSSIBLY AVOIDABLE HOUSEHOLD FOOD AND DRINK WASTE IN THE UK FOR DIRECT
EMISSION AND EMISSIONS FROM LAND USE CHANGES. ............................................................................................... 20 FIGURE 10: WATER FOOTPRINT OF AVOIDABLE AND POSSIBLY AVOIDABLE HOUSEHOLD WASTE OF WHEAT PRODUCTS IN THE UK. .... 21 FIGURE 11: WATER FOOTPRINT OF AVOIDABLE AND POSSIBLY AVOIDABLE HOUSEHOLD WASTE OF TOMATO PRODUCTS. ................. 22 FIGURE 12: WATER FOOTPRINT OF THE UK’S HOUSEHOLD WASTE OF BEEF PRODUCTS. ............................................................ 24 FIGURE 13: SCHEMATIC TO CALCULATE THE VARIOUS COMPONENTS OF THE CARBON FOOTPRINT OF AN AGRICULTURAL PRODUCT. ... 39 FIGURE 14: THE VARIOUS COMPONENTS OF THE WATER FOOTPRINT OF AN AGRICULTURAL PRODUCT. ........................................ 43 FIGURE 15: MATRIX OF WATER FOOTPRINT ACCOUNTS ALONG THE VALUE CHAIN OF A PRODUCT. .............................................. 44 FIGURE 16: WATER FOOTPRINT AND WATER AVAILABILITY ALONG THE VALUE CHAIN OF A PRODUCT ........................................... 45
Tables
TABLE 1: SHARES OF HOUSEHOLD FOOD WASTE BASED ON ABILITY TO BE AVOIDED IN THE UK, MILLION TONNES PER YEAR .............. 10 TABLE 2: AGRICULTURAL WATER FOOTPRINT OF THE UK .................................................................................................... 11 TABLE 3: TOTAL WATER FOOTPRINT OF THE HOUSEHOLD FOOD WASTE IN THE UK. ................................................................. 11 TABLE 4: TOP 15 COUNTRIES IN THE LIST OF LARGEST EXTERNAL WATER FOOTPRINT OF THE HOUSEHOLD FOOD WASTE IN THE UK ... 14 TABLE 5: TOTAL CARBON FOOTPRINT OF THE HOUSEHOLD FOOD WASTE IN THE UK (‘000 TONNES PER YEAR). ............................. 19 TABLE 6: INDIRECT CARBON FOOTPRINT OF HOUSEHOLD FOOD WASTE IN THE UK ASSOCIATED WITH LAND USE CHANGE (‘000 T
CO2EQ/YR) ....................................................................................................................................................... 19 TABLE 7: TOTAL EXTERNAL WATER FOOTPRINT OF UK’S HOUSEHOLD WHEAT WASTE (‘000 M
3/YR). .......................................... 21
TABLE 8: TOTAL EXTERNAL WATER FOOTPRINT OF UK’S HOUSEHOLD TOMATO WASTE IN THE UK (‘000 M3/YEAR) ....................... 22
TABLE 9: TOTAL EXTERNAL WATER FOOTPRINT OF UK’S HOUSEHOLD BEEF PRODUCT WASTE IN THE UK (‘000 M3/YR). .................. 23
TABLE 10: TOTAL WATER FOOTPRINT IN SPAIN OF THE UK’S HOUSEHOLD FOOD WASTE. .......................................................... 25 TABLE 11: TOTAL WATER FOOTPRINT OF THE UK’S HOUSEHOLD FOOD WASTE IN BRAZIL .......................................................... 25 TABLE 12: CO2 EMISSION DATA, METRIC TONNES CO2 EQ ................................................................................................. 41
Acronyms
CF – Carbon footprint
Defra – Department for Environment, Food and Rural Affairs
DFID – Department for International Development
EA – Environment Agency, UK
EF – Ecological footprint
EWF – External water footprint
FAO – Food and Agriculture Organization of the United Nations, Rome
FCRN – Food Climate Research Network
GHG – Greenhouse gas
GWP – Global warming potential
ITC – International Trade Centre
IWF – Internal water footprint
LA – Local authority
OPF – One Planet Food Programme, WWF-UK

WRAP and WWF working together for a world without waste 4
SIWI - Stockholm International Water Institute
WBCSD – World Business Council for Sustainable Development
WF – Water footprint
WFN – Water Footprint Network
WRAP – Waste & Resources Action Programme, UK
WWF – World Wide Fund For Nature (Formerly World Wildlife Fund)
Acknowledgements
The authors would like to thank the following individuals and organisations for their assistance in developing this
report:
Thanks to Alistair Wyness (URS) for formally peer reviewing the draft report, as well as Jan Lundqvist (SIWI),
Tony Allan (King's College London and SOAS London) Dave Tickner, Conor Linstead, Stuart Bond, Duncan
Williamson and Mark Driscoll (WWF-UK), and Andrew Parry, Mark Barthel, Sarah Macnaughton and Peter Maddox
(WRAP) for reviewing and informing the report as it has progressed. Specific thanks to Tom Quested (WRAP) for
his invaluable help in providing data on food and drink waste arisings as well as further understanding of this
information.

WRAP and WWF working together for a world without waste 5
1 Introduction The 2010 Living Planet Report (WWF 2010) shows that we are consuming the earth‟s resources much faster
than they can be replenished and are destroying the very systems on which our food supply depends; some two
thirds of our ecosystems, including our forests, oceans, rivers and lakes, are in decline.
The food we buy accounts for 23% of our ecological footprint - a measure of our environmental impact on the
world (WWF 2010). However, not all of this food is consumed. The comprehensive WRAP report Household food
and drink waste in the UK (Quested & Johnson 2009) highlighted the importance of understanding the
connection between wastage rates and resources used in the production process of these goods. The report
classified household food waste in the UK based on avoidability (avoidable, possibly avoidable, unavoidable),
disposal routes and reasons for disposal. „Avoidable waste‟ is classified as the food and drink thrown away that
was, at some point prior to disposal, edible, e.g. milk, lettuce, fruit juice, meat (excluding bones, skin etc.).
„Possibly avoidable waste‟ is classified as the food and drink that some people eat and others do not, e.g. bread
crusts, or that can be eaten when a food is prepared in one way but not in another, e.g. potato skins.
„Unavoidable food waste‟ is classified as the waste arising from food and drink preparation that is not, and has
not been, edible under normal circumstances, e.g. meat bones, egg shells, pineapple skin, tea bags.
The WRAP report estimated that the total amount of food and drink waste generated by households in the UK is
8.3 million tonnes per year (Quested & Johnson 2009). The average UK household wastes around 22% of total
food and drink purchases, and the proportion of waste deemed avoidable or possibly avoidable prior to disposal
amounts to 81% of the total food and drink wasted. The report concludes that reducing the considerable amount
of household food and drink waste generated in the UK saves households money, while reducing our
environmental impact.
With the publication of WWF-UK‟s report on the water footprint of the food and fibre consumption in the UK and
its impact on global water resources (Chapagain & Orr 2008), quantification of water use by food consumption in
the UK became possible. The WWF report, for the first time, not only quantified but also mapped where in the
world water is being used to grow agricultural and industrial products consumed in the UK. The report contained
recommendations for businesses, government and individuals on how they could manage the impact of their
water footprint, one of the recommendations being the reduction of food waste.
Wasting food unnecessarily represents a direct waste of precious water resources, though to date there has been
little quantification of water associated with food waste (Lundqvist et al. 2008). Recent studies have been
undertaken quantifying the volume of water waste related to a single fruit industry (mango) in Australia (Ridoutt
et al. 2009) and beef, potatoes and tomatoes in the UK (Langley et al. 2010, Lewis 2010). In the United States it
has been reported that wasted calories account for about a quarter of the country‟s freshwater consumption (The
Economist 2009).
In addition to water, the UK food economy is also responsible for a significant quantity of greenhouse gas
emissions in the UK and abroad. Several studies have attempted to quantify the footprint of specific food and
drink products, but to date no research has been published on the national impacts of UK household food waste.
Given the fact that a large proportion of food is wasted, it is also relevant to assess the equivalent carbon
footprint of household food waste.
The quantification of water and carbon footprints of food and drink waste is potentially of interest to a range of
stakeholders such as consumers, food retailers, suppliers and producers, NGOs, environmental agencies, water
managemers, national and regional governments. The information can be used in a variety of contexts such as:
identifying foods with high and low environmental impacts;
identifying where to focus efforts to reduce the environmental impact of food production and to improve
management of natural resources;
understanding the way in which changes to the food supply chain can contribute to wider environmental policy objectives; and
supporting activity in preventing food waste.
WRAP and WWF-UK have therefore worked together to estimate the footprints of household food and drink waste
in the UK and analyse them in the context of water and environmental resources management.
It is important to recognise that food production is, in most parts of the world, an important economic activity
which provides benefits to many people. This is particularly the case in developing countries where agriculture is

WRAP and WWF working together for a world without waste 6
often the primary source of income for poor rural communities. Equally, mismanagement of natural resources
such as water can have adverse impacts on the poorest people. While acknowledging these issues, WRAP and
WWF-UK have not, in this report, sought to quantify them in relation to water and carbon footprints of food
waste. Any policy responses stimulated by the information in this report should also be informed by analyses of
the social and economic components of natural resource management.
2 One Planet Food programme at WWF-UK In January 2009, WWF-UK launched the One Planet Food programme (OPF). Its aim is to reduce the negative
environmental and social impacts of UK food consumption. It takes a holistic approach and impacts are analysed
across the whole food chain, from the production of commodities through processing and on to consumption and
disposal. This is a complex task, and since 2008 WWF-UK has been working in collaboration with scientists and
key actors in the food system – businesses, policy makers, consumer organisations and other non-governmental
organisations – to understand the impacts of the food consumed in the UK, whether grown here or imported from
abroad. The OPF engages with these various stakeholders to achieve three key goals - reducing greenhouse gas
emissions from food consumption in the UK, eliminating unsustainable impacts on freshwater ecosystems in
relation to water scarce areas, and changing trading patterns and governance structures so that UK food is
making a net positive contribution to ecosystems and the services they provide.
The OPF aims to reduce the negative environmental impacts of a number of key commodities (for example, fish,
soya, beef and palm oil) through the establishment of multi-stakeholder initiatives. At the same time it also
collaborates with others on some of the equally important consumption drivers including diets and food waste
(WWF-UK 2009). The programme runs a number of initiatives around WWF-UK‟s three key strategic priorities,
which are:
to work with the food business sector to assess business risk and to reduce negative impacts throughout the value chain;
to work with producers on a livestock dialogue programme; and
to work with government on issues such as sustainable diets.
The OPF programme supports and works collaboratively across the food system - as exemplified through its
Tasting the Future initiative (WWF-UK 2010).
3 WRAP and food waste Preventing food waste, and managing that which arises more effectively, are among WRAP‟s priorities. Food is a
significant proportion of household and business waste in the UK, accounting for 18% and 8% of waste arisings
respectively (Resource Futures 2009, Defra 2010b).
Households throw away more food and drink (8.3 million tonnes) each year than packaging (4.9 million tonnes).
Avoidable food waste adds around £600 to the average family annual grocery bill. WRAP‟s 2008-2011 business
plan aims to help reduce household food and drink waste by 250,000 tonnes, making a significant contribution to
both national efforts to reduce greenhouse gas emissions and diversion of biodegradable municipal waste from
landfill as required by the 1999 EU Landfill Directive.
The WRAP campaign „Love Food Hate Waste‟ (WRAP 2010a) aims to raise awareness of the amount of avoidable
food waste thrown away. It provides advice on how easy practical everyday actions in the home can help us all
waste less food, which will ultimately benefit our finances and the environment.
Success in delivering food waste reduction relies on the support of the whole grocery supply chain, local
government, regulatory bodies, education sectors and trade associations. WRAP brings partners together through
the Courtauld Commitment, a voluntary agreement aimed at improving resource efficiency and reducing the
carbon and wider environmental impacts of the grocery retail sector. The results of the first phase of the
Courtauld Commitment show that action by the UK grocery sector and WRAP, in partnership with local
authorities, helped consumers reduce food waste by 270,000 tonnes between 2007-08 and 2009-10 (WRAP
2010b), exceeding the Business Plan target. Courtauld Commitment 2, launched in 2010, includes a target to
reduce UK household food and drink waste by 4% by 2012 from a 2009 baseline (330,000 tonnes).

WRAP and WWF working together for a world without waste 7
4 Scope and objective The purpose of this report is to raise awareness of the wider impacts of food wasted in the UK, and to catalyse a
discussion on the implications of these and how best to address them. This is done, first, by quantifying the water
footprint of food waste and its potential impacts, especially in water scarce regions; then by linking water
footprint data with the greenhouse gas impacts of wasted food, accounting for the whole life cycle. The report
also identifies where in the world water is used to produce the part of the food being wasted in the UK.
The specific objectives of this study are to:
quantify the water footprint of the food wasted by UK households in total and by country of origin;
establish the linkages of wastage to locations where water resources are used and, in doing so, shed light on
potential impacts on freshwater ecosystems;
establish the carbon footprint of food waste by UK households in total and by item;
classify the footprints by waste categories such as avoidable food waste; and
present case studies for specific foodstuffs and specific locations.
The report does not attempt to paint a comprehensive picture of every environmental, social or economic impact
– positive and negative – of food production, consumption and waste.
5 Concept 5.1 Association between food and drink waste and environmental impacts All products, including food and drink, create environmental impacts throughout their lives. Figure 1 below
highlights the main stages in the life cycle of food and drink purchased by UK households. Although the diagram
only shows food waste arising from retail and households, in reality it may also arise at any point within the
supply chain.
The underlying hypothesis behind this report is that, if the food and drink were properly „managed‟ (i.e. better
decisions made during purchasing, storage, etc.), then wasted food and drink would not have had to be produced
and the environmental impacts from all stages of the supply chain would be reduced. In other words, the
resources employed to produce food and drink subsequently wasted would be available for other uses.
If water was not used to produce food that was subsequently wasted, it could have been used in other ways. For
example, it could be used to grow the same crop for alternative markets, a different crop, or to replenish aquifers
or water courses for subsequent extraction for drinking water or industrial applications.
In this study we have focused on the avoidable and possibly avoidable fraction of food waste only, as the impact
associated with unavoidable food waste is allocated to food that has not been wasted (e.g. banana skins from
bananas which have been eaten, tea bags used to make cups of tea), and from which unavoidable food waste is
a natural consequence.
Figure 1: Simplified life cycle diagram for food.
Transport
Household
Food waste Disposal
Processing
Transport
Agriculture
Composting
Seed
preparation
Retail

WRAP and WWF working together for a world without waste 8
5.2 Water footprint The concept of footprint has been used successfully to describe the impact of production and consumption. It is
most commonly applied to carbon, as in PAS2050 (BSI Group & Carbon Trust 2008) but recently it has been
applied to water as well.
The founding stone of water footprint (WF) is the concept of „virtual water‟. In the early 1990s, Prof. Tony Allan
coined the term „virtual water‟ in an attempt to analyse the food and water security in the Middle East and
Northern American countries (Allan 1996). It is defined as the volume of water required to produce a commodity
or service along its whole supply chain. In its initial form, virtual water was seen as a rational means by which
water-scarce countries could import water, embedded in goods, from water-abundant countries (Allan 2001).
The water footprint is an indicator of freshwater use that looks not only at the direct water use of a consumer or
producer, but also at the indirect water use (Hoekstra & Chapagain 2008). It is a comprehensive indicator of
freshwater resources appropriation, next to the traditional and restricted measure of water withdrawal (Hoekstra
et al. 2011). The water footprint of a product is defined as the volume of freshwater used to produce the product,
measured over the full supply chain. It shows water consumption volumes by source and polluted volumes by
type of pollution. All components of a total water footprint are specified both in time and space.
The water footprint of a product comprises three colour-coded components (Hoekstra et al. 2011), which are
green water (water evaporated from soil moisture supplemented by rainfall), blue water (water withdrawn from
ground or surface water sources) and grey water (the polluted volume of blue water returned after production). Of
these three components, the inclusion of green water is the most commonly debated. Whilst it is widely accepted
that blue water resources are limited and their exploitation can have obvious effects, green water is often seen as
water that could be exploited with limited adverse impacts on freshwater ecosystems. However, taking the use
of soil moisture as granted has immensely undervalued the importance of green water in managing water
resources wisely (Rockström 2001, Falkenmark 2003). Green water may also be scarce, and in the context of
food waste it represents a potentially significant opportunity cost; if it was not used to grow food that was
subsequently wasted, it could be used for an alternative crop which might have significant economic and/or
nutritional value. In agriculture, green water can be substituted for blue water and vice versa, so both must be
accounted for to obtain a full picture.
Food processing, whether it is simply washing prior to sale (e.g. carrots) or more complicated preparation (e.g.
preparing a pizza with multiple toppings) uses large quantities of water. This is normally blue water which, once
used, is generally discharged back to surface waters. Although most of this is „non-evaporative use‟, the returned
water is usually of a lower quality than the abstracted blue water, and additional blue water may be required to
dilute or assimilate emissions (pollution) to the freshwater ecosystem from the production process. In the
absence of accurate information on the assimilation capacity of freshwater ecosystems in the majority of places,
grey water footprint accounting can be quite difficult and controversial.
In this study the scope of the water footprint is limited to the agricultural production phase, which is the stage
with the largest water footprint in the whole supply chain (Figure 1). It is assumed that the quality of return flows
is just enough to meet local norms and standards, although this inevitably underestimates the grey water
footprints. In addition, the calculation does not include grey water footprints arising from other stages in the
whole life cycle of the food.
The water footprint offers a wider perspective on how a consumer or producer relates to freshwater ecosystems.
As argued by Hoekstra et al. (2011), it is not a measure of the severity of the local environmental impact of water
consumption and pollution. The local environmental impact of a certain amount of water consumption and
pollution depends on the vulnerability of the local water system and the attributes of water consumers and
polluters making use of the same system. Water footprint accounts give explicit information on how water is
appropriated for various human purposes for specific time and location. A water footprint can inform the
discussion about sustainable and equitable water use and allocation, and also form a good basis for a local
assessment of environmental, social and economic risks and impacts.
Agricultural production uses large amounts of water; for example, Chapagain and Hoekstra (2004) calculated
that, in the Netherlands, it requires 1,300,000 litres of water to produce a tonne of wheat and 15,500,000 litres
to produce a tonne of beef. The recent WWF report suggests that imported food and fibre account for 62% of the
UK's total water footprint (Chapagain & Orr 2008). In countries where water stress is less extreme, such as the
UK, the impact of water use is generally concentrated in certain areas (such as East Anglia) and is restricted to

WRAP and WWF working together for a world without waste 9
certain times of the year. Although water abstraction for agriculture is less than 1% of total blue water
abstraction in the UK, in some catchments and at peak times it can exceed abstraction for domestic water supply.
However, in countries where water stress is common, blue water abstraction can have much more severe
impacts. For detailed water footprint accounting and impact assessment please see Appendix 6.
5.3 Carbon footprint As with water footprint, carbon footprint accounting can be carried out at a variety of levels (e.g. national, per
person, product, service etc.). Despite the high level of interest in carbon footprinting, there is a surprising lack
of agreed definitions as to what a carbon footprint is. The Guide to PAS 2050 (BSI 2008) suggests that: “The
term „product carbon footprint‟ refers to the greenhouse gas emissions of a product across its life cycle, from raw
materials through production (or service provision), distribution, consumer use and disposal/ recycling. It includes
the greenhouse gases carbon dioxide (CO2), methane (CH4) and nitrous oxide (N2O), together with families of
gases including hydrofluorocarbons (HFCs) and perfluorocarbons (PFCs).”
In WWF‟s One Planet Economy Network Europe Project (OPEN: EU) an agreed definition of a Carbon Footprint
has been developed in conjunction with a range of organisations. Here WWF suggest that “Introduced in the
scientific and public arena almost ten years ago, the Carbon Footprint is a measure of the total amount of GHG
emissions that are directly and indirectly caused by an activity or are accumulated over the life stages of a
product. This includes activities of individuals, populations, governments, companies, organizations, processes,
industry sectors, etc. Products include goods and services. In any case, all direct (on-site, internal) and indirect
emissions (off-site, external, embodied, upstream, and downstream) need to be taken into account.”
As identified in this definition, climate change is influenced by a range of greenhouse gases. Each of these has a
different potential to increase atmospheric temperature. To enable them to be discussed in a common language,
characterisation factors are applied to the gases against a standard radiative effect (the act of emitting or causing
the emission of radiation). The characterisation model for climate change, as developed by the
Intergovernmental Panel on Climate Change (IPCC), contains a series of internationally recognised
characterisation factors. Factors are expressed as global warming potential (GWP) for a time horizon of 100
years (GWP100), in kg carbon dioxide equivalent (CO2 eq)/kg emission. For a calculation of lifetimes and a full
list of greenhouse gases and their global warming potentials please refer to (Solomon et al. 2007).
Greenhouse gas emissions arise at every point in the life of a product. Emissions may be direct (from animals,
fertiliser application, fuel use) or indirect (e.g. from electricity generation). In this study all stages shown in
Figure 1 have been considered in estimating the carbon footprint of food waste. The approach taken is to view
emissions from a consumption perspective. This means that emissions associated with cultivating and
transporting food destined for the UK but grown elsewhere are included, and in turn a proportion of emissions
from UK agriculture are allocated to food exported from the UK, so not included herein. Several studies have
highlighted that imports of all goods account for around a third of the UK / European greenhouse gas emissions
from a consumption perspective (Wiedmann et al. 2008, Davis & Caldeira 2010, Brinkley & Less 2010). This
approach is in line with the approach taken in water footprint accounting within this report.
Unlike a water footprint, there are no local or regional interpretations of the impact of carbon emissions; a
kilogram of carbon dioxide emitted in one country contributes to climate change in the same way as a kilogram
emitted elsewhere (Forster et al. 2007).
Carbon footprinting may be used in a variety of ways. It may be used in auditing the environmental impacts of a
nation, company, individual or product; setting targets to reduce emissions; public reporting; and awareness
raising. In this document, the objective is to raise awareness of the total carbon footprint of food waste and the
current understanding of where most emissions occur.
As well as data gaps for processed food, we have assumed that the greenhouse gas emissions associated with
growing the same crop in different countries remains constant. This is a significant limitation, as from studies by
Mila i Canals et al. (2007) and others, it is known that the emissions associated with growing a foodstuff vary by
season and location. For example, tomatoes grown in heated greenhouses in the UK will have a very different
emissions profile to those grown outdoors in Spain. The use of single figures in this analysis does not allow for
illustration of the varying emissions associated with wasting food at different times of the year or from different
sources. There are a range of data gaps for different food products at present. In the short to medium term we
anticipate that this will be filled through a wider adoption of product carbon footprinting using PAS 2050, the
WRI/WBCSD GHG Protocol and the upcoming ISO Standard on product carbon footprinting. For details on carbon
footprint accounting and impact assessment please see Appendix 5.

WRAP and WWF working together for a world without waste 10
5.4 Land Use Change Land Use Change is responsible for 18% of global greenhouse gas emissions, principally from deforestation
(Herzog 2009). The FAO (2007) estimate that 58% of deforestation is due to commercial agriculture Land Use
Change. Conventionally, when considering emissions from Land Use Change, accounting methods ascribe these
to the products grown on the land recently converted to agriculture. However, if we consider the whole system, it
is the level of demand for a product which drives expansion in agricultural land. In 2009 FCRN (Food Climate
Research Network) and WWF published How Low Can We Go?, a study which quantified the emissions associated
with Land Use Change attributable to UK demand for food stuffs (Audsley et al. 2010). The study estimated that
87 million tonnes CO2 equivalent can be attributed to deforestation related to the UK food economy and provides
figures for a variety of foods.
These figures have been used to report separately on Land Use Change impacts. It should be further noted that
estimates of CO2 eq from Land Use Change are still subject to large uncertainties. The IPCC 4th Assessment
Report cites error ranges of up to ±2,933 million tonnes CO2 at the global level in the 1990s (Forster et al. 2007).
6 Data Household food waste data were taken from WRAP (Quested & Johnson 2009). A short summary of the
household food waste, split by ability to avoid, is presented in Table 1. The full list of products selected for the
study is presented in Appendix 1. In this study we have focused on the avoidable and possibly avoidable part of
the food waste only. The unavoidable part in the table is presented as additional information for comparison
among different categories of household food waste.
Table 1: Shares of household food waste based on ability to be avoided in the UK, million tonnes per year.
Categories Avoidable Possibly avoidable Unavoidable Total
Food 4.5 1.5 1.1 7.1
Drink 0.8 0.0 0.4 1.2
Total 5.3 1.5 1.5 8.3
Source: WRAP (Quested & Johnson 2009).
The production statistics are taken from FAO (FAOSTAT data 2008), international trade data are retrieved from
International Trade Centre (ITC 2006, ITC 2009), and the water resources withdrawal data are taken from FAO
(2003a, 2003b). The virtual water content data for agricultural products are taken from Chapagain and Hoekstra
(2004). The various sources of other data on climate, crop coefficients and crop periods which are used in the
calculations of water footprint are listed in volume 2 of the WWF-UK report (Chapagain & Orr 2008). Based on
primary ingredient, the virtual water flow results are re-grouped to match with the list of household waste
products in the WRAP database. Data on carbon has been drawn from various sources as listed in Appendix 6.
As the report is based on data retrieved from a variety of sources, it is inevitable that any errors in these sources
can influence the result of this analysis. Every effort has been made to cross check these data sources with
various other independent sources, and the selection of datasets used in this study is made based on the scope
and the degree of precision achievable within the scope and limitations of this study.
7 Results of water footprint accounting 7.1 Water footprint of food consumption in the UK Of the total UK water footprint of 102 billion cubic metres per year, agricultural products comprise 70 billion cubic
metres per year (Chapagain & Orr 2008), excluding the water footprint of cotton textiles, which is a further 5
billion cubic metres per year. The UK‟s per capita average water footprint of agricultural products (excluding
cotton textiles) is 708 cubic metres per person per year, equivalent to 3,190 litres per person per day.
Of the water footprint of agricultural products, 38% relates to water use in the UK (internal water footprint) and
62% abroad (external water footprint), as shown in Table 2. The top 12 countries in the list of the UK‟s external
agricultural water footprint are Brazil, France, Ireland, Ghana, India, The Netherlands, Ivory Coast, Denmark,
Indonesia, Spain, Germany and the USA. The top products making the external water footprint of the UK are
cocoa, bovine products, cotton, swine, palm oil, soybeans, coffee, miscellaneous livestock products, milk, maize,
rice and wheat (Chapagain & Orr 2008).

WRAP and WWF working together for a world without waste 11
Table 2: Agricultural water footprint of the UK.
Crop products
(million m3 per year)
Livestock products
(million m3 per year)
Total
(million m3 per year)
Share
to the
total
Internal water footprint
12,500 16,100 28,600 40%
External water footprint
28,600 13,100 41,800 60%
Total agricultural water footprint
41,100 29,200 70,400 100%
58% 42%
Note: The total agricultural water footprint of the UK in this table excludes the water footprint related to cotton
textiles, adapted from Chapagain and Orr (2008).
7.2 Water footprint of household food waste in the UK The total water footprint of food waste in UK households is 6,262 million cubic metres per year, of which 5,368
million cubic metres per year is attributed to avoidable food waste, and a further 894 million cubic metres to
possibly avoidable waste. These figures represent 5% and 1% of the UK‟s total food water footprint respectively.
In per capita terms, the water footprint of total avoidable and possibly avoidable household food waste in the UK
is 284 litres per person per day. By comparison, the daily average household water use in the UK (i.e. water from
the tap) is about 150 litres per person per day(Defra 2008b). Out of the total household food waste, 243 litres
per person per day (86%) is completely avoidable and the remainder is possibly avoidable (Table 3).
A large part (71%) of the avoidable food waste in the UK is from imported products. Please note that the table
doesn‟t show the water footprint of unavoidable food waste, as this will be counted towards water footprint of
actual food consumption. The rationale for this is that unavoidable waste (e.g. banana skins, bones) is an integral
part of the food consumption.
The share of the UK‟s External WF (EWF) for agricultural products (excluding textiles) is about 60% (Table 2),
whereas the EWF of household food waste is 71% (Table 3). It shows that the imported food products are more
water intensive (cubic metres per tonne) compared to the products from the UK itself.
Table 3: Total water footprint of the household food waste in the UK.
Avoidable
(million m3 per year)
Possibly avoidable
(million m3 per year)
Total
(million m3 per year) Internal water footprint
1,473 339 1,812 29%
External water footprint
3,895 555 4,450 71%
Total water footprint 5,368 894 6,262 100%
86% 14% 100%
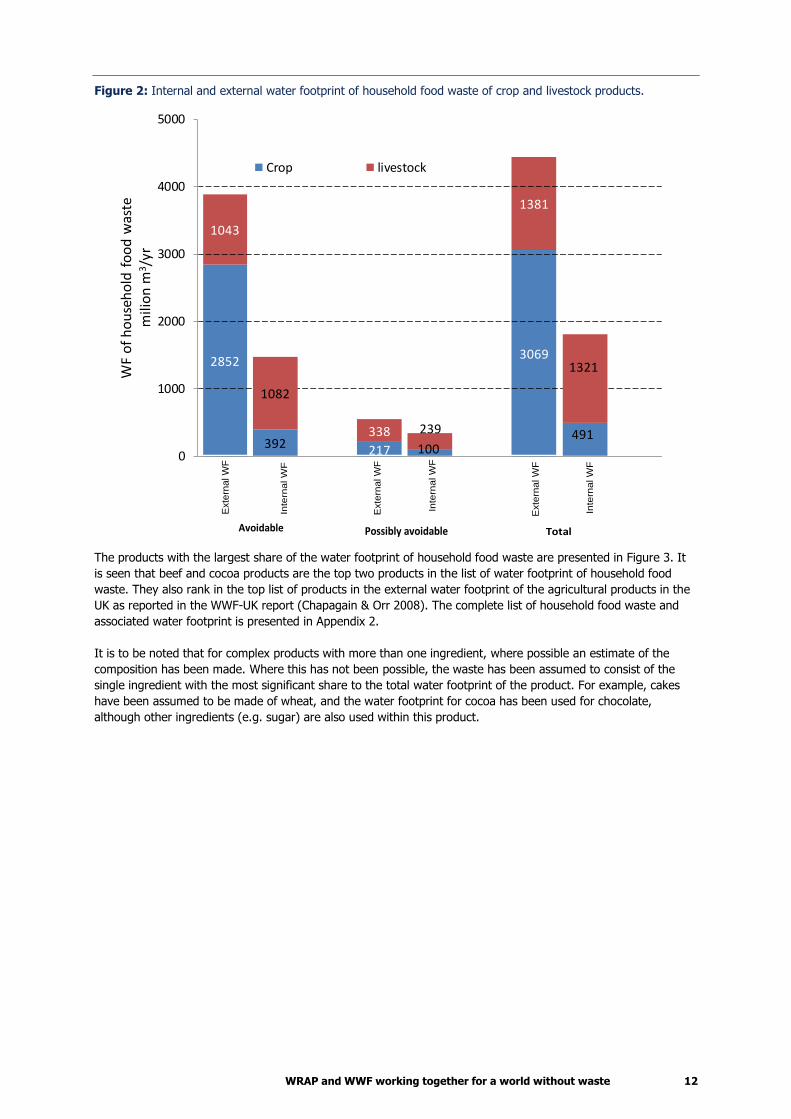
Though the total food waste by quantity is about 22% by weight, it is only 14% in terms of equivalent water
footprint. This is because the wasted food has relatively low water content per tonne of products. The Internal
Water Footprint (IWF) of wasted food is relatively bigger for livestock products (i.e. meat and dairy) compared to
that for crop products. However, for imported products, it is the crop product component which has higher EWF
(Figure 2).
WRAP and WWF working together for a world without waste 12
Figure 2: Internal and external water footprint of household food waste of crop and livestock products.
2852
217
3069
1043
338
1381
0
1000
2000
3000
4000
5000
Crop livestock
392 100491
1082
239
1321
0
1000
2000
3000
4000
5000W
F o
f h
ou
seh
old
fo
od
was
tem
ilio
n m
3/y
r
WF of household food waste in the UK
Inte
rna
l W
F
Inte
rna
l W
F
Inte
rna
l W
F
Exte
rna
l W
F
Exte
rna
l W
F
Exte
rna
l W
FAvoidable Possibly avoidable Total
The products with the largest share of the water footprint of household food waste are presented in Figure 3. It
is seen that beef and cocoa products are the top two products in the list of water footprint of household food
waste. They also rank in the top list of products in the external water footprint of the agricultural products in the
UK as reported in the WWF-UK report (Chapagain & Orr 2008). The complete list of household food waste and
associated water footprint is presented in Appendix 2.
It is to be noted that for complex products with more than one ingredient, where possible an estimate of the
composition has been made. Where this has not been possible, the waste has been assumed to consist of the
single ingredient with the most significant share to the total water footprint of the product. For example, cakes
have been assumed to be made of wheat, and the water footprint for cocoa has been used for chocolate,
although other ingredients (e.g. sugar) are also used within this product.

WRAP and WWF working together for a world without waste 13
Figure 3: Total water footprint of household food waste in the UK for major food categories.
Avoidable WF 5368 Mm3/yr
Possibly avoidable WF 894 Mm3/yr
Total WF 6262 Mm3/yr

WRAP and WWF working together for a world without waste 14
7.3 External water footprint of household food waste in the UK The locations where the UK has the highest water footprints related to household food waste are presented in
Table 4. A complete list of these locations and the size of the UK‟s water footprint is presented in Appendix 3.
Although Ghana, Brazil and the Ivory Coast feature at or near the top of the list of External Water Footprints, it is
important to note that the products originating in these locations are mainly rain fed, and so exert limited
pressure on blue water resources in these locations.
Table 4: Top 15 countries in the list of largest external water footprint of the household food waste in the UK.
Locations EWF (million m3/year) Top products and EWF (million
m3/year) Avoidable Possibly
avoidable
Total
Ghana 423 0 423 Cocoa beans 413, Coffee 5, Bananas 4, Pineapples
1
Brazil 271 64 336 Beef 148, Coffee 89, Poultry 47, Livestock others
35, Cocoa beans 5
India 263 22 284 Rice 165, Pepper 54, Beans dry 30, Oilseeds
others 18, Coffee 5
Ireland 175 71 246 Beef 177, Poultry 27, Pork 26, Livestock others
12, Wheat 1
Netherlands 168 50 218 Pork 92, Poultry 74, Livestock others 24, Beef 15,
Vegetables fresh others 6
Thailand 176 21 197 Rice 109, Poultry 62, Livestock others 14, Citrus
fruit others 6, Vegetables fresh others 3
Ivory Coast 171 2 173 Cocoa beans 148, Coffee 16, Bananas 4, Stone
fruit 2, Oilseeds others 2
France 129 38 166 Poultry 43, Pork 25, Wheat 25, Maize 13,
Livestock others 13
Denmark 128 29 156 Pork 131, Poultry 10, Livestock others 9, Beef 3,
Wheat 1
USA 128 7 135 Rice 55, Beans dry 49, Wheat 12, Apples 4, Stone
fruit others fresh 3
Italy 102 15 118 Rice 37, Beef 19, Livestock others 12, Citrus fruit
others 8, Wheat 7
Pakistan 114 0 115 Rice 111, Beans dry 3, Fruit fresh others 1
Nigeria 113 0 114 Cocoa beans 113
Spain 87 17 104 Rice 22, Pork 8, Poultry 8, Beef 8, Fruit fresh
others 6
Canada 88 10 98 Wheat 71, Beans dry 26, Beef 1
Others 1,359 207 1,565
Total 3,895 555 4,450
A complete map of the water footprint of UK‟s household food waste is presented in Figure 4.

WRAP and WWF working together for a world without waste 15
Figure 4: The UK‟s external water footprint of household food waste.
Water footprint of household
food waste in the UK
Million m3/yr

WRAP and WWF working together for a world without waste 16
7.4 Impacts of the UK‟s water footprint from household food waste Impact assessments of these water footprints were conducted using hydrological attributes of regions where
water is used in food cultivation and processing. Water stress in these locations is calculated as the ratio of actual
blue water withdrawal to the net blue water available after taking into account environmental flow requirements.
Following the scheme of impact categorisation suggested in WWF-UK (Chapagain & Orr 2008), the various
countries are then grouped based on the severity of the impacts using the schematic presented in Figure 5.
Figure 5: Hot-spotting impact locations based on hydrological attributes.
Exte
rna
l w
ate
r fo
otp
rin
t o
f th
e U
K
Group A
Countries where
— High external water footprint of the UK
— Low water withdrawal per unit available
Group B
Countries where
— Low external water footprint of the UK
— Low water withdrawal per unit available
Group D
Countries where
— High external water footprint of the UK
— High water withdrawal per unit available
Group C
Countries where
— Low external water footprint of the UK
— High water withdrawal per unit available
Water withdrawalWater stress =
Actual renewable water resources Environmental flow requirement
A shortcoming of this approach is that it doesn‟t take into account green water availability in these locations, nor
the impact of grey water. Thus, calculations of stress on hydrology, based only on the blue water availability in
these locations, are incomplete.
The results are presented in Figure 6. Egypt, Israel, Pakistan, India, Thailand and Spain are examples of countries
falling in the Group D, where water stress is very high and the external water footprint of the UK‟s household
food waste is also high. In contrast, countries falling in Group B have relatively lower water stress and the water
footprint of UK household food waste in these countries is relatively low. Although Ghana and Brazil, both in
Group A, support a large part of the external water footprint of household food waste in the UK, water stress in
these countries is low.
In section 9, short case studies are set out of two countries, Spain and Brazil, to illustrate Groups D and A
respectively.

WRAP and WWF working together for a world without waste 17
Figure 6: The UK‟s external water footprint of household food waste versus water stress.

WRAP and WWF working together for a world without waste 18
8 Results of carbon footprint accounting 8.1 Total carbon footprint of household food consumption in the UK WRAP estimates that the total carbon footprint of food and drink consumed in the UK is 130 million tonnes CO2
eq per year. This is approximately equivalent to a fifth of UK territorial emissions, or 2 tonnes of CO2 eq per
person per year. Excluding emissions from wasted items, the average impact of a tonne of food and drink
purchased is 3.4 tonnes CO2 eq, rising to 3.8 tonnes CO2 eq per tonne of food alone.
8.2 Total carbon footprint of household food waste in the UK This report uses two approaches to quantify the carbon footprint of food waste. The first of these is a top down
approach, described in Appendix 5, attributing emissions from each life cycle stage to food and drink
subsequently wasted. Using this approach, the total carbon footprint of the UK‟s household food and drink waste
is 25.7 million tonnes CO2 eq, of which 20 million tonnes CO2 eq is associated with avoidable waste.
Secondly, the carbon footprint of household food and drink waste has been constructed from the bottom up, to
allow allocation of emissions to country of origin. Due to data gaps for specific foods, it should be noted that the
carbon emissions attributed to specific foods do not add up to the top down average. For example, no specific
farm emission data was identified for approximately 10% of avoidable food waste by weight, and 20% of possibly
avoidable food waste. No data to allocate specific emissions from regional distribution centres was identified for
6% of avoidable food waste by weight, and 20% of possibly avoidable food waste. Where food waste has not
been identifiable, the carbon emissions associated with this have not been allocated to any specific country.
Figure 7: Contribution to the average carbon footprint of household food and drink waste using top down
approach (tonnes CO2 eq per tonne).
1.22
0.08
1.090.17
0.48
0.42
0.13
-0.18
0.41
Agriculture
Fertiliser Manufacture
Food Manufacturing
Packaging
Transport (incl overseas)
Home Related
Retail
Food exports
Waste
The top down results suggest that, on average, approximately one quarter of the impact of food is associated
with growing / rearing the crops and animals which enter the food chain, one quarter is associated with food
processing, and one eighth is associated with home related impacts (e.g. cooking). Waste management and
degradation accounts for one tenth of emissions. This is illustrated in Figure 7.
The specific breakdown varies by food type, and this is discussed further in the case studies presented below.

WRAP and WWF working together for a world without waste 19
8.3 Carbon footprint of the UK household food waste by source Out of the total carbon footprint of the UK‟s household waste of food and drink, 78% is related to waste under
the „avoidable‟ category and 22% under the „possibly avoidable‟ category (Table 5). The average carbon footprint
of avoidable household food waste is 330kg CO2 eq per person per year. This is equivalent to approximately one
third of the emissions of CO2 (rather than CO2 eq) associated with household electricity use per person in the UK
(DECC 2010).
Table 5: Total carbon footprint of the household food waste in the UK („000 tonnes per year).
Avoidable
waste Possibly avoidable
waste Total
Internal emissions 14,002 3,223 17,225
External emissions 6,138 696 6,834
Unattributed emissions 1,658 1,658
Total carbon footprint 20,140 5,577 25,717
The products with the greatest share in the carbon footprint of household food waste are presented in Figure 8.
Data limitations mean that few processed foods were able to be identified, and subsequently limited emissions
have been attributed to these. The complete list of household food waste and associated carbon footprint is
presented in Appendix 4.
Figure 8: Total carbon footprint of household food waste in the UK for major food categories.
In addition to the direct emissions associated with the life cycle of food, we also estimate that avoidable food
waste generated in the UK is responsible for emissions associated with Land Use Change totalling 7.6 million
tonnes CO2 eq per annum, as shown in Table 6 below. The main contributors are shown in Figure 9.
Table 6: Indirect carbon footprint of household food waste in the UK associated with Land Use Change („000 t
CO2eq/yr).
Avoidable Possibly avoidable Total
Total 6,092 1,538 7,630

WRAP and WWF working together for a world without waste 20
The impact has not been split by external and internal Land Use Change. All figures used to calculate Land Use
Change are global averages, rather than nation-specific. As such they are not necessarily representative of
emissions arising within the UK as a consequence of Land Use Change.
Figure 9: Carbon footprint of avoidable and possibly avoidable household food and drink waste in the UK for
direct emission and emissions from Land Use Changes.
Inclusion of emissions associated with Land Use Change would increase the average carbon footprint of avoidable
food and drink waste by approximately one fifth. As a proportion of Land Use Change emissions associated with
UK consumption of agricultural products it is 7%. Further discussion of the impact of Land Use Change is
contained in the case studies, conclusions and recommendations of this report.
9 Case studies In recent years there has been an increase in the UK‟s fruit and vegetable consumption even as production of
these crops in the UK is decreasing (FAOSTAT data 2010). Major increases in agricultural product flows from the
Mediterranean region, South Africa, South America, and elsewhere have made up the difference. To illustrate the
connection between use of natural resources overseas with household food waste in the UK, case studies are set
out below of three food products (wheat, tomato and beef) and two producing regions (Spain and Brazil).
9.1 Wheat The water footprint of wheat consumption (e.g. bread, cakes) in the UK is 7,483 million cubic metres per year
(Chapagain and Orr 2008). The water footprint of household waste of wheat products in the UK is equal to 143
million cubic metres per year (2% of total UK wheat water footprint), all of which is classed as avoidable. The
major regions where the UK‟s water footprint from household waste of wheat products falls are presented in
Table 7. As wheat is mostly rainfed in the UK, the impact on blue water resources in the UK is negligible.
However, this does vary by region. The Environment Agency (2008) note that although farmers use less than 1%
of the total amount of water abstracted in England and Wales for spray irrigation, this can reach 20% in East
Anglia, and that on occasion more water is used on a hot dry day for spray irrigation than for public water supply.
Nearly all of this water is lost by evaporation and can therefore represent a significant contributor to the internal
water footprint of wheat production.

WRAP and WWF working together for a world without waste 21
Table 7: Total external water footprint of UK‟s household wheat waste („000 m3/yr).
Avoidable Possibly avoidable Total ‘000m3/yr
Share of external water footprint of wheat waste
Canada 61,581 9,177 70,759 50%
France 22,018 3,281 25,300 18%
USA 10,739 1,600 12,340 9%
Germany 10,673 1,591 12,264 9%
Italy 6,131 914 7,045 5%
Russia 2,386 356 2,742 2%
Belgium 1,250 186 1,437 1%
Denmark 1,103 164 1,267 1%
Others 8,517 1,269 9,786 7%
Total 124,399 18,539 142,938
The EWF of waste of wheat products in the UK is presented in Figure 10. The darker the area, the larger is the
EWF of UK‟s household wheat waste in these areas. Note that what wheat is rainfed in some of these regions and
irrigated in others.
Figure 10: Water footprint of avoidable and possibly avoidable household waste of wheat products in the UK.
Water footprint of household
waste of wheat products in the UK
‘000 m3/yr
The carbon footprint of household waste of wheat products in the UK is 1,556,000 tonnes CO2 eq per year. The
internal part of the total carbon footprint is 1,448,000 tonnes CO2 eq per year and the rest is due to activities at
external locations. Almost 87% of the carbon footprint is composed of avoidable food waste, rather than possibly
avoidable food waste. The greatest contribution to the footprint is made by emissions from agriculture and
processing (e.g. into bread, cakes and pastries). Packaging (transit and primary) accounts for approximately 10%
of the carbon footprint of the product, and the emissions from waste management is the next most significant
source.
WRAP and WWF working together for a world without waste 22
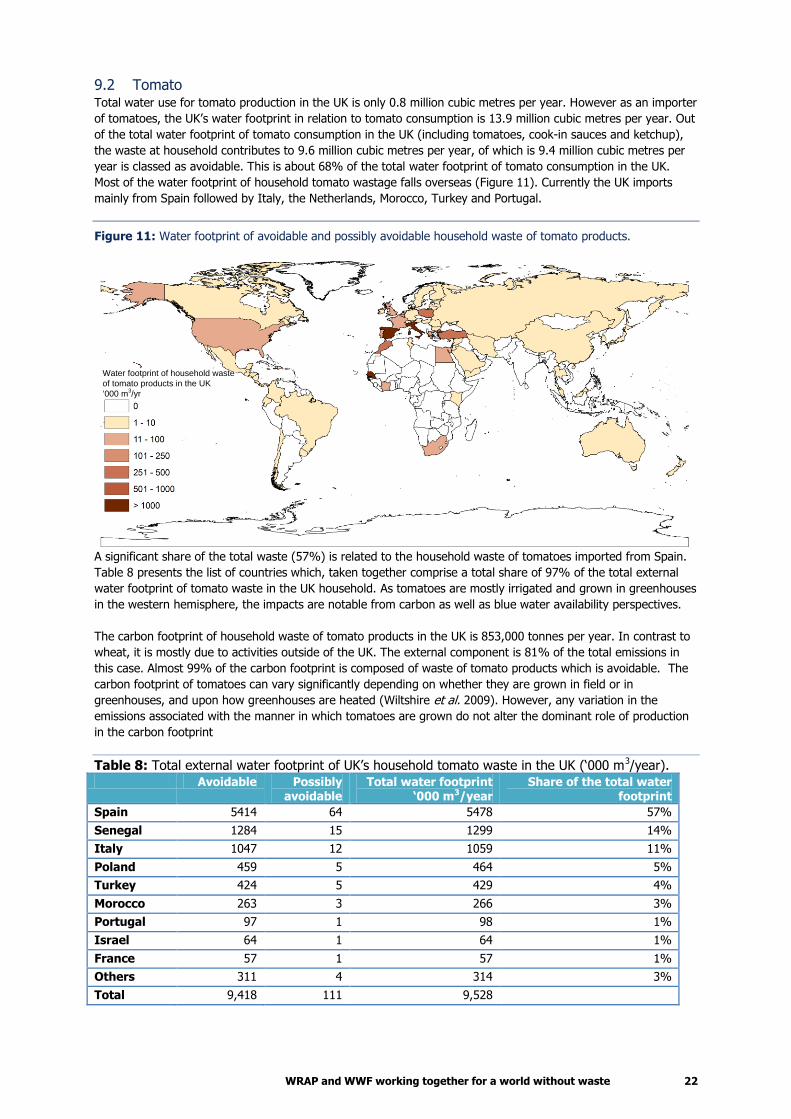
9.2 Tomato Total water use for tomato production in the UK is only 0.8 million cubic metres per year. However as an importer
of tomatoes, the UK‟s water footprint in relation to tomato consumption is 13.9 million cubic metres per year. Out
of the total water footprint of tomato consumption in the UK (including tomatoes, cook-in sauces and ketchup),
the waste at household contributes to 9.6 million cubic metres per year, of which is 9.4 million cubic metres per
year is classed as avoidable. This is about 68% of the total water footprint of tomato consumption in the UK.
Most of the water footprint of household tomato wastage falls overseas (Figure 11). Currently the UK imports
mainly from Spain followed by Italy, the Netherlands, Morocco, Turkey and Portugal.
Figure 11: Water footprint of avoidable and possibly avoidable household waste of tomato products.
Water footprint of household waste
of tomato products in the UK
‘000 m3/yr
A significant share of the total waste (57%) is related to the household waste of tomatoes imported from Spain.
Table 8 presents the list of countries which, taken together comprise a total share of 97% of the total external
water footprint of tomato waste in the UK household. As tomatoes are mostly irrigated and grown in greenhouses
in the western hemisphere, the impacts are notable from carbon as well as blue water availability perspectives.
The carbon footprint of household waste of tomato products in the UK is 853,000 tonnes per year. In contrast to
wheat, it is mostly due to activities outside of the UK. The external component is 81% of the total emissions in
this case. Almost 99% of the carbon footprint is composed of waste of tomato products which is avoidable. The
carbon footprint of tomatoes can vary significantly depending on whether they are grown in field or in
greenhouses, and upon how greenhouses are heated (Wiltshire et al. 2009). However, any variation in the
emissions associated with the manner in which tomatoes are grown do not alter the dominant role of production
in the carbon footprint
Table 8: Total external water footprint of UK‟s household tomato waste in the UK („000 m3/year).
Avoidable Possibly avoidable
Total water footprint ‘000 m3/year
Share of the total water footprint
Spain 5414 64 5478 57%
Senegal 1284 15 1299 14%
Italy 1047 12 1059 11%
Poland 459 5 464 5%
Turkey 424 5 429 4%
Morocco 263 3 266 3%
Portugal 97 1 98 1%
Israel 64 1 64 1%
France 57 1 57 1%
Others 311 4 314 3%
Total 9,418 111 9,528
WRAP and WWF working together for a world without waste 23
A recent study (Chapagain & Orr 2009) shows that the EU consumes 955,000 tonnes of Spanish fresh tomatoes
annually, which evaporates 71 million cubic metres of water per year and would require a further 7 million cubic
metres of water per year to dilute leached nitrates in Spain. The main tomato producing regions in Spain are in
the Ebro valley (Navarra, Rioja, and Zaragoza) and Guadiana valley (Extremadura), and in the south-east
catchments of the Júcar, Segura and Sur (Valencia, Alicante, Murcia, Almería) and Canary Islands. The majority
of fresh tomato imports to the UK originate from the southern Spanish mainland and the Canary Islands. These
sites are among the most significant in Spain in terms of water stress. Other than water consumption, the main
environmental issues associated with tomato cultivation are water pollution, soil pollution and erosion, with
habitat loss from expanding cultivation in some areas. The over-exploitation of aquifers from horticulture exports
has affected water quantity and quality, including water salinisation and declining water tables, with additional
loss of biodiversity, ecological value and landscape amenity across the Mediterranean area (Martínez-Fernández &
Selma 2004). Current water use, in Almeria for example, is around 4-5 times more than annual rainfall and is
mainly obtained from deep wells with high salinity of water, limiting the possibilities for water reuse. Almeria also
has the largest poly-tunnel concentration in the world, with around 40,000ha of greenhouse crops grown
predominantly under flat-roof greenhouses. Ensuring sustainable, equitable and productive use of water
resources in these regions presents a challenge to all companies and organisations with a stake in these fresh
produce supply chains.
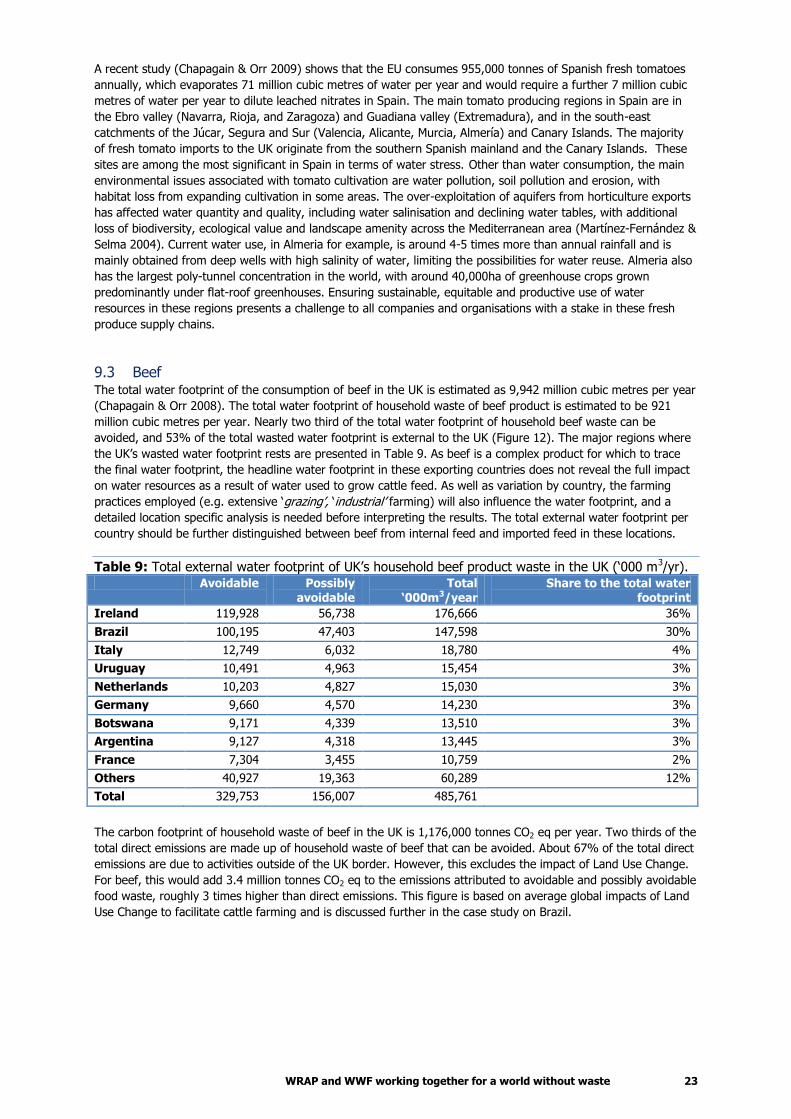
9.3 Beef The total water footprint of the consumption of beef in the UK is estimated as 9,942 million cubic metres per year
(Chapagain & Orr 2008). The total water footprint of household waste of beef product is estimated to be 921
million cubic metres per year. Nearly two third of the total water footprint of household beef waste can be
avoided, and 53% of the total wasted water footprint is external to the UK (Figure 12). The major regions where
the UK‟s wasted water footprint rests are presented in Table 9. As beef is a complex product for which to trace
the final water footprint, the headline water footprint in these exporting countries does not reveal the full impact
on water resources as a result of water used to grow cattle feed. As well as variation by country, the farming
practices employed (e.g. extensive „grazing‟, „industrial‟ farming) will also influence the water footprint, and a
detailed location specific analysis is needed before interpreting the results. The total external water footprint per
country should be further distinguished between beef from internal feed and imported feed in these locations.
Table 9: Total external water footprint of UK‟s household beef product waste in the UK („000 m3/yr). Avoidable Possibly
avoidable Total
‘000m3/year Share to the total water
footprint
Ireland 119,928 56,738 176,666 36%
Brazil 100,195 47,403 147,598 30%
Italy 12,749 6,032 18,780 4%
Uruguay 10,491 4,963 15,454 3%
Netherlands 10,203 4,827 15,030 3%
Germany 9,660 4,570 14,230 3%
Botswana 9,171 4,339 13,510 3%
Argentina 9,127 4,318 13,445 3%
France 7,304 3,455 10,759 2%
Others 40,927 19,363 60,289 12%
Total 329,753 156,007 485,761
The carbon footprint of household waste of beef in the UK is 1,176,000 tonnes CO2 eq per year. Two thirds of the
total direct emissions are made up of household waste of beef that can be avoided. About 67% of the total direct
emissions are due to activities outside of the UK border. However, this excludes the impact of Land Use Change.
For beef, this would add 3.4 million tonnes CO2 eq to the emissions attributed to avoidable and possibly avoidable
food waste, roughly 3 times higher than direct emissions. This figure is based on average global impacts of Land
Use Change to facilitate cattle farming and is discussed further in the case study on Brazil.
●

WRAP and WWF working together for a world without waste 24
Figure 12: Water footprint of the UK‟s household waste of beef products.
Water footprint of household
waste of beef in the UK
‘000 m3/yr
9.4 Spain Spain uses more than 70% of its water for irrigated agriculture. The main regions of Spain with some of the most
pressing issues in the country in terms of their use and management of water are Almeria, Murcia and Barcelona.
In the Almeria rising water demands have resulted in over abstraction of many of the province‟s aquifers (in some
cases withdrawals exceeding recharge by 250%) leading to significant water deficits and increasing salinisation.
Murcia has undergone a resort-building boom, even as many of its farmers have switched to more thirsty crops
which have put new pressures on the land and on Murcia‟s dwindling supply of water. There is a considerable
shortage of household water supplies in Barcelona, prompting a national debate about poor planning and failed
governance. There are efforts to supply drinking water with tanker deliveries to homes in dry seasons.
The Spanish Government has introduced a national water plan, „Programa Agua‟ calling for an increase in
desalination plants. Desalination, while it may address immediate water shortages, may contribute to other
environmental problems including through energy use and greenhouse gas emissions, and through marine
ecosystem impacts from hyper-saline waste flows (Chapagain & Orr 2008). The most water-intensive products
exported from Spain to the UK are olives, grapes, oranges, rice, and swine and bovine products (Chapagain & Orr
2008). While imports from Spain represent a small proportion of the UK‟s total water footprint, the impacts which
arise on Spanish water resources are significant, contributing to increased competition for water resources,
particularly where agricultural and tourism areas overlap.
Spain provides about 104 million cubic metres per year of the UK‟s water footprint from household food waste.
Table 10 presents the various agricultural products imported from Spain to the UK, and their related water
footprints in Spain as a result of household food waste in the UK.

WRAP and WWF working together for a world without waste 25
Table 10: Total water footprint in Spain of the UK‟s household food waste. EWF
Million m3/year Share of the total external water
footprint
Rice 22.0 21%
Pork 8.1 8%
Poultry 8.1 8%
Beef 8.1 8%
Fruit fresh, others 6.4 6%
Cabbages 6.0 6%
Tomatoes 5.5 5%
Livestock others 5.2 5%
Carrots 4.9 5%
Oranges 4.3 4%
Olives 3.8 4%
Strawberries 3.2 3%
Apples 3.1 3%
Others 15.6 15%
Total 104.3 100%
This highlights that, although the total water footprint associated with goods imported from Spain is relatively
small (only 2% of the UK‟s EWF), the impact of water use is relatively high due to limited water availability and
over-exploitation of groundwater and surface water supplies in many parts of Spain.
9.5 Brazil Brazil provides about 336 million cubic metres per year of the UK‟s water footprint from household food waste.
Table 11 presents the various agricultural products imported to the UK from Brazil together with figures on the
water footprint in Brazil as a result of household food waste in the UK.
Table 11: Total water footprint of the UK‟s household food waste in Brazil.
EWF Million m3/year
Share of the total external water footprint
Beef 148 44.0%
Coffee 89 26.4%
Poultry 47 14.1%
Livestock others 35 10.3%
Cocoa 5 1.4%
Oranges 4 1.3%
Bananas 4 1.1%
Pepper 2 0.6%
Apples 1 0.4%
Maize 1 0.2%
Others 1 0.2%
Total 336 100%
Since Brazil contains 12% of the world‟s fresh water supplies, it may not appear at first glance to be a relevant
country from which to draw lessons in managing scarce water resources. North-eastern Brazil, however, is a
semi-arid region characterised by water scarcity, pronounced climatic variability and social stress situations (Krol
et al. 2001). The limited availability of water results from moderate rainfall, which is generally unreliable and
seasonally distributed, and a high evaporation rate. A large portion of the UK‟s EWF on this region is related to
beef products. It is increasingly becoming evident that rising beef consumption is a major driver of regional and
global change, and warrants greater policy attention (McAlpine et al. 2009). Coffee and beef from Brazil has
negligible blue and grey water footprints. However, the impacts are on Land Use Change and other ecosystem
services as a result of deforestation etc.

WRAP and WWF working together for a world without waste 26
As with all animal products, the manner of animal husbandry practiced will have a significant impact on the
specific carbon impacts of beef. Intensive, extensive, upland, lowland and organic farming practices all alter the
carbon footprint. However, they do not diminish the dominant role of agriculture in the overall carbon footprint.
The case study on beef identifies that, on average, indirect emissions from Land Use Change are three times
higher than direct emissions associated with beef production. However, this is a global average. Cederberg et al.
(2011) identify carbon emissions from deforestation associated with producing beef in Brazil. Their work suggests
that, averaged across all Brazilian beef production, emissions from Land Use Change are equivalent to 180 tonnes
CO2 eq per tonne of beef. If the emissions were allocated exclusively to cattle reared on newly deforested land,
the figure would rise to 700 tonnes CO2 eq per tonne of beef.
The case study of Brazil highlights the importance of considering local (i.e. sub-national) conditions when
assessing how to act on water footprint data, as well as the need to clearly understand the way in which Land
Use Change is accounted for in carbon footprinting.
10 Discussion This work demonstrates the water and carbon footprint of food and drink waste generated within the UK. For the
first time, the carbon and water footprint of food waste has been identified by country of origin (Appendices 4
and 5) with case studies on two countries.
Much of the produce which carries a significant water footprint is also significant in terms of carbon footprint.
Milk, beef, pork products, poultry, coffee, rice and apples are identified as large contributors to both indicators.
Some notable differences between the carbon and water footprint data can be seen in the cases of bananas,
citrus fruit, peppers and cocoa, which have relatively high avoidable water footprint and relatively low avoidable
carbon footprint; and potatoes, tea and cucumbers and gherkins, which have a relatively high avoidable carbon
footprint, but low avoidable water footprint.
Chocolate is another example of contrasting impacts. The quantity of chocolate thrown away is relatively small
(24,000 tonnes of chocolate bars plus 7,000 tonnes in hot chocolate). Its contribution to the carbon footprint of
food and drink waste is also small (117,000 tonnes CO2 equivalent), yet it significantly contributes to the water
footprint of food waste, accounting for over 750 million cubic metres of water. Dairy and meat products comprise
a relatively low proportion of food and drink waste by tonnes, but are significant both in terms of both the water
and carbon footprint. This is because of the amount of feed required to support livestock, as well as enteric
emissions from the animals themselves during their lives. This highlights the need to consider more than one
issue when identifying priority products to be addressed by waste prevention initiatives.
The assessment of the carbon footprint excludes the impact of Land Use Change associated with demand for
certain food stuffs. For some products this makes little difference. For example, Land Use Change associated with
demand for mushrooms (which are subsequently wasted) contributes 9 tonnes CO2 eq per year. However, the
demand for land to grow wheat for bread is responsible for an additional 270,000 tonnes CO2 eq per year. In the
case of beef and lamb, emissions associated with Land Use Change are actually higher than direct emissions
associated with avoidable waste. This highlights the need to understand the boundaries of any assessment of
environmental impact and the issues which one is in a position to influence.
In using the information contained in a water or carbon footprint, a number of issues need to be considered. The
amount of water used or carbon emitted does not take account of how efficiently crops are grown and food
produced within the local environment. In addition, the footprint does not consider the level of competition for
water resources, and local issues such as access to water. There is therefore a need also to consider scarcity of
water in a given catchment area, and also how effectively it is being managed. In considering these issues from a
policy perspective, it is important to take account of a range of economic, social and environmental factors, many
of which have not been discussed in this report.
Egypt, Israel, Pakistan, India, Thailand and Spain are examples of countries where water stress is very high and
the external water footprint of the UK‟s food waste is also relatively high. In such countries an appropriate policy
response from UK stakeholders should include consideration of how to play a constructive role in improving
information flows, stakeholder engagement, data availability and institutional capacity in order to support water
management regimes which adequately balance the needs of different users and ensure the continued viability of
the freshwater ecosystems.
Conversely, though Ghana and Brazil support a large part of the external water footprint of household food waste
in the UK, water stress in these countries is relatively low (with local exceptions). It may be that other

WRAP and WWF working together for a world without waste 27
environmental issues are more pressing and that positive socioeconomic impacts from sourcing produce from
these countries might outweigh the negative externalities related to hydrology.
The work presented here could be further developed and improved in a number of ways. Information on the
water footprint of food and drink is presented herein as a total figure. This could be disaggregated to highlight
the contribution of green, blue and grey water to a particular water footprint. The water footprint could also be
disaggregated within a nation, to highlight particular areas of water stress and surplus to inform decisions
regarding food production. At present, the impact of Land Use Change on the carbon footprint is discussed
separately to the emissions directly associated with the food supply chain. Further analysis could be used to
highlight particular „hot spots‟ which would require further attention, as well as highlighting the interlinked nature
of a range of issues, such as agriculture and forestry.
To address the water and carbon footprints of food and drink, and food and drink waste, WWF-UK (Macdiarmid J
et al. 2011) and others (e.g. (Stehfest et al. 2009)) have advocated a focus on reducing, or altering patterns of
consumption, which could be complementary to objectives around a healthy diet. However, a quick win in the UK
would be to reduce the sheer volume of food waste at household level. It would bring positive changes in terms
of impacts from the use of fertilisers and feedstuffs in the food industry overall. Another way of dealing with food
waste is to reduce its creation along the full supply chain. Packaging protects food from damage during its
transportation from farms and factories via warehouses to retailing, as well as preserving its freshness upon
arrival. Like other waste, food waste can be sent to landfill, but some food waste can also be fed to animals
(typically swine), or it can be biodegraded by composting or anaerobic digestion, and reused to enrich soil.
Demand for food is increasing, and with a projected global population of 7 billion by 2020, there is a need to
ensure that the food we do produce is effectively grown, stored, distributed, prepared, and consumed, with
minimal waste. Beyond this the research shows the value of considering a range of issues when tackling waste,
and highlights the effect of considering water and greenhouse gas emissions in informing priorities. While it will
never the answer by itself, reducing food waste could contribute toward reducing serious environmental problems
associated with increasing scarcity of water resources and with climate change. Consumers, manufacturers,
retailers and those in the hospitality sector can all contribute to minimising food waste, an action which is
particularly relevant in the context of the global food security debate.
The way food is stored, packaged, labelled and marketed, and our expectations of what good food looks like and
when we can purchase it can all influence the amount we waste. It is rather less wasteful if we align
consumption to availability and adapt to the seasonal variability in supplies. A way forward to reduce waste is
possible if waste generation is decoupled from economic growth as argued by Sjöström and Östblom (2010).
Reducing food waste requires action by all sectors of society. Those involved in farming can use the information
contained in this and the referenced reports to reflect on the crops that they grow and their suitability given
water availability and efficiency of production. Businesses can act in a number of ways, such as reviewing their
supply chains and the processes and technologies they employ. Initiatives such as the Courtauld Commitment,
the Federation House Commitment and WWF-UK‟s One Planet Food programme can help facilitate this activity on
a national and international level. Businesses can also help consumers by providing information on products,
altering pack sizes to reduce waste, implementing standards, or advice on how to reduce waste within the home.
Households can act to reduce food waste through a range of simple measures, as advocated through the Love
Food Hate Waste campaign, supported by work undertaken by other sectors of society. Love Food Hate Waste
continues to be a valuable initiative in highlighting the magnitude of household food waste, and ways in which
this can be tackled.

WRAP and WWF working together for a world without waste 28
11 Conclusion This report identifies the water footprint of meeting the UK‟s food and drink needs, and the carbon footprint
across the supply chain of delivering this, from farm to plate, including emissions associated with Land Use
Change. Avoidable food waste represents approximately 6% of the UK water footprint, equivalent to almost twice
the direct household water use of the UK. Just the internal water footprint from household food waste in the UK
is equivalent to the direct household water use of 33 million people. Avoidable food waste also represents
approximately 3% of the UK‟s domestic greenhouse gas emissions, with further emissions abroad. Excluding Land
Use Change, emissions associated with avoidable food waste are equivalent to the annual greenhouse gas
emissions from 7 million cars.
The case studies highlight the need to consider context when interpreting water footprint data. It is not
necessarily the total volume of the water footprint which is critical; rather, it is the local context within which that
water is used to produce food which determines the impacts on the environment and on other water users. The
impacts in areas suffering water stress (e.g. excessive extraction of water) are normally far more significant than
in areas with relatively plentiful water supplies.
The research reinforces the benefits of partnership working by organisations such as WRAP and WWF-UK to
highlight issues of mutual interest. This research could be extended in future to consider the sources of water
used in different countries (green, blue) and the impacts of effluent (grey water) across additional stages in the
supply chain. The carbon footprint data could also be developed to provide nation-specific factors.
Even without this additional detail the key conclusion, that reducing food waste can make a significant
contribution to addressing the water and carbon footprints of the UK, is clear. The research provides a framework
around which to discuss how food waste could be reduced to provide the greatest environmental benefit.

WRAP and WWF working together for a world without waste 29
Appendix 1: Household food waste in the UK
Code Food waste description
Weight (tonne/year)
Avoidable Possibly
avoidable Unavoidable Total
A01 Cracker / crisp bread 8,968 8,968
A02 Bread sticks 259 259
A03 Dough 12,301 12,301
A04 Dumpling 769 769
A05 Morning goods 15,133 15,133
A06 Pastry 6,835 6,835
A07 Speciality bread 80,473 547 81,020
A08 Standard bread 542,023 117,291 659,314
A10 Yorkshire pudding and other batter 13,212 13,212
A11 Other bakery 1,645 1,645
B01a Pork - bacon 13,668 4,603 18,271
B01b Pork - carcass meat / bones 26,582 6,961 4,966 38,510
B01c Pork - sausages 28,665 2,243 30,908
B01d Pork - sliced ham 21,376 6,283 27,659
B01f Pork - other 3,107 3,107
B02 Beef 43,168 20,423 8,786 72,377
B05 Fish and shellfish 32,260 3,327 7,110 42,696
B07 Lamb 8,283 3,522 19,847 31,652
B10a Poultry - carcass meat / bones 61,075 31,749 176,740 269,565
B10b Poultry - poultry product 17,798 1,016 10,490 29,304
B10c Sliced Poultry 2,358 2,358
B11 Meat and fish based sandwich spread 12,124 12,124
B12 Bone (unidentifiable / mixed) 705 6,763 7,467
B13 Other meat (unidentifiable / mixed meat / offal) 11,336 2,528 1,730 15,594
B15 Game 12,830 12,830
C01 Milk 363,598 363,598
C02 Cheese 37,635 243 48 37,926
C03 Cream and crème fraiche 22,247 22,247
C04 Egg 23,627 53,724 77,351
C05 Yoghurt / yoghurt drink 79,815 79,815
C06 Other dairy 1,820 1,820
D01 Breakfast cereal 74,996 74,996
D02 Flour 19,815 19,815
D03 Pasta 41,608 41,608
D05 Rice 64,433 64,433
D06 Other staple foods 2,702 2,702
E01 Apple 175,452 53,462 31,188 260,103
E02 Banana 82,595 838 230,390 313,822
E03 Kiwi 2,972 2,799 5,771

WRAP and WWF working together for a world without waste 30
Code Food waste description
Weight (tonne/year)
Avoidable Possibly
avoidable Unavoidable Total
E04 Melon 29,775 27 73,649 103,451
E05 Mixed fruit 7,920 14,610 17,214 39,744
E06 Orange 49,254 564 83,660 133,478
E07 Pear 34,262 3,859 2,652 40,773
E08 Pineapple 7,650 124 20,381 28,156
E10 Soft / berry fruit 40,632 92 2,818 43,541
E11 Stone fruit 43,374 473 22,685 66,531
E12 Other citrus 18,560 1,730 24,649 44,939
E13 Other fruit 8,912 5,343 5,772 20,028
F01 Apple 4,896 4,896
F02 Banana 1,678 1,678
F05 Mixed fruit 4,961 4,961
F07 Pear 571 571
F08 Pineapple 1,675 1,675
F10 Soft / berry fruit 4,802 4,802
F11 Stone fruit 5,944 5,944
F12 Other citrus 1,432 1,432
F13 Other fruit 3,816 3,816
G01 Aubergine 1,150 249 373 1,772
G03 Bean (all varieties) 21,821 1,507 5,599 28,928
G04 Broccoli 21,389 18,230 1,262 40,881
G05 Cabbage 53,208 14,019 18,077 85,304
G06 Carrot 45,964 65,308 6,148 117,420
G07 Cauliflower 10,450 2,973 26,104 39,527
G08 Celery 20,119 1,766 1,360 23,245
G10 Courgette 4,798 2,059 1,489 8,346
G11 Cucumber 30,868 2,807 10,330 44,005
G12 Leafy salad 35,784 562 552 36,898
G13 Leek 8,491 543 11,397 20,431
G14 Lettuce 61,072 1,958 3,589 66,619
G15 Mixed vegetables 47,705 198,780 7,085 253,571
G16 Mushroom 13,529 2,598 16,126
G18 Onion 35,801 67 92,830 128,698
G19 Pea (all varieties) 2,445 832 5,500 8,777
G20 Pepper 15,760 722 7,997 24,478
G21 Potato 286,336 481,021 564 767,921
G22 Spinach 2,924 538 3,461
G24 Spring onion 5,763 451 2,118 8,331
G25 Sprout 2,085 146 4,973 7,204
G26 Sweet corn / corn on the cob 24,188 1,181 17,764 43,133
G27 Tomato 60,895 1,674 618 63,187
G28 Other vegetables and salad 21,928 6,974 4,742 33,644

WRAP and WWF working together for a world without waste 31
Code Food waste description
Weight (tonne/year)
Avoidable Possibly
avoidable Unavoidable Total
G29 Other root vegetables 21,885 4,390 22,935 49,210
H02 Baked beans 26,581 26,581
H03 Bean (all varieties) 3,778 3,778
H04 Broccoli 788 788
H05 Cabbage 1,164 1,164
H06 Carrot 1,095 1,095
H07 Cauliflower 130 130
H09 Coleslaw and hummus 29,887 29,887
H15 Mixed vegetables 5,348 5,348
H16 Mushroom 853 853
H17 Non-leafy salad 10,011 10,011
H18 Onion 3,031 3,031
H19 Pea (all varieties) 3,817 3,817
H20 Pepper 221 221
H21 Potato 74,160 74,160
H22 Spinach 280 280
H23 Vegetable based sandwich spread 3,981 3,981
H25 Sprout 1,811 1,811
H26 Sweet corn / corn on the cob 3,963 11 3,974
H27 Tomato 19,787 19,787
H28 Other vegetables and salad 9,323 9,323
H29 Other root vegetables 8,176 8,176
I01 Chocolate and sweets 24,325 24,325
I02 Cereal bar 1,371 1,371
I03 Savoury snacks 22,649 3,613 26,262
I04 Other confectionery and snacks 830 830
I05 Sweet biscuits 18,262 31 18,293
J01 Coffee 29,678 60,379 90,057
J02 Fruit juice and smoothies 157,357 157,357
J03 Hot chocolate 17,170 17,170
J04 Lager, beer and cider 73,788 73,788
J05 Milkshake and milk drink 33,430 33,430
J06 Carbonated soft drink 278,323 278,323
J07 Squash 52,800 52,800
J08 Tea waste 86,175 366,151 452,326
J09 Bottled water 68,607 68,607
J10 Wine 50,858 50,858
J11 Other alcohol 15,759 15,759
J12 Other drink 9,078 9,078
K01 Cook in sauce 56,994 56,994
K02 Dip 9,562 9,562
K03 Gravy 12,475 12,475

WRAP and WWF working together for a world without waste 32
Code Food waste description
Weight (tonne/year)
Avoidable Possibly
avoidable Unavoidable Total
K04 Herb / spice 10,220 5,712 679 16,611
K05 Honey 2,234 2,234
K06 Jam 14,710 14,710
K07 Ketchup 4,567 4,567
K08 Mayonnaise / salad cream 12,175 12,175
K09 Olives 2,148 2,148
K10 Pickle 3,830 3,830
K11 Salt 393 393
K12 Sugar 4,808 4,808
K13 Sweet spread 1,274 1,274
K14 Other condiments etc. 66,281 66,281
L01 Oil 8,634 60,805 5,089 74,528
L02 Fat 11,715 3,688 15,403
M01 Cheesecake 4,694 4,694
M02 Chocolate pudding / dessert 1,471 1,471
M03 Cakes / gateau / doughnuts / pastries 90,977 90,977
M04 Fruit pie / strudel / crumble 18,113 18,113
M05 Ice Cream 15,732 15,732
M06 Jelly 2,029 2,029
M07 Milk pudding (custard etc.) 44,703 44,703
M08 Mousse 2,632 2,632
M09 Trifle 3,480 3,480
M10 Other desserts 8,608 8,608
P01 Baby food 5,630 5,630
P02 Baby milk 8,599 8,599
P03 Gunge 136,964 136,964
P05 Mixed food 2,336 3,904 6,240
P07 Other food 3,047 1,005 4,052
P08 Draining from canned food 137,638 137,638
Q01a Soup - pre-prepared 32,538 32,538
Q01b Soup - homemade 46,965 46,965
Q02a Composite meal - pre-prepared 178,485 1,314 179,799
Q02b Composite meal - homemade 313,138 21,272 334,410
Q03a Sandwich - pre-prepared 9,711 32 9,743
Q03b Sandwich - homemade 37,647 1,233 38,880
Q04a Savoury products - pre-prepared 41,425 41,425
Q04b Savoury products - homemade 3,901 3,901
663,810 23,851 5,089 8,307,464
Source: WRAP (Quested & Johnson 2009).

WRAP and WWF working together for a world without waste 33
Appendix 2: Water footprint of household food waste
by products
Products Internal water
footprint (million m3/year)
External water
footprint (million m3/year)
Total water footprint (million m3/year)
A1 PA2 Total A1 PA2 Total A1 PA2 Total
Beef 295.7 139.9 435.6 329.8 156.0 485.8 625.4 295.9 921.3
Cocoa beans 753.8 753.8 753.8 753.8
Rice 556.3 556.3 556.3 556.3
Poultry 135.5 54.7 190.2 251.2 101.3 352.5 386.7 156.0 542.6
Wheat 344.0 51.3 395.2 124.4 18.5 142.9 468.4 69.8 538.2
Coffee 521.7 521.7 521.7 521.7
Pork 146.8 31.6 178.4 279.5 60.1 339.6 426.2 91.7 517.9
Milk 452.3 0.2 452.5 3.5 0.0 3.5 455.8 0.2 456.0
Citrus fruit others 238.9 2.3 241.3 238.9 2.3 241.3
Livestock others 25.6 2.3 27.8 165.9 14.8 180.7 191.5 17.1 208.6
Beans 131.7 3.8 135.5 131.7 3.8 135.5
Vegetables fresh others 14.1 19.4 33.5 27.5 37.9 65.4 41.6 57.3 98.9
Pepper 90.0 4.1 94.1 90.0 4.1 94.1
Apples 5.9 1.7 7.6 65.2 19.3 84.5 71.1 21.1 92.2
Bananas 87.3 0.9 88.2 87.3 0.9 88.2
Oilseeds others 10.4 73.0 83.3 10.4 73.0 83.3
Potatoes 20.3 27.1 47.5 12.5 16.7 29.3 32.9 43.9 76.7
Goat and sheep 25.7 10.9 36.6 13.5 5.8 19.3 39.2 16.7 55.9
Stone fruit others 51.3 0.5 51.7 51.3 0.5 51.7
Fruit fresh others 27.0 21.0 48.0 27.0 21.0 48.0
Strawberries 29.6 0.1 29.6 29.6 0.1 29.6
Oranges 25.4 0.3 25.6 25.4 0.3 25.6
Pears 18.4 2.0 20.4 18.4 2.0 20.4
Maize 15.7 0.6 16.3 15.7 0.6 16.3
Cauliflowers and broccoli
8.0 4.6 12.6 8.0 4.6 12.6
Carrots and turnips 5.2 7.2 12.4 5.2 7.2 12.4
Cabbages & other brassicas
9.2 2.4 11.6 9.2 2.4 11.6
Tomatoes 0.1 0.0 0.1 9.4 0.1 9.5 9.5 0.1 9.6
Onions and shallots 7.3 0.1 7.4 0.6 0.0 0.6 7.8 0.1 7.9
Olives 6.4 6.4 6.4 6.4
Watermelons 4.6 0.0 4.7 4.6 0.0 4.7
Lettuce and chicory 4.4 0.1 4.5 4.4 0.1 4.5
Cucumbers and gherkins
3.7 0.5 4.2 3.7 0.5 4.2
Spinach 3.9 0.1 4.0 3.9 0.1 4.0
Pineapples 3.5 0.0 3.6 3.5 0.0 3.6
Peas, green 2.1 0.3 2.4 2.1 0.3 2.4

WRAP and WWF working together for a world without waste 34
Products Internal water
footprint (million m3/year)
External water
footprint (million m3/year)
Total water footprint (million m3/year)
A1 PA2 Total A1 PA2 Total A1 PA2 Total
Roots and tubers, others
1.2 0.2 1.3 1.2 0.2 1.3
Kiwi fruit 1.3 1.3 1.3 1.3
Leeks, other alliaceous 0.6 0.0 0.7 0.6 0.0 0.7
Sugar cane 0.5 0.5 0.5 0.5
Eggplants 0.2 0.0 0.2 0.2 0.0 0.2
Grand Total 1,473 339 1,812 3,895 555 4,450 5,368 894 6,262
1Note: A=avoidable 2Note: PA=possibly avoidable.

WRAP and WWF working together for a world without waste 35
Appendix 3: External water footprint of household
food waste
External water footprint (million m
3 per year)
Avoidable Possibly avoidable Total
Ghana 423 0 423
Brazil 271 64 336
India 263 22 284
Ireland 175 71 246
Netherlands 168 50 218
Thailand 176 21 197
Ivory Cost 171 2 173
France 129 38 166
Denmark 128 29 156
USA 128 7 135
Italy 102 15 118
Pakistan 114 0 115
Nigeria 113 0 114
Spain 87 17 104
Canada 88 10 98
Germany 72 20 92
Kenya 82 9 91
Cameroon 89 0 90
Indonesia 82 2 84
Belgium 53 17 71
Colombia 55 0 55
Mexico 49 1 50
South Africa 36 10 45
China 35 7 42
Turkey 34 6 40
Portugal 32 4 36
Ethiopia 8 27 35
Ecuador 25 1 27
Ukraine 6 18 23
Guyana 22 0 22
Argentina 15 5 20
Uganda 19 2 20
El Salvador 20 0 20
Greece 16 3 19
Peru 18 0 18
Nicaragua 18 0 18
Honduras 17 0 17
Viet Nam 17 0 17

WRAP and WWF working together for a world without waste 36
External water footprint (million m
3 per year)
Avoidable Possibly avoidable Total
Australia 13 4 17
Uruguay 12 5 17
Jamaica 15 0 15
Poland 10 5 14
Hungary 11 3 14
Botswana 9 4 14
Papua N. Guinea 12 0 12
Zimbabwe 9 3 12
Israel 8 4 12
Egypt 10 2 12
Guatemala 10 1 10
Dominican R. 10 0 10
Namibia 7 3 10
Suriname 9 0 9
Angola 9 0 9
Chile 6 2 8
Malaysia 3 5 8
Sri Lanka 7 1 8
St. Lucia 7 0 7
Costa Rica 7 0 7
Tanzania 6 0 6
Cuba 5 0 5
S. Vincent-Gr 5 0 5
Madagascar 4 1 5
Aruba 5 0 5
Sweden 4 1 5
Togo 4 0 4
Iran 4 0 4
Dominica 4 0 4
Morocco 3 0 4
New Zealand 3 1 4
Cyprus 2 2 4
Malawi 3 1 4
Russia 3 1 3
Austria 2 1 3
Myanmar 3 0 3
Bulgaria 2 1 3
Zambia 1 2 3
Others 291 21 312
Total 3,895 555 4,450

WRAP and WWF working together for a world without waste 37
Appendix 4: Carbon footprint of the UK‟s
household food waste
Products Internal Carbon Footprint
(‘000 t/year)
External Carbon Footprint
(‘000 t/year)
Total Carbon Footprint (‘000 t/year)
A1 PA2 Total A1 PA2 Total A1 PA2 Total
Milk 1,690 3 1,693 293 1 294 1,983 3 1,987
Wheat 1,253 195 1,448 93 15 108 1,347 209 1,556
Potatoes 491 656 1,147 38 50 88 529 706 1,234
Beef 533 252 786 265 125 391 799 378 1,176
Coffee 19 19 989 989 1,008 1,008
Pork 535 115 650 293 63 357 828 178 1,007
Vegetables fresh others
222 364 586 95 175 270 317 539 856
Tomatoes 160 2 162 674 7 682 834 9 843
Poultry 517 209 726 84 34 118 601 242 843
Rice 229 229 386 386 615 615
Tea 56 56 417 417 473 473
Apples 140 41 181 85 25 110 225 67 291
Livestock others 188 16 204 48 4 52 236 19 256
Goat and sheep 125 53 179 33 14 47 159 67 226
Cucumbers & gherkins
122 14 136 58 6 64 180 19 200
Citrus fruit others 121 1 122 71 0 71 192 1 193
Strawberries 72 0 72 115 0 115 186 0 187
Carrots 58 80 138 17 24 42 75 104 179
Lettuce 133 4 137 32 1 33 165 5 170
Cocoa beans 24 24 135 135 159 159
Bananas 58 1 59 65 1 66 123 1 124
Cabbages 69 18 87 22 6 28 91 23 115
Spinach 82 2 84 24 1 24 105 3 108
Cauliflower 41 25 66 14 9 24 56 34 90
Fruit fresh others 20 16 36 29 23 52 49 39 88
Stone fruit others, fresh
38 0 39 46 0 46 84 1 85
Oranges 34 0 34 40 0 41 74 1 75
Oilseeds others 7 50 58 2 11 13 9 61 70
Onions & shallots (green)
56 1 56 13 0 13 69 1 69
Beans, dry 42 1 43 17 0 17 59 2 60
Roots and tubers others
41 6 47 5 1 6 46 7 53
Pepper 11 0 12 39 2 40 50 2 52
Pears 26 3 29 18 2 20 43 5 48
Mushrooms 25 5 30 12 2 14 37 7 44
Maize 25 1 26 13 0 13 38 1 39
Citrus fruit others 21 0 21 10 0 10 30 0 30

WRAP and WWF working together for a world without waste 38
Pineapples 6 0 7 12 0 12 19 0 19
Peas, green 14 2 16 0 0 0 14 2 16
Leeks & oth.alliac.veg
10 1 11 3 0 3 13 1 14
Sugar cane 3 3 4 4 8 8
Citrus fruit others 2 2 3 3 6 6
Olives 1 1 3 3 5 5
Eggplants 1 0 1 0 0 0 1 0 2
Others 2,989 320 3,308 1,520 92 1,612 4,509 412 4,921
Unallocated 2,694 767
Total 13,007 3,223 16,230 6,138 696 6,833 19,145 3,919 23,064
1Note: A=avoidable 2Note: PA=possibly avoidable.
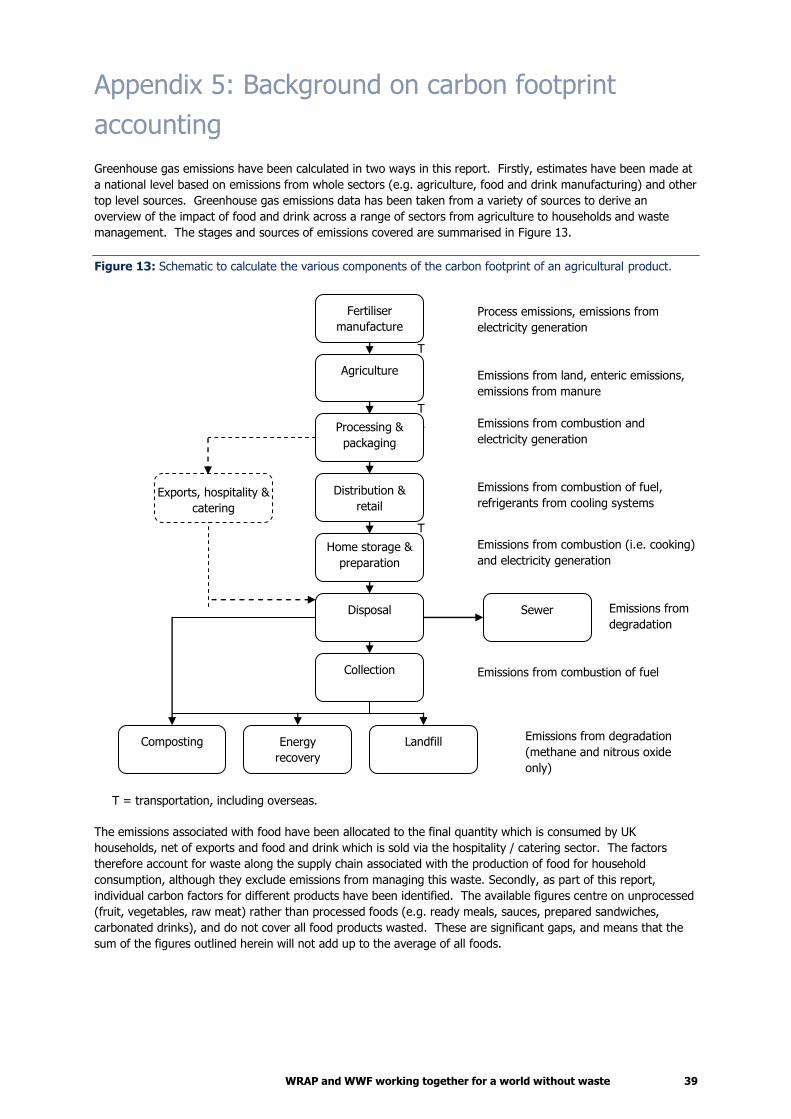
WRAP and WWF working together for a world without waste 39
Appendix 5: Background on carbon footprint
accounting
Greenhouse gas emissions have been calculated in two ways in this report. Firstly, estimates have been made at
a national level based on emissions from whole sectors (e.g. agriculture, food and drink manufacturing) and other
top level sources. Greenhouse gas emissions data has been taken from a variety of sources to derive an
overview of the impact of food and drink across a range of sectors from agriculture to households and waste
management. The stages and sources of emissions covered are summarised in Figure 13.
Figure 13: Schematic to calculate the various components of the carbon footprint of an agricultural product.
Process emissions, emissions from
electricity generation
Emissions from land, enteric emissions,
emissions from manure
Emissions from combustion and
electricity generation
Emissions from combustion of fuel,
refrigerants from cooling systems
Emissions from combustion (i.e. cooking)
and electricity generation
Emissions from
degradation
Emissions from combustion of fuel
Emissions from degradation
(methane and nitrous oxide
only)
The emissions associated with food have been allocated to the final quantity which is consumed by UK
households, net of exports and food and drink which is sold via the hospitality / catering sector. The factors
therefore account for waste along the supply chain associated with the production of food for household
consumption, although they exclude emissions from managing this waste. Secondly, as part of this report,
individual carbon factors for different products have been identified. The available figures centre on unprocessed
(fruit, vegetables, raw meat) rather than processed foods (e.g. ready meals, sauces, prepared sandwiches,
carbonated drinks), and do not cover all food products wasted. These are significant gaps, and means that the
sum of the figures outlined herein will not add up to the average of all foods.
T = transportation, including overseas.
T
T
T
T
Composting Energy
recovery
Sewer
Landfill
Collection
Home storage &
preparation
Distribution &
retail
Processing &
packaging
Agriculture
Fertiliser
manufacture
Disposal
Exports, hospitality &
catering

WRAP and WWF working together for a world without waste 40
Several sources have been used to derive the emissions associated with growing food items of interest. In order
to be selected for use in this study, the information must meet specific criteria. These are:
The study must be a life cycle analysis or life cycle analysis-like study.
It must have been critically reviewed (e.g. in a scientific journal or in line with ISO 14040 or other relevant
standards such as PAS 2050).
The study must be representative of the UK supply chain for food.
The report must clearly outline the scope of the emissions reported (e.g. clear system boundary).
The assumptions made must be transparent.
Clearly identify data from primary and secondary research.
No ambiguity in the way impacts are ascribed to materials (e.g. co-products).
Data which complies with either the International Standard on life cycle assessment, ISO14040, or the standard
on carbon footprinting, PAS 2050 has been used wherever possible. Where this is not available, data from
scientific journals has also been used. A full list of studies used is provided within the references for this report.
Information on emissions associated with processing food for consumption within the UK are limited. Defra
(2009a) and DECC (2010) publish data on emissions associated with the food, drink and tobacco sector in the UK
and associated with food imported. However, whilst applicable at a top down level, this information cannot be
used at a product level. In lieu of this, product specific reports have been used where possible. One study (ERM
2009) has been identified which contains information on processing pork. In this report, the figures associated
with pork have been applied to all meats. Processing data from Yoshikawa (Yoshikawa et al. 2008) have been
used for stoned fruit, broccoli, cabbage, carrots, potatoes, spinach and sprouts, Beccali (Beccali et al. 2009) for
citrus fruit, Ruini and Marino (2009) for pasta, Kasmaprapruet et al. (2009) for rice, Zespri et al. (2009) for Kiwi
fruit, Cadbury (2008) for chocolate, and Tesco (2008) for orange juice.
Watkiss et al. (2005) identify that approximately 9 million tonnes of CO2 emissions were associated with the
import of 28 million tonnes of food to the UK. Although this figure is CO2 only, it has been used in this study as a
rough approximation for the impact of importing one tonne of food, with an emission factor of 0.320 tonnes CO2
per tonne of imported food used for emissions which occur abroad in transporting food to the UK. An average
packaging emission factor has been applied to all food items, based on data collected for the Courtauld
Commitment. This includes primary and secondary packaging. The emissions factors used are identified in James
(2010).
Tassou et al. (2009) identified emissions associated with storage, distribution and retail of 11 specimen food
products in a study to test and inform the development of PAS 2050. The emissions derived accounted for the
time products spend on shelf, the temperature at which they are kept and the volume of the product. In this
report, these emissions factors have been applied to similar food items. For example, emissions factors for bread
have been applied to crackers, pastries and flour. Most fruit have been classified as fresh apples. Soft berries,
cucumbers, leafy salad and lettuce have been allocated the same Retail Distribution Centre (RDC), transport and
retail emissions as strawberries. Emissions associated with drink products have been estimated based on WRAP
estimates in discussion with industry.
Pretty et al. (2005) calculated that UK household food shopping involves around 8km of car travel per household
per week (in addition to travel by bus, bicycle and on foot). The food expenditure survey suggests that food
consumption is about 12kg per person per week. With an average UK household size of 2.32 persons, this
equates to 28kg per household per week. Defra (2010a) provide emissions factors for a range of vehicles. Based
on a lower medium size passenger car, and assuming that the sole purpose of the journey is food shopping, this
equates to 0.228kg CO2 eq per km. This equates to 0.07kg CO2 eq per kilogram of food transported home, or
0.07 tonnes CO2 eq per tonne of food.
As with processing, limited food-specific emission factors are available for home storage and preparation of food.
Information on drink storage is based upon WRAP estimates in discussion with industry, squash has been taken
from Tesco (2008), peas have been taken from Defra (2009b) pasta from Ruini and Marino (2009) and meat from
ERM (2009). At waste stage, an average emission factor for all foods has been applied as per Table 12. To
provide an average estimate several data sources have been used. These have been sense checked against a
separate top down calculation outlined below. Table 12 identifies the carbon factors used to estimate the average
impact of food. Information on agriculture and fertiliser manufacture is based upon UK agriculture and fertiliser
use only.

WRAP and WWF working together for a world without waste 41
Data on food and drink brought into the home (from retail, takeaways and sources of free food) come from
Defra‟s Family Food Survey for the calendar year 2007 (Defra 2008a). The food types used in this report were
aligned as closely as possible with the classification of food and drink in the Family Food dataset and then
estimates for amounts of purchases at the food group level were obtained. The information from the Family Food
dataset was converted from grams per person per week into tonnes in the UK each year. From this, we estimate
that UK households purchase approximately 38.5 million tonnes of food and drink per annum, with a further 4.8
million tonnes consumed outside of the home (e.g. restaurants).
Of the 5.3 million tonnes of avoidable food and drink waste, 17% is drink and 83% food. The bottom-up
calculation takes these relative proportions into account in obtaining the overall carbon factor for food and drink
(3.8). Defra estimates that greenhouse gas emissions from the UK food chain are equivalent to about 180 million
tonnes CO2 eq, excluding waste (Defra figure 4). This suggests an average figure of 4.2 tonnes CO2 eq per tonne
of food, excluding waste management impacts. The results from both assessments are similar in the magnitude
of impact.
Table 12: CO2 Emission data, metric tonnes CO2 eq .
Life Cycle Stage Total
million tonnes
CO2 eq)
Per tonne food
waste (tonnes
CO2 eq )*
Data source
Agriculture 52.7 1.22 Defra (2006)
Fertiliser manufacture 3.5 0.08 Composition (AIC 2008)
Impacts (Davis & Haglund
1999)
Food and drink manufacturing 13.3 (UK),
47.2 (non-UK)
1.09 DTI (2002)
Defra (2009a)
Packaging 6.6 0.17 WRAP**
Transport (including overseas) 18.4 0.48 Defra (2005)
Food exports -8.0 -0.18 Defra (2009a)
Retail 5.0 0.13 Tassou et al. (2009)
Home related 16.1 0.42 Brook Lyndhurst (2008)
Waste emissions (avoidable food only) 2.4 0.41 WRAP***
Total 130* 3.8
* Note: Total and per tonne factor is for food purchased by households only
** Note: WRAP calculation based on Courtauld Methodology and packaging data
**Note: Calculation based upon 62% to landfill, 8% to Energy from Waste, 22% to sewer and 8% to home
composting

WRAP and WWF working together for a world without waste 42
Appendix 6: Background on water footprint
accounting
The total water footprint of a product/nation is made up of two components; the direct water footprint and
indirect water footprint. The direct water footprint is calculated as the sum of volume of water either evaporated
or polluted at the point of operation. For a nation, it is also called as the internal water footprint (IWF) of the
nation. The indirect water footprint is equal to the sum of total water footprints of the predecessor suppliers in
the product supply chain. In the national context, it also referred as the external water footprint (EWF) of the
nation.
WF IWF EWF
For detailed methods and data used in calculating the water footprint of the UK, please refer to the volume 2 of
the WWF report on water footprint (Chapagain & Orr 2008). In gist, first the water footprint of the products (also
called virtual water content of the products) imported in the UK is calculated based on the climate and production
statistics of the producing regions.
The internal water footprint of the UK, IWF, is calculated as:
IWF Total domestic water use Export of domestic virtual water
The external water footprint of the UK, EWF, is calculated as:
EWF Total import Export of imported virtual water
However, international trade is more complicated and a substantial volume of trade originates in countries which
are not directly exporting to the country where the final consumption takes place. Hence, tracking the products of
origin is not straight forward. We‟ve followed the method used in WWF report (Chapagain & Orr 2008) to trace
the origin of the virtual water imports. The virtual water flow calculations and footprint estimates are made at
product category level. The product level information is aggregated only at the final stage in the calculations,
allowing us to analyse individual products as a case study in this report. Based on international trade data
(tonne/year) and the water footprint of these products (cubic metres/tonne), the virtual water flows (cubic
metres/year) are estimated. Using crop production data (tonne/year) and the water footprint of crops in the UK
(cubic metres/tonne), the total domestic water use is calculated. To avoid double accounting, the part of the
crops used as feed has been separated from crop water use based on Food Balance Sheets produced by FAO
(FAOSTAT data 2010). Water use in livestock products is calculated using the water footprint of livestock
products (cubic metres/tonne) and the production volumes in the UK (tonne/year).
A schematic on estimating the water footprint of product is presented in Figure 14 with a short discussion on
each of these components in the following paragraphs.
Green water footprint
This is soil water derived from rainfall. Green water supports all non-irrigated agricultural production (rain fed
cropping) and is normally assumed to be the volume of water that is lost through evapotranspiration during crop
growth. As evapotranspiration is a function of climate, crop location has a major impact on the volumetric water
footprint. Consequently, a key issue for water footprint accounting of agricultural products is the treatment of
green water. Green water is often seen as „free‟ and its use unproblematic but this is not necessarily always the
case. In the majority of situations, interception of rainfall by the plant canopy of cash crops is less than that of
natural vegetation; this leads to the scenario where replacing natural vegetation by cash crops can increase
ground water and river flows (Scanlon et al. 2007). However where rainfall is limited and there are concerns over
low levels of ground water or river flows, it may be economically, environmentally and socially preferable to grow
an irrigated high value crop like strawberry or flowers rather than a rain fed high water requirement crop, like
maize.
More recent works on green water has shown that it is an important dimension in the global food and water
security (Chapagain & Orr 2009, Aldaya et al. 2009, Chapagain & Hoekstra 2010, Mekonnen & Hoekstra 2010,
Chapagain et al. 2006). The inclusion of green water is again being questioned since some workers contend that
“green water (and other resources) is only accessible through access to and occupation of land” and that “the
consumption of green water in agri-food product life cycles is better considered in the context of land use”

WRAP and WWF working together for a world without waste 43
(SABMiller & WWF 2009, Ridoutt & Pfister 2009). The inclusion of green water within the volumetric water
footprint is a useful auditing tool but the need to consider water use within the wider context of land use and
environmental impact has exposed its limitations.
Blue water footprint
The blue water footprint is an indicator of consumptive use of so-called blue water, i.e. fresh surface (lakes and
rivers) or groundwater (Hoekstra et al. 2011). The term consumptive refers to the volume that meets any of the
three conditions of either being evaporated, or incorporated into the product, or water diverted into another
catchment (not available in the same place and time). Generally, this is the part of the water abstracted by
farmers for irrigation or by water companies to supply the general population that meet either of the above three
conditions of being consumptive use. The blue water footprint can be further refined based on different kinds of
blue water e.g. surface water (rivers and lakes), renewable ground water (residence time in the order of months
and a few years), fossil ground water (residence time in the order of thousands of years. As such distinction is
very data and time demanding, it is often limited to specific examples where such refined information is needed.
The green water footprint has a relatively low opportunity cost compared to the blue water footprint. The
environmental impact of the blue water footprint in crop production depends on the timing and location of the
water use. It would need a dedicated analysis to estimate where and when blue water footprints in crop
production constitute significant environmental problems.
Figure 14: The various components of the water footprint of an agricultural product.
water footprint(direct water use in operation)
Indirect water footprint(total water use in the supply
chain of input goods)
Water footprint of a product
Water withdrawal from
surface/ground water
Return flows
(quantity and quality)
Green water evaporated Blue water evaporated
Green water footprint Blue water footprint
Fresh water polluted
Grey water footprint
Soil moisture maintained
by rainfall
Grey water footprint
The existing definition of grey water in water supply literatures defines it as the total volume of polluted return
flows. Based on this definition, the grey water use can be easily quantified as most businesses will have a
discharge licence which states the volume of water that they may discharge but the second definition can create
difficulties. However, it doesn‟t explicitly show the quality of the return flow and the assimilating capacity of the
receiving water bodies. Later on grey water footprint has been introduced in an attempt to account the degree of
pollution of fresh water system from pollution arising in the production process such as residual fertilisers and
pesticides in the return flows from the agricultural fields, or various contaminants from an industrial effluent
(Hoekstra & Chapagain 2008, 2006, Chapagain 2006). The grey water footprint is defined as the volume of
freshwater that is required to assimilate the load of pollutants based on natural background concentrations and
existing ambient water quality standards (Hoekstra et al. 2011). The definition of grey water in water footprint
accounting is more holistic. It is based on the quality and quantity of the polluted return flows (effluent), and is
quantified based on the size and existing water quality standards of the receiving water bodies. In this report,
we‟ve used the second definition of grey water footprint.

WRAP and WWF working together for a world without waste 44
The idea of expressing water pollution in terms of a water volume needed to dilute the waste is not new.
Falkenmark and Lindh (1974) proposed as a rule of thumb to reckon with a dilution factor of 10 to 50 times the
wastewater flow. Postel et al. (1996) applied a dilution factor for waste absorption of 28 litres per second per
1,000 population. These generic dilution factors do not account for the sort of pollution and the level of treatment
before disposal, but implicitly assume some average characteristics of human waste flows. Chapagain et al.
(2006) proposed to make the dilution factor dependent on the type of pollutant and to use the ambient water
quality standard for a certain pollutant as the criterion to quantify the dilution requirement. The grey water
footprint concept has grown out of the recognition that the size of water pollution can be expressed in terms of
the volume of water that is required to dilute pollutants such that they become harmless. The requirement to
calculate a volume of water required to dilute another volume of water to an agreed discharge standard involves
knowing the concentration of pollutants in return flows as well as in the receiving water bodies, and the exact
volumes required achieving a set discharge concentration. Not all grey water is derived from blue water. Rain fed
agriculture will have a grey water footprint due to leaching by rainfall. In fact good irrigation management can
reduce the grey water footprint compared to rain fed agriculture in a place like the UK. These reasons illustrate
why grey water calculations are difficult to make and why grey water is often excluded from water footprint
calculations.
Assessing the impacts of water footprint
A volumetric water footprint accounting exercise produces a 3-dimensional matrix of information where the water
footprint of a product/service/business/nation is disaggregated both in time and space with a clear distinction on
kinds of water evaporated (blue and green) or polluted (grey) (Chapagain et al. 2011). The volumetric water
footprint is useful mostly in awareness raising and in auditing process, but for a complete impact assessment, it
needs to be analysed in the right context of local economic, environmental or social attributes. The impact and
sustainability of the water footprint depends on its various attributes (e.g. size, time, location and kinds of water
use) and the local conditions in those places where the footprints are located. The impact assessment can be
done both quantitatively as well as qualitatively. Furthermore, the quantitative assessment can be carried out
from different perspectives using either hydrological attributes, ecological attributes, social attributes, or any
combination of these attributes (Chapagain et al. 2011).
Figure 15 shows a full chain of food supply. For example, at location A tomatoes are grown in the farm, stored at
B, processed at C and consumed at D. As these activities can take place at any time of the year, the water use
can be presented along the time axis as well. The variation can either be presented as a continuous curve or
lumped into different columns of information depending upon the scope of the study. The figure breaks down the
information into blue, green and grey water footprints for three different periods in a year for all these four
locations. Though the total water footprint of a product is the sum of all the columns in the whole supply chain of
a product, it is vital to remember the granularity of the background information while interpreting the impacts.
Figure 15: Matrix of water footprint accounts along the value chain of a product.
Time
(sea
sons
)
Wa
ter
foo
tprin
t
m3
Locations
Locat
ion
A
Locat
ion
B
Locat
ion
C
Locat
ion
D
Grey WF
Green WF
Blue WF
Legend
Source: Chapagain et al. (2011)

WRAP and WWF working together for a world without waste 45
Figure 16 presents an illustration of water footprint accounting along the supply chain of a product where the
largest water footprint occurs at the sourcing of raw material phase. As 100% of water footprint is blue at this
stage, it is analysed in the context of blue water availability at sourcing region. As it is seen that most of the
water footprint is below the available water quantity curve, the resulting negative impacts might be lower
compared to the one at consumption stage. At consumption stage, the water footprint is entirely grey in this
case, meaning that there is no evaporation or losses of blue water from the immediate hydrology. However, as it
would take almost all the blue water available to assimilate the emitted pollution at consumption at this time of
the year at this location, the impacts will be severe from the hydrological perspectives.
Figure 16: Water footprint and water availability along the value chain of a product
Grey
WF
Water quantity Water quantity Water quantity
Location C
– consumption/disposal
Location B
– processing
Location A
– sourcing raw materials
Blue WFA
va
ilab
le w
ate
r
Ava
ilab
le w
ate
r
Jan
Feb
Mar
Apr
May
Jun
Jul
Aug
Sep
Oct
Nov
Dec
Jan
Feb
Mar
Apr
May
Jun
Jul
Aug
Sep
Oct
Nov
Dec
Jan
Feb
Mar
Apr
May
Jun
Jul
Aug
Sep
Oct
Nov
Dec
Grey WF
Blue WF
Ava
ilab
le w
ate
r
The use of water always has an environmental impact. In water rich countries, like the UK, this is generally small
and is concentrated in certain areas of the country (such as East Anglia) and is restricted to certain times of the
year. Although blue water abstraction for agriculture is less than 1% of the total, in some catchments and at peak
times it can exceed abstraction for domestic water supply. However, in water poor countries, water use can have
severe impacts, for example, in Morocco, where water demand for horticultural irrigation has lowered the water
table to the detriment of future supplies for all sectors. The impact of the UK‟s water footprint, both domestically
and overseas, has environmental and social consequences.

WRAP and WWF working together for a world without waste 46
References
AIC (2008) Fertiliser Statistics 2008 Report. AIC, Peterborough.
Aldaya, M. M., J. A. Allan & A. Y. Hoekstra (2009) Strategic importance of green water in international crop trade.
Ecological Economics, 69(4), 887-894.
Allan, J. (1996) The political economy of water: reasons for optimism but long-term caution. In J. E. Allan (ed.),
Water, Peace and the Middle East: Negotiating Resources in the Jordan Basin. Tauris Academic Studies,
London.
Allan, J. A. (2001) The Middle East water question: Hydropolitics and the global economy. I.B. Tauris, London.
Audsley, E., M. Brander, J. Chatterton, D. Murphy-Bokern, C. Webster & A. Williams (2010) How low can we go?
An assessment of greenhouse gas emissions from the UK food system and the scope for to reducetion
them by 2050. How low can we go? WWF- UK, and the Food Climate Research Network.
Beccali, M., M. Cellura, M. Iudicello & M. Mistretta (2009) Resource Consumption and Environmental Impacts of
the Agrofood Sector: Life Cycle Assessment of Italian Citrus-Based Products. Environmental
Management, 43(4), 707-724.
Brinkley, A. & S. Less (2010) Carbon Omissions Consumption‐based accounting for international carbon
emissions. Policy Exchange, London.
Brook Lyndhurst (2008) London‟s Food Sector GHG Emissions: A Report for the Greater London Authority.
London.
BSI (2008) Guide to PAS 2050: How to assess the carbon footprint of goods and services. British Standards
Institution.
BSI Group & Carbon Trust (2008) PAS 2050:2008 : specification for the assessment of the life cycle greenhouse
gas emissions of goods and services. British Standards Institution.
Cadbury (2008) Dairy Milk Carbon Footprint [online].
http://www.cadbury.com/ourresponsibilities/purplegoesgreen/Pages/CarbonFootprint.aspx [accessed 15
February 2008]
Cederberg, C., U. M. Persson, K. Neovius, S. Molander & R. Clift (2011) Including Carbon Emissions from
Deforestation in the Carbon Footprint of Brazilian Beef. Environmental Science & Technology, 45(5),
1773-1779.
Chapagain, A. K. (2006) Globalisation of water; Opportunities and threats of virtual water trade. Leiden, Balkema.
Chapagain, A. K. & A. Y. Hoekstra (2004) Water footprints of nations. Value of Water Research Report Series No.
16. UNESCO-IHE, Delft, the Netherlands.
Chapagain, A. K. & A. Y. Hoekstra (2010) The green, blue and grey water footprint of rice from both a production
and consumption perspective. Value of Water Research Report Series No. 40. UNESCO-IHE, and
University of Twente, the Netherlands.
Chapagain, A. K., A. Y. Hoekstra, H. H. G. Savenije & R. Gautam (2006) The water footprint of cotton
consumption: An assessment of the impact of worldwide consumption of cotton products on the water
resources in the cotton producing countries. Ecological Economics, 60(1), 186-203.
Chapagain, A. K. & S. Orr (2008) UK Water Footprint: the impact of the UK‟s food and fibre consumption on
global water resources WWF-UK, Surrey.
Chapagain, A. K. & S. Orr (2009) An improved water footprint methodology linking global consumption to local
water resources: A case of Spanish tomatoes. Journal of Environmental Management, 90(2), 1219-1228.
Chapagain, A. K., D. Tickner & S. Orr (2011) The utility and limits of water footprint approaches. Water, 2,
submitted(doi:10.3390/w20x000x).
Davis, J. & C. Haglund (1999) Life Cycle Inventory (LCI) of Fertiliser Production. Fertiliser Products Used in
Sweden and Western Europe. Chalmers University of Technology.
Davis, S. & K. Caldeira (2010) Consumption-based accounting of CO2 emissions. Proceedings of the National
Academy of Science, 107(12), 5687–5692.
DECC (2010) Local and Regional CO2 Emissions Estimates for 2005-2008 [online]. DECC.
http://www.decc.gov.uk/en/content/cms/statistics/climate_change/gg_emissions/uk_emissions/2008_loc
al/2008_local.aspx
DEFRA (2005) Food transport: The Validity of Food Miles as an Indicator of Sustainable Development [online].
Defra. http://statistics.defra.gov.uk/esg/reports/foodmiles/default.asp
Defra (2006) Animal Health and Welfare Strategy indicators: headline indicator 4B [online]. Defra.
http://www.defra.gov.uk/foodfarm/policy/animalhealth/eig/indicators/h4b.htm [accessed 9 September
2009]
Defra (2008a) Family Food in 2007: A report on the 2007 Expenditure and Food Survey. Defra, London, UK.
Defra (2008b) Future Water: The Government‟s water strategy for England. Defra Report. UK.

WRAP and WWF working together for a world without waste 47
Defra (2009a) Environmental Indicators In Your Pocket 2009 [online].
http://www.defra.gov.uk/evidence/statistics/environment/eiyp/pdf/eiyp2009.pdf
Defra (2009b) Understanding the GHG impacts of food preparation and consumption in the home [online]. Defra.
http://randd.defra.gov.uk/Document.aspx?Document=FO0409_8192_FRP.pdf
Defra (2010a) 2010 Guidelines to Defra / DECC's GHG Conversion Factors for Company Reporting [online]. Defra.
http://www.defra.gov.uk/environment/business/reporting/conversion-factors.htm
Defra (2010b) Statistical release 16 december 2010 survey of commercial and industrial waste arisings 2010 –
final results [online]. http://www.defra.gov.uk/evidence/statistics/environment/waste/documents/stats-
release101216.pdf [accessed 10 January 2010
DTI (2002) Energy Consumption In The UK. DTI, London, UK.
Environment Agency (2008) Water resources in England and Wales - current state and future pressures.
Environment Agency, UK.
ERM (2009) Scoping LCA of Pork Production. BPEX, Kenilworth.
Falkenmark, M. (2003) Freshwater as shared between society and ecosystems: from divided approaches to
integrated challenges. Philosophical Transactions of the Royal Society B: Biological Sciences, 358(1440),
2037-2049.
Falkenmark, M. & G. Lindh (1974) How can we cope with the water resources situation by the year 2015? Ambio,
3(3-4), 114-122.
FAO (2003a) AQUASTAT 2002. Food and Agriculture Organization of the United Nations, Rome, Italy.
FAO (2003b) AQUASTAT 2003. Food and Agriculture Organization of the United Nations, Rome, Italy.
FAO (2007) State of the World's Forests 2007. Food and Agriculture Organization of the United Nations, Rome.
FAOSTAT data (2008) FAO Statistical Databases [online]. FAO. http://faostat.fao.org/default.jsp [accessed 10
January 2008]
FAOSTAT data (2010) Food Balance Sheets [online]. FAO. http://faostat.fao.org/site/291/default.aspx [accessed
10 January 2010]
Forster, P., V. Ramaswamy, P. Artaxo, T. Berntsen, R. Betts, D. W. Fahey, J. Haywood, J. Lean, D. C. Lowe, G.
Myhre, J. Nganga, R. Prinn, G. Raga, M. Schulz & R. V. Dorland (2007) Changes in Atmospheric
Constituents and in Radiative Forcing. In S. Solomon, D. Qin, M. Manning, Z. Chen, M. Marquis, K. B.
Averyt, M.Tignor & H. L. Miller (eds.), Climate Change 2007: The Physical Science Basis. Contribution of
Working Group I to the Fourth Assessment Report of the Intergovernmental Panel on Climate Change.
Cambridge University Press, Cambridge, UK and New York, NY, USA.
Herzog, T. (2009) World Greenhouse Gas Emissions in 2005,. World Resources Institute, Washington DC.
Hoekstra, A. Y. & A. K. Chapagain (2008) Globalization of Water: Sharing the Planet‟s Freshwater Resources.
Blackwell Publishing Ltd, Oxford, UK.
Hoekstra, A. Y., A. K. Chapagain, M. M. Aldaya & M. M. Mekonnen (2011) The Water Footprint Assessment
Manual: Setting the Global Standard. Earthscan.
ITC (2006) PC-TAS version 2000-2004 in HS or SITC, CD-ROM. International Trade Centre, Geneva.
ITC (2009) PC-TAS version 2004-2008 in HS or SITC, CD-ROM. International Trade Centre, Geneva.
James (2010) Methodology for assessing the climate change impacts of packaging optimisation under the
Courtauld Commitment Phase 2. WRAP, Banbury.
Krol, M. S., A. Jaeger, A. Bronstert & J. Krywkow (2001) The semi-arid integrated model (SIM), a regional
integrated model assessing water availability, vulnerability of ecosystems and society in NE-Brazil.
Physics and Chemistry of the Earth, Part B: Hydrology, Oceans and Atmosphere, 26(7-8), 529-533.
Langley, J., A. Yoxall, G. Heppell, E. Rodriguez-Falcon, S. Bradbury, R. Lewis, J. Luxmoore, A. Hodzic & J. Rowson
(2010) Food for Thought? - A UK pilot study testing a methodology for compositional domestic food
waste analysis. Waste Management & Research, 28(3), p. 220-227.
Lewis, E. (2010) Uncovering water losses in UK household food waste: A critical assessment of the water
offsetting potential arising from the waste of beef, potatoes and tomatoes. Kings College of London.
Lundqvist, J., C. de Fraiture & D. Molden (2008) Saving Water: From Field to Fork – Curbing Losses and Wastage
in the Food Chain. SIWI Policy Brief. SIWI.
Macdiarmid J, Kyle J, Horgan G, Loe L, Fyfe C, Johnston A & McNeill G (2011) Livewell - a balance of healthy and
sustainable food choices. WWF-UK, UK.
Martínez-Fernández, J. & M. A. Selma (2004) Assessing the sustainability of Mediterranean intensive agricultural
systems through the combined use of dynamic system models, environmental modelling and
geographical information systems. Edward Elgar Publishing, Cheltenham.
McAlpine, C. A., A. Etter, P. M. Fearnside, L. Seabrook & W. F. Laurance (2009) Increasing world consumption of
beef as a driver of regional and global change: A call for policy action based on evidence from
Queensland (Australia), Colombia and Brazil. Global Environmental Change, 19(1), 21-33.
Mekonnen, M. M. & A. Y. Hoekstra (2010) A global and high-resolution assessment of the green, blue and grey
water footprint of wheat. Hydrology and Earth System Sciences, 14(7), 1259-1276.
WRAP and WWF working together for a world without waste 48
Milà i Canals L, A. Hospido, R Clift, M Truninger, B Hounsome & G. Edwards-Jones (2007) Environmental effects
and consumer considerations of consuming lettuce in the UK winter. LCA in Foods 5th International
Conference. Sweden.
Postel, S. L., G. C. Daily & P. R. Ehrlich (1996) Human appropriation of renewable fresh water. Science, 271,
785-788.
Pretty, J. N., A. S. Ball, T. Lang & J. I. L. Morison (2005) Farm costs and food miles: An Assessment of the full
cost of the UK weekly food basket. Food Policy, 30(1), 1-19.
Quested, T. & H. Johnson (2009) Household Food and Drink Waste in the UK. WRAP, Banbury.
Resource Futures (2009) Municipal Waste Composition: A Review of Municipal Waste Component Analyses
[online]. Defra.
http://randd.defra.gov.uk/Default.aspx?Menu=Menu&Module=More&Location=None&Completed=0&Pro
jectID=15133 [accessed 20 January 2011
Ridoutt, B. G., P. Juliano, P. Sanguansri & J. Sellahewa (2009) Consumptive water use associated with food
waste: case study of fresh mango in Australia. Hydrology and Earth System Sciences Discussions, 6,
5085–5114.
Ridoutt, B. G. & S. Pfister (2009) A revised approach to water footprinting to make transparent the impacts of
consumption and production on global freshwater scarcity. Global Environmental Change, 20(1), 113-
120.
Rockström, J. (2001) Green water security for the food makers of tomorrow: windows of opportunity in drought-
prone savannahs. Water Science and Technology, 43(4), 71-78.
Ruini, L. & M. Marino (2009) LCA of semolina dry pasta. EC, Brussels.
SABMiller & WWF (2009) Water footprinting: Identifying & addressing water risks in the value chain. SABMiller,
and WWF-UK, Surrey, England.
Sakaorat, K., P. Woranee, S. Phanida & P. Harnpon (2009) Life Cycle Assessment of Milled Rice Production: Case
Study in Thailand. European Journal of Scientific Research, 30(2), 195-203.
Scanlon, B. R., I. Jolly, M. Sophocleous & L. Zhang (2007) Global impacts of conversions from natural to
agricultural ecosystems on water resources: Quantity versus quality. Water Resour. Res., 43(3),
W03437.
Sjöström, M. & G. Ostblom (2010) Decoupling waste generation from economic growth : An analysis of the
swedish case. Ecological Economics, 69, 1545-1552.
Solomon, S., D., D. Qin, M. Manning, Z. Chen, M. Marquis, K. B. Avery, T. M. & H. L. Miller (2007) Contribution of
Working Group I to the Fourth Assessment Report of the Intergovernmental Panel on Climate Change
Cambridge University Press, Cambridge, United Kingdom.
Stehfest, E., L. Bouwman, D. van Vuuren, M. den Elzen, B. Eickhout & P. Kabat (2009) Climate benefits of
changing diet. Climatic Change, 95(1), 83-102.
Tassou, S. A., G. De-Lille & Y. T. Ge (2009) FO0405 Greenhouse Gas Impacts of Food Retailing. Defra, London,
UK.
Tesco (2008) Our Carbon Label Findings [online].
http://www.tesco.com/assets/greenerliving/content/documents/pdfs/carbon_label_findings.pdf
[accessed 16 October 2010]
The Economist (2009) A hill of beans: America‟s food-waste problem is getting worse [online].
http://www.economist.com/node/14960159 Nov. 26th 2009]
Watkiss, P., A. Smith, G. Tweddle, A. McKinnon, M. Browne, A. Hunt, C. Treleven, C. Nash & S. Cross (2005) The
Validity of Food Miles as an Indicator of Sustainable Development. Defra, London, UK.
Wiedmann, T., R. Wood, M. Lenzen, J. Minx, D. Guan & J. Barrett (2008) Development of an Embedded Carbon
Emissions Indicator – Producing a Time Series of Input-Output Tables and Embedded Carbon Dioxide
Emissions for the UK by Using a MRIO Data Optimisation System. Defra, London, UK.
Wiltshire, J., Sarah Wynn, James Clarke, Brian Chambers, Bruce Cottrill, Dan Drakes, Jason Gittins, Chris
Nicholson, Kate Phillips, Rachel Thorman, Don Tiffin, Odelle Walker, Gary Tucker, Robin Thorn, Andrew
Green, Anke Fendler, Adrian Williams, Pat Bellamy, Eric Audsley, Julia Chatterton, Dave Chadwick & C.
Foster (2009) Scenario building to test and inform the development of a BSI method for assessing
greenhouse gas emissions from food. Defra, London.
WRAP (2010a) Love food hate waste [online]. WRAP. http://www.lovefoodhatewaste.com/
WRAP (2010b) One million tonnes of waste prevented through Courtauld success [online].
http://www.wrap.org.uk/media_centre/press_releases/one_million_tonnes.html [accessed 10 January
2010
WWF-UK (2009) One Planet Food Programme [online].
http://www.wwf.org.uk/what_we_do/changing_the_way_we_live/food/
WWF-UK (2010) Tasting The Future: Collaborative innovation for One Planet Food. In N. Carey (ed.). WWF,
ADAS, FDF and Food Ethics council, UK.

WRAP and WWF working together for a world without waste 49
WWF (2010) Living planet report 2010. WWF-International, Gland, Switzerland.
Yoshikawa, N., K. Amano & S. K. (2008) Evaluation of Environmental Loads Related to Fruit and Vegetable
Consumption Using the Hybrid LCA Method: Japanese Case Study. Proceedings of Life Cycle Assessment
VIII. Seattle, Washington.
Zespri, New Zealand Ministry of Agriculture & Forestry, Landcare Research, Massey University, Plant & Food
Research & AgriLINK (2009) Carbon Footprint of Kiwi Fruit. Zespri, Mount Maunganui, New Zealand.

www.wrap.org.uk