short selling in extreme events
TRANSCRIPT

Short selling in extreme events?
Marco Valerio Geracia,1,∗, Tomas Garbaraviciusb, David Veredasc,d
aCambridge-INET Institute, University of Cambridge, CB3 9DD Cambridge, UKbBank of Lithuania, Gedimino pr. 6, 01103 Vilnius, Lithuania
cVlerick Business School, Bolwerklaan 21, 1210 Brussels, BelgiumdUniversity of Ghent, Reep 1, 9000 Gent, Belgium
Abstract
We study the association between daily changes in short selling activity and financial stock prices
during extreme events using TailCoR, a measure of tail correlation. For the largest European and
US banks, as well as European insurers, we uncover a strong relation during exceptional (extreme)
days and a weak relation during normal (average) days. Examining days with large increases
in short positions and large downfalls in stock prices, we find evidence of both momentum and
contrarian short selling taking place. For North American bank stocks, contrarian short selling
appears more practiced than for European bank and insurance stocks. We find that the uncovered
relationship decreases with firm size and increases during ban periods, which is in line with short
selling becoming more informative when constrained.
Keywords: short selling, tail correlation
JEL Classification: G15, G18, G28
?Previously entitled “Short selling in the tails”.∗Corresponding authorEmail address: [email protected] (Marco Valerio Geraci)
Preprint submitted to Journal of Financial Stability September 25, 2018

1. Introduction
In this paper, our objective is to shed more light on the concern among policy makers that
short selling can exacerbate price downfalls. Whereas most of the literature has analysed the
average relation between short selling and price changes, our study focuses on the relation that
occurs during extreme events. We propose to use TailCoR, a new measure developed by Ricci &5
Veredas (2013) that stems from the literature on tail correlations. TailCoR allows to decompose
the relation between short selling activity and stock returns into the relation that occurs during
normal (average) days and the relation that occurs during exceptional (extreme) days.
We examine the relation between short selling and stock returns for the largest European and
North American banks, as well as for the largest European insurers, from July 2006 to September10
2013. Our indicator for short selling activity (short interest) is the daily number of shares on loan.
This is a well-established indicator of short selling activity that has been used by, among others,
Richardson et al. (2017) and Jones et al. (2016). We find that the average association between
short selling and price changes, is quite weak, whereas it is strong in the tails of the empirical
distribution i.e., during extreme events. Moreover, large changes in short selling positions are15
strongly and negatively related to large changes in stock prices.
Previous studies have focused on US stock markets, and have found that short selling is
associated, on average, with positive contemporaneous returns and negative future returns (Dechow
et al., 2001; Asquith et al., 2005; Diether et al., 2009b; Boehmer et al., 2010). These studies
show that short sellers are capable of predicting future returns and concentrate on stocks that are20
overpriced relative to fundamentals. Our results for large North American banks confirm these
findings by showing that there is a strong relationship in the positive tails of the joint distribution
of short interest changes and returns. That is, we find that for North American banks, extreme
short interest changes are more strongly related to extreme positive returns than extreme negative
returns. This indicates that there is evidence of short sellers acting as contrarian traders.25
Consistent with the findings of Curtis & Fargher (2014), we also find evidence of momentum
trading by short sellers taking position against large North American bank stocks. Our analysis
using conditional tail frequencies highlights that, in episodes of extreme short selling activity,
contemporaneous returns are extremely negative (i.e., in their 10% empirical quantile) 14.5% of
the time. We find that, during 50% of these episodes, prices tend to revert within 1 to 2 trading30
days, which suggests that part of these price downfalls are not due to informative short selling.
2

Our sample spans banks of several European countries, which allows us to compare our results
obtained for North American banks. We find that, in the case of European bank stocks, contrarian
short selling is much less prevalent. Our measure of tail correlation shows that, for 70% of the
European banks in our sample, extreme positive short interest changes are more strongly related to35
extreme negative returns than to extreme positive returns. This suggests that there are differences
between short selling on European markets and North American markets. Moreover, results for
European banks provide some basis for the concerns of European regulators that banned short
selling during the European sovereign debt crisis.
For European financial companies, we find that the relationship between extreme negative price40
changes and extreme positive returns is stronger for firms with smaller market capital. There can
be two possible explanations for this result. First, smaller firms are likely to have a lower absolute
(and possibly relative) amount of free float capital, which makes their shares less liquid (Glosten
& Harris, 1988). Second, smaller firms are more susceptible to information asymmetry between
specialist short sellers and buyers.45
Our paper is close in spirit to the studies of Boehmer & Wu (2013) and Shkilko et al. (2012),
who assessed the relation between short selling and stock prices on days of extreme price changes.
Compared to their approach, we do not impose selection criteria but use TailCoR, a non-parametric
measure that makes use of the entire sample of observations. Our results are closer to those of
Shkilko et al. (2012), who found that short sellers exacerbate price declines, than those of Boehmer &50
Wu (2013), who found that short sellers act as liquidity providers during transient price turnarounds,
buying when the price drops and selling when the price jumps unusually high.
Our study also contributes to the literature on short selling bans. Whereas, prior studies have
focused on the effect of short selling bans on price levels and returns (e.g., Boehmer et al., 2008;
Chang et al., 2007), we study the impact of covered short selling bans on the association between55
(remaining) short selling activity and returns. In addition to the bans introduced in the US and
many European countries following the financial crisis, we also analyse the more recent joint ban of
five European regulators introduced in August 2011, which were not included in the prior studies
of Beber & Pagano (2013) and Bris et al. (2007).
For Canadian and European banks, we find that the 2008 bans were associated with a higher60
relationship between short selling changes and returns. In line with the results of Boehmer et al.
(2013) and Kolasinski et al. (2013), this points towards short selling becoming more informative
3

during ban periods. Conversely, we did not find similar results for the 2011 ban period, perhaps
indicating that this more recent ban was less effective towards impeding uninformative short selling.
Although TailCoR has several advantages (it does not depend on specific distributional assumptions,65
and it is straightforward to compute, as no optimisations are needed), similarly to linear correlation,
it does not make it possible to draw conclusions about the direction of causality. This is a limitation
of our study that we address in the supplementary online material. We provide several additional
results using different leads and lags of our short selling measure and find that short sellers can
anticipate large price declines by about one to four trading days.70
Overall, our study provides evidence on the relationship between short selling and extreme price
changes that could motivate future work in this direction. For example, our analysis could be
extended using a bivariate autoregressive model of conditional quantiles, such as that of White
et al. (2015), applied to short selling and price changes.
The remainder of the paper is structured as follows. In Section 2, we introduce the securities75
lending market, from which our data comes from. In Section 3, we describe our data in more depth
and in Section 4 we explain our methodology. In Section 5, we report our results and in Section 6
we present our conclusions.
2. Short Selling and Securities Lending
A short sale relates to the sale of a security that is not owned by the seller at the time of the80
agreement.1 There are two main mechanisms to sell a security short. The first is to engage in a
covered short sale by which the seller borrows the security before selling it short. By contrast, a
short sale is considered “naked” or uncovered if the seller has not borrowed the stock beforehand,
potentially giving rise to a failure to deliver the security to the buyer at the time of settlement.
Figure 1 highlights the two steps that occur in a covered short sale. In the first step, the short85
seller borrows the security from a securities lender, either directly or through an intermediary.
Securities lenders are generally institutional investors, such as pension funds or insurance companies
that have securities in their portfolios as longer-term investments and from which they wish to obtain
some additional revenue. Securities lending is not their primary activity, which is why securities
1Regulation (EU) No 236/2012 of the European Parliament and of the Council of 14 March 2012 on short selling
and certain aspects of credit default swaps.
4

lending is often outsourced to intermediaries such as custodian banks, asset managers, or dealers90
lending securities on behalf of beneficial owners. Once the short seller has obtained the shares
in step one, these shares will be sold at the market price to a buyer who is usually unaware of
participating in a short sale. In the second step of the operation, the short seller will buy back the
shares from the market. If expectations were correct, the short seller will buy the shares back at a
lower price, thereby making a gain from the price difference. Finally, the short sale is closed when95
the short seller returns the securities to the lender.
Fig. 1. Covered short selling. The figure shows the steps involved in a covered short sale. In the first step,
the short seller borrows the security from a lender. The short seller then sells the borrowed security in the
market. In the second step, the short seller buys an equivalent security back from the market so to return
it to the original holder, the security lender. If the price has declined between step 1 and step 2, the short
seller will have made a profit from the trade.
5

In addition to purely directional short selling, there are also other motives to borrow and short
sell a stock. For example, various arbitrage trading strategies also use short selling and stock
borrowing—e.g. convertible arbitrage, pairs trading, or index arbitrage.2 Given that short selling
is a high-risk operation, sophisticated market participants, such as investment banks and hedge100
funds, usually adopt these strategies.
Particularly in Europe, where taxes on dividend payments vary greatly from country to country,
dividend arbitrage is yet another motive for stock borrowing. Contractually, beneficial owners
always retain the right to receive any dividend payments made on the shares they own. However, it
is the holder of the stock who physically receives the dividend payment and is thus subject to a tax105
obligation. For this reason, a stockholder may lend out the shares to an agent in another country
and agree to receive in return a negotiated percentage of a dividend pay-out (usually from 95% to
98%), which is much larger than an after-tax payment in a home country.
It is worth mentioning here the role of the securities lending market during periods in which
short selling is banned. Covered short selling bans prohibit the short sale of stocks that are not110
owned by the seller at the time of the sale. This means that short selling borrowed stocks is
prohibited, but it is still possible to short a stock through other means.
For example, synthetic short positions are still achievable using put options, credit default swaps,
and inverse exchange traded funds (ETFs). Grundy et al. (2012) show that, during the September
2008 ban implemented in the US, the transaction prices for options substantially increased due115
to their higher demand. During the same period, Karmaziene & Sokolovski (2017) found that
shorting of ETFs increased as short sellers were trying to circumvent the short selling prohibition.
Traders engaging in short selling through options are more sophisticated than ordinary short sellers
(Kolasinski et al., 2013). Moreover, the higher costs of short selling through options makes it likely
that these short sellers are also more informed.120
Short selling during the ban was also possible for registered market makers, including liquidity
providers, specialists, and options market makers, that were exempted from the short selling
prohibition Boehmer & Wu (2013). The exemption was put in place to allow market makers
to continue making markets smoothly, but was not valid for informal market makers, such as high
frequency traders and algorithmic traders, who often make markets in large-cap and active stocks125
2See Faulkner (2007) for an overview of the role of stock lending in these strategies.
6
(Hendershott et al., 2011; Menkveld, 2013). For the US, the ban exemption was paired with a
borrow requirement i.e., market makers were required to locate and borrow shares prior to short
selling them (Blocher & Ringgenberg, 2018).
Our indicator of short selling activity, which is based on shares on loan, should capture part of
the synthetic short selling by entities trying to circumvent the ban. This is because market makers130
engaging in the other side of the trade might resort to the securities lending market to hedge their
exposure. For example, imagine an entity would like to buy a put option to create a synthetic short
position in the underlying asset. The market maker facing this trade, might hedge its exposure by
shorting the underlying asset.
As argued by Boehmer & Wu (2013), market makers might have multiple reasons for borrowing135
and short selling a stock apart from hedging. For example, they might engage in a covered short
sale simply to provide liquidity to a buyer. For this reason, during ban periods, our indicator based
on shares on loan represents only an upper limit of the short selling by entities trying to circumvent
the ban.
3. Data140
Our dataset is composed of securities lending data provided by Markit Securities Finance
(MSF) that acquired Data Explorers, the former provider of such data. MSF claims that it
offers the most comprehensive dataset on securities lending activities by using, among other things,
a so-called “give-to-get” data gathering and distribution model that involves key players in the
securities lending market—banks, prime brokers, custodians, agent lenders, hedge funds and other145
institutional investors. Security lenders provide data on the inventory of securities they make
available to borrow (i.e. supply) as well as the amount of securities that they actually lend out (i.e.
demand). Security borrowers report information on the securities that they borrow (i.e. demand).
MSF then cleans the data to avoid double counting.
3.1. Sample and Short Interest Indicator150
Our data sample includes daily information on prices and stock borrowing activity of 104
constituents of the Stoxx Europe 600 Banks, the Stoxx Europe 600 Insurance, and the Stoxx
7

North America 600 Banks stock indices.3 We chose stocks that are included in major stock indices
to ensure that these are relatively liquid in the secondary trading market and securities lending
market.155
The sample consists of 47 European banks, 35 European insurance companies and 22 North
American banks.4 Our data comprises over 8,895 daily observations in eight countries from 3 July
2006 and ends on 30 September 2013.5
During some periods of our sample, short selling—both naked and covered—was banned. We
collected short selling ban dates from the websites of national financial markets authorities of six160
countries: Canada, France, Italy, Spain, the UK, and the US. We concentrated on covered short
selling bans because our indicator of short selling activity primarily accounts for covered short
selling.
We constructed subsamples of the pre-ban and post-ban periods as follows. For a given stock,
with d ban observations, we considered the last d observations prior to ban implementation for the165
pre-ban sample. Similarly, we considered the first d observations after the end of the ban for the
post-ban sample. In this way, we kept the number of observations relating to pre- and post-ban
periods equal to the number of ban period observations. For those stocks that were banned several
times during the sample period (e.g., Italian or Spanish bank stocks), we only considered the first
ban period for the construction of the ban, pre-ban, and post-ban subsamples. This was done so170
to avoid pre- and post-ban periods overlapping in the case of several bans.
To construct the best indicator for short selling activity on a given stock, we make use of a
variable provided by MSF called Short Loan Quantity (SLQ). SLQ is the number of shares on
loan of a given stock, filtered in order to estimate short selling activity. Based on transaction-level
data, the proprietary algorithm applied by MSF removes those stock borrowing transactions that175
are clearly unrelated to short selling, because, for example, they are financing trades or are part of
dividend arbitrage or convertible arbitrage trades.6
Short Loan Quantity is settlement data, which implies that it refers to transactions that
3We provide a detailed list of the firms in our sample in the online supplementary material.4Classified as such by the Industry Classification Benchmark. The main criterion is the main source of revenue.5During some holidays markets were closed for trading, but open for settlement. In these cases, prices were
reported as constant by MSF, while borrowing amounts still varied. Since our prime interest is the relationship
between short selling and stock price changes, we excluded these days.6In the online supplementary material, we show that our main results are robust to the dividend arbitrage effect.
8

were executed three days prior to the reported date, given that in the securities lending market
transactions generally settle at T + 3 (as also stock purchase/sale in most equity markets).7 Due180
to T + 3 settlement, for our calculation we have shifted observations of SLQ backwards by three
trading days, so that on a particular date the SLQ would relate to the trading and price change
on that same day.
We standardise SLQ by the number of shares outstanding (SO) and call this new variable short
interest (SI). Thus, for firm i on day t, the short interest is:185
SIi t =SLQi tSOi t
, (1)
i.e., the number of shares sold short as a percentage of the shares outstanding.
Since we are interested in day-to-day changes in short selling and stock prices, we work primarily
with first differences.
∆SIi t = SIi t − SIi t−1, (2)
ri t = log(pi t)− log(pi t−1). (3)
To avoid self-created jumps in our proxy for change in short interest ∆SIi t, we excluded
observations that related to days on which the number of shares outstanding changed. By discarding
such observations, we remove the instances of abrupt changes in our short selling indicator that are
not due to short selling.190
Our indicator overcomes some of the limitations of other similar measures for short selling
activity .
First, in the past, short interest was generally publicly available bi-monthly, and this low
frequency posed an analytical limitation in early studies. Our SI is a daily measure capable of
capturing changes in short positions in a timely manner.195
Second, unlike order/trade data (as used in e.g. Boehmer et al., 2008; Christophe et al., 2009;
Diether et al., 2009a), which only collects trades flagged as short sales, short interest can capture
both subtractions from and additions to short sales.
7Settlement does not mean that the loan is closed. Rather, it implies that the transfer has taken place and the
securities have been delivered to the borrower. The loan is open until expiry or a recall from the lender, according
to contractual agreements.
9

Despite these advantages, our indicator is still an imperfect measure of short selling activity.
According to Cohen et al. (2007), ∆SIi t can be related to shifts in the demand for shorting of200
stock i, or shifts in the supply, or both. Since stocks in our sample are relatively liquid, they should
not be subject to supply constraints (Asquith et al., 2005), and thus our proxy should principally
capture changes in demand to sell short.
Another limitation is that our indicator does not capture short positions opened and closed
within the same day. Reed (2002) reports that, for the US equity market, the median loan duration205
is three days, but the mode is 1 day. Thus, potentially, we could be missing short selling activity
that occurs at the intraday frequency. According to Boehmer et al. (2013) and Menkveld (2013),
however, a substantial part of intraday short selling activity may be attributed to high-frequency
liquidity providers (including, but not limited to, algorithmic traders), whose trades should not be,
at least a priori, extreme.210
3.2. Descriptive Data Analysis
Table 1 provides a comparison of data characteristics during pre-ban, ban, and post-ban periods.
Panel A of Table 1 reports median values and interquartile ranges of the variables in levels, SIi t
and pi t.8 To make prices comparable across firms, we divided each firm’s stock price by the its
stock price on October 17, 2012.215
Panel A of Table 1 shows that the median level of short interest was lower by 4% and 50% for,
respectively, European banks and insurers during ban periods compared to non-ban periods. For
North American banks, short interest was lower by 27% during ban periods compared to non-ban
periods. For all three groups of stocks, short selling activity has decreased during ban periods, in
line with the primary intent of bans.220
As mentioned in the previous section, at least part of the remaining short selling activity that is
observed during ban periods may be attributed to market makers (including specialists and option
market makers) that were exempted from the ban. The short selling activity of these exempted
market makers may be the result of hedging synthetic short positions provided to short sellers
that were trying to circumvent the ban. Thus, our results give us an indication of the potential225
magnitude of this type of short selling.
8We thank an anonymous referee for suggesting this analysis.
10

Panel A of Table 1 also shows that the median prices of European bank and insurance stocks were
respectively 39% and 30% lower during the ban period compared to the pre-ban period. In contrast,
during ban periods affecting North American banks, the median price rose by 13% compared to
the pre-ban period. This might be in part the effect of the Trouble Asset Relief Program, which230
coincided with the ban period in the US and might have had a positive effect on the stock prices.
Thus, it seems that bans did not effectively sustain price levels of European financial stocks, whereas
they were effective, to some extent, for North American bank stocks.
Panel B of Table 1 reports descriptive statistics for the differenced variables, ∆SIi t and ri t.
For all three groups of financial firms, Panel B of Table 1 shows that the median changes in short235
interest ∆SIi t were large and negative during the ban period. This suggests that, short sellers were
closing their short positions during ban periods in order to comply with the new regulation.
For the median European banks and insurers in our study, Panel B of Table 1 shows that the
interquartile range of short interest changes (∆SIi t) was lower during ban periods than during non-
ban periods. Since market makers were the only agents allowed to short during ban periods, this240
result suggests that they generate less dispersed short interest changes than banned short sellers,
including informed sellers and speculators. A similar argument can be made if we consider the
median interquartile range of short interest in levels (SIi t), shown in Panel A of Table 1.
We do not observe the same result for North American banks, for which the median interquartile
ranges of short interest and short interest changes are higher during ban periods than during non-245
ban periods. This might be due to the small sample size available for North American banks during
the ban period, which was, at most, only 14 trading days long. Short sellers closing their short
positions to comply with the ban will induce a higher interquartile range of SI and ∆SI. Moreover,
as noted by Boehmer & Wu (2013), the first day of the ban was a ”triple witching day” i.e., the last
day of trading before expiration of index options, equity options on individual stocks, and index250
futures. Such days are characterised by large order imbalances and excess volatility in the equity
markets. This might explain the large interquartile range of SI and ∆SI observed during ban
periods for North American banks.
Panel B of Table 1 also shows that, during ban periods, the median European bank witnessed
less negative daily changes in its stock price than during the pre-ban period. We do not observe this255
effect for North American banks, for which median pre-ban returns were positive and the median
ban returns were heavily negative. This might be due to the fact that bans for North American
11

banks were implemented after the bankruptcy of Lehman Brothers in mid-September 2008, in an
extremely bearish and volatile market, as can also be noticed from the rows of Panel B of Table 1
relating to median interquartile ranges of returns.260
12

Panel
A:
Vari
able
sin
level
s
SIit
pit
All
sam
ple
Pre
-ban
per
iod
Ban
per
iod
Post
-ban
per
iod
All
sam
ple
Pre
-ban
per
iod
Ban
per
iod
Post
-ban
per
iod
Median
of
medians
Euro
pea
nbanks
1.4
75
1.9
93
1.9
18
1.9
05
141.2
220.0
134.5
128.9
Nort
hA
mer
ican
banks
2.8
25
6.4
13
4.7
02
3.7
33
96.6
30
101.9
114.6
94.4
0
Euro
pea
nin
sure
rs1.4
38
2.9
95
1.4
95
1.9
07
94.8
30
116.7
81.8
30
82.8
40
Median
of
inte
rquartile
ranges
Euro
pea
nbanks
1.4
87
0.9
30
0.6
66
0.8
63
131.5
29.9
022.4
022.3
5
Nort
hA
mer
ican
banks
2.1
08
0.5
32
0.9
47
0.5
95
26.9
50
7.0
25
9.2
37
7.5
43
Euro
pea
nin
sure
rs1.3
94
0.6
93
0.5
78
0.8
26
30.7
90
8.6
39
8.8
17
8.1
88
Panel
B:
Vari
able
sin
firs
tdiff
eren
ces
∆SIit
r it
All
sam
ple
Pre
-ban
per
iod
Ban
per
iod
Post
-ban
per
iod
All
sam
ple
Pre
-ban
per
iod
Ban
per
iod
Post
-ban
per
iod
Median
of
medians
Euro
pea
nbanks
0.0
00
-0.0
16
-0.0
35
-0.0
11
0.0
00
-0.3
13
-0.1
21
0.0
00
Nort
hA
mer
ican
banks
-0.0
02
-1.9
94
-6.8
21
-4.2
10
0.0
00
0.9
18
-1.5
24
-0.6
43
Euro
pea
nin
sure
rs-0
.029
0.0
00
-0.1
33
0.1
14
0.0
19
-0.1
47
-0.1
67
-0.3
34
Median
of
inte
rquartile
ranges
Euro
pea
nbanks
7.2
65
12.9
76.5
87
8.4
33
2.4
72
2.5
76
4.1
61
3.4
35
Nort
hA
mer
ican
banks
13.5
237.8
146.1
431.0
32.2
14
6.7
61
7.8
76
8.4
02
Euro
pea
nin
sure
rs5.9
38
9.7
27
7.8
91
11.0
91.9
81
2.8
50
3.7
29
3.5
23
Table
1.
Des
crip
tive
stati
stic
s.P
anel
Ash
ows
the
med
ian
valu
esand
inte
rquart
ile
ranges
of
daily
short
inte
rest
and
stock
pri
ces,
(SIit,pit).
Med
ians
and
inte
rquart
ile
ranges
ofSI
are
mult
iplied
by
100
for
vis
ibilit
yre
aso
ns,
soth
at
they
are
per
centa
ge
poin
ts.
For
each
firm
,i,
pri
ces,pit,
are
com
pute
dre
lati
ve
tofirm
i’s
stock
pri
ceon
Oct
ob
er17,
2012,
soth
at
pri
ces
are
100
at
the
base
date
.P
anel
Bsh
ows
the
med
ian
valu
esand
inte
rquart
ile
ranges
of
daily
changes
insh
ort
inte
rest
and
stock
pri
ces,
(∆SIit,rit).
Med
ians
and
inte
rquart
ile
ranges
of
∆SI
are
mult
iplied
by
10,0
00
for
vis
ibilit
yre
aso
ns,
soth
at
they
are
basi
sp
oin
ts.
Med
ians
and
inte
rquart
ile
ranges
ofr
are
mult
iplied
by
100,
soth
at
they
are
per
centa
ges
.
13

To describe the average dependence between short interest changes and returns, we examined
the linear correlation between the two variables.9 For the three groups of firms in our sample,
Figure 2 shows the median correlation between ∆SIi t+h and ri t for leads and lags of up to ten
days, h = [−10, 10], of changes in short interest. The dashed lines represent the interquartile range
of the correlation estimates as a measure of cross-sectional dispersion.265
For all leads and lags, the median correlations are low, between 0.03 and -0.03, and with an
interquartile range between -0.1 and 0.1. At a first glance, Figure 2 could suggest that there is no
relation between changes in short interest and stock prices. However, correlation largely measures
the association that occurs between two variables in normal times or, graphically, the association
around the centre of the joint probability distribution. It does not capture the association at the270
tails, i.e. the relation between extreme changes in short selling and stock prices.
To examine the dependence that occurs during extreme events, we computed the empirical
conditional tail frequencies for each of the 103 firms in our sample. This is the frequency of
observing one of the two variables in its empirical tail given that the other variable is also in its
empirical tail.10275
Figure 3 shows the medians and interquartile ranges of the conditional tail frequencies across the
three groups of firms. Panel A of Figure 3 shows the conditional tail frequency when both variables
are in the same extreme side of their empirical distribution, whereas Panel B of Figure 3 shows the
conditional tail frequency when the two variables are in opposite extremes. The tail event referred
to in the table is for the π = 90% quantile of the variables.11 The last row of each panel shows the280
corresponding probability calculated for a bivariate normal distribution, with variance-covariance
matrix equal to that of the sample variance-covariance matrix between changes in short interest
and stock prices.
Figure 3 shows that the tails of ∆SI and r are substantially heavier than Gaussian i.e., the
probability of observing a joint tail event is usually larger than in the bivariate normal distribution.285
Moreover, across all three groups of firms, Panel B of Figure 3 shows that the probability of r being
9Throughout the paper, we measure linear correlation using the highly robust and efficient Fisher consistent
version of Kendall’s correlation for the normal model, defined as: ρK = sin(π2ρK), where ρK is Kendall’s correlation
(Lindskog et al., 2003; Croux & Dehon, 2010).10For a similar exercise using stock return pairs, see Fortin & Kuzmics (2002).11Results for different levels of π are available on request.
14

-0.1
-0.05
0
0.05
0.1
-10 -8 -6 -4 -2 0 2 4 6 8 10
Europeaninsurers
-0.1
-0.05
0
0.05
0.1
-10 -8 -6 -4 -2 0 2 4 6 8 10
Europeanbanks
-10 -8 -6 -4 -2 0 2 4 6 8 10
NorthAmericanbanks
h
Fig. 2. Correlation between changes in short interest and stock price returns. The figure shows the median
correlation between changes in short interest and stock price returns for different leads and lags (in days)
of the changes in short interest. The figure also plots the upper and lower quartiles of the correlation across
all firms in the three groups.
in its lower tail given that ∆SI is in its upper tail, Pr[rt < Q1−πr ,∆SIt > Qπ∆SI ] is high. For
European banks and insurers, Pr[rt < Q1−πr ,∆SIt > Qπ∆SI ] is higher than all other conditional
tail frequencies, indicating that there is asymmetry in our data.
We analysed the tail episodes characterised by large changes in short selling and large price290
downfalls, [rt < Q1−πr ,∆SIt > Qπ∆SI ], with particular attention. Specifically, we examined the
days successive to these events and checked for price reversions.12 Results provided in full in the
supplementary online material show that in almost 50% of the [rt < Q1−πr ,∆SIt > Qπ∆SI ] cases
analysed, the price downfall recovered within one to two days. Given that price changes that reverse
quickly involve no new information, this seem to suggest that a considerable part of the short selling295
12We thank an anonymous referee for suggesting this exercise.
15

12.9%
12.0%
10.6%
Pr[r>Q(r,π)|ΔSI>Q(ΔSI,π)]
Pr[r<Q(r,1-π)|ΔSI<Q(ΔSI,1-π)]
Multivariatenormal
0.00% 5.00% 10.00% 15.00% 20.00%
10.4%
13.3%
11.2%
Pr[r>Q(r,π)|ΔSI>Q(ΔSI,π)]
Pr[r<Q(r,1-π)|ΔSI<Q(ΔSI,1-π)]
Multivariatenormal
0% 5% 10% 15% 20%
MedianInterquartilerange
15.9%
15.1%
10.9%
Pr[r>Q(r,π)|ΔSI>Q(ΔSI,π)]
Pr[r<Q(r,1-π)|ΔSI<Q(ΔSI,1-π)]
Multivariatenormal
0.00% 5.00% 10.00% 15.00% 20.00%
14.5%
14.5%
12.0%
Pr[r>Q(r,π)|ΔSI>Q(ΔSI,π)]
Pr[r<Q(r,1-π)|ΔSI<Q(ΔSI,1-π)]
Multivariatenormal
0% 5% 10% 15% 20%
10.4%
11.4%
9.1%
Pr[r>Q(r,π)|ΔSI>Q(ΔSI,π)]
Pr[r<Q(r,1-π)|ΔSI<Q(ΔSI,1-π)]
Multivariatenormal
0.00% 5.00% 10.00% 15.00% 20.00%
11.6%
13.7%
8.5%
Pr[r>Q(r,π)|ΔSI<Q(ΔSI,1-π)]
Pr[r<Q(r,1-π)|ΔSI>Q(ΔSI,π)]
Multivariatenormal
0% 5% 10% 15% 20%
PANELB:variableareattheiroppositetails
PANELA:bothvariablesareattheextremeoftheirempiricaldistribution
Europeanbanks NorthAmericanbanks Europeaninsurers
Fig. 3. Conditional tail probabilities of short interest and stock returns. The figure shows the median and
interquartile range of the empirical conditional tail frequencies between returns and changes in short interest
at the empirical quantile π = 90%. The last row of each panel indicates the corresponding probabilities for
a multivariate normal with variance-covariance matrix equal to the sample variance-covariance matrix of
the firms in the given group. Results for different levels of π are available on request.
activity occurring during these [rt < Q1−πr ,∆SIt > Qπ∆SI ] episodes was non-informative.
Although conditional tail frequencies do not allow us to make statements about the direction of
causality, high levels of P [rt < Q1−πr | ∆SIt > Qπ∆SI ] are feared by policy makers. In an attempt to
explore the potential causal relationship in more depth, we studied the conditional tail frequencies
for different lags (in days) of ∆SI and r. Results fully reported in the supplementary online material300
show that P [rt < Q1−πr | ∆SIt+h > Qπ∆SI ] is highest when h = [−1,−4], which suggests that short
sellers anticipate price downfalls one to four days before they occur.
Lastly, Panel A of Figure 3 shows that, for North American banks, the probability of large
16

positive returns conditional on large positive movements in short interest, P [rt > Q1−πr | ∆SIt >
Qπ∆SI ], is high (15.9%), evidencing the occurence of contrarian short selling. These results are also305
consistent with the study of Boehmer et al. (2013) and Diether et al. (2009b), who show that short
sellers in the US equity markets act as contrarian traders, providing liquidity when it is needed.
We do not observe similar evidence of contrarian short selling for European bank stocks and this
might be because short selling is more constrained in European markets. With the exception of the
UK, which has lending supply and borrowing fees similar to those of Canadian and US stocks, Saffi310
& Sigurdsson (2011) show that short sellers are less constrained in North American equity markets
than in European equity markets.
Overall, the data show a lack of linear correlation between changes in short interest and stock
prices, but provides strong evidence of tail relationships.
4. Methodology315
To quantify the dependence between tail changes in short selling and stock prices, we rely on
TailCoR, a measure that takes into account both linear and tail relationships.
4.1. TailCoR
We give an intuitive derivation of the measure in Figure 4 and we refer an interested reader
to Ricci & Veredas (2013) for an in-depth discussion. Figure 4 shows the scatter plot of changes320
in short interest (horizontal axis) and stock prices (vertical axis) for an unnamed bank. Both
variables are standardised (i.e. centred at their medians and scaled by their interquartile ranges) so
to mitigate dependencies between short interest changes and returns that are due to their respective
marginal distributions.13 For notational convenience, we drop the firm subscript, i, and denote the
standardised variables ∆SIt and rt.325
All pairs of observations are projected on the 135-degree line, thereby producing a new random
variable:
Zt =1√2
(rt −∆SIt
). (4)
13An alternative step, proposed by Ricci & Veredas (2013), would be to standardise the variables by their cumulative
marginal distributions, so to eliminate marginal dependencies that go beyond the location and scale. However, under
the assumption of ellipticity, standardising using the median and interquartile range is sufficient.
17

As illustrated in Figure 4, the projected observations Zt sit on the 135-degree line.14
-10
-8
-6
-4
-2
0
2
4
6
8
10
-10 -8 -6 -4 -2 0 2 4 6 8 10
r
ΔSI
Fig. 4. Scatter plot of ∆SIt and rt for an unnamed bank. The figure illustrates changes in short interest
and stock prices centred at their medians and scaled by their interquartile ranges to render them comparable.
To calculate TailCoR, all points are then projected on the 135-degree line.
The degree of dispersion of Zt depends on the strength of the relationship between changes in
short interest and stock prices. With extreme events, the cloud of observations spreads along the
135-degree line more widely, either in the northwest or the southeast quadrants, or both.
TailCoR is defined as the normalised tail interquantile range (at probability level ξ) of Z:
TailCoRξ = sg(ξ)IQRξZ , (5)
where IQRξZ = QξZ − Q1−ξZ is the tail interquantile range of the projection, and sg(ξ) is the330
normalisation (equal to Φ−1(0.75)/Φ−1(ξ), where Φ−1(·) is the inverse cumulative density function
of a normal distribution). The aim of the normalisation is to have a reference number: under
14Note that the vector (1/√
2,−1/√
2) is the eigenvector associated with the largest eigenvalue of a standardised
elliptical random vector with negative relation. In other words, Zt is the first principal component.
18
Gaussianity and no correlation (and hence independence), TailCoRξ equals 1.
If rt and ∆SIt were positively related, then projecting on the 45-degree line would yield a
higher TailCoR. In that case, Zt = (1/√
2)(rt + ∆SIt
)and IQRξZ can be interpreted as a measure335
of contrarian short selling.15 However, since we are primarily interested in the negative association
between changes in short interest and stock prices, we will primarily analyse TailCoR obtained by
projecting along the 135-degree line. If the true relationship is positive, then projecting on the
135-degree line will yield a more conservative value of TailCoR.
Under the assumption of ellipticity (i.e. that the probability contours of the bivariate distribution
of changes in short interest and stock prices are ellipsoids), all dependence is due to the scatter
matrix (a multiple of the covariance matrix) and a common shape parameter, α, which generates
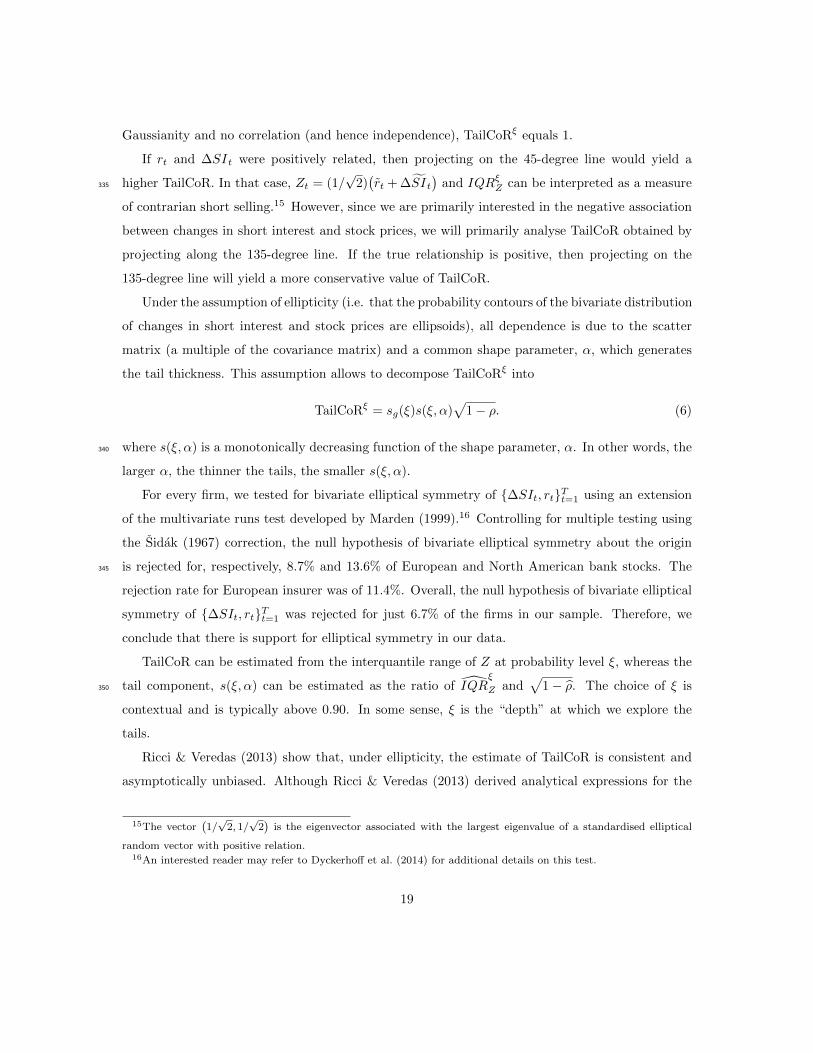
the tail thickness. This assumption allows to decompose TailCoRξ into
TailCoRξ = sg(ξ)s(ξ, α)√
1− ρ. (6)
where s(ξ, α) is a monotonically decreasing function of the shape parameter, α. In other words, the340
larger α, the thinner the tails, the smaller s(ξ, α).
For every firm, we tested for bivariate elliptical symmetry of {∆SIt, rt}Tt=1 using an extension
of the multivariate runs test developed by Marden (1999).16 Controlling for multiple testing using
the Sidak (1967) correction, the null hypothesis of bivariate elliptical symmetry about the origin
is rejected for, respectively, 8.7% and 13.6% of European and North American bank stocks. The345
rejection rate for European insurer was of 11.4%. Overall, the null hypothesis of bivariate elliptical
symmetry of {∆SIt, rt}Tt=1 was rejected for just 6.7% of the firms in our sample. Therefore, we
conclude that there is support for elliptical symmetry in our data.
TailCoR can be estimated from the interquantile range of Z at probability level ξ, whereas the
tail component, s(ξ, α) can be estimated as the ratio of IQRξ
Z and√
1− ρ. The choice of ξ is350
contextual and is typically above 0.90. In some sense, ξ is the “depth” at which we explore the
tails.
Ricci & Veredas (2013) show that, under ellipticity, the estimate of TailCoR is consistent and
asymptotically unbiased. Although Ricci & Veredas (2013) derived analytical expressions for the
15The vector(1/√
2, 1/√
2)
is the eigenvector associated with the largest eigenvalue of a standardised elliptical
random vector with positive relation.16An interested reader may refer to Dyckerhoff et al. (2014) for additional details on this test.
19

standard errors for TailCoR, based on the variance of quantile estimators, the sample estimates of355
these expressions are far from straightforward to estimate. Hence, we restrict our analysis to the
dispersion of TailCoR estimates among the groups of firms analysed, measured by the interquartile
group range of TailCoR estimates.
4.2. Southeast-TailCoR
TailCoR, as we have defined it so far, measures the association of tail events symmetrically.360
That is, it picks up the association between both the lower tail (negative changes in short interest
and positive changes in stock prices) and the upper tail (positive changes in short interest and
negative changes in stock prices).
As discussed earlier, policy makers often motivated the use of bans by fears that short selling
and stock prices are negatively related in times of crisis. For this reason, it is of particular interest365
to us to quantify the tail association between positive changes in short interest and negative changes
in stock prices.
To assess this relationship, we make use of Southeast TailCoR, which focuses on observations
in the southeast quadrant of Figure 4, as more clearly shown in Figure 5.
Southeast TailCoR (SE-TailCoR) is defined as
SE-TailCoRξ = 2sg(ξ)IQRξ+Z , (7)
where IQRξ+Z =
(QξZ − Q0.5
Z
)is the interquantile range between the ξth quantile and the median370
of the projection Z.
Under the assumption that returns and short interest changes follow a normal mean-variance
mixture with uniform asymmetry, Southeast TailCoR can also be decomposed as:
SE-TailCoRξ = 2 sg(ξ) sSE(ξ, α)√
1− ρ(+−), (8)
where ρ(+−) is a positive-negative semi-correlation defined as
ρ(+−) =σ(+−)
σ+∆SIσ
−r, (9)
and where σ+∆SI is the positive semi-variance of ∆SIt, and σ−r is the negative semi-variance of rt.
20

-10
-8
-6
-4
-2
0
2
4
6
8
10
-10 -8 -6 -4 -2 0 2 4 6 8 10
r
ΔSI
Fig. 5. Scatter plot of ∆SIi t and ri t for an unnamed bank focusing on the southeast quadrant. The
figure illustrates positive changes in short interest and negative changes in stock prices. As in the case of
TailCoR, all points are projected on the 135-degree line, but only the southeast part of the interquantile
range is used to compute the Southeast TailCoR.
We call σ(+−) the positive-negative semi-covariance.17
The normal mean-variance mixture is considered a flexible family of multivariate asymmetric
distributions that nests several elliptically symmetric and asymmetric distributions (Mencıa &375
Sentana, 2009). It allows the dependence between ∆SI and r to become stronger at some extremes
of the joint distribution of the variables. Uniform asymmetry means that short interest changes
and returns are assumed asymmetric by the same extent.
The asymptotic distribution of Southeast TailCoR (SE-TailCoR) is not given by Ricci & Veredas
17We define the positive-negative semi-covariance between the changes in short interest and stock price returns as
σ+− = E[(
(∆SIt −∆SI) · I(∆SIt > ∆SI)
)((rt − r) · I(rt < r)
)](10)
where ∆SI is the mean of ∆SI and r is the mean of r. The indicator function I(∆SIt > ∆SI) is equal to one when
∆SIt > ∆SI and zero otherwise. Similarly, I(rt < r) is equal to one when rt < r and zero otherwise.
21

(2013) but it can easily be derived as,
√T ( SE-TailCoRξ − SE-TailCoRξ)
D−→ N (0, 4sg(ξ)2Σ) (11)
where,
Σ =Γ(QξZ)
f2(F−1(ξ))+
Γ(Q0.5Z
f2(F−1(0.5))− 2
Γ(QξZ , Q0.5Z )
f(F−1(ξ))f(F−1(0.5))(12)
The proof follows that of Corollary 1 in Ricci & Veredas (2013).
5. Results380
We calculate TailCoR between changes in short interest and stock price for every firm and we
then analysed group medians. For the remainder of the paper, we display results for ξ = 95%.
Results for TailCoR computed using the full sample of observations and for different values of ξ are
provided in the online supplementary material.
5.1. TailCoR between short interest and stock price changes385
Table 2 shows that the level of TailCoR is high across all firms, reflecting strong tail dependence
between changes in short interest and stock prices. The median values of TailCoR for the three
groups of firms are around 2.08. To get a sense of the order of magnitude of TailCoR, random
simulations from a Student t-distribution with tail parameter α = 2.5 (so heavy tailed) result in
average TailCoR of 1.46.390
For North American banks, the first and third quartiles (shown in parentheses) of TailCoR
suggest that coefficients are tightly dispersed around their median values, whereas for European
banks and insurers the coefficients are more widely dispersed. European insurance companies have
the largest TailCoR, possibly because the market capitalisation of insurers is smaller than that of
banks and thus the liquidity of the former stocks is likely to be lower.395
We compared TailCoR coefficients computed with 135-degree and 45-degree lines and found
that using the 135- rather than 45-degree line resulted in a higher TailCoR for 72% of European
banks, 36% North American banks, and 49% European insurers.18 This result is in line with the
tail conditional frequencies presented in Section 3.2, which showed that North American banks had
18Results for TailCoR computed using the 45-degree line projection is provided in the online supplementary
material.
22

a high empirical frequency when both r and ∆SI are in their positive tails, further evidencing that400
contrarian short selling is taking place in North American markets.
TailCoR ρ√
1− ρ s(ξ, α)
European Banks2.08
(1.88 ; 2.59)
-0.03
(-0.08 ; 0.00)
1.01
(1.00 ; 1.04)
5.08
(4.53 ; 6.30)
North American Banks1.95
(1.81 ; 2.13)
0.03
(-0.03 ; 0.07)
0.99
(0.97 ; 1.01)
4.87
(4.56 ; 5.11)
European Insurers2.33
(1.93 ; 2.87)
0.02
(0.00 ; 0.05)
0.99
(0.97 ; 1.00)
5.69
(4.77 ; 7.05)
Table 2. TailCoR between changes in short interest and stock prices. The table shows TailCoR and linear
correlation between changes in short interest and stock prices for 46 European banks, 35 European insurers
and 22 North American banks. The table also shows the components of TailCoR that depend on the linear
correlation (ρ) and on the tail index (α). The table reports median group values as well as the first and
third quartiles (in parentheses). Here, ξ = 95%. Additional results for different values of ξ are provided in
the supplementary online material.
Table 2 also shows the decomposition of the computed TailCoR coefficients into the component
that depends on the linear correlation between short selling and returns,√
1− ρ, and the component
that depends on the tail association, s(ξ, α). The values indicate that TailCoR is primarily driven
by the association between extreme changes in short interest and extreme changes in stock prices.405
For all three groups of firms,√
1− ρ is close to 1, indicating weak linear association. The tail
components, however, are high, indicating that large positive (negative) changes in short interest
are associated with large negative (positive) changes in stock prices.
5.2. Southeast TailCoR between short interest and stock price changes
We computed Southeast TailCoR and compared it with TailCoR of all other quadrants. We410
found that the former was greater in the majority of pairwise comparisons. Results are shown
in Table 3 and can be interpreted as follows: for 70% of the European banks in our sample, for
example, Southeast TailCoR was found to be greater than Northeast TailCoR.
As was highlighted in Section 3 with the conditional tail frequencies, Table 3 shows evidence
of a tail relationship when short selling is positive and returns are negative. For North American415
23

Northeast-
TailCoR
Northwest-
TailCoR
Southwest-
TailCoR
European banks 70% 70% 76%
North American banks 36% 59% 45%
European insurers 60% 74% 57%
Table 3. Percentage of firms for which Southeast TailCoR was greater than TailCoR computed using other
quadrants. The table shows the percentage of firms for which Southeast TailCoR was greater than TailCoR
computed using other quadrants of the scatter plot of standardized points.
banks, Table 3 also shows evidence of a strong relationship in the northeast quadrant, which can
be associated with contrarian short selling. We do not find the same level of Northeast TailCoR for
European stocks.
To quantify the relationship in the southeast quadrant, we calculated Southeast TailCoR for all
firms and present results in Table 4 (which reads similarly to Table 2).420
SE-TailCoR ρ(+−)√
1− ρ(+−) sSE(ξ, α)
European Banks2.16
(1.9 ; 2.73)
-0.20
(-0.24 ; -0.14)
1.10
(1.07 ; 1.11)
2.41
(2.10 ; 3.10)
North American Banks1.93
(1.83 ; 2.16)
-0.19
(-0.20 ; -0.17)
1.09
(1.08 ; 1.10)
2.16
(2.04 ; 2.40)
European Insurers2.42
(1.96 ; 2.85)
-0.14
(-0.21 ; -0.12)
1.07
(1.06 ; 1.10)
2.81
(2.19 ; 3.24)
Table 4. Southeast TailCoR and its components. The table shows Southeast TailCoR (SE-TailCoR) and
the positive-negative semi-correlation correlation, as defined in Eq. 9, between changes in short interest and
stock prices for 46 European banks, 35 European insurers and 22 North American banks. The table also
shows the components of Southeast TailCoR that depend on the positive-negative semi-correlation (ρ(+−))
and on the tail index (α). The table reports median group values as well as the first and third quartiles (in
parentheses). Here, ξ = 95%. Additional results for varying levels of ξ are available on request.
The median value of Southeast TailCoR is around 2.14 for all firms. Table 4 also displays, across
24

the three group of firms in our sample, the median values of the components of Southeast TailCoR:√1− ρ+− and sSE(ξ, α).
The positive-negative linear correlation is larger in absolute terms than the full-fledged linear
correlation that we had presented previously in Table 2. When looking at points in the southeast425
quadrant of our data, a linear relationship is clearly distinguishable, such that, on average, higher
short interest is associated with lower returns. Moreover, our data have a strong tail component,
which indicates that extreme positive short interest changes are associated with extreme negative
returns.
Similarly to Table 2, Table 4 shows that European insurance companies have the highest430
Southeast TailCoR while European and North American Banks show lower levels of tail association.
To retrieve a market measure of Southeast TailCoR, we repeated this analysis using portfolios of
stocks of European banks and insurance companies, and North American banks. Results, given in
the online supplementary material, showed that the market Southeast TailCoR of North American
banks was higher than the Southeast TailCoR for the median North American bank. Moreover,435
across the three groups of firms, market Southeast TailCoR of North American banks was higher
than the market Southeast TailCoR of European banks and insurance companies. This suggests
that there are extreme cases in the group of firms analysed that increase the overall tail correlation
between the market return and short selling occurring on the market. These extreme cases appear
more important for North American banks.440
High Southeast TailCoR values do not allow us to make statements about the direction of
causality. It could well be that extreme increases in short positions instigate extreme price declines,
but it could also be that extreme price falls induce bursts of directional short selling activity. To
shed more light on causality, we studied Southeast TailCoR at different leads and lags (in days)
of (∆SI, r). Results are reported in the supplementary online material and show that Southeast445
TailCoR tends to be highest for lags of ∆SI between 1 and 4 days. For North American banks, for
example, Southeast TailCoR peaks at lag 2 (days) of ∆SI, suggesting that short sellers can predict
extreme negative price movements of North American bank stocks with two days anticipation.
Our results presented above are in line with the findings of Shkilko et al. (2012), who found
that short sellers exacerbate price declines, but to a lesser extent than long sellers. By contrast,450
Boehmer and Wu (2013) find that short sellers act as liquidity providers during transient price
turnarounds, buying when the price drops and selling when the price jumps unusually high. This
25

is interpreted as evidence that short sellers trade on the basis of superior information rather than
speculation.
The contrasting results of Boehmer & Wu (2013) may be attributable to different standardisation455
of the short selling indicator. Similarly to Shkilko et al. (2012), we standardised our indicator of
shares short sold (shares on loans) by the number of shares outstanding. Boehmer & Wu (2013),
on the other hand, standardised the number of shares short sold by total volume of trades.
In the online supplementary material, we re-calculated results standardising SLQ by volume
of trades.19 We found a weaker tail relationship than that found using the standardisation by460
shares outstanding. Nonetheless, the relationship uncovered is still much higher than that between
independent random variables, and we conclude that the standardisation does not alter our main
findings.
5.3. Southeast-TailCoR and firm size
We ranked firms according to market capitalization and analysed Southeast TailCoR for groups465
of firms of different size. Figure 6 depicts the median and interquartile ranges of Southeast TailCoR
for different quartiles of firm size. Results show that, for the European banks and insurance
companies considered, the smallest companies (the first and second quartile in terms of firm size)
have the highest Southeast TailCoR. Such results are not observed for North American banks, for
which the largest banks appear to have the highest Southeast TailCoR.470
Across all firms, Southeast TailCoR is highest for the companies with the lowest market capital.
All firms in the smallest size quartile have a market capital of between $1.6 billion and $7.2 billion
and are predominantly insurance companies (out of 26 firms composing the smallest size quartile
across all firms, 15 are insurance companies and 11 are European banks). Thus, European insurance
firms in our sample are generally smaller than the European banks in our sample and this might475
explain the high Southeast TailCoR result for European insurers found in Table 4 of Section 5.2.
There are two possible channels through which firm size can affect the relationship between
short interest changes and returns.
First, small firms are affected by the liquidity channel. Boehmer et al. (2013) found that liquidity
can have important implications for the impact of short selling on prices and a smaller firm is likely480
19We thank an anonymous referee for suggesting this exercise.
26

2.4
2.1
2.1
2.1
SE-TailCoRMedianInterquartilerange
4
15
37
77
Marketcap(USDbillion)Median
Min-Maxrange
12
12
12
10
Sizequartile1(smallest)
Sizequartile2
Sizequartile3
Sizequartile4(largest)
Numberof=irms
Europeanbanks
1.9
2.0
1.9
2.2
9
21
75
205
6
6
6
4
Sizequartile1(smallest)
Sizequartile2
Sizequartile3
Sizequartile4(largest)
NorthAmericanbanks
2.5
3.0
2.3
2.0
1.0 2.0 3.0 4.0
4
7
17
50
0 50 100 150 200 250
9
9
9
8
Sizequartile1(smallest)
Sizequartile2
Sizequartile3
Sizequartile4(largest)
0 5 10 15
Europeaninsurers
Fig. 6. Southeast TailCoR for firms of different size. Our sample firms are generally mid to large-cap as
we used membership of the Stoxx600 indices to construct our database.
to have less free float capital available to borrow and sell short (Beber & Pagano, 2013).
Second, small firms are susceptible to the asymmetric information channel. As pointed out
by Diether et al. (2009b), short sellers may act as opportunistic risk bearers when there is high
uncertainty due to asymmetric information. In the model of Glosten & Harris (1988), a market
specialist engaging in a trade faces an adverse selection problem because the customer on the other485
side of the trade may have some insider information that the specialist does not have. Especially
27

in the case of small companies, which have low trading volume and liquidity, specialists may have
to short in order to meet the trade with the informed trader. In return for holding the risk, the
short sellers would require compensation in the form of negative returns (a high ask price).
Results for North American banks in Figure 6 concur with the liquidity channel and information490
asymmetry channel explanations. North American banks are larger across all size quartiles than
European banks and, apart from the largest size quartile, North American banks also have a lower
Southeast TailCoR than their European counterparts. This could be because North American bank
stocks are more liquid and have less information asymmetry than European bank stocks. However,
the fourth size quartile of North American banks is associated with a higher Southeast TailCoR495
than the fourth size quartile of European banks. One explanation could be that these extremely
large North American banks are global and highly complex, and thus could be treated as a different
case.
The next subsection focuses on evaluating the impact of covered short selling bans on the
relationship we have just uncovered.500
5.4. Short selling bans
Several studies show that short selling prohibitions are harmful for market efficiency and liquidity
(Beber & Pagano, 2013; Bernal et al., 2014). In a regime of low liquidity, bans can result in the
opposite of the effect intended. Boehmer et al. (2013), for example, show that the short-term price
impact of short selling increased by 14 basis points for banned stocks during the SEC ban. Similarly,505
Kolasinski et al. (2013) show that short selling prohibitions increased the proportion of informed
trades and the negative impact of short selling on returns.
The above-mentioned studies concentrate primarily on the bans adopted by the SEC. However,
it is particularly difficult to identify the effects of bans in the US because these were implemented
for a short period of time (14 trading days) and were concomitant with the Troubled Asset Relief510
Program (TARP). Using international data, Bris et al. (2007) and Chang et al. (2007) show that
short selling bans are associated with higher (less negative) skewness of returns. In contrast,
Boehmer et al. (2013) and Kolasinski et al. (2013) find that the magnitude (but not in frequency)
of negative extreme returns increase when short selling is allowed.20 Our data, which span several
20This result is consistent with the notion that short selling does not affect the frequency of crashes but affects
their depth. Saffi & Sigurdsson (2011) however ascribe this result to less over pricing when short selling is allowed.
28

countries and policy regimes, can help shed light on these results.515
The sample of bans includes the short selling prohibitions enacted during the 2008 crisis by the
financial market authorities of Canada, Italy, the UK, and the US. Additionally, we also examine
the ban imposed by the financial market authorities of France and Spain between August 2011 and
February 2012, which was not analysed in prior studies.
For stocks involved in these bans, we compared the level of Southeast TailCoR obtained with ban520
observations to the level of Southeast TailCoR obtained using pre-ban and post-ban observations.21
Figure 7 shows median Southeast TailCoR for the stocks examined, grouped by country of listing
and sector. The vertical axis displays the level of Southeast TailCoR, whereas the horizontal axis
shows the pre-ban, ban, and post-ban periods. Southeast TailCoR was computed using the relevant
standardisation for each period (see Section 4).525
Figure 7 shows that, regarding bans, the effects on the relationship between short interest and
returns were not uniform across sectors or short selling regime. For example, for Italian and UK
bank stocks that were banned during the 2008 financial crisis, Southeast TailCoR increased during
the ban and returned to pre-ban levels after the ban. For French and Spanish bank stocks, which
were banned during the European debt crisis in August 2011, Southeast TailCoR did not change530
substantially between pre-ban, ban, and post-ban periods.
Canadian bank stocks, which were banned for 14 days during September 2008, also displayed
a similar pattern to Italian and UK bank stocks, whereas US bank stocks, which were banned
for the same period, showed a decline in Southeast TailCoR during and after the ban. Thus, for
Canadian, Italian, and UK banks, results seem to confirm the findings of Boehmer et al. (2013)535
and Kolasinski et al. (2013), who showed that the price reaction to short selling activity increased
during ban periods. According to their studies, this is due to the increased informativeness of those
short sellers who continued their activity after the ban.
We found more consistent results across European insurers. For all European insurers studied,
Figure 7 shows a decrease in Southeast TailCoR during the ban compared to the pre-ban period.540
Once the ban expired, Southeast TailCoR rose again to pre-ban levels or higher. The only exception
was for Spanish insurers, for whom Southeast TailCoR declined during the ban and then remained
roughly stable thereafter.
21We thank an anonymous referee for this suggestion.
29

FR FR
IT
SP
UK
FR
IT
IT
SPSP
UK
UK
US US
CA
CA
0.50
1.00
1.50
2.00
2.50
3.00
3.50
4.00
4.50
Ban Post-ban
EuropeanBanks EuropeanInsurers NorthAmericanBanks
FR
IT
SP
UK
FR
ITSP
UK
US
CA
0.50
1.00
1.50
2.00
2.50
3.00
3.50
4.00
4.50
Pre-ban Ban
Fig. 7. Median Southeast TailCoR according to country-listing and financial sector for pre-, ban, and
post-ban periods. The figure shows the median Southeast TailCoR for the groups of firms in our study
computed using observations from three subsamples of observations relating to different covered short selling
regulatory periods, which we name pre-ban, ban, and post-ban periods. We constructed the subsamples
as follows. For a given stock, with d ban observations, we considered the last d observations prior to ban
implementation for the pre-ban sample. Similarly, we considered the first d observations after the end of
the ban for the post-ban sample. For those stocks that were banned several times during the sample period
(e.g., Italian or Spanish bank stocks), we only considered the first ban period for the construction of the
pre- and post-ban subsamples.
To analyse a more time-dependent measure of the tail relation between short interest and returns
and thus to track the effect of ban implementations, we computed daily estimates of Southeast545
TailCoR over rolling windows of a year. We grouped the dynamic Southeast TailCoR results of
European and North American banks according to stock country listings. Figure 8 depicts the
medians and interquartile ranges of Southeast TailCoR for banks listed in the six countries studied.
The shaded areas in Figure 8 depict periods of short selling bans affecting banks in those countries.
30

Canada France
1
2
3
4
Sep-07
Jun-08
Mar-09
Dec-09
Sep-10
Jun-11
Mar-12
Dec-12
Sep-13
1
2
3
4
Sep-07
Jun-08
Mar-09
Dec-09
Sep-10
Jun-11
Mar-12
Dec-12
Sep-13
Italy Spain
1
2
3
4
Sep-07
Jun-08
Mar-09
Dec-09
Sep-10
Jun-11
Mar-12
Dec-12
Sep-13
1
2
3
4
Sep-07
Jun-08
Mar-09
Dec-09
Sep-10
Jun-11
Mar-12
Dec-12
Sep-13
United Kingdom United States
1
2
3
4
Sep-07
Jun-08
Mar-09
Dec-09
Sep-10
Jun-11
Mar-12
Dec-12
Sep-13
1
2
3
4
Sep-07
Jun-08
Mar-09
Dec-09
Sep-10
Jun-11
Mar-12
Dec-12
Sep-13
Fig. 8. Southeast TailCoR by country of listing. The figure depicts the group medians (bold solid) of
Southeast TailCoR for firms according to country of listing and their interquartile range (light dashed).
Southeast TailCoR was computed using rolling windows of 252 trading days, sliding the window by one
trading day for each estimation. Periods during which national bans on covered short selling were introduced
are indicated with shaded hatched areas.
31

For Canadian banks, Figure 8 shows that the ban is associated with an increase in Southeast550
TailCoR, consistent with results shown in Figure 7. Canada implemented an emergency short selling
ban following the US SEC on 18 September 2008 on certain Canadian financial stocks. The rise
in Southeast TailCoR continues during 2009, then decreases towards the end of the year. Overall,
Southeast TailCoR for Canadian banks is tightly dispersed around the median value, which displays
a steadily increasing positive trend. After 2012, the value of Southeast TailCoR is above 2, which555
indicates a strong relationship between extreme price downfalls and extreme increases in short
interest.
For French, Italian, Spanish, and UK banks we notice an increase in Southeast TailCoR beginning
in early 2010, concomitant with the deteriorating European Sovereign debt crisis. In April 2010
Greece requested a $ 53-billion bailout and a few days later Standard & Poor’s downgraded its560
sovereign bonds to BB+. Figure 8 suggests a strong relationship between extreme short selling and
returns during the European Sovereign debt crisis for French banks. French banks owned a non-
residual part of Greek debt and this might explain the large peak in Southeast TailCoR displayed
for France around September 2010.
A closer look at the ban period for French banks shows that the upper quartile of Southeast565
TailCoR decreased steadily during the ban only to increase once the ban was lifted. The French ban
of August 2011 was part of a joint action on short selling taken by the financial market authorities
of Belgium, France, Greece, Italy, and Spain. A similar Southeast TailCoR reaction to the August
2011 ban is displayed for Italian and Spanish banks.
Italy implemented three bans during the sample period. First, on 22 September 2008, following570
the US SEC, the Italian market authority (Consob) implemented a covered short selling ban on
financial stocks, successively extended to all stocks, listed on the Italian regulated market. After
several extensions, the ban was to last until July 2008. Second, as part of the joint action with
other European regulators, Consob banned covered short selling in August 2011 until February
2012. Third, in July 2012, Consob banned covered short selling on a list of banking and insurance575
stocks. This third ban lasted until September of the same year.
During the joint European ban of August 2011, Southeast TailCoR of Italian banks decreased,
whereas during the first and the third Italian ban periods (September 2008 to February 2012 and
July 2012 to September 2012, respectively), Southeast TailCoR increased. For the bans implemented
in Spain, this is also the case. The August 2011 joint European ban is associated with a decrease580
32
in Southeast TailCoR for Spanish banks, whereas the subsequent Spanish ban of July 2012 is
associated with an increase in Southeast TailCoR. Hence, there is some difference between the joint
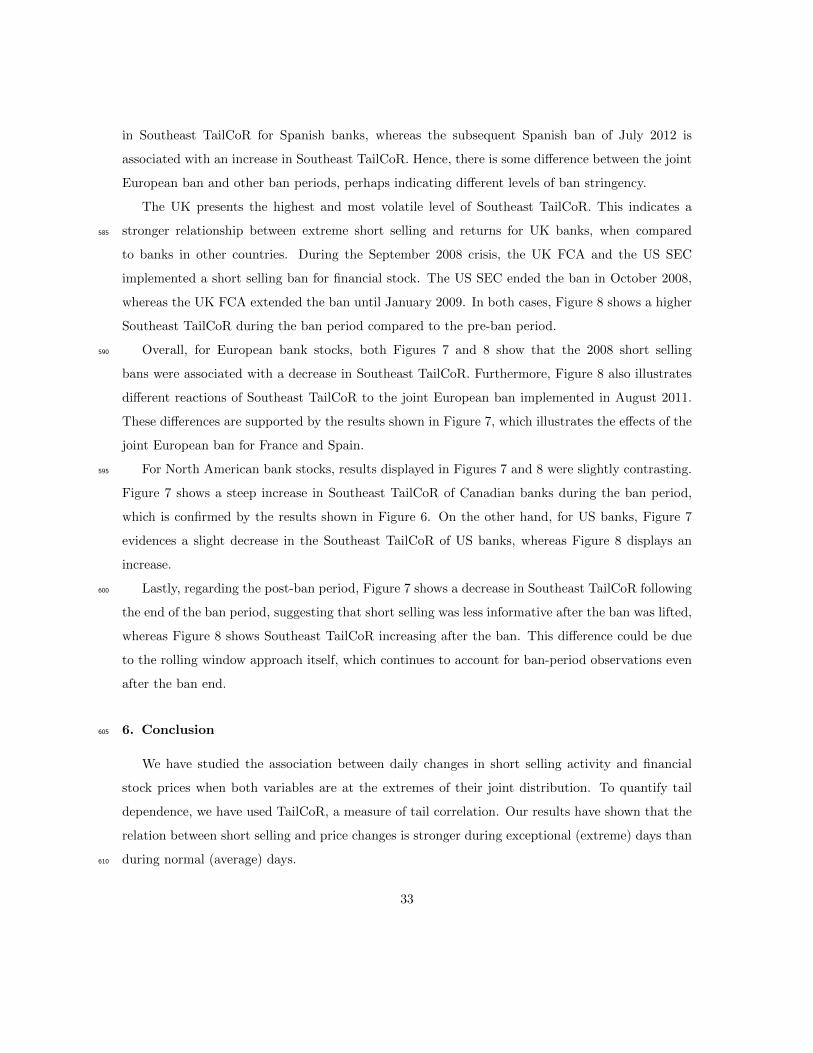
European ban and other ban periods, perhaps indicating different levels of ban stringency.
The UK presents the highest and most volatile level of Southeast TailCoR. This indicates a
stronger relationship between extreme short selling and returns for UK banks, when compared585
to banks in other countries. During the September 2008 crisis, the UK FCA and the US SEC
implemented a short selling ban for financial stock. The US SEC ended the ban in October 2008,
whereas the UK FCA extended the ban until January 2009. In both cases, Figure 8 shows a higher
Southeast TailCoR during the ban period compared to the pre-ban period.
Overall, for European bank stocks, both Figures 7 and 8 show that the 2008 short selling590
bans were associated with a decrease in Southeast TailCoR. Furthermore, Figure 8 also illustrates
different reactions of Southeast TailCoR to the joint European ban implemented in August 2011.
These differences are supported by the results shown in Figure 7, which illustrates the effects of the
joint European ban for France and Spain.
For North American bank stocks, results displayed in Figures 7 and 8 were slightly contrasting.595
Figure 7 shows a steep increase in Southeast TailCoR of Canadian banks during the ban period,
which is confirmed by the results shown in Figure 6. On the other hand, for US banks, Figure 7
evidences a slight decrease in the Southeast TailCoR of US banks, whereas Figure 8 displays an
increase.
Lastly, regarding the post-ban period, Figure 7 shows a decrease in Southeast TailCoR following600
the end of the ban period, suggesting that short selling was less informative after the ban was lifted,
whereas Figure 8 shows Southeast TailCoR increasing after the ban. This difference could be due
to the rolling window approach itself, which continues to account for ban-period observations even
after the ban end.
6. Conclusion605
We have studied the association between daily changes in short selling activity and financial
stock prices when both variables are at the extremes of their joint distribution. To quantify tail
dependence, we have used TailCoR, a measure of tail correlation. Our results have shown that the
relation between short selling and price changes is stronger during exceptional (extreme) days than
during normal (average) days.610
33

Our results have demonstrated that the extremes of the joint distribution of short selling and
price changes can conceal additional useful information. Future research could build on our analysis
by adopting bivariate models of conditional quantiles. For example, a natural candidate could be
the CoVaR model developed by Adrian & Brunnermeier (2016). Here, the value at risk (VaR)
of returns could be expressed as a conditional function of the change in short interest. Another615
possibility is a state-dependent value at risk approach, such as the one adopted by Adams et al.
(2014), that can model the differential impact of short selling on the VaR of returns, depending on
the state of financial markets. Lastly, it may also be possible to model the quantiles of returns and
short interest changes simultaneously using an approach that has been proposed by White et al.
(2015).620
Acknowledgements
We are grateful to Sophie Bereau, Catherine Dehon, Yves Dominicy, Igor Fedotenkov, Matteo
Luciani, Daniele Massacci, and Davy Paindaveine for their helpful comments and suggestions. We
also thank seminar and conference participants at the Bank of England, the European Central Bank,
the Sveriges Riskbank, the Universite of Namur, the 8th International Conference on Computational625
and Financial Econometrics, the 12eme Journee d’Econometrie in Nanterre Paris X, the 3rd Summer
Meeting of Economists in Vilnius. This work was supported by the Communaute francaise de
Belgique [grant number 13/17-055]. The views expressed in this paper are those of the authors and
should not be interpreted as the views of the Bank of Lithuania or the European Central Bank.
Any remaining errors are our own.630
References
Adams, Z., Fuss, R., & Gropp, R. (2014). Spillover effects among financial institutions: A state-
dependent sensitivity value-at-risk approach. Journal of Financial and Quantitative Analysis,
49 , 575–598. doi:10.1017/S0022109014000325.
Adrian, T., & Brunnermeier, M. K. (2016). CoVaR. American Economic Review , 106 , 1705–1741.635
doi:10.1257/aer.20120555.
Asquith, P., Pathak, P. A., & Ritter, J. R. (2005). Short interest, institutional ownership, and stock
returns. Journal of Financial Economics, 78 , 243–276. doi:10.1016/j.jfineco.2005.01.001.
34

Beber, A., & Pagano, M. (2013). Short-selling bans around the world: Evidence from the 2007-09
crisis. Journal of Finance, 68 , 343–381. doi:10.1111/j.1540-6261.2012.01802.x.640
Bernal, O., Herinckx, A., & Szafarz, A. (2014). Which short-selling regulation is the least damaging
to market efficiency? evidence from europe. International Review of Law and Economics, 37 ,
244–256. doi:10.1016/j.irle.2013.12.002.
Blocher, J. A., & Ringgenberg, M. C. (2018). Stock options, stock loans, and the law of one price.
URL: https://ssrn.com/abstract=3087563. doi:10.2139/ssrn.3087563 working paper.645
Boehmer, E., Huszar, Z. R., & Jordan, B. D. (2010). The good news in short interest. Journal of
Financial Economics, 96 , 80–97. doi:10.1016/j.jfineco.2009.12.002.
Boehmer, E., Jones, C. M., & Zhang, X. (2008). Which shorts are informed? Journal of Finance,
63 , 491–527. doi:10.1111/j.1540-6261.2008.01324.x.
Boehmer, E., Jones, C. M., & Zhang, X. (2013). Shackling short sellers: The 2008 shorting ban.650
Review of Financial Studies, 26 , 1363–1400. doi:10.1093/rfs/hht017.
Boehmer, E., & Wu, J. J. (2013). Short selling and the price discovery process. Review of Financial
Studies, 26 , 287–322. doi:10.1093/rfs/hhs097.
Bris, A., Goetzmann, W. N., & Zhu, N. (2007). Efficiency and the bear: Short sales and markets
around the world. Journal of Finance, 62 , 1029–1079. doi:10.1111/j.1540-6261.2007.01230.x.655
Chang, E. C., Cheng, J. W., & Yu, Y. (2007). Short-sales constraints and price discovery: Evidence
from the hong kong market. Journal of Finance, 62 , 2097–2122. doi:10.1111/j.1540-6261.
2007.01270.x.
Christophe, S. E., Ferri, M. G., & Angel, J. J. (2009). Short selling and the weekend effect in
Nasdaq stock returns. Financial Review , 44 , 31–57. doi:10.1111/j.1540-6288.2008.00209.x.660
Cohen, L., Diether, K. B., & Malloy, C. J. (2007). Supply and demand shifts in the shorting market.
Journal of Finance, 62 , 2061–2096. doi:10.1111/j.1540-6261.2007.01269.x.
Croux, C., & Dehon, C. (2010). Influence functions of the Spearman and Kendall correlation
measures. Statistical Methods and Applications, 19 , 497–515. doi:10.1007/s10260-010-0142-z.
35

Curtis, A., & Fargher, N. L. (2014). Does short selling amplify price declines or align stocks with665
their fundamental values? Management Science, 60 , 2324–2340. doi:10.1287/mnsc.2013.1872.
Dechow, P. M., Hutton, A. P., Meulbroek, L., & Sloan, R. G. (2001). Short-sellers, fundamental
analysis, and stock returns. Journal of Financial Economics, 61 , 77–106. doi:10.1016/
S0304-405X(01)00056-3.
Diether, K. B., Lee, K., & Werner, I. M. (2009a). It’s SHO time! short–sale price tests and market670
quality. The Journal of Finance, 64 , 37–73. doi:10.1111/j.1540-6261.2008.01428.x.
Diether, K. B., Lee, K., & Werner, I. M. (2009b). Short-sale strategies and return predictability.
Review of Financial Studies, 22 , 575–607. doi:10.1093/rfs/hhn047.
Dyckerhoff, R., Ley, C., & Paindaveine, D. (2014). Depth-based runs tests for bivariate central
symmetry. Annals of the Institute of Statistical Mathematics, 67 , 917–941. doi:10.1007/675
s10463-014-0480-y.
Faulkner, M. C. (2007). An Introduction to Securities Lending . Technical Report Spitalfields
Advisors. Fourth Edition.
Fortin, I., & Kuzmics, C. (2002). Tail-dependence in stock-return pairs. International Journal of
Intelligent Systems in Accounting, Finance & Management , 11 , 89–107. doi:10.1002/isaf.216.680
Glosten, L. R., & Harris, L. E. (1988). Estimating the components of the bid/ask spread. Journal
of Financial Economics, 21 , 123–142. doi:10.1016/0304-405x(88)90034-7.
Grundy, B. D., Lim, B., & Verwijmeren, P. (2012). Do option markets undo restrictions on short
sales? evidence from the 2008 short-sale ban. Journal of Financial Economics, 106 , 331–348.
doi:10.1016/j.jfineco.2012.05.013.685
Hendershott, T., Jones, C. M., & Menkveld, A. J. (2011). Does algorithmic trading improve
liquidity? Journal of Finance, 66 , 1–33. doi:10.1111/j.1540-6261.2010.01624.x.
Jones, C. M., Reed, A. V., & Waller, W. (2016). Revealing shorts: An examination of large short
position disclosures. The Review of Financial Studies, 29 , 3278–3320. doi:10.1093/rfs/hhw064.
36

Karmaziene, E., & Sokolovski, V. (2017). Short selling of equity exchange traded funds and its690
effect on the underlying stocks. doi:10.2139/ssrn.2901916 Swedish House of Finance Research
Paper No. 14-05.
Kolasinski, A. C., Reed, A., & Thornock, J. R. (2013). Can short restrictions actually increase
informed short selling? Financial Management , 42 , 155–181. doi:10.1111/j.1755-053x.2012.
01223.x.695
Lindskog, F., McNeil, A., & Schmock, U. (2003). Credit Risk: Measurement, Evaluation and
Management. chapter Kendall’s tau for elliptical distributions. (pp. 149–156). Physica-Verlag
Heidelberg.
Marden, J. (1999). Multivariate rank tests. In S. Ghosh (Ed.), Multivariate Analysis, Design of
Experiments, and Sampling Survey chapter 14. (pp. 401–432). M Dekker.700
Mencıa, J., & Sentana, E. (2009). Multivariate location–scale mixtures of normals and
mean–variance–skewness portfolio allocation. Journal of Econometrics, 153 , 105–121. doi:10.
1016/j.jeconom.2009.05.001.
Menkveld, A. J. (2013). High frequency trading and the new market makers. Journal of Financial
Markets, 16 , 71–740. doi:10.1016/j.finmar.2013.06.006.705
Reed, A. V. (2002). Costly short selling and stock price adjustment to earnings
announcements. Ph.D. thesis University of Pennsylvania. URL: https://repository.upenn.
edu/dissertations/AAI3073047/.
Ricci, L., & Veredas, D. (2013). TailCoR. doi:10.2139/ssrn.2071126 ECARES Working Paper.
Richardson, S., Saffi, P. A. C., & Sigurdsson, K. (2017). Deleveraging risk. Journal of Financial710
and Quantitative Analysis, 52 , 2491–2522. doi:10.1017/S0022109017001077.
Saffi, P. A. C., & Sigurdsson, K. (2011). Price efficiency and short selling. Review of Financial
Studies, 24 , 821–852. doi:10.1093/rfs/hhq124.
Shkilko, A., Ness, B. V., & Ness, R. V. (2012). Short selling and intraday price pressures. Financial
Management , 41 , 345–370. doi:10.1111/j.1755-053x.2012.01189.x.715
37

Sidak, Z. (1967). Rectangular confidence regions for the means of multivariate normal distributions.
Journal of the American Statistical Association, 62 , 626–633. doi:10.1080/01621459.1967.
10482935.
White, H., Kim, T.-H., & Manganelli, S. (2015). VAR for VaR: Measuring tail dependence
using multivariate regression quantiles. Journal of Econometrics, 187 , 169–188. doi:10.1016/j.720
jeconom.2015.02.004.
38