shire of brookton annual report 2 015 2016
TRANSCRIPT
Shire of Brookton
Robinson Road Precinct
14 White Street (PO Box 42) Brookton WA 6306 Phone: (08) 9642 1106 Fax: (08) 9642 1173 E-mail: [email protected] Web: www.brookton.wa.gov.au
AN
NU
AL R
EP
OR
T 2015-2016
Shire of Brookton Annual Report 2015/16 Page 1 of 31
Table of Contents
Shire President’s Report ................................................................................................. 2
Chief Executive Officer’s Report ..................................................................................... 3
Shire Profile .................................................................................................................... 5
Strategic Plan Update ..................................................................................................... 8
Corporate Business Plan 2015/16 – Progress Report ................................................... 11
Disability Access & Inclusion Plan ................................................................................. 22
Freedom of Information Statement ................................................................................ 24
Official Conduct Report ................................................................................................. 27
National Competition Policy Statement ......................................................................... 27
State Records Act 2000 ................................................................................................ 29
Appendix : Annual Financial Report 2015/16 ................................................................ 30
Shire of Brookton Annual Report 2015/16 Page 2 of 31
Shire President’s Report
Pursuant to Section 5.53 (2) (a) of the Local Government Act 1995, I submit the following President’s Report. The 2015/16 Financial Year has seen the Shire of Brookton continue its sound financial management, finishing the year with a municipal surplus of $572,848. This surplus translates to a healthy unrestricted cash balance of $599,037 as at 30 June 2016. In addition, the balance of the Shire’s cash reserves is $3.4m, positioning the Shire to meeting the challenge of funding future asset renewal requirements in relation to community buildings, facilities, and infrastructure assets such as roads and footpaths. The Council is committed to responsible fiscal management whilst continuing to deliver a high level of service to the community.
Whilst the 2015/16 Budget was a fairly conservative budget, the Shire did complete over $2.4m of capital works. Flagship projects for the year included the following:
$823k spent on road construction/renewal including the Brookton-Kweda Road, Corberding Road and Gartrell Road
$44k spent on the redevelopment of the Brookton cemetery Continuation of the Shire’s footpath program with $29k spent on footpaths for White Street
and Tiller Street $264k spent on beautification and townscape works on Robinson Road Construction of two new dwellings being Unit 1 and 2, 2 Montgomery Street $127k upgrade of sewer infrastructure Purchase of a new Volvo Grader $284k Purchase of a new Fire Truck $347k
The Townscape works on Robinson Road has been particularly pleasing, adding to the aesthetics and amenity of our main street, thereby encouraging business and tourist activity. I would like to congratulate the Shire’s works team for a job well done, as Mother Nature played her part to hinder works. Council has also continued its strong advocacy and lobbying role to ensure that the State Government is meeting its obligations to the Brookton community in the key areas of health, education and transport. Some of the key issues raised with State Government include:
Condition of all main roads within the Shire of Brookton Provision of additional government employee housing in Brookton Continued provision of medical and allied health services Funding for aged housing (Independent Living Units)
The 2015/16 year also saw a strong focus on the environment with the provision of bulk bins for recycling and domestic waste clean ups, as well as a business case finalised for the Happy Valley Borefield to secure a community water supply. Council is also investigating solar energy solutions for Shire buildings.
On behalf of Council, I would like to thank and acknowledge Shire staff for their contributions throughout the year. I would also like to congratulate Cr Mills, Cr Walker, Cr Eva and Cr Allington on their election to Council following the October 2015 elections (all elected unopposed). In closing, I must thank all Councillors for their continued support and community leadership as we endeavour to make Brookton a wonderful place to work, rest and play. Kym Wilkinson SHIRE PRESIDENT
Shire of Brookton Annual Report 2015/16 Page 3 of 31
Chief Executive Officer’s Report
I am pleased to report on the activities of the Shire of Brookton for the 2015/16 financial year. I must however acknowledge the previous Chief Executive Officer, Mr Darren Friend, who ceased employment with the Shire of Brookton in September 2016. As such, I am providing this report with limited visibility of the reporting period. Future Planning The Shire continues to further develop its suite of Integrated Plans which will see it provide for its community needs into the future. Following a desktop review of the Strategic Community Plan in 2015, the Corporate Business Plan was also reviewed and adopted by Council. The Shire of Brookton has now finalised the following key strategic documents, all of which have been adopted by Council:
Strategic Community Plan Corporate Business Plan Asset Management Plan Long Term Financial Plan
Additionally, the Shire of Brookton is actively seeking to develop several informing strategies which will work hand-in-hand with these Plans:
White Street Precinct Economic Development Waste Management Aged Care
The Shire of Brookton is also strongly committed to regional collaboration and has developed strategic partnerships to deliver sustainable solutions for Early Childhood Education in the Wheatbelt, as well as the development of the Wheatbelt Aged Support and Care Solutions Project. The three Shires of Brookton, Pingelly and Beverley, having previously formalised their commitment to collaborating on this issue, hope to maximize resource sharing opportunities in Aged Care planning, services and infrastructure in the region. 2015/16 Annual Financial Report – Financial Health Indicators The Department of Local Government and Communities has developed the My Council website (mycouncil.wa.gov.au) which provides an assessment of all local governments in Western Australia. One of the key measures assessed is the Financial Health Indicator (FHI) score which is a measurement of a local governments overall financial health. It is calculated from the seven financial ratios that local governments are required to calculate annually and disclose in the Annual Financial Report. An FHI result of 70 and above indicates sound financial health. The maximum result achievable is 100. The Department assessed the Shire of Brookton’s FHI to be 87 in 2014/15. However, the FHI score is likely to fall to about 61 in 2015/16 as a result of declining ratios, specifically the Asset Sustainability Ratio (ASR). The ASR expresses capital expenditure on renewal and replacement of existing assets as a percentage of depreciation costs. A percentage of less than 100% on an ongoing basis indicates assets may be deteriorating at a greater rate than spending on renewal or replacement. The Shire’s ratio of 0.64 is below the target level and both Regional and State 4 year averages and is trending downwards. The main reason for the deterioration in this ratio is the increase in depreciation expense following the revaluation of infrastructure assets during the year ended 30 June 2015. The downward trend requires a review of depreciation calculations along with reviewing the Shire’s long term capital investment program to help ensure renewal is maintained at an appropriate level with sufficient funding support in the future.
Shire of Brookton Annual Report 2015/16 Page 4 of 31
A full explanation of all of the ratios is included on page 44 of the Annual Financial Report. Staff
In conclusion I offer my sincere thanks to all Councillors and Staff for their hard work and efforts in ensuring Brookton continues “To be a leading community within the region that delivers core services, builds capacity and focuses on delivery”.
I would also like to acknowledge the community members who play a vital role in continuing to progress and enhance the liveability of the Shire of Brookton, by making it a vibrant, friendly and welcoming place. I would strongly encourage all community members to continue to play an active part in reviewing the strategies and actions that Council has adopted, as these will drive the future social, economic and environmental projects and services that Council delivers on your behalf.
Dale Stewart Acting Chief Executive Officer
Shire of Brookton Annual Report 2015/16 Page 5 of 31
Shire Profile
The following information is general information about the Shire of Brookton. All specific enquiries should be directed to the shire office during normal business hours.
(a) Address
Shire of Brookton Administration Centre
14 White Street (P O Box 42) BROOKTON WA 6306
Telephone: (08) 9642 1106 Facsimile: (08) 9642 1173 Email: [email protected]
Shire of Brookton Works Depot
Richardson Street (P O Box 42) BROOKTON WA 6306
Telephone: (08) 9642 1144 Facsimile: (08) 9642 1144 Email: [email protected]
Brookton Public Swimming Pool
Brookton Highway (P O Box 42) BROOKTON WA 6306
Telephone: (08) 9642 1112 Facsimile: (08) 9642 1173 Email: [email protected]
(b) Location
The town of Brookton is situated 138km east/south-east of Perth on the Brookton Highway. The Shire of Brookton covers an area of 1,626km2, and also includes the localities of Jelcobine, Aldersyde and Kweda. The population of the Shire is estimated to be 935 (Census 2011).
Being less than 100km from the Perth metropolitan area, Brookton is a comfortable one hour drive from Karragullen and enjoys many lifestyle benefits of outer metropolitan country living. The Shire of Brookton borders the Shires of Wandering, Beverley, Quairading, Corrigin and Pingelly.
The Brookton district is considered the Gateway to the Central South and is renowned for local events such as the Old Time Motor Show which is held biennially. Tourist attractions include the Old Railway Station and Police Museum located on Robinson Road, the Jack Hansen Ruins at Nine Acre Rock, a Look Out situated west of Brookton overlooking the town, Heritage Trail, Boyagin Rock reserve and the Yenyenning Lakes.
(c) History
One of Brookton’s first European Settlers, John Seabrook settled in this area c.1846. The name of his property, Brookton House, inspired the name for the town and subsequently the Shire. The first Brookton Road Board meeting was conducted on the 10 September 1906, after Mr Samuel Williams esq. broke away from the Beverley Road Board.
Shire of Brookton Annual Report 2015/16 Page 6 of 31
In 1999, the town site of Brookton celebrated the Centenary of gazettal. To commemorate the occasion, a written history of Brookton, titled “Kalkarni – The Brookton Story”, has been released which details the past 100 years of the town.
(d) Council
Council meetings commence at 12.30pm on the third Thursday of each month (except January) and all members of the public are welcome to attend. Council meetings are held in the Shire of Brookton Council Chambers, located within the Administration Centre, and a provision for ‘public question time’ is allocated at the beginning of the meeting.
Elected Members (as at 30 June 2016)
President Cr Kym Wilkinson (2017) PO Box 155 BROOKTON WA 6306 Phone: (08) 9642 7027 Fax: (08) 9642 7037
Deputy President Cr Katrina Crute (2017) PO Box 193 BROOKTON WA 6306 Phone: (08) 9642 1049 Fax: (08) 9642 1049
Cr Travis Eva (2019) PO Box 148 BROOKTON WA 6306 Phone: (08) 9642 6076 Fax: (08) 9642 6072
Cr Neil Walker (2019) PO Box 55 BROOKTON WA 6306 Phone: (08) 9647 4018 Fax: (08) 9647 4064
Cr Kim Mills (2019) 16 Montgomery St BROOKTON WA 6306 Phone: (08) 9642 6013 Fax: (08) 9642 6034
Cr Louise Allington (2019) 45 Groser St BROOKTON WA 6306 Phone: (08) 9642 1431 Fax: (08) 9642 1431
Cr Theresa Fancote (2017) PO Box 154 BROOKTON WA 6306 Phone: (08) 9642 1269 Fax: Nil
Shire of Brookton Annual Report 2015/16 Page 7 of 31
Senior Staff
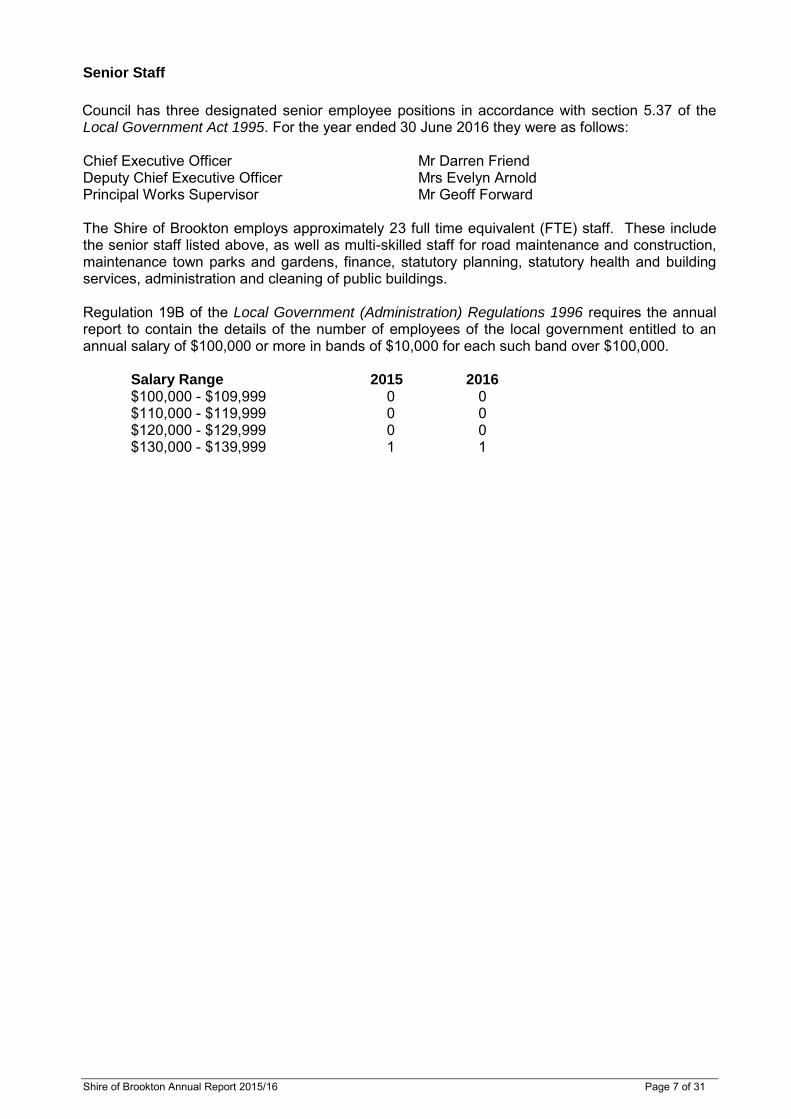
Council has three designated senior employee positions in accordance with section 5.37 of the Local Government Act 1995. For the year ended 30 June 2016 they were as follows: Chief Executive Officer Mr Darren Friend Deputy Chief Executive Officer Mrs Evelyn Arnold Principal Works Supervisor Mr Geoff Forward The Shire of Brookton employs approximately 23 full time equivalent (FTE) staff. These include the senior staff listed above, as well as multi-skilled staff for road maintenance and construction, maintenance town parks and gardens, finance, statutory planning, statutory health and building services, administration and cleaning of public buildings. Regulation 19B of the Local Government (Administration) Regulations 1996 requires the annual report to contain the details of the number of employees of the local government entitled to an annual salary of $100,000 or more in bands of $10,000 for each such band over $100,000. Salary Range 2015 2016
$100,000 - $109,999 0 0 $110,000 - $119,999 0 0
$120,000 - $129,999 0 0 $130,000 - $139,999 1 1
Shire of Brookton Annual Report 2015/16 Page 8 of 31
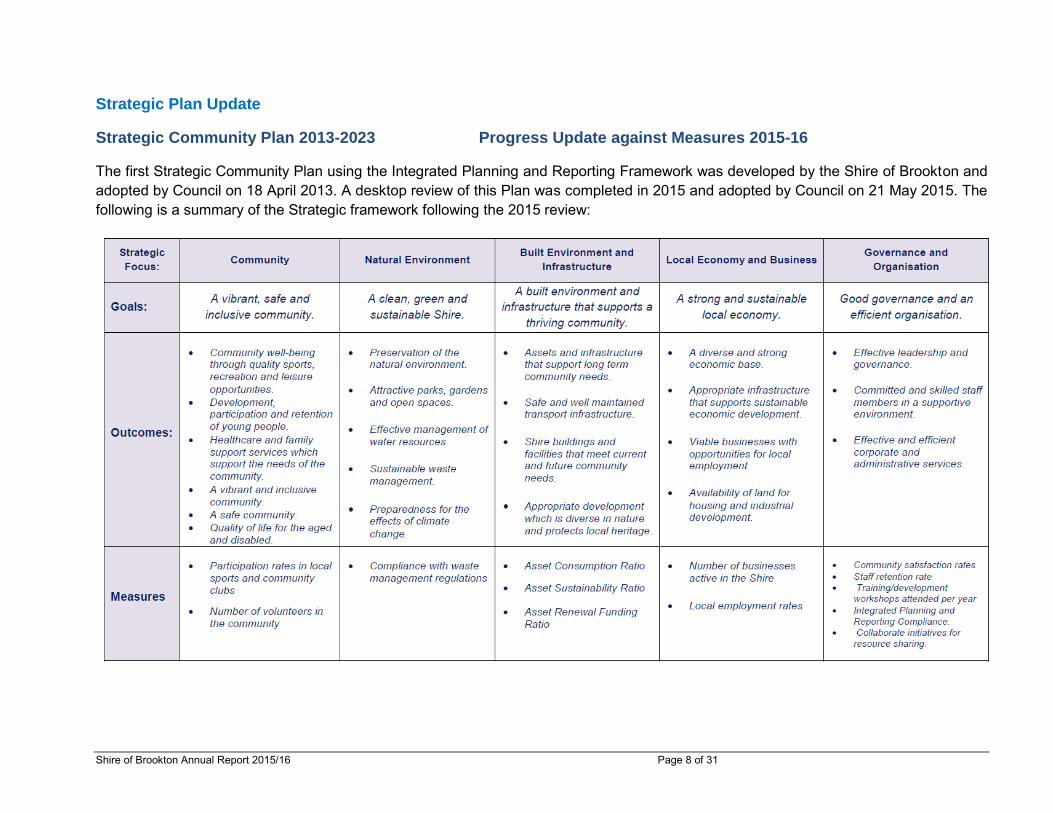
Strategic Plan Update Strategic Community Plan 2013-2023 Progress Update against Measures 2015-16
The first Strategic Community Plan using the Integrated Planning and Reporting Framework was developed by the Shire of Brookton and adopted by Council on 18 April 2013. A desktop review of this Plan was completed in 2015 and adopted by Council on 21 May 2015. The following is a summary of the Strategic framework following the 2015 review:
Shire of Brookton Annual Report 2015/16 Page 9 of 31
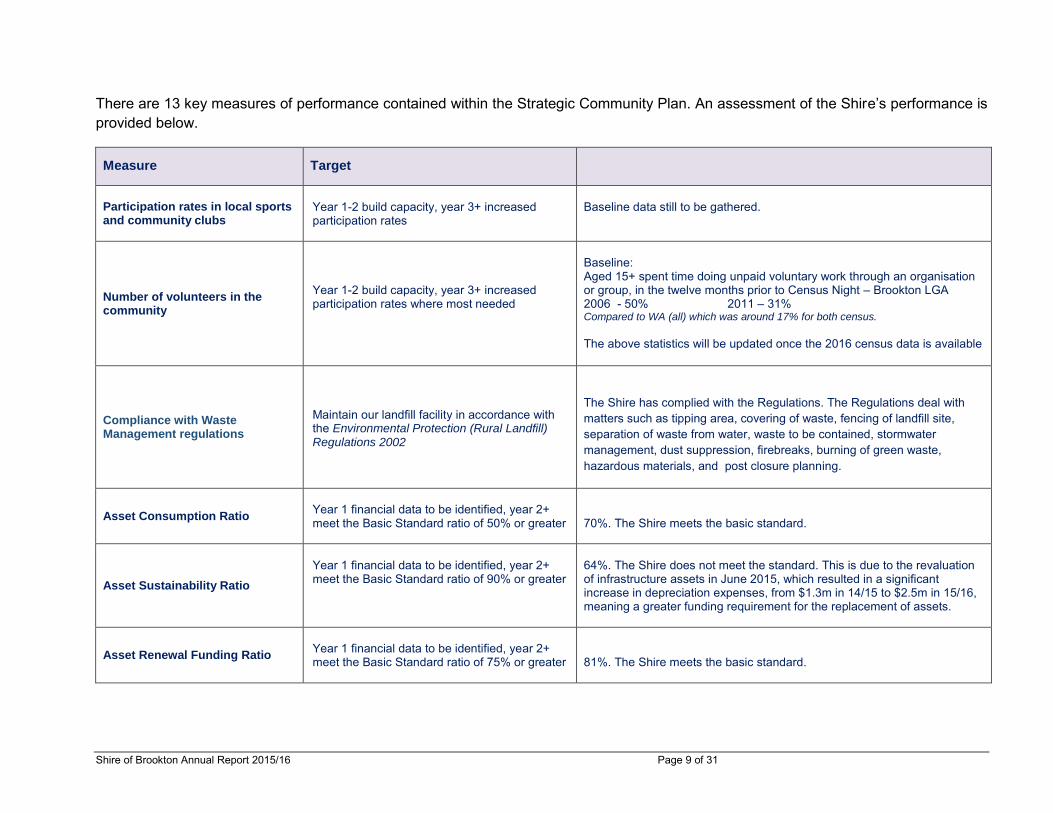
There are 13 key measures of performance contained within the Strategic Community Plan. An assessment of the Shire’s performance is provided below.
Measure Target
Participation rates in local sports and community clubs
Year 1-2 build capacity, year 3+ increased participation rates
Baseline data still to be gathered.
Number of volunteers in the community
Year 1-2 build capacity, year 3+ increased participation rates where most needed
Baseline: Aged 15+ spent time doing unpaid voluntary work through an organisation or group, in the twelve months prior to Census Night – Brookton LGA 2006 - 50% 2011 – 31% Compared to WA (all) which was around 17% for both census.
The above statistics will be updated once the 2016 census data is available
Compliance with Waste Management regulations
Maintain our landfill facility in accordance with the Environmental Protection (Rural Landfill) Regulations 2002
The Shire has complied with the Regulations. The Regulations deal with matters such as tipping area, covering of waste, fencing of landfill site, separation of waste from water, waste to be contained, stormwater management, dust suppression, firebreaks, burning of green waste, hazardous materials, and post closure planning.
Asset Consumption Ratio
Year 1 financial data to be identified, year 2+ meet the Basic Standard ratio of 50% or greater
70%. The Shire meets the basic standard.
Asset Sustainability Ratio
Year 1 financial data to be identified, year 2+ meet the Basic Standard ratio of 90% or greater
64%. The Shire does not meet the standard. This is due to the revaluation of infrastructure assets in June 2015, which resulted in a significant increase in depreciation expenses, from $1.3m in 14/15 to $2.5m in 15/16, meaning a greater funding requirement for the replacement of assets.
Asset Renewal Funding Ratio
Year 1 financial data to be identified, year 2+ meet the Basic Standard ratio of 75% or greater
81%. The Shire meets the basic standard.
Shire of Brookton Annual Report 2015/16 Page 10 of 31
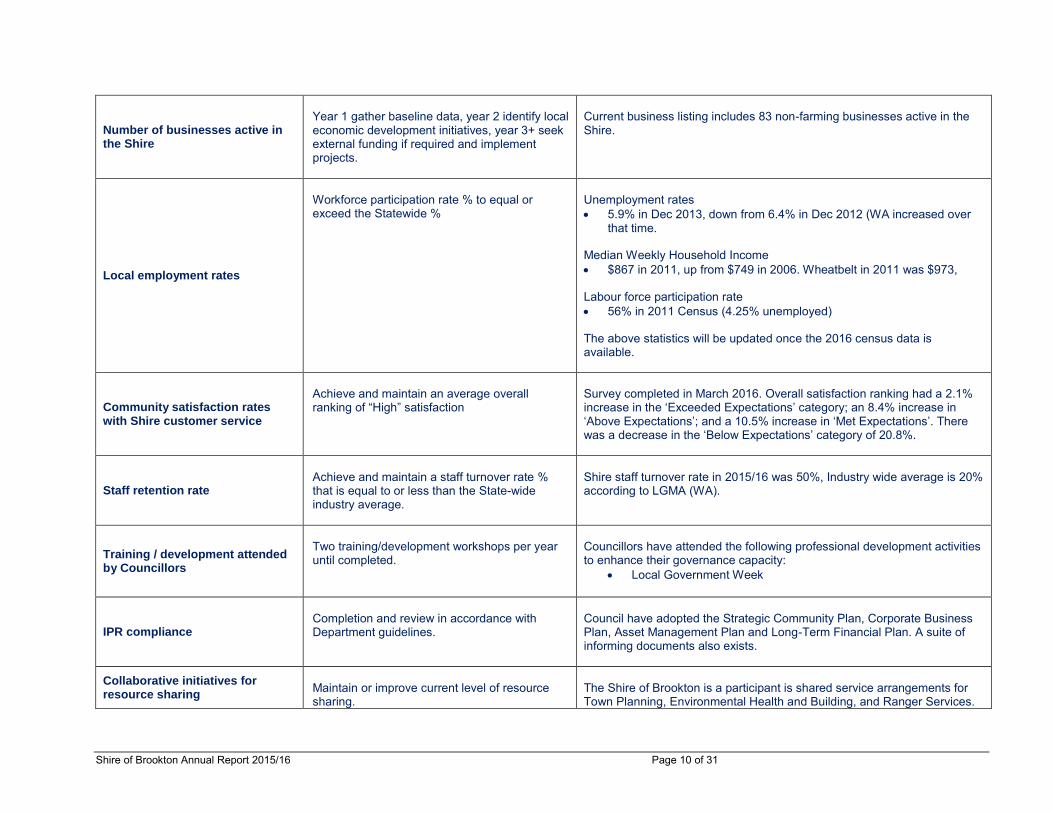
Number of businesses active in the Shire
Year 1 gather baseline data, year 2 identify local economic development initiatives, year 3+ seek external funding if required and implement projects.
Current business listing includes 83 non-farming businesses active in the Shire.
Local employment rates
Workforce participation rate % to equal or exceed the Statewide %
Unemployment rates 5.9% in Dec 2013, down from 6.4% in Dec 2012 (WA increased over
that time.
Median Weekly Household Income $867 in 2011, up from $749 in 2006. Wheatbelt in 2011 was $973,
Labour force participation rate 56% in 2011 Census (4.25% unemployed)
The above statistics will be updated once the 2016 census data is available.
Community satisfaction rates with Shire customer service
Achieve and maintain an average overall ranking of “High” satisfaction
Survey completed in March 2016. Overall satisfaction ranking had a 2.1% increase in the ‘Exceeded Expectations’ category; an 8.4% increase in ‘Above Expectations’; and a 10.5% increase in ‘Met Expectations’. There was a decrease in the ‘Below Expectations’ category of 20.8%.
Staff retention rate Achieve and maintain a staff turnover rate % that is equal to or less than the State-wide industry average.
Shire staff turnover rate in 2015/16 was 50%, Industry wide average is 20% according to LGMA (WA).
Training / development attended by Councillors
Two training/development workshops per year until completed.
Councillors have attended the following professional development activities to enhance their governance capacity:
Local Government Week
IPR compliance Completion and review in accordance with Department guidelines.
Council have adopted the Strategic Community Plan, Corporate Business Plan, Asset Management Plan and Long-Term Financial Plan. A suite of informing documents also exists.
Collaborative initiatives for resource sharing
Maintain or improve current level of resource sharing.
The Shire of Brookton is a participant is shared service arrangements for Town Planning, Environmental Health and Building, and Ranger Services.
Shire of Brookton Annual Report 2015/16 Page 11 of 31
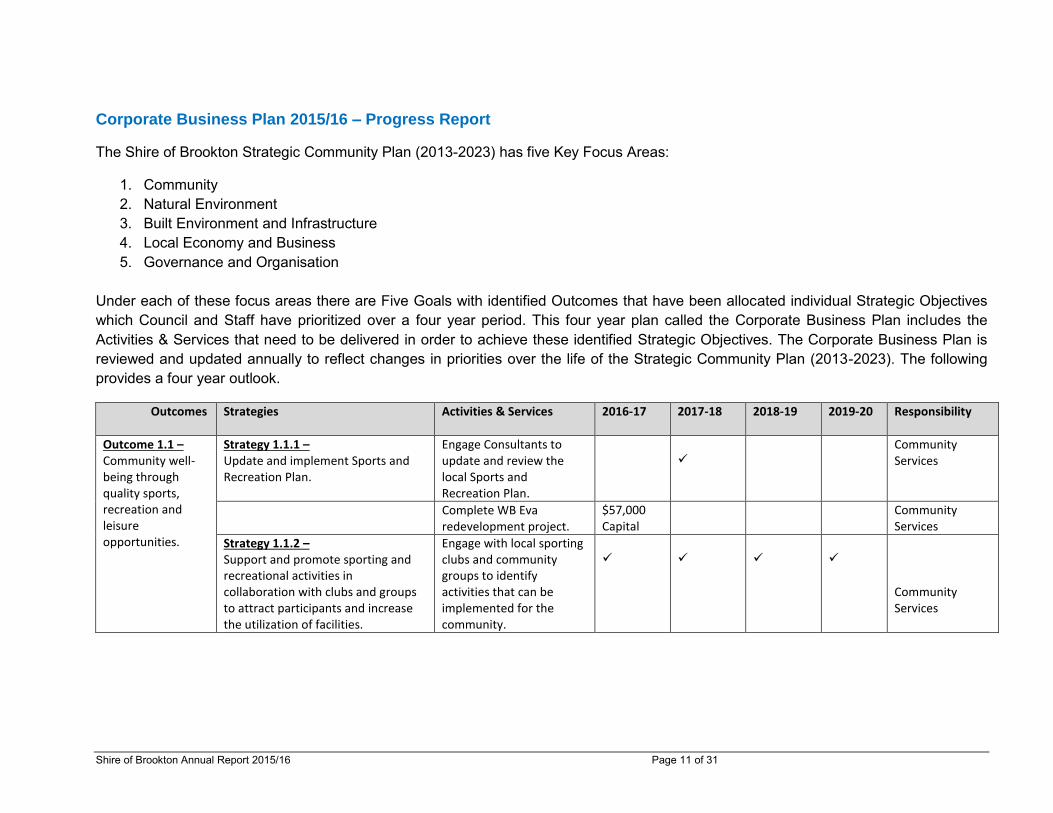
Corporate Business Plan 2015/16 – Progress Report
The Shire of Brookton Strategic Community Plan (2013-2023) has five Key Focus Areas:
1. Community2. Natural Environment3. Built Environment and Infrastructure4. Local Economy and Business5. Governance and Organisation
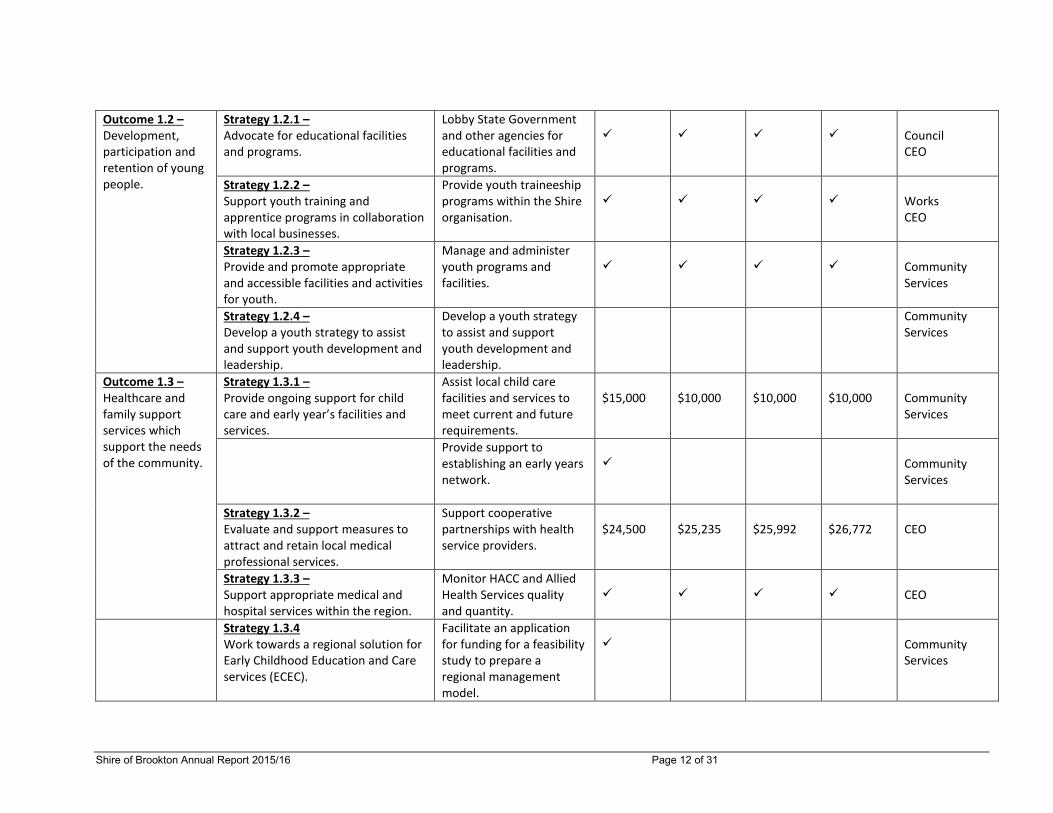
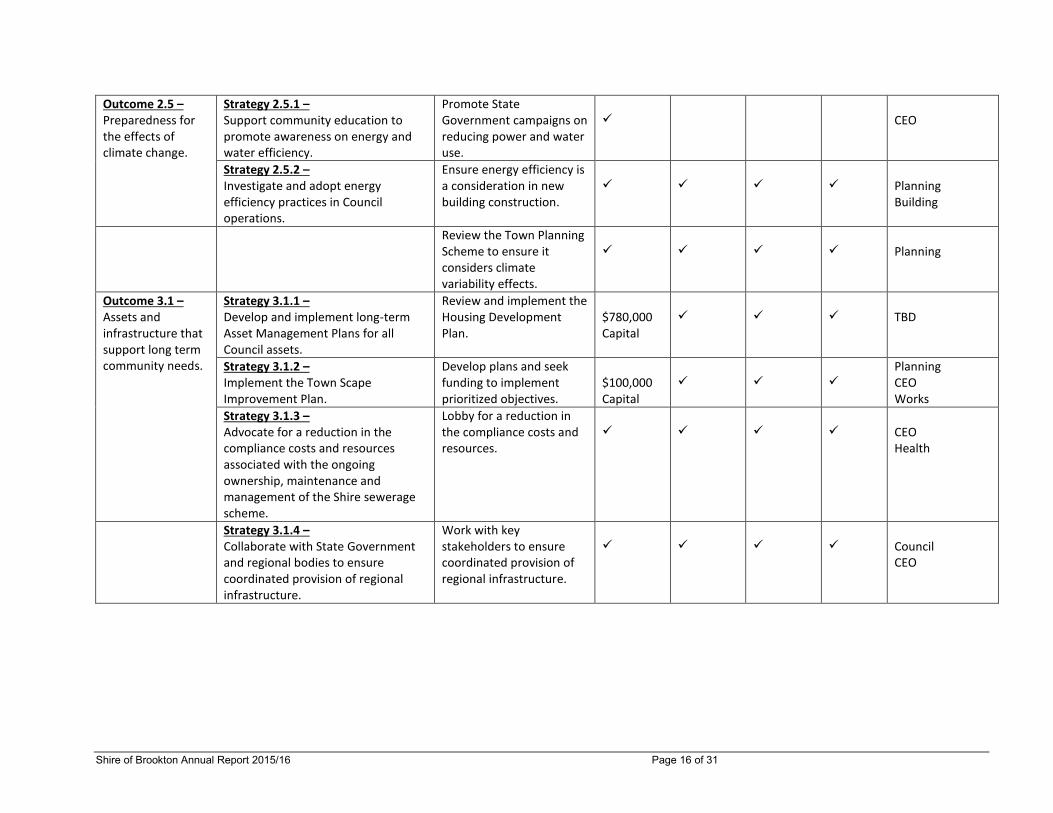
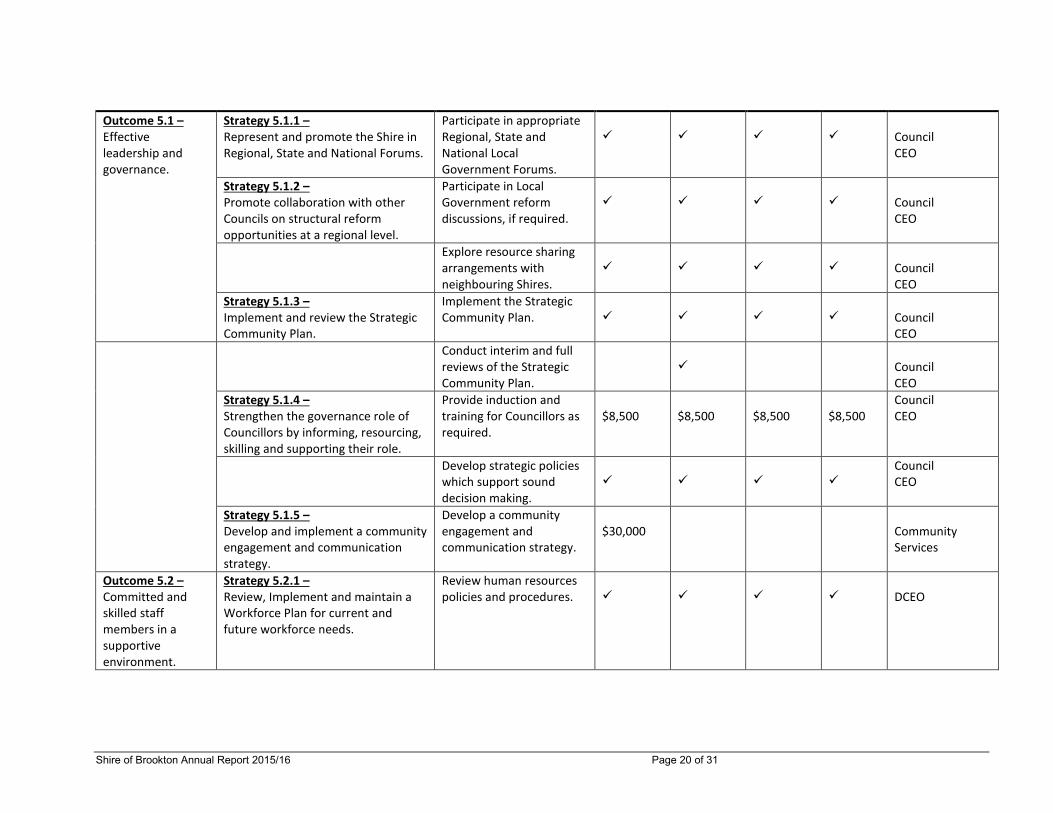
Under each of these focus areas there are Five Goals with identified Outcomes that have been allocated individual Strategic Objectives which Council and Staff have prioritized over a four year period. This four year plan called the Corporate Business Plan includes the Activities & Services that need to be delivered in order to achieve these identified Strategic Objectives. The Corporate Business Plan is reviewed and updated annually to reflect changes in priorities over the life of the Strategic Community Plan (2013-2023). The following provides a four year outlook.
Outcomes Strategies Activities & Services 2016-17 2017-18 2018-19 2019-20 Responsibility
Outcome 1.1 – Community well-being through quality sports, recreation and leisure opportunities.
Strategy 1.1.1 – Update and implement Sports and Recreation Plan.
Engage Consultants to update and review the local Sports and Recreation Plan.
Community Services
Complete WB Eva redevelopment project.
$57,000 Capital
Community Services
Strategy 1.1.2 – Support and promote sporting and recreational activities in collaboration with clubs and groups to attract participants and increase the utilization of facilities.
Engage with local sporting clubs and community groups to identify activities that can be implemented for the community.
Community Services
Shire of Brookton Annual Report 2015/16 Page 12 of 31
Outcome 1.2 – Development, participation and retention of young people.
Strategy 1.2.1 – Advocate for educational facilities and programs.
Lobby State Government and other agencies for educational facilities and programs.
Council CEO
Strategy 1.2.2 – Support youth training and apprentice programs in collaboration with local businesses.
Provide youth traineeship programs within the Shire organisation.
Works CEO
Strategy 1.2.3 – Provide and promote appropriate and accessible facilities and activities for youth.
Manage and administer youth programs and facilities.
Community Services
Strategy 1.2.4 – Develop a youth strategy to assist and support youth development and leadership.
Develop a youth strategy to assist and support youth development and leadership.
Community Services
Outcome 1.3 – Healthcare and family support services which support the needs of the community.
Strategy 1.3.1 – Provide ongoing support for child care and early year’s facilities and services.
Assist local child care facilities and services to meet current and future requirements.
$15,000 $10,000 $10,000 $10,000 Community Services
Provide support to establishing an early years network.
Community Services
Strategy 1.3.2 – Evaluate and support measures to attract and retain local medical professional services.
Support cooperative partnerships with health service providers.
$24,500 $25,235 $25,992 $26,772 CEO
Strategy 1.3.3 – Support appropriate medical and hospital services within the region.
Monitor HACC and Allied Health Services quality and quantity.
CEO
Strategy 1.3.4 Work towards a regional solution for Early Childhood Education and Care services (ECEC).
Facilitate an application for funding for a feasibility study to prepare a regional management model.
Community Services
Shire of Brookton Annual Report 2015/16 Page 13 of 31
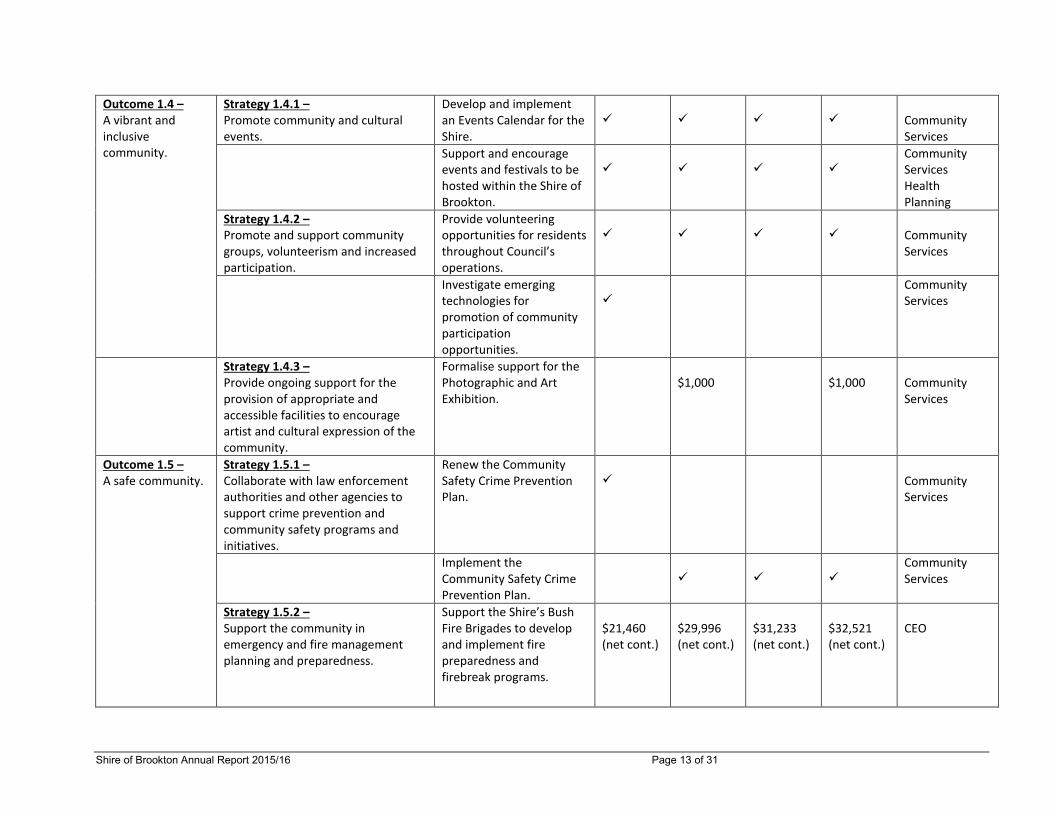
Outcome 1.4 – A vibrant and inclusive community.
Strategy 1.4.1 – Promote community and cultural events.
Develop and implement an Events Calendar for the Shire.
Community Services
Support and encourage events and festivals to be hosted within the Shire of Brookton.
Community Services Health Planning
Strategy 1.4.2 – Promote and support community groups, volunteerism and increased participation.
Provide volunteering opportunities for residents throughout Council’s operations.
Community Services
Investigate emerging technologies for promotion of community participation opportunities.
Community Services
Strategy 1.4.3 – Provide ongoing support for the provision of appropriate and accessible facilities to encourage artist and cultural expression of the community.
Formalise support for the Photographic and Art Exhibition.
$1,000 $1,000 Community Services
Outcome 1.5 – A safe community.
Strategy 1.5.1 – Collaborate with law enforcement authorities and other agencies to support crime prevention and community safety programs and initiatives.
Renew the Community Safety Crime Prevention Plan.
Community Services
Implement the Community Safety Crime Prevention Plan.
Community Services
Strategy 1.5.2 – Support the community in emergency and fire management planning and preparedness.
Support the Shire’s Bush Fire Brigades to develop and implement fire preparedness and firebreak programs.
$21,460 (net cont.)
$29,996 (net cont.)
$31,233 (net cont.)
$32,521 (net cont.)
CEO
Shire of Brookton Annual Report 2015/16 Page 14 of 31
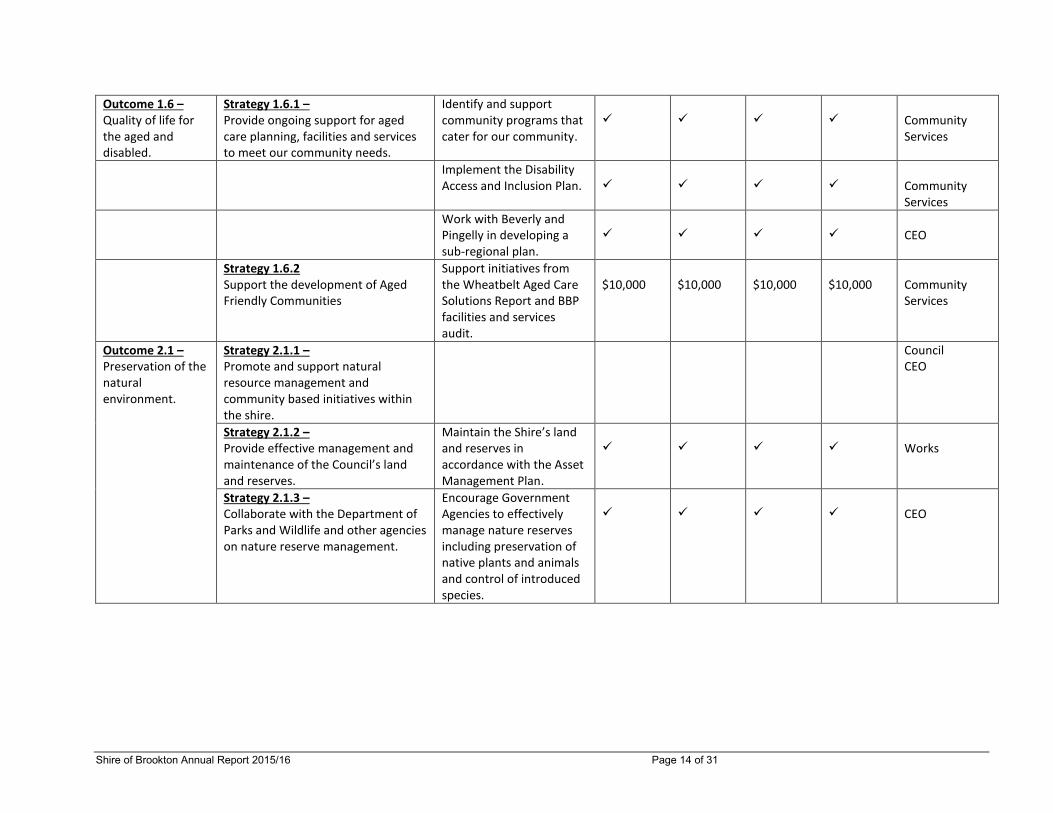
Outcome 1.6 – Quality of life for the aged and disabled.
Strategy 1.6.1 – Provide ongoing support for aged care planning, facilities and services to meet our community needs.
Identify and support community programs that cater for our community.
Community Services
Implement the Disability Access and Inclusion Plan. Community
Services
Work with Beverly and Pingelly in developing a sub-regional plan.
CEO
Strategy 1.6.2 Support the development of Aged Friendly Communities
Support initiatives from the Wheatbelt Aged Care Solutions Report and BBP facilities and services audit.
$10,000 $10,000 $10,000 $10,000 Community Services
Outcome 2.1 – Preservation of the natural environment.
Strategy 2.1.1 – Promote and support natural resource management and community based initiatives within the shire.
Council CEO
Strategy 2.1.2 – Provide effective management and maintenance of the Council’s land and reserves.
Maintain the Shire’s land and reserves in accordance with the Asset Management Plan.
Works
Strategy 2.1.3 – Collaborate with the Department of Parks and Wildlife and other agencies on nature reserve management.
Encourage Government Agencies to effectively manage nature reserves including preservation of native plants and animals and control of introduced species.
CEO
Shire of Brookton Annual Report 2015/16 Page 15 of 31
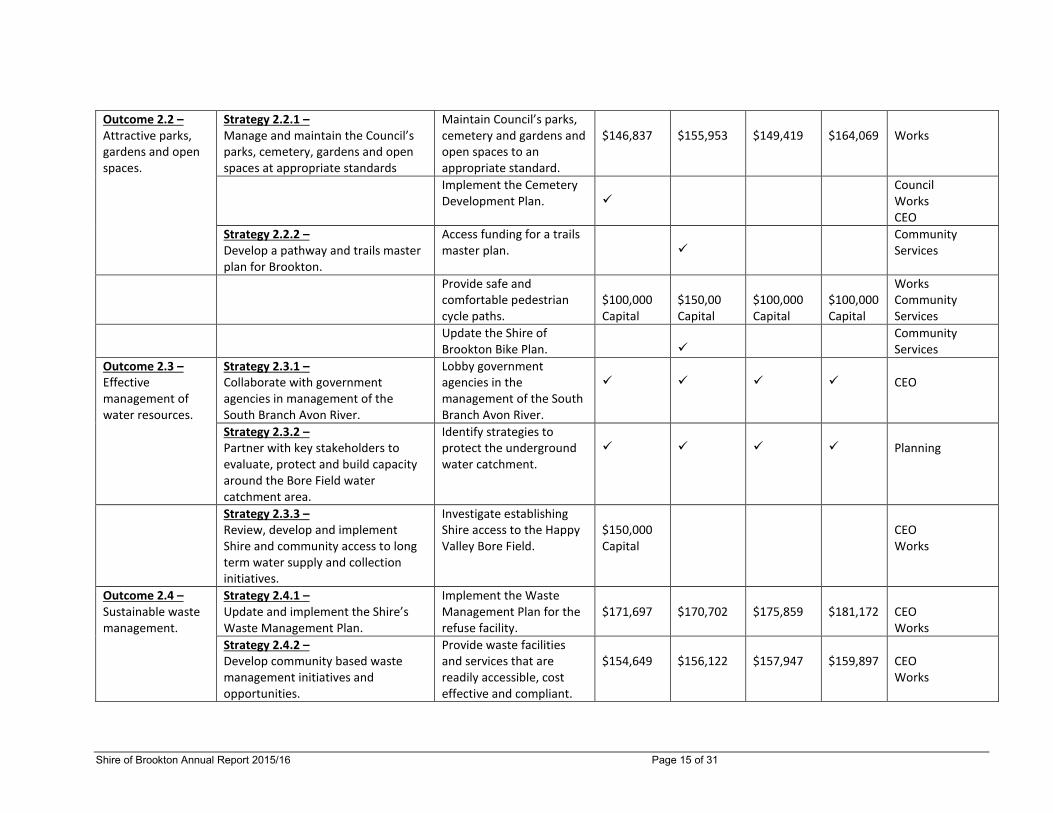
Outcome 2.2 – Attractive parks, gardens and open spaces.
Strategy 2.2.1 – Manage and maintain the Council’s parks, cemetery, gardens and open spaces at appropriate standards
Maintain Council’s parks, cemetery and gardens and open spaces to an appropriate standard.
$146,837 $155,953 $149,419 $164,069 Works
Implement the Cemetery Development Plan.
Council Works CEO
Strategy 2.2.2 – Develop a pathway and trails master plan for Brookton.
Access funding for a trails master plan.
Community Services
Provide safe and comfortable pedestrian cycle paths.
$100,000 Capital
$150,00 Capital
$100,000 Capital
$100,000 Capital
Works Community Services
Update the Shire of Brookton Bike Plan.
Community Services
Outcome 2.3 – Effective management of water resources.
Strategy 2.3.1 – Collaborate with government agencies in management of the South Branch Avon River.
Lobby government agencies in the management of the South Branch Avon River.
CEO
Strategy 2.3.2 – Partner with key stakeholders to evaluate, protect and build capacity around the Bore Field water catchment area.
Identify strategies to protect the underground water catchment.
Planning
Strategy 2.3.3 – Review, develop and implement Shire and community access to long term water supply and collection initiatives.
Investigate establishing Shire access to the Happy Valley Bore Field.
$150,000 Capital
CEO Works
Outcome 2.4 – Sustainable waste management.
Strategy 2.4.1 – Update and implement the Shire’s Waste Management Plan.
Implement the Waste Management Plan for the refuse facility.
$171,697 $170,702 $175,859 $181,172 CEO Works
Strategy 2.4.2 – Develop community based waste management initiatives and opportunities.
Provide waste facilities and services that are readily accessible, cost effective and compliant.
$154,649 $156,122 $157,947 $159,897 CEO Works
Shire of Brookton Annual Report 2015/16 Page 16 of 31
Outcome 2.5 – Preparedness for the effects of climate change.
Strategy 2.5.1 – Support community education to promote awareness on energy and water efficiency.
Promote State Government campaigns on reducing power and water use.
CEO
Strategy 2.5.2 – Investigate and adopt energy efficiency practices in Council operations.
Ensure energy efficiency is a consideration in new building construction.
Planning Building
Review the Town Planning Scheme to ensure it considers climate variability effects.
Planning
Outcome 3.1 – Assets and infrastructure that support long term community needs.
Strategy 3.1.1 – Develop and implement long-term Asset Management Plans for all Council assets.
Review and implement the Housing Development Plan.
$780,000 Capital
TBD
Strategy 3.1.2 – Implement the Town Scape Improvement Plan.
Develop plans and seek funding to implement prioritized objectives.
$100,000 Capital
Planning CEO Works
Strategy 3.1.3 – Advocate for a reduction in the compliance costs and resources associated with the ongoing ownership, maintenance and management of the Shire sewerage scheme.
Lobby for a reduction in the compliance costs and resources.
CEO Health
Strategy 3.1.4 – Collaborate with State Government and regional bodies to ensure coordinated provision of regional infrastructure.
Work with key stakeholders to ensure coordinated provision of regional infrastructure.
Council CEO
Shire of Brookton Annual Report 2015/16 Page 17 of 31
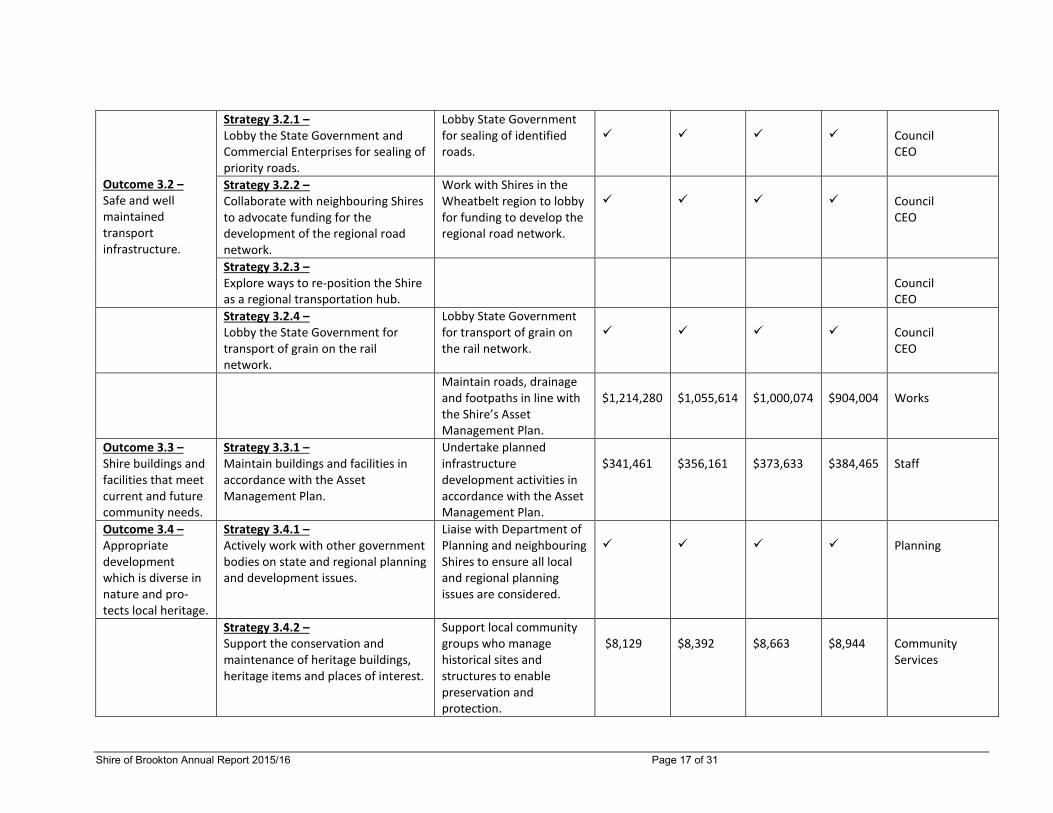
Outcome 3.2 – Safe and well maintained transport infrastructure.
Strategy 3.2.1 – Lobby the State Government and Commercial Enterprises for sealing of priority roads.
Lobby State Government for sealing of identified roads.
Council CEO
Strategy 3.2.2 – Collaborate with neighbouring Shires to advocate funding for the development of the regional road network.
Work with Shires in the Wheatbelt region to lobby for funding to develop the regional road network.
Council CEO
Strategy 3.2.3 – Explore ways to re-position the Shire as a regional transportation hub.
Council CEO
Strategy 3.2.4 – Lobby the State Government for transport of grain on the rail network.
Lobby State Government for transport of grain on the rail network.
Council CEO
Maintain roads, drainage and footpaths in line with the Shire’s Asset Management Plan.
$1,214,280 $1,055,614 $1,000,074 $904,004 Works
Outcome 3.3 – Shire buildings and facilities that meet current and future community needs.
Strategy 3.3.1 – Maintain buildings and facilities in accordance with the Asset Management Plan.
Undertake planned infrastructure development activities in accordance with the Asset Management Plan.
$341,461 $356,161 $373,633 $384,465 Staff
Outcome 3.4 – Appropriate development which is diverse in nature and pro-tects local heritage.
Strategy 3.4.1 – Actively work with other government bodies on state and regional planning and development issues.
Liaise with Department of Planning and neighbouring Shires to ensure all local and regional planning issues are considered.
Planning
Strategy 3.4.2 – Support the conservation and maintenance of heritage buildings, heritage items and places of interest.
Support local community groups who manage historical sites and structures to enable preservation and protection.
$8,129 $8,392 $8,663 $8,944 Community Services
Shire of Brookton Annual Report 2015/16 Page 18 of 31
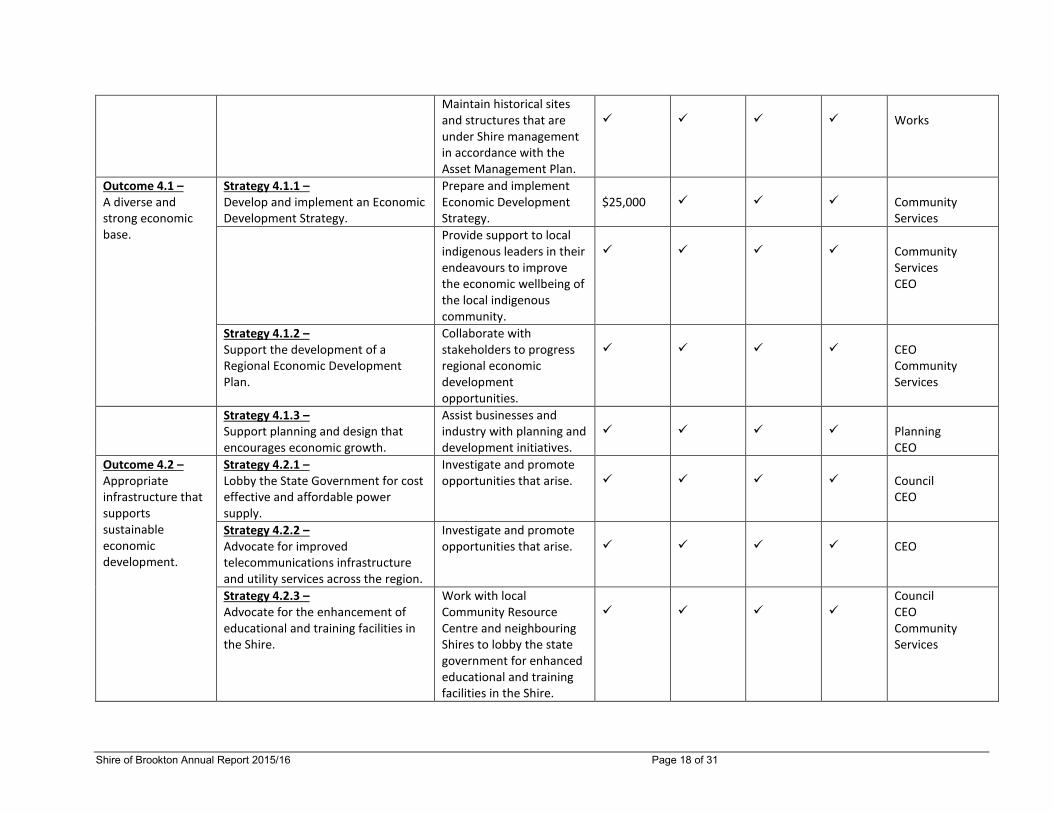
Maintain historical sites and structures that are under Shire management in accordance with the Asset Management Plan.
Works
Outcome 4.1 – A diverse and strong economic base.
Strategy 4.1.1 – Develop and implement an Economic Development Strategy.
Prepare and implement Economic Development Strategy.
$25,000 Community Services
Provide support to local indigenous leaders in their endeavours to improve the economic wellbeing of the local indigenous community.
Community Services CEO
Strategy 4.1.2 – Support the development of a Regional Economic Development Plan.
Collaborate with stakeholders to progress regional economic development opportunities.
CEO Community Services
Strategy 4.1.3 – Support planning and design that encourages economic growth.
Assist businesses and industry with planning and development initiatives.
Planning CEO
Outcome 4.2 – Appropriate infrastructure that supports sustainable economic development.
Strategy 4.2.1 – Lobby the State Government for cost effective and affordable power supply.
Investigate and promote opportunities that arise. Council
CEO
Strategy 4.2.2 – Advocate for improved telecommunications infrastructure and utility services across the region.
Investigate and promote opportunities that arise. CEO
Strategy 4.2.3 – Advocate for the enhancement of educational and training facilities in the Shire.
Work with local Community Resource Centre and neighbouring Shires to lobby the state government for enhanced educational and training facilities in the Shire.
Council CEO Community Services
Shire of Brookton Annual Report 2015/16 Page 19 of 31
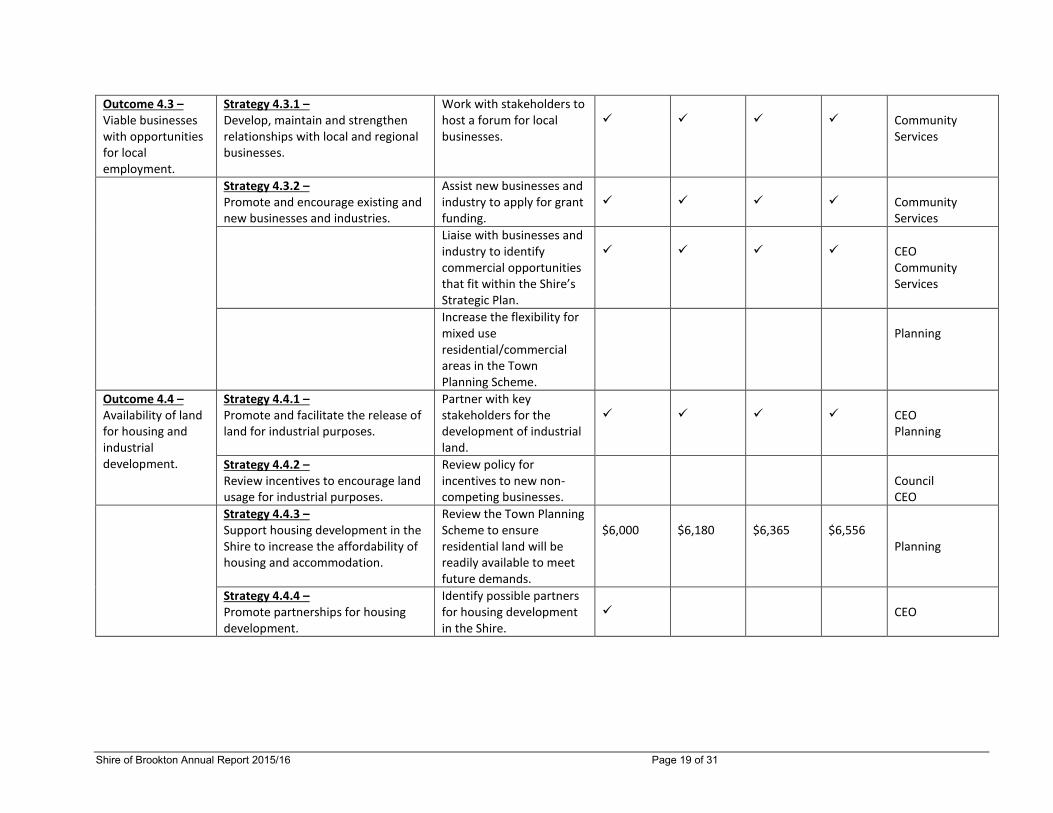
Outcome 4.3 – Viable businesses with opportunities for local employment.
Strategy 4.3.1 – Develop, maintain and strengthen relationships with local and regional businesses.
Work with stakeholders to host a forum for local businesses.
Community Services
Strategy 4.3.2 – Promote and encourage existing and new businesses and industries.
Assist new businesses and industry to apply for grant funding.
Community Services
Liaise with businesses and industry to identify commercial opportunities that fit within the Shire’s Strategic Plan.
CEO Community Services
Increase the flexibility for mixed use residential/commercial areas in the Town Planning Scheme.
Planning
Outcome 4.4 – Availability of land for housing and industrial development.
Strategy 4.4.1 – Promote and facilitate the release of land for industrial purposes.
Partner with key stakeholders for the development of industrial land.
CEO Planning
Strategy 4.4.2 – Review incentives to encourage land usage for industrial purposes.
Review policy for incentives to new non-competing businesses.
Council CEO
Strategy 4.4.3 – Support housing development in the Shire to increase the affordability of housing and accommodation.
Review the Town Planning Scheme to ensure residential land will be readily available to meet future demands.
$6,000 $6,180 $6,365 $6,556 Planning
Strategy 4.4.4 – Promote partnerships for housing development.
Identify possible partners for housing development in the Shire.
CEO
Shire of Brookton Annual Report 2015/16 Page 20 of 31
Outcome 5.1 – Effective leadership and governance.
Strategy 5.1.1 – Represent and promote the Shire in Regional, State and National Forums.
Participate in appropriate Regional, State and National Local Government Forums.
Council CEO
Strategy 5.1.2 – Promote collaboration with other Councils on structural reform opportunities at a regional level.
Participate in Local Government reform discussions, if required.
Council CEO
Explore resource sharing arrangements with neighbouring Shires.
Council CEO
Strategy 5.1.3 – Implement and review the Strategic Community Plan.
Implement the Strategic Community Plan. Council
CEO
Conduct interim and full reviews of the Strategic Community Plan.
Council CEO
Strategy 5.1.4 – Strengthen the governance role of Councillors by informing, resourcing, skilling and supporting their role.
Provide induction and training for Councillors as required.
$8,500 $8,500 $8,500 $8,500 Council CEO
Develop strategic policies which support sound decision making.
Council CEO
Strategy 5.1.5 – Develop and implement a community engagement and communication strategy.
Develop a community engagement and communication strategy.
$30,000 Community Services
Outcome 5.2 – Committed and skilled staff members in a supportive environment.
Strategy 5.2.1 – Review, Implement and maintain a Workforce Plan for current and future workforce needs.
Review human resources policies and procedures. DCEO
Shire of Brookton Annual Report 2015/16 Page 21 of 31
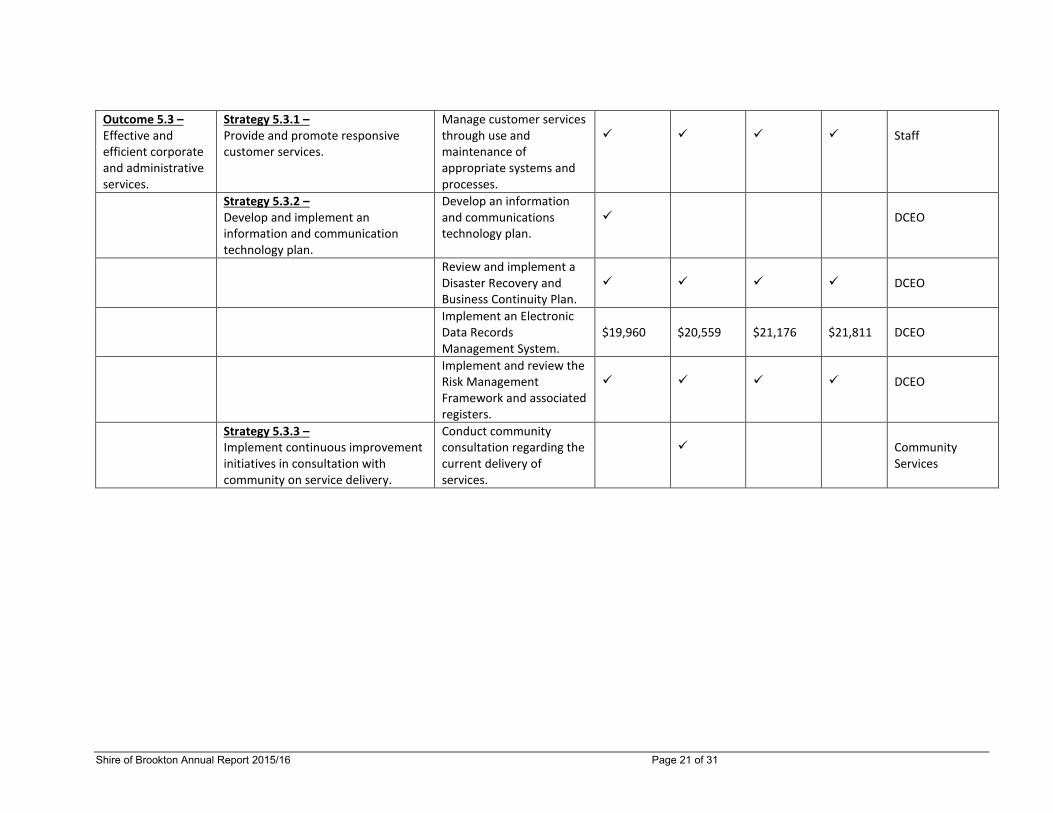
Outcome 5.3 – Effective and efficient corporate and administrative services.
Strategy 5.3.1 – Provide and promote responsive customer services.
Manage customer services through use and maintenance of appropriate systems and processes.
Staff
Strategy 5.3.2 – Develop and implement an information and communication technology plan.
Develop an information and communications technology plan.
DCEO
Review and implement a Disaster Recovery and Business Continuity Plan.
DCEO
Implement an Electronic Data Records Management System.
$19,960 $20,559 $21,176 $21,811 DCEO
Implement and review the Risk Management Framework and associated registers.
DCEO
Strategy 5.3.3 – Implement continuous improvement initiatives in consultation with community on service delivery.
Conduct community consultation regarding the current delivery of services.
Community Services
Shire of Brookton Annual Report 2015/16 Page 22 of 31
Disability Access & Inclusion Plan
The Disability Services Act 1993 (amended 2004) requires local governments to report on their Disability Access & Inclusion Plan (DAIP) achievements annually. The achievements for the year ended 30 June 2016 are listed below and grouped into the outcome areas addressed in the Shire of Brookton Disability Access and Inclusion Plan 2013-2018.
OUTCOME 1: People with disability have the same opportunities as other people to access the services of, and any events organised by, the Shire of Brookton.
Accessible Events checklist used for Shire organised events. Accessible Events checklist issued to planner for use in evaluating
externally organised events. Corporate Business Plan includes initiatives from the DAIP.
OUTCOME 2: People with disability have the same opportunities as other people to access Shire of Brookton buildings and other facilities.
Legal requirements for access are met in new buildings. Development Applications are not signed off without declaration that it
meets legal requirements. Public buildings inspected.
OUTCOME 3: People with disability receive information from the Shire of Brookton in a format that will enable them to access the information as readily as other people are able to access it.
New staff have been briefed on the requirements for provision ofinformation and made aware of locally available resources.
OUTCOME 4: People with disability receive the same level and quality of service from the employees of the Shire of Brookton as other people receive from the employees of the Shire of Brookton.
Information on alternative provision is made available to staff. Staff are aware of their obligations in service provision.
OUTCOME 5: People with disability have the same opportunities as other people
to make complaints to the Shire of Brookton.
Information about grievance mechanisms is prepared using clear andconcise language. This information is made available in alternativeformats on request. During the year no such requests were received.
Web based forms were introduced for reporting of issues and makingcomplaints.
Shire of Brookton Annual Report 2015/16 Page 23 of 31
OUTCOME 6: People with disability have the same opportunities as other people to participate in any public consultation by the Shire of Brookton.
Consultation provided in a variety of formats including electronic. Venues that are utilised for community participation in Council
processes are selected with the objective of ensuring access for all members of the community.
OUTCOME 7: People with disability have the same opportunities as other people
to obtain and maintain employment with the Shire of Brookton.
Senior staff have attended Lighthouse Project training. Audit app has been prepared for audit to be undertaken.
People with disability have been engaged in both volunteer and paid roles during the year.
Shire of Brookton Annual Report 2015/16 Page 24 of 31
Freedom of Information Statement This information statement is published in accordance with section 96 of the Freedom of Information Act 1992. 1. Structure and Functions of Council Establishment The Shire of Brookton is established under the Local Government Act 1995, and has the responsibility for the administration of this Act within the municipality. Other major legislation which creates a duty or an authority for Council to act includes but is not limited to:
Health Act 1911 Planning and Development Act 2005 Bush Fires Act 1954
Dog Act 1976 Cemeteries Act 1986 Litter Act 1979 Freedom of Information Act 1992
Council Council’s affairs are managed by seven Councillors elected from and by the community. The Council acts as a community board, establishing policies and making decisions within the requirements of the Local Government Act on a wide range of issues affecting the community, and in keeping with the legislative requirements to:
Determine policies to be applied by Council in exercising its discretionary powers. Determine the type, range and scope of projects to be undertaken by Council. Develop comprehensive management plans, budgets, financial controls and
performance objectives and indicators for the operations of Council.
Council makes decisions which direct and/or determine its activities and functions. Such decisions include the approval of works and services to be undertaken, and the allocation of resources to works and services. Decisions are also made to determine whether or not approvals are to be granted for applications for residential and commercial development. Ordinary meetings of Council are held on the third Thursday of each month (except January) commencing at 12.30 pm. All members of the public are welcome to attend. Personal Involvement Elected members are involved with many organisations within the community, and are also active in representing Brookton at a regional or state level. Council’s nominations to other organisations include:
WALGA Central Country Zone (Regional) Main Roads WA Wheatbelt South Regional Road Group Hotham/Dale Sub Group Yenyenning Lakes Committee (Regional)
Shire of Brookton Annual Report 2015/16 Page 25 of 31
Personal Involvement (continued)
School Bus Run Committees (Local) Brookton Old Time Motor Show (Local) Worsley Community Liaison (Regional) Central AgCare (Regional) Local Emergency Management Committee (Local)
Standing Committees At present there are seven standing Committees of Council:
Employment Committee Kalkarni Consultative Committee Community Housing Committee Les McMullen Memorial Recreation Grants Committee Audit Committee Bush Fire Advisory Committee Plant and Works Committee
Occasional Committees Council utilises occasional Committees as and when required. Agendas Agendas are prepared for members and are distributed one week prior to the meeting. Copies of the Agenda are available prior to the meeting in accordance with the Local Government Act 1995. Please note that all Minutes are subject to confirmation by Council.
Delegated Authority
Under the Local Government Act 1995, Council is able to delegate many powers to either Committees or to the Chief Executive Officer. A Committee or the CEO may then further delegate the duty or responsibility to perform a task. Delegations are recorded in a Register, and are reviewed by Council annually. 2. Services to the Community Council provides an extensive variety of services for the community under a wide range of legislation. Services provided include: Building control Library services Recycling Bush fire control Litter bins Roads, footpaths & kerbs Cemeteries Media releases Rubbish collection Citizenship ceremonies Parks and reserves Sewerage Crossovers Planning Controls Street lighting Dog control Playground equipment Street sweeping Drainage Public buildings for hire Street tree planting
Shire of Brookton Annual Report 2015/16 Page 26 of 31
Services to the Community (continued) Environmental health Public toilets Swimming Pool Fire prevention Recreation/sporting facilities Traffic control works 3. Access to Council Documents The following documents are available for inspection at the Council Offices free of charge. Copies of the documents can be made available, although some will incur a charge to cover the cost of photocopying. The Local Government Act 1995 does stipulate minimum requirements for documents to be made available for public inspection, and these include:
Minutes and Agendas of Council and Committee meetings General Policy Manual Annual Budget Annual Report Annual Financial Statements Monthly Financial Statements Council Local Laws Town Planning Scheme Electoral Roll Financial Interest Register - Primary and Annual Returns and Declarations
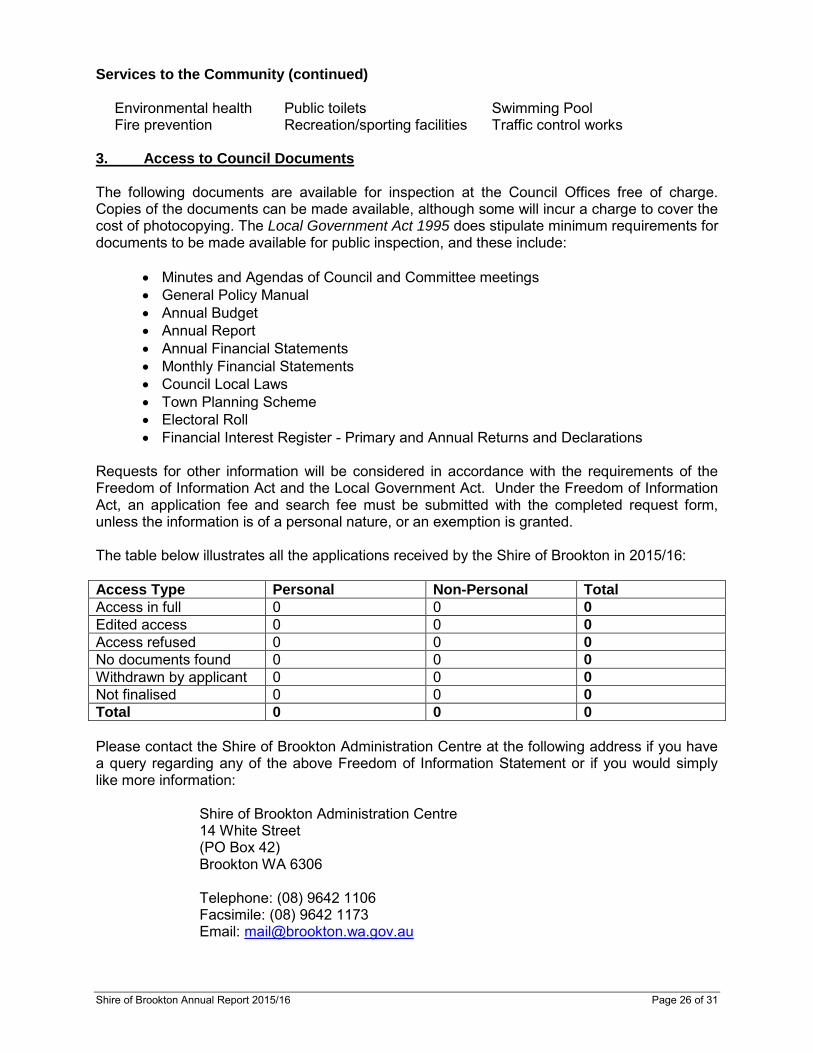
Requests for other information will be considered in accordance with the requirements of the Freedom of Information Act and the Local Government Act. Under the Freedom of Information Act, an application fee and search fee must be submitted with the completed request form, unless the information is of a personal nature, or an exemption is granted. The table below illustrates all the applications received by the Shire of Brookton in 2015/16: Access Type Personal Non-Personal Total
Access in full 0 0 0
Edited access 0 0 0
Access refused 0 0 0
No documents found 0 0 0
Withdrawn by applicant 0 0 0
Not finalised 0 0 0
Total 0 0 0
Please contact the Shire of Brookton Administration Centre at the following address if you have a query regarding any of the above Freedom of Information Statement or if you would simply like more information:
Shire of Brookton Administration Centre 14 White Street (PO Box 42) Brookton WA 6306 Telephone: (08) 9642 1106 Facsimile: (08) 9642 1173 Email: [email protected]
Shire of Brookton Annual Report 2015/16 Page 27 of 31
Most documents can also be accessed through the Shire of Brookton website at www.brookton.wa.gov.au. Official Conduct Report The Local Government Act 1995 requires the Shire to report on the number of official conduct complaints recorded under section 5.121 during a financial year. The Shire of Brookton did not receive complaints of this nature that resulted in action under section 5.110 (6)(b) or (c) during the 2015/16 financial year. National Competition Policy Statement The Federal and all State governments have a Competition Principles Agreement in place, which is binding on local government. The agreement requires the Shire of Brookton to carry out a number of procedures and include a report on the matter in each year’s Annual Report. The three areas that affect Local Government are: 1) Competitive Neutrality - To remove benefits (and costs) which accrue to Government
business as a result of their public ownership. 2) Structural Reform - Local government is required to reform the structure of publicly owned
monopoly businesses where it is proposed to introduce competition. 3) Legislation Review - To review legislation that restricts competition. The full requirements of the package are contained in a statement issued by the Department of Local Government and Communities. Competitive Neutrality There are several tests to apply that assist in determining if there is a “significant business enterprise”: 1) Does the activity receive revenue from external sources that exceeds $200,000 per
annum? (In determining this amount, Council has been advised to disregard grant income, internal charges, and statutory fees.)
2) Would the benefits to be realised from the implementation of competitive neutrality exceed
the costs? From an examination of the revenue statement for the Shire of Brookton for the preceding period, there is no activity that satisfies this first part of the test, and accordingly, the principles of competitive neutrality do not apply to any Council activities. Structural Reform In this area, the Council has no monopoly activities. What is basic to the function of restructuring public monopolies is the splitting or division of the regulatory role from the service provision role.
Shire of Brookton Annual Report 2015/16 Page 28 of 31
To address the question of monopoly, the following test has been applied to each activity: 1) Definition: In regards to this service, does the Council have “exclusive or near exclusive
control of the market supply of this service?” 2) Dual Function: Does the Council have both a regulatory and supply function in this area of
activity? 3) Willing competitors: If the Council tendered for the supply of this service in the open
market, is it likely that there would be a supplier willing to perform this service? The Council does not have a dual function role in any of the following services:
Aged person residency Swimming pool Parks and gardens Roads Recreation services Cemetery
When reviewed, these functions appeared to have substance to the sole provider argument however, it is considered that only in parks and gardens maintenance, is it likely that there would be willing local competitors. On balance, therefore, it was concluded that a monopoly does not exist.
Legislation Review
The Council has a portfolio of local laws (previously known as by-laws), which may or may not conflict with the Competition Principles Agreement. These local laws have been reviewed to ensure compliance with the reporting requirements. As a result of the review, a report was produced which provides the following information regarding existing local laws:
Statement of objective to be specified for each local law Statement of possible restrictions that may result as a consequence of the application
of the local law Statement of likely affects on the restriction of competition Statement of costs and benefits of the restrictions Statement of proposals for alternatives.
In conducting the review, in particular concerning provision of services, Council considered the effect of local laws with regard to how they:
Regulate the entry and exit of participants in various markets Control pricing or production levels Regulate the price of goods or services used in various production processes Regulate the quality, amount or location of goods and service delivery Regulate advertising and promotional activities Confer benefits on particular classes of competitors Allow only one entity to supply a good or service
Shire of Brookton Annual Report 2015/16 Page 29 of 31
Require producers of goods or services to sell to a single entity Limit the number of actual or potential producers of goods or services in a market Limit the output of an entity Limit the number of people that can be engaged in an occupation or activity
The findings of the review will be implemented, on a staged basis over time, by the repeal of inappropriate provisions and the adoption of new local laws where necessary. State Records Act 2000 The State Records Act 2000 (the Act) is an Act to provide for the keeping of State records and for related purposes. Section 19 of the Act requires each government organisation to have a Recordkeeping Plan approved by the State Records Commission.
State Records Commission (SRC) Standard 1 – Government Recordkeeping requires that government organisations ensure that records are created, managed and maintained over time and disposed of in accordance with principles and standards issued by the SRC. SRC Standard 2 – Recordkeeping Plans comprises six Recordkeeping principles each of which contains minimum compliance requirements. SRC Standard 6 – Outsourcing comprises seven principles each of which contains minimum compliance requirements.
The purpose of the Shire’s Recordkeeping Plan (RKP) is to set out the minimum requirements as to which records are to be created by the Shire of Brookton and how it is to keep its records. Recordkeeping Plans are to provide an accurate reflection of the recordkeeping program within the organisation, including information regarding the organisation’s recordkeeping system(s), disposal arrangements, policies, practices and processes. The RKP is the primary means of providing evidence of compliance with the Act. The objectives of the Shire of Brookton RKP are to ensure: Compliance with Section 19 of the State Records Act 2000; Recordkeeping within the Local Government is moving towards compliance with State
Records Commission Standards and Records Management Standard AS ISO 15489; Processes are in place to facilitate the complete and accurate record of business
transactions and decisions; Recorded information can be retrieved quickly, accurately and cheaply when required; and
the Protection and preservation of the Local Government’s records.
In accordance with Section 17 of the Act, the Shire of Brookton and all its employees are required to comply with the contents of this Plan.
This RKP applies to all of the Shire of Brookton’s:
employees; contractors; organisations performing outsourced services on behalf of the Shire of Brookton; and Elected Members.
Shire of Brookton Annual Report 2015/16 Page 30 of 31
Appendix : Annual Financial Report 2015/16
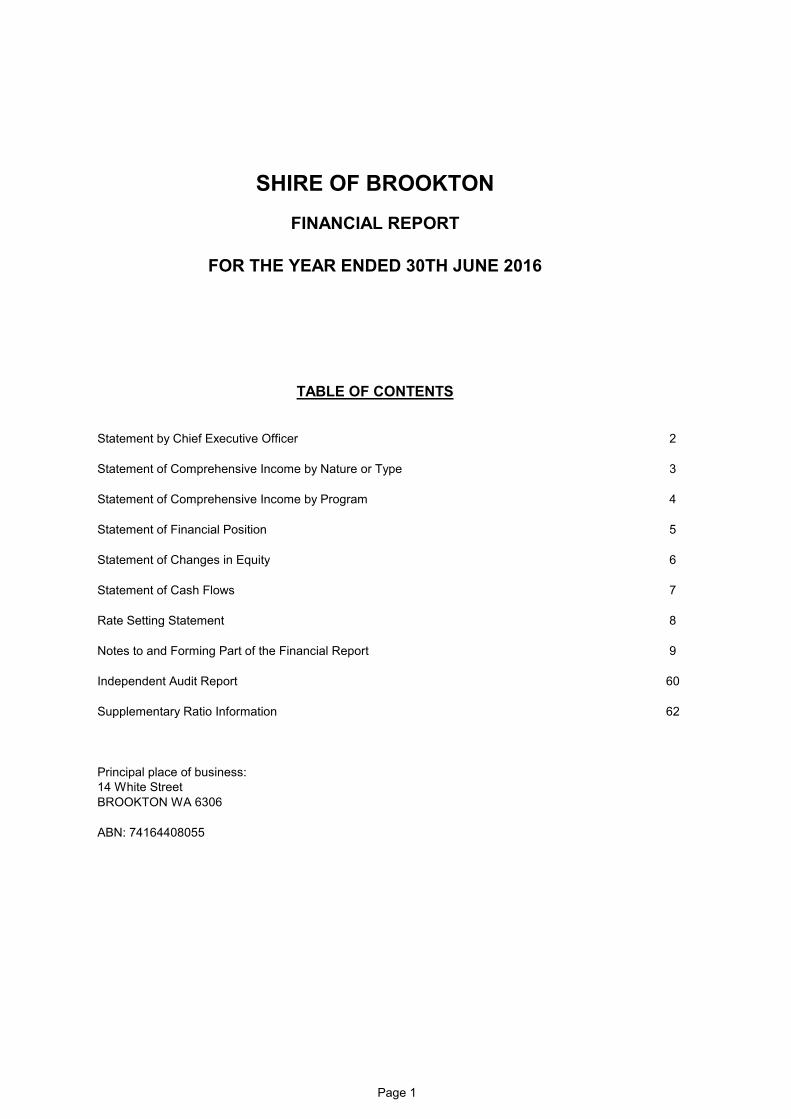
FINANCIAL REPORT
FOR THE YEAR ENDED 30TH JUNE 2016
TABLE OF CONTENTS
Statement by Chief Executive Officer 2
Statement of Comprehensive Income by Nature or Type 3
Statement of Comprehensive Income by Program 4
Statement of Financial Position 5
Statement of Changes in Equity 6
Statement of Cash Flows 7
Rate Setting Statement 8
Notes to and Forming Part of the Financial Report 9
Independent Audit Report 60
Supplementary Ratio Information 62
Principal place of business:14 White StreetBROOKTON WA 6306
ABN: 74164408055
SHIRE OF BROOKTON
Page 1
SHIRE OF BROOKTONFINANCIAL REPORT
FOR THE YEAR ENDED 30TH JUNE 2016
LOCAL GOVERNMENT ACT 1995LOCAL GOVERNMENT (FINANCIAL MANAGEMENT) REGULATIONS 1996
STATEMENT BY CHIEF EXECUTIVE OFFICER
The attached financial report of the Shire being the annual financial report andother information for the financial year ended 30 June 2016 are in my opinion properly drawnup to present fairly the financial position of the Shire at 30th June 2016 and theresults of the operations for the financial year then ended in accordance with the AustralianAccounting Standards and comply with the provisions of the Local Government Act 1995 andthe regulations under that Act.
Page 2
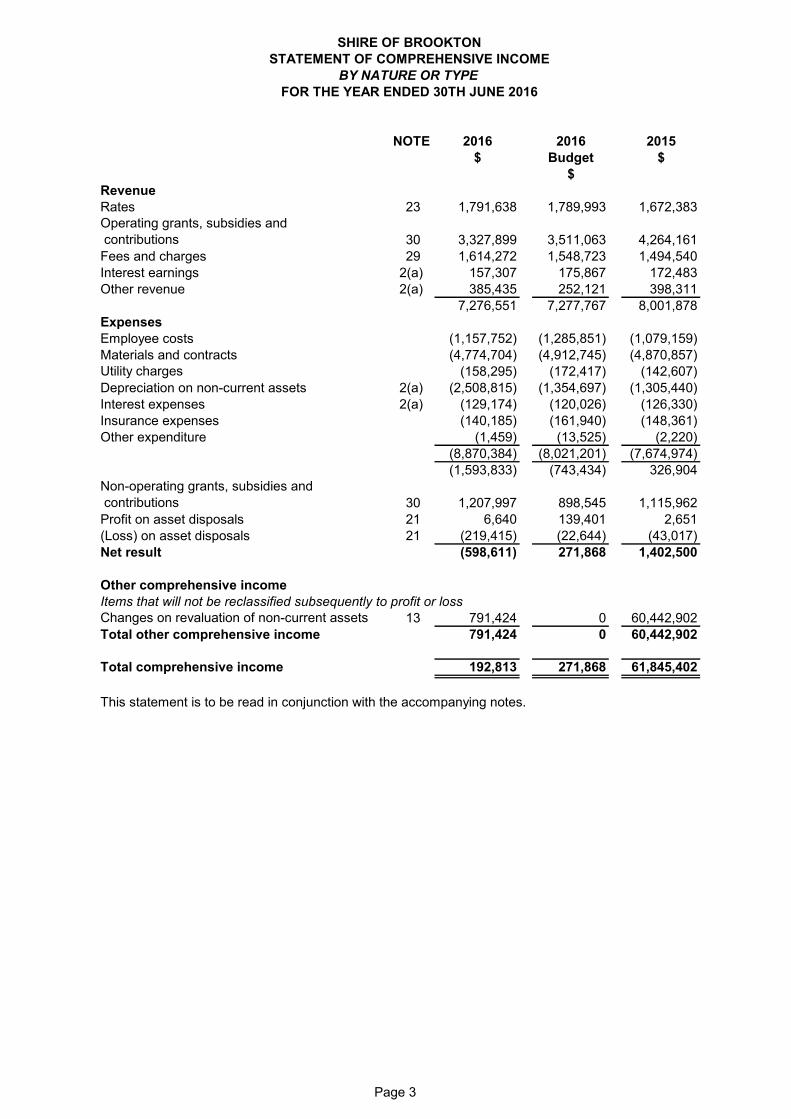
SHIRE OF BROOKTONSTATEMENT OF COMPREHENSIVE INCOME
BY NATURE OR TYPEFOR THE YEAR ENDED 30TH JUNE 2016
NOTE 2016 2016 2015$ Budget $
$RevenueRates 23 1,791,638 1,789,993 1,672,383Operating grants, subsidies and contributions 30 3,327,899 3,511,063 4,264,161Fees and charges 29 1,614,272 1,548,723 1,494,540Interest earnings 2(a) 157,307 175,867 172,483Other revenue 2(a) 385,435 252,121 398,311
7,276,551 7,277,767 8,001,878ExpensesEmployee costs (1,157,752) (1,285,851) (1,079,159)Materials and contracts (4,774,704) (4,912,745) (4,870,857)Utility charges (158,295) (172,417) (142,607)Depreciation on non-current assets 2(a) (2,508,815) (1,354,697) (1,305,440)Interest expenses 2(a) (129,174) (120,026) (126,330)Insurance expenses (140,185) (161,940) (148,361)Other expenditure (1,459) (13,525) (2,220)
(8,870,384) (8,021,201) (7,674,974)(1,593,833) (743,434) 326,904
Non-operating grants, subsidies and contributions 30 1,207,997 898,545 1,115,962Profit on asset disposals 21 6,640 139,401 2,651(Loss) on asset disposals 21 (219,415) (22,644) (43,017)Net result (598,611) 271,868 1,402,500
Other comprehensive incomeItems that will not be reclassified subsequently to profit or lossChanges on revaluation of non-current assets 13 791,424 0 60,442,902Total other comprehensive income 791,424 0 60,442,902
Total comprehensive income 192,813 271,868 61,845,402
This statement is to be read in conjunction with the accompanying notes.
Page 3
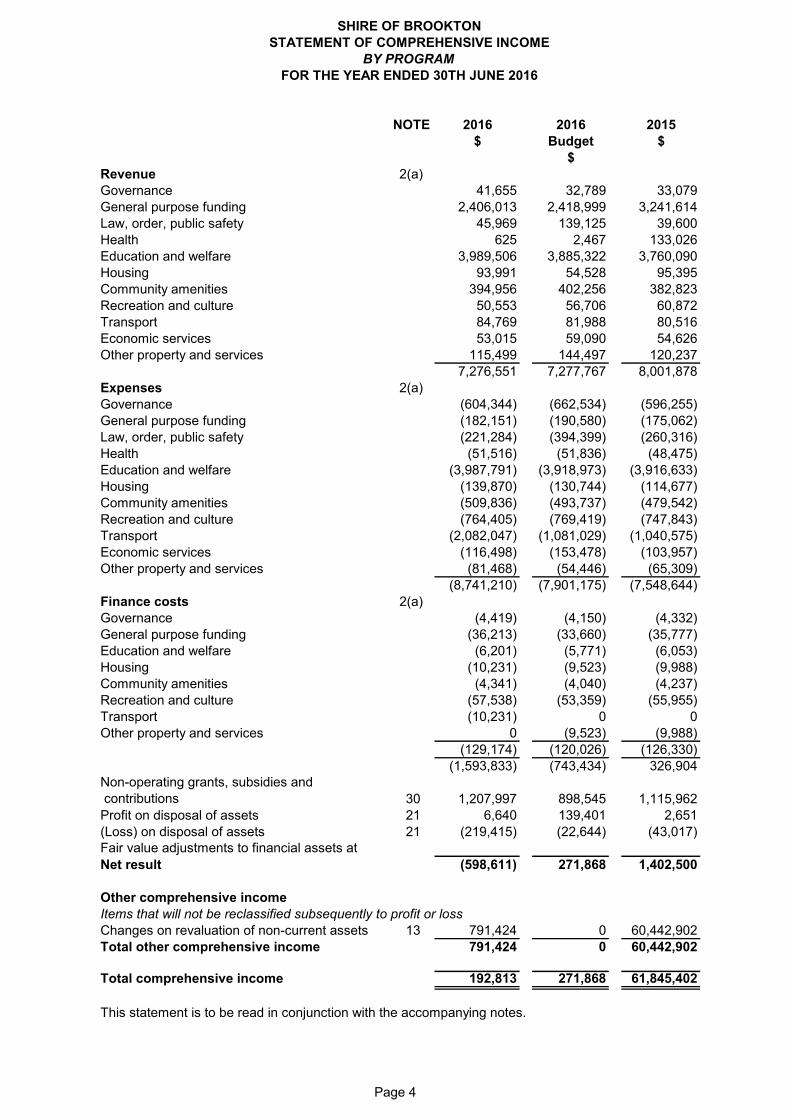
SHIRE OF BROOKTONSTATEMENT OF COMPREHENSIVE INCOME
BY PROGRAMFOR THE YEAR ENDED 30TH JUNE 2016
NOTE 2016 2016 2015$ Budget $
$Revenue 2(a) Governance 41,655 32,789 33,079General purpose funding 2,406,013 2,418,999 3,241,614Law, order, public safety 45,969 139,125 39,600Health 625 2,467 133,026Education and welfare 3,989,506 3,885,322 3,760,090Housing 93,991 54,528 95,395Community amenities 394,956 402,256 382,823Recreation and culture 50,553 56,706 60,872Transport 84,769 81,988 80,516Economic services 53,015 59,090 54,626Other property and services 115,499 144,497 120,237
7,276,551 7,277,767 8,001,878Expenses 2(a) Governance (604,344) (662,534) (596,255)General purpose funding (182,151) (190,580) (175,062)Law, order, public safety (221,284) (394,399) (260,316)Health (51,516) (51,836) (48,475)Education and welfare (3,987,791) (3,918,973) (3,916,633)Housing (139,870) (130,744) (114,677)Community amenities (509,836) (493,737) (479,542)Recreation and culture (764,405) (769,419) (747,843)Transport (2,082,047) (1,081,029) (1,040,575)Economic services (116,498) (153,478) (103,957)Other property and services (81,468) (54,446) (65,309)
(8,741,210) (7,901,175) (7,548,644)Finance costs 2(a) Governance (4,419) (4,150) (4,332)General purpose funding (36,213) (33,660) (35,777)Education and welfare (6,201) (5,771) (6,053)Housing (10,231) (9,523) (9,988)Community amenities (4,341) (4,040) (4,237)Recreation and culture (57,538) (53,359) (55,955)Transport (10,231) 0 0Other property and services 0 (9,523) (9,988)
(129,174) (120,026) (126,330)(1,593,833) (743,434) 326,904
Non-operating grants, subsidies and contributions 30 1,207,997 898,545 1,115,962Profit on disposal of assets 21 6,640 139,401 2,651(Loss) on disposal of assets 21 (219,415) (22,644) (43,017)Fair value adjustments to financial assets at Net result (598,611) 271,868 1,402,500
Other comprehensive incomeItems that will not be reclassified subsequently to profit or lossChanges on revaluation of non-current assets 13 791,424 0 60,442,902Total other comprehensive income 791,424 0 60,442,902
Total comprehensive income 192,813 271,868 61,845,402
This statement is to be read in conjunction with the accompanying notes.
Page 4
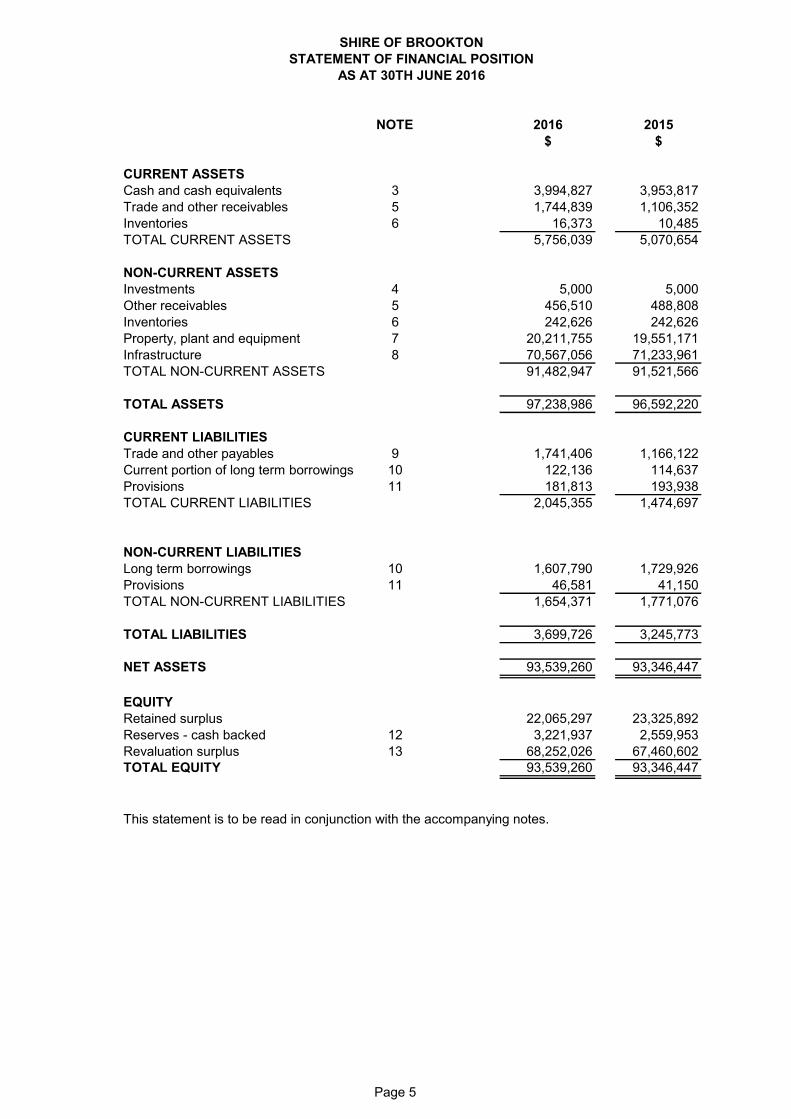
SHIRE OF BROOKTONSTATEMENT OF FINANCIAL POSITION
AS AT 30TH JUNE 2016
NOTE 2016 2015$ $
CURRENT ASSETSCash and cash equivalents 3 3,994,827 3,953,817Trade and other receivables 5 1,744,839 1,106,352Inventories 6 16,373 10,485TOTAL CURRENT ASSETS 5,756,039 5,070,654
NON-CURRENT ASSETSInvestments 4 5,000 5,000Other receivables 5 456,510 488,808Inventories 6 242,626 242,626Property, plant and equipment 7 20,211,755 19,551,171Infrastructure 8 70,567,056 71,233,961TOTAL NON-CURRENT ASSETS 91,482,947 91,521,566
TOTAL ASSETS 97,238,986 96,592,220
CURRENT LIABILITIESTrade and other payables 9 1,741,406 1,166,122Current portion of long term borrowings 10 122,136 114,637Provisions 11 181,813 193,938TOTAL CURRENT LIABILITIES 2,045,355 1,474,697
NON-CURRENT LIABILITIESLong term borrowings 10 1,607,790 1,729,926Provisions 11 46,581 41,150TOTAL NON-CURRENT LIABILITIES 1,654,371 1,771,076
TOTAL LIABILITIES 3,699,726 3,245,773
NET ASSETS 93,539,260 93,346,447
EQUITYRetained surplus 22,065,297 23,325,892Reserves - cash backed 12 3,221,937 2,559,953Revaluation surplus 13 68,252,026 67,460,602TOTAL EQUITY 93,539,260 93,346,447
This statement is to be read in conjunction with the accompanying notes.
Page 5
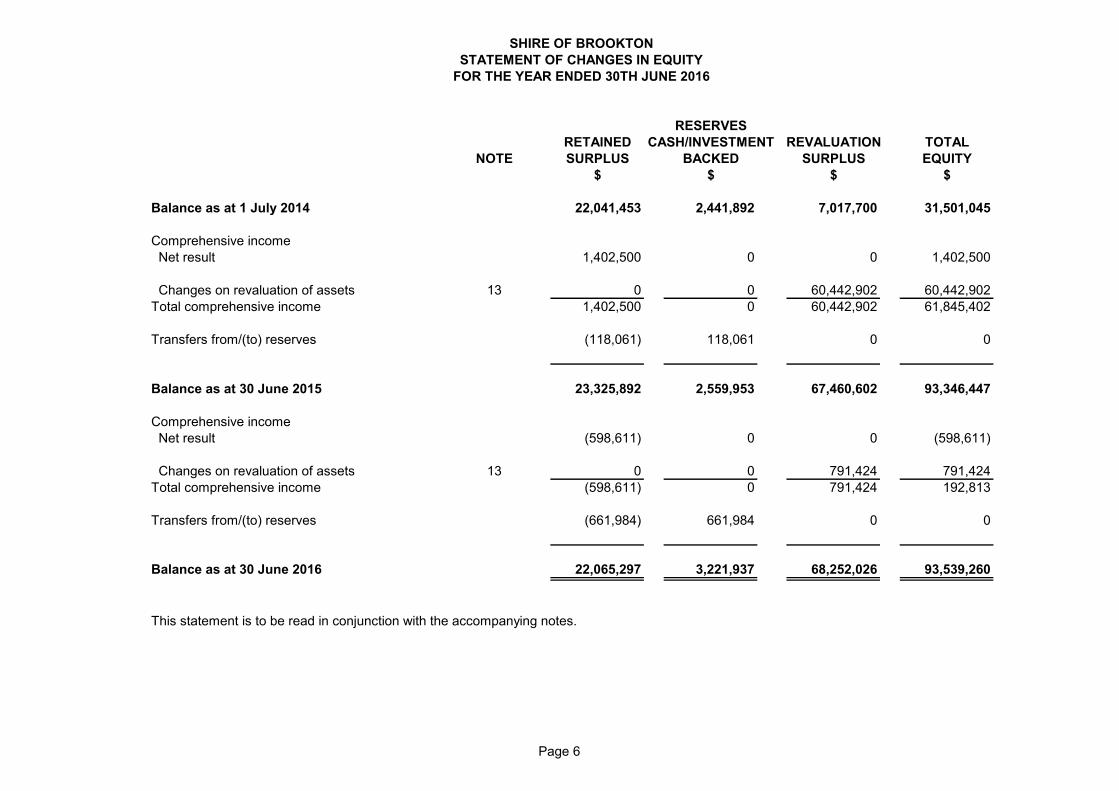
SHIRE OF BROOKTONSTATEMENT OF CHANGES IN EQUITY
FOR THE YEAR ENDED 30TH JUNE 2016
RESERVESRETAINED CASH/INVESTMENT REVALUATION TOTAL
NOTE SURPLUS BACKED SURPLUS EQUITY$ $ $ $
Balance as at 1 July 2014 22,041,453 2,441,892 7,017,700 31,501,045
Comprehensive income Net result 1,402,500 0 0 1,402,500
Changes on revaluation of assets 13 0 0 60,442,902 60,442,902Total comprehensive income 1,402,500 0 60,442,902 61,845,402
Transfers from/(to) reserves (118,061) 118,061 0 0
Balance as at 30 June 2015 23,325,892 2,559,953 67,460,602 93,346,447
Comprehensive income Net result (598,611) 0 0 (598,611)
Changes on revaluation of assets 13 0 0 791,424 791,424Total comprehensive income (598,611) 0 791,424 192,813
Transfers from/(to) reserves (661,984) 661,984 0 0
Balance as at 30 June 2016 22,065,297 3,221,937 68,252,026 93,539,260
This statement is to be read in conjunction with the accompanying notes.
Page 6
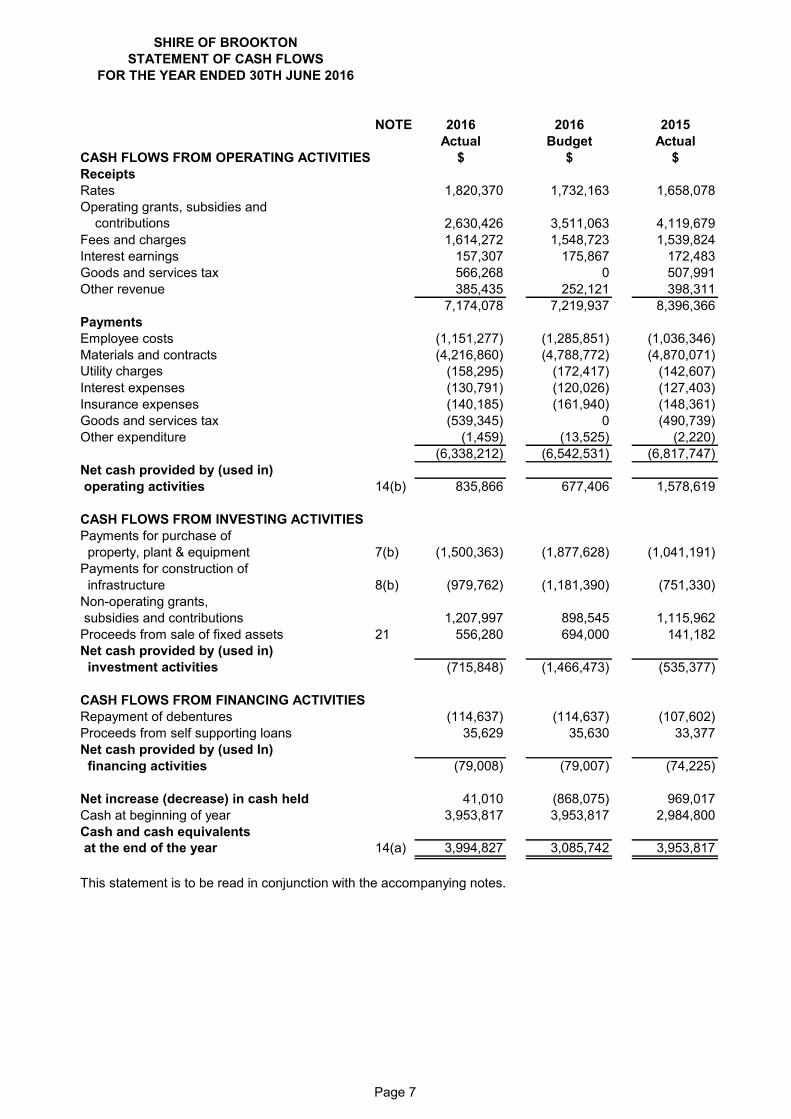
SHIRE OF BROOKTONSTATEMENT OF CASH FLOWS
FOR THE YEAR ENDED 30TH JUNE 2016
NOTE 2016 2016 2015Actual Budget Actual
CASH FLOWS FROM OPERATING ACTIVITIES $ $ $ReceiptsRates 1,820,370 1,732,163 1,658,078Operating grants, subsidies and
contributions 2,630,426 3,511,063 4,119,679Fees and charges 1,614,272 1,548,723 1,539,824Interest earnings 157,307 175,867 172,483Goods and services tax 566,268 0 507,991Other revenue 385,435 252,121 398,311
7,174,078 7,219,937 8,396,366PaymentsEmployee costs (1,151,277) (1,285,851) (1,036,346)Materials and contracts (4,216,860) (4,788,772) (4,870,071)Utility charges (158,295) (172,417) (142,607)Interest expenses (130,791) (120,026) (127,403)Insurance expenses (140,185) (161,940) (148,361)Goods and services tax (539,345) 0 (490,739)Other expenditure (1,459) (13,525) (2,220)
(6,338,212) (6,542,531) (6,817,747)Net cash provided by (used in) operating activities 14(b) 835,866 677,406 1,578,619
CASH FLOWS FROM INVESTING ACTIVITIESPayments for purchase of property, plant & equipment 7(b) (1,500,363) (1,877,628) (1,041,191)Payments for construction of infrastructure 8(b) (979,762) (1,181,390) (751,330)Non-operating grants, subsidies and contributions 1,207,997 898,545 1,115,962Proceeds from sale of fixed assets 21 556,280 694,000 141,182Net cash provided by (used in) investment activities (715,848) (1,466,473) (535,377)
CASH FLOWS FROM FINANCING ACTIVITIESRepayment of debentures (114,637) (114,637) (107,602)Proceeds from self supporting loans 35,629 35,630 33,377Net cash provided by (used In) financing activities (79,008) (79,007) (74,225)
Net increase (decrease) in cash held 41,010 (868,075) 969,017Cash at beginning of year 3,953,817 3,953,817 2,984,800Cash and cash equivalents at the end of the year 14(a) 3,994,827 3,085,742 3,953,817
This statement is to be read in conjunction with the accompanying notes.
Page 7
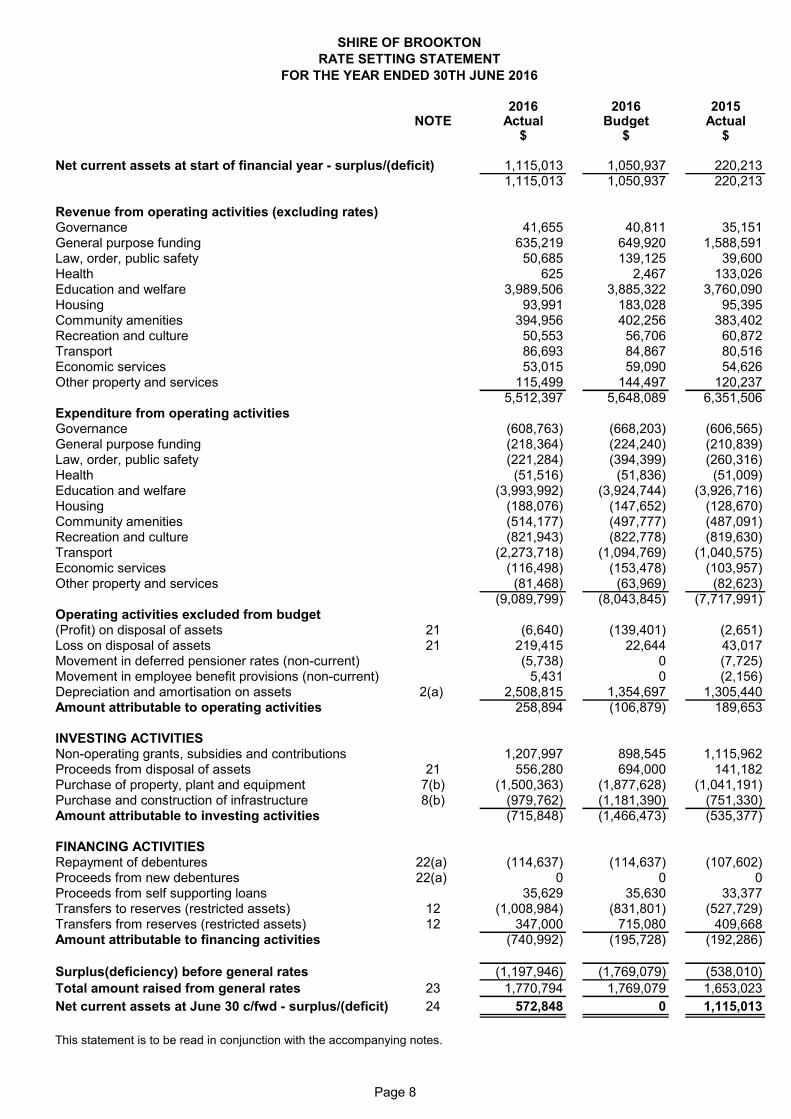
SHIRE OF BROOKTONRATE SETTING STATEMENT
FOR THE YEAR ENDED 30TH JUNE 2016
2016 2016 2015NOTE Actual Budget Actual
$ $ $
Net current assets at start of financial year - surplus/(deficit) 1,115,013 1,050,937 220,2131,115,013 1,050,937 220,213
Governance 41,655 40,811 35,151General purpose funding 635,219 649,920 1,588,591Law, order, public safety 50,685 139,125 39,600Health 625 2,467 133,026Education and welfare 3,989,506 3,885,322 3,760,090Housing 93,991 183,028 95,395Community amenities 394,956 402,256 383,402Recreation and culture 50,553 56,706 60,872Transport 86,693 84,867 80,516Economic services 53,015 59,090 54,626Other property and services 115,499 144,497 120,237
5,512,397 5,648,089 6,351,506
Governance (608,763) (668,203) (606,565)General purpose funding (218,364) (224,240) (210,839)Law, order, public safety (221,284) (394,399) (260,316)Health (51,516) (51,836) (51,009)Education and welfare (3,993,992) (3,924,744) (3,926,716)Housing (188,076) (147,652) (128,670)Community amenities (514,177) (497,777) (487,091)Recreation and culture (821,943) (822,778) (819,630)Transport (2,273,718) (1,094,769) (1,040,575)Economic services (116,498) (153,478) (103,957)Other property and services (81,468) (63,969) (82,623)
(9,089,799) (8,043,845) (7,717,991)Operating activities excluded from budget(Profit) on disposal of assets 21 (6,640) (139,401) (2,651)Loss on disposal of assets 21 219,415 22,644 43,017Movement in deferred pensioner rates (non-current) (5,738) 0 (7,725)Movement in employee benefit provisions (non-current) 5,431 0 (2,156)Depreciation and amortisation on assets 2(a) 2,508,815 1,354,697 1,305,440Amount attributable to operating activities 258,894 (106,879) 189,653
INVESTING ACTIVITIESNon-operating grants, subsidies and contributions 1,207,997 898,545 1,115,962Proceeds from disposal of assets 21 556,280 694,000 141,182Purchase of property, plant and equipment 7(b) (1,500,363) (1,877,628) (1,041,191)Purchase and construction of infrastructure 8(b) (979,762) (1,181,390) (751,330)Amount attributable to investing activities (715,848) (1,466,473) (535,377)
FINANCING ACTIVITIESRepayment of debentures 22(a) (114,637) (114,637) (107,602)Proceeds from new debentures 22(a) 0 0 0Proceeds from self supporting loans 35,629 35,630 33,377Transfers to reserves (restricted assets) 12 (1,008,984) (831,801) (527,729)Transfers from reserves (restricted assets) 12 347,000 715,080 409,668Amount attributable to financing activities (740,992) (195,728) (192,286)
Surplus(deficiency) before general rates (1,197,946) (1,769,079) (538,010)Total amount raised from general rates 23 1,770,794 1,769,079 1,653,023Net current assets at June 30 c/fwd - surplus/(deficit) 24 572,848 0 1,115,013
This statement is to be read in conjunction with the accompanying notes.
Revenue from operating activities (excluding rates)
Expenditure from operating activities
Page 8
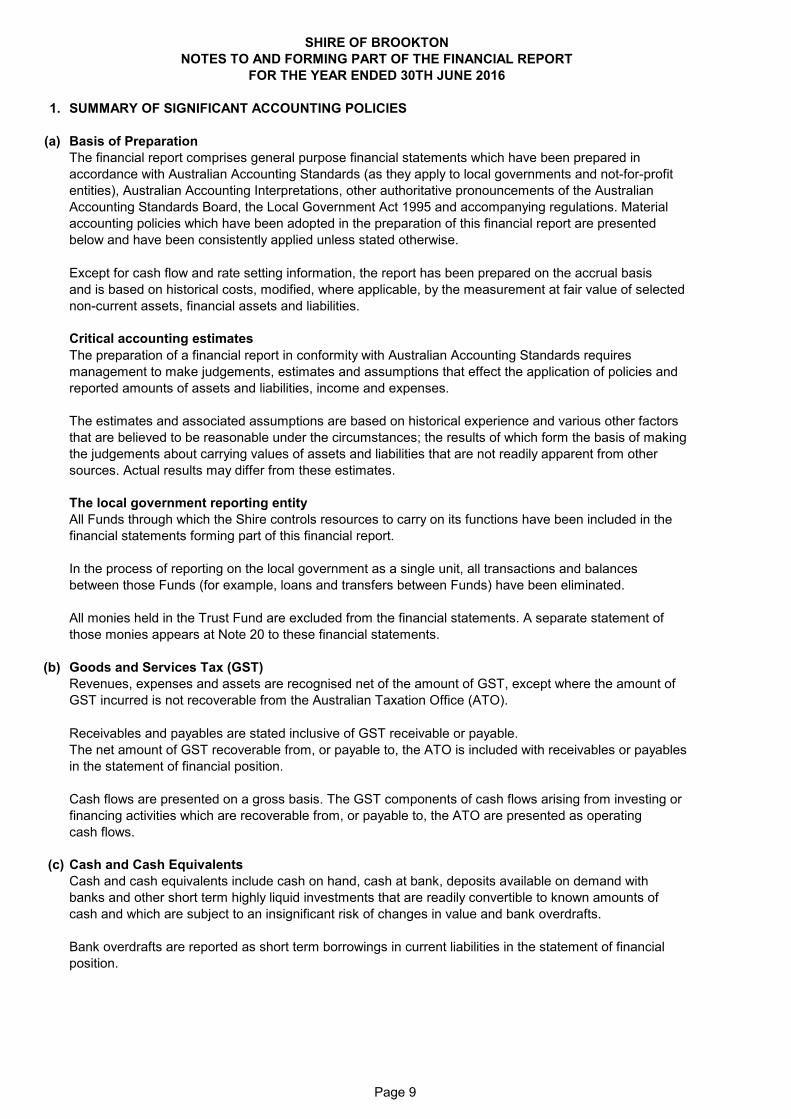
1. SUMMARY OF SIGNIFICANT ACCOUNTING POLICIES
(a) Basis of PreparationThe financial report comprises general purpose financial statements which have been prepared in accordance with Australian Accounting Standards (as they apply to local governments and not-for-profit entities), Australian Accounting Interpretations, other authoritative pronouncements of the AustralianAccounting Standards Board, the Local Government Act 1995 and accompanying regulations. Material accounting policies which have been adopted in the preparation of this financial report are presentedbelow and have been consistently applied unless stated otherwise.
Except for cash flow and rate setting information, the report has been prepared on the accrual basis and is based on historical costs, modified, where applicable, by the measurement at fair value of selected non-current assets, financial assets and liabilities.
Critical accounting estimatesThe preparation of a financial report in conformity with Australian Accounting Standards requires management to make judgements, estimates and assumptions that effect the application of policies and reported amounts of assets and liabilities, income and expenses.
The estimates and associated assumptions are based on historical experience and various other factors that are believed to be reasonable under the circumstances; the results of which form the basis of making the judgements about carrying values of assets and liabilities that are not readily apparent from other sources. Actual results may differ from these estimates.
The local government reporting entityAll Funds through which the Shire controls resources to carry on its functions have been included in thefinancial statements forming part of this financial report.
In the process of reporting on the local government as a single unit, all transactions and balances between those Funds (for example, loans and transfers between Funds) have been eliminated.
All monies held in the Trust Fund are excluded from the financial statements. A separate statement ofthose monies appears at Note 20 to these financial statements.
(b) Goods and Services Tax (GST)Revenues, expenses and assets are recognised net of the amount of GST, except where the amount of GST incurred is not recoverable from the Australian Taxation Office (ATO).
Receivables and payables are stated inclusive of GST receivable or payable.The net amount of GST recoverable from, or payable to, the ATO is included with receivables or payables in the statement of financial position.
Cash flows are presented on a gross basis. The GST components of cash flows arising from investing or financing activities which are recoverable from, or payable to, the ATO are presented as operatingcash flows.
(c) Cash and Cash EquivalentsCash and cash equivalents include cash on hand, cash at bank, deposits available on demand with banks and other short term highly liquid investments that are readily convertible to known amounts of cash and which are subject to an insignificant risk of changes in value and bank overdrafts.
Bank overdrafts are reported as short term borrowings in current liabilities in the statement of financial position.
SHIRE OF BROOKTONNOTES TO AND FORMING PART OF THE FINANCIAL REPORT
FOR THE YEAR ENDED 30TH JUNE 2016
Page 9
1. SUMMARY OF SIGNIFICANT ACCOUNTING POLICIES (Continued)
(d) Trade and Other ReceivablesTrade and other receivables include amounts due from ratepayers for unpaid rates and service charges and other amounts due from third parties for goods sold and services performed in the ordinary course of business.
Receivables expected to be collected within 12 months of the end of the reporting period are classified as current assets. All other receivables are classified as non-current assets.
Collectability of trade and other receivables is reviewed on an ongoing basis. Debts that are known to be uncollectible are written off when identified. An allowance for doubtful debts is raised when there is objective evidence that they will not be collectible.
(e) Inventories
GeneralInventories are measured at the lower of cost and net realisable value.
Net realisable value is the estimated selling price in the ordinary course of business less the estimated costs of completion and the estimated costs necessary to make the sale.
Land held for saleLand held for development and sale is valued at the lower of cost and net realisable value. Cost includes the cost of acquisition, development, borrowing costs and holding costs until completion of development.Finance costs and holding charges incurred after development is completed are expensed.
Gains and losses are recognised in profit or loss at the time of signing an unconditional contract of sale if significant risks and rewards, and effective control over the land, are passed on to the buyer at this point.
Land held for sale is classified as current except where it is held as non-current based on the Council’sintentions to release for sale.
(f) Fixed AssetsEach class of fixed assets within either property, plant and equipment or infrastructure, is carried at cost or fair value as indicated less, where applicable, any accumulated depreciation and impairment losses.
Mandatory requirement to revalue non-current assetsEffective from 1 July 2012, the Local Government (Financial Management) Regulations were amended and the measurement of non-current assets at Fair Value became mandatory.
During the year ended 30 June 2013, the Shire commenced the process of adopting Fair Value in accordance with the Regulations.
Whilst the amendments initially allowed for a phasing in of fair value in relation to fixed assets over threeyears, as at 30 June 2015 all non-current assets were carried at Fair Value in accordance withthe requirements.
Thereafter, each asset class must be revalued in accordance with the regulatory framework established and
Relevant disclosures, in accordance with the requirements of Australian Accounting Standards, have been made in the financial report as necessary.
SHIRE OF BROOKTONNOTES TO AND FORMING PART OF THE FINANCIAL REPORT
FOR THE YEAR ENDED 30TH JUNE 2016
the Shire revalues its asset classes in accordance with this mandatory timetable.
Page 10
1. SUMMARY OF SIGNIFICANT ACCOUNTING POLICIES (Continued)
(f) Fixed Assets (Continued)
Land under controlIn accordance with Local Government (Financial Management) Regulation 16(a), the Shire was requiredto include as an asset (by 30 June 2013), Crown Land operated by the local government as a golf course,showground, racecourse or other sporting or recreational facility of State or Regional significance.
Upon initial recognition, these assets were recorded at cost in accordance with AASB 116. They were then classified as Land and revalued along with other land in accordance with the other policies detailed in this Note.
Initial recognition and measurement between mandatory revaluation datesAll assets are initially recognised at cost and subsequently revalued in accordance with the mandatory measurement framework detailed above.
In relation to this initial measurement, cost is determined as the fair value of the assets given as consideration plus costs incidental to the acquisition. For assets acquired at no cost or for nominal consideration, cost is determined as fair value at the date of acquisition. The cost of non-current assetsconstructed by the Shire includes the cost of all materials used in construction, direct labour on the projectand an appropriate proportion of variable and fixed overheads.
Individual assets acquired between initial recognition and the next revaluation of the asset class in accordance with the mandatory measurement framework detailed above, are carried at cost lessaccumulated depreciation as management believes this approximates fair value. They will be subject tosubsequent revaluation at the next anniversary date in accordance with the mandatory measurement framework detailed above.
RevaluationIncreases in the carrying amount arising on revaluation of assets are credited to a revaluation surplus in equity. Decreases that offset previous increases of the same asset are recognised against revaluation surplus directly in equity. All other decreases are recognised in profit or loss.
Land under roadsIn Western Australia, all land under roads is Crown Land, the responsibility for managing which, is vested in the local government.
Effective as at 1 July 2008, Council elected not to recognise any value for land under roads acquired on or before 30 June 2008. This accords with the treatment available in Australian Accounting Standard AASB 1051 Land Under Roads and the fact Local Government (Financial Management) Regulation 16(a)(i) prohibits local governments from recognising such land as an asset.
In respect of land under roads acquired on or after 1 July 2008, as detailed above, Local Government (Financial Management) Regulation 16(a)(i) prohibits local governments from recognising such landas an asset.
Whilst such treatment is inconsistent with the requirements of AASB 1051, Local Government (Financial Management) Regulation 4(2) provides, in the event of such an inconsistency, the Local Government (Financial Management) Regulations prevail.
Consequently, any land under roads acquired on or after 1 July 2008 is not included as an asset of the Shire.
SHIRE OF BROOKTONNOTES TO AND FORMING PART OF THE FINANCIAL REPORT
FOR THE YEAR ENDED 30TH JUNE 2016
Page 11
1. SUMMARY OF SIGNIFICANT ACCOUNTING POLICIES (Continued)
(f) Fixed Assets (Continued)
DepreciationThe depreciable amount of all fixed assets including buildings but excluding freehold land, are depreciated on a straight-line basis over the individual asset’s useful life from the time the asset is held ready for use. Leasehold improvements are depreciated over the shorter of either the unexpired period of the lease or the estimated useful life of the improvements.
When an item of property, plant and equipment is revalued, any accumulated depreciation at the date of the revaluation is treated in one of the following ways:a) Restated proportionately with the change in the gross carrying amount of the asset so that the carrying amount of the asset after revaluation equals its revalued amount; orb) Eliminated against the gross carrying amount of the asset and the net amount restated to the revalued amount of the asset.
Major depreciation periods used for each class of depreciable asset are:
Buildings 30 to 50 yearsFurniture and equipment 4 to 10 yearsPlant and equipment 5 to 15 yearsSealed roads and streets formation not depreciated pavement 50 - 85 years seal - bituminous seals 20 years - asphalt surfaces 25 yearsGravel roads formation not depreciated pavement 50 - 85 years surface 12 - 17 yearsFormed roads (unsealed) formation not depreciated pavement 50 - 65 yearsBridges 75 yearsFootpaths - slab 20 - 80 yearsSewerage piping 100 yearsWater supply piping and drainage systems 75 years
The assets residual values and useful lives are reviewed, and adjusted if appropriate, at the end of each reporting period.
An asset's carrying amount is written down immediately to its recoverable amount if the asset's carryingamount is greater than its estimated recoverable amount.
Gains and losses on disposals are determined by comparing proceeds with the carrying amount. These gains and losses are included in the statement of comprehensive income in the period in whichthey arise.
Capitalisation thresholdExpenditure on items of equipment under $5,000 is not capitalised. Rather, it is recorded on an asset inventory listing.
SHIRE OF BROOKTONNOTES TO AND FORMING PART OF THE FINANCIAL REPORT
FOR THE YEAR ENDED 30TH JUNE 2016
Page 12
1. SUMMARY OF SIGNIFICANT ACCOUNTING POLICIES (Continued)
(g) Fair Value of Assets and LiabilitiesWhen performing a revaluation, the Shire uses a mix of both independent and management valuationsusing the following as a guide:
Fair Value is the price that the Shire would receive to sell the asset or would have to pay to transfer aliability, in an orderly (i.e. unforced) transaction between independent, knowledgeable and willing market participants at the measurement date.
As fair value is a market-based measure, the closest equivalent observable market pricing information is used to determine fair value. Adjustments to market values may be made having regard to the characteristics of the specific asset or liability. The fair values of assets that are not traded in an active market are determined using one or more valuation techniques. These valuation techniques maximise, to the extent possible, the use of observable market data.
To the extent possible, market information is extracted from either the principal market for the asset orliability (i.e. the market with the greatest volume and level of activity for the asset or liability) or, in the absence of such a market, the most advantageous market available to the entity at the end of thereporting period (i.e. the market that maximises the receipts from the sale of the asset after taking into account transaction costs and transport costs).
For non-financial assets, the fair value measurement also takes into account a market participant’s ability to use the asset in its highest and best use or to sell it to another market participant that would use the asset in its highest and best use.
Fair value hierarchyAASB 13 requires the disclosure of fair value information by level of the fair value hierarchy, which categorises fair value measurement into one of three possible levels based on the lowest level that an input that is significant to the measurement can be categorised into as follows:
Level 1Measurements based on quoted prices (unadjusted) in active markets for identical assets or liabilities that the entity can access at the measurement date.
Level 2Measurements based on inputs other than quoted prices included in Level 1 that are observable for the asset or liability, either directly or indirectly.
Level 3Measurements based on unobservable inputs for the asset or liability.
The fair values of assets and liabilities that are not traded in an active market are determined using one or more valuation techniques. These valuation techniques maximise, to the extent possible, the use of observable market data. If all significant inputs required to measure fair value are observable, the asset or liability is included in Level 2. If one or more significant inputs are not based on observable market data, the asset or liability is included in Level 3.
Valuation techniquesThe Shire selects a valuation technique that is appropriate in the circumstances and for which sufficientdata is available to measure fair value. The availability of sufficient and relevant data primarily depends on the specific characteristics of the asset or liability being measured. The valuation techniques selected bythe Shire are consistent with one or more of the following valuation approaches:
Market approachValuation techniques that use prices and other relevant information generated by market transactions for identical or similar assets or liabilities.
SHIRE OF BROOKTONNOTES TO AND FORMING PART OF THE FINANCIAL REPORT
FOR THE YEAR ENDED 30TH JUNE 2016
Page 13
1. SUMMARY OF SIGNIFICANT ACCOUNTING POLICIES (Continued)
(g) Fair Value of Assets and Liabilities (Continued)
Income approachValuation techniques that convert estimated future cash flows or income and expenses into a single discounted present value.
Cost approachValuation techniques that reflect the current replacement cost of an asset at its current service capacity.
Each valuation technique requires inputs that reflect the assumptions that buyers and sellers would use when pricing the asset or liability, including assumptions about risks. When selecting a valuation technique, the Shire gives priority to those techniques that maximise the use of observable inputs and minimise the use of unobservable inputs. Inputs that are developed using market data (such as publicly available information on actual transactions) and reflect the assumptions that buyers and sellers wouldgenerally use when pricing the asset or liability are considered observable, whereas inputs for which market data is not available and therefore are developed using the best information available about such assumptions are considered unobservable.
As detailed above, the mandatory measurement framework imposed by the Local Government (Financial Management) Regulations requires, as a minimum, all assets carried at a revalued amount to be revalued in accordance with the regulatory framework.
(h) Financial Instruments
Initial recognition and measurementFinancial assets and financial liabilities are recognised when the Shire becomes a party to thecontractual provisions to the instrument. For financial assets, this is equivalent to the date that the Shire commits itself to either the purchase or sale of the asset (i.e. trade date accounting isadopted).
Financial instruments are initially measured at fair value plus transaction costs, except where the instrument is classified 'at fair value through profit or loss', in which case transaction costs are expensed to profit or loss immediately.
Classification and subsequent measurementFinancial instruments are subsequently measured at fair value, amortised cost using the effective interest rate method, or at cost.
Amortised cost is calculated as:
(a) the amount in which the financial asset or financial liability is measured at initial recognition;
(b) less principal repayments and any reduction for impairment; and
(c) plus or minus the cumulative amortisation of the difference, if any, between the amount initially recognised and the maturity amount calculated using the effective interest rate method.
The effective interest method is used to allocate interest income or interest expense over the relevant period and is equivalent to the rate that discounts estimated future cash payments or receipts (including fees, transaction costs and other premiums or discounts) through the expected life (or when this cannot be reliably predicted, the contractual term) of the financial instrument to the net carrying amount of the financial asset or financial liability. Revisions to expected future net cash flows will necessitate an adjustment to the carrying value with a consequential recognition of an income or expense in profit or loss.
FOR THE YEAR ENDED 30TH JUNE 2016
SHIRE OF BROOKTONNOTES TO AND FORMING PART OF THE FINANCIAL REPORT
Page 14
1. SUMMARY OF SIGNIFICANT ACCOUNTING POLICIES (Continued)
(h) Financial Instruments (Continued)
Classification and subsequent measurement (continued)
(i) Financial assets at fair value through profit and loss Financial assets are classified at “fair value through profit or loss” when they are held for trading for the purpose of short-term profit taking. Such assets are subsequently measured at fair value with changes in carrying amount being included in profit or loss. Assets in this category are classified as current assets.
(ii) Loans and receivables Loans and receivables are non-derivative financial assets with fixed or determinable payments that are not quoted in an active market and are subsequently measured at amortised cost. Gains or losses are recognised in profit or loss.
Loans and receivables are included in current assets where they are expected to mature within 12 months after the end of the reporting period.
(iii) Held-to-maturity investments Held-to-maturity investments are non-derivative financial assets with fixed maturities and fixed or determinable payments that the Shire has the positive intention and ability to hold to maturity. Theyare subsequently measured at amortised cost. Gains or losses are recognised in profit or loss.
Held-to-maturity investments are included in current assets, where they are expected to mature within 12 months after the end of the reporting period. All other investments are classified as non-current.
(iv) Available-for-sale financial assets Available-for-sale financial assets are non-derivative financial assets that are either not suitable to be classified into other categories of financial assets due to their nature, or they are designated as such by management. They comprise investments in the equity of other entities where there is neither a fixed maturity nor fixed or determinable payments.
They are subsequently measured at fair value with changes in such fair value (i.e. gains or losses) recognised in other comprehensive income (except for impairment losses). When the financial asset is derecognised, the cumulative gain or loss pertaining to that asset previously recognised in other comprehensive income is reclassified into profit or loss.
Available-for-sale financial assets are included in current assets, where they are expected to be sold within 12 months after the end of the reporting period. All other available-for-sale financial assets are classified as non-current.
(v) Financial liabilitiesNon-derivative financial liabilities (excluding financial guarantees) are subsequently measured at amortised cost. Gains or losses are recognised in profit or loss.
SHIRE OF BROOKTONNOTES TO AND FORMING PART OF THE FINANCIAL REPORT
FOR THE YEAR ENDED 30TH JUNE 2016
Page 15
1. SUMMARY OF SIGNIFICANT ACCOUNTING POLICIES (Continued)
(h) Financial Instruments (Continued)
ImpairmentA financial asset is deemed to be impaired if, and only if, there is objective evidence of impairment asa result of one or more events (a “loss event”) having occurred, which will have an impact on the estimated future cash flows of the financial asset(s).
In the case of available-for-sale financial assets, a significant or prolonged decline in the market value of the instrument is considered a loss event. Impairment losses are recognised in profit or loss immediately. Also, any cumulative decline in fair value previously recognised in other comprehensive income is reclassified to profit or loss at this point.
In the case of financial assets carried at amortised cost, loss events may include: indications that the debtors or a group of debtors are experiencing significant financial difficulty, default or delinquency in interest or principal payments; indications that they will enter bankruptcy or other financial reorganisation; and changes in arrears or economic conditions that correlate with defaults.
For financial assets carried at amortised cost (including loans and receivables), a separate allowance account is used to reduce the carrying amount of financial assets impaired by credit losses. After having taken all possible measures of recovery, if management establishes that the carrying amount cannot be recovered by any means, at that point the written-off amounts are charged to the allowance account or the carrying amount of impaired financial assets is reduced directly if no impairment amount was previously recognised in the allowance account.
DerecognitionFinancial assets are derecognised where the contractual rights to receipt of cash flows expire or theasset is transferred to another party whereby the Shire no longer has any significant continualinvolvement in the risks and benefits associated with the asset.
Financial liabilities are derecognised where the related obligations are discharged, cancelled or expired. The difference between the carrying amount of the financial liability extinguished or transferred to another party and the fair value of the consideration paid, including the transfer of non-cash assets or liabilities assumed, is recognised in profit or loss.
(i) Impairment of AssetsIn accordance with Australian Accounting Standards the Shire's assets, other than inventories,are assessed at each reporting date to determine whether there is any indication they may be impaired.
Where such an indication exists, an impairment test is carried out on the asset by comparing the recoverable amount of the asset, being the higher of the asset's fair value less costs to sell and value in use, to the asset's carrying amount.
Any excess of the asset's carrying amount over its recoverable amount is recognised immediately in profit or loss, unless the asset is carried at a revalued amount in accordance with another Standard (e.g. AASB 116) whereby any impairment loss of a revalued asset is treated as a revaluation decrease in accordance with that other Standard.
For non-cash generating assets such as roads, drains, public buildings and the like, value in use isrepresented by the depreciated replacement cost of the asset.
(j) Trade and Other PayablesTrade and other payables represent liabilities for goods and services provided to the Shire prior to theend of the financial year that are unpaid and arise when the Shire becomes obliged to make futurepayments in respect of the purchase of these goods and services. The amounts are unsecured, are recognised as a current liability and are normally paid within 30 days of recognition.
SHIRE OF BROOKTONNOTES TO AND FORMING PART OF THE FINANCIAL REPORT
FOR THE YEAR ENDED 30TH JUNE 2016
Page 16
1. SUMMARY OF SIGNIFICANT ACCOUNTING POLICIES (Continued)
(k) Employee BenefitsShort-term employee benefits Provision is made for the Shire’s obligations for short-term employee benefits. Short-term employeebenefits are benefits (other than termination benefits) that are expected to be settled wholly before 12 months after the end of the annual reporting period in which the employees render the related service, including wages, salaries and sick leave. Short-term employee benefits are measured at the (undiscounted) amounts expected to be paid when the obligation is settled.
The Shire’s obligations for short-term employee benefits such as wages, salaries and sick leave arerecognised as a part of current trade and other payables in the statement of financial position. The Shire’s obligations for employees’ annual leave and long service leave entitlements are recognised asprovisions in the statement of financial position.
Other long-term employee benefitsProvision is made for employees’ long service leave and annual leave entitlements not expected to be settled wholly within 12 months after the end of the annual reporting period in which the employees render the related service. Other long-term employee benefits are measured at the present value of the expected future payments to be made to employees. Expected future payments incorporate anticipated future wage and salary levels, durations of service and employee departures and are discounted at rates determined by reference to market yields at the end of the reporting period on government bonds that have maturity dates that approximate the terms of the obligations. Any remeasurements for changes in assumptions of obligations for other long-term employee benefits are recognised in profit or loss in the periods in which the changes occur.
The Shire’s obligations for long-term employee benefits are presented as non-current provisions in its statement of financial position, except where the Shire does not have an unconditional right to defer settlement for at least 12 months after the end of the reporting period, in which case the obligations are presented as current provisions.
(l) Borrowing CostsBorrowing costs are recognised as an expense when incurred except where they are directly attributable to the acquisition, construction or production of a qualifying asset. Where this is the case, they are capitalised as part of the cost of the particular asset until such time as the asset is substantially ready for its intended use or sale.
(m) ProvisionsProvisions are recognised when the Shire has a present legal or constructive obligation, as a result of past events, for which it is probable that an outflow of economic benefits will result and that outflow can be reliably measured.
Provisions are measured using the best estimate of the amounts required to settle the obligation at the end of the reporting period.
(n) LeasesLeases of fixed assets where substantially all the risks and benefits incidental to the ownership of the asset, but not legal ownership, are transferred to the Shire, are classified as finance leases.
Finance leases are capitalised recording an asset and a liability at the lower amounts equal to the fair value of the leased property or the present value of the minimum lease payments, including anyguaranteed residual values. Lease payments are allocated between the reduction of the lease liabilityand the lease interest expense for the period.
Leased assets are depreciated on a straight line basis over the shorter of their estimated useful lives or the lease term.
Lease payments for operating leases, where substantially all the risks and benefits remain with thelessor, are charged as expenses in the periods in which they are incurred.
Lease incentives under operating leases are recognised as a liability and amortised on a straight linebasis over the life of the lease term.
NOTES TO AND FORMING PART OF THE FINANCIAL REPORTFOR THE YEAR ENDED 30TH JUNE 2016
SHIRE OF BROOKTON
Page 17
1. SUMMARY OF SIGNIFICANT ACCOUNTING POLICIES (Continued)
(o) Investment in AssociatesAn associate is an entity over which the Shire has significant influence. Significant influence is the power to participate in the financial operating policy decisions of that entity but is not control or joint control of those policies. Investments in associates are accounted for in the financial statements by applying the equity method of accounting, whereby the investment is initially recognised at cost and adjusted thereafter for the post-acquisition change in the Shire’s share of net assets of the associate.In addition, the Shire’s share of the profit or loss of the associate is included in the Shire’s profit or loss.
The carrying amount of the investment includes, where applicable, goodwill relating to the associate. Any discount on acquisition, whereby the Shire’s share of the net fair value of the associate exceedsthe cost of investment, is recognised in profit or loss in the period in which the investment is acquired.
Profits and losses resulting from transactions between the Shire and the associate are eliminated tothe extent of the Shire’s interest in the associate.
When the Shire’s share of losses in an associate equals or exceeds its interest in the associate, theShire discontinues recognising its share of further losses unless it has incurred legal or constructiveobligations or made payments on behalf of the associate. When the associate subsequently makes profits, the Shire will resume recognising its share of those profits once its share of the profits equalsthe share of the losses not recognised.
(p) Interests in Joint ArrangementsJoint arrangements represent the contractual sharing of control between parties in a business venture where unanimous decisions about relevant activities are required.
Separate joint venture entities providing joint venturers with an interest to net assets are classified as a joint venture and accounted for using the equity method. Refer to note 1(o) for a description of the equity method of accounting.
Joint venture operations represent arrangements whereby joint operators maintain direct interests in each asset and exposure to each liability of the arrangement. The Shire’s interests in the assets,liabilities, revenue and expenses of joint operations are included in the respective line items of the financial statements. Information about the joint ventures is set out in Note 17.
(q) Rates, Grants, Donations and Other ContributionsRates, grants, donations and other contributions are recognised as revenues when the local government obtains control over the assets comprising the contributions.
Control over assets acquired from rates is obtained at the commencement of the rating period or, where earlier, upon receipt of the rates.
Where contributions recognised as revenues during the reporting period were obtained on the condition that they be expended in a particular manner or used over a particular period, and those conditions were undischarged as at the reporting date, the nature of and amounts pertaining to those undischarged conditions are disclosed in Note 2(c) . That note also discloses the amount of contributions recognisedas revenues in a previous reporting period which were obtained in respect of the local government's operations for the current reporting period.
(r) SuperannuationThe Shire contributes to a number of Superannuation Funds on behalf of employees. All funds towhich the Shire contributes are defined contribution plans.
NOTES TO AND FORMING PART OF THE FINANCIAL REPORTFOR THE YEAR ENDED 30TH JUNE 2016
SHIRE OF BROOKTON
Page 18
1. SUMMARY OF SIGNIFICANT ACCOUNTING POLICIES (Continued)
(s) Current and Non-Current ClassificationIn the determination of whether an asset or liability is current or non-current, consideration is given to the time when each asset or liability is expected to be settled. The asset or liability is classified as current if it is expected to be settled within the next 12 months, being the Shire’s operational cycle. In the caseof liabilities where the Shire does not have the unconditional right to defer settlement beyond 12 months,such as vested long service leave, the liability is classified as current even if not expected to be settled within the next 12 months. Inventories held for trading are classified as current even if not expected to be realised in the next 12 months except for land held for sale where it is held as non-current based on the Shire’s intentions to release for sale.
(t) Rounding Off FiguresAll figures shown in this annual financial report, other than a rate in the dollar, are rounded to the nearest dollar.
(u) Comparative FiguresWhere required, comparative figures have been adjusted to conform with changes in presentation for the current financial year.
When the Shire applies an accounting policy retrospectively, makes a retrospective restatement or reclassifies items in its financial statement, an additional (third) statement of financial position as at thebeginning of the preceding period in addition to the minimum comparative financial statements ispresented.
(v) Budget Comparative FiguresUnless otherwise stated, the budget comparative figures shown in this annual financial report relate to the original budget estimate for the relevant item of disclosure.
NOTES TO AND FORMING PART OF THE FINANCIAL REPORTFOR THE YEAR ENDED 30TH JUNE 2016
SHIRE OF BROOKTON
Page 19
SHIRE OF BROOKTONNOTES TO AND FORMING PART OF THE FINANCIAL REPORT
FOR THE YEAR ENDED 30TH JUNE 2016
1. SIGNIFICANT ACCOUNTING POLICIES (Continued)
(w) New Accounting Standards and Interpretations for Application in Future Periods
Management's assessment of the new and amended pronouncements that are relevant to the Shire, applicable to future reporting periods and which have not yetbeen adopted are set out as follows:
Title Issued / Compiled Applicable (1) Impact
(i) AASB 9 Financial Instruments December 2014 1 January 2018 Nil – The objective of this Standard is to improve and simplify the (incorporating AASB 2014-7 and approach for classification and measurement of financial assetsAASB 2014-8) compared with the requirements of AASB 139. Given the nature of
the financial assets of the Shire, it is not anticipated the Standard will have any material effect.
(ii) AASB 15 Revenue from Contracts with December 2014 1 January 2018 This Standard establishes principles for entities to apply to reportCustomers useful information to users of financial statements about the nature,
amount, timing and uncertainty of revenue and cash flows arisingfrom a contract with a customer.
The effect of this Standard will depend upon the nature of futuretransactions the Shire has with those third parties it has dealingswith. It may or may not be significant.
(iii) AASB 16 Leases February 2016 1 January 2019 Under AASB 16 there is no longer a distinction between financeand operating leases. Lessees will now bring to account aright-to-use asset and lease liability onto their statement of financialpoition for all leases. Effectively this means the vast majority ofoperating leases as defined by the current AASB 117 Leases whichcurrently do not impact the statement of financial position will berequired to be capitalised on the statement of financial position once AASB 16 is adopted.
Currently, operating lease payments are expensed as incurred.This will cease and will be replaced by both depreciation and interest charges. Based on the current number of operating leases held by the Shire, the impact is not expected to besignificant.
The AASB has issued a number of new and amended Accounting Standards and Interpretations that have mandatory application dates for future reporting periods,some of which are relevant to the Shire.
Page 20
SHIRE OF BROOKTONNOTES TO AND FORMING PART OF THE FINANCIAL REPORT
FOR THE YEAR ENDED 30TH JUNE 2016
1. SIGNIFICANT ACCOUNTING POLICIES (Continued)(w) New Accounting Standards and Interpretations for Application in Future Periods (Continued)
Title Issued / Compiled Applicable (1) Impact
(iv) AASB 2014-3 Amendments to Australian August 2014 1 January 2016 This Standard amends AASB 11: Joint Arrangements to require theAccounting Standards - Accounting for acquirer of an interest (both initial and additional) in a joint operationAcquisitions of Interests in Joint Operations in which the activity constitutes a business, as defined in AASB 3:
Business Combinations, to apply all of the principles on business[AASB 1 & AASB 11] combinations accounting in AASB 3 and other Australian
Accounting Standards except for those principles that conflict withthe guidance in AASB 11; and disclose the information requiredby AASB 3 and other Australian Accounting Standards for businesscombinations.
Since adoption of this Standard would impact only acquisitions ofinterests in joint operations on or after 1 January 2016,management believes it is impracticable at this stage to provide areasonable estimate of such impact on the Shire's financialstatements.
(v) AASB 2014-4 Amendments to Australian August 2014 1 January 2016 This Standard amends AASB 116 and AASB 138 to establish theAccounting Standards - Clarification of principle for the basis of depreciation and amortisation as being theAcceptable Methods of Depreciation and expected pattern of consumption of the future economic benefits ofAmortisation an asset. It also clarifies the use of revenue-based methods to
calculate the depreciation of an asset is not appropriate nor is[AASB 116 & 138] revenue generally an appropriate basis for measuring the
consumption of the economic benefits embodied in an intangibleasset.
Given the Shire curently uses the expected pattern of consumptionof the future economic benefits of an asset as the basis of calculationof depreciation, it is not expected to have a significant impact.
(vi) AASB 2014-5 Amendments to Australian December 2014 1 January 2017 Consequential changes to various Standards arising from the Accounting Standards arising from AASB 15 issuance of AASB 15.
It will require changes to reflect the impact of AASB 15.
Page 21
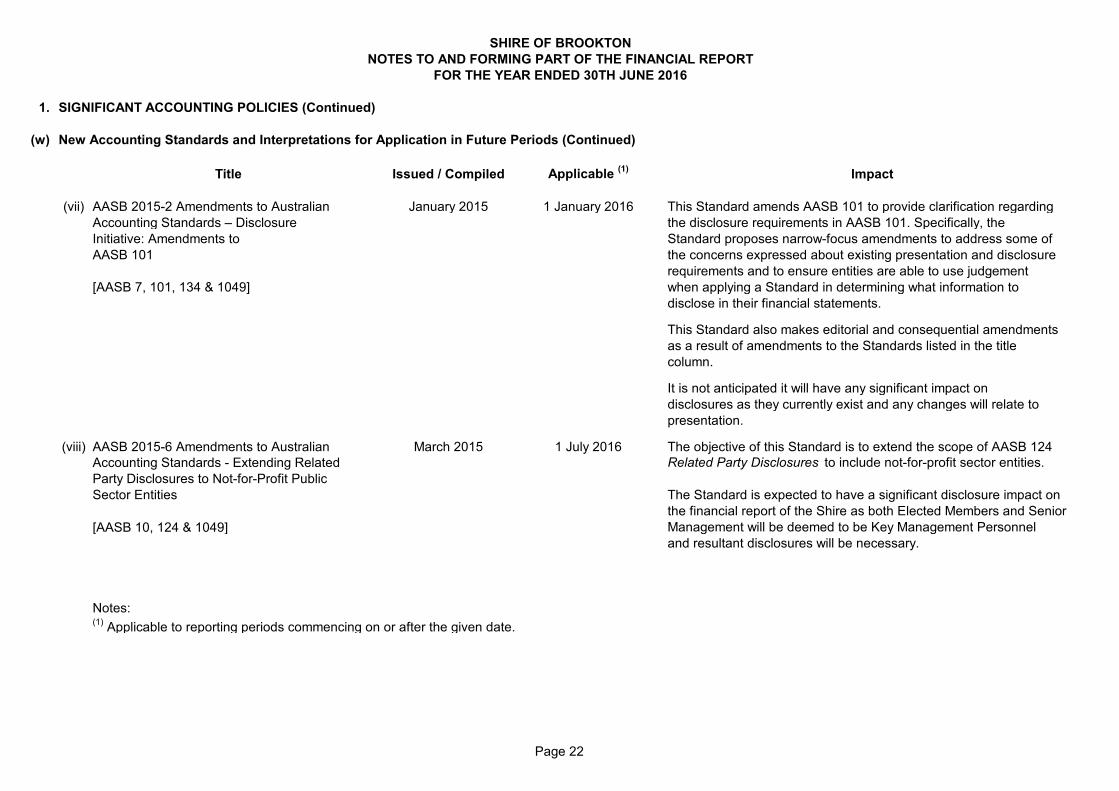
SHIRE OF BROOKTONNOTES TO AND FORMING PART OF THE FINANCIAL REPORT
FOR THE YEAR ENDED 30TH JUNE 2016
1. SIGNIFICANT ACCOUNTING POLICIES (Continued)
(w) New Accounting Standards and Interpretations for Application in Future Periods (Continued)
Title Issued / Compiled Applicable (1) Impact
(vii) AASB 2015-2 Amendments to Australian January 2015 1 January 2016 This Standard amends AASB 101 to provide clarification regardingAccounting Standards – Disclosure the disclosure requirements in AASB 101. Specifically, theInitiative: Amendments to Standard proposes narrow-focus amendments to address some of AASB 101 the concerns expressed about existing presentation and disclosure
requirements and to ensure entities are able to use judgement[AASB 7, 101, 134 & 1049] when applying a Standard in determining what information to
disclose in their financial statements.
This Standard also makes editorial and consequential amendmentsas a result of amendments to the Standards listed in the titlecolumn.
It is not anticipated it will have any significant impact ondisclosures as they currently exist and any changes will relate to presentation.
(viii) AASB 2015-6 Amendments to Australian March 2015 1 July 2016 The objective of this Standard is to extend the scope of AASB 124Accounting Standards - Extending Related Related Party Disclosures to include not-for-profit sector entities.Party Disclosures to Not-for-Profit PublicSector Entities The Standard is expected to have a significant disclosure impact on
the financial report of the Shire as both Elected Members and Senior[AASB 10, 124 & 1049] Management will be deemed to be Key Management Personnel
and resultant disclosures will be necessary.
Notes:(1) Applicable to reporting periods commencing on or after the given date.
Page 22
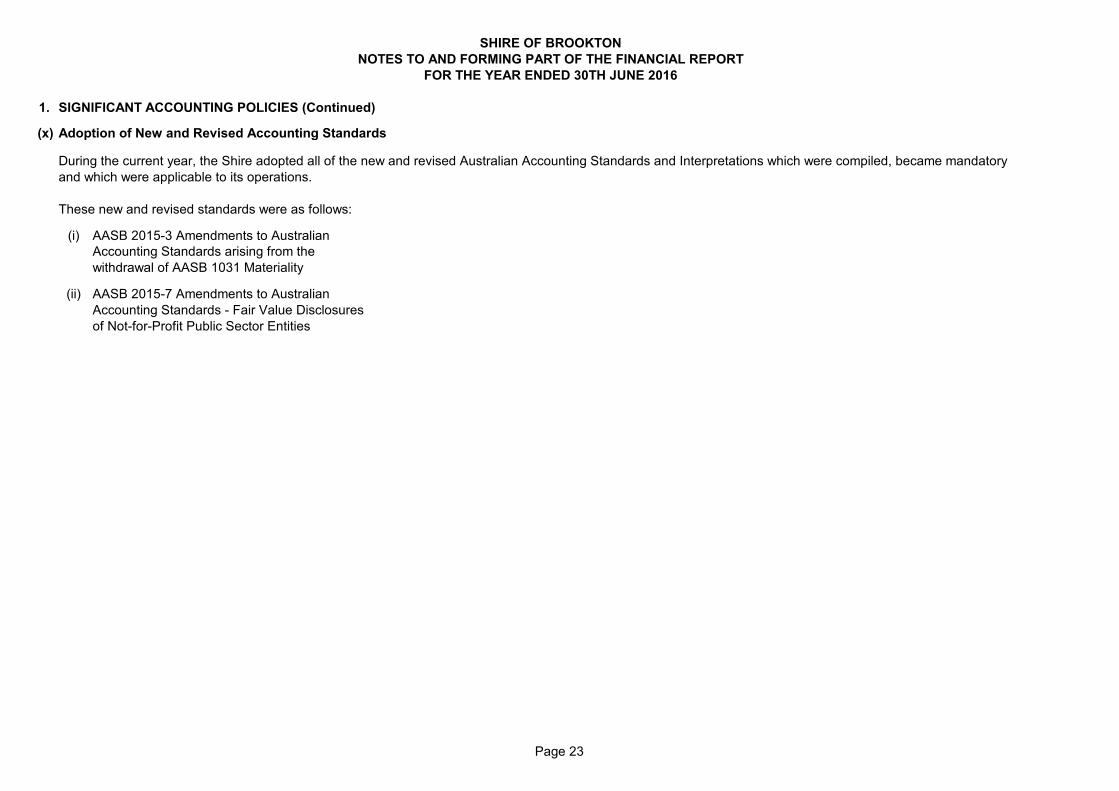
SHIRE OF BROOKTONNOTES TO AND FORMING PART OF THE FINANCIAL REPORT
FOR THE YEAR ENDED 30TH JUNE 2016
1. SIGNIFICANT ACCOUNTING POLICIES (Continued)
(x) Adoption of New and Revised Accounting Standards
These new and revised standards were as follows:
(i) AASB 2015-3 Amendments to Australian Accounting Standards arising from thewithdrawal of AASB 1031 Materiality
(ii) AASB 2015-7 Amendments to AustralianAccounting Standards - Fair Value Disclosuresof Not-for-Profit Public Sector Entities
and which were applicable to its operations.During the current year, the Shire adopted all of the new and revised Australian Accounting Standards and Interpretations which were compiled, became mandatory
Page 23
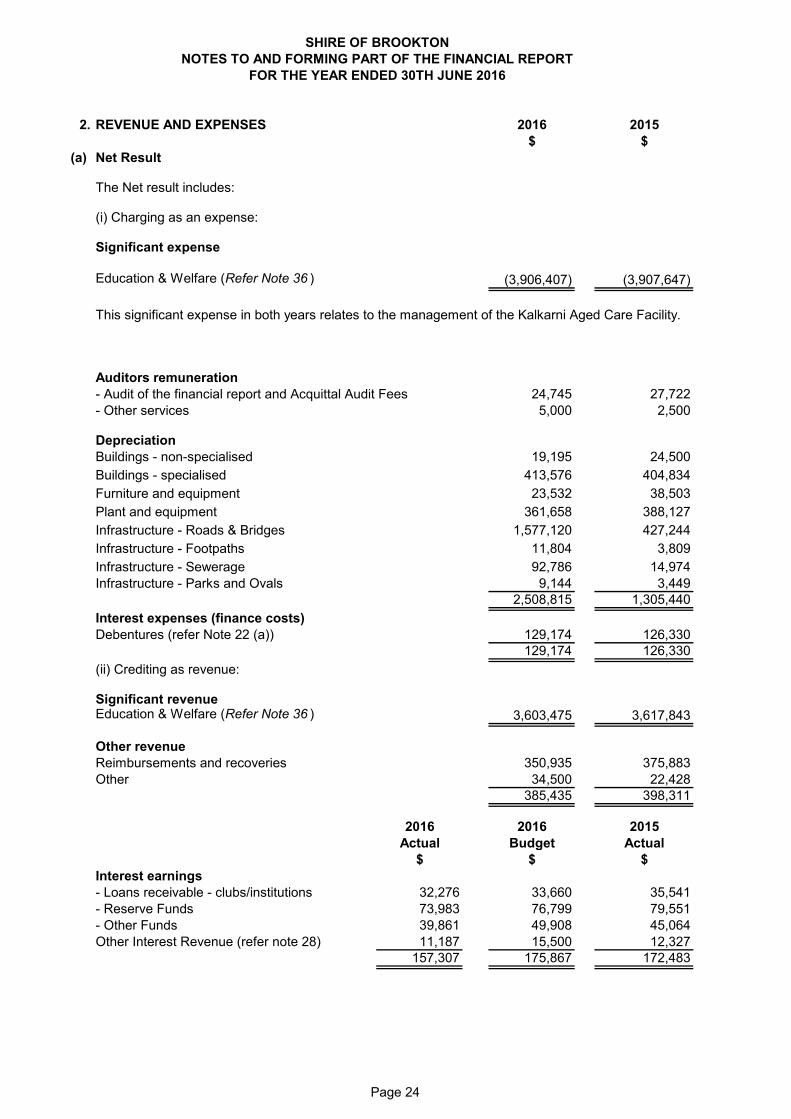
SHIRE OF BROOKTONNOTES TO AND FORMING PART OF THE FINANCIAL REPORT
FOR THE YEAR ENDED 30TH JUNE 2016
2. REVENUE AND EXPENSES 2016 2015$ $
(a) Net Result
The Net result includes:
(i) Charging as an expense:
Significant expense
Education & Welfare (Refer Note 36 ) (3,906,407) (3,907,647)
This significant expense in both years relates to the management of the Kalkarni Aged Care Facility.
Auditors remuneration- Audit of the financial report and Acquittal Audit Fees 24,745 27,722- Other services 5,000 2,500
DepreciationBuildings - non-specialised 19,195 24,500Buildings - specialised 413,576 404,834Furniture and equipment 23,532 38,503Plant and equipment 361,658 388,127Infrastructure - Roads & Bridges 1,577,120 427,244Infrastructure - Footpaths 11,804 3,809Infrastructure - Sewerage 92,786 14,974Infrastructure - Parks and Ovals 9,144 3,449
2,508,815 1,305,440Interest expenses (finance costs)Debentures (refer Note 22 (a)) 129,174 126,330
129,174 126,330(ii) Crediting as revenue:
Significant revenueEducation & Welfare (Refer Note 36 ) 3,603,475 3,617,843
Other revenueReimbursements and recoveries 350,935 375,883Other 34,500 22,428
385,435 398,311
2016 2016 2015Actual Budget Actual
$ $ $Interest earnings- Loans receivable - clubs/institutions 32,276 33,660 35,541- Reserve Funds 73,983 76,799 79,551- Other Funds 39,861 49,908 45,064Other Interest Revenue (refer note 28) 11,187 15,500 12,327
157,307 175,867 172,483
Page 24
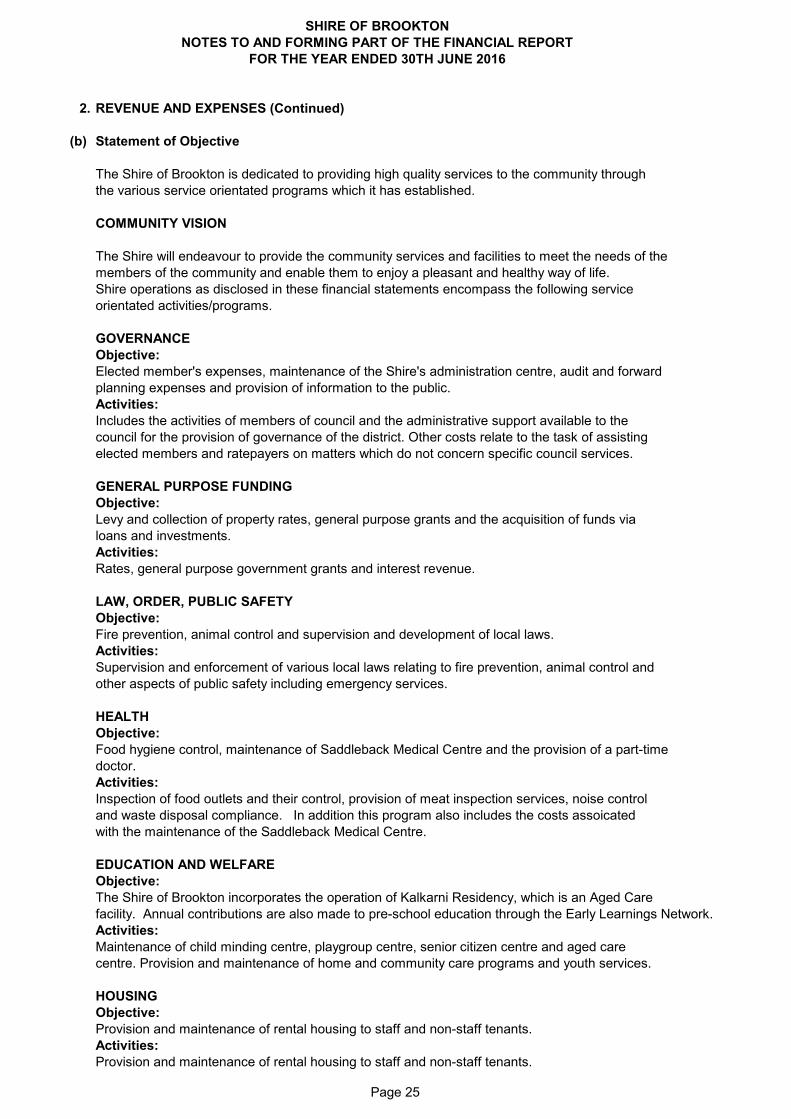
SHIRE OF BROOKTONNOTES TO AND FORMING PART OF THE FINANCIAL REPORT
FOR THE YEAR ENDED 30TH JUNE 2016
2. REVENUE AND EXPENSES (Continued)
(b) Statement of Objective
The Shire of Brookton is dedicated to providing high quality services to the community throughthe various service orientated programs which it has established.
COMMUNITY VISION
members of the community and enable them to enjoy a pleasant and healthy way of life.Shire operations as disclosed in these financial statements encompass the following serviceorientated activities/programs.
GOVERNANCEObjective:Elected member's expenses, maintenance of the Shire's administration centre, audit and forwardplanning expenses and provision of information to the public.Activities:
GENERAL PURPOSE FUNDINGObjective:Levy and collection of property rates, general purpose grants and the acquisition of funds vialoans and investments.Activities:
LAW, ORDER, PUBLIC SAFETYObjective:
Activities:
HEALTHObjective:Food hygiene control, maintenance of Saddleback Medical Centre and the provision of a part-timedoctor.Activities:
with the maintenance of the Saddleback Medical Centre.
EDUCATION AND WELFAREObjective:The Shire of Brookton incorporates the operation of Kalkarni Residency, which is an Aged Carefacility. Annual contributions are also made to pre-school education through the Early Learnings Network.Activities:
HOUSINGObjective:
Activities:Provision and maintenance of rental housing to staff and non-staff tenants.
The Shire will endeavour to provide the community services and facilities to meet the needs of the
Includes the activities of members of council and the administrative support available to thecouncil for the provision of governance of the district. Other costs relate to the task of assistingelected members and ratepayers on matters which do not concern specific council services.
Rates, general purpose government grants and interest revenue.
Maintenance of child minding centre, playgroup centre, senior citizen centre and aged carecentre. Provision and maintenance of home and community care programs and youth services.
Provision and maintenance of rental housing to staff and non-staff tenants.
Fire prevention, animal control and supervision and development of local laws.
Supervision and enforcement of various local laws relating to fire prevention, animal control andother aspects of public safety including emergency services.
Inspection of food outlets and their control, provision of meat inspection services, noise controland waste disposal compliance. In addition this program also includes the costs assoicated
Page 25
2. REVENUE AND EXPENSES (Continued)
(b) Statement of Objective (Continued)
COMMUNITY AMENITIESObjective:Provision and maintenance of a sewerage overflow system; street, houshold and commercial refusecollection; provision and maintenance of the Brookton refuse disposal site; administration of a townplanning scheme; provision and maintenance of public conveniences, and Brookton Cemeteryoperations.Activities:
RECREATION AND CULTUREObjective:Provision and maintenance of Brookton Memorial Hall, other public halls, the WB Eva Pavilion, recreation ground, Brookton swimming pool and community parks and gardens. Operation of theBrookton library and the community bus.Activities:
TRANSPORTObjective:Construction and maintenance of road network including traffic signs, footpaths, bridges, culverts and other drains, street cleaning and lighting of streets. Townscape projects and the maintenanceof a works depot.Activities:
ECONOMIC SERVICESObjective:Tourism and promotion of Brookton, operation of Brookton Caravan Park, building controland land care development of the Brookton district.Activities:
OTHER PROPERTY AND SERVICESObjective:Private works and indirect cost allocation pools for plant operation and public works.Activities:
Control.
Private works operation, plant repair and operation costs and engineering operation costs.
various sporting facilities. Provision and maintenance of parks, gardens and playgrounds.Operation of library, museum and other cultural facilities.
Construction and maintenance of roads, streets, footpaths, depots, cycleways, parking facilities and traffic control. Cleaning of streets and maintenance of street trees, street lighting etc.
Tourism and area promotion including the maintenance and operation of a caravan park.Provision of rural services including weed control, vermin control and standpipes. Building
Rubbish collection services, operation of rubbish disposal sites, litter control, construction andmaintenance of urban storm water drains, protection of the environment and administration oftown planning schemes, cemetery and public conveniences.
Maintenance of public halls, civic centres, aquatic centre, beaches, recreation centres and
SHIRE OF BROOKTONNOTES TO AND FORMING PART OF THE FINANCIAL REPORT
FOR THE YEAR ENDED 30TH JUNE 2016
Page 26
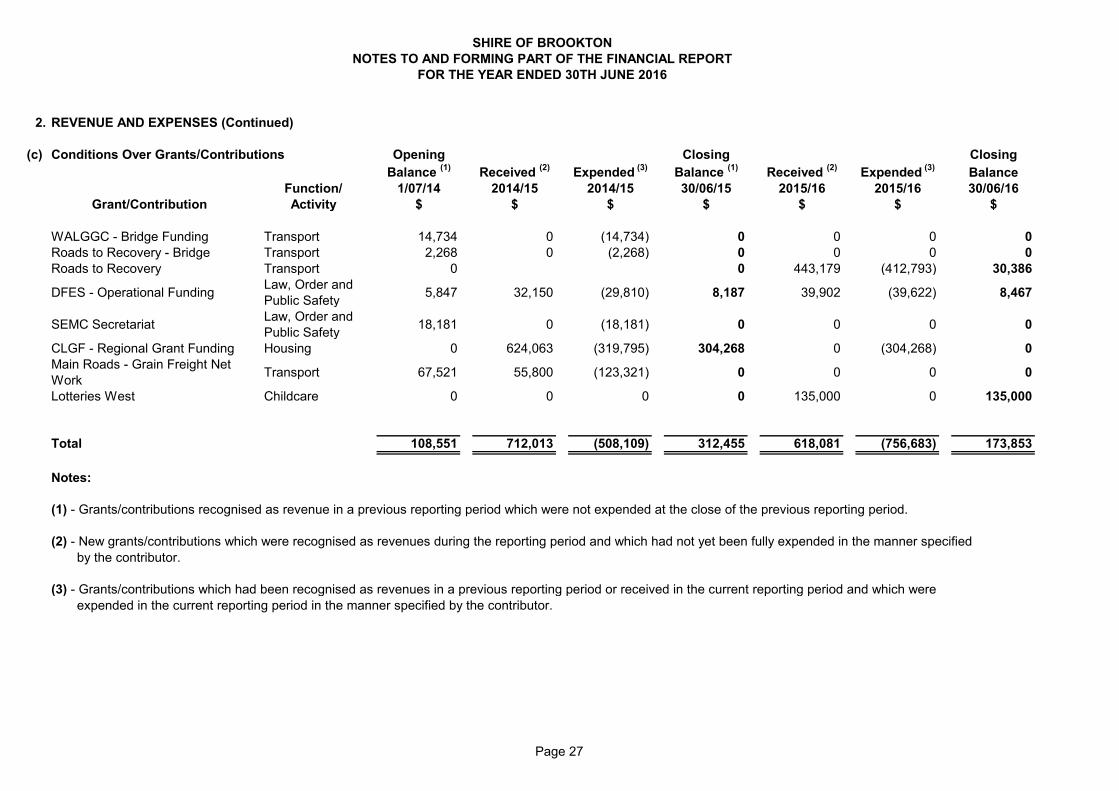
SHIRE OF BROOKTONNOTES TO AND FORMING PART OF THE FINANCIAL REPORT
FOR THE YEAR ENDED 30TH JUNE 2016
2. REVENUE AND EXPENSES (Continued)
(c) Conditions Over Grants/Contributions Opening Closing ClosingBalance (1) Received (2) Expended (3) Balance (1) Received (2) Expended (3) Balance
Function/ 1/07/14 2014/15 2014/15 30/06/15 2015/16 2015/16 30/06/16Grant/Contribution Activity $ $ $ $ $ $ $
WALGGC - Bridge Funding Transport 14,734 0 (14,734) 0 0 0 0Roads to Recovery - Bridge Transport 2,268 0 (2,268) 0 0 0 0Roads to Recovery Transport 0 0 443,179 (412,793) 30,386
DFES - Operational Funding Law, Order and Public Safety 5,847 32,150 (29,810) 8,187 39,902 (39,622) 8,467
SEMC Secretariat Law, Order and Public Safety 18,181 0 (18,181) 0 0 0 0
CLGF - Regional Grant Funding Housing 0 624,063 (319,795) 304,268 0 (304,268) 0Main Roads - Grain Freight Net Work Transport 67,521 55,800 (123,321) 0 0 0 0
Lotteries West Childcare 0 0 0 0 135,000 0 135,000
Total 108,551 712,013 (508,109) 312,455 618,081 (756,683) 173,853
Notes:
(1) - Grants/contributions recognised as revenue in a previous reporting period which were not expended at the close of the previous reporting period.
(2) - New grants/contributions which were recognised as revenues during the reporting period and which had not yet been fully expended in the manner specified by the contributor.
(3) - Grants/contributions which had been recognised as revenues in a previous reporting period or received in the current reporting period and which were expended in the current reporting period in the manner specified by the contributor.
Page 27
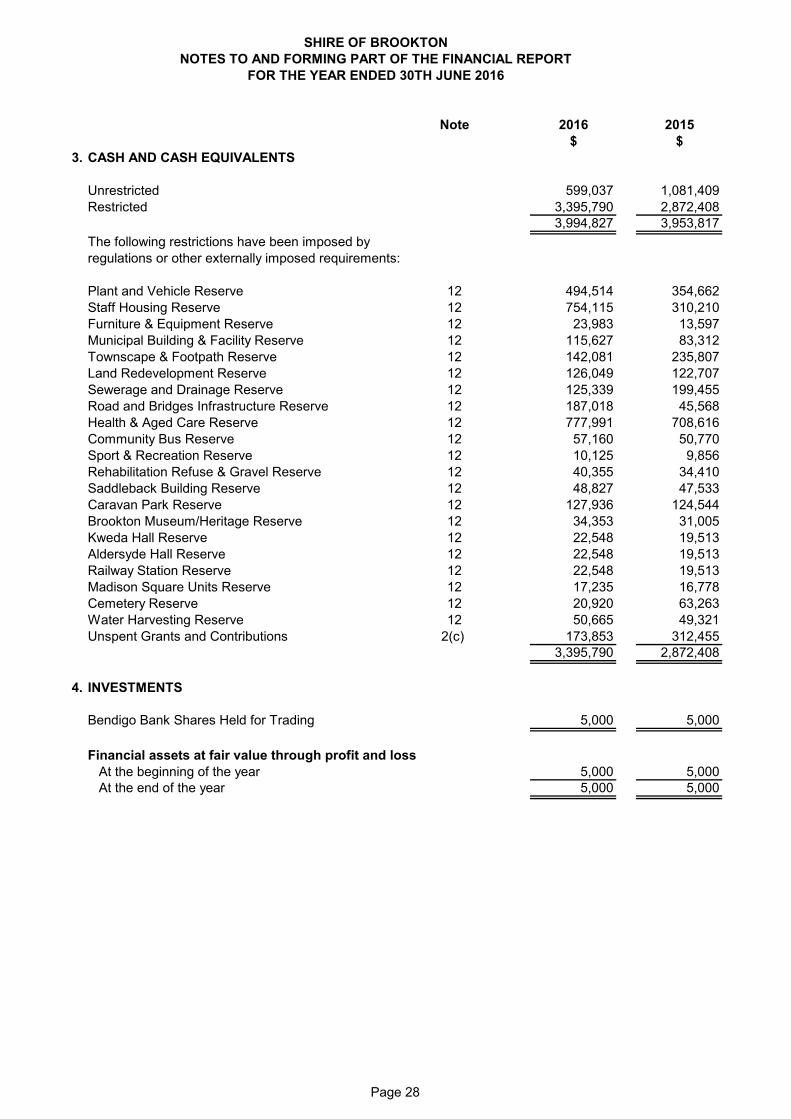
SHIRE OF BROOKTONNOTES TO AND FORMING PART OF THE FINANCIAL REPORT
FOR THE YEAR ENDED 30TH JUNE 2016
Note 2016 2015$ $
3. CASH AND CASH EQUIVALENTS
Unrestricted 599,037 1,081,409Restricted 3,395,790 2,872,408
3,994,827 3,953,817The following restrictions have been imposed byregulations or other externally imposed requirements:
Plant and Vehicle Reserve 12 494,514 354,662Staff Housing Reserve 12 754,115 310,210Furniture & Equipment Reserve 12 23,983 13,597Municipal Building & Facility Reserve 12 115,627 83,312Townscape & Footpath Reserve 12 142,081 235,807Land Redevelopment Reserve 12 126,049 122,707Sewerage and Drainage Reserve 12 125,339 199,455Road and Bridges Infrastructure Reserve 12 187,018 45,568Health & Aged Care Reserve 12 777,991 708,616Community Bus Reserve 12 57,160 50,770Sport & Recreation Reserve 12 10,125 9,856Rehabilitation Refuse & Gravel Reserve 12 40,355 34,410Saddleback Building Reserve 12 48,827 47,533Caravan Park Reserve 12 127,936 124,544Brookton Museum/Heritage Reserve 12 34,353 31,005Kweda Hall Reserve 12 22,548 19,513Aldersyde Hall Reserve 12 22,548 19,513Railway Station Reserve 12 22,548 19,513Madison Square Units Reserve 12 17,235 16,778Cemetery Reserve 12 20,920 63,263Water Harvesting Reserve 12 50,665 49,321Unspent Grants and Contributions 2(c) 173,853 312,455
3,395,790 2,872,408
4. INVESTMENTS
Bendigo Bank Shares Held for Trading 5,000 5,000
Financial assets at fair value through profit and lossAt the beginning of the year 5,000 5,000At the end of the year 5,000 5,000
Page 28
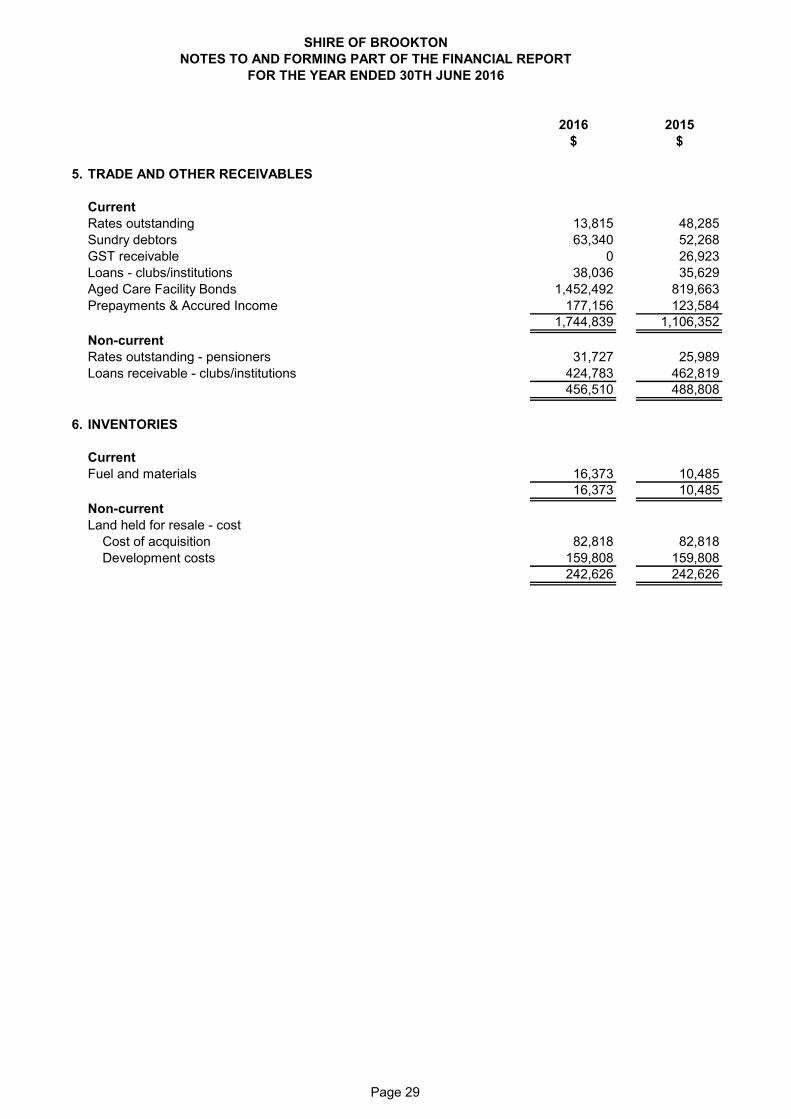
SHIRE OF BROOKTONNOTES TO AND FORMING PART OF THE FINANCIAL REPORT
FOR THE YEAR ENDED 30TH JUNE 2016
2016 2015$ $
5. TRADE AND OTHER RECEIVABLES
CurrentRates outstanding 13,815 48,285Sundry debtors 63,340 52,268GST receivable 0 26,923Loans - clubs/institutions 38,036 35,629Aged Care Facility Bonds 1,452,492 819,663Prepayments & Accured Income 177,156 123,584
1,744,839 1,106,352Non-currentRates outstanding - pensioners 31,727 25,989Loans receivable - clubs/institutions 424,783 462,819
456,510 488,808
6. INVENTORIES
CurrentFuel and materials 16,373 10,485
16,373 10,485Non-currentLand held for resale - cost Cost of acquisition 82,818 82,818 Development costs 159,808 159,808
242,626 242,626
Page 29
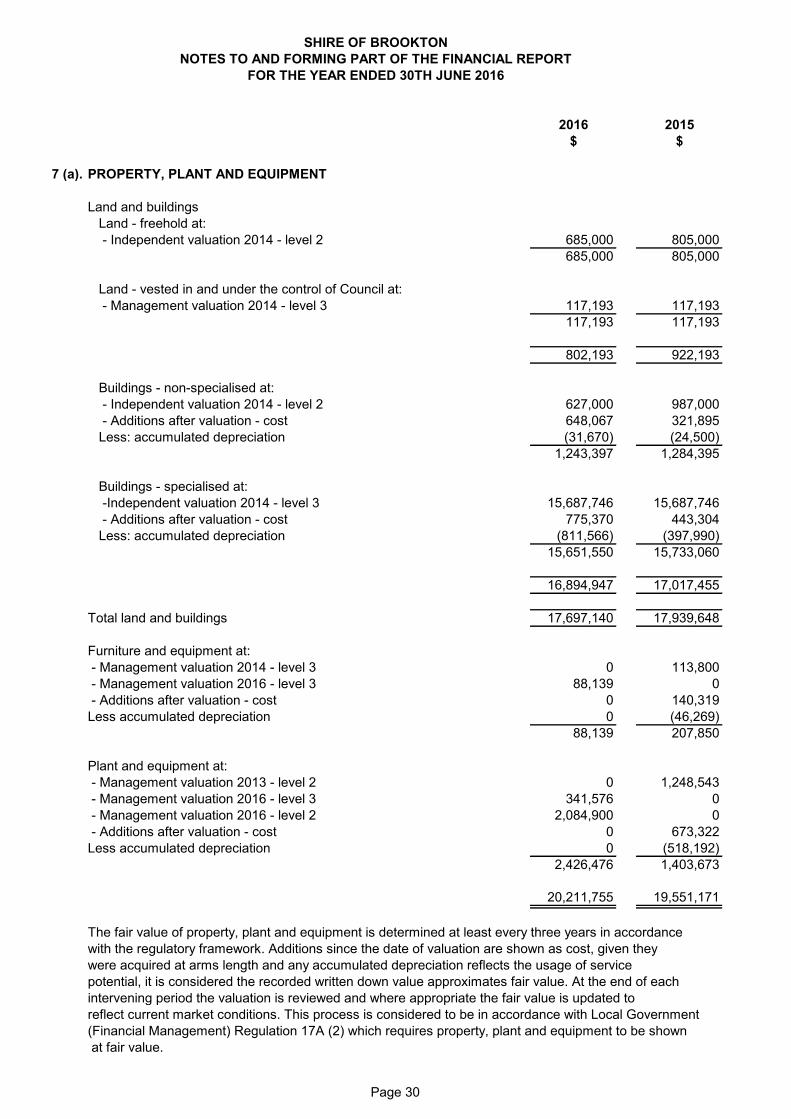
SHIRE OF BROOKTONNOTES TO AND FORMING PART OF THE FINANCIAL REPORT
FOR THE YEAR ENDED 30TH JUNE 2016
2016 2015$ $
7 (a). PROPERTY, PLANT AND EQUIPMENT
Land and buildingsLand - freehold at: - Independent valuation 2014 - level 2 685,000 805,000
685,000 805,000
Land - vested in and under the control of Council at: - Management valuation 2014 - level 3 117,193 117,193
117,193 117,193
802,193 922,193
Buildings - non-specialised at: - Independent valuation 2014 - level 2 627,000 987,000 - Additions after valuation - cost 648,067 321,895Less: accumulated depreciation (31,670) (24,500)
1,243,397 1,284,395
Buildings - specialised at: -Independent valuation 2014 - level 3 15,687,746 15,687,746 - Additions after valuation - cost 775,370 443,304Less: accumulated depreciation (811,566) (397,990)
15,651,550 15,733,060
16,894,947 17,017,455
Total land and buildings 17,697,140 17,939,648
Furniture and equipment at: - Management valuation 2014 - level 3 0 113,800 - Management valuation 2016 - level 3 88,139 0 - Additions after valuation - cost 0 140,319Less accumulated depreciation 0 (46,269)
88,139 207,850
Plant and equipment at: - Management valuation 2013 - level 2 0 1,248,543 - Management valuation 2016 - level 3 341,576 0 - Management valuation 2016 - level 2 2,084,900 0 - Additions after valuation - cost 0 673,322Less accumulated depreciation 0 (518,192)
2,426,476 1,403,673
20,211,755 19,551,171
The fair value of property, plant and equipment is determined at least every three years in accordancewith the regulatory framework. Additions since the date of valuation are shown as cost, given they were acquired at arms length and any accumulated depreciation reflects the usage of service potential, it is considered the recorded written down value approximates fair value. At the end of eachintervening period the valuation is reviewed and where appropriate the fair value is updated toreflect current market conditions. This process is considered to be in accordance with Local Government (Financial Management) Regulation 17A (2) which requires property, plant and equipment to be shown at fair value.
Page 30
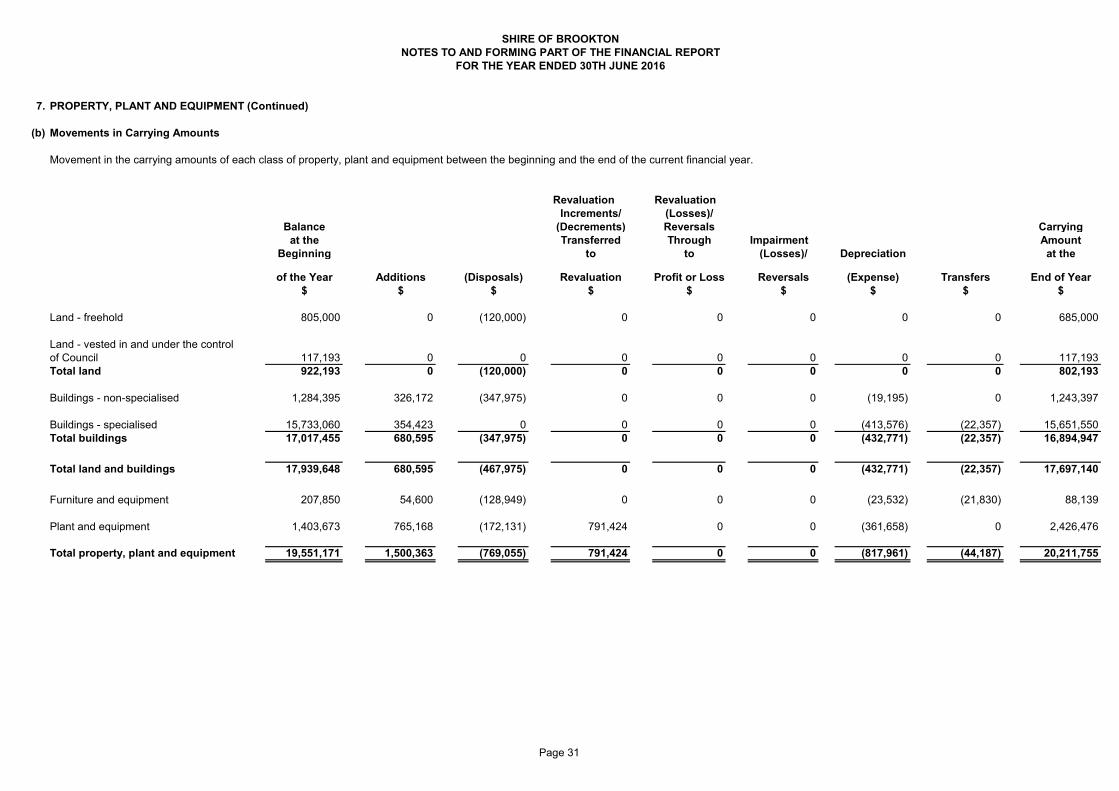
SHIRE OF BROOKTONNOTES TO AND FORMING PART OF THE FINANCIAL REPORT
FOR THE YEAR ENDED 30TH JUNE 2016
7. PROPERTY, PLANT AND EQUIPMENT (Continued)
(b) Movements in Carrying Amounts
Movement in the carrying amounts of each class of property, plant and equipment between the beginning and the end of the current financial year.
Revaluation RevaluationIncrements/ (Losses)/
Balance (Decrements) Reversals Carryingat the Transferred Through Impairment Amount
Beginning to to (Losses)/ Depreciation at the
of the Year Additions (Disposals) Revaluation Profit or Loss Reversals (Expense) Transfers End of Year$ $ $ $ $ $ $ $ $
Land - freehold 805,000 0 (120,000) 0 0 0 0 0 685,000
117,193 0 0 0 0 0 0 0 117,193Total land 922,193 0 (120,000) 0 0 0 0 0 802,193
Buildings - non-specialised 1,284,395 326,172 (347,975) 0 0 0 (19,195) 0 1,243,397
Buildings - specialised 15,733,060 354,423 0 0 0 0 (413,576) (22,357) 15,651,550Total buildings 17,017,455 680,595 (347,975) 0 0 0 (432,771) (22,357) 16,894,947
Total land and buildings 17,939,648 680,595 (467,975) 0 0 0 (432,771) (22,357) 17,697,140
Furniture and equipment 207,850 54,600 (128,949) 0 0 0 (23,532) (21,830) 88,139
Plant and equipment 1,403,673 765,168 (172,131) 791,424 0 0 (361,658) 0 2,426,476
Total property, plant and equipment 19,551,171 1,500,363 (769,055) 791,424 0 0 (817,961) (44,187) 20,211,755
Land - vested in and under the control of Council
Page 31
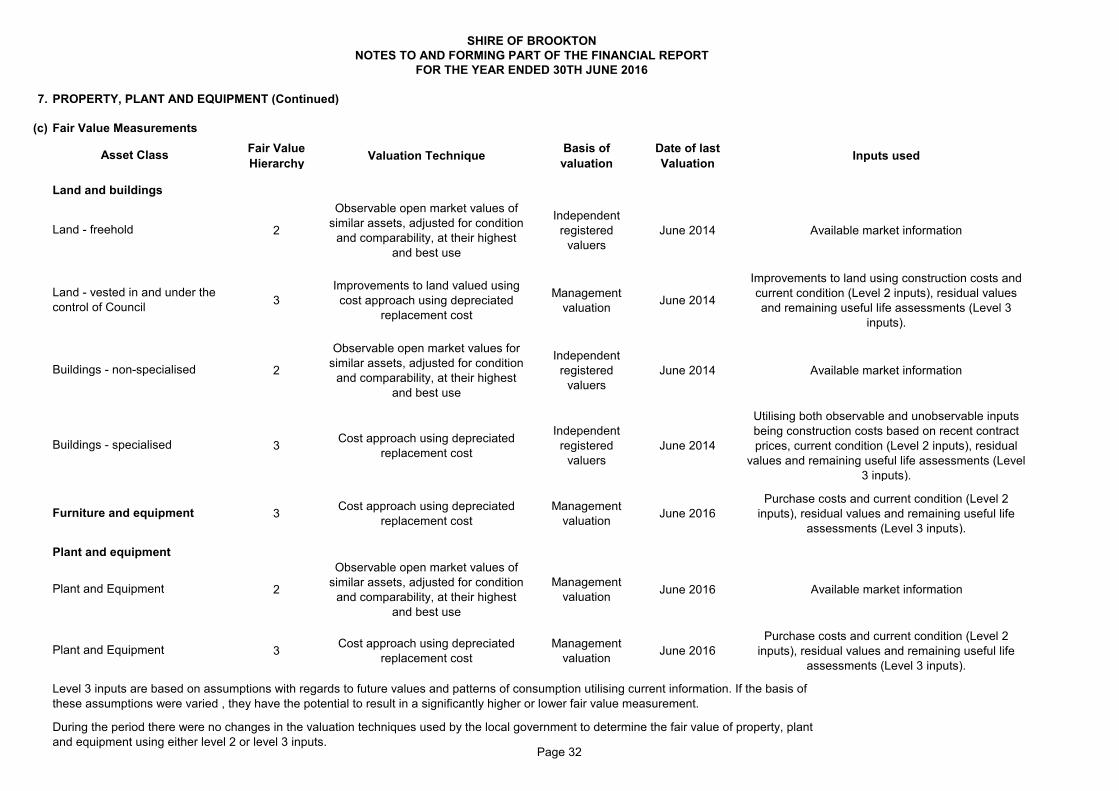
7. PROPERTY, PLANT AND EQUIPMENT (Continued)
(c) Fair Value MeasurementsFair Value Hierarchy Valuation Technique Basis of
valuationDate of last Valuation Inputs used
Land and buildings
2
Observable open market values of similar assets, adjusted for condition
and comparability, at their highest and best use
Independent registered
valuersJune 2014 Available market information
3Improvements to land valued using cost approach using depreciated
replacement cost
Management valuation June 2014
Improvements to land using construction costs and current condition (Level 2 inputs), residual values and remaining useful life assessments (Level 3
inputs).
2
Observable open market values for similar assets, adjusted for condition
and comparability, at their highest and best use
Independent registered
valuersJune 2014 Available market information
3 Cost approach using depreciated replacement cost
Independent registered
valuersJune 2014
Utilising both observable and unobservable inputs being construction costs based on recent contract prices, current condition (Level 2 inputs), residual
values and remaining useful life assessments (Level 3 inputs).
3 Cost approach using depreciated replacement cost
Management valuation June 2016
Purchase costs and current condition (Level 2 inputs), residual values and remaining useful life
assessments (Level 3 inputs).
2
Observable open market values of similar assets, adjusted for condition
and comparability, at their highest and best use
Management valuation June 2016 Available market information
3 Cost approach using depreciated replacement cost
Management valuation June 2016
Purchase costs and current condition (Level 2 inputs), residual values and remaining useful life
assessments (Level 3 inputs).
Level 3 inputs are based on assumptions with regards to future values and patterns of consumption utilising current information. If the basis of these assumptions were varied , they have the potential to result in a significantly higher or lower fair value measurement.
During the period there were no changes in the valuation techniques used by the local government to determine the fair value of property, plant and equipment using either level 2 or level 3 inputs.
Plant and Equipment
Plant and Equipment
Plant and equipment
Land - freehold
Land - vested in and under the control of Council
Buildings - non-specialised
Buildings - specialised
SHIRE OF BROOKTONNOTES TO AND FORMING PART OF THE FINANCIAL REPORT
FOR THE YEAR ENDED 30TH JUNE 2016
Asset Class
Furniture and equipment
Page 32
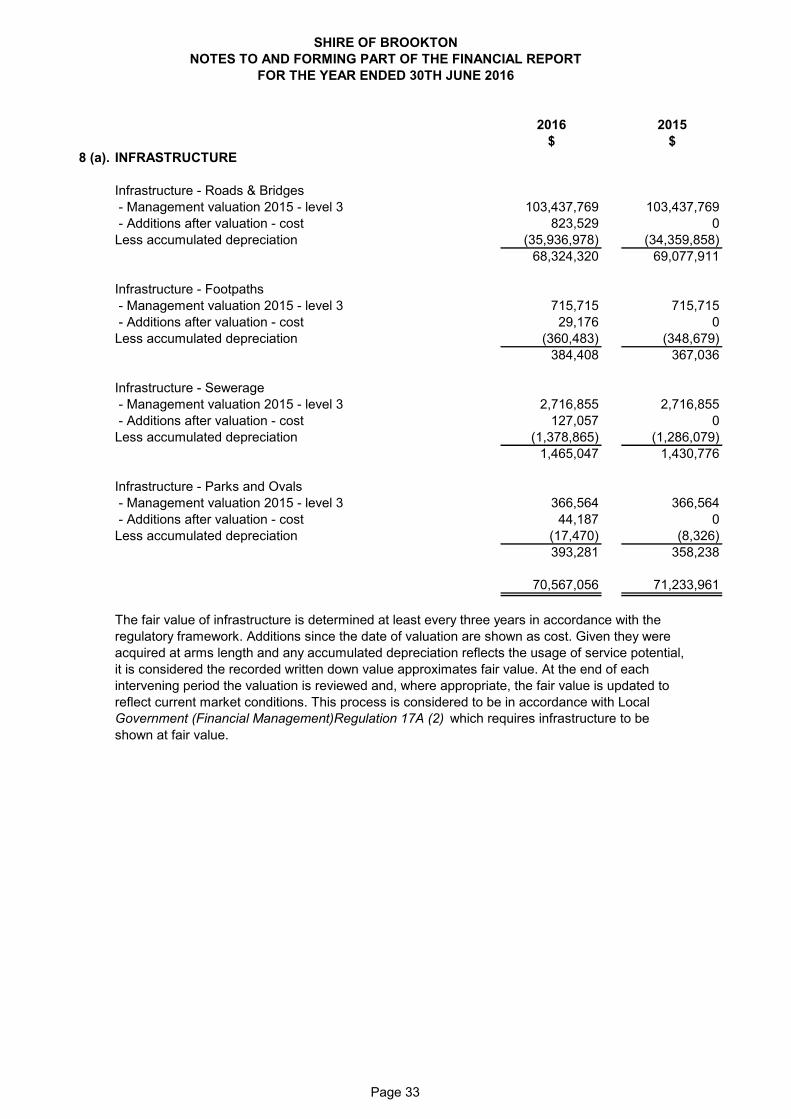
SHIRE OF BROOKTONNOTES TO AND FORMING PART OF THE FINANCIAL REPORT
FOR THE YEAR ENDED 30TH JUNE 2016
2016 2015$ $
8 (a). INFRASTRUCTURE
Infrastructure - Roads & Bridges - Management valuation 2015 - level 3 103,437,769 103,437,769 - Additions after valuation - cost 823,529 0Less accumulated depreciation (35,936,978) (34,359,858)
68,324,320 69,077,911
Infrastructure - Footpaths - Management valuation 2015 - level 3 715,715 715,715 - Additions after valuation - cost 29,176 0Less accumulated depreciation (360,483) (348,679)
384,408 367,036
Infrastructure - Sewerage - Management valuation 2015 - level 3 2,716,855 2,716,855 - Additions after valuation - cost 127,057 0Less accumulated depreciation (1,378,865) (1,286,079)
1,465,047 1,430,776
Infrastructure - Parks and Ovals - Management valuation 2015 - level 3 366,564 366,564 - Additions after valuation - cost 44,187 0Less accumulated depreciation (17,470) (8,326)
393,281 358,238
70,567,056 71,233,961
The fair value of infrastructure is determined at least every three years in accordance with theregulatory framework. Additions since the date of valuation are shown as cost. Given they were acquired at arms length and any accumulated depreciation reflects the usage of service potential, it is considered the recorded written down value approximates fair value. At the end of eachintervening period the valuation is reviewed and, where appropriate, the fair value is updated toreflect current market conditions. This process is considered to be in accordance with LocalGovernment (Financial Management)Regulation 17A (2) which requires infrastructure to beshown at fair value.
Page 33
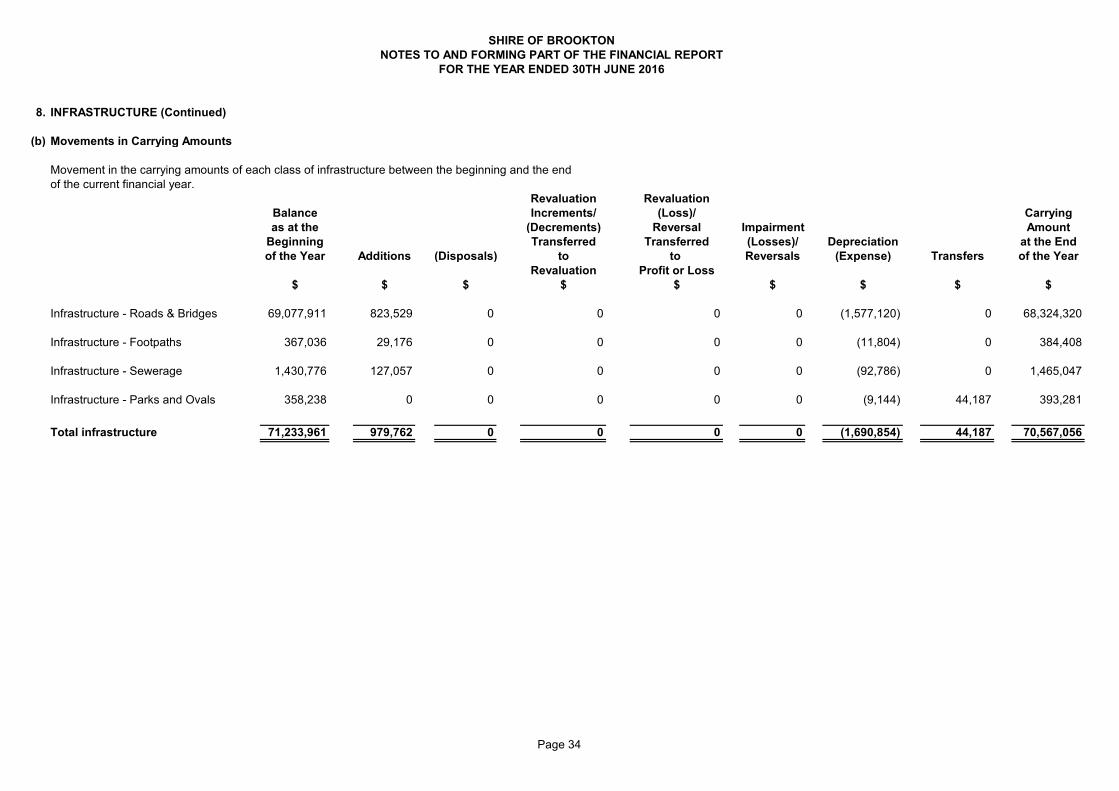
SHIRE OF BROOKTONNOTES TO AND FORMING PART OF THE FINANCIAL REPORT
FOR THE YEAR ENDED 30TH JUNE 2016
8. INFRASTRUCTURE (Continued)
(b) Movements in Carrying Amounts
Movement in the carrying amounts of each class of infrastructure between the beginning and the endof the current financial year.
Revaluation RevaluationBalance Increments/ (Loss)/ Carryingas at the (Decrements) Reversal Impairment Amount
Beginning Transferred Transferred (Losses)/ Depreciation at the Endof the Year Additions (Disposals) to to Reversals (Expense) Transfers of the Year
Revaluation Profit or Loss$ $ $ $ $ $ $ $ $
Infrastructure - Roads & Bridges 69,077,911 823,529 0 0 0 0 (1,577,120) 0 68,324,320
Infrastructure - Footpaths 367,036 29,176 0 0 0 0 (11,804) 0 384,408
Infrastructure - Sewerage 1,430,776 127,057 0 0 0 0 (92,786) 0 1,465,047
Infrastructure - Parks and Ovals 358,238 0 0 0 0 0 (9,144) 44,187 393,281
Total infrastructure 71,233,961 979,762 0 0 0 0 (1,690,854) 44,187 70,567,056
Page 34
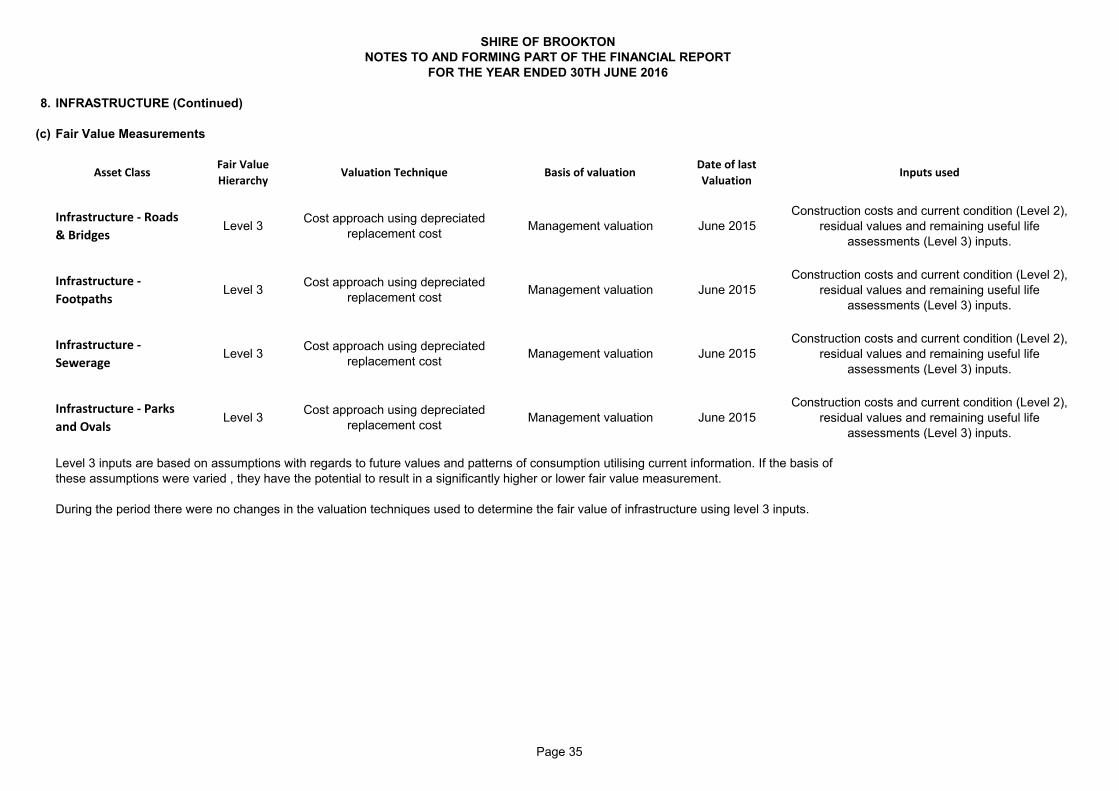
8. INFRASTRUCTURE (Continued)
(c) Fair Value Measurements
Asset ClassFair Value Hierarchy
Valuation Technique Basis of valuationDate of last Valuation
Inputs used
Infrastructure - Roads & Bridges
Level 3 Cost approach using depreciated replacement cost Management valuation June 2015
Construction costs and current condition (Level 2), residual values and remaining useful life
assessments (Level 3) inputs.
Infrastructure - Footpaths
Level 3 Cost approach using depreciated replacement cost Management valuation June 2015
Construction costs and current condition (Level 2), residual values and remaining useful life
assessments (Level 3) inputs.
Infrastructure - Sewerage
Level 3 Cost approach using depreciated replacement cost Management valuation June 2015
Construction costs and current condition (Level 2), residual values and remaining useful life
assessments (Level 3) inputs.
Infrastructure - Parks and Ovals
Level 3 Cost approach using depreciated replacement cost Management valuation June 2015
Construction costs and current condition (Level 2), residual values and remaining useful life
assessments (Level 3) inputs.
Level 3 inputs are based on assumptions with regards to future values and patterns of consumption utilising current information. If the basis of these assumptions were varied , they have the potential to result in a significantly higher or lower fair value measurement.
During the period there were no changes in the valuation techniques used to determine the fair value of infrastructure using level 3 inputs.
SHIRE OF BROOKTONNOTES TO AND FORMING PART OF THE FINANCIAL REPORT
FOR THE YEAR ENDED 30TH JUNE 2016
Page 35
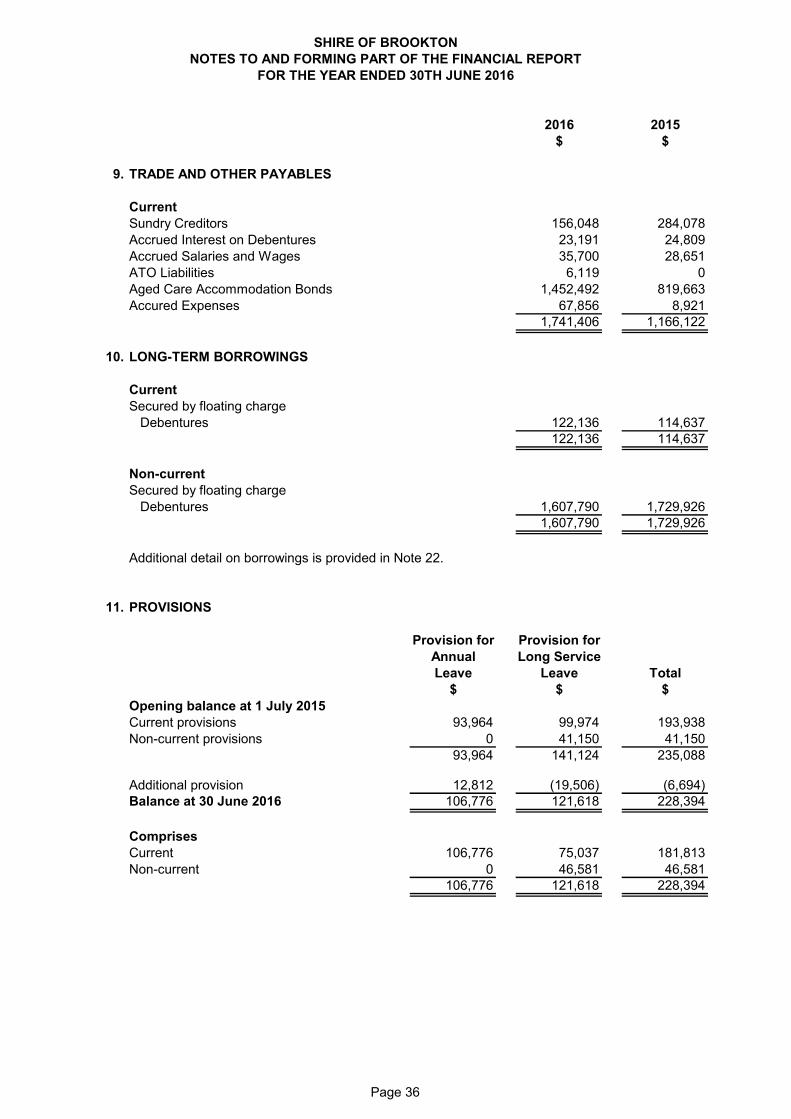
SHIRE OF BROOKTONNOTES TO AND FORMING PART OF THE FINANCIAL REPORT
FOR THE YEAR ENDED 30TH JUNE 2016
2016 2015$ $
9. TRADE AND OTHER PAYABLES
CurrentSundry Creditors 156,048 284,078Accrued Interest on Debentures 23,191 24,809Accrued Salaries and Wages 35,700 28,651ATO Liabilities 6,119 0Aged Care Accommodation Bonds 1,452,492 819,663Accured Expenses 67,856 8,921
1,741,406 1,166,122
10. LONG-TERM BORROWINGS
CurrentSecured by floating charge Debentures 122,136 114,637
122,136 114,637
Non-currentSecured by floating charge Debentures 1,607,790 1,729,926
1,607,790 1,729,926
Additional detail on borrowings is provided in Note 22.
11. PROVISIONS
Provision for Provision forAnnual Long ServiceLeave Leave Total
$ $ $Opening balance at 1 July 2015Current provisions 93,964 99,974 193,938Non-current provisions 0 41,150 41,150
93,964 141,124 235,088
Additional provision 12,812 (19,506) (6,694)Balance at 30 June 2016 106,776 121,618 228,394
ComprisesCurrent 106,776 75,037 181,813Non-current 0 46,581 46,581
106,776 121,618 228,394
Page 36
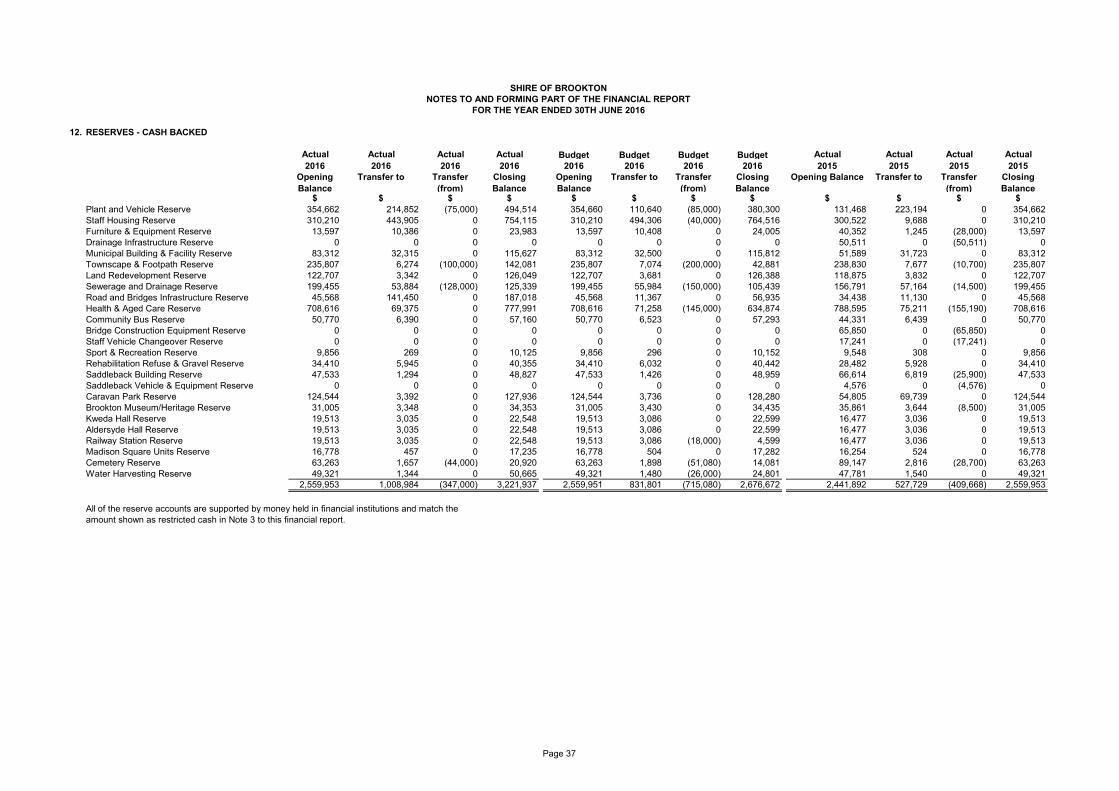
12. RESERVES - CASH BACKED
Actual Actual Actual Actual Budget Budget Budget Budget Actual Actual Actual Actual2016 2016 2016 2016 2016 2016 2016 2016 2015 2015 2015 2015
Opening Balance
Transfer to Transfer (from)
Closing Balance
Opening Balance
Transfer to Transfer (from)
Closing Balance
Opening Balance Transfer to Transfer (from)
Closing Balance
$ $ $ $ $ $ $ $ $ $ $ $Plant and Vehicle Reserve 354,662 214,852 (75,000) 494,514 354,660 110,640 (85,000) 380,300 131,468 223,194 0 354,662Staff Housing Reserve 310,210 443,905 0 754,115 310,210 494,306 (40,000) 764,516 300,522 9,688 0 310,210Furniture & Equipment Reserve 13,597 10,386 0 23,983 13,597 10,408 0 24,005 40,352 1,245 (28,000) 13,597Drainage Infrastructure Reserve 0 0 0 0 0 0 0 0 50,511 0 (50,511) 0Municipal Building & Facility Reserve 83,312 32,315 0 115,627 83,312 32,500 0 115,812 51,589 31,723 0 83,312Townscape & Footpath Reserve 235,807 6,274 (100,000) 142,081 235,807 7,074 (200,000) 42,881 238,830 7,677 (10,700) 235,807Land Redevelopment Reserve 122,707 3,342 0 126,049 122,707 3,681 0 126,388 118,875 3,832 0 122,707Sewerage and Drainage Reserve 199,455 53,884 (128,000) 125,339 199,455 55,984 (150,000) 105,439 156,791 57,164 (14,500) 199,455Road and Bridges Infrastructure Reserve 45,568 141,450 0 187,018 45,568 11,367 0 56,935 34,438 11,130 0 45,568Health & Aged Care Reserve 708,616 69,375 0 777,991 708,616 71,258 (145,000) 634,874 788,595 75,211 (155,190) 708,616Community Bus Reserve 50,770 6,390 0 57,160 50,770 6,523 0 57,293 44,331 6,439 0 50,770Bridge Construction Equipment Reserve 0 0 0 0 0 0 0 0 65,850 0 (65,850) 0Staff Vehicle Changeover Reserve 0 0 0 0 0 0 0 0 17,241 0 (17,241) 0Sport & Recreation Reserve 9,856 269 0 10,125 9,856 296 0 10,152 9,548 308 0 9,856Rehabilitation Refuse & Gravel Reserve 34,410 5,945 0 40,355 34,410 6,032 0 40,442 28,482 5,928 0 34,410Saddleback Building Reserve 47,533 1,294 0 48,827 47,533 1,426 0 48,959 66,614 6,819 (25,900) 47,533Saddleback Vehicle & Equipment Reserve 0 0 0 0 0 0 0 0 4,576 0 (4,576) 0Caravan Park Reserve 124,544 3,392 0 127,936 124,544 3,736 0 128,280 54,805 69,739 0 124,544Brookton Museum/Heritage Reserve 31,005 3,348 0 34,353 31,005 3,430 0 34,435 35,861 3,644 (8,500) 31,005Kweda Hall Reserve 19,513 3,035 0 22,548 19,513 3,086 0 22,599 16,477 3,036 0 19,513Aldersyde Hall Reserve 19,513 3,035 0 22,548 19,513 3,086 0 22,599 16,477 3,036 0 19,513Railway Station Reserve 19,513 3,035 0 22,548 19,513 3,086 (18,000) 4,599 16,477 3,036 0 19,513Madison Square Units Reserve 16,778 457 0 17,235 16,778 504 0 17,282 16,254 524 0 16,778Cemetery Reserve 63,263 1,657 (44,000) 20,920 63,263 1,898 (51,080) 14,081 89,147 2,816 (28,700) 63,263Water Harvesting Reserve 49,321 1,344 0 50,665 49,321 1,480 (26,000) 24,801 47,781 1,540 0 49,321
2,559,953 1,008,984 (347,000) 3,221,937 2,559,951 831,801 (715,080) 2,676,672 2,441,892 527,729 (409,668) 2,559,953
All of the reserve accounts are supported by money held in financial institutions and match theamount shown as restricted cash in Note 3 to this financial report.
SHIRE OF BROOKTONNOTES TO AND FORMING PART OF THE FINANCIAL REPORT
FOR THE YEAR ENDED 30TH JUNE 2016
Page 37
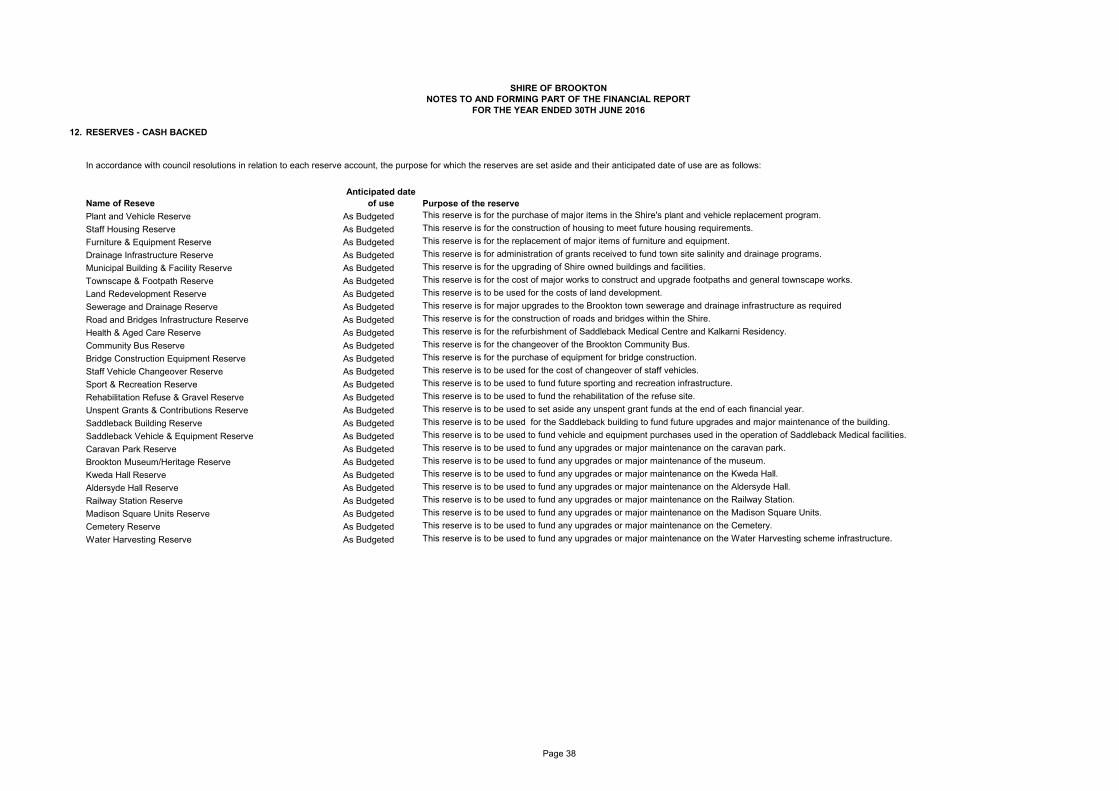
12. RESERVES - CASH BACKED
In accordance with council resolutions in relation to each reserve account, the purpose for which the reserves are set aside and their anticipated date of use are as follows:
Name of ReseveAnticipated date
of use Purpose of the reservePlant and Vehicle Reserve As Budgeted This reserve is for the purchase of major items in the Shire's plant and vehicle replacement program.Staff Housing Reserve As Budgeted This reserve is for the construction of housing to meet future housing requirements.Furniture & Equipment Reserve As Budgeted This reserve is for the replacement of major items of furniture and equipment.Drainage Infrastructure Reserve As Budgeted This reserve is for administration of grants received to fund town site salinity and drainage programs.Municipal Building & Facility Reserve As Budgeted This reserve is for the upgrading of Shire owned buildings and facilities.Townscape & Footpath Reserve As Budgeted This reserve is for the cost of major works to construct and upgrade footpaths and general townscape works.Land Redevelopment Reserve As Budgeted This reserve is to be used for the costs of land development.Sewerage and Drainage Reserve As Budgeted This reserve is for major upgrades to the Brookton town sewerage and drainage infrastructure as requiredRoad and Bridges Infrastructure Reserve As Budgeted This reserve is for the construction of roads and bridges within the Shire.Health & Aged Care Reserve As Budgeted This reserve is for the refurbishment of Saddleback Medical Centre and Kalkarni Residency.Community Bus Reserve As Budgeted This reserve is for the changeover of the Brookton Community Bus.Bridge Construction Equipment Reserve As Budgeted This reserve is for the purchase of equipment for bridge construction.Staff Vehicle Changeover Reserve As Budgeted This reserve is to be used for the cost of changeover of staff vehicles.Sport & Recreation Reserve As Budgeted This reserve is to be used to fund future sporting and recreation infrastructure.Rehabilitation Refuse & Gravel Reserve As Budgeted This reserve is to be used to fund the rehabilitation of the refuse site.Unspent Grants & Contributions Reserve As Budgeted This reserve is to be used to set aside any unspent grant funds at the end of each financial year.Saddleback Building Reserve As Budgeted This reserve is to be used for the Saddleback building to fund future upgrades and major maintenance of the building.Saddleback Vehicle & Equipment Reserve As Budgeted This reserve is to be used to fund vehicle and equipment purchases used in the operation of Saddleback Medical facilities.Caravan Park Reserve As Budgeted This reserve is to be used to fund any upgrades or major maintenance on the caravan park.Brookton Museum/Heritage Reserve As Budgeted This reserve is to be used to fund any upgrades or major maintenance of the museum.Kweda Hall Reserve As Budgeted This reserve is to be used to fund any upgrades or major maintenance on the Kweda Hall.Aldersyde Hall Reserve As Budgeted This reserve is to be used to fund any upgrades or major maintenance on the Aldersyde Hall.Railway Station Reserve As Budgeted This reserve is to be used to fund any upgrades or major maintenance on the Railway Station.Madison Square Units Reserve As Budgeted This reserve is to be used to fund any upgrades or major maintenance on the Madison Square Units.Cemetery Reserve As Budgeted This reserve is to be used to fund any upgrades or major maintenance on the Cemetery.Water Harvesting Reserve As Budgeted This reserve is to be used to fund any upgrades or major maintenance on the Water Harvesting scheme infrastructure.
SHIRE OF BROOKTONNOTES TO AND FORMING PART OF THE FINANCIAL REPORT
FOR THE YEAR ENDED 30TH JUNE 2016
Page 38
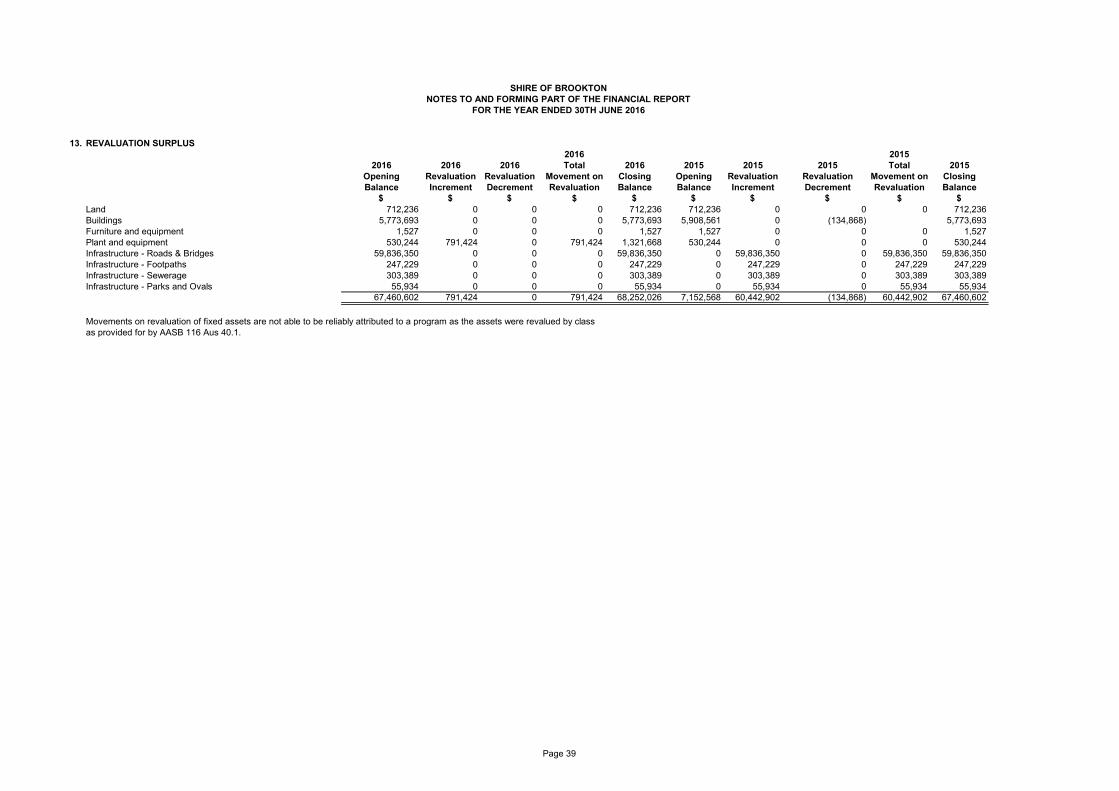
13. REVALUATION SURPLUS2016 2015
2016 2016 2016 Total 2016 2015 2015 2015 Total 2015Opening Revaluation Revaluation Movement on Closing Opening Revaluation Revaluation Movement on ClosingBalance Increment Decrement Revaluation Balance Balance Increment Decrement Revaluation Balance
$ $ $ $ $ $ $ $ $ $Land 712,236 0 0 0 712,236 712,236 0 0 0 712,236Buildings 5,773,693 0 0 0 5,773,693 5,908,561 0 (134,868) 5,773,693Furniture and equipment 1,527 0 0 0 1,527 1,527 0 0 0 1,527Plant and equipment 530,244 791,424 0 791,424 1,321,668 530,244 0 0 0 530,244Infrastructure - Roads & Bridges 59,836,350 0 0 0 59,836,350 0 59,836,350 0 59,836,350 59,836,350Infrastructure - Footpaths 247,229 0 0 0 247,229 0 247,229 0 247,229 247,229Infrastructure - Sewerage 303,389 0 0 0 303,389 0 303,389 0 303,389 303,389Infrastructure - Parks and Ovals 55,934 0 0 0 55,934 0 55,934 0 55,934 55,934
67,460,602 791,424 0 791,424 68,252,026 7,152,568 60,442,902 (134,868) 60,442,902 67,460,602
as provided for by AASB 116 Aus 40.1.
SHIRE OF BROOKTONNOTES TO AND FORMING PART OF THE FINANCIAL REPORT
FOR THE YEAR ENDED 30TH JUNE 2016
Movements on revaluation of fixed assets are not able to be reliably attributed to a program as the assets were revalued by class
Page 39

SHIRE OF BROOKTONNOTES TO AND FORMING PART OF THE FINANCIAL REPORT
FOR THE YEAR ENDED 30TH JUNE 2016
14. NOTES TO THE STATEMENT OF CASH FLOWS
(a) Reconciliation of Cash
For the purposes of the Statement of Cash Flows, cash includes cash and cash equivalents,net of outstanding bank overdrafts. Cash at the end of the reporting period is reconciled to therelated items in the Statement of Financial Position as follows:
20162016 Budget 2015
$ $ $
Cash and cash equivalents 3,994,827 3,085,742 3,953,817
(b) Reconciliation of Net Cash Provided ByOperating Activities to Net Result
Net result (598,611) 271,868 1,402,500
Non-cash flows in Net result:Depreciation 2,508,815 1,354,697 1,305,440(Profit)/Loss on sale of asset 212,775 (116,757) 40,366
Changes in assets and liabilities:(Increase)/Decrease in receivables (641,818) (57,830) (96,248)(Increase)/Decrease in inventories (5,888) 0 5,385Increase/(Decrease) in payables 575,284 123,973 10,914Increase/(Decrease) in provisions (6,694) 0 26,224
Grants contributions for the development of assets (1,207,997) (898,545) (1,115,962)Net cash from operating activities 835,866 677,406 1,578,619
2016 2015(c) Undrawn Borrowing Facilities $ $
Credit Standby ArrangementsCredit card limit 10,000 10,000Credit card balance at balance date (1,206) (766)Total amount of credit unused 8,794 9,234
Loan facilitiesLoan facilities - current 122,136 114,637Loan facilities - non-current 1,607,790 1,729,926Total facilities in use at balance date 1,729,926 1,844,563
Unused loan facilities at balance date NIL NIL
Page 40

SHIRE OF BROOKTONNOTES TO AND FORMING PART OF THE FINANCIAL REPORT
FOR THE YEAR ENDED 30TH JUNE 2016
15. CONTINGENT LIABILITIES
16. CAPITAL AND LEASING COMMITMENTS
(a) Operating Lease Commitments
(b) Capital Expenditure Commitments
There are no contingent liabilities as at 30 June 2016.
The Shire did not have any future operating lease commitments at the reporting date.
The Shire did not have any future capital expenditure commitments at the reporting date.
Page 41
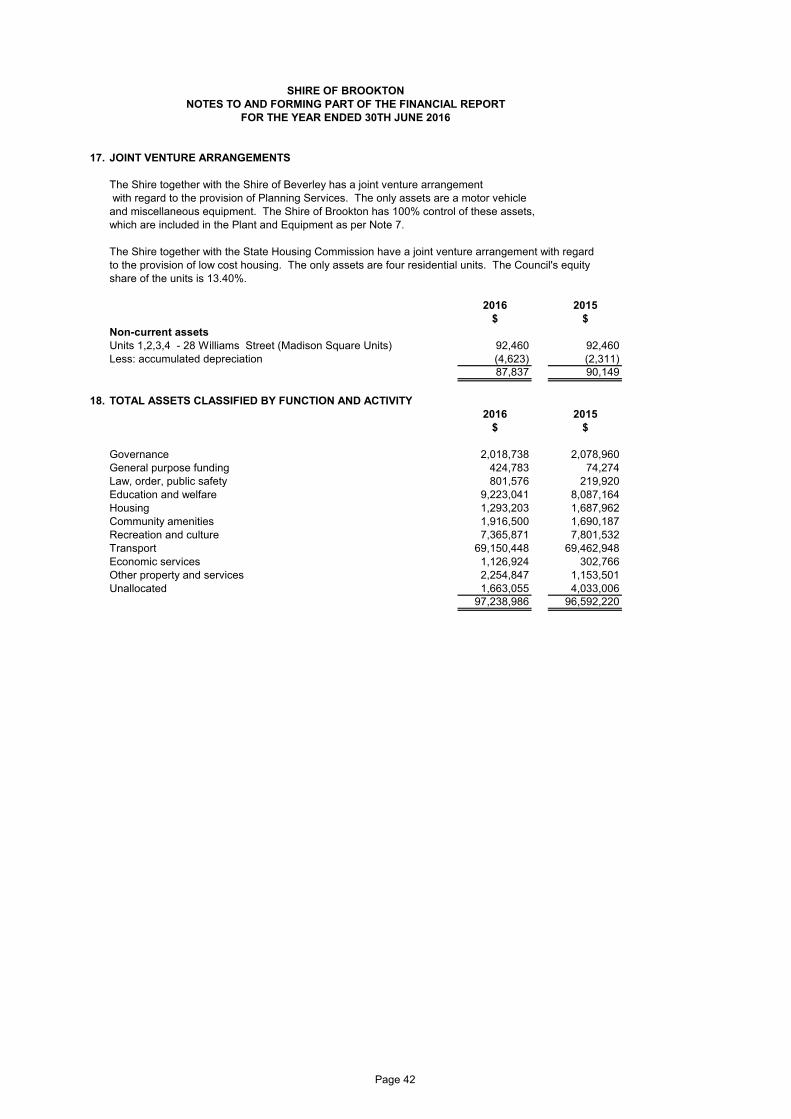
SHIRE OF BROOKTONNOTES TO AND FORMING PART OF THE FINANCIAL REPORT
FOR THE YEAR ENDED 30TH JUNE 2016
17. JOINT VENTURE ARRANGEMENTS
The Shire together with the Shire of Beverley has a joint venture arrangement with regard to the provision of Planning Services. The only assets are a motor vehicleand miscellaneous equipment. The Shire of Brookton has 100% control of these assets,which are included in the Plant and Equipment as per Note 7.
The Shire together with the State Housing Commission have a joint venture arrangement with regardto the provision of low cost housing. The only assets are four residential units. The Council's equityshare of the units is 13.40%.
2016 2015$ $
Non-current assetsUnits 1,2,3,4 - 28 Williams Street (Madison Square Units) 92,460 92,460Less: accumulated depreciation (4,623) (2,311)
87,837 90,149
18. TOTAL ASSETS CLASSIFIED BY FUNCTION AND ACTIVITY2016 2015
$ $
Governance 2,018,738 2,078,960General purpose funding 424,783 74,274Law, order, public safety 801,576 219,920Education and welfare 9,223,041 8,087,164Housing 1,293,203 1,687,962Community amenities 1,916,500 1,690,187Recreation and culture 7,365,871 7,801,532Transport 69,150,448 69,462,948Economic services 1,126,924 302,766Other property and services 2,254,847 1,153,501Unallocated 1,663,055 4,033,006
97,238,986 96,592,220
Page 42
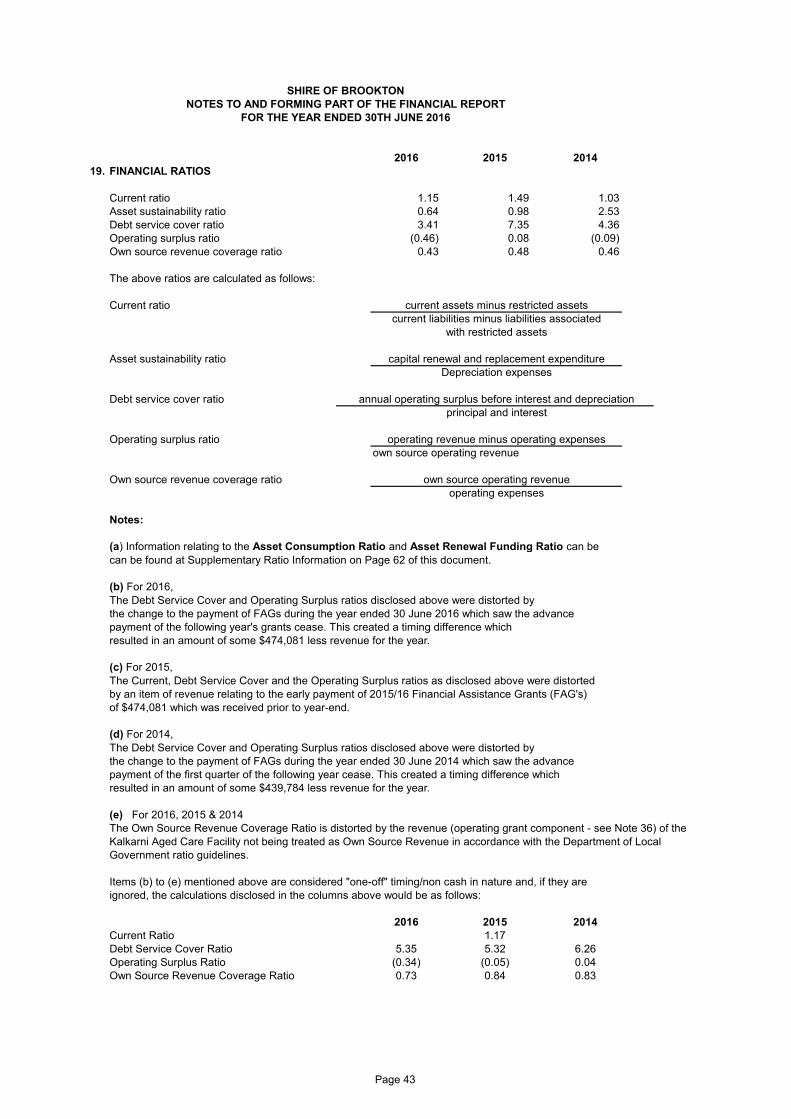
SHIRE OF BROOKTONNOTES TO AND FORMING PART OF THE FINANCIAL REPORT
FOR THE YEAR ENDED 30TH JUNE 2016
2016 2015 201419. FINANCIAL RATIOS
Current ratio 1.15 1.49 1.03Asset sustainability ratio 0.64 0.98 2.53Debt service cover ratio 3.41 7.35 4.36Operating surplus ratio (0.46) 0.08 (0.09)Own source revenue coverage ratio 0.43 0.48 0.46
The above ratios are calculated as follows:
Current ratio current assets minus restricted assetscurrent liabilities minus liabilities associated
with restricted assets
Asset sustainability ratioDepreciation expenses
Debt service cover ratio annual operating surplus before interest and depreciationprincipal and interest
Operating surplus ratio operating revenue minus operating expensesown source operating revenue
Own source revenue coverage ratio own source operating revenueoperating expenses
Notes:
(a) Information relating to the Asset Consumption Ratio and Asset Renewal Funding Ratio can becan be found at Supplementary Ratio Information on Page 62 of this document.
(b) For 2016,The Debt Service Cover and Operating Surplus ratios disclosed above were distorted bythe change to the payment of FAGs during the year ended 30 June 2016 which saw the advance payment of the following year's grants cease. This created a timing difference which resulted in an amount of some $474,081 less revenue for the year.
(c) For 2015,The Current, Debt Service Cover and the Operating Surplus ratios as disclosed above were distortedby an item of revenue relating to the early payment of 2015/16 Financial Assistance Grants (FAG's)of $474,081 which was received prior to year-end.
(d) For 2014,The Debt Service Cover and Operating Surplus ratios disclosed above were distorted bythe change to the payment of FAGs during the year ended 30 June 2014 which saw the advance payment of the first quarter of the following year cease. This created a timing difference which resulted in an amount of some $439,784 less revenue for the year.
(e) For 2016, 2015 & 2014The Own Source Revenue Coverage Ratio is distorted by the revenue (operating grant component - see Note 36) of theKalkarni Aged Care Facility not being treated as Own Source Revenue in accordance with the Department of LocalGovernment ratio guidelines.
Items (b) to (e) mentioned above are considered "one-off" timing/non cash in nature and, if they areignored, the calculations disclosed in the columns above would be as follows:
2016 2015 2014Current Ratio 1.17Debt Service Cover Ratio 5.35 5.32 6.26Operating Surplus Ratio (0.34) (0.05) 0.04Own Source Revenue Coverage Ratio 0.73 0.84 0.83
capital renewal and replacement expenditure
Page 43
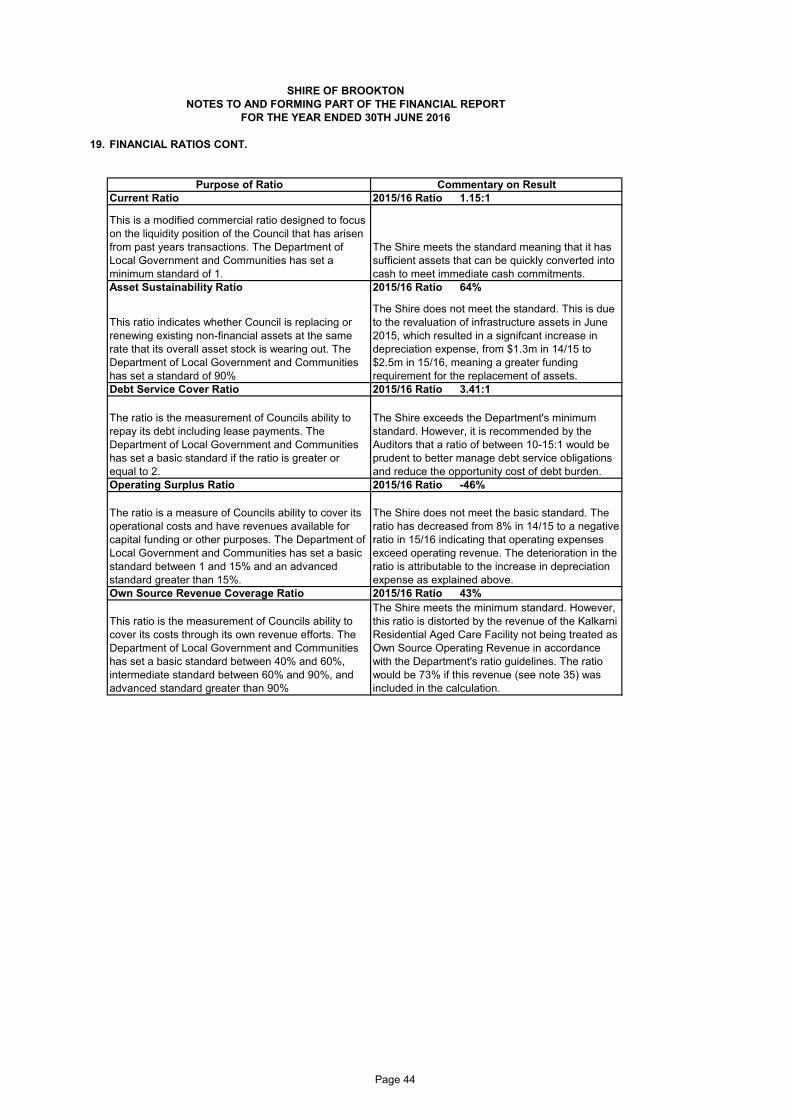
SHIRE OF BROOKTONNOTES TO AND FORMING PART OF THE FINANCIAL REPORT
FOR THE YEAR ENDED 30TH JUNE 2016
19. FINANCIAL RATIOS CONT.
2015/16 Ratio 1.15:1
Asset Sustainability Ratio 2015/16 Ratio 64%
2015/16 Ratio 3.41:1
2015/16 Ratio -46%
2015/16 Ratio 43%
Purpose of Ratio Commentary on ResultCurrent Ratio
This is a modified commercial ratio designed to focus on the liquidity position of the Council that has arisen from past years transactions. The Department of Local Government and Communities has set a minimum standard of 1.
The Shire meets the standard meaning that it has sufficient assets that can be quickly converted into cash to meet immediate cash commitments.
The Shire does not meet the standard. This is due to the revaluation of infrastructure assets in June 2015, which resulted in a signifcant increase in depreciation expense, from $1.3m in 14/15 to $2.5m in 15/16, meaning a greater funding requirement for the replacement of assets.
The Shire exceeds the Department's minimum standard. However, it is recommended by the Auditors that a ratio of between 10-15:1 would be prudent to better manage debt service obligations and reduce the opportunity cost of debt burden.
The Shire does not meet the basic standard. The ratio has decreased from 8% in 14/15 to a negative ratio in 15/16 indicating that operating expenses exceed operating revenue. The deterioration in the ratio is attributable to the increase in depreciation expense as explained above.
The Shire meets the minimum standard. However, this ratio is distorted by the revenue of the Kalkarni Residential Aged Care Facility not being treated as Own Source Operating Revenue in accordance with the Department's ratio guidelines. The ratio would be 73% if this revenue (see note 35) was included in the calculation.
The ratio is the measurement of Councils ability to repay its debt including lease payments. The Department of Local Government and Communities has set a basic standard if the ratio is greater or equal to 2.
This ratio indicates whether Council is replacing or renewing existing non-financial assets at the same rate that its overall asset stock is wearing out. The Department of Local Government and Communities has set a standard of 90%
The ratio is a measure of Councils ability to cover its operational costs and have revenues available for capital funding or other purposes. The Department of Local Government and Communities has set a basic standard between 1 and 15% and an advanced standard greater than 15%.
This ratio is the measurement of Councils ability to cover its costs through its own revenue efforts. The Department of Local Government and Communities has set a basic standard between 40% and 60%, intermediate standard between 60% and 90%, and advanced standard greater than 90%
Debt Service Cover Ratio
Operating Surplus Ratio
Own Source Revenue Coverage Ratio
Page 44
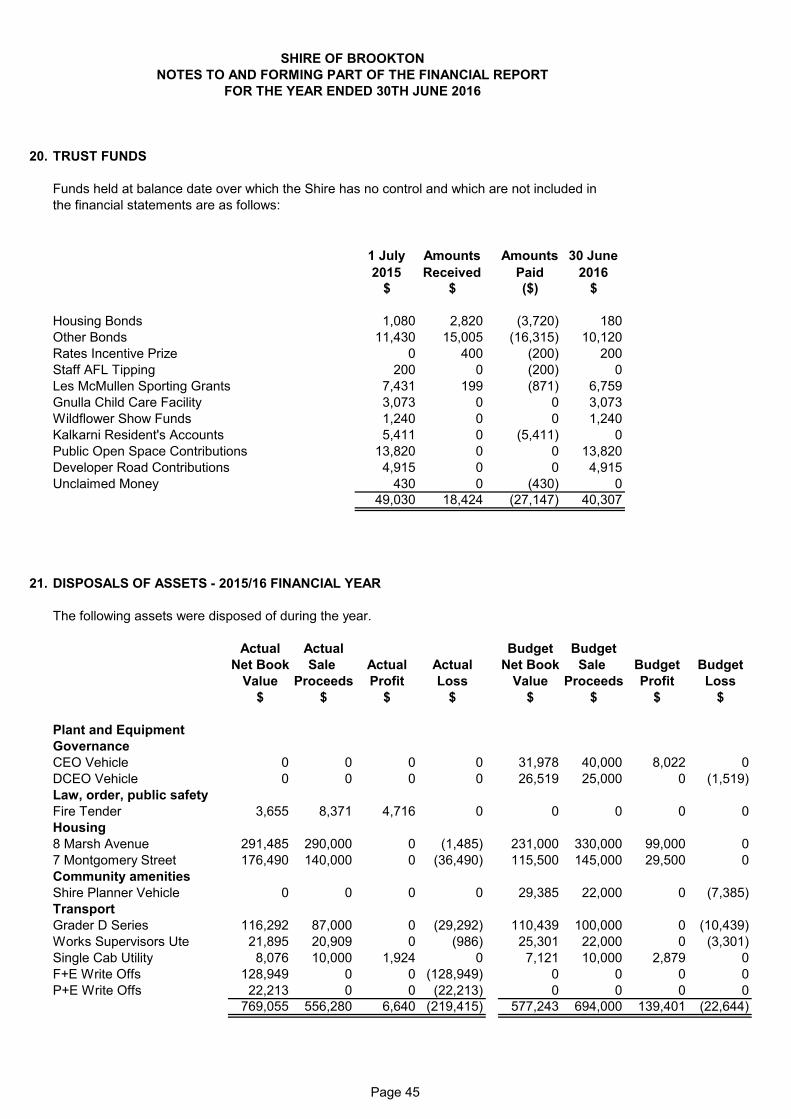
SHIRE OF BROOKTONNOTES TO AND FORMING PART OF THE FINANCIAL REPORT
FOR THE YEAR ENDED 30TH JUNE 2016
20. TRUST FUNDS
Funds held at balance date over which the Shire has no control and which are not included inthe financial statements are as follows:
1 July 2015
Amounts Received
Amounts Paid
30 June 2016
$ $ ($) $
Housing Bonds 1,080 2,820 (3,720) 180Other Bonds 11,430 15,005 (16,315) 10,120Rates Incentive Prize 0 400 (200) 200Staff AFL Tipping 200 0 (200) 0Les McMullen Sporting Grants 7,431 199 (871) 6,759Gnulla Child Care Facility 3,073 0 0 3,073Wildflower Show Funds 1,240 0 0 1,240Kalkarni Resident's Accounts 5,411 0 (5,411) 0Public Open Space Contributions 13,820 0 0 13,820Developer Road Contributions 4,915 0 0 4,915Unclaimed Money 430 0 (430) 0
49,030 18,424 (27,147) 40,307
21. DISPOSALS OF ASSETS - 2015/16 FINANCIAL YEAR
The following assets were disposed of during the year.
Actual Actual Budget Budget Net Book Sale Actual Actual Net Book Sale Budget Budget
Value Proceeds Profit Loss Value Proceeds Profit Loss$ $ $ $ $ $ $ $
Plant and EquipmentGovernanceCEO Vehicle 0 0 0 0 31,978 40,000 8,022 0DCEO Vehicle 0 0 0 0 26,519 25,000 0 (1,519)Law, order, public safetyFire Tender 3,655 8,371 4,716 0 0 0 0 0Housing8 Marsh Avenue 291,485 290,000 0 (1,485) 231,000 330,000 99,000 07 Montgomery Street 176,490 140,000 0 (36,490) 115,500 145,000 29,500 0Community amenitiesShire Planner Vehicle 0 0 0 0 29,385 22,000 0 (7,385)TransportGrader D Series 116,292 87,000 0 (29,292) 110,439 100,000 0 (10,439)Works Supervisors Ute 21,895 20,909 0 (986) 25,301 22,000 0 (3,301)Single Cab Utility 8,076 10,000 1,924 0 7,121 10,000 2,879 0F+E Write Offs 128,949 0 0 (128,949) 0 0 0 0P+E Write Offs 22,213 0 0 (22,213) 0 0 0 0
769,055 556,280 6,640 (219,415) 577,243 694,000 139,401 (22,644)
Page 45
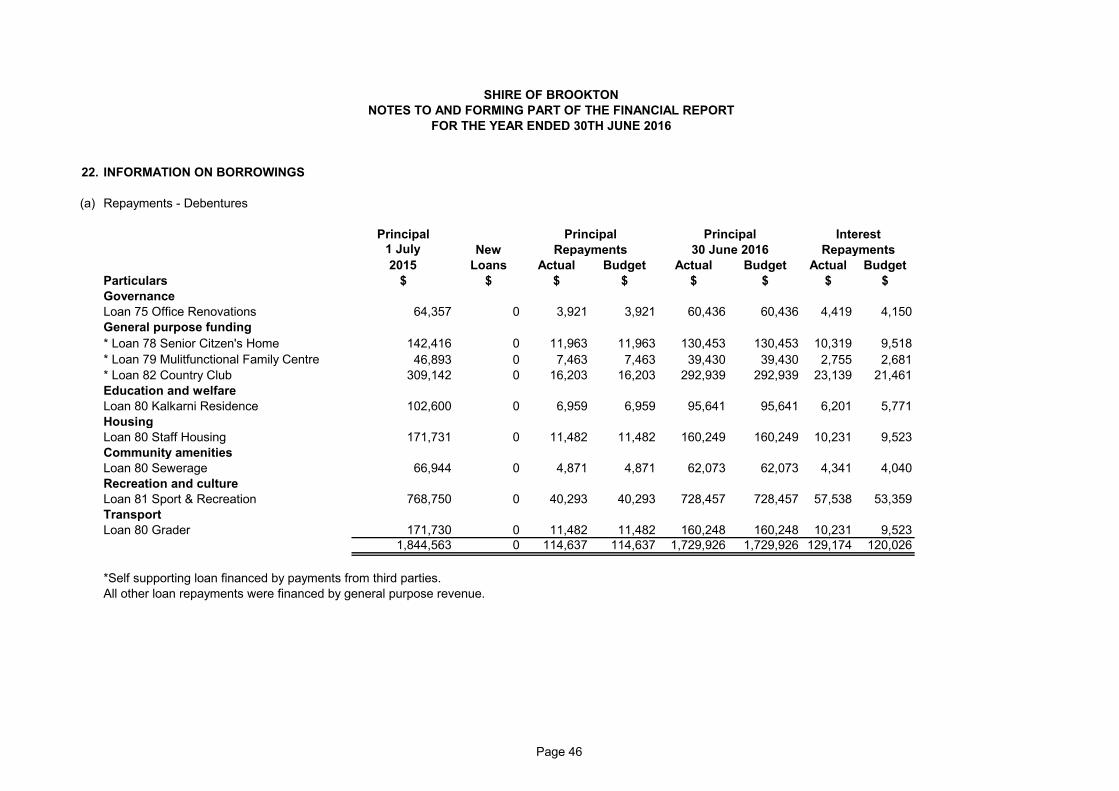
SHIRE OF BROOKTONNOTES TO AND FORMING PART OF THE FINANCIAL REPORT
FOR THE YEAR ENDED 30TH JUNE 2016
22. INFORMATION ON BORROWINGS
(a) Repayments - Debentures
Principal Principal Principal InterestNew Repayments 30 June 2016 Repayments
Loans Actual Budget Actual Budget Actual BudgetParticulars $ $ $ $ $ $ $ $GovernanceLoan 75 Office Renovations 64,357 0 3,921 3,921 60,436 60,436 4,419 4,150General purpose funding* Loan 78 Senior Citzen's Home 142,416 0 11,963 11,963 130,453 130,453 10,319 9,518* Loan 79 Mulitfunctional Family Centre 46,893 0 7,463 7,463 39,430 39,430 2,755 2,681* Loan 82 Country Club 309,142 0 16,203 16,203 292,939 292,939 23,139 21,461Education and welfareLoan 80 Kalkarni Residence 102,600 0 6,959 6,959 95,641 95,641 6,201 5,771HousingLoan 80 Staff Housing 171,731 0 11,482 11,482 160,249 160,249 10,231 9,523Community amenitiesLoan 80 Sewerage 66,944 0 4,871 4,871 62,073 62,073 4,341 4,040Recreation and cultureLoan 81 Sport & Recreation 768,750 0 40,293 40,293 728,457 728,457 57,538 53,359TransportLoan 80 Grader 171,730 0 11,482 11,482 160,248 160,248 10,231 9,523
1,844,563 0 114,637 114,637 1,729,926 1,729,926 129,174 120,026
*Self supporting loan financed by payments from third parties.All other loan repayments were financed by general purpose revenue.
1 July 2015
Page 46
SHIRE OF BROOKTONNOTES TO AND FORMING PART OF THE FINANCIAL REPORT
FOR THE YEAR ENDED 30TH JUNE 2016
22. INFORMATION ON BORROWINGS (Continued)
(b) New Debentures - 2015/16
(c) Unspent Debentures
(d) OverdraftThe Shire does not have an overdraft facility in place with its Banking Provider.
The Shire did not take up any new debentures during the year ended 30 June 2016.
The Shire did not have any unspent debentures as at 30 June 2016.
Page 47
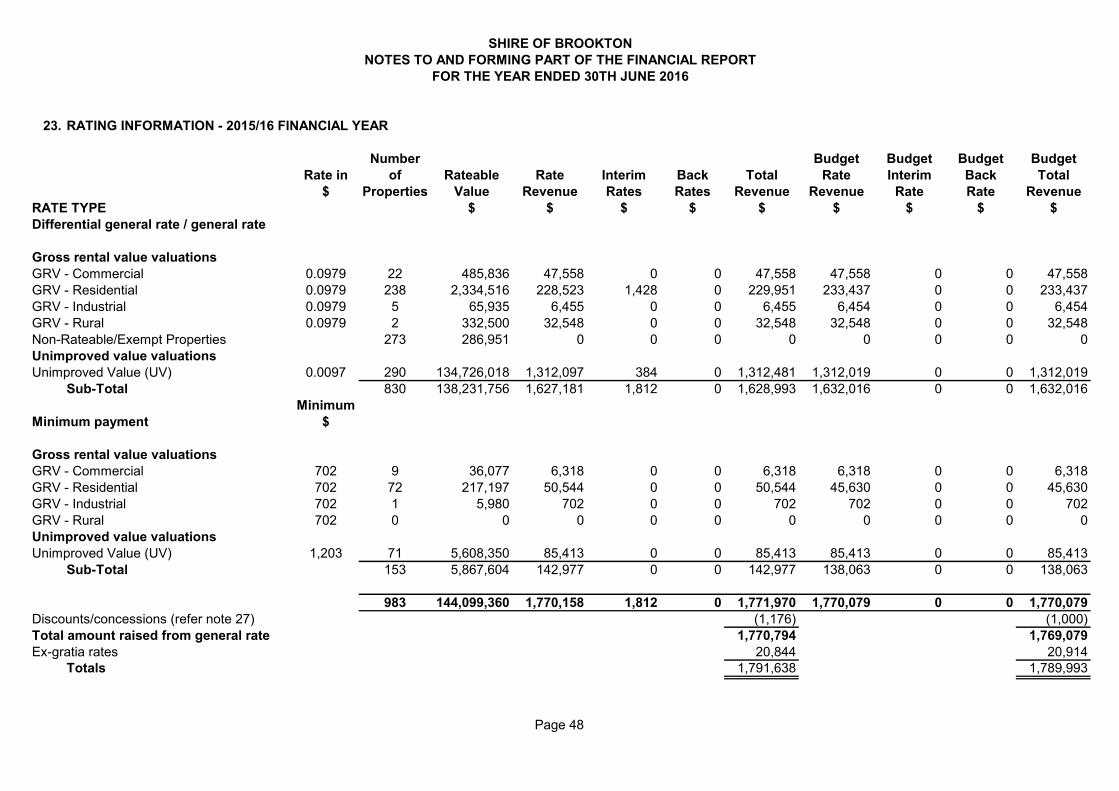
SHIRE OF BROOKTONNOTES TO AND FORMING PART OF THE FINANCIAL REPORT
FOR THE YEAR ENDED 30TH JUNE 2016
23. RATING INFORMATION - 2015/16 FINANCIAL YEAR
Number Budget Budget Budget BudgetRate in of Rateable Rate Interim Back Total Rate Interim Back Total
$ Properties Value Revenue Rates Rates Revenue Revenue Rate Rate RevenueRATE TYPE $ $ $ $ $ $ $ $ $Differential general rate / general rate
Gross rental value valuationsGRV - Commercial 0.0979 22 485,836 47,558 0 0 47,558 47,558 0 0 47,558GRV - Residential 0.0979 238 2,334,516 228,523 1,428 0 229,951 233,437 0 0 233,437GRV - Industrial 0.0979 5 65,935 6,455 0 0 6,455 6,454 0 0 6,454GRV - Rural 0.0979 2 332,500 32,548 0 0 32,548 32,548 0 0 32,548Non-Rateable/Exempt Properties 273 286,951 0 0 0 0 0 0 0 0Unimproved value valuationsUnimproved Value (UV) 0.0097 290 134,726,018 1,312,097 384 0 1,312,481 1,312,019 0 0 1,312,019
Sub-Total 830 138,231,756 1,627,181 1,812 0 1,628,993 1,632,016 0 0 1,632,016Minimum
Minimum payment $
Gross rental value valuationsGRV - Commercial 702 9 36,077 6,318 0 0 6,318 6,318 0 0 6,318GRV - Residential 702 72 217,197 50,544 0 0 50,544 45,630 0 0 45,630GRV - Industrial 702 1 5,980 702 0 0 702 702 0 0 702GRV - Rural 702 0 0 0 0 0 0 0 0 0 0Unimproved value valuationsUnimproved Value (UV) 1,203 71 5,608,350 85,413 0 0 85,413 85,413 0 0 85,413
Sub-Total 153 5,867,604 142,977 0 0 142,977 138,063 0 0 138,063
983 144,099,360 1,770,158 1,812 0 1,771,970 1,770,079 0 0 1,770,079Discounts/concessions (refer note 27) (1,176) (1,000)Total amount raised from general rate 1,770,794 1,769,079Ex-gratia rates 20,844 20,914
Totals 1,791,638 1,789,993
Page 48
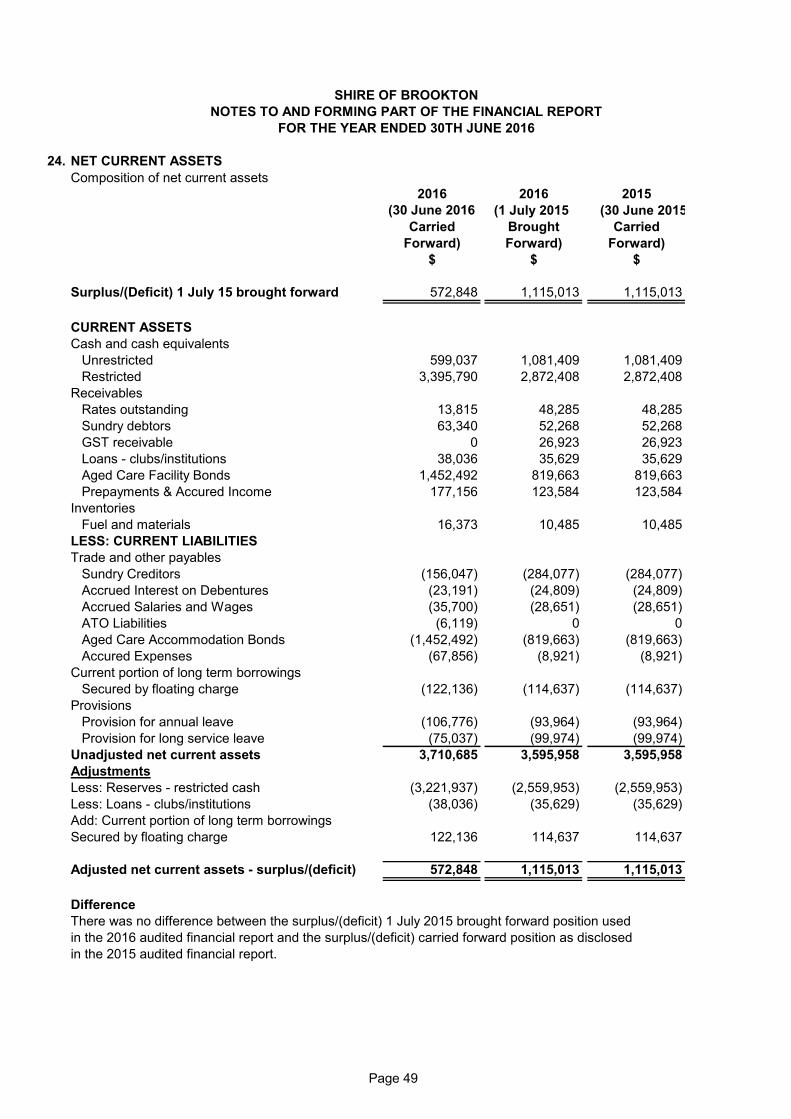
SHIRE OF BROOKTONNOTES TO AND FORMING PART OF THE FINANCIAL REPORT
FOR THE YEAR ENDED 30TH JUNE 2016
24. NET CURRENT ASSETS
2016 2016 2015(30 June 2016
Carried Brought CarriedForward) Forward) Forward)
$ $ $
Surplus/(Deficit) 1 July 15 brought forward 572,848 1,115,013 1,115,013
CURRENT ASSETSCash and cash equivalents
Unrestricted 599,037 1,081,409 1,081,409Restricted 3,395,790 2,872,408 2,872,408
ReceivablesRates outstanding 13,815 48,285 48,285Sundry debtors 63,340 52,268 52,268GST receivable 0 26,923 26,923Loans - clubs/institutions 38,036 35,629 35,629Aged Care Facility Bonds 1,452,492 819,663 819,663Prepayments & Accured Income 177,156 123,584 123,584
InventoriesFuel and materials 16,373 10,485 10,485
LESS: CURRENT LIABILITIESTrade and other payables
Sundry Creditors (156,047) (284,077) (284,077)Accrued Interest on Debentures (23,191) (24,809) (24,809)Accrued Salaries and Wages (35,700) (28,651) (28,651)ATO Liabilities (6,119) 0 0Aged Care Accommodation Bonds (1,452,492) (819,663) (819,663)Accured Expenses (67,856) (8,921) (8,921)
Current portion of long term borrowingsSecured by floating charge (122,136) (114,637) (114,637)
ProvisionsProvision for annual leave (106,776) (93,964) (93,964)Provision for long service leave (75,037) (99,974) (99,974)
Unadjusted net current assets 3,710,685 3,595,958 3,595,958AdjustmentsLess: Reserves - restricted cash (3,221,937) (2,559,953) (2,559,953)Less: Loans - clubs/institutions (38,036) (35,629) (35,629)Add: Current portion of long term borrowingsSecured by floating charge 122,136 114,637 114,637
Adjusted net current assets - surplus/(deficit) 572,848 1,115,013 1,115,013
Difference
in the 2016 audited financial report and the surplus/(deficit) carried forward position as disclosedin the 2015 audited financial report.
Composition of net current assets
(30 June 2015
There was no difference between the surplus/(deficit) 1 July 2015 brought forward position used
(1 July 2015
Page 49
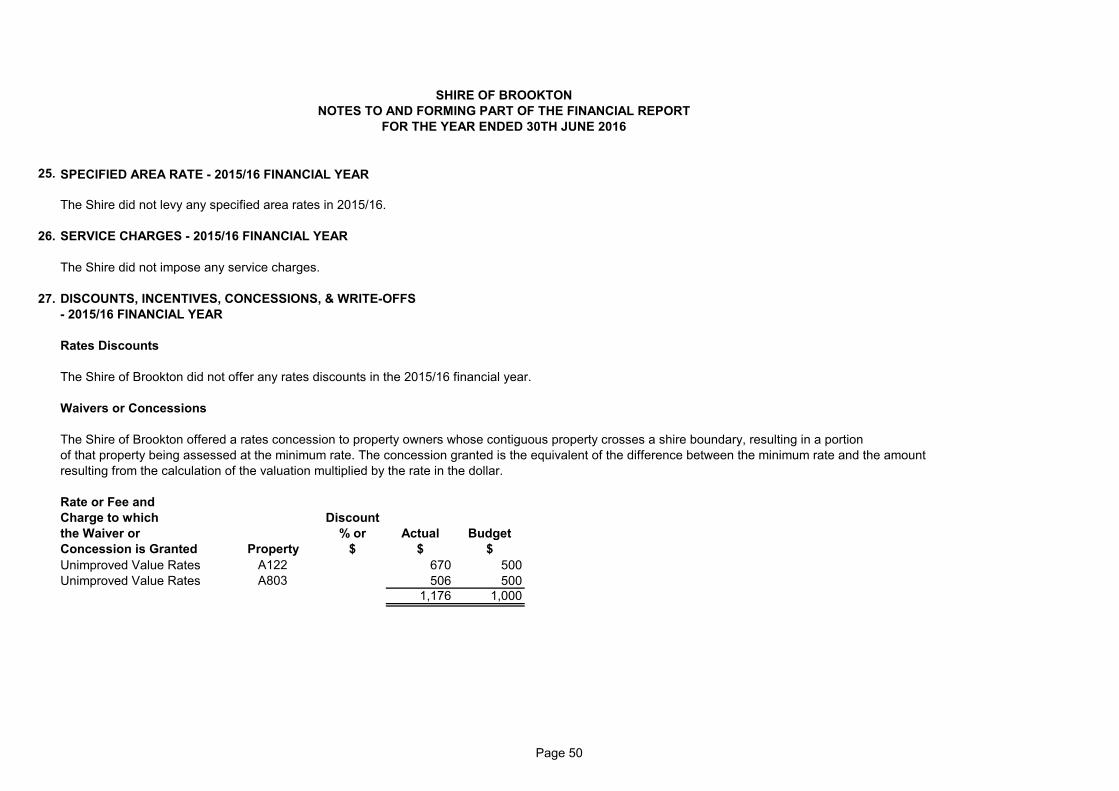
25.
The Shire did not levy any specified area rates in 2015/16.
26. SERVICE CHARGES - 2015/16 FINANCIAL YEAR
The Shire did not impose any service charges.
27. DISCOUNTS, INCENTIVES, CONCESSIONS, & WRITE-OFFS- 2015/16 FINANCIAL YEAR
Rates Discounts
The Shire of Brookton did not offer any rates discounts in the 2015/16 financial year.
Waivers or Concessions
The Shire of Brookton offered a rates concession to property owners whose contiguous property crosses a shire boundary, resulting in a portionof that property being assessed at the minimum rate. The concession granted is the equivalent of the difference between the minimum rate and the amountresulting from the calculation of the valuation multiplied by the rate in the dollar.
Rate or Fee andCharge to which Discountthe Waiver or % or Actual BudgetConcession is Granted Property $ $ $Unimproved Value Rates A122 670 500Unimproved Value Rates A803 506 500
1,176 1,000
SHIRE OF BROOKTONNOTES TO AND FORMING PART OF THE FINANCIAL REPORT
FOR THE YEAR ENDED 30TH JUNE 2016
SPECIFIED AREA RATE - 2015/16 FINANCIAL YEAR
Page 50
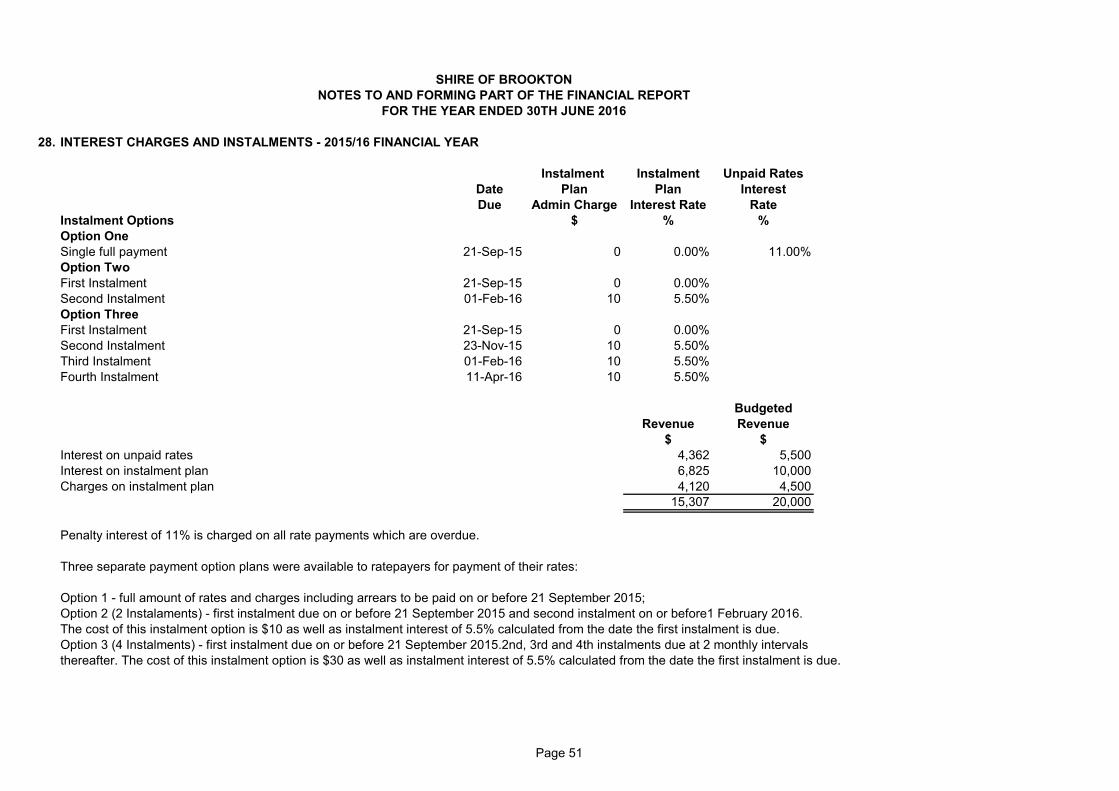
28. INTEREST CHARGES AND INSTALMENTS - 2015/16 FINANCIAL YEAR
Instalment Instalment Unpaid RatesDate Plan Plan InterestDue Admin Charge Interest Rate Rate
Instalment Options $ % %Option OneSingle full payment 21-Sep-15 0 0.00% 11.00%Option TwoFirst Instalment 21-Sep-15 0 0.00%Second Instalment 01-Feb-16 10 5.50%Option ThreeFirst Instalment 21-Sep-15 0 0.00%Second Instalment 23-Nov-15 10 5.50%Third Instalment 01-Feb-16 10 5.50%Fourth Instalment 11-Apr-16 10 5.50%
BudgetedRevenue Revenue
$ $Interest on unpaid rates 4,362 5,500Interest on instalment plan 6,825 10,000Charges on instalment plan 4,120 4,500
15,307 20,000
Penalty interest of 11% is charged on all rate payments which are overdue.
Three separate payment option plans were available to ratepayers for payment of their rates:
Option 1 - full amount of rates and charges including arrears to be paid on or before 21 September 2015;Option 2 (2 Instalaments) - first instalment due on or before 21 September 2015 and second instalment on or before1 February 2016.The cost of this instalment option is $10 as well as instalment interest of 5.5% calculated from the date the first instalment is due.Option 3 (4 Instalments) - first instalment due on or before 21 September 2015.2nd, 3rd and 4th instalments due at 2 monthly intervals thereafter. The cost of this instalment option is $30 as well as instalment interest of 5.5% calculated from the date the first instalment is due.
SHIRE OF BROOKTONNOTES TO AND FORMING PART OF THE FINANCIAL REPORT
FOR THE YEAR ENDED 30TH JUNE 2016
Page 51
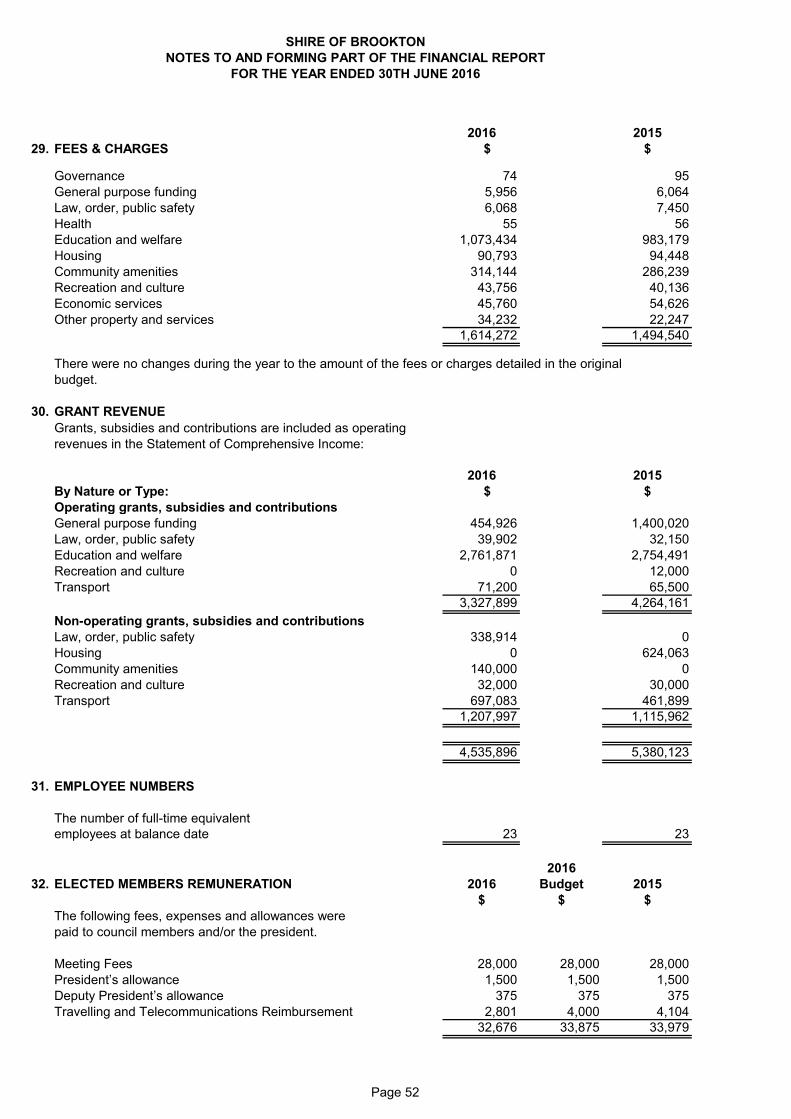
2016 201529. FEES & CHARGES $ $
Governance 74 95General purpose funding 5,956 6,064Law, order, public safety 6,068 7,450Health 55 56Education and welfare 1,073,434 983,179Housing 90,793 94,448Community amenities 314,144 286,239Recreation and culture 43,756 40,136Economic services 45,760 54,626Other property and services 34,232 22,247
1,614,272 1,494,540
There were no changes during the year to the amount of the fees or charges detailed in the original
30. GRANT REVENUEGrants, subsidies and contributions are included as operatingrevenues in the Statement of Comprehensive Income:
2016 2015By Nature or Type: $ $Operating grants, subsidies and contributionsGeneral purpose funding 454,926 1,400,020Law, order, public safety 39,902 32,150Education and welfare 2,761,871 2,754,491Recreation and culture 0 12,000Transport 71,200 65,500
3,327,899 4,264,161Non-operating grants, subsidies and contributionsLaw, order, public safety 338,914 0Housing 0 624,063Community amenities 140,000 0Recreation and culture 32,000 30,000Transport 697,083 461,899
1,207,997 1,115,962
4,535,896 5,380,123
31. EMPLOYEE NUMBERS
The number of full-time equivalentemployees at balance date 23 23
201632. ELECTED MEMBERS REMUNERATION 2016 Budget 2015
$ $ $The following fees, expenses and allowances werepaid to council members and/or the president.
Meeting Fees 28,000 28,000 28,000President’s allowance 1,500 1,500 1,500Deputy President’s allowance 375 375 375Travelling and Telecommunications Reimbursement 2,801 4,000 4,104
32,676 33,875 33,979
SHIRE OF BROOKTONNOTES TO AND FORMING PART OF THE FINANCIAL REPORT
FOR THE YEAR ENDED 30TH JUNE 2016
budget.
Page 52
33. MAJOR LAND TRANSACTIONS
The Shire did not participate in any major land transactions during the 2015/16 financial year.
34. TRADING UNDERTAKINGS AND MAJOR TRADING UNDERTAKINGS
The Shire did not participate in any trading undertakings or major trading undertakings during the 2015/16financial year.
SHIRE OF BROOKTONNOTES TO AND FORMING PART OF THE FINANCIAL REPORT
FOR THE YEAR ENDED 30TH JUNE 2016
Page 53
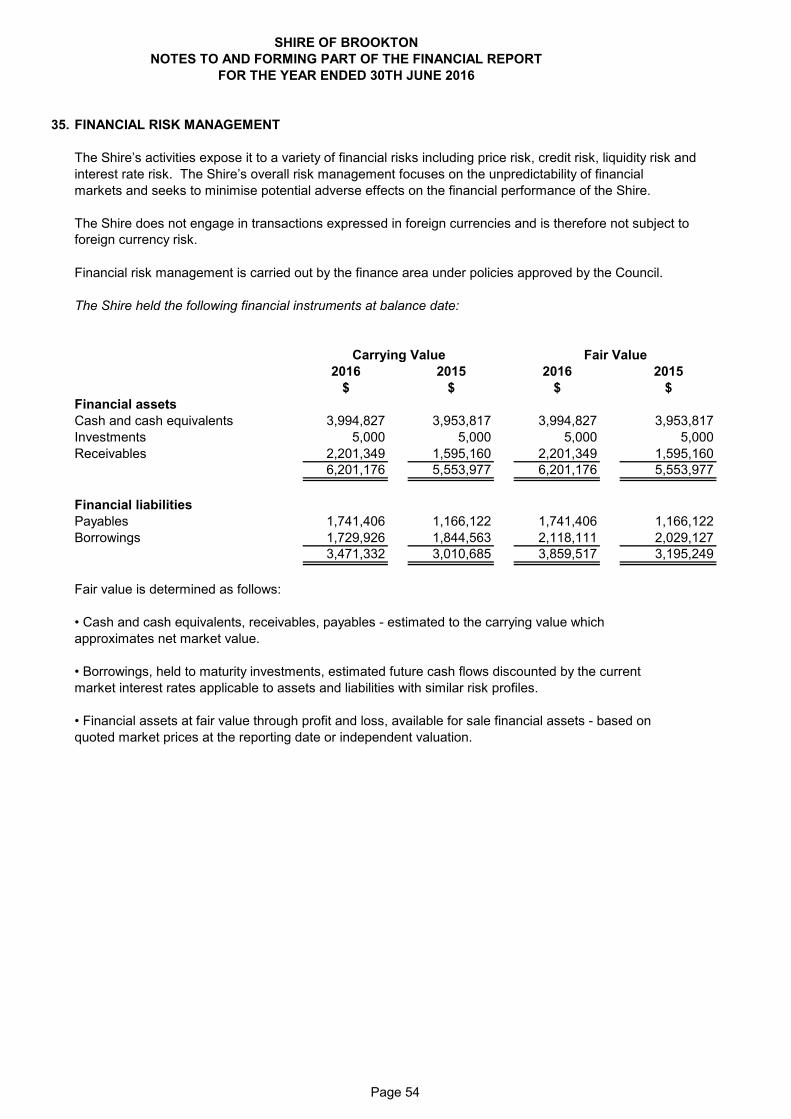
SHIRE OF BROOKTONNOTES TO AND FORMING PART OF THE FINANCIAL REPORT
FOR THE YEAR ENDED 30TH JUNE 2016
35. FINANCIAL RISK MANAGEMENT
foreign currency risk.
Carrying Value Fair Value2016 2015 2016 2015
$ $ $ $Financial assetsCash and cash equivalents 3,994,827 3,953,817 3,994,827 3,953,817Investments 5,000 5,000 5,000 5,000Receivables 2,201,349 1,595,160 2,201,349 1,595,160
6,201,176 5,553,977 6,201,176 5,553,977
Financial liabilitiesPayables 1,741,406 1,166,122 1,741,406 1,166,122Borrowings 1,729,926 1,844,563 2,118,111 2,029,127
3,471,332 3,010,685 3,859,517 3,195,249
Fair value is determined as follows:
• Cash and cash equivalents, receivables, payables - estimated to the carrying value whichapproximates net market value.
• Borrowings, held to maturity investments, estimated future cash flows discounted by the currentmarket interest rates applicable to assets and liabilities with similar risk profiles.
• Financial assets at fair value through profit and loss, available for sale financial assets - based onquoted market prices at the reporting date or independent valuation.
The Shire’s activities expose it to a variety of financial risks including price risk, credit risk, liquidity risk and
The Shire does not engage in transactions expressed in foreign currencies and is therefore not subject to
Financial risk management is carried out by the finance area under policies approved by the Council.
The Shire held the following financial instruments at balance date:
interest rate risk. The Shire’s overall risk management focuses on the unpredictability of financialmarkets and seeks to minimise potential adverse effects on the financial performance of the Shire.
Page 54
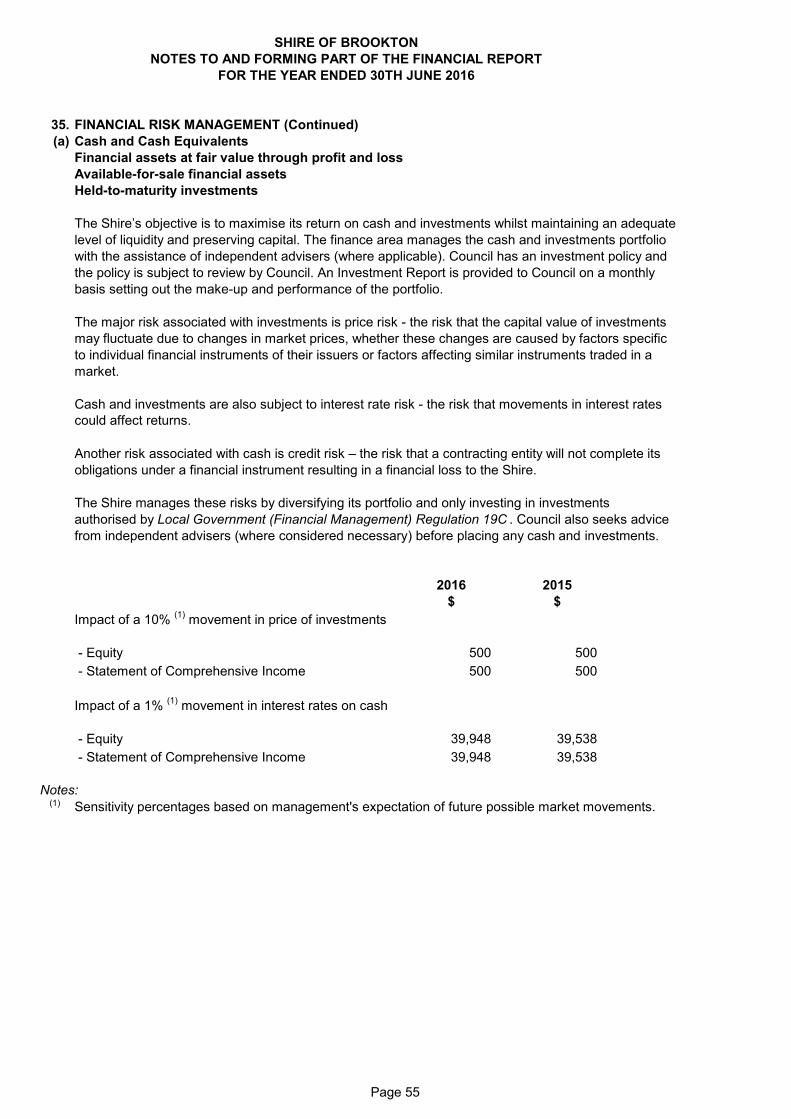
SHIRE OF BROOKTONNOTES TO AND FORMING PART OF THE FINANCIAL REPORT
FOR THE YEAR ENDED 30TH JUNE 2016
35. FINANCIAL RISK MANAGEMENT (Continued)(a) Cash and Cash Equivalents
Financial assets at fair value through profit and lossAvailable-for-sale financial assetsHeld-to-maturity investments
The major risk associated with investments is price risk - the risk that the capital value of investmentsmay fluctuate due to changes in market prices, whether these changes are caused by factors specificto individual financial instruments of their issuers or factors affecting similar instruments traded in amarket.
could affect returns.
2016 2015$ $
Impact of a 10% (1) movement in price of investments
- Equity 500 500 - Statement of Comprehensive Income 500 500
Impact of a 1% (1) movement in interest rates on cash
- Equity 39,948 39,538 - Statement of Comprehensive Income 39,948 39,538
Notes:(1)
Cash and investments are also subject to interest rate risk - the risk that movements in interest rates
Another risk associated with cash is credit risk – the risk that a contracting entity will not complete its
The Shire’s objective is to maximise its return on cash and investments whilst maintaining an adequatelevel of liquidity and preserving capital. The finance area manages the cash and investments portfolio with the assistance of independent advisers (where applicable). Council has an investment policy and the policy is subject to review by Council. An Investment Report is provided to Council on a monthly basis setting out the make-up and performance of the portfolio.
obligations under a financial instrument resulting in a financial loss to the Shire.
The Shire manages these risks by diversifying its portfolio and only investing in investments authorised by Local Government (Financial Management) Regulation 19C . Council also seeks advice from independent advisers (where considered necessary) before placing any cash and investments.
Sensitivity percentages based on management's expectation of future possible market movements.
Page 55
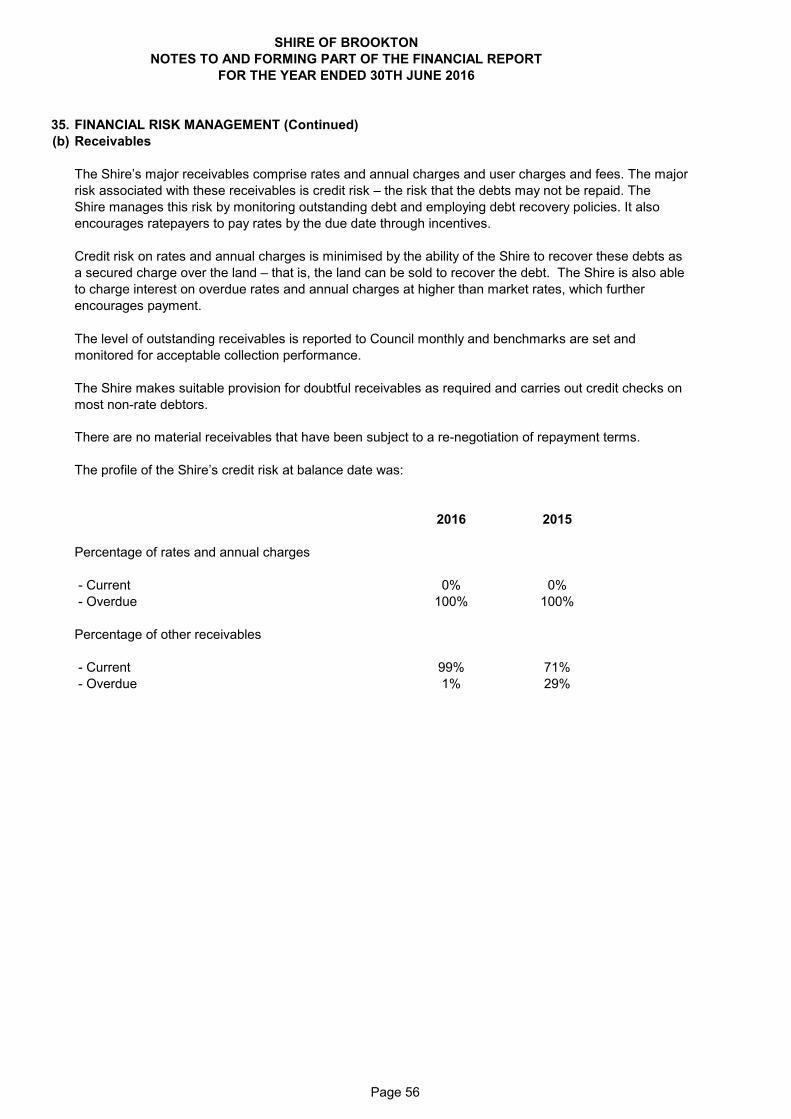
SHIRE OF BROOKTONNOTES TO AND FORMING PART OF THE FINANCIAL REPORT
FOR THE YEAR ENDED 30TH JUNE 2016
35. FINANCIAL RISK MANAGEMENT (Continued)(b) Receivables
most non-rate debtors.
2016 2015
Percentage of rates and annual charges
- Current 0% 0% - Overdue 100% 100%
Percentage of other receivables
- Current 99% 71% - Overdue 1% 29%
The profile of the Shire’s credit risk at balance date was:
The Shire makes suitable provision for doubtful receivables as required and carries out credit checks on
There are no material receivables that have been subject to a re-negotiation of repayment terms.
encourages ratepayers to pay rates by the due date through incentives.
a secured charge over the land – that is, the land can be sold to recover the debt. The Shire is also ableto charge interest on overdue rates and annual charges at higher than market rates, which further encourages payment.
monitored for acceptable collection performance.
Credit risk on rates and annual charges is minimised by the ability of the Shire to recover these debts as
Shire manages this risk by monitoring outstanding debt and employing debt recovery policies. It also
The Shire’s major receivables comprise rates and annual charges and user charges and fees. The major
The level of outstanding receivables is reported to Council monthly and benchmarks are set and
risk associated with these receivables is credit risk – the risk that the debts may not be repaid. The
Page 56
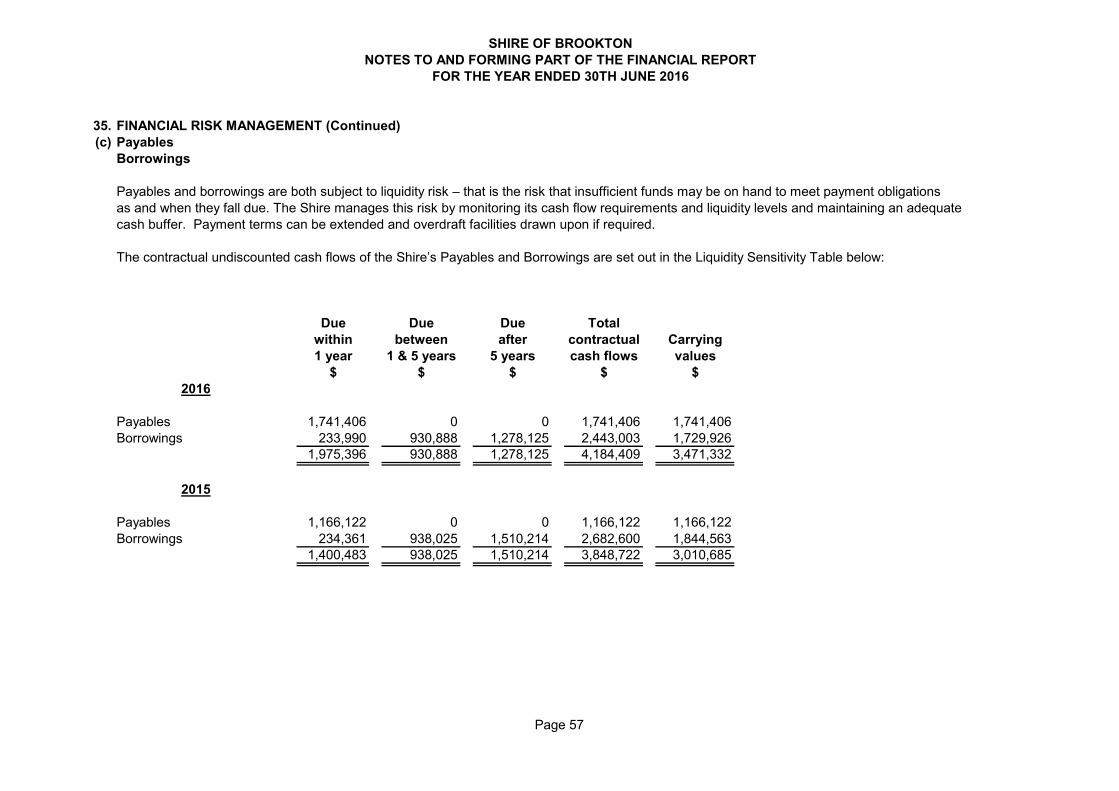
SHIRE OF BROOKTONNOTES TO AND FORMING PART OF THE FINANCIAL REPORT
FOR THE YEAR ENDED 30TH JUNE 2016
35. FINANCIAL RISK MANAGEMENT (Continued)(c) Payables
Borrowings
Due Due Due Totalwithin between after contractual Carrying1 year 1 & 5 years 5 years cash flows values
$ $ $ $ $2016
Payables 1,741,406 0 0 1,741,406 1,741,406Borrowings 233,990 930,888 1,278,125 2,443,003 1,729,926
1,975,396 930,888 1,278,125 4,184,409 3,471,332
2015
Payables 1,166,122 0 0 1,166,122 1,166,122Borrowings 234,361 938,025 1,510,214 2,682,600 1,844,563
1,400,483 938,025 1,510,214 3,848,722 3,010,685
Payables and borrowings are both subject to liquidity risk – that is the risk that insufficient funds may be on hand to meet payment obligations
The contractual undiscounted cash flows of the Shire’s Payables and Borrowings are set out in the Liquidity Sensitivity Table below:
as and when they fall due. The Shire manages this risk by monitoring its cash flow requirements and liquidity levels and maintaining an adequatecash buffer. Payment terms can be extended and overdraft facilities drawn upon if required.
Page 57
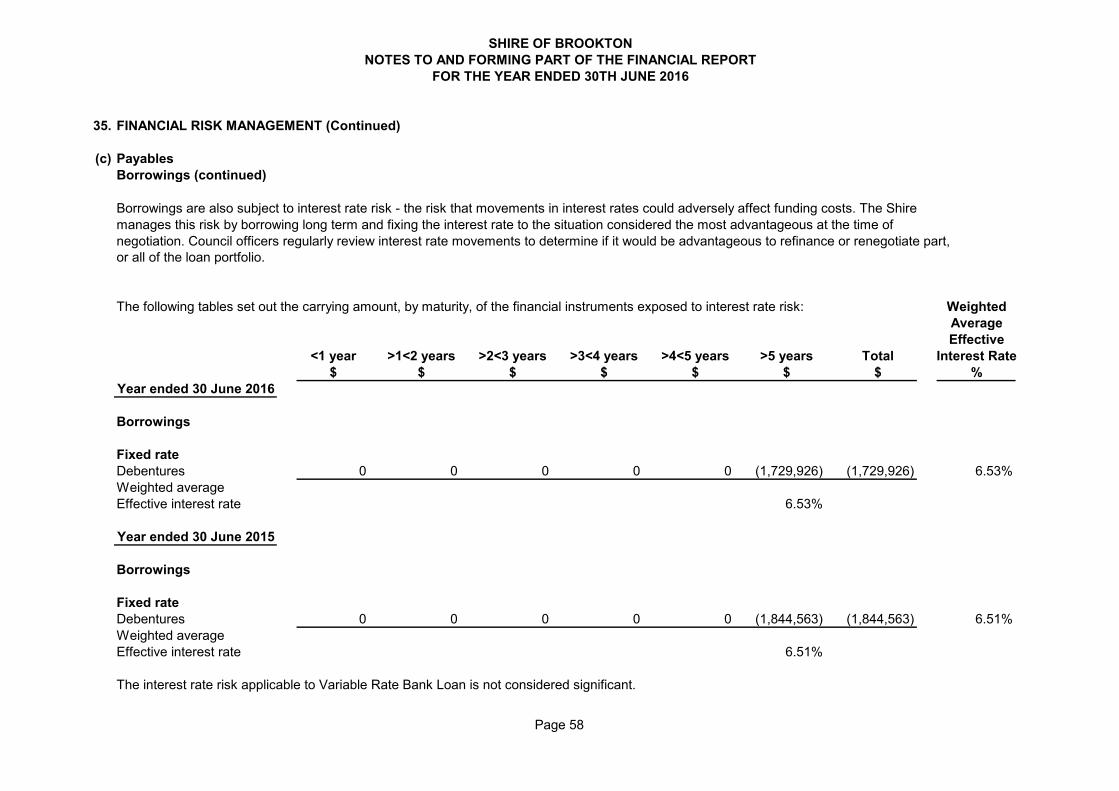
SHIRE OF BROOKTONNOTES TO AND FORMING PART OF THE FINANCIAL REPORT
FOR THE YEAR ENDED 30TH JUNE 2016
35. FINANCIAL RISK MANAGEMENT (Continued)
(c) PayablesBorrowings (continued)
The following tables set out the carrying amount, by maturity, of the financial instruments exposed to interest rate risk: WeightedAverageEffective
<1 year >1<2 years >2<3 years >3<4 years >4<5 years >5 years Total Interest Rate$ $ $ $ $ $ $ %
Year ended 30 June 2016
Borrowings
Fixed rateDebentures 0 0 0 0 0 (1,729,926) (1,729,926) 6.53%Weighted averageEffective interest rate 6.53%
Year ended 30 June 2015
Borrowings
Fixed rateDebentures 0 0 0 0 0 (1,844,563) (1,844,563) 6.51%Weighted averageEffective interest rate 6.51%
The interest rate risk applicable to Variable Rate Bank Loan is not considered significant.
negotiation. Council officers regularly review interest rate movements to determine if it would be advantageous to refinance or renegotiate part,or all of the loan portfolio.
manages this risk by borrowing long term and fixing the interest rate to the situation considered the most advantageous at the time of Borrowings are also subject to interest rate risk - the risk that movements in interest rates could adversely affect funding costs. The Shire
Page 58
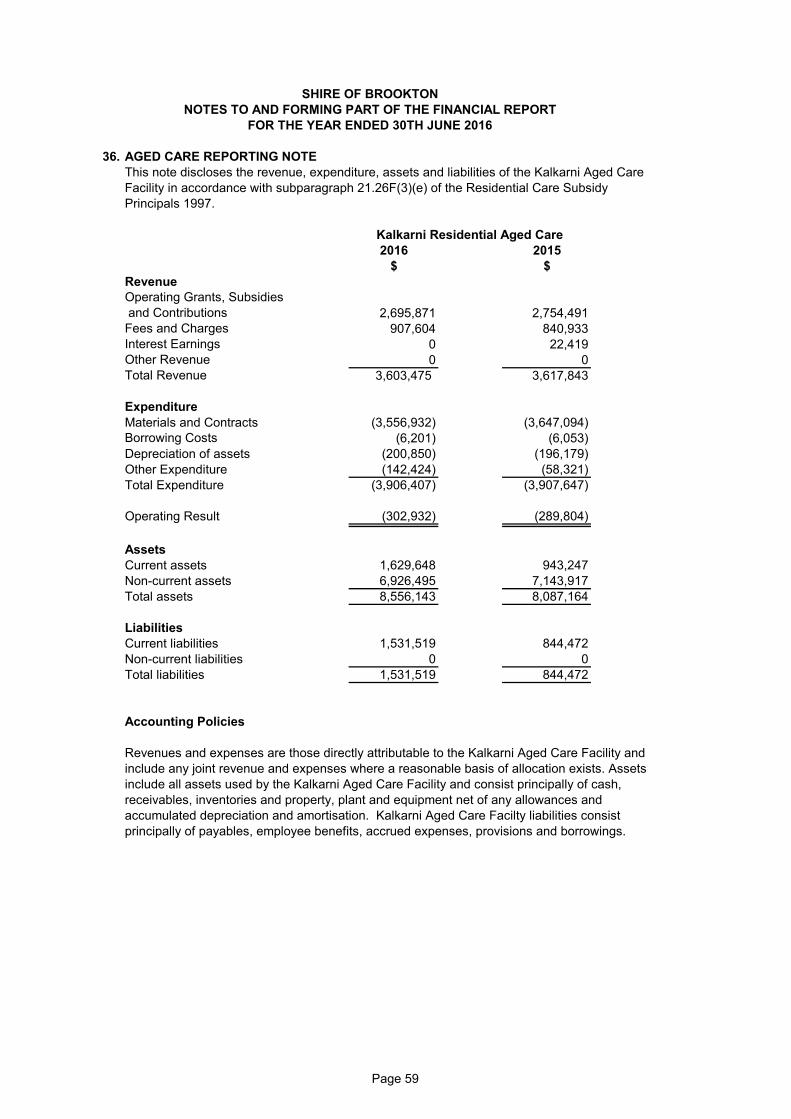
36. AGED CARE REPORTING NOTEThis note discloses the revenue, expenditure, assets and liabilities of the Kalkarni Aged Care Facility in accordance with subparagraph 21.26F(3)(e) of the Residential Care SubsidyPrincipals 1997.
2016 2015$ $
RevenueOperating Grants, Subsidies and Contributions 2,695,871 2,754,491Fees and Charges 907,604 840,933Interest Earnings 0 22,419Other Revenue 0 0Total Revenue 3,603,475 3,617,843
ExpenditureMaterials and Contracts (3,556,932) (3,647,094) Borrowing Costs (6,201) (6,053) Depreciation of assets (200,850) (196,179) Other Expenditure (142,424) (58,321) Total Expenditure (3,906,407) (3,907,647)
Operating Result (302,932) (289,804)
AssetsCurrent assets 1,629,648 943,247Non-current assets 6,926,495 7,143,917Total assets 8,556,143 8,087,164
LiabilitiesCurrent liabilities 1,531,519 844,472Non-current liabilities 0 0Total liabilities 1,531,519 844,472
Accounting Policies
Revenues and expenses are those directly attributable to the Kalkarni Aged Care Facility and include any joint revenue and expenses where a reasonable basis of allocation exists. Assets include all assets used by the Kalkarni Aged Care Facility and consist principally of cash,receivables, inventories and property, plant and equipment net of any allowances andaccumulated depreciation and amortisation. Kalkarni Aged Care Facilty liabilities consist principally of payables, employee benefits, accrued expenses, provisions and borrowings.
SHIRE OF BROOKTONNOTES TO AND FORMING PART OF THE FINANCIAL REPORT
FOR THE YEAR ENDED 30TH JUNE 2016
Kalkarni Residential Aged Care
Page 59
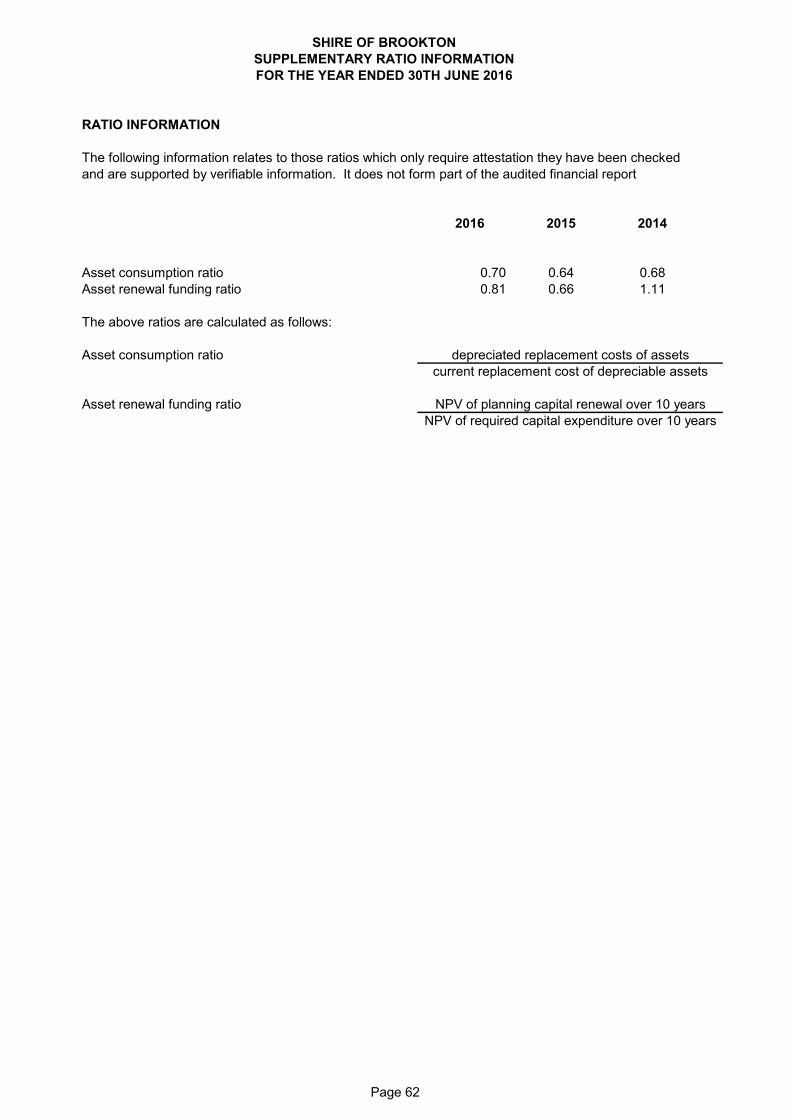
RATIO INFORMATION
2016 2015 2014
Asset consumption ratio 0.70 0.64 0.68Asset renewal funding ratio 0.81 0.66 1.11
The above ratios are calculated as follows:
Asset consumption ratio
Asset renewal funding ratio
depreciated replacement costs of assetscurrent replacement cost of depreciable assets
NPV of planning capital renewal over 10 yearsNPV of required capital expenditure over 10 years
SHIRE OF BROOKTONSUPPLEMENTARY RATIO INFORMATION
The following information relates to those ratios which only require attestation they have been checkedand are supported by verifiable information. It does not form part of the audited financial report
FOR THE YEAR ENDED 30TH JUNE 2016
Page 62