ship manoeuvre analysis and simulation to obtain …
TRANSCRIPT

Ship manoeuvre analysis and simulation to obtain scouring related propeller variables
19th Annual General Assembly – AGA 2018 International Association of Maritime Universities (IAMU)
M. Grifoll, F.X. Martínez de Osés, M. Castells and A. Martin (Eds)
SHIP MANOEUVRE ANALYSIS AND SIMULATION TO OBTAIN
SCOURING RELATED PROPELLER VARIABLES
LLULL, T.*, MUJAL-COLILLES, A. *, GIRONELLA, X. *, CASTELLS, M. †, MARTÍNEZ DE OSÉS, X. †, MARTIN, A. †, SÁNCHEZ-ARCILLA,
A. *
* Marine Engineering Laboratory, Department of Civil and Environmental Engineering (LIM/UPC-BarcelonaTech)
Universitat Politècnica de Catalunya – BarcelonaTech Carrer Jordi Girona, 1, 08034 Barcelona, Spain
e-mail: [email protected], web page: http://lim.upc.edu
† Barcelona School of Nautical Studies (FNB/UPC-BarcelonaTech) Universitat Politècnica de Catalunya - BarcelonaTech
Pla de Palau, 18, 08003 Barcelona, Spain e-mail: [email protected], web page: http://www.fnb.upc.edu
Keywords: AIS data, ship trajectory monitoring, ship simulator, scouring action, propeller generated erosion.
Abstract. The evolution of shipping industry in terms of bigger and more powerful ships, is causing several issues in existing ports and marinas designed, initially, to host smaller vessels with smaller propulsion systems and lower drafts, such as harbour basin erosion near quay walls, deposited zones in low frequented areas and reduction of operational areas. Previous studies concluded that main problems come from regular vessels such as ferries, which dock and undock frequently in the same quays performing the same manoeuvres. This contribution deals with a method to reproduce real ship manoeuvres in a full mission ship simulator obtained through Automatic Identification System (AIS) data analysis. A faithful reproduction permits to extract propeller and propulsion variables, which, in turn, allow the study of the scouring action using literature formulae. Results obtained show that AIS data can be used to obtain manoeuvring patterns, allowing the study of the scouring action for every particular case depending on vessel type, manoeuvre or met-ocean conditions. 1 INTRODUCTION
The evolution of shipping industry in terms of bigger and more powerful ships, is causing several issues in existing ports and marinas designed, initially, to host smaller vessels with smaller propulsion systems and lower drafts, such as harbour basin erosion near quay walls, deposited zones in low frequented areas and reduction of operational areas. The erosion of port
296

Llull, T., Mujal-Colilles, A., Gironella, X., Castells, M., Martínez de Osés, X., Martin, A., Sánchez-Arcilla, A.
2
sediment in which quays and other structures are settled is leading to structural problems caused by scouring action and navigational problems due to sediment transport and relocation. Previous studies concluded that main problems come from regular vessels (excepting tugboats and pilot vessels) such as ferries, which dock and undock frequently in the same quays performing the same manoeuvres. Moreover, ferry ships require a particular quay to allow their ramping systems to be used during port operations, which is parallel to the propeller plane, so it is perpendicularly affected by main propellers generated thrust during docking and undocking manoeuvres.
This problem has been approached in engineering by several authors over the last decades, mainly through laboratory studies considering mostly one single propeller ([1]–[5]), with more recent research using twin propeller generated streams ([6]). They consider different combinations of the main propellers characteristics such as rotational velocity, pitch, blade projected area, etc., to obtain the size and location of the generated scour depending on the propeller behaviour. However, the real value of these variables, in particular rotational velocity and pitch, are mostly unknown by harbour authorities and researchers. The study of the manoeuvre, obtained through AIS data analysis ([7]–[9]), and its reproduction by means of a full mission bridge simulator can be used to obtain the evolution of parameters directly related with the scouring action.
This contribution deals with a method to reproduce real ship manoeuvres in a full mission ship simulator starting from AIS data analysis from a concrete study case. A faithful reproduction permits to extract variables such as rotational velocity, engine power and propeller pitch, which, in turn, allow the study of the scouring action using literature formulae. Once the engine and propeller behaviour variables are obtained and related to the geographical position of the ship during the maneuver, the points of maximum forcing can be located, giving the port authorities a clue about the most probably affected area so that they can arrange prevention and protection actions.
2 SCOURING VARIABLES Equations proposed by the guidelines of PIANC [1] use as independent variables i) the efflux
velocity: 𝑉𝑉0; ii) ship propeller features: propeller diameter, 𝐷𝐷𝑝𝑝, power, 𝑃𝑃; and iii) seabed and manoeuvre characteristics such as the sediment size, 𝐷𝐷50, the clearance distance, 𝑐𝑐, and sediment density. The first variable introducing uncertainty is the efflux velocity. Many authors have tried to validate a coefficient, A, for the equation obtained using the momentum and mass conservation conditions:
𝑉𝑉0 = 𝐴𝐴𝐴𝐴𝐷𝐷𝑝𝑝√𝐶𝐶𝑇𝑇 ( 1 )
with n, the speed rotation in rps, and 𝐶𝐶𝑇𝑇 the thrust coefficient of the propellers. According to the axial momentum theory, A = 1.59, but Hamill and Johnston [10] propose
A = 1.03, whereas Hashmi [11] increase it up to A = 1.1. Stewart in his PhD thesis developed a more complex equation to obtain the coefficient A through the characteristics of the propellers:
297

Llull, T., Mujal-Colilles, A., Gironella, X., Castells, M., Martínez de Osés, X., Martin, A., Sánchez-Arcilla, A.
3
𝐴𝐴 = 𝐷𝐷𝑝𝑝−0.0686𝑝𝑝1.519𝛽𝛽−0.323 ( 2 )
where p is the pitch to diameter ratio and 𝛽𝛽 is the blade expanded area ratio. However, using the axial momentum theory as the basis, efflux velocity can be computed
using other variables, when one of the previous variables is difficult to obtain –usually the thrust coefficient. Eq. ( 3 ) is proposed by the Spanish guidelines [12] for non-ducted propellers and also by the international guidelines published by PIANC [1]. The main differences are the percentage of maximum installed power, 𝑃𝑃𝑝𝑝, each of them recommends: 𝑓𝑓𝑝𝑝 = 0.4 and 0.15 respectively; and the coefficient 𝐶𝐶1, for which they recommend 1.17 and 1.48 respectively
𝑉𝑉0 = 𝐶𝐶1 (𝑓𝑓𝑝𝑝𝑃𝑃𝑝𝑝𝜌𝜌𝑤𝑤𝐷𝐷𝑝𝑝2
)1 3⁄
( 3 )
All the previous equations have been proposed for single propellers after experimental campaigns in laboratories. Mujal-Colilles et al. [13], compared the laboratory experiments of twin propellers with the equations present in literature and concluded that both Eq. ( 1 ) and Eq. ( 3 ) overestimated by a factor of two the experimental results, yielding Eq. ( 1 ) closer results.
The second variable needed to estimate the seabed erosion is the velocity at the seabed.
Blockland an Smedes [14] proposed the following expression using in-situ measurements
𝑉𝑉𝑏𝑏 = 2.8𝑉𝑉0𝐷𝐷𝑝𝑝
𝑋𝑋𝑤𝑤 + (𝑐𝑐 + 𝐷𝐷𝑝𝑝2 )
( 4 )
where 𝑋𝑋𝑤𝑤 is the distance from the propellers to the vertical wall of the quay. Again, the uncertainty is introduced by the several definitions of the efflux velocity.
Finally, according to the conclusions found in Mujal-Colilles et al. [15], the maximum
scouring depth in confined situations, 𝜀𝜀𝑚𝑚𝑚𝑚𝑚𝑚𝑐𝑐 , is located close to a vertical wall and can be
computed using the equation proposed by Hamill et al. [5] for confined situations:
𝜀𝜀𝑚𝑚𝑚𝑚𝑚𝑚𝑐𝑐 = 𝜀𝜀𝑚𝑚𝑚𝑚𝑚𝑚
𝑢𝑢 + [𝜀𝜀𝑚𝑚𝑚𝑚𝑚𝑚𝑢𝑢 + (𝑐𝑐 +
𝐷𝐷𝑝𝑝2 )] [1.18 (𝑋𝑋𝑤𝑤𝑋𝑋𝑚𝑚𝑢𝑢
)−0.2
]
𝑋𝑋𝑚𝑚𝑢𝑢 = 𝑐𝑐𝐹𝐹00.94 𝜀𝜀𝑚𝑚𝑚𝑚𝑚𝑚𝑢𝑢 = 45.04 · 10−3Γ−6.98(𝑙𝑙𝑙𝑙(𝑡𝑡))Γ
Γ = 4.1135 ( 𝑐𝑐𝐷𝐷50
)0.724
(𝐷𝐷𝑝𝑝𝐷𝐷50
)−0.522
𝐹𝐹0−0.682
( 5 )
introducing more uncertainties since the densimetric Froude number, 𝐹𝐹0, includes at the
same time the efflux velocity and the sediment diameter.
3 METHODOLOGY AIS data is used as a reference to simulate the docking and undocking manoeuvre at a
298
Llull, T., Mujal-Colilles, A., Gironella, X., Castells, M., Martínez de Osés, X., Martin, A., Sánchez-Arcilla, A.
4
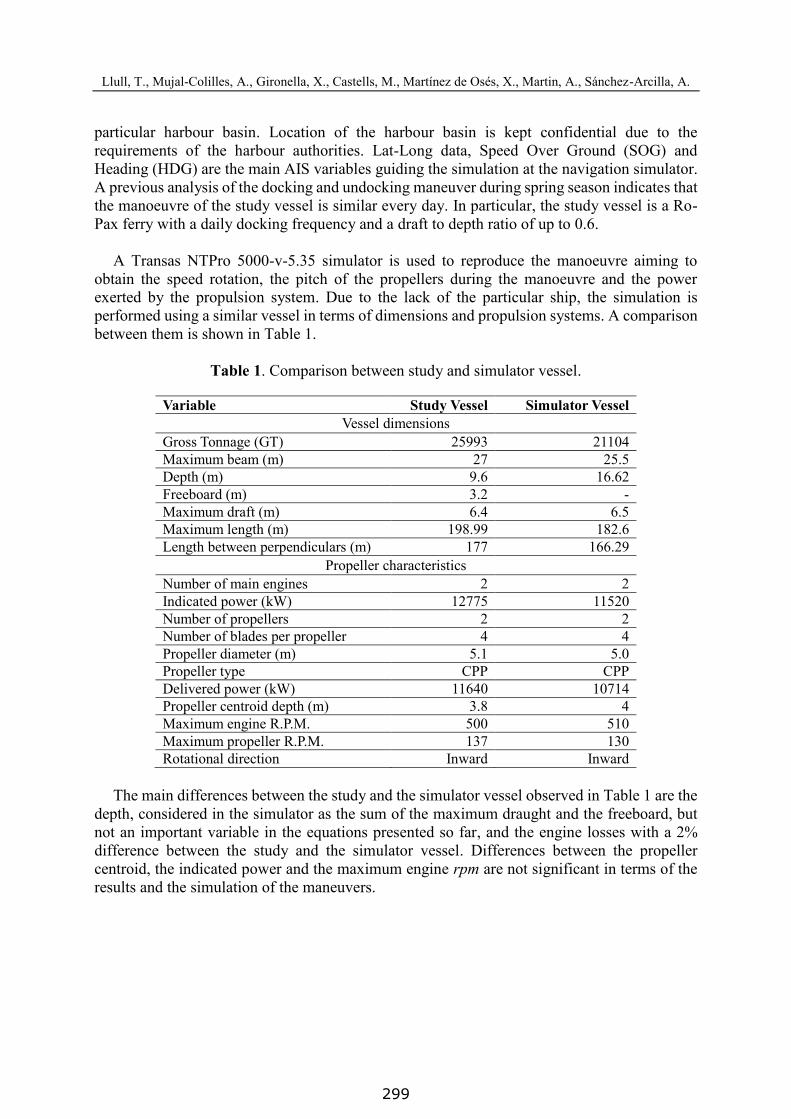
particular harbour basin. Location of the harbour basin is kept confidential due to the requirements of the harbour authorities. Lat-Long data, Speed Over Ground (SOG) and Heading (HDG) are the main AIS variables guiding the simulation at the navigation simulator. A previous analysis of the docking and undocking maneuver during spring season indicates that the manoeuvre of the study vessel is similar every day. In particular, the study vessel is a Ro-Pax ferry with a daily docking frequency and a draft to depth ratio of up to 0.6.
A Transas NTPro 5000-v-5.35 simulator is used to reproduce the manoeuvre aiming to
obtain the speed rotation, the pitch of the propellers during the manoeuvre and the power exerted by the propulsion system. Due to the lack of the particular ship, the simulation is performed using a similar vessel in terms of dimensions and propulsion systems. A comparison between them is shown in Table 1.
Table 1. Comparison between study and simulator vessel.
Variable Study Vessel Simulator Vessel Vessel dimensions
Gross Tonnage (GT) 25993 21104 Maximum beam (m) 27 25.5 Depth (m) 9.6 16.62 Freeboard (m) 3.2 - Maximum draft (m) 6.4 6.5 Maximum length (m) 198.99 182.6 Length between perpendiculars (m) 177 166.29
Propeller characteristics Number of main engines 2 2 Indicated power (kW) 12775 11520 Number of propellers 2 2 Number of blades per propeller 4 4 Propeller diameter (m) 5.1 5.0 Propeller type CPP CPP Delivered power (kW) 11640 10714 Propeller centroid depth (m) 3.8 4 Maximum engine R.P.M. 500 510 Maximum propeller R.P.M. 137 130 Rotational direction Inward Inward
The main differences between the study and the simulator vessel observed in Table 1 are the
depth, considered in the simulator as the sum of the maximum draught and the freeboard, but not an important variable in the equations presented so far, and the engine losses with a 2% difference between the study and the simulator vessel. Differences between the propeller centroid, the indicated power and the maximum engine rpm are not significant in terms of the results and the simulation of the maneuvers.
299

Llull, T., Mujal-Colilles, A., Gironella, X., Castells, M., Martínez de Osés, X., Martin, A., Sánchez-Arcilla, A.
5
4 RESULTS A comparison between AIS Lat-Long data and simulation results of the same variable is
shown in Figure 1, where no big differences can be found either in arrival or departure maneuver. In fact, according to the Lat-Long position of the ship in the simulator, both maneuvers are reproduced almost equal to the real AIS data. Figure 1 also confirms the few differences existing between one and another arrival/departure maneuver from different days. It is important to bear in mind that Figure 1 plots the transmitting point of the vessel AIS data, which is located near by the bridge.
Figure 1. Comparison between AIS Lat-Long data and simulator Lat-Long results. (a) Arrival maneuver. (b)
Departure maneuver.
The most harmful instants of each maneuver, according to the conclusions of Llull et al. [16], are plotted in Figure 2. During the arrival maneuver, when the ship is already parallel to the dock and the captain starts the stopping orders, the wash generated by the propellers is directed towards the wall being, therefore, a harmful potential action. This is marked using a circle with number one in Figure 2a. Likewise, the departure maneuver, Figure 2b, the wash is directed towards the Ro-Ro dock, at the beginning of the maneuver, number 2 in Figure 2b, and when the vessel is turning to exit the harbor basin, number 3 in Figure 2b.
Figure 2. Vessel’s heading arrows and details of the instants with maximum scouring potential from the stern
propellers. (a) Arrival. (b) Departure.
300

Llull, T., Mujal-Colilles, A., Gironella, X., Castells, M., Martínez de Osés, X., Martin, A., Sánchez-Arcilla, A.
6
The engine power, pitch ratio and speed revolution used in the particular moments described previously can be observed in the results obtained from the simulator in Figure 3. At the arrival maneuver, Figure 3a, during the last minutes of the maneuver, starboard engine is working astern using high engine power in order to stop the vessel. Although it is working astern and the flux is not directed towards the docking Ro-Ro wall, the high values of engine power and speed rotation, may create a scouring hole underneath the propellers. At the same time, the port propeller is working ahead with the flux impacting to the wall increasing the scouring action according to [5]. During the departure maneuver, Figure 3b, both at the beginning of the maneuver, number 2 in Figure 3b when the propellers are 28 m far from the docking wall, and during the turning action, number 3 in Figure 3b when the propellers are 155 m away from the docking wall, one of the propellers is working astern using higher engine power and speed rotation, while the other is working ahead with also relatively high values of engine power. The scouring potential of the latter but, is enhanced by the quay wall, which the propeller generated stream is directed to.
Figure 3. Results obtained from the navigation simulator. Red-dashed lines indicate the most potential harmful
actions shown in Figure 2. (a) Arrival. (b) Departure.
If the values of the variables obtained from Figure 3 using the navigation simulator are introduced to obtain the efflux velocity, Eq. ( 1 ) and the bed velocity, Eq. ( 4 ), final values are
301

Llull, T., Mujal-Colilles, A., Gironella, X., Castells, M., Martínez de Osés, X., Martin, A., Sánchez-Arcilla, A.
7
more scarce for the efflux velocity, as seen in Figure 4, although Eq. ( 4 ) already introduces the uncertainties in efflux velocity values. Maximum efflux velocity results are obtained during the first instants of the departure maneuver. Consequently, maximum values in bed velocity are also found at the same moment since the bed velocity is proportional to the efflux velocity. Therefore, apparently, the maximum scouring depth shall be produced at the first instants of the departure maneuver by the port propeller, which is working ahead.
Figure 4. Efflux velocity and bed velocity results for the maximum potentially harmful instants according to
Figure 2. (a) Arrival -1. (b) Departure -2. (c) Departure -3.
Scouring results obtained using Eq. ( 5 ), plotted in Figure 5 use only the values of speed rotation and engine power of the propellers working with the flux towards the wall, this is positive pitch values. According to Hamill et al. [5], the presence of a wall can increase the maximum erosion depth up to a factor of 1.5. Results are within the expected order of magnitude using real values of the maneuver. Figure 5 shows that the maximum scouring depth is found at the beginning of the departure maneuver. The last times of the arrival maneuver, red line in Figure 5a are also more harmful than the moment when the ship is turning during the departure, Figure 5b, due to the closer position of the stern with respect to the docking wall.
Figure 5. Maximum erosion depth for confined situations at the instants detailed in Figure 2. (a) Arrival -1 and
Departure -2. (b) Departure -3.
302

Llull, T., Mujal-Colilles, A., Gironella, X., Castells, M., Martínez de Osés, X., Martin, A., Sánchez-Arcilla, A.
8
5 CONCLUSIONS In the present paper, the reproduction of the arrival and departure maneuvers using a
navigation simulator is introduced as a methodology to estimate the maximum scouring depth. The simulation, performed after analyzing the AIS data of each maneuver, permitted to obtain the variables needed in the formulas used to predict the maximum scouring depth. After introducing the value of these variables, the results help to conclude that:
- The use of the simulator is needed to predict maximum scouring depth. Otherwise, variables value far from reality in terms of speed rotation, pitch and engine power can yield unrealistic results.
- AIS data analysis turns to be very useful to find out the manoeuvre patterns of a particular ship on a particular basin to later mimic the manoeuvre.
- Departure maneuver is more dangerous since it produces larger scouring holes and, therefore, can damage the docking structures. Moreover, the time interval within which the propeller generated wash is impacting against the wall is larger during this manoeuvre.
REFERENCES [1] PIANC, Guidelines for protecting berthing structures from scour caused by ships. Report n° 180. The
World Association for Waterborne Transportation Infrastructure, 2015. [2] D. P. J. Stewart, “Characteristics of a ship’s screw wash and the influence of quay wall proximity,” Dr.
Diss. Queen’s Univ. Belfast, 1992. [3] D. Ryan and G. a. Hamill, “Determining Propeller Erosion at the Stern of a Berthing Ship,” J. Waterw.
Port, Coastal, Ocean Eng., no. August, p. 104, 2012. [4] G. Hamill, “The scouring action of the propeller jet produced by a slowly manoeuvring ship,” Bull.
Perm. Int. Assoc. Navig. Congr., vol. 62, 1988. [5] G. Hamill, H. T. Johnston, and D. Stewart, “Propeller Wash Scour Near Quay Walls,” J. Waterw. Port,
Coast. Ocean Eng., vol. 125, no. 4, pp. 170–175, 1999. [6] A. Mujal-Colilles, X. Gironella, A. Jaquet, R. Gomez-Gesteira, and A. Sanchez-Arcilla, “Study of the
Efflux Velocity Induced By Two Propellers,” in SCACR, Conference on Applied Coastal Research, 2015.
[7] M. Castells, F. X. M. De Osés, A. Martín, A.Mujal and X. Gironella, “Tools for evaluation quay toe scouring induced by vessel propellers in harbour basins during the docking and undocking manoeuvring,” Mar. Navig. Saf. Sea Transp. 61-66., 2017.
[8] K. Gunnar Aarsæther and T. Moan, “Estimating navigation patterns from AIS,” J. Navig., vol. 62, no. 4, pp. 587–607, 2009.
[9] K. G. Aarsæther and T. Moan, “Computer vision and ship traffic analysis: Inferring maneuver patterns from the automatic identification system,” Mar. Navig. Saf. Sea Transp., vol. 4, no. 3, pp. 303–308, 2009.
[10] G. Hamill and H. T. Johnston, “The decay of maximum velocity within the initial stages of a propeller wash,” J. Hydraul. Res., vol. 31, no. 5, 1993.
[11] H. N. Hashmi, “Erosion of a granular bed at a quay wall by a ship’s screw wash.,” PhD thesis, Queen’s Univ. Belfast, North. Ireland;, 1993.
[12] Puertos del Estado, “Obras de Atraque y Amarre: Criterios generales y Factores del Proyecto (R.O.M. 2.0-11),” R.O.M. 2.0-11, 2012.
[13] A. Mujal-Colilles, X. Gironella, A. J. C. Crespo, and A. Sanchez-Arcilla, “Study of the bed velocity induced by twin propellers,” J. Waterw. Port, Coast. Ocean Eng., vol. 143, no. 5, 2017.
[14] R. H. Blokland, T., & Smedes, “In situ tests of current velocities and stone movements caused by a propeller jet against a vertical quay wall.,” Proc. 11th Int. Harb. Congr. Antwerp, Belgium., 1996.
[15] A. Mujal-Colilles, X. Gironella, A. Sanchez-Arcilla, C. Puig Polo, and M. Garcia-Leon, “Erosion caused
303

Llull, T., Mujal-Colilles, A., Gironella, X., Castells, M., Martínez de Osés, X., Martin, A., Sánchez-Arcilla, A.
9
by propeller jets in a low energy harbour basin,” J. Hydraul. Res., vol. 55, no. 1, 2017. [16] T. Llull et al., “Hybrid tool to prevent ship propeller erosion,” in Proceedings of the ASME 2018 37th
International Conference on Ocean, Offshore and Arctic Engineering (OMAE2018), 2018.
304